
🇦🇺🇺🇸#AUDUSD
🔥AUDUSD looks bearish!
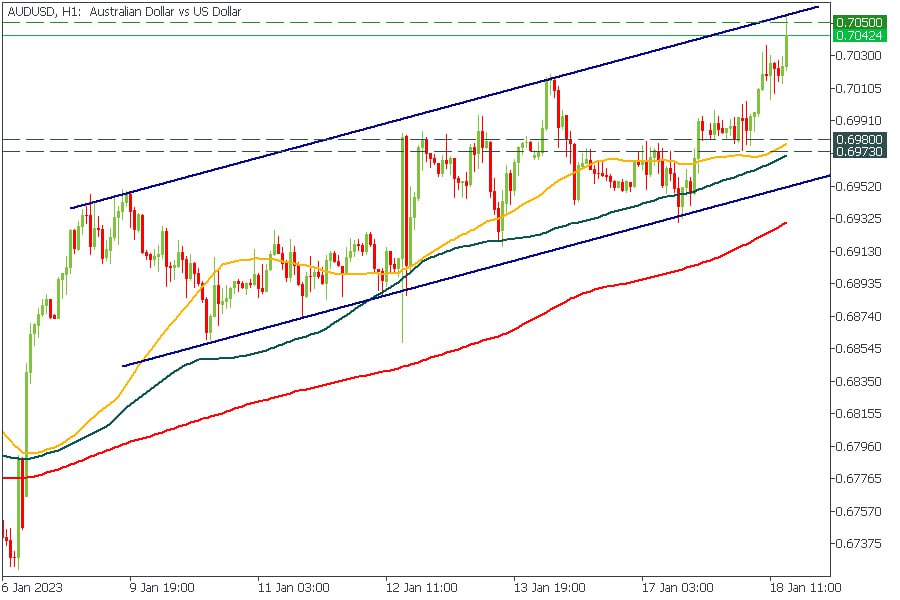
AUDUSD bounces off the upper border of the ascending channel. Thus, we expect the pair to reverse toward the 0.6973 - 0.6980 support range.
👍The resistance level of 0.7050 looks like a great point to sell.
❌SL: Above the resistance trend line
Do you think the US dollar might reverse now?
✅START TRADING ✅
🔥AUDUSD looks bearish!
AUDUSD bounces off the upper border of the ascending channel. Thus, we expect the pair to reverse toward the 0.6973 - 0.6980 support range.
👍The resistance level of 0.7050 looks like a great point to sell.
❌SL: Above the resistance trend line
Do you think the US dollar might reverse now?
✅START TRADING ✅
👍12🔥2🐳2🥱1
#Education
🏆Trading gold in 2023🏆
🥇Why do traders prefer gold?
There are many reasons for this. In this article, we will discuss the reasons to choose gold as a trading asset, what moves gold prices, and how to trade gold via CFD.
📈What moves gold prices?
Before learning how to trade gold, it is important to understand what affects the price of yellow metal. This information can help you make logical trading decisions and reduce the risk of loss.
➡️Read the article: http://bit.ly/3XAq4D6
🏆Trading gold in 2023🏆
🥇Why do traders prefer gold?
There are many reasons for this. In this article, we will discuss the reasons to choose gold as a trading asset, what moves gold prices, and how to trade gold via CFD.
📈What moves gold prices?
Before learning how to trade gold, it is important to understand what affects the price of yellow metal. This information can help you make logical trading decisions and reduce the risk of loss.
➡️Read the article: http://bit.ly/3XAq4D6

👍20🔥10❤6🐳3😍2❤🔥1😢1
🇺🇸🇨🇦#USDCAD
🔥USDCAD looks bullish!
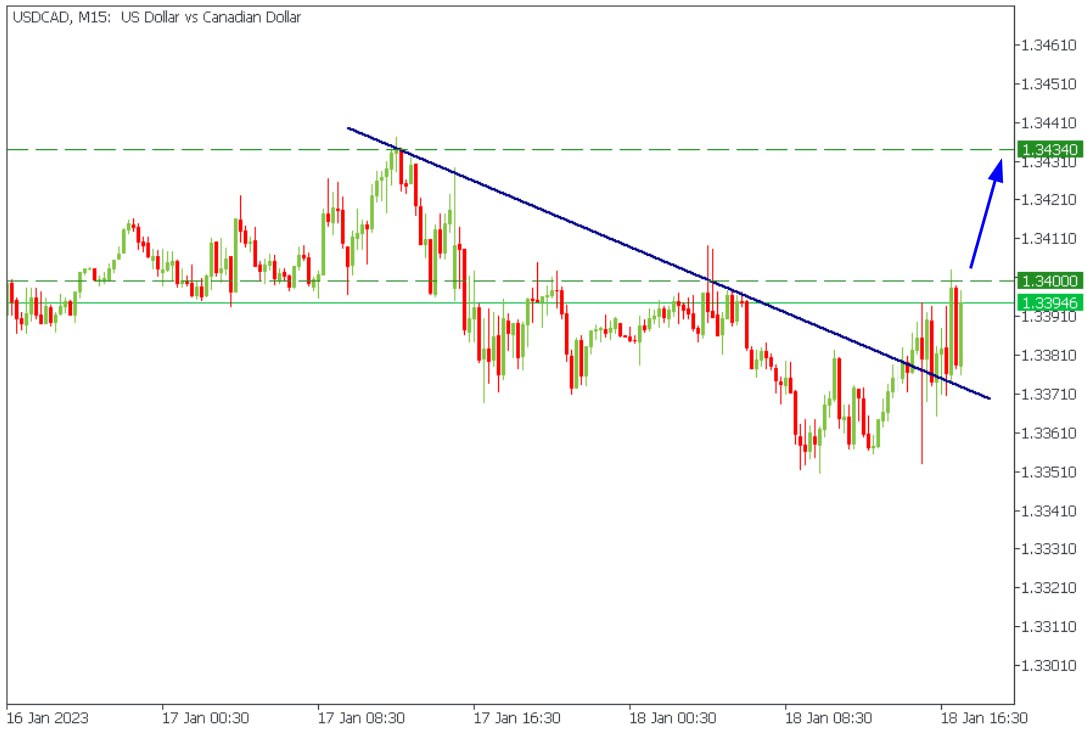
The price broke through the descending trendline and retested if from the above. Thus, consider buying the pair when the price breaks through the 1.3400.
🎯Target: 1.3400
Are you still trading today?
✅TRY TRADING WITH FBS ✅
🔥USDCAD looks bullish!
The price broke through the descending trendline and retested if from the above. Thus, consider buying the pair when the price breaks through the 1.3400.
🎯Target: 1.3400
Are you still trading today?
✅TRY TRADING WITH FBS ✅
👍24🔥14❤9🐳4🍌3
🇪🇺🇺🇸#EURUSD
🔥💥Congratulations to everyone who traded AUDUSD and USDCAD yesterday! One thousand points are booked from two trades! Let's keep going!
😱EURUSD looks bullish!
The price is consolidating above the support range and the 50-period moving average. Thus, we expect the pair to return to 1.0870!
❗️However, be careful! If the price breaks below the 50-period MA and the 1.0775 support level, it will drop to 1.0710.
Are you bullish or bearish on EURUSD today?
✅TRY TRADING WITH FBS ✅
🔥💥Congratulations to everyone who traded AUDUSD and USDCAD yesterday! One thousand points are booked from two trades! Let's keep going!
😱EURUSD looks bullish!
The price is consolidating above the support range and the 50-period moving average. Thus, we expect the pair to return to 1.0870!
❗️However, be careful! If the price breaks below the 50-period MA and the 1.0775 support level, it will drop to 1.0710.
Are you bullish or bearish on EURUSD today?
✅TRY TRADING WITH FBS ✅

🔥24👍12❤4👏2🥰1😱1🥱1🍌1🍾1
#MarketNews
💚 Hello traders! Another great day full of trading opportunities. Let’s dive in together!
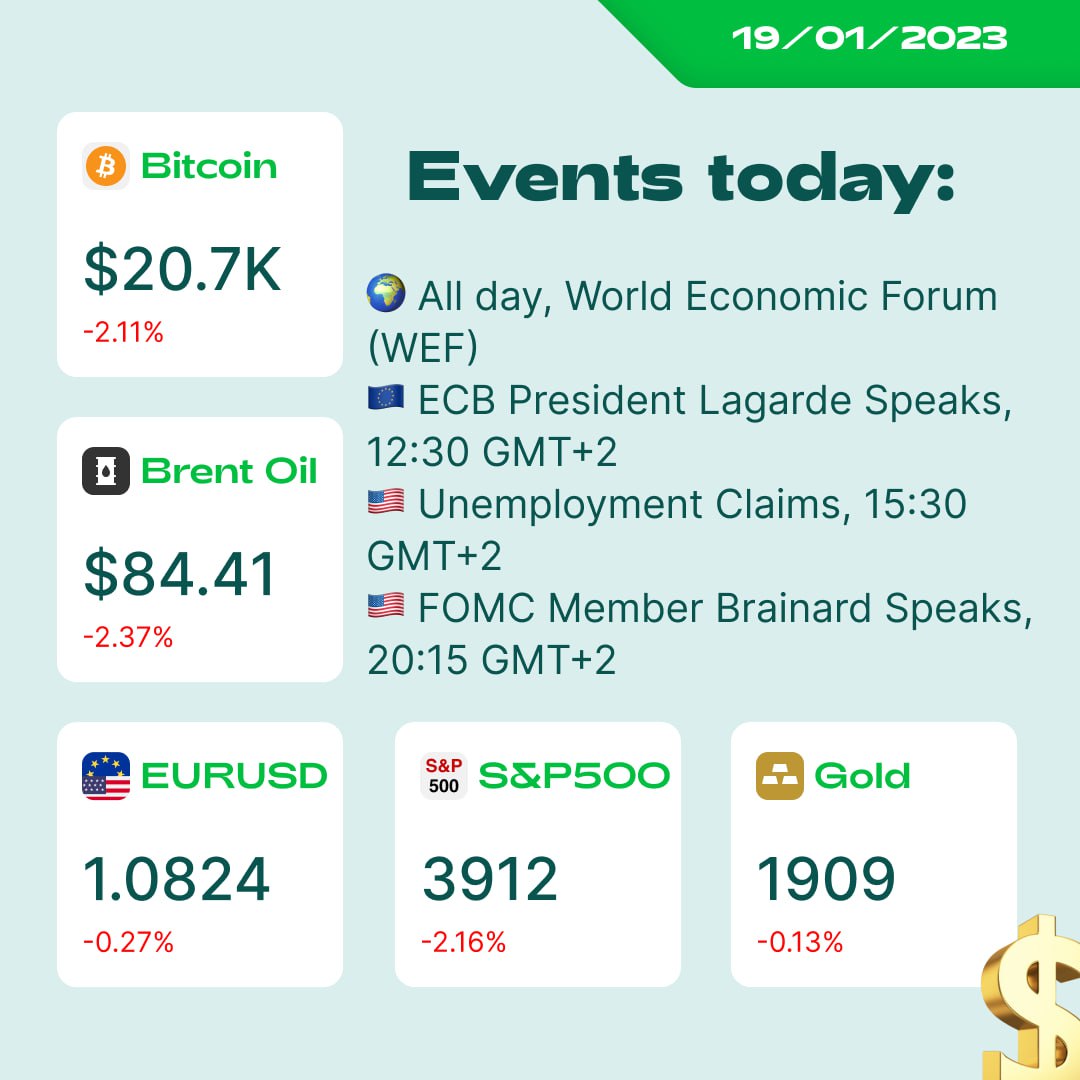
🇳🇿 New Zealand’s prime minister suddenly resigned despite expectations of her being elected for the third time. NZDUSD is down 2%.
🥈Alcoa corporation released better-than-expected results yesterday. However, the stock was down 6%.
🇦🇺 The unemployment rate in Australia rose to 3.6% from 3.5% in the previous month. AUDUSD is down 640 points since the release.
🇺🇸 Bad Retail Sales data in the US caused EURUSD to fall 800 points. PPI is also way lower than expected (-0.5% actual vs. -0.1% forecast).
💸 US Ministry of Justice declared it would fight money laundering in the crypto industry, starting from the unpopular Russian exchange “Bitzlato,” which is responsible for $700 million of fraudulent activity. The crypto market lost 2%.
🏆 Gold is again rejected from the support line of $1900. The breakout would send the metal to $1885.
💭 How is your day?
💚 Hello traders! Another great day full of trading opportunities. Let’s dive in together!
🇳🇿 New Zealand’s prime minister suddenly resigned despite expectations of her being elected for the third time. NZDUSD is down 2%.
🥈Alcoa corporation released better-than-expected results yesterday. However, the stock was down 6%.
🇦🇺 The unemployment rate in Australia rose to 3.6% from 3.5% in the previous month. AUDUSD is down 640 points since the release.
🇺🇸 Bad Retail Sales data in the US caused EURUSD to fall 800 points. PPI is also way lower than expected (-0.5% actual vs. -0.1% forecast).
💸 US Ministry of Justice declared it would fight money laundering in the crypto industry, starting from the unpopular Russian exchange “Bitzlato,” which is responsible for $700 million of fraudulent activity. The crypto market lost 2%.
🏆 Gold is again rejected from the support line of $1900. The breakout would send the metal to $1885.
💭 How is your day?
👍23🔥6❤🔥4🐳4😍3❤1😈1🙈1
🇦🇺🇺🇸#AUDUSD
🔥AUDUSD - correction might happen!
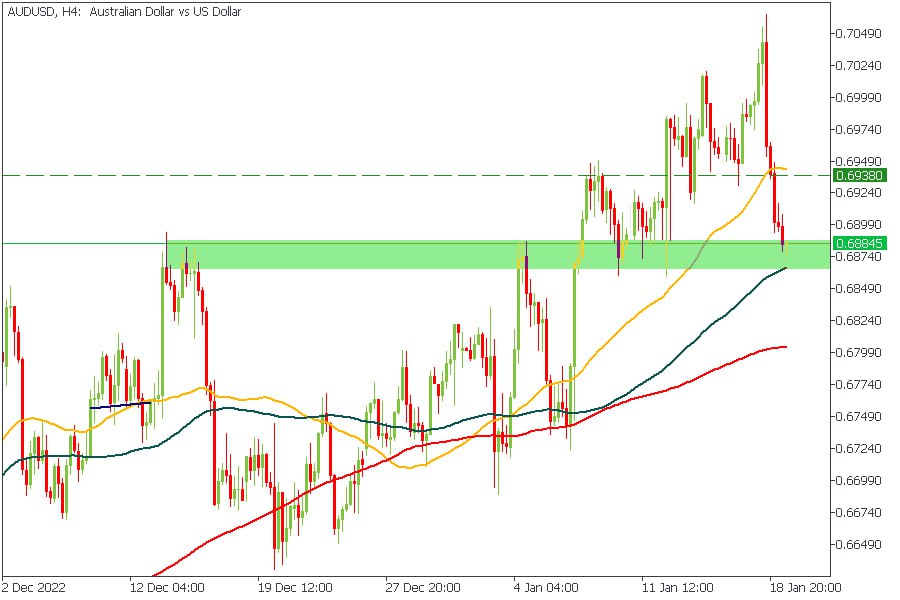
After a massive dump the price reached the support range and the 100-period moving average. Thus, we expect a tiny correction to happen here. Our target is the 50-period moving average.
🟢Trade: BUY
🎯Target: 0.6938
How often do you trade AUDUSD?
✅START TRADING ✅
🔥AUDUSD - correction might happen!
After a massive dump the price reached the support range and the 100-period moving average. Thus, we expect a tiny correction to happen here. Our target is the 50-period moving average.
🟢Trade: BUY
🎯Target: 0.6938
How often do you trade AUDUSD?
✅START TRADING ✅
👍28🔥4🐳4❤3❤🔥1
🇬🇧🇺🇸#GBPUSD
🔥GBPUSD looks bullish!
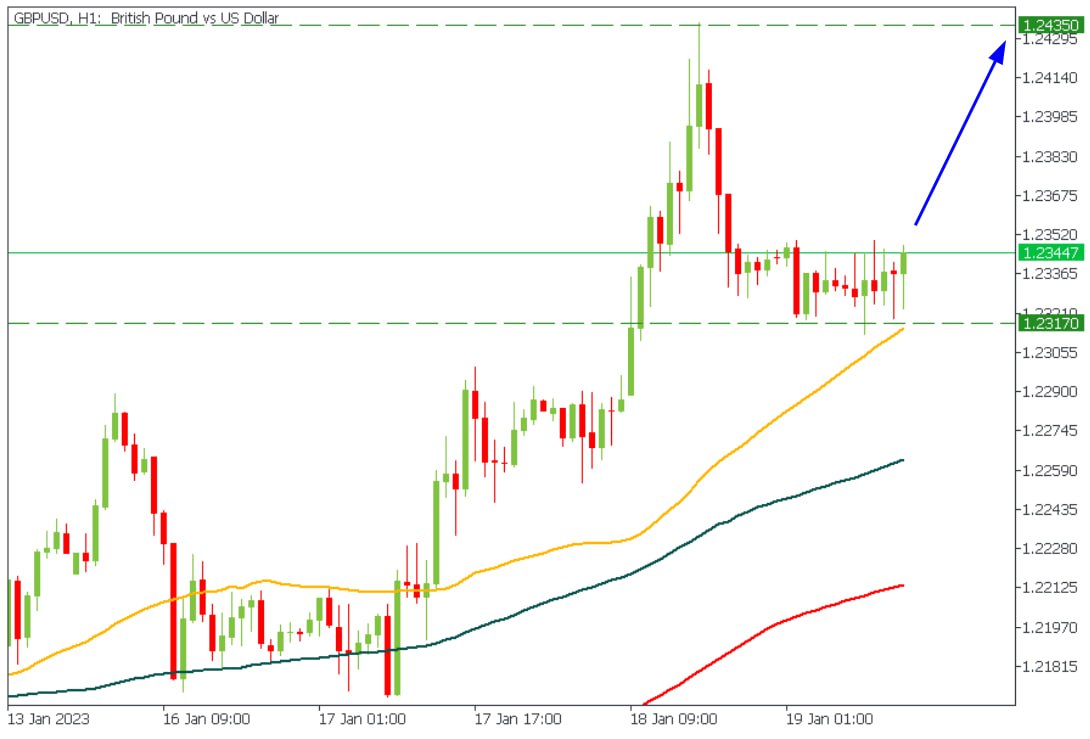
The price is rounding above the 50-hour moving average. Thus, we suggest the pair will make another attempt to break above the 1.2435.
🟢Trade: BUY
🎯Target: 1.2435
Do you agree?
✅START TRADING ✅
🔥GBPUSD looks bullish!
The price is rounding above the 50-hour moving average. Thus, we suggest the pair will make another attempt to break above the 1.2435.
🟢Trade: BUY
🎯Target: 1.2435
Do you agree?
✅START TRADING ✅
👍16❤5🔥5🍾2🙈1
#education
Smart money concept that works
⏸ Supply and demand trading is about placing your orders according to zones where the price tends to reverse due to various factors. It’s almost like support and resistance lines but wider and usually backed up by fundamental factors.
⚡️ Usually, the price reacts sharply to supply and demand zones, meaning there is a lot of selling or buying interest.
✅ But how do you know when to enter? That’s what the picture is about. Look for a rally-base-drop movement or other variations of it. The price tends to retest the base before moving toward the rally.
📍 These areas allow traders to implement a favorable risk-to-reward approach in trades. You can set a buy limit order before the price reaches the base, and the chart will do it for you. Notice that stop loss should usually be near the demand zone and below the supply zone.
💭 What else do you want to know about trading?
Smart money concept that works
⏸ Supply and demand trading is about placing your orders according to zones where the price tends to reverse due to various factors. It’s almost like support and resistance lines but wider and usually backed up by fundamental factors.
⚡️ Usually, the price reacts sharply to supply and demand zones, meaning there is a lot of selling or buying interest.
✅ But how do you know when to enter? That’s what the picture is about. Look for a rally-base-drop movement or other variations of it. The price tends to retest the base before moving toward the rally.
📍 These areas allow traders to implement a favorable risk-to-reward approach in trades. You can set a buy limit order before the price reaches the base, and the chart will do it for you. Notice that stop loss should usually be near the demand zone and below the supply zone.
💭 What else do you want to know about trading?

👍49🔥17❤🔥6👌4🐳4🍾3✍2🍌2
💰What’s your average target for one trade?
Anonymous Poll
32%
0-50 points
32%
50-100 points
14%
100-200 points
9%
200-500 points
6%
500-1000 points
8%
>1000 points
👍44❤23🤪15❤🔥5🙈4🔥3⚡2🥰2😍2🐳1
🇺🇸🇨🇦#USDCAD
USDCAD looks bullish!
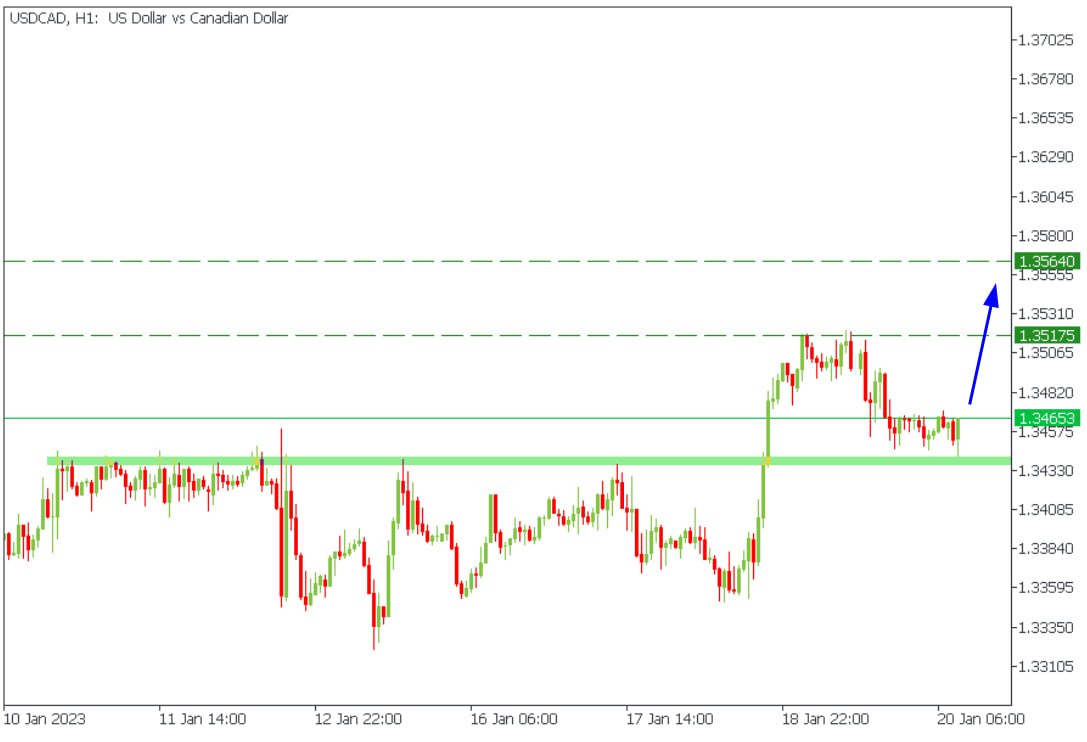
The price retested the breakout and bounced back. Thus, we believe the rally in USDCAD might continue.
🟢Trade: BUY
🎯Targets: 1.35175, 1.3565
Do you agree? Hit 🔥 if yes!
✅TRY TRADING WITH FBS ✅
USDCAD looks bullish!
The price retested the breakout and bounced back. Thus, we believe the rally in USDCAD might continue.
🟢Trade: BUY
🎯Targets: 1.35175, 1.3565
Do you agree? Hit 🔥 if yes!
✅TRY TRADING WITH FBS ✅
🔥41👍12❤7😱4
#MarketNews
💚 Happy Friday, traders! Let's start the day!
🇬🇧JPMorgan improves UK GDP forecast to -0.1% from -0.3% in 2023. The bank raised the forecast for the peak rate of the Central Bank of England to 4.5% from 4.25%.
🇺🇸The US national debt has reached its ceiling. The Biden administration refused to discuss the conditions for raising the national debt ceiling with the US Congress and called for an immediate decision to increase its level. The US national debt reached its ceiling. The Biden administration refused to discuss the conditions for raising the national debt ceiling with the US Congress and called for an immediate increase.
🇯🇵Core inflation in Japan hit a 41-year high of 4%.
📺Netflix stock gained 7% after the earnings release as the number of subscribers overperformed expectations.
🏦JPMorgan believes investors should sell shares and take profits. The risks of a recession and excessive tightening of the Fed's policy remain high, so the US stock market is expected to fall.
Would you like to know what pattern EURUSD is trading in?
Smash ❤️!
💚 Happy Friday, traders! Let's start the day!
🇬🇧JPMorgan improves UK GDP forecast to -0.1% from -0.3% in 2023. The bank raised the forecast for the peak rate of the Central Bank of England to 4.5% from 4.25%.
🇺🇸The US national debt has reached its ceiling. The Biden administration refused to discuss the conditions for raising the national debt ceiling with the US Congress and called for an immediate decision to increase its level. The US national debt reached its ceiling. The Biden administration refused to discuss the conditions for raising the national debt ceiling with the US Congress and called for an immediate increase.
🇯🇵Core inflation in Japan hit a 41-year high of 4%.
📺Netflix stock gained 7% after the earnings release as the number of subscribers overperformed expectations.
🏦JPMorgan believes investors should sell shares and take profits. The risks of a recession and excessive tightening of the Fed's policy remain high, so the US stock market is expected to fall.
Would you like to know what pattern EURUSD is trading in?
Smash ❤️!
❤35👍18🔥4🍾2
😱😱If your heartbeat is increasing with every sec and your palms are getting sweaty when you are about to click Buy or Sell buttons, you have to watch our new vid.
💚 We’ve gathered 3 trading psychology tips to help you avoid emotional roller coasters while trading.
➡️ http://bit.ly/3XHTFL1
💚 We’ve gathered 3 trading psychology tips to help you avoid emotional roller coasters while trading.
Please open Telegram to view this post
VIEW IN TELEGRAM
YouTube
How to Control Hope, Fear, Greed. Emotional Trading
Emotional trading is something that is familiar to every trader. It truly is challenging to deal with hope, fear, and greed in trading because trading is challenging. Wrong and hasty choices may bring losses. The best thing you can do is to stay calm and…
👍15❤5👏5🐳4❤🔥3🤓3🔥2👌1😍1🍾1
🇪🇺🇺🇸#EURUSD
🔥EURUSD looks bearish!
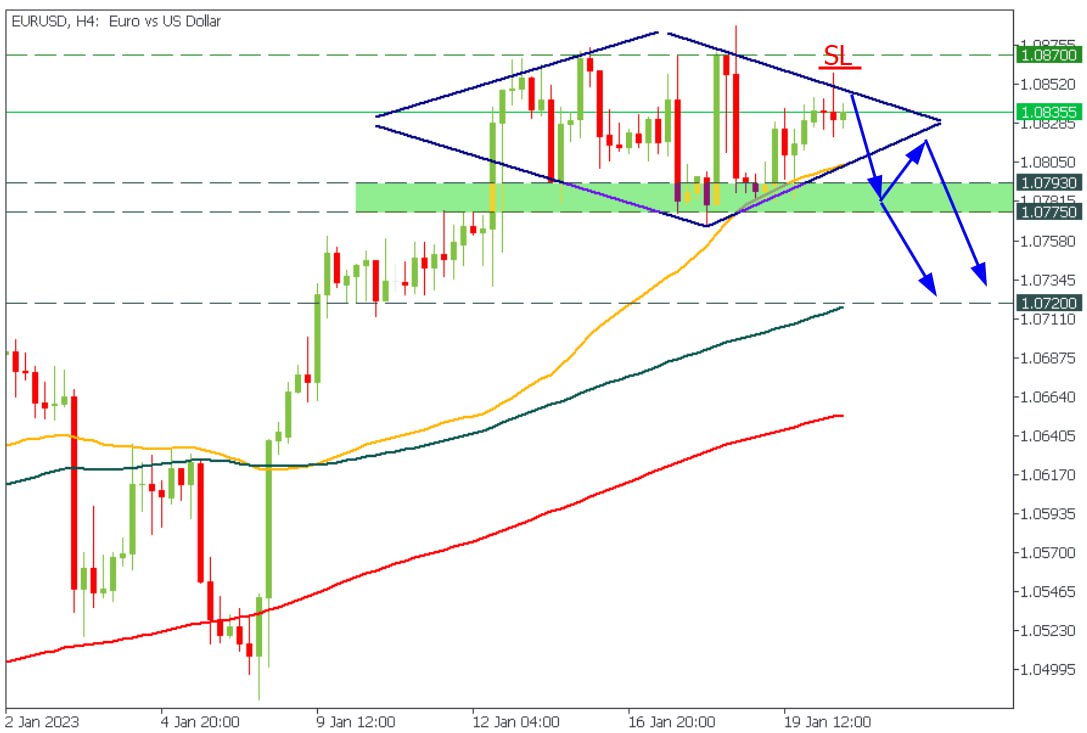
The price has formed a perfect diamond pattern. Thus, we suggest looking for sell opportunities.
👍The best entry points are:
1️⃣Sell at the upper border of the Diamond with the SL above the trend line at the target at the lower Diamond's border.
2️⃣Sell after the breakout below the lower Diamond's border and the 1.0775 - 1.0793 support range. In this case, the target will be at 1.0720.
🤔Would EURUSD reverse soon?
✅TRY TRADING WITH FBS ✅
🔥EURUSD looks bearish!
The price has formed a perfect diamond pattern. Thus, we suggest looking for sell opportunities.
👍The best entry points are:
1️⃣Sell at the upper border of the Diamond with the SL above the trend line at the target at the lower Diamond's border.
2️⃣Sell after the breakout below the lower Diamond's border and the 1.0775 - 1.0793 support range. In this case, the target will be at 1.0720.
🤔Would EURUSD reverse soon?
✅TRY TRADING WITH FBS ✅
👍26🔥7🐳4❤3
FBS Analytics
🇦🇺🇺🇸#AUDUSD 🔥AUDUSD - correction might happen! After a massive dump the price reached the support range and the 100-period moving average. Thus, we expect a tiny correction to happen here. Our target is the 50-period moving average. 🟢Trade: BUY 🎯Target:…
🇦🇺🇺🇸#AUDUSD
🔥AUDUSD looks bearish!
The price reached our target☝️ and bounced back. Moreover, the price broke through the ascending support trend line. Thus, right now we are selling AUDUSD with the target at 0.6875.
😈 Are you with us?
✅START TRADING ✅
🔥AUDUSD looks bearish!
The price reached our target
✅START TRADING ✅
Please open Telegram to view this post
VIEW IN TELEGRAM
👍30🔥7🐳3🙈2
#Best_Investments
Part 5
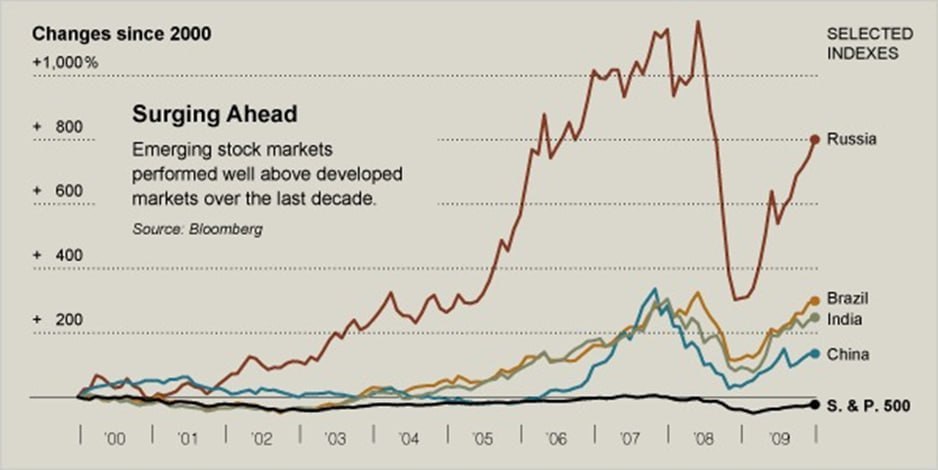
2️⃣0️⃣0️⃣0️⃣, emerging markets!
💹 As you can see, overvaluation is a common problem that follows the market almost every decade, leading to high risks and huge losses.
📚 History repeats itself, and in the 2000s, we witnessed another round of overvaluation. This time, emerging markets were in the limelight.
🌊 Huge flows of foreign investments went to emerging countries with higher risks and rewards. For example, Russia benefited from soaring oil prices, and its main stock gauge gained 880% over the decade, even despite the market crash of 2008.
🚀 Other high-yield markets are Brazil, with over 300% growth, India, and China. Meanwhile, the US500 index finished the decade with a loss of several percent.
Give us a ❤️ if you want the next part to come!
How long ago did you start trading?
Part 5
2️⃣0️⃣0️⃣0️⃣, emerging markets!
💹 As you can see, overvaluation is a common problem that follows the market almost every decade, leading to high risks and huge losses.
📚 History repeats itself, and in the 2000s, we witnessed another round of overvaluation. This time, emerging markets were in the limelight.
🌊 Huge flows of foreign investments went to emerging countries with higher risks and rewards. For example, Russia benefited from soaring oil prices, and its main stock gauge gained 880% over the decade, even despite the market crash of 2008.
🚀 Other high-yield markets are Brazil, with over 300% growth, India, and China. Meanwhile, the US500 index finished the decade with a loss of several percent.
Give us a ❤️ if you want the next part to come!
How long ago did you start trading?
❤79👍18❤🔥6🐳5🍾4😍3🔥2🤪2😢1
#Education
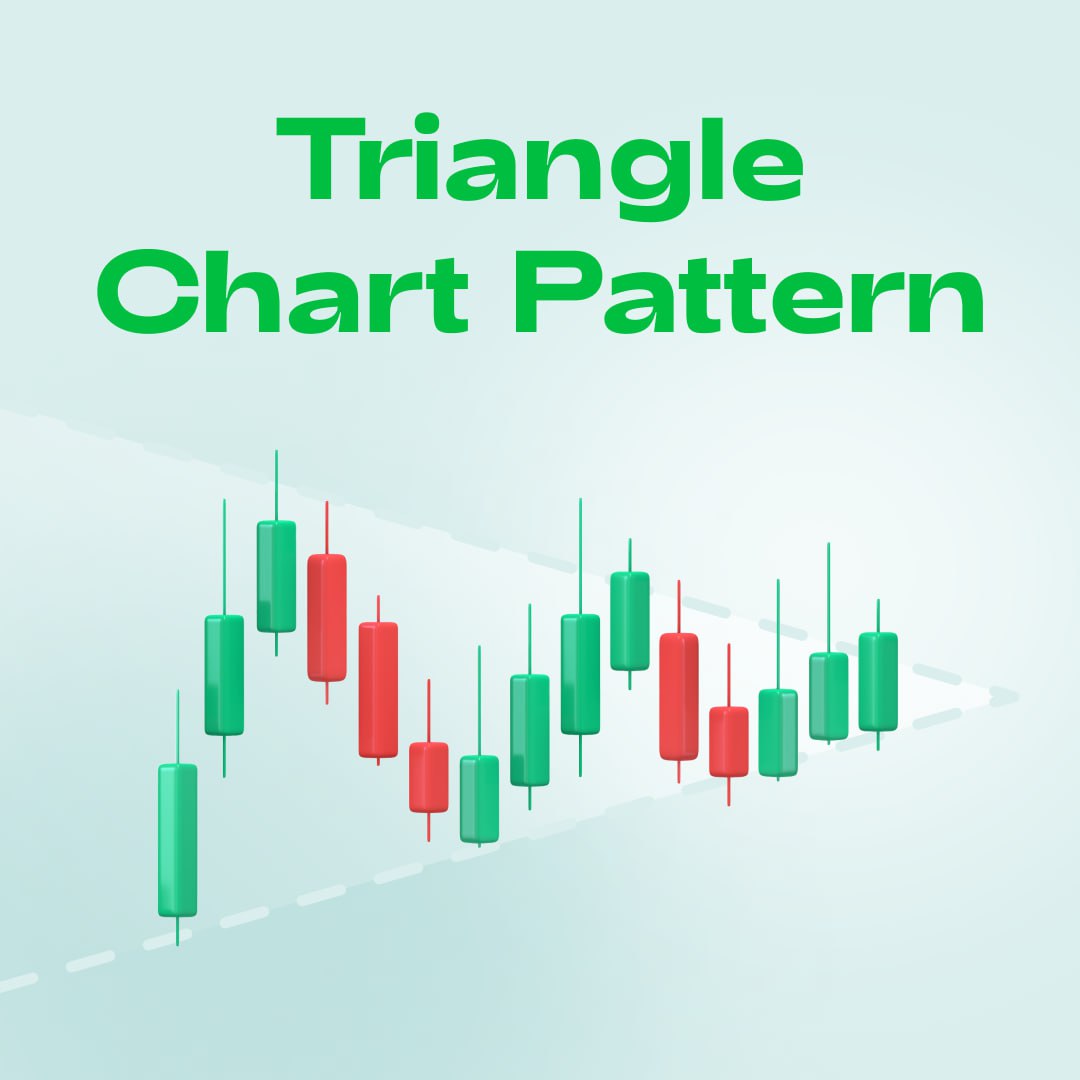
🔺Triangle patterns
Triangle patterns are one of the most common patterns you can meet daily! That's why it is important to learn how to trade them correctly.
👇This article describes the rules for trading all types of triangle patterns.
Read the article: http://bit.ly/3we0JTX
🔺Triangle patterns
Triangle patterns are one of the most common patterns you can meet daily! That's why it is important to learn how to trade them correctly.
👇This article describes the rules for trading all types of triangle patterns.
Read the article: http://bit.ly/3we0JTX
👍59❤5🔥5😱4😢3🐳3🤪3🍓2🍾2💋2🗿1
↩️How to Spot a Trend Reversal?
👦The trend is a trader's friend - one of the most famous and important sayings about the financial markets. Every trader knows that following the market is the easiest way to succeed. For example, if the market is bullish, a trader must wait for downside corrections and look for buy trade opportunities. On the contrary, a trader must wait for upside corrections and look for sell trade opportunities.
Why is it so important to stop a trend reversal?
The correct definition of a trend reversal will allow you to:
✅Exit your previous positions
✅Open positions following a new trend
How do you know a trend is reversing?
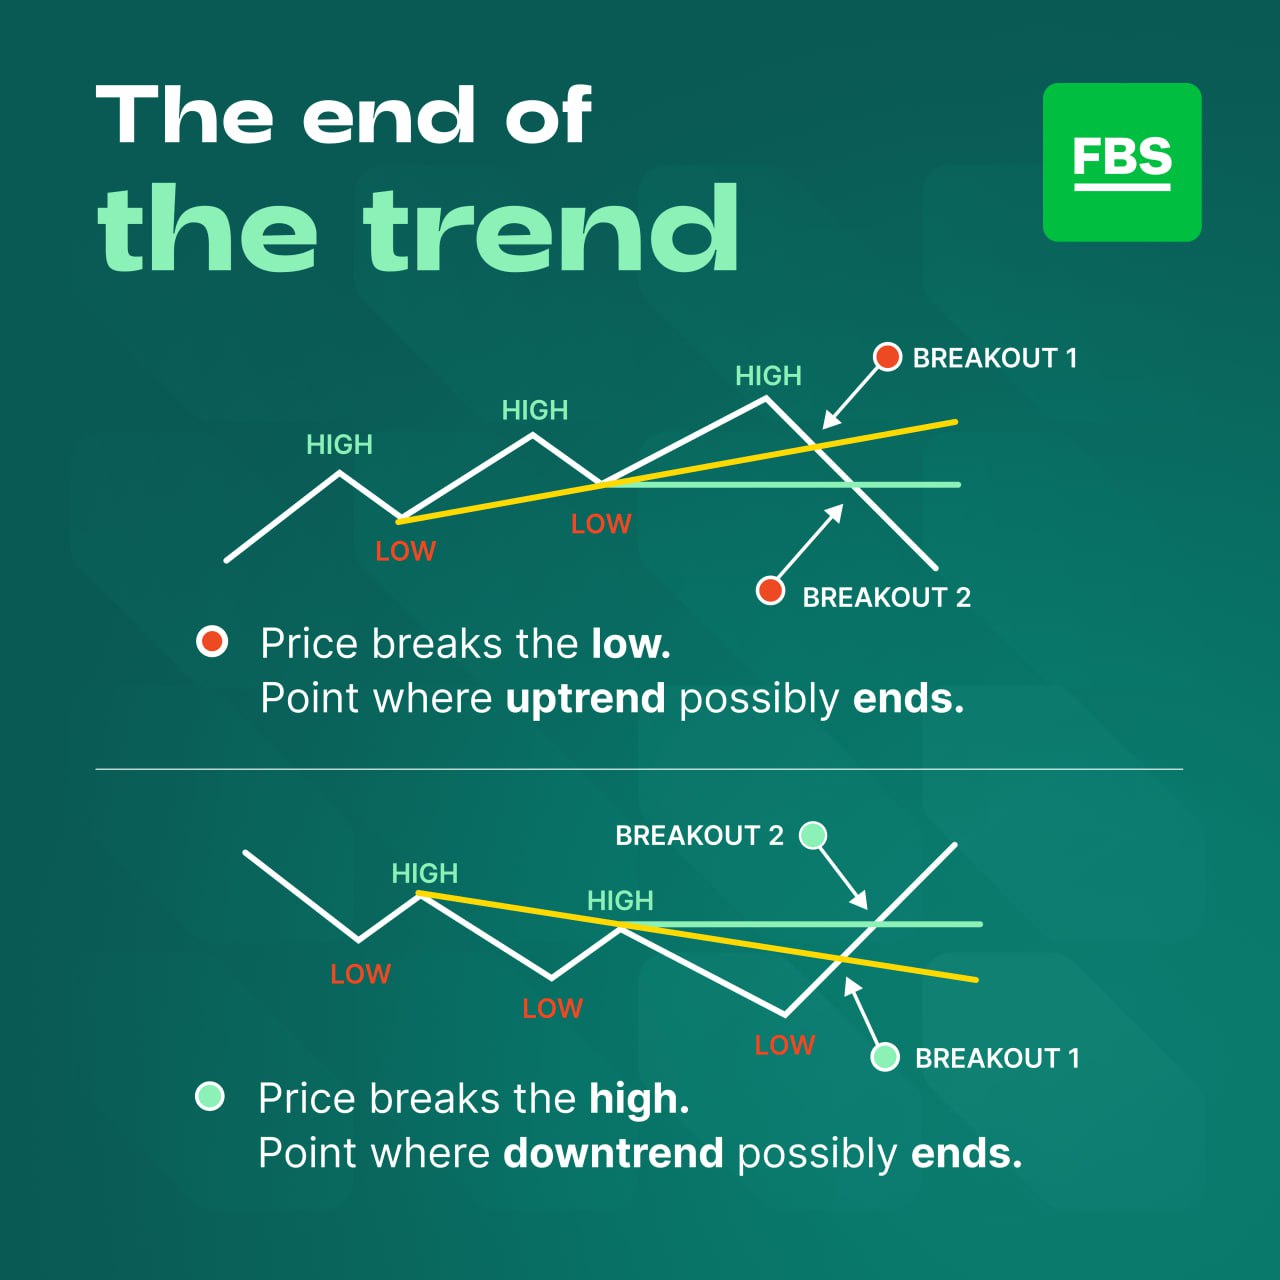
Scenario 1: The main sign of a strong bullish trend is that each next bottom should be higher than the previous one. The line that connects these bottoms forms the support trend line.
1️⃣The first sign of a trend reversal is when the price falls below the support line. This breakout is our first entry point for a trend reversal.
2️⃣The second and most important sign of a bullish trend reversal is a price drop below the recent bottom, which means the weakness of buyers and the dominance of sellers in the market. This breakout is our second sell entry point.
Scenario 2: The main sign of a strong bearish trend is that each next high should be lower than the previous one. The line that connects these highs forms the resistance trend line.
1️⃣The first sign of a trend reversal is the price breakout above the resistance line. This breakout is our first buy entry point.
2️⃣The second and most important sign of a bearish trend reversal is a price breakout above the recent high, meaning the sellers' weakness and the buyers' dominance in the market. This breakout is the second buy entry point.
Now you know how to define a trend reversal! What else do you want to know about trading?
➡️Want more? Read the article: http://bit.ly/3Xi8GmR
👦The trend is a trader's friend - one of the most famous and important sayings about the financial markets. Every trader knows that following the market is the easiest way to succeed. For example, if the market is bullish, a trader must wait for downside corrections and look for buy trade opportunities. On the contrary, a trader must wait for upside corrections and look for sell trade opportunities.
Why is it so important to stop a trend reversal?
The correct definition of a trend reversal will allow you to:
✅Exit your previous positions
✅Open positions following a new trend
How do you know a trend is reversing?
Scenario 1: The main sign of a strong bullish trend is that each next bottom should be higher than the previous one. The line that connects these bottoms forms the support trend line.
1️⃣The first sign of a trend reversal is when the price falls below the support line. This breakout is our first entry point for a trend reversal.
2️⃣The second and most important sign of a bullish trend reversal is a price drop below the recent bottom, which means the weakness of buyers and the dominance of sellers in the market. This breakout is our second sell entry point.
Scenario 2: The main sign of a strong bearish trend is that each next high should be lower than the previous one. The line that connects these highs forms the resistance trend line.
1️⃣The first sign of a trend reversal is the price breakout above the resistance line. This breakout is our first buy entry point.
2️⃣The second and most important sign of a bearish trend reversal is a price breakout above the recent high, meaning the sellers' weakness and the buyers' dominance in the market. This breakout is the second buy entry point.
Now you know how to define a trend reversal! What else do you want to know about trading?
➡️Want more? Read the article: http://bit.ly/3Xi8GmR
👍76❤11🐳5❤🔥4🔥2🍾2😈2😁1🥱1
🇪🇺🇺🇸#EURUSD
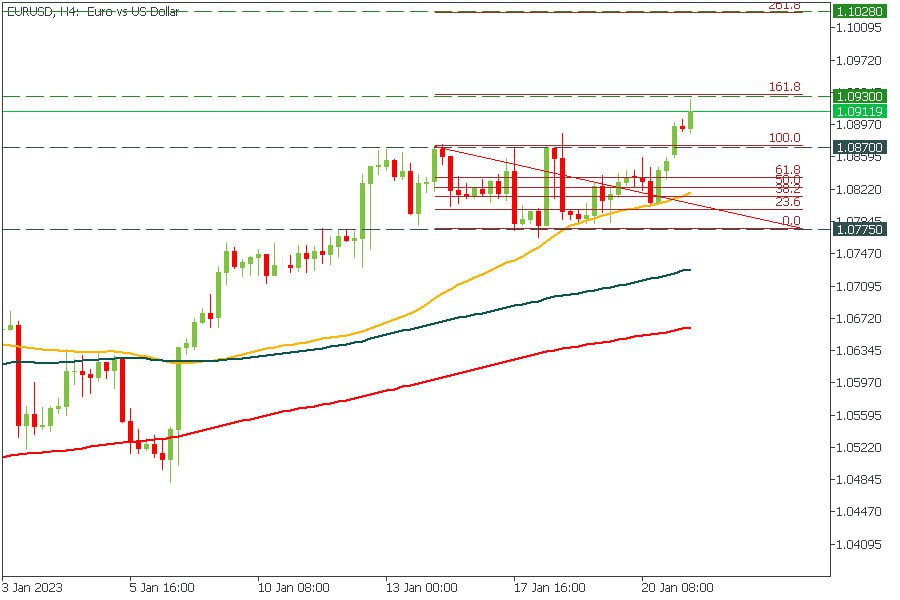
🔥The pair might pull back soon!
According to the Fibonacci retracement, the level of 1.0930 is a 161.8 Fibonacci level. Thus, it might act as a solid resistance for the price. That's why you might be looking for sell trades around this level with the target at 1.0870.
Are you bullish or bearish on the EURUSD today?
✅START TRADING ✅
🔥The pair might pull back soon!
According to the Fibonacci retracement, the level of 1.0930 is a 161.8 Fibonacci level. Thus, it might act as a solid resistance for the price. That's why you might be looking for sell trades around this level with the target at 1.0870.
Are you bullish or bearish on the EURUSD today?
✅START TRADING ✅
👍24🔥16❤4🐳3❤🔥1🥰1
#MarketNews
💚 Happy Monday, dear traders! Let's see what news is moving the markets at the beginning of the week!
🇯🇵According to the Bank of Japan meeting minutes, all group members consider it critical to maintain the soft monetary policy. Moreover, incentives will be increased if needed. Overall, the discussion was about how to make monetary policy easing more sustainable.
🇺🇸Bloomberg survey shows nearly 20% of US firms expect to reduce the number of employees.
💸World managers continue to build up shorts in the USD. The US dollar index is trading at 101.81.
🍏Indian Commerce Minister stated Apple plans to move up to 25% of production to India, which is now 5-7%.
🇨🇳Chinese household savings increased significantly in 2022. As a result, a $720 billion inflation bomb comes with China's opening.
🛢XBRUSD is moving toward the 88.75 resistance = monthly high.
☢️BTCUSD broke above $22 500. Currently, the price is heading toward $24 500, the 6-months high.
🥇What are your thoughts about XAUUSD?
💚 Happy Monday, dear traders! Let's see what news is moving the markets at the beginning of the week!
🇯🇵According to the Bank of Japan meeting minutes, all group members consider it critical to maintain the soft monetary policy. Moreover, incentives will be increased if needed. Overall, the discussion was about how to make monetary policy easing more sustainable.
🇺🇸Bloomberg survey shows nearly 20% of US firms expect to reduce the number of employees.
💸World managers continue to build up shorts in the USD. The US dollar index is trading at 101.81.
🍏Indian Commerce Minister stated Apple plans to move up to 25% of production to India, which is now 5-7%.
🇨🇳Chinese household savings increased significantly in 2022. As a result, a $720 billion inflation bomb comes with China's opening.
🛢XBRUSD is moving toward the 88.75 resistance = monthly high.
☢️BTCUSD broke above $22 500. Currently, the price is heading toward $24 500, the 6-months high.
🥇What are your thoughts about XAUUSD?

👍19🔥4❤2🐳2🤪2
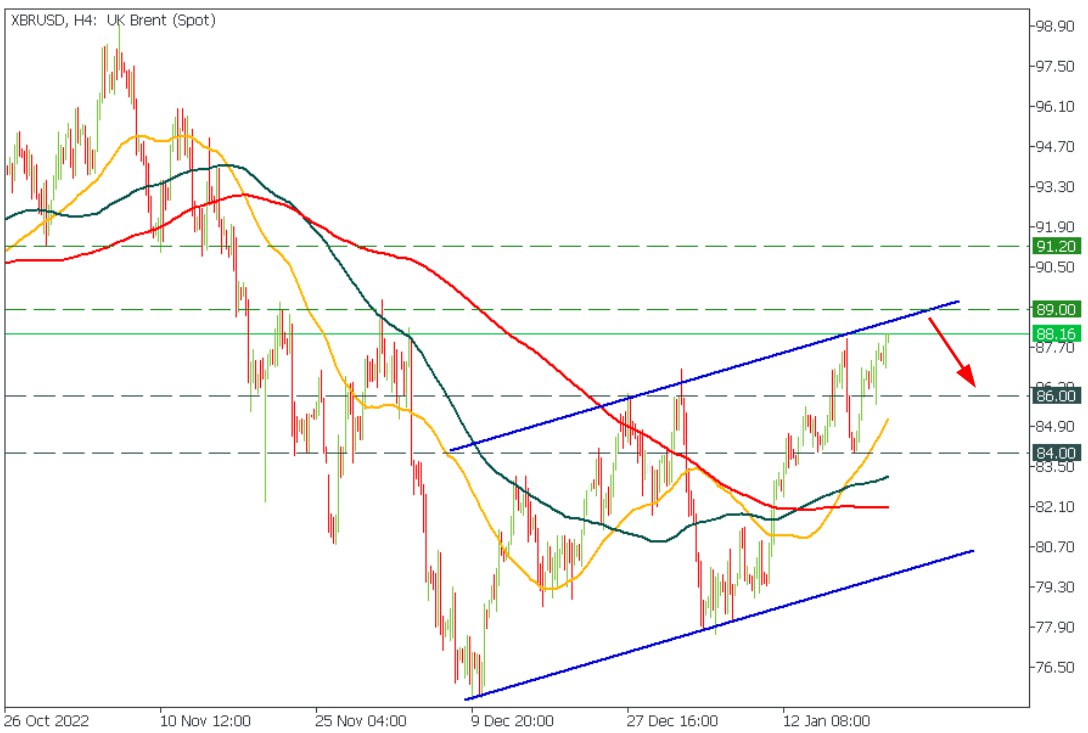
🛢#XBRUSD
🔥XBRUSD might reverse soon!
The price is slowly moving toward the upper border of the ascending channel and the 89.00 resistance level. Consider looking for sell trade opportunities around 89.00 and the target at 86.00.
❗️However, if the price breaks through the upper channel's border, the price will fly to 91.20.
How often do you trade Brent?
✅START TRADING ✅
🔥XBRUSD might reverse soon!
The price is slowly moving toward the upper border of the ascending channel and the 89.00 resistance level. Consider looking for sell trade opportunities around 89.00 and the target at 86.00.
❗️However, if the price breaks through the upper channel's border, the price will fly to 91.20.
How often do you trade Brent?
✅START TRADING ✅
👍16🔥4🐳4😍3