
#marketanalysis #MarketNews #stockmarket #stocktrading
Oracle Shares (ORCL) Surge Over 11% to Record High
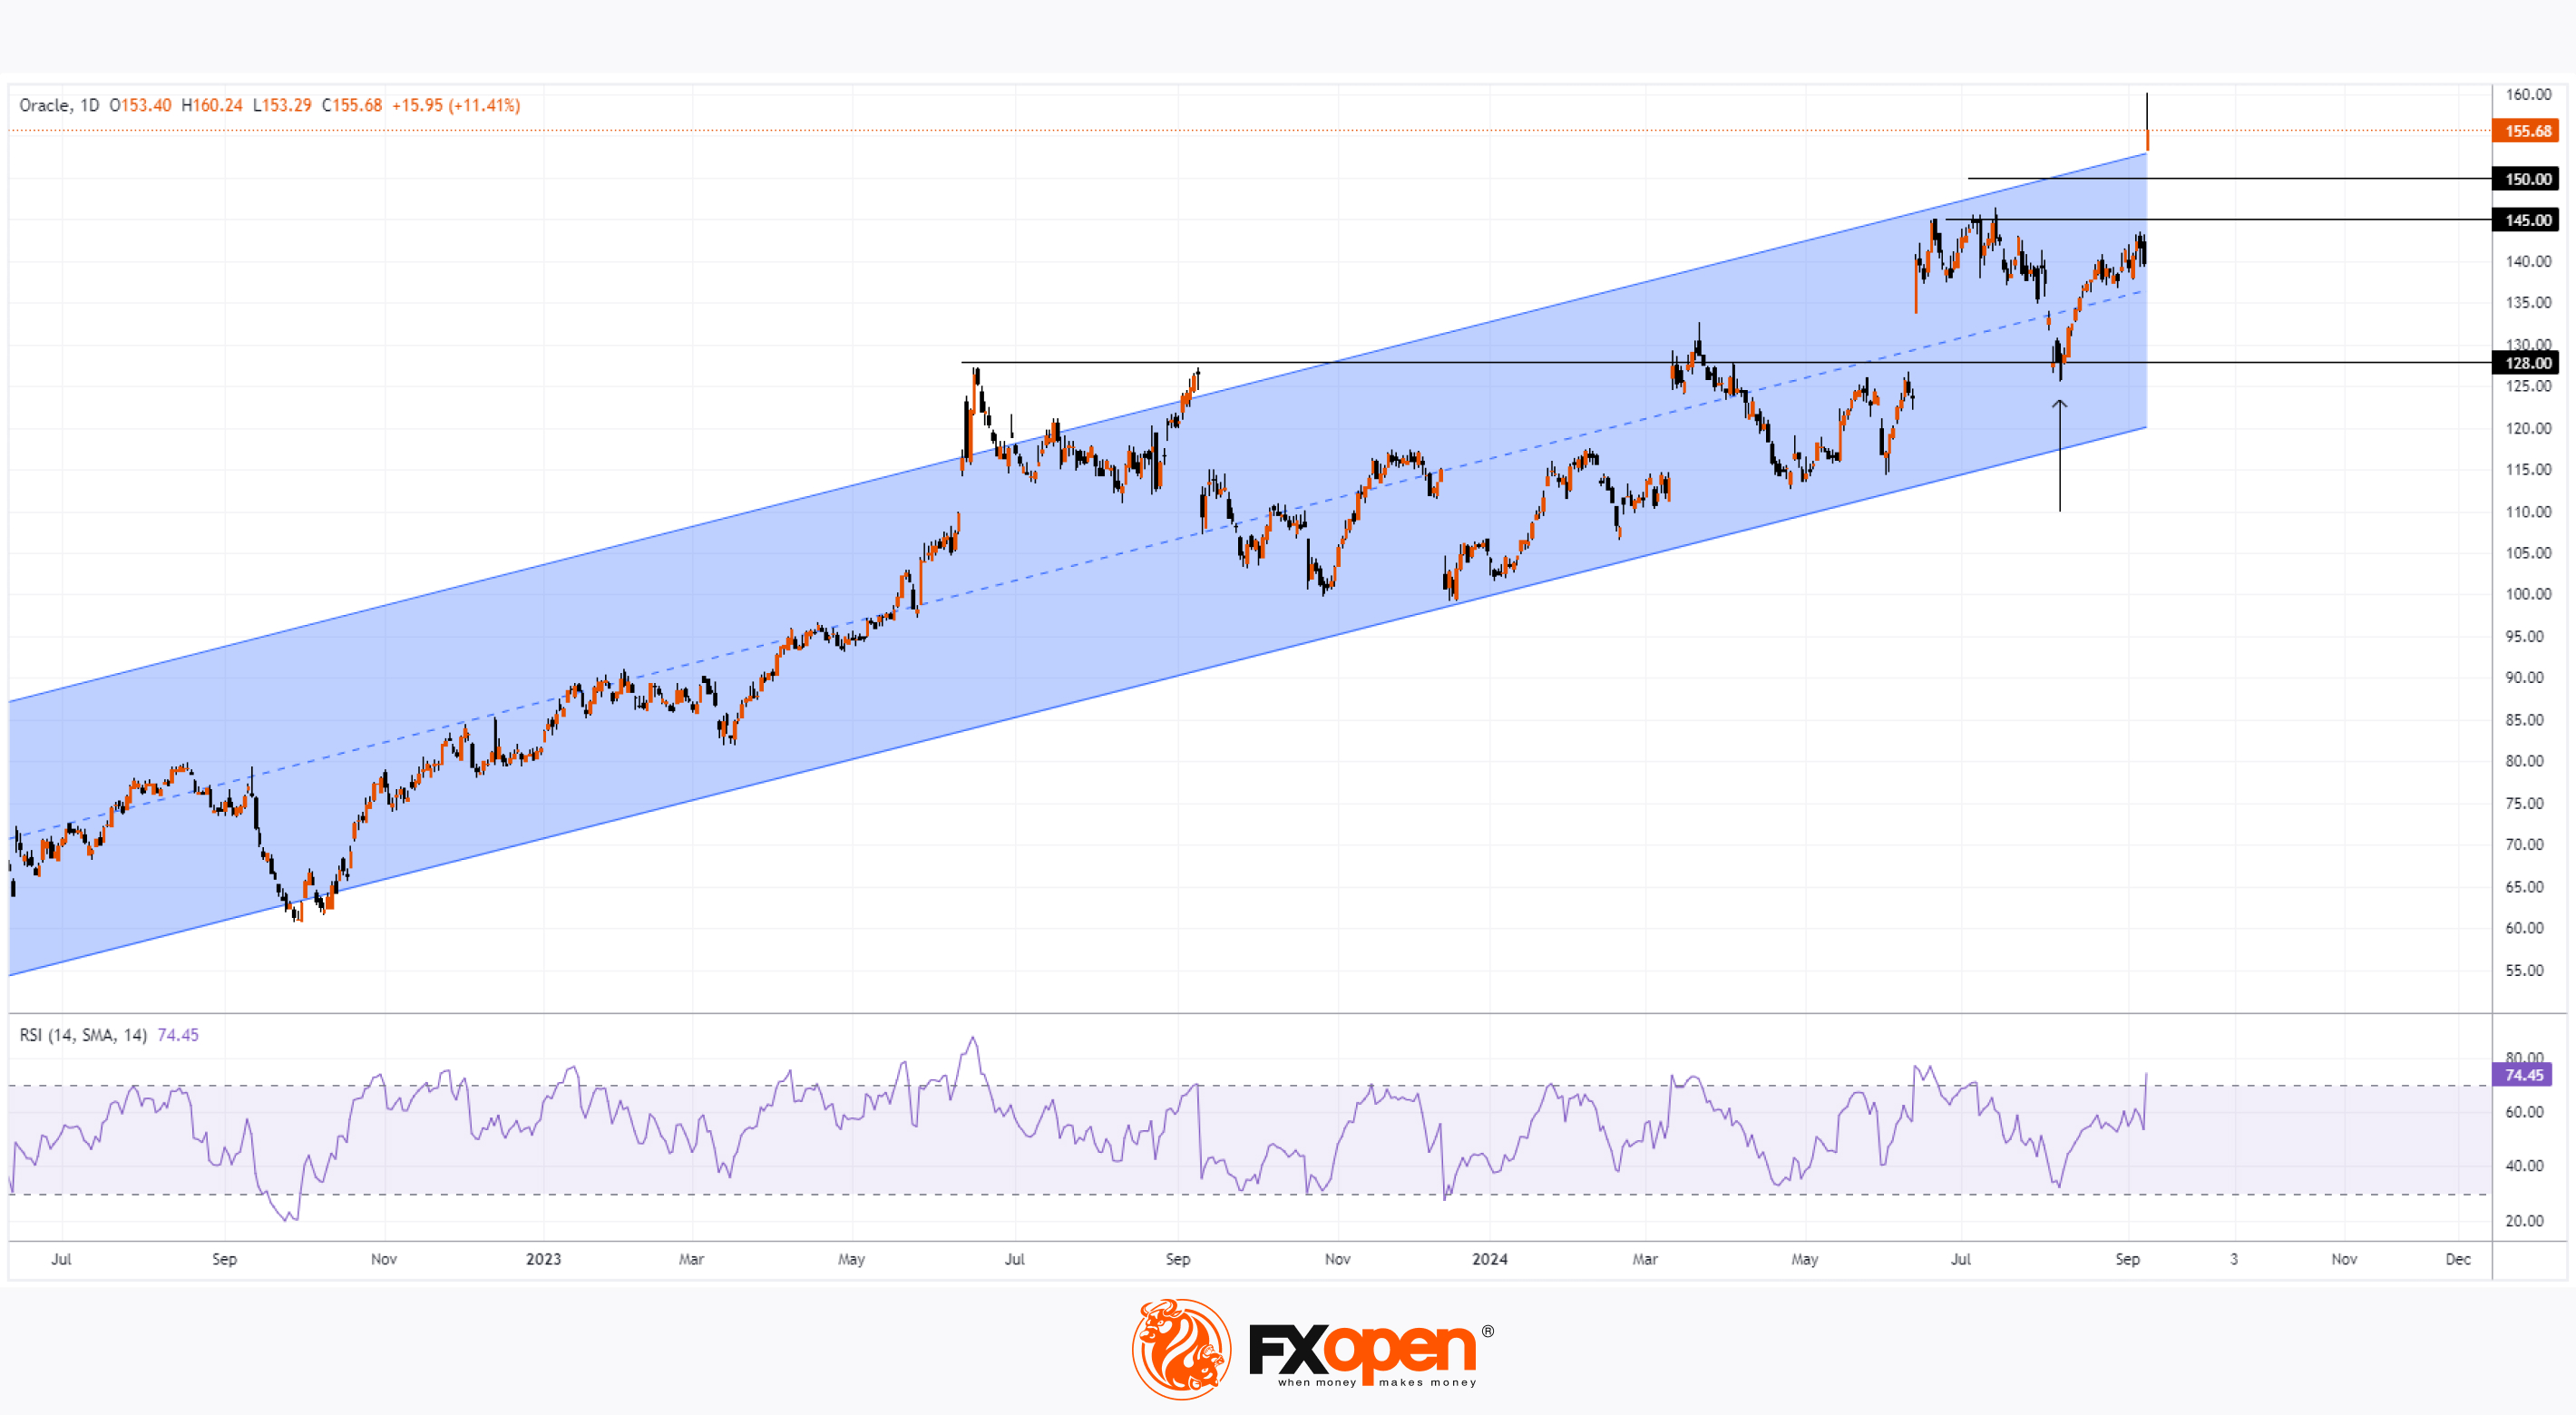
As the chart shows, Oracle Corp. (ORCL) closed yesterday’s trading session above $155, and during the session, the stock even climbed above $160, marking an all-time high.
The bullish sentiment is driven by a strong quarterly earnings report:
→ Earnings per share were $1.39, surpassing the $1.33 expected by FactSet analysts.
→ Revenue rose to $13.31 billion from $12.45 billion, beating the forecast of $13.23 billion.
"With cloud services becoming Oracle’s largest business, the growth in our operating profit and earnings per share has accelerated," said CEO Safra Catz in a press release.
Investors reacted positively to news of Oracle’s partnership with Amazon Web Services and projections of accelerated growth in the company’s order backlog.
However, technical analysis of Oracle Corp. (ORCL) shares suggests the market might be “overheated.” This is indicated by:
→ The price's position relative to the linear regression channel, which started in 2022. The price is significantly above the upper boundary.
→ The RSI indicator entering the overbought zone.
This situation is reminiscent of June 2023, when the price rose above the upper boundary of the channel but failed to break $128, eventually falling back below the median.
It’s possible that the current optimism around the strong report could fade, and profit-taking might lead to a correction. In this case, Oracle Corp. (ORCL) shares could test a potential support area formed by the psychological level of $150 and the former resistance of $145, which may switch roles, as seen with the $128 level (indicated by the arrow).
Trade global index CFDs with zero commission and tight spreads. Open your FXOpen account now or learn more about trading index CFDs with FXOpen.
CFDs are complex instruments and come with a high risk of losing your money.
This article represents the opinion of the Companies operating under the FXOpen brand only. It is not to be construed as an offer, solicitation, or recommendation with respect to products and services provided by the Companies operating under the FXOpen brand, nor is it to be considered financial advice.
Oracle Shares (ORCL) Surge Over 11% to Record High
As the chart shows, Oracle Corp. (ORCL) closed yesterday’s trading session above $155, and during the session, the stock even climbed above $160, marking an all-time high.
The bullish sentiment is driven by a strong quarterly earnings report:
→ Earnings per share were $1.39, surpassing the $1.33 expected by FactSet analysts.
→ Revenue rose to $13.31 billion from $12.45 billion, beating the forecast of $13.23 billion.
"With cloud services becoming Oracle’s largest business, the growth in our operating profit and earnings per share has accelerated," said CEO Safra Catz in a press release.
Investors reacted positively to news of Oracle’s partnership with Amazon Web Services and projections of accelerated growth in the company’s order backlog.
However, technical analysis of Oracle Corp. (ORCL) shares suggests the market might be “overheated.” This is indicated by:
→ The price's position relative to the linear regression channel, which started in 2022. The price is significantly above the upper boundary.
→ The RSI indicator entering the overbought zone.
This situation is reminiscent of June 2023, when the price rose above the upper boundary of the channel but failed to break $128, eventually falling back below the median.
It’s possible that the current optimism around the strong report could fade, and profit-taking might lead to a correction. In this case, Oracle Corp. (ORCL) shares could test a potential support area formed by the psychological level of $150 and the former resistance of $145, which may switch roles, as seen with the $128 level (indicated by the arrow).
Trade global index CFDs with zero commission and tight spreads. Open your FXOpen account now or learn more about trading index CFDs with FXOpen.
CFDs are complex instruments and come with a high risk of losing your money.
This article represents the opinion of the Companies operating under the FXOpen brand only. It is not to be construed as an offer, solicitation, or recommendation with respect to products and services provided by the Companies operating under the FXOpen brand, nor is it to be considered financial advice.
👍2
#USDJPY #marketanalysis #MarketNews #forextrading
USD/JPY Analysis: Rate Drops to New Yearly Low
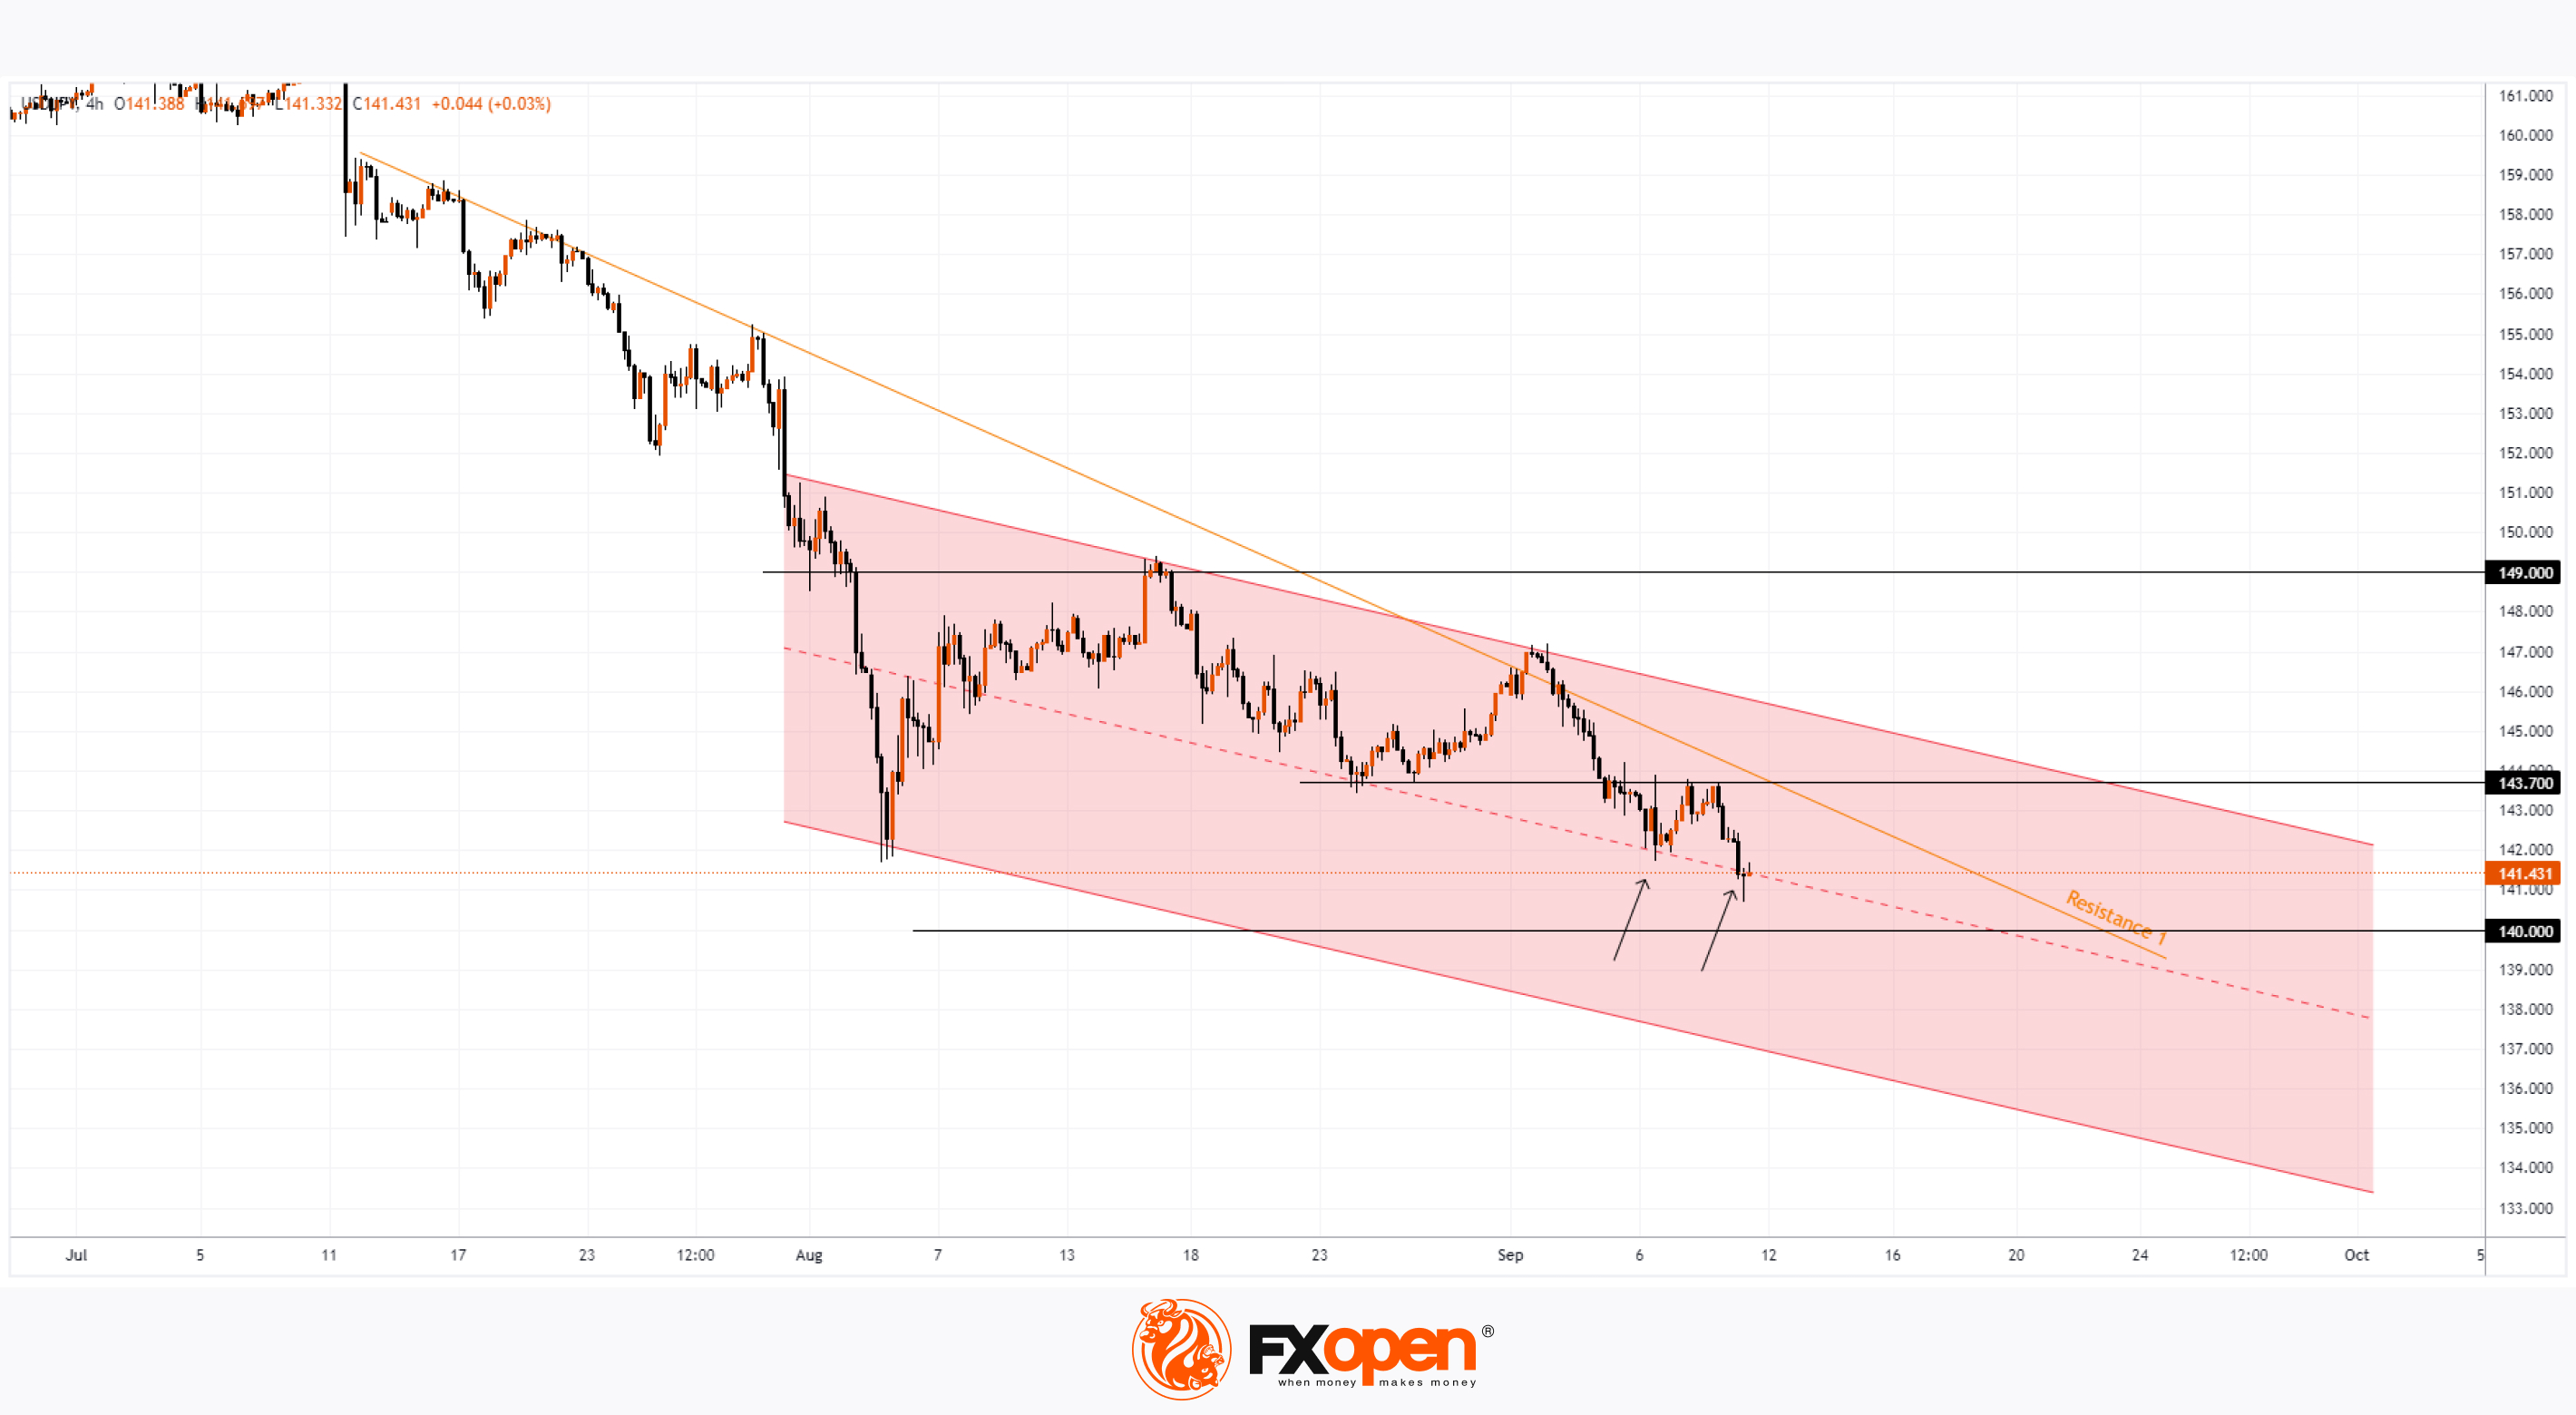
The USD/JPY chart shows the rate has fallen below its 5 August low.
This decline was influenced by comments from Bank of Japan representative Junko Nakagawa, who stated that the bank would continue raising interest rates if inflation keeps decreasing.
“Given that real interest rates are currently very low, we will adjust the level of monetary support to ensure the sustainable and stable achievement of our 2% inflation target,” she said.
Technical analysis of the USD/JPY chart shows:
→ Since early August, the price movement has fit within a descending channel (shown in red). → The price has fallen to the median of this channel, which continues to show signs of support (indicated by arrows).
Bearish dominance is evident as:
→ The 143.7 level has shifted from support to resistance, as previously happened with the 149 level.
→ The price is below the Resistance 1 trendline.
It’s worth noting that at 15:30 today, the US Consumer Price Index will be released, which is likely to cause increased market volatility.
As a result, bears may attempt to push the rate down to the psychological level of 140 yen per dollar as early as today.
Trade over 50 forex markets 24 hours a day with FXOpen. Take advantage of low commissions, deep liquidity, and spreads from 0.0 pips. Open your FXOpen account now or learn more about trading forex with FXOpen.
CFDs are complex instruments and come with a high risk of losing your money.
This article represents the opinion of the Companies operating under the FXOpen brand only. It is not to be construed as an offer, solicitation, or recommendation with respect to products and services provided by the Companies operating under the FXOpen brand, nor is it to be considered financial advice.
USD/JPY Analysis: Rate Drops to New Yearly Low
The USD/JPY chart shows the rate has fallen below its 5 August low.
This decline was influenced by comments from Bank of Japan representative Junko Nakagawa, who stated that the bank would continue raising interest rates if inflation keeps decreasing.
“Given that real interest rates are currently very low, we will adjust the level of monetary support to ensure the sustainable and stable achievement of our 2% inflation target,” she said.
Technical analysis of the USD/JPY chart shows:
→ Since early August, the price movement has fit within a descending channel (shown in red). → The price has fallen to the median of this channel, which continues to show signs of support (indicated by arrows).
Bearish dominance is evident as:
→ The 143.7 level has shifted from support to resistance, as previously happened with the 149 level.
→ The price is below the Resistance 1 trendline.
It’s worth noting that at 15:30 today, the US Consumer Price Index will be released, which is likely to cause increased market volatility.
As a result, bears may attempt to push the rate down to the psychological level of 140 yen per dollar as early as today.
Trade over 50 forex markets 24 hours a day with FXOpen. Take advantage of low commissions, deep liquidity, and spreads from 0.0 pips. Open your FXOpen account now or learn more about trading forex with FXOpen.
CFDs are complex instruments and come with a high risk of losing your money.
This article represents the opinion of the Companies operating under the FXOpen brand only. It is not to be construed as an offer, solicitation, or recommendation with respect to products and services provided by the Companies operating under the FXOpen brand, nor is it to be considered financial advice.
👍2
#sp500 #stockmarket #MarketNews #stocktrading
S&P 500 Rises Following Inflation Data Release
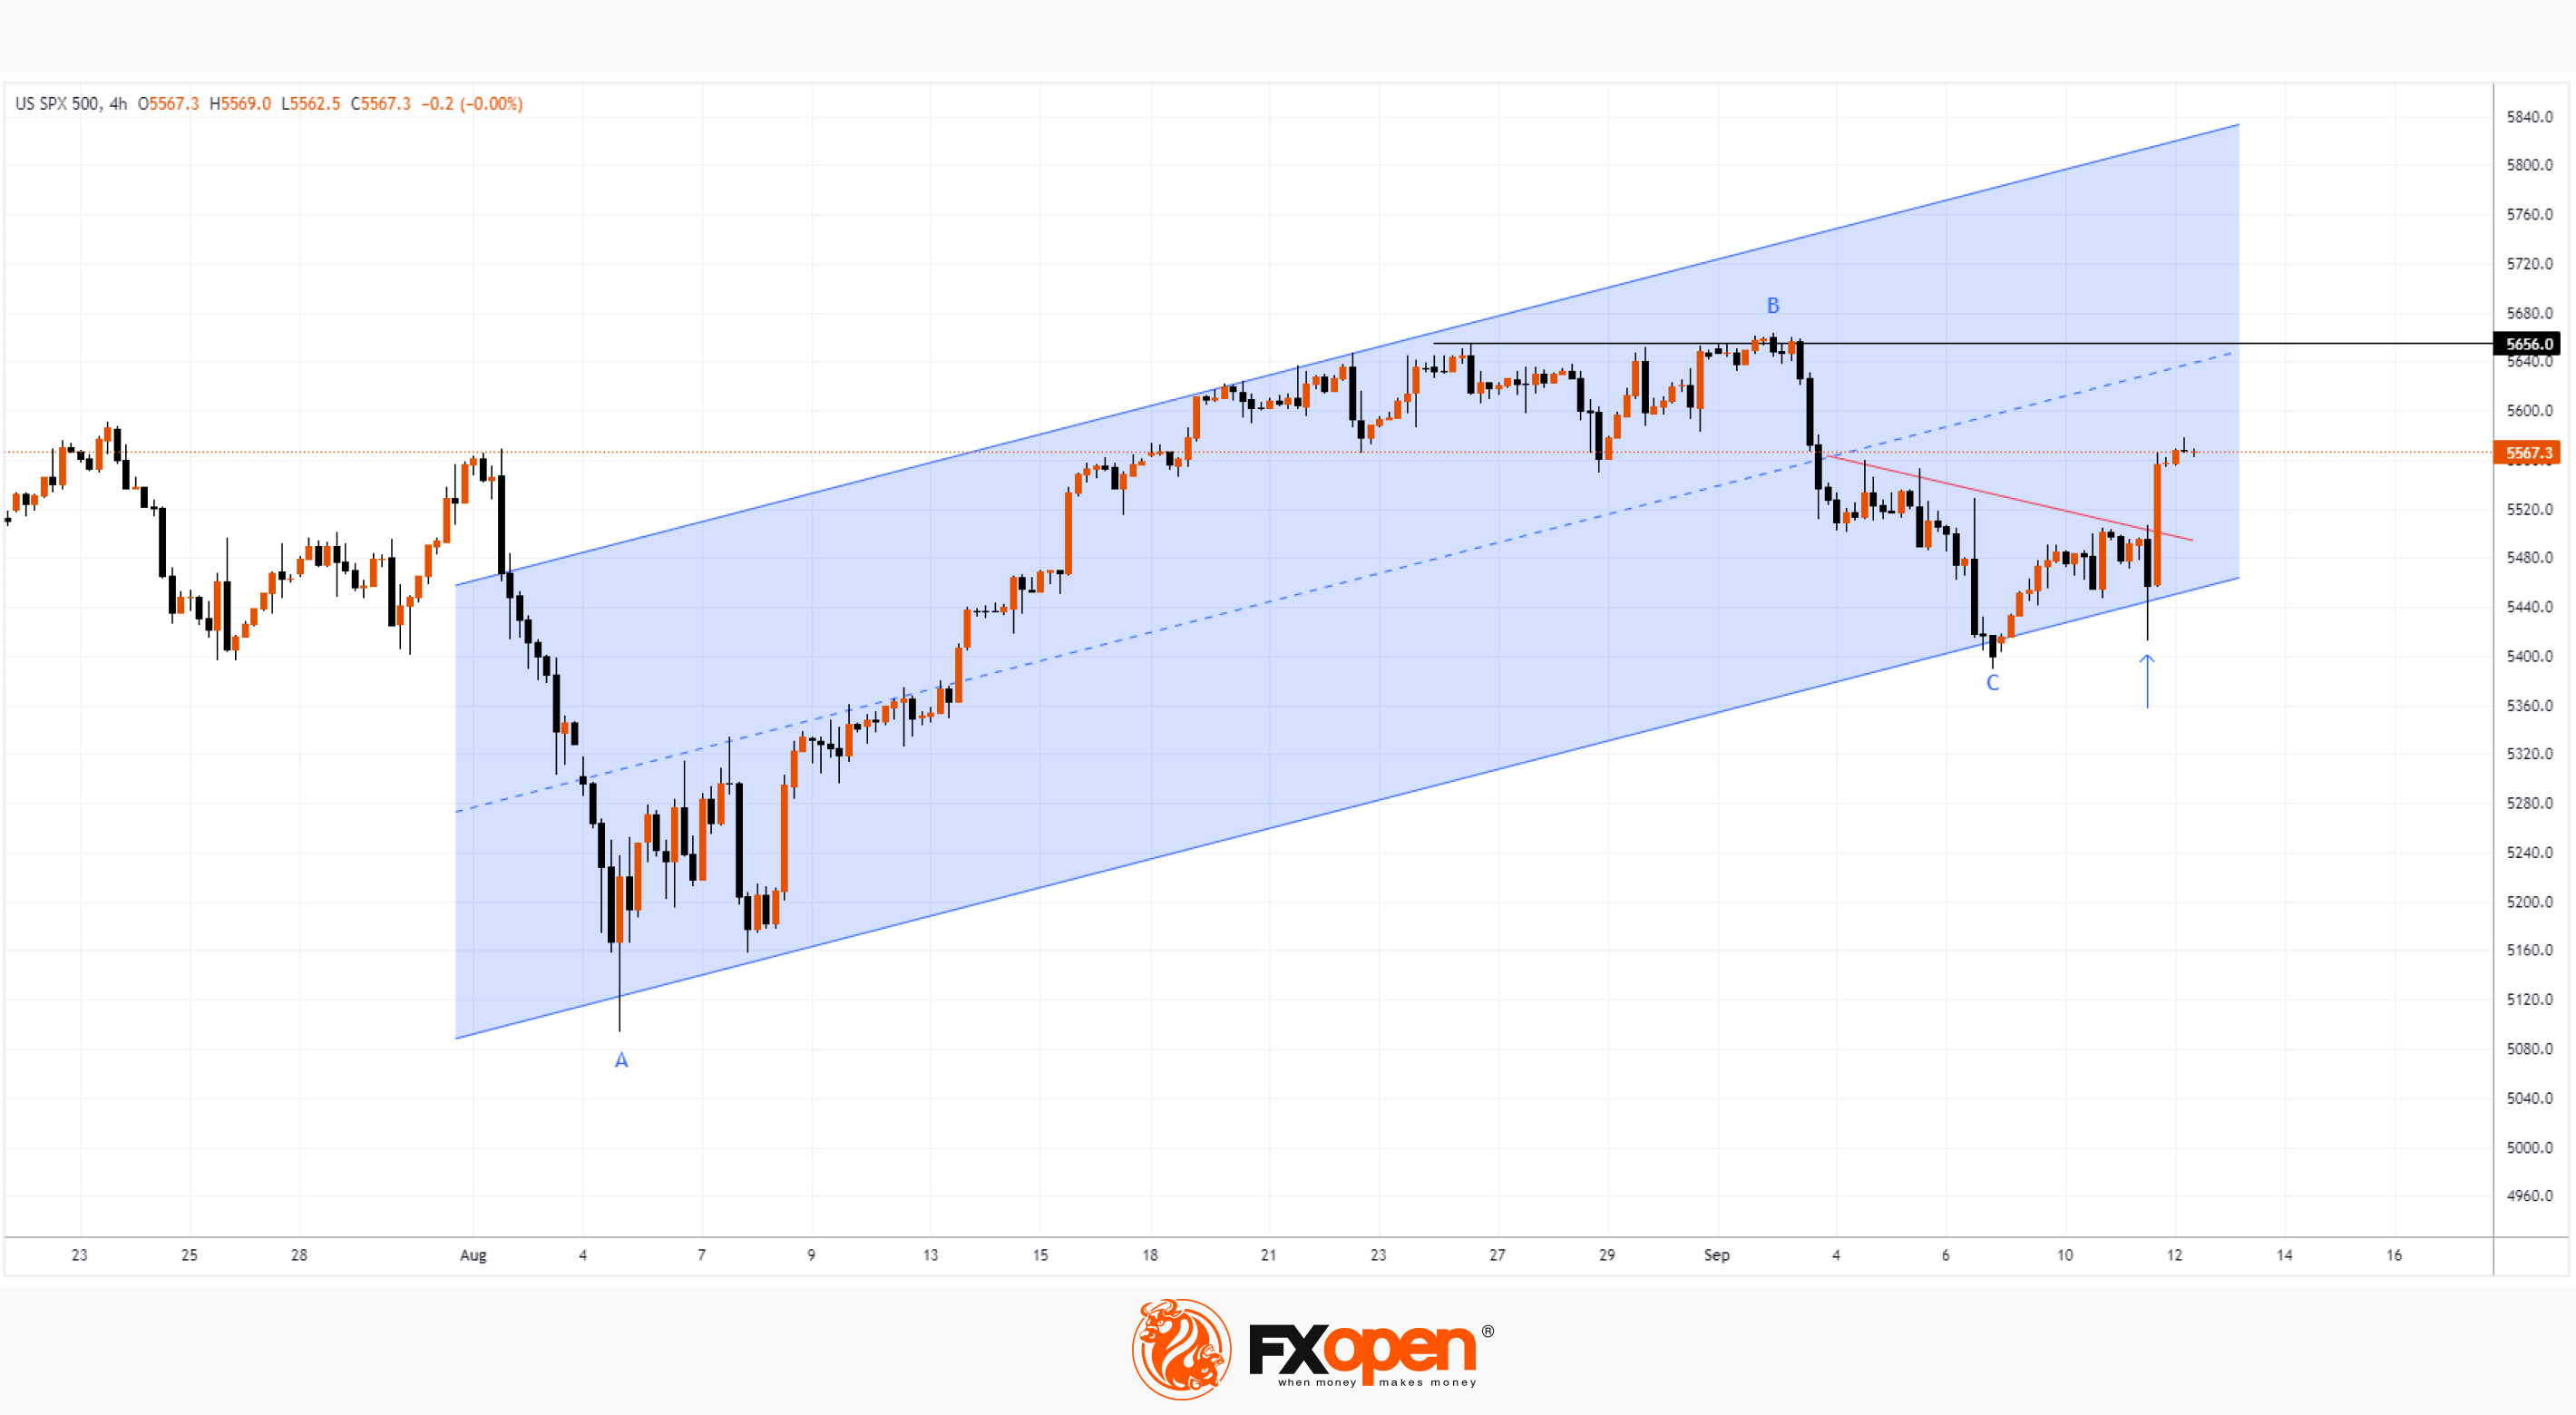
Historically, September has been the worst month for the S&P 500 (US SPX 500 mini on FXOpen), and the start of the month reflected this trend, with the index dropping around 4.5% from 1 to 6 September, indicating bearish sentiment.
However, yesterday's event — the release of the Consumer Price Index (CPI) — may have marked a turning point.
According to Reuters, US inflation data showed that the core CPI rose by 0.28% in August, slightly above the forecast of 0.2%. This led market participants to believe that the Federal Reserve might agree to a 25-basis point rate cut next Wednesday.
Technical analysis of the S&P 500 (US SPX 500 mini on FXOpen) chart indicates:
→ The price is moving within an ascending channel (shown in blue), having rebounded from its lower boundary yesterday and breaking the local descending trend line (shown in red).
→ The movement from B to C is approximately 50% of the A to B impulse, a bullish signal that suggests the "normal" correction may be complete, indicating a potential rally from the 5 August low.
→ Yesterday's price drop was a false move (indicated by the arrow), creating a bear trap.
As of mid-month, the outlook appears positive. It’s possible that the S&P 500 (US SPX 500 mini on FXOpen) could finish the month in the green, though the Fed's long-anticipated rate cut decision, expected next week, will play a crucial role in this outcome.
Trade global index CFDs with zero commission and tight spreads. Open your FXOpen account now or learn more about trading index CFDs with FXOpen.
CFDs are complex instruments and come with a high risk of losing your money.
This article represents the opinion of the Companies operating under the FXOpen brand only. It is not to be construed as an offer, solicitation, or recommendation with respect to products and services provided by the Companies operating under the FXOpen brand, nor is it to be considered financial advice.
S&P 500 Rises Following Inflation Data Release
Historically, September has been the worst month for the S&P 500 (US SPX 500 mini on FXOpen), and the start of the month reflected this trend, with the index dropping around 4.5% from 1 to 6 September, indicating bearish sentiment.
However, yesterday's event — the release of the Consumer Price Index (CPI) — may have marked a turning point.
According to Reuters, US inflation data showed that the core CPI rose by 0.28% in August, slightly above the forecast of 0.2%. This led market participants to believe that the Federal Reserve might agree to a 25-basis point rate cut next Wednesday.
Technical analysis of the S&P 500 (US SPX 500 mini on FXOpen) chart indicates:
→ The price is moving within an ascending channel (shown in blue), having rebounded from its lower boundary yesterday and breaking the local descending trend line (shown in red).
→ The movement from B to C is approximately 50% of the A to B impulse, a bullish signal that suggests the "normal" correction may be complete, indicating a potential rally from the 5 August low.
→ Yesterday's price drop was a false move (indicated by the arrow), creating a bear trap.
As of mid-month, the outlook appears positive. It’s possible that the S&P 500 (US SPX 500 mini on FXOpen) could finish the month in the green, though the Fed's long-anticipated rate cut decision, expected next week, will play a crucial role in this outcome.
Trade global index CFDs with zero commission and tight spreads. Open your FXOpen account now or learn more about trading index CFDs with FXOpen.
CFDs are complex instruments and come with a high risk of losing your money.
This article represents the opinion of the Companies operating under the FXOpen brand only. It is not to be construed as an offer, solicitation, or recommendation with respect to products and services provided by the Companies operating under the FXOpen brand, nor is it to be considered financial advice.
👍3
#marketanalysis #MarketNews #stocktrading #stockmarket #NVDA
Nvidia (NVDA) Shares Surge Over 8%
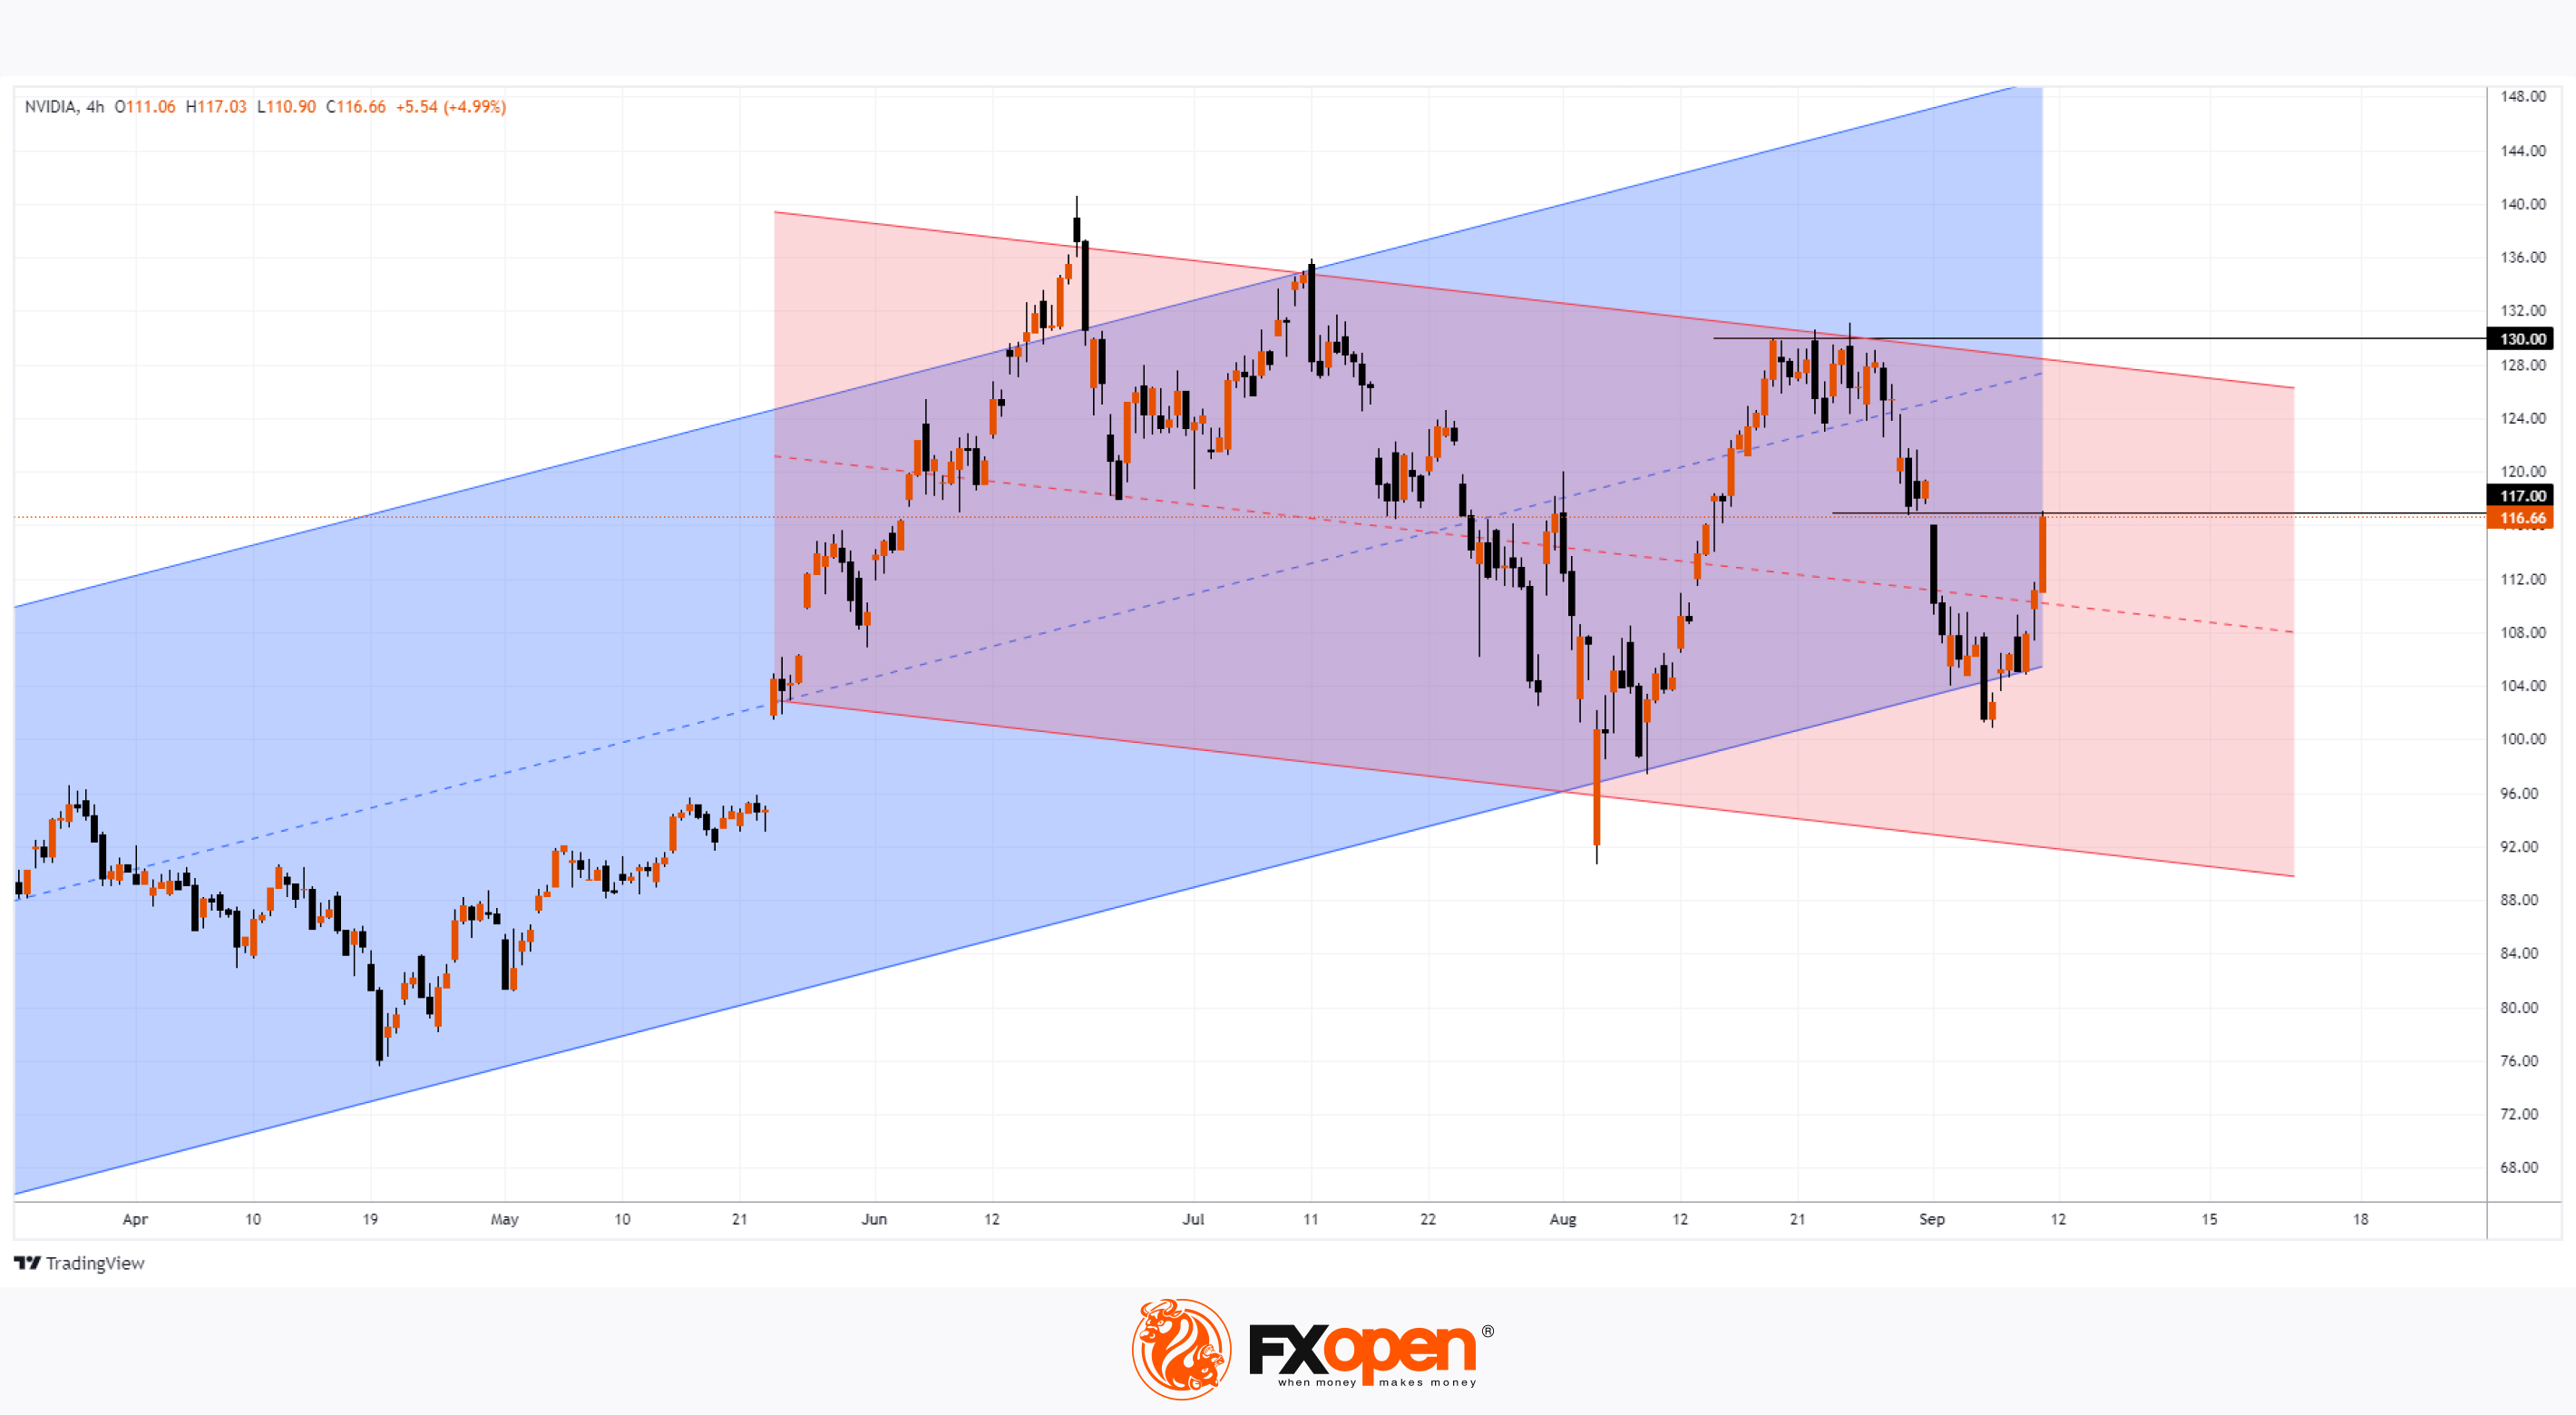
According to the Nvidia (NVDA) stock chart, yesterday’s closing price was just below $117, compared to just over $108 the day before. The positive momentum was largely driven by the stock market’s reaction to inflation news, as mentioned earlier.
For Nvidia investors, this is a clear sign that the stock is regaining its leadership position, a success attributed to CEO Jensen Huang.
As Barron’s reports, at the Goldman Sachs conference in San Francisco, Huang discussed the launch of the new Blackwell chip and the return on investment for Nvidia’s clients. He mentioned that demand is so high that some companies Nvidia works with have become "emotional."
Technical analysis of Nvidia's (NVDA) stock chart shows the price forming an ascending linear regression channel (shown in blue), rebounding from its lower boundary.
However, bulls will need to prove their strength, as a series of resistance levels lie ahead:
→ The bearish gap zone around $117. → The psychological level of $130. → The upper boundary of the descending channel (shown in red).
If the Federal Reserve cuts rates next week and Powell’s comments are dovish, Nvidia’s stock could break through this resistance and continue its impressive 2024 rally, which saw the price increase by around 150% in the first half of the year.
Analyst forecasts remain optimistic. According to a Tipranks survey of 42 analysts, 39 recommend buying NVDA stock, with an average price target of $153.24 over the next 12 months.
Trade global index CFDs with zero commission and tight spreads. Open your FXOpen account now or learn more about trading index CFDs with FXOpen.
CFDs are complex instruments and come with a high risk of losing your money.
This article represents the opinion of the Companies operating under the FXOpen brand only. It is not to be construed as an offer, solicitation, or recommendation with respect to products and services provided by the Companies operating under the FXOpen brand, nor is it to be considered financial advice.
Nvidia (NVDA) Shares Surge Over 8%
According to the Nvidia (NVDA) stock chart, yesterday’s closing price was just below $117, compared to just over $108 the day before. The positive momentum was largely driven by the stock market’s reaction to inflation news, as mentioned earlier.
For Nvidia investors, this is a clear sign that the stock is regaining its leadership position, a success attributed to CEO Jensen Huang.
As Barron’s reports, at the Goldman Sachs conference in San Francisco, Huang discussed the launch of the new Blackwell chip and the return on investment for Nvidia’s clients. He mentioned that demand is so high that some companies Nvidia works with have become "emotional."
Technical analysis of Nvidia's (NVDA) stock chart shows the price forming an ascending linear regression channel (shown in blue), rebounding from its lower boundary.
However, bulls will need to prove their strength, as a series of resistance levels lie ahead:
→ The bearish gap zone around $117. → The psychological level of $130. → The upper boundary of the descending channel (shown in red).
If the Federal Reserve cuts rates next week and Powell’s comments are dovish, Nvidia’s stock could break through this resistance and continue its impressive 2024 rally, which saw the price increase by around 150% in the first half of the year.
Analyst forecasts remain optimistic. According to a Tipranks survey of 42 analysts, 39 recommend buying NVDA stock, with an average price target of $153.24 over the next 12 months.
Trade global index CFDs with zero commission and tight spreads. Open your FXOpen account now or learn more about trading index CFDs with FXOpen.
CFDs are complex instruments and come with a high risk of losing your money.
This article represents the opinion of the Companies operating under the FXOpen brand only. It is not to be construed as an offer, solicitation, or recommendation with respect to products and services provided by the Companies operating under the FXOpen brand, nor is it to be considered financial advice.
👍2
#XAUUSD #marketanalysis #MarketNews #goldprice
Gold Price Hits New Record
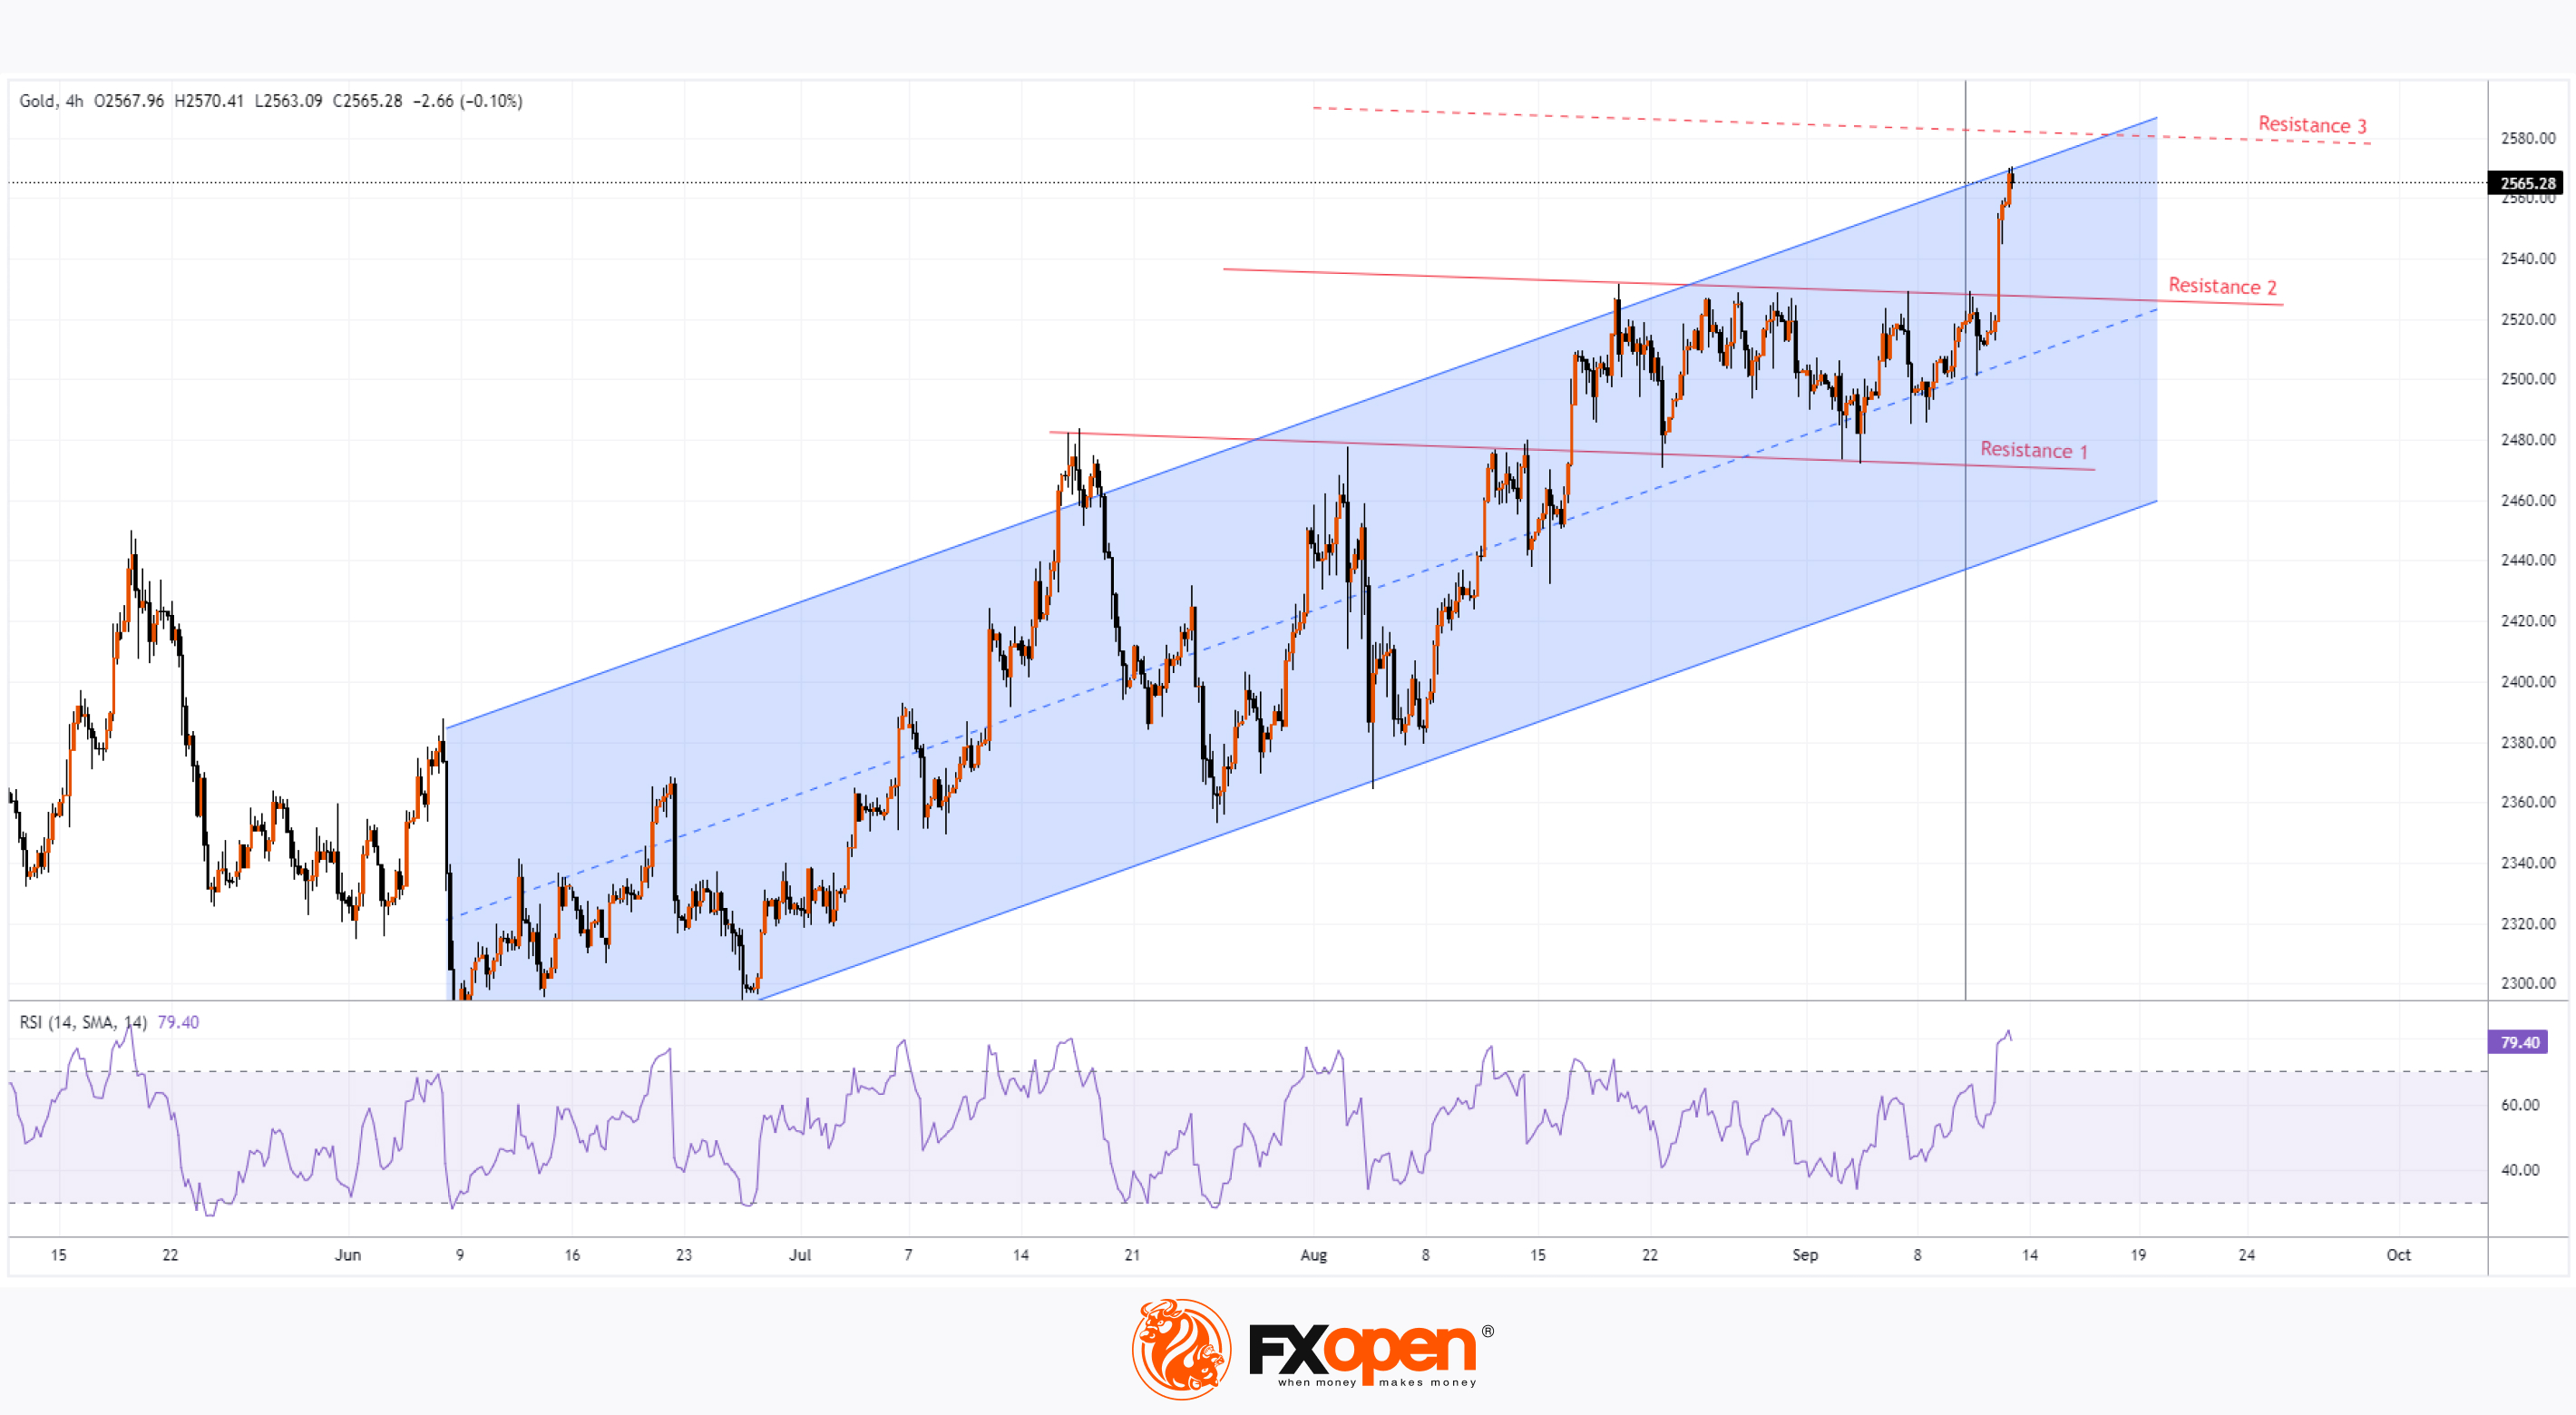
As shown by the XAU/USD chart:
→ Gold has reached a new all-time high;
→ This morning, gold is trading around $2,567 per ounce.
Bullish sentiment is being driven by expectations of a Federal Reserve rate cut next week. According to MoneyControl, the International Monetary Fund stated on Thursday that it would be "appropriate" for the Fed to start its long-awaited monetary easing cycle at its meeting next week, as inflation risks have eased.
On 6 September, we analysed the gold price chart and identified:
→ an ascending channel (shown in blue);
→ two resistance lines forming a “bullish flag” pattern.
Gold’s surge to a new all-time high has broken through the “bullish flag,” suggesting a potential resumption of the rally. How successful could this be?
Technical analysis of the XAU/USD chart today shows that the price is approaching resistance levels formed by:
→ the upper boundary of the blue channel;
→ Resistance line 3, which can be viewed as the target following the breakout of resistances 1 and 2, according to technical analysis principles.
Therefore, gold has limited potential for further growth due to the proximity of these resistance levels. It's worth noting that the RSI is in the overbought zone, which could encourage bulls to take profits at this historic peak.
Given these factors, the market may be vulnerable to a correction. However, the key influence will be the actual decision from the Fed, which will be announced next Wednesday.
Start trading commodities with tight spreads. Open your trading account now or learn more about trading commodity CFDs with FXOpen.
CFDs are complex instruments and come with a high risk of losing your money.
This article represents the opinion of the Companies operating under the FXOpen brand only. It is not to be construed as an offer, solicitation, or recommendation with respect to products and services provided by the Companies operating under the FXOpen brand, nor is it to be considered financial advice.
Gold Price Hits New Record
As shown by the XAU/USD chart:
→ Gold has reached a new all-time high;
→ This morning, gold is trading around $2,567 per ounce.
Bullish sentiment is being driven by expectations of a Federal Reserve rate cut next week. According to MoneyControl, the International Monetary Fund stated on Thursday that it would be "appropriate" for the Fed to start its long-awaited monetary easing cycle at its meeting next week, as inflation risks have eased.
On 6 September, we analysed the gold price chart and identified:
→ an ascending channel (shown in blue);
→ two resistance lines forming a “bullish flag” pattern.
Gold’s surge to a new all-time high has broken through the “bullish flag,” suggesting a potential resumption of the rally. How successful could this be?
Technical analysis of the XAU/USD chart today shows that the price is approaching resistance levels formed by:
→ the upper boundary of the blue channel;
→ Resistance line 3, which can be viewed as the target following the breakout of resistances 1 and 2, according to technical analysis principles.
Therefore, gold has limited potential for further growth due to the proximity of these resistance levels. It's worth noting that the RSI is in the overbought zone, which could encourage bulls to take profits at this historic peak.
Given these factors, the market may be vulnerable to a correction. However, the key influence will be the actual decision from the Fed, which will be announced next Wednesday.
Start trading commodities with tight spreads. Open your trading account now or learn more about trading commodity CFDs with FXOpen.
CFDs are complex instruments and come with a high risk of losing your money.
This article represents the opinion of the Companies operating under the FXOpen brand only. It is not to be construed as an offer, solicitation, or recommendation with respect to products and services provided by the Companies operating under the FXOpen brand, nor is it to be considered financial advice.
👍2
#DAX40 #stockmarket #marketanalysis #MarketNews
DAX 40 Reacts Positively to ECB's Rate Cut Decision
Yesterday, the European Central Bank’s Governing Council cut the refinancing rate, as expected, from 4.25% to 3.65%.
The ECB also stated that monetary policy would remain sufficiently restrictive "for as long as necessary" to ensure inflation returns to its medium-term target of 2%.
Financial markets responded with:
→ A strengthening of the euro. EUR/USD rose by more than 0.5% after the rate cut announcement.
→ A rise in European stock market indices.
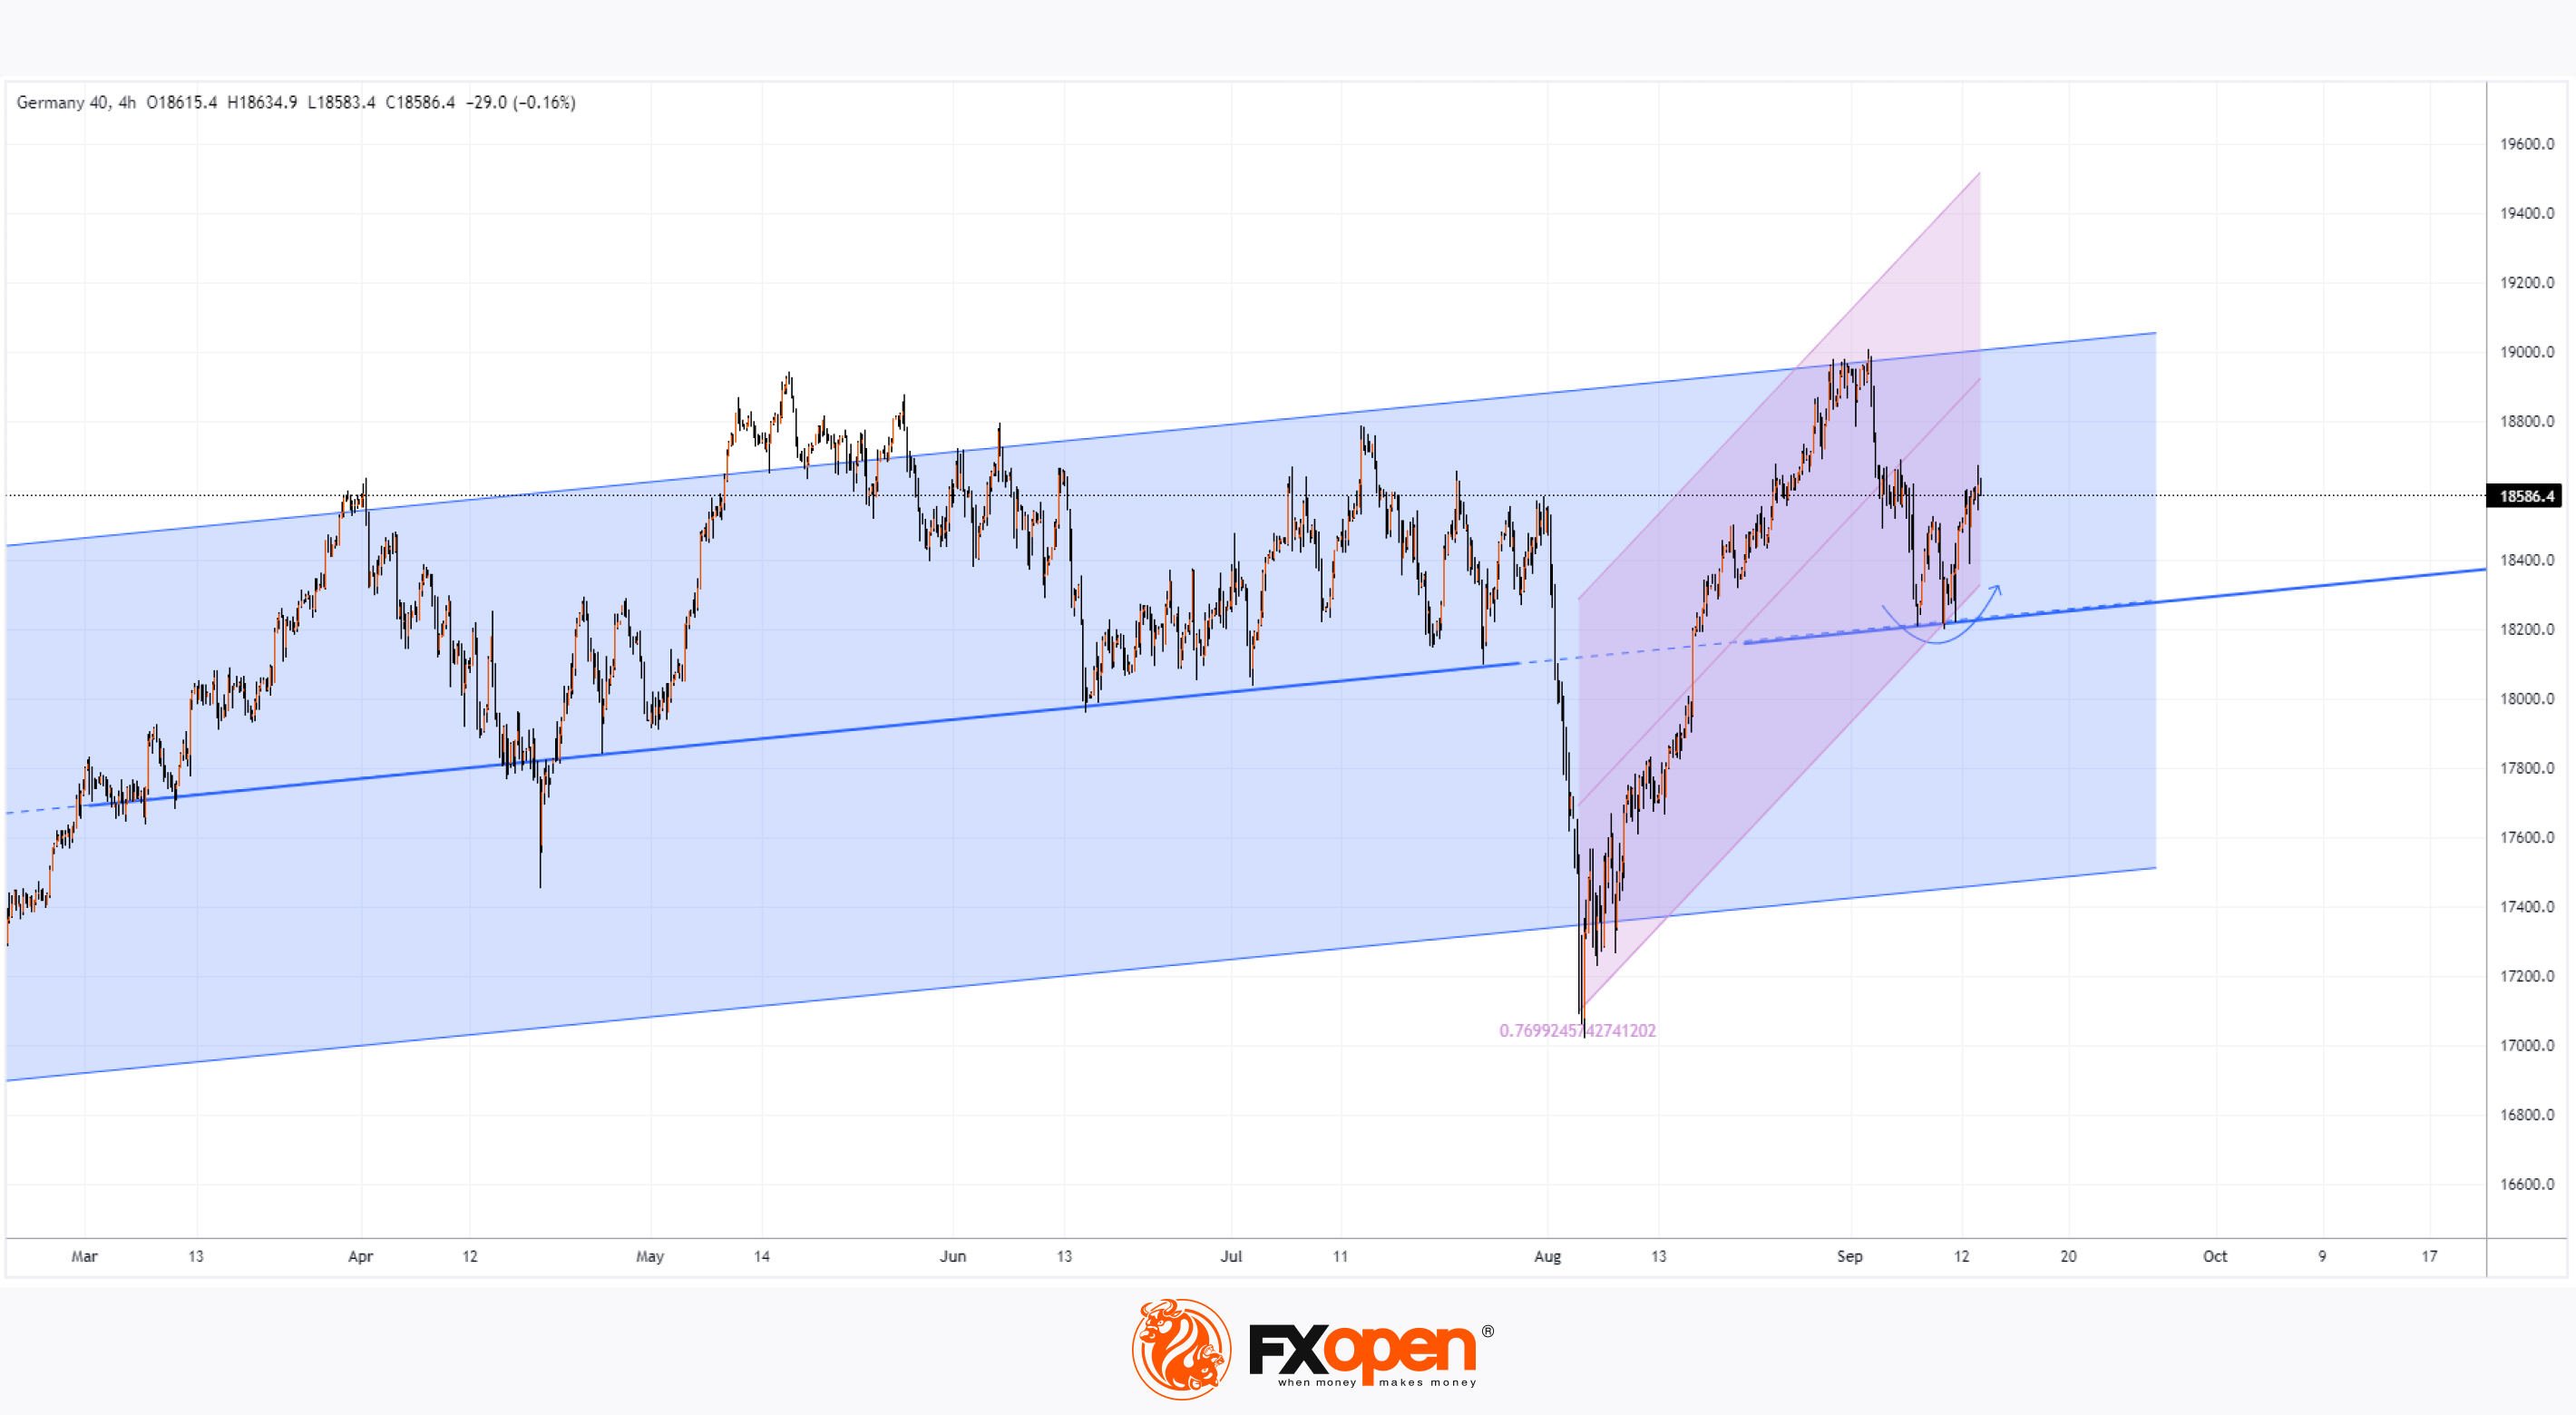
For example, Germany's DAX 40 index (Germany 40 mini on FXOpen) received a bullish boost, which supports more optimistic conclusions in today's technical analysis:
→ Price movement fits within the ascending channel shown in blue.
→ The thickened line highlights that the median of the channel repeatedly acted as support before early August. As indicated by the arrow, it regained this role after the sharp decline on 5 August.
→ The linear regression channel (shown in purple) points to upward momentum.
Investors may feel optimistic, expecting that this autumn demand forces could lift the DAX 40 (Germany 40 mini on FXOpen) towards the upper boundary of the channel.
Trade global index CFDs with zero commission and tight spreads. Open your FXOpen account now or learn more about trading index CFDs with FXOpen.
CFDs are complex instruments and come with a high risk of losing your money.
This article represents the opinion of the Companies operating under the FXOpen brand only. It is not to be construed as an offer, solicitation, or recommendation with respect to products and services provided by the Companies operating under the FXOpen brand, nor is it to be considered financial advice.
DAX 40 Reacts Positively to ECB's Rate Cut Decision
Yesterday, the European Central Bank’s Governing Council cut the refinancing rate, as expected, from 4.25% to 3.65%.
The ECB also stated that monetary policy would remain sufficiently restrictive "for as long as necessary" to ensure inflation returns to its medium-term target of 2%.
Financial markets responded with:
→ A strengthening of the euro. EUR/USD rose by more than 0.5% after the rate cut announcement.
→ A rise in European stock market indices.
For example, Germany's DAX 40 index (Germany 40 mini on FXOpen) received a bullish boost, which supports more optimistic conclusions in today's technical analysis:
→ Price movement fits within the ascending channel shown in blue.
→ The thickened line highlights that the median of the channel repeatedly acted as support before early August. As indicated by the arrow, it regained this role after the sharp decline on 5 August.
→ The linear regression channel (shown in purple) points to upward momentum.
Investors may feel optimistic, expecting that this autumn demand forces could lift the DAX 40 (Germany 40 mini on FXOpen) towards the upper boundary of the channel.
Trade global index CFDs with zero commission and tight spreads. Open your FXOpen account now or learn more about trading index CFDs with FXOpen.
CFDs are complex instruments and come with a high risk of losing your money.
This article represents the opinion of the Companies operating under the FXOpen brand only. It is not to be construed as an offer, solicitation, or recommendation with respect to products and services provided by the Companies operating under the FXOpen brand, nor is it to be considered financial advice.
👍2
#MarketUpdate #SP500 #ForexMarket #BearMarket #Nvidia #TechStocks #InvestmentNews
Weekly Market Wrap With Gary Thomson: S&P 500, AUD/USD, NZD/USD, USD/JPY Analysis, NVDA Shares
Get the latest scoop on the week's hottest headlines, all in one convenient video. Join Gary Thomson, the COO of FXOpen UK, as he breaks down the most significant news reports and shares his expert insights.
🔸S&P Rises Following Inflation Data Release
🔸Market Analysis: AUD/USD and NZD/USD Trim Gains, are Bears Back?
🔸USD/JPY Analysis: Rate Drops to New Yearly Low
🔸Nvidia (NVDA) Shares Surge over 8%
Stay in the know and empower yourself with our short, yet power-packed video. Watch it now and stay updated with FXOpen. Don't miss out on this invaluable opportunity to sharpen your trading skills and make informed decisions.
https://cutt.ly/deRJ6Zdu
To take advantage of price fluctuations in the foreign exchange markets, consider enlisting the services of a reliable broker like FXOpen.
⚠️
This forecast represents FXOpen Companies opinion only, it should not be construed as an offer, invitation or recommendation in respect to FXOpen Companies products and services or as financial advice.
Weekly Market Wrap With Gary Thomson: S&P 500, AUD/USD, NZD/USD, USD/JPY Analysis, NVDA Shares
Get the latest scoop on the week's hottest headlines, all in one convenient video. Join Gary Thomson, the COO of FXOpen UK, as he breaks down the most significant news reports and shares his expert insights.
🔸S&P Rises Following Inflation Data Release
🔸Market Analysis: AUD/USD and NZD/USD Trim Gains, are Bears Back?
🔸USD/JPY Analysis: Rate Drops to New Yearly Low
🔸Nvidia (NVDA) Shares Surge over 8%
Stay in the know and empower yourself with our short, yet power-packed video. Watch it now and stay updated with FXOpen. Don't miss out on this invaluable opportunity to sharpen your trading skills and make informed decisions.
https://cutt.ly/deRJ6Zdu
To take advantage of price fluctuations in the foreign exchange markets, consider enlisting the services of a reliable broker like FXOpen.
⚠️
This forecast represents FXOpen Companies opinion only, it should not be construed as an offer, invitation or recommendation in respect to FXOpen Companies products and services or as financial advice.
YouTube
Weekly Market Wrap With Gary Thomson: S&P 500, AUD/USD, NZD/USD, USD/JPY Analysis, NVDA Shares
Get the latest scoop on the week's hottest headlines, all in one convenient video. Join Gary Thomson, the COO of FXOpen UK, as he breaks down the most significant news reports and shares his expert insights.
00:43 S&P Rises Following Inflation Data Release…
00:43 S&P Rises Following Inflation Data Release…
👍2
#USDJPY #marketanalysis #MarketNews #forextrading
USD/JPY Analysis: The Rate Falls Below 140 Yen per Dollar
Despite today's public holiday in Japan, yen buyers remain active.
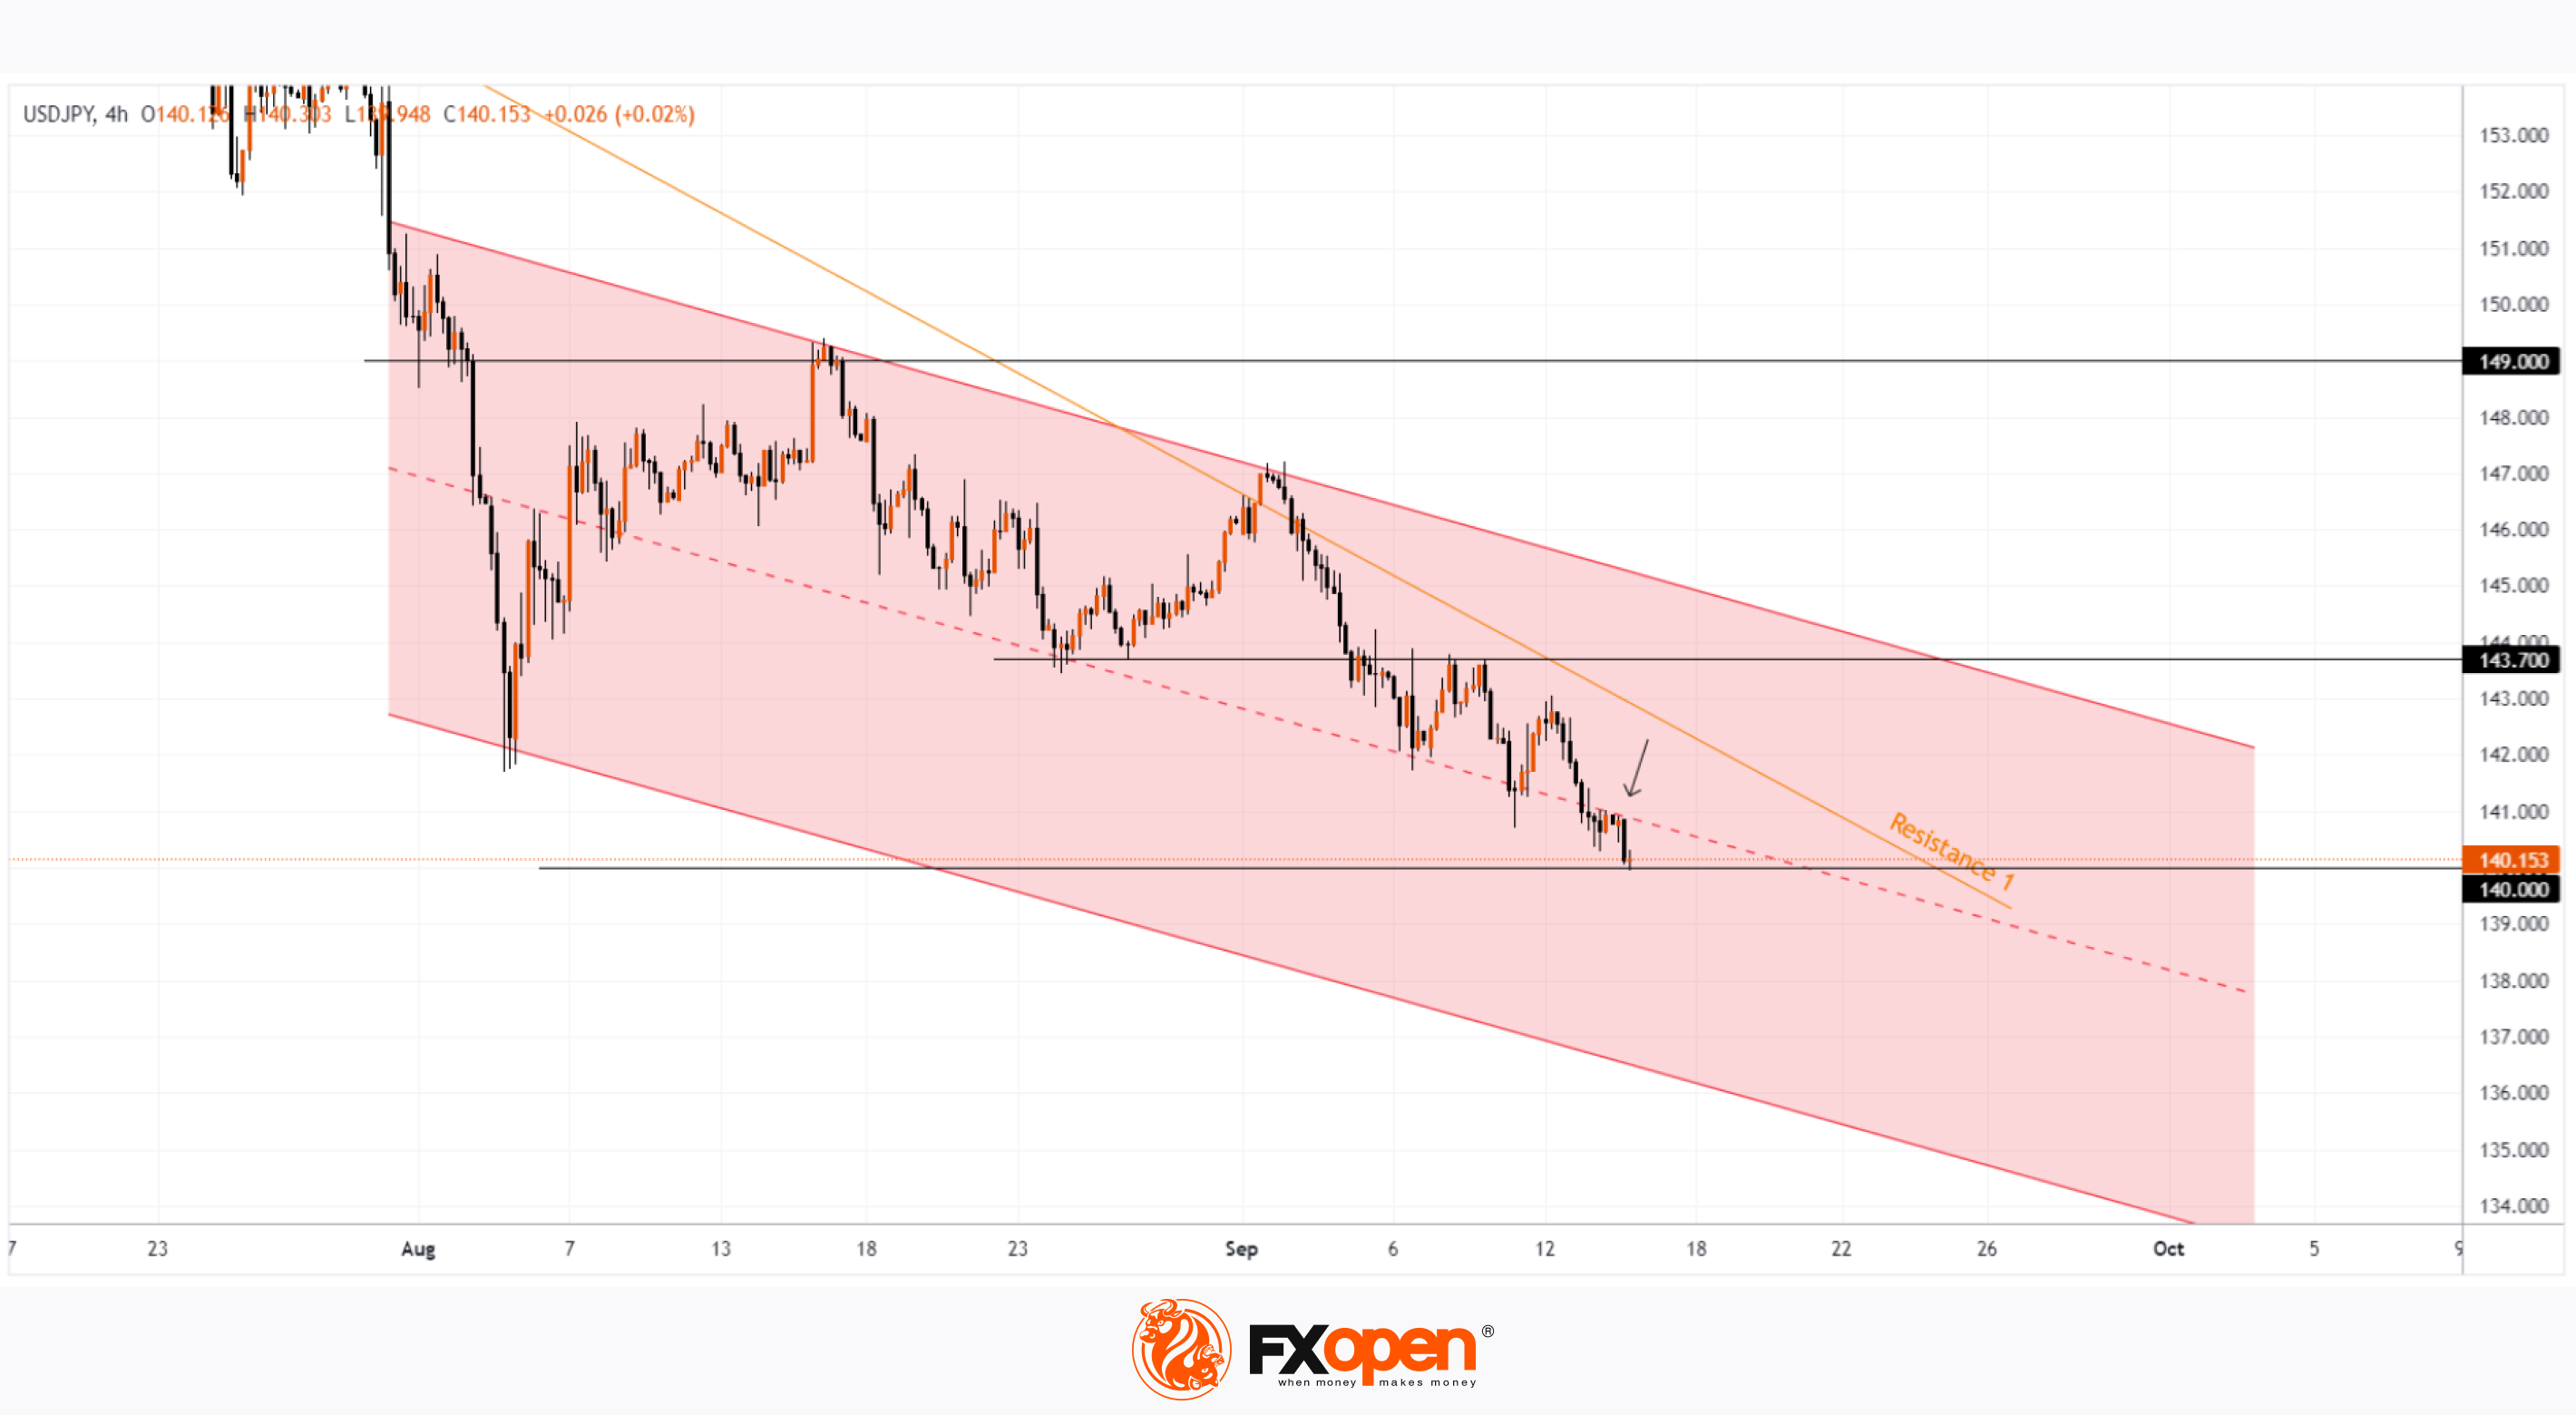
As shown on the USD/JPY chart, today's candle low has dropped below the psychological level of 140 yen per dollar. The last time this exchange rate was seen was on 28 July 2023.
On 11 September, when analysing the USD/JPY chart, we:
→ drew a descending channel (shown in red);
→ plotted a resistance line (shown in orange);
→ predicted the possibility of a bearish attack on the 140 yen per dollar level.
Current market sentiment is influenced by:
→ comments from Bank of Japan representative Junko Nakagawa, who stated last week that interest rates will continue to rise if economic and inflation forecasts align with expectations;
→ expectations of a rate cut from the Federal Reserve. A shift towards monetary easing now seems almost inevitable, with the main question being whether the rate will be reduced by 25 or 50 basis points.
The technical analysis of the USD/JPY chart shows that the median of the descending channel acts as resistance (as indicated by the arrow). This suggests that bears remain in control. It's likely that these market sentiments will persist until Wednesday (21:00 GMT+3), when the Federal Reserve announces its decision – undoubtedly the key event of the week.
Trade over 50 forex markets 24 hours a day with FXOpen. Take advantage of low commissions, deep liquidity, and spreads from 0.0 pips. Open your FXOpen account now or learn more about trading forex with FXOpen.
CFDs are complex instruments and come with a high risk of losing your money.
This article represents the opinion of the Companies operating under the FXOpen brand only. It is not to be construed as an offer, solicitation, or recommendation with respect to products and services provided by the Companies operating under the FXOpen brand, nor is it to be considered financial advice.
USD/JPY Analysis: The Rate Falls Below 140 Yen per Dollar
Despite today's public holiday in Japan, yen buyers remain active.
As shown on the USD/JPY chart, today's candle low has dropped below the psychological level of 140 yen per dollar. The last time this exchange rate was seen was on 28 July 2023.
On 11 September, when analysing the USD/JPY chart, we:
→ drew a descending channel (shown in red);
→ plotted a resistance line (shown in orange);
→ predicted the possibility of a bearish attack on the 140 yen per dollar level.
Current market sentiment is influenced by:
→ comments from Bank of Japan representative Junko Nakagawa, who stated last week that interest rates will continue to rise if economic and inflation forecasts align with expectations;
→ expectations of a rate cut from the Federal Reserve. A shift towards monetary easing now seems almost inevitable, with the main question being whether the rate will be reduced by 25 or 50 basis points.
The technical analysis of the USD/JPY chart shows that the median of the descending channel acts as resistance (as indicated by the arrow). This suggests that bears remain in control. It's likely that these market sentiments will persist until Wednesday (21:00 GMT+3), when the Federal Reserve announces its decision – undoubtedly the key event of the week.
Trade over 50 forex markets 24 hours a day with FXOpen. Take advantage of low commissions, deep liquidity, and spreads from 0.0 pips. Open your FXOpen account now or learn more about trading forex with FXOpen.
CFDs are complex instruments and come with a high risk of losing your money.
This article represents the opinion of the Companies operating under the FXOpen brand only. It is not to be construed as an offer, solicitation, or recommendation with respect to products and services provided by the Companies operating under the FXOpen brand, nor is it to be considered financial advice.
👍2
#stockmarket #MarketNews #marketanalysis
Adobe (ADBE) Shares Drop Over 8%
On Thursday evening, Adobe Inc. (ADBE) reported its third-quarter financial results:
→ Earnings per share: actual = $4.65, expected = $4.53;
→ Revenue: actual = $5.40 billion, expected = $5.37 billion.
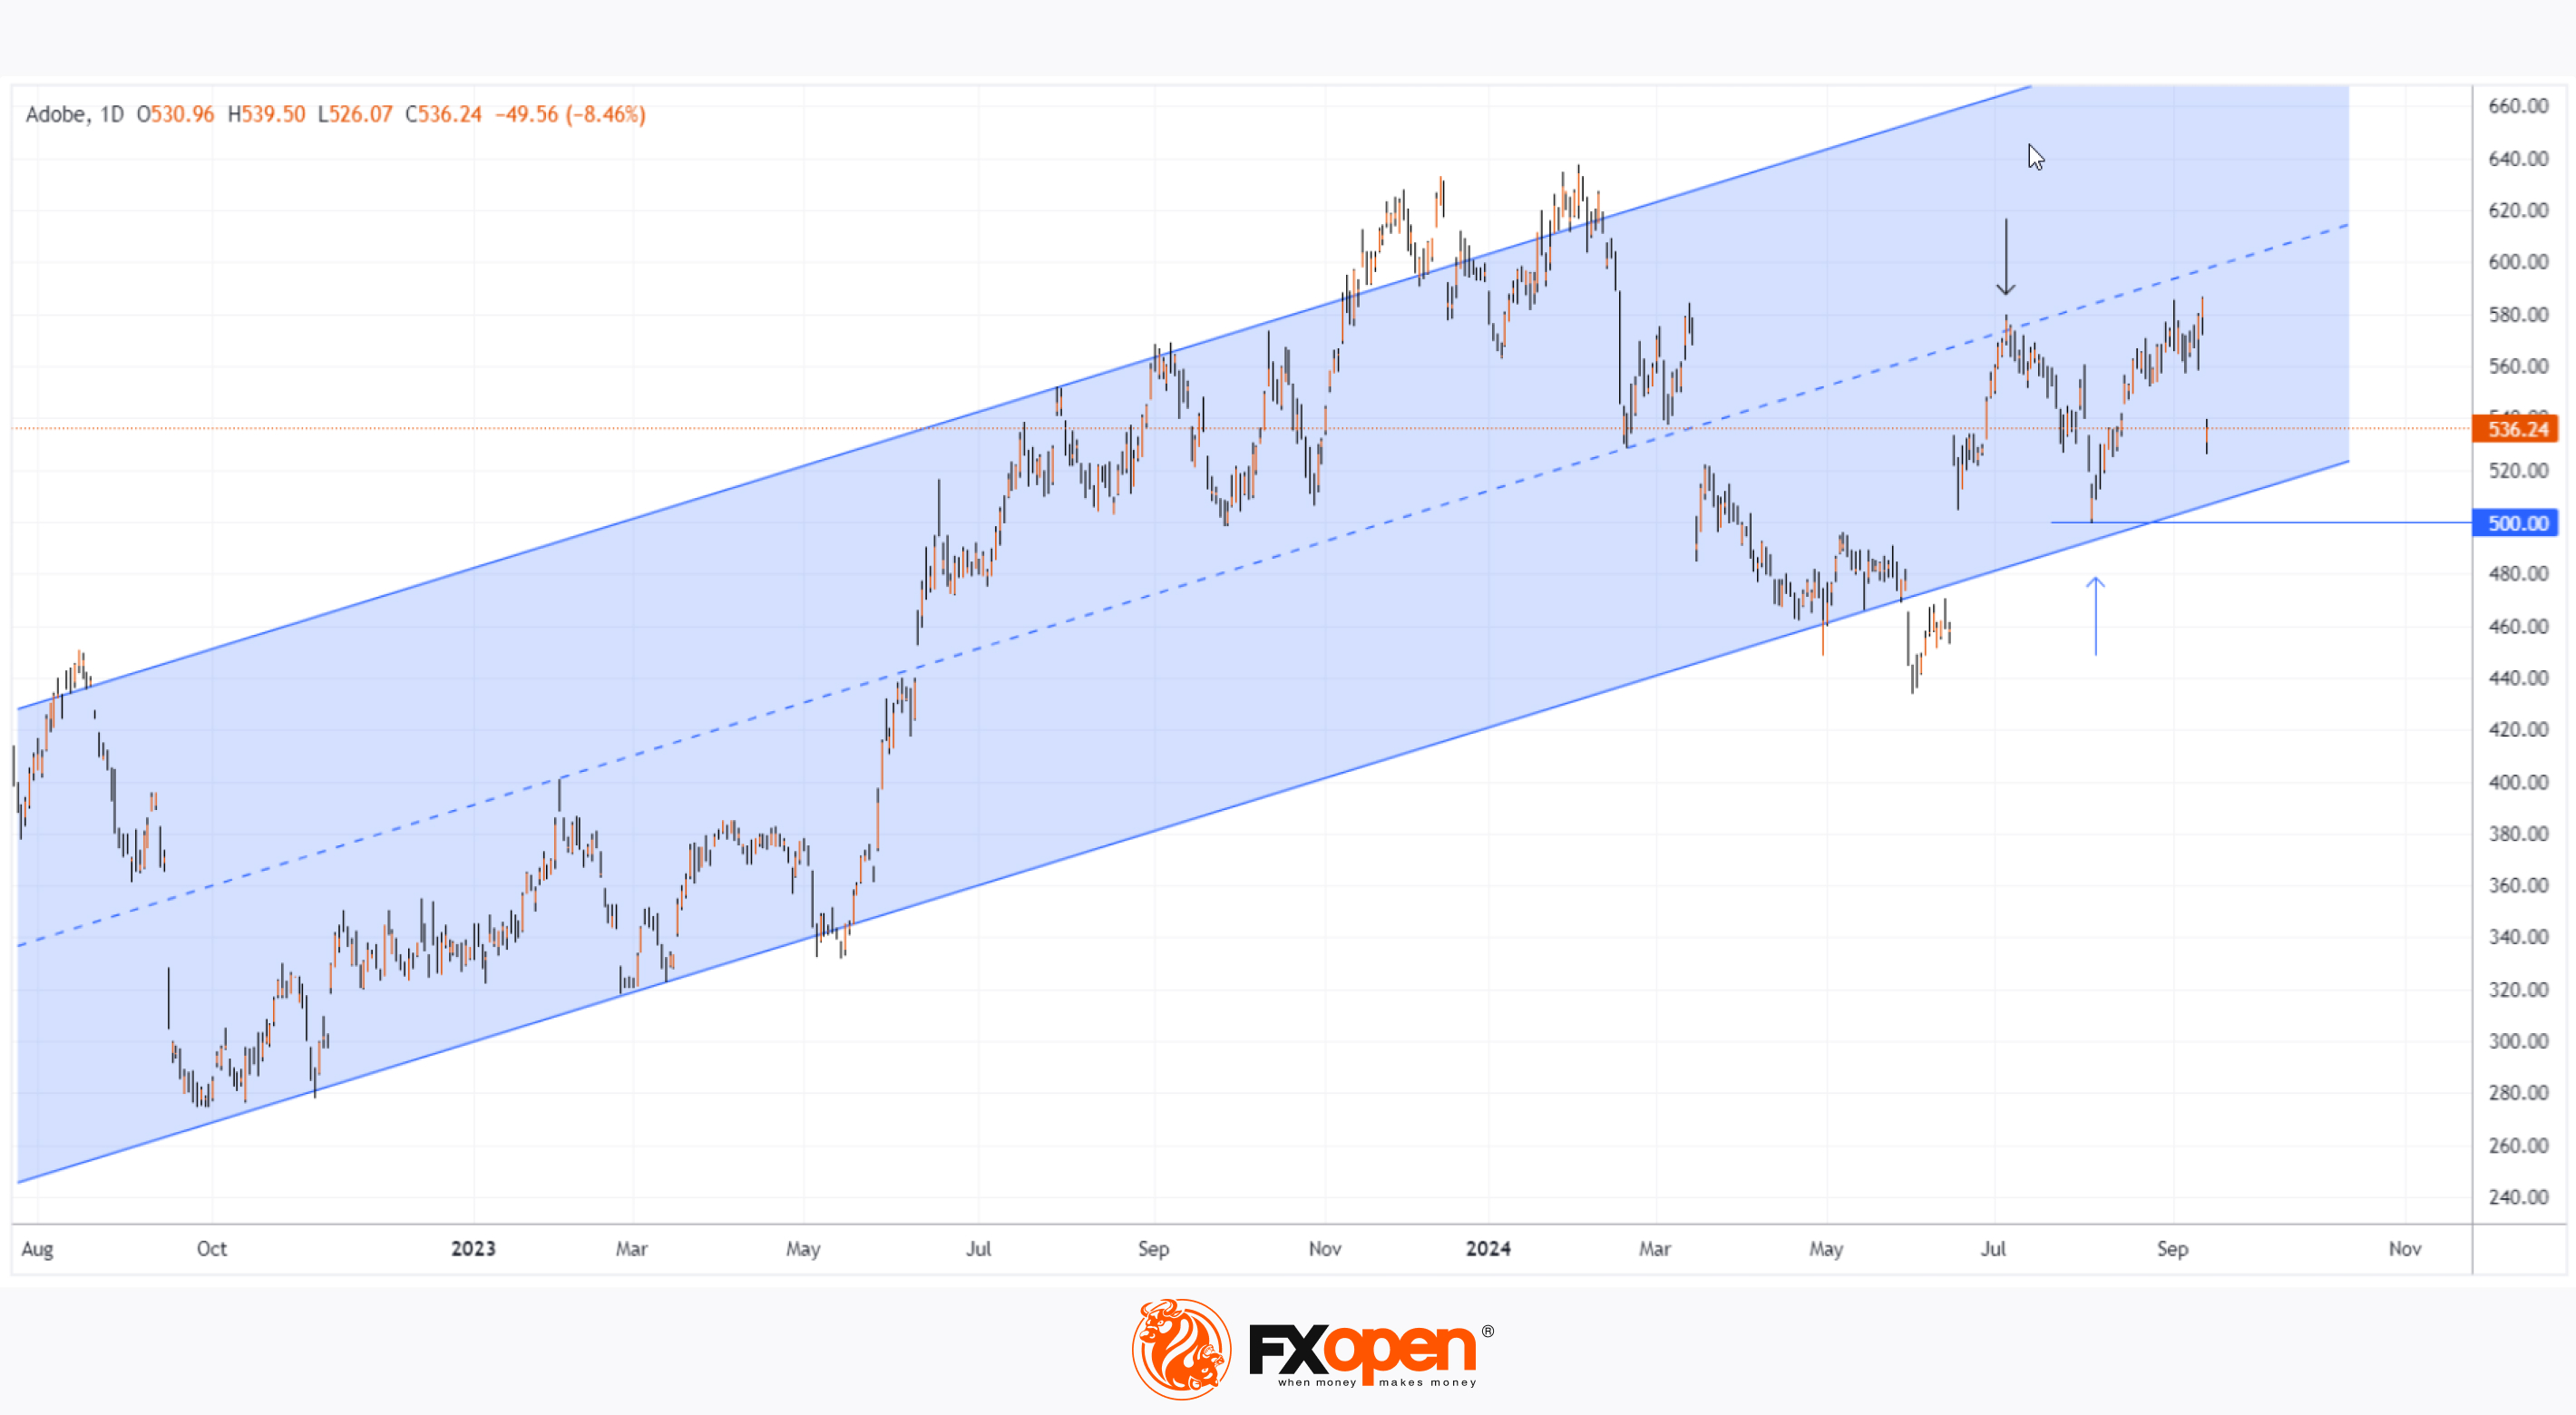
Despite beating analyst estimates, Adobe Inc.'s (ADBE) stock dropped by more than 9% due to a disappointing fourth-quarter forecast, which fell short of market expectations. According to the chart for Adobe Inc. (ADBE), trading on Friday opened with a large bearish gap. By the end of the day, the stock had fallen by more than 8% compared to Thursday's close.
To recap, on 5 June, when the stock price was around $460, we conducted a technical analysis and identified an upward channel (shown in blue), pointing to the potential resumption of a bullish trend.
Since then:
→ The price has risen by approximately 25% to the median line of the channel, which acted as resistance (shown by the blue arrow);
→ The price briefly broke through the psychological level of $500 (shown by the black arrow).
What’s next for Adobe Inc. (ADBE) stock?
It's worth noting that Friday's candle closed above its midpoint, which could be interpreted as a sign that demand forces were present, viewing the price drop as an opportunity to take long positions. Any panic, if there was any, didn’t significantly extend the downward momentum.
Therefore, while the disappointing forecast may continue to weigh on ADBE's stock price, bulls might show renewed activity – potentially around the psychological $500 mark or the lower boundary of the channel.
According to TipRanks, the average price target for ADBE stock is $620 over the next 12 months, indicating a potential upside of 15% from current levels.
Trade global index CFDs with zero commission and tight spreads. Open your FXOpen account now or learn more about trading index CFDs with FXOpen.
CFDs are complex instruments and come with a high risk of losing your money.
This article represents the opinion of the Companies operating under the FXOpen brand only. It is not to be construed as an offer, solicitation, or recommendation with respect to products and services provided by the Companies operating under the FXOpen brand, nor is it to be considered financial advice.
Adobe (ADBE) Shares Drop Over 8%
On Thursday evening, Adobe Inc. (ADBE) reported its third-quarter financial results:
→ Earnings per share: actual = $4.65, expected = $4.53;
→ Revenue: actual = $5.40 billion, expected = $5.37 billion.
Despite beating analyst estimates, Adobe Inc.'s (ADBE) stock dropped by more than 9% due to a disappointing fourth-quarter forecast, which fell short of market expectations. According to the chart for Adobe Inc. (ADBE), trading on Friday opened with a large bearish gap. By the end of the day, the stock had fallen by more than 8% compared to Thursday's close.
To recap, on 5 June, when the stock price was around $460, we conducted a technical analysis and identified an upward channel (shown in blue), pointing to the potential resumption of a bullish trend.
Since then:
→ The price has risen by approximately 25% to the median line of the channel, which acted as resistance (shown by the blue arrow);
→ The price briefly broke through the psychological level of $500 (shown by the black arrow).
What’s next for Adobe Inc. (ADBE) stock?
It's worth noting that Friday's candle closed above its midpoint, which could be interpreted as a sign that demand forces were present, viewing the price drop as an opportunity to take long positions. Any panic, if there was any, didn’t significantly extend the downward momentum.
Therefore, while the disappointing forecast may continue to weigh on ADBE's stock price, bulls might show renewed activity – potentially around the psychological $500 mark or the lower boundary of the channel.
According to TipRanks, the average price target for ADBE stock is $620 over the next 12 months, indicating a potential upside of 15% from current levels.
Trade global index CFDs with zero commission and tight spreads. Open your FXOpen account now or learn more about trading index CFDs with FXOpen.
CFDs are complex instruments and come with a high risk of losing your money.
This article represents the opinion of the Companies operating under the FXOpen brand only. It is not to be construed as an offer, solicitation, or recommendation with respect to products and services provided by the Companies operating under the FXOpen brand, nor is it to be considered financial advice.
👍2
#FTSE #marketanalysis #MarketNews #stockmarket
FTSE 100 bullish ahead of key announcements
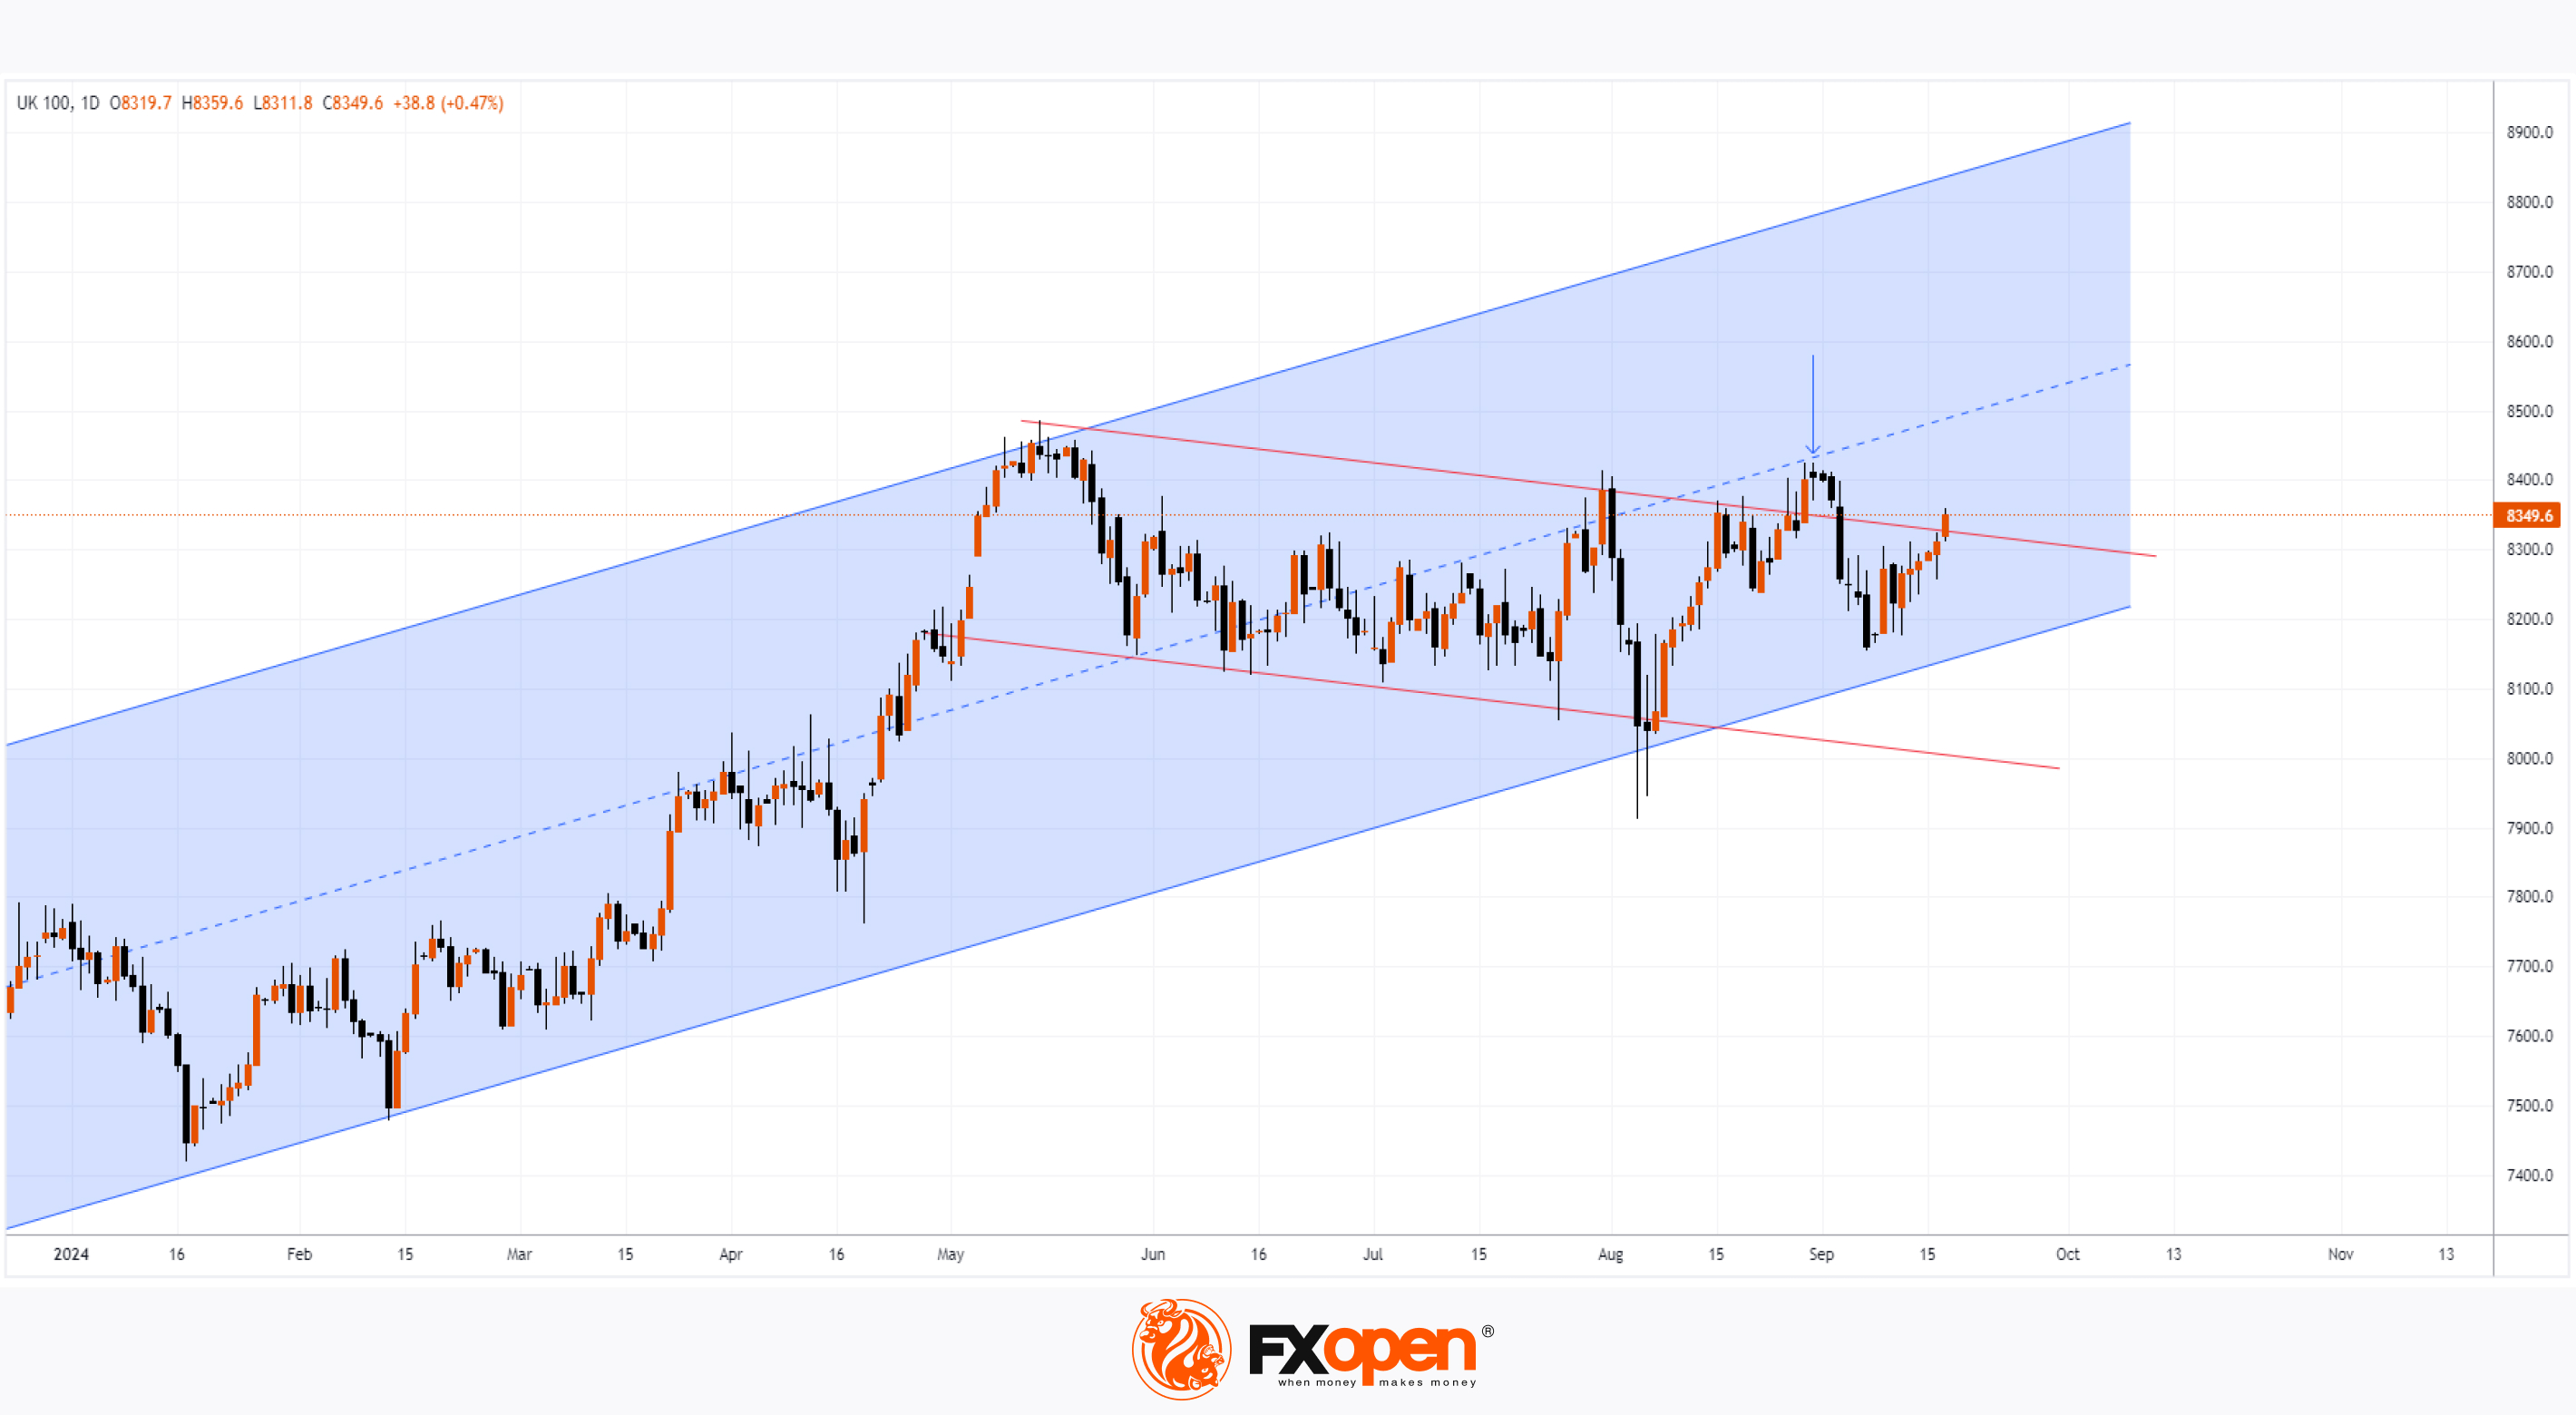
The chart of the UK stock index FTSE 100 (UK 100 on FXOpen) shows prevailing positive sentiment in the market. The right side of the daily chart displays a series of bullish candles, with a likelihood of this trend continuing today, as the price has been rising since the market opened.
This optimism is likely driven by the anticipation of key announcements:
→ Tomorrow at 09:00 GMT+3, the UK CPI figures will be released. Analysts expect inflation to remain steady without an increase.
→ Also tomorrow, at 21:00 GMT+3, the Federal Reserve will announce its decision on interest rates, with a cut seeming inevitable.
Technical analysis of the FTSE 100 (UK 100 on FXOpen) chart shows:
→ In 2024, the price movement has followed an upward blue channel. The period starting in May may represent an interim correction (marked by red lines) within the ongoing uptrend.
→ The significance of the current rise lies in it being the second attempt to break through the upper red line, offering a chance to exit the corrective channel and resume growth. The first attempt was unsuccessful, as the bullish breakout above the upper red line encountered resistance from the median of the blue channel (indicated by an arrow).
Therefore, tomorrow's expected volatility spike could either reinforce the positive momentum, pushing the FTSE 100 (UK 100 on FXOpen) higher beyond the red line, or act as a "cold shower," undoing recent bullish gains and driving the price back into the red channel.
Trade global index CFDs with zero commission and tight spreads. Open your FXOpen account now or learn more about trading index CFDs with FXOpen.
CFDs are complex instruments and come with a high risk of losing your money.
This article represents the opinion of the Companies operating under the FXOpen brand only. It is not to be construed as an offer, solicitation, or recommendation with respect to products and services provided by the Companies operating under the FXOpen brand, nor is it to be considered financial advice.
FTSE 100 bullish ahead of key announcements
The chart of the UK stock index FTSE 100 (UK 100 on FXOpen) shows prevailing positive sentiment in the market. The right side of the daily chart displays a series of bullish candles, with a likelihood of this trend continuing today, as the price has been rising since the market opened.
This optimism is likely driven by the anticipation of key announcements:
→ Tomorrow at 09:00 GMT+3, the UK CPI figures will be released. Analysts expect inflation to remain steady without an increase.
→ Also tomorrow, at 21:00 GMT+3, the Federal Reserve will announce its decision on interest rates, with a cut seeming inevitable.
Technical analysis of the FTSE 100 (UK 100 on FXOpen) chart shows:
→ In 2024, the price movement has followed an upward blue channel. The period starting in May may represent an interim correction (marked by red lines) within the ongoing uptrend.
→ The significance of the current rise lies in it being the second attempt to break through the upper red line, offering a chance to exit the corrective channel and resume growth. The first attempt was unsuccessful, as the bullish breakout above the upper red line encountered resistance from the median of the blue channel (indicated by an arrow).
Therefore, tomorrow's expected volatility spike could either reinforce the positive momentum, pushing the FTSE 100 (UK 100 on FXOpen) higher beyond the red line, or act as a "cold shower," undoing recent bullish gains and driving the price back into the red channel.
Trade global index CFDs with zero commission and tight spreads. Open your FXOpen account now or learn more about trading index CFDs with FXOpen.
CFDs are complex instruments and come with a high risk of losing your money.
This article represents the opinion of the Companies operating under the FXOpen brand only. It is not to be construed as an offer, solicitation, or recommendation with respect to products and services provided by the Companies operating under the FXOpen brand, nor is it to be considered financial advice.
👍2
#marketanalysis #MarketNews #forextrading
EUR/ZAR: A New Currency Pair for Trading on FXOpen
Traders using FXOpen can now incorporate the EUR/ZAR currency pair into their strategies.
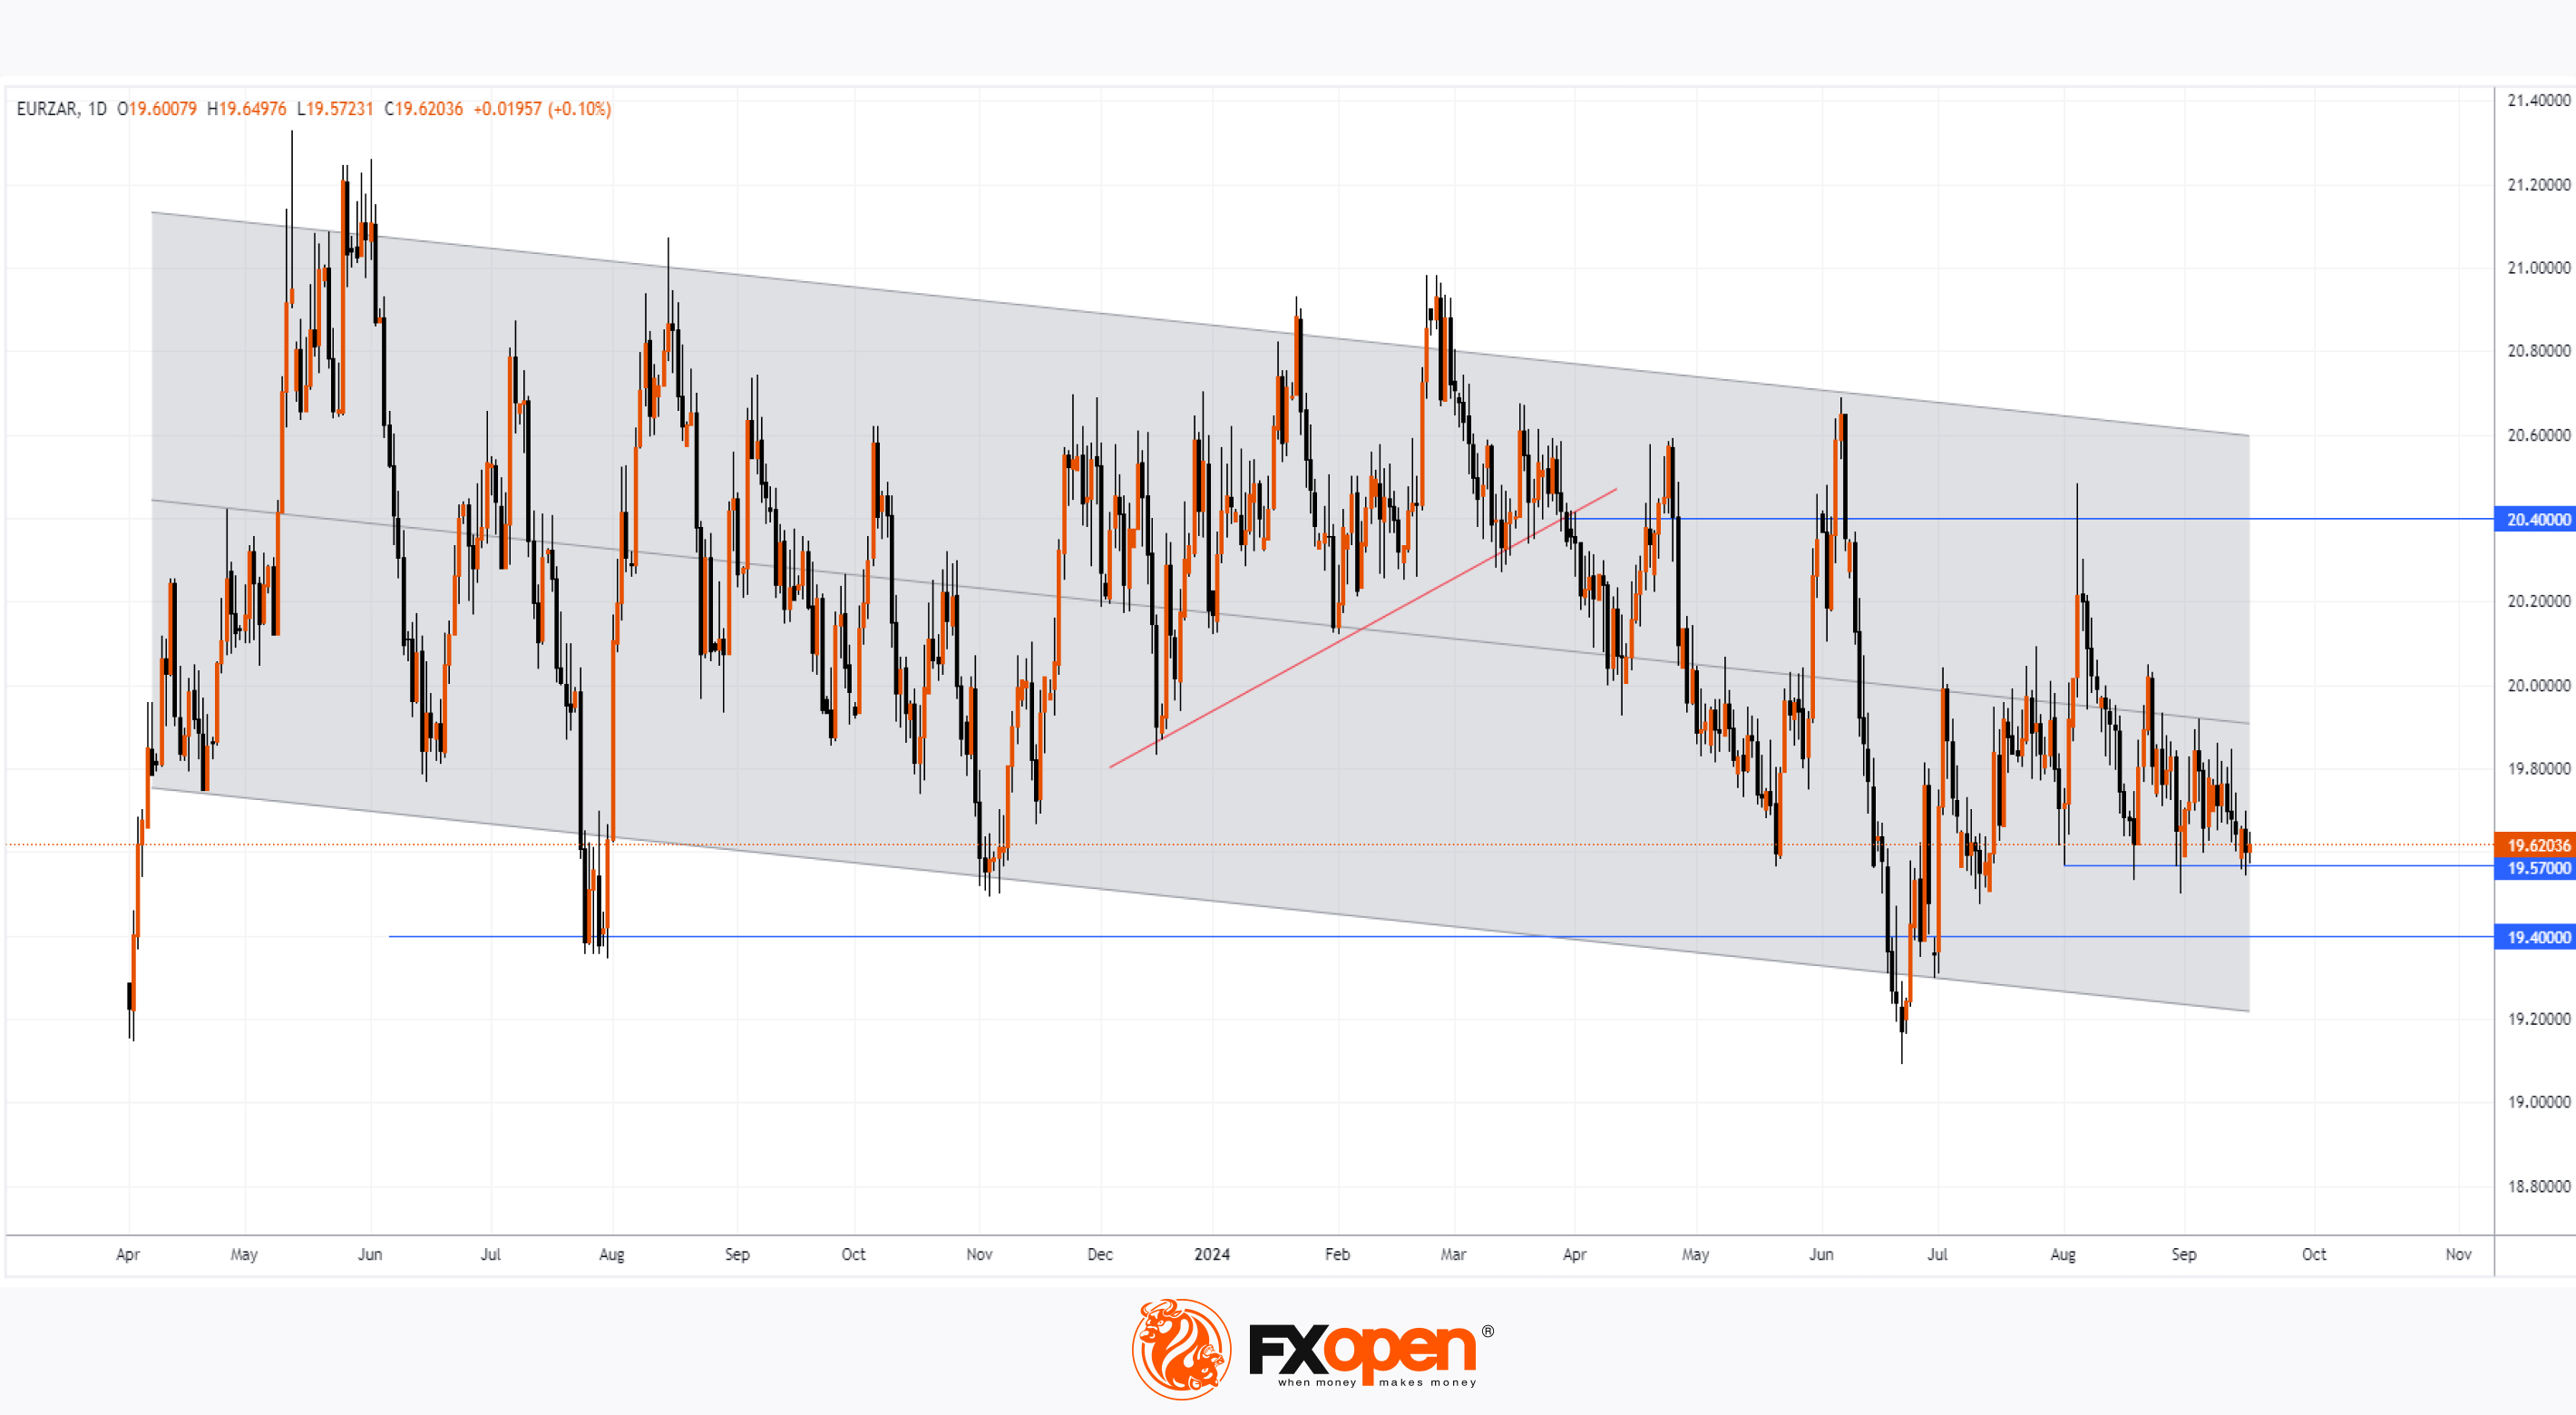
The EUR/ZAR pair is known for its volatility, making it suitable for trend trading within a single day. On the other hand, as the daily chart (below) shows, the exchange rate remains within a range, which supports swing trading around key support and resistance levels.
What Influences the EUR/ZAR Exchange Rate?
Key factors affecting the value of the South African rand (ZAR) in 2024 include:
→ High Inflation: In January, inflation was 5.4%, but by July it had decreased to 4.6% due to high interest rates set by the South African Reserve Bank, which strengthen the rand.
→ Prices of Exported Commodities: Gold, platinum, and diamonds.
→ Political Instability: Domestic political events and reforms can trigger spikes in volatility.
Technical Analysis of EUR/ZAR
Analysis of the EUR/ZAR chart for 2024 reveals that:
→ The price is moving in a weak downtrend, as indicated by the grey linear regression channel.
→ At the end of 2023, the price was supported by a trendline (in red), but after a bearish breakout in March 2024, the breakout zone (around 20.4) started to show signs of resistance.
→ Conversely, the level of 19.4 appears as significant support. It is possible that the price may test this level for resilience later this year. Currently, bearish pressure is held at the support level of 19.57.
EUR/ZAR Forecasts
Using global macroeconomic forecasting models, Trading Economics analysts predict that the EUR/ZAR rate could be 19.9468 in one year.
Trade over 50 forex markets 24 hours a day with FXOpen. Take advantage of low commissions, deep liquidity, and spreads from 0.0 pips. Open your FXOpen account now or learn more about trading forex with FXOpen.
CFDs are complex instruments and come with a high risk of losing your money.
This article represents the opinion of the Companies operating under the FXOpen brand only. It is not to be construed as an offer, solicitation, or recommendation with respect to products and services provided by the Companies operating under the FXOpen brand, nor is it to be considered financial advice.
EUR/ZAR: A New Currency Pair for Trading on FXOpen
Traders using FXOpen can now incorporate the EUR/ZAR currency pair into their strategies.
The EUR/ZAR pair is known for its volatility, making it suitable for trend trading within a single day. On the other hand, as the daily chart (below) shows, the exchange rate remains within a range, which supports swing trading around key support and resistance levels.
What Influences the EUR/ZAR Exchange Rate?
Key factors affecting the value of the South African rand (ZAR) in 2024 include:
→ High Inflation: In January, inflation was 5.4%, but by July it had decreased to 4.6% due to high interest rates set by the South African Reserve Bank, which strengthen the rand.
→ Prices of Exported Commodities: Gold, platinum, and diamonds.
→ Political Instability: Domestic political events and reforms can trigger spikes in volatility.
Technical Analysis of EUR/ZAR
Analysis of the EUR/ZAR chart for 2024 reveals that:
→ The price is moving in a weak downtrend, as indicated by the grey linear regression channel.
→ At the end of 2023, the price was supported by a trendline (in red), but after a bearish breakout in March 2024, the breakout zone (around 20.4) started to show signs of resistance.
→ Conversely, the level of 19.4 appears as significant support. It is possible that the price may test this level for resilience later this year. Currently, bearish pressure is held at the support level of 19.57.
EUR/ZAR Forecasts
Using global macroeconomic forecasting models, Trading Economics analysts predict that the EUR/ZAR rate could be 19.9468 in one year.
Trade over 50 forex markets 24 hours a day with FXOpen. Take advantage of low commissions, deep liquidity, and spreads from 0.0 pips. Open your FXOpen account now or learn more about trading forex with FXOpen.
CFDs are complex instruments and come with a high risk of losing your money.
This article represents the opinion of the Companies operating under the FXOpen brand only. It is not to be construed as an offer, solicitation, or recommendation with respect to products and services provided by the Companies operating under the FXOpen brand, nor is it to be considered financial advice.
👍2
#sp500 #stockmarket #stocktrading #marketanalysis
S&P 500 Sets Record Ahead of Fed Decision
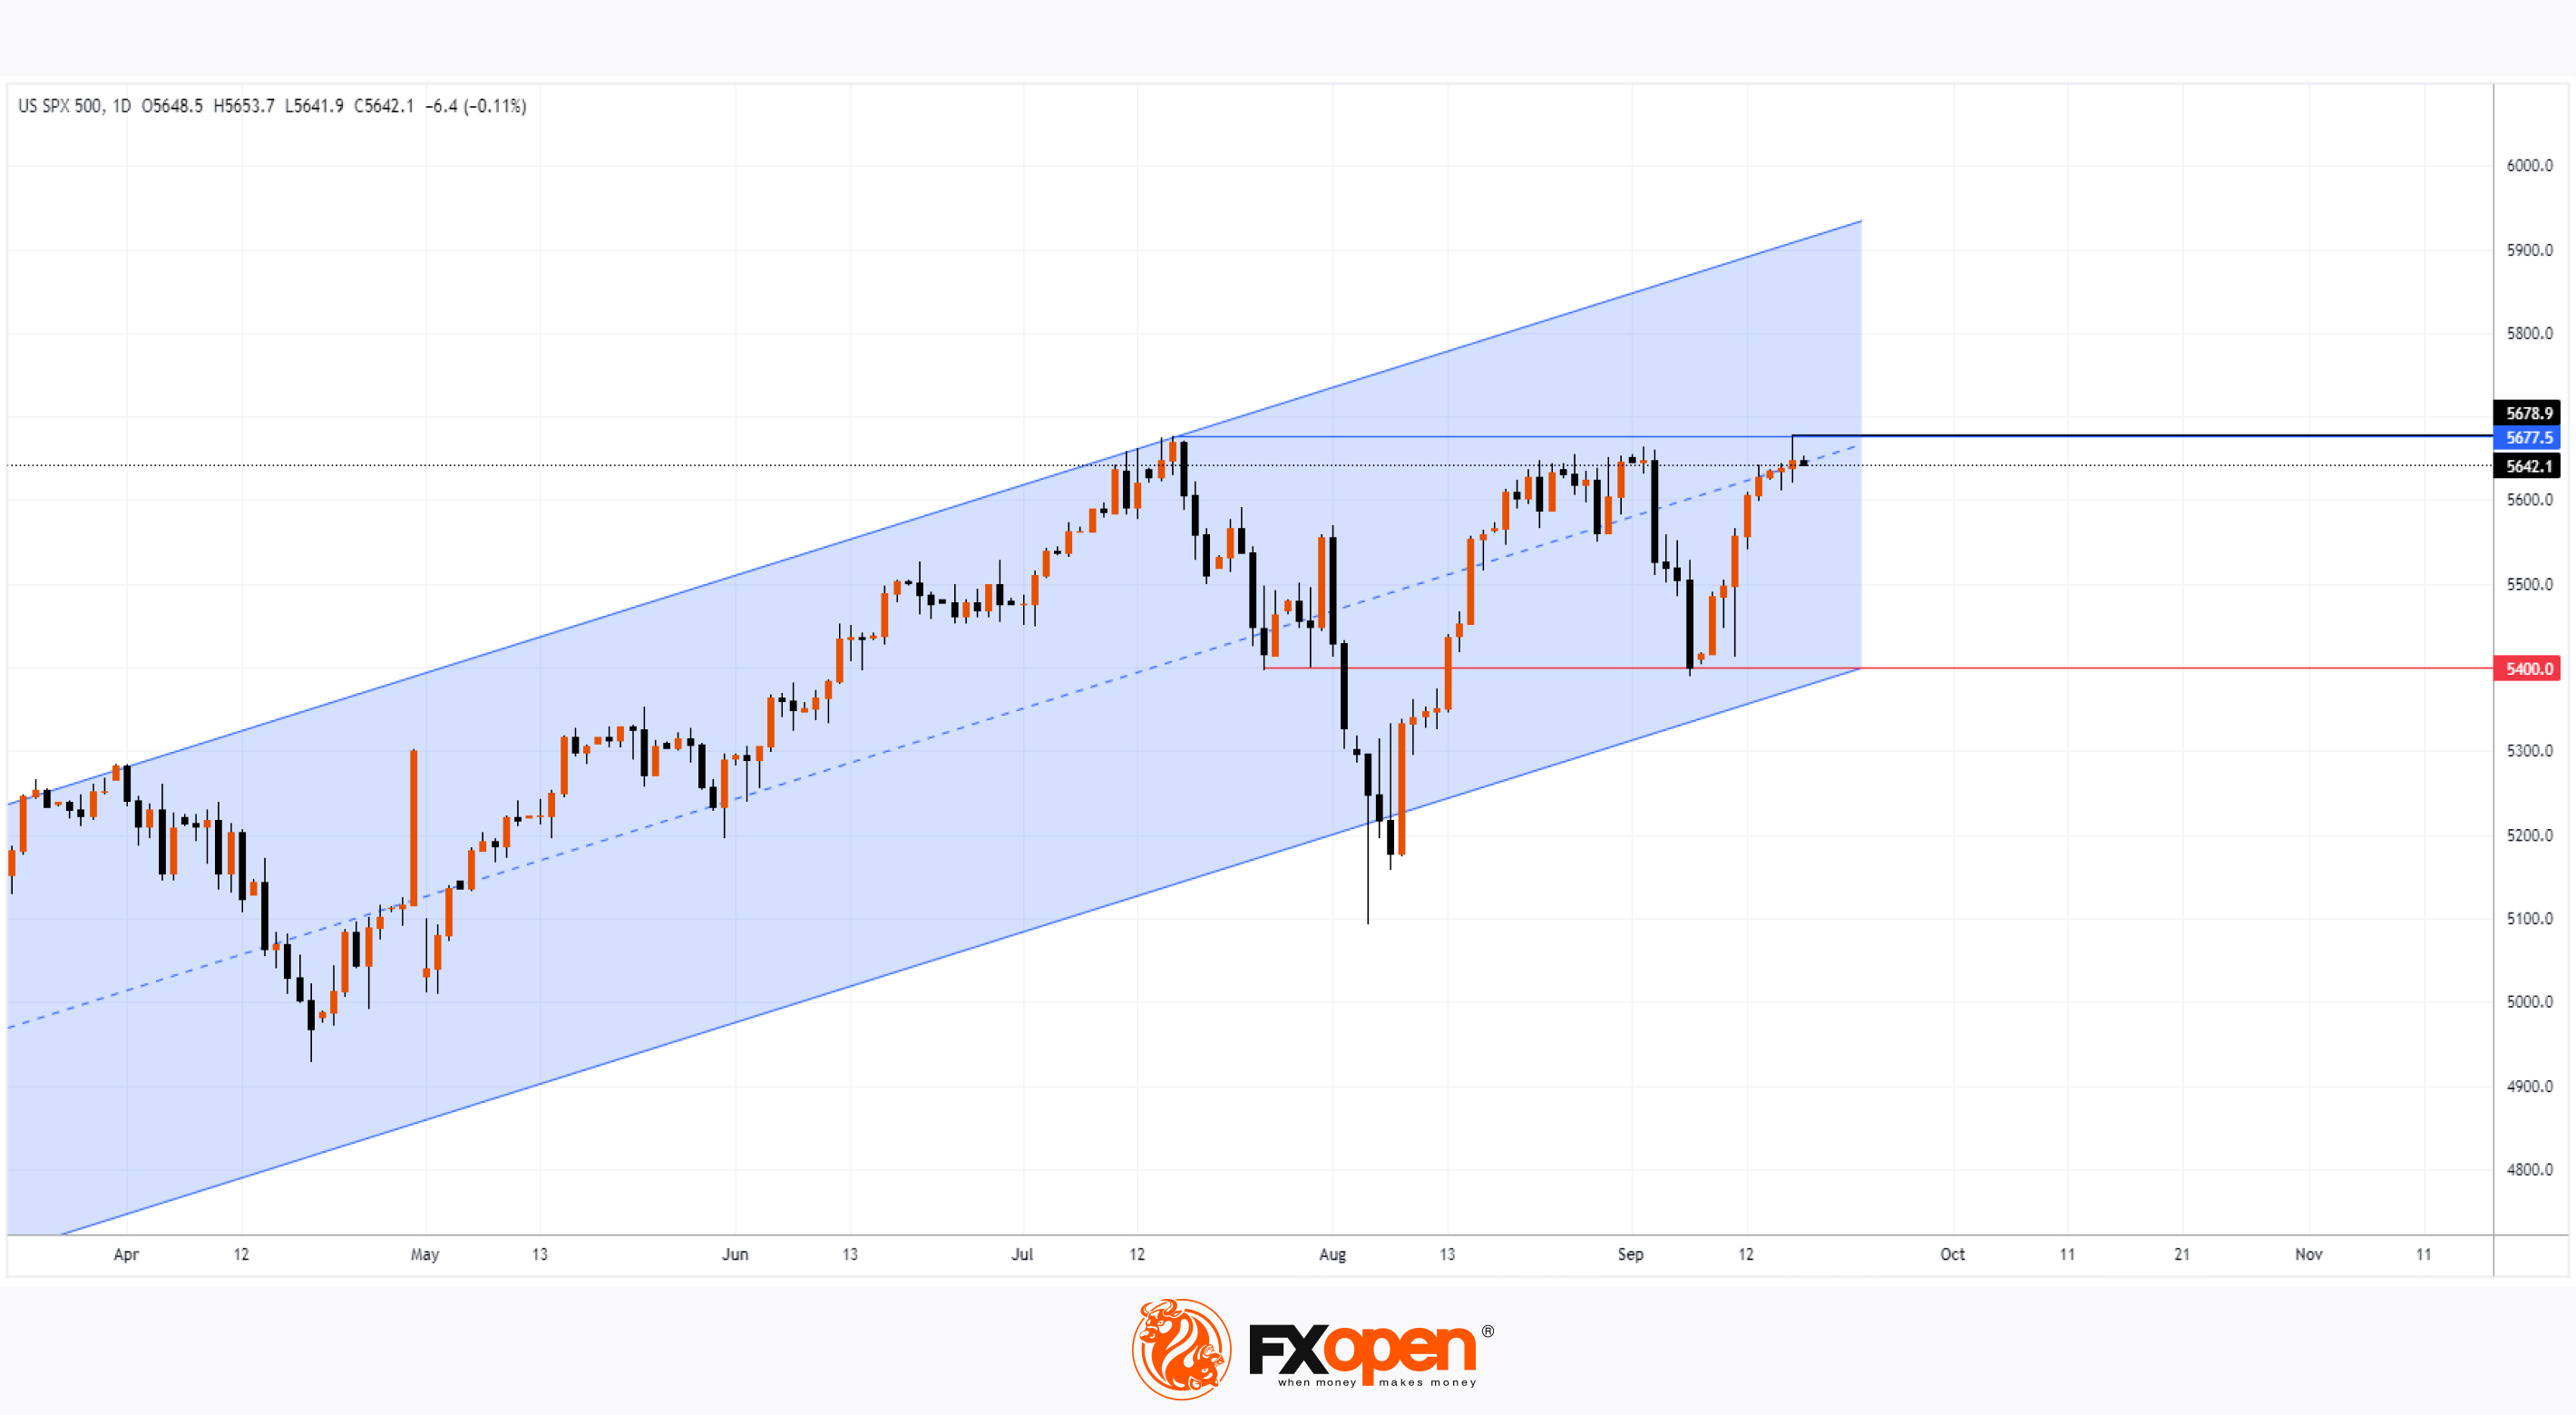
As shown by the S&P 500 index chart (US SPX 500 mini on FXOpen), yesterday's trading saw the index hit a new intraday high of 5,678.9, surpassing the previous record of 5,677.5 set on 16 July. However, the bulls were unable to maintain this historic peak, which is a negative sign, suggesting the possibility of a bear trap scenario.
Nevertheless, this first new record in two months is significant as it shows the market's recovery from the panic-driven drop on 5 August, which was linked to fears of a potential recession.
Yesterday’s rise was boosted by the US Commerce Department's August retail sales report, which exceeded expectations. As Forbes noted, this supports the view that the US is not on the brink of a recession.
The market now heads into the final stretch before the highly anticipated Federal Reserve decision, expected today at 21:00 GMT+3, which will likely see the first interest rate cut in 4.5 years.
According to Forex Factory, analysts predict a rate cut to 5.25% from the current 5.50%. However, surprises are possible, with a 0.5% cut also on the table. Only a small minority seems to expect the rate to remain unchanged.
Technical analysis of the S&P 500 index chart (US SPX 500 mini on FXOpen) shows that the market is in an uptrend, marked by a blue channel. The index is trading near the median of this channel, suggesting a balance of supply and demand. Such conditions increase the likelihood of a flat market, but this seems unlikely with the Fed potentially starting a rate-cutting cycle.
Prepare for volatility today: the decision will be announced at 21:00 GMT+3, followed by Fed Chair Powell's press conference at 21:30 GMT+3. If a bearish move occurs, support for the S&P 500 index (US SPX 500 mini on FXOpen) may come at the 5,400 level.
Trade global index CFDs with zero commission and tight spreads. Open your FXOpen account now or learn more about trading index CFDs with FXOpen.
CFDs are complex instruments and come with a high risk of losing your money.
This article represents the opinion of the Companies operating under the FXOpen brand only. It is not to be construed as an offer, solicitation, or recommendation with respect to products and services provided by the Companies operating under the FXOpen brand, nor is it to be considered financial advice.
S&P 500 Sets Record Ahead of Fed Decision
As shown by the S&P 500 index chart (US SPX 500 mini on FXOpen), yesterday's trading saw the index hit a new intraday high of 5,678.9, surpassing the previous record of 5,677.5 set on 16 July. However, the bulls were unable to maintain this historic peak, which is a negative sign, suggesting the possibility of a bear trap scenario.
Nevertheless, this first new record in two months is significant as it shows the market's recovery from the panic-driven drop on 5 August, which was linked to fears of a potential recession.
Yesterday’s rise was boosted by the US Commerce Department's August retail sales report, which exceeded expectations. As Forbes noted, this supports the view that the US is not on the brink of a recession.
The market now heads into the final stretch before the highly anticipated Federal Reserve decision, expected today at 21:00 GMT+3, which will likely see the first interest rate cut in 4.5 years.
According to Forex Factory, analysts predict a rate cut to 5.25% from the current 5.50%. However, surprises are possible, with a 0.5% cut also on the table. Only a small minority seems to expect the rate to remain unchanged.
Technical analysis of the S&P 500 index chart (US SPX 500 mini on FXOpen) shows that the market is in an uptrend, marked by a blue channel. The index is trading near the median of this channel, suggesting a balance of supply and demand. Such conditions increase the likelihood of a flat market, but this seems unlikely with the Fed potentially starting a rate-cutting cycle.
Prepare for volatility today: the decision will be announced at 21:00 GMT+3, followed by Fed Chair Powell's press conference at 21:30 GMT+3. If a bearish move occurs, support for the S&P 500 index (US SPX 500 mini on FXOpen) may come at the 5,400 level.
Trade global index CFDs with zero commission and tight spreads. Open your FXOpen account now or learn more about trading index CFDs with FXOpen.
CFDs are complex instruments and come with a high risk of losing your money.
This article represents the opinion of the Companies operating under the FXOpen brand only. It is not to be construed as an offer, solicitation, or recommendation with respect to products and services provided by the Companies operating under the FXOpen brand, nor is it to be considered financial advice.
👍2
#marketanalysis #MarketNews
Fed Cuts Interest Rates by 0.5%
As we have frequently noted, a rate cut by the Federal Reserve seemed inevitable. Market participants debated whether the reduction would be 0.5% or 0.25%, and those predicting a 0.5% cut were proven correct.
According to Bloomberg, a narrow majority of 10 out of 19 committee members supported the 50-basis-point cut. Seven members favoured an additional 0.25% cut later this year, while two opposed any further reductions.
Fed Chair Jerome Powell stated that the 0.5% cut "reflects our growing confidence that we can maintain labour market strength amid moderate growth and a steady decline in inflation to 2%". He added that interest rates are unlikely to return to the ultra-low levels seen for many years before the pandemic.
Financial markets reacted with increased volatility, with stock indices rising and the dollar strengthening slightly against other currencies. However, it is still too early to determine the impact of the Fed's decision on current trends.
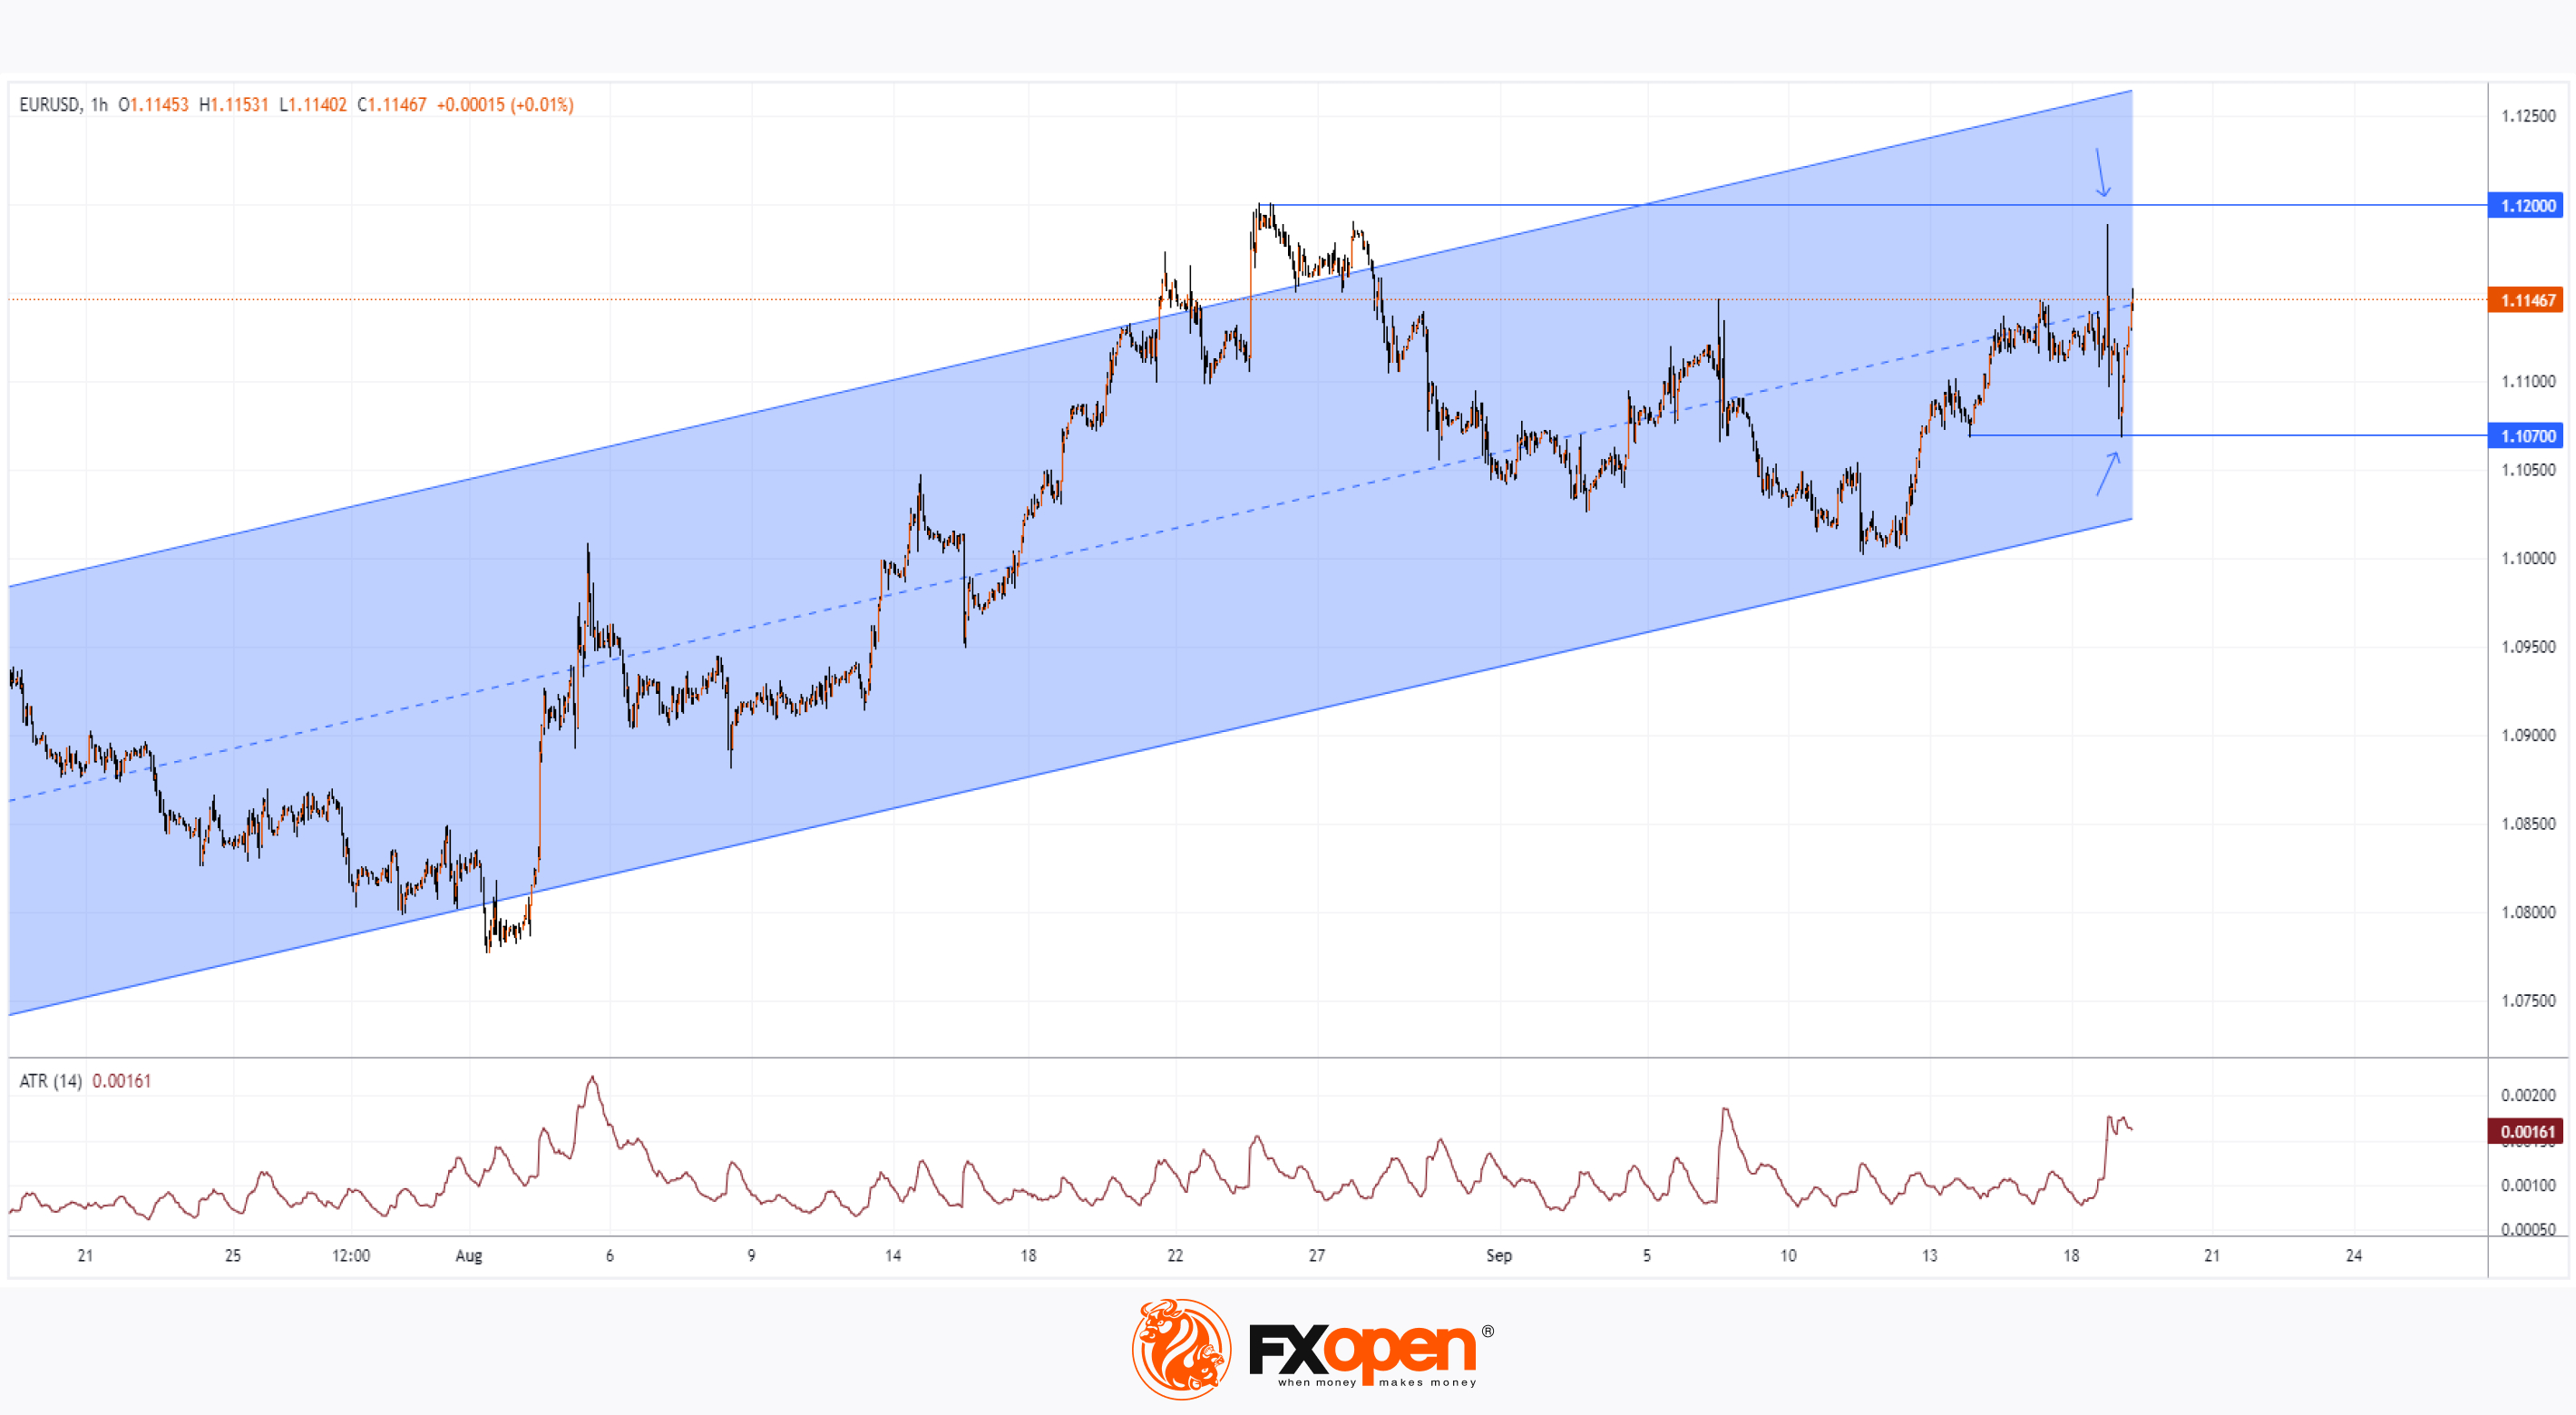
Technical analysis of the EUR/USD chart shows that:
→ The ATR indicator reveals that the Fed's decision led to a volatility spike, though it was smaller than the panic-induced drop in the Japanese stock market on 5 August. It seems the markets were better prepared for yesterday’s news.
→ Following the announcement, the price approached the late August high near the psychological level of 1.120 but did not exceed it. The volatility spike also tested the 13 September low around 1.107.
→ As of this morning, the EUR/USD rate is near the median line of the blue uptrend channel, constructed using linear regression, and equidistant from the extremes set during the volatility spike.
This suggests that the market is in a relatively balanced position. Market participants may need to better understand the implications of the Fed's decision. Their revised assessments, reflected in trading decisions, will provide more insight into the prevailing trends.
Trade over 50 forex markets 24 hours a day with FXOpen. Take advantage of low commissions, deep liquidity, and spreads from 0.0 pips. Open your FXOpen account now or learn more about trading forex with FXOpen.
CFDs are complex instruments and come with a high risk of losing your money.
This article represents the opinion of the Companies operating under the FXOpen brand only. It is not to be construed as an offer, solicitation, or recommendation with respect to products and services provided by the Companies operating under the FXOpen brand, nor is it to be considered financial advice.
Fed Cuts Interest Rates by 0.5%
As we have frequently noted, a rate cut by the Federal Reserve seemed inevitable. Market participants debated whether the reduction would be 0.5% or 0.25%, and those predicting a 0.5% cut were proven correct.
According to Bloomberg, a narrow majority of 10 out of 19 committee members supported the 50-basis-point cut. Seven members favoured an additional 0.25% cut later this year, while two opposed any further reductions.
Fed Chair Jerome Powell stated that the 0.5% cut "reflects our growing confidence that we can maintain labour market strength amid moderate growth and a steady decline in inflation to 2%". He added that interest rates are unlikely to return to the ultra-low levels seen for many years before the pandemic.
Financial markets reacted with increased volatility, with stock indices rising and the dollar strengthening slightly against other currencies. However, it is still too early to determine the impact of the Fed's decision on current trends.
Technical analysis of the EUR/USD chart shows that:
→ The ATR indicator reveals that the Fed's decision led to a volatility spike, though it was smaller than the panic-induced drop in the Japanese stock market on 5 August. It seems the markets were better prepared for yesterday’s news.
→ Following the announcement, the price approached the late August high near the psychological level of 1.120 but did not exceed it. The volatility spike also tested the 13 September low around 1.107.
→ As of this morning, the EUR/USD rate is near the median line of the blue uptrend channel, constructed using linear regression, and equidistant from the extremes set during the volatility spike.
This suggests that the market is in a relatively balanced position. Market participants may need to better understand the implications of the Fed's decision. Their revised assessments, reflected in trading decisions, will provide more insight into the prevailing trends.
Trade over 50 forex markets 24 hours a day with FXOpen. Take advantage of low commissions, deep liquidity, and spreads from 0.0 pips. Open your FXOpen account now or learn more about trading forex with FXOpen.
CFDs are complex instruments and come with a high risk of losing your money.
This article represents the opinion of the Companies operating under the FXOpen brand only. It is not to be construed as an offer, solicitation, or recommendation with respect to products and services provided by the Companies operating under the FXOpen brand, nor is it to be considered financial advice.
👍2
#sp500 #stockmarket #marketanalysis #MarketNews
Australian S&P/ASX 200 Index Hits All-Time High
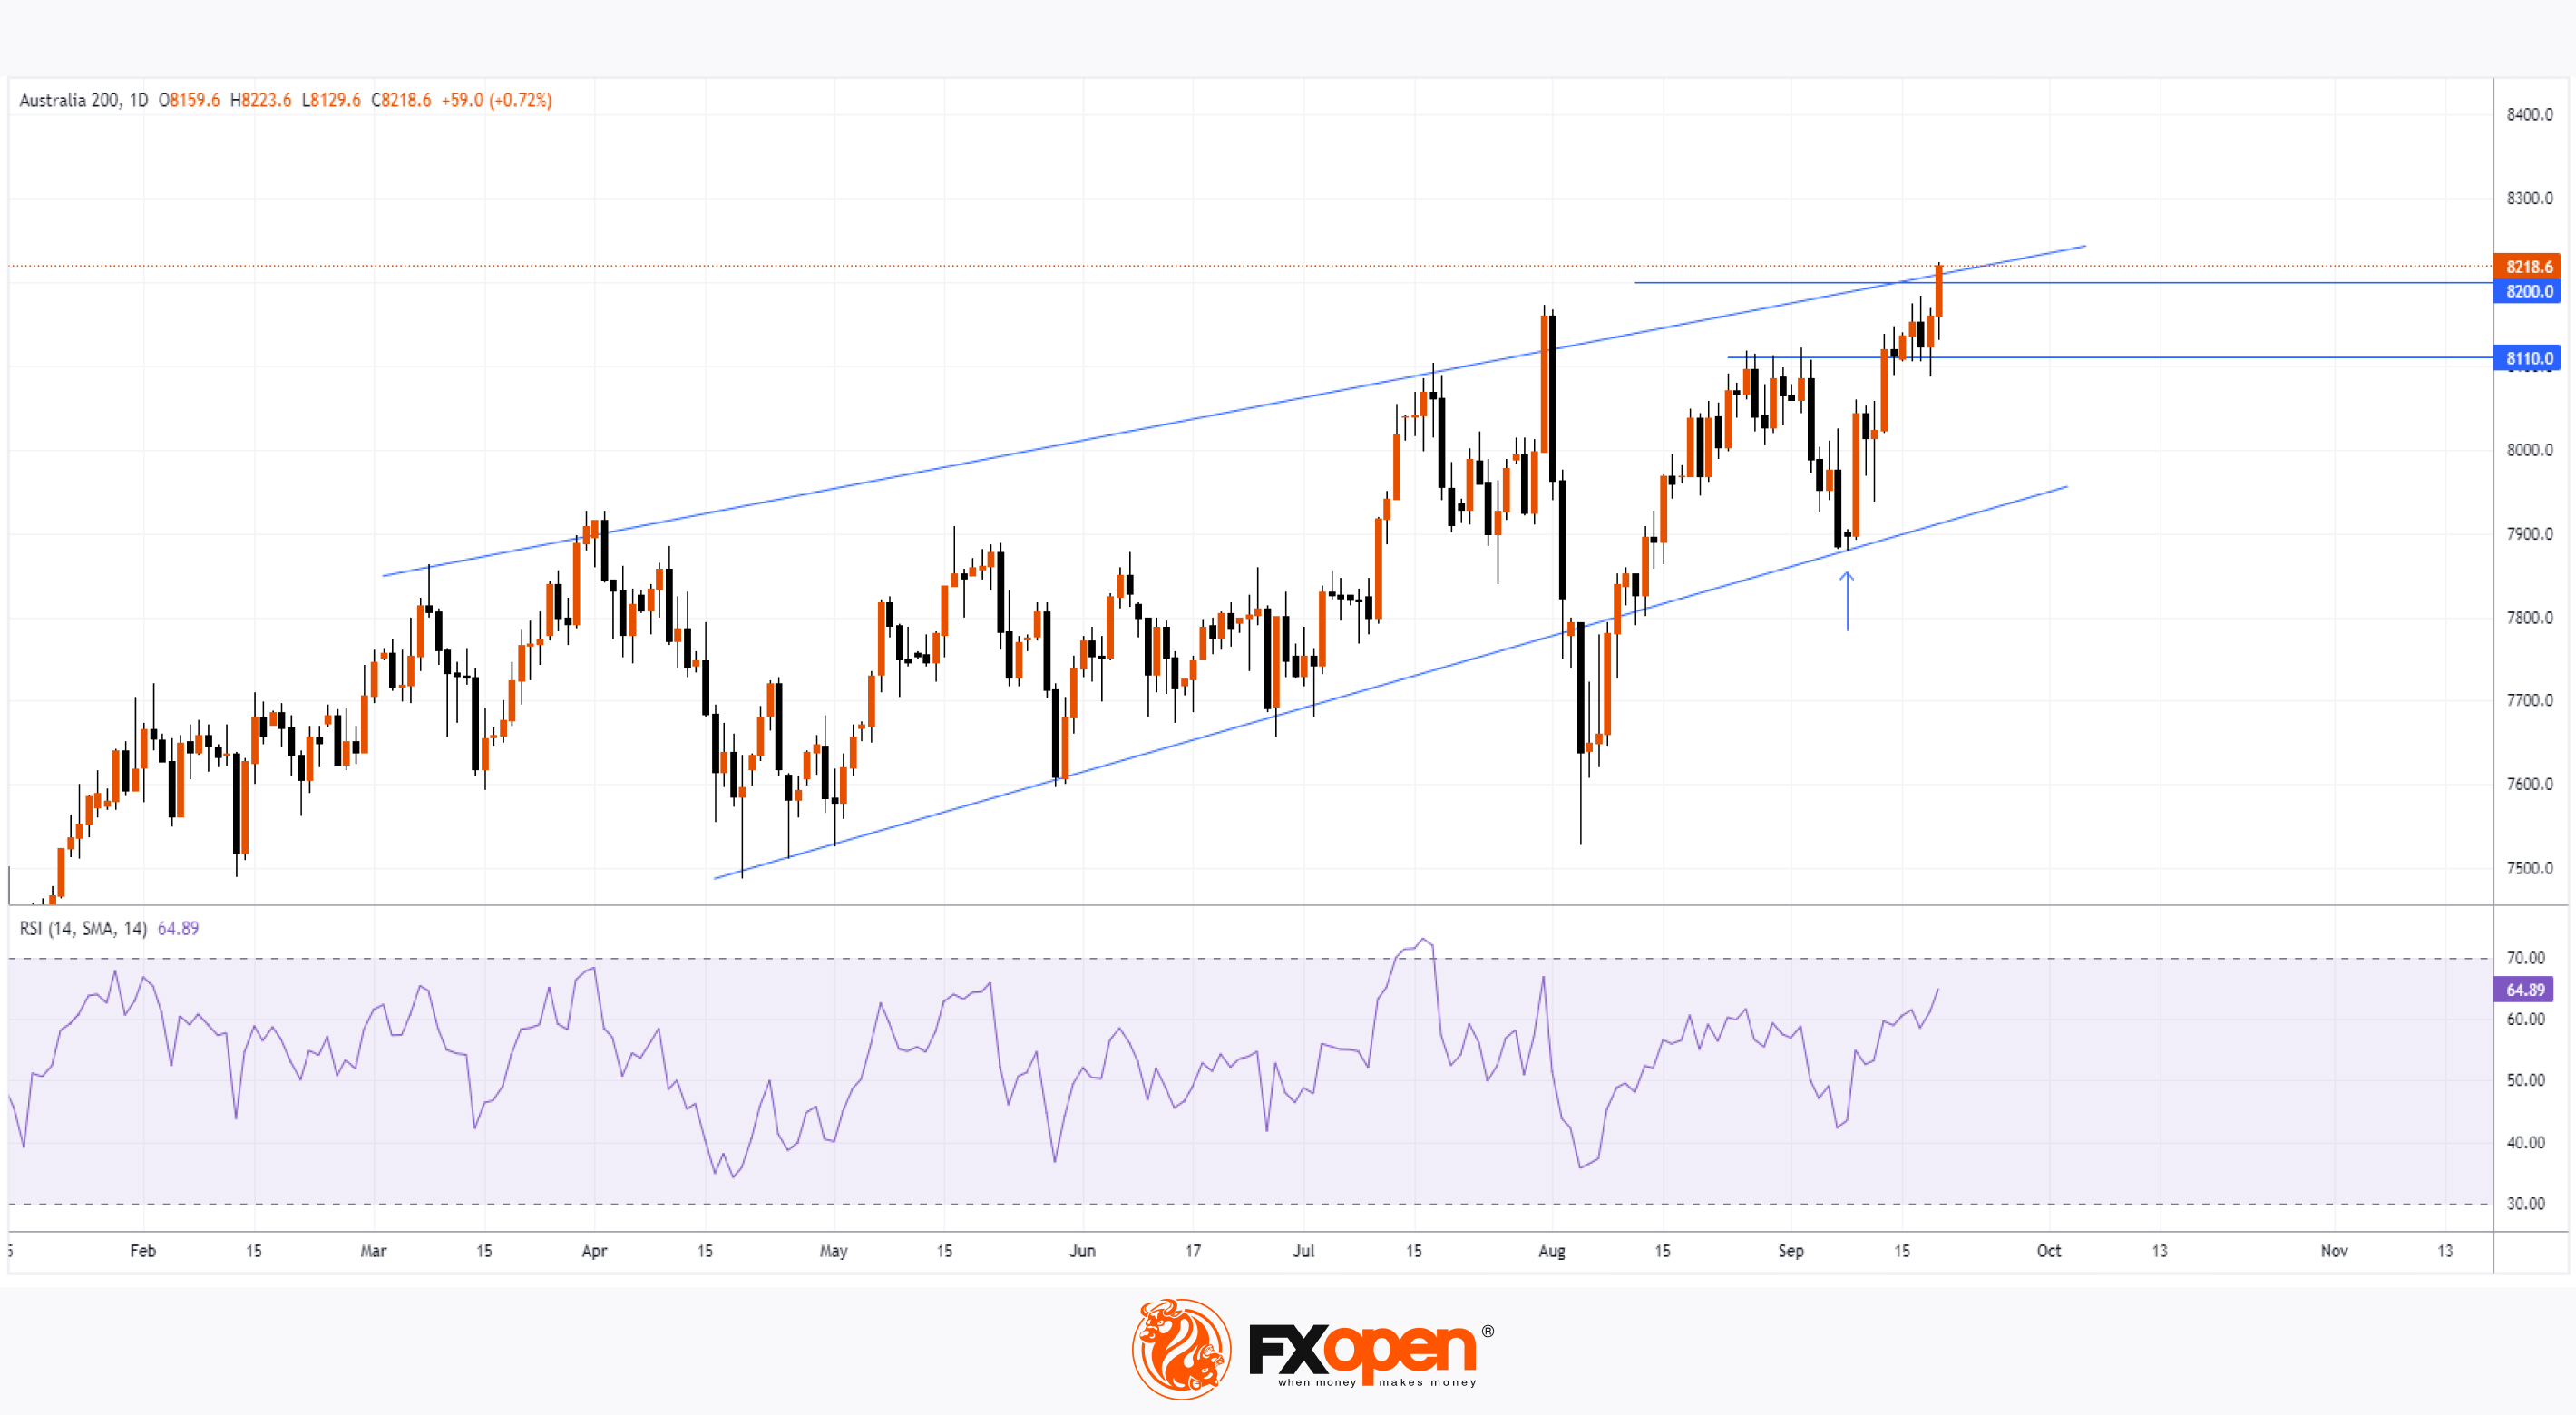
As seen on the S&P/ASX 200 chart (Australia 200 on FXOpen), today's candle surpassed the 8200 level, marking a new all-time high.
Positive sentiment was driven by:
→ The Federal Reserve’s decision to cut interest rates, which led to a surge in volatility and set historical records for gold prices (XAU/USD), the S&P 500 index (US SPX 500 mini on FXOpen), and others.
→ Today's positive news from the Australian labour market, showing that unemployment has not increased, and the number of new jobs created in the month exceeded expectations (actual = 47.5 thousand, forecast = 26.4 thousand).
Technical Analysis
The S&P/ASX 200 chart (Australia 200 on FXOpen) indicates price movement within converging trend lines:
→ The lower line was breached in early August amid widespread panic across financial markets. However, it later resumed its role as support, as indicated by the arrow.
→ The upper line acts as resistance, which today is reinforced by the psychological level of 8200. Despite this, the price's position near the candle's high suggests that bulls are showing persistence, at least for now.
Given that the RSI indicator is at its highest level since early August, it is reasonable to anticipate that current bullish sentiment might face increased selling pressure in the short term. If the S&P/ASX 200 (Australia 200 on FXOpen) follows a correction scenario, support could come from the previously mentioned level of 8200, as well as the 8110 level, which has shifted from resistance to support.
Trade global index CFDs with zero commission and tight spreads. Open your FXOpen account now or learn more about trading index CFDs with FXOpen.
CFDs are complex instruments and come with a high risk of losing your money.
This article represents the opinion of the Companies operating under the FXOpen brand only. It is not to be construed as an offer, solicitation, or recommendation with respect to products and services provided by the Companies operating under the FXOpen brand, nor is it to be considered financial advice.
Australian S&P/ASX 200 Index Hits All-Time High
As seen on the S&P/ASX 200 chart (Australia 200 on FXOpen), today's candle surpassed the 8200 level, marking a new all-time high.
Positive sentiment was driven by:
→ The Federal Reserve’s decision to cut interest rates, which led to a surge in volatility and set historical records for gold prices (XAU/USD), the S&P 500 index (US SPX 500 mini on FXOpen), and others.
→ Today's positive news from the Australian labour market, showing that unemployment has not increased, and the number of new jobs created in the month exceeded expectations (actual = 47.5 thousand, forecast = 26.4 thousand).
Technical Analysis
The S&P/ASX 200 chart (Australia 200 on FXOpen) indicates price movement within converging trend lines:
→ The lower line was breached in early August amid widespread panic across financial markets. However, it later resumed its role as support, as indicated by the arrow.
→ The upper line acts as resistance, which today is reinforced by the psychological level of 8200. Despite this, the price's position near the candle's high suggests that bulls are showing persistence, at least for now.
Given that the RSI indicator is at its highest level since early August, it is reasonable to anticipate that current bullish sentiment might face increased selling pressure in the short term. If the S&P/ASX 200 (Australia 200 on FXOpen) follows a correction scenario, support could come from the previously mentioned level of 8200, as well as the 8110 level, which has shifted from resistance to support.
Trade global index CFDs with zero commission and tight spreads. Open your FXOpen account now or learn more about trading index CFDs with FXOpen.
CFDs are complex instruments and come with a high risk of losing your money.
This article represents the opinion of the Companies operating under the FXOpen brand only. It is not to be construed as an offer, solicitation, or recommendation with respect to products and services provided by the Companies operating under the FXOpen brand, nor is it to be considered financial advice.
👍2
#tsla #stockmarket #stocktrading #MarketNews
The Price of Tesla (TSLA) Shares Has Risen by More Than 7%
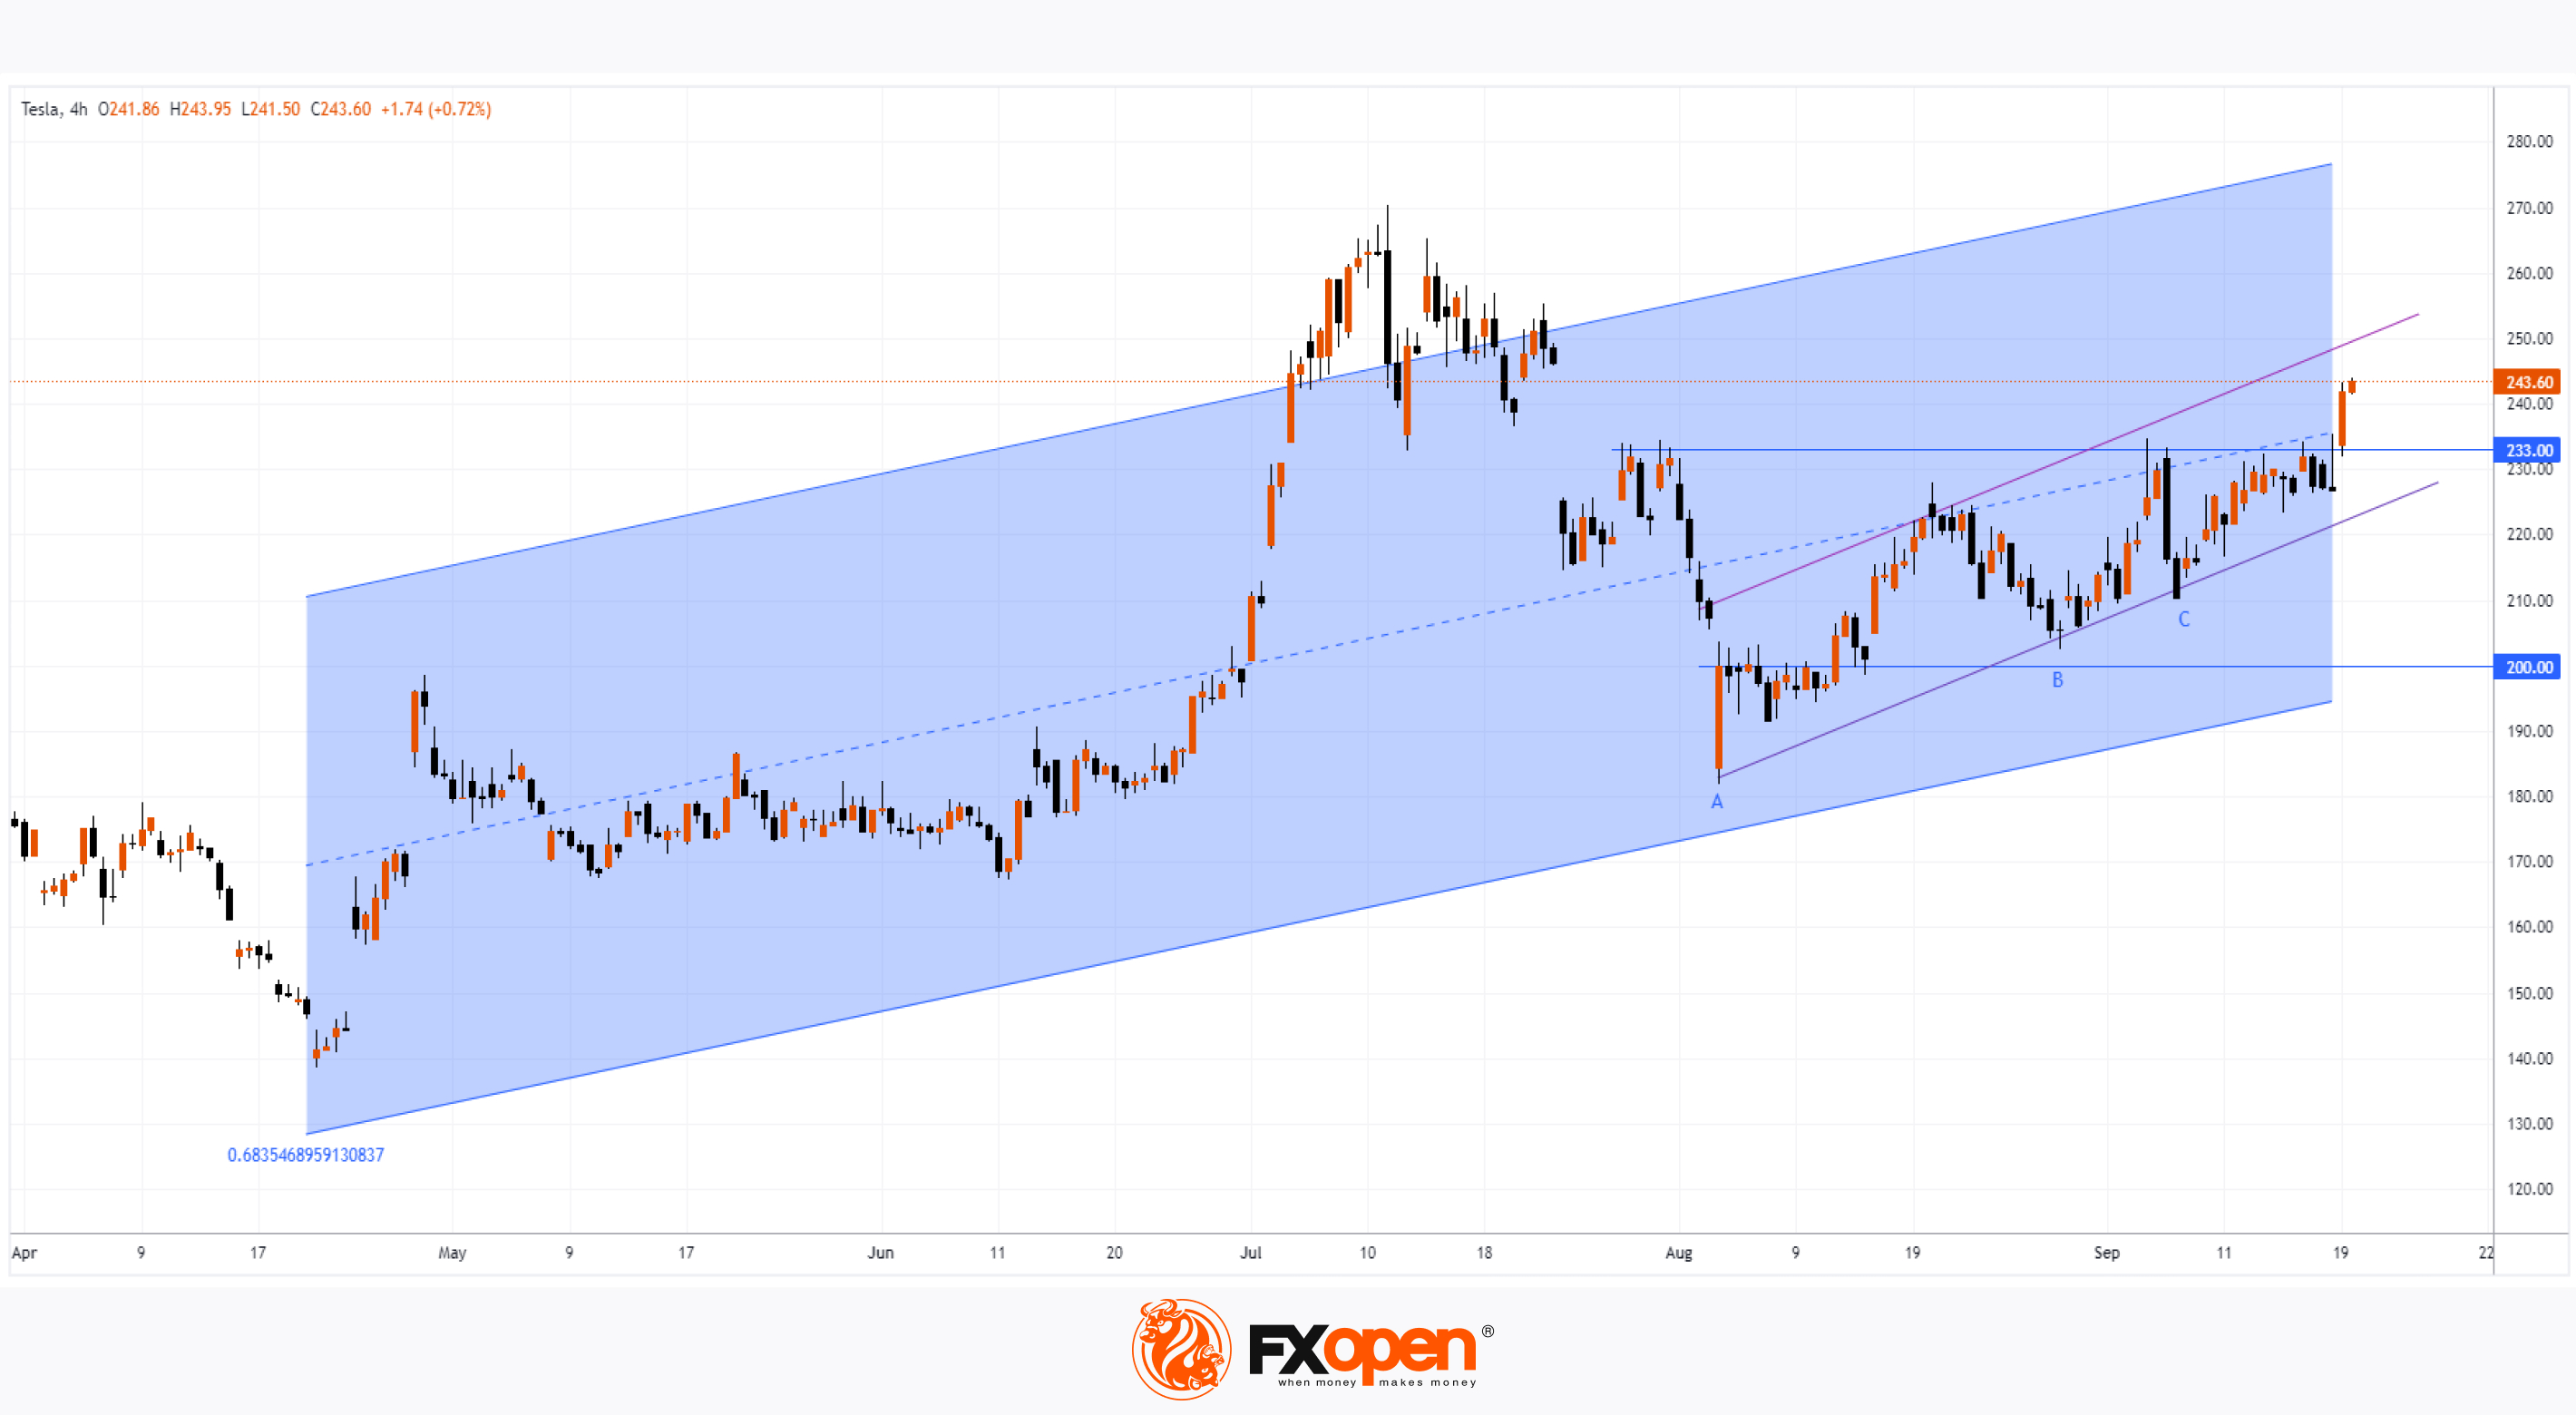
As the Tesla (TSLA) stock chart shows today, the price increased by more than 7% during yesterday's trading, surpassing the $240 mark.
The bullish sentiment was supported by the following factors:
→ The Federal Reserve's decision to cut interest rates by 0.5%;
→ Data tracked by Citi analyst Jeff Chung. According to Barron’s, they indicated that Tesla sold more than 15,000 vehicles in China last week – strong sales there could help the company deliver one of its best quarters.
→ A key signal from the technical analysis of the Tesla (TSLA) chart.
Today's technical analysis of the Tesla (TSLA) chart shows that:
→ The price has broken through the $233 resistance level, which had been exerting pressure since the end of July. Notably, the rising lows A-B-C (resembling a bullish cup and handle pattern) suggest that demand strength has been increasing over time, which ultimately led to the breakout.
→ The blue channel, constructed using the linear regression method, points to an upward trend, with the price entering the upper half of this channel – further confirmation of bullish sentiment.
On 16 August, when analysing the TSLA chart, we suggested that the $200 level could serve as a platform from which Tesla (TSLA) would begin its growth story. What’s next?
It’s possible that the bullish momentum accompanying the break of the $233 resistance will drive the price towards the upper boundary of the upward channel, which was formed from the lows of 5 August (shown in purple). This could result in closing the bearish gap from 24 July.
If so, it would motivate experts to raise their assessments, as they currently remain pessimistic. According to the average opinion of analysts surveyed by TipRanks, the 12-month price forecast for Tesla (TSLA) shares stands at $208.46, indicating the potential for a decline towards the lower boundary of the blue channel.
Trade global index CFDs with zero commission and tight spreads. Open your FXOpen account now or learn more about trading index CFDs with FXOpen.
CFDs are complex instruments and come with a high risk of losing your money.
This article represents the opinion of the Companies operating under the FXOpen brand only. It is not to be construed as an offer, solicitation, or recommendation with respect to products and services provided by the Companies operating under the FXOpen brand, nor is it to be considered financial advice.
The Price of Tesla (TSLA) Shares Has Risen by More Than 7%
As the Tesla (TSLA) stock chart shows today, the price increased by more than 7% during yesterday's trading, surpassing the $240 mark.
The bullish sentiment was supported by the following factors:
→ The Federal Reserve's decision to cut interest rates by 0.5%;
→ Data tracked by Citi analyst Jeff Chung. According to Barron’s, they indicated that Tesla sold more than 15,000 vehicles in China last week – strong sales there could help the company deliver one of its best quarters.
→ A key signal from the technical analysis of the Tesla (TSLA) chart.
Today's technical analysis of the Tesla (TSLA) chart shows that:
→ The price has broken through the $233 resistance level, which had been exerting pressure since the end of July. Notably, the rising lows A-B-C (resembling a bullish cup and handle pattern) suggest that demand strength has been increasing over time, which ultimately led to the breakout.
→ The blue channel, constructed using the linear regression method, points to an upward trend, with the price entering the upper half of this channel – further confirmation of bullish sentiment.
On 16 August, when analysing the TSLA chart, we suggested that the $200 level could serve as a platform from which Tesla (TSLA) would begin its growth story. What’s next?
It’s possible that the bullish momentum accompanying the break of the $233 resistance will drive the price towards the upper boundary of the upward channel, which was formed from the lows of 5 August (shown in purple). This could result in closing the bearish gap from 24 July.
If so, it would motivate experts to raise their assessments, as they currently remain pessimistic. According to the average opinion of analysts surveyed by TipRanks, the 12-month price forecast for Tesla (TSLA) shares stands at $208.46, indicating the potential for a decline towards the lower boundary of the blue channel.
Trade global index CFDs with zero commission and tight spreads. Open your FXOpen account now or learn more about trading index CFDs with FXOpen.
CFDs are complex instruments and come with a high risk of losing your money.
This article represents the opinion of the Companies operating under the FXOpen brand only. It is not to be construed as an offer, solicitation, or recommendation with respect to products and services provided by the Companies operating under the FXOpen brand, nor is it to be considered financial advice.
👍2
#marketanalysis #MarketNews #USDZAR #forextrading
Analysis of USD/ZAR: Price Recovers from Multi-Month Low
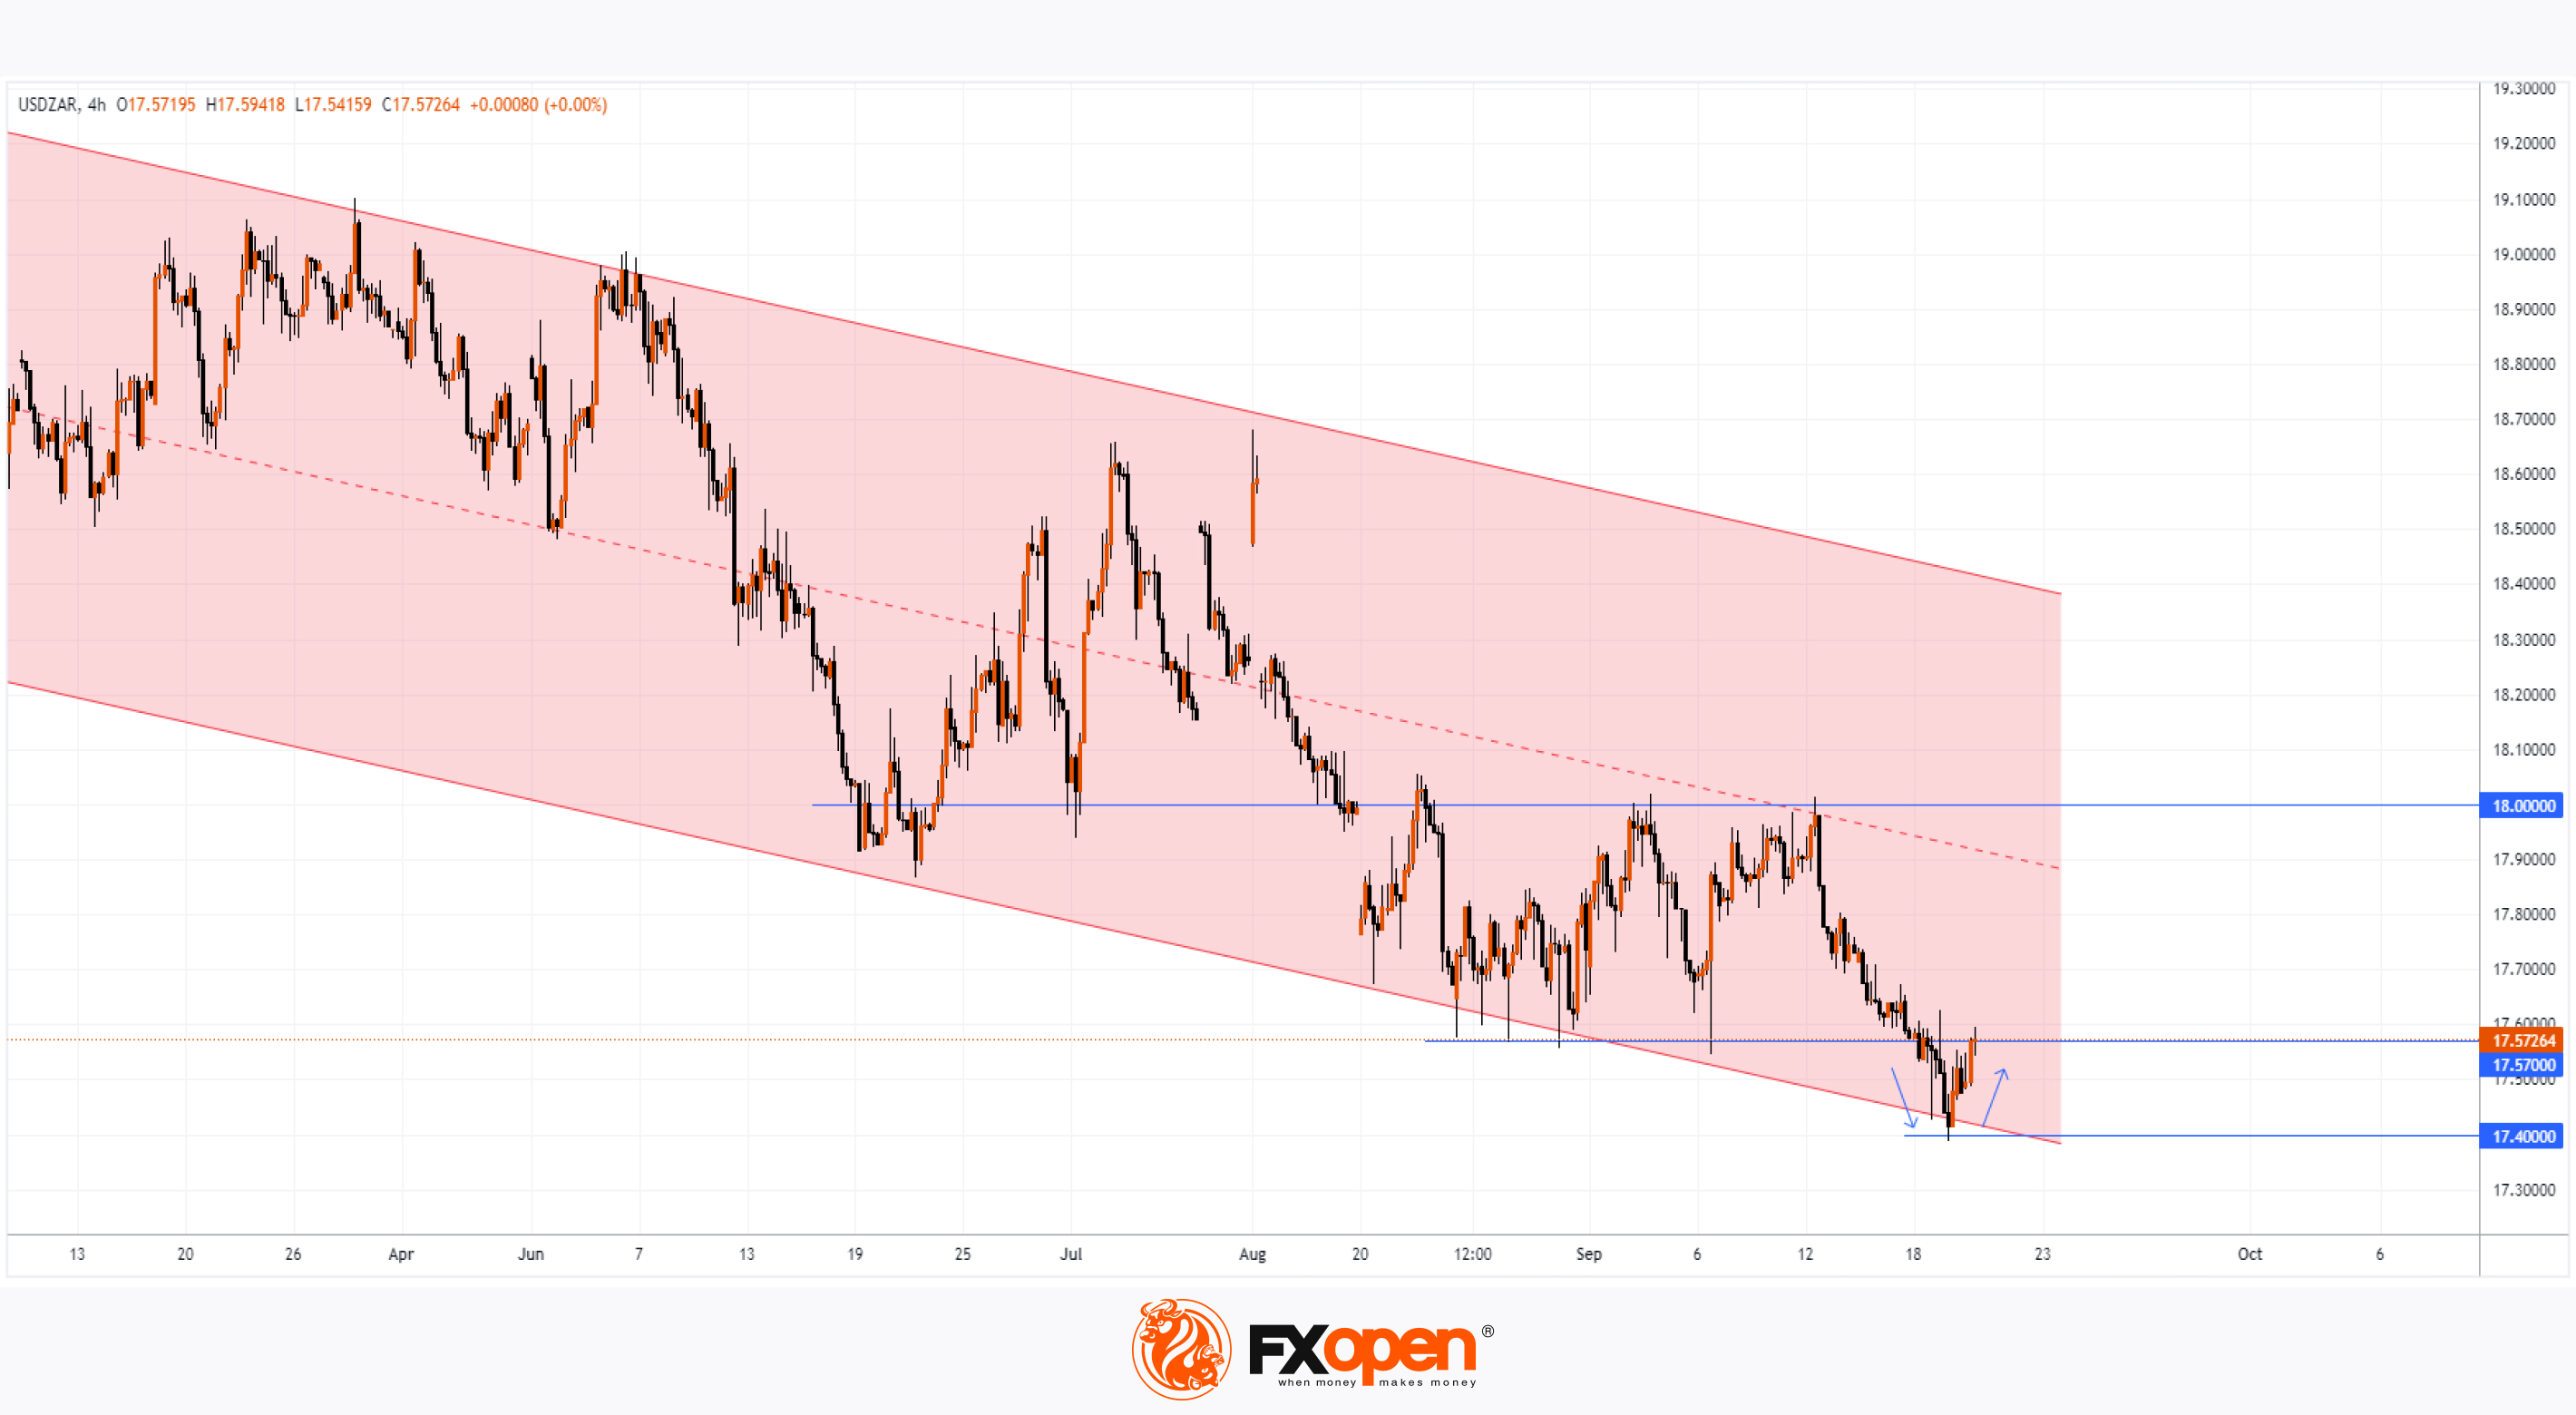
As shown by the USD/ZAR chart, on 19th September the price fell below the 17.400 level for the first time since February 2023.
It is likely that this was more due to the weakness of the US dollar ahead of the Federal Reserve's decision on interest rate cuts than to the strength of the South African rand.
However, after the decision was published, the ensuing surge in volatility led the price to hit a multi-month low, and today the USD/ZAR chart offers bulls increasing hope for a rebound.
The technical analysis of the USD/ZAR chart indicates that in 2024, the price movement has been forming a downtrend, represented by the red descending price channel. Bears have managed to push the price below the psychological level of 18 rand per US dollar, and since the end of August, this level has acted as resistance.
During the current week, the price dropped (first arrow) below the 17.57 level, which had previously acted as support. The subsequent recovery (second arrow) from the lower boundary of the channel could prove to be an important signal:
→ if the price consolidates above 17.57, this may indicate a bear trap, signalling a bullish reversal;
→ if the price shows that the 17.57 level acts as resistance, it may be interpreted as bears maintaining control of the market.
In any case, the addition of the volatile USD/ZAR currency pair to the list of available instruments on FXOpen opens up new opportunities for Forex traders.
For information. According to data for 2024:
The average daily price fluctuation for USD/ZAR is 1.22%;
The most volatile days are Tuesday, Wednesday, and Thursday;
The least volatile day is Monday.
Trade over 50 forex markets 24 hours a day with FXOpen. Take advantage of low commissions, deep liquidity, and spreads from 0.0 pips. Open your FXOpen account now or learn more about trading forex with FXOpen.
CFDs are complex instruments and come with a high risk of losing your money.
This article represents the opinion of the Companies operating under the FXOpen brand only. It is not to be construed as an offer, solicitation, or recommendation with respect to products and services provided by the Companies operating under the FXOpen brand, nor is it to be considered financial advice.
Analysis of USD/ZAR: Price Recovers from Multi-Month Low
As shown by the USD/ZAR chart, on 19th September the price fell below the 17.400 level for the first time since February 2023.
It is likely that this was more due to the weakness of the US dollar ahead of the Federal Reserve's decision on interest rate cuts than to the strength of the South African rand.
However, after the decision was published, the ensuing surge in volatility led the price to hit a multi-month low, and today the USD/ZAR chart offers bulls increasing hope for a rebound.
The technical analysis of the USD/ZAR chart indicates that in 2024, the price movement has been forming a downtrend, represented by the red descending price channel. Bears have managed to push the price below the psychological level of 18 rand per US dollar, and since the end of August, this level has acted as resistance.
During the current week, the price dropped (first arrow) below the 17.57 level, which had previously acted as support. The subsequent recovery (second arrow) from the lower boundary of the channel could prove to be an important signal:
→ if the price consolidates above 17.57, this may indicate a bear trap, signalling a bullish reversal;
→ if the price shows that the 17.57 level acts as resistance, it may be interpreted as bears maintaining control of the market.
In any case, the addition of the volatile USD/ZAR currency pair to the list of available instruments on FXOpen opens up new opportunities for Forex traders.
For information. According to data for 2024:
The average daily price fluctuation for USD/ZAR is 1.22%;
The most volatile days are Tuesday, Wednesday, and Thursday;
The least volatile day is Monday.
Trade over 50 forex markets 24 hours a day with FXOpen. Take advantage of low commissions, deep liquidity, and spreads from 0.0 pips. Open your FXOpen account now or learn more about trading forex with FXOpen.
CFDs are complex instruments and come with a high risk of losing your money.
This article represents the opinion of the Companies operating under the FXOpen brand only. It is not to be construed as an offer, solicitation, or recommendation with respect to products and services provided by the Companies operating under the FXOpen brand, nor is it to be considered financial advice.
👍2
#SP500 #FedRateCut #FinancialNews #StockMarket #ASX200 #USDollar #MarketUpdates
Weekly Market Wrap With Gary Thomson: S&P 500, Fed Cuts Interest Rates, US Dollar, S&P/ASX 200 Index
Get the latest scoop on the week's hottest headlines, all in one convenient video. Join Gary Thomson, the COO of FXOpen UK, as he breaks down the most significant news reports and shares his expert insights.
🔸 S&P 500 Sets Record Ahead of Fed Decision
🔸 Fed Cuts Interest Rates by 0.5%
🔸 Dollar Trades Mixed after Fed Rate Cut
🔸 Australian S&P/ASX 200 Index Hits All-Time High
Stay in the know and empower yourself with our short, yet power-packed video. Watch it now and stay updated with FXOpen. Don't miss out on this invaluable opportunity to sharpen your trading skills and make informed decisions.
https://cutt.ly/meYf0OCZ
To take advantage of price fluctuations in the foreign exchange markets, consider enlisting the services of a reliable broker like FXOpen.
⚠️
This forecast represents FXOpen Companies opinion only, it should not be construed as an offer, invitation or recommendation in respect to FXOpen Companies products and services or as financial advice.
Weekly Market Wrap With Gary Thomson: S&P 500, Fed Cuts Interest Rates, US Dollar, S&P/ASX 200 Index
Get the latest scoop on the week's hottest headlines, all in one convenient video. Join Gary Thomson, the COO of FXOpen UK, as he breaks down the most significant news reports and shares his expert insights.
🔸 S&P 500 Sets Record Ahead of Fed Decision
🔸 Fed Cuts Interest Rates by 0.5%
🔸 Dollar Trades Mixed after Fed Rate Cut
🔸 Australian S&P/ASX 200 Index Hits All-Time High
Stay in the know and empower yourself with our short, yet power-packed video. Watch it now and stay updated with FXOpen. Don't miss out on this invaluable opportunity to sharpen your trading skills and make informed decisions.
https://cutt.ly/meYf0OCZ
To take advantage of price fluctuations in the foreign exchange markets, consider enlisting the services of a reliable broker like FXOpen.
⚠️
This forecast represents FXOpen Companies opinion only, it should not be construed as an offer, invitation or recommendation in respect to FXOpen Companies products and services or as financial advice.
YouTube
Weekly Market Wrap With Gary Thomson: S&P 500, Fed Cuts Interest Rates, US Dollar, S&P/ASX 200 Index
Get the latest scoop on the week's hottest headlines, all in one convenient video. Join Gary Thomson, the COO of FXOpen UK, as he breaks down the most significant news reports and shares his expert insights.
00:38 S&P 500 Sets Record Ahead of Fed Decision…
00:38 S&P 500 Sets Record Ahead of Fed Decision…
👍3
#stockmarket #marketanalysis #MarketNews
The Price of Nike (NKE) Shares Surged by More Than 6%
Investors in Nike (NKE) can hardly call 2024 a successful year:
→ while the S&P 500 index (US SPX 500 mini on FXOpen) has risen by over 20% since the beginning of the year and is hovering near historic highs,
→ the price of NKE shares has dropped by about 20% in 2024 and is now more than twice as low as its all-time high reached in 2021.
Nike’s shares have been in a downward trend for several months, driven by increasing competition, as confirmed by the latest quarterly report, which showed that sales remained flat, and the company forecasts a potential 10% decline in quarterly sales.
As CNN reports, many investors had been calling for changes at Nike. Thus, they welcomed the news of a leadership change – it was announced last week that the current CEO, John Donahoe, will retire next month and will be replaced by former Nike executive Elliott Hill – which led to a rise in the company’s shares by over 6% in a single day.
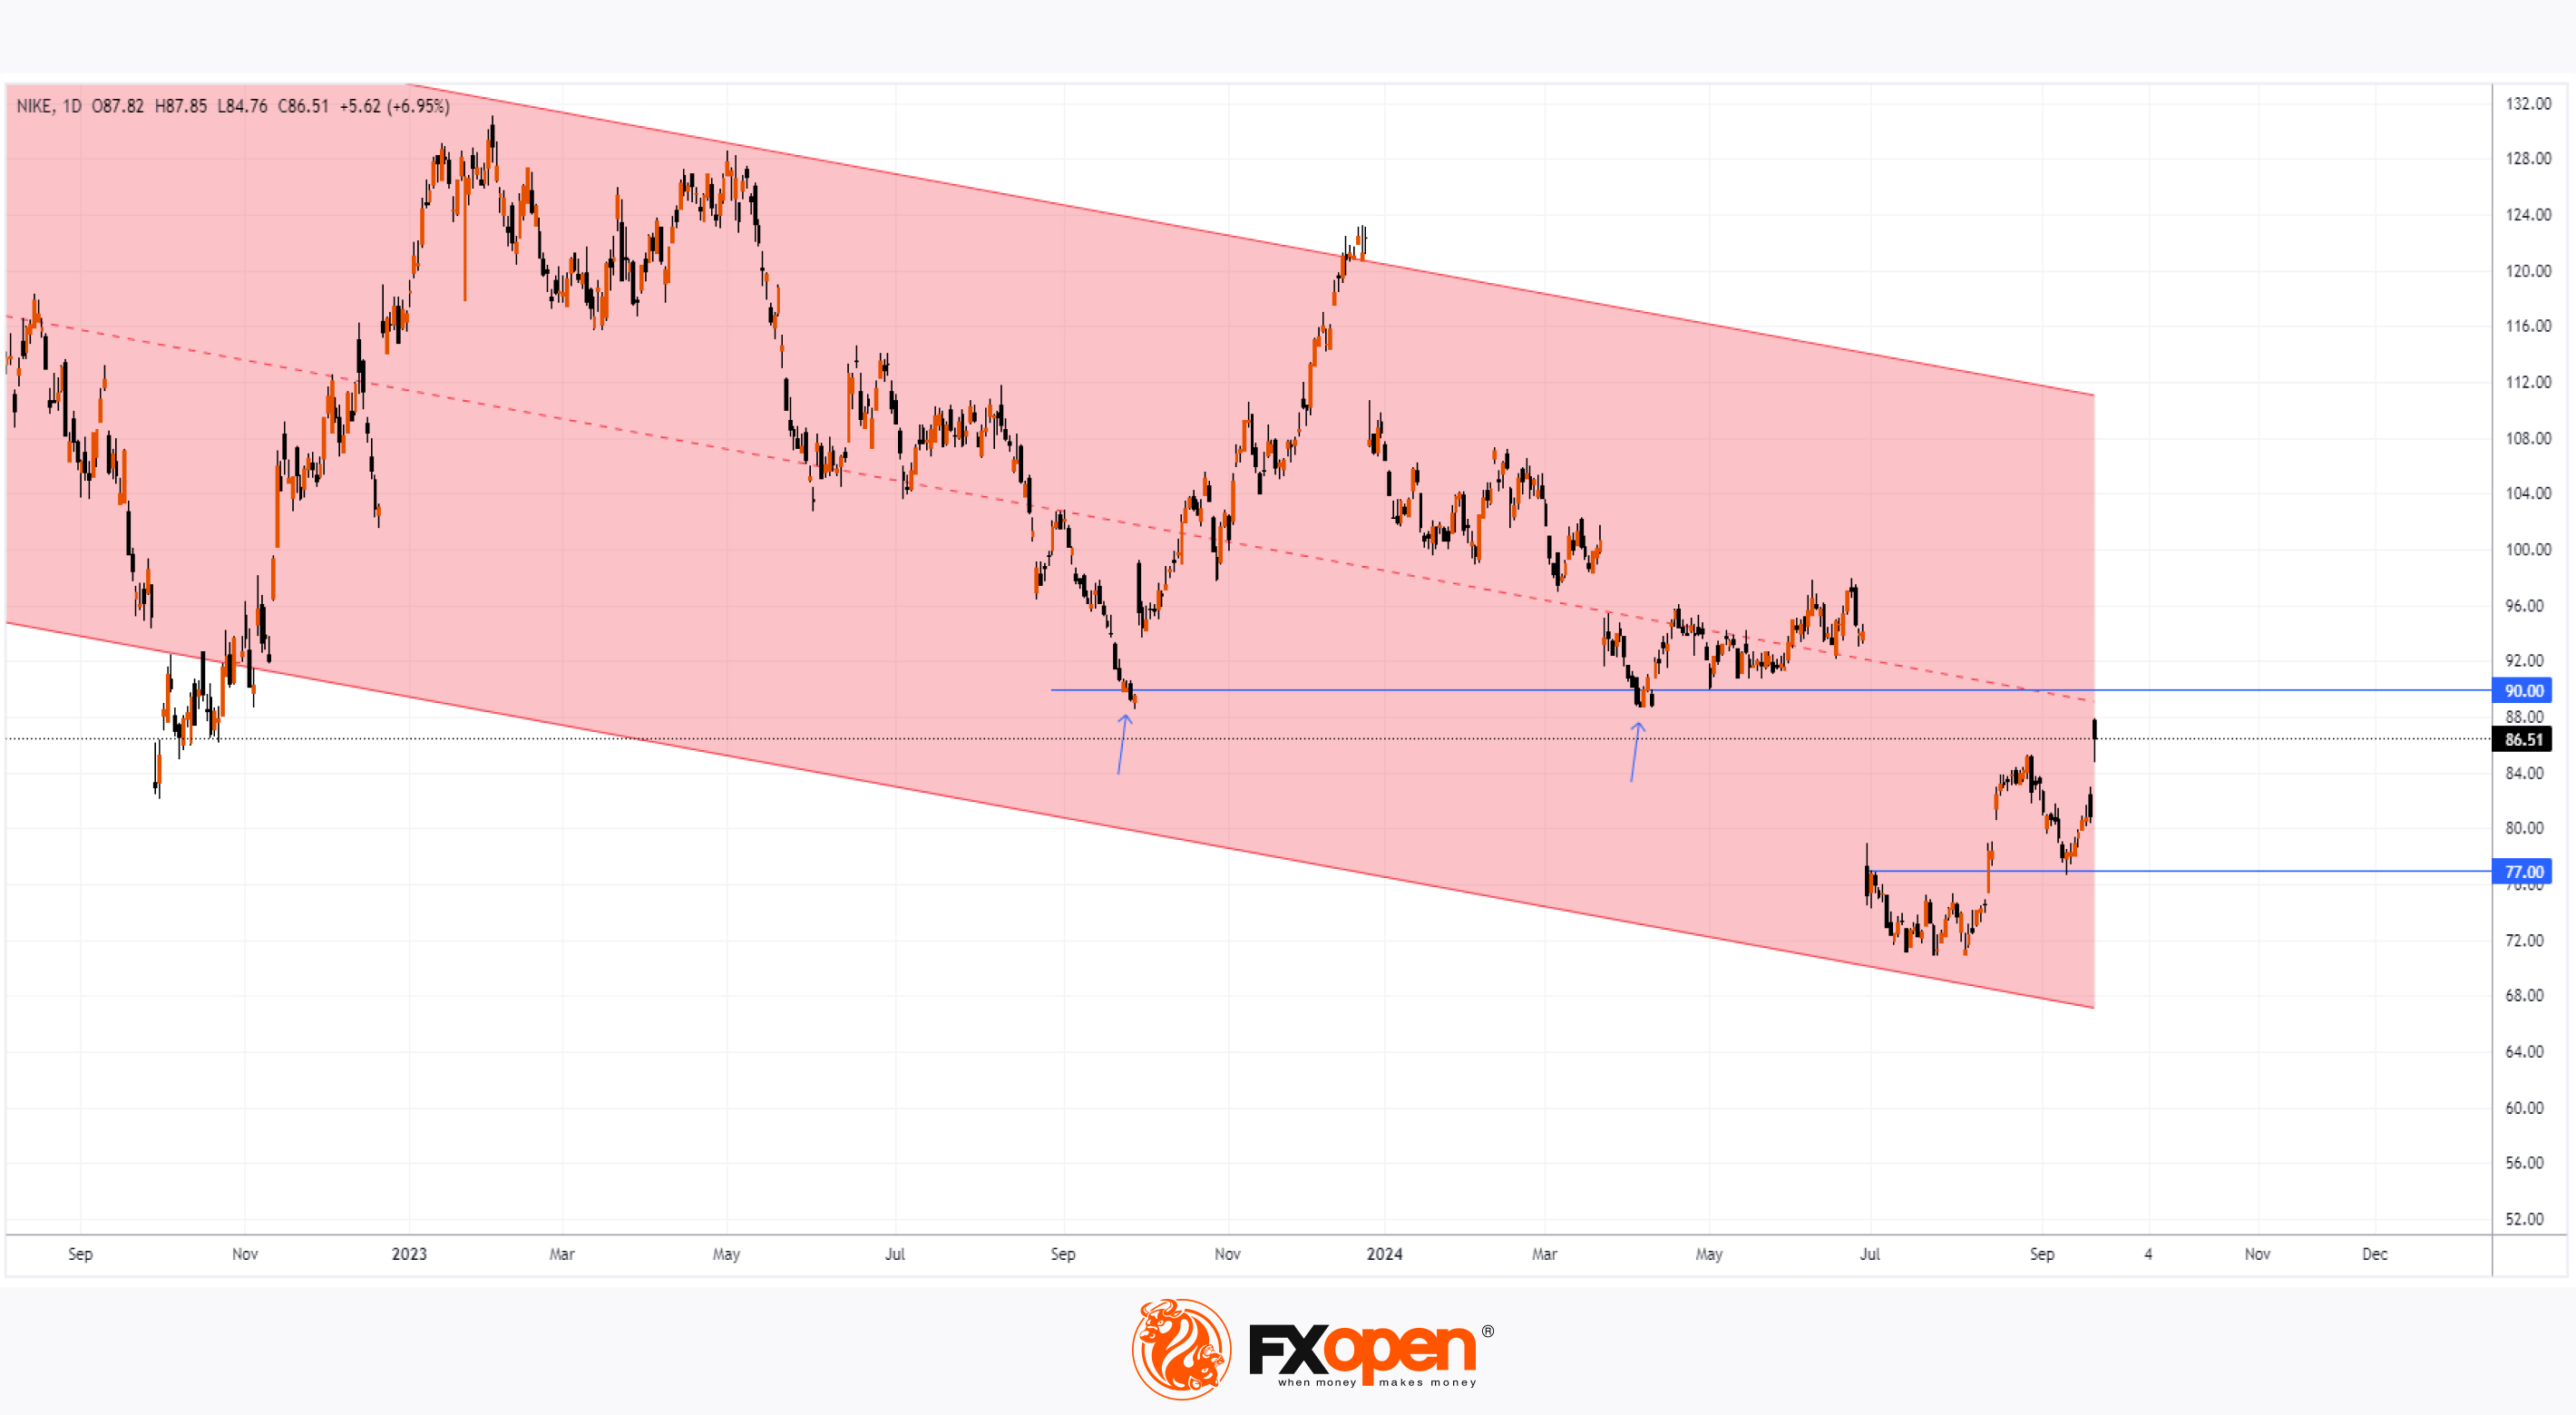
Technical analysis of Nike (NKE) shares today suggests that the bullish momentum may fade due to a cluster of potential resistance lines, including:
→ the psychological level of $90, which previously acted as support (as indicated by the arrows);
→ the median line of the red channel, constructed using the linear regression method;
→ the upper boundary of the bearish gap formed on 28 June.
On the other hand, the bulls have their argument: the $77.00 level provided support during the test on 11 September. The significance of this level lies in the fact that it originates from the 28 June candlestick, when, according to NASDAQ data, an abnormally high volume of 130 million shares was traded. It’s possible that professional traders were the buyers, believing the share price of the well-known brand had become attractive.
Trade global index CFDs with zero commission and tight spreads. Open your FXOpen account now or learn more about trading index CFDs with FXOpen.
CFDs are complex instruments and come with a high risk of losing your money.
This article represents the opinion of the Companies operating under the FXOpen brand only. It is not to be construed as an offer, solicitation, or recommendation with respect to products and services provided by the Companies operating under the FXOpen brand, nor is it to be considered financial advice.
The Price of Nike (NKE) Shares Surged by More Than 6%
Investors in Nike (NKE) can hardly call 2024 a successful year:
→ while the S&P 500 index (US SPX 500 mini on FXOpen) has risen by over 20% since the beginning of the year and is hovering near historic highs,
→ the price of NKE shares has dropped by about 20% in 2024 and is now more than twice as low as its all-time high reached in 2021.
Nike’s shares have been in a downward trend for several months, driven by increasing competition, as confirmed by the latest quarterly report, which showed that sales remained flat, and the company forecasts a potential 10% decline in quarterly sales.
As CNN reports, many investors had been calling for changes at Nike. Thus, they welcomed the news of a leadership change – it was announced last week that the current CEO, John Donahoe, will retire next month and will be replaced by former Nike executive Elliott Hill – which led to a rise in the company’s shares by over 6% in a single day.
Technical analysis of Nike (NKE) shares today suggests that the bullish momentum may fade due to a cluster of potential resistance lines, including:
→ the psychological level of $90, which previously acted as support (as indicated by the arrows);
→ the median line of the red channel, constructed using the linear regression method;
→ the upper boundary of the bearish gap formed on 28 June.
On the other hand, the bulls have their argument: the $77.00 level provided support during the test on 11 September. The significance of this level lies in the fact that it originates from the 28 June candlestick, when, according to NASDAQ data, an abnormally high volume of 130 million shares was traded. It’s possible that professional traders were the buyers, believing the share price of the well-known brand had become attractive.
Trade global index CFDs with zero commission and tight spreads. Open your FXOpen account now or learn more about trading index CFDs with FXOpen.
CFDs are complex instruments and come with a high risk of losing your money.
This article represents the opinion of the Companies operating under the FXOpen brand only. It is not to be construed as an offer, solicitation, or recommendation with respect to products and services provided by the Companies operating under the FXOpen brand, nor is it to be considered financial advice.
👍2
#EURGBP #marketanalysis #MarketNews #forextrading
EUR/GBP Exchange Rate Hits 29-Month Low
According to today’s daily chart of EUR/GBP:
→ The rate is around £0.832 per euro – the lowest since April 2022.
→ The RSI indicator has dropped into oversold territory.
Yesterday, the EUR/GBP rate fell by 0.71%, driven by bearish sentiment following the release of PMI indices, which indicated a slowdown in the Eurozone economy.
According to Forex Factory:
French Flash Manufacturing PMI:
Actual = 44.0, Expected = 44.3, Previous = 43.9
French Flash Services PMI:
Actual = 48.3, Expected = 53.0, Previous = 55.0
German Flash Manufacturing PMI:
Actual = 40.3, Expected = 42.4, Previous = 42.4
German Flash Services PMI:
Actual = 50.6, Expected = 51.1, Previous = 51.2
Meanwhile, PMI indices for the UK remain above 50, signalling economic growth.
Flash Manufacturing PMI:
Actual = 51.5, Expected = 52.3, Previous = 52.5
Flash Services PMI:
Actual = 52.8, Expected = 53.5, Previous = 53.7
Technical analysis of the EUR/GBP chart today shows the price moving within a descending channel (marked in red).
In September, the price bounced off the £0.840 level, which had acted as support since June. The price movement formed an arc (shown by an arrow), suggesting that:
Demand is weakening.
The median line of the red channel is acting as resistance.
If bears maintain control of the market, the EUR/GBP rate could fall towards the lower boundary of the red channel.
However, if bulls attempt to recover, the price may face strong resistance at the £0.840 level.
Trade over 50 forex markets 24 hours a day with FXOpen. Take advantage of low commissions, deep liquidity, and spreads from 0.0 pips. Open your FXOpen account now or learn more about trading forex with FXOpen.
CFDs are complex instruments and come with a high risk of losing your money.
This article represents the opinion of the Companies operating under the FXOpen brand only. It is not to be construed as an offer, solicitation, or recommendation with respect to products and services provided by the Companies operating under the FXOpen brand, nor is it to be considered financial advice.
EUR/GBP Exchange Rate Hits 29-Month Low
According to today’s daily chart of EUR/GBP:
→ The rate is around £0.832 per euro – the lowest since April 2022.
→ The RSI indicator has dropped into oversold territory.
Yesterday, the EUR/GBP rate fell by 0.71%, driven by bearish sentiment following the release of PMI indices, which indicated a slowdown in the Eurozone economy.
According to Forex Factory:
French Flash Manufacturing PMI:
Actual = 44.0, Expected = 44.3, Previous = 43.9
French Flash Services PMI:
Actual = 48.3, Expected = 53.0, Previous = 55.0
German Flash Manufacturing PMI:
Actual = 40.3, Expected = 42.4, Previous = 42.4
German Flash Services PMI:
Actual = 50.6, Expected = 51.1, Previous = 51.2
Meanwhile, PMI indices for the UK remain above 50, signalling economic growth.
Flash Manufacturing PMI:
Actual = 51.5, Expected = 52.3, Previous = 52.5
Flash Services PMI:
Actual = 52.8, Expected = 53.5, Previous = 53.7
Technical analysis of the EUR/GBP chart today shows the price moving within a descending channel (marked in red).
In September, the price bounced off the £0.840 level, which had acted as support since June. The price movement formed an arc (shown by an arrow), suggesting that:
Demand is weakening.
The median line of the red channel is acting as resistance.
If bears maintain control of the market, the EUR/GBP rate could fall towards the lower boundary of the red channel.
However, if bulls attempt to recover, the price may face strong resistance at the £0.840 level.
Trade over 50 forex markets 24 hours a day with FXOpen. Take advantage of low commissions, deep liquidity, and spreads from 0.0 pips. Open your FXOpen account now or learn more about trading forex with FXOpen.
CFDs are complex instruments and come with a high risk of losing your money.
This article represents the opinion of the Companies operating under the FXOpen brand only. It is not to be construed as an offer, solicitation, or recommendation with respect to products and services provided by the Companies operating under the FXOpen brand, nor is it to be considered financial advice.
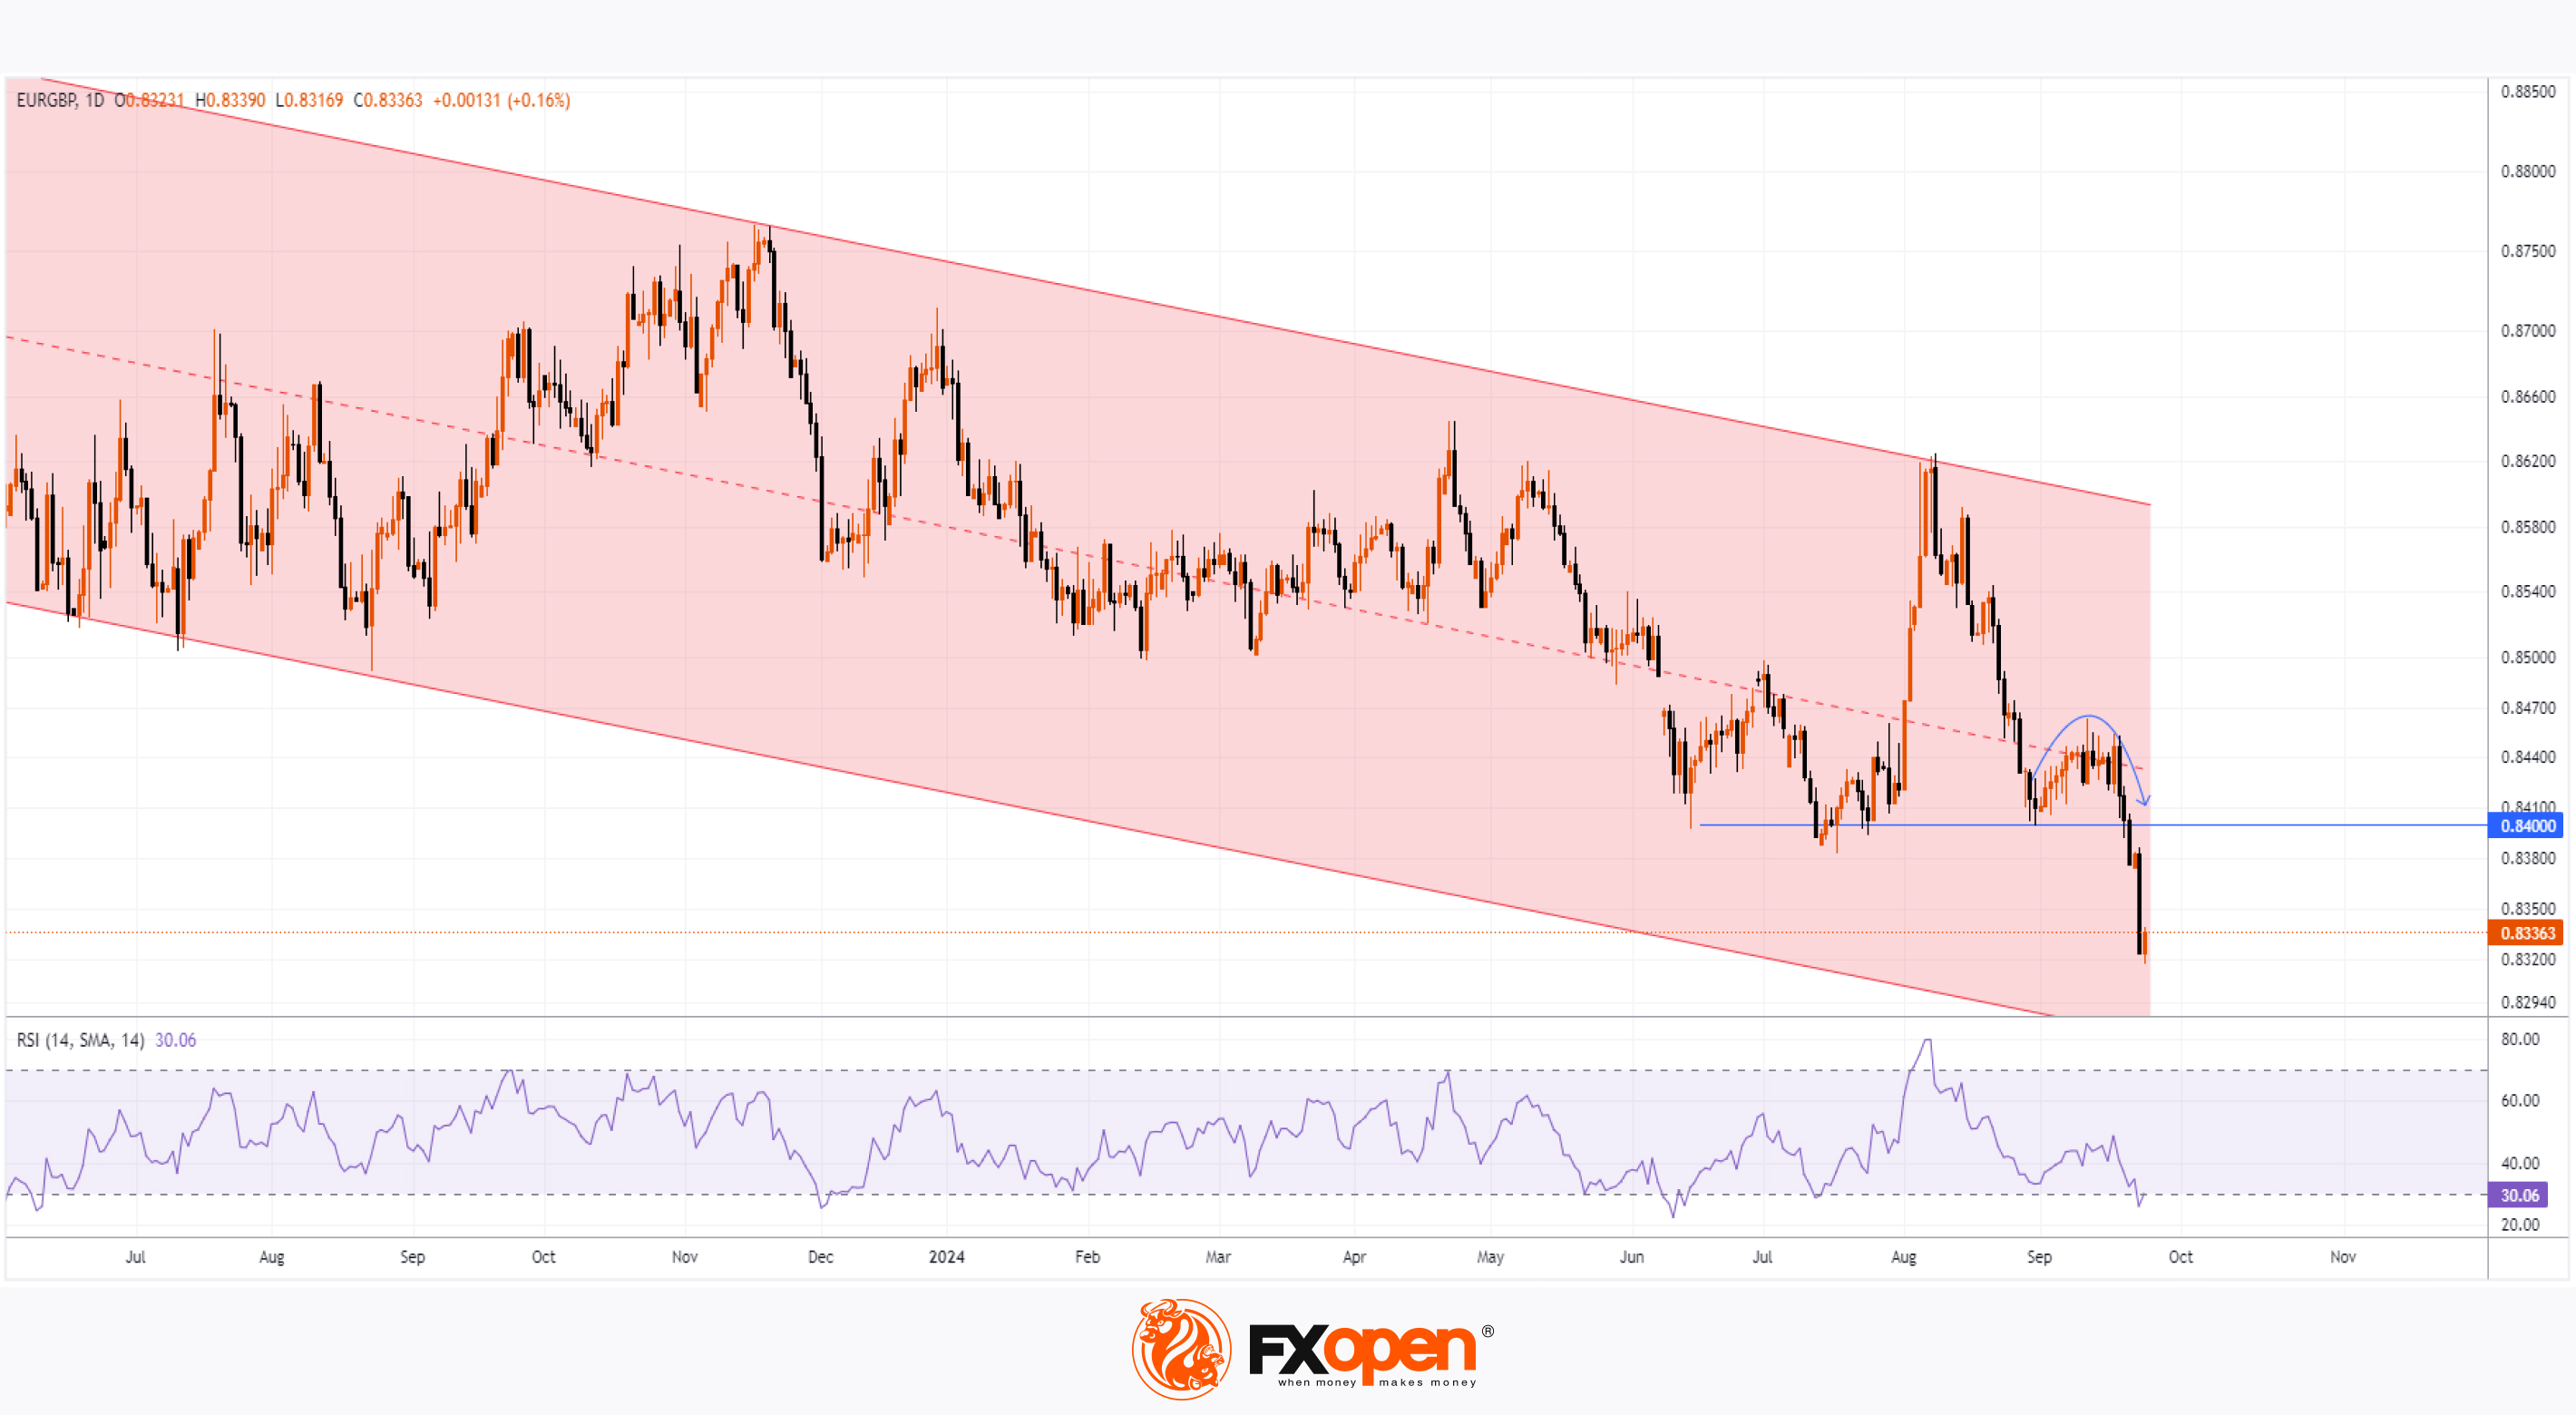
👍2
#goldprice #XAUUSD #marketanalysis #MarketNews
The Price of Gold Continues to Hit Record Highs
As shown by today's XAU/USD chart, the price of an ounce of gold is around $2,628, marking a new all-time high for three consecutive trading days: 20th, 23rd, and 24th September.
The bullish sentiment in the gold market is driven by:
→ the reaction to Wednesday’s decision by the Federal Reserve to cut interest rates by 50 basis points;
→ another surge in tensions in the Middle East.
Technical analysis of the XAU/USD chart shows gold’s price is moving within an upward channel (marked in blue), with the bullish momentum becoming more pronounced in September. Since the beginning of the month, bulls have managed to:
→ break through the resistance level of $2,530;
→ lift the price into the upper half of the blue channel;
→ establish a steeper upward trajectory (shown by yellow lines).
However, it’s worth noting that:
→ each new record high is only slightly above the previous one;
→ the RSI indicator is forming a divergence.
This suggests that the bullish momentum may be weakening. It’s possible that market participants may look to take profits from long positions, leaving the price vulnerable to a pullback, potentially towards the lower boundary of the yellow channel, which is reinforced by the blue median line.
Start trading commodities with tight spreads. Open your trading account now or learn more about trading commodity CFDs with FXOpen.
CFDs are complex instruments and come with a high risk of losing your money.
This article represents the opinion of the Companies operating under the FXOpen brand only. It is not to be construed as an offer, solicitation, or recommendation with respect to products and services provided by the Companies operating under the FXOpen brand, nor is it to be considered financial advice.
The Price of Gold Continues to Hit Record Highs
As shown by today's XAU/USD chart, the price of an ounce of gold is around $2,628, marking a new all-time high for three consecutive trading days: 20th, 23rd, and 24th September.
The bullish sentiment in the gold market is driven by:
→ the reaction to Wednesday’s decision by the Federal Reserve to cut interest rates by 50 basis points;
→ another surge in tensions in the Middle East.
Technical analysis of the XAU/USD chart shows gold’s price is moving within an upward channel (marked in blue), with the bullish momentum becoming more pronounced in September. Since the beginning of the month, bulls have managed to:
→ break through the resistance level of $2,530;
→ lift the price into the upper half of the blue channel;
→ establish a steeper upward trajectory (shown by yellow lines).
However, it’s worth noting that:
→ each new record high is only slightly above the previous one;
→ the RSI indicator is forming a divergence.
This suggests that the bullish momentum may be weakening. It’s possible that market participants may look to take profits from long positions, leaving the price vulnerable to a pullback, potentially towards the lower boundary of the yellow channel, which is reinforced by the blue median line.
Start trading commodities with tight spreads. Open your trading account now or learn more about trading commodity CFDs with FXOpen.
CFDs are complex instruments and come with a high risk of losing your money.
This article represents the opinion of the Companies operating under the FXOpen brand only. It is not to be construed as an offer, solicitation, or recommendation with respect to products and services provided by the Companies operating under the FXOpen brand, nor is it to be considered financial advice.
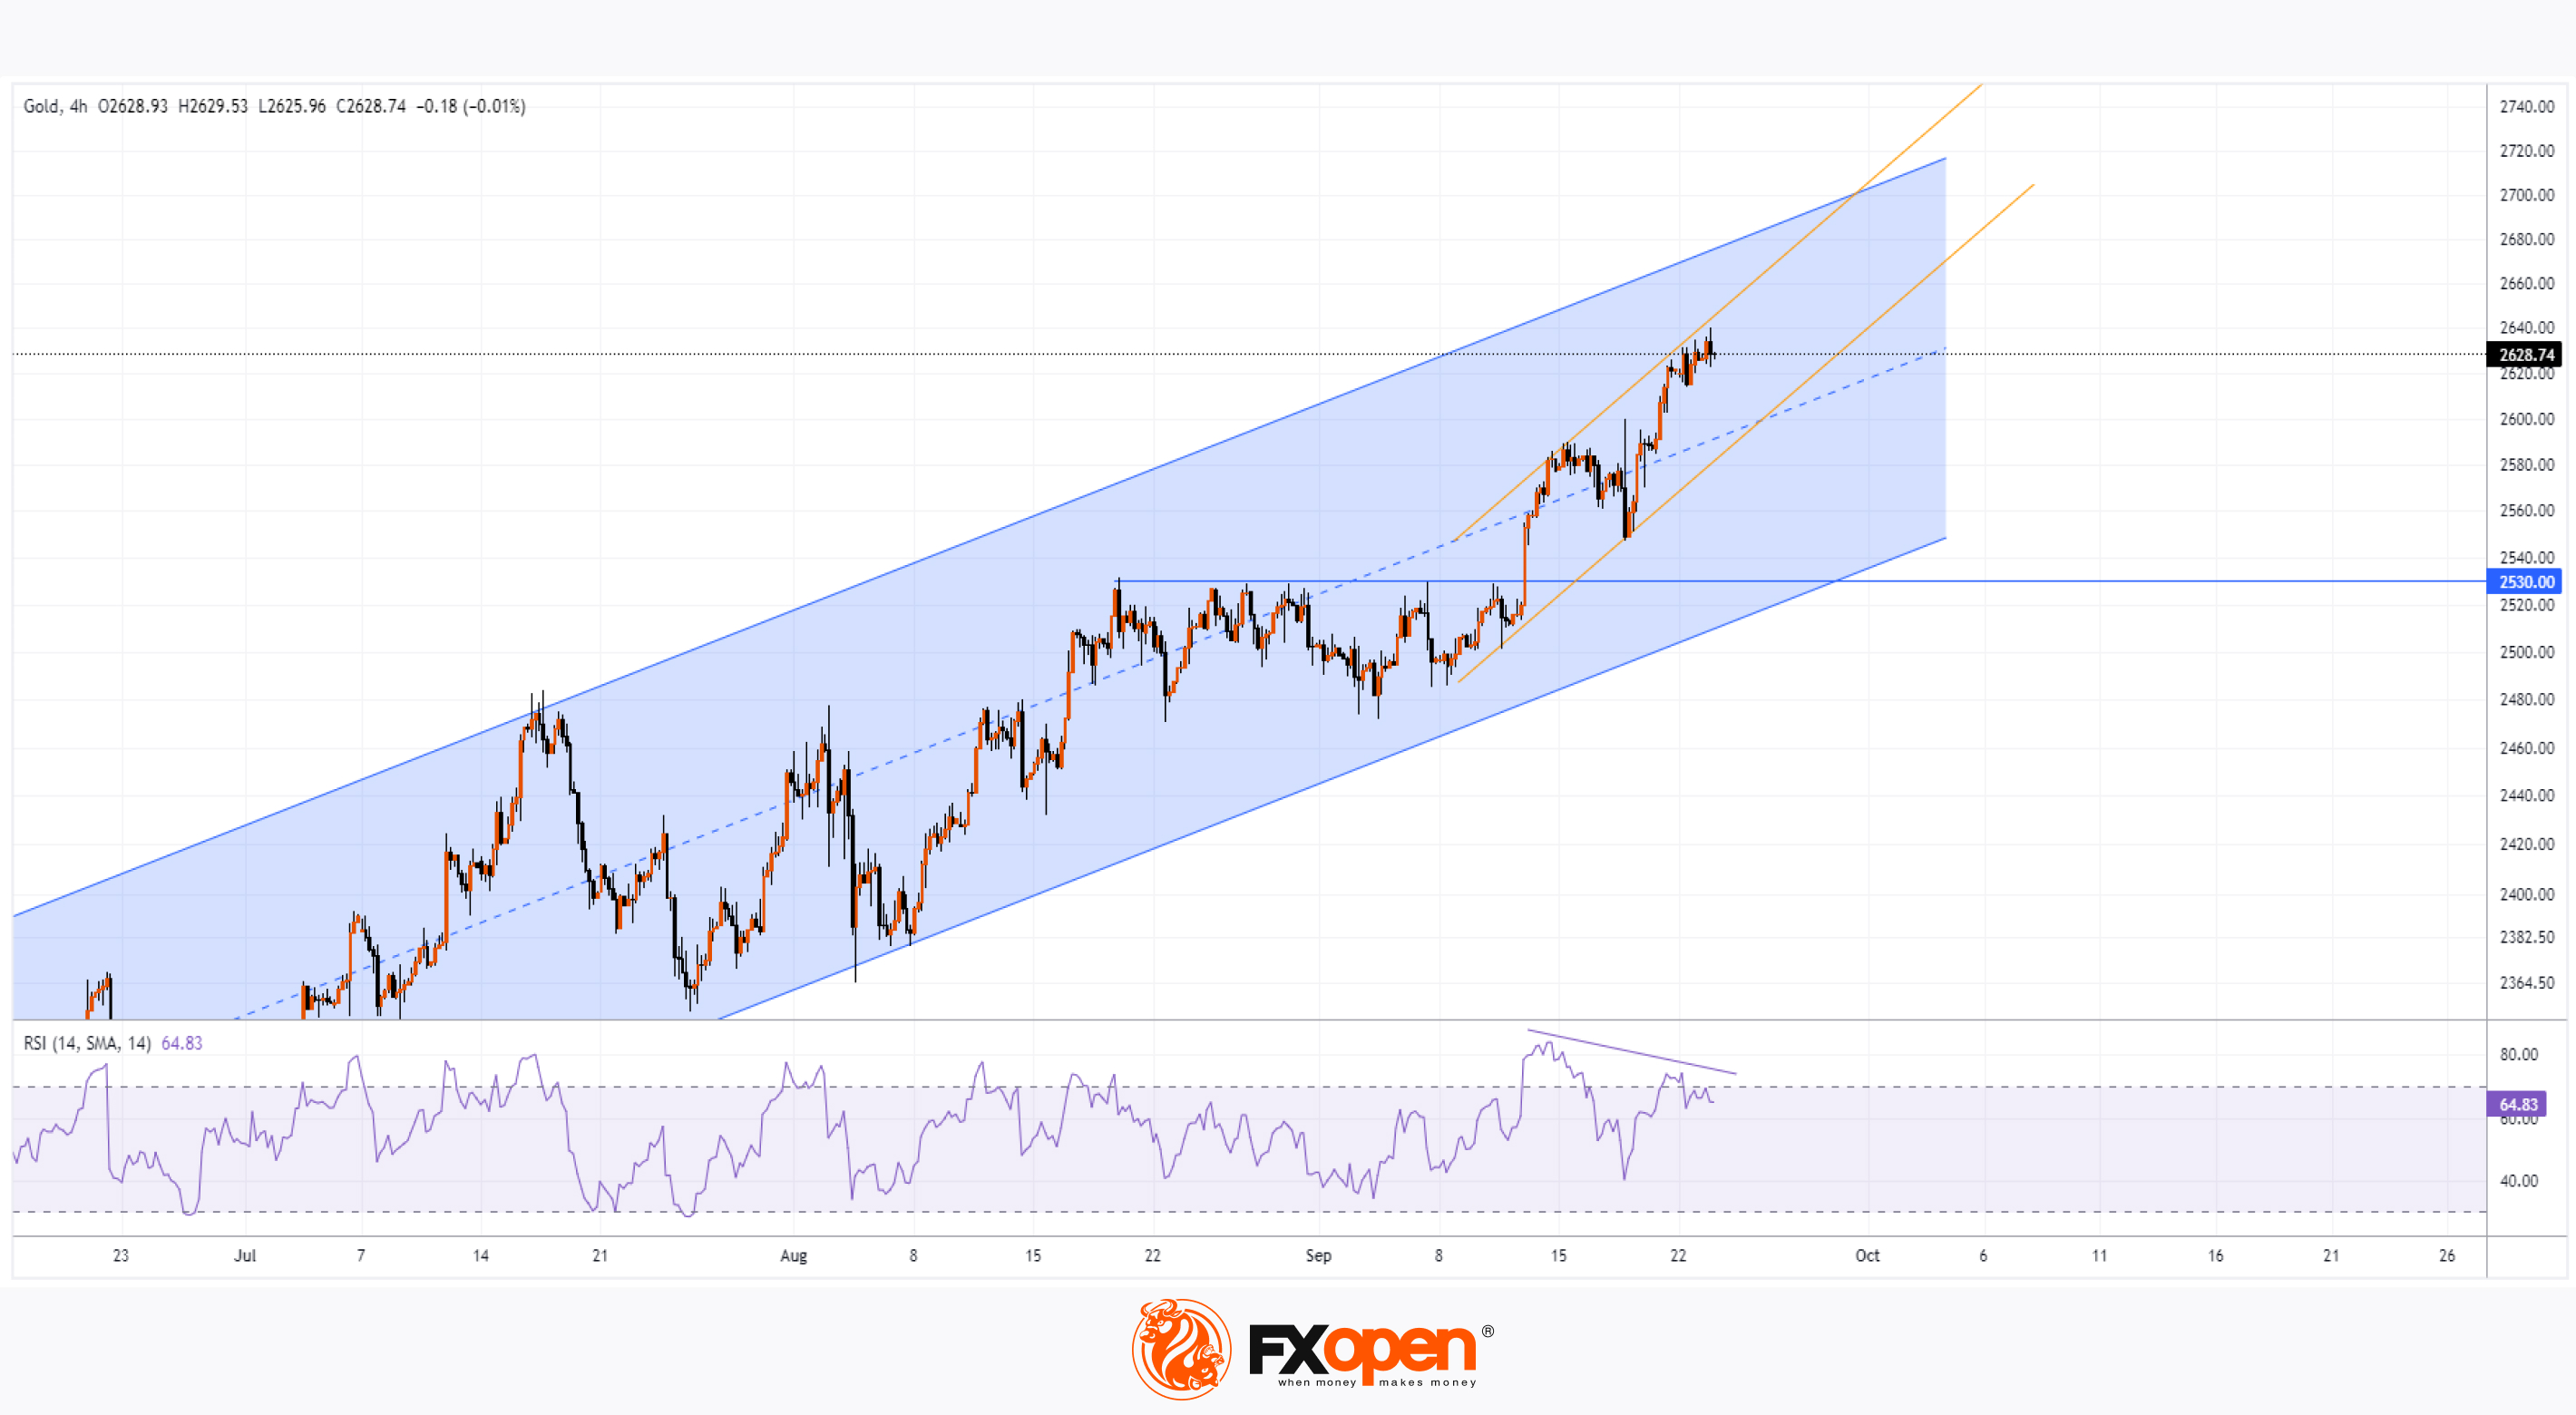
👍2