
#MarketNews #NFLX
NFLX ANALYSIS: NETFLIX ENDING BULL SEASON?
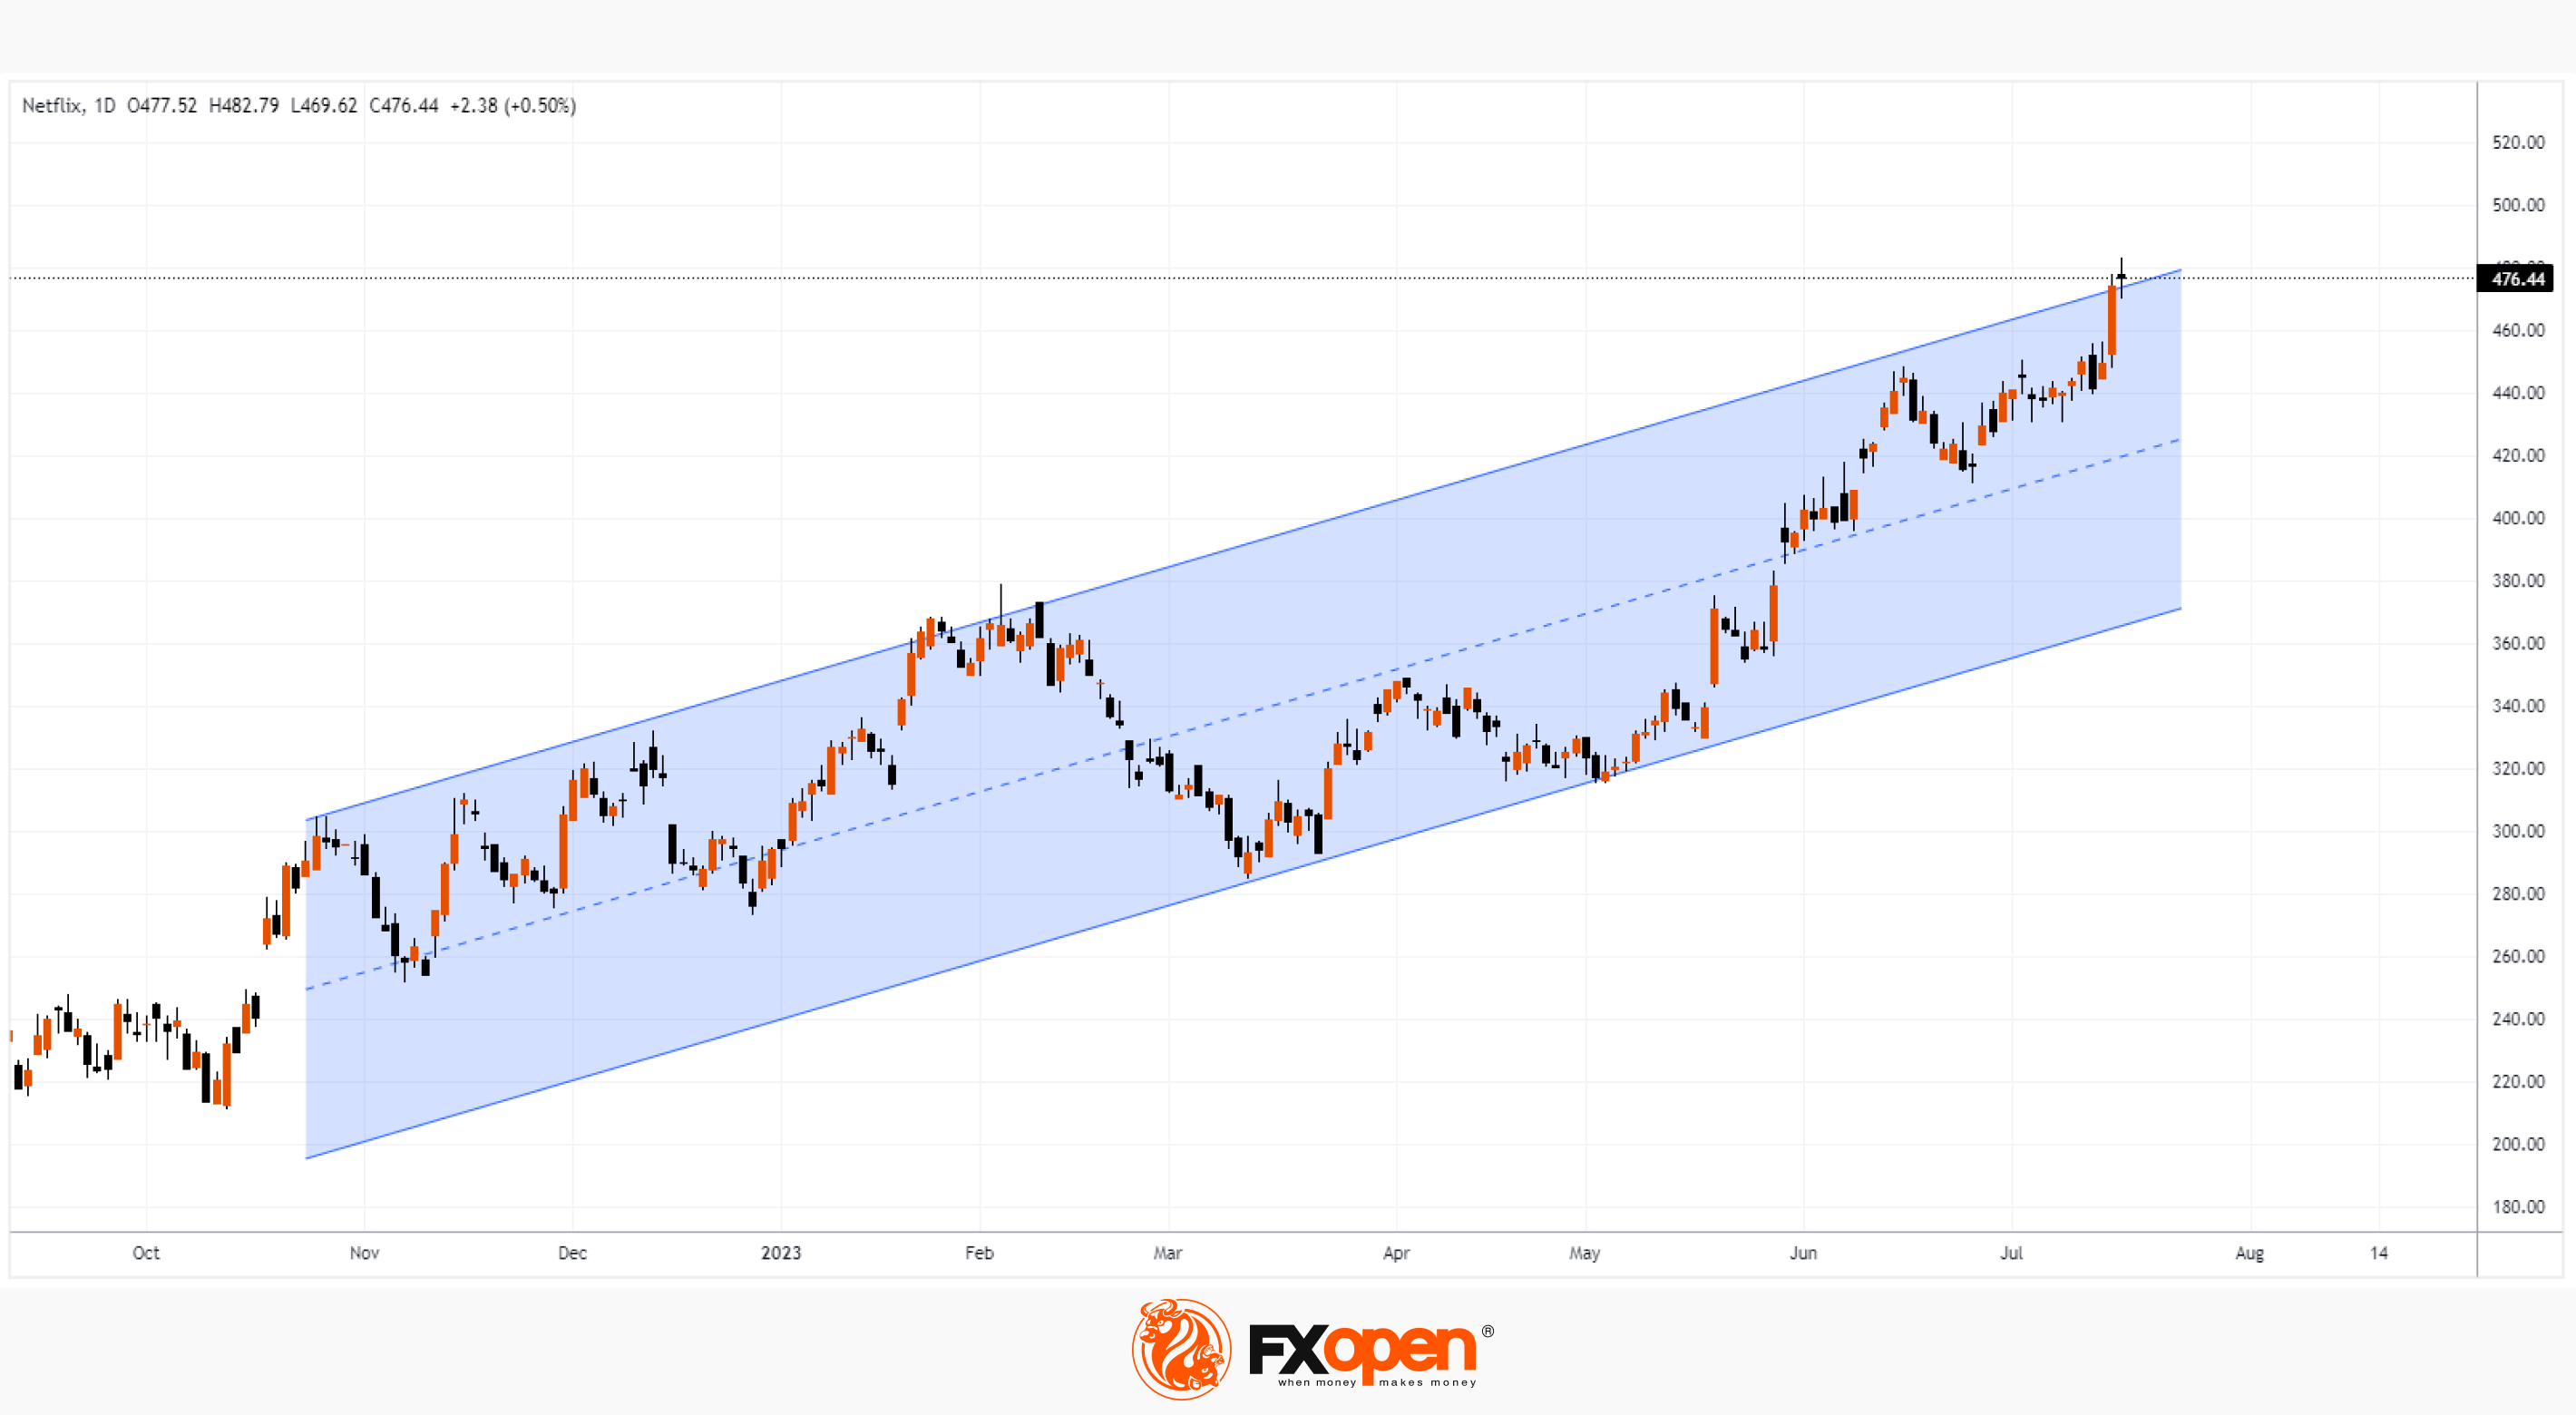
In mid-October 2022, the NFLX share price was about $250; in those days we wrote the post “Is Netflix starting a new bull season?”. Since then, the NFLX stock has more than doubled in price. But after the publication of yesterday's news, everything has changed, hence the headline.
The company added nearly 6 million subscribers in the quarter, with a forecast of 1.9 million. As of the end of June, Netflix had 238.4 million subscribers worldwide. This is positive news.
Some negative news: the decline in revenue. While 8.3bn was expected, the actual number is 8.1bn. “While we have made steady progress this year, we still have a lot of work to do to accelerate our growth again,” the company said in a quarterly letter to shareholders.
However, the most serious argument lies in the behavior of the price on the NFLX chart.
On the eve of the earnings report, we witnessed an increase in the price on rumors of an increase in subscribers. The price of NFLX was close to USD 500, but fell almost 9% post-market after the news. So today the trading session is likely to open below USD 440 per share. This abrupt change in market behavior provides an argument to suggest that the months-long rally has reached a culminating phase. A surge in volatility will help large stockholders take profits — perhaps they see Netflix's difficulties with the strike of actors and authors, increased competition, restrictions on the prospects for further growth.
The median line of the rising channel is now seen as the nearest support, the breakdown of which will confirm the change in market sentiment.
To benefit from the rise and fall of the price of NFLX, as well as shares of other companies, consider enlisting the services of a reliable broker like FXOpen.
⚠️
CFDs are complex instruments and come with a high risk of losing your money.
This article represents the opinion of the Companies operating under the FXOpen brand only. It is not to be construed as an offer, solicitation, or recommendation with respect to products and services provided by the Companies operating under the FXOpen brand, nor is it to be considered financial advice.
NFLX ANALYSIS: NETFLIX ENDING BULL SEASON?
In mid-October 2022, the NFLX share price was about $250; in those days we wrote the post “Is Netflix starting a new bull season?”. Since then, the NFLX stock has more than doubled in price. But after the publication of yesterday's news, everything has changed, hence the headline.
The company added nearly 6 million subscribers in the quarter, with a forecast of 1.9 million. As of the end of June, Netflix had 238.4 million subscribers worldwide. This is positive news.
Some negative news: the decline in revenue. While 8.3bn was expected, the actual number is 8.1bn. “While we have made steady progress this year, we still have a lot of work to do to accelerate our growth again,” the company said in a quarterly letter to shareholders.
However, the most serious argument lies in the behavior of the price on the NFLX chart.
On the eve of the earnings report, we witnessed an increase in the price on rumors of an increase in subscribers. The price of NFLX was close to USD 500, but fell almost 9% post-market after the news. So today the trading session is likely to open below USD 440 per share. This abrupt change in market behavior provides an argument to suggest that the months-long rally has reached a culminating phase. A surge in volatility will help large stockholders take profits — perhaps they see Netflix's difficulties with the strike of actors and authors, increased competition, restrictions on the prospects for further growth.
The median line of the rising channel is now seen as the nearest support, the breakdown of which will confirm the change in market sentiment.
To benefit from the rise and fall of the price of NFLX, as well as shares of other companies, consider enlisting the services of a reliable broker like FXOpen.
⚠️
CFDs are complex instruments and come with a high risk of losing your money.
This article represents the opinion of the Companies operating under the FXOpen brand only. It is not to be construed as an offer, solicitation, or recommendation with respect to products and services provided by the Companies operating under the FXOpen brand, nor is it to be considered financial advice.
#MarketNews #US30
MARKET ANALYSIS: US30 DOW JONES INDEX RISES FOR 9 SESSIONS IN A ROW
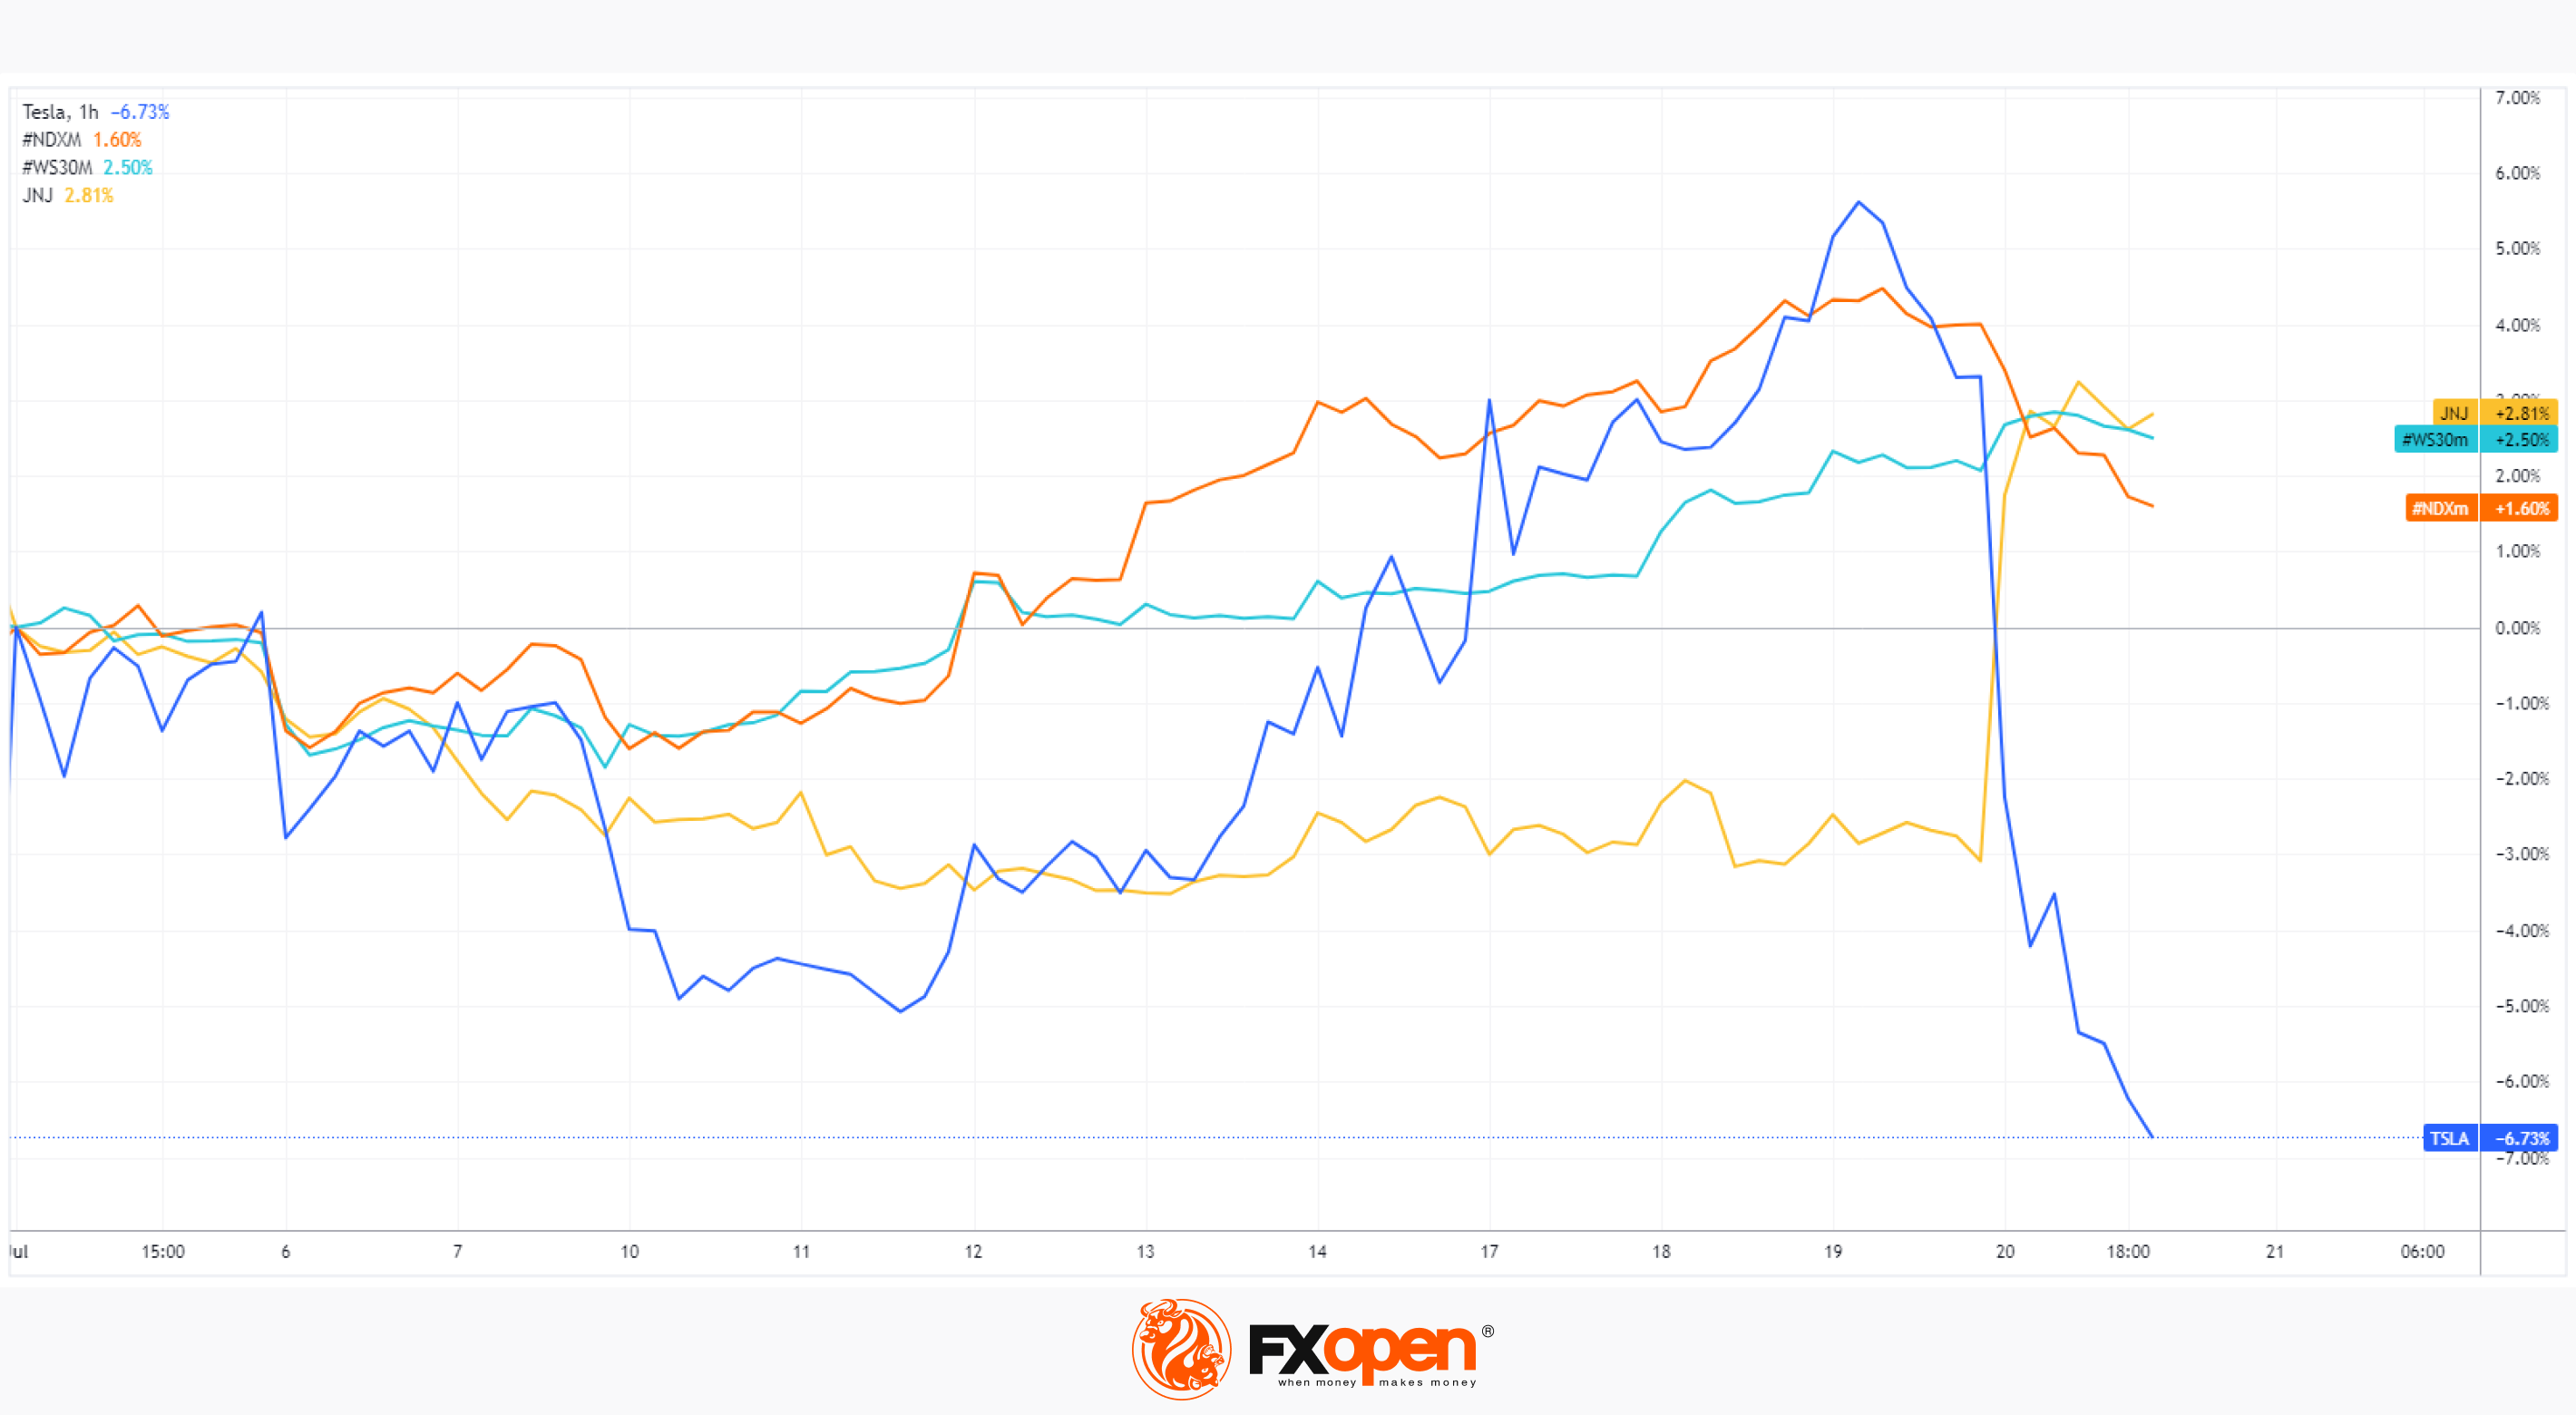
This is the most successful series in almost 6 years. Shares of JNJ helped demonstrate it to the US30 index, which rose by 6% after a strong report — J&J's profit and revenue turned out to be higher than expected. Sales worldwide grew by 6.3% in annual terms.
Unusually for 2023, the Dow Jones US30 is now acting stronger than the Nasdaq 100 technology stock index.
E-mini Nasdaq 100 futures are down almost 3% from a week high, driven by weak Netflix reports (reported yesterday) and a sharp drop in TSLA stock price (-9.7% per session) after a disappointing report. Investors are worried about Tesla's lower margins due to lower model prices, as well as a projected third-quarter production slowdown due to factory upgrades. At the same time, Musk remains optimistic and calls for looking at the bigger picture; in his opinion, the key to future profits will be fully autonomous driving.
The weakening of the Nasdaq 100 amid the bullish behavior of the Dow Jones US30 index suggests that a correction has begun in technology stocks, which is overdue due to the AI-related boom. How true this assumption is, it will be more clear after the reports of Microsoft (July 25), Apple (August 3), Google (July 25).
To benefit from fluctuations in the values of the US30, Nasdaq 100 indices, as well as stock prices of JNJ, TSLA and other popular companies, consider enlisting the services of a reliable broker like FXOpen.
⚠️
CFDs are complex instruments and come with a high risk of losing your money.
This article represents the opinion of the Companies operating under the FXOpen brand only. It is not to be construed as an offer, solicitation, or recommendation with respect to products and services provided by the Companies operating under the FXOpen brand, nor is it to be considered financial advice.
MARKET ANALYSIS: US30 DOW JONES INDEX RISES FOR 9 SESSIONS IN A ROW
This is the most successful series in almost 6 years. Shares of JNJ helped demonstrate it to the US30 index, which rose by 6% after a strong report — J&J's profit and revenue turned out to be higher than expected. Sales worldwide grew by 6.3% in annual terms.
Unusually for 2023, the Dow Jones US30 is now acting stronger than the Nasdaq 100 technology stock index.
E-mini Nasdaq 100 futures are down almost 3% from a week high, driven by weak Netflix reports (reported yesterday) and a sharp drop in TSLA stock price (-9.7% per session) after a disappointing report. Investors are worried about Tesla's lower margins due to lower model prices, as well as a projected third-quarter production slowdown due to factory upgrades. At the same time, Musk remains optimistic and calls for looking at the bigger picture; in his opinion, the key to future profits will be fully autonomous driving.
The weakening of the Nasdaq 100 amid the bullish behavior of the Dow Jones US30 index suggests that a correction has begun in technology stocks, which is overdue due to the AI-related boom. How true this assumption is, it will be more clear after the reports of Microsoft (July 25), Apple (August 3), Google (July 25).
To benefit from fluctuations in the values of the US30, Nasdaq 100 indices, as well as stock prices of JNJ, TSLA and other popular companies, consider enlisting the services of a reliable broker like FXOpen.
⚠️
CFDs are complex instruments and come with a high risk of losing your money.
This article represents the opinion of the Companies operating under the FXOpen brand only. It is not to be construed as an offer, solicitation, or recommendation with respect to products and services provided by the Companies operating under the FXOpen brand, nor is it to be considered financial advice.
👍3
#MarketNews #EUR/USD
EUR/USD PRICE ANALYSIS: UPDATE ON THE MARKET SITUATION
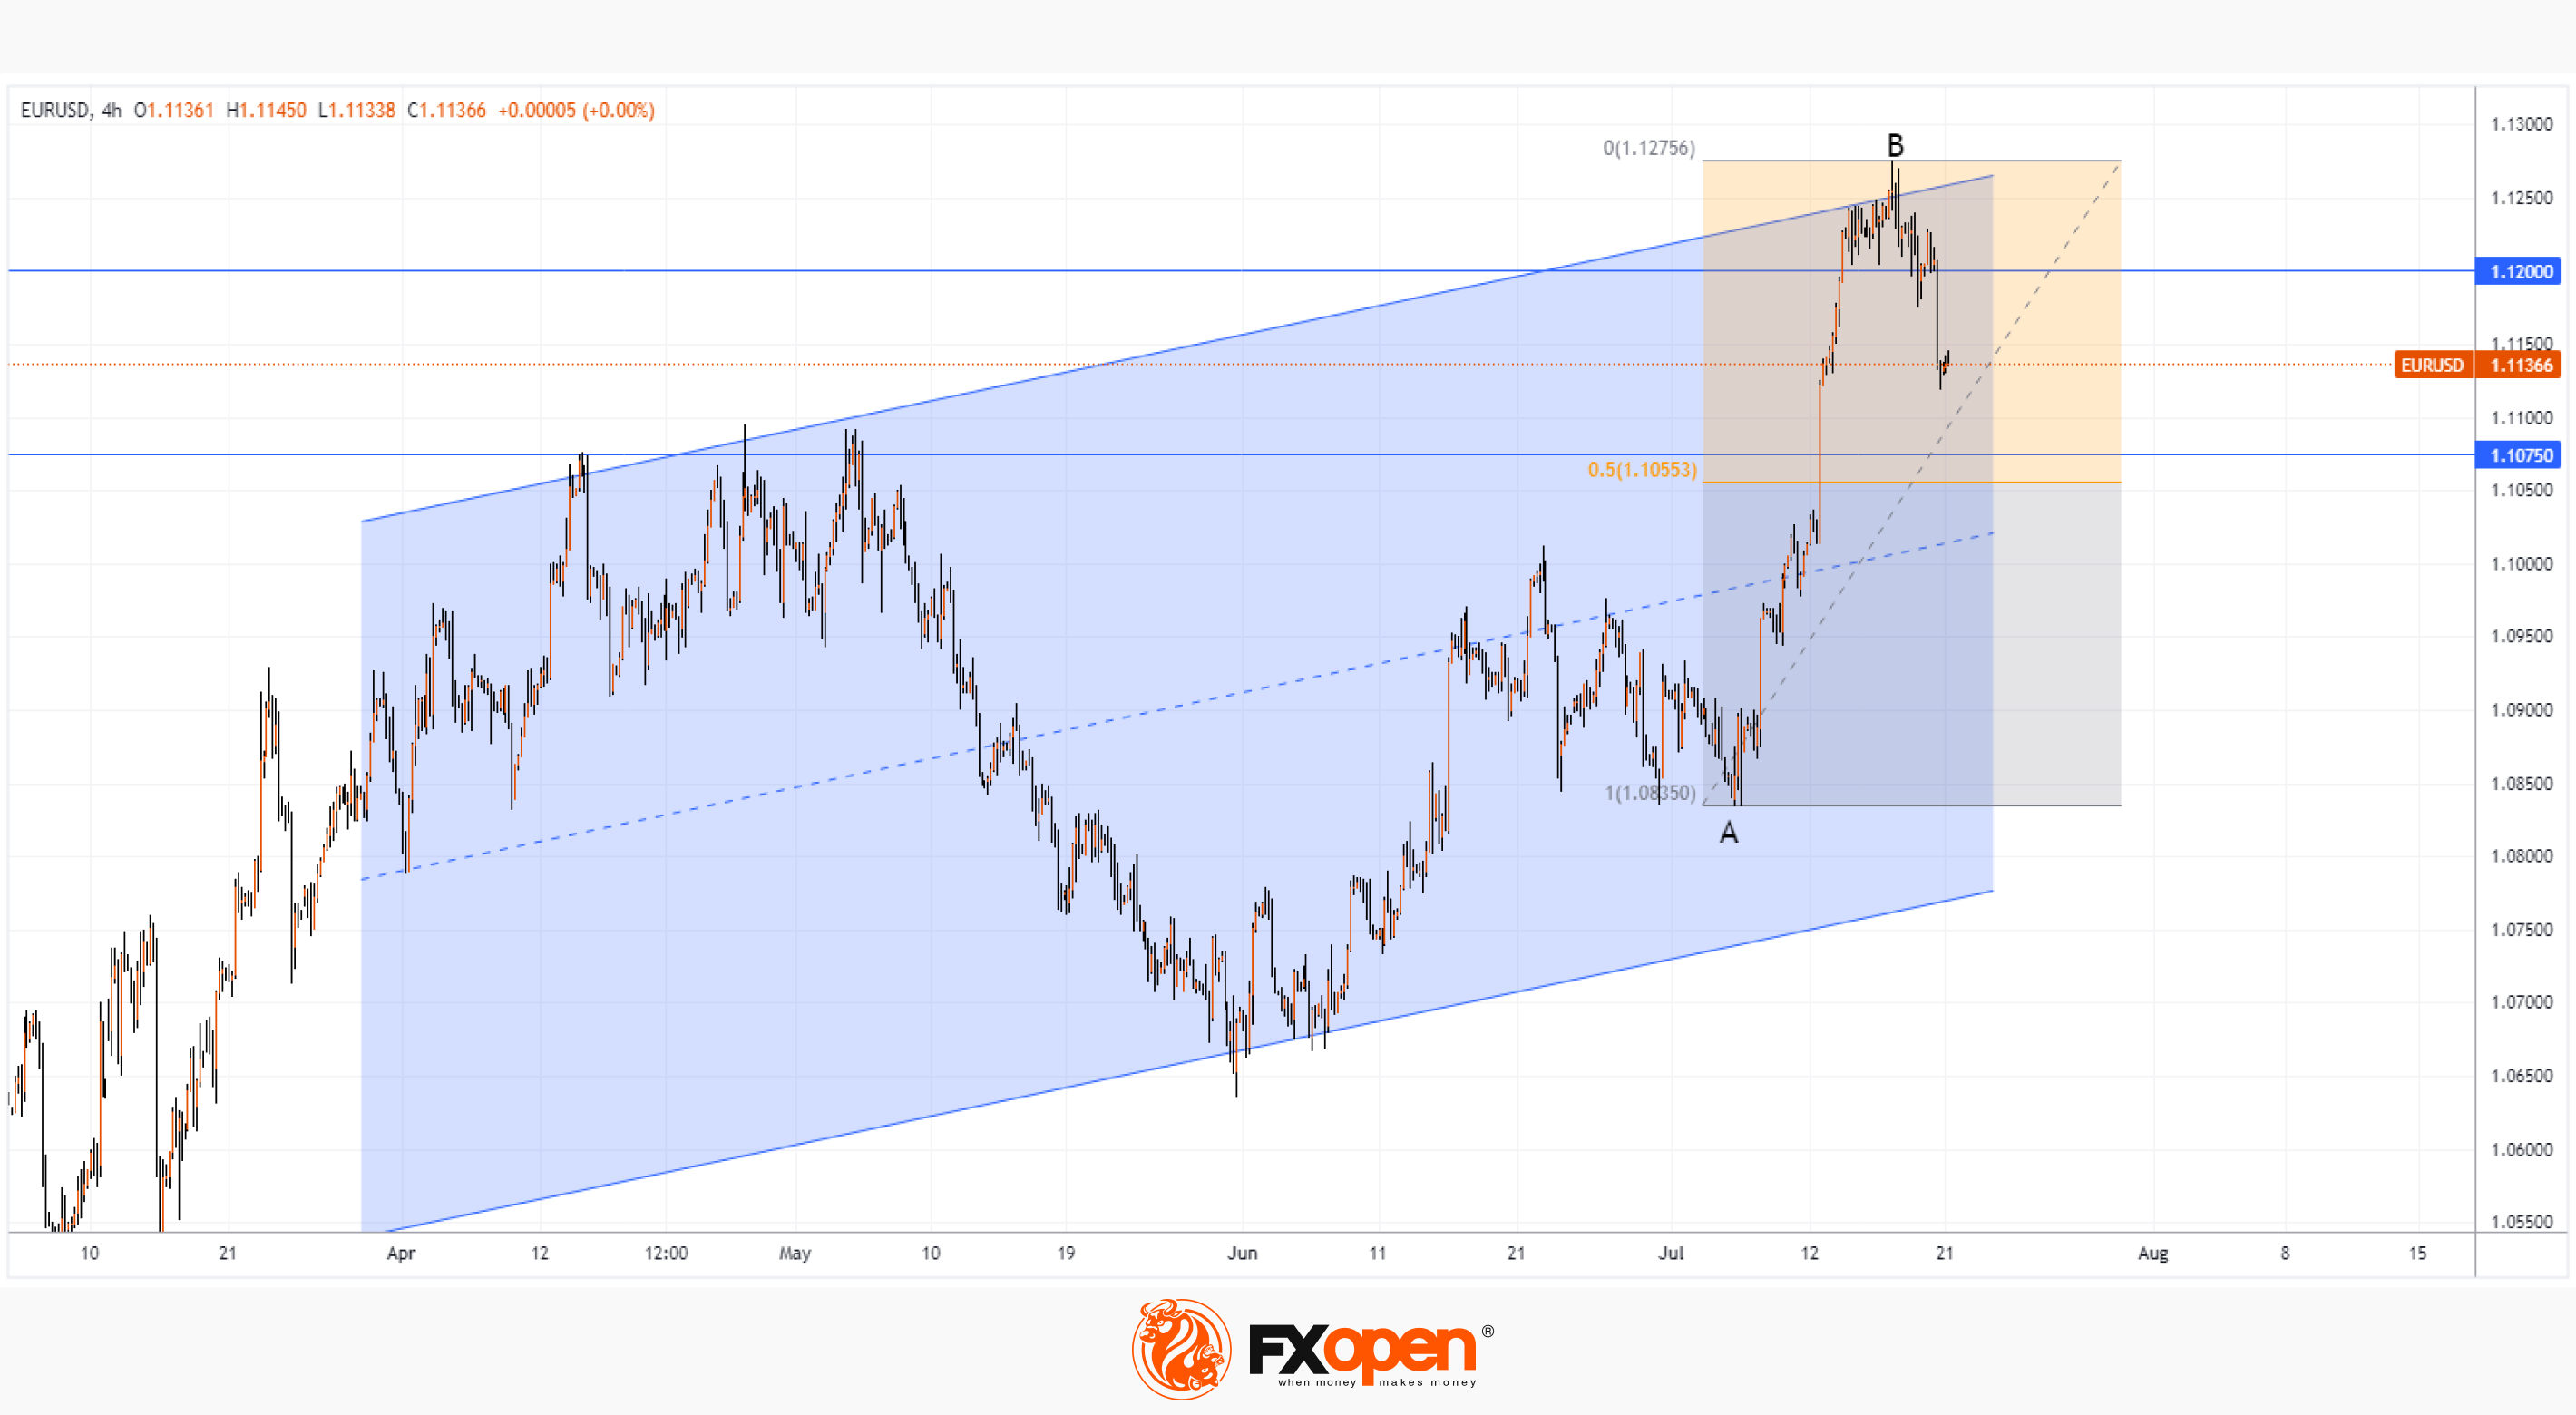
On July 18, we wrote about the vulnerability of the market to a rollback from the block of resistance, which is formed by the level of 1.12 euros per US dollar and the upper line of the rising channel. Since then, the EUR/USD price has fallen by more than 1%.
The most noticeable was yesterday's decline in the price of EUR/USD, which was due, among other things, to the rise in price of the dollar due to a strong report on the US labor market. Weekly data showed that jobless claims fell to a nearly 2-month low.
How deep can the EUR/USD price pull back from the resistance block?
If the decline continues, then, from the point of view of technical analysis, the horizontal level 1.075 can be considered the level at which the bulls can try to change the situation:
→ in April-May this level worked as resistance;
→ approximately, here passes the Fibonacci line 50% of the growth A→B.
The decision of the ECB to raise interest rates by 25 basis points could lead to bullish momentum in the EUR/USD price. The decision will be announced on July 27.
To benefit from price fluctuations in EUR/USD and other currencies, consider enlisting the services of a reliable broker like FXOpen.
⚠️
CFDs are complex instruments and come with a high risk of losing your money.
This article represents the opinion of the Companies operating under the FXOpen brand only. It is not to be construed as an offer, solicitation, or recommendation with respect to products and services provided by the Companies operating under the FXOpen brand, nor is it to be considered financial advice.
EUR/USD PRICE ANALYSIS: UPDATE ON THE MARKET SITUATION
On July 18, we wrote about the vulnerability of the market to a rollback from the block of resistance, which is formed by the level of 1.12 euros per US dollar and the upper line of the rising channel. Since then, the EUR/USD price has fallen by more than 1%.
The most noticeable was yesterday's decline in the price of EUR/USD, which was due, among other things, to the rise in price of the dollar due to a strong report on the US labor market. Weekly data showed that jobless claims fell to a nearly 2-month low.
How deep can the EUR/USD price pull back from the resistance block?
If the decline continues, then, from the point of view of technical analysis, the horizontal level 1.075 can be considered the level at which the bulls can try to change the situation:
→ in April-May this level worked as resistance;
→ approximately, here passes the Fibonacci line 50% of the growth A→B.
The decision of the ECB to raise interest rates by 25 basis points could lead to bullish momentum in the EUR/USD price. The decision will be announced on July 27.
To benefit from price fluctuations in EUR/USD and other currencies, consider enlisting the services of a reliable broker like FXOpen.
⚠️
CFDs are complex instruments and come with a high risk of losing your money.
This article represents the opinion of the Companies operating under the FXOpen brand only. It is not to be construed as an offer, solicitation, or recommendation with respect to products and services provided by the Companies operating under the FXOpen brand, nor is it to be considered financial advice.
Weekly Market Wrap With Gary Thomson: EUR/USD, FTSE 100, CRUDE OIL PRICES, NETFLIX NEWS
Get the latest scoop on the week's hottest headlines, all in one convenient video. Join Gary Thomson, the COO of FXOpen UK, as he breaks down the most significant news reports and shares his expert insights.
🔸EUR/USD price reaches 17-month maximum. Last week, the dollar index posted its worst week of 2023
🔸FTSE 100 bounces back on UK inflation news. The quotes demonstrate the expectations of market participants
🔸Crude Oil prices experience mild volatility as China's economic outlook boosts sentiment
🔸Is Netflix ending bull season? Some positive news, some negative news
https://youtu.be/pj1JJV02BLs
To take advantage of price fluctuations in the foreign exchange markets, consider enlisting the services of a reliable broker like FXOpen.
⚠️
This forecast represents FXOpen Companies opinion only, it should not be construed as an offer, invitation or recommendation in respect to FXOpen Companies products and services or as financial advice
Get the latest scoop on the week's hottest headlines, all in one convenient video. Join Gary Thomson, the COO of FXOpen UK, as he breaks down the most significant news reports and shares his expert insights.
🔸EUR/USD price reaches 17-month maximum. Last week, the dollar index posted its worst week of 2023
🔸FTSE 100 bounces back on UK inflation news. The quotes demonstrate the expectations of market participants
🔸Crude Oil prices experience mild volatility as China's economic outlook boosts sentiment
🔸Is Netflix ending bull season? Some positive news, some negative news
https://youtu.be/pj1JJV02BLs
To take advantage of price fluctuations in the foreign exchange markets, consider enlisting the services of a reliable broker like FXOpen.
⚠️
This forecast represents FXOpen Companies opinion only, it should not be construed as an offer, invitation or recommendation in respect to FXOpen Companies products and services or as financial advice
YouTube
Weekly Market Wrap With Gary Thomson: EUR/USD, FTSE 100, CRUDE OIL PRICES, NETFLIX NEWS
Get the latest scoop on the week's hottest headlines, all in one convenient video. Join Gary Thomson, the COO of FXOpen UK, as he breaks down the most significant news reports and shares his expert insights.
- EUR/USD price reaches 17-month maximum. Last…
- EUR/USD price reaches 17-month maximum. Last…
🔥2👍1
FXOpen official pinned «Weekly Market Wrap With Gary Thomson: EUR/USD, FTSE 100, CRUDE OIL PRICES, NETFLIX NEWS Get the latest scoop on the week's hottest headlines, all in one convenient video. Join Gary Thomson, the COO of FXOpen UK, as he breaks down the most significant news…»
#MarketNews #MSFT
MSFT STOCKS: FUNDAMENTAL VS. TECHNICAL ANALYSIS
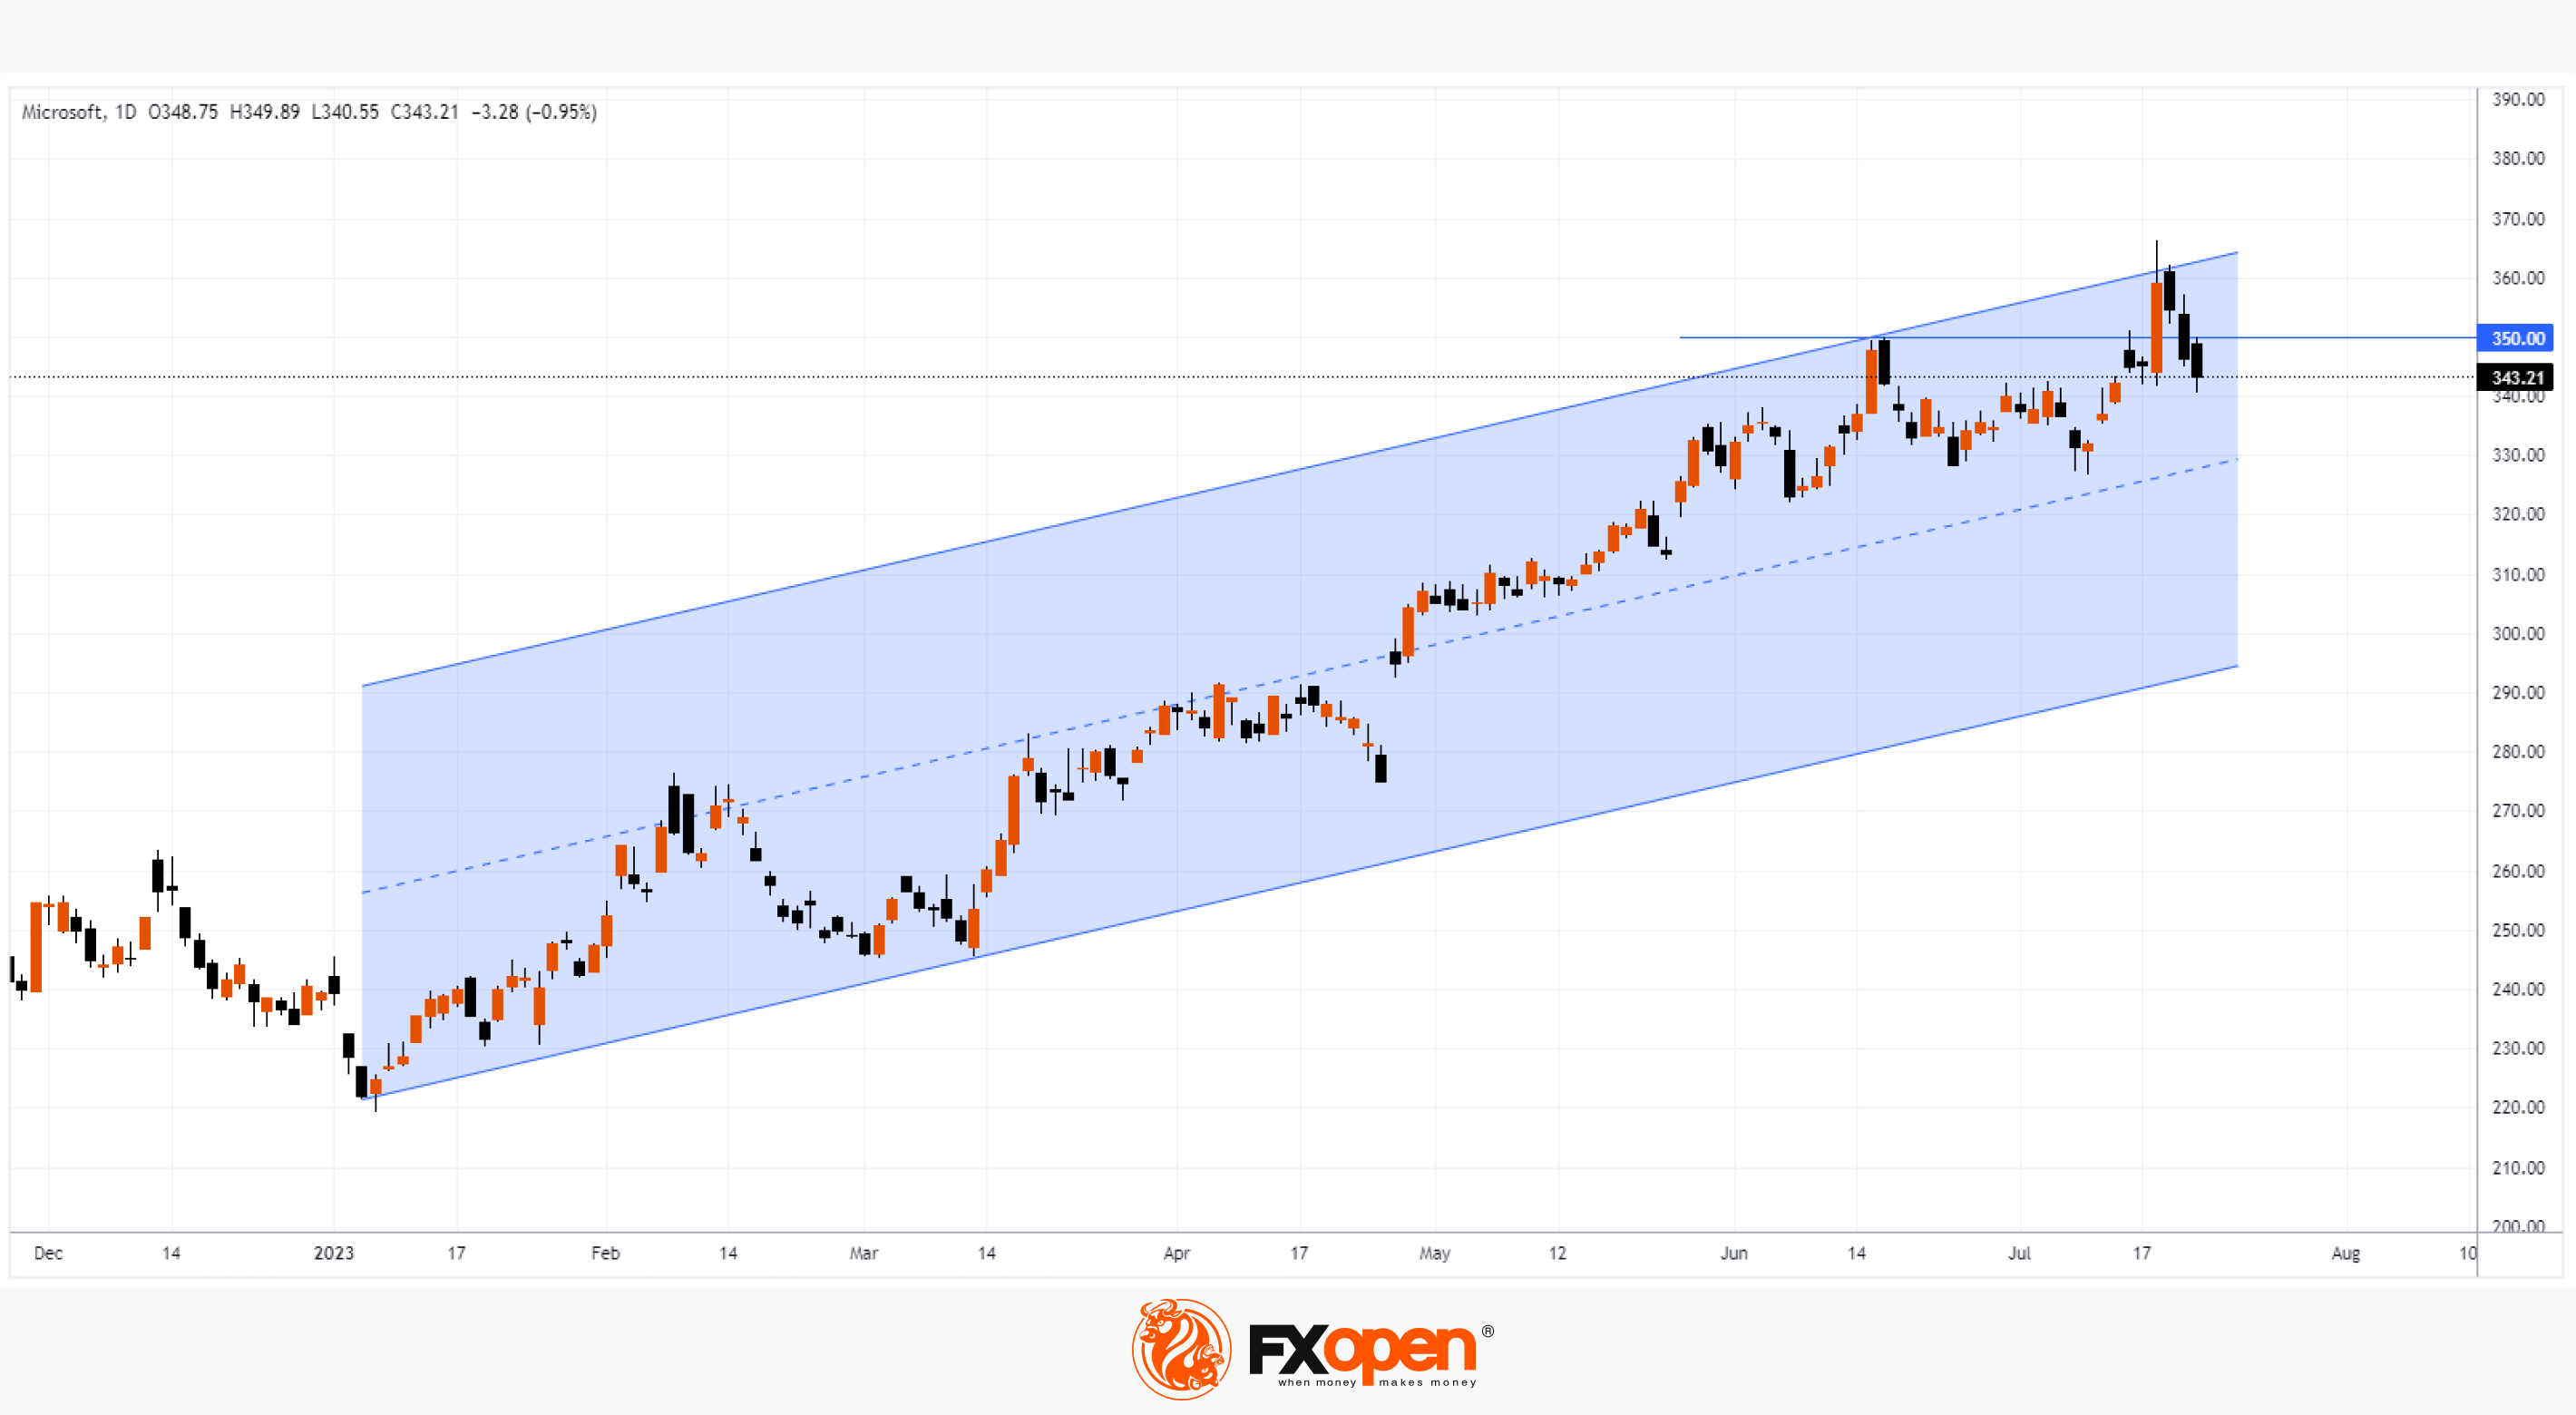
This week 166 companies that make up 33% of the S & P 500 index will publish their reports for the second quarter. Among them, the second largest company in the index, Microsoft. And here, an interesting situation develops: the fundamental background is quite strong, and technical analysis shows signs of weakness. Judge for yourself.
Fundamental analysis:
→ the Android version of the sensational ChatGPT will be released this week;
→ Fundstrat analysts see a target price for MSFT shares of around USD 380 in the short term and USD 426 in the long term;
→ Barclays analysts have rated MSFT stock as a Buy with a target of USD 425 (previous MSFT share price target of USD 425.00) amid Microsoft 365 AI rollout.
However, let's evaluate the MSFT stock chart from the point of view of technical analysis. Note that after a sharp breakdown of the psychological level of USD 350 on July 18, 3 days of rollback followed, which completely leveled the progress of the bulls and lowered the stock price back below USD 350; Friday's low is below the low of July 18, which can be interpreted as a shortage of buyers after a bullish breakdown. The attack of the bulls did not attract followers. Thus, the market, by its behavior, casts doubt on the scenario of further growth, which can be imagined on the basis of a strong fundamental.
Fundamental or technical analysis? We will find out on Tuesday after the close of the main session, when the Microsoft report is released.
To benefit from MSFT share price movements, consider elisting the services of a reliable broker like FXOpen.
⚠️
CFDs are complex instruments and come with a high risk of losing your money.
This article represents the opinion of the Companies operating under the FXOpen brand only. It is not to be construed as an offer, solicitation, or recommendation with respect to products and services provided by the Companies operating under the FXOpen brand, nor is it to be considered financial advice.
MSFT STOCKS: FUNDAMENTAL VS. TECHNICAL ANALYSIS
This week 166 companies that make up 33% of the S & P 500 index will publish their reports for the second quarter. Among them, the second largest company in the index, Microsoft. And here, an interesting situation develops: the fundamental background is quite strong, and technical analysis shows signs of weakness. Judge for yourself.
Fundamental analysis:
→ the Android version of the sensational ChatGPT will be released this week;
→ Fundstrat analysts see a target price for MSFT shares of around USD 380 in the short term and USD 426 in the long term;
→ Barclays analysts have rated MSFT stock as a Buy with a target of USD 425 (previous MSFT share price target of USD 425.00) amid Microsoft 365 AI rollout.
However, let's evaluate the MSFT stock chart from the point of view of technical analysis. Note that after a sharp breakdown of the psychological level of USD 350 on July 18, 3 days of rollback followed, which completely leveled the progress of the bulls and lowered the stock price back below USD 350; Friday's low is below the low of July 18, which can be interpreted as a shortage of buyers after a bullish breakdown. The attack of the bulls did not attract followers. Thus, the market, by its behavior, casts doubt on the scenario of further growth, which can be imagined on the basis of a strong fundamental.
Fundamental or technical analysis? We will find out on Tuesday after the close of the main session, when the Microsoft report is released.
To benefit from MSFT share price movements, consider elisting the services of a reliable broker like FXOpen.
⚠️
CFDs are complex instruments and come with a high risk of losing your money.
This article represents the opinion of the Companies operating under the FXOpen brand only. It is not to be construed as an offer, solicitation, or recommendation with respect to products and services provided by the Companies operating under the FXOpen brand, nor is it to be considered financial advice.
#MarketNews #Cryptocurrency #BTC
BTC/USD ANALYSIS: BREAKDOWN OF JULY SUPPORT
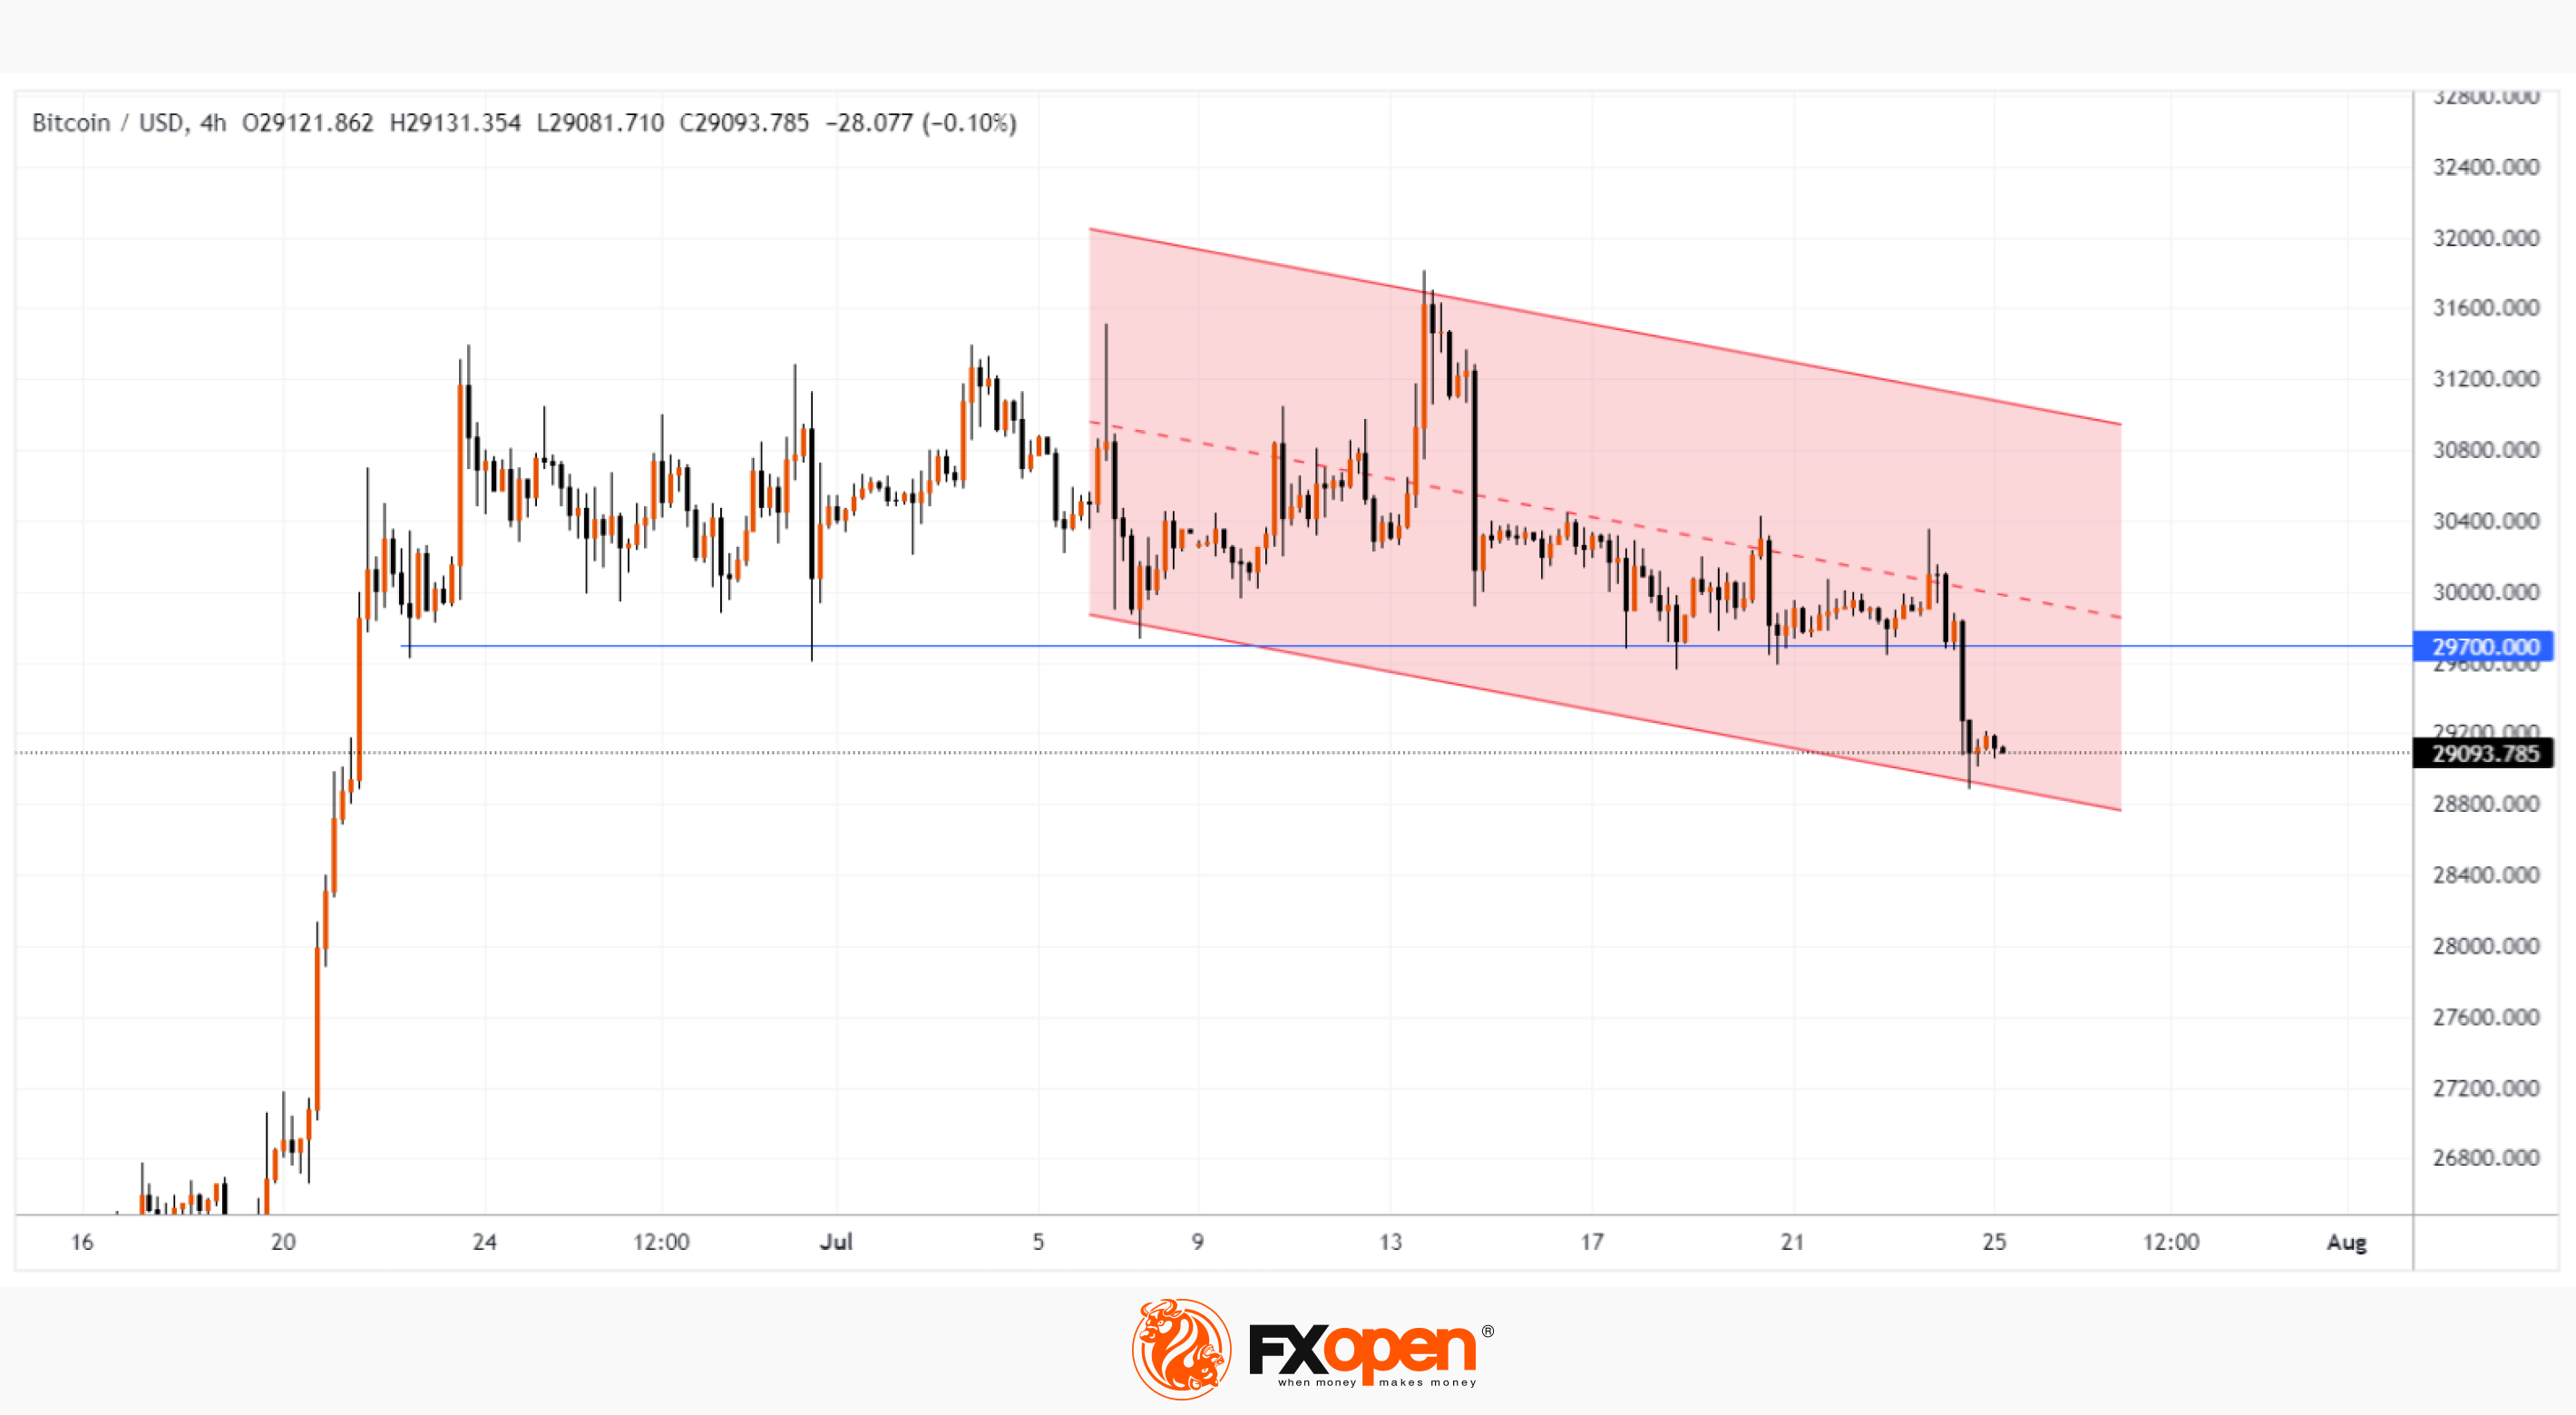
Yesterday, the price of BTC/USD fell below the level of 29,700, a support that has been in place for about a month.
What are the reasons for the decline? CNBC writes about:
→ strengthening of the USD on the eve of the Fed's meeting on the interest rate, which puts pressure on the price of bitcoin, denominated in US dollars;
→ an article in the WSJ raising concerns for the crypto industry in light of the pending SEC lawsuit against Binance.
Note that in our previous post, we pointed out a sign of weakness, which manifested itself in the inability of the bulls to take advantage of the positive from Ripple Labs' victory in court with the SEC, and also built a downward channel (shown in red). Yesterday, on the chart, the price of BTC/USD reached its lower limit, where it found support.
Will the price of bitcoin continue to develop dynamics within this channel? A lot depends on the Fed. The decision on the key interest rate will be announced tomorrow at 21:00 GMT+3. And at 21:30 Powell will hold a press conference.
We also draw attention to the fact that:
→ news on the interest rate from the ECB will be released on Thursday at 15:15 GMT+3;
→ on Friday at 06:00 GMT+3, a similar event from the Bank of Japan.
Be prepared for bursts of volatility, including in the BTC/USD market.
To benefit from trends in the cryptocurrency markets, consider enlisting the services of a trusted broker like FXOpen.
⚠️
CFDs are complex instruments and come with a high risk of losing your money.
At FXOpen UK and FXOpen AU, Cryptocurrency CFDs are only available for trading by those clients categorised as Professional clients under FCA Rules and Professional clients under ASIC Rules, respectively. They are not available for trading by Retail clients.
This article represents the opinion of the Companies operating under the FXOpen brand only. It is not to be construed as an offer, solicitation, or recommendation with respect to products and services provided by the Companies operating under the FXOpen brand, nor is it to be considered financial advice.
BTC/USD ANALYSIS: BREAKDOWN OF JULY SUPPORT
Yesterday, the price of BTC/USD fell below the level of 29,700, a support that has been in place for about a month.
What are the reasons for the decline? CNBC writes about:
→ strengthening of the USD on the eve of the Fed's meeting on the interest rate, which puts pressure on the price of bitcoin, denominated in US dollars;
→ an article in the WSJ raising concerns for the crypto industry in light of the pending SEC lawsuit against Binance.
Note that in our previous post, we pointed out a sign of weakness, which manifested itself in the inability of the bulls to take advantage of the positive from Ripple Labs' victory in court with the SEC, and also built a downward channel (shown in red). Yesterday, on the chart, the price of BTC/USD reached its lower limit, where it found support.
Will the price of bitcoin continue to develop dynamics within this channel? A lot depends on the Fed. The decision on the key interest rate will be announced tomorrow at 21:00 GMT+3. And at 21:30 Powell will hold a press conference.
We also draw attention to the fact that:
→ news on the interest rate from the ECB will be released on Thursday at 15:15 GMT+3;
→ on Friday at 06:00 GMT+3, a similar event from the Bank of Japan.
Be prepared for bursts of volatility, including in the BTC/USD market.
To benefit from trends in the cryptocurrency markets, consider enlisting the services of a trusted broker like FXOpen.
⚠️
CFDs are complex instruments and come with a high risk of losing your money.
At FXOpen UK and FXOpen AU, Cryptocurrency CFDs are only available for trading by those clients categorised as Professional clients under FCA Rules and Professional clients under ASIC Rules, respectively. They are not available for trading by Retail clients.
This article represents the opinion of the Companies operating under the FXOpen brand only. It is not to be construed as an offer, solicitation, or recommendation with respect to products and services provided by the Companies operating under the FXOpen brand, nor is it to be considered financial advice.
#MarketNews
MARKET ANALYSIS: GOOGLE REPORT GIVES POSITIVE MOMENTUM TO S&P 500 PRICE AHEAD OF FED DECISION
Yesterday, after the close of the main trading session, the reports of Microsoft and Google, one of the leaders of the AI-related boom, were published.
MSFT's share price fell more than 3% post-market as, despite Microsoft's Q2 performance for 2023 exceeding analysts' expectations, the company's forecasts for future periods turned out to be disappointing.
But the growth in the price of GOOG shares (in the postmarket) at the peak exceeded 7%. The company has demonstrated revenue growth in both search engines and YouTube and Cloud services, as well as through online advertising sales.
However, the main event of the week will take place today — namely, the news from the Fed at 21:00 GMT+3. Market participants are divided in their opinion: either the interest rate will be increased to 5.5% or remain unchanged at 5.25%. Also of great interest will be the words of Powell at a press conference at 21:30 GMT+3 regarding the rate of falling inflation, how much this will affect the current tight monetary policy.
Pending news from the Fed, trading volumes on the CME E-mini S&P 500 futures were well below average on Monday and Tuesday, but today there is likely to be a surge in volatility.
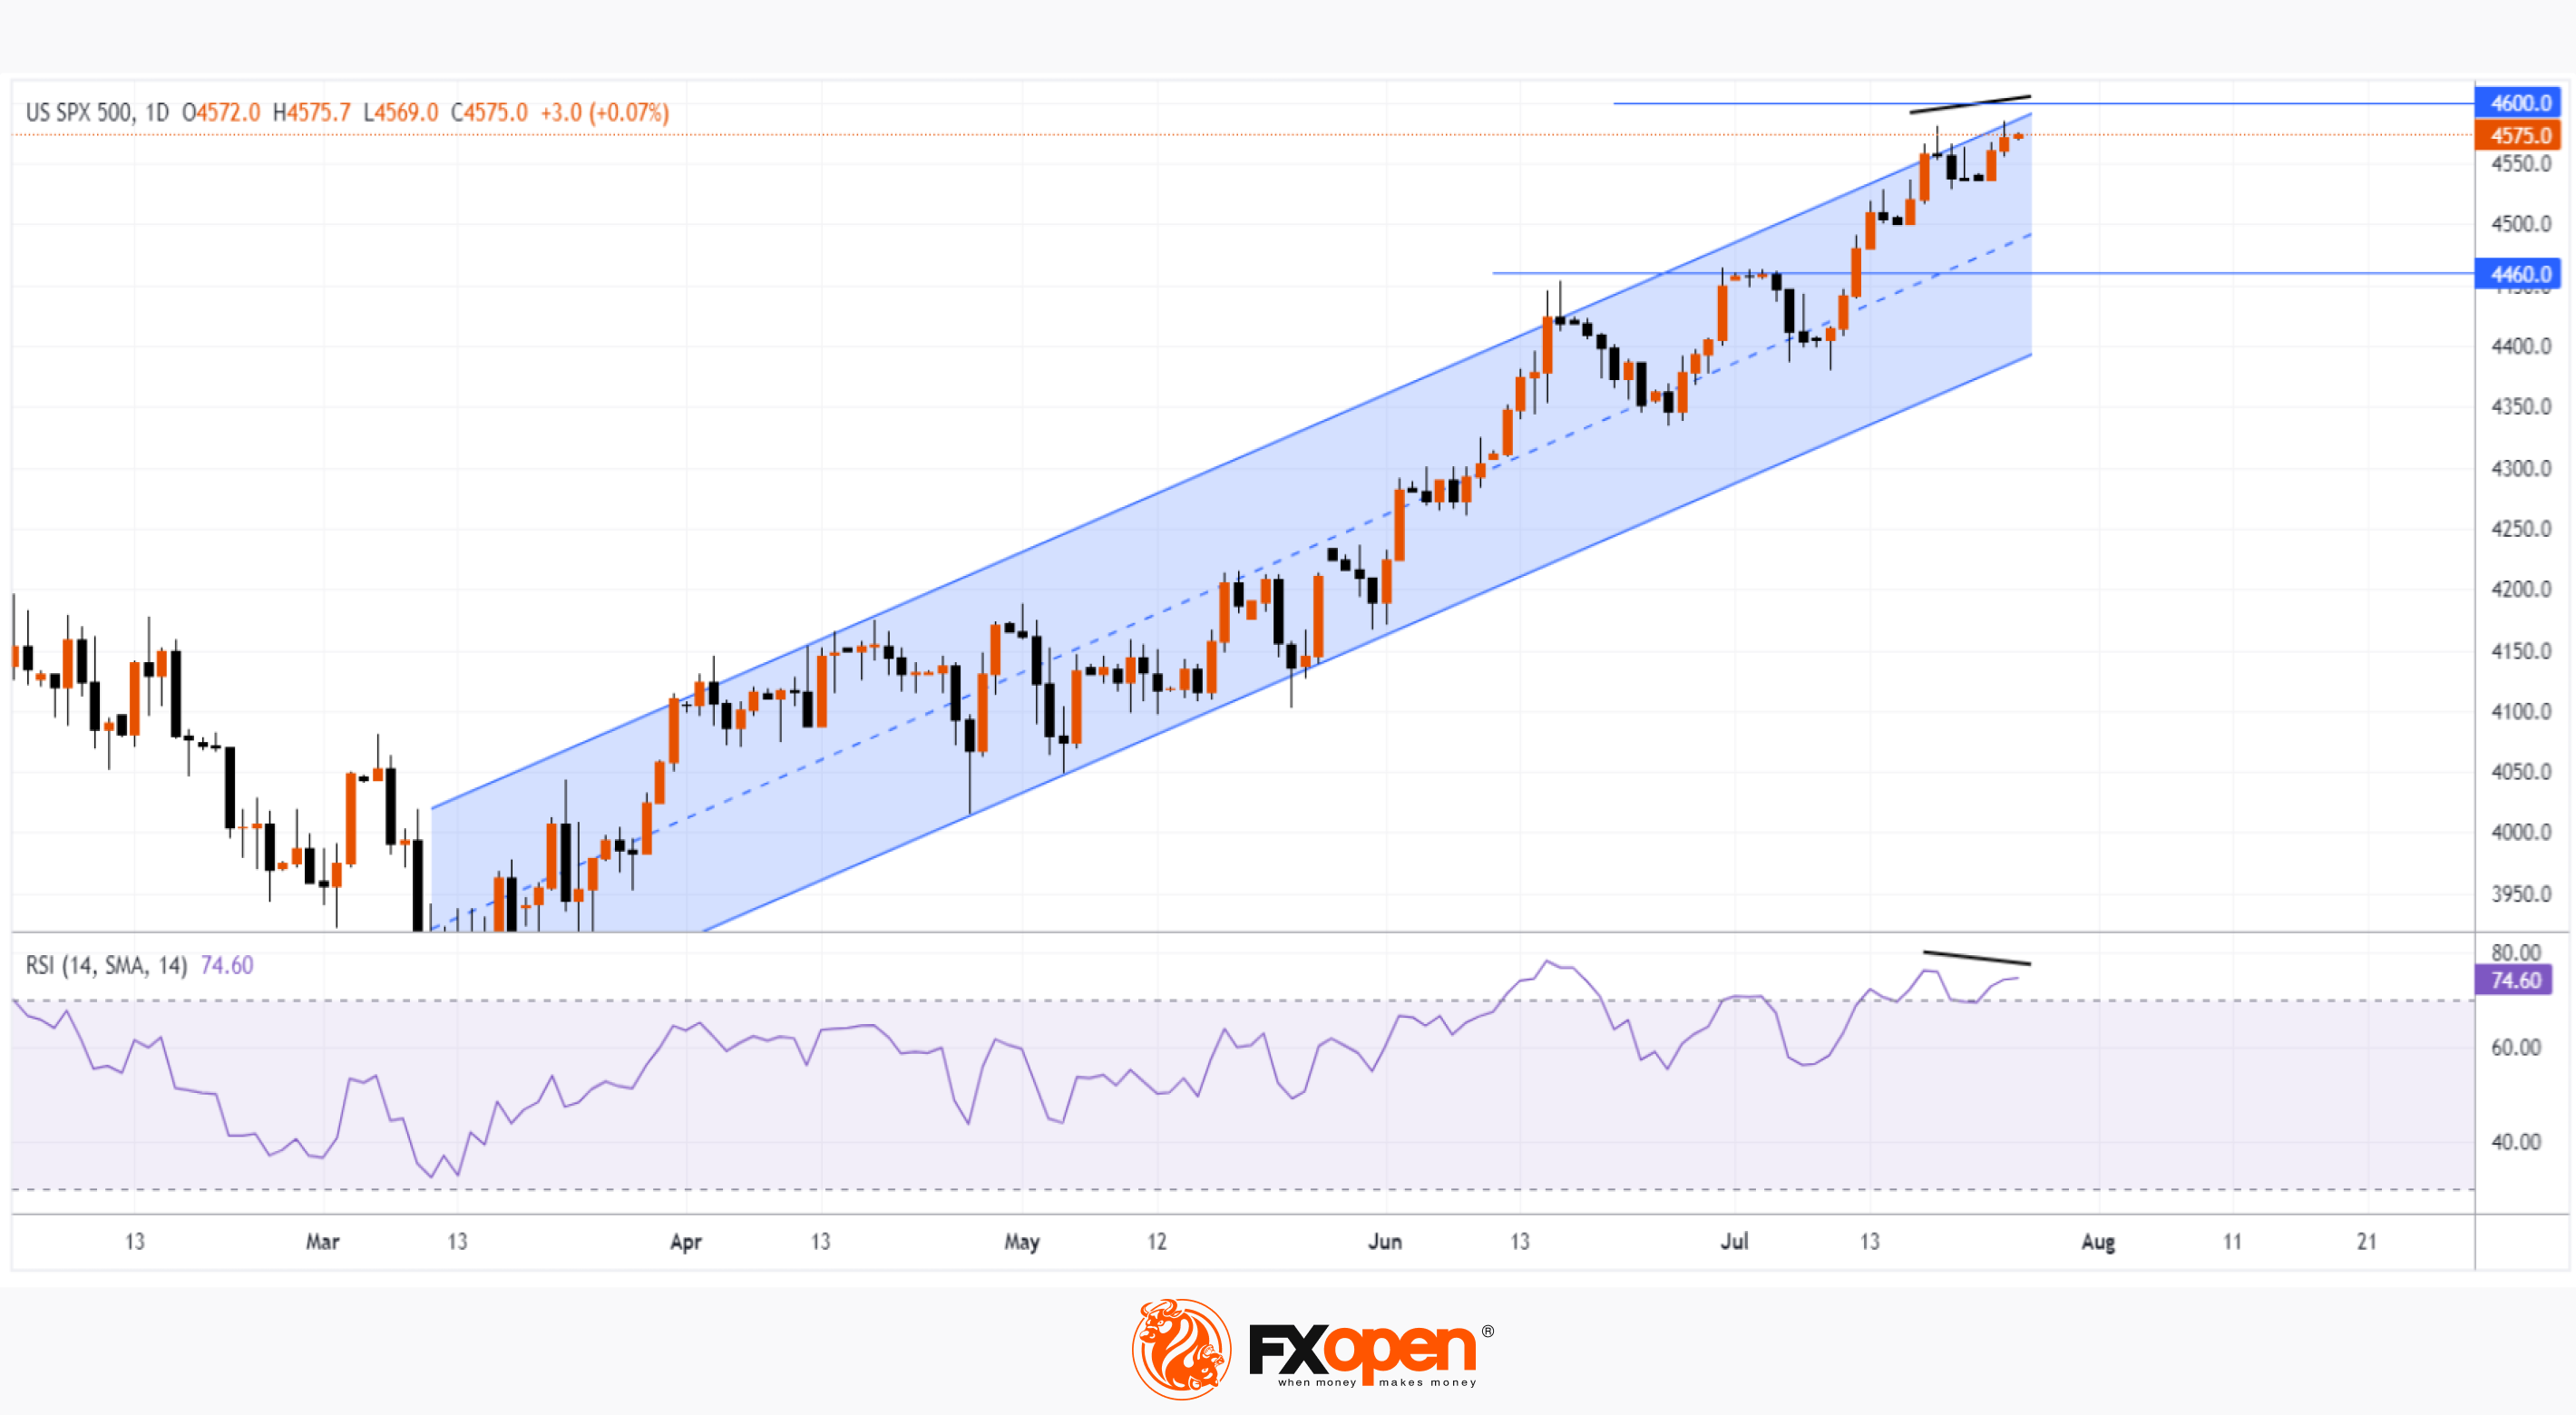
This morning the price of the S&P 500 index is near the highs of the year.
Possible resistance levels:
→ psychological level 4,600;
→ upper limit of the ascending channel (shown in blue).
Note the potential divergence between the price and the RSI indicator, which puts the S&P 500 in a vulnerable position for a pullback.
Support can be provided by the median line of the rising channel and its lower border, as well as the level of 4,460, which worked as resistance in June.
To benefit from trends in the S&P 500 market, consider enlisting the services of a trusted broker like FXOpen.
⚠️
CFDs are complex instruments and come with a high risk of losing your money.
This article represents the opinion of the Companies operating under the FXOpen brand only. It is not to be construed as an offer, solicitation, or recommendation with respect to products and services provided by the Companies operating under the FXOpen brand, nor is it to be considered financial advice.
MARKET ANALYSIS: GOOGLE REPORT GIVES POSITIVE MOMENTUM TO S&P 500 PRICE AHEAD OF FED DECISION
Yesterday, after the close of the main trading session, the reports of Microsoft and Google, one of the leaders of the AI-related boom, were published.
MSFT's share price fell more than 3% post-market as, despite Microsoft's Q2 performance for 2023 exceeding analysts' expectations, the company's forecasts for future periods turned out to be disappointing.
But the growth in the price of GOOG shares (in the postmarket) at the peak exceeded 7%. The company has demonstrated revenue growth in both search engines and YouTube and Cloud services, as well as through online advertising sales.
However, the main event of the week will take place today — namely, the news from the Fed at 21:00 GMT+3. Market participants are divided in their opinion: either the interest rate will be increased to 5.5% or remain unchanged at 5.25%. Also of great interest will be the words of Powell at a press conference at 21:30 GMT+3 regarding the rate of falling inflation, how much this will affect the current tight monetary policy.
Pending news from the Fed, trading volumes on the CME E-mini S&P 500 futures were well below average on Monday and Tuesday, but today there is likely to be a surge in volatility.
This morning the price of the S&P 500 index is near the highs of the year.
Possible resistance levels:
→ psychological level 4,600;
→ upper limit of the ascending channel (shown in blue).
Note the potential divergence between the price and the RSI indicator, which puts the S&P 500 in a vulnerable position for a pullback.
Support can be provided by the median line of the rising channel and its lower border, as well as the level of 4,460, which worked as resistance in June.
To benefit from trends in the S&P 500 market, consider enlisting the services of a trusted broker like FXOpen.
⚠️
CFDs are complex instruments and come with a high risk of losing your money.
This article represents the opinion of the Companies operating under the FXOpen brand only. It is not to be construed as an offer, solicitation, or recommendation with respect to products and services provided by the Companies operating under the FXOpen brand, nor is it to be considered financial advice.
👍1
#MarketNews
MARKET ANALYSIS: THE US DOLLAR WEAKENS AFTER THE FED'S DECISION TO RAISE RATES
After the 11th increase, the interest rate reached 5.5%.
At the same time, the US dollar weakened because:
→ market participants may consider this to be the last hike in the cycle (although Powell admitted the possibility of a rate hike in September);
→ the Fed is no longer considering a recession scenario, which has reduced the relevance of cash as a defensive asset. Reuters reports analysts saying Powell's tone has become more dovish.
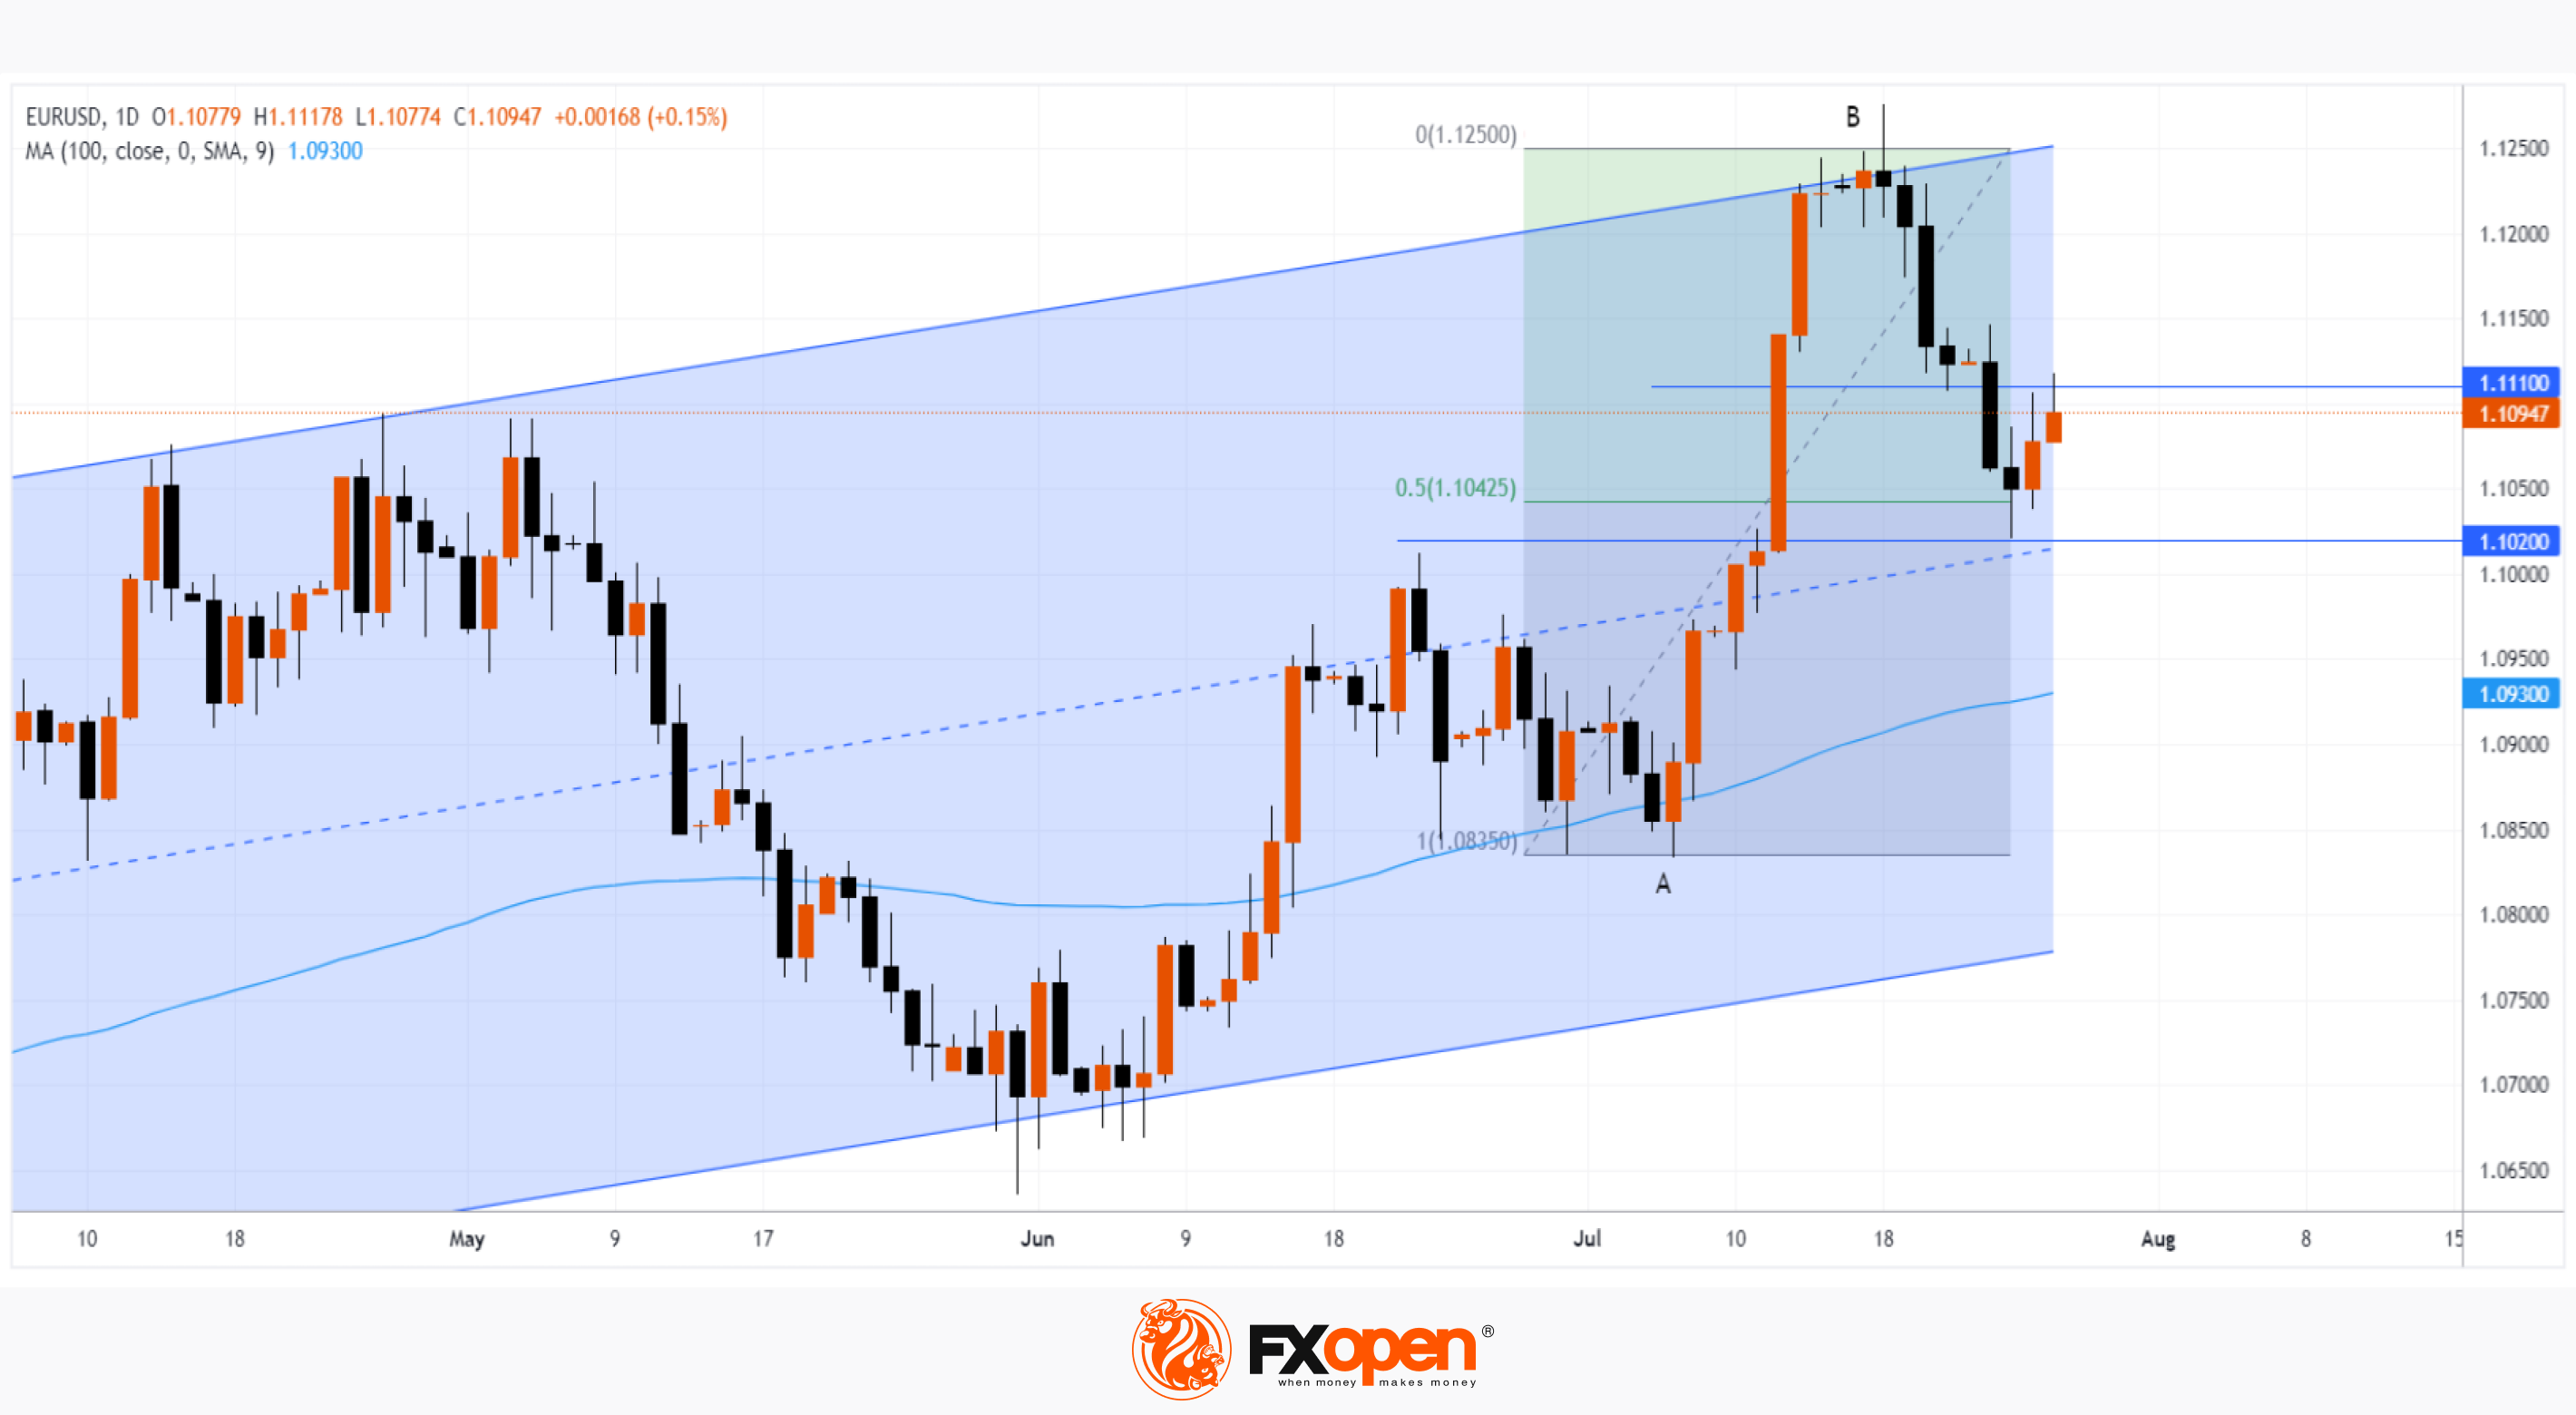
The weakening of the US dollar led to an increase in the prices of currencies traded in tandem with the USD. Thus, the EUR/USD rate rose by 0.75% from the low of the week, where the support block is located:
→ level 50% of growth A→B;
→ median line of the ascending channel (shown in blue);
→ level 1.02, which worked as a resistance in June.
At the same time, the nearest resistance is at the level of 1.111, which was support last week. Pay attention to the rate of decline in the price on the EUR/USD chart on the 20th and 24th — a sign of the initiative of the bears. Will they be able to break through the support block, or will the bulls intend to use it as a support for a new swing within the channel shown in blue? There should be more arguments for reasoning after the news from the ECB is released today at 15:15 GMT+3.
To benefit from trends in the currency markets, consider enlisting the services of a trusted broker like FXOpen.
⚠️
CFDs are complex instruments and come with a high risk of losing your money.
This article represents the opinion of the Companies operating under the FXOpen brand only. It is not to be construed as an offer, solicitation, or recommendation with respect to products and services provided by the Companies operating under the FXOpen brand, nor is it to be considered financial advice.
MARKET ANALYSIS: THE US DOLLAR WEAKENS AFTER THE FED'S DECISION TO RAISE RATES
After the 11th increase, the interest rate reached 5.5%.
At the same time, the US dollar weakened because:
→ market participants may consider this to be the last hike in the cycle (although Powell admitted the possibility of a rate hike in September);
→ the Fed is no longer considering a recession scenario, which has reduced the relevance of cash as a defensive asset. Reuters reports analysts saying Powell's tone has become more dovish.
The weakening of the US dollar led to an increase in the prices of currencies traded in tandem with the USD. Thus, the EUR/USD rate rose by 0.75% from the low of the week, where the support block is located:
→ level 50% of growth A→B;
→ median line of the ascending channel (shown in blue);
→ level 1.02, which worked as a resistance in June.
At the same time, the nearest resistance is at the level of 1.111, which was support last week. Pay attention to the rate of decline in the price on the EUR/USD chart on the 20th and 24th — a sign of the initiative of the bears. Will they be able to break through the support block, or will the bulls intend to use it as a support for a new swing within the channel shown in blue? There should be more arguments for reasoning after the news from the ECB is released today at 15:15 GMT+3.
To benefit from trends in the currency markets, consider enlisting the services of a trusted broker like FXOpen.
⚠️
CFDs are complex instruments and come with a high risk of losing your money.
This article represents the opinion of the Companies operating under the FXOpen brand only. It is not to be construed as an offer, solicitation, or recommendation with respect to products and services provided by the Companies operating under the FXOpen brand, nor is it to be considered financial advice.
#MarketNews
MARKET ANALYSIS: META STOCK UP 7% AFTER REPORT
The social media giant's second-quarter results encouraged investors as ad revenue surged, the company is embracing AI, monetization of Instagram and Reels.
→ Facebook now has 2.06 billion daily active users, up 5% from a year ago. And taking into account Instagram and other applications — 3.07 billion, which is 7% more.
→ At the same time, the number of employees decreased by 14% compared to last year to 71,000 people. Zuckerberg said the austerity program will run until 2024.
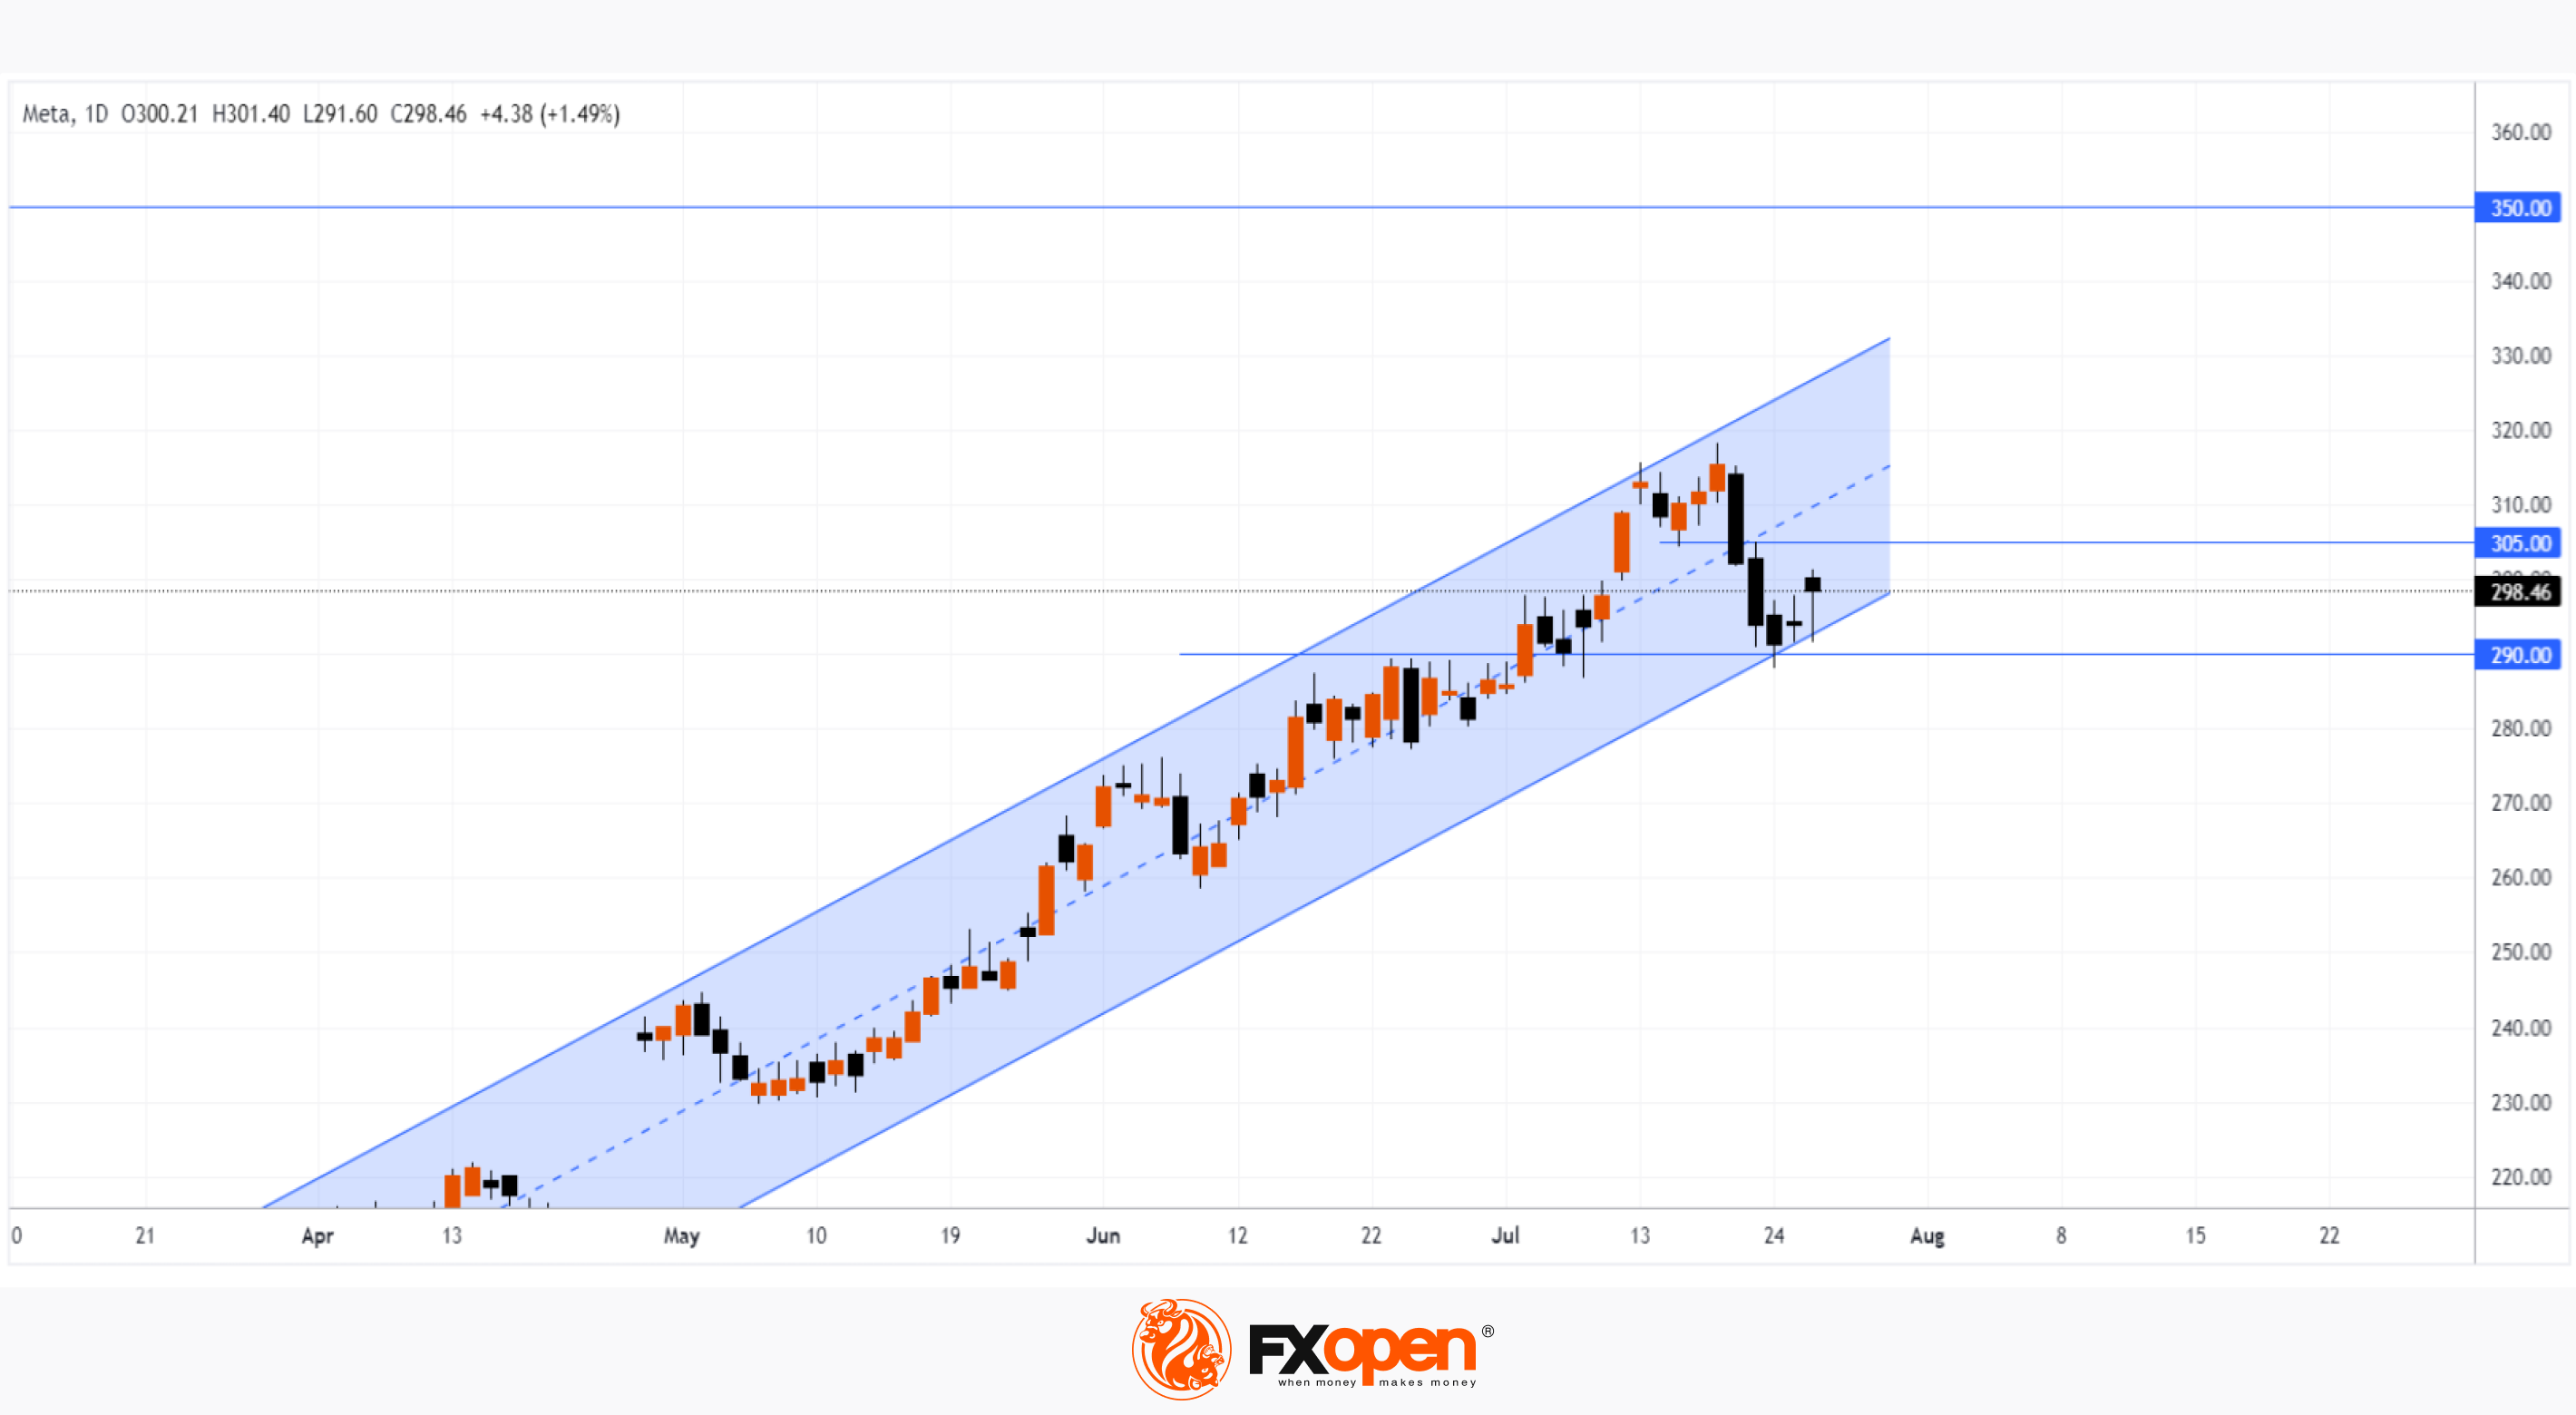
Amid the data, META's stock price jumped 7% in premarket trading. The META stock chart shows that:
→ today the price should update the high of the year;
→ with this sharp momentum, the bulls get the opportunity to gain a foothold above the psychological level of $300, pushing off from the support around $290;
Possible resistance level:
→ the $350 psychological mark, where the 2022 high is approximately located.
Possible support levels:
→ median and lower limit of the active ascending channel;
→ the $305 level that had an impact on the price in July.
According to the WSJ, analysts see an average target price for META's stock at around USD 330, but given the company's performance as evidenced by the report, the target price could be revised upwards by analysts.
To benefit from the growth of shares of the world's best companies, consider enlisting the services of a trusted broker like FXOpen.
⚠️
CFDs are complex instruments and come with a high risk of losing your money.
This article represents the opinion of the Companies operating under the FXOpen brand only. It is not to be construed as an offer, solicitation, or recommendation with respect to products and services provided by the Companies operating under the FXOpen brand, nor is it to be considered financial advice.
MARKET ANALYSIS: META STOCK UP 7% AFTER REPORT
The social media giant's second-quarter results encouraged investors as ad revenue surged, the company is embracing AI, monetization of Instagram and Reels.
→ Facebook now has 2.06 billion daily active users, up 5% from a year ago. And taking into account Instagram and other applications — 3.07 billion, which is 7% more.
→ At the same time, the number of employees decreased by 14% compared to last year to 71,000 people. Zuckerberg said the austerity program will run until 2024.
Amid the data, META's stock price jumped 7% in premarket trading. The META stock chart shows that:
→ today the price should update the high of the year;
→ with this sharp momentum, the bulls get the opportunity to gain a foothold above the psychological level of $300, pushing off from the support around $290;
Possible resistance level:
→ the $350 psychological mark, where the 2022 high is approximately located.
Possible support levels:
→ median and lower limit of the active ascending channel;
→ the $305 level that had an impact on the price in July.
According to the WSJ, analysts see an average target price for META's stock at around USD 330, but given the company's performance as evidenced by the report, the target price could be revised upwards by analysts.
To benefit from the growth of shares of the world's best companies, consider enlisting the services of a trusted broker like FXOpen.
⚠️
CFDs are complex instruments and come with a high risk of losing your money.
This article represents the opinion of the Companies operating under the FXOpen brand only. It is not to be construed as an offer, solicitation, or recommendation with respect to products and services provided by the Companies operating under the FXOpen brand, nor is it to be considered financial advice.
👍1
#MarketAnalysis
MARKET ANALYSIS: BOJ’S DECISION LEADS TO SHARP SURGE IN VOLATILITY
The interest rate in Japan has remained unchanged since 2016 at -0.1%. Thus, the leadership of the Bank of Japan, unlike its counterparts, is pursuing a stable ultra-soft policy. This morning, the expected decision to keep the interest rate was published, but the attention of traders was attracted by the intention of the Bank of Japan to offer the market 10-year government bonds (JGB) at a fixed rate of 1.0% instead of 0.5%. This is a hint at a possible tightening of policy, which could greatly affect the yen.
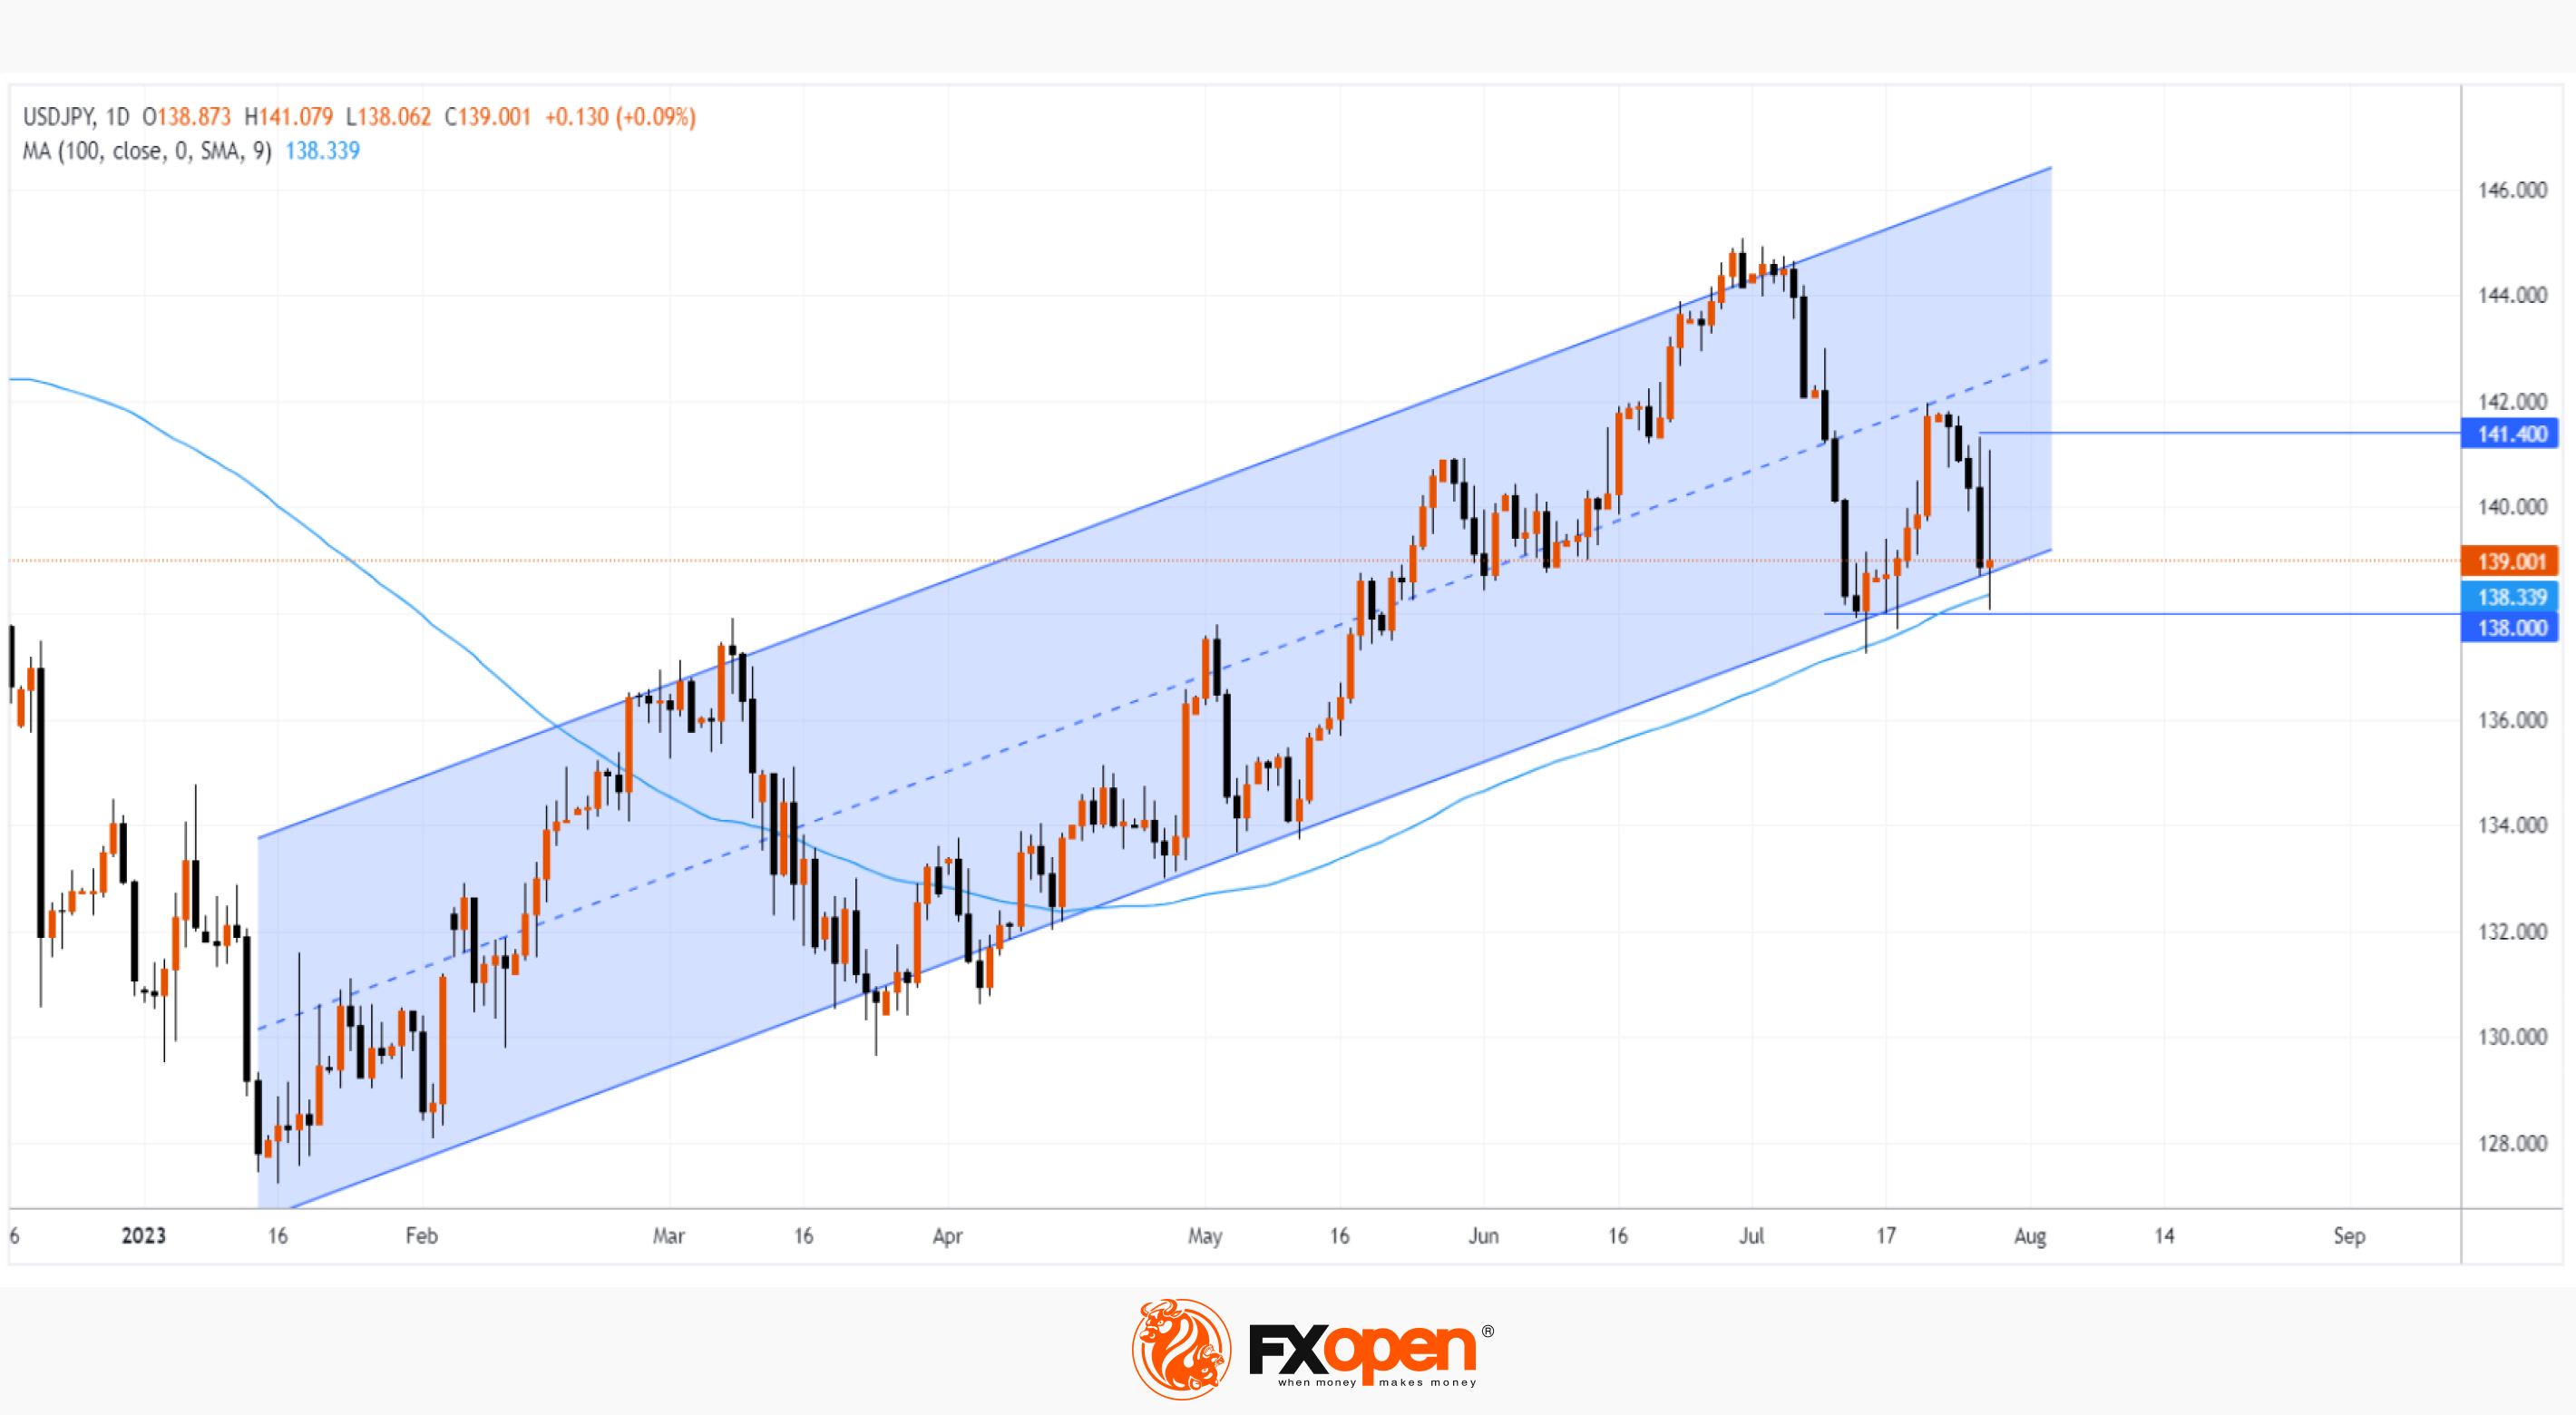
Against the backdrop of the latest news from the Fed and the Bank of Japan, the USD/JPY rate was extremely volatile. The extremes of the last 3 days indicate a range formed by support at 138.0 and resistance at 141.4. It is acceptable to assume that after a surge in volatility, the USD/JPY rate will consolidate within this range.
Note also that the support near 138.0 is reinforced by the SMA (100) and the lower boundary of the long-term channel. But it is possible that a surge in volatility could change the balance of supply and demand and lead to a bearish breakdown of the upward channel that has been operating in the USD/JPY market since the beginning of 2023.
To benefit from trends in the currency markets, consider enlisting the services of a trusted broker like FXOpen.
⚠️
CFDs are complex instruments and come with a high risk of losing your money.
This article represents the opinion of the Companies operating under the FXOpen brand only. It is not to be construed as an offer, solicitation, or recommendation with respect to products and services provided by the Companies operating under the FXOpen brand, nor is it to be considered financial advice.
MARKET ANALYSIS: BOJ’S DECISION LEADS TO SHARP SURGE IN VOLATILITY
The interest rate in Japan has remained unchanged since 2016 at -0.1%. Thus, the leadership of the Bank of Japan, unlike its counterparts, is pursuing a stable ultra-soft policy. This morning, the expected decision to keep the interest rate was published, but the attention of traders was attracted by the intention of the Bank of Japan to offer the market 10-year government bonds (JGB) at a fixed rate of 1.0% instead of 0.5%. This is a hint at a possible tightening of policy, which could greatly affect the yen.
Against the backdrop of the latest news from the Fed and the Bank of Japan, the USD/JPY rate was extremely volatile. The extremes of the last 3 days indicate a range formed by support at 138.0 and resistance at 141.4. It is acceptable to assume that after a surge in volatility, the USD/JPY rate will consolidate within this range.
Note also that the support near 138.0 is reinforced by the SMA (100) and the lower boundary of the long-term channel. But it is possible that a surge in volatility could change the balance of supply and demand and lead to a bearish breakdown of the upward channel that has been operating in the USD/JPY market since the beginning of 2023.
To benefit from trends in the currency markets, consider enlisting the services of a trusted broker like FXOpen.
⚠️
CFDs are complex instruments and come with a high risk of losing your money.
This article represents the opinion of the Companies operating under the FXOpen brand only. It is not to be construed as an offer, solicitation, or recommendation with respect to products and services provided by the Companies operating under the FXOpen brand, nor is it to be considered financial advice.
👍1
#MarketAnalysis
MARKET ANALYSIS: INTC SHARE PRICE SOARS APPROXIMATELY 7% AFTER REPORT
It happened at yesterday's postmarket. At the same time, at the peak, the price of INTC shares reached a maximum of 2023. Here are the key points voiced by Intel CEO Pat Gelsinger:
→ Sales of server chips will only recover in Q4.
→ The company is prepared to take advantage of all the opportunities that open up with the development of AI.
→ The company is focused on implementing the Smart Capital strategy to support sustainable growth and financial discipline.
Investors were enthusiastic about the fact that the company became profitable, earning USD 1.5 billion (in the second quarter of 2022, a loss of USD 0.5 billion was recorded).
According to MarketWatch, analysts believe that Intel can benefit from the AI revolution, but it is not yet clear if Gelsinger can avoid the mistakes of his predecessors.
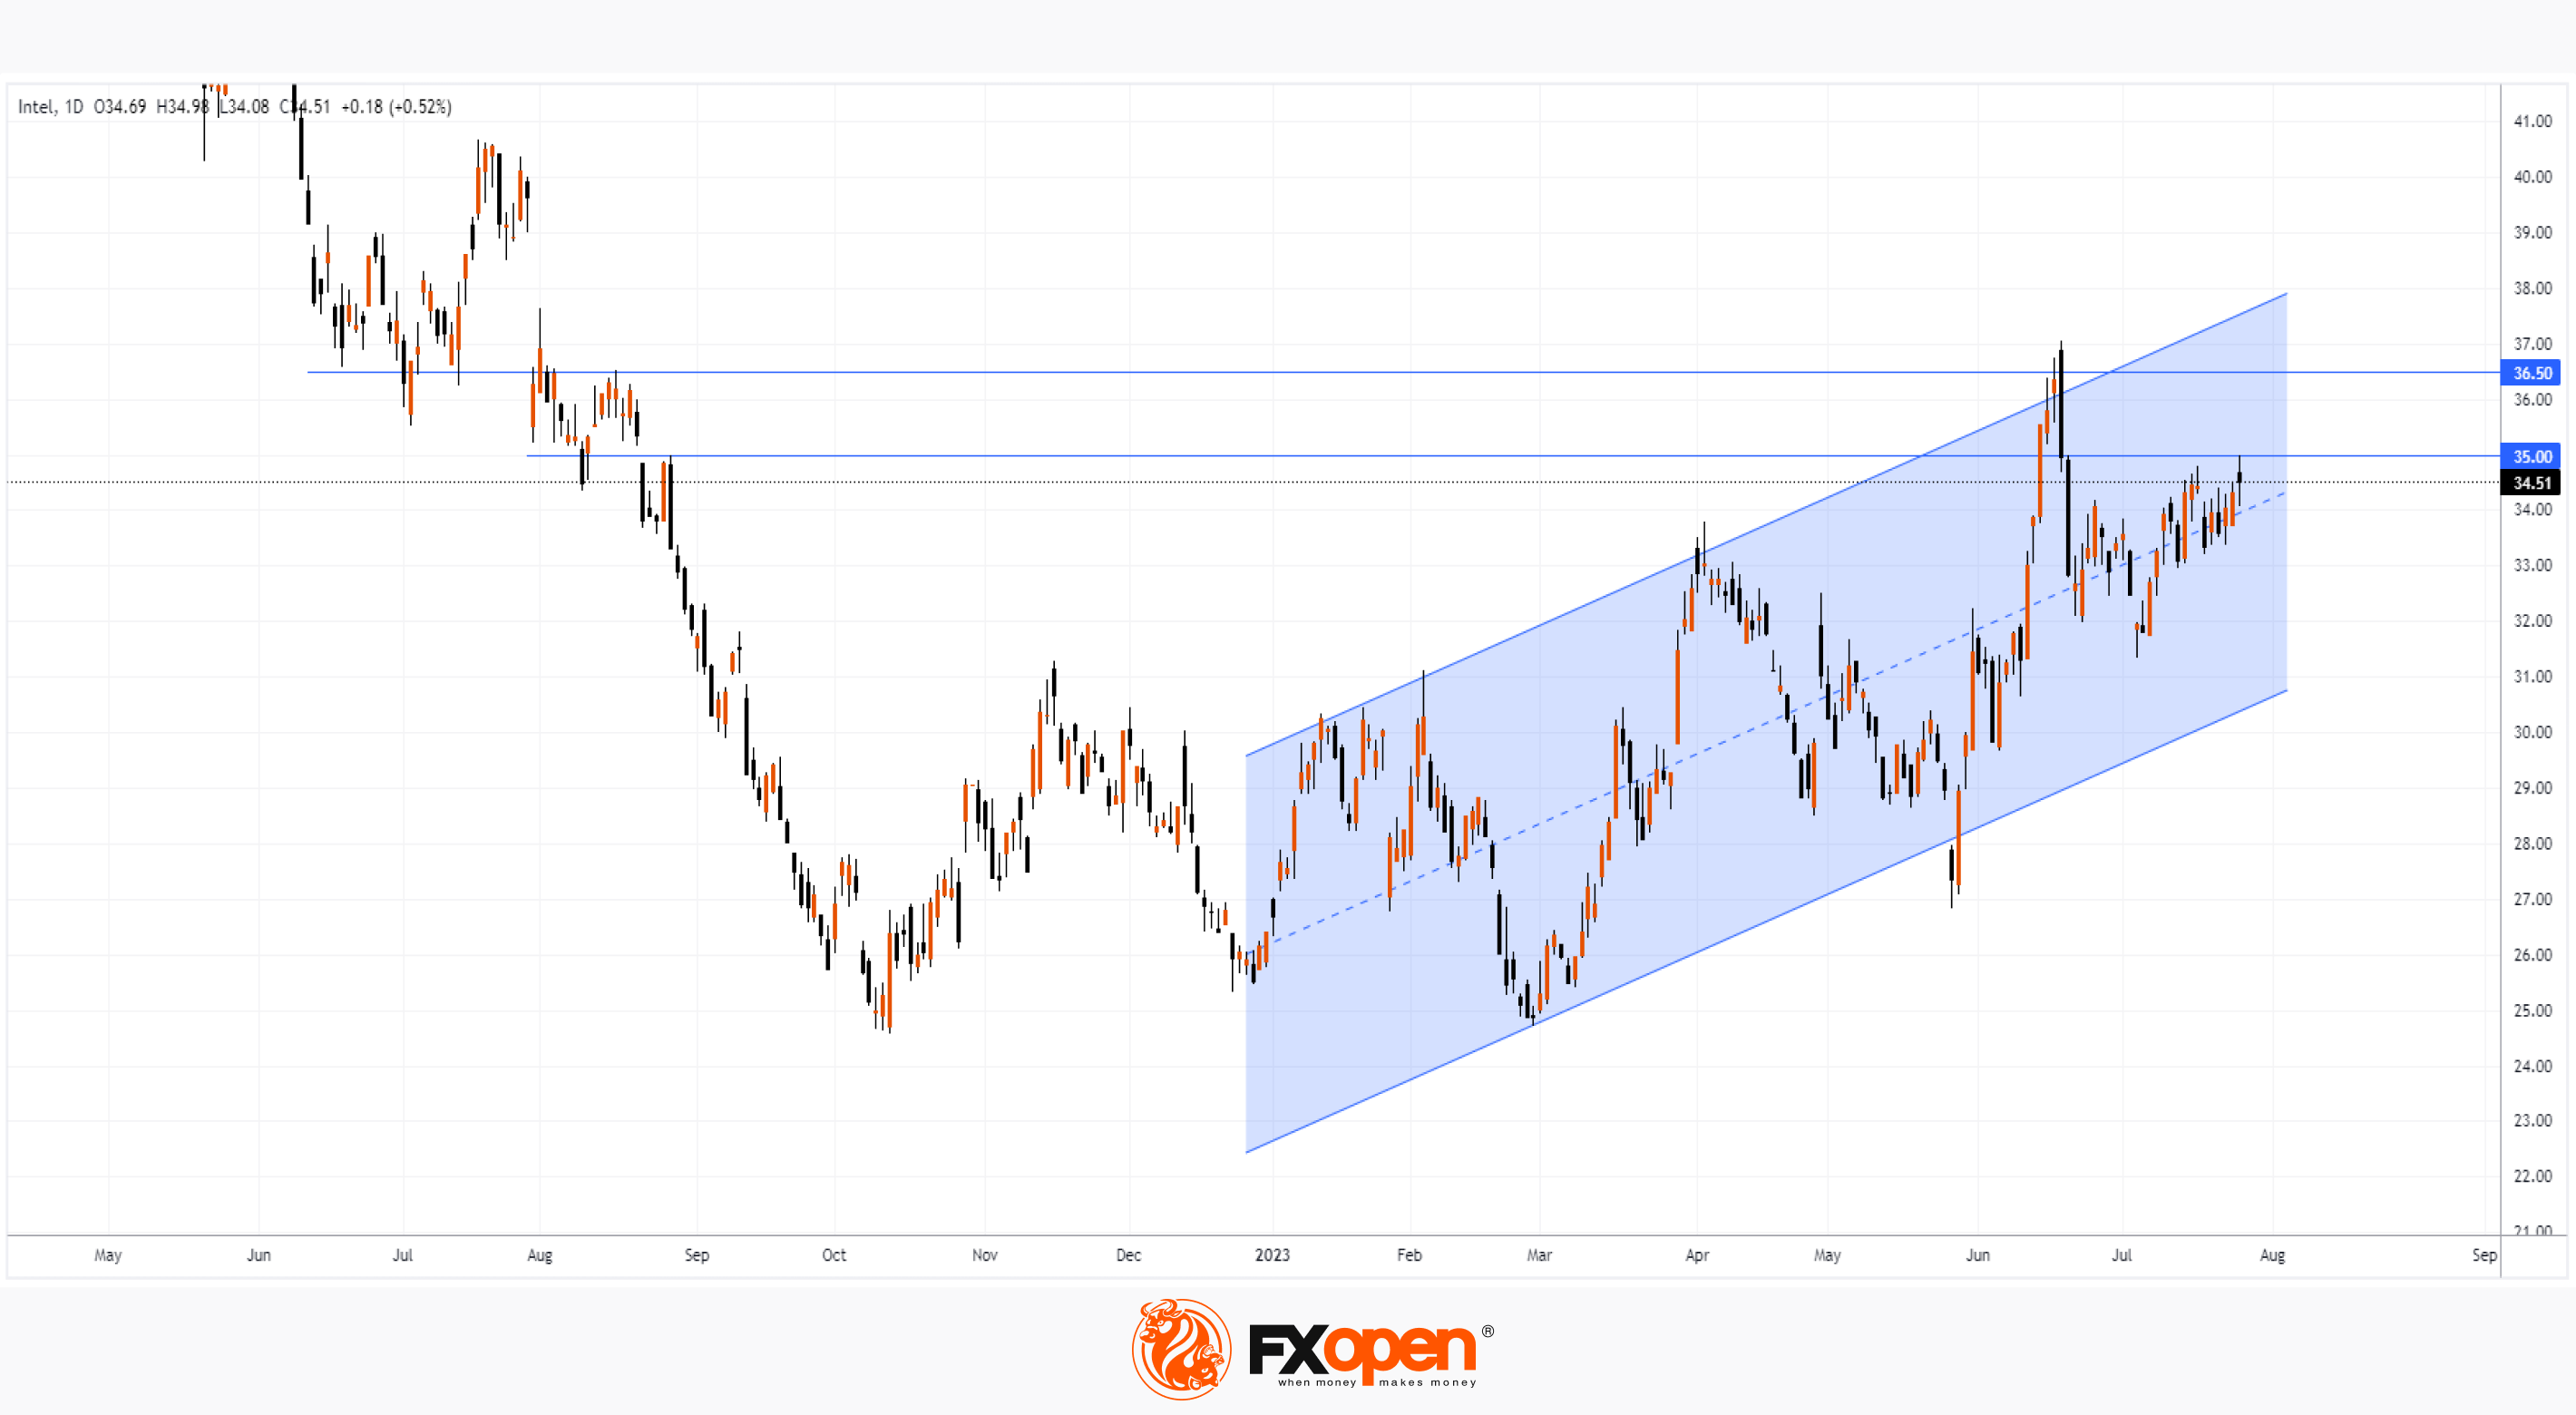
The INTC stock chart shows that the price is moving within an ascending channel in 2023. Today, trading is likely to open near its upper border. And now the bulls will have to try to keep the progress made, gaining a foothold above the USD 35.00-36.50 zone, which originates in 2022 and acted as resistance during 2023.
According to the WSJ, the average target price for INTC shares is around USD 33.63, but after yesterday's report, it is likely to be revised upwards.
To benefit from trends in the stock markets of Intel and other popular companies making money from the spread of AI, consider enlisting the services of a trusted broker like FXOpen.
⚠️
CFDs are complex instruments and come with a high risk of losing your money.
This article represents the opinion of the Companies operating under the FXOpen brand only. It is not to be construed as an offer, solicitation, or recommendation with respect to products and services provided by the Companies operating under the FXOpen brand, nor is it to be considered financial advice.
MARKET ANALYSIS: INTC SHARE PRICE SOARS APPROXIMATELY 7% AFTER REPORT
It happened at yesterday's postmarket. At the same time, at the peak, the price of INTC shares reached a maximum of 2023. Here are the key points voiced by Intel CEO Pat Gelsinger:
→ Sales of server chips will only recover in Q4.
→ The company is prepared to take advantage of all the opportunities that open up with the development of AI.
→ The company is focused on implementing the Smart Capital strategy to support sustainable growth and financial discipline.
Investors were enthusiastic about the fact that the company became profitable, earning USD 1.5 billion (in the second quarter of 2022, a loss of USD 0.5 billion was recorded).
According to MarketWatch, analysts believe that Intel can benefit from the AI revolution, but it is not yet clear if Gelsinger can avoid the mistakes of his predecessors.
The INTC stock chart shows that the price is moving within an ascending channel in 2023. Today, trading is likely to open near its upper border. And now the bulls will have to try to keep the progress made, gaining a foothold above the USD 35.00-36.50 zone, which originates in 2022 and acted as resistance during 2023.
According to the WSJ, the average target price for INTC shares is around USD 33.63, but after yesterday's report, it is likely to be revised upwards.
To benefit from trends in the stock markets of Intel and other popular companies making money from the spread of AI, consider enlisting the services of a trusted broker like FXOpen.
⚠️
CFDs are complex instruments and come with a high risk of losing your money.
This article represents the opinion of the Companies operating under the FXOpen brand only. It is not to be construed as an offer, solicitation, or recommendation with respect to products and services provided by the Companies operating under the FXOpen brand, nor is it to be considered financial advice.
Weekly Market Wrap With Gary Thomson: EUR/USD, FTSE 100, CRUDE OIL PRICES, NETFLIX NEWS
Get the latest scoop on the week's hottest headlines, all in one convenient video. Join Gary Thomson, the COO of FXOpen UK, as he breaks down the most significant news reports and shares his expert insights.
🔸The price of Brent oil has reached the level of resistance. Will this July become the best month since June 2022?
🔸The hyperbole around British pound indicates a huge decline, but a long-term view says otherwise
🔸The US dollar weakens after the Fed's decision to raise rates. Will the bears be able to break through the support block, or will the bulls intend to use it as a support for a new swing?
🔸META shares up 7% after report. The social media giant's Q2 results encouraged investors as ad revenue surged, the company is embracing AI, monetization of Instagram and Reels
- META shares up 7% after report. The social media giant's Q2 results encouraged investors as ad revenue surged, the company is embracing AI, monetization of Instagram and Reels
https://youtu.be/3A0AJR_Qjv4
To take advantage of price fluctuations in the foreign exchange markets, consider enlisting the services of a reliable broker like FXOpen.
⚠️
This forecast represents FXOpen Companies opinion only, it should not be construed as an offer, invitation or recommendation in respect to FXOpen Companies products and services or as financial advice
Get the latest scoop on the week's hottest headlines, all in one convenient video. Join Gary Thomson, the COO of FXOpen UK, as he breaks down the most significant news reports and shares his expert insights.
🔸The price of Brent oil has reached the level of resistance. Will this July become the best month since June 2022?
🔸The hyperbole around British pound indicates a huge decline, but a long-term view says otherwise
🔸The US dollar weakens after the Fed's decision to raise rates. Will the bears be able to break through the support block, or will the bulls intend to use it as a support for a new swing?
🔸META shares up 7% after report. The social media giant's Q2 results encouraged investors as ad revenue surged, the company is embracing AI, monetization of Instagram and Reels
- META shares up 7% after report. The social media giant's Q2 results encouraged investors as ad revenue surged, the company is embracing AI, monetization of Instagram and Reels
https://youtu.be/3A0AJR_Qjv4
To take advantage of price fluctuations in the foreign exchange markets, consider enlisting the services of a reliable broker like FXOpen.
⚠️
This forecast represents FXOpen Companies opinion only, it should not be construed as an offer, invitation or recommendation in respect to FXOpen Companies products and services or as financial advice
YouTube
Weekly Market Wrap With Gary Thomson: BRENT OIL PRICE, BRITISH POUND & US DOLLAR, META
Get the latest scoop on the week's hottest headlines, all in one convenient video. Join Gary Thomson, the COO of FXOpen UK, as he breaks down the most significant news reports and shares his expert insights.
- The price of Brent oil has reached the level…
- The price of Brent oil has reached the level…
#MarketNews
Market Analysis: US Stocks Continue to Rise
After a turbulent week filled with macroeconomic news and decisions of the central bank of the leading economies, on Monday morning futures for the E-mini S&P 500 index look bullish, being near the highs of the year.
The following factors contribute to the positive in the market:
→ Friday's data indicating a slowdown in inflation. The Core PCE Price index was 0.2% in monthly terms (expected = 0.3%, last month = 0.3%).
→ The probability of a rate hike in September according to FEDWatch is only 20%. The US economy is moving towards a soft landing, according to WSJ analysts.
→ Strong reports from a number of companies for the 2nd quarter, including Google. Also, market participants are looking forward to new reports with enthusiasm — news for AAPL, AMZN, AMD and other companies included in the S&P 500 index are scheduled this week.
However, analysts at Bank of America note that the cost of options used to hedge against falling stock prices is at an all-time low — evidence of excessive positivity in the market, which could lead to a correction.
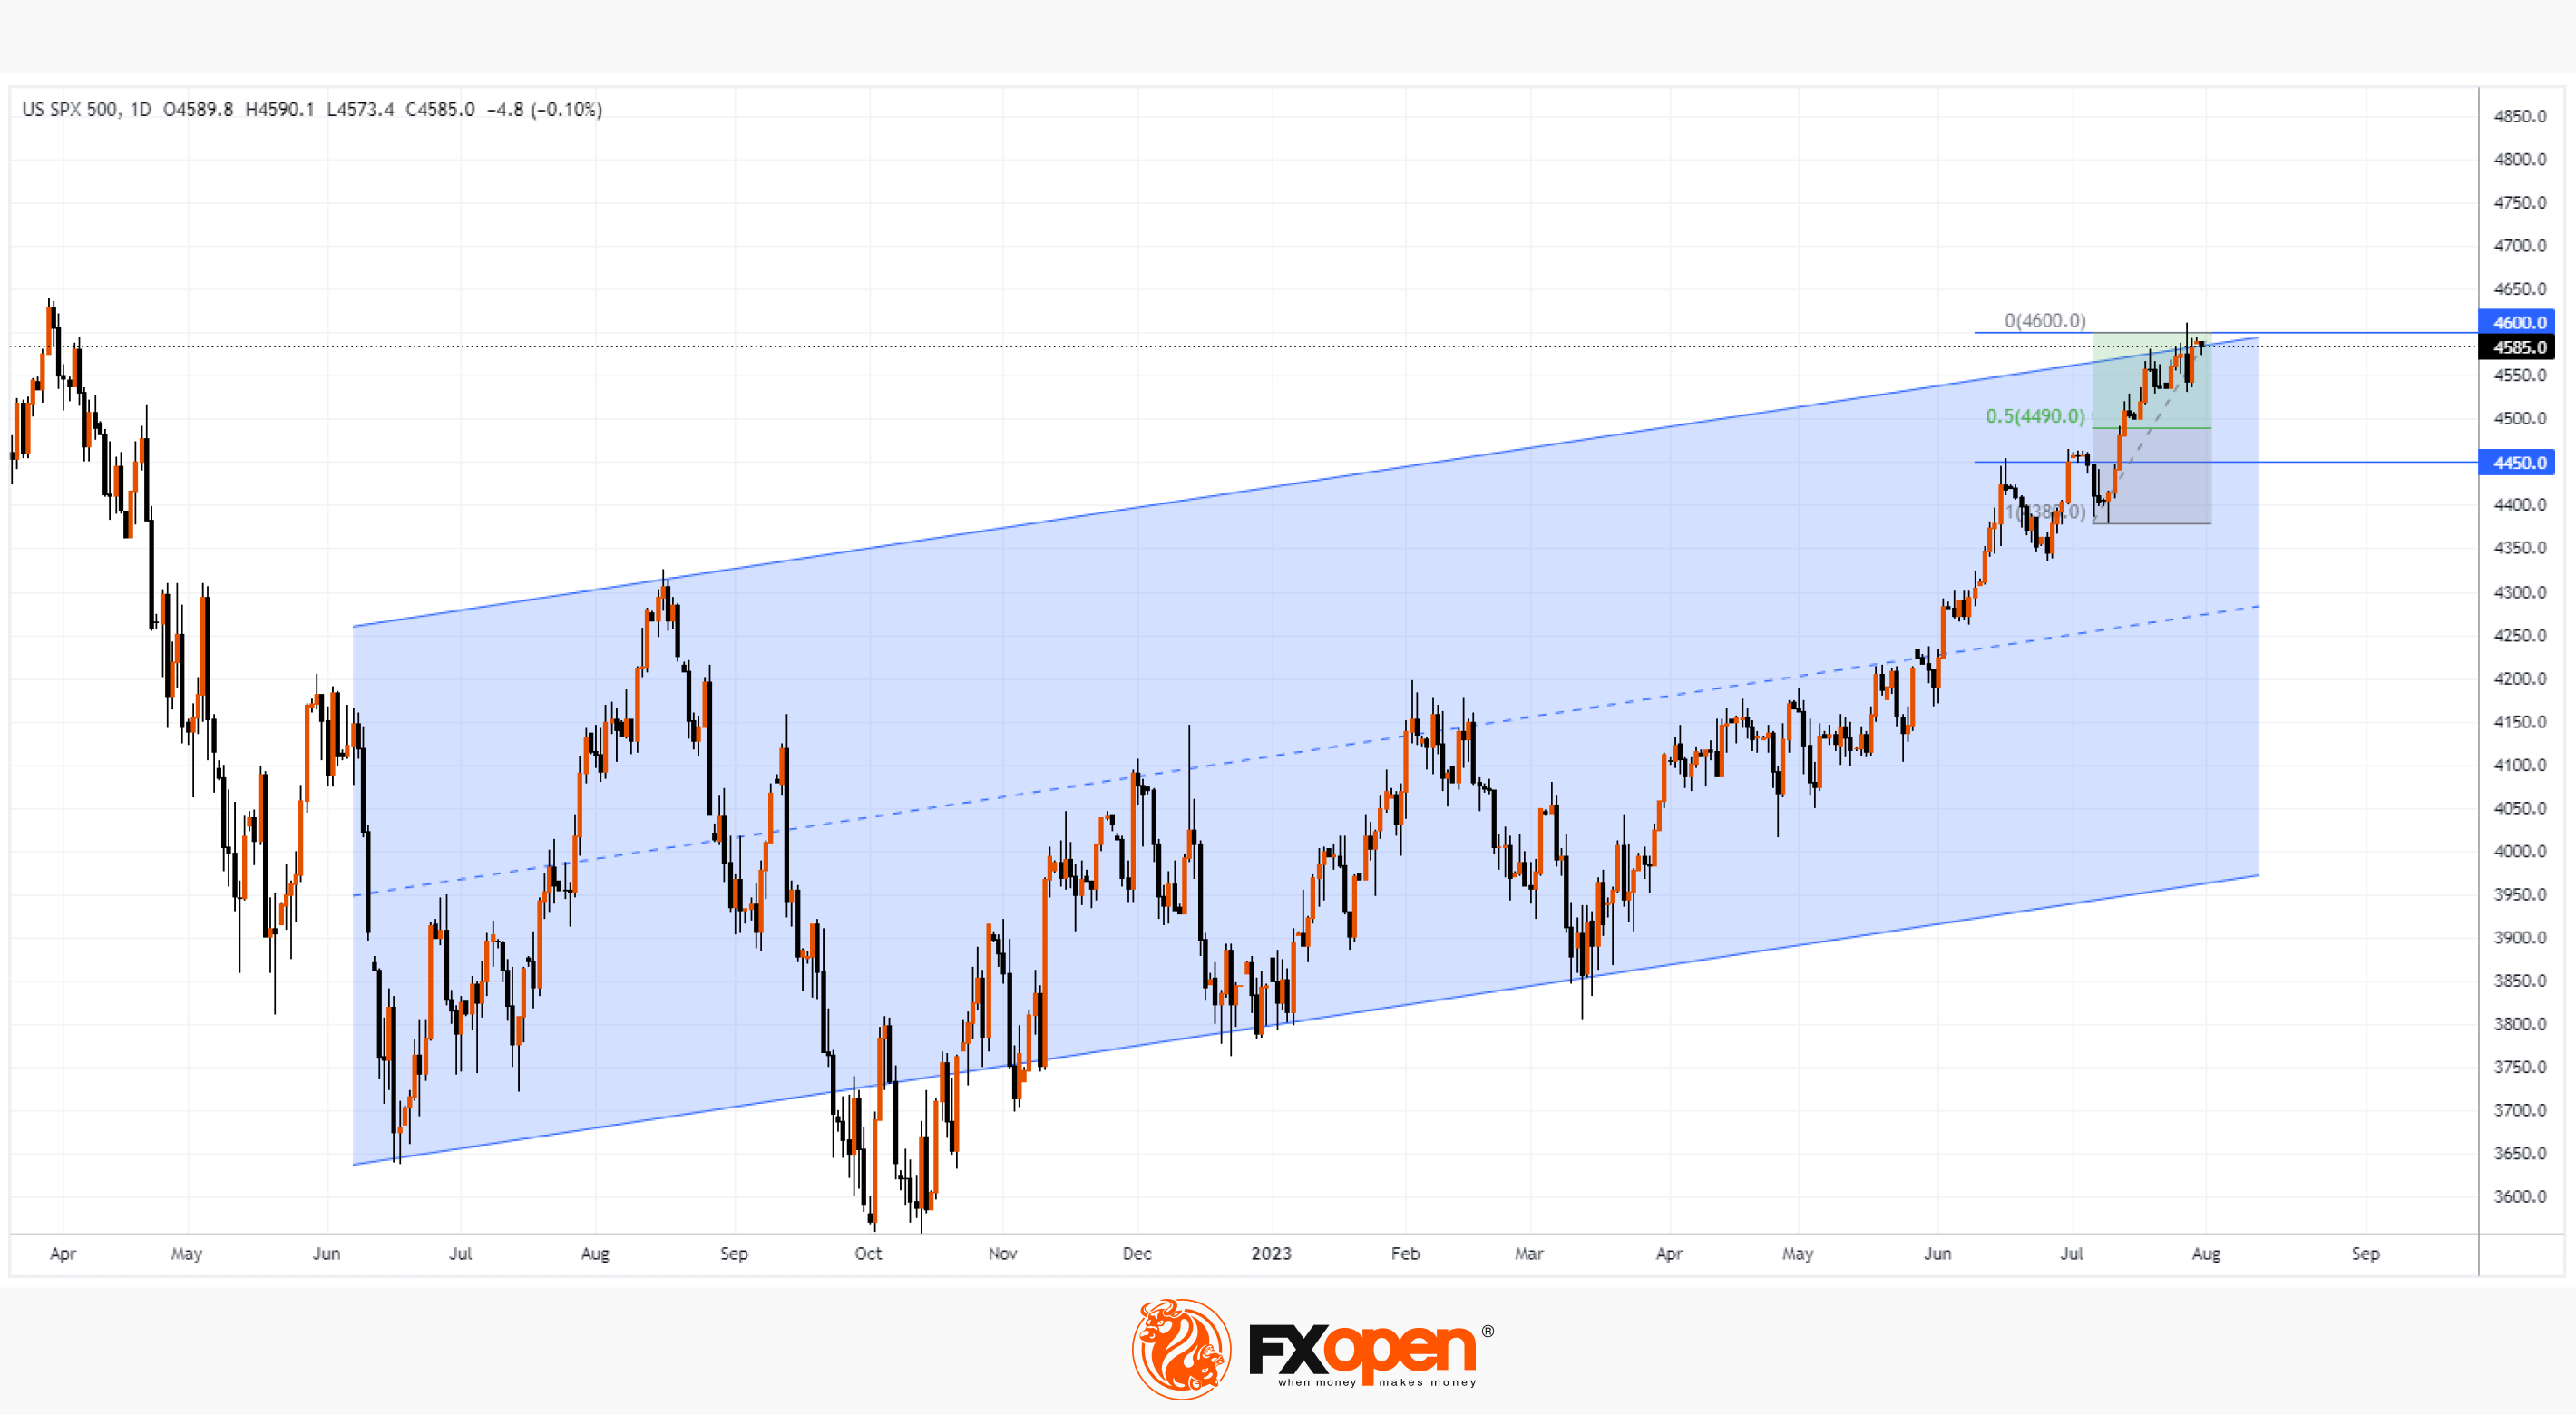
The S&P 500 index chart shows that the price is in a vulnerable position for a pullback, as it is in the resistance area:
→ from the psychological level 4,600;
→ from the upper border of the ascending channel (shown in blue).
Support levels:
→ 4,490 level, which corresponds to approximately 50% of the rally from July lows to its high
→ median line of the ascending channel. It seems unattainable, but Bloomberg reminds that August and September are historically the worst months for stock prices from the S&P 500 index.
To benefit from trends in the world's stock markets, consider enlisting the services of a trusted broker like FXOpen.
⚠️
CFDs are complex instruments and come with a high risk of losing your money.
This article represents the opinion of the Companies operating under the FXOpen brand only. It is not to be construed as an offer, solicitation, or recommendation with respect to products and services provided by the Companies operating under the FXOpen brand, nor is it to be considered financial advice.
Market Analysis: US Stocks Continue to Rise
After a turbulent week filled with macroeconomic news and decisions of the central bank of the leading economies, on Monday morning futures for the E-mini S&P 500 index look bullish, being near the highs of the year.
The following factors contribute to the positive in the market:
→ Friday's data indicating a slowdown in inflation. The Core PCE Price index was 0.2% in monthly terms (expected = 0.3%, last month = 0.3%).
→ The probability of a rate hike in September according to FEDWatch is only 20%. The US economy is moving towards a soft landing, according to WSJ analysts.
→ Strong reports from a number of companies for the 2nd quarter, including Google. Also, market participants are looking forward to new reports with enthusiasm — news for AAPL, AMZN, AMD and other companies included in the S&P 500 index are scheduled this week.
However, analysts at Bank of America note that the cost of options used to hedge against falling stock prices is at an all-time low — evidence of excessive positivity in the market, which could lead to a correction.
The S&P 500 index chart shows that the price is in a vulnerable position for a pullback, as it is in the resistance area:
→ from the psychological level 4,600;
→ from the upper border of the ascending channel (shown in blue).
Support levels:
→ 4,490 level, which corresponds to approximately 50% of the rally from July lows to its high
→ median line of the ascending channel. It seems unattainable, but Bloomberg reminds that August and September are historically the worst months for stock prices from the S&P 500 index.
To benefit from trends in the world's stock markets, consider enlisting the services of a trusted broker like FXOpen.
⚠️
CFDs are complex instruments and come with a high risk of losing your money.
This article represents the opinion of the Companies operating under the FXOpen brand only. It is not to be construed as an offer, solicitation, or recommendation with respect to products and services provided by the Companies operating under the FXOpen brand, nor is it to be considered financial advice.
#stockmarket #AUD
Market Analysis: Australian Dollar Plummeting After RBA Decision
The Reserve Bank of Australia (RBA) this morning decided to leave the interest rate at 4.10%, although market participants expected an increase to 4.35%.
According to the forecast of the central bank, inflation in Australia will return to its target range of 2-3% by the end of 2025 from the current 6%. At the same time, a warning was made that additional tightening (rate increase) may be required to curb inflation.
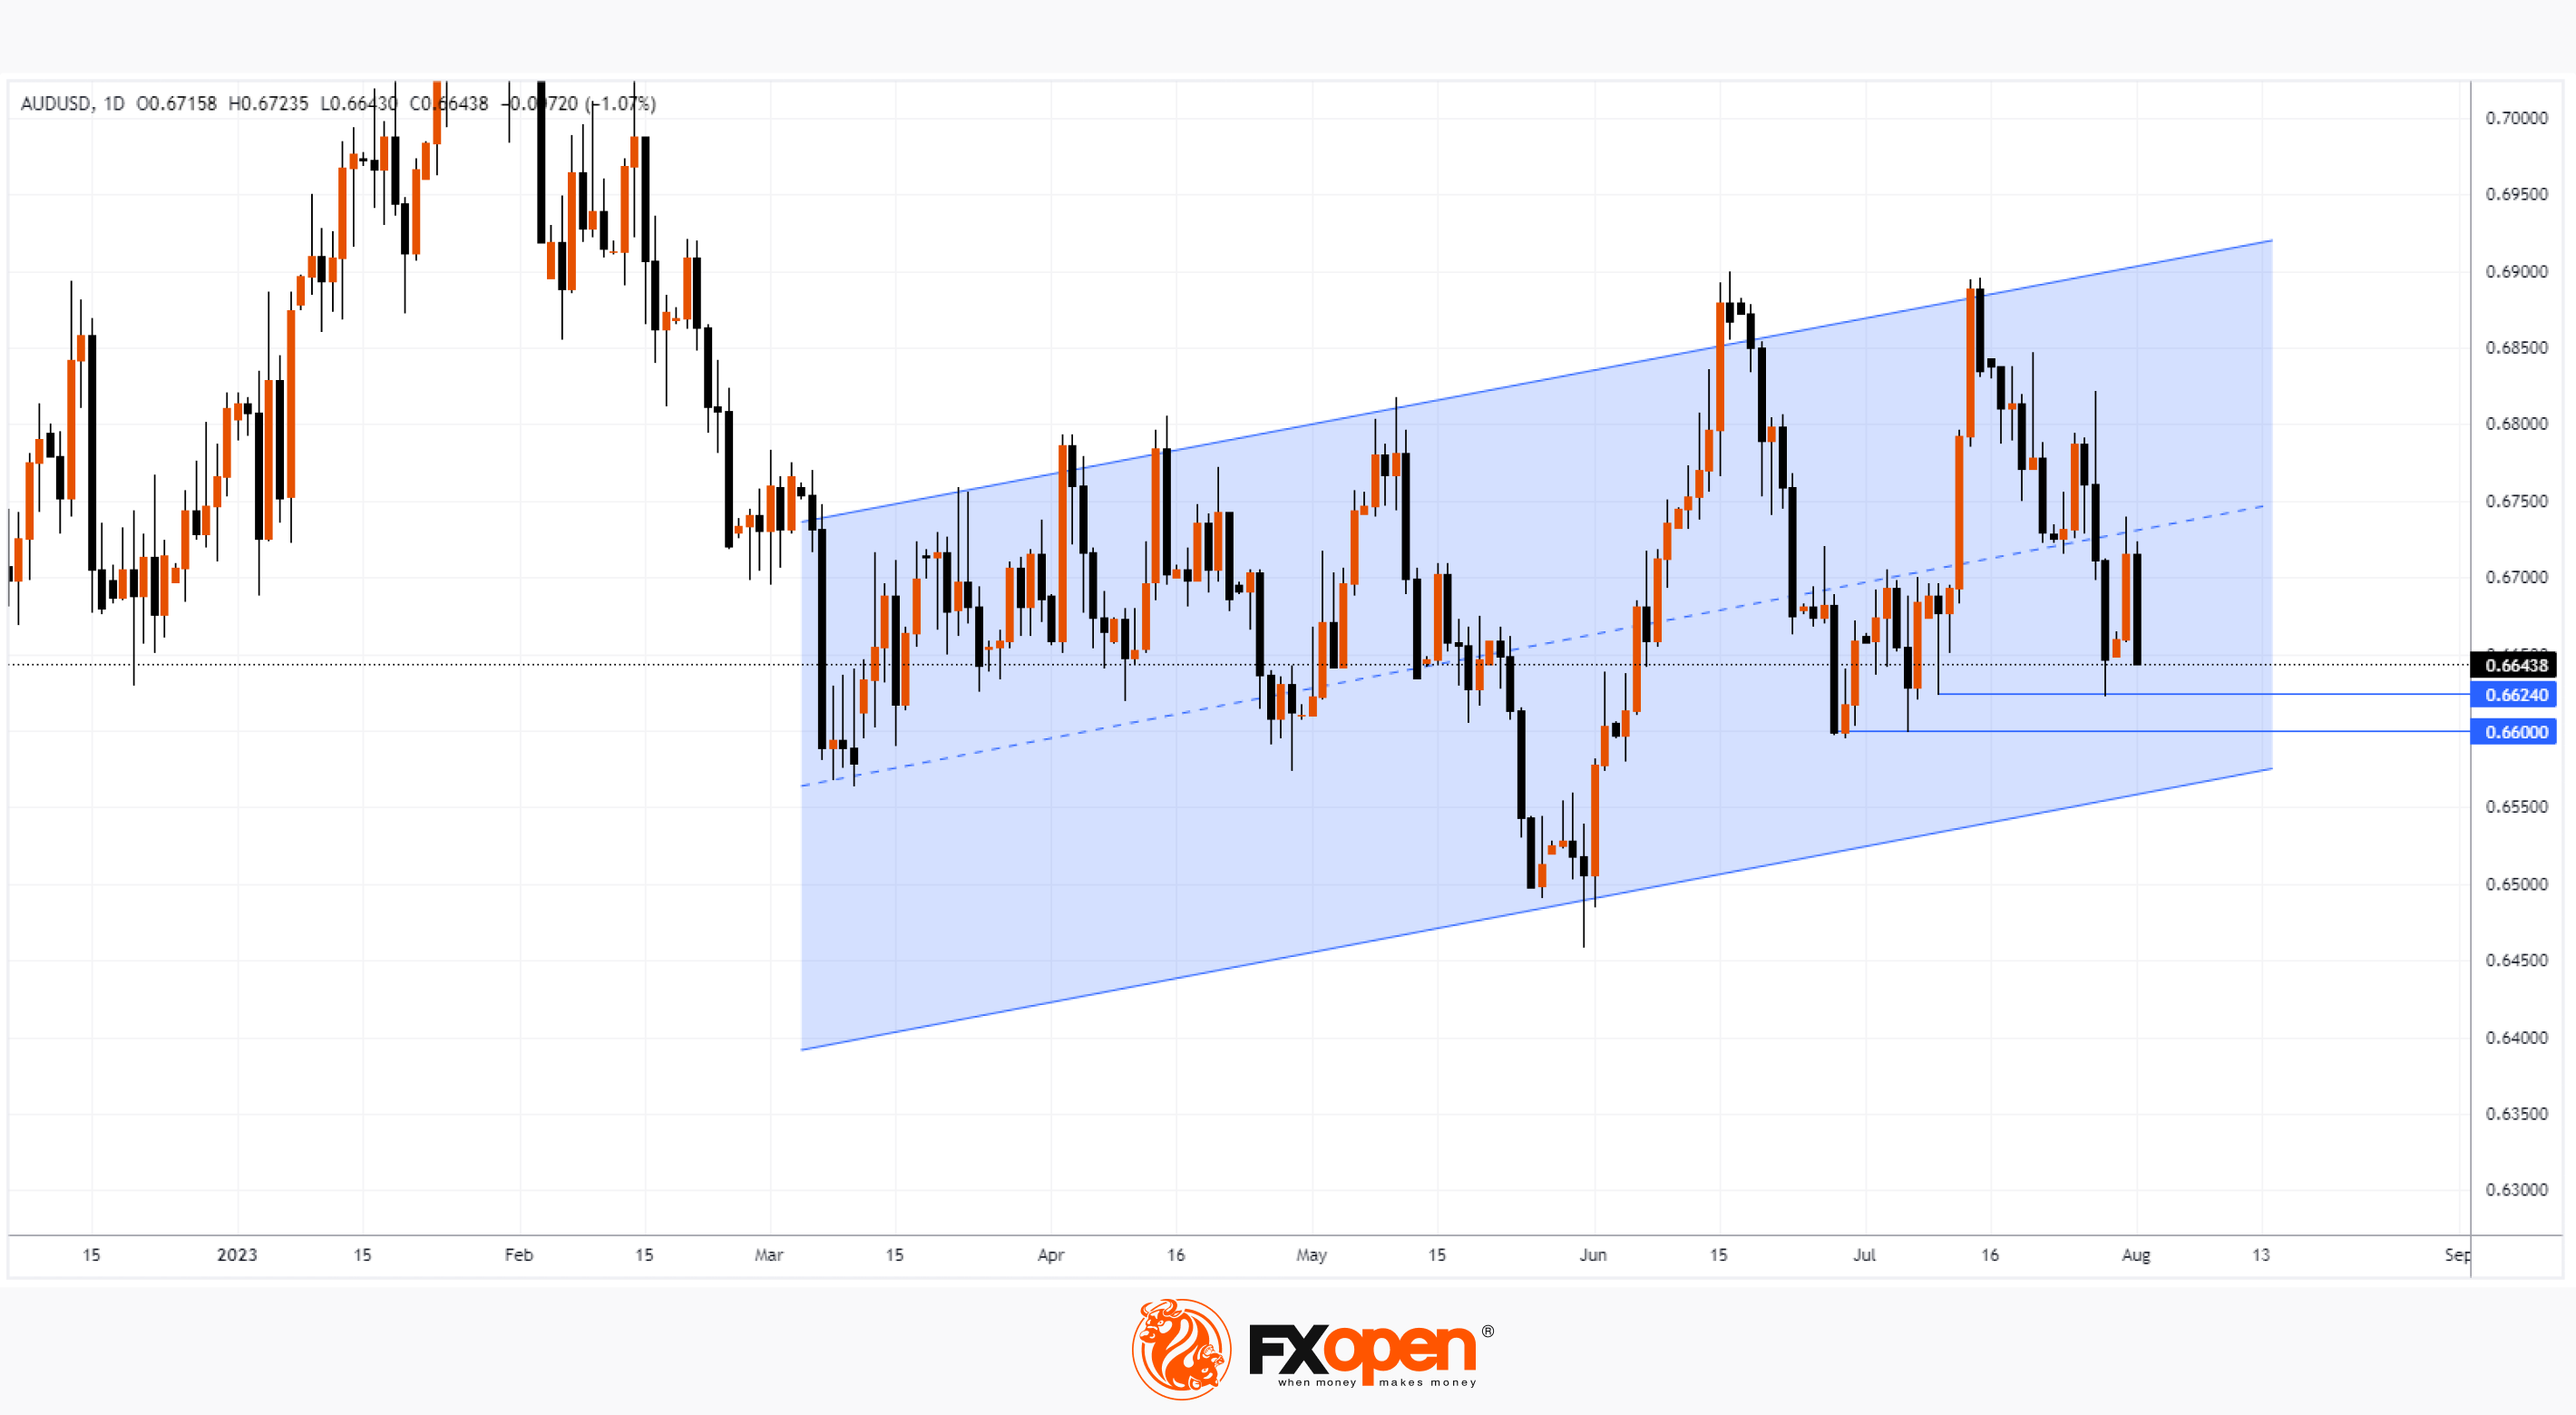
Amid the RBA's decision, the Australian dollar weakened against other currencies. So, on the AUD/USD chart, the price fell below the level of 0.665. At the same time, a reversal was formed from the median line of the channel, shown in blue; at yesterday's maximum, it was tested as a resistance line.
If the downward movement on the AUD/USD pair caused by the RBA decision continues, then the market may find support:
→ at the level of 0.6624 – where important July lows were formed;
→ at the level of 0.66 – there are important June lows;
→ near the lower border of the blue channel.
To benefit from trends in the currency markets, consider enlisting the services of a trusted broker like FXOpen.
⚠️
CFDs are complex instruments and come with a high risk of losing your money.
This article represents the opinion of the Companies operating under the FXOpen brand only. It is not to be construed as an offer, solicitation, or recommendation with respect to products and services provided by the Companies operating under the FXOpen brand, nor is it to be considered financial advice.
Market Analysis: Australian Dollar Plummeting After RBA Decision
The Reserve Bank of Australia (RBA) this morning decided to leave the interest rate at 4.10%, although market participants expected an increase to 4.35%.
According to the forecast of the central bank, inflation in Australia will return to its target range of 2-3% by the end of 2025 from the current 6%. At the same time, a warning was made that additional tightening (rate increase) may be required to curb inflation.
Amid the RBA's decision, the Australian dollar weakened against other currencies. So, on the AUD/USD chart, the price fell below the level of 0.665. At the same time, a reversal was formed from the median line of the channel, shown in blue; at yesterday's maximum, it was tested as a resistance line.
If the downward movement on the AUD/USD pair caused by the RBA decision continues, then the market may find support:
→ at the level of 0.6624 – where important July lows were formed;
→ at the level of 0.66 – there are important June lows;
→ near the lower border of the blue channel.
To benefit from trends in the currency markets, consider enlisting the services of a trusted broker like FXOpen.
⚠️
CFDs are complex instruments and come with a high risk of losing your money.
This article represents the opinion of the Companies operating under the FXOpen brand only. It is not to be construed as an offer, solicitation, or recommendation with respect to products and services provided by the Companies operating under the FXOpen brand, nor is it to be considered financial advice.
#MarketNews #xauusd
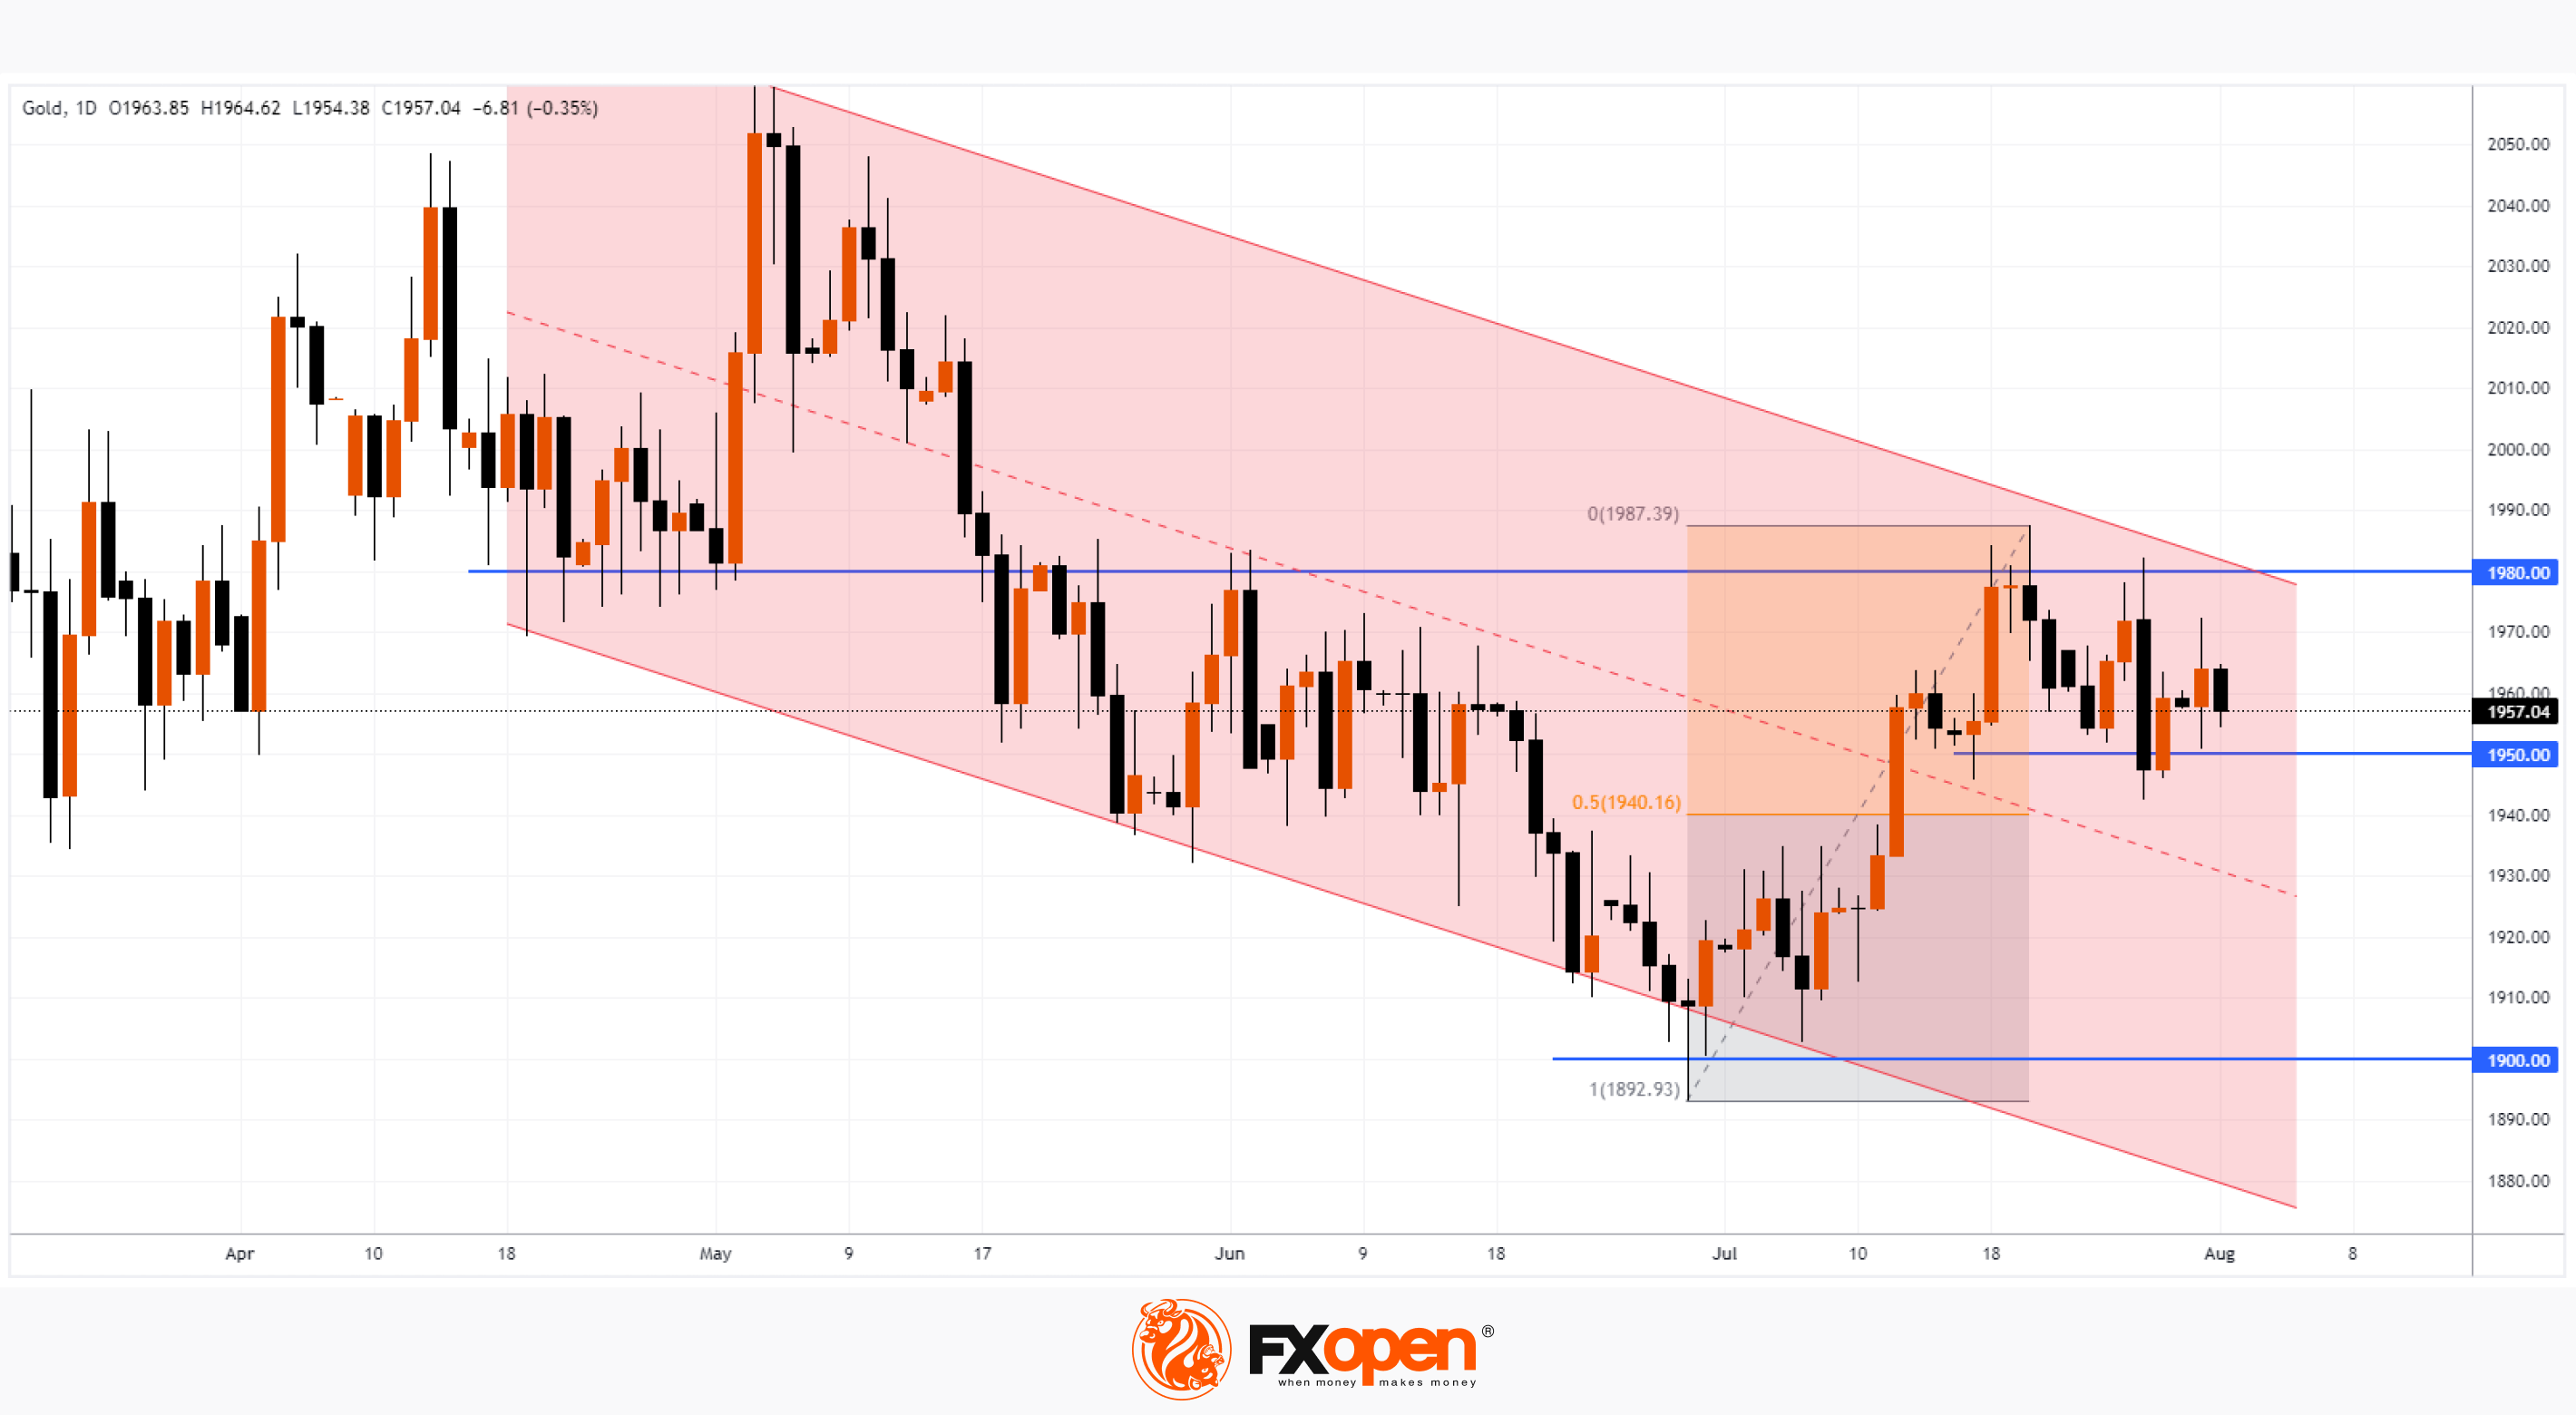
Market Analysis: Gold Starts August with a Sell-Off despite Bullish Headlines
Just yesterday gold was trading above USD 1,970, but this morning the XAU/USD price is already below 1,960. The decline comes amid bullish headlines in the media:
→ According to Dow Jones, in the first half of 2023, the demand for gold from central banks reached a record level and amounted to 387 tons.
→ According to JP Morgan analysts, the price of gold will reach USD 2,000 by the end of 2023 and reach new records in 2024 when interest rates start to fall.
→ UBS analysts share the same opinion. They note that the price of gold may come under pressure from time to time, but investors should use price drawdowns below USD 1,950 per ounce to buy for the long term.
But despite the positive background in the media, August began in a bearish way for the gold market. The resistance block from the 1,980 level and the upper border of the descending channel looks powerful (shown in red).
Upcoming support levels:
→ the psychological level of 1,950, from which the price of gold rebounded twice in July;
→ the level of 1,940, corresponding to a 50% increase from the low to the high in July;
→ median channel line.
Pay attention to the abundance of false breakouts of support and resistance levels on the XAU/USD chart.
To apply your strategies for trading gold and other exchange-traded assets, consider enlisting the services of a reliable broker like FXOpen.
⚠️
CFDs are complex instruments and come with a high risk of losing your money.
This article represents the opinion of the Companies operating under the FXOpen brand only. It is not to be construed as an offer, solicitation, or recommendation with respect to products and services provided by the Companies operating under the FXOpen brand, nor is it to be considered financial advice.
Market Analysis: Gold Starts August with a Sell-Off despite Bullish Headlines
Just yesterday gold was trading above USD 1,970, but this morning the XAU/USD price is already below 1,960. The decline comes amid bullish headlines in the media:
→ According to Dow Jones, in the first half of 2023, the demand for gold from central banks reached a record level and amounted to 387 tons.
→ According to JP Morgan analysts, the price of gold will reach USD 2,000 by the end of 2023 and reach new records in 2024 when interest rates start to fall.
→ UBS analysts share the same opinion. They note that the price of gold may come under pressure from time to time, but investors should use price drawdowns below USD 1,950 per ounce to buy for the long term.
But despite the positive background in the media, August began in a bearish way for the gold market. The resistance block from the 1,980 level and the upper border of the descending channel looks powerful (shown in red).
Upcoming support levels:
→ the psychological level of 1,950, from which the price of gold rebounded twice in July;
→ the level of 1,940, corresponding to a 50% increase from the low to the high in July;
→ median channel line.
Pay attention to the abundance of false breakouts of support and resistance levels on the XAU/USD chart.
To apply your strategies for trading gold and other exchange-traded assets, consider enlisting the services of a reliable broker like FXOpen.
⚠️
CFDs are complex instruments and come with a high risk of losing your money.
This article represents the opinion of the Companies operating under the FXOpen brand only. It is not to be construed as an offer, solicitation, or recommendation with respect to products and services provided by the Companies operating under the FXOpen brand, nor is it to be considered financial advice.
#MarketNews #stocktrading
Market Analysis: AMD Share Price on the Rise After Financial Statement Release
Positivity:
→ Advanced Micro Devices EPS of USD 58 cents (Wall Street Consensus = 57 cents);
→ Q2 revenue of USD 5.36 billion (Analysts expectation = USD 5.3 billion).
Negativity:
→ revenue from data centers decreased by 11% compared to the same period last year;
→ PC revenue fell 54% year-over-year: the pandemic is fading.
Particular attention of investors was attracted by the words of CEO Lisa Su regarding AI. According to her, by 2027 the market for artificial intelligence processors in data centers will exceed USD 150 billion. She also noted that in Q2, the company's AI business grew 7 times.
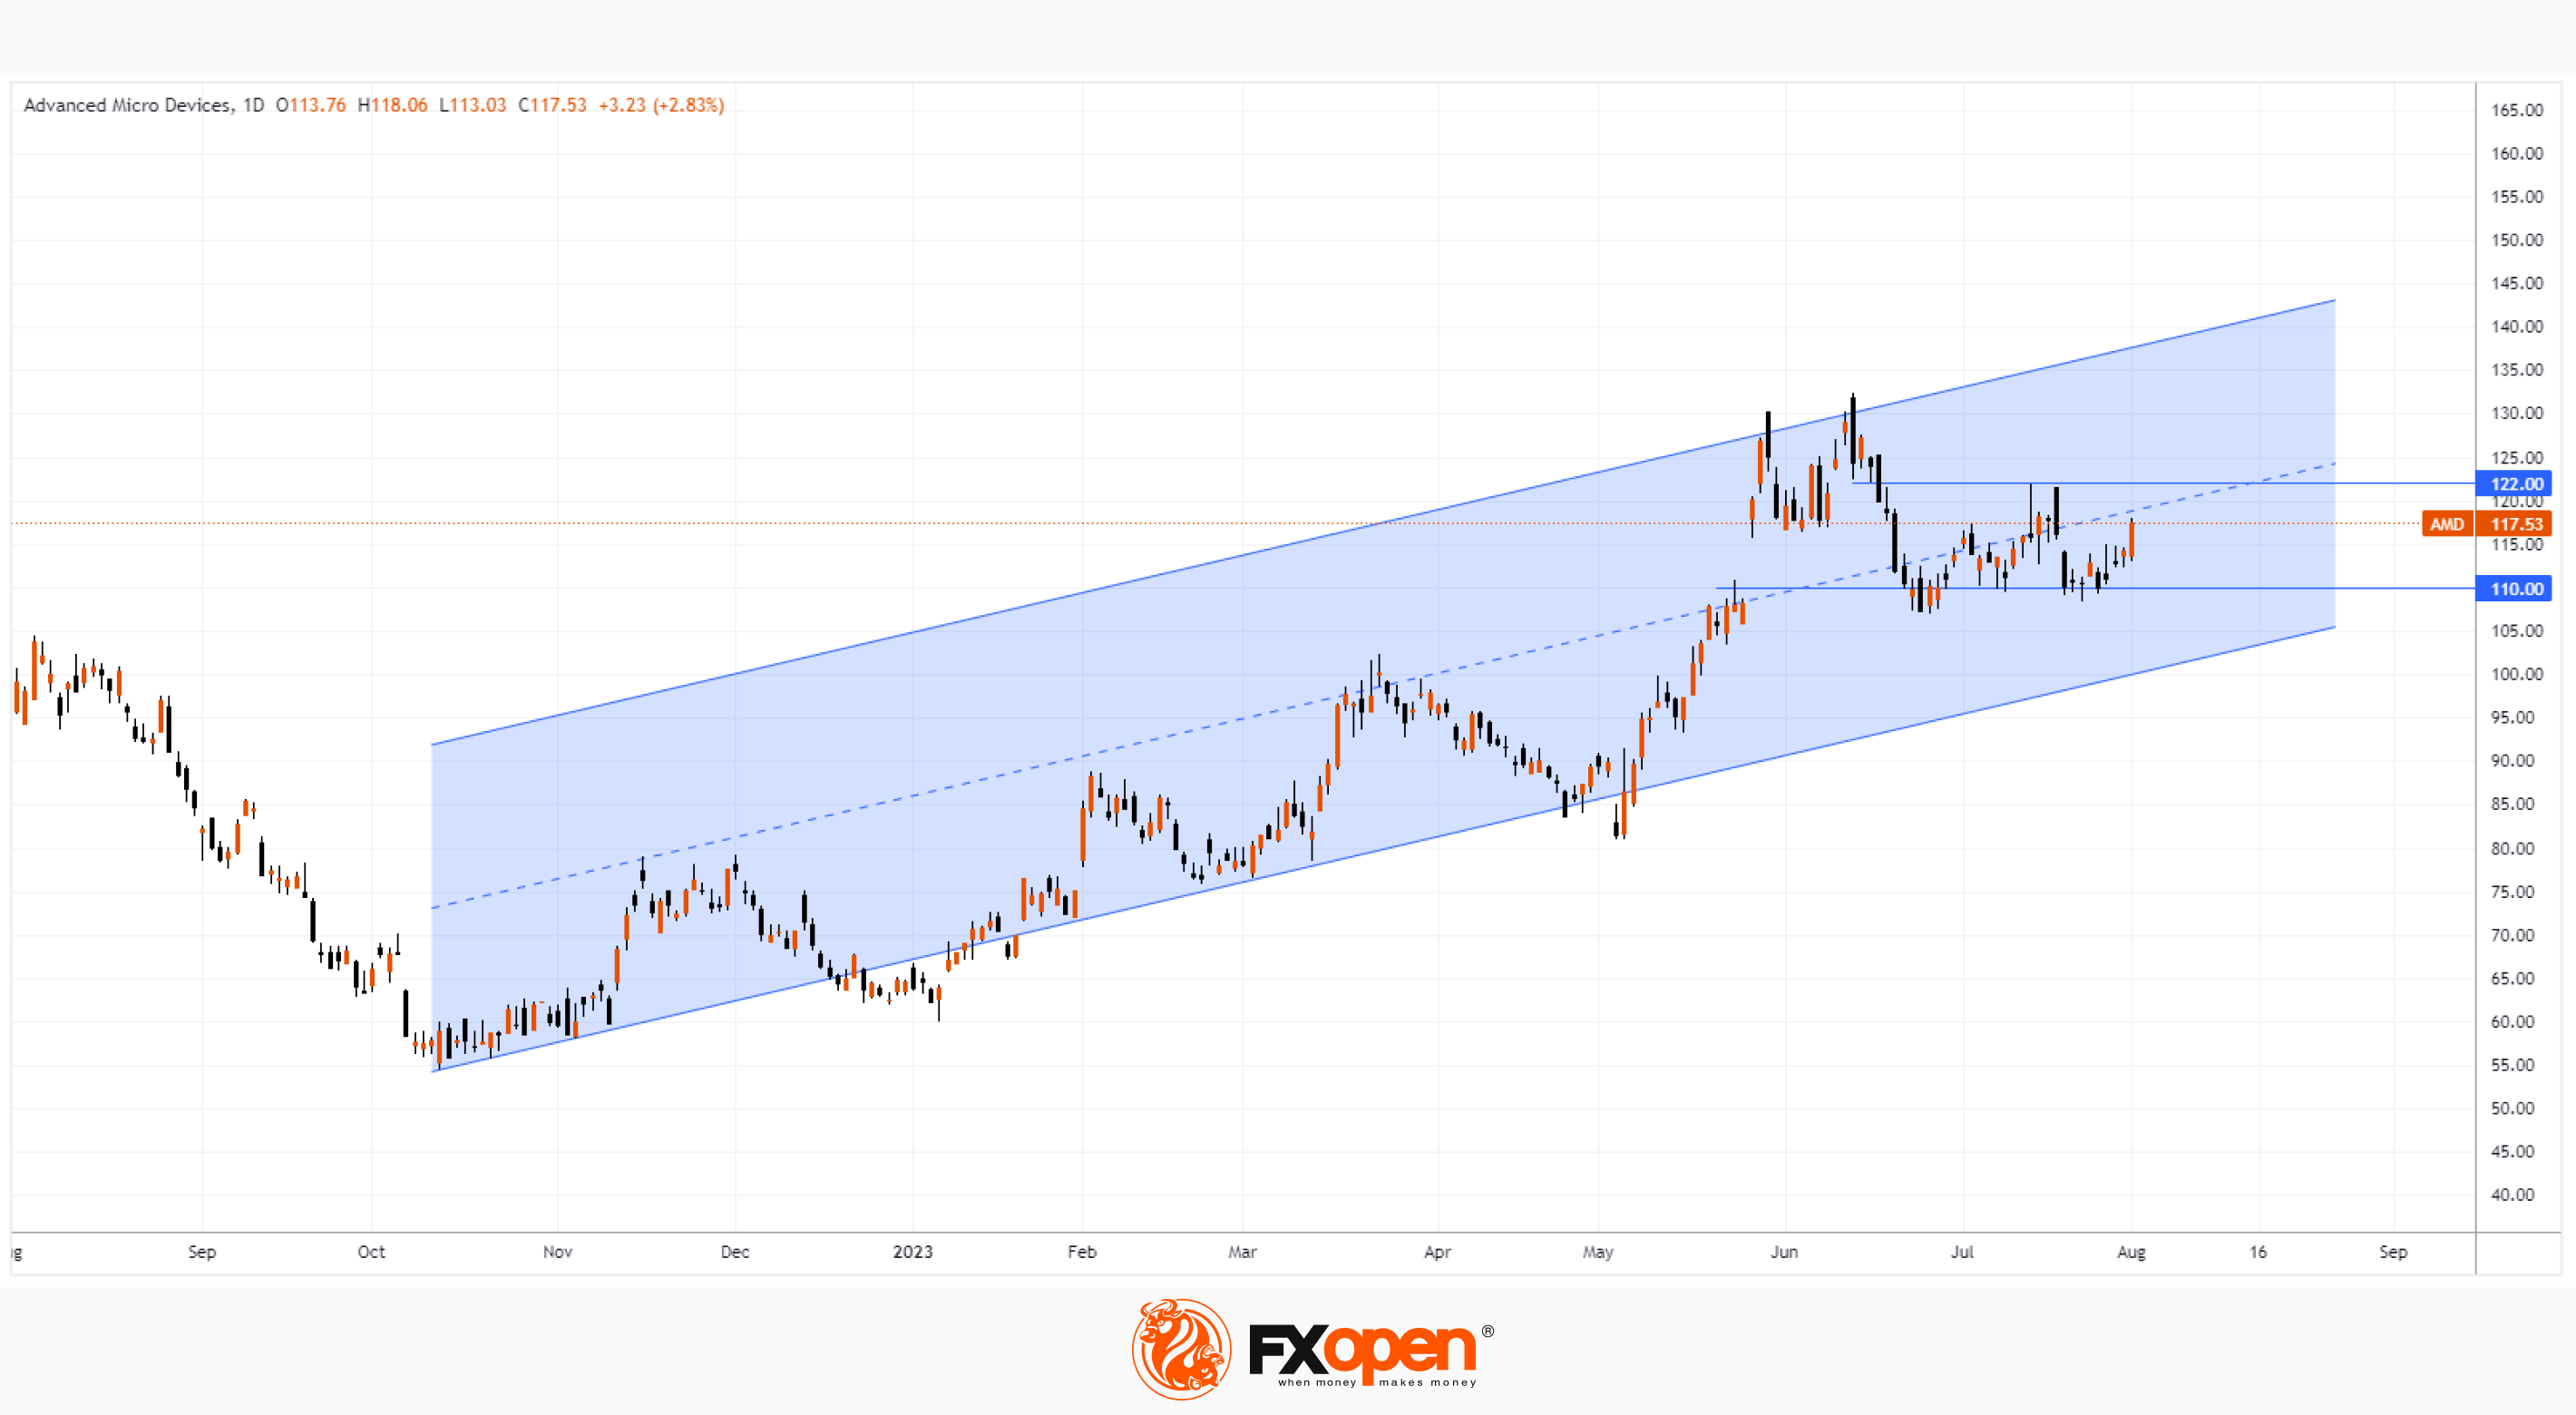
AMD's share price jumped up +3% after the report, which was published after the end of the main trading session. At the same time, the AMD stock chart shows mixed signals.
Bullish technical analysis arguments for AMD stock:
→ AMD share price continues to rise within the rising channel in 2023, acting significantly stronger than the S&P 500 stock market index;
→ AMD's USD 110 support level, originating from the May bullish gap, has confirmed its strength.
Bearish arguments:
→ After a jump related to reporting, the price decreases in the premarket. A long upper shadow is a sign that the first positive emotional reaction could be wrong;
→ AMD's share price is experiencing resistance near the USD 122 level, which originates from the low of the bear bar on June 13 (the day the NASDAQ exchange recorded the largest trading volumes for the spring-summer, which indicates selling pressure).
According to MarketWatch, the average target price for AMD shares is USD 137.50 — analysts are positive about the prospects, seeing the renewal of the historical maximum.
To benefit from trends in the stock markets, consider enlisting the services of a trusted broker like FXOpen.
⚠️
CFDs are complex instruments and come with a high risk of losing your money.
This article represents the opinion of the Companies operating under the FXOpen brand only. It is not to be construed as an offer, solicitation, or recommendation with respect to products and services provided by the Companies operating under the FXOpen brand, nor is it to be considered financial advice.
Market Analysis: AMD Share Price on the Rise After Financial Statement Release
Positivity:
→ Advanced Micro Devices EPS of USD 58 cents (Wall Street Consensus = 57 cents);
→ Q2 revenue of USD 5.36 billion (Analysts expectation = USD 5.3 billion).
Negativity:
→ revenue from data centers decreased by 11% compared to the same period last year;
→ PC revenue fell 54% year-over-year: the pandemic is fading.
Particular attention of investors was attracted by the words of CEO Lisa Su regarding AI. According to her, by 2027 the market for artificial intelligence processors in data centers will exceed USD 150 billion. She also noted that in Q2, the company's AI business grew 7 times.
AMD's share price jumped up +3% after the report, which was published after the end of the main trading session. At the same time, the AMD stock chart shows mixed signals.
Bullish technical analysis arguments for AMD stock:
→ AMD share price continues to rise within the rising channel in 2023, acting significantly stronger than the S&P 500 stock market index;
→ AMD's USD 110 support level, originating from the May bullish gap, has confirmed its strength.
Bearish arguments:
→ After a jump related to reporting, the price decreases in the premarket. A long upper shadow is a sign that the first positive emotional reaction could be wrong;
→ AMD's share price is experiencing resistance near the USD 122 level, which originates from the low of the bear bar on June 13 (the day the NASDAQ exchange recorded the largest trading volumes for the spring-summer, which indicates selling pressure).
According to MarketWatch, the average target price for AMD shares is USD 137.50 — analysts are positive about the prospects, seeing the renewal of the historical maximum.
To benefit from trends in the stock markets, consider enlisting the services of a trusted broker like FXOpen.
⚠️
CFDs are complex instruments and come with a high risk of losing your money.
This article represents the opinion of the Companies operating under the FXOpen brand only. It is not to be construed as an offer, solicitation, or recommendation with respect to products and services provided by the Companies operating under the FXOpen brand, nor is it to be considered financial advice.
#marketnews #EURUSD #tradingtips
EUR/USD and USD/JPY Daily Chart Outlook: Dollar Could Outperform
🔸The Euro failed to clear 1.1265 and declined below 1.1090.
🔸There is a key bullish trend line forming with support near 1.0965 on the daily chart of EUR/USD at FXOpen.
🔸USD/JPY climbed above the 140.00 and 141.15 levels.
🔸There is a major bullish trend line in place with support at 139.00 on the daily chart at FXOpen.
https://cutt.ly/4wsBRFnX
To take advantage of price fluctuations in the foreign exchange markets, consider enlisting the services of a reliable broker like FXOpen.
⚠️
This forecast represents FXOpen Companies opinion only, it should not be construed as an offer, invitation or recommendation in respect to FXOpen Companies products and services or as financial advice
EUR/USD and USD/JPY Daily Chart Outlook: Dollar Could Outperform
🔸The Euro failed to clear 1.1265 and declined below 1.1090.
🔸There is a key bullish trend line forming with support near 1.0965 on the daily chart of EUR/USD at FXOpen.
🔸USD/JPY climbed above the 140.00 and 141.15 levels.
🔸There is a major bullish trend line in place with support at 139.00 on the daily chart at FXOpen.
https://cutt.ly/4wsBRFnX
To take advantage of price fluctuations in the foreign exchange markets, consider enlisting the services of a reliable broker like FXOpen.
⚠️
This forecast represents FXOpen Companies opinion only, it should not be construed as an offer, invitation or recommendation in respect to FXOpen Companies products and services or as financial advice
Market Pulse
EUR/USD and USD/JPY Daily Chart Outlook: Dollar Could Outperform
EUR/USD started a fresh decline from the 1.1265 zone. USD/JPY is rising and might aim to move above the 144.85 resistance.
#marketnews #usdollar
Market Analysis: Fitch Downgrades US Credit Rating
Fitch has downgraded the US sovereign credit rating by one level from AAA (held since 1994) to AA+ — having warned about this 2 months ago. However, the news came as a surprise.
The reason for the downgrade is the high and growing debt burden. This manifests itself in repeated debt ceiling cancellations and last-minute decisions. The last example is the events this spring.
Fitch analysts expect that:
→ the state budget deficit will rise to 6.3% of GDP in 2023 from 3.7% in 2022;
→ tightening credit conditions, weakening business investment and slowing consumption will push the US economy into a moderate recession in Q4 2023 and Q1 2024.
By the way, the last time the US rating was lowered was in 2011, also in August. Standard & Poor's then downgraded the US credit rating from the maximum "AAA" to "AA +". This caused the stock market to fall.
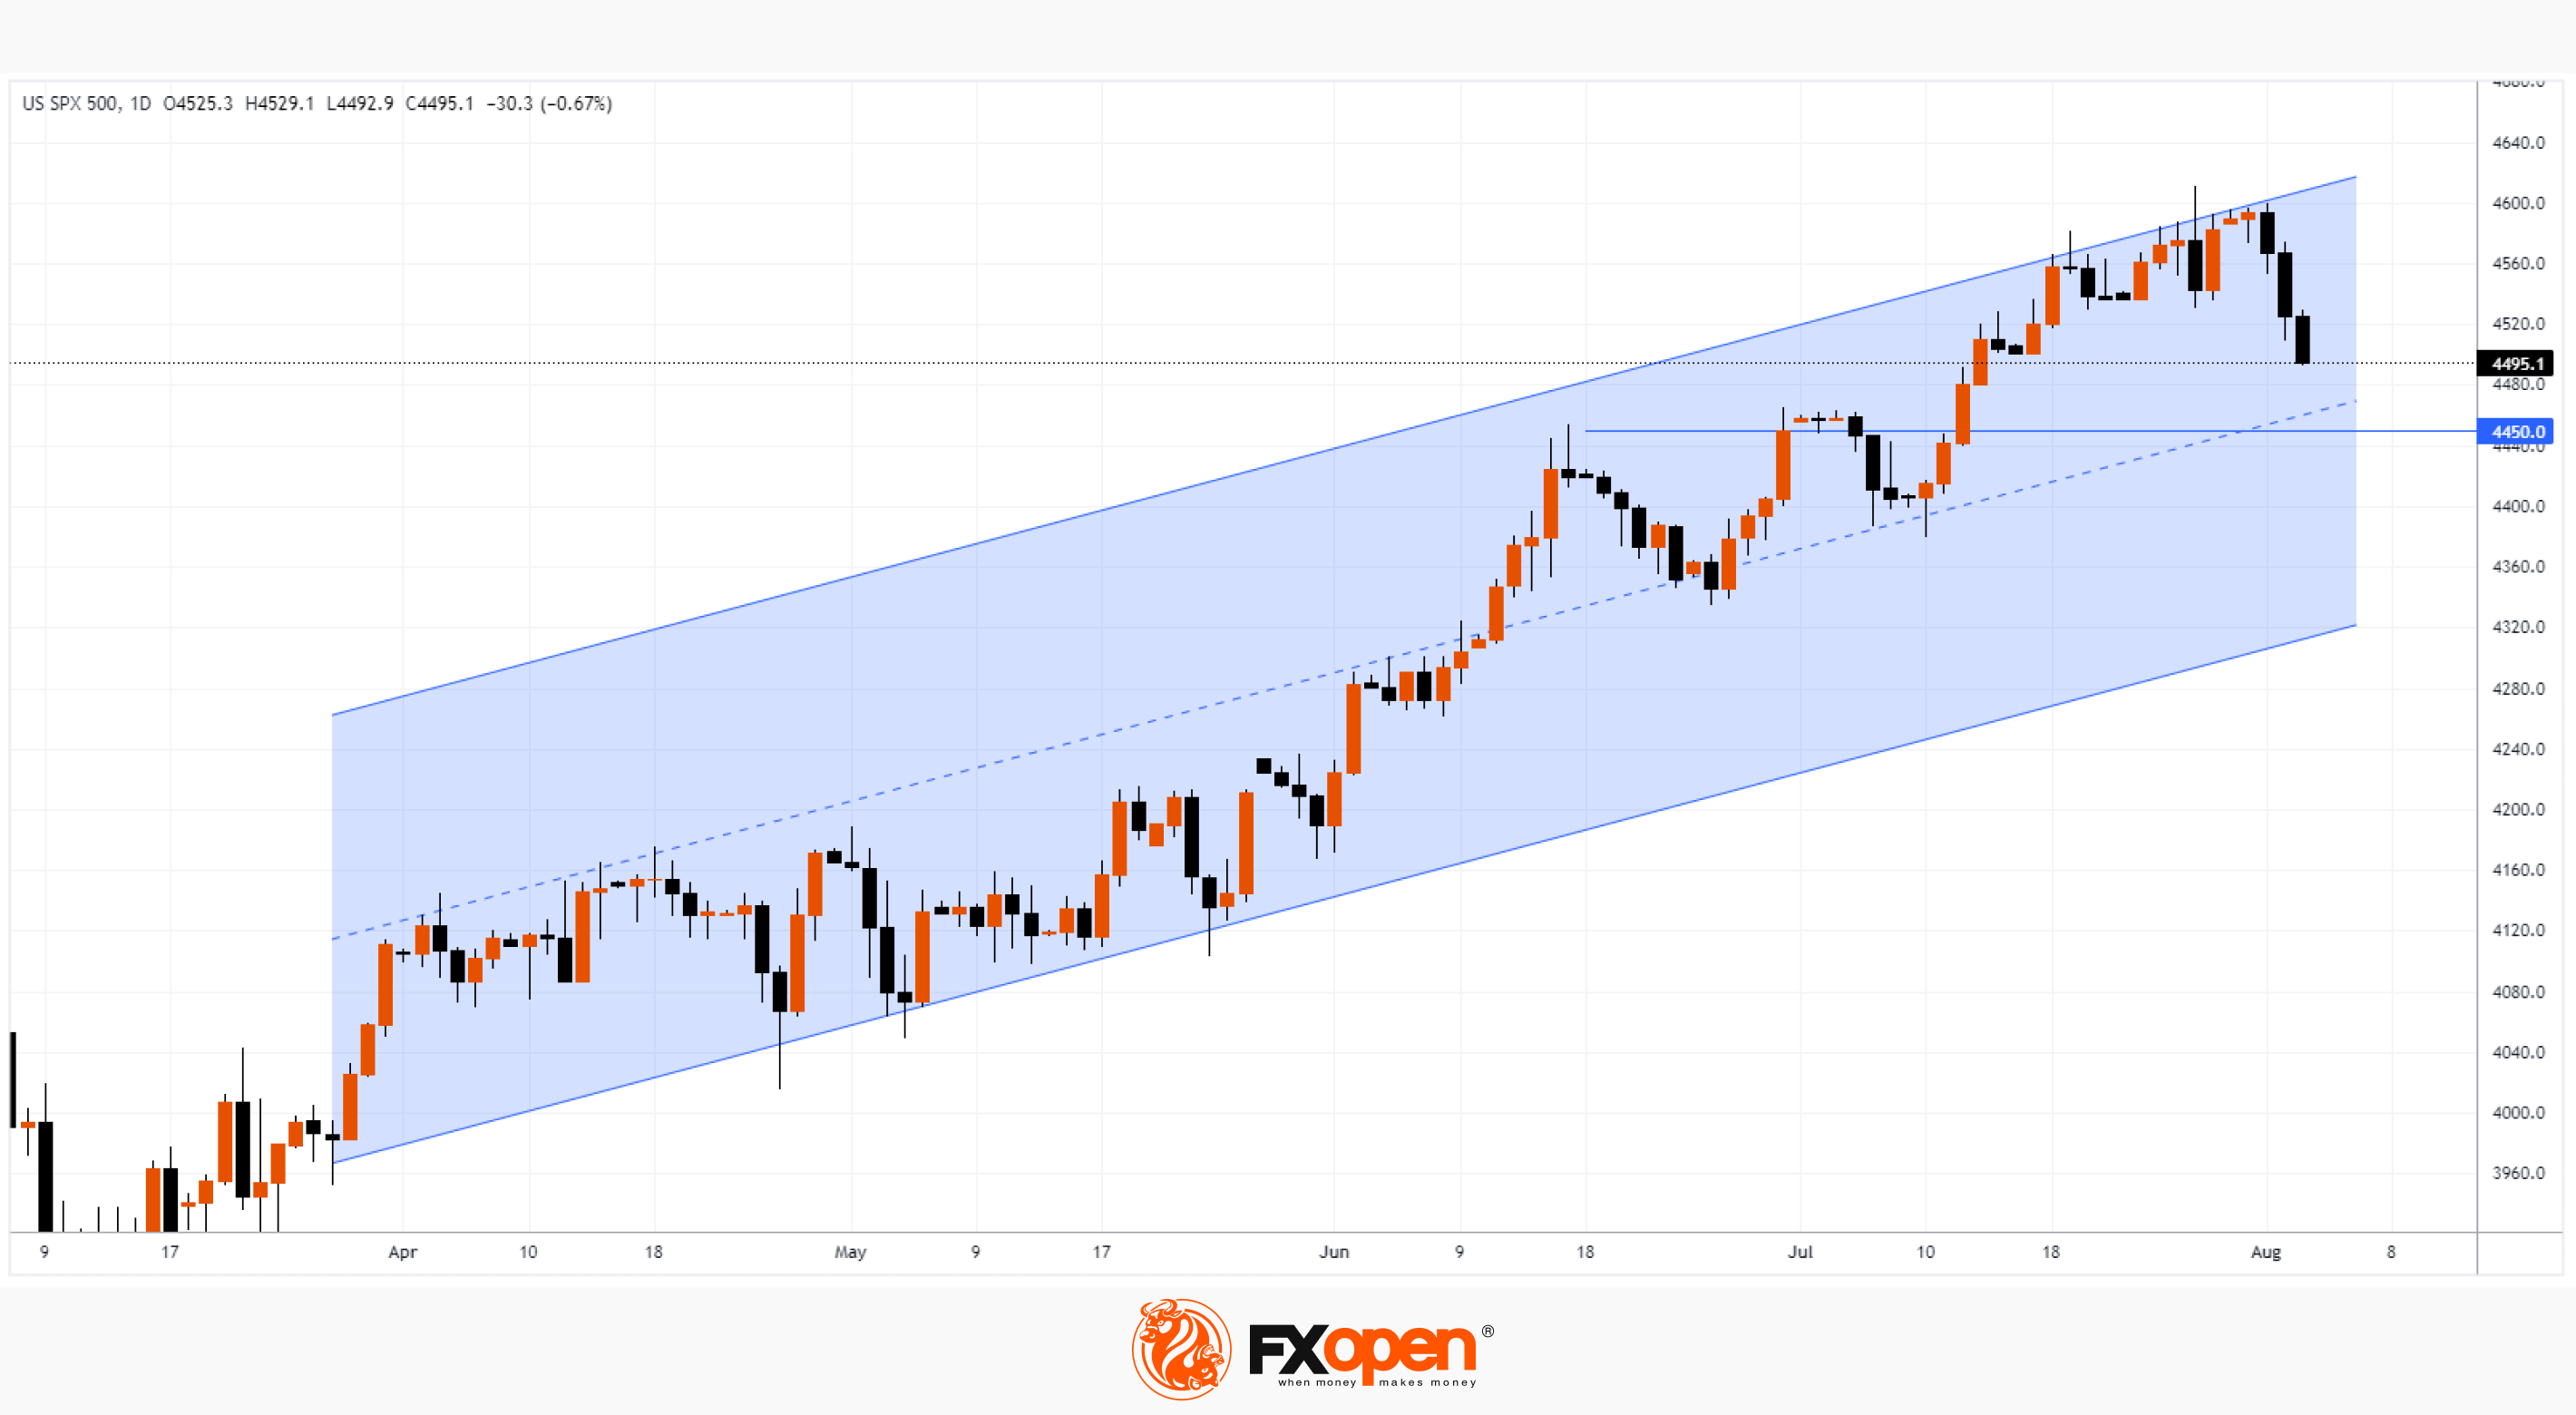
We wrote in our review on July 31 that the stock market is in a vulnerable position for a correction. As expected, the downgrade helped push the S&P 500 off the highs of the year, dropping below the psychological 4500 level.
Support levels can slow down the fall of the S&P 500 index:
→ around 4,450 is the former resistance level;
→ median line of the ascending channel.
To benefit from trends in the world's stock markets, consider enlisting the services of a trusted broker like FXOpen.
⚠️
CFDs are complex instruments and come with a high risk of losing your money.
This article represents the opinion of the Companies operating under the FXOpen brand only. It is not to be construed as an offer, solicitation, or recommendation with respect to products and services provided by the Companies operating under the FXOpen brand, nor is it to be considered financial advice.
Market Analysis: Fitch Downgrades US Credit Rating
Fitch has downgraded the US sovereign credit rating by one level from AAA (held since 1994) to AA+ — having warned about this 2 months ago. However, the news came as a surprise.
The reason for the downgrade is the high and growing debt burden. This manifests itself in repeated debt ceiling cancellations and last-minute decisions. The last example is the events this spring.
Fitch analysts expect that:
→ the state budget deficit will rise to 6.3% of GDP in 2023 from 3.7% in 2022;
→ tightening credit conditions, weakening business investment and slowing consumption will push the US economy into a moderate recession in Q4 2023 and Q1 2024.
By the way, the last time the US rating was lowered was in 2011, also in August. Standard & Poor's then downgraded the US credit rating from the maximum "AAA" to "AA +". This caused the stock market to fall.
We wrote in our review on July 31 that the stock market is in a vulnerable position for a correction. As expected, the downgrade helped push the S&P 500 off the highs of the year, dropping below the psychological 4500 level.
Support levels can slow down the fall of the S&P 500 index:
→ around 4,450 is the former resistance level;
→ median line of the ascending channel.
To benefit from trends in the world's stock markets, consider enlisting the services of a trusted broker like FXOpen.
⚠️
CFDs are complex instruments and come with a high risk of losing your money.
This article represents the opinion of the Companies operating under the FXOpen brand only. It is not to be construed as an offer, solicitation, or recommendation with respect to products and services provided by the Companies operating under the FXOpen brand, nor is it to be considered financial advice.
#MarketNews #GBPUSD #tradingtips
Market Analysis: The GBP/USD Exchange Rate Falls to a Month’s Minimum
Yesterday and today, the GBP/USD rate fell below 1.27 for the first time since July 6. A number of factors contributed to this:
→ rising bond yields amid downgrade of the US rating by Fitch;
→ strong data on the ADP labor market — the number of jobs in the US, excluding the agricultural sector, increased by more than 300k over the month;
→ market expectation of news from the Bank of England, which will publish its interest rate decision today at 14:00 GMT+3.
According to Reuters, forecasts for the UK economy are disappointing. Market participants expect a 14th rate hike by the Bank of England by 0.25%.
Technical analysis of the GBP/USD chart shows that:
→ summer peaks formed an important head-and-shoulders pattern;
→ the neckline, which can be drawn through the median line of the ascending channel, has already been broken after a weak rebound in the last days of July.
The pound, which looks weak against the US dollar, may be supported by:
→ encouraging words from the head of the Bank of England;
→ block of support formed in the area of 1.2600 from the low of June, the lower border of the channel and SMA (100).
Get ready for bursts of volatility in the GBP/USD market.
To benefit from trends in the currency markets, consider enlisting the services of a trusted broker like FXOpen.
⚠️
CFDs are complex instruments and come with a high risk of losing your money.
This article represents the opinion of the Companies operating under the FXOpen brand only. It is not to be construed as an offer, solicitation, or recommendation with respect to products and services provided by the Companies operating under the FXOpen brand, nor is it to be considered financial advice.
Market Analysis: The GBP/USD Exchange Rate Falls to a Month’s Minimum
Yesterday and today, the GBP/USD rate fell below 1.27 for the first time since July 6. A number of factors contributed to this:
→ rising bond yields amid downgrade of the US rating by Fitch;
→ strong data on the ADP labor market — the number of jobs in the US, excluding the agricultural sector, increased by more than 300k over the month;
→ market expectation of news from the Bank of England, which will publish its interest rate decision today at 14:00 GMT+3.
According to Reuters, forecasts for the UK economy are disappointing. Market participants expect a 14th rate hike by the Bank of England by 0.25%.
Technical analysis of the GBP/USD chart shows that:
→ summer peaks formed an important head-and-shoulders pattern;
→ the neckline, which can be drawn through the median line of the ascending channel, has already been broken after a weak rebound in the last days of July.
The pound, which looks weak against the US dollar, may be supported by:
→ encouraging words from the head of the Bank of England;
→ block of support formed in the area of 1.2600 from the low of June, the lower border of the channel and SMA (100).
Get ready for bursts of volatility in the GBP/USD market.
To benefit from trends in the currency markets, consider enlisting the services of a trusted broker like FXOpen.
⚠️
CFDs are complex instruments and come with a high risk of losing your money.
This article represents the opinion of the Companies operating under the FXOpen brand only. It is not to be construed as an offer, solicitation, or recommendation with respect to products and services provided by the Companies operating under the FXOpen brand, nor is it to be considered financial advice.