
#inflation #stockmarket #AAPL #MSFT #usdollar #OPEC
Weekly Market Wrap with Gary Thomson: UK100 DROPS 1.5%, USD RISES, OPEC’S FORECASTS, MICROSOFT SURPASSES APPLE
Get the latest scoop on the week's hottest headlines, all in one convenient video. Join Gary Thomson, the COO of FXOpen UK, as he breaks down the most significant news reports and shares his expert insights.
🔸 The UK100 Price Plummeted After the Publication of Inflation Data
🔸The Dollar Continues to Strengthen since the Beginning of the Year
🔸 OPEC Forecasts an Increase in Oil Demand in 2024
🔸 Microsoft Becomes the Most Expensive Company in the World, Surpassing Apple
Stay in the know and empower yourself with our short, yet power-packed video. Watch it now and stay updated with FXOpen. Don't miss out on this invaluable opportunity to sharpen your trading skills and make informed decisions.
https://cutt.ly/YwKB4FvC
CFDs are complex instruments and come with a high risk of losing money rapidly due to leverage. 65.68% of retail investor accounts lose money when trading CFDs with this provider. You should consider whether you understand how CFDs work, and whether you can afford to take the high risk of losing your money.
To take advantage of price fluctuations in the foreign exchange markets, consider enlisting the services of a reliable broker like FXOpen.
⚠️
This forecast represents FXOpen Companies opinion only, it should not be construed as an offer, invitation or recommendation in respect to FXOpen Companies products and services or as financial advice
Weekly Market Wrap with Gary Thomson: UK100 DROPS 1.5%, USD RISES, OPEC’S FORECASTS, MICROSOFT SURPASSES APPLE
Get the latest scoop on the week's hottest headlines, all in one convenient video. Join Gary Thomson, the COO of FXOpen UK, as he breaks down the most significant news reports and shares his expert insights.
🔸 The UK100 Price Plummeted After the Publication of Inflation Data
🔸The Dollar Continues to Strengthen since the Beginning of the Year
🔸 OPEC Forecasts an Increase in Oil Demand in 2024
🔸 Microsoft Becomes the Most Expensive Company in the World, Surpassing Apple
Stay in the know and empower yourself with our short, yet power-packed video. Watch it now and stay updated with FXOpen. Don't miss out on this invaluable opportunity to sharpen your trading skills and make informed decisions.
https://cutt.ly/YwKB4FvC
CFDs are complex instruments and come with a high risk of losing money rapidly due to leverage. 65.68% of retail investor accounts lose money when trading CFDs with this provider. You should consider whether you understand how CFDs work, and whether you can afford to take the high risk of losing your money.
To take advantage of price fluctuations in the foreign exchange markets, consider enlisting the services of a reliable broker like FXOpen.
⚠️
This forecast represents FXOpen Companies opinion only, it should not be construed as an offer, invitation or recommendation in respect to FXOpen Companies products and services or as financial advice
YouTube
Weekly Market Wrap with Gary Thomson: UK100 DROPS 1.5%, USD RISES, OPEC’S FORECASTS, MSFT GROWS
Get the latest scoop on the week's hottest headlines, all in one convenient video. Join Gary Thomson, the COO of FXOpen UK, as he breaks down the most significant news reports and shares his expert insights.
00:36 - The UK100 Price Plummeted After the Publication…
00:36 - The UK100 Price Plummeted After the Publication…
👍1
#MSFT #stockmarket #stocktrading #marketanalysis
MSFT Shares Surge on Record Yearly Volumes
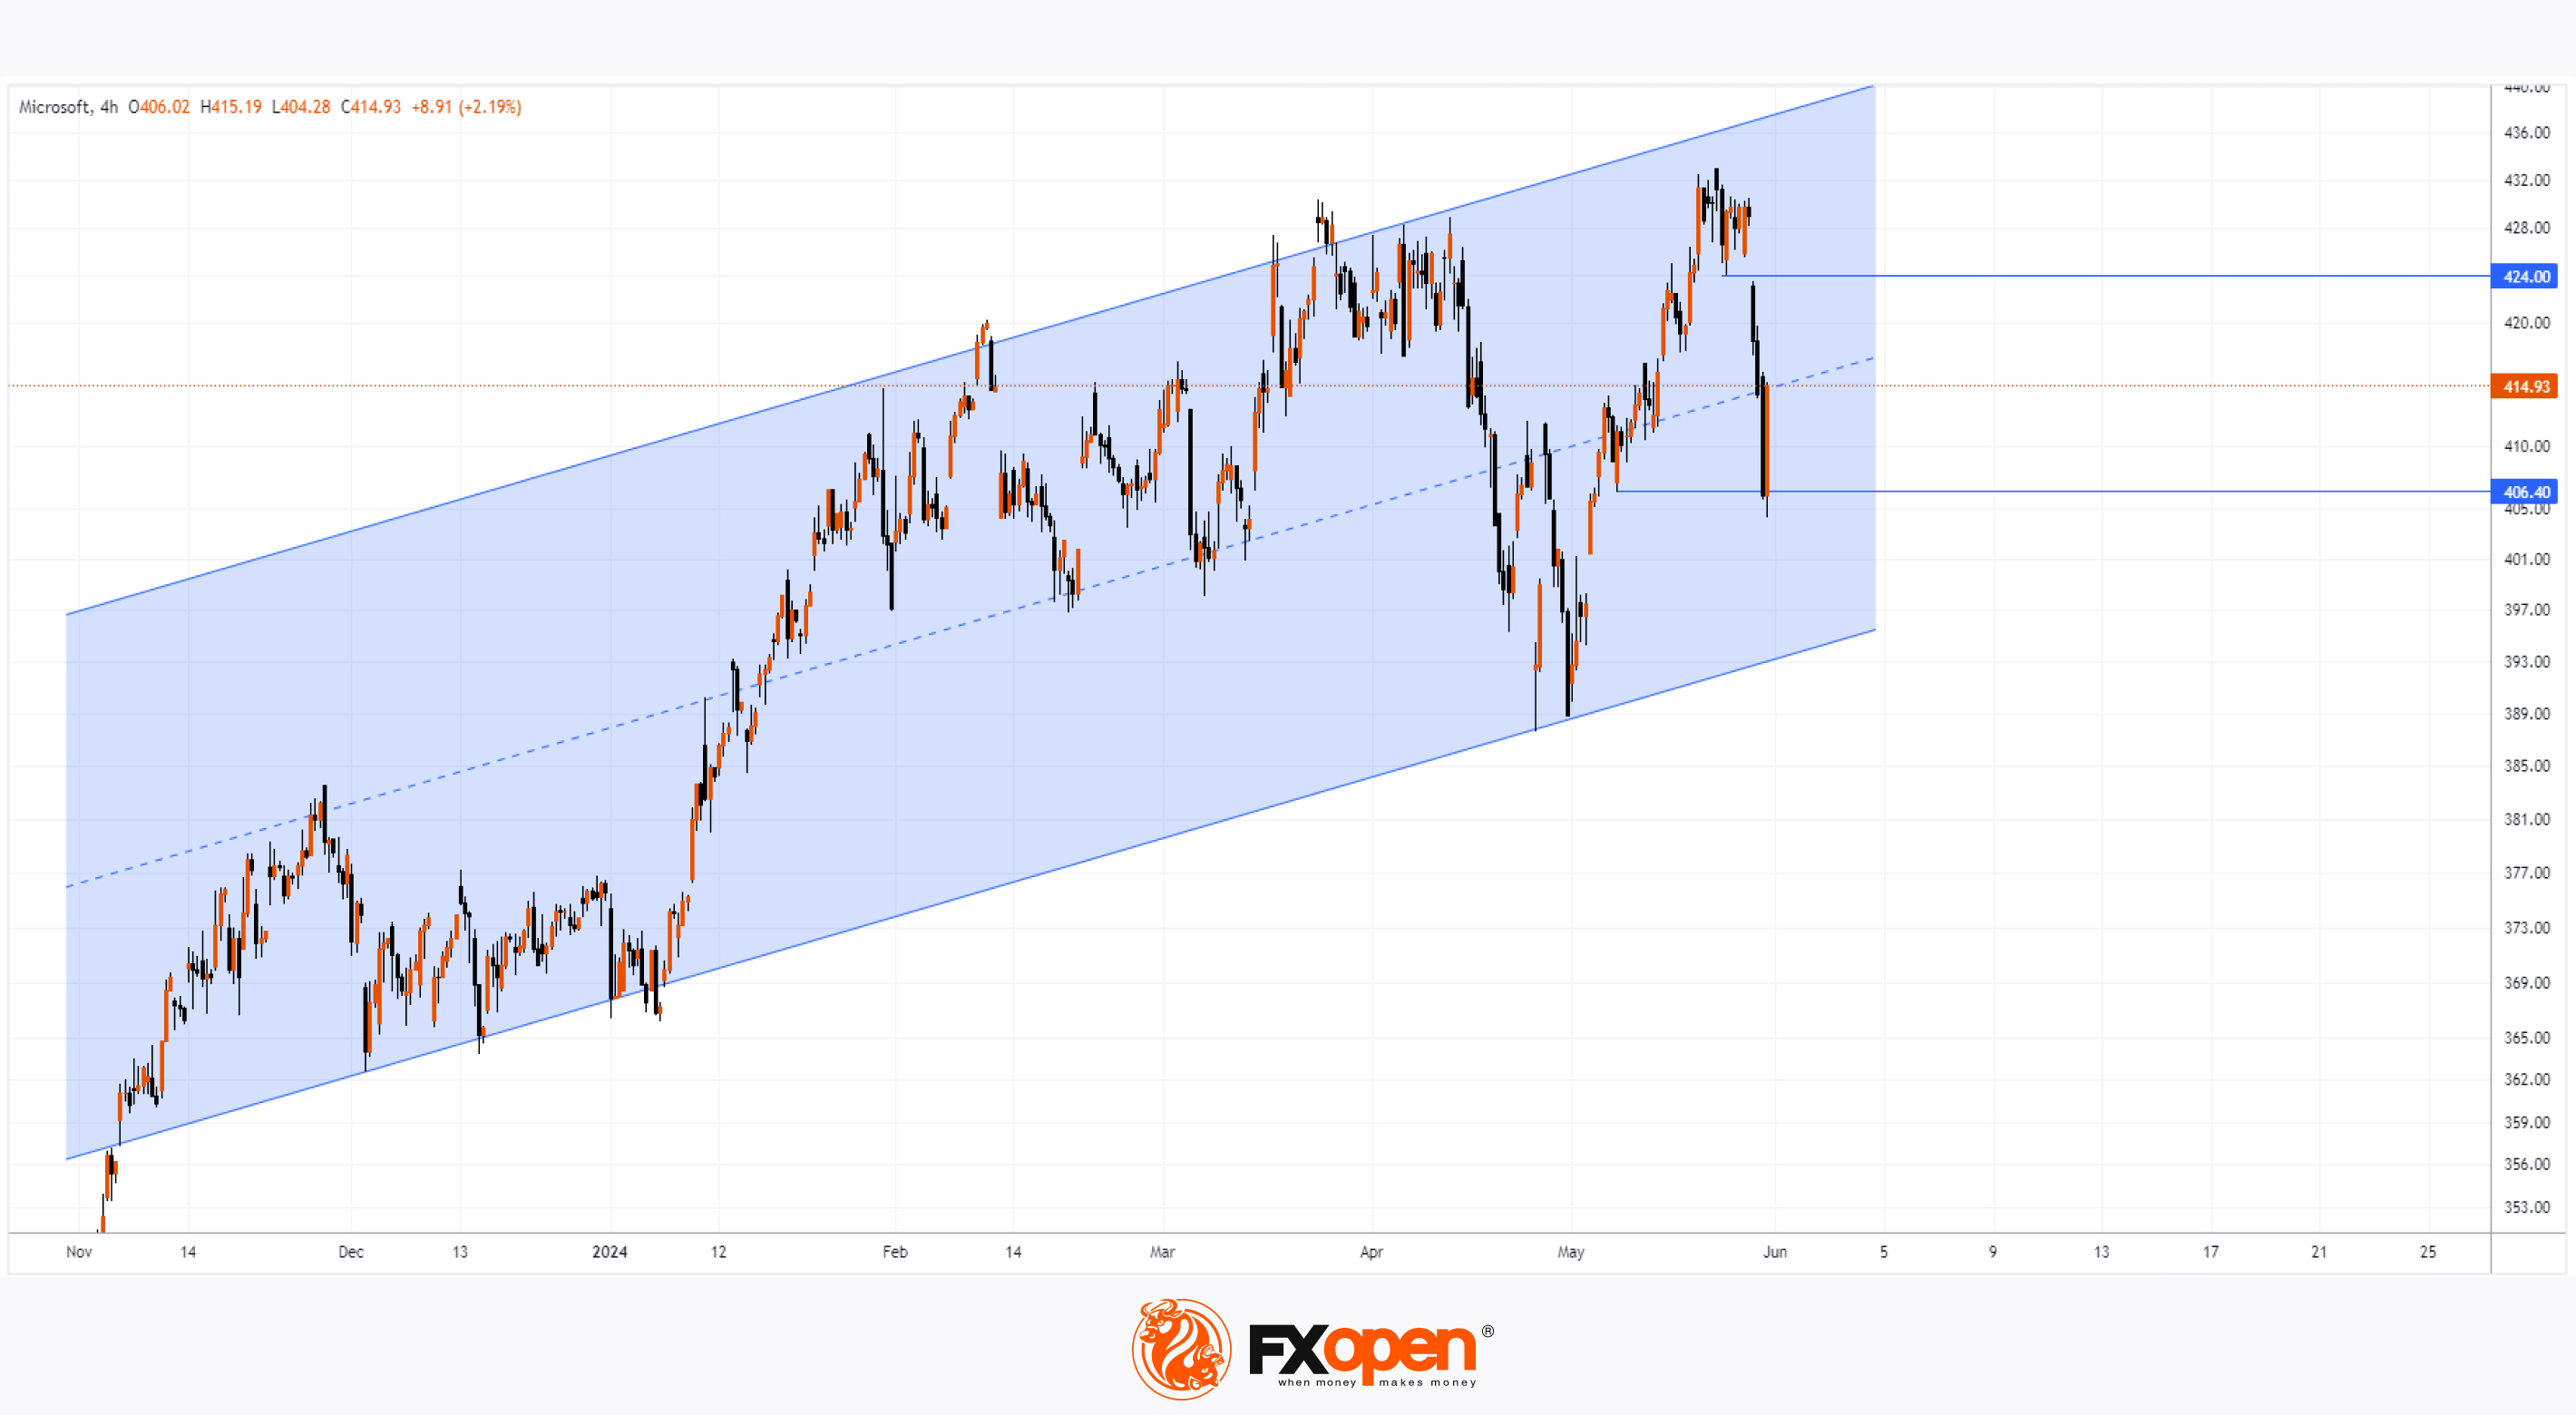
On Friday, 31 May, almost 48 million Microsoft shares were traded on the NASDAQ – the highest number since the start of 2024. Meanwhile, the MSFT price chart formed a “hammer” candle:
→ trading opened at $416.75 per MSFT share;
→ mid-session, the price dropped below $406;
→ however, by the end of trading, the price had recovered to $415.13.
Fundamentally, it is difficult to pinpoint a single piece of news that served as the bullish driver. According to Barron's, a significant incentive for investing in MSFT shares should be considered the prospect of high dividend payouts.
From the perspective of MSFT chart technical analysis, the price action can be interpreted as evidence of demand absorbing all selling pressure:
→ the share price is within an ascending channel;
→ having dropped to the $406 level, the price pierced the $406.40 support from 8 May – this likely triggered mass activation of buyers' stop-losses and led to a shift in the balance of buyers and sellers;
→ in the pre-market today, the MSFT price is around the median – thus, it can be assumed that the market will consolidate at the beginning of the week. If Friday's bullish momentum continues, the price may encounter resistance around the bearish gap at $424 per MSFT share.
A crucial driver for the price of MSFT and other market leaders in the near future will be the upcoming Fed meeting on interest rates, scheduled for Wednesday, 12 June.
According to TipRanks, the average forecasted price of MSFT shares in 12 months is $491.90 (+18.49% from current levels).
Trade global index CFDs with zero commission and tight spreads. Open your FXOpen account now or learn more about trading index CFDs with FXOpen.
CFDs are complex instruments and come with a high risk of losing your money.
This article represents the opinion of the Companies operating under the FXOpen brand only. It is not to be construed as an offer, solicitation, or recommendation with respect to products and services provided by the Companies operating under the FXOpen brand, nor is it to be considered financial advice.
MSFT Shares Surge on Record Yearly Volumes
On Friday, 31 May, almost 48 million Microsoft shares were traded on the NASDAQ – the highest number since the start of 2024. Meanwhile, the MSFT price chart formed a “hammer” candle:
→ trading opened at $416.75 per MSFT share;
→ mid-session, the price dropped below $406;
→ however, by the end of trading, the price had recovered to $415.13.
Fundamentally, it is difficult to pinpoint a single piece of news that served as the bullish driver. According to Barron's, a significant incentive for investing in MSFT shares should be considered the prospect of high dividend payouts.
From the perspective of MSFT chart technical analysis, the price action can be interpreted as evidence of demand absorbing all selling pressure:
→ the share price is within an ascending channel;
→ having dropped to the $406 level, the price pierced the $406.40 support from 8 May – this likely triggered mass activation of buyers' stop-losses and led to a shift in the balance of buyers and sellers;
→ in the pre-market today, the MSFT price is around the median – thus, it can be assumed that the market will consolidate at the beginning of the week. If Friday's bullish momentum continues, the price may encounter resistance around the bearish gap at $424 per MSFT share.
A crucial driver for the price of MSFT and other market leaders in the near future will be the upcoming Fed meeting on interest rates, scheduled for Wednesday, 12 June.
According to TipRanks, the average forecasted price of MSFT shares in 12 months is $491.90 (+18.49% from current levels).
Trade global index CFDs with zero commission and tight spreads. Open your FXOpen account now or learn more about trading index CFDs with FXOpen.
CFDs are complex instruments and come with a high risk of losing your money.
This article represents the opinion of the Companies operating under the FXOpen brand only. It is not to be construed as an offer, solicitation, or recommendation with respect to products and services provided by the Companies operating under the FXOpen brand, nor is it to be considered financial advice.
👍2
#sp500 #stockmarket #USDollar #xagusd #silverprice #MSFT
Weekly Market Wrap With Gary Thomson: S&P 500, US Dollar, Gold and Silver, MSFT Shares
Get the latest scoop on the week's hottest headlines, all in one convenient video. Join Gary Thomson, the COO of FXOpen UK, as he breaks down the most significant news reports and shares his expert insights.
🔸S&P 500 Index: Latest Analysts’ Forecasts
🔸The Dollar Continues Range-Bound Trading Ahead of US Employment Data
🔸The Price of Silver Is Acting Weaker Than Gold
🔸MSFT Shares Surge on Record Yearly Volumes
Stay in the know and empower yourself with our short, yet power-packed video. Watch it now and stay updated with FXOpen. Don't miss out on this invaluable opportunity to sharpen your trading skills and make informed decisions.
https://cutt.ly/9eiJADm2
To take advantage of price fluctuations in the foreign exchange markets, consider enlisting the services of a reliable broker like FXOpen.
⚠️
This forecast represents FXOpen Companies opinion only, it should not be construed as an offer, invitation or recommendation in respect to FXOpen Companies products and services or as financial advice
Weekly Market Wrap With Gary Thomson: S&P 500, US Dollar, Gold and Silver, MSFT Shares
Get the latest scoop on the week's hottest headlines, all in one convenient video. Join Gary Thomson, the COO of FXOpen UK, as he breaks down the most significant news reports and shares his expert insights.
🔸S&P 500 Index: Latest Analysts’ Forecasts
🔸The Dollar Continues Range-Bound Trading Ahead of US Employment Data
🔸The Price of Silver Is Acting Weaker Than Gold
🔸MSFT Shares Surge on Record Yearly Volumes
Stay in the know and empower yourself with our short, yet power-packed video. Watch it now and stay updated with FXOpen. Don't miss out on this invaluable opportunity to sharpen your trading skills and make informed decisions.
https://cutt.ly/9eiJADm2
To take advantage of price fluctuations in the foreign exchange markets, consider enlisting the services of a reliable broker like FXOpen.
⚠️
This forecast represents FXOpen Companies opinion only, it should not be construed as an offer, invitation or recommendation in respect to FXOpen Companies products and services or as financial advice
YouTube
Weekly Market Wrap With Gary Thomson: S&P 500, US Dollar, Gold and Silver, MSFT Shares
Get the latest scoop on the week's hottest headlines, all in one convenient video. Join Gary Thomson, the COO of FXOpen UK, as he breaks down the most significant news reports and shares his expert insights.
00:37 S&P 500 Index: Latest Analysts’ Forecasts…
00:37 S&P 500 Index: Latest Analysts’ Forecasts…
👍2
#MSFT #stockmarket #stocktrading #stockmarket
MSFT Share Price Dropped After Global Outage
On 19th July, a global outage occurred. Numerous computers running Windows worldwide experienced "blue screens of death" (BSOD), affecting companies in different sectors, including airlines, hospitals, media, banks, and others. The outage was caused by a CrowdStrike Falcon Sensor update, a component of the Windows system that essentially works to protect computers from cyber threats. CrowdStrike quickly acknowledged the issue, stating that it was not a cyberattack but an update error, and suggested a solution.
According to CNBC, the large-scale outage did not significantly impact the operation of most financial markets. Representatives of the New York Stock Exchange and Nasdaq stated on Friday that they were operating despite the issues with the CrowdStrike update. The only noticeable unpleasant consequence for most was the inability to calculate the Russell stock indices, including the popular Russell 2000. However, the confusion was resolved later on Friday.
At the same time, the large-scale outage affected stock prices, including Microsoft. In pre-market trading on Friday, MSFT's price dropped below $430, but during the main session, the price managed to rise above it. As technical analysis of the MSFT chart shows, the $430 level is important – as it acted as resistance in March-May 2024. Therefore, its role as support might be justified by analysts. Additionally, the MSFT share price is near the lower boundary of the upward channel (shown in blue), which may provide additional support. However, no one can guarantee that the mentioned support levels will lead to a subsequent bullish impulse.
On 19th July, we wrote about bearish signs on META stock charts. These are bearish aggression signs, which are concerning:
→ the price's inability to reach the upper boundary of the blue channel in early July;
→ a wide bearish gap when breaking through the median on 17th July. Wall Street analysts remain positive for now. According to TipRanks, the average forecast for MSFT is $504.12 (+15.33% from the current price) over the next 12 months. Microsoft's Q2 earnings report, scheduled for release on 30 July, has the potential to significantly alter the balance of sentiments.
Trade global index CFDs with zero commission and tight spreads. Open your FXOpen account now or learn more about trading index CFDs with FXOpen.
CFDs are complex instruments and come with a high risk of losing your money.
This article represents the opinion of the Companies operating under the FXOpen brand only. It is not to be construed as an offer, solicitation, or recommendation with respect to products and services provided by the Companies operating under the FXOpen brand, nor is it to be considered financial advice.
MSFT Share Price Dropped After Global Outage
On 19th July, a global outage occurred. Numerous computers running Windows worldwide experienced "blue screens of death" (BSOD), affecting companies in different sectors, including airlines, hospitals, media, banks, and others. The outage was caused by a CrowdStrike Falcon Sensor update, a component of the Windows system that essentially works to protect computers from cyber threats. CrowdStrike quickly acknowledged the issue, stating that it was not a cyberattack but an update error, and suggested a solution.
According to CNBC, the large-scale outage did not significantly impact the operation of most financial markets. Representatives of the New York Stock Exchange and Nasdaq stated on Friday that they were operating despite the issues with the CrowdStrike update. The only noticeable unpleasant consequence for most was the inability to calculate the Russell stock indices, including the popular Russell 2000. However, the confusion was resolved later on Friday.
At the same time, the large-scale outage affected stock prices, including Microsoft. In pre-market trading on Friday, MSFT's price dropped below $430, but during the main session, the price managed to rise above it. As technical analysis of the MSFT chart shows, the $430 level is important – as it acted as resistance in March-May 2024. Therefore, its role as support might be justified by analysts. Additionally, the MSFT share price is near the lower boundary of the upward channel (shown in blue), which may provide additional support. However, no one can guarantee that the mentioned support levels will lead to a subsequent bullish impulse.
On 19th July, we wrote about bearish signs on META stock charts. These are bearish aggression signs, which are concerning:
→ the price's inability to reach the upper boundary of the blue channel in early July;
→ a wide bearish gap when breaking through the median on 17th July. Wall Street analysts remain positive for now. According to TipRanks, the average forecast for MSFT is $504.12 (+15.33% from the current price) over the next 12 months. Microsoft's Q2 earnings report, scheduled for release on 30 July, has the potential to significantly alter the balance of sentiments.
Trade global index CFDs with zero commission and tight spreads. Open your FXOpen account now or learn more about trading index CFDs with FXOpen.
CFDs are complex instruments and come with a high risk of losing your money.
This article represents the opinion of the Companies operating under the FXOpen brand only. It is not to be construed as an offer, solicitation, or recommendation with respect to products and services provided by the Companies operating under the FXOpen brand, nor is it to be considered financial advice.

👍2
#StockMarket #USDJPY #MSFT #meta #Investing #finance #marketupdate
Weekly Market Wrap With Gary Thomson: GBP/USD, USD/JPY, MSFT and META Shares
Get the latest scoop on the week's hottest headlines, all in one convenient video. Join Gary Thomson, the COO of FXOpen UK, as he breaks down the most significant news reports and shares his expert insights.
🔸 Market Reacts Mildly To Fed Decision, Focus Shifts To Nonfarm Payrolls
🔸 USD/JPY Falls Below 150 Yen Per Dollar
🔸 MSFT Share Price Plummets After Earnings Report, But It’s Not All Bad
🔸 META Shares Rise Above $500
Stay in the know and empower yourself with our short, yet power-packed video. Watch it now and stay updated with FXOpen. Don't miss out on this invaluable opportunity to sharpen your trading skills and make informed decisions.
https://cutt.ly/KezJn2Ni
To take advantage of price fluctuations in the foreign exchange markets, consider enlisting the services of a reliable broker like FXOpen.
⚠️
This forecast represents FXOpen Companies opinion only, it should not be construed as an offer, invitation or recommendation in respect to FXOpen Companies products and services or as financial advice.
Weekly Market Wrap With Gary Thomson: GBP/USD, USD/JPY, MSFT and META Shares
Get the latest scoop on the week's hottest headlines, all in one convenient video. Join Gary Thomson, the COO of FXOpen UK, as he breaks down the most significant news reports and shares his expert insights.
🔸 Market Reacts Mildly To Fed Decision, Focus Shifts To Nonfarm Payrolls
🔸 USD/JPY Falls Below 150 Yen Per Dollar
🔸 MSFT Share Price Plummets After Earnings Report, But It’s Not All Bad
🔸 META Shares Rise Above $500
Stay in the know and empower yourself with our short, yet power-packed video. Watch it now and stay updated with FXOpen. Don't miss out on this invaluable opportunity to sharpen your trading skills and make informed decisions.
https://cutt.ly/KezJn2Ni
To take advantage of price fluctuations in the foreign exchange markets, consider enlisting the services of a reliable broker like FXOpen.
⚠️
This forecast represents FXOpen Companies opinion only, it should not be construed as an offer, invitation or recommendation in respect to FXOpen Companies products and services or as financial advice.
YouTube
Weekly Market Wrap With Gary Thomson: GBP/USD, USD/JPY, MSFT and META Shares
Get the latest scoop on the week's hottest headlines, all in one convenient video. Join Gary Thomson, the COO of FXOpen UK, as he breaks down the most significant news reports and shares his expert insights.
00:34 Market Reacts Mildly To Fed Decision, Focus…
00:34 Market Reacts Mildly To Fed Decision, Focus…
👍2
#stockmarket #MSFT #marketanalysis #MarketUpdates
Microsoft (MSFT) Shares Drop Over 3% This Month
An overview of stock market charts since the beginning of the month reveals that while the Nasdaq 100 index (US Tech 100 mini on FXOpen) is in positive territory, Microsoft (MSFT) shares have underperformed significantly. The opening price on 1st October was $427.47, but by yesterday's close, it had fallen over 3%.
One of the key drivers behind this bearish sentiment is analysis from Oppenheimer, suggesting that Microsoft's financial performance may be negatively impacted by losses related to OpenAI. Additionally, Oppenheimer downgraded Microsoft's stock rating, a concerning sign ahead of the upcoming third-quarter earnings season.
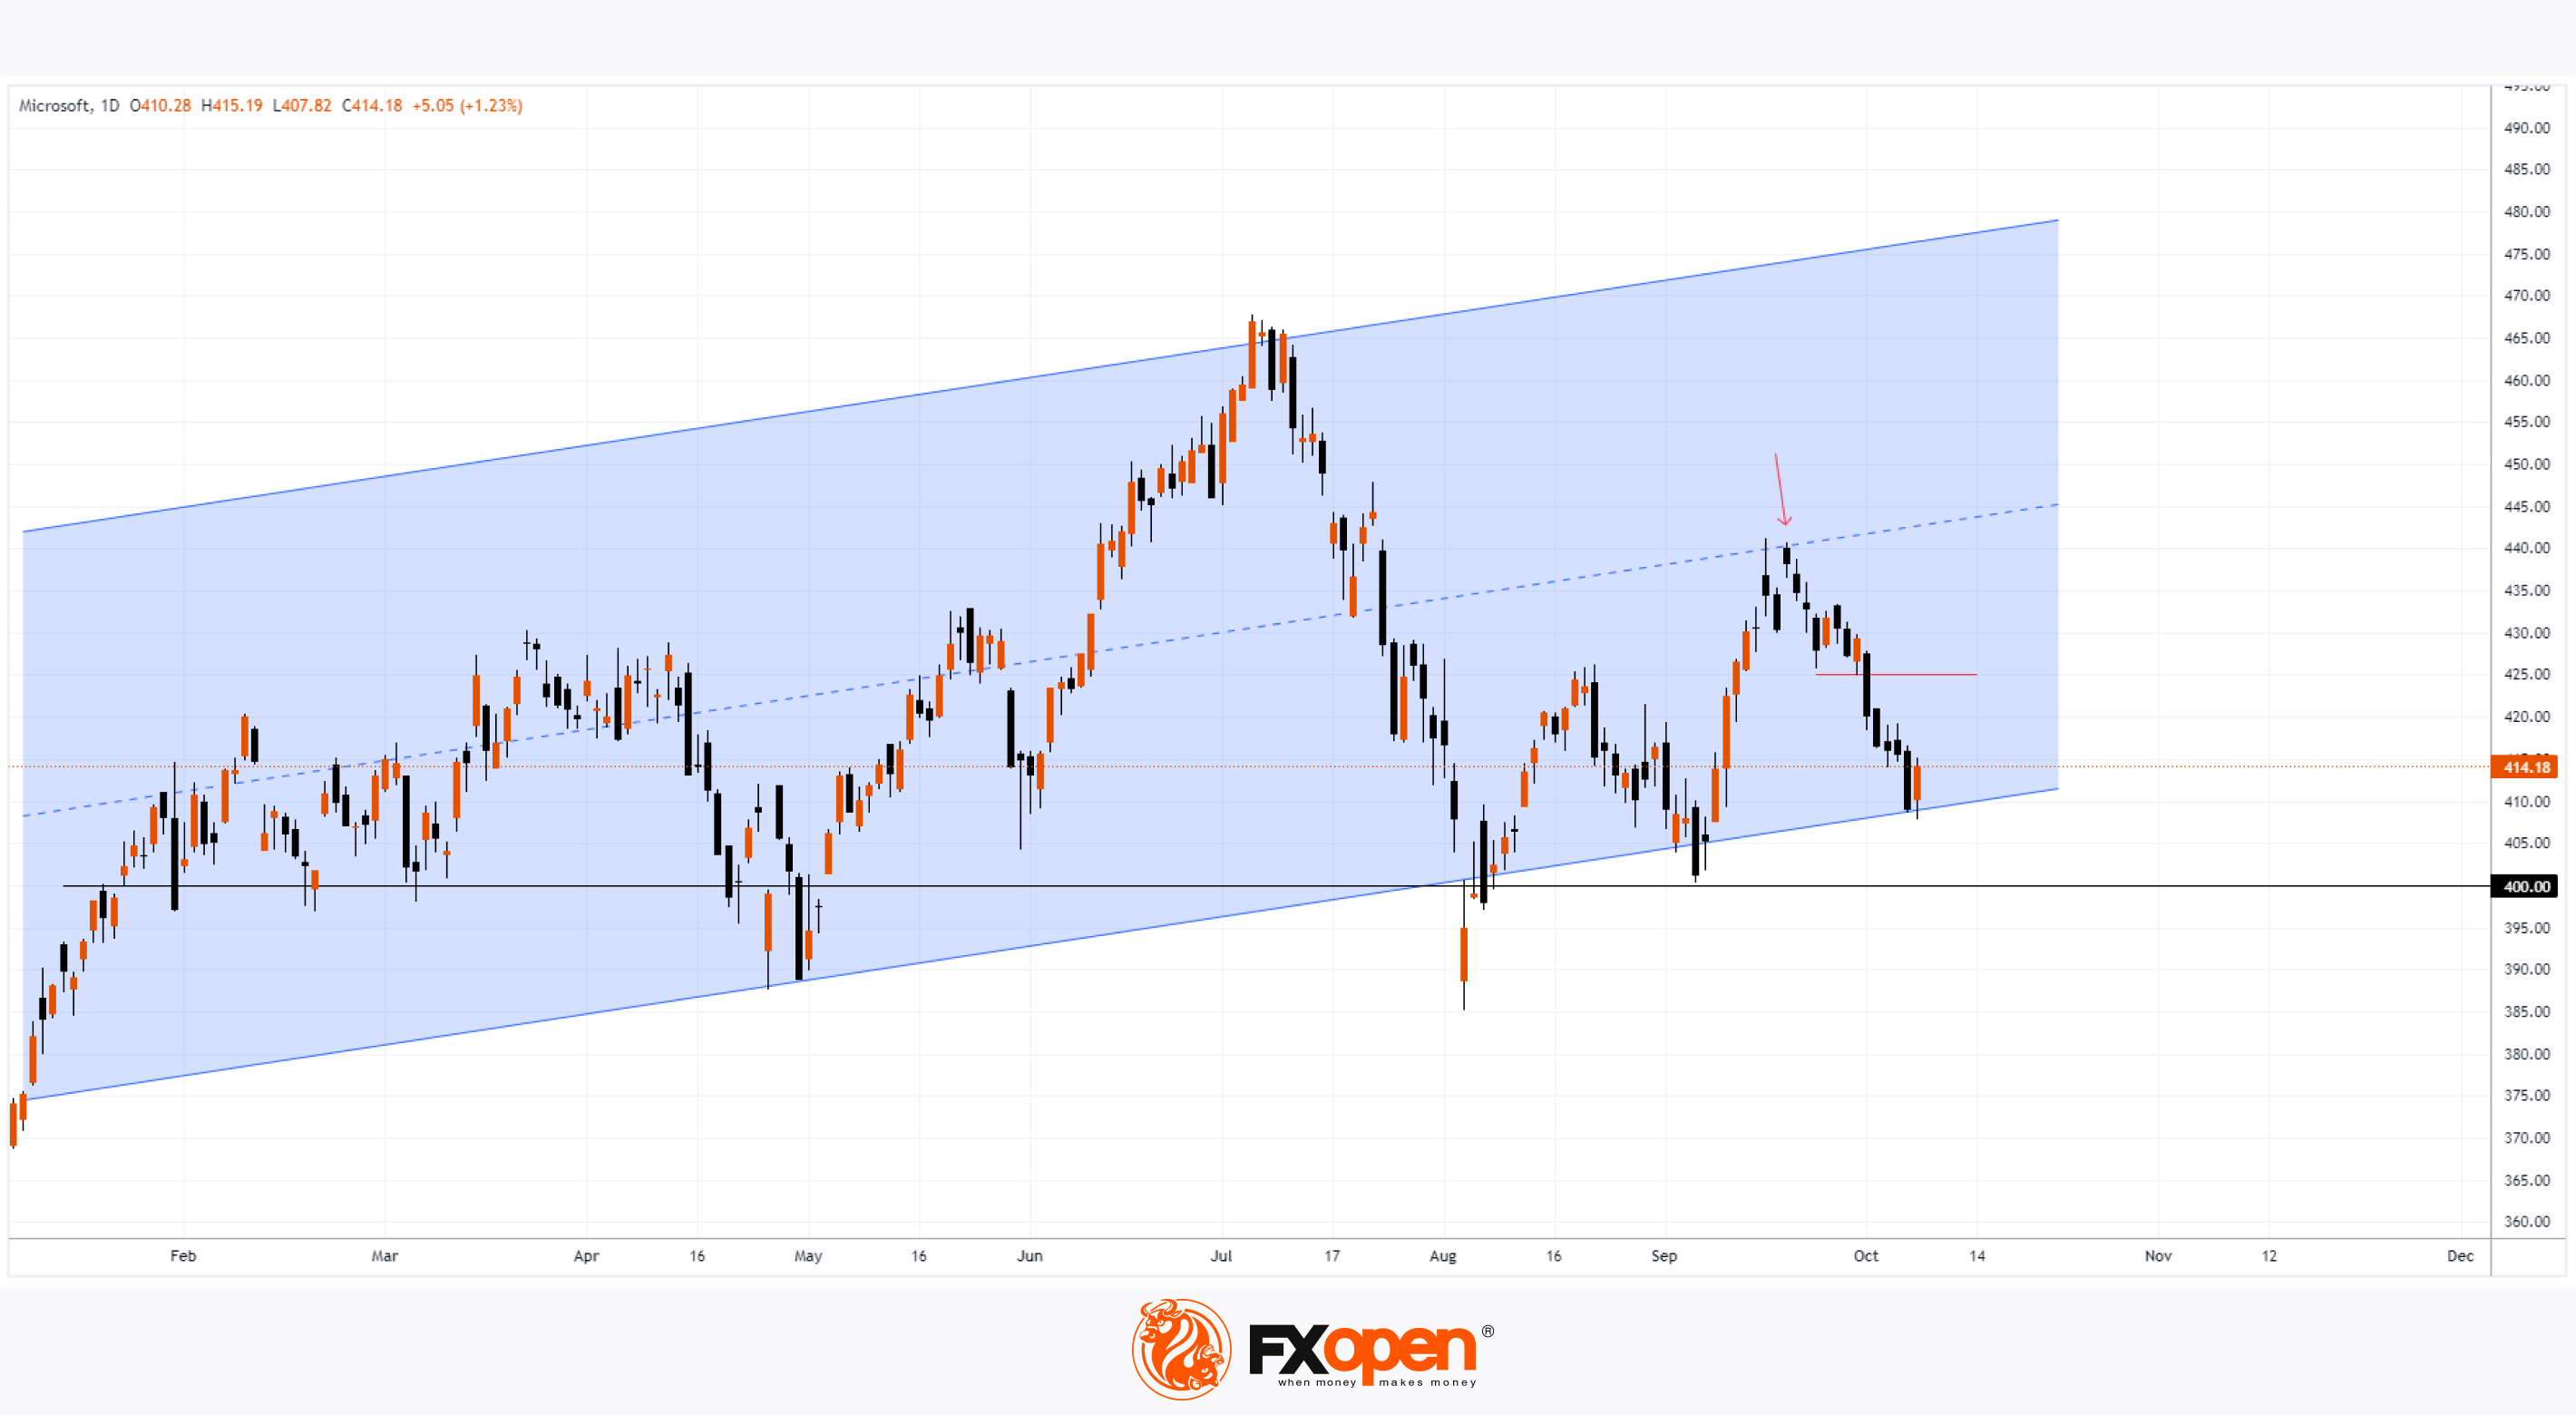
Technical analysis of Microsoft's (MSFT) stock chart shows that the price is hovering around a critical support zone, which is formed by:
→ the lower boundary of an upward channel that has been in place since early 2024 (marked in blue);
→ the psychological level of $400 per share.
What could happen next?
Bullish outlook: Microsoft's (MSFT) share price may reverse upwards from this support zone. Yesterday’s bullish candle indicates a potential increase in demand.
Bearish outlook: The median line of the blue channel has acted as resistance (shown by the arrow). It’s possible that the next level where bears could confirm control is the former support at $425.
Which scenario plays out largely depends on Microsoft's upcoming earnings report, scheduled for 22nd October.
Trade global index CFDs with zero commission and tight spreads. Open your FXOpen account now or learn more about trading index CFDs with FXOpen.
CFDs are complex instruments and come with a high risk of losing your money.
This article represents the opinion of the Companies operating under the FXOpen brand only. It is not to be construed as an offer, solicitation, or recommendation with respect to products and services provided by the Companies operating under the FXOpen brand, nor is it to be considered financial advice.
Microsoft (MSFT) Shares Drop Over 3% This Month
An overview of stock market charts since the beginning of the month reveals that while the Nasdaq 100 index (US Tech 100 mini on FXOpen) is in positive territory, Microsoft (MSFT) shares have underperformed significantly. The opening price on 1st October was $427.47, but by yesterday's close, it had fallen over 3%.
One of the key drivers behind this bearish sentiment is analysis from Oppenheimer, suggesting that Microsoft's financial performance may be negatively impacted by losses related to OpenAI. Additionally, Oppenheimer downgraded Microsoft's stock rating, a concerning sign ahead of the upcoming third-quarter earnings season.
Technical analysis of Microsoft's (MSFT) stock chart shows that the price is hovering around a critical support zone, which is formed by:
→ the lower boundary of an upward channel that has been in place since early 2024 (marked in blue);
→ the psychological level of $400 per share.
What could happen next?
Bullish outlook: Microsoft's (MSFT) share price may reverse upwards from this support zone. Yesterday’s bullish candle indicates a potential increase in demand.
Bearish outlook: The median line of the blue channel has acted as resistance (shown by the arrow). It’s possible that the next level where bears could confirm control is the former support at $425.
Which scenario plays out largely depends on Microsoft's upcoming earnings report, scheduled for 22nd October.
Trade global index CFDs with zero commission and tight spreads. Open your FXOpen account now or learn more about trading index CFDs with FXOpen.
CFDs are complex instruments and come with a high risk of losing your money.
This article represents the opinion of the Companies operating under the FXOpen brand only. It is not to be construed as an offer, solicitation, or recommendation with respect to products and services provided by the Companies operating under the FXOpen brand, nor is it to be considered financial advice.
👍2
#StockMarket #FinancialNews #GlobalMarkets #GoldPrices #TechStocks #MSFT #NFLX #MarketUpdate
Weekly Market Wrap With Gary Thomson: Hang Seng Index, XAU/USD, Microsoft and Netflix Shares
Get the latest scoop on the week's hottest headlines, all in one convenient video. Join Gary Thomson, the COO of FXOpen UK, as he breaks down the most significant news reports and shares his expert insights.
🔸 Hang Seng Index (HSI) Drops Nearly 10% Today
🔸 Analysis of XAU/USD: Gold Price Drops to a Two-Week Low
🔸 Microsoft (MSFT) Shares Drop Over 3% This Month
🔸The Netflix (NFLX) Share Price Has Reached an All-Time High
Stay in the know and empower yourself with our short, yet power-packed video. Watch it now and stay updated with FXOpen. Don't miss out on this invaluable opportunity to sharpen your trading skills and make informed decisions.
https://cutt.ly/XeAfLryh
To take advantage of price fluctuations in the foreign exchange markets, consider enlisting the services of a reliable broker like FXOpen.
⚠️
This forecast represents FXOpen Companies opinion only, it should not be construed as an offer, invitation or recommendation in respect to FXOpen Companies products and services or as financial advice.
Weekly Market Wrap With Gary Thomson: Hang Seng Index, XAU/USD, Microsoft and Netflix Shares
Get the latest scoop on the week's hottest headlines, all in one convenient video. Join Gary Thomson, the COO of FXOpen UK, as he breaks down the most significant news reports and shares his expert insights.
🔸 Hang Seng Index (HSI) Drops Nearly 10% Today
🔸 Analysis of XAU/USD: Gold Price Drops to a Two-Week Low
🔸 Microsoft (MSFT) Shares Drop Over 3% This Month
🔸The Netflix (NFLX) Share Price Has Reached an All-Time High
Stay in the know and empower yourself with our short, yet power-packed video. Watch it now and stay updated with FXOpen. Don't miss out on this invaluable opportunity to sharpen your trading skills and make informed decisions.
https://cutt.ly/XeAfLryh
To take advantage of price fluctuations in the foreign exchange markets, consider enlisting the services of a reliable broker like FXOpen.
⚠️
This forecast represents FXOpen Companies opinion only, it should not be construed as an offer, invitation or recommendation in respect to FXOpen Companies products and services or as financial advice.
YouTube
Weekly Market Wrap With Gary Thomson: Hang Seng Index, XAU/USD, Microsoft and Netflix Shares
Get the latest scoop on the week's hottest headlines, all in one convenient video. Join Gary Thomson, the COO of FXOpen UK, as he breaks down the most significant news reports and shares his expert insights.
00:25 Hang Seng Index (HSI) Drops Nearly 10% Today…
00:25 Hang Seng Index (HSI) Drops Nearly 10% Today…
👍2
#MSFT #stockmarket #stocktrading #MarketUpdates
Microsoft (MSFT) Shares Decline Despite Strong Earnings Report
On 9 October, our analysis of Microsoft (MSFT) suggested that the stock price:
→ Was forming an ascending channel (shown in blue on the chart);
→ Could see a rebound from its lower boundary (indicated by an arrow).
Since then, the price indeed moved upward from this support around the $411 level, even surpassing $437. However, following Microsoft’s Q3 earnings report released post-market yesterday, the share price faced heightened volatility.
In the Q3 report:
→ Earnings per share (EPS) came in at $3.30, exceeding the expected $3.10;
→ Gross revenue was $65.58 billion, also above the forecasted $64.57 billion.
Despite these positive figures, MSFT shares saw a decline due to high volatility during after-hours trading, reaching $444 at one point and then falling to around $410. This drop may be due to Microsoft’s rising expenses. As reported by The Wall Street Journal, Microsoft’s capital expenditures in 2024 have hit $53 billion (about 28% of revenue), a substantial increase from the 12% average of revenue allocated to capital costs between 2014 and 2023.
As of pre-market trading today, MSFT is trading around $417 (approximately -4% from yesterday’s close), likely setting the opening level for today’s main session.
Today’s technical analysis of MSFT suggests that the opening may see a bearish gap, potentially pushing MSFT’s price toward the lower boundary of the ascending blue channel, where a new consensus between buyers and sellers could emerge. This sets up two scenarios:
→ Bulls may see an opportunity for another rebound;
→ Bears could aim for a breakdown of this key support level, with potential testing of the psychological $400 level.
Analyst sentiment remains positive. According to TipRanks surveys:
→ 27 out of 30 analysts recommend buying MSFT shares;
→ The average 12-month target price for MSFT is $503.
Trade global index CFDs with zero commission and tight spreads. Open your FXOpen account now or learn more about trading index CFDs with FXOpen.
CFDs are complex instruments and come with a high risk of losing your money.
This article represents the opinion of the Companies operating under the FXOpen brand only. It is not to be construed as an offer, solicitation, or recommendation with respect to products and services provided by the Companies operating under the FXOpen brand, nor is it to be considered financial advice.
Microsoft (MSFT) Shares Decline Despite Strong Earnings Report
On 9 October, our analysis of Microsoft (MSFT) suggested that the stock price:
→ Was forming an ascending channel (shown in blue on the chart);
→ Could see a rebound from its lower boundary (indicated by an arrow).
Since then, the price indeed moved upward from this support around the $411 level, even surpassing $437. However, following Microsoft’s Q3 earnings report released post-market yesterday, the share price faced heightened volatility.
In the Q3 report:
→ Earnings per share (EPS) came in at $3.30, exceeding the expected $3.10;
→ Gross revenue was $65.58 billion, also above the forecasted $64.57 billion.
Despite these positive figures, MSFT shares saw a decline due to high volatility during after-hours trading, reaching $444 at one point and then falling to around $410. This drop may be due to Microsoft’s rising expenses. As reported by The Wall Street Journal, Microsoft’s capital expenditures in 2024 have hit $53 billion (about 28% of revenue), a substantial increase from the 12% average of revenue allocated to capital costs between 2014 and 2023.
As of pre-market trading today, MSFT is trading around $417 (approximately -4% from yesterday’s close), likely setting the opening level for today’s main session.
Today’s technical analysis of MSFT suggests that the opening may see a bearish gap, potentially pushing MSFT’s price toward the lower boundary of the ascending blue channel, where a new consensus between buyers and sellers could emerge. This sets up two scenarios:
→ Bulls may see an opportunity for another rebound;
→ Bears could aim for a breakdown of this key support level, with potential testing of the psychological $400 level.
Analyst sentiment remains positive. According to TipRanks surveys:
→ 27 out of 30 analysts recommend buying MSFT shares;
→ The average 12-month target price for MSFT is $503.
Trade global index CFDs with zero commission and tight spreads. Open your FXOpen account now or learn more about trading index CFDs with FXOpen.
CFDs are complex instruments and come with a high risk of losing your money.
This article represents the opinion of the Companies operating under the FXOpen brand only. It is not to be construed as an offer, solicitation, or recommendation with respect to products and services provided by the Companies operating under the FXOpen brand, nor is it to be considered financial advice.

👍2
#StockMarket #MSFT #GOOGL #Nasdaq100 #FinancialNews #Investing #USMarkets
Weekly Market Wrap With Gary Thomson: NASDAQ 100, US Dollar, GOOGLE, MSFT Shares Price
Get the latest scoop on the week's hottest headlines, all in one convenient video. Join Gary Thomson, the COO of FXOpen UK, as he breaks down the most significant news reports and shares his expert insights.
🔸 Nasdaq 100 consolidates ahead of major market leader earnings report;
🔸 Dollar continues aggressive rise ahead of U.S. elections;
🔸 Alphabet Inc. (GOOGL) shares rise to $180 following earnings report;
🔸 Microsoft (MSFT) shares decline despite strong earnings report;
Stay in the know and empower yourself with our short, yet power-packed video. Watch it now and stay updated with FXOpen. Don't miss out on this invaluable opportunity to sharpen your trading skills and make informed decisions.
https://cutt.ly/VeF8427m
To take advantage of price fluctuations in the foreign exchange markets, consider enlisting the services of a reliable broker like FXOpen.
⚠️
This forecast represents FXOpen Companies opinion only, it should not be construed as an offer, invitation or recommendation in respect to FXOpen Companies products and services or as financial advice.
Weekly Market Wrap With Gary Thomson: NASDAQ 100, US Dollar, GOOGLE, MSFT Shares Price
Get the latest scoop on the week's hottest headlines, all in one convenient video. Join Gary Thomson, the COO of FXOpen UK, as he breaks down the most significant news reports and shares his expert insights.
🔸 Nasdaq 100 consolidates ahead of major market leader earnings report;
🔸 Dollar continues aggressive rise ahead of U.S. elections;
🔸 Alphabet Inc. (GOOGL) shares rise to $180 following earnings report;
🔸 Microsoft (MSFT) shares decline despite strong earnings report;
Stay in the know and empower yourself with our short, yet power-packed video. Watch it now and stay updated with FXOpen. Don't miss out on this invaluable opportunity to sharpen your trading skills and make informed decisions.
https://cutt.ly/VeF8427m
To take advantage of price fluctuations in the foreign exchange markets, consider enlisting the services of a reliable broker like FXOpen.
⚠️
This forecast represents FXOpen Companies opinion only, it should not be construed as an offer, invitation or recommendation in respect to FXOpen Companies products and services or as financial advice.
YouTube
Weekly Market Wrap With Gary Thomson: NASDAQ 100, US Dollar, GOOGLE, MSFT Shares Price
Get the latest scoop on the week's hottest headlines, all in one convenient video. Join Gary Thomson, the COO of FXOpen UK, as he breaks down the most significant news reports and shares his expert insights
- NASDAQ 100 CONSOLIDATES AHEAD OF MAJOR MARKET…
- NASDAQ 100 CONSOLIDATES AHEAD OF MAJOR MARKET…
👍2
#marketanalysis #MarketNews #stockmarket #stocktrading #MSFT
Microsoft (MSFT) Stock Hits a 4.5-Month High
On 31 October, our analysis of Microsoft (MSFT) stock highlighted:
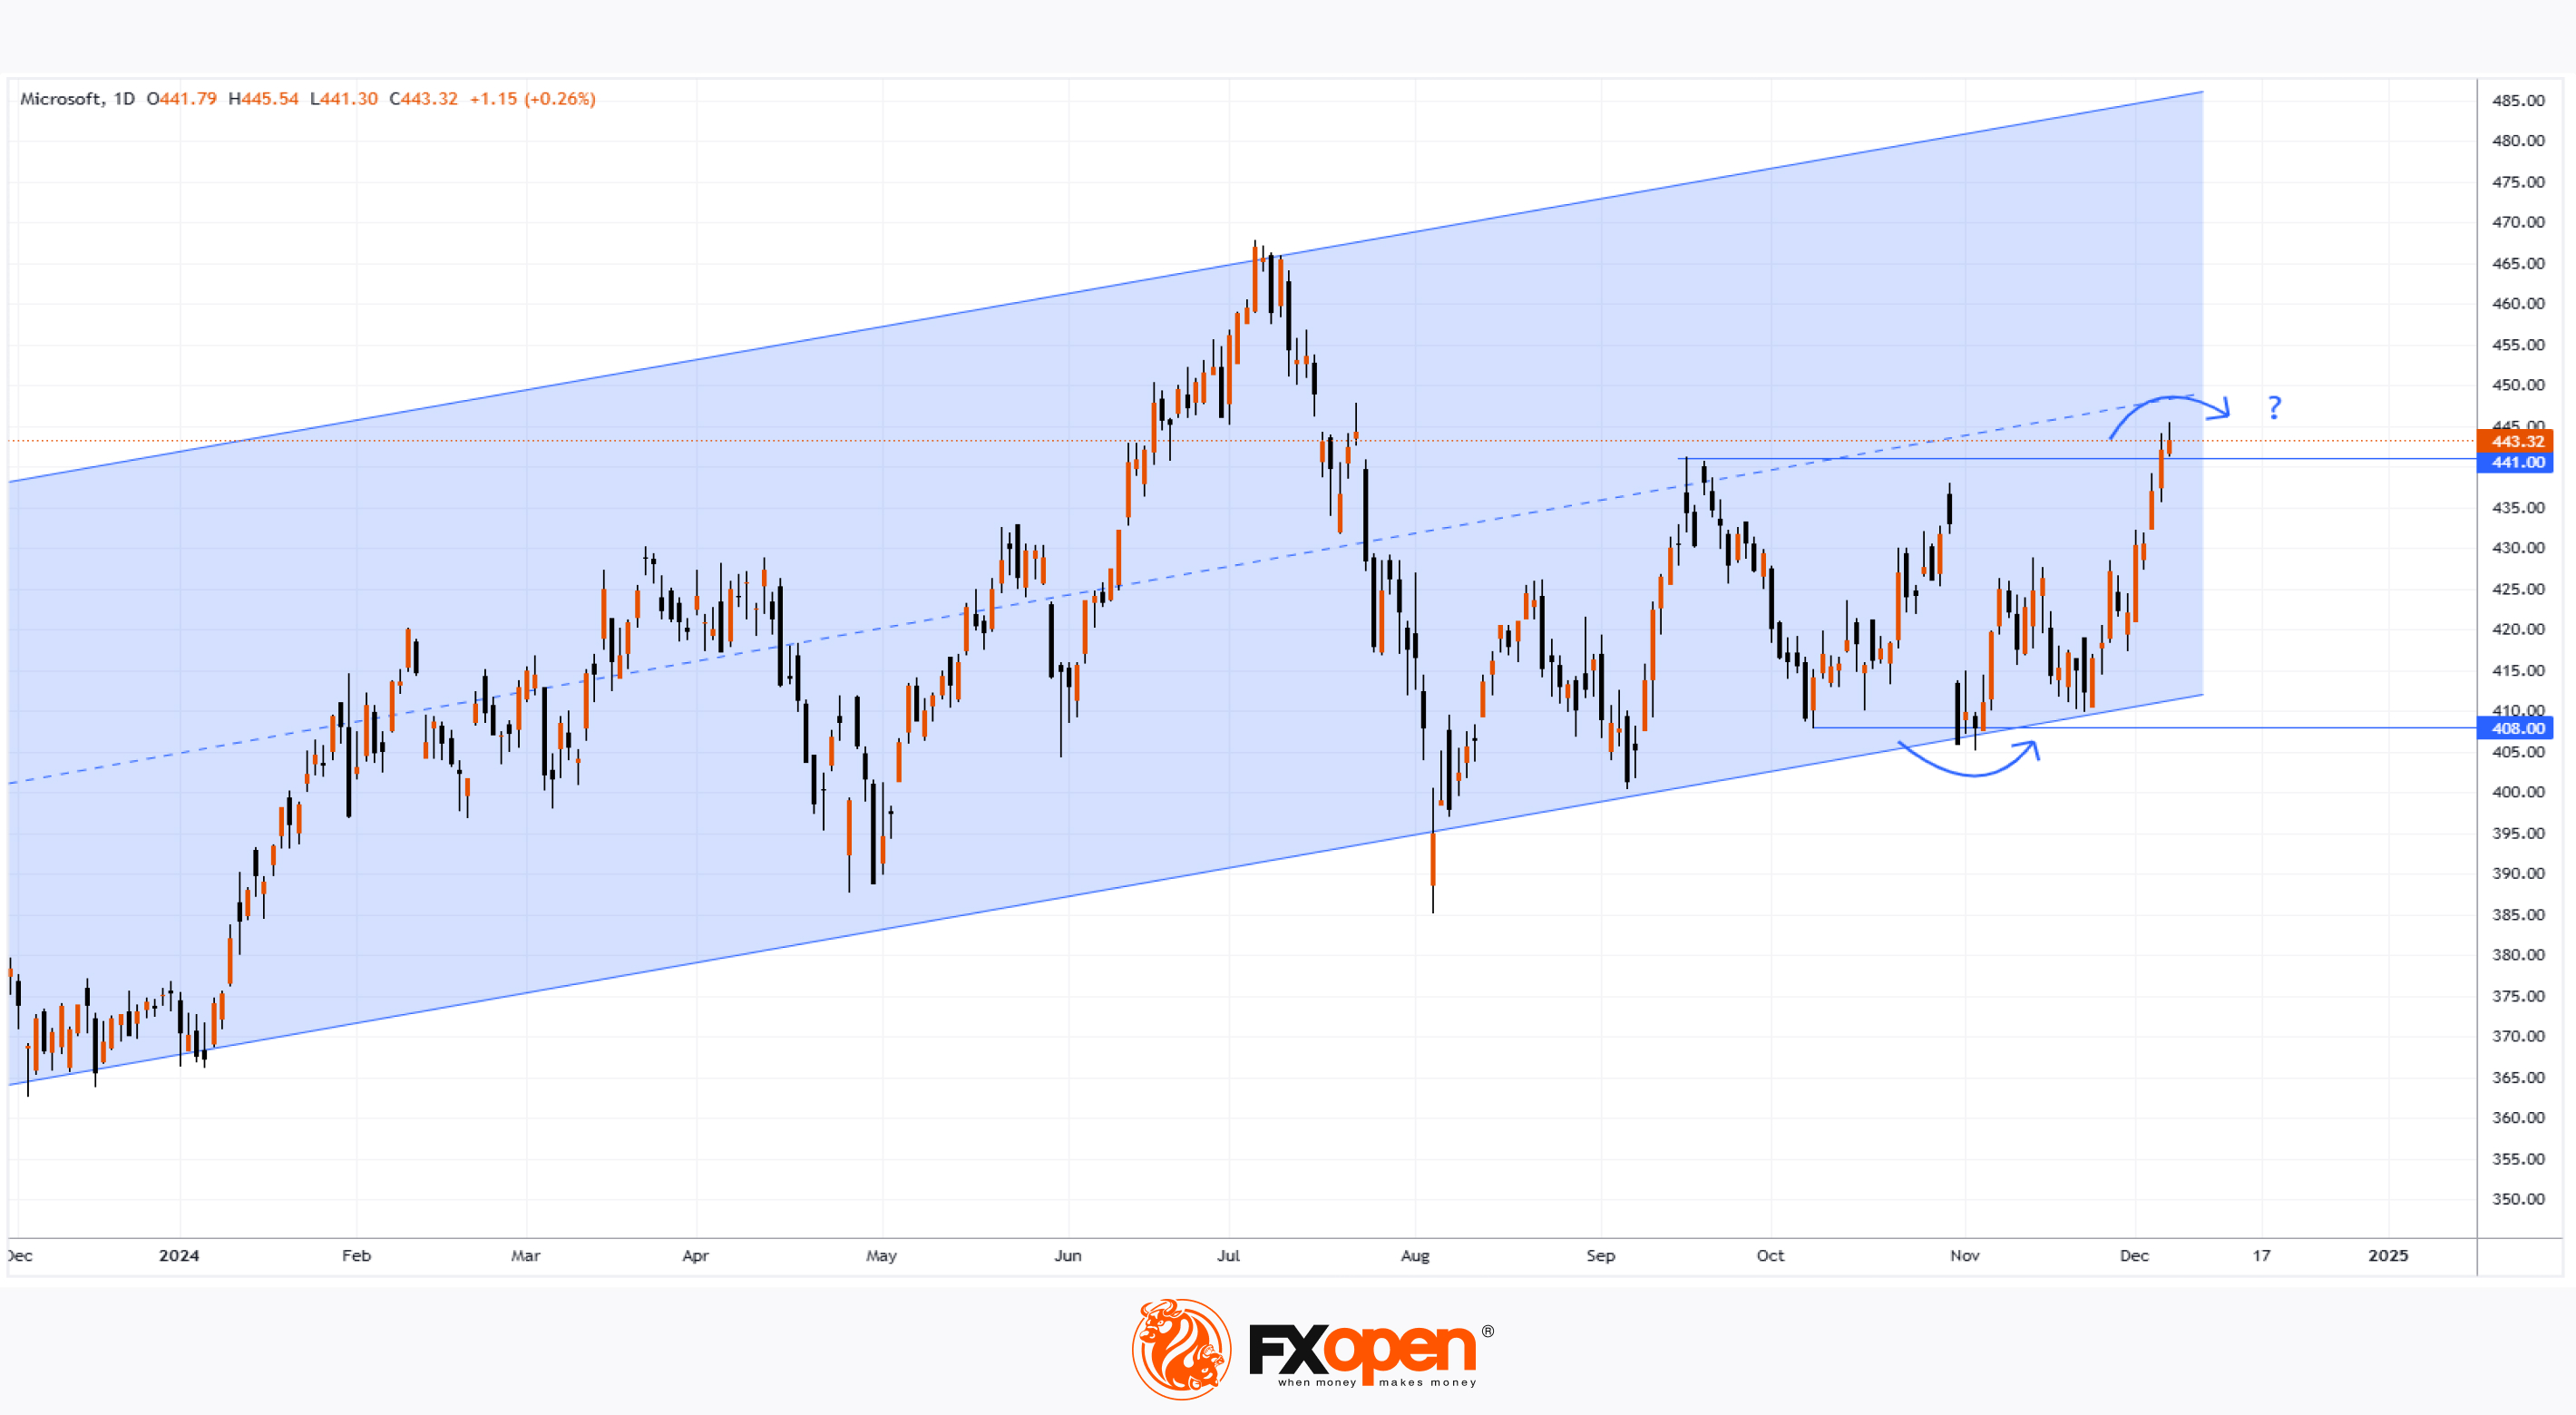
→ The price is forming a long-term upward channel, illustrated in blue.
→ The channel’s lower boundary serves as a significant support level.
On Friday, MSFT stock climbed to $445, its highest level since mid-July, buoyed by news that OpenAI may grant Microsoft access to key AI-related technologies.
Will the Price Continue to Rise?
There are reasons to suspect that the bullish momentum may not sustain.
Technical analysis of MSFT’s chart today suggests:
→ The price is near the median of the long-term channel, and this median could act as resistance. This is hinted at by the long upper shadows on Thursday and Friday’s candles.
→ The emerging bullish breakout above the September high around $441 might prove to be a false breakout, similar to the false bearish breakout of early October support near $408 (highlighted with arrows).
Additionally, Microsoft’s stock has underperformed compared to market indices, which are at historic highs. This could mean the price may retrace to $430 or lower, aligning more closely with average autumn levels.
Analysts, however, remain optimistic about MSFT’s prospects. According to TipRanks:
→ 26 out of 29 analysts recommend buying MSFT stock.
→ The average 12-month price target for MSFT is $497.
Trade global index CFDs with zero commission and tight spreads. Open your FXOpen account now or learn more about trading index CFDs with FXOpen.
CFDs are complex instruments and come with a high risk of losing your money.
This article represents the opinion of the Companies operating under the FXOpen brand only. It is not to be construed as an offer, solicitation, or recommendation with respect to products and services provided by the Companies operating under the FXOpen brand, nor is it to be considered financial advice.
Microsoft (MSFT) Stock Hits a 4.5-Month High
On 31 October, our analysis of Microsoft (MSFT) stock highlighted:
→ The price is forming a long-term upward channel, illustrated in blue.
→ The channel’s lower boundary serves as a significant support level.
On Friday, MSFT stock climbed to $445, its highest level since mid-July, buoyed by news that OpenAI may grant Microsoft access to key AI-related technologies.
Will the Price Continue to Rise?
There are reasons to suspect that the bullish momentum may not sustain.
Technical analysis of MSFT’s chart today suggests:
→ The price is near the median of the long-term channel, and this median could act as resistance. This is hinted at by the long upper shadows on Thursday and Friday’s candles.
→ The emerging bullish breakout above the September high around $441 might prove to be a false breakout, similar to the false bearish breakout of early October support near $408 (highlighted with arrows).
Additionally, Microsoft’s stock has underperformed compared to market indices, which are at historic highs. This could mean the price may retrace to $430 or lower, aligning more closely with average autumn levels.
Analysts, however, remain optimistic about MSFT’s prospects. According to TipRanks:
→ 26 out of 29 analysts recommend buying MSFT stock.
→ The average 12-month price target for MSFT is $497.
Trade global index CFDs with zero commission and tight spreads. Open your FXOpen account now or learn more about trading index CFDs with FXOpen.
CFDs are complex instruments and come with a high risk of losing your money.
This article represents the opinion of the Companies operating under the FXOpen brand only. It is not to be construed as an offer, solicitation, or recommendation with respect to products and services provided by the Companies operating under the FXOpen brand, nor is it to be considered financial advice.
👍2
#stockmarket #AAPL #MSFT #interestrates #marketanalysis #MarketNews
Market Insights with Gary Thomson: BoC, Fed & ECB Interest Rates, PCE Price Index, Earnings Reports
In this video, we’ll explore the key economic events, market trends, and corporate news shaping the financial landscape. Get ready for expert insights into forex, commodities, and stocks to help you navigate the week ahead. Let’s dive in!
In this episode:
🔸BoC Interest Rate Decision
Will the BoC cut rates? Discover the potential impacts on the USD/CAD pair
🔸 Fed Interest Rate Decision
In December, US stock markets dropped after the Fed signaled fewer rate cuts than expected. Will history repeat itself?
🔸 ECB Interest Rate Decision
After 4 reductions in 2024, will the ECB plan further cuts? Find out how this could impact the EUR/USD pair.
🔸 US PCE Price Index
In November 2024, annual PCE inflation rose for the second consecutive month. Will this trend continue, and how might the index impact the US dollar?
🔸 Corporate Earnings Statements
Big names like Meta, Tesla, Microsoft, and Apple are releasing their quarterly results. Check their expected performance and market implications.
Don’t miss out—gain insights to stay ahead in your trading journey.
https://cutt.ly/Be4lPhMh
To take advantage of price fluctuations in the foreign exchange markets, consider enlisting the services of a reliable broker like FXOpen.
⚠️
This forecast represents FXOpen Companies opinion only, it should not be construed as an offer, invitation or recommendation in respect to FXOpen Companies products and services or as financial advice.
Market Insights with Gary Thomson: BoC, Fed & ECB Interest Rates, PCE Price Index, Earnings Reports
In this video, we’ll explore the key economic events, market trends, and corporate news shaping the financial landscape. Get ready for expert insights into forex, commodities, and stocks to help you navigate the week ahead. Let’s dive in!
In this episode:
🔸BoC Interest Rate Decision
Will the BoC cut rates? Discover the potential impacts on the USD/CAD pair
🔸 Fed Interest Rate Decision
In December, US stock markets dropped after the Fed signaled fewer rate cuts than expected. Will history repeat itself?
🔸 ECB Interest Rate Decision
After 4 reductions in 2024, will the ECB plan further cuts? Find out how this could impact the EUR/USD pair.
🔸 US PCE Price Index
In November 2024, annual PCE inflation rose for the second consecutive month. Will this trend continue, and how might the index impact the US dollar?
🔸 Corporate Earnings Statements
Big names like Meta, Tesla, Microsoft, and Apple are releasing their quarterly results. Check their expected performance and market implications.
Don’t miss out—gain insights to stay ahead in your trading journey.
https://cutt.ly/Be4lPhMh
To take advantage of price fluctuations in the foreign exchange markets, consider enlisting the services of a reliable broker like FXOpen.
⚠️
This forecast represents FXOpen Companies opinion only, it should not be construed as an offer, invitation or recommendation in respect to FXOpen Companies products and services or as financial advice.
YouTube
Market Insights with Gary Thomson: BoC, Fed & ECB Interest Rates, PCE Price Index, Earnings Reports
In this video, we’ll explore the key economic events, market trends, and corporate news shaping the financial landscape. Get ready for expert insights into forex, commodities, and stocks to help you navigate the week ahead. Let’s dive in!
In this episode:…
In this episode:…
👍3
#MSFT #stockmarket #MarketUpdates #marketanalysis
Microsoft (MSFT) Shares Drop Over 6% After Earnings Report
According to the Microsoft (MSFT) stock chart:
→ The candle on 29 January closed around $441 before the company released its Q4 2024 earnings report.
→ As a result, the 30 January session opened with a significant bearish gap and closed lower at around $415, marking a total decline of over 6%, despite the company exceeding analysts' expectations.
Media reports indicate:
→ Earnings per share (EPS) stood at $3.23, surpassing the forecast of $3.11.
→ Total revenue reached $69.63 billion, beating the projected $68.78 billion.
However, investor concerns arose due to slowing growth in Microsoft's Azure cloud segment and rising AI development costs. Business Insider reports that Microsoft plans to spend $80 billion on AI infrastructure this financial year. While this substantial investment aims to strengthen its AI position, doubts remain about its long-term profitability.
The technical analysis of the Microsoft (MSFT) stock chart presents a concerning picture, as the price has dropped to a key support level—the lower boundary of the upward channel (shown in blue). This channel was formed by a strong bullish impulse in early 2024 (indicated by an arrow), driven by AI enthusiasm. However, sentiment has shifted, with AI now acting as a selling trigger, increasing the risk of MSFT breaking below this key support.
If this happens, MSFT may test the psychological level of $400 per share once again. Notably, in 2024, the price has not stayed below this level for long.
Despite the recent decline, analysts remain optimistic about MSFT stock. According to a TipRanks survey:
→ 27 out of 30 analysts recommend buying MSFT.
→ The average 12-month price target for MSFT is $508.
Trade global index CFDs with zero commission and tight spreads. Open your FXOpen account now or learn more about trading index CFDs with FXOpen.
CFDs are complex instruments and come with a high risk of losing your money.
This article represents the opinion of the Companies operating under the FXOpen brand only. It is not to be construed as an offer, solicitation, or recommendation with respect to products and services provided by the Companies operating under the FXOpen brand, nor is it to be considered financial advice.
Microsoft (MSFT) Shares Drop Over 6% After Earnings Report
According to the Microsoft (MSFT) stock chart:
→ The candle on 29 January closed around $441 before the company released its Q4 2024 earnings report.
→ As a result, the 30 January session opened with a significant bearish gap and closed lower at around $415, marking a total decline of over 6%, despite the company exceeding analysts' expectations.
Media reports indicate:
→ Earnings per share (EPS) stood at $3.23, surpassing the forecast of $3.11.
→ Total revenue reached $69.63 billion, beating the projected $68.78 billion.
However, investor concerns arose due to slowing growth in Microsoft's Azure cloud segment and rising AI development costs. Business Insider reports that Microsoft plans to spend $80 billion on AI infrastructure this financial year. While this substantial investment aims to strengthen its AI position, doubts remain about its long-term profitability.
The technical analysis of the Microsoft (MSFT) stock chart presents a concerning picture, as the price has dropped to a key support level—the lower boundary of the upward channel (shown in blue). This channel was formed by a strong bullish impulse in early 2024 (indicated by an arrow), driven by AI enthusiasm. However, sentiment has shifted, with AI now acting as a selling trigger, increasing the risk of MSFT breaking below this key support.
If this happens, MSFT may test the psychological level of $400 per share once again. Notably, in 2024, the price has not stayed below this level for long.
Despite the recent decline, analysts remain optimistic about MSFT stock. According to a TipRanks survey:
→ 27 out of 30 analysts recommend buying MSFT.
→ The average 12-month price target for MSFT is $508.
Trade global index CFDs with zero commission and tight spreads. Open your FXOpen account now or learn more about trading index CFDs with FXOpen.
CFDs are complex instruments and come with a high risk of losing your money.
This article represents the opinion of the Companies operating under the FXOpen brand only. It is not to be construed as an offer, solicitation, or recommendation with respect to products and services provided by the Companies operating under the FXOpen brand, nor is it to be considered financial advice.

👍3
#stockmarket #stocktrading #MSFT #MarketUpdates #marketanalysis
Microsoft (MSFT) Share Price Jumps Nearly 9% – What’s Next?
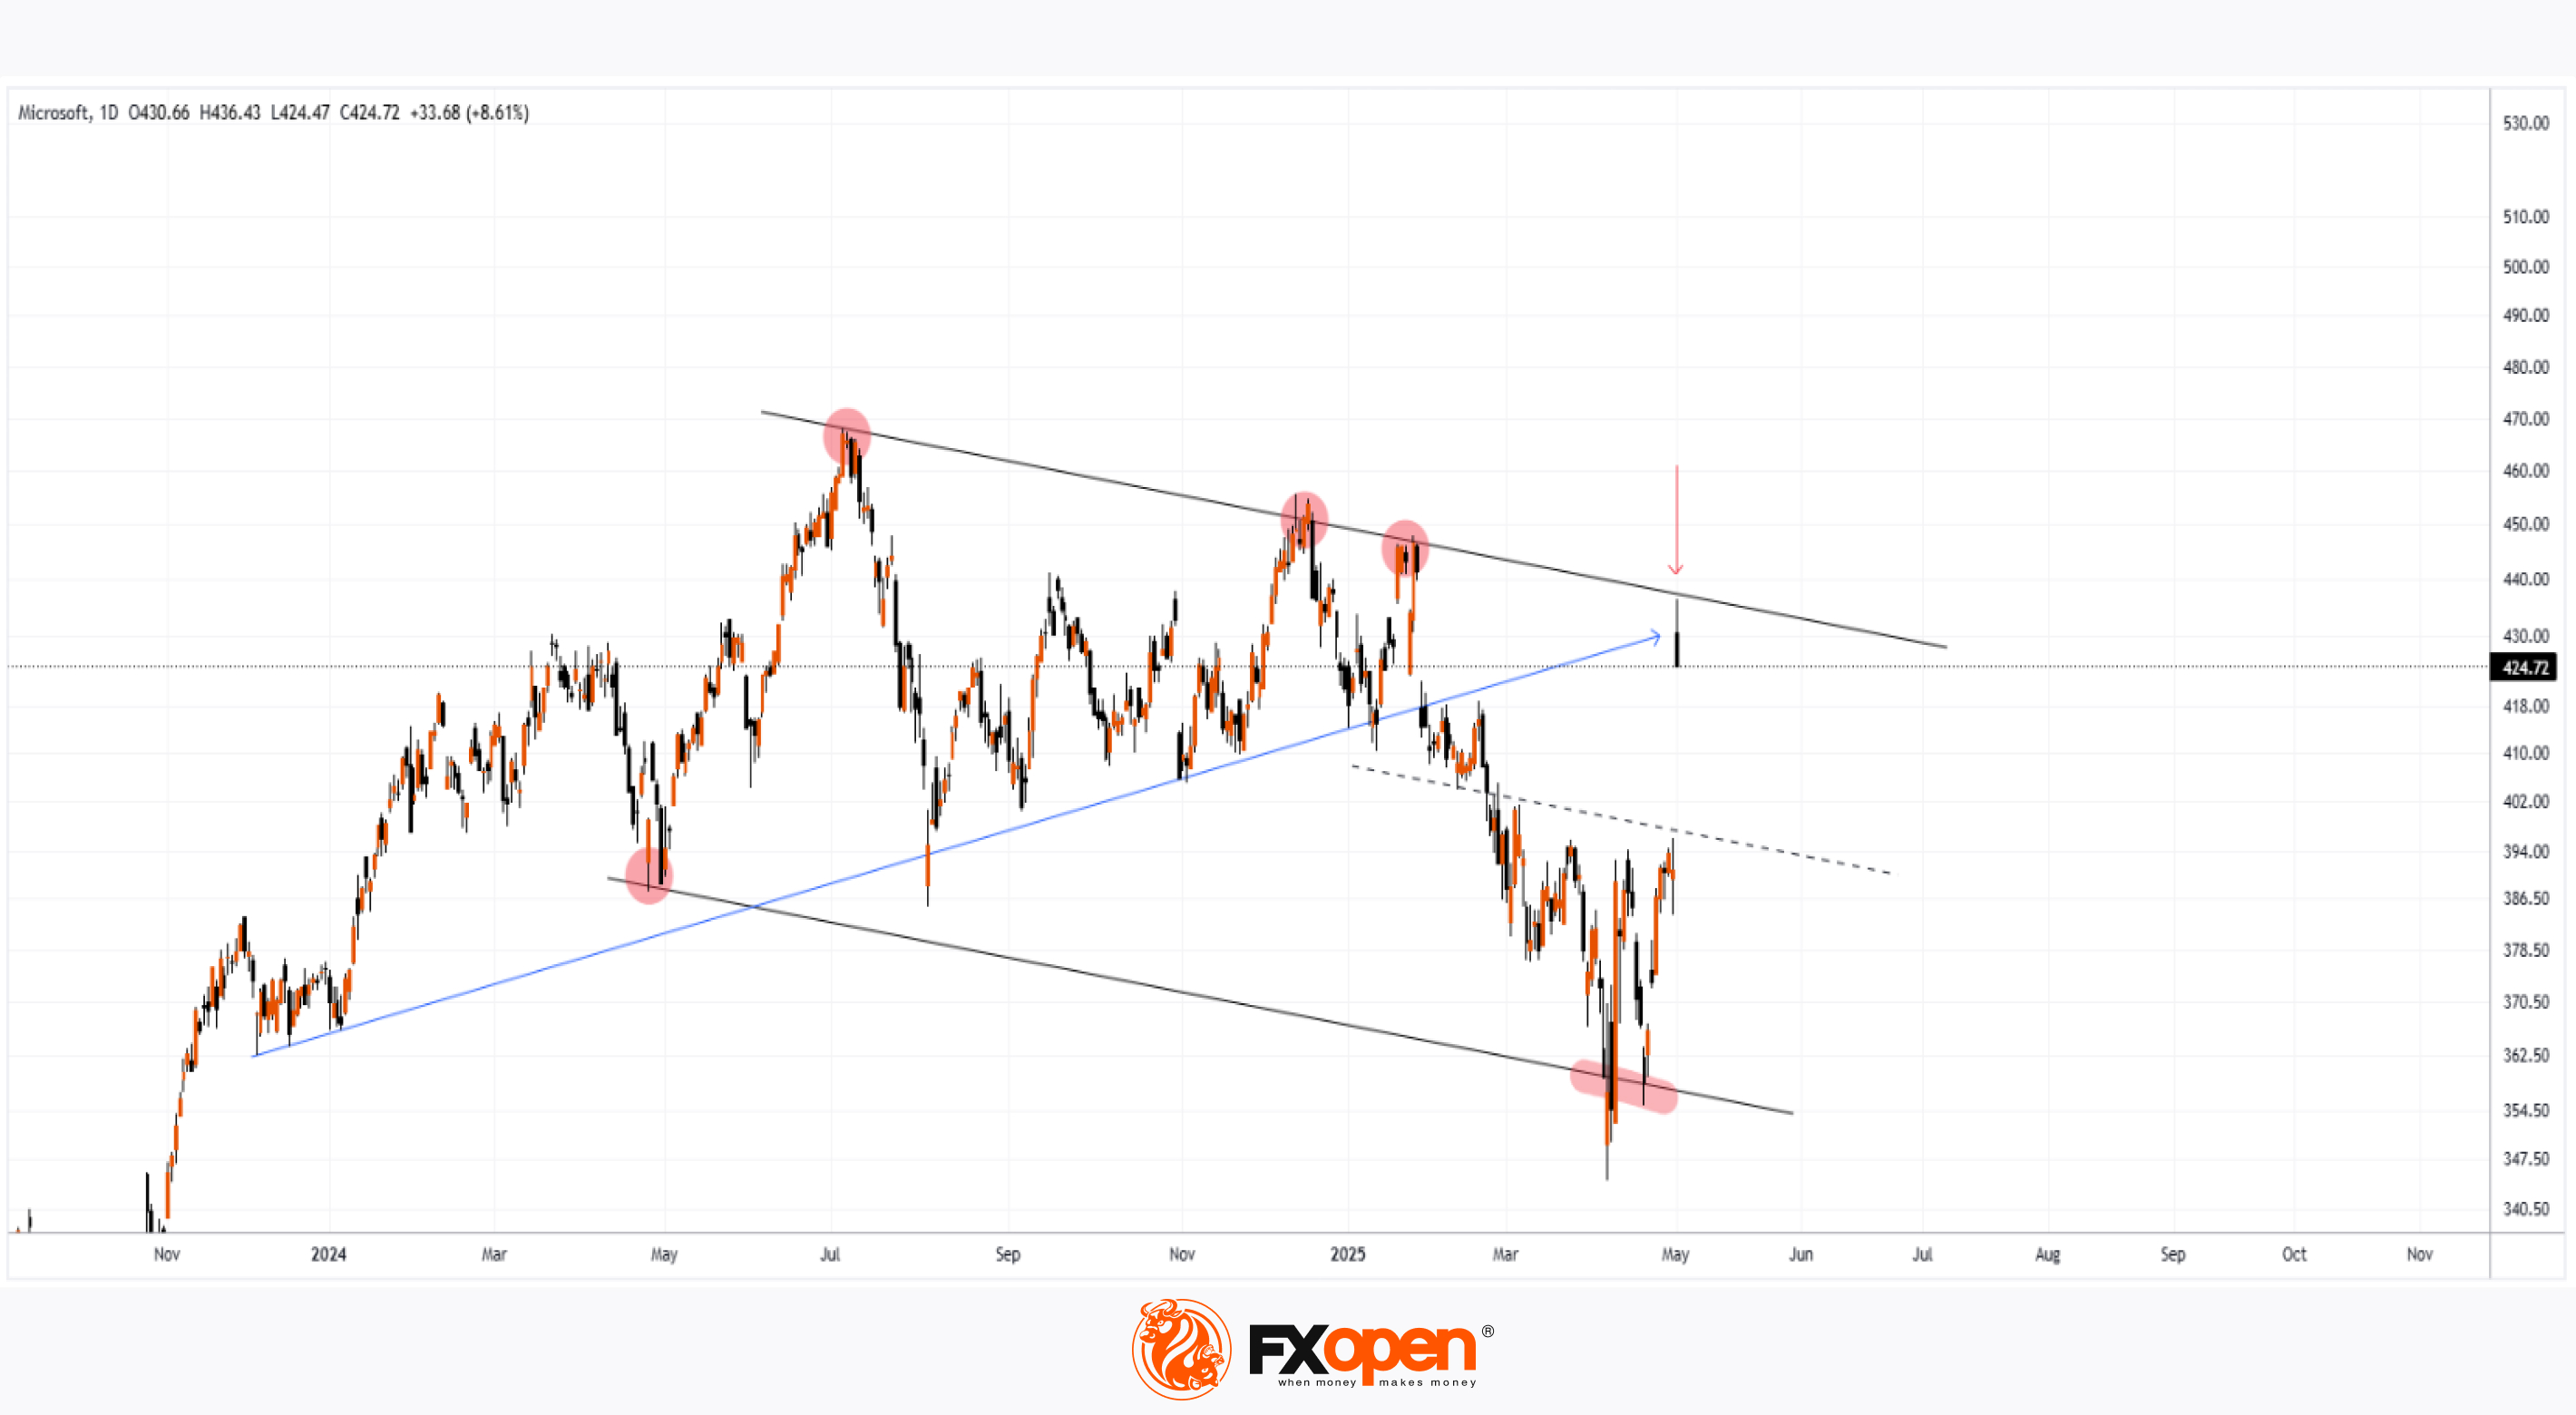
As the chart shows, Microsoft (MSFT) shares surged sharply, forming a large bullish gap: while trading closed around $391 on 30 April, yesterday’s candlestick closed just below the $425 mark.
What Drove the Rally in Microsoft Shares?
Microsoft released its financial results for the first quarter of 2025, exceeding Wall Street expectations on both revenue (actual = $70.1 billion, 2.4% above forecasts) and earnings per share (actual = $3.46, 7.4% above forecasts).
Particular attention was drawn to the strong performance of Azure – revenue from Azure and other cloud services soared by 33% year-on-year. A significant part of this growth was fuelled by robust demand for artificial intelligence services, which helps ease concerns about the return on large-scale infrastructure investments related to AI.
In addition, Microsoft issued an upbeat outlook for the next quarter, which ultimately triggered the sharp rise in its share price.
Technical Analysis of MSFT Chart
Yesterday’s candlestick closed near its low (highlighted by the arrow), indicating that bears were active during the trading session. From a technical analysis perspective, this can be explained by the proximity of the price to two key resistance lines:
1 → The upper boundary of a descending channel drawn from significant price action patterns (marked in red). The relevance of this channel is confirmed by the price’s behaviour near its median line (dashed).
2 → A former trendline that served as support throughout 2024.
Therefore, a short-term correction cannot be ruled out following the sharp rally in MSFT shares, potentially tempering some of the enthusiasm generated by Microsoft’s strong quarterly report.
Trade global index CFDs with zero commission and tight spreads. Open your FXOpen account now or learn more about trading index CFDs with FXOpen.
CFDs are complex instruments and come with a high risk of losing your money.
This article represents the opinion of the Companies operating under the FXOpen brand only. It is not to be construed as an offer, solicitation, or recommendation with respect to products and services provided by the Companies operating under the FXOpen brand, nor is it to be considered financial advice.
Microsoft (MSFT) Share Price Jumps Nearly 9% – What’s Next?
As the chart shows, Microsoft (MSFT) shares surged sharply, forming a large bullish gap: while trading closed around $391 on 30 April, yesterday’s candlestick closed just below the $425 mark.
What Drove the Rally in Microsoft Shares?
Microsoft released its financial results for the first quarter of 2025, exceeding Wall Street expectations on both revenue (actual = $70.1 billion, 2.4% above forecasts) and earnings per share (actual = $3.46, 7.4% above forecasts).
Particular attention was drawn to the strong performance of Azure – revenue from Azure and other cloud services soared by 33% year-on-year. A significant part of this growth was fuelled by robust demand for artificial intelligence services, which helps ease concerns about the return on large-scale infrastructure investments related to AI.
In addition, Microsoft issued an upbeat outlook for the next quarter, which ultimately triggered the sharp rise in its share price.
Technical Analysis of MSFT Chart
Yesterday’s candlestick closed near its low (highlighted by the arrow), indicating that bears were active during the trading session. From a technical analysis perspective, this can be explained by the proximity of the price to two key resistance lines:
1 → The upper boundary of a descending channel drawn from significant price action patterns (marked in red). The relevance of this channel is confirmed by the price’s behaviour near its median line (dashed).
2 → A former trendline that served as support throughout 2024.
Therefore, a short-term correction cannot be ruled out following the sharp rally in MSFT shares, potentially tempering some of the enthusiasm generated by Microsoft’s strong quarterly report.
Trade global index CFDs with zero commission and tight spreads. Open your FXOpen account now or learn more about trading index CFDs with FXOpen.
CFDs are complex instruments and come with a high risk of losing your money.
This article represents the opinion of the Companies operating under the FXOpen brand only. It is not to be construed as an offer, solicitation, or recommendation with respect to products and services provided by the Companies operating under the FXOpen brand, nor is it to be considered financial advice.
👍2
#stockmarket #stocktrading #MSFT #marketanalysis #MarketNews
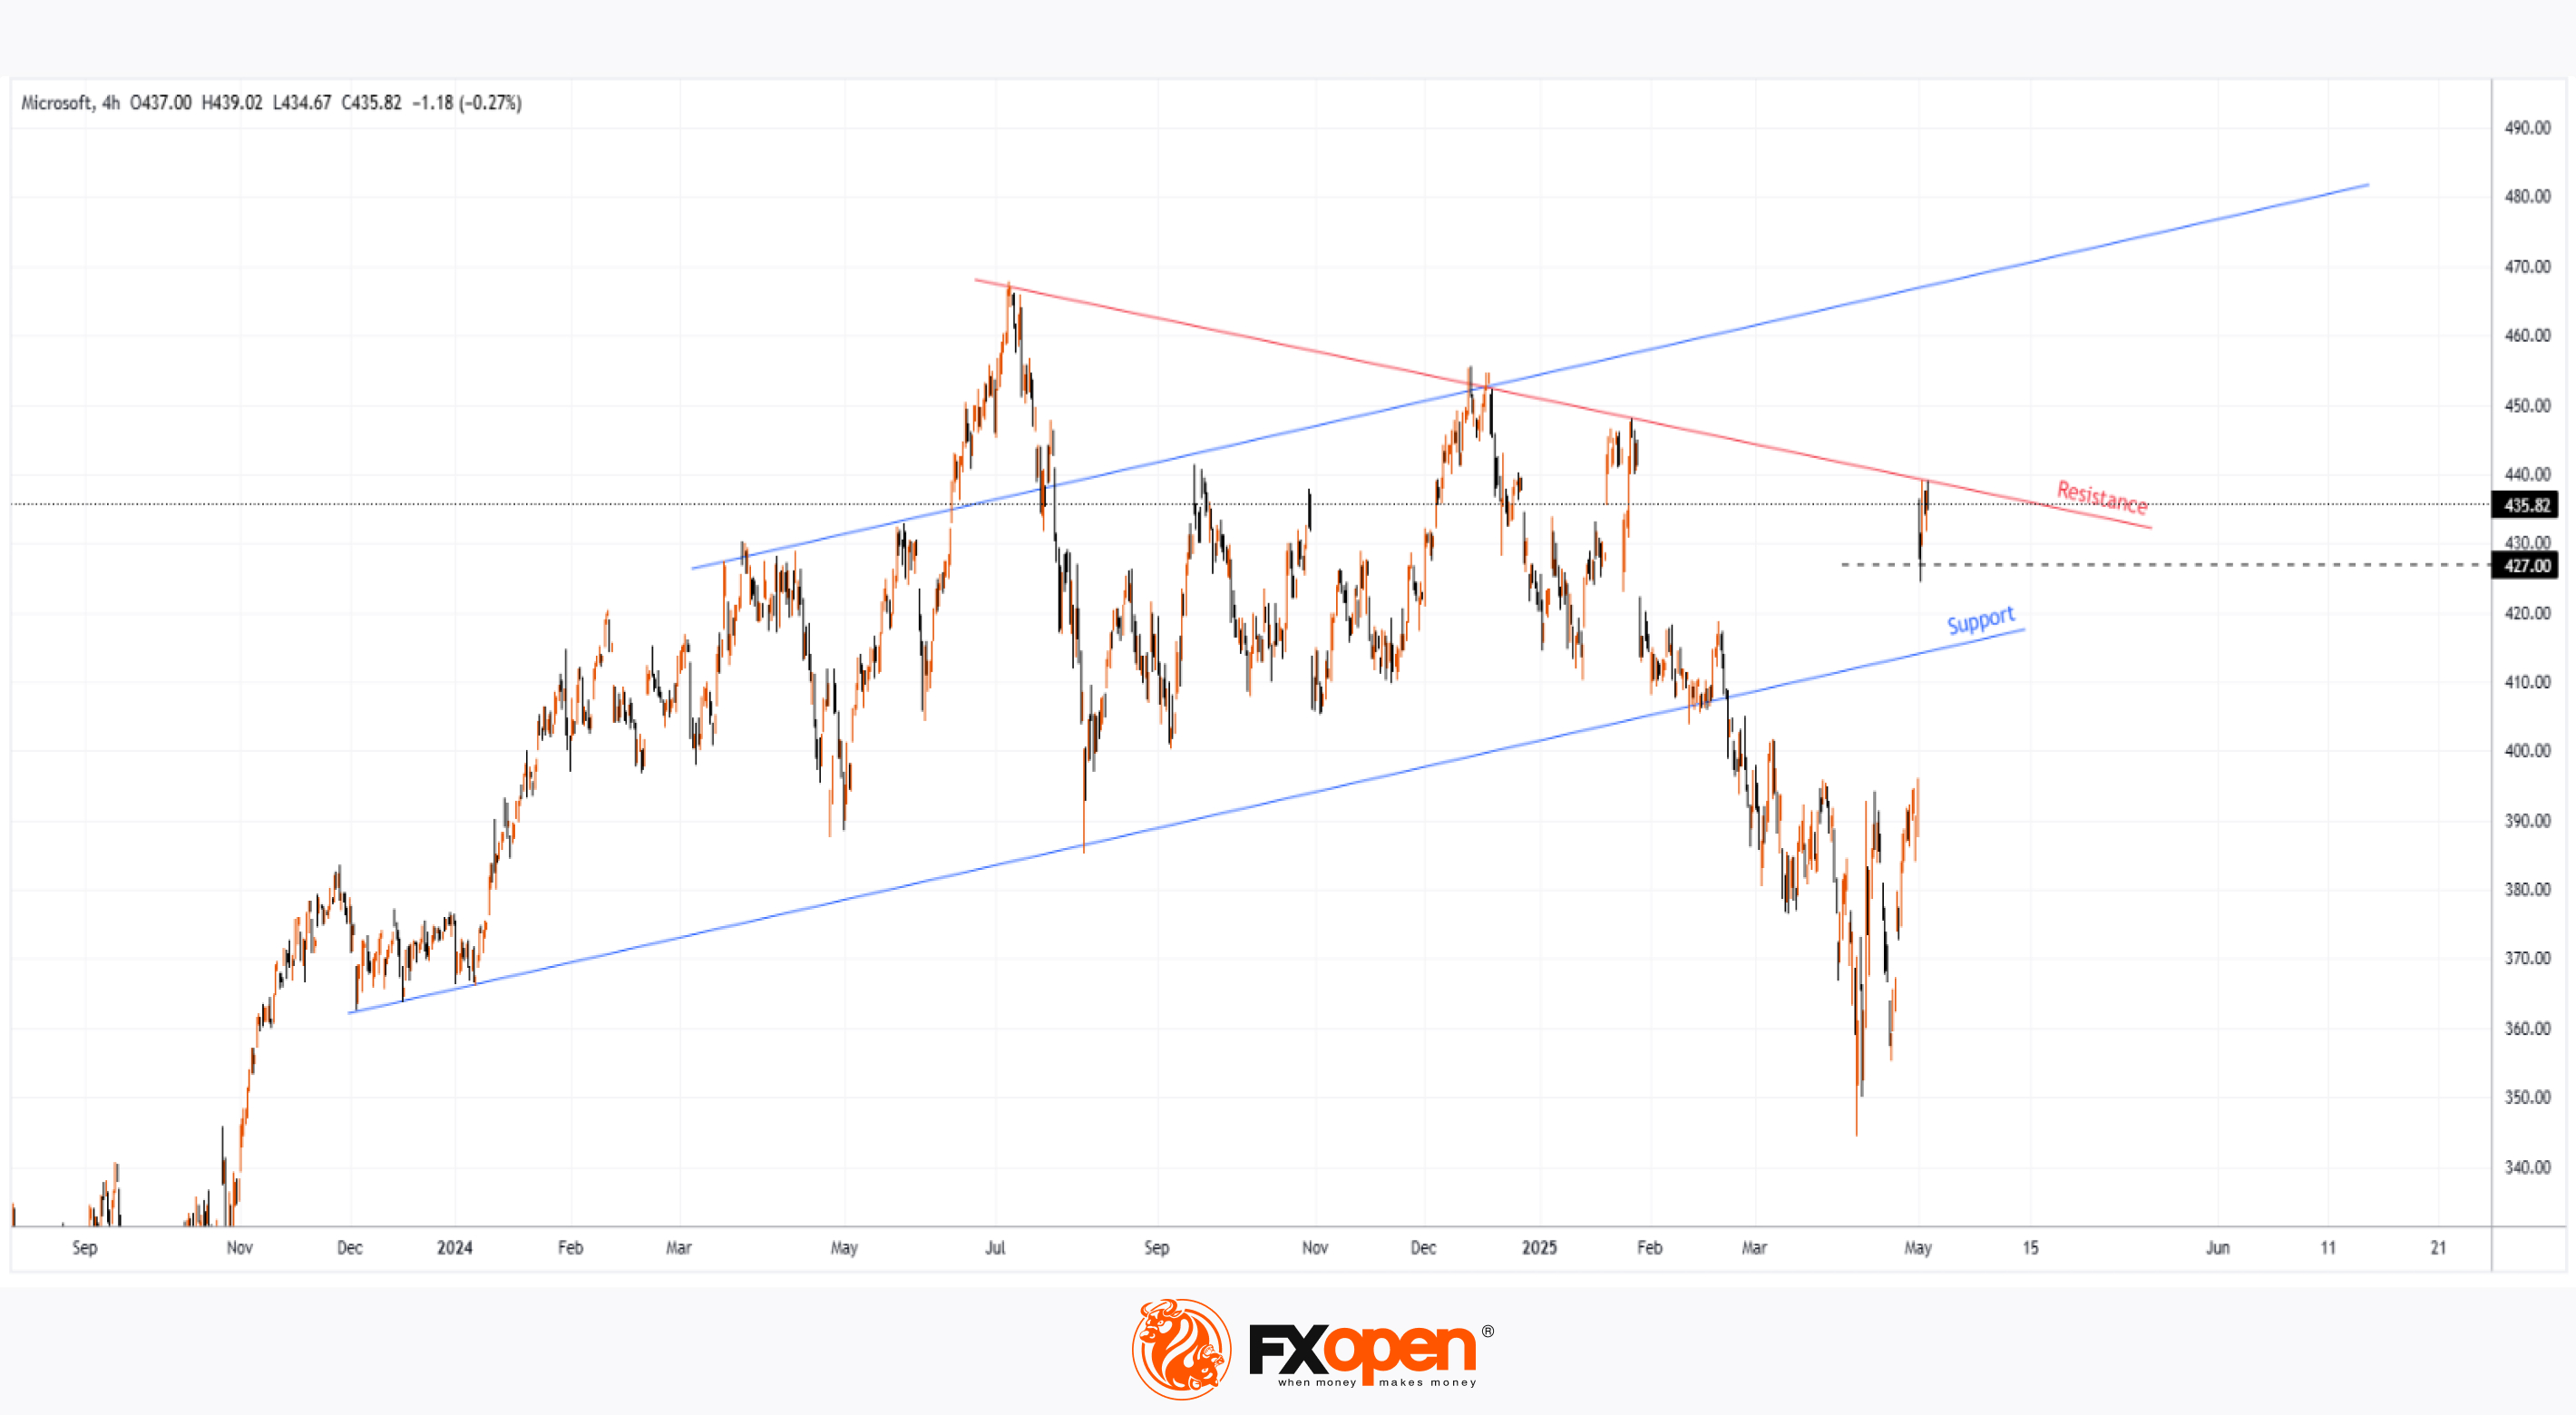
Microsoft (MSFT) Becomes the World’s Most Valuable Company
According to financial data, Microsoft’s market capitalisation currently stands at approximately $3.24 trillion, while the valuations of Apple and Nvidia — second and third on the list respectively — remain below $3 trillion.
This follows a sharp surge in Microsoft’s share price (MSFT), which has risen by over 26% from its April low.
Why has Microsoft’s share price risen?
The main driver behind the MSFT stock rally was last week’s quarterly report, which outperformed analysts’ expectations:
→ Earnings per share: actual = $3.46, forecast = $3.22;
→ Revenue: actual = $70 billion, forecast = $68.4 billion.
As reported in the media, investors responded positively to a notable increase in revenue from Azure cloud services.
Technical Analysis of Microsoft (MSFT) Shares
A wide bullish gap — over 7% — pushed the price above a key support line that had underpinned the 2024 uptrend in Microsoft stock.
However, following the report’s release, the price stabilised just below a resistance line drawn through previous key highs.
This provides grounds to interpret the current setup as a symmetrical triangle pattern with an axis around the $427 mark, suggesting short-term price consolidation within the defined boundaries.
Going forward, further key news related to Microsoft — a company less exposed to trade war impacts than Apple — could:
→ help maintain its status as the world’s most valuable firm;
→ support a potential bullish breakout through the resistance line and a continuation of the 2024 uptrend.
Trade global index CFDs with zero commission and tight spreads. Open your FXOpen account now or learn more about trading index CFDs with FXOpen.
CFDs are complex instruments and come with a high risk of losing your money.
This article represents the opinion of the Companies operating under the FXOpen brand only. It is not to be construed as an offer, solicitation, or recommendation with respect to products and services provided by the Companies operating under the FXOpen brand, nor is it to be considered financial advice.
Microsoft (MSFT) Becomes the World’s Most Valuable Company
According to financial data, Microsoft’s market capitalisation currently stands at approximately $3.24 trillion, while the valuations of Apple and Nvidia — second and third on the list respectively — remain below $3 trillion.
This follows a sharp surge in Microsoft’s share price (MSFT), which has risen by over 26% from its April low.
Why has Microsoft’s share price risen?
The main driver behind the MSFT stock rally was last week’s quarterly report, which outperformed analysts’ expectations:
→ Earnings per share: actual = $3.46, forecast = $3.22;
→ Revenue: actual = $70 billion, forecast = $68.4 billion.
As reported in the media, investors responded positively to a notable increase in revenue from Azure cloud services.
Technical Analysis of Microsoft (MSFT) Shares
A wide bullish gap — over 7% — pushed the price above a key support line that had underpinned the 2024 uptrend in Microsoft stock.
However, following the report’s release, the price stabilised just below a resistance line drawn through previous key highs.
This provides grounds to interpret the current setup as a symmetrical triangle pattern with an axis around the $427 mark, suggesting short-term price consolidation within the defined boundaries.
Going forward, further key news related to Microsoft — a company less exposed to trade war impacts than Apple — could:
→ help maintain its status as the world’s most valuable firm;
→ support a potential bullish breakout through the resistance line and a continuation of the 2024 uptrend.
Trade global index CFDs with zero commission and tight spreads. Open your FXOpen account now or learn more about trading index CFDs with FXOpen.
CFDs are complex instruments and come with a high risk of losing your money.
This article represents the opinion of the Companies operating under the FXOpen brand only. It is not to be construed as an offer, solicitation, or recommendation with respect to products and services provided by the Companies operating under the FXOpen brand, nor is it to be considered financial advice.
👍2
#MSFT #stockmarket #stocktrading #marketanalysis #MarketNews
Microsoft Stock (MSFT) Soars to Record High Following Strong Earnings Report
As the chart illustrates, Microsoft (MSFT) shares surged sharply after the close of the regular trading session – an immediate market reaction to the company’s strong quarterly results.
According to available data, MSFT's post-market price jumped to $555 per share, exceeding its previous all-time high by more than 8%.
Why Did MSFT Share Price Rise?
The quarterly report provided several reasons for optimism, including:
→ Earnings per share (EPS) came in at $3.65, beating analysts’ expectations of $3.37 by over 8%. Revenue also exceeded forecasts, totalling $76.4 billion versus the projected $73.9 billion.
→ Microsoft’s cloud revenue rose by 27% to $46.7 billion, while Azure’s annualised revenue exceeded $75 billion, driven by growing demand for AI-related services.
In response to these results, Barclays analysts quickly raised their price target for Microsoft shares from $550 to $625.
Technical Analysis of MSFT Chart
It is worth noting that the previous quarterly report was also strong, resulting in the formation of a large bullish gap on 1 May, followed by a sustained upward trend (highlighted by the purple trendline S). Importantly, the gap in the $395–425 range remains unfilled.
Yesterday’s report is also likely to result in a large bullish gap at the market open today, though this time, the market context could lead to a different scenario.
The key factor here is the long-term ascending channel (shown in blue), which reflects MSFT’s price movements throughout 2024–2025. After the previous strong report, the share price moved from the median to the upper boundary of the channel without setting a new record high. However, following the most recent report, the price has surged deep into overbought territory, potentially setting a multi-month high on the RSI and achieving a significant breakout to a new record.
As a result, once the initial excitement around the earnings subsides – and the desire of investors to close long positions intensifies – MSFT could undergo a correction from the upper boundary of the channel. In this scenario, the following support levels could come into play:
→ The psychological level of $550 in the short term;
→ The S trendline, as a possible support during a deeper correction.
Trade global index CFDs with zero commission and tight spreads. Open your FXOpen account now or learn more about trading index CFDs with FXOpen.
CFDs are complex instruments and come with a high risk of losing your money.
This article represents the opinion of the Companies operating under the FXOpen brand only. It is not to be construed as an offer, solicitation, or recommendation with respect to products and services provided by the Companies operating under the FXOpen brand, nor is it to be considered financial advice.
Microsoft Stock (MSFT) Soars to Record High Following Strong Earnings Report
As the chart illustrates, Microsoft (MSFT) shares surged sharply after the close of the regular trading session – an immediate market reaction to the company’s strong quarterly results.
According to available data, MSFT's post-market price jumped to $555 per share, exceeding its previous all-time high by more than 8%.
Why Did MSFT Share Price Rise?
The quarterly report provided several reasons for optimism, including:
→ Earnings per share (EPS) came in at $3.65, beating analysts’ expectations of $3.37 by over 8%. Revenue also exceeded forecasts, totalling $76.4 billion versus the projected $73.9 billion.
→ Microsoft’s cloud revenue rose by 27% to $46.7 billion, while Azure’s annualised revenue exceeded $75 billion, driven by growing demand for AI-related services.
In response to these results, Barclays analysts quickly raised their price target for Microsoft shares from $550 to $625.
Technical Analysis of MSFT Chart
It is worth noting that the previous quarterly report was also strong, resulting in the formation of a large bullish gap on 1 May, followed by a sustained upward trend (highlighted by the purple trendline S). Importantly, the gap in the $395–425 range remains unfilled.
Yesterday’s report is also likely to result in a large bullish gap at the market open today, though this time, the market context could lead to a different scenario.
The key factor here is the long-term ascending channel (shown in blue), which reflects MSFT’s price movements throughout 2024–2025. After the previous strong report, the share price moved from the median to the upper boundary of the channel without setting a new record high. However, following the most recent report, the price has surged deep into overbought territory, potentially setting a multi-month high on the RSI and achieving a significant breakout to a new record.
As a result, once the initial excitement around the earnings subsides – and the desire of investors to close long positions intensifies – MSFT could undergo a correction from the upper boundary of the channel. In this scenario, the following support levels could come into play:
→ The psychological level of $550 in the short term;
→ The S trendline, as a possible support during a deeper correction.
Trade global index CFDs with zero commission and tight spreads. Open your FXOpen account now or learn more about trading index CFDs with FXOpen.
CFDs are complex instruments and come with a high risk of losing your money.
This article represents the opinion of the Companies operating under the FXOpen brand only. It is not to be construed as an offer, solicitation, or recommendation with respect to products and services provided by the Companies operating under the FXOpen brand, nor is it to be considered financial advice.

👍2
#MSFT #stocks #stocktrading #stockmarket #marketanalysis #MarketNews
Microsoft (MSFT) shares fall below $460
As the Microsoft (MSFT) share chart shows:
→ yesterday’s candle closed below $460 — the lowest level since early June last year;
→ the decline from the all-time high near $550 has exceeded 16%.
Why MSFT shares are falling
The downward move may reflect a shift in market sentiment from AI-driven euphoria to a more sober reassessment of the actual returns on investment. Investors are locking in profits amid concerns that the company’s current infrastructure spending may not pay off in the near term.
Concerns have been reinforced by media reports of:
→ disappointing sales momentum for its AI products (Microsoft 365 Copilot);
→ intensifying competition, including from Google Gemini and Amazon AWS;
→ rising capital expenditure (forecast at more than $80bn per year).
Technical analysis of Microsoft (MSFT) shares
From a long-term perspective, the share price continues to move within a key ascending channel. In this context:
→ the lower boundary acted as support in April 2025;
→ the upper boundary has served as resistance. The orange arrows highlight aggressive selling pressure whenever the price moves beyond it. The black arrow points to rising volumes during the price decline in early November — a bearish signal following overbought conditions;
→ the QH line, which divides the upper half of the channel into two parts, has switched from support to resistance near the psychological $500 level;
→ the current price has fallen towards the channel’s median, where supply and demand typically come into balance (marked by the blue arrow).
In light of the above, it is reasonable to assume that the market may find an equilibrium that could persist until 28 January, when the quarterly earnings report is scheduled for release.
Trade global index CFDs with zero commission and tight spreads*. Learn more about trading index CFDs with FXOpen. *Additional fees may apply.
CFDs are complex instruments and come with a high risk of losing money rapidly due to leverage. You should consider whether you understand how CFDs work, and whether you can afford to take the high risk of losing your money. You can find the full disclaimer here: www.fxopen.com
This article represents the opinion of the Companies operating under the FXOpen brand only. It is not to be construed as an offer, solicitation, or recommendation with respect to products and services provided by the Companies operating under the FXOpen brand, nor is it to be considered financial advice.
Microsoft (MSFT) shares fall below $460
As the Microsoft (MSFT) share chart shows:
→ yesterday’s candle closed below $460 — the lowest level since early June last year;
→ the decline from the all-time high near $550 has exceeded 16%.
Why MSFT shares are falling
The downward move may reflect a shift in market sentiment from AI-driven euphoria to a more sober reassessment of the actual returns on investment. Investors are locking in profits amid concerns that the company’s current infrastructure spending may not pay off in the near term.
Concerns have been reinforced by media reports of:
→ disappointing sales momentum for its AI products (Microsoft 365 Copilot);
→ intensifying competition, including from Google Gemini and Amazon AWS;
→ rising capital expenditure (forecast at more than $80bn per year).
Technical analysis of Microsoft (MSFT) shares
From a long-term perspective, the share price continues to move within a key ascending channel. In this context:
→ the lower boundary acted as support in April 2025;
→ the upper boundary has served as resistance. The orange arrows highlight aggressive selling pressure whenever the price moves beyond it. The black arrow points to rising volumes during the price decline in early November — a bearish signal following overbought conditions;
→ the QH line, which divides the upper half of the channel into two parts, has switched from support to resistance near the psychological $500 level;
→ the current price has fallen towards the channel’s median, where supply and demand typically come into balance (marked by the blue arrow).
In light of the above, it is reasonable to assume that the market may find an equilibrium that could persist until 28 January, when the quarterly earnings report is scheduled for release.
Trade global index CFDs with zero commission and tight spreads*. Learn more about trading index CFDs with FXOpen. *Additional fees may apply.
CFDs are complex instruments and come with a high risk of losing money rapidly due to leverage. You should consider whether you understand how CFDs work, and whether you can afford to take the high risk of losing your money. You can find the full disclaimer here: www.fxopen.com
This article represents the opinion of the Companies operating under the FXOpen brand only. It is not to be construed as an offer, solicitation, or recommendation with respect to products and services provided by the Companies operating under the FXOpen brand, nor is it to be considered financial advice.
👍2
#MSFT #stockmarket #stocks #marketanalysis #MarketNews
Microsoft (MSFT) Shares Post a Record Decline
On Wednesday, after the close of the regular trading session, Microsoft (MSFT) released its quarterly earnings report, which exceeded analysts’ expectations:
→ Earnings per share: actual $4.14, forecast $3.90;
→ Gross revenue: actual $81.2bn, forecast $80.3bn;
→ Operating profit: up 21%.
Despite the strong results, MSFT shares suffered a dramatic sell-off of around 10% by the close of yesterday’s trading. According to media reports, this was the largest one-day drop in Microsoft’s share price on record, with the company losing roughly $360bn in market capitalisation.
Why MSFT Shares Collapsed
Market participants were most likely disappointed by the following factors:
→ A sharp rise in capital expenditure: capex surged by 66% to $37.5bn as Microsoft continued to invest heavily in data centres and AI infrastructure, while the timing of meaningful returns on these investments remains uncertain.
→ Slowing growth in the cloud computing segment.
Technical Analysis of Microsoft (MSFT) Shares
When analysing the MSFT chart on 15 January, we identified a key ascending channel reflecting the stock’s long-term price structure. At that time, we suggested that the market might find a temporary balance ahead of the earnings release.
Since then, although volatility persisted, the price showed an ability to recover from 22 January onwards, indicating that buyers were attempting to wrest control from sellers.
Yesterday’s record decline significantly altered the picture, but two factors are worth noting:
1 → The price fell below the 1 May low, entering the area of a broad bullish gap located above the psychological $400 level.
2 → In 2026, the market has been forming a descending channel (shown in red), with the price now reaching its lower boundary.
It is reasonable to assume that these two factors could act as support. The structure of yesterday’s candle supports this view: the session closed well above the low, and trading volumes were the highest in several years. This suggests active buying interest, with the price rebounding from around $422 to $433.
As a result, it is possible that the initial emotional reaction may fade and MSFT shares will avoid a further acceleration of the downtrend. However, a meaningful shift back to a bullish market structure would require strong fundamental catalysts.
Trade global index CFDs with zero commission and tight spreads*. Learn more about trading index CFDs with FXOpen. *Additional fees may apply.
CFDs are complex instruments and come with a high risk of losing money rapidly due to leverage. You should consider whether you understand how CFDs work, and whether you can afford to take the high risk of losing your money. You can find the full disclaimer here: www.fxopen.com
This article represents the opinion of the Companies operating under the FXOpen brand only. It is not to be construed as an offer, solicitation, or recommendation with respect to products and services provided by the Companies operating under the FXOpen brand, nor is it to be considered financial advice.
Microsoft (MSFT) Shares Post a Record Decline
On Wednesday, after the close of the regular trading session, Microsoft (MSFT) released its quarterly earnings report, which exceeded analysts’ expectations:
→ Earnings per share: actual $4.14, forecast $3.90;
→ Gross revenue: actual $81.2bn, forecast $80.3bn;
→ Operating profit: up 21%.
Despite the strong results, MSFT shares suffered a dramatic sell-off of around 10% by the close of yesterday’s trading. According to media reports, this was the largest one-day drop in Microsoft’s share price on record, with the company losing roughly $360bn in market capitalisation.
Why MSFT Shares Collapsed
Market participants were most likely disappointed by the following factors:
→ A sharp rise in capital expenditure: capex surged by 66% to $37.5bn as Microsoft continued to invest heavily in data centres and AI infrastructure, while the timing of meaningful returns on these investments remains uncertain.
→ Slowing growth in the cloud computing segment.
Technical Analysis of Microsoft (MSFT) Shares
When analysing the MSFT chart on 15 January, we identified a key ascending channel reflecting the stock’s long-term price structure. At that time, we suggested that the market might find a temporary balance ahead of the earnings release.
Since then, although volatility persisted, the price showed an ability to recover from 22 January onwards, indicating that buyers were attempting to wrest control from sellers.
Yesterday’s record decline significantly altered the picture, but two factors are worth noting:
1 → The price fell below the 1 May low, entering the area of a broad bullish gap located above the psychological $400 level.
2 → In 2026, the market has been forming a descending channel (shown in red), with the price now reaching its lower boundary.
It is reasonable to assume that these two factors could act as support. The structure of yesterday’s candle supports this view: the session closed well above the low, and trading volumes were the highest in several years. This suggests active buying interest, with the price rebounding from around $422 to $433.
As a result, it is possible that the initial emotional reaction may fade and MSFT shares will avoid a further acceleration of the downtrend. However, a meaningful shift back to a bullish market structure would require strong fundamental catalysts.
Trade global index CFDs with zero commission and tight spreads*. Learn more about trading index CFDs with FXOpen. *Additional fees may apply.
CFDs are complex instruments and come with a high risk of losing money rapidly due to leverage. You should consider whether you understand how CFDs work, and whether you can afford to take the high risk of losing your money. You can find the full disclaimer here: www.fxopen.com
This article represents the opinion of the Companies operating under the FXOpen brand only. It is not to be construed as an offer, solicitation, or recommendation with respect to products and services provided by the Companies operating under the FXOpen brand, nor is it to be considered financial advice.
👍1
#MSFT #stockmarket #stocktrading #marketanalysis #MarketNews
Microsoft Analysis: Earnings Beat Expectations
On 29 July 2026, Microsoft reported its results for the fourth quarter of fiscal year 2026. Revenue reached $90 billion, up 18% year-on-year, while adjusted earnings per share came in at $4.74, comfortably ahead of analysts' expectations of $4.24. The company exceeded consensus forecasts for both revenue and its cloud business, reflecting continued strong demand for AI infrastructure. The earnings release came after months of pressure on the stock, driven by investor concerns over the scale of capital expenditure required to expand Microsoft's cloud and AI capabilities.
Technical Analysis of Microsoft
Since the beginning of June, the MSFT chart has developed a clear short-term downtrend. After peaking near $465, the stock declined sharply along a descending trendline before finding support around $350 on 25 June. An unusually large bullish trading volume was recorded during the rebound from this area.
Since then, the stock has entered a recovery phase and is now trading between the POC (Point of Control) at $389.5 and the upper boundary of the current market profile at $400.5. The $405 resistance level sits just above the profile boundary and could reinforce resistance in this area.
Below the current price, two nearby support levels stand out: the lower boundary of the profile at $373.5 and the support level at $367. The RSI + MAs indicator currently shows readings of 50, 49 and 50, with all three values positioned in the middle of the neutral zone. Such a configuration is typically associated with a period of consolidation before the market develops its next directional move.
Summary
The near-term performance of Microsoft shares is likely to depend more on how investors reassess the company's recently reported operating results than on the reaction to individual technical levels. For now, the debate surrounding capital expenditure on AI infrastructure remains the dominant fundamental theme shaping market sentiment.
Trade global index CFDs with zero commission and tight spreads*. Learn more about trading index CFDs with FXOpen. *Additional fees may apply.
CFDs are complex instruments and come with a high risk of losing money rapidly due to leverage. You should consider whether you understand how CFDs work, and whether you can afford to take the high risk of losing your money. You can find the full disclaimer here: www.fxopen.com
This article represents the opinion of the Companies operating under the FXOpen brand only. It is not to be construed as an offer, solicitation, or recommendation with respect to products and services provided by the Companies operating under the FXOpen brand, nor is it to be considered financial advice.
Microsoft Analysis: Earnings Beat Expectations
On 29 July 2026, Microsoft reported its results for the fourth quarter of fiscal year 2026. Revenue reached $90 billion, up 18% year-on-year, while adjusted earnings per share came in at $4.74, comfortably ahead of analysts' expectations of $4.24. The company exceeded consensus forecasts for both revenue and its cloud business, reflecting continued strong demand for AI infrastructure. The earnings release came after months of pressure on the stock, driven by investor concerns over the scale of capital expenditure required to expand Microsoft's cloud and AI capabilities.
Technical Analysis of Microsoft
Since the beginning of June, the MSFT chart has developed a clear short-term downtrend. After peaking near $465, the stock declined sharply along a descending trendline before finding support around $350 on 25 June. An unusually large bullish trading volume was recorded during the rebound from this area.
Since then, the stock has entered a recovery phase and is now trading between the POC (Point of Control) at $389.5 and the upper boundary of the current market profile at $400.5. The $405 resistance level sits just above the profile boundary and could reinforce resistance in this area.
Below the current price, two nearby support levels stand out: the lower boundary of the profile at $373.5 and the support level at $367. The RSI + MAs indicator currently shows readings of 50, 49 and 50, with all three values positioned in the middle of the neutral zone. Such a configuration is typically associated with a period of consolidation before the market develops its next directional move.
Summary
The near-term performance of Microsoft shares is likely to depend more on how investors reassess the company's recently reported operating results than on the reaction to individual technical levels. For now, the debate surrounding capital expenditure on AI infrastructure remains the dominant fundamental theme shaping market sentiment.
Trade global index CFDs with zero commission and tight spreads*. Learn more about trading index CFDs with FXOpen. *Additional fees may apply.
CFDs are complex instruments and come with a high risk of losing money rapidly due to leverage. You should consider whether you understand how CFDs work, and whether you can afford to take the high risk of losing your money. You can find the full disclaimer here: www.fxopen.com
This article represents the opinion of the Companies operating under the FXOpen brand only. It is not to be construed as an offer, solicitation, or recommendation with respect to products and services provided by the Companies operating under the FXOpen brand, nor is it to be considered financial advice.
👍1
#MSFT #stockmarket #stocktrading #marketanalysis #MarketNews
Microsoft: AI Payoff or AI Overspend — The Chart Weighs In
Microsoft's stock has lived two very different lives in the space of a month. On July 30, shares surged 15.5% in a single session, their biggest one-day jump since 2020, wiping out nearly all of 2026's earlier losses, after fiscal Q4 earnings crushed expectations: Azure revenue growth accelerated to 43% year-over-year, crossing $100 billion in annual revenue for the first time, while Microsoft 365 Copilot surpassed 30 million paid seats.
That euphoria has since cooled. Morgan Stanley sounded a fresh alarm this week, warning that the gap between Microsoft's massive AI capital spending, some $190 billion planned for infrastructure, and the revenue it's actually generating continues to widen, pressuring near-term cash flow. Shares dropped over 3% on the news, adding to a separate wave of investor-lawsuit headlines questioning the company's earlier disclosures.
Still, Wall Street's underlying conviction hasn't wavered: 56 analysts maintain a "Strong Buy" consensus with an average price target above $560. The tension is clear, genuine AI monetization proof from Azure against mounting concerns that the spending required to sustain it may be outpacing the payoff.
Technical Analysis of Microsoft
As the daily chart shows, Microsoft broke decisively above the descending trendline from January's highs during July's earnings surge, a genuinely significant technical shift after months of decline. Price has since pulled back from the 512 highs and is now consolidating just above the 460-470 support zone, with the 0.382 and 0.5 Fibonacci retracements, along with the 100-period EMA near $426.60, still sitting well below as the next real tests.
Bullish Scenario
Should buyers defend the 460-470 support and the reclaimed trendline, the breakout structure remains intact. A renewed push higher would target a retest of the 512 highs, the 0 Fibonacci level marking the origin of the entire decline, confirming the July rally has genuine staying power.
Bearish Scenario
Conversely, a break below the 460-470 support would expose the 0.382 retracement first, with a deeper slide bringing price down toward the more significant confluence of the 0.5 Fibonacci retracement and the 100-period EMA near $426-430, a zone that would need to hold to prevent a full reversal of July's breakout. A break below even that would risk exposing the 0.618 level near $410.
With price still comfortably above its key support and the more decisive trendline-EMA confluence still some distance below, Microsoft's next move looks set to determine whether July's historic rally has real staying power, or whether the stock is only beginning to give back its gains.
Trade global index CFDs with zero commission and tight spreads*. Learn more about trading index CFDs with FXOpen. *Additional fees may apply.
CFDs are complex instruments and come with a high risk of losing money rapidly due to leverage. You should consider whether you understand how CFDs work, and whether you can afford to take the high risk of losing your money. You can find the full disclaimer here: www.fxopen.com
This article represents the opinion of the Companies operating under the FXOpen brand only. It is not to be construed as an offer, solicitation, or recommendation with respect to products and services provided by the Companies operating under the FXOpen brand, nor is it to be considered financial advice.
Microsoft: AI Payoff or AI Overspend — The Chart Weighs In
Microsoft's stock has lived two very different lives in the space of a month. On July 30, shares surged 15.5% in a single session, their biggest one-day jump since 2020, wiping out nearly all of 2026's earlier losses, after fiscal Q4 earnings crushed expectations: Azure revenue growth accelerated to 43% year-over-year, crossing $100 billion in annual revenue for the first time, while Microsoft 365 Copilot surpassed 30 million paid seats.
That euphoria has since cooled. Morgan Stanley sounded a fresh alarm this week, warning that the gap between Microsoft's massive AI capital spending, some $190 billion planned for infrastructure, and the revenue it's actually generating continues to widen, pressuring near-term cash flow. Shares dropped over 3% on the news, adding to a separate wave of investor-lawsuit headlines questioning the company's earlier disclosures.
Still, Wall Street's underlying conviction hasn't wavered: 56 analysts maintain a "Strong Buy" consensus with an average price target above $560. The tension is clear, genuine AI monetization proof from Azure against mounting concerns that the spending required to sustain it may be outpacing the payoff.
Technical Analysis of Microsoft
As the daily chart shows, Microsoft broke decisively above the descending trendline from January's highs during July's earnings surge, a genuinely significant technical shift after months of decline. Price has since pulled back from the 512 highs and is now consolidating just above the 460-470 support zone, with the 0.382 and 0.5 Fibonacci retracements, along with the 100-period EMA near $426.60, still sitting well below as the next real tests.
Bullish Scenario
Should buyers defend the 460-470 support and the reclaimed trendline, the breakout structure remains intact. A renewed push higher would target a retest of the 512 highs, the 0 Fibonacci level marking the origin of the entire decline, confirming the July rally has genuine staying power.
Bearish Scenario
Conversely, a break below the 460-470 support would expose the 0.382 retracement first, with a deeper slide bringing price down toward the more significant confluence of the 0.5 Fibonacci retracement and the 100-period EMA near $426-430, a zone that would need to hold to prevent a full reversal of July's breakout. A break below even that would risk exposing the 0.618 level near $410.
With price still comfortably above its key support and the more decisive trendline-EMA confluence still some distance below, Microsoft's next move looks set to determine whether July's historic rally has real staying power, or whether the stock is only beginning to give back its gains.
Trade global index CFDs with zero commission and tight spreads*. Learn more about trading index CFDs with FXOpen. *Additional fees may apply.
CFDs are complex instruments and come with a high risk of losing money rapidly due to leverage. You should consider whether you understand how CFDs work, and whether you can afford to take the high risk of losing your money. You can find the full disclaimer here: www.fxopen.com
This article represents the opinion of the Companies operating under the FXOpen brand only. It is not to be construed as an offer, solicitation, or recommendation with respect to products and services provided by the Companies operating under the FXOpen brand, nor is it to be considered financial advice.
👍2
#microsoft #MSFT #stockmarket #marketanalysis #MarketNews
Microsoft Analysis: Attempt to Hold Below the Wedge and Profile
On 3 September, OpenAI unveiled its new flagship GPT-6 Astra model, which became available to Microsoft Foundry customers. Microsoft positions the model as a system designed to handle complex, multi-step tasks, including planning sequences of actions, working with documents and spreadsheets, and interacting with applications and interfaces, including scenarios where specialised API capabilities are limited. The expansion of the AI model range available through Microsoft Foundry strengthens Azure’s capabilities for enterprise AI adoption. For Microsoft shares, such product announcements provide an additional positive fundamental backdrop, reflecting the company’s continued development of its AI business.
Microsoft Technical Analysis
On Microsoft’s four-hour chart, a pattern resembling a rising wedge has formed near the top of a pronounced uptrend that began in late June. A breakout attempt is now underway: alongside the pattern’s lower boundary, the price has also broken below the lower boundary of the current market profile at $497.50 and is attempting to establish itself below both levels. If the downside scenario develops, market participants could look towards the green support level around $478.50.
The red resistance level is located around $517.50 at the top of the wedge and is very close to the profile’s upper boundary at $515.50. Meanwhile, the Point of Control (POC) is at $505.00 and should be taken into account when assessing the current setup from a bullish perspective. The RSI + MAs indicator shows readings of 46, 51 and 56, with the oscillator and both moving averages remaining in the neutral zone. It is therefore too early to consider the downside breakout of the pattern confirmed.
Key Takeaways
The attempt to establish the price below both the wedge and the lower boundary of the profile has yet to receive confirmation from the oscillator. The neutral RSI + MAs picture leaves the breakout scenario unresolved. The continued expansion of Microsoft’s AI product offering provides an additional positive backdrop for the shares.
Trade global index CFDs with zero commission and tight spreads*. Learn more about trading index CFDs with FXOpen. *Additional fees may apply.
CFDs are complex instruments and come with a high risk of losing money rapidly due to leverage. You should consider whether you understand how CFDs work, and whether you can afford to take the high risk of losing your money. You can find the full disclaimer here: www.fxopen.com
This article represents the opinion of the Companies operating under the FXOpen brand only. It is not to be construed as an offer, solicitation, or recommendation with respect to products and services provided by the Companies operating under the FXOpen brand, nor is it to be considered financial advice.
Microsoft Analysis: Attempt to Hold Below the Wedge and Profile
On 3 September, OpenAI unveiled its new flagship GPT-6 Astra model, which became available to Microsoft Foundry customers. Microsoft positions the model as a system designed to handle complex, multi-step tasks, including planning sequences of actions, working with documents and spreadsheets, and interacting with applications and interfaces, including scenarios where specialised API capabilities are limited. The expansion of the AI model range available through Microsoft Foundry strengthens Azure’s capabilities for enterprise AI adoption. For Microsoft shares, such product announcements provide an additional positive fundamental backdrop, reflecting the company’s continued development of its AI business.
Microsoft Technical Analysis
On Microsoft’s four-hour chart, a pattern resembling a rising wedge has formed near the top of a pronounced uptrend that began in late June. A breakout attempt is now underway: alongside the pattern’s lower boundary, the price has also broken below the lower boundary of the current market profile at $497.50 and is attempting to establish itself below both levels. If the downside scenario develops, market participants could look towards the green support level around $478.50.
The red resistance level is located around $517.50 at the top of the wedge and is very close to the profile’s upper boundary at $515.50. Meanwhile, the Point of Control (POC) is at $505.00 and should be taken into account when assessing the current setup from a bullish perspective. The RSI + MAs indicator shows readings of 46, 51 and 56, with the oscillator and both moving averages remaining in the neutral zone. It is therefore too early to consider the downside breakout of the pattern confirmed.
Key Takeaways
The attempt to establish the price below both the wedge and the lower boundary of the profile has yet to receive confirmation from the oscillator. The neutral RSI + MAs picture leaves the breakout scenario unresolved. The continued expansion of Microsoft’s AI product offering provides an additional positive backdrop for the shares.
Trade global index CFDs with zero commission and tight spreads*. Learn more about trading index CFDs with FXOpen. *Additional fees may apply.
CFDs are complex instruments and come with a high risk of losing money rapidly due to leverage. You should consider whether you understand how CFDs work, and whether you can afford to take the high risk of losing your money. You can find the full disclaimer here: www.fxopen.com
This article represents the opinion of the Companies operating under the FXOpen brand only. It is not to be construed as an offer, solicitation, or recommendation with respect to products and services provided by the Companies operating under the FXOpen brand, nor is it to be considered financial advice.
👍3