#MarketNews #AAPL #stockmarket
Market Analysis: Apple Stock Plunges 2% Despite Better-than-expected Sales
Yesterday, after the close of the main trading session on the stock exchange, the largest company by capitalization reported for the quarter.
→ AAPL EPS of USD 1.26 (expected $1.195);
→ Gross revenue was USD 81.8 billion (as expected);
→ The decline in iPhone sales was offset by strong sales in the services segment (which includes Apple TV+) and sales in China, which were up 8% year-on-year.
However, AAPL's share price fell in premarket today, probably because market participants are concerned about:
→ a forecast for a further decline in iPhone sales;
→ vague prospects for the release of a new product Vision Pro;
→ Apple's rising R&D spending reaching USD 22.61 billion a year.
The capitalization of the company fell below USD 3 billion.
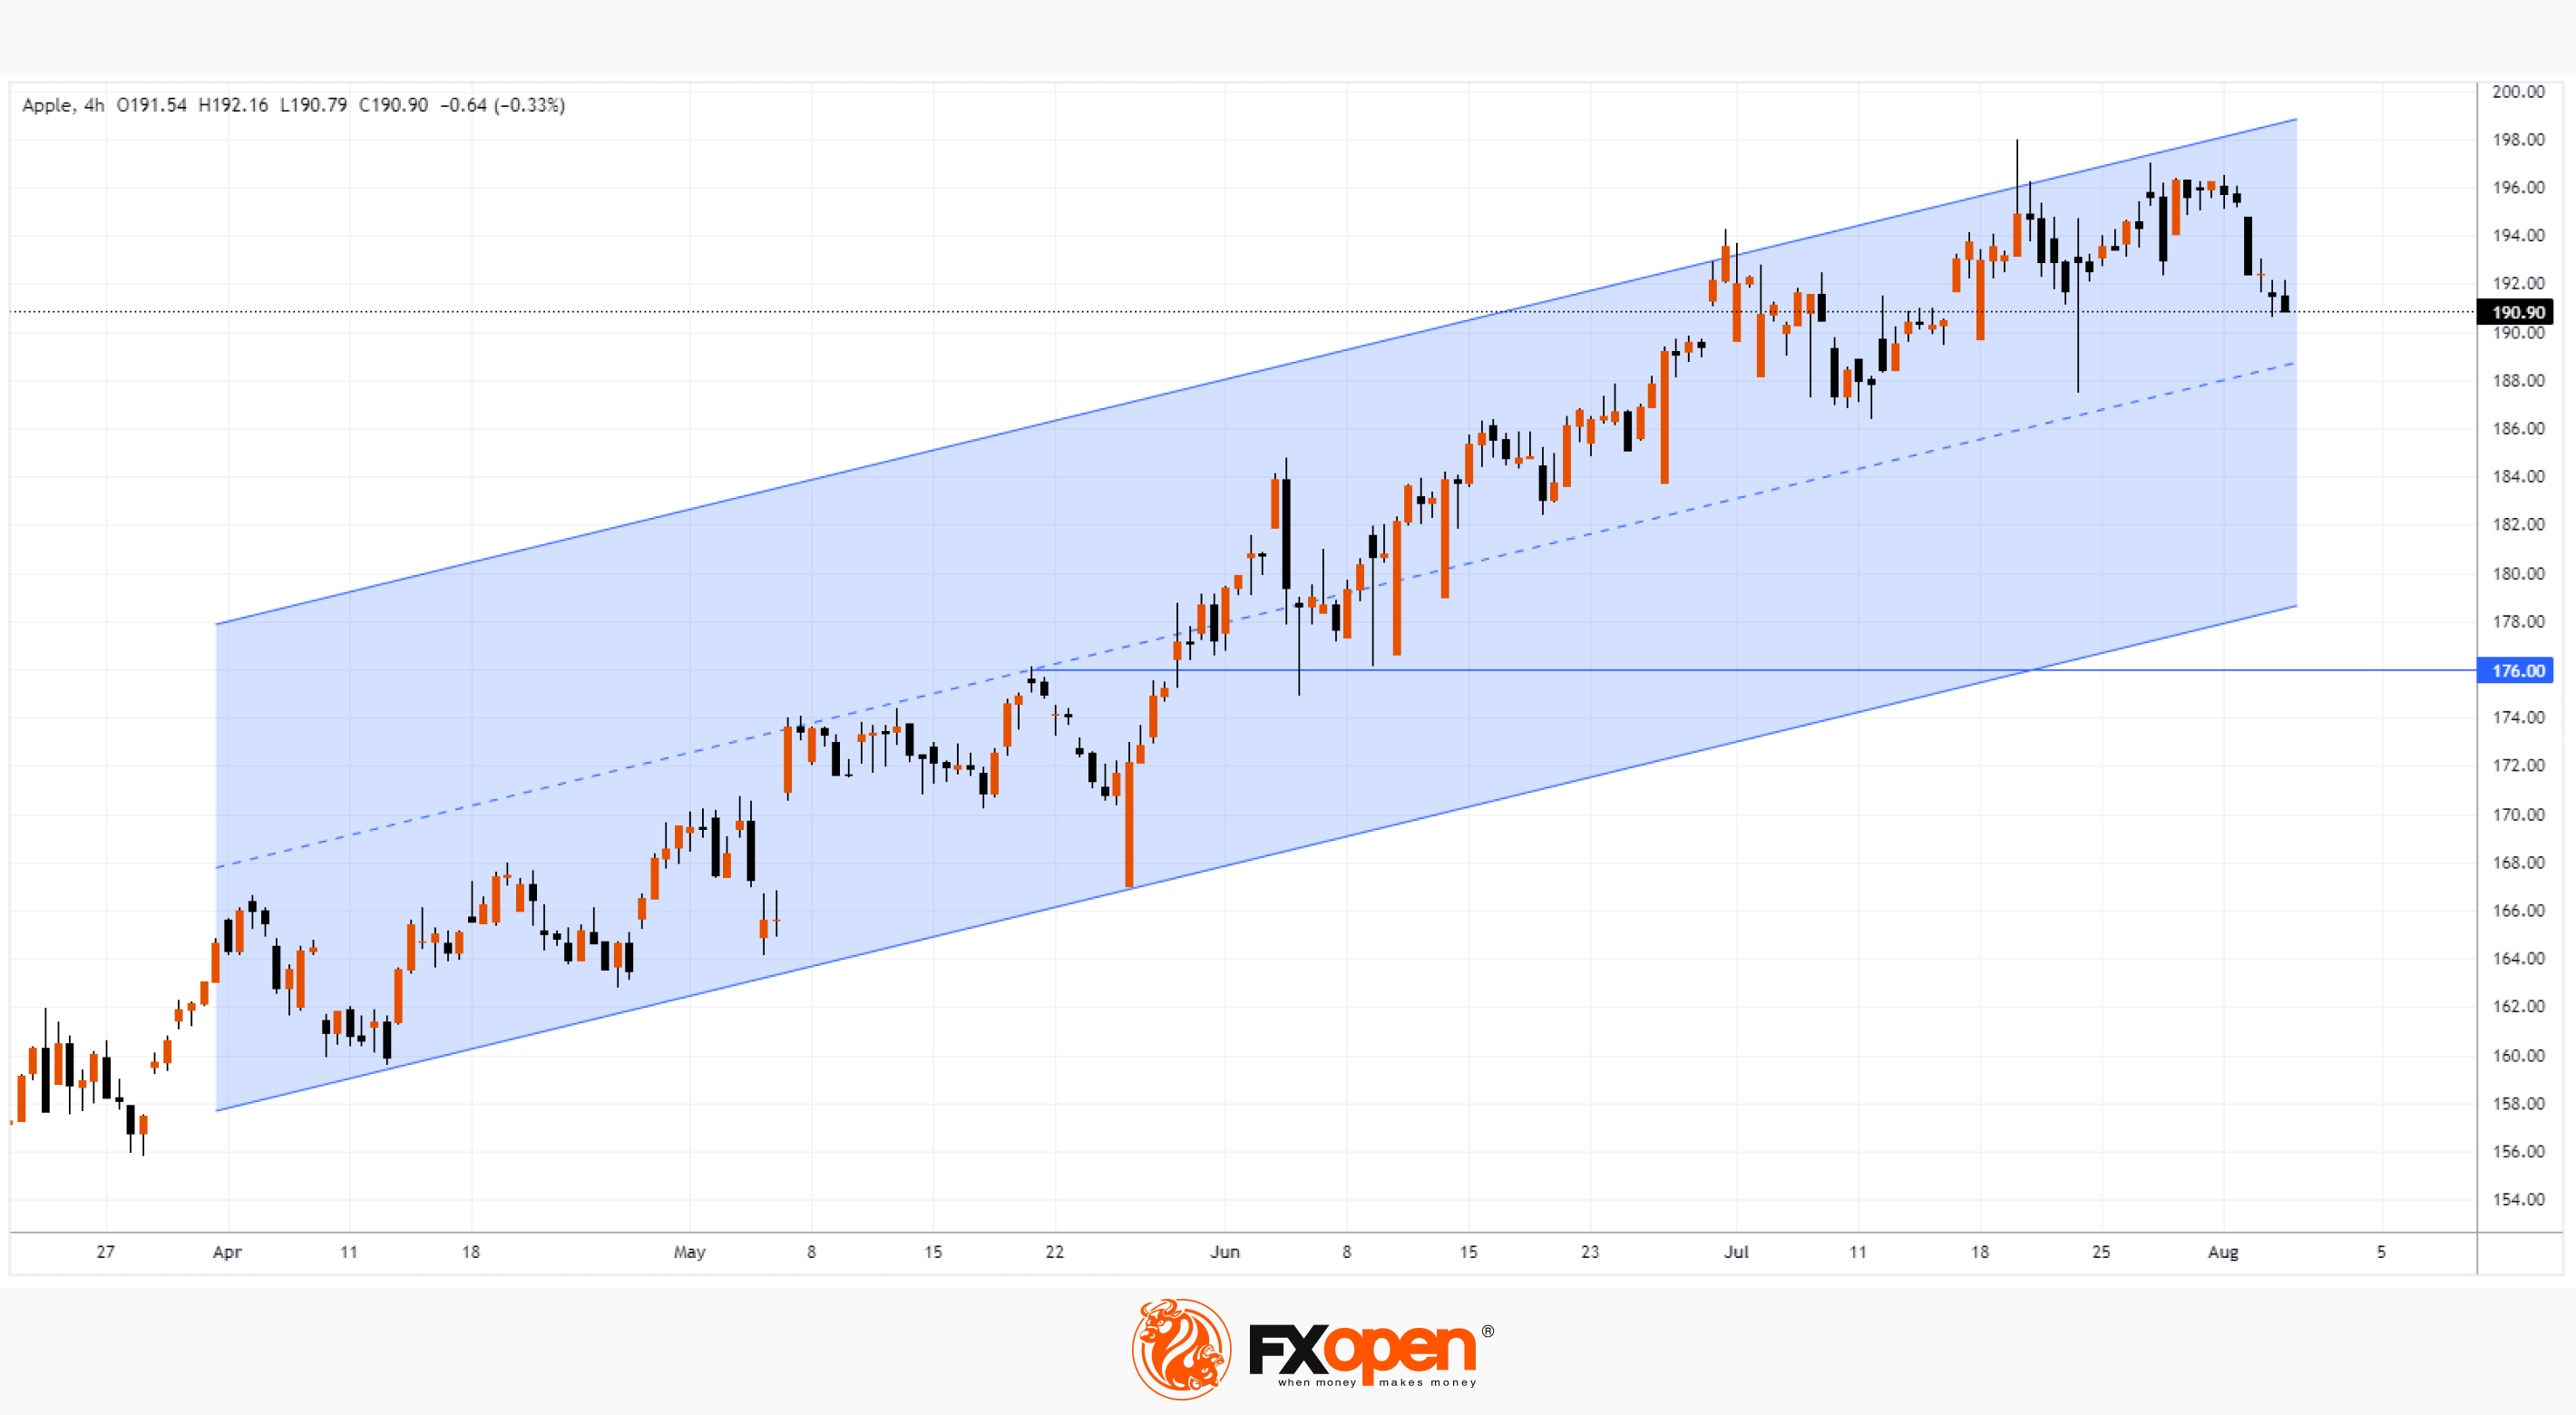
The AAPL stock price chart shows that the price has not reached the psychological level of USD 200, while the market may be supported by:
→ the lower limit of the rising channel, within which the price has been moving since the spring of 2023;
→ the level of USD 176 per AAPL share – the price repelled from it in June.
The opening of trading is expected at the level of USD 187. According to MarketWatch analysts, the target price for AAPL shares is USD 195.00.
To benefit from trends in the stock markets of the world's most popular companies, consider enlisting the services of a trusted broker like FXOpen.
⚠️
CFDs are complex instruments and come with a high risk of losing your money.
This article represents the opinion of the Companies operating under the FXOpen brand only. It is not to be construed as an offer, solicitation, or recommendation with respect to products and services provided by the Companies operating under the FXOpen brand, nor is it to be considered financial advice.
Market Analysis: Apple Stock Plunges 2% Despite Better-than-expected Sales
Yesterday, after the close of the main trading session on the stock exchange, the largest company by capitalization reported for the quarter.
→ AAPL EPS of USD 1.26 (expected $1.195);
→ Gross revenue was USD 81.8 billion (as expected);
→ The decline in iPhone sales was offset by strong sales in the services segment (which includes Apple TV+) and sales in China, which were up 8% year-on-year.
However, AAPL's share price fell in premarket today, probably because market participants are concerned about:
→ a forecast for a further decline in iPhone sales;
→ vague prospects for the release of a new product Vision Pro;
→ Apple's rising R&D spending reaching USD 22.61 billion a year.
The capitalization of the company fell below USD 3 billion.
The AAPL stock price chart shows that the price has not reached the psychological level of USD 200, while the market may be supported by:
→ the lower limit of the rising channel, within which the price has been moving since the spring of 2023;
→ the level of USD 176 per AAPL share – the price repelled from it in June.
The opening of trading is expected at the level of USD 187. According to MarketWatch analysts, the target price for AAPL shares is USD 195.00.
To benefit from trends in the stock markets of the world's most popular companies, consider enlisting the services of a trusted broker like FXOpen.
⚠️
CFDs are complex instruments and come with a high risk of losing your money.
This article represents the opinion of the Companies operating under the FXOpen brand only. It is not to be construed as an offer, solicitation, or recommendation with respect to products and services provided by the Companies operating under the FXOpen brand, nor is it to be considered financial advice.
#AMZN #stocktrading #marketnews
Market Analysis: After the Report, AMZN Shares Soar Almost 9%
Strong gains in Amazon's stock supported E-mini S&P 500 futures, which were hit by Fitch's US downgrade and Apple's disappointing report.
→ Amazon revenue for the quarter: USD 134.4 billion, +11% year-on-year;
→ profit: USD 6.8 billion for the quarter (-USD 2 billion last quarter);
→ the company continued to reduce the cost of maintaining supply chains;
→ growth of Amazon Web Services has stabilized as customers move from cost optimization to deployment of new workloads;
→ forecasts of sales growth encouraged investors.
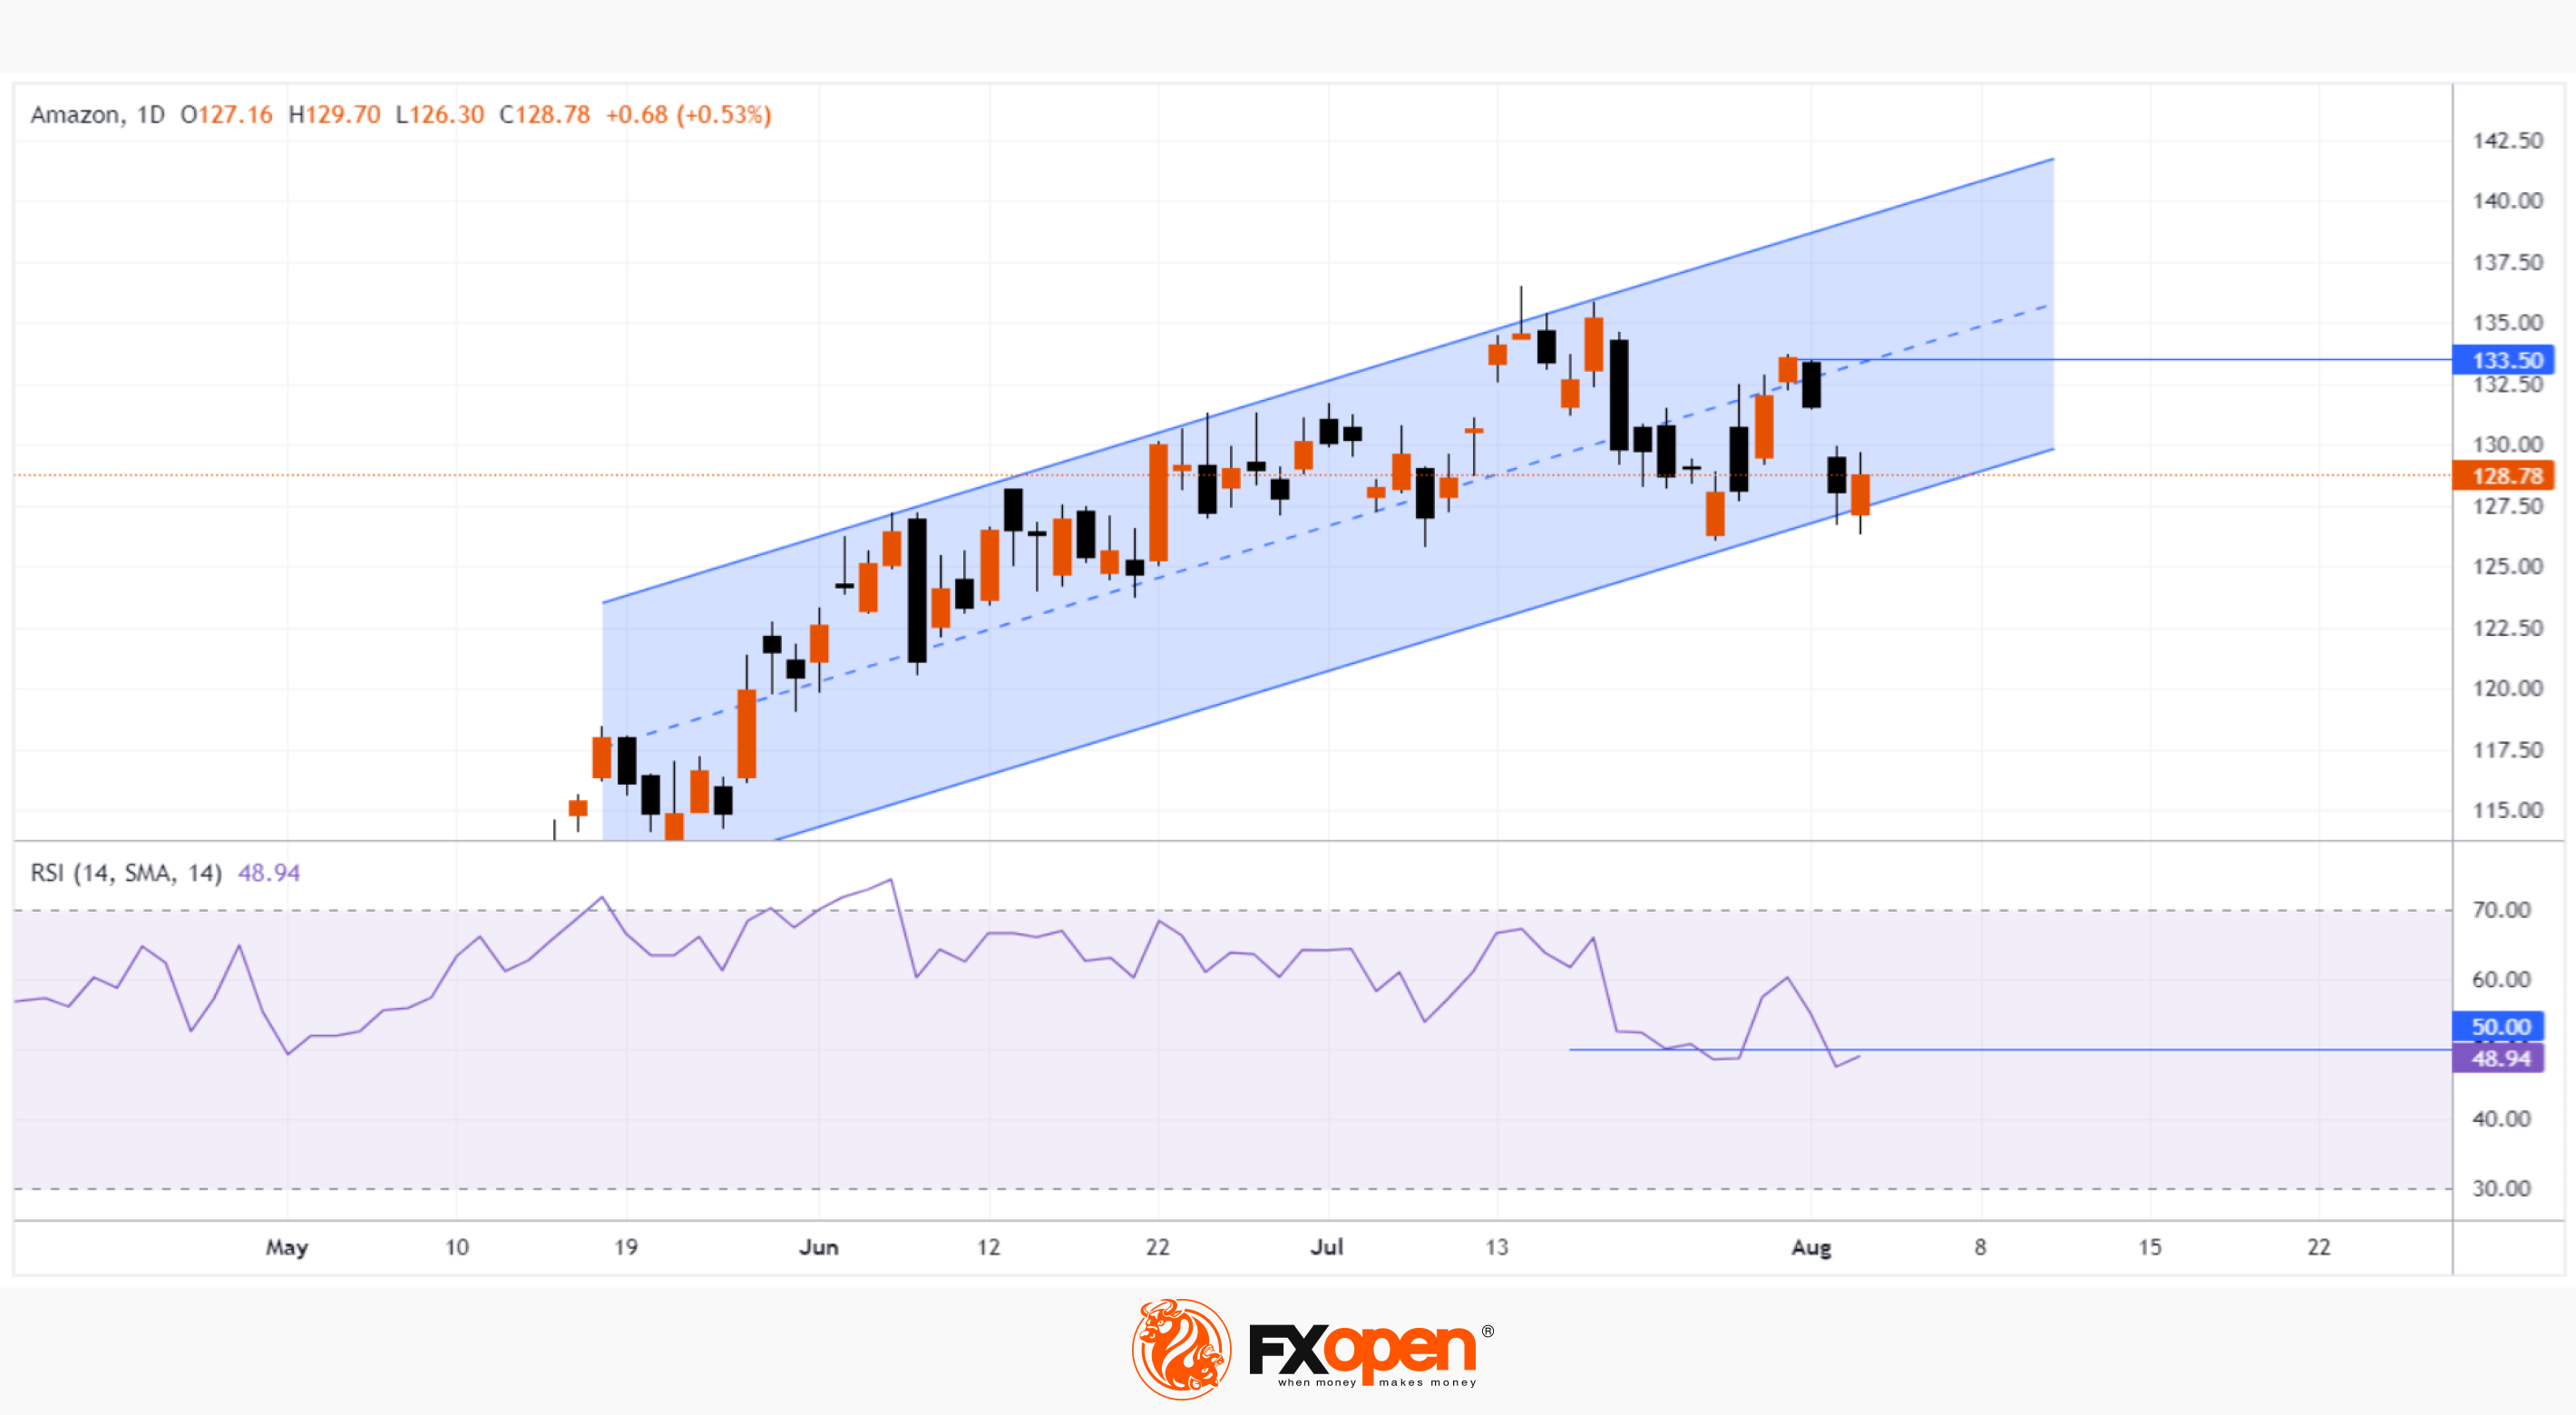
The AMZN stock chart shows that a successful report pushed the price to a year high, trading in the morning may start around USD 129 per share. Thus:
→ a wide gap is formed on the chart, which can serve as support;
→ the price may rise from the lower border of the channel to the upper, where it may meet resistance;
→ RSI may bounce off the 50 line;
→ the market may be supported by the area around USD 133.5 per share, where the median line of the channel and the maximum from July 31 pass.
Despite the sharp rise, AMZN's share price is still far from meeting the average target values, which, according to Tipranks, are in the region of USD 157.
To benefit from the rise and fall of the AMZN share price, consider enlisting the services of a trusted broker like FXOpen.
⚠️
CFDs are complex instruments and come with a high risk of losing your money.
This article represents the opinion of the Companies operating under the FXOpen brand only. It is not to be construed as an offer, solicitation, or recommendation with respect to products and services provided by the Companies operating under the FXOpen brand, nor is it to be considered financial advice.
Market Analysis: After the Report, AMZN Shares Soar Almost 9%
Strong gains in Amazon's stock supported E-mini S&P 500 futures, which were hit by Fitch's US downgrade and Apple's disappointing report.
→ Amazon revenue for the quarter: USD 134.4 billion, +11% year-on-year;
→ profit: USD 6.8 billion for the quarter (-USD 2 billion last quarter);
→ the company continued to reduce the cost of maintaining supply chains;
→ growth of Amazon Web Services has stabilized as customers move from cost optimization to deployment of new workloads;
→ forecasts of sales growth encouraged investors.
The AMZN stock chart shows that a successful report pushed the price to a year high, trading in the morning may start around USD 129 per share. Thus:
→ a wide gap is formed on the chart, which can serve as support;
→ the price may rise from the lower border of the channel to the upper, where it may meet resistance;
→ RSI may bounce off the 50 line;
→ the market may be supported by the area around USD 133.5 per share, where the median line of the channel and the maximum from July 31 pass.
Despite the sharp rise, AMZN's share price is still far from meeting the average target values, which, according to Tipranks, are in the region of USD 157.
To benefit from the rise and fall of the AMZN share price, consider enlisting the services of a trusted broker like FXOpen.
⚠️
CFDs are complex instruments and come with a high risk of losing your money.
This article represents the opinion of the Companies operating under the FXOpen brand only. It is not to be construed as an offer, solicitation, or recommendation with respect to products and services provided by the Companies operating under the FXOpen brand, nor is it to be considered financial advice.
#marketnews #gbpusd #gbp
Weekly Market Wrap With Gary Thomson: GBP/USD, US Credit Rating, Gold, AMD
Get the latest scoop on the week's hottest headlines, all in one convenient video. Join Gary Thomson, the COO of FXOpen UK, as he breaks down the most significant news reports and shares his expert insights.
🔸 The GBP/USD Exchange Rate Falls to a Month’s Minimum
🔸 Fitch Downgrades US Credit Rating
🔸 Gold Starts August with a Sell-Off despite Bullish Headlines
🔸 AMD Share Price on the Rise After Financial Statement Release
Stay in the know and empower yourself with our short, yet power-packed video. Watch it now and stay updated with FXOpen.
Don't miss out on this invaluable opportunity to sharpen your trading skills and make informed decisions.
https://cutt.ly/8wdhCed4
To take advantage of price fluctuations in the foreign exchange markets, consider enlisting the services of a reliable broker like FXOpen.
⚠️
This forecast represents FXOpen Companies opinion only, it should not be construed as an offer, invitation or recommendation in respect to FXOpen Companies products and services or as financial advice
Weekly Market Wrap With Gary Thomson: GBP/USD, US Credit Rating, Gold, AMD
Get the latest scoop on the week's hottest headlines, all in one convenient video. Join Gary Thomson, the COO of FXOpen UK, as he breaks down the most significant news reports and shares his expert insights.
🔸 The GBP/USD Exchange Rate Falls to a Month’s Minimum
🔸 Fitch Downgrades US Credit Rating
🔸 Gold Starts August with a Sell-Off despite Bullish Headlines
🔸 AMD Share Price on the Rise After Financial Statement Release
Stay in the know and empower yourself with our short, yet power-packed video. Watch it now and stay updated with FXOpen.
Don't miss out on this invaluable opportunity to sharpen your trading skills and make informed decisions.
https://cutt.ly/8wdhCed4
To take advantage of price fluctuations in the foreign exchange markets, consider enlisting the services of a reliable broker like FXOpen.
⚠️
This forecast represents FXOpen Companies opinion only, it should not be construed as an offer, invitation or recommendation in respect to FXOpen Companies products and services or as financial advice
YouTube
Weekly Market Wrap With Gary Thomson: GBP/USD, US Credit Rating, Gold, AMD
Get the latest scoop on the week's hottest headlines, all in one convenient video. Join Gary Thomson, the COO of FXOpen UK, as he breaks down the most significant news reports and shares his expert insights.
- The GBP/USD Exchange Rate Falls to a Month’s…
- The GBP/USD Exchange Rate Falls to a Month’s…
#marketnews #stocks #stockmarket
Market Analysis: Berkshire Shares Fall after Great Report
Warren Buffett's holdings posted record operating profits last week, pushing Berkshire Hathaway's asset value to over USD 1 trillion for the first time.
→ Operating income rose 6.65% in the second quarter to USD 10.04 billion, the company's all-time high from USD 9.42 billion in the same period last year.
→ BRK's earnings per share were USD 4.6 (expected USD 3.7).
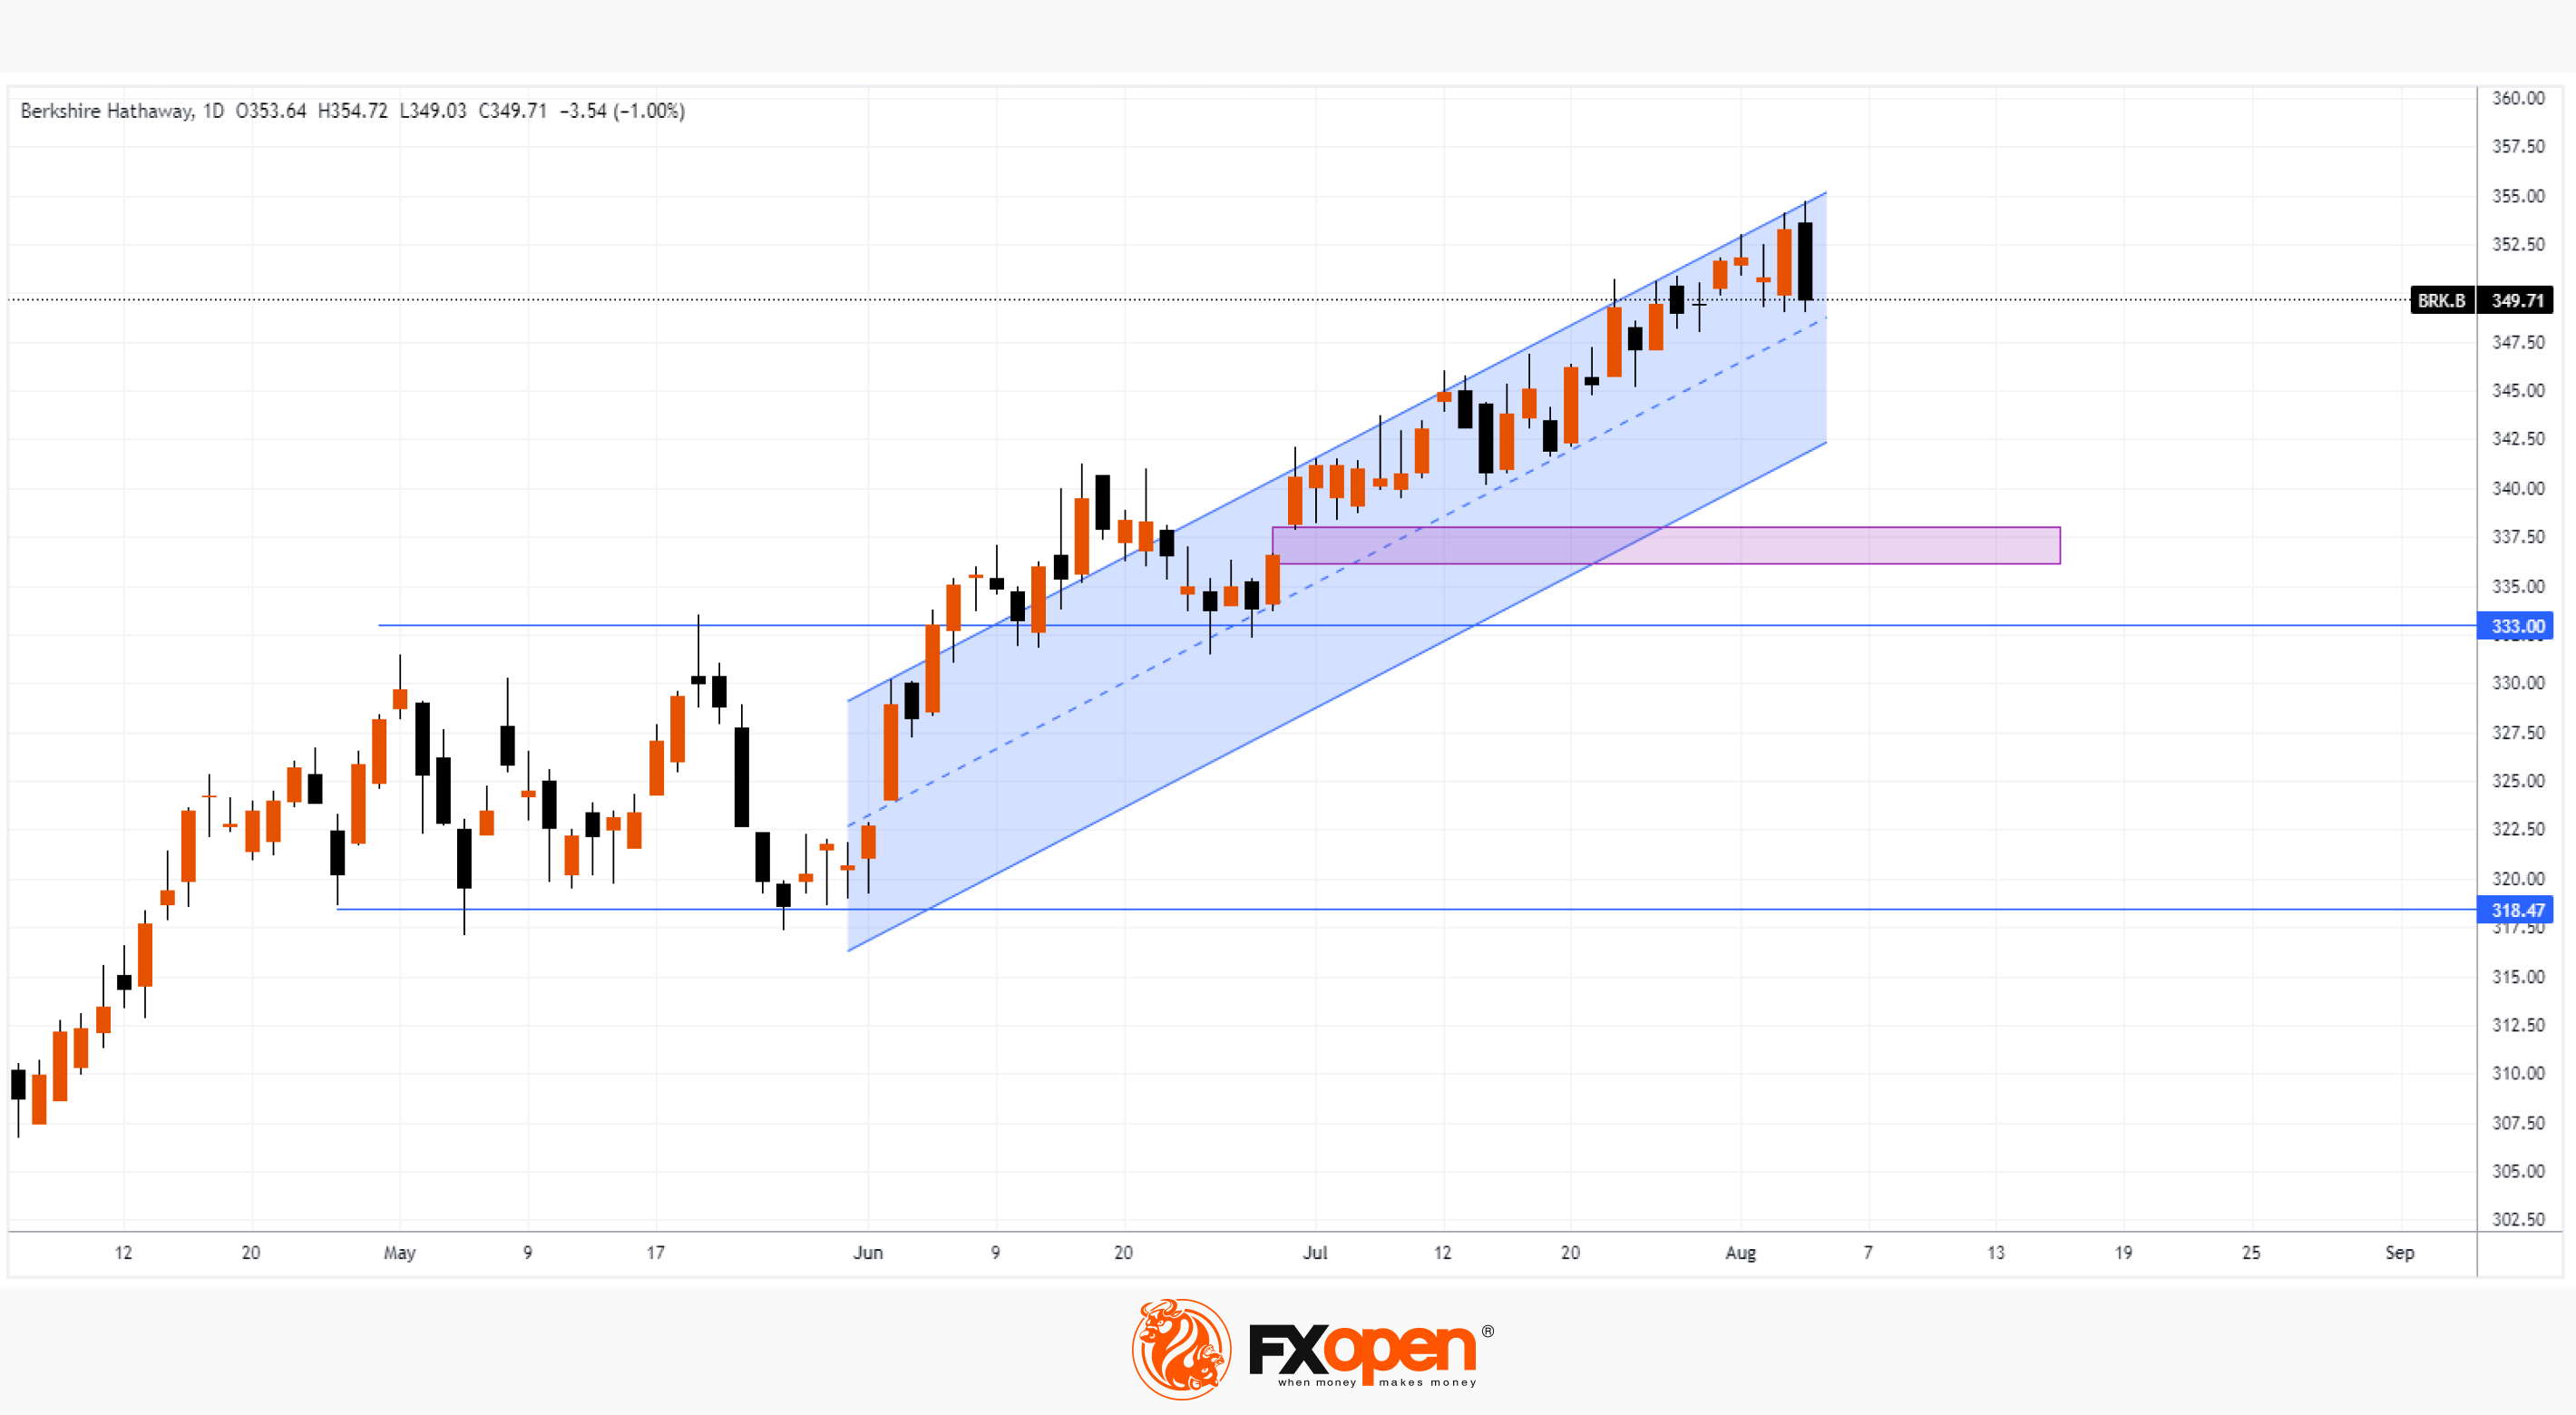
However, a bearish engulfing pattern has formed on the BRK stock chart near the all-time high of USD 362.1 set in March 2022. The share price fell overall with the US stock market under pressure, including from the rating downgrade by Fitch. At the same time, BRK's share price is stronger than E-mini S&P 500 futures, which are down more than 2% from their August high.
Technical analysis of the BRK chart suggests that Berkshire Hathaway's share price may be affected by:
→ support from the lower border of the ascending channel (shown in blue);
→ support from the USD 333 level, which served as resistance for the May range;
→ a bullish gap zone around USD 337, where, by the way, the 50% level of growth from the lows of the May range to the high of the year passes.
Analysts polled by MarketWatch have a median target price of USD 384.26 for BRK (about +10% from current levels).
To benefit from the rise and fall of the BRK share price, consider enlisting the services of a trusted broker like FXOpen.
⚠️
CFDs are complex instruments and come with a high risk of losing your money.
This article represents the opinion of the Companies operating under the FXOpen brand only. It is not to be construed as an offer, solicitation, or recommendation with respect to products and services provided by the Companies operating under the FXOpen brand, nor is it to be considered financial advice.
Market Analysis: Berkshire Shares Fall after Great Report
Warren Buffett's holdings posted record operating profits last week, pushing Berkshire Hathaway's asset value to over USD 1 trillion for the first time.
→ Operating income rose 6.65% in the second quarter to USD 10.04 billion, the company's all-time high from USD 9.42 billion in the same period last year.
→ BRK's earnings per share were USD 4.6 (expected USD 3.7).
However, a bearish engulfing pattern has formed on the BRK stock chart near the all-time high of USD 362.1 set in March 2022. The share price fell overall with the US stock market under pressure, including from the rating downgrade by Fitch. At the same time, BRK's share price is stronger than E-mini S&P 500 futures, which are down more than 2% from their August high.
Technical analysis of the BRK chart suggests that Berkshire Hathaway's share price may be affected by:
→ support from the lower border of the ascending channel (shown in blue);
→ support from the USD 333 level, which served as resistance for the May range;
→ a bullish gap zone around USD 337, where, by the way, the 50% level of growth from the lows of the May range to the high of the year passes.
Analysts polled by MarketWatch have a median target price of USD 384.26 for BRK (about +10% from current levels).
To benefit from the rise and fall of the BRK share price, consider enlisting the services of a trusted broker like FXOpen.
⚠️
CFDs are complex instruments and come with a high risk of losing your money.
This article represents the opinion of the Companies operating under the FXOpen brand only. It is not to be construed as an offer, solicitation, or recommendation with respect to products and services provided by the Companies operating under the FXOpen brand, nor is it to be considered financial advice.
#MarketNews #BTCUSD
BTC/USD Price Analysis: ADX Indicator Falls to the Lowest Level of 2023
The latest news from the world of cryptocurrencies could be both bearish and bullish drivers:
→ PayPal launches a stablecoin that will be pegged to the dollar and backed by US Treasuries;
→ Cathie Wood believes that the SEC can approve several BTC ETFs at the same time;
→ the Central Bank of Brazil plans to launch its digital currency called DREX in 2024;
→ rumors about problems with the USDC stablecoin are spreading in the network;
→ the US Department of Justice is considering filing fraud charges against Binance.
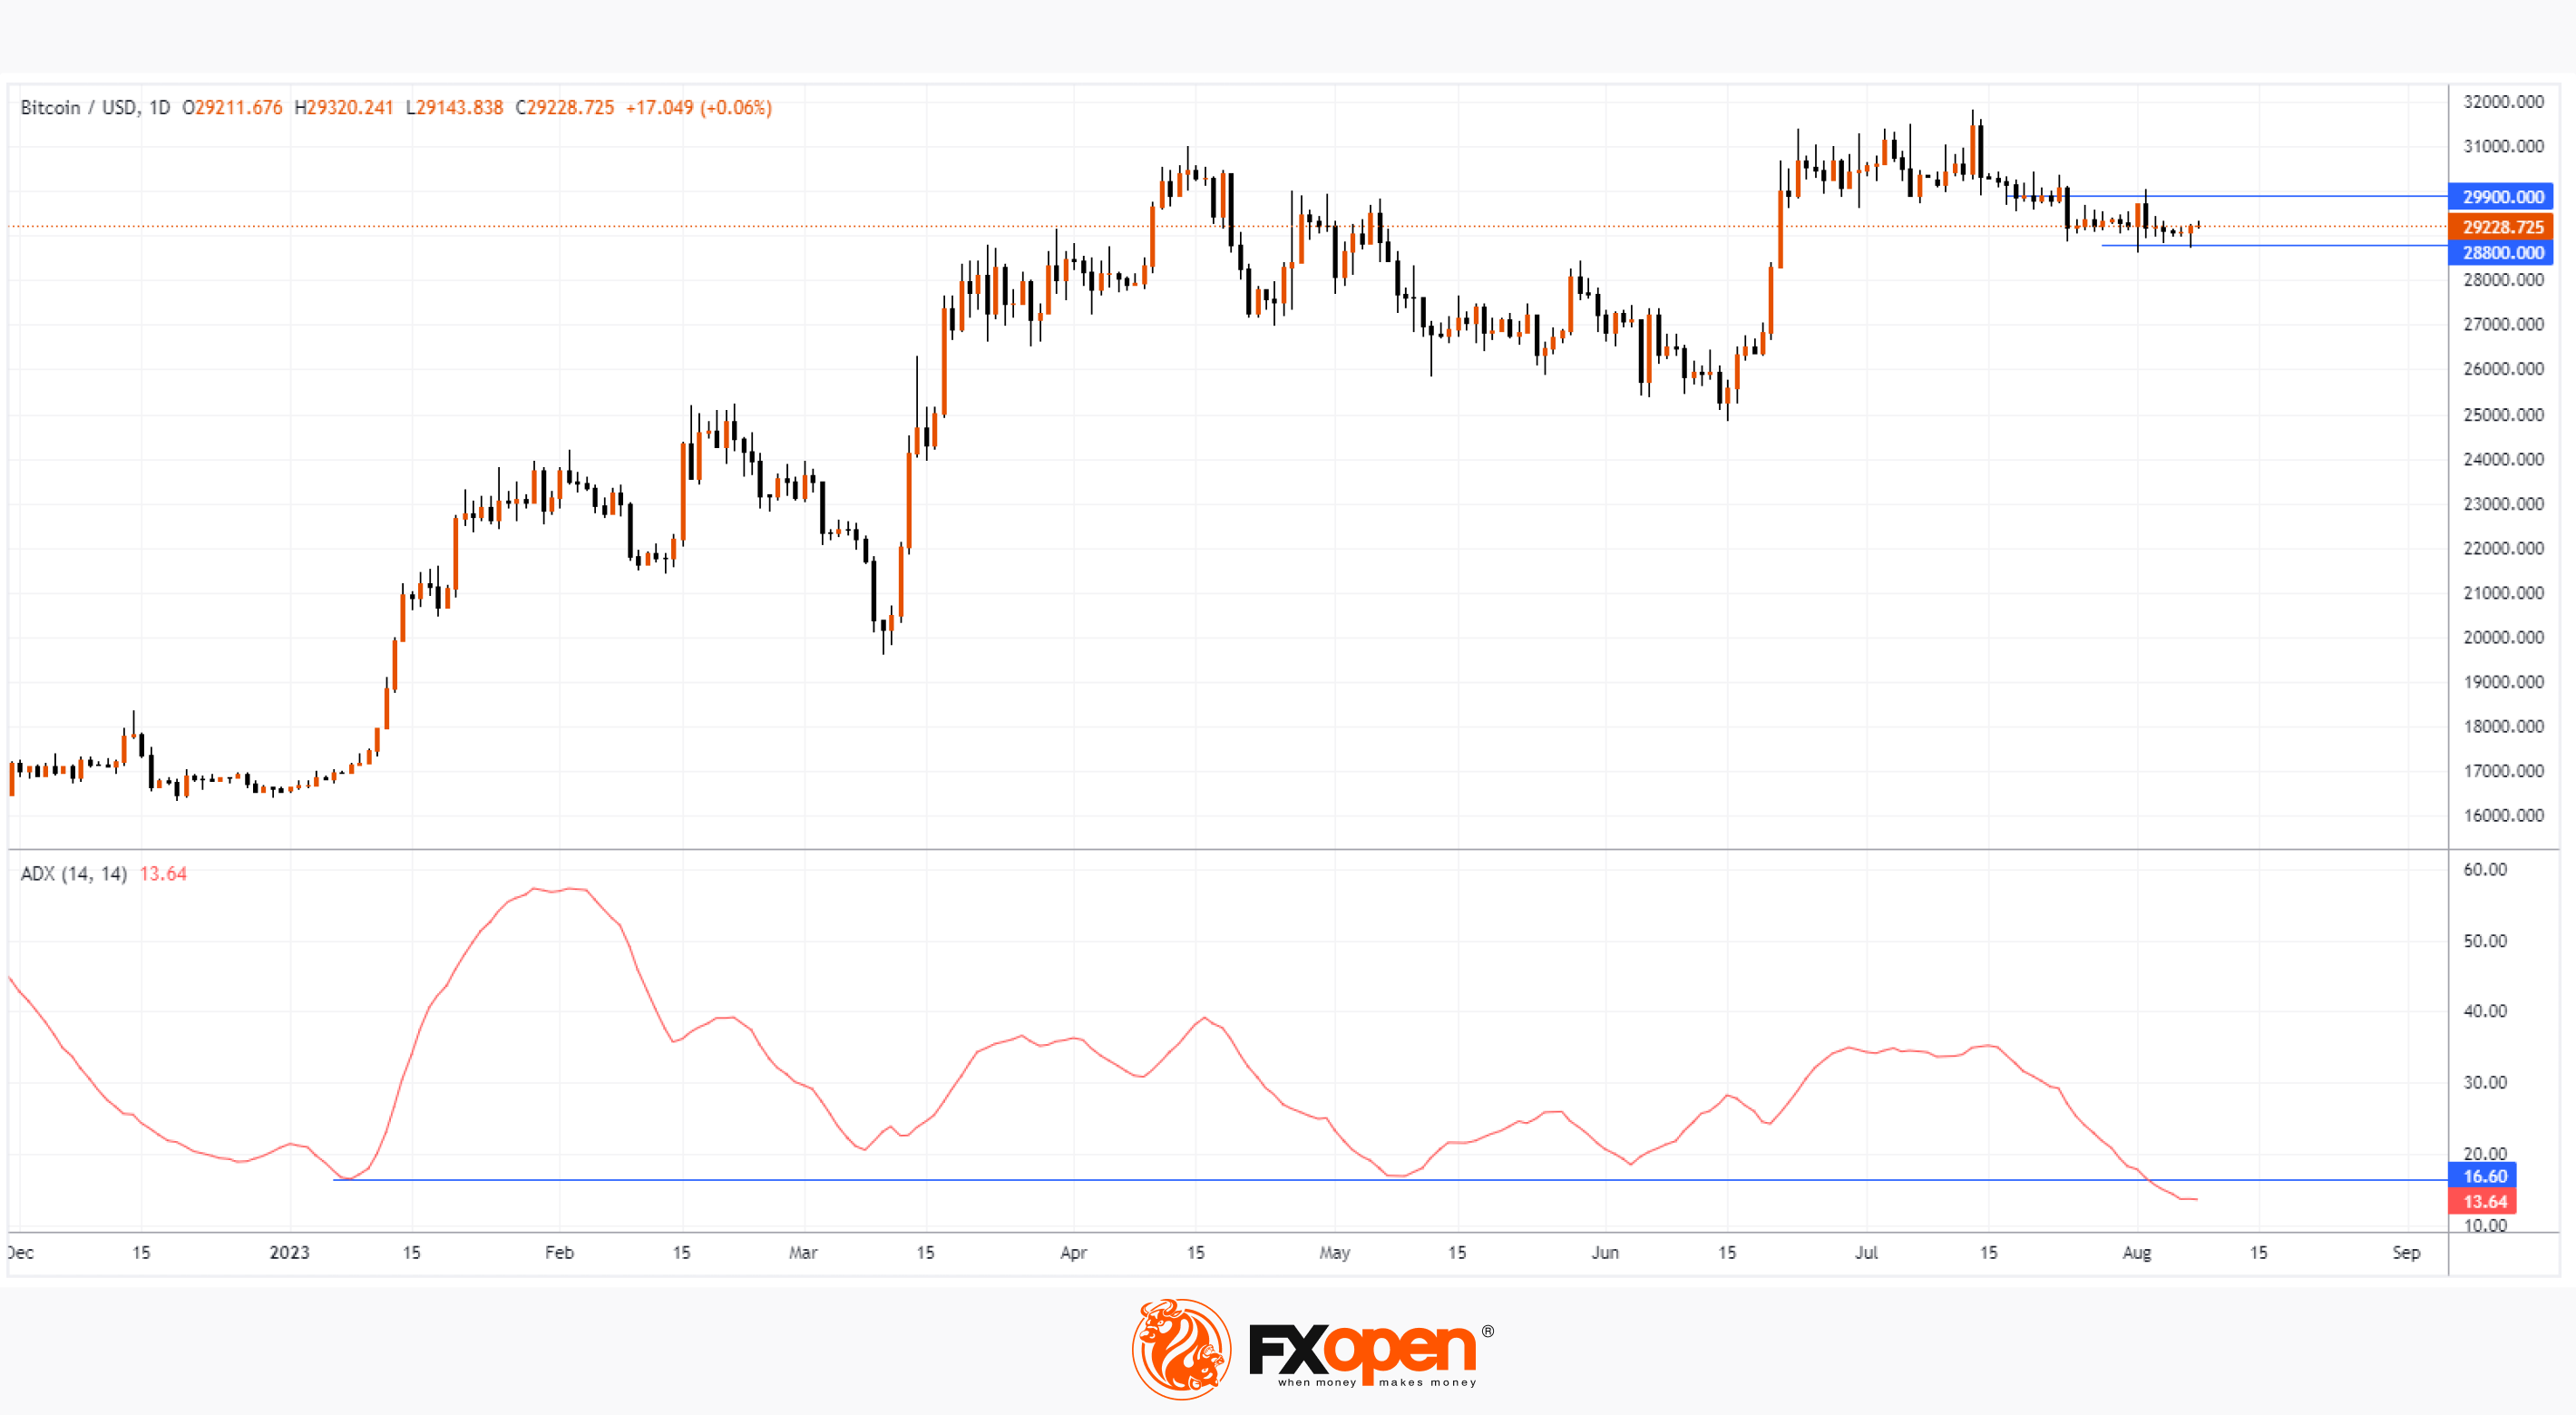
However, the BTC/USD rate has stabilized around USD 29,000 per coin since July 25th. The bitcoin market is showing unusually low volatility (except for the surge associated with news from the Fed). At the same time, the ADX indicator, which helps determine the presence of a trend, fell to its lowest level since 2023. Obviously, this indicates that the market is flat. But note the trend that followed in early 2023 as the ADX fell close to its current low.
At the beginning of August, the BTC/USD rate was limited by the resistance level of 29,900 and the support level of 28,800. A breakdown of one of these levels can lead to the beginning of a strong trend against the backdrop of a low ADX value — this has happened more than once historically.
To benefit from the rise and fall of cryptocurrencies, consider enlisting the services of a trusted broker like FXOpen.
⚠️
CFDs are complex instruments and come with a high risk of losing your money.
This article represents the opinion of the Companies operating under the FXOpen brand only. It is not to be construed as an offer, solicitation, or recommendation with respect to products and services provided by the Companies operating under the FXOpen brand, nor is it to be considered financial advice.
At FXOpen UK and FXOpen AU, Cryptocurrency CFDs are only available for trading by those clients categorised as Professional clients under FCA Rules and Professional clients under ASIC Rules, respectively. They are not available for trading by Retail clients.
BTC/USD Price Analysis: ADX Indicator Falls to the Lowest Level of 2023
The latest news from the world of cryptocurrencies could be both bearish and bullish drivers:
→ PayPal launches a stablecoin that will be pegged to the dollar and backed by US Treasuries;
→ Cathie Wood believes that the SEC can approve several BTC ETFs at the same time;
→ the Central Bank of Brazil plans to launch its digital currency called DREX in 2024;
→ rumors about problems with the USDC stablecoin are spreading in the network;
→ the US Department of Justice is considering filing fraud charges against Binance.
However, the BTC/USD rate has stabilized around USD 29,000 per coin since July 25th. The bitcoin market is showing unusually low volatility (except for the surge associated with news from the Fed). At the same time, the ADX indicator, which helps determine the presence of a trend, fell to its lowest level since 2023. Obviously, this indicates that the market is flat. But note the trend that followed in early 2023 as the ADX fell close to its current low.
At the beginning of August, the BTC/USD rate was limited by the resistance level of 29,900 and the support level of 28,800. A breakdown of one of these levels can lead to the beginning of a strong trend against the backdrop of a low ADX value — this has happened more than once historically.
To benefit from the rise and fall of cryptocurrencies, consider enlisting the services of a trusted broker like FXOpen.
⚠️
CFDs are complex instruments and come with a high risk of losing your money.
This article represents the opinion of the Companies operating under the FXOpen brand only. It is not to be construed as an offer, solicitation, or recommendation with respect to products and services provided by the Companies operating under the FXOpen brand, nor is it to be considered financial advice.
At FXOpen UK and FXOpen AU, Cryptocurrency CFDs are only available for trading by those clients categorised as Professional clients under FCA Rules and Professional clients under ASIC Rules, respectively. They are not available for trading by Retail clients.
Introducing Our New Service: Automated Expert Advisors and Indicator Script Fixes for FXOpen International Clients!
We are thrilled to announce a valuable addition to all FXOpen International clients. Now, you have the opportunity to optimise your trading experience through our specialised service for writing Expert Advisors and fixing indicators and scripts.
🔸Automate Your Trading with Expert Advisors
Take advantage of our expertise in creating powerful Expert Advisors tailored to your unique trading strategies. Our team is dedicated to developing solutions that align perfectly with your trading goals, enabling you to execute trades with greater efficiency and precision.
🔸Enhance Your Indicators and Scripts
If you're seeking to enhance the performance of your indicators or scripts, our service has got you covered. Fine-tune your existing indicators and scripts to provide more accurate insights and better align with your trading preferences.
🔸Easy Process for Ordering
Ordering our Expert Advisor or indicator/script fixing service is simple and accessible to all registered FXOpen International clients on our forum. Just visit the forum thread and leave your task for our skilled programmers to handle.
Best of All, It's Free!
We value our clients' success, and that's why we are delighted to offer this service completely free of charge. Your success is our success, and we are committed to supporting your trading journey.
Don't miss out on this opportunity to supercharge your trading strategy with our automated Expert Advisors and optimised indicators/scripts service. Join our forum, place your order, and experience the benefits firsthand.
https://cutt.ly/9wd0K213
To take advantage of price fluctuations in the foreign exchange markets, consider enlisting the services of a reliable broker like FXOpen.
We are thrilled to announce a valuable addition to all FXOpen International clients. Now, you have the opportunity to optimise your trading experience through our specialised service for writing Expert Advisors and fixing indicators and scripts.
🔸Automate Your Trading with Expert Advisors
Take advantage of our expertise in creating powerful Expert Advisors tailored to your unique trading strategies. Our team is dedicated to developing solutions that align perfectly with your trading goals, enabling you to execute trades with greater efficiency and precision.
🔸Enhance Your Indicators and Scripts
If you're seeking to enhance the performance of your indicators or scripts, our service has got you covered. Fine-tune your existing indicators and scripts to provide more accurate insights and better align with your trading preferences.
🔸Easy Process for Ordering
Ordering our Expert Advisor or indicator/script fixing service is simple and accessible to all registered FXOpen International clients on our forum. Just visit the forum thread and leave your task for our skilled programmers to handle.
Best of All, It's Free!
We value our clients' success, and that's why we are delighted to offer this service completely free of charge. Your success is our success, and we are committed to supporting your trading journey.
Don't miss out on this opportunity to supercharge your trading strategy with our automated Expert Advisors and optimised indicators/scripts service. Join our forum, place your order, and experience the benefits firsthand.
https://cutt.ly/9wd0K213
To take advantage of price fluctuations in the foreign exchange markets, consider enlisting the services of a reliable broker like FXOpen.
Forex, Stocks, Crypto CFDs trading with FXOpen INT: A True ECN Forex Broker
Introducing Our New Service: Automated Expert Advisors and Indicator Script Fixes for FXOpen International Clients!
We are thrilled to announce a valuable addition to all FXOpen International clients. Now, you have the opportunity to optimise your trading experience through our specialised service for writing Expert Advisors and fixing indicators and scripts. Automate…
#MarketNews #nasdaq
Market Analysis: Nasdaq 100 Tests Important Support
FactSet agency notes a disturbing feature of the current reporting season in the US stock market: if a company publishes a report that exceeds forecasts, its share price does not react with a price increase, which should be expected. This hasn't happened since August 2011, when the stock market fell over 15% in 2 weeks.
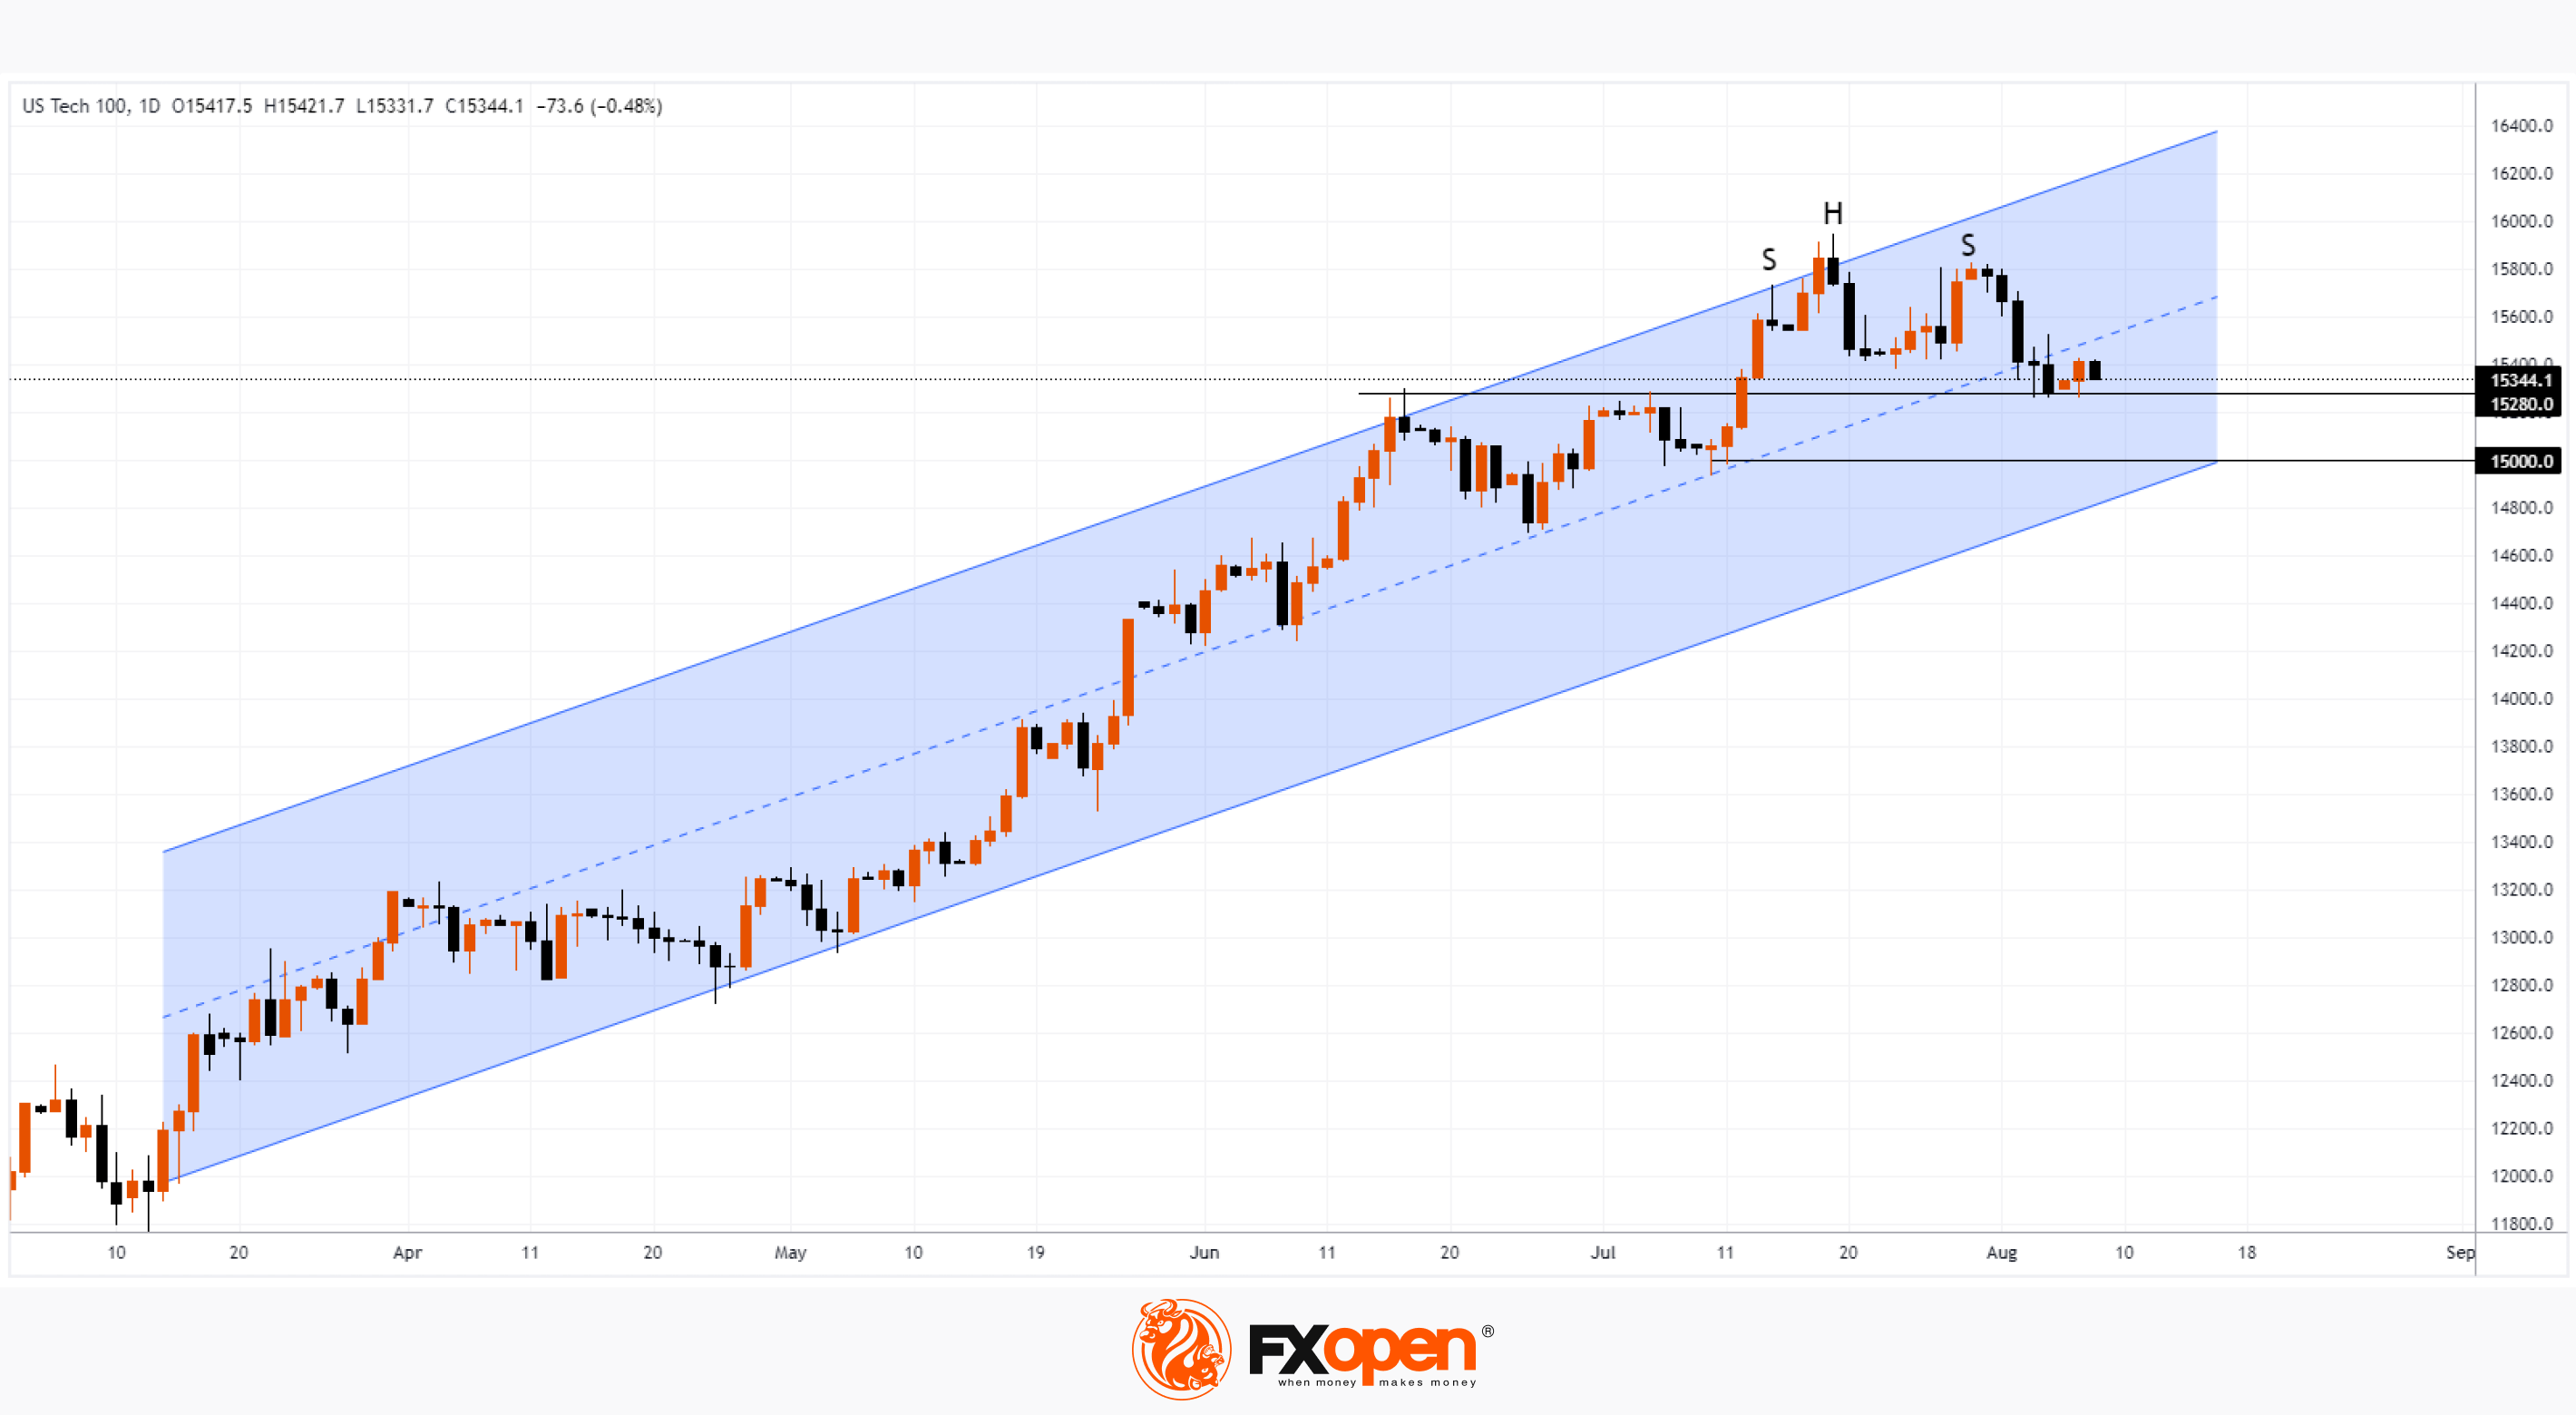
This behavior may suggest that the stock market is overbought (due to the AI boom), and a reason to more closely monitor the nature of the test of the 15,280 support level by the price of the Nasdaq 100. The Nasdaq 100 daily chart gives hints that the bears are seizing the initiative:
→ the price of the index has formed a head-and-shoulders pattern;
→ the price goes down to the lower half of the rising channel;
→ since July 19, the chart shows 2 lower tops and 2 lower lows.
If the bears break through the level of 15,280, the next target could be the psychological level of 15,000, in the area of which the lower border of the ascending channel that operates this summer passes — this block can provide significant support.
To benefit from the ups and downs of the Nasdaq 100 Index, consider enlisting the services of a trusted broker like FXOpen.
⚠️
CFDs are complex instruments and come with a high risk of losing your money.
This article represents the opinion of the Companies operating under the FXOpen brand only. It is not to be construed as an offer, solicitation, or recommendation with respect to products and services provided by the Companies operating under the FXOpen brand, nor is it to be considered financial advice.
Market Analysis: Nasdaq 100 Tests Important Support
FactSet agency notes a disturbing feature of the current reporting season in the US stock market: if a company publishes a report that exceeds forecasts, its share price does not react with a price increase, which should be expected. This hasn't happened since August 2011, when the stock market fell over 15% in 2 weeks.
This behavior may suggest that the stock market is overbought (due to the AI boom), and a reason to more closely monitor the nature of the test of the 15,280 support level by the price of the Nasdaq 100. The Nasdaq 100 daily chart gives hints that the bears are seizing the initiative:
→ the price of the index has formed a head-and-shoulders pattern;
→ the price goes down to the lower half of the rising channel;
→ since July 19, the chart shows 2 lower tops and 2 lower lows.
If the bears break through the level of 15,280, the next target could be the psychological level of 15,000, in the area of which the lower border of the ascending channel that operates this summer passes — this block can provide significant support.
To benefit from the ups and downs of the Nasdaq 100 Index, consider enlisting the services of a trusted broker like FXOpen.
⚠️
CFDs are complex instruments and come with a high risk of losing your money.
This article represents the opinion of the Companies operating under the FXOpen brand only. It is not to be construed as an offer, solicitation, or recommendation with respect to products and services provided by the Companies operating under the FXOpen brand, nor is it to be considered financial advice.
#MarketNews #brentoil #oilprices
Market Analysis: The Price of Brent Oil Approaching the Highs of the Year
The price is driven up by:
→ the policy of limiting oil production by OPEC+ countries. For example, Saudi Arabia last week announced a cut in production by 1 million barrels per day until the end of September, adding that the decision could be extended. Russia is also reducing production volumes. We wrote about the scenario of increasing growth in the price of Brent oil due to production cuts in a post dated July 7;
→ hopes/rumors that the Chinese authorities will stimulate the economy, which is not recovering enough after the lifting of COVID-related restrictions.
Selling pressure is driven by:
→ raising rates by Western central banks to fight high inflation.
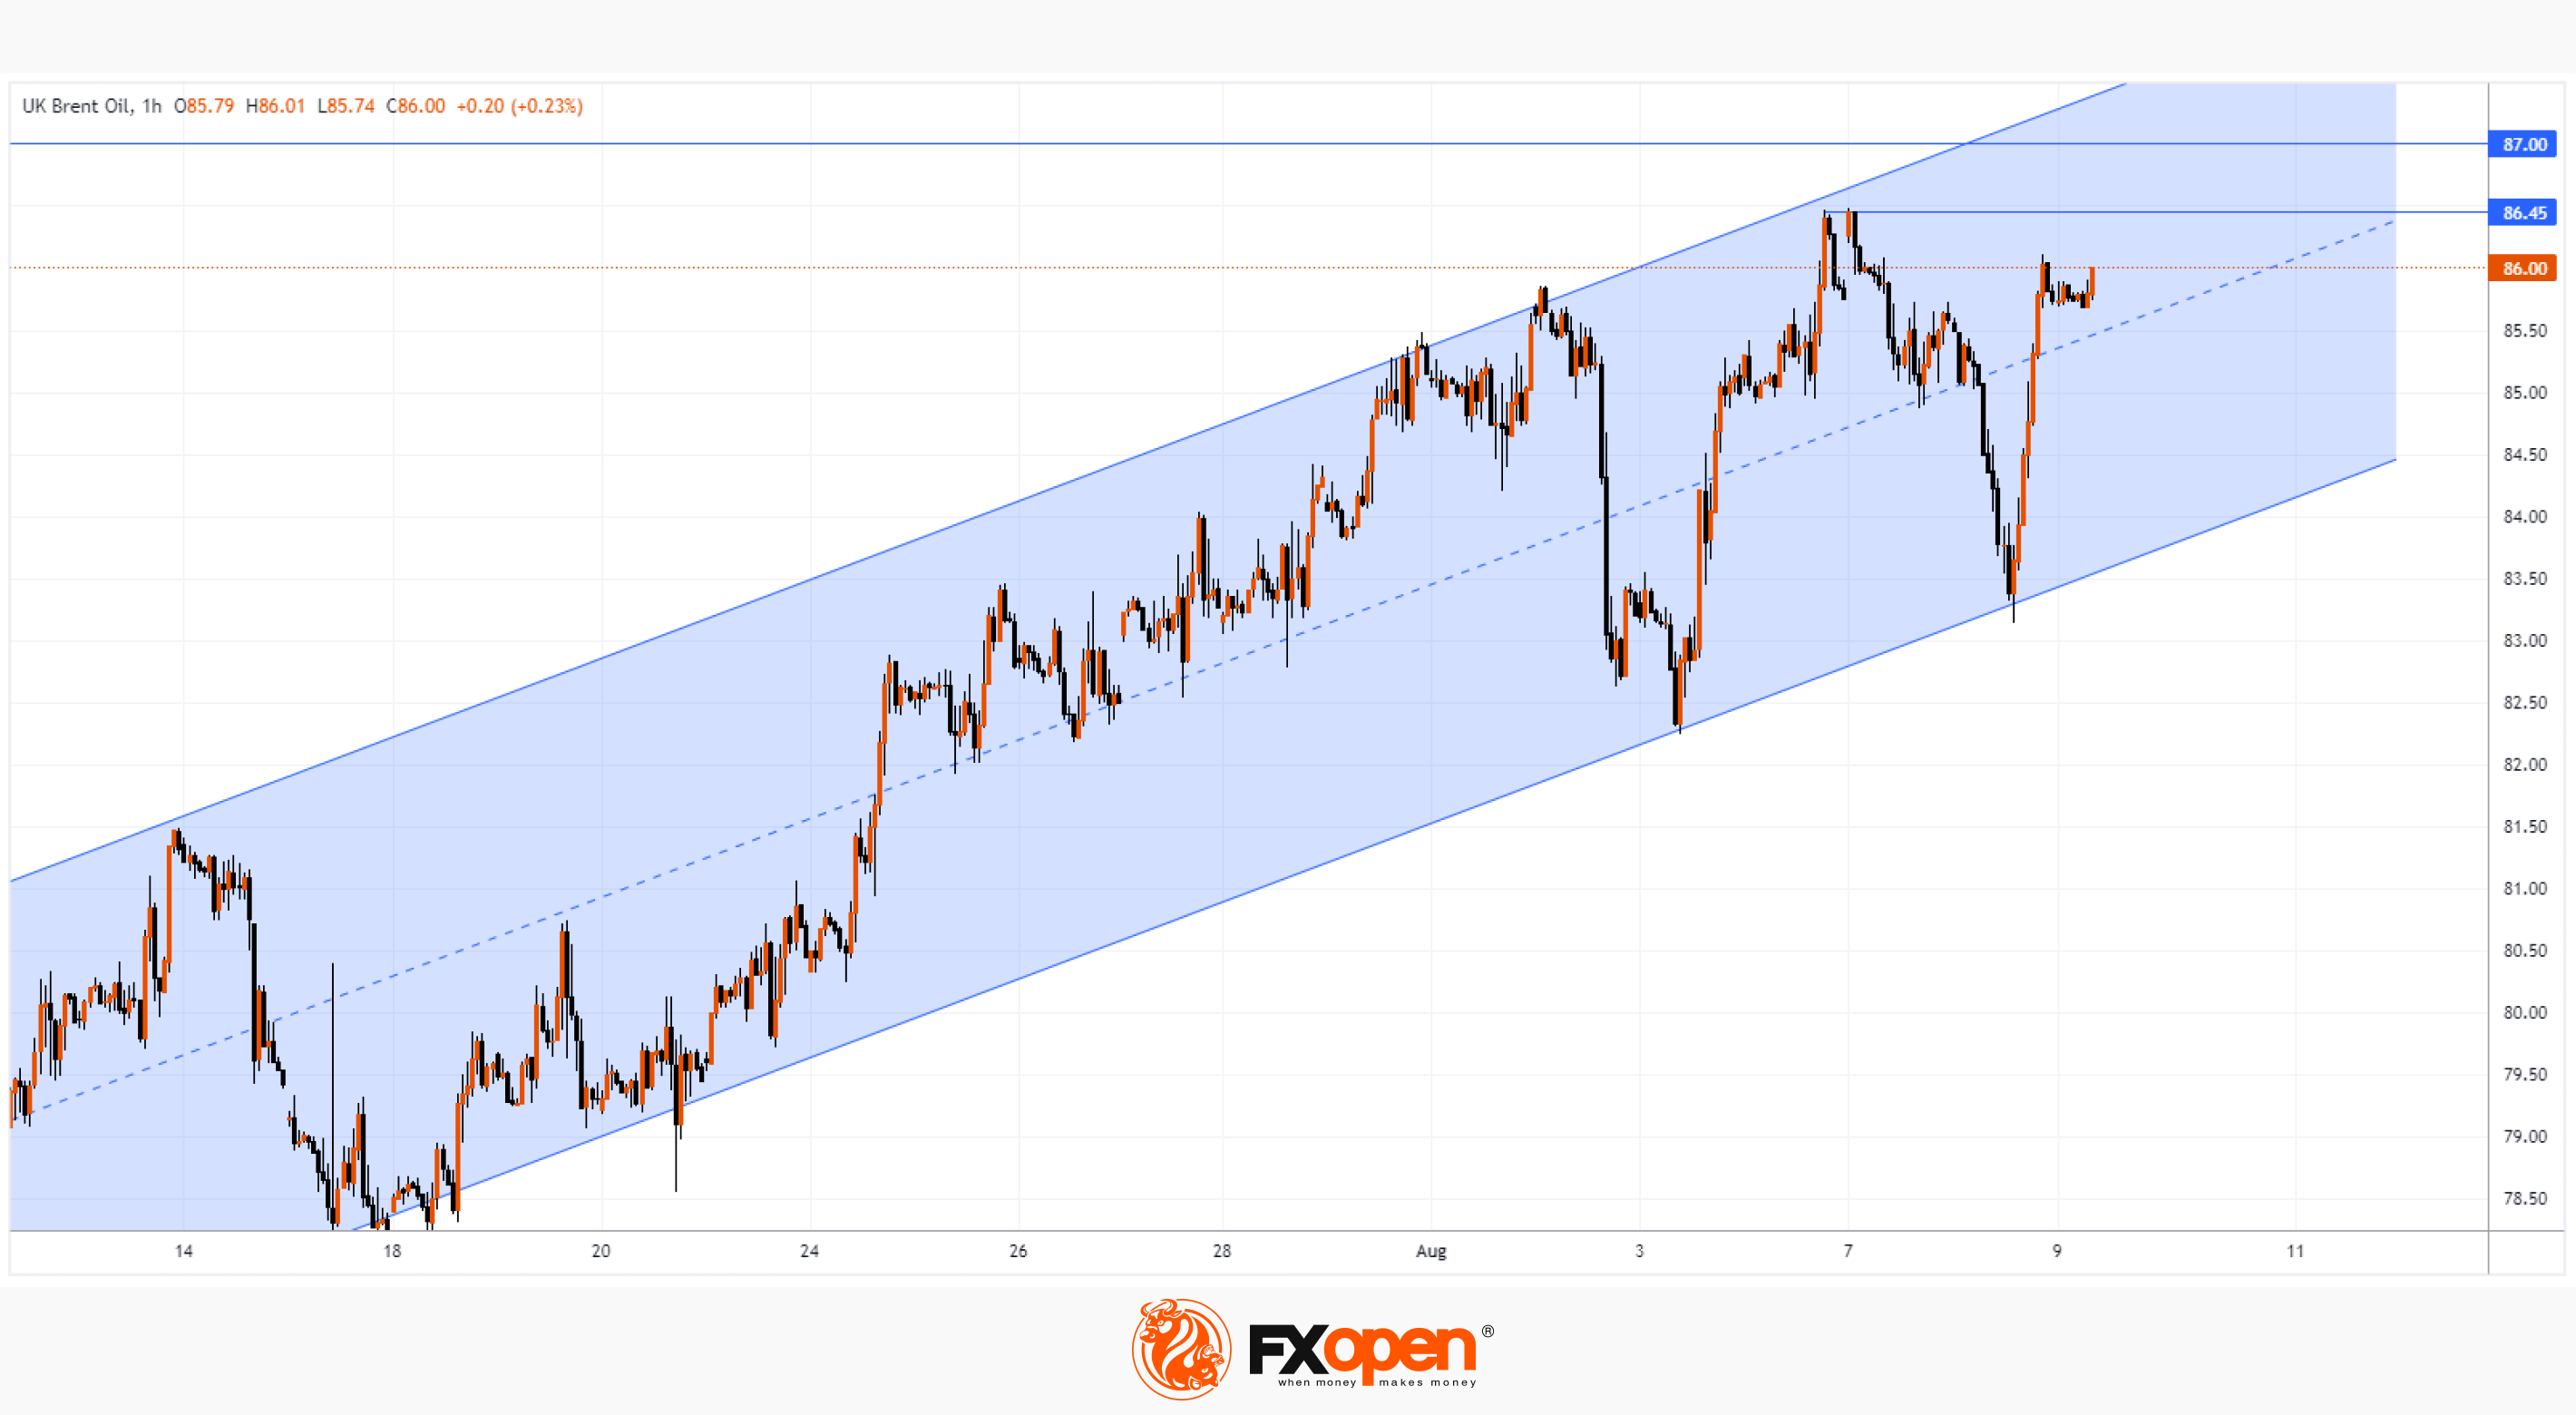
Under the influence of these and other factors, the price of Brent oil rose close to the highs of the year around USD 87 per barrel, forming an upward channel. At the same time, in August, the price bounced strongly from its lower border twice, indicating the strength of demand. On the other hand, the progress of the bulls in the formation of the August high is very small, if you compare this peak with the previous one, set on the 2nd of August — a sign of the exhaustion of the bullish momentum.
It is reasonable to assume that the market can find a balance at current levels, and the price will enter the consolidation range, as holders of long positions can take profits after the increase in the price of Brent oil by more than 14% since July 1. At the same time, false breakdowns of the high of the year are not ruled out.
Important levels:
→ USD 87.15 – resistance of the high of the year;
→ USD 86.45 – resistance from August high;
→ borders of the ascending channel.
To benefit from the rise and fall of Brent oil prices, consider enlisting the services of a trusted broker like FXOpen.
⚠️
CFDs are complex instruments and come with a high risk of losing your money.
This article represents the opinion of the Companies operating under the FXOpen brand only. It is not to be construed as an offer, solicitation, or recommendation with respect to products and services provided by the Companies operating under the FXOpen brand, nor is it to be considered financial advice.
Market Analysis: The Price of Brent Oil Approaching the Highs of the Year
The price is driven up by:
→ the policy of limiting oil production by OPEC+ countries. For example, Saudi Arabia last week announced a cut in production by 1 million barrels per day until the end of September, adding that the decision could be extended. Russia is also reducing production volumes. We wrote about the scenario of increasing growth in the price of Brent oil due to production cuts in a post dated July 7;
→ hopes/rumors that the Chinese authorities will stimulate the economy, which is not recovering enough after the lifting of COVID-related restrictions.
Selling pressure is driven by:
→ raising rates by Western central banks to fight high inflation.
Under the influence of these and other factors, the price of Brent oil rose close to the highs of the year around USD 87 per barrel, forming an upward channel. At the same time, in August, the price bounced strongly from its lower border twice, indicating the strength of demand. On the other hand, the progress of the bulls in the formation of the August high is very small, if you compare this peak with the previous one, set on the 2nd of August — a sign of the exhaustion of the bullish momentum.
It is reasonable to assume that the market can find a balance at current levels, and the price will enter the consolidation range, as holders of long positions can take profits after the increase in the price of Brent oil by more than 14% since July 1. At the same time, false breakdowns of the high of the year are not ruled out.
Important levels:
→ USD 87.15 – resistance of the high of the year;
→ USD 86.45 – resistance from August high;
→ borders of the ascending channel.
To benefit from the rise and fall of Brent oil prices, consider enlisting the services of a trusted broker like FXOpen.
⚠️
CFDs are complex instruments and come with a high risk of losing your money.
This article represents the opinion of the Companies operating under the FXOpen brand only. It is not to be construed as an offer, solicitation, or recommendation with respect to products and services provided by the Companies operating under the FXOpen brand, nor is it to be considered financial advice.
#MarketNews #gasprice
XNG/USD: Natural Gas Price Hits 5-month High
The hostilities in Ukraine have drastically changed the world's natural gas transportation routes, and yesterday's information about possible interruptions in the supply of liquefied gas from Australia due to the planned strikes of workers led to the fact that the XNG/USD quote jumped above the psychological level of USD 3.0.
Citigroup analysts believe that gas prices in Europe could double by January if strikes in Australia, which is an important supplier of liquefied gas to Europe and Asia, drag on through the autumn.
And the FT writes that yesterday's growth was accelerated due to the fact that traders closed short positions, thereby increasing demand.
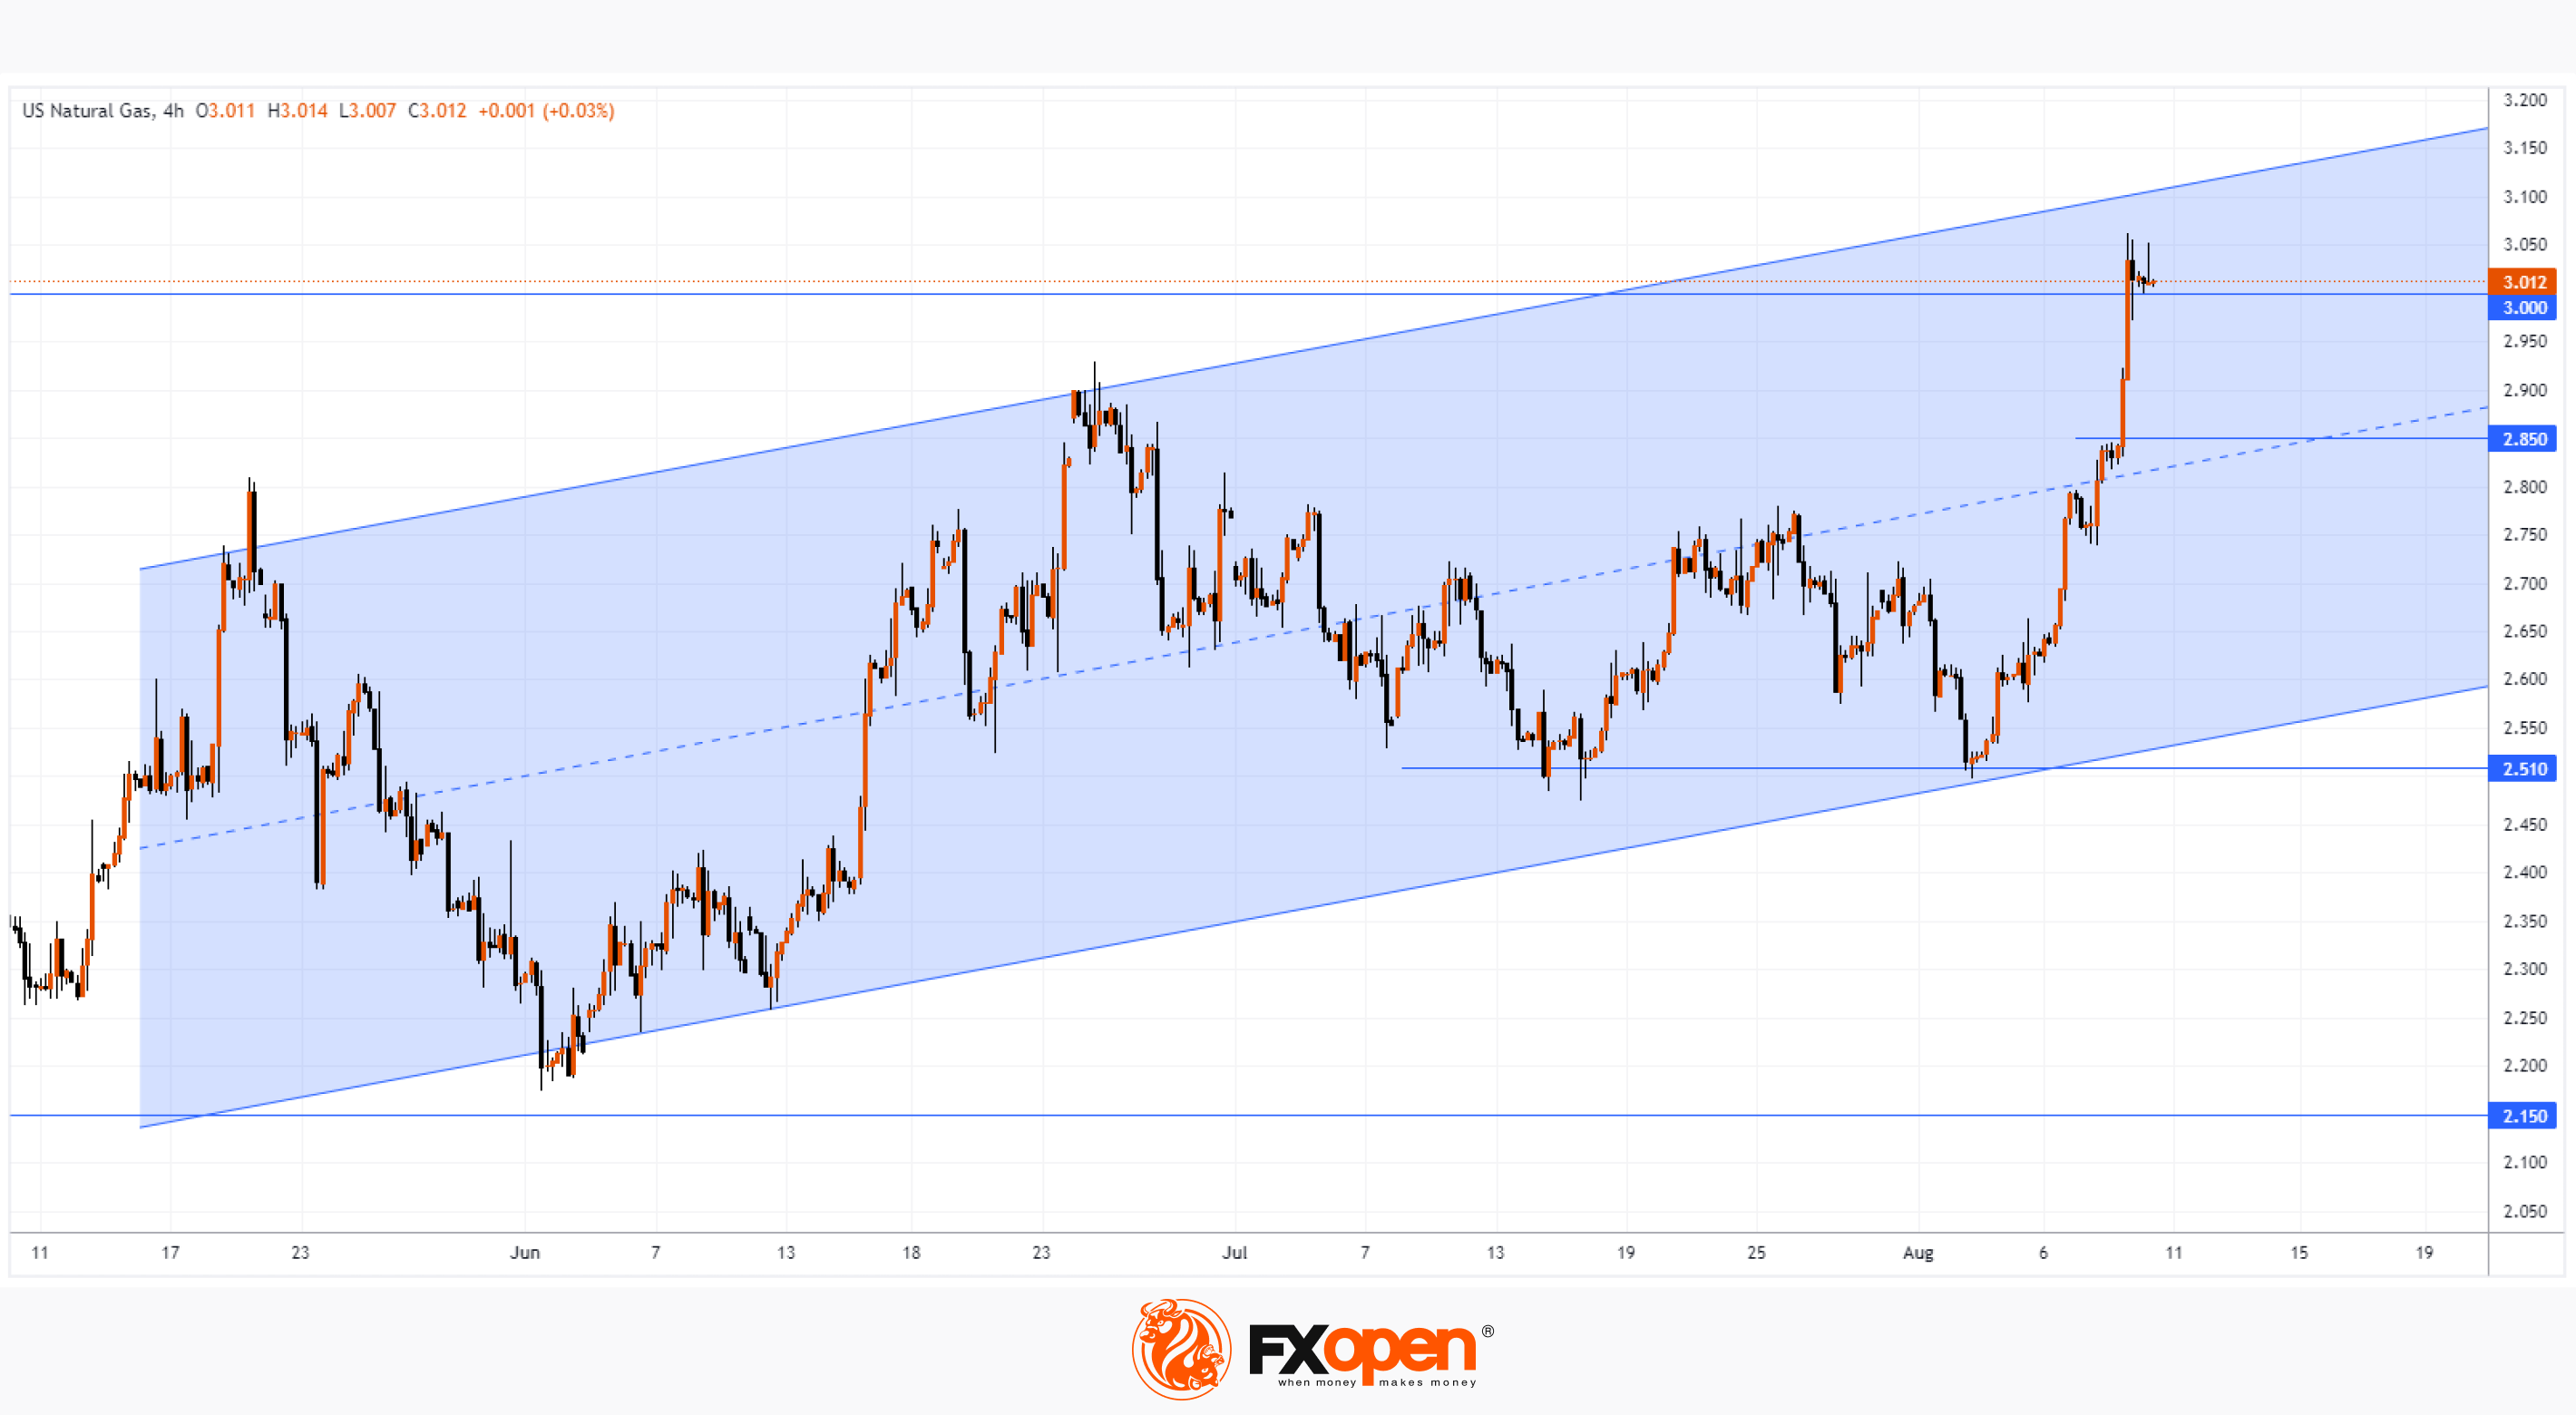
The XNG price chart shows that the extremes of summer are forming an ascending channel, and its upper limit has not yet been reached. The ability of the bulls to gain a foothold above the psychological level of USD 3.0 will indicate the strength of demand.
Important lines on the XNG/USD chart:
→ resistance from the upper border of the channel;
→ support from the median line of the channel;
→ support at USD 2.51;
→ support at USD 2.85 – yesterday this level near the June maximum acted as resistance, but was broken.
Market volatility is likely to continue today as news on US natural gas reserves is scheduled to be released at 17:30 GMT+3.
To benefit from rising and falling prices in the energy markets, consider enlisting the services of a trusted broker like FXOpen.
⚠️
CFDs are complex instruments and come with a high risk of losing your money.
This article represents the opinion of the Companies operating under the FXOpen brand only. It is not to be construed as an offer, solicitation, or recommendation with respect to products and services provided by the Companies operating under the FXOpen brand, nor is it to be considered financial advice.
XNG/USD: Natural Gas Price Hits 5-month High
The hostilities in Ukraine have drastically changed the world's natural gas transportation routes, and yesterday's information about possible interruptions in the supply of liquefied gas from Australia due to the planned strikes of workers led to the fact that the XNG/USD quote jumped above the psychological level of USD 3.0.
Citigroup analysts believe that gas prices in Europe could double by January if strikes in Australia, which is an important supplier of liquefied gas to Europe and Asia, drag on through the autumn.
And the FT writes that yesterday's growth was accelerated due to the fact that traders closed short positions, thereby increasing demand.
The XNG price chart shows that the extremes of summer are forming an ascending channel, and its upper limit has not yet been reached. The ability of the bulls to gain a foothold above the psychological level of USD 3.0 will indicate the strength of demand.
Important lines on the XNG/USD chart:
→ resistance from the upper border of the channel;
→ support from the median line of the channel;
→ support at USD 2.51;
→ support at USD 2.85 – yesterday this level near the June maximum acted as resistance, but was broken.
Market volatility is likely to continue today as news on US natural gas reserves is scheduled to be released at 17:30 GMT+3.
To benefit from rising and falling prices in the energy markets, consider enlisting the services of a trusted broker like FXOpen.
⚠️
CFDs are complex instruments and come with a high risk of losing your money.
This article represents the opinion of the Companies operating under the FXOpen brand only. It is not to be construed as an offer, solicitation, or recommendation with respect to products and services provided by the Companies operating under the FXOpen brand, nor is it to be considered financial advice.
👍1
#MarketNews #EURJPY
EUR/JPY Analysis: Highest Since Fall 2008
Yen Weakening Drivers:
→ rising prices for energy resources. After all, Japan is a major importer.
→ The inflation index CGPI (corporate goods price index) indicates a slowdown in inflation. Therefore, this raises the likelihood that the Bank of Japan will maintain an ultra-loose monetary policy.
The growth of the euro against the yen is facilitated by the fact that the ECB is pursuing a tough policy. Market participants expect that another rate increase could be made in autumn.
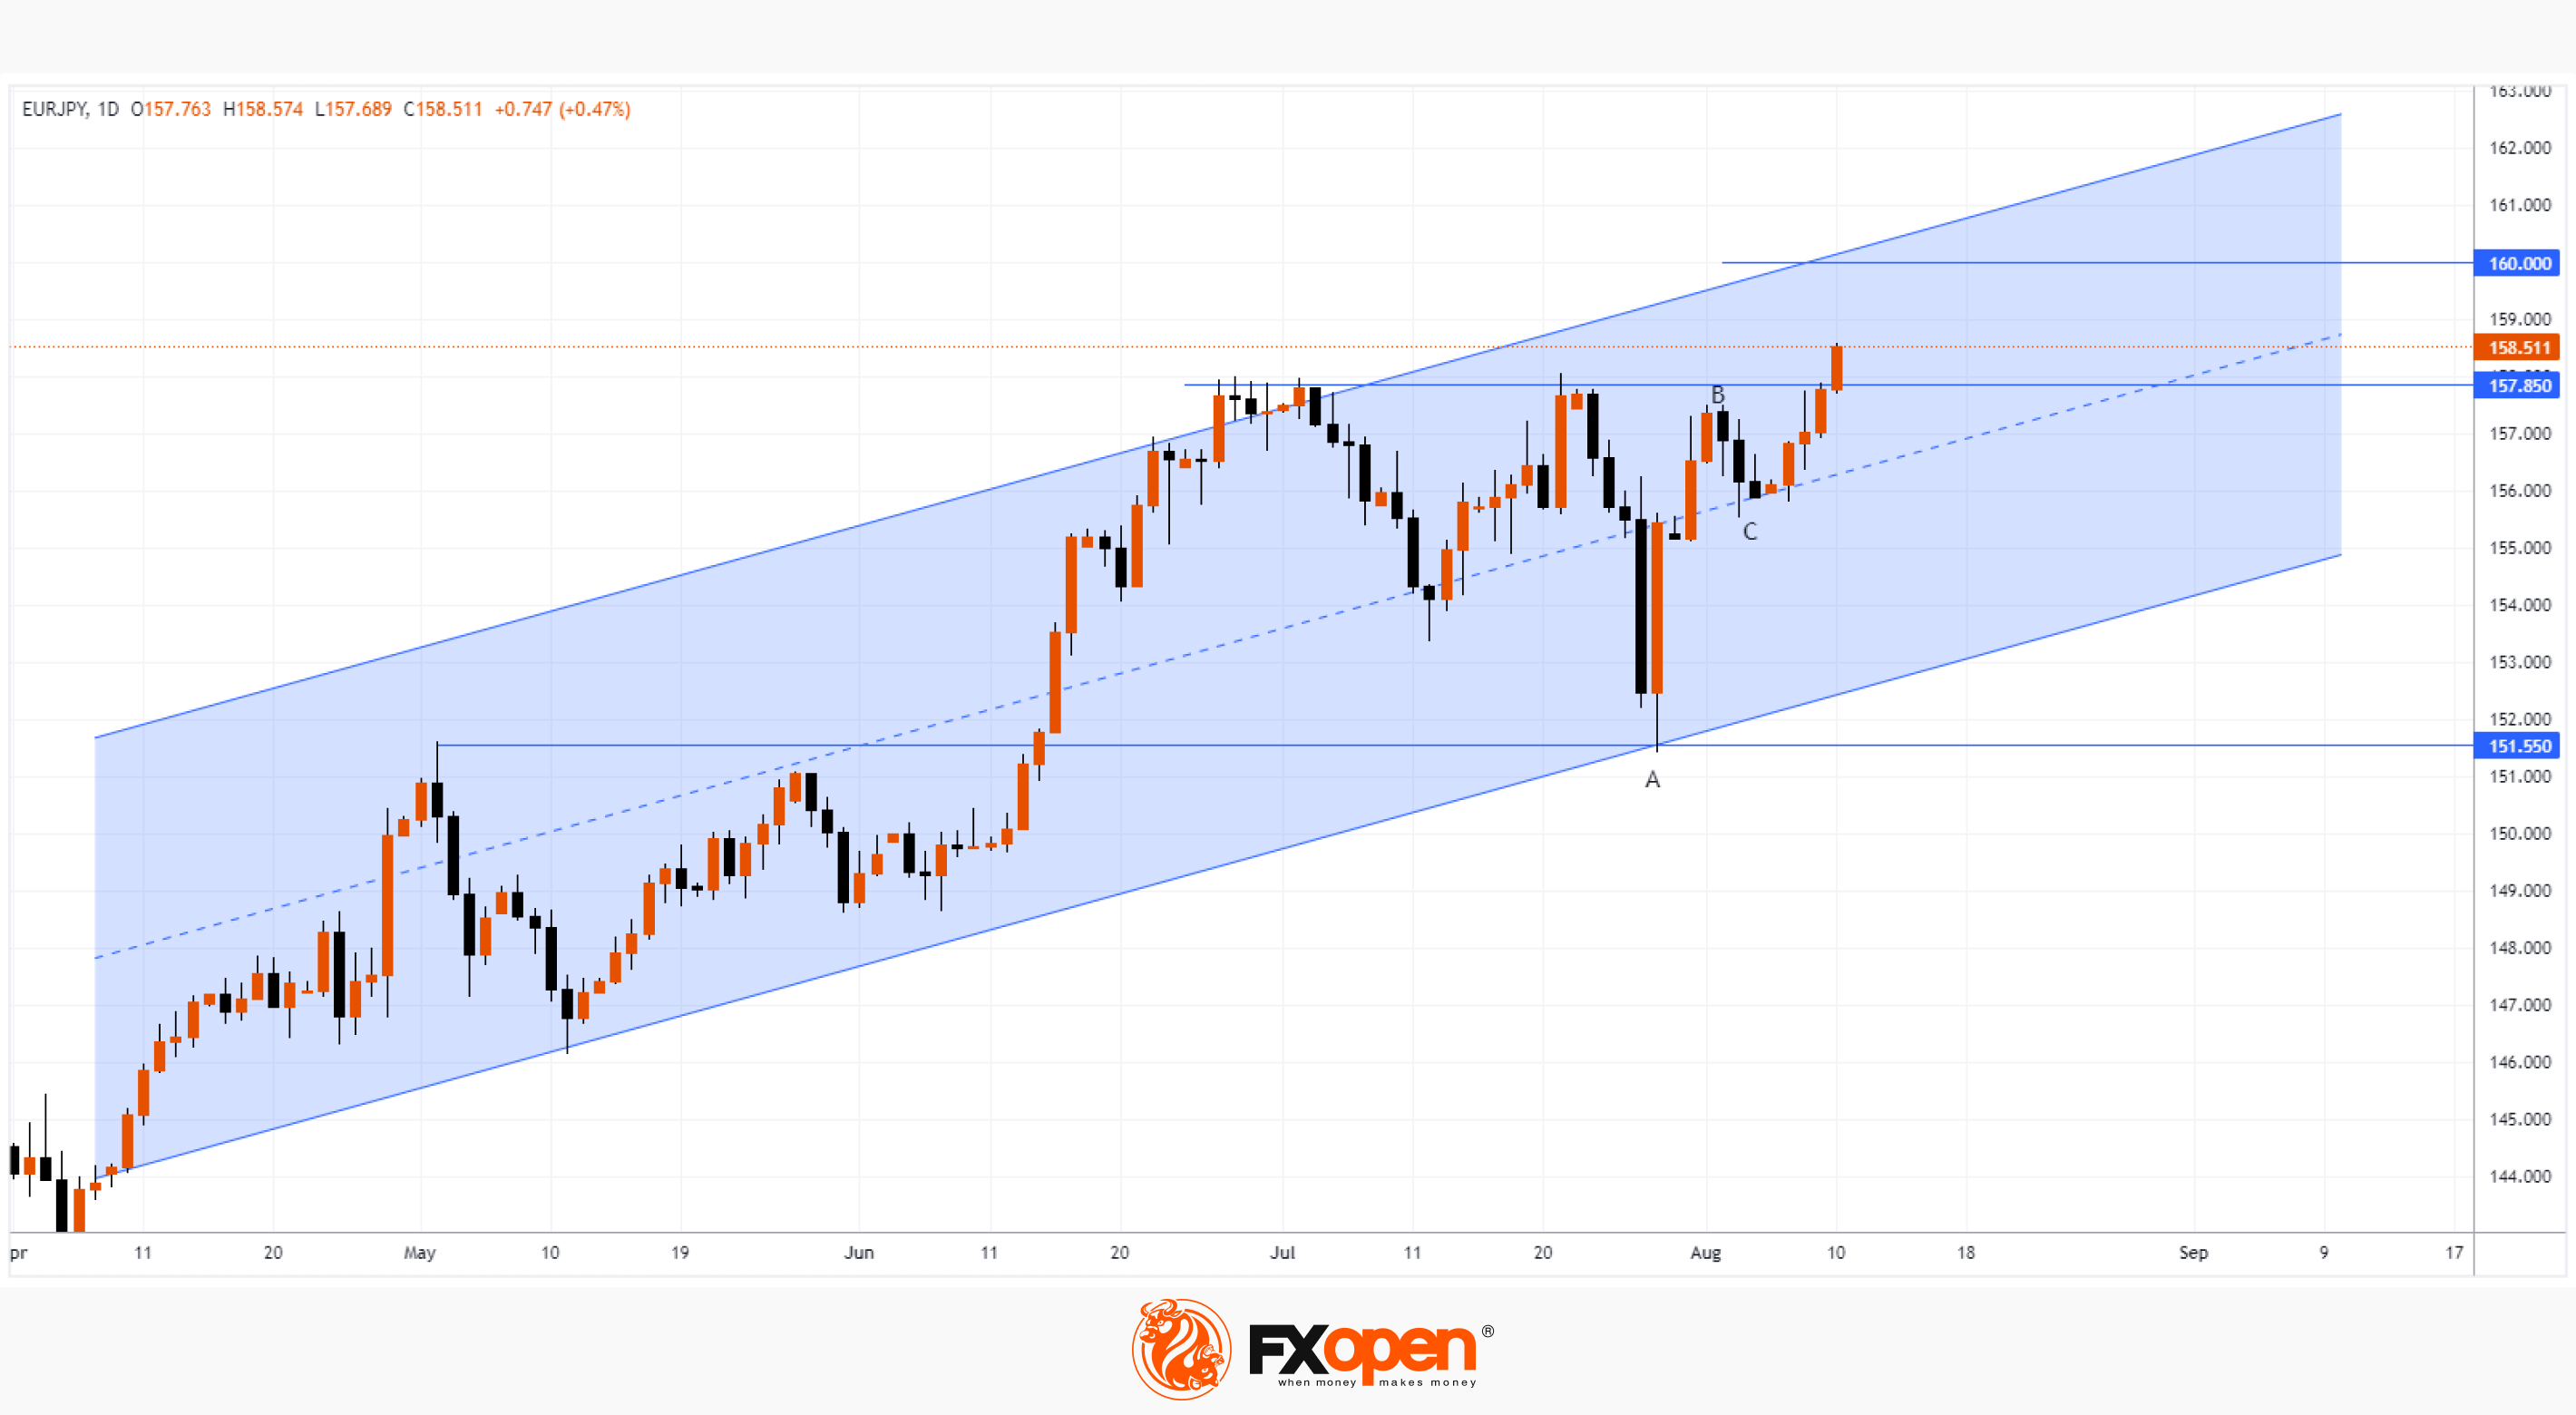
The EUR/JPY chart shows that the rate is in an uptrend. The market recovered quickly from the sharp decline on July 27, a testament to the strength of demand. Another piece of evidence is the amount of B→C retracement after A→B rises. It was only about 30% of the momentum.
Support levels:
→ 157.85. After the breakout by the bulls, the previous resistance may provide support, as was the case with the 151.55 level, which worked as a resistance in May, but provided support at the end of June;
→ median channel line.
Resistance Levels:
→ upper border of the channel;
→ the psychological level of 160 yen per euro.
Today (at 15:30 GMT+3) inflation news in the US is expected, which can shake financial markets a lot.
To benefit from the rise and fall of currency quotes, consider enlisting the services of a trusted broker like FXOpen.
⚠️
CFDs are complex instruments and come with a high risk of losing your money.
This article represents the opinion of the Companies operating under the FXOpen brand only. It is not to be construed as an offer, solicitation, or recommendation with respect to products and services provided by the Companies operating under the FXOpen brand, nor is it to be considered financial advice.
EUR/JPY Analysis: Highest Since Fall 2008
Yen Weakening Drivers:
→ rising prices for energy resources. After all, Japan is a major importer.
→ The inflation index CGPI (corporate goods price index) indicates a slowdown in inflation. Therefore, this raises the likelihood that the Bank of Japan will maintain an ultra-loose monetary policy.
The growth of the euro against the yen is facilitated by the fact that the ECB is pursuing a tough policy. Market participants expect that another rate increase could be made in autumn.
The EUR/JPY chart shows that the rate is in an uptrend. The market recovered quickly from the sharp decline on July 27, a testament to the strength of demand. Another piece of evidence is the amount of B→C retracement after A→B rises. It was only about 30% of the momentum.
Support levels:
→ 157.85. After the breakout by the bulls, the previous resistance may provide support, as was the case with the 151.55 level, which worked as a resistance in May, but provided support at the end of June;
→ median channel line.
Resistance Levels:
→ upper border of the channel;
→ the psychological level of 160 yen per euro.
Today (at 15:30 GMT+3) inflation news in the US is expected, which can shake financial markets a lot.
To benefit from the rise and fall of currency quotes, consider enlisting the services of a trusted broker like FXOpen.
⚠️
CFDs are complex instruments and come with a high risk of losing your money.
This article represents the opinion of the Companies operating under the FXOpen brand only. It is not to be construed as an offer, solicitation, or recommendation with respect to products and services provided by the Companies operating under the FXOpen brand, nor is it to be considered financial advice.
#MarketNews #xauusd
XAU/USD Price Analysis: Bears Approach Important Support
Yesterday, fresh values of the CPI index were published, which testified to a moderate slowdown in inflation in the US. The actual value was 3.2% in annual terms (expected 3.3%, a month earlier = 3.0%, a year earlier = 9.1%).
In reaction to the news, the price of gold fell from a daily high around USD 1,930 an ounce to renew the August low. Such behavior can be interpreted as a decrease in the value of the precious metal, as it loses its relevance as a protective asset against inflation.
Earlier we wrote that August began for the gold market in a bearish way. The trend continues.
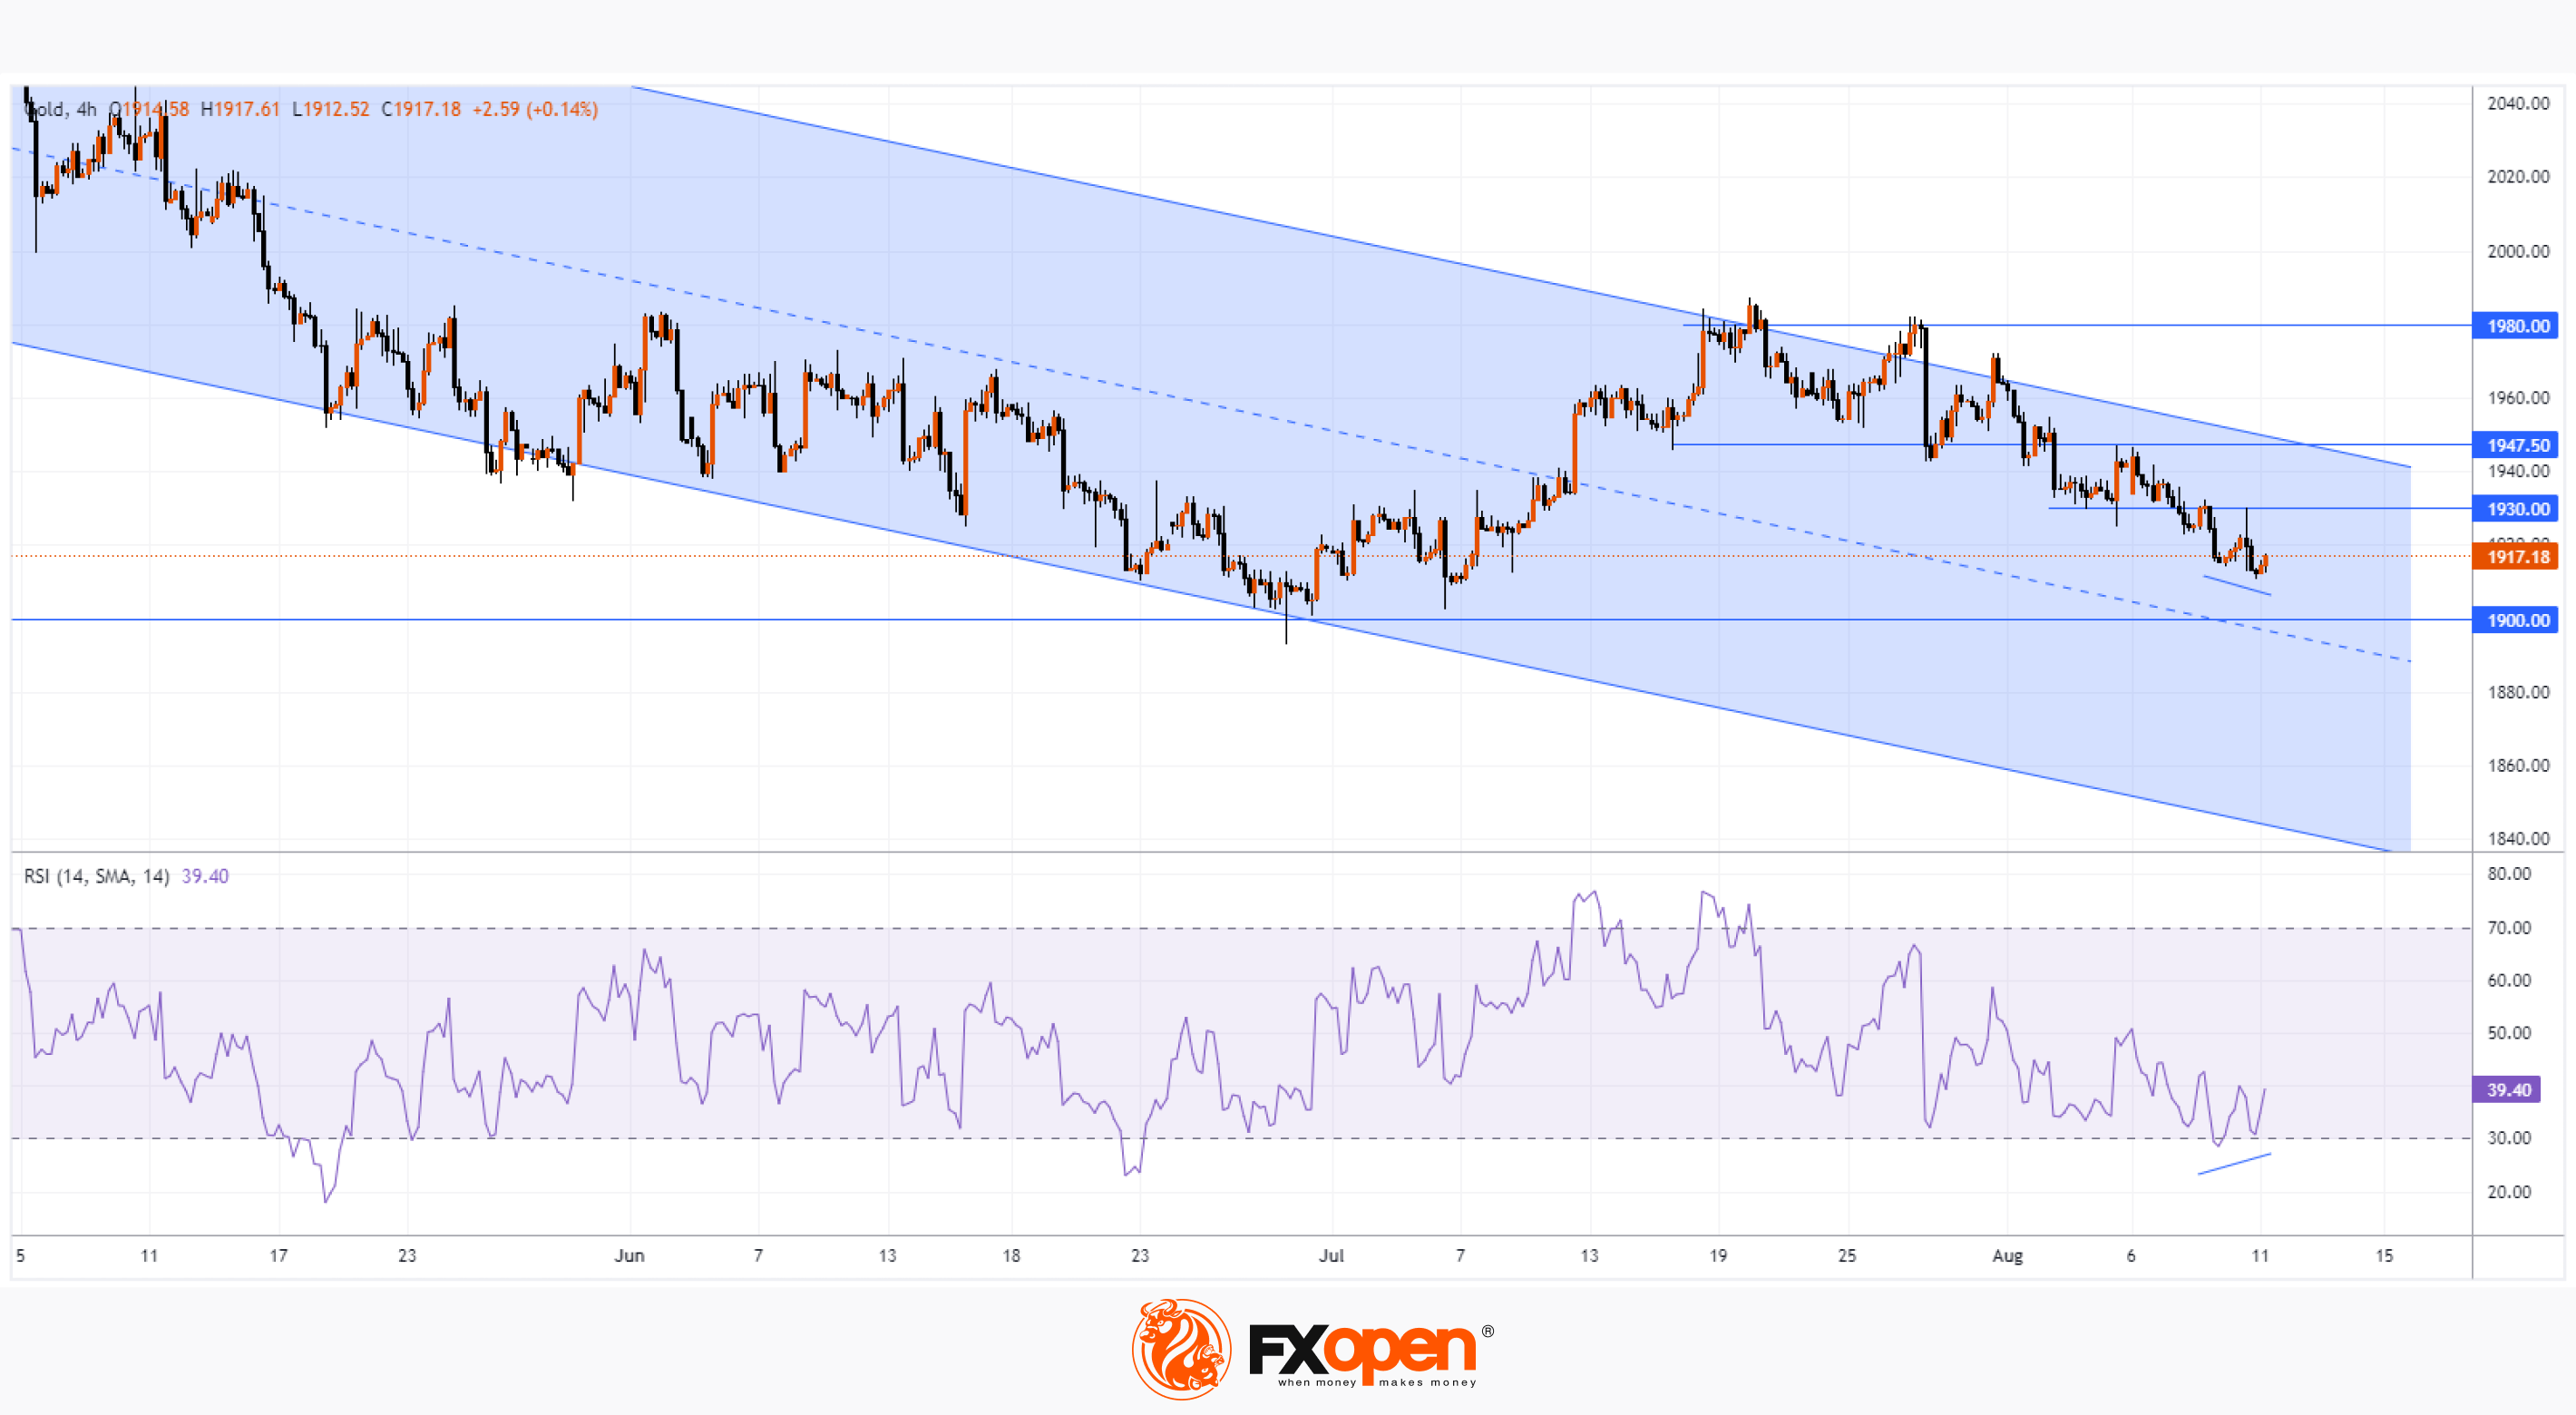
Technical analysis of the XAU/USD chart on the 4-hour timeframe shows that:
→ the price develops dynamics within the descending channel, which has been operating since May of this year;
→ yesterday there was a test of resistance at the level of USD 1,930, which served as support in early August. This is a bearish sign;
→ the price of gold is approaching an important support at the psychological level of USD 1,900 per ounce;
→ a series of lower highs is formed on the chart;
→ the RSI indicator rose from the oversold zone, forming a bullish divergence pattern.
It is reasonable to assume that when approaching psychological support, the bears in the gold market will lose confidence, and therefore rebounds are possible. But in order for them to develop into a sustainable rally, it will probably take the impact of important news.
To benefit from the rise and fall in the price of XAU/USD, consider enlisting the services of a trusted broker like FXOpen.
⚠️
CFDs are complex instruments and come with a high risk of losing your money.
This article represents the opinion of the Companies operating under the FXOpen brand only. It is not to be construed as an offer, solicitation, or recommendation with respect to products and services provided by the Companies operating under the FXOpen brand, nor is it to be considered financial advice.
XAU/USD Price Analysis: Bears Approach Important Support
Yesterday, fresh values of the CPI index were published, which testified to a moderate slowdown in inflation in the US. The actual value was 3.2% in annual terms (expected 3.3%, a month earlier = 3.0%, a year earlier = 9.1%).
In reaction to the news, the price of gold fell from a daily high around USD 1,930 an ounce to renew the August low. Such behavior can be interpreted as a decrease in the value of the precious metal, as it loses its relevance as a protective asset against inflation.
Earlier we wrote that August began for the gold market in a bearish way. The trend continues.
Technical analysis of the XAU/USD chart on the 4-hour timeframe shows that:
→ the price develops dynamics within the descending channel, which has been operating since May of this year;
→ yesterday there was a test of resistance at the level of USD 1,930, which served as support in early August. This is a bearish sign;
→ the price of gold is approaching an important support at the psychological level of USD 1,900 per ounce;
→ a series of lower highs is formed on the chart;
→ the RSI indicator rose from the oversold zone, forming a bullish divergence pattern.
It is reasonable to assume that when approaching psychological support, the bears in the gold market will lose confidence, and therefore rebounds are possible. But in order for them to develop into a sustainable rally, it will probably take the impact of important news.
To benefit from the rise and fall in the price of XAU/USD, consider enlisting the services of a trusted broker like FXOpen.
⚠️
CFDs are complex instruments and come with a high risk of losing your money.
This article represents the opinion of the Companies operating under the FXOpen brand only. It is not to be construed as an offer, solicitation, or recommendation with respect to products and services provided by the Companies operating under the FXOpen brand, nor is it to be considered financial advice.
#MarketNews #LTCUSD
LTC/USD Analysis: Litecoin Price Declines after Halving
On Wednesday, August 2, the planned halving took place in the Litecoin network. Now the reward of miners for each mined block has decreased by 2 times from 12.5 LTC to 6.25 LTC. Theoretically, this should make the cryptocurrency more scarce.
On the eve of the halving, experts were bullish. Thus, financier David Cox voiced a forecast about a possible increase in LTC to USD 189.2. Analyst Michaël van de Poppe provided a bolder upside scenario to USD 200. Also positive statements were made by the creator of the Litecoin project Charlie Lee. However, in fact, we see that the LTC/USD rate fell after the halving.
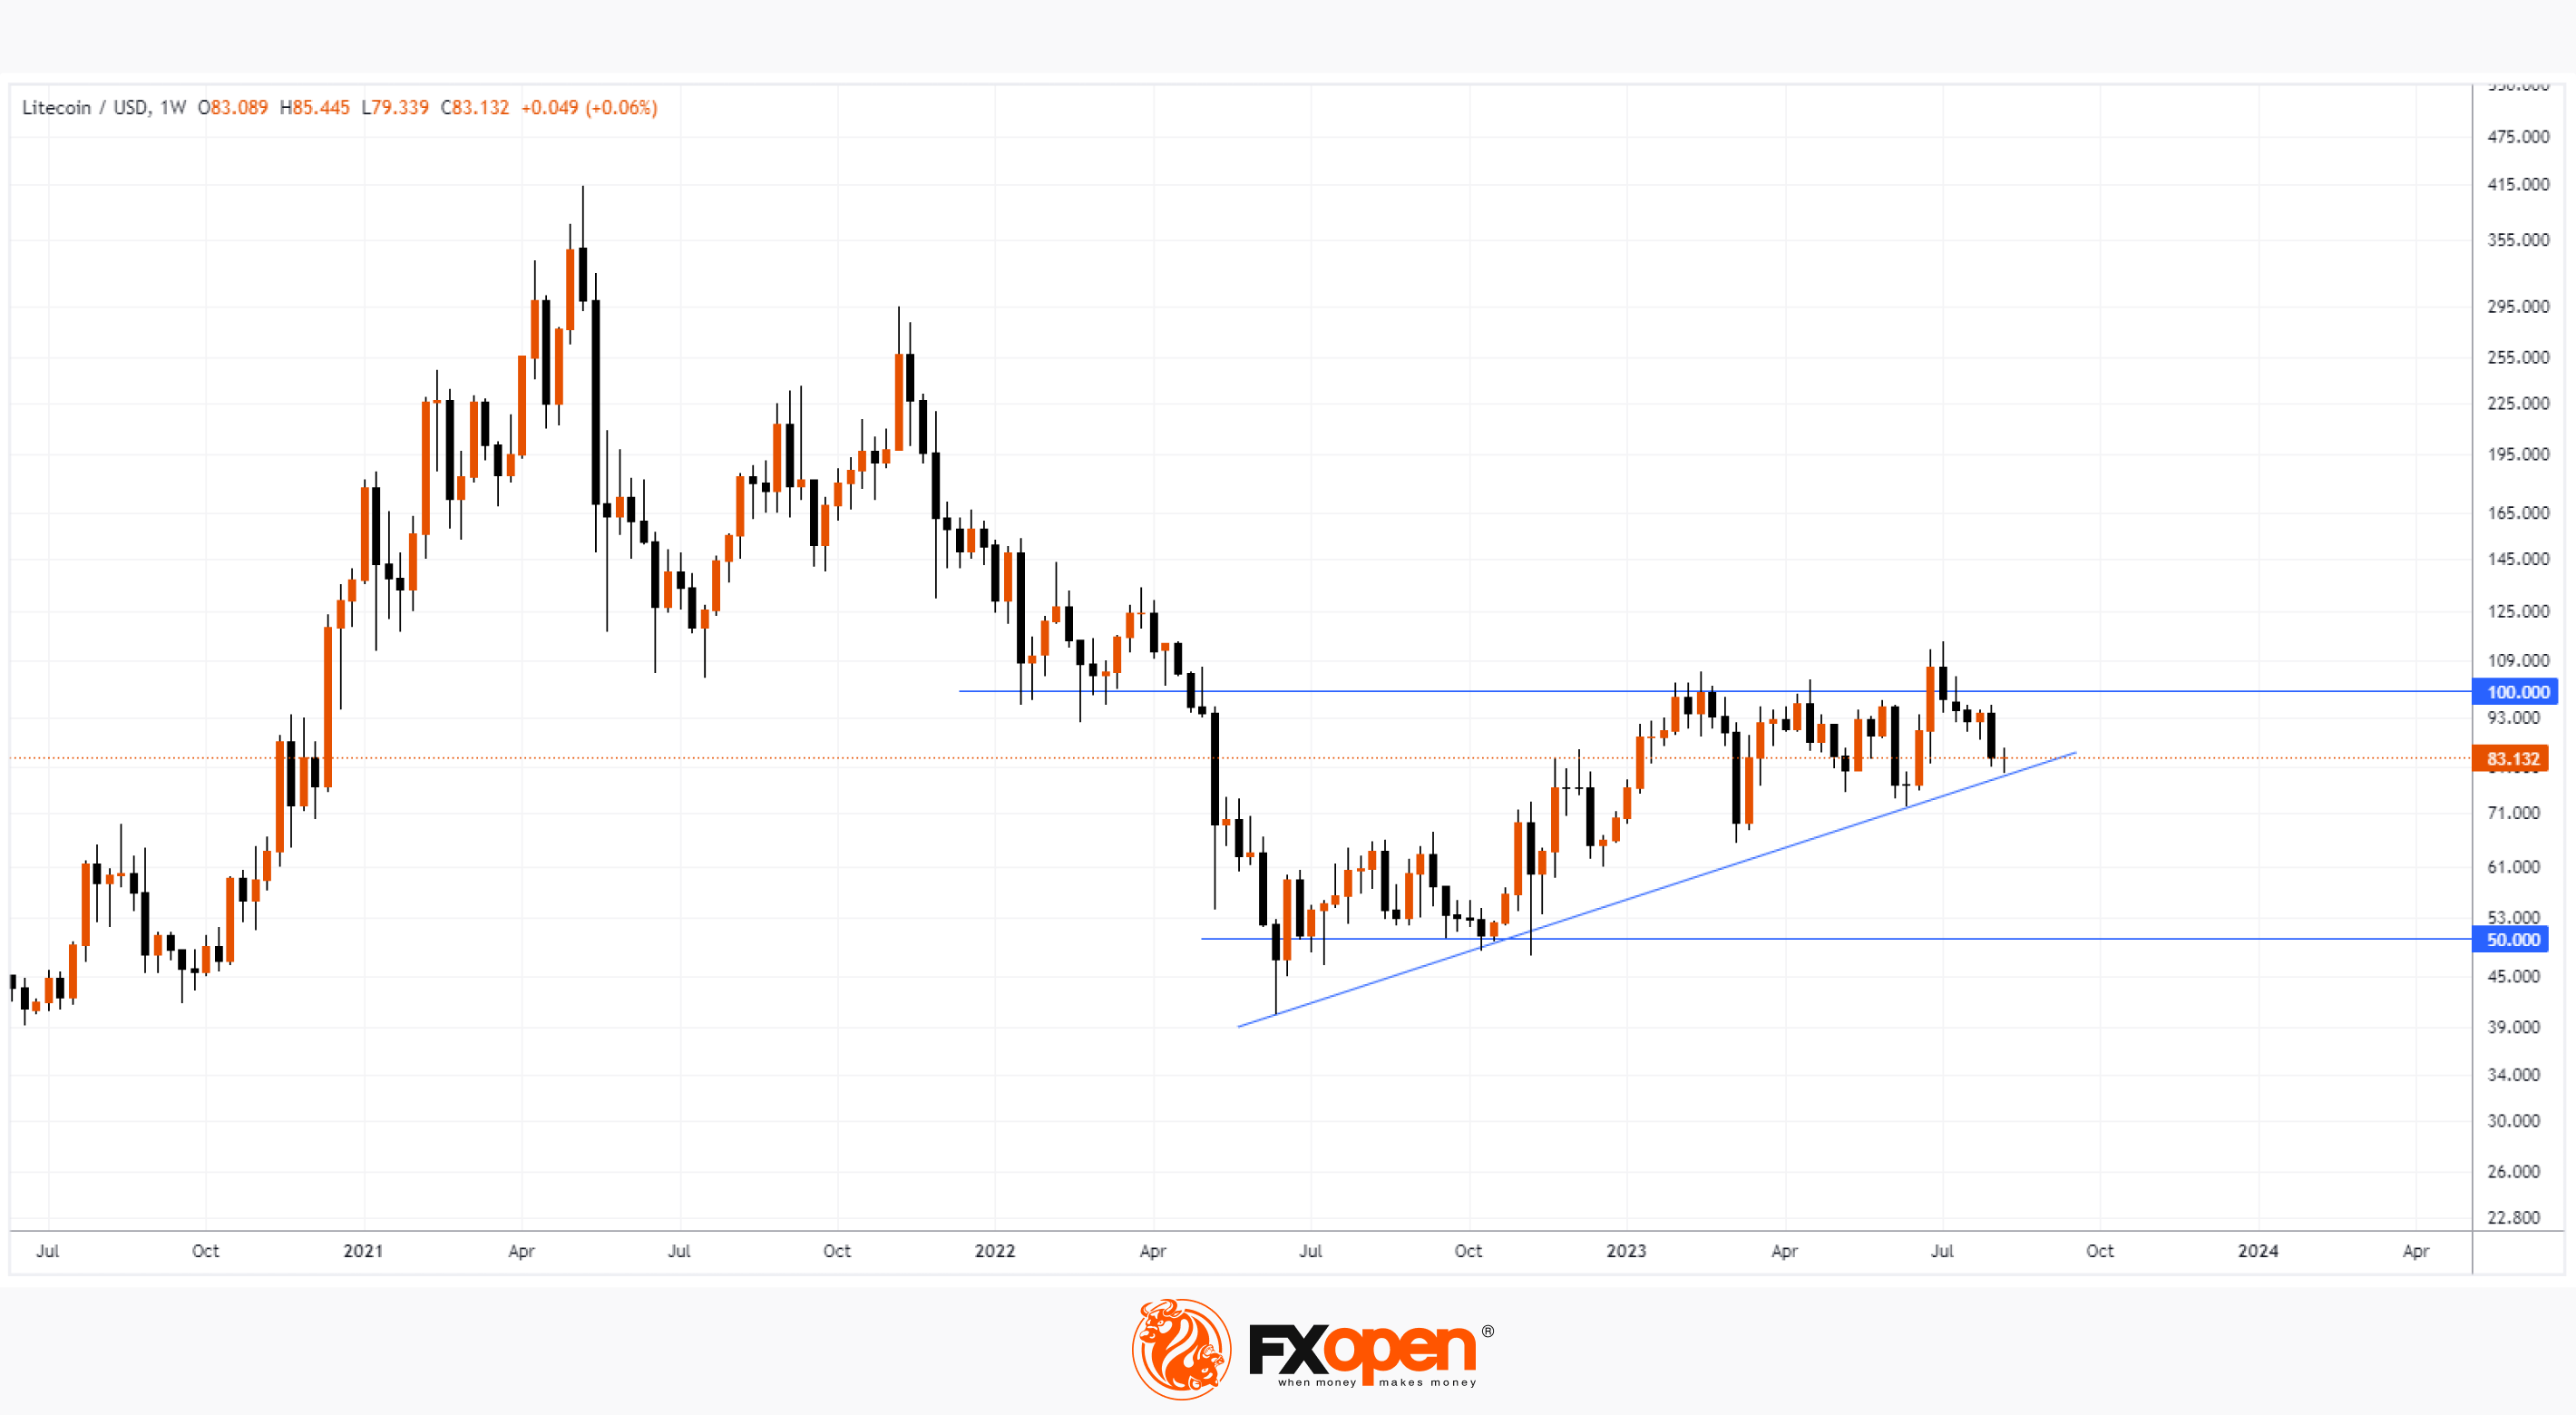
According to the technical analysis of the LTC/USD chart on a weekly period:
→ The “round” level of USD 100 looks like an important resistance. In 2022, it acted as support, but in 2023 it proved to be able to keep the price of litecoin on the back of a general rally in the cryptocurrency market and the positive associated with halving.
→ The price is near an important support (shown in blue) that has been in effect since mid-2022. The price shows no signs of a bounce, which calls into question the strength of demand and increases the likelihood of a bearish breakout.
→ The USD 50 level looks like a major support, because it kept Litecoin from falling in the second half of 2022, when the same bitcoin was making new lows amid the collapse of the FTX exchange.
A breakdown of the narrowing triangle that forms the blue support line and the psychological level of USD 100 per coin can lead to a significant trend.
To benefit from the rise and fall of the LTC/USD rate, consider enlisting the services of a trusted broker like FXOpen.
⚠️
CFDs are complex instruments and come with a high risk of losing your money.
This article represents the opinion of the Companies operating under the FXOpen brand only. It is not to be construed as an offer, solicitation, or recommendation with respect to products and services provided by the Companies operating under the FXOpen brand, nor is it to be considered financial advice.
At FXOpen UK and FXOpen AU, Cryptocurrency CFDs are only available for trading by those clients categorised as Professional clients under FCA Rules and Professional clients under ASIC Rules, respectively. They are not available for trading by Retail clients.
LTC/USD Analysis: Litecoin Price Declines after Halving
On Wednesday, August 2, the planned halving took place in the Litecoin network. Now the reward of miners for each mined block has decreased by 2 times from 12.5 LTC to 6.25 LTC. Theoretically, this should make the cryptocurrency more scarce.
On the eve of the halving, experts were bullish. Thus, financier David Cox voiced a forecast about a possible increase in LTC to USD 189.2. Analyst Michaël van de Poppe provided a bolder upside scenario to USD 200. Also positive statements were made by the creator of the Litecoin project Charlie Lee. However, in fact, we see that the LTC/USD rate fell after the halving.
According to the technical analysis of the LTC/USD chart on a weekly period:
→ The “round” level of USD 100 looks like an important resistance. In 2022, it acted as support, but in 2023 it proved to be able to keep the price of litecoin on the back of a general rally in the cryptocurrency market and the positive associated with halving.
→ The price is near an important support (shown in blue) that has been in effect since mid-2022. The price shows no signs of a bounce, which calls into question the strength of demand and increases the likelihood of a bearish breakout.
→ The USD 50 level looks like a major support, because it kept Litecoin from falling in the second half of 2022, when the same bitcoin was making new lows amid the collapse of the FTX exchange.
A breakdown of the narrowing triangle that forms the blue support line and the psychological level of USD 100 per coin can lead to a significant trend.
To benefit from the rise and fall of the LTC/USD rate, consider enlisting the services of a trusted broker like FXOpen.
⚠️
CFDs are complex instruments and come with a high risk of losing your money.
This article represents the opinion of the Companies operating under the FXOpen brand only. It is not to be construed as an offer, solicitation, or recommendation with respect to products and services provided by the Companies operating under the FXOpen brand, nor is it to be considered financial advice.
At FXOpen UK and FXOpen AU, Cryptocurrency CFDs are only available for trading by those clients categorised as Professional clients under FCA Rules and Professional clients under ASIC Rules, respectively. They are not available for trading by Retail clients.
#MarketNews #USDJPY
USD/JPY Analysis: Rate Reaches Max of the Year
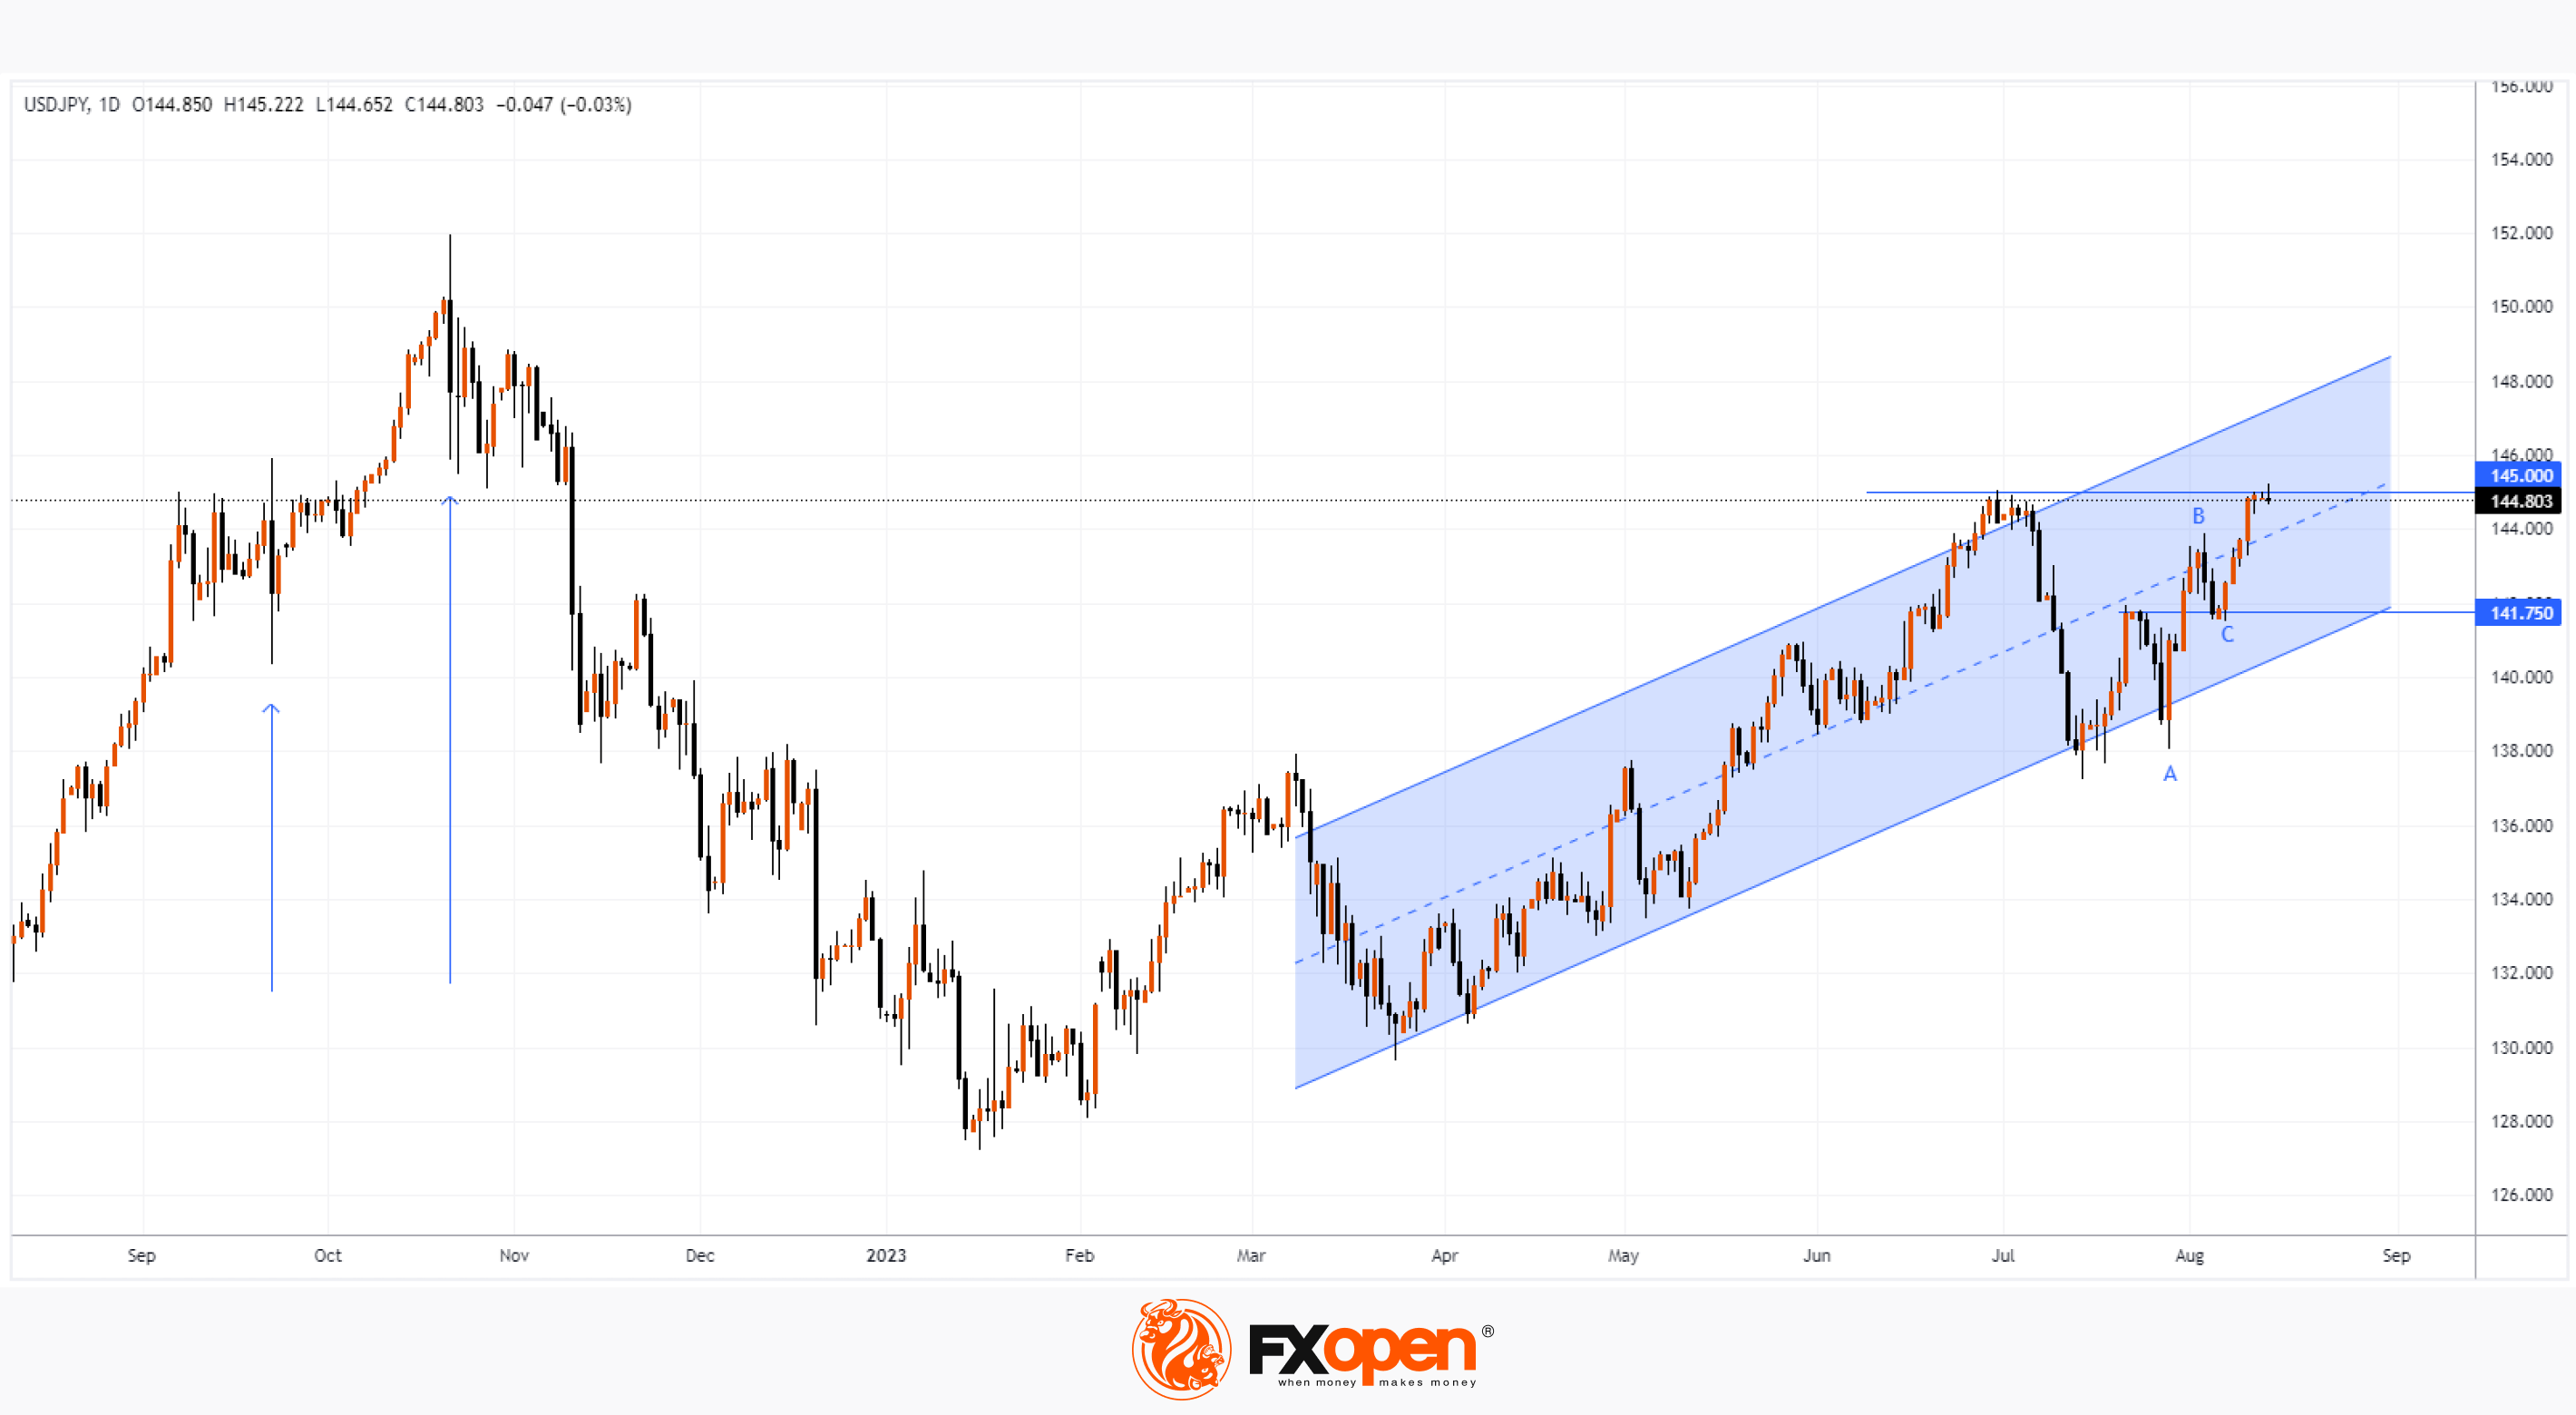
The uptrend in 2023 is due to the difference in the monetary policy of the Bank of Japan and the US Federal Reserve. As the chart shows, USD/JPY hit 145.22 yen per US dollar today. The last time such a rate was relevant was in November 2022 after foreign exchange interventions (marked with arrows).
Since the USD/JPY rate has again reached the level of 145 yen per US dollar, which is important for the Japanese authorities, traders expect official warnings regarding interventions, but there are none yet. Reuters reports the words of Joey Chu, head of Asian currency research at HSBC: "We believe that the Treasury will start moving in the 145-148 range."
Bullish arguments:
→ The ability of the exchange rate to recover from a sharp fall in early July indicates the strength of demand in the market.
→ The chart shows that the rate has not yet reached the upper limit of the ascending channel.
→ B→C retracement after A→B advance was less than 50%.
→ Central bank monetary policy differentials are unlikely to change any time soon.
Bearish arguments:
→ Presumably, traders may take profits from long positions, fearing currency interventions, which will slow down the current bullish trend.
→ This morning there was a false breakdown of June-July highs to force sellers to close positions and lure buyers in the wrong direction.
Important news calendar for USD/JPY (GMT+3):
→ data on inflation in Japan - on Friday, at 2:30;
→ US retail sales data - Tuesday at 15:30;
→ FOMC minutes - Wednesday at 21:30;
→ US labor market data - Thursday at 15:30.
Important levels:
→ support from the median line of the uplink;
→ psychological mark of 145 yen per US dollar;
→ support for 141.75.
To benefit from the rise and fall of the Japanese yen against the US dollar, consider enlisting the services of a trusted broker like FXOpen.
⚠️
CFDs are complex instruments and come with a high risk of losing your money.
This article represents the opinion of the Companies operating under the FXOpen brand only. It is not to be construed as an offer, solicitation, or recommendation with respect to products and services provided by the Companies operating under the FXOpen brand, nor is it to be considered financial advice.
USD/JPY Analysis: Rate Reaches Max of the Year
The uptrend in 2023 is due to the difference in the monetary policy of the Bank of Japan and the US Federal Reserve. As the chart shows, USD/JPY hit 145.22 yen per US dollar today. The last time such a rate was relevant was in November 2022 after foreign exchange interventions (marked with arrows).
Since the USD/JPY rate has again reached the level of 145 yen per US dollar, which is important for the Japanese authorities, traders expect official warnings regarding interventions, but there are none yet. Reuters reports the words of Joey Chu, head of Asian currency research at HSBC: "We believe that the Treasury will start moving in the 145-148 range."
Bullish arguments:
→ The ability of the exchange rate to recover from a sharp fall in early July indicates the strength of demand in the market.
→ The chart shows that the rate has not yet reached the upper limit of the ascending channel.
→ B→C retracement after A→B advance was less than 50%.
→ Central bank monetary policy differentials are unlikely to change any time soon.
Bearish arguments:
→ Presumably, traders may take profits from long positions, fearing currency interventions, which will slow down the current bullish trend.
→ This morning there was a false breakdown of June-July highs to force sellers to close positions and lure buyers in the wrong direction.
Important news calendar for USD/JPY (GMT+3):
→ data on inflation in Japan - on Friday, at 2:30;
→ US retail sales data - Tuesday at 15:30;
→ FOMC minutes - Wednesday at 21:30;
→ US labor market data - Thursday at 15:30.
Important levels:
→ support from the median line of the uplink;
→ psychological mark of 145 yen per US dollar;
→ support for 141.75.
To benefit from the rise and fall of the Japanese yen against the US dollar, consider enlisting the services of a trusted broker like FXOpen.
⚠️
CFDs are complex instruments and come with a high risk of losing your money.
This article represents the opinion of the Companies operating under the FXOpen brand only. It is not to be construed as an offer, solicitation, or recommendation with respect to products and services provided by the Companies operating under the FXOpen brand, nor is it to be considered financial advice.
#MarketNews #GBPUSD
Market Analysis: GBP/USD Turns Red While USD/CAD Climbs Higher
🔸The British Pound started a fresh decline from the 1.2800 resistance zone.
🔸There is a key bearish trend line forming with resistance near 1.2700 on the hourly chart of GBP/USD at FXOpen.
🔸USD/CAD is rising steadily from the 1.3400 support zone.
🔸There is a major bullish trend line forming with support near 1.3450 on the hourly chart at FXOpen.
https://cutt.ly/9wgdiHPr
To take advantage of price fluctuations in the foreign exchange markets, consider enlisting the services of a reliable broker like FXOpen.
⚠️
This forecast represents FXOpen Companies opinion only, it should not be construed as an offer, invitation or recommendation in respect to FXOpen Companies products and services or as financial advice
Market Analysis: GBP/USD Turns Red While USD/CAD Climbs Higher
🔸The British Pound started a fresh decline from the 1.2800 resistance zone.
🔸There is a key bearish trend line forming with resistance near 1.2700 on the hourly chart of GBP/USD at FXOpen.
🔸USD/CAD is rising steadily from the 1.3400 support zone.
🔸There is a major bullish trend line forming with support near 1.3450 on the hourly chart at FXOpen.
https://cutt.ly/9wgdiHPr
To take advantage of price fluctuations in the foreign exchange markets, consider enlisting the services of a reliable broker like FXOpen.
⚠️
This forecast represents FXOpen Companies opinion only, it should not be construed as an offer, invitation or recommendation in respect to FXOpen Companies products and services or as financial advice
Market Pulse
Market Analysis: GBP/USD Turns Red While USD/CAD Climbs Higher
GBP/USD is showing bearish signs below 1.2700. USD/CAD is rising and might gain pace above the 1.3500 resistance zone.
#MarketNews #gbpusd #gbp
GBP/USD Analysis: The Pound Trying to Grow on News from Labor Market
On Tuesday morning data from the UK market were published:
→ base wage rose at a record pace in the second quarter. It was 7.8% higher than a year earlier, representing the highest annual growth rate since 2001.
→ at the same time, the number of unemployed also increased. In July, 29k applications for unemployment benefits were submitted (expected - 19.2).
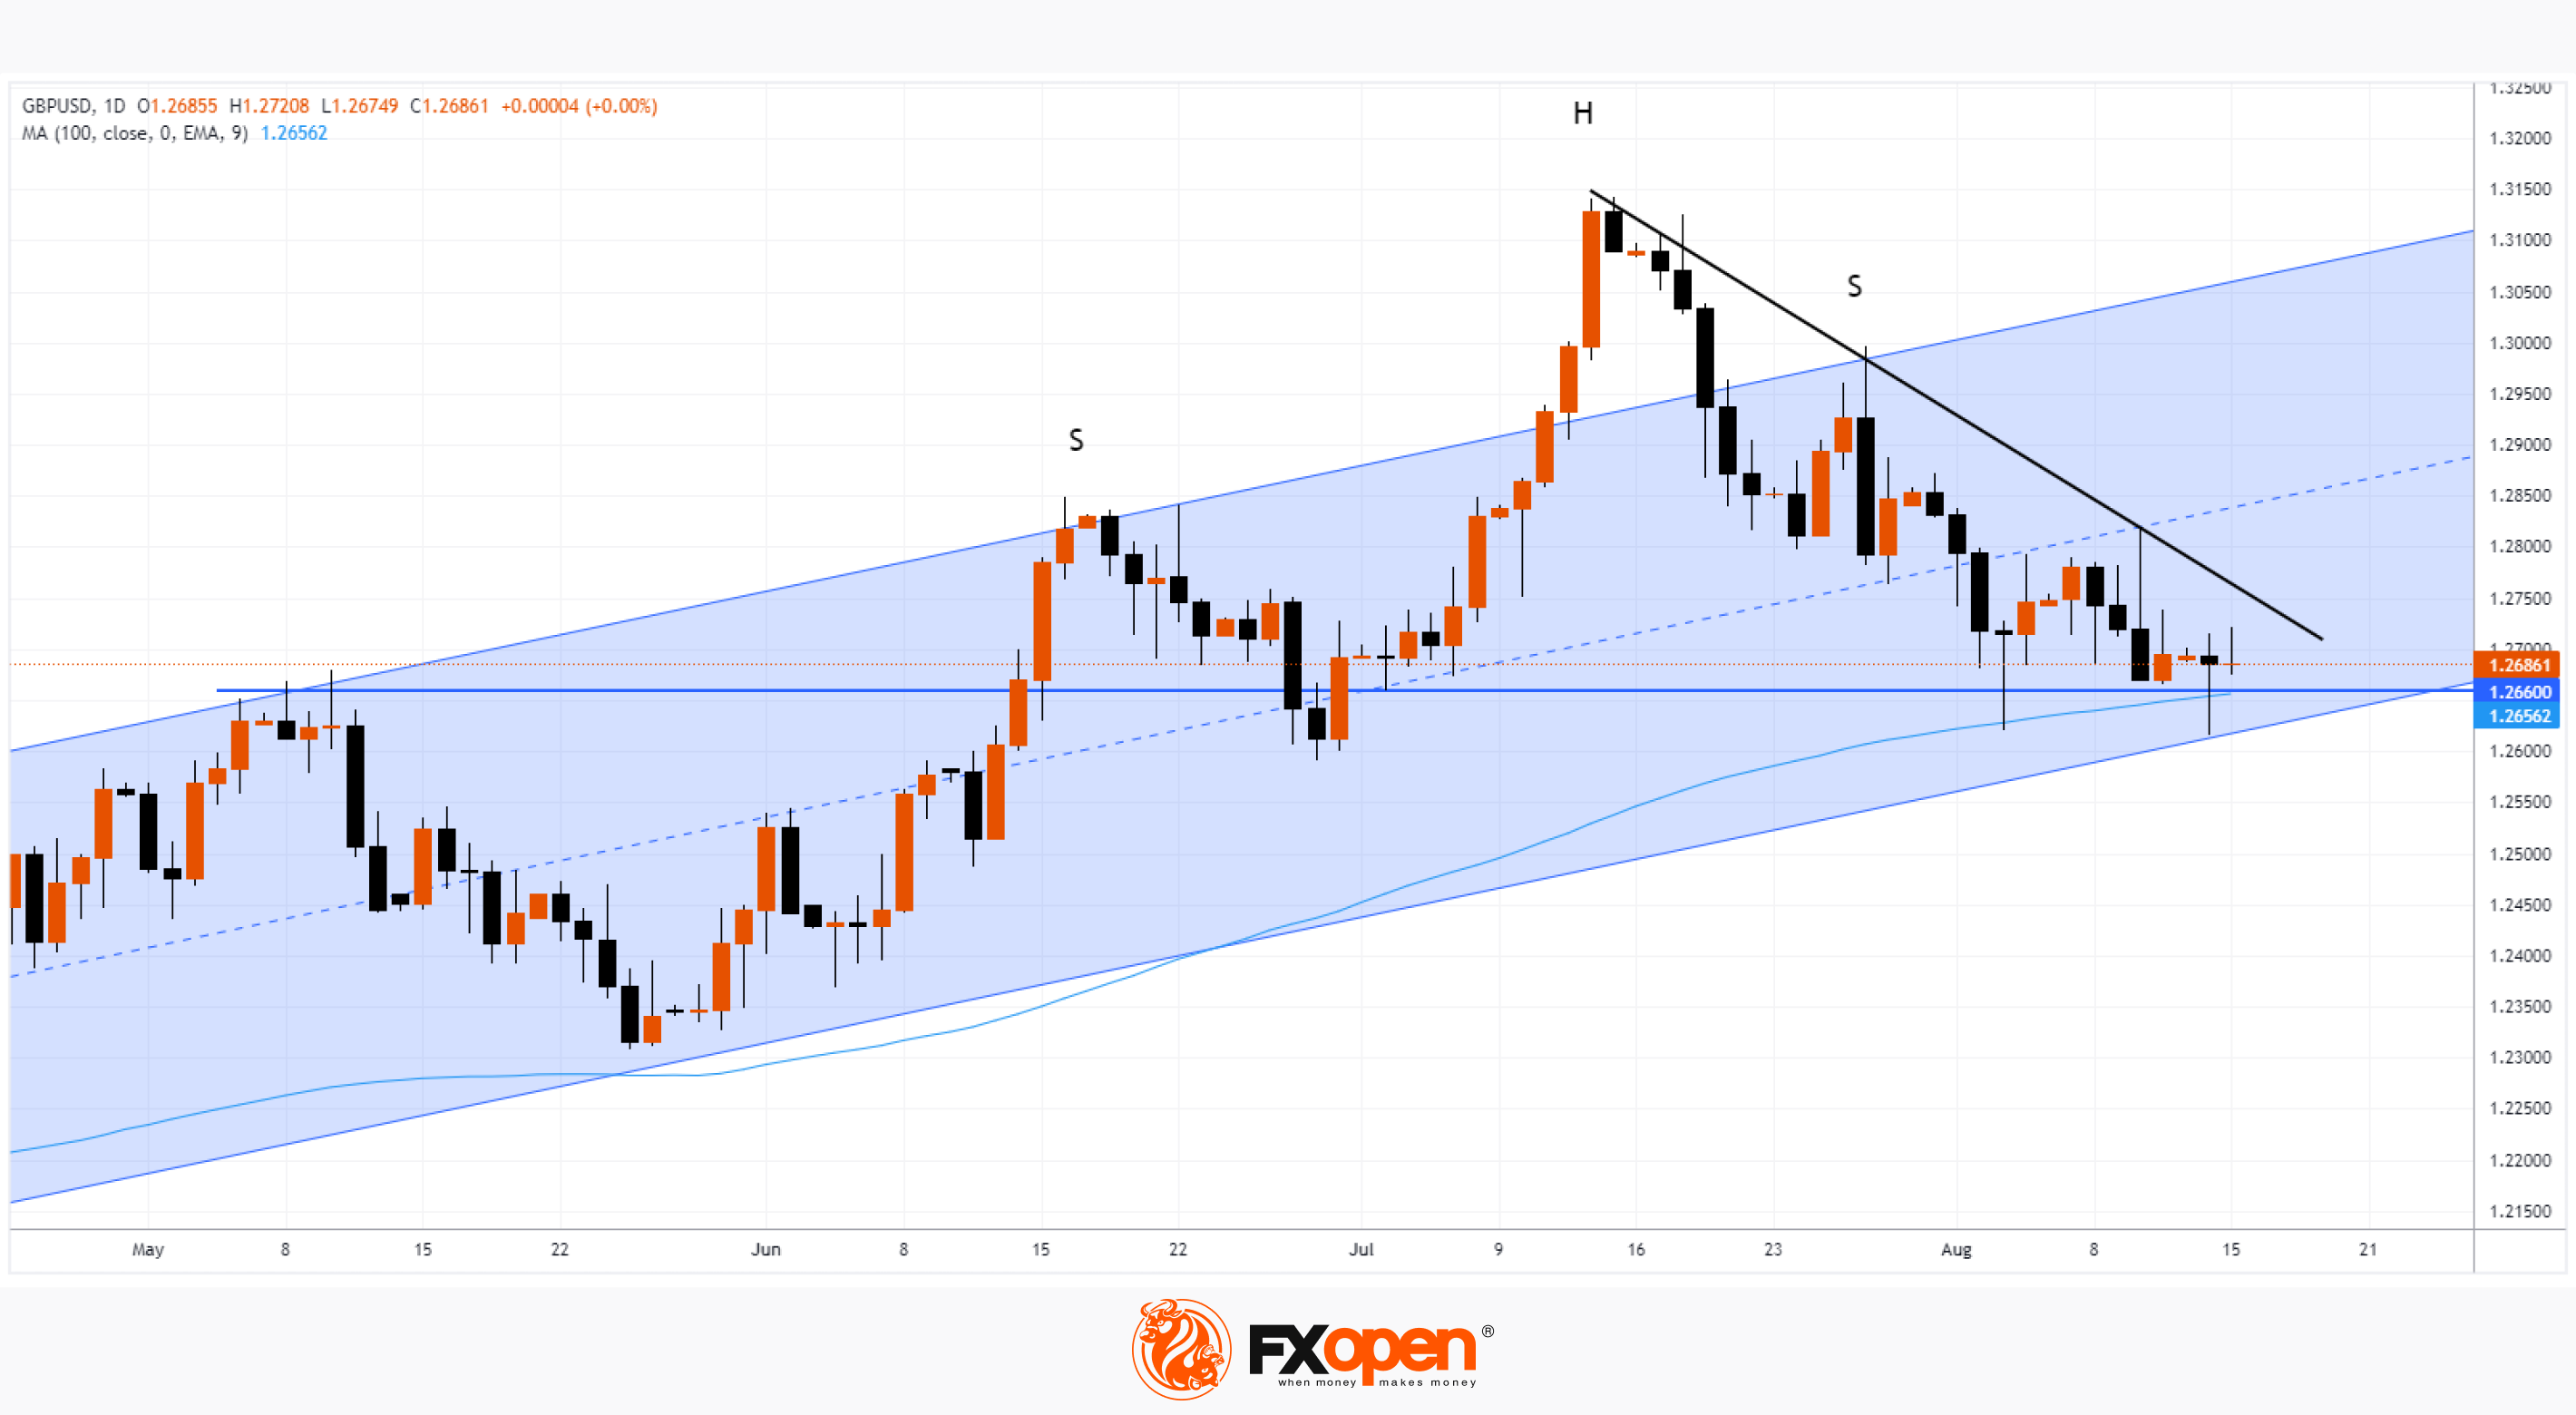
The first reaction of the pound is growth. It is possible that market participants have increased fears that wage growth will give the Bank of England more grounds for a sharper increase in interest rates. At the same time, the bullish momentum faded quickly, in line with the bearish momentum that has dominated the GBP/USD market since mid-July (as shown by the black line) amid the formation of the SHS pattern.
However, the situation may change.
As the daily chart shows, the GBP/USD rate dropped to the border of the ascending channel, which is valid in 2023, and seems to have found support there — as a candle with a long lower shadow was formed yesterday. Buyers quickly snapped up the fall, showing strength of demand around the 1.266 support line, which is also being strengthened by the 100-day moving average.
The probability of a rate hike in September by the Bank of England by 0.25 points is 99%, according to Reuters. And the closer the decision is, the stronger the demand can become, which can lead to a bullish reversal from the block of supports and a breakdown of the black line.
To benefit from the ups and downs in the currency market, consider enlisting the services of a trusted broker like FXOpen.
⚠️
CFDs are complex instruments and come with a high risk of losing your money.
This article represents the opinion of the Companies operating under the FXOpen brand only. It is not to be construed as an offer, solicitation, or recommendation with respect to products and services provided by the Companies operating under the FXOpen brand, nor is it to be considered financial advice.
GBP/USD Analysis: The Pound Trying to Grow on News from Labor Market
On Tuesday morning data from the UK market were published:
→ base wage rose at a record pace in the second quarter. It was 7.8% higher than a year earlier, representing the highest annual growth rate since 2001.
→ at the same time, the number of unemployed also increased. In July, 29k applications for unemployment benefits were submitted (expected - 19.2).
The first reaction of the pound is growth. It is possible that market participants have increased fears that wage growth will give the Bank of England more grounds for a sharper increase in interest rates. At the same time, the bullish momentum faded quickly, in line with the bearish momentum that has dominated the GBP/USD market since mid-July (as shown by the black line) amid the formation of the SHS pattern.
However, the situation may change.
As the daily chart shows, the GBP/USD rate dropped to the border of the ascending channel, which is valid in 2023, and seems to have found support there — as a candle with a long lower shadow was formed yesterday. Buyers quickly snapped up the fall, showing strength of demand around the 1.266 support line, which is also being strengthened by the 100-day moving average.
The probability of a rate hike in September by the Bank of England by 0.25 points is 99%, according to Reuters. And the closer the decision is, the stronger the demand can become, which can lead to a bullish reversal from the block of supports and a breakdown of the black line.
To benefit from the ups and downs in the currency market, consider enlisting the services of a trusted broker like FXOpen.
⚠️
CFDs are complex instruments and come with a high risk of losing your money.
This article represents the opinion of the Companies operating under the FXOpen brand only. It is not to be construed as an offer, solicitation, or recommendation with respect to products and services provided by the Companies operating under the FXOpen brand, nor is it to be considered financial advice.
#MarketNews #stocks
NVDA Analysis: Reasons For Price Surge of More Than 9%
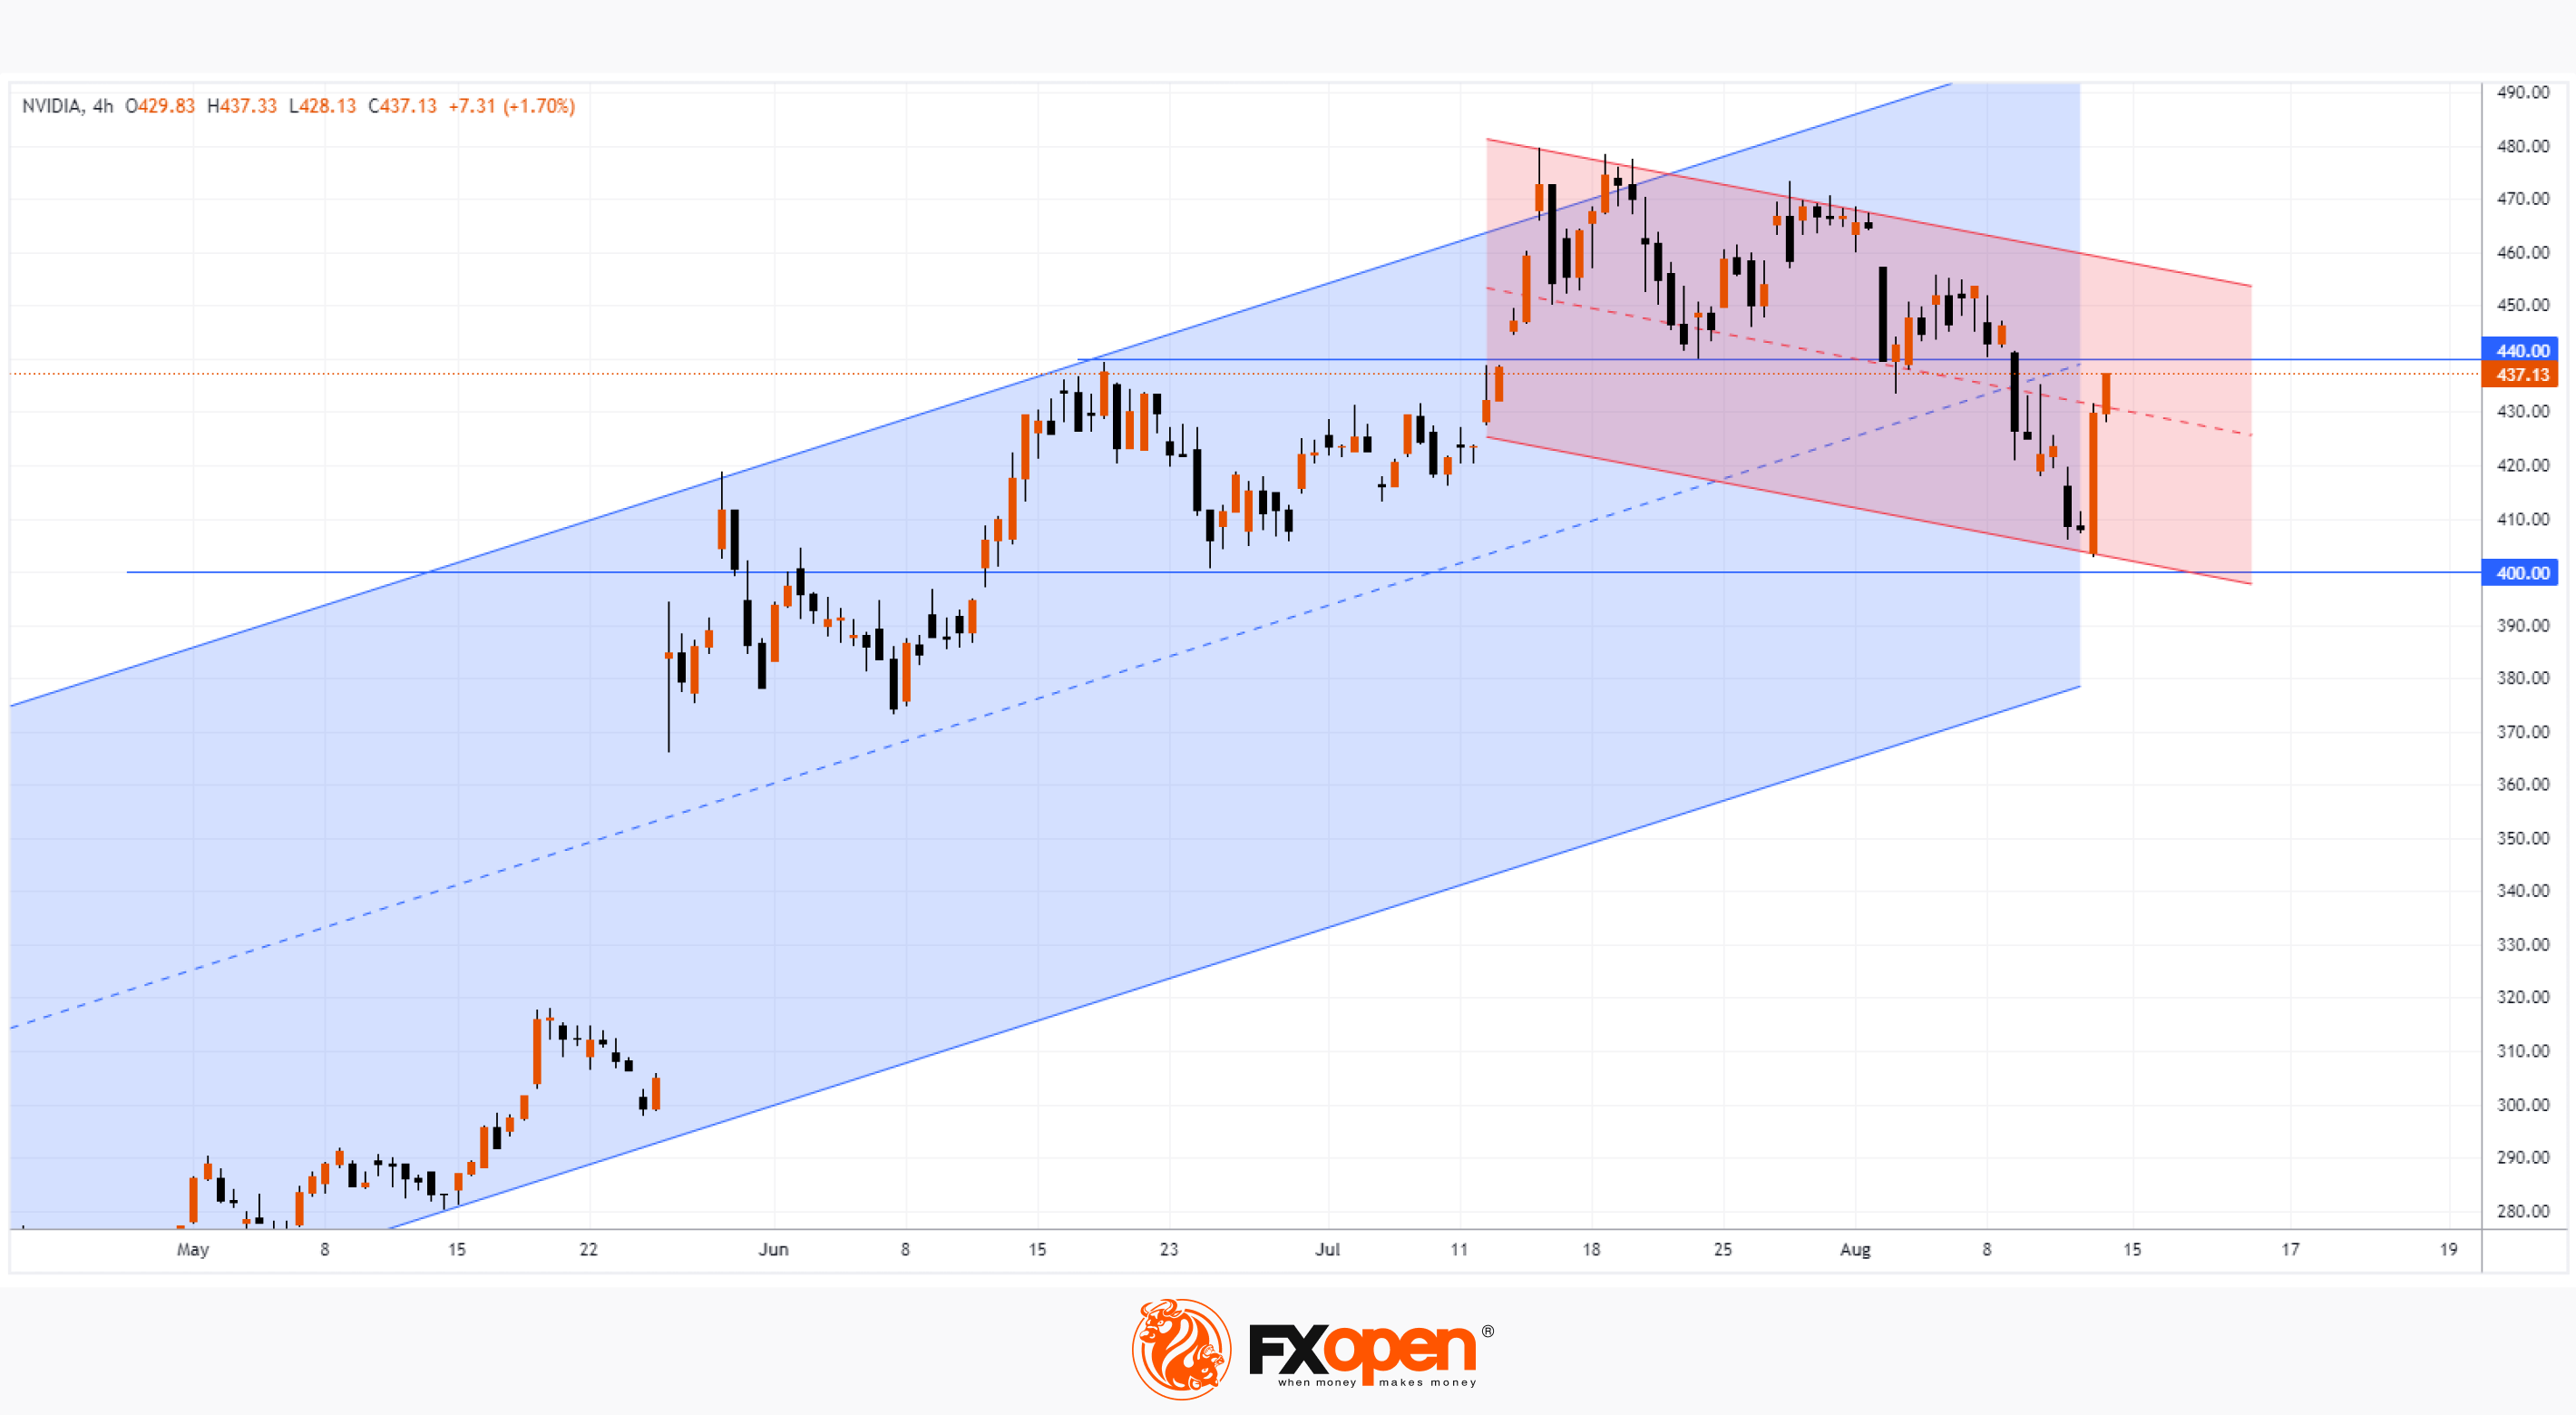
Shares of Nvidia are the main newsmakers of the stock market at the beginning of this week. As the chart shows, NVDA opened at USD 403.45 per share on Monday and is trading above USD 440 (over +9%) in premarket Tuesday.
The reasons for this are as follows:
→ analysts at Morgan Stanley confirmed their bullish outlook on the stock;
→ positive expectations from the company's report, which will be published on August 23.
Bullish arguments:
→ support from the psychological level of USD 400;
→ support from the lower line of the ascending channel, active in 2023;
→ a wide bullish candle could be the beginning of a new momentum after a pullback that began in mid-July.
Bearish arguments:
→ the price will have to overcome the upper limit of the descending channel (shown in red), which was formed during the mentioned rollback;
→ The USD 440/NVDA level looks like resistance, as it previously affected the price dynamics. The median line of the blue channel can increase the resistance.
But whatever the technical analysis of the NVDA stock chart, it is reasonable to assume that the August 23rd report will have a decisive impact on the price. It is possible that it can become a cold shower and wash away all the achievements of the bulls in the market, which is experiencing the hype associated with AI.
To benefit from trends in Nvidia and other popular companies’ stock markets, consider enlisting the services of a trusted broker like FXOpen.
At FXOpen UK and FXOpen AU, Cryptocurrency CFDs are only available for trading by those clients categorised as Professional clients under FCA Rules and Professional clients under ASIC Rules, respectively. They are not available for trading by Retail clients.
NVDA Analysis: Reasons For Price Surge of More Than 9%
Shares of Nvidia are the main newsmakers of the stock market at the beginning of this week. As the chart shows, NVDA opened at USD 403.45 per share on Monday and is trading above USD 440 (over +9%) in premarket Tuesday.
The reasons for this are as follows:
→ analysts at Morgan Stanley confirmed their bullish outlook on the stock;
→ positive expectations from the company's report, which will be published on August 23.
Bullish arguments:
→ support from the psychological level of USD 400;
→ support from the lower line of the ascending channel, active in 2023;
→ a wide bullish candle could be the beginning of a new momentum after a pullback that began in mid-July.
Bearish arguments:
→ the price will have to overcome the upper limit of the descending channel (shown in red), which was formed during the mentioned rollback;
→ The USD 440/NVDA level looks like resistance, as it previously affected the price dynamics. The median line of the blue channel can increase the resistance.
But whatever the technical analysis of the NVDA stock chart, it is reasonable to assume that the August 23rd report will have a decisive impact on the price. It is possible that it can become a cold shower and wash away all the achievements of the bulls in the market, which is experiencing the hype associated with AI.
To benefit from trends in Nvidia and other popular companies’ stock markets, consider enlisting the services of a trusted broker like FXOpen.
At FXOpen UK and FXOpen AU, Cryptocurrency CFDs are only available for trading by those clients categorised as Professional clients under FCA Rules and Professional clients under ASIC Rules, respectively. They are not available for trading by Retail clients.
👍1
#marketanalysis #sp500 #stockmarket
Market Analysis: E-mini S&P 500 Price Drops to Lowest in a Month
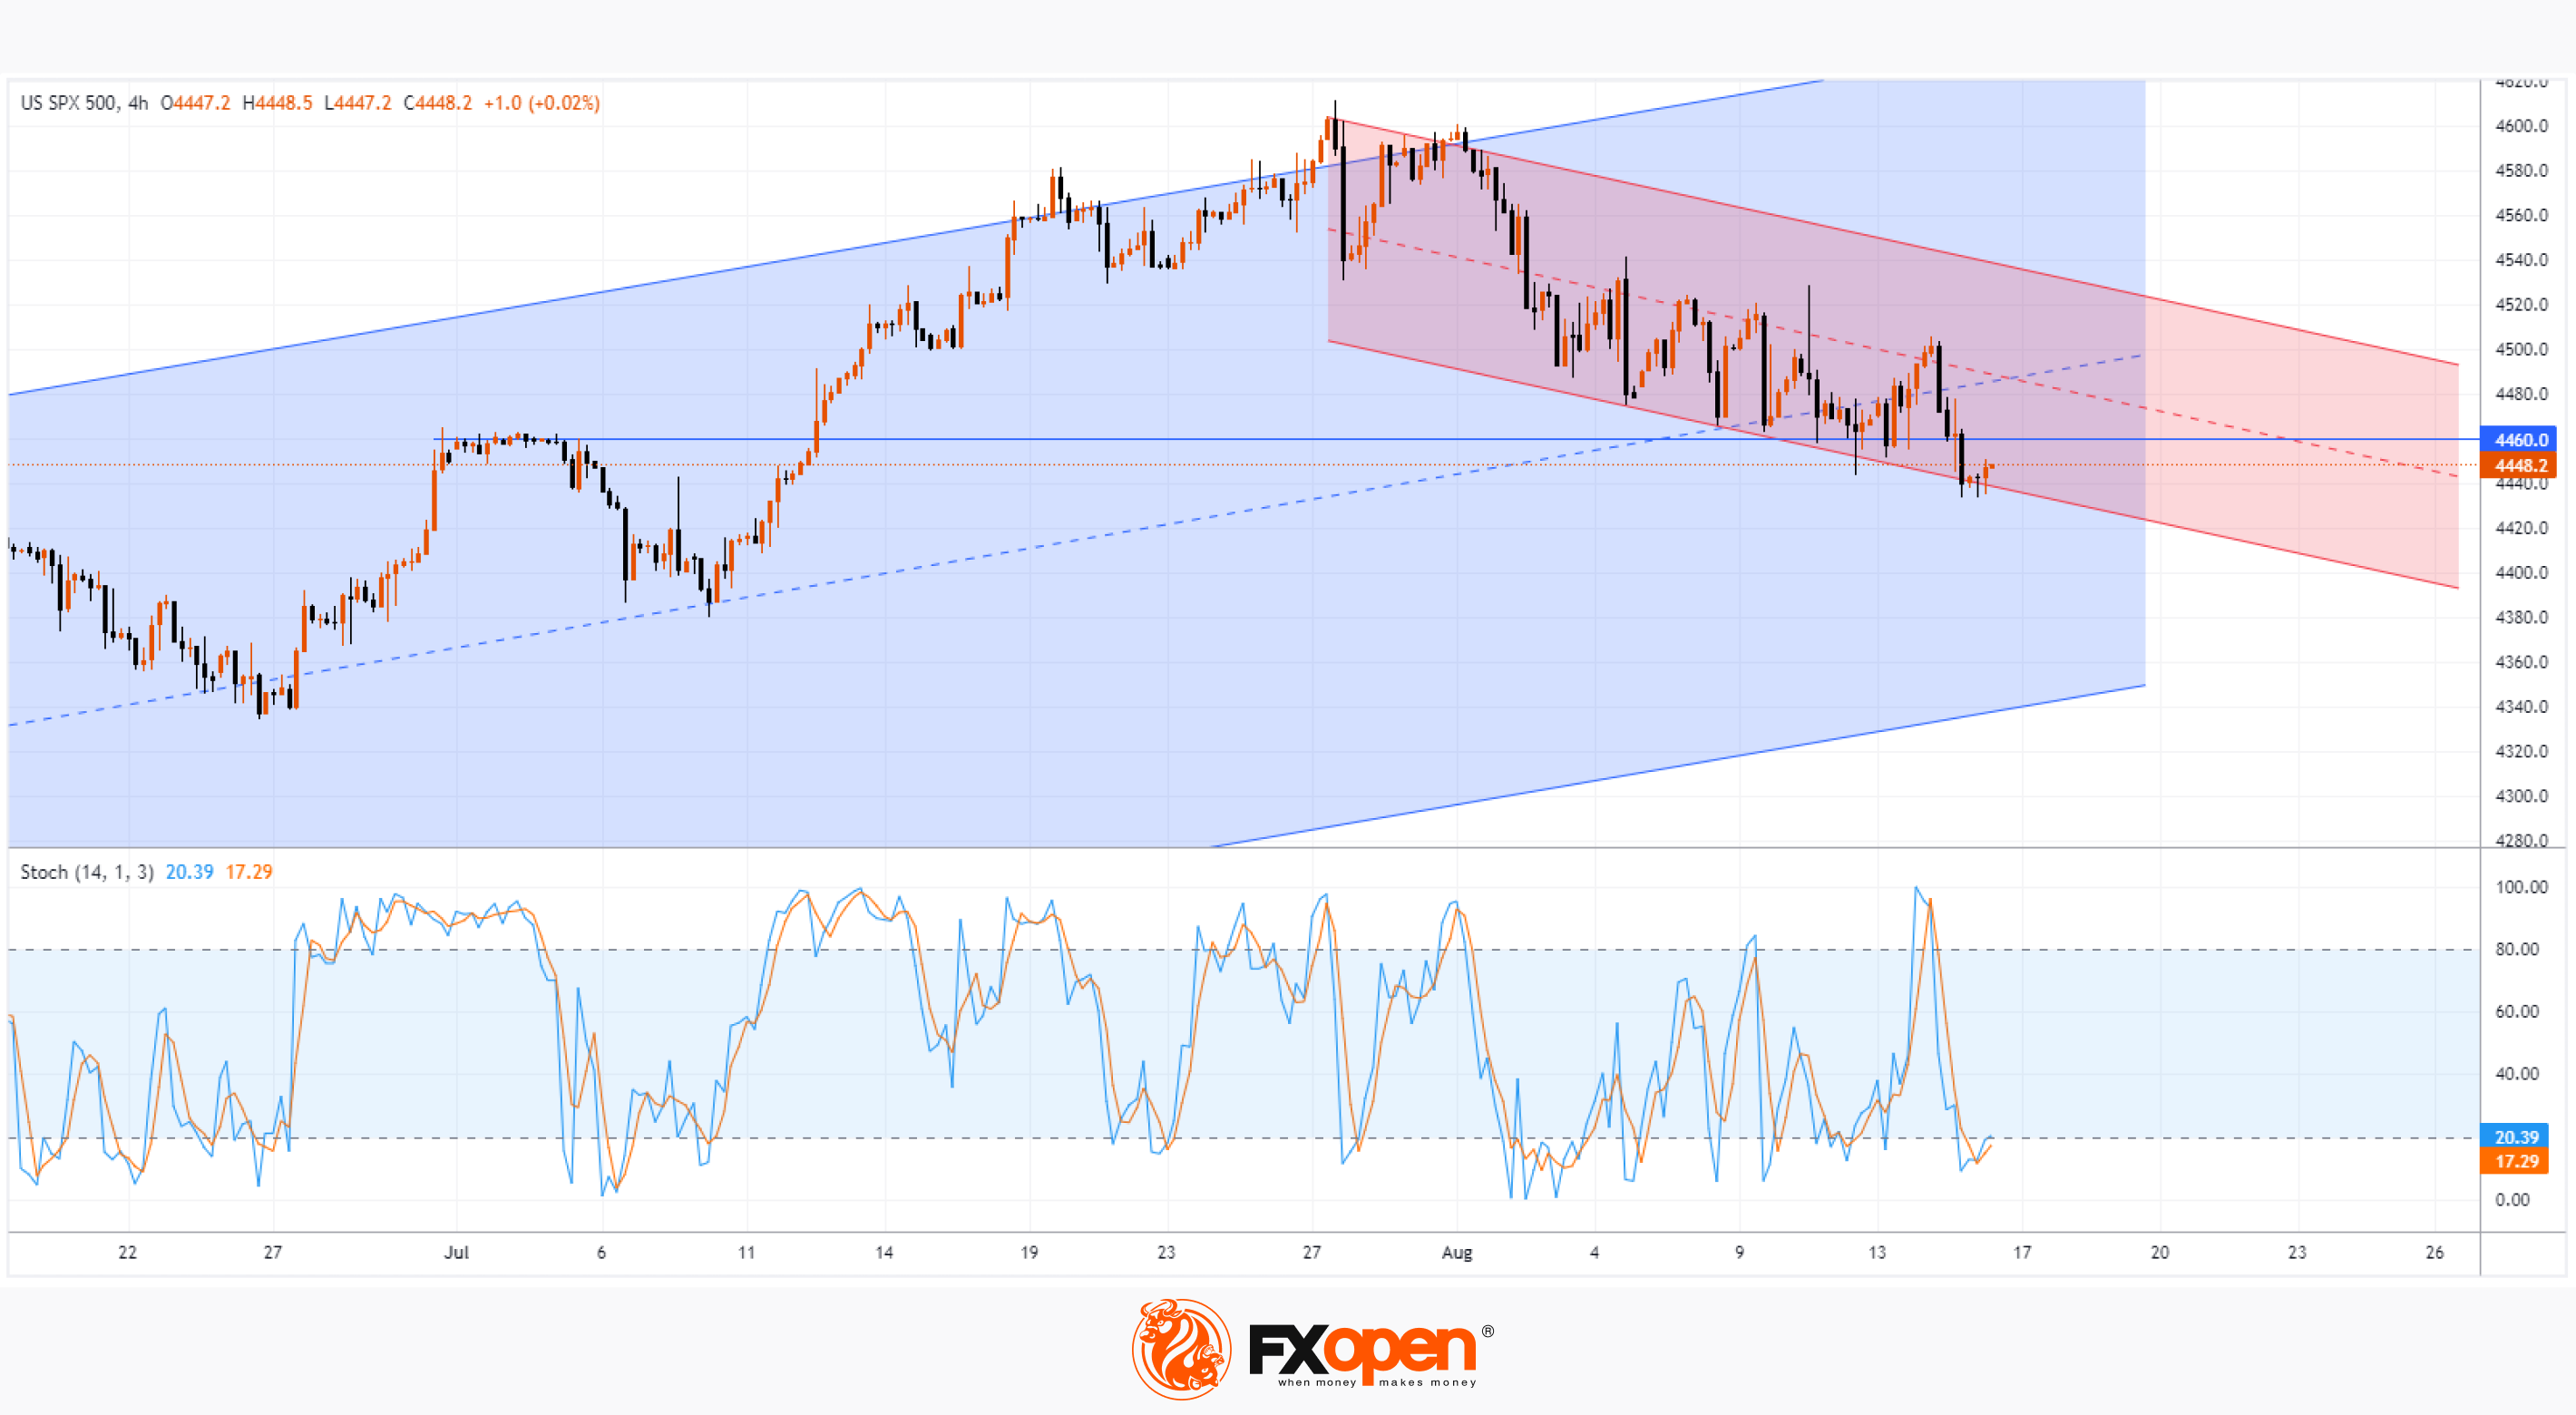
Yesterday, the S&P 500 fell below the 4,440 level — the last time the price of the S&P 500 was this much was on July 12.
The following contributed to the decline in the stock market:
→ strong US retail sales data (actual: +0.7%, expected +0.4%, last month: +0.2%). Market participants fear that interest rates may remain high for longer;
→ information that Fitch may downgrade further.
Thus, the decline amounted to more than 3.5% from the highs of the year recorded at the end of July. Will the decline continue? MarketWatch published the opinion of stock market strategist Hayes Martin: the correction could continue from 8% to 13%. However, the good news is that, according to the strategist, it will not break the current bull market.
Bullish arguments for the 4-hour chart:
→ the price is at the lower border of the descending channel (shown in red), which gives reason to expect a rebound;
→ many technical indicators (for example, stochastic) show oversold conditions;
→ this morning the E-mini S&P 500 did not develop a fall — perhaps yesterday's fears were emotional.
Bearish arguments:
→ the level 4,460 can serve as resistance;
→ the median and upper line of the red channel can also provide resistance.
An important factor that will affect the price of the E-mini S&P 500 will be information from the FOMC (to be published today at 21:00 GMT+3). Bloomberg writes that the topic of discussion at the Fed is changing from "how high should the rate be" to "how long will it be held at a high level." Get ready for spikes in volatility tonight.
To benefit from the ups and downs of the S&P 500, consider enlisting the services of a trusted broker like FXOpen.
CFDs are complex instruments and come with a high risk of losing your money.
This article represents the opinion of the Companies operating under the FXOpen brand only. It is not to be construed as an offer, solicitation, or recommendation with respect to products and services provided by the Companies operating under the FXOpen brand, nor is it to be considered financial advice.
Market Analysis: E-mini S&P 500 Price Drops to Lowest in a Month
Yesterday, the S&P 500 fell below the 4,440 level — the last time the price of the S&P 500 was this much was on July 12.
The following contributed to the decline in the stock market:
→ strong US retail sales data (actual: +0.7%, expected +0.4%, last month: +0.2%). Market participants fear that interest rates may remain high for longer;
→ information that Fitch may downgrade further.
Thus, the decline amounted to more than 3.5% from the highs of the year recorded at the end of July. Will the decline continue? MarketWatch published the opinion of stock market strategist Hayes Martin: the correction could continue from 8% to 13%. However, the good news is that, according to the strategist, it will not break the current bull market.
Bullish arguments for the 4-hour chart:
→ the price is at the lower border of the descending channel (shown in red), which gives reason to expect a rebound;
→ many technical indicators (for example, stochastic) show oversold conditions;
→ this morning the E-mini S&P 500 did not develop a fall — perhaps yesterday's fears were emotional.
Bearish arguments:
→ the level 4,460 can serve as resistance;
→ the median and upper line of the red channel can also provide resistance.
An important factor that will affect the price of the E-mini S&P 500 will be information from the FOMC (to be published today at 21:00 GMT+3). Bloomberg writes that the topic of discussion at the Fed is changing from "how high should the rate be" to "how long will it be held at a high level." Get ready for spikes in volatility tonight.
To benefit from the ups and downs of the S&P 500, consider enlisting the services of a trusted broker like FXOpen.
CFDs are complex instruments and come with a high risk of losing your money.
This article represents the opinion of the Companies operating under the FXOpen brand only. It is not to be construed as an offer, solicitation, or recommendation with respect to products and services provided by the Companies operating under the FXOpen brand, nor is it to be considered financial advice.
#marketanalysis #trading #tradingtips #usdcad
USD/CAD Analysis: The Loonie Strengthens amid Rising Inflation
Yesterday, data from Statistics Canada was published, which testified to the stability of inflation in the country: the rise in prices for the month amounted to +0.6% (+0.3% was expected).
This increased the likelihood that the Bank of Canada will raise the rate yet again. Now it is at a maximum for 22 years and is 5.0%.
As a result, USD/CAD is declining today after a volatile Tuesday.
Bullish arguments:
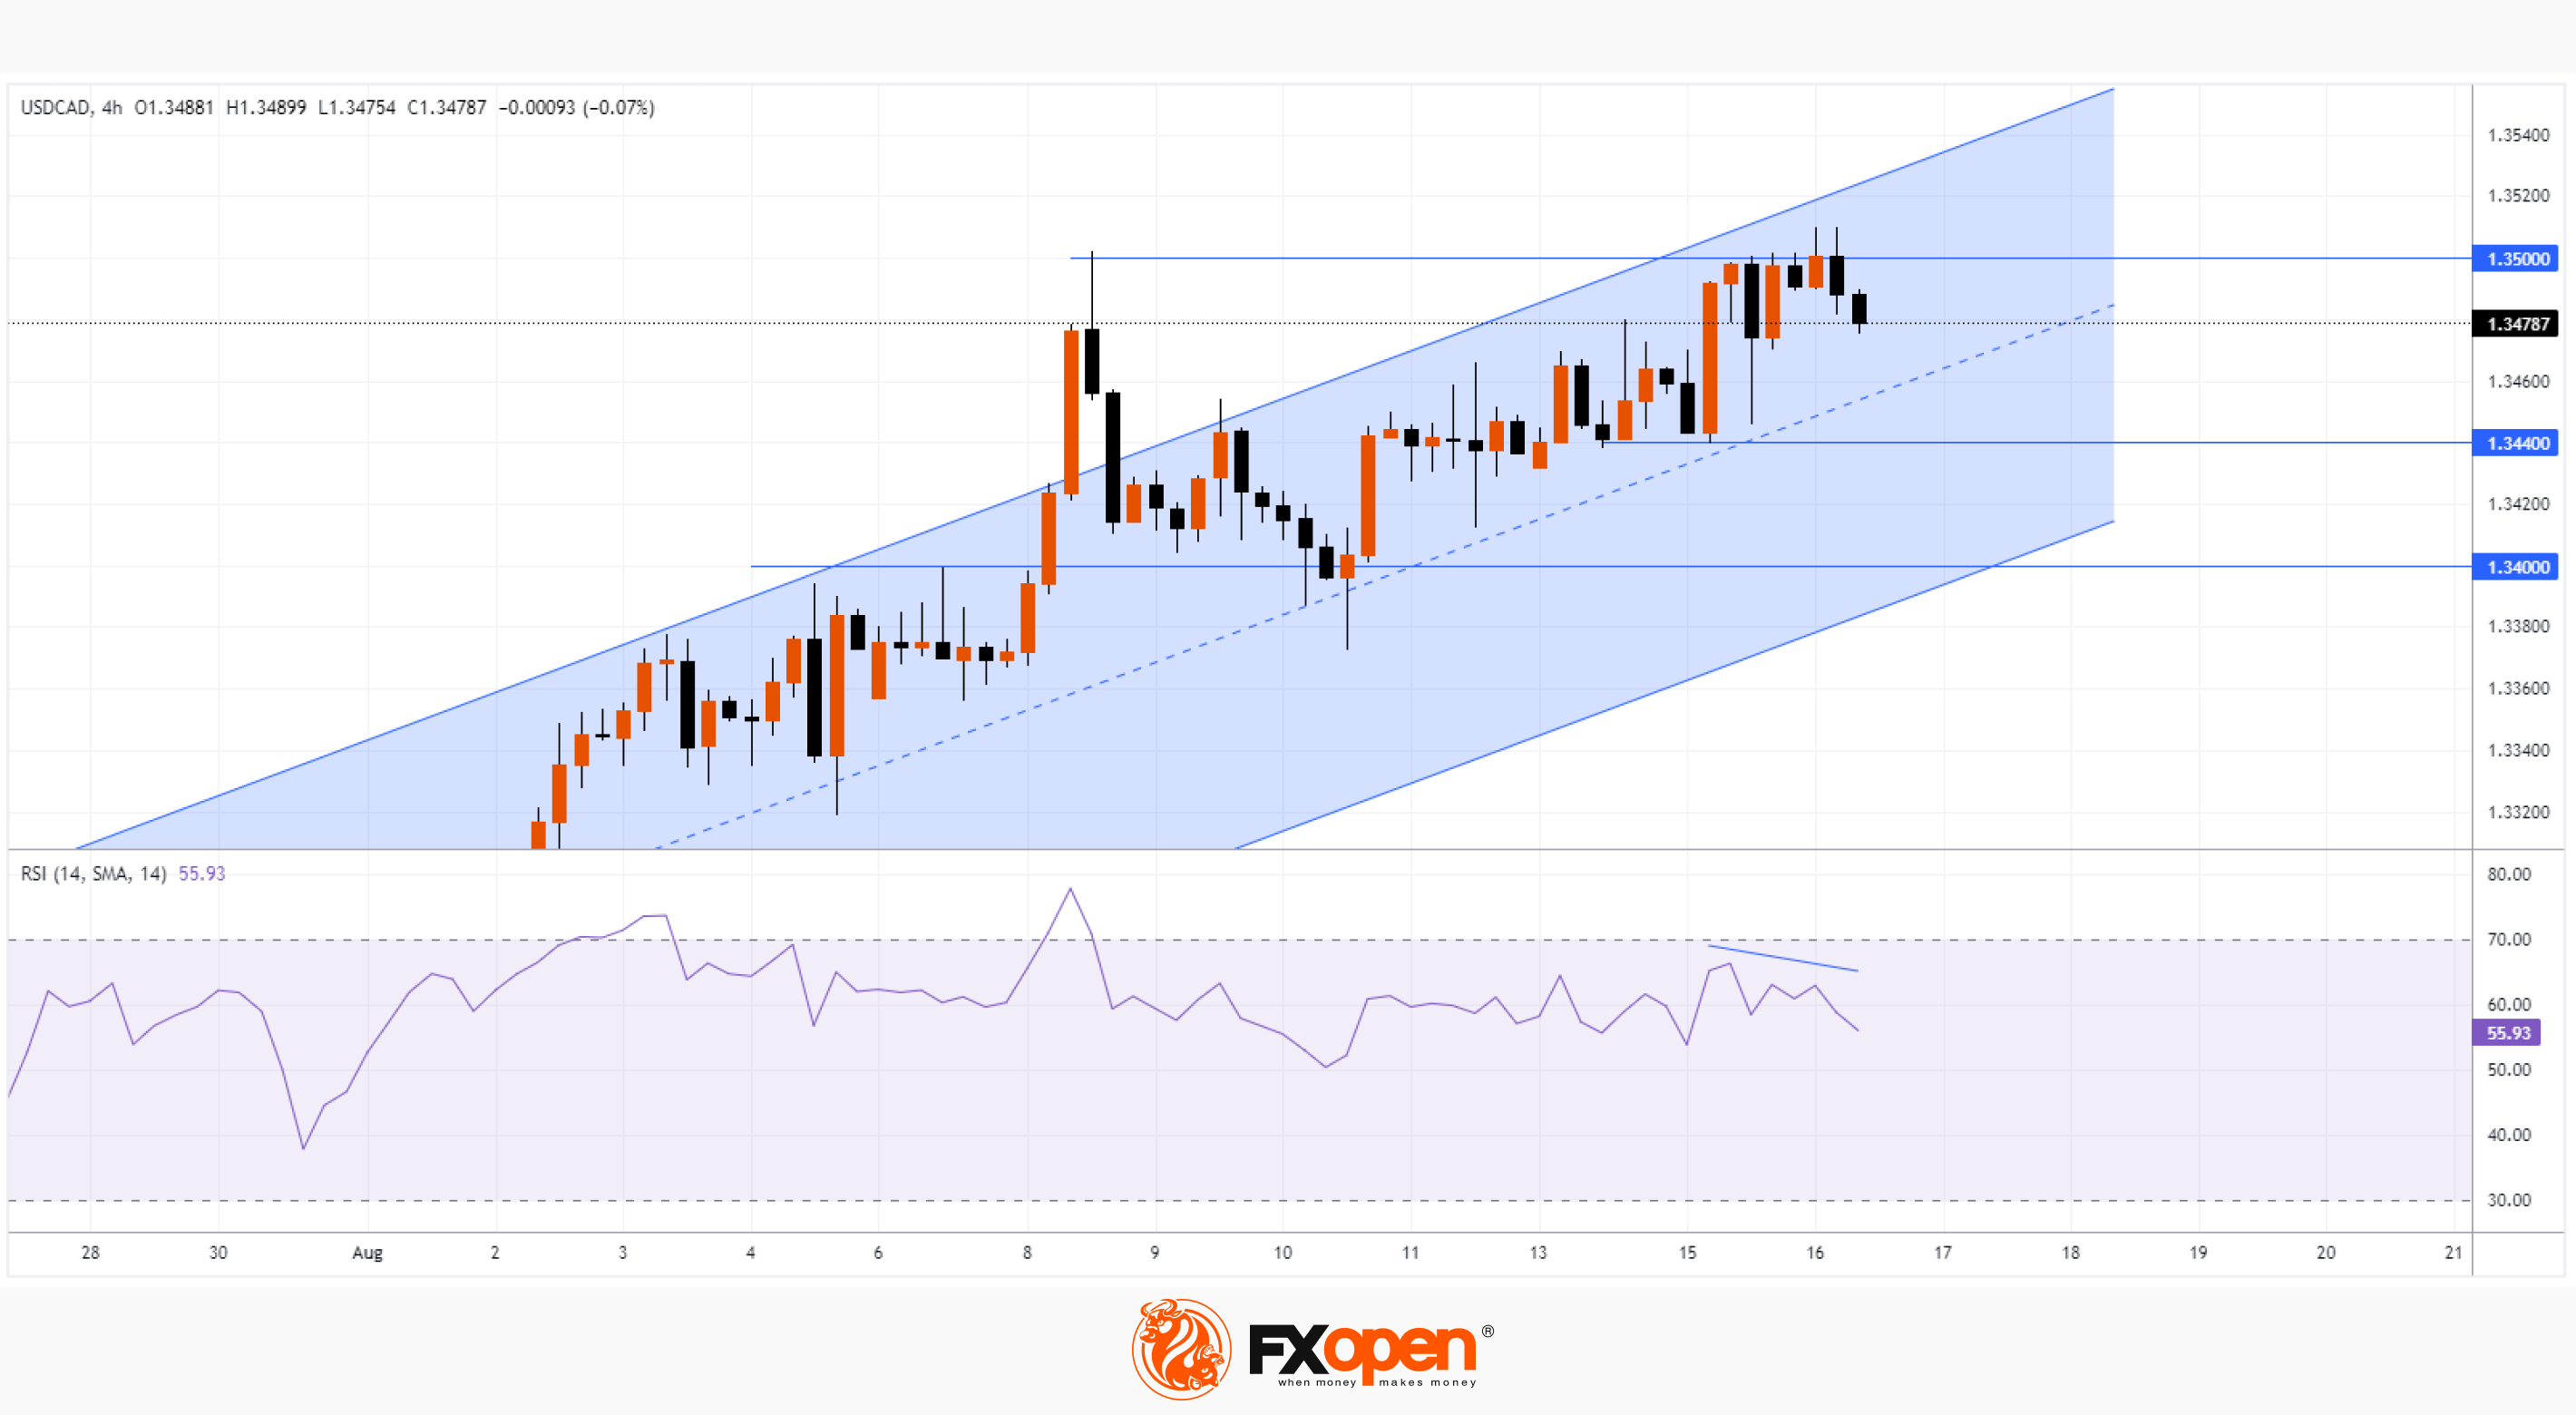
→ the price may be supported by the median line and the lower limit of the current ascending channel;
→ the price may be supported by the level of 1.34, which previously served as resistance;
→ support may continue to be provided by the level of 1.344.
Bearish arguments:
→ the price made a false breakout of the top on August 8;
→ resistance is provided by the psychological level at 1.35;
→ divergence on the RSI indicator;
→ the price is in the zone of a sharp fall in the rate recorded on June 1 — sellers can maintain control.
Since August 1, the USD/CAD rate has risen by more than 2.3%. In such conditions, a correction may be a fairly natural scenario.
To benefit from the rise and fall of currencies, consider enlisting the services of a trusted broker like FXOpen.
CFDs are complex instruments and come with a high risk of losing your money.
This article represents the opinion of the Companies operating under the FXOpen brand only. It is not to be construed as an offer, solicitation, or recommendation with respect to products and services provided by the Companies operating under the FXOpen brand, nor is it to be considered financial advice.
USD/CAD Analysis: The Loonie Strengthens amid Rising Inflation
Yesterday, data from Statistics Canada was published, which testified to the stability of inflation in the country: the rise in prices for the month amounted to +0.6% (+0.3% was expected).
This increased the likelihood that the Bank of Canada will raise the rate yet again. Now it is at a maximum for 22 years and is 5.0%.
As a result, USD/CAD is declining today after a volatile Tuesday.
Bullish arguments:
→ the price may be supported by the median line and the lower limit of the current ascending channel;
→ the price may be supported by the level of 1.34, which previously served as resistance;
→ support may continue to be provided by the level of 1.344.
Bearish arguments:
→ the price made a false breakout of the top on August 8;
→ resistance is provided by the psychological level at 1.35;
→ divergence on the RSI indicator;
→ the price is in the zone of a sharp fall in the rate recorded on June 1 — sellers can maintain control.
Since August 1, the USD/CAD rate has risen by more than 2.3%. In such conditions, a correction may be a fairly natural scenario.
To benefit from the rise and fall of currencies, consider enlisting the services of a trusted broker like FXOpen.
CFDs are complex instruments and come with a high risk of losing your money.
This article represents the opinion of the Companies operating under the FXOpen brand only. It is not to be construed as an offer, solicitation, or recommendation with respect to products and services provided by the Companies operating under the FXOpen brand, nor is it to be considered financial advice.
#marketanalysis #tradingupdate #trading
Market Analysis: EUR/USD Extends Losses While USD/CHF Eyes Upside Break
🔸 The Euro struggled to clear the 1.1040 resistance against the US Dollar.
🔸 There is a major bearish trend line forming with resistance near 1.0920 on the hourly chart of EUR/USD at FXOpen.
🔸 USD/CHF is gaining pace above the 0.8745 resistance zone.
🔸 There is a key bullish trend line forming with support near 0.8760 on the hourly chart at FXOpen.
Read the latest market analysis on our blog: https://cutt.ly/KwgHNvRL
To take advantage of price fluctuations in the foreign exchange markets, consider enlisting the services of a reliable broker like FXOpen.
⚠️
This forecast represents FXOpen Companies opinion only, it should not be construed as an offer, invitation or recommendation in respect to FXOpen Companies products and services or as financial advice
Market Analysis: EUR/USD Extends Losses While USD/CHF Eyes Upside Break
🔸 The Euro struggled to clear the 1.1040 resistance against the US Dollar.
🔸 There is a major bearish trend line forming with resistance near 1.0920 on the hourly chart of EUR/USD at FXOpen.
🔸 USD/CHF is gaining pace above the 0.8745 resistance zone.
🔸 There is a key bullish trend line forming with support near 0.8760 on the hourly chart at FXOpen.
Read the latest market analysis on our blog: https://cutt.ly/KwgHNvRL
To take advantage of price fluctuations in the foreign exchange markets, consider enlisting the services of a reliable broker like FXOpen.
⚠️
This forecast represents FXOpen Companies opinion only, it should not be construed as an offer, invitation or recommendation in respect to FXOpen Companies products and services or as financial advice
Market Pulse
Market Analysis: EUR/USD Extends Losses While USD/CHF Eyes Upside Break
EUR/USD started a fresh decline below the 1.0000 support. USD/CHF is rising and might aim a move toward the 0.8850 resistance.
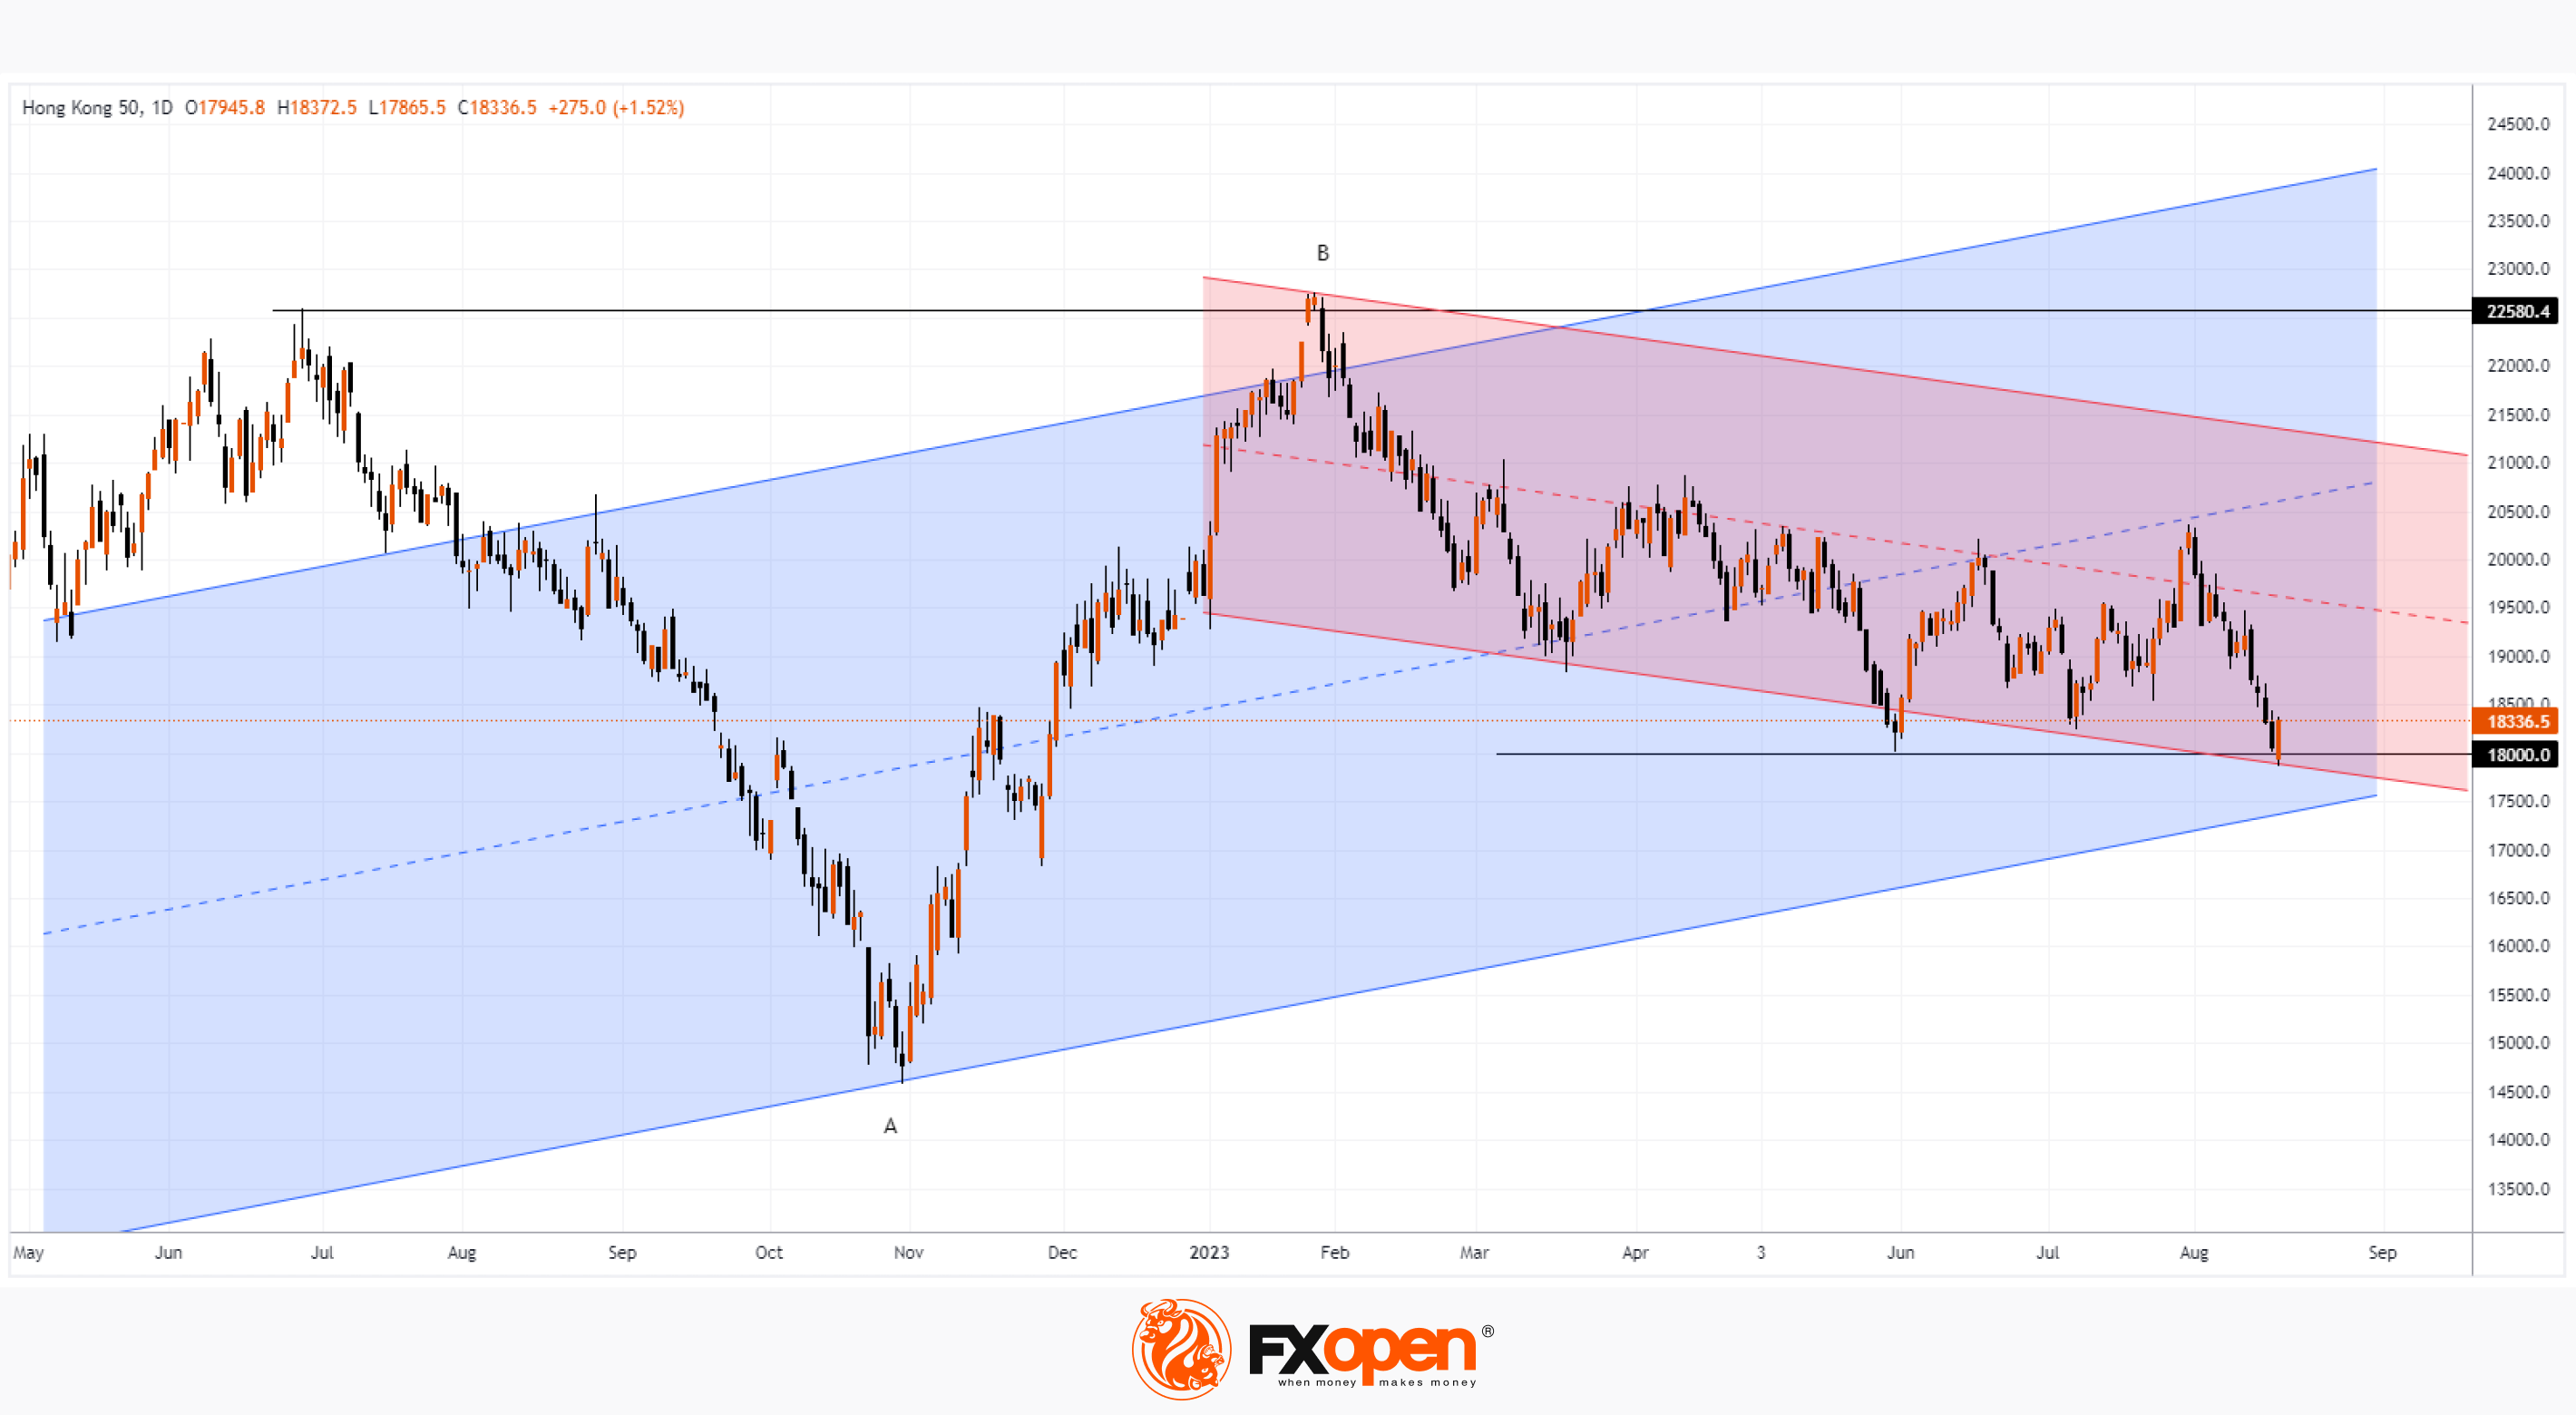
Hang Seng Index Analysis: Minimum of the Year, But Not Everything Is So Bad
Today, the price of the Hang Seng index fell below the level of 18,000 for the first time since November 2022. The media is publishing materials about the slowdown in the Chinese economy (which is confirmed by statistics) and the lack of expected government stimulus.
The FT writes that foreign investors have canceled purchases of Chinese shares worth USD 7.4 billion, which were made following a July 24 pledge by the Chinese Communist Party Politburo to increase support for the economy. And according to data released by the Chinese currency regulator on Wednesday, the volume of bonds of foreign institutional investors fell by USD 5 billion in July.
However, not everything is so bad.
Bullish arguments:
→ The price of the Hang Seng index rose rapidly after breaking through the psychological level at 18,000.
→ Also, at the close of today's candlestick, a false bearish breakdown of the previous low of the year, recorded on the last day of May, may form. Pay attention to the false bullish breakdown at the end of January — perhaps a mirror image situation is happening.
→ The price is near the lower line of the ascending channel, shown in blue (which is not quite obvious yet).
→ The price is near the lower line of the descending channel shown in red.
→ The price is near the level of 50% of the increase in A→B.
If the price of the Hang Seng index rises from a block of listed supports, this will be another example of how market lows are accompanied by negative media.
To follow the price of the Hang Seng stock index live and benefit from its fluctuations, consider enlisting the services of a trusted broker like FXOpen.
CFDs are complex instruments and come with a high risk of losing your money.
This article represents the opinion of the Companies operating under the FXOpen brand only. It is not to be construed as an offer, solicitation, or recommendation with respect to products and services provided by the Companies operating under the FXOpen brand, nor is it to be considered financial advice.
Today, the price of the Hang Seng index fell below the level of 18,000 for the first time since November 2022. The media is publishing materials about the slowdown in the Chinese economy (which is confirmed by statistics) and the lack of expected government stimulus.
The FT writes that foreign investors have canceled purchases of Chinese shares worth USD 7.4 billion, which were made following a July 24 pledge by the Chinese Communist Party Politburo to increase support for the economy. And according to data released by the Chinese currency regulator on Wednesday, the volume of bonds of foreign institutional investors fell by USD 5 billion in July.
However, not everything is so bad.
Bullish arguments:
→ The price of the Hang Seng index rose rapidly after breaking through the psychological level at 18,000.
→ Also, at the close of today's candlestick, a false bearish breakdown of the previous low of the year, recorded on the last day of May, may form. Pay attention to the false bullish breakdown at the end of January — perhaps a mirror image situation is happening.
→ The price is near the lower line of the ascending channel, shown in blue (which is not quite obvious yet).
→ The price is near the lower line of the descending channel shown in red.
→ The price is near the level of 50% of the increase in A→B.
If the price of the Hang Seng index rises from a block of listed supports, this will be another example of how market lows are accompanied by negative media.
To follow the price of the Hang Seng stock index live and benefit from its fluctuations, consider enlisting the services of a trusted broker like FXOpen.
CFDs are complex instruments and come with a high risk of losing your money.
This article represents the opinion of the Companies operating under the FXOpen brand only. It is not to be construed as an offer, solicitation, or recommendation with respect to products and services provided by the Companies operating under the FXOpen brand, nor is it to be considered financial advice.