#ripple #XRPUSD #cryptonews
Market Analysis: XRP/USD Price Rolls Back to Important Support
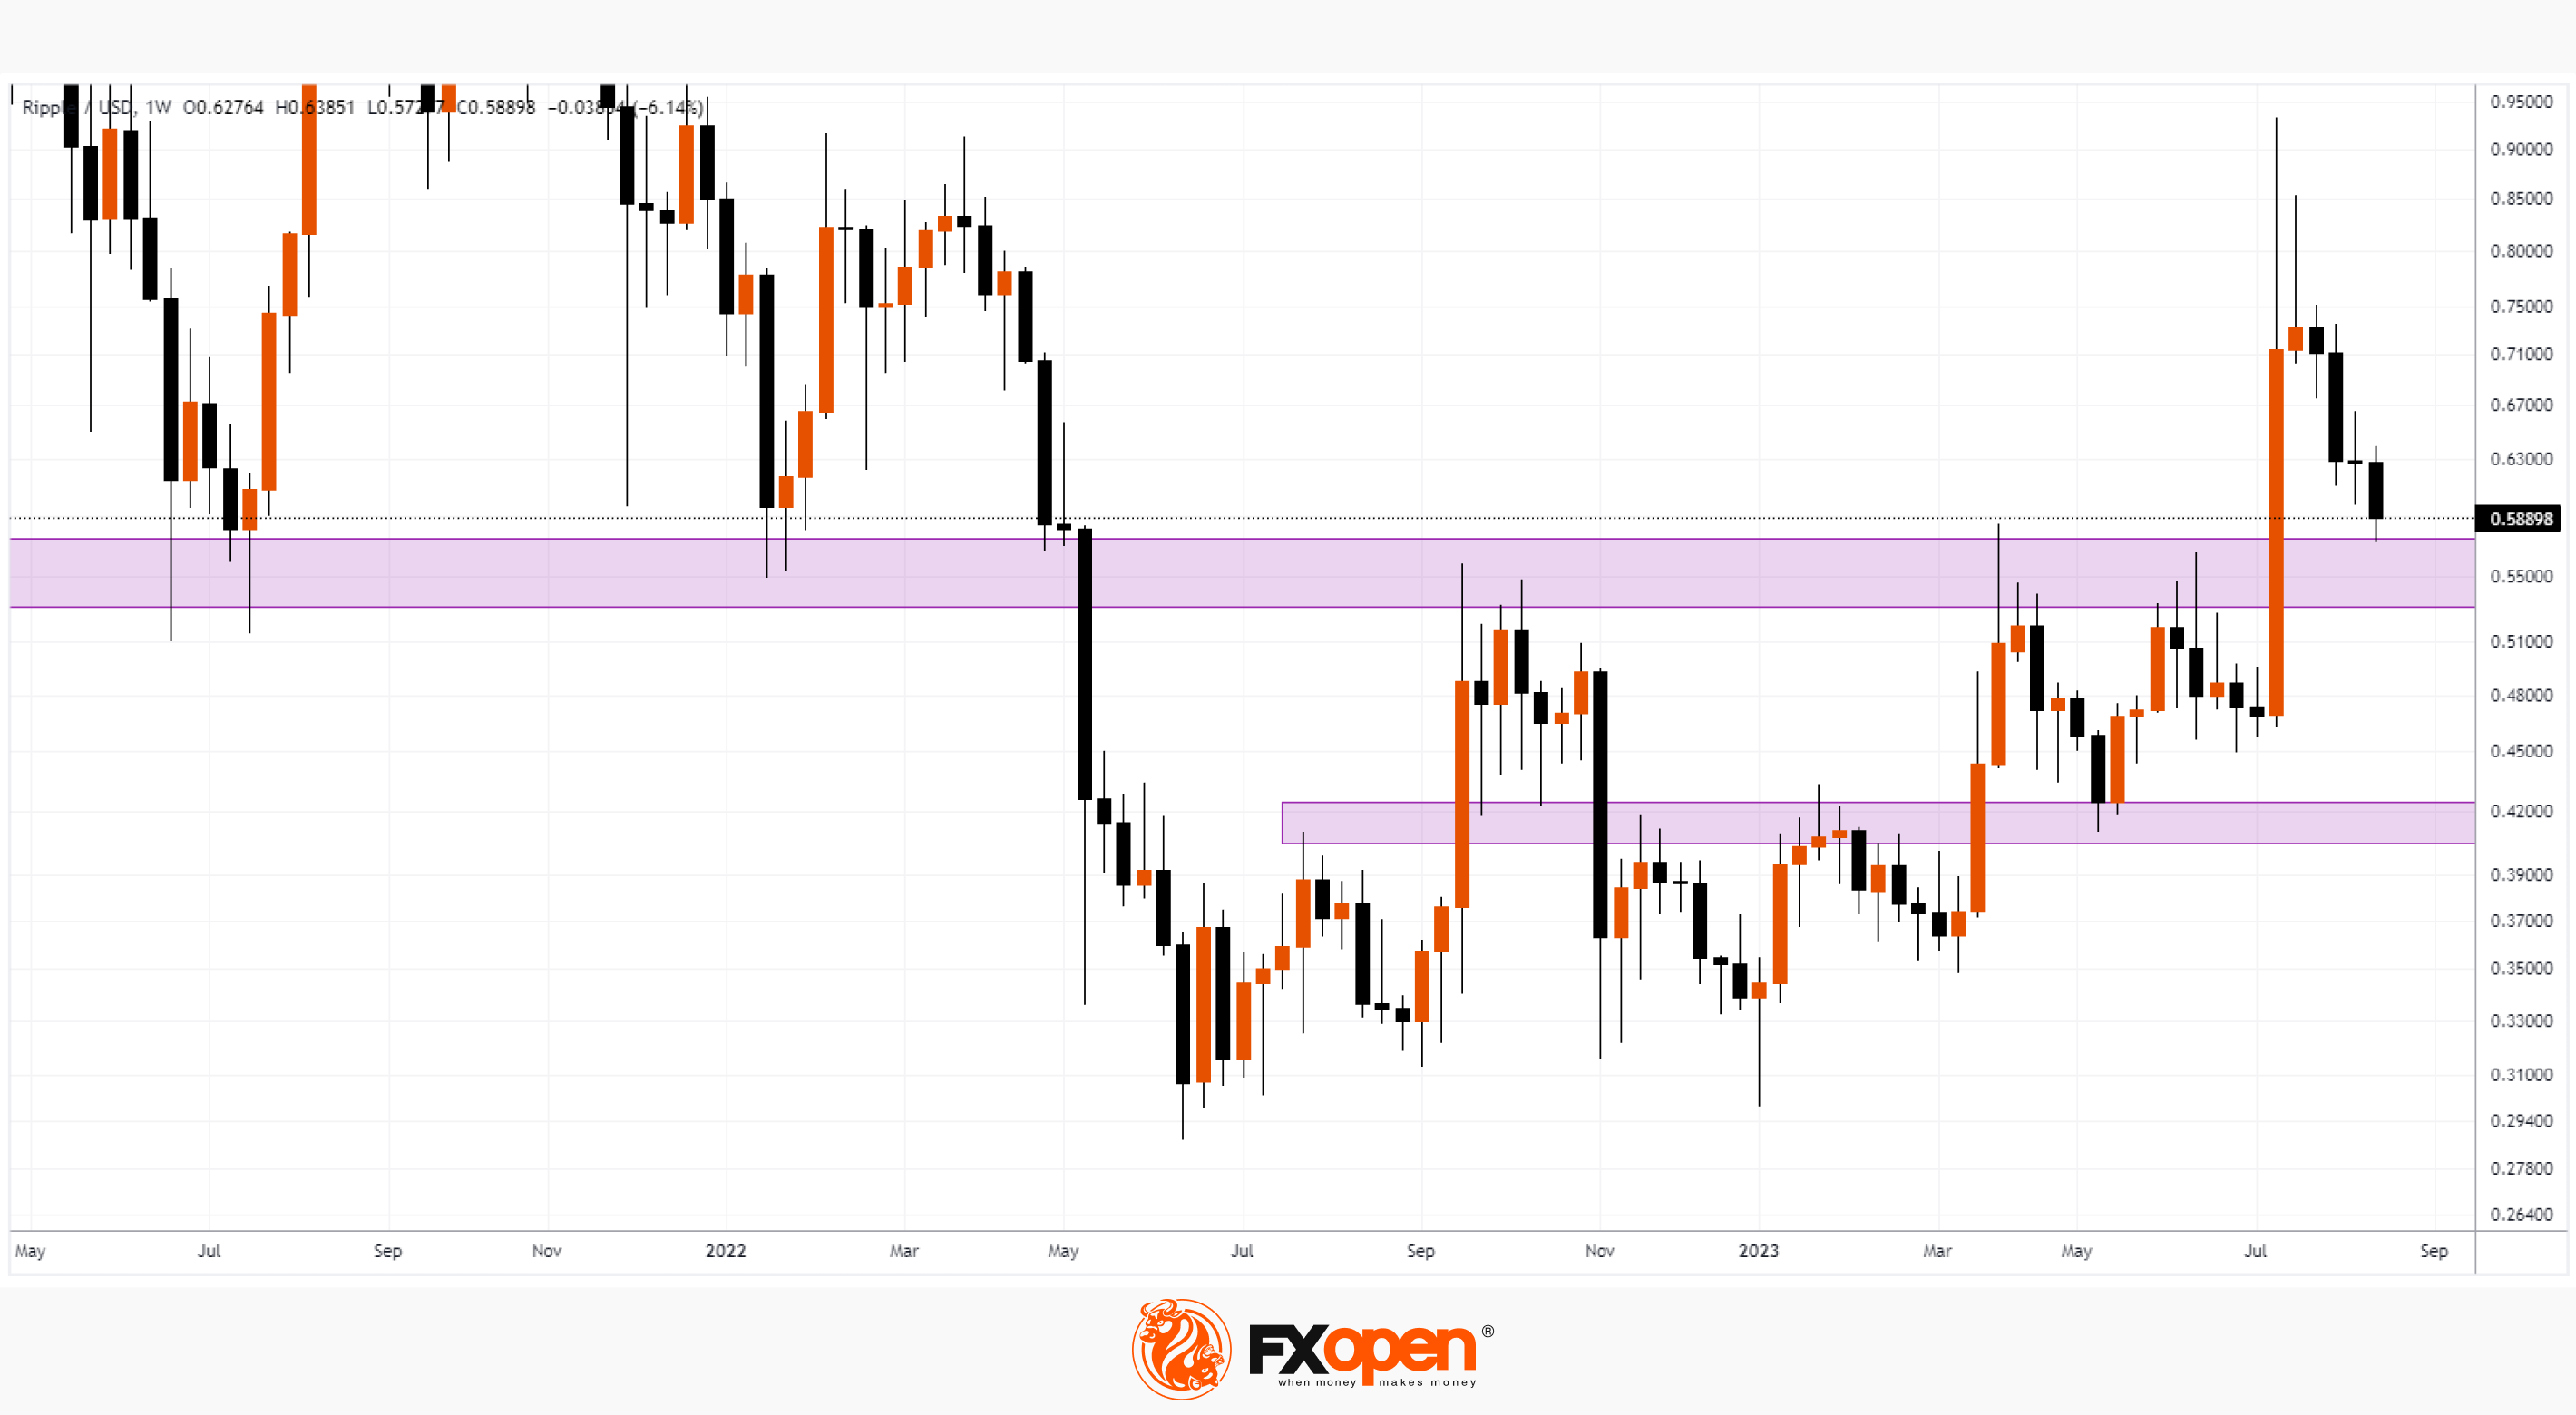
July was marked by the end of the trial between the SEC regulator and Ripple Labs in favor of the latter, which led to a sharp increase in the XRP token to a price above USD 0.9, but then a rollback followed after the first emotional reaction.
By the way, the trial is not completed yet. As it became known, the SEC intends to appeal the court's decision.
Bearish arguments:
→ The price of the XRP token may fall after the SEC formally files an appeal.
→ The price of the XRP token has rolled back by more than 2/3 from the July rapid growth — this is too deep a size for a normal correction.
Bullish arguments:
→ The price dropped to the important support zone 0.530 – 0.575, which repeatedly affected the price dynamics of the XRP token in 2021-2023.
→ Long lower shadows on the intraday XRP/USD charts may indicate that the support effect from this zone has already begun. Similar reversals can be observed, by the way, in a similar zone 0.404 – 0.424.
To check the live XRP/USD forex chart and benefit from the rise and fall of the price of the Ripple token, consider enlisting the services of a trusted broker like FXOpen.
CFDs are complex instruments and come with a high risk of losing your money.
This article represents the opinion of the Companies operating under the FXOpen brand only. It is not to be construed as an offer, solicitation, or recommendation with respect to products and services provided by the Companies operating under the FXOpen brand, nor is it to be considered financial advice.
Market Analysis: XRP/USD Price Rolls Back to Important Support
July was marked by the end of the trial between the SEC regulator and Ripple Labs in favor of the latter, which led to a sharp increase in the XRP token to a price above USD 0.9, but then a rollback followed after the first emotional reaction.
By the way, the trial is not completed yet. As it became known, the SEC intends to appeal the court's decision.
Bearish arguments:
→ The price of the XRP token may fall after the SEC formally files an appeal.
→ The price of the XRP token has rolled back by more than 2/3 from the July rapid growth — this is too deep a size for a normal correction.
Bullish arguments:
→ The price dropped to the important support zone 0.530 – 0.575, which repeatedly affected the price dynamics of the XRP token in 2021-2023.
→ Long lower shadows on the intraday XRP/USD charts may indicate that the support effect from this zone has already begun. Similar reversals can be observed, by the way, in a similar zone 0.404 – 0.424.
To check the live XRP/USD forex chart and benefit from the rise and fall of the price of the Ripple token, consider enlisting the services of a trusted broker like FXOpen.
CFDs are complex instruments and come with a high risk of losing your money.
This article represents the opinion of the Companies operating under the FXOpen brand only. It is not to be construed as an offer, solicitation, or recommendation with respect to products and services provided by the Companies operating under the FXOpen brand, nor is it to be considered financial advice.
#BTCUSD #bitcoin #cryptonews
BTC/USD price analysis: The Price of Bitcoin Collapses by about 8% in One Day
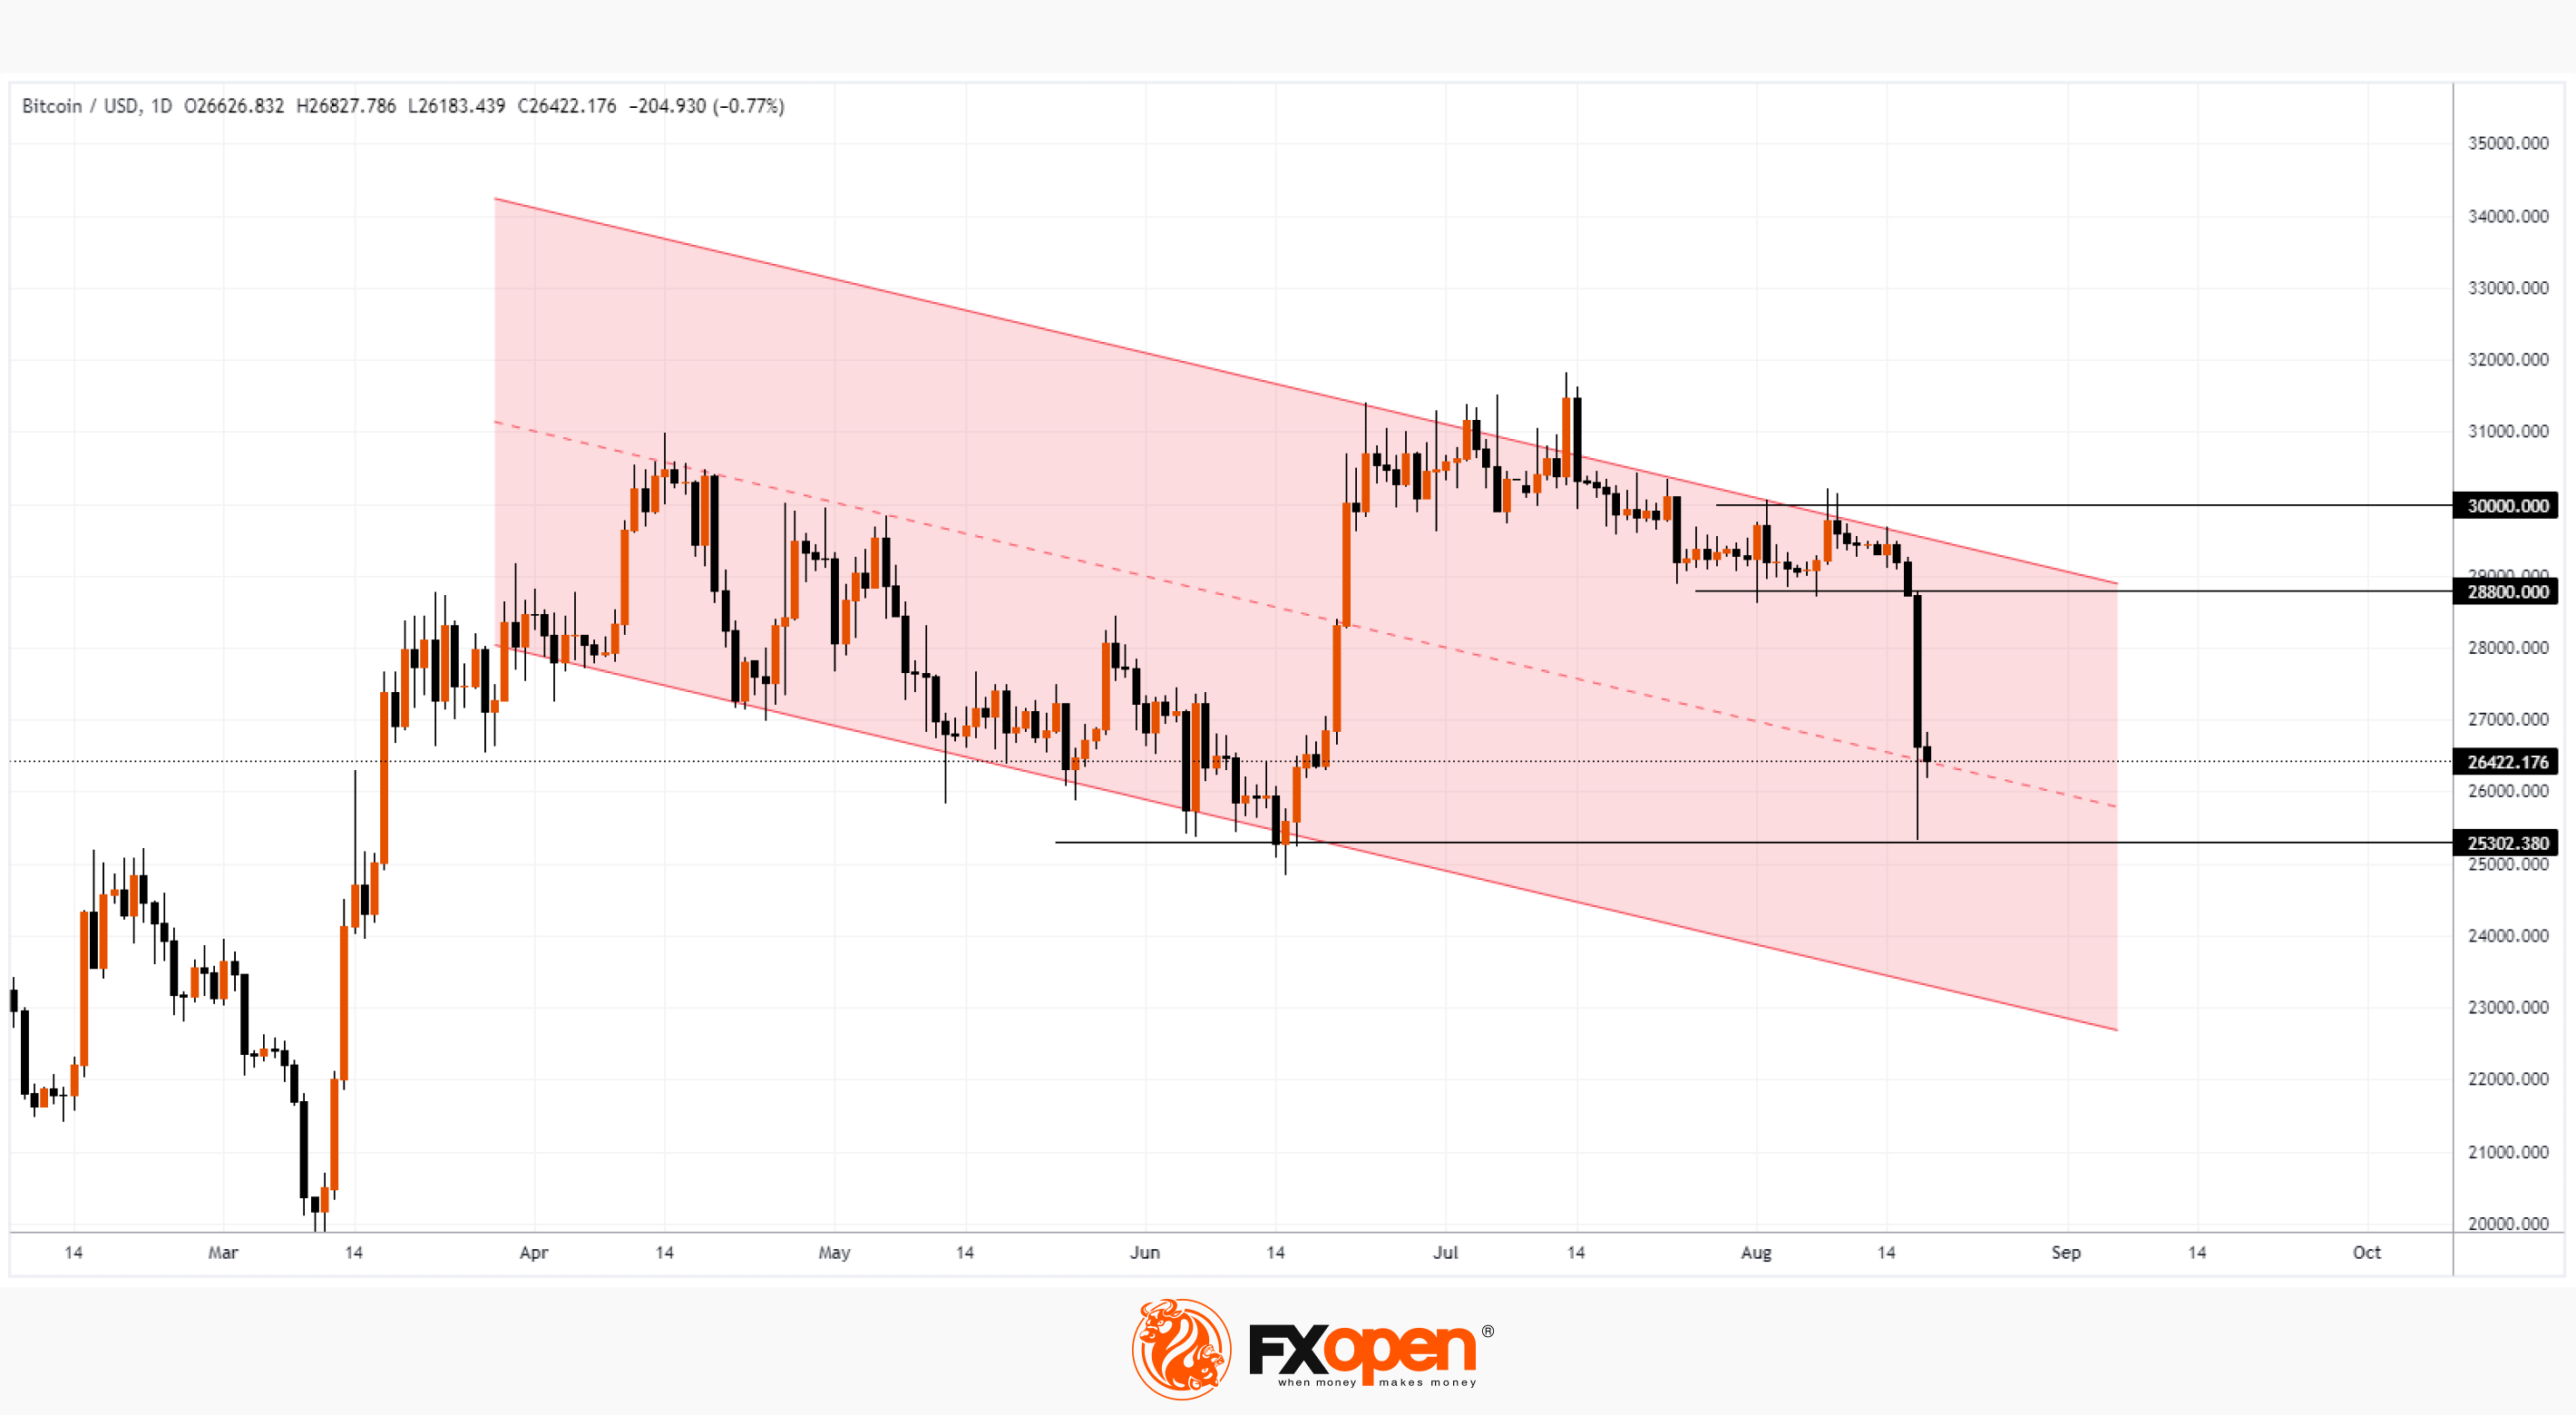
This morning the BTC/USD price is near 26,500, the lowest price since mid-June.
What is the reason for this? Among the drivers of the decline may be information that Elon Musk's SpaceX company intends to sell (or has already sold) USD 373 million worth of bitcoins. However, the collapse could have been influenced more by technical than by fundamental factors.
On August 8, we wrote that the ADX indicator fell to a minimum since the beginning of the year — that is, the market was in a protracted flat. It was a vulnerable position for the birth of a new impulse.
Note that the USD 30K psychological level acted as resistance in August — the price was not able to stay higher for long. It was logical to assume that the bears would try to take the initiative. And it happened this week — notice the widening bearish candles on August 15-16 as we approach the 28,800 support.
The decline triggered a cascade of stop-losses (more than USD 1 billion worth of positions on cryptocurrency exchanges were liquidated), which intensified the selling wave.
The chart shows that the price of BTC/USD today is near the median line of the descending channel, where the demand for cheaper bitcoins has balanced the supply. If the price continues to develop within this channel, we can see a new attempt to break through the psychological level of USD 25,000, which in mid-June led to a sharp increase in the price of bitcoins.
To benefit from trends in the cryptocurrency markets, consider enlisting the services of a trusted broker like FXOpen.
CFDs are complex instruments and come with a high risk of losing your money.
This article represents the opinion of the Companies operating under the FXOpen brand only. It is not to be construed as an offer, solicitation, or recommendation with respect to products and services provided by the Companies operating under the FXOpen brand, nor is it to be considered financial advice.
At FXOpen UK and FXOpen AU, Cryptocurrency CFDs are only available for trading by those clients categorised as Professional clients under FCA Rules and Professional clients under ASIC Rules, respectively. They are not available for trading by Retail clients.
BTC/USD price analysis: The Price of Bitcoin Collapses by about 8% in One Day
This morning the BTC/USD price is near 26,500, the lowest price since mid-June.
What is the reason for this? Among the drivers of the decline may be information that Elon Musk's SpaceX company intends to sell (or has already sold) USD 373 million worth of bitcoins. However, the collapse could have been influenced more by technical than by fundamental factors.
On August 8, we wrote that the ADX indicator fell to a minimum since the beginning of the year — that is, the market was in a protracted flat. It was a vulnerable position for the birth of a new impulse.
Note that the USD 30K psychological level acted as resistance in August — the price was not able to stay higher for long. It was logical to assume that the bears would try to take the initiative. And it happened this week — notice the widening bearish candles on August 15-16 as we approach the 28,800 support.
The decline triggered a cascade of stop-losses (more than USD 1 billion worth of positions on cryptocurrency exchanges were liquidated), which intensified the selling wave.
The chart shows that the price of BTC/USD today is near the median line of the descending channel, where the demand for cheaper bitcoins has balanced the supply. If the price continues to develop within this channel, we can see a new attempt to break through the psychological level of USD 25,000, which in mid-June led to a sharp increase in the price of bitcoins.
To benefit from trends in the cryptocurrency markets, consider enlisting the services of a trusted broker like FXOpen.
CFDs are complex instruments and come with a high risk of losing your money.
This article represents the opinion of the Companies operating under the FXOpen brand only. It is not to be construed as an offer, solicitation, or recommendation with respect to products and services provided by the Companies operating under the FXOpen brand, nor is it to be considered financial advice.
At FXOpen UK and FXOpen AU, Cryptocurrency CFDs are only available for trading by those clients categorised as Professional clients under FCA Rules and Professional clients under ASIC Rules, respectively. They are not available for trading by Retail clients.
#sp500 #marketanalysis #stockmarket
Market Analysis: E-mini S&P 500 Stock Market under Pressure
In 3 trading sessions this week, the S&P 500 is down approximately 2.85%. This pace has not been observed since March, when traders feared a banking crisis.
Possible reasons for the current decline:
→ at the end of August there will be a summit in Jackson Hole, where representatives of central banks will gather. Powell is expected to speak on August 25. It is acceptable to assume that market participants fear the continuation of a tight monetary policy. In parallel, the BRICS summit will be held in South Africa, which Xi Jinping will visit.
→ Prospects for an economic crisis in China that could spread to the whole world. Today it became known that the largest Chinese developer Evergrande (whose shares are traded in New York) has filed for bankruptcy, which should lead to new bankruptcies.
→ A series of reports of companies from the index for the Q2, which disappointed investors.
Meanwhile, Markets Insider publishes the opinion of experienced investor Bill Miller, who believes that after a strong first half of the year, a second may follow. Moreover, inflation is declining, while GDP growth remains stable.
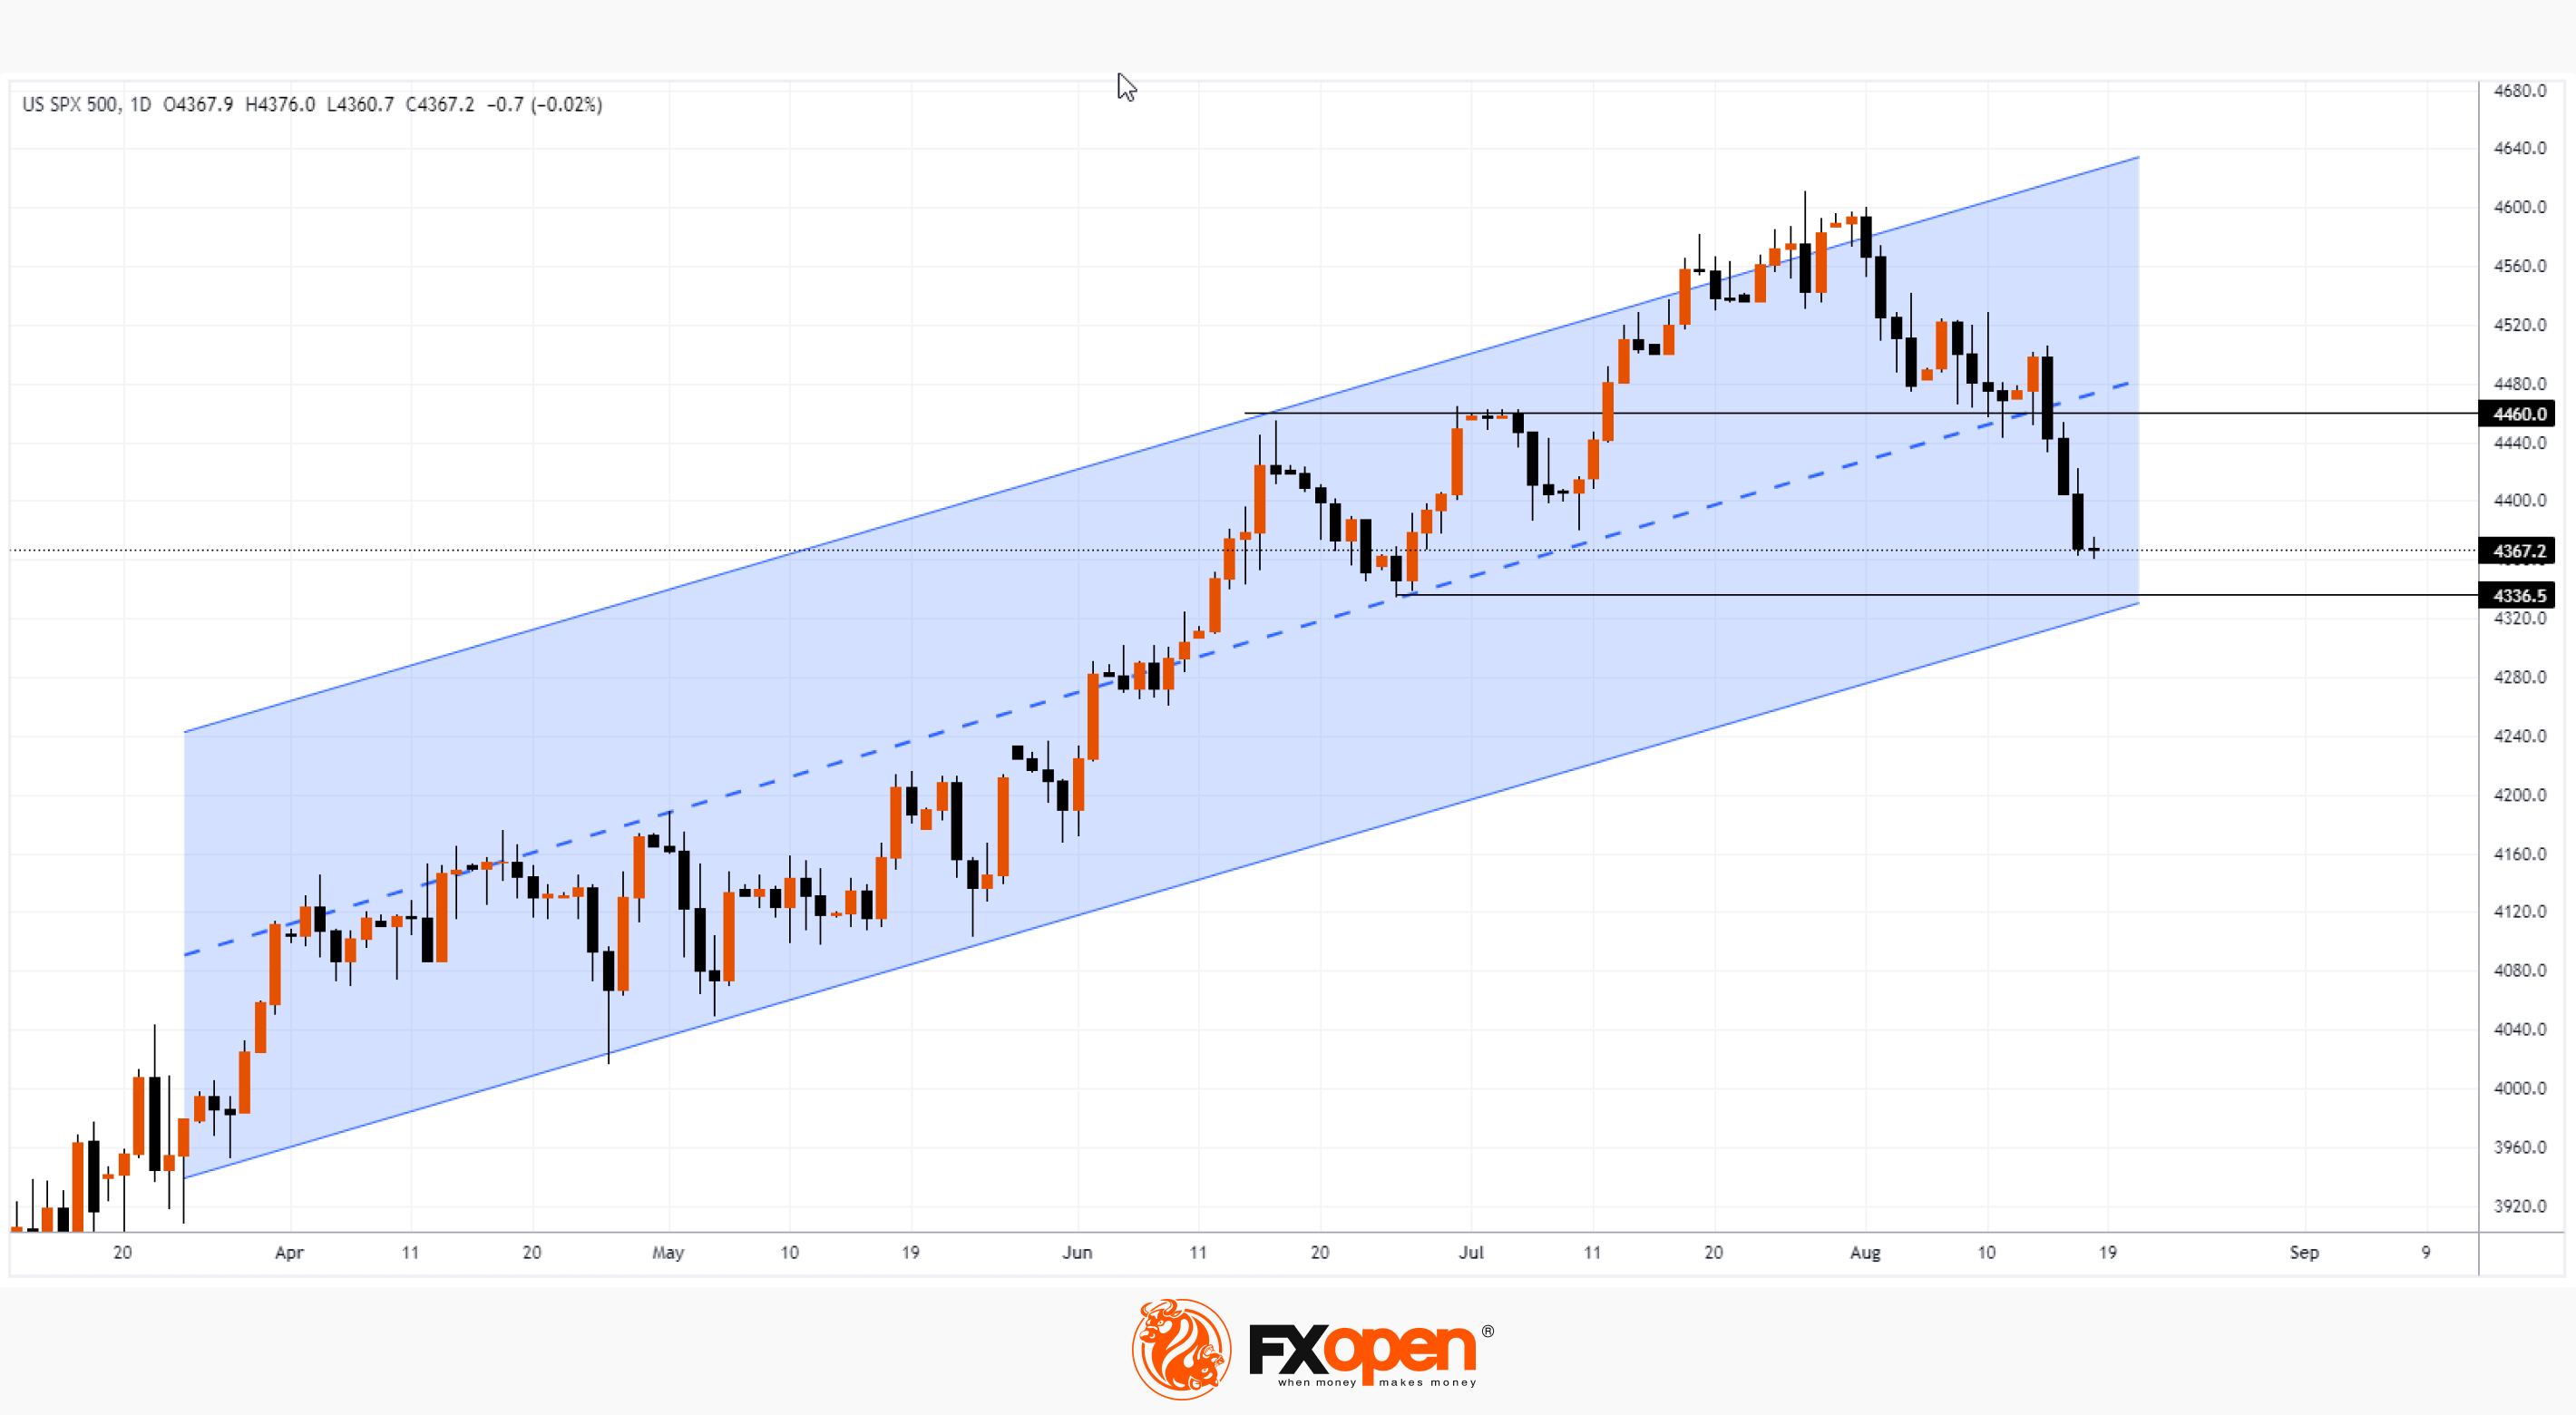
The chart of the S&P-500 index shows that the decline accelerated after the bears cleared a block of support from the median line of the ascending channel and the level of 4,460. The next such block may form the lower line of the channel, where support from the June low also passes. At the same time, the results of the summits in Jackson Hole and Johannesburg may contribute to the return of positive to the market.
To benefit from the rise and fall of stock market indices, consider enlisting the services of a trusted broker like FXOpen.
CFDs are complex instruments and come with a high risk of losing your money.
This article represents the opinion of the Companies operating under the FXOpen brand only. It is not to be construed as an offer, solicitation, or recommendation with respect to products and services provided by the Companies operating under the FXOpen brand, nor is it to be considered financial advice.
Market Analysis: E-mini S&P 500 Stock Market under Pressure
In 3 trading sessions this week, the S&P 500 is down approximately 2.85%. This pace has not been observed since March, when traders feared a banking crisis.
Possible reasons for the current decline:
→ at the end of August there will be a summit in Jackson Hole, where representatives of central banks will gather. Powell is expected to speak on August 25. It is acceptable to assume that market participants fear the continuation of a tight monetary policy. In parallel, the BRICS summit will be held in South Africa, which Xi Jinping will visit.
→ Prospects for an economic crisis in China that could spread to the whole world. Today it became known that the largest Chinese developer Evergrande (whose shares are traded in New York) has filed for bankruptcy, which should lead to new bankruptcies.
→ A series of reports of companies from the index for the Q2, which disappointed investors.
Meanwhile, Markets Insider publishes the opinion of experienced investor Bill Miller, who believes that after a strong first half of the year, a second may follow. Moreover, inflation is declining, while GDP growth remains stable.
The chart of the S&P-500 index shows that the decline accelerated after the bears cleared a block of support from the median line of the ascending channel and the level of 4,460. The next such block may form the lower line of the channel, where support from the June low also passes. At the same time, the results of the summits in Jackson Hole and Johannesburg may contribute to the return of positive to the market.
To benefit from the rise and fall of stock market indices, consider enlisting the services of a trusted broker like FXOpen.
CFDs are complex instruments and come with a high risk of losing your money.
This article represents the opinion of the Companies operating under the FXOpen brand only. It is not to be construed as an offer, solicitation, or recommendation with respect to products and services provided by the Companies operating under the FXOpen brand, nor is it to be considered financial advice.
#marketanalysis #XAUUSD #oilprices
Market Analysis: Gold Price and Crude Oil Price Signal Negative Trend
🔸 Gold price failed to clear the 1,930 resistance and moved lower against the US Dollar.
🔸 A major bearish trend line is forming with resistance near $1,895 on the hourly chart of gold at FXOpen.
🔸 Crude oil prices are also moving lower below the $80.00 resistance zone.
🔸 There is a key bearish trend line forming with resistance near $80.00 on the hourly chart of XTI/USD at FXOpen.
Read the full article now: https://cutt.ly/0whtFzCo
To take advantage of price fluctuations in the foreign exchange markets, consider enlisting the services of a reliable broker like FXOpen.
⚠️
This forecast represents FXOpen Companies opinion only, it should not be construed as an offer, invitation or recommendation in respect to FXOpen Companies products and services or as financial advice
Market Analysis: Gold Price and Crude Oil Price Signal Negative Trend
🔸 Gold price failed to clear the 1,930 resistance and moved lower against the US Dollar.
🔸 A major bearish trend line is forming with resistance near $1,895 on the hourly chart of gold at FXOpen.
🔸 Crude oil prices are also moving lower below the $80.00 resistance zone.
🔸 There is a key bearish trend line forming with resistance near $80.00 on the hourly chart of XTI/USD at FXOpen.
Read the full article now: https://cutt.ly/0whtFzCo
To take advantage of price fluctuations in the foreign exchange markets, consider enlisting the services of a reliable broker like FXOpen.
⚠️
This forecast represents FXOpen Companies opinion only, it should not be construed as an offer, invitation or recommendation in respect to FXOpen Companies products and services or as financial advice
Market Pulse
Market Analysis: Gold Price and Crude Oil Price Signal Negative Trend
Gold price is moving lower from the $1,930 resistance. Crude oil price is also declining and showing bearish signs below $80.00.
#marketanalysis #xauusd #xau
Market Analysis: Gold Price Updates Minimum of the Year against the Background of Rising Yields of US Govt Bonds
Treasury yields are rising, especially for long-term periods. For example, the yield on 10-year bonds today is 4.28%, and a month ago it was 3.88%, a year ago, 3.02%. Barron's writes that yields may continue to rise amid sustained inflation.
Rising US government bond yields are attracting investors who are diversifying their portfolios by moving capital away from the gold and equity markets, which is having a bearish effect on them.
So, according to information from MarketWatch, August could be the worst month in 2023 for the S&P 500 index precisely because of rising bond yields.
And according to Bloomberg, at the end of last week, the assets of exchange-traded funds (ETFs) investing in gold approached the level of 2.8 thousand tons, having updated the minimum since March 30, 2020.
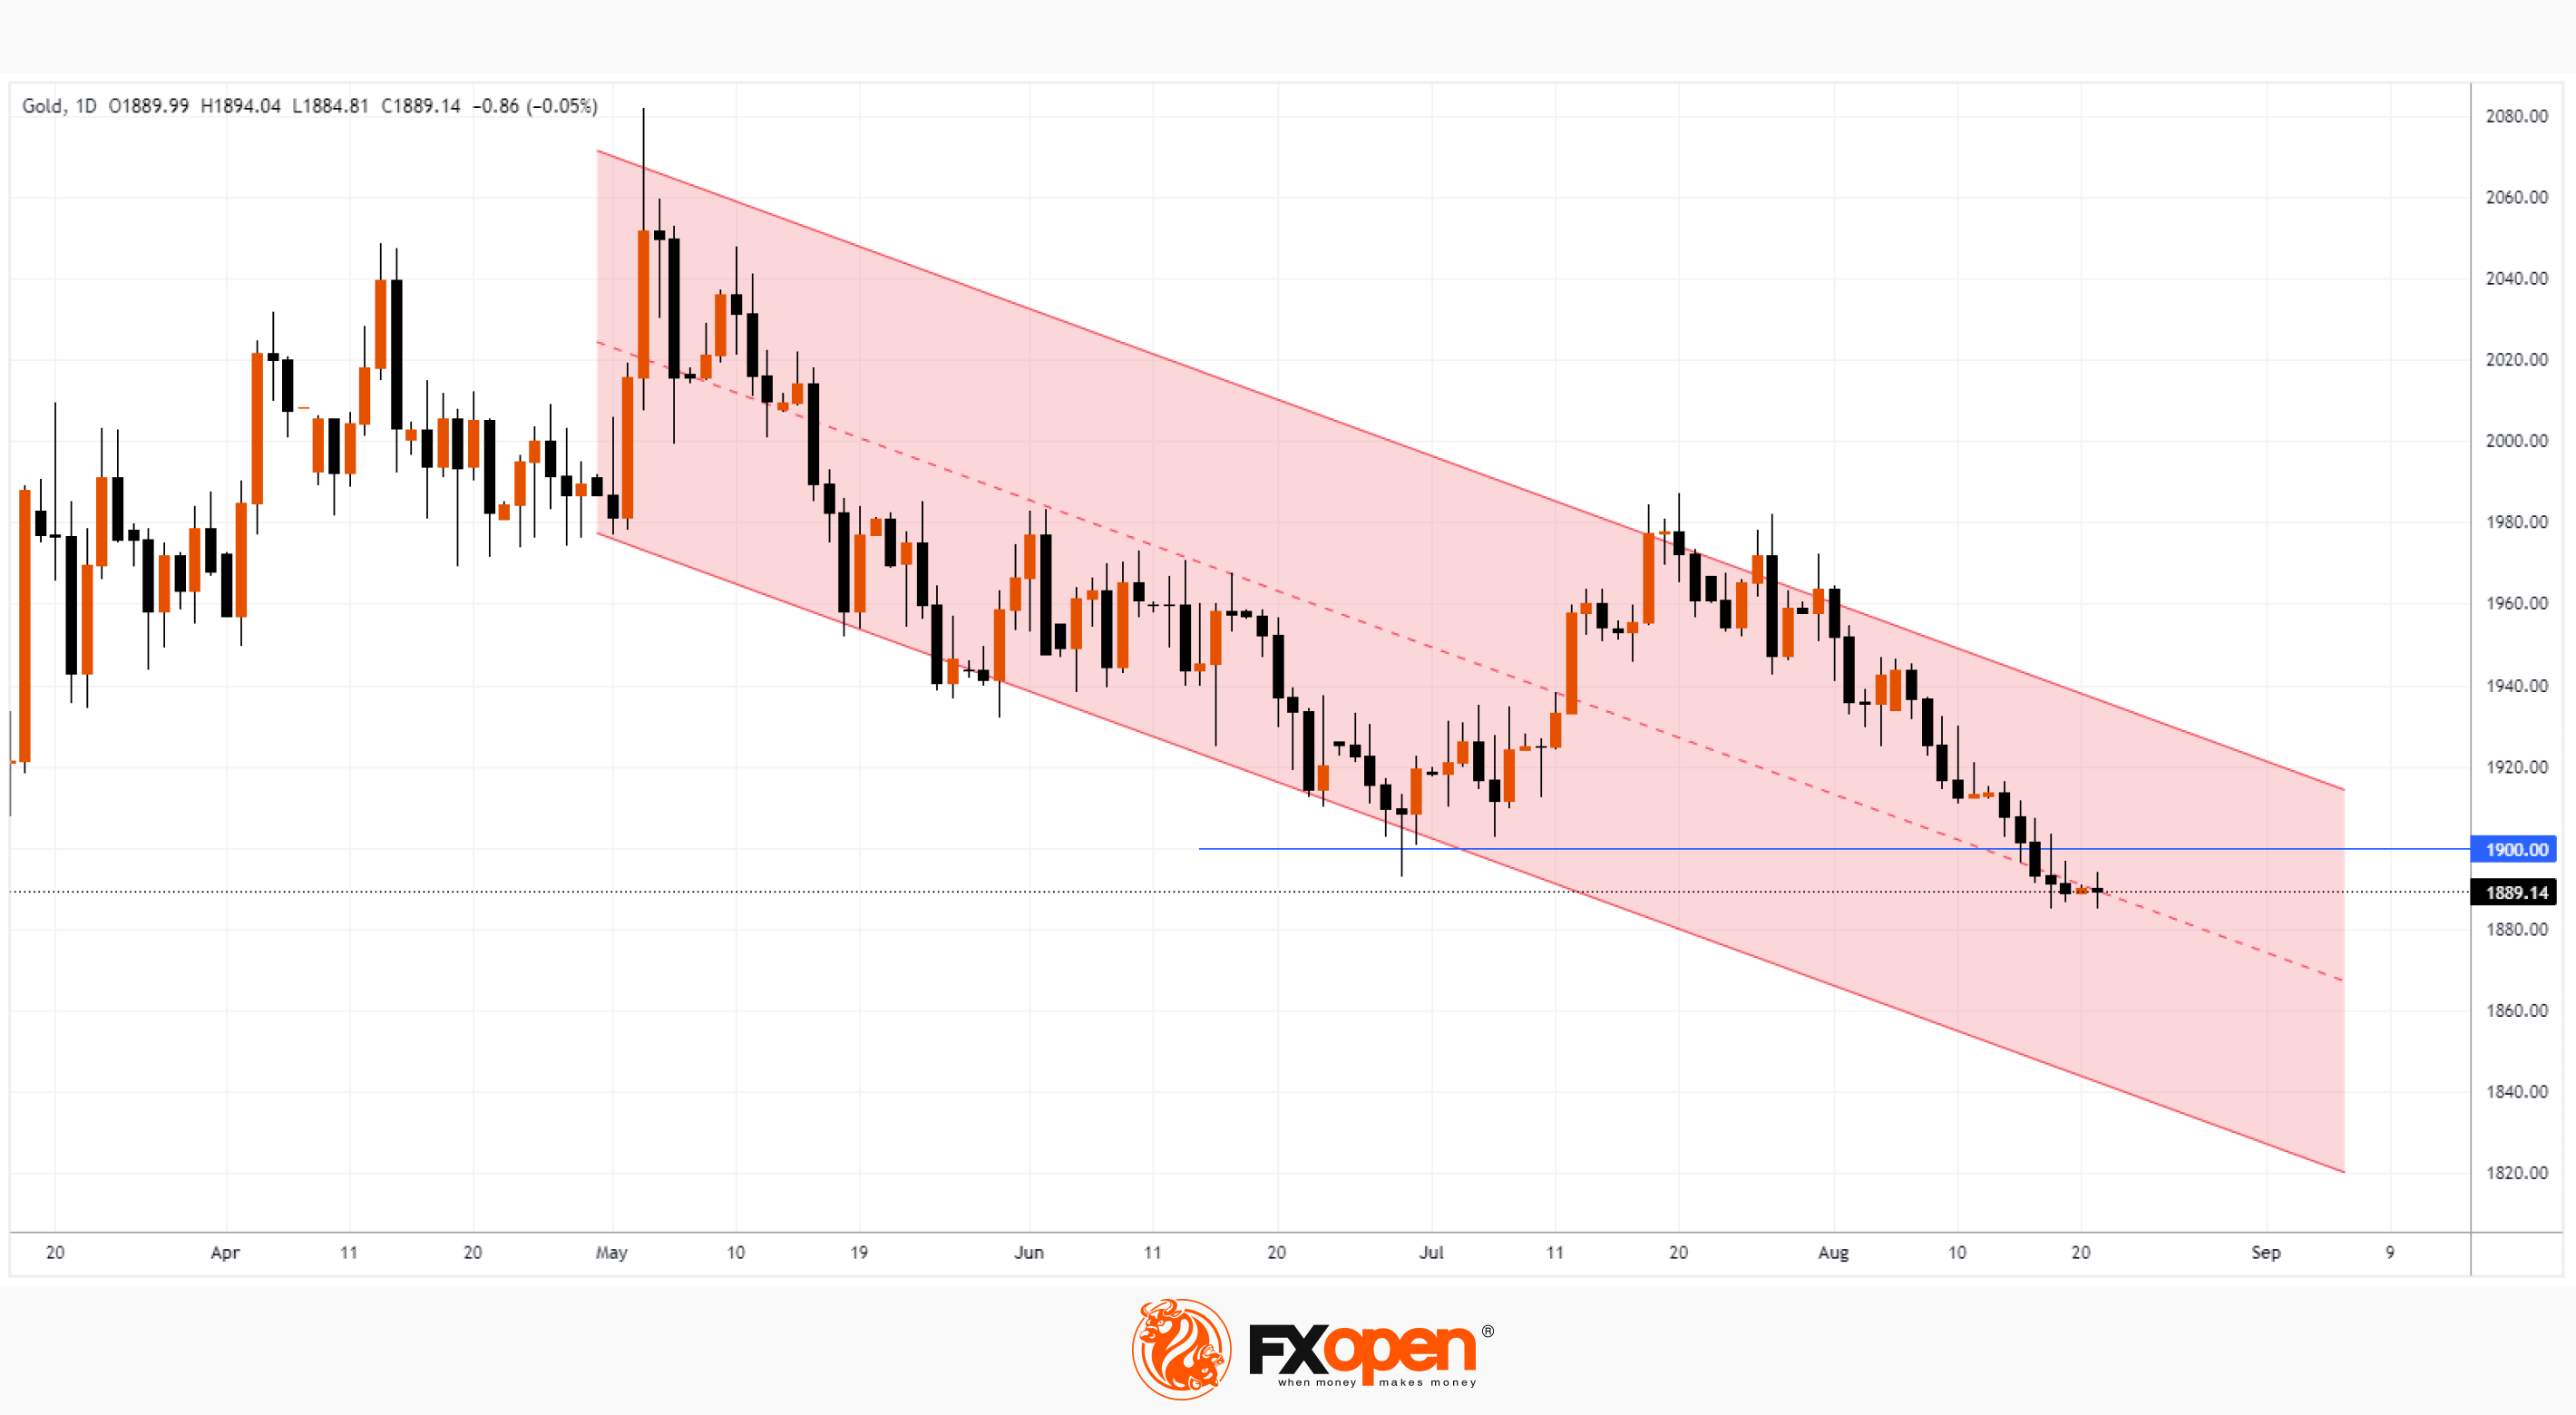
Today, as the chart shows, the price of gold has updated the minimum of the year.
Bearish arguments:
→ The price dynamics is developing within the bearish channel, which has been in effect since May.
→ The price has consolidated below the psychological level of 1900 dollars per ounce, from which we can now expect resistance to the price increase.
Bullish arguments:
→ The market is oversold, as evidenced by the daily RSI indicator. Therefore, the probability of a bullish correction increases.
This week, the BRICS summit and the Jackson Hole conference will take place, the news from which can have a significant impact on the price of gold.
And according to MarketWatch, August could be the worst month in 2023 for the S&P 500 precisely because of rising bond yields.
To benefit from fluctuations in the value of gold and silver, consider enlisting the services of a trusted broker like FXOpen.
CFDs are complex instruments and come with a high risk of losing your money.
This article represents the opinion of the Companies operating under the FXOpen brand only. It is not to be construed as an offer, solicitation, or recommendation with respect to products and services provided by the Companies operating under the FXOpen brand, nor is it to be considered financial advice.
Market Analysis: Gold Price Updates Minimum of the Year against the Background of Rising Yields of US Govt Bonds
Treasury yields are rising, especially for long-term periods. For example, the yield on 10-year bonds today is 4.28%, and a month ago it was 3.88%, a year ago, 3.02%. Barron's writes that yields may continue to rise amid sustained inflation.
Rising US government bond yields are attracting investors who are diversifying their portfolios by moving capital away from the gold and equity markets, which is having a bearish effect on them.
So, according to information from MarketWatch, August could be the worst month in 2023 for the S&P 500 index precisely because of rising bond yields.
And according to Bloomberg, at the end of last week, the assets of exchange-traded funds (ETFs) investing in gold approached the level of 2.8 thousand tons, having updated the minimum since March 30, 2020.
Today, as the chart shows, the price of gold has updated the minimum of the year.
Bearish arguments:
→ The price dynamics is developing within the bearish channel, which has been in effect since May.
→ The price has consolidated below the psychological level of 1900 dollars per ounce, from which we can now expect resistance to the price increase.
Bullish arguments:
→ The market is oversold, as evidenced by the daily RSI indicator. Therefore, the probability of a bullish correction increases.
This week, the BRICS summit and the Jackson Hole conference will take place, the news from which can have a significant impact on the price of gold.
And according to MarketWatch, August could be the worst month in 2023 for the S&P 500 precisely because of rising bond yields.
To benefit from fluctuations in the value of gold and silver, consider enlisting the services of a trusted broker like FXOpen.
CFDs are complex instruments and come with a high risk of losing your money.
This article represents the opinion of the Companies operating under the FXOpen brand only. It is not to be construed as an offer, solicitation, or recommendation with respect to products and services provided by the Companies operating under the FXOpen brand, nor is it to be considered financial advice.
#marketanalysis #EURUSD #tradingtips
EURUSD Analysis: Price is Forming a Rebound from the Support of 1.085
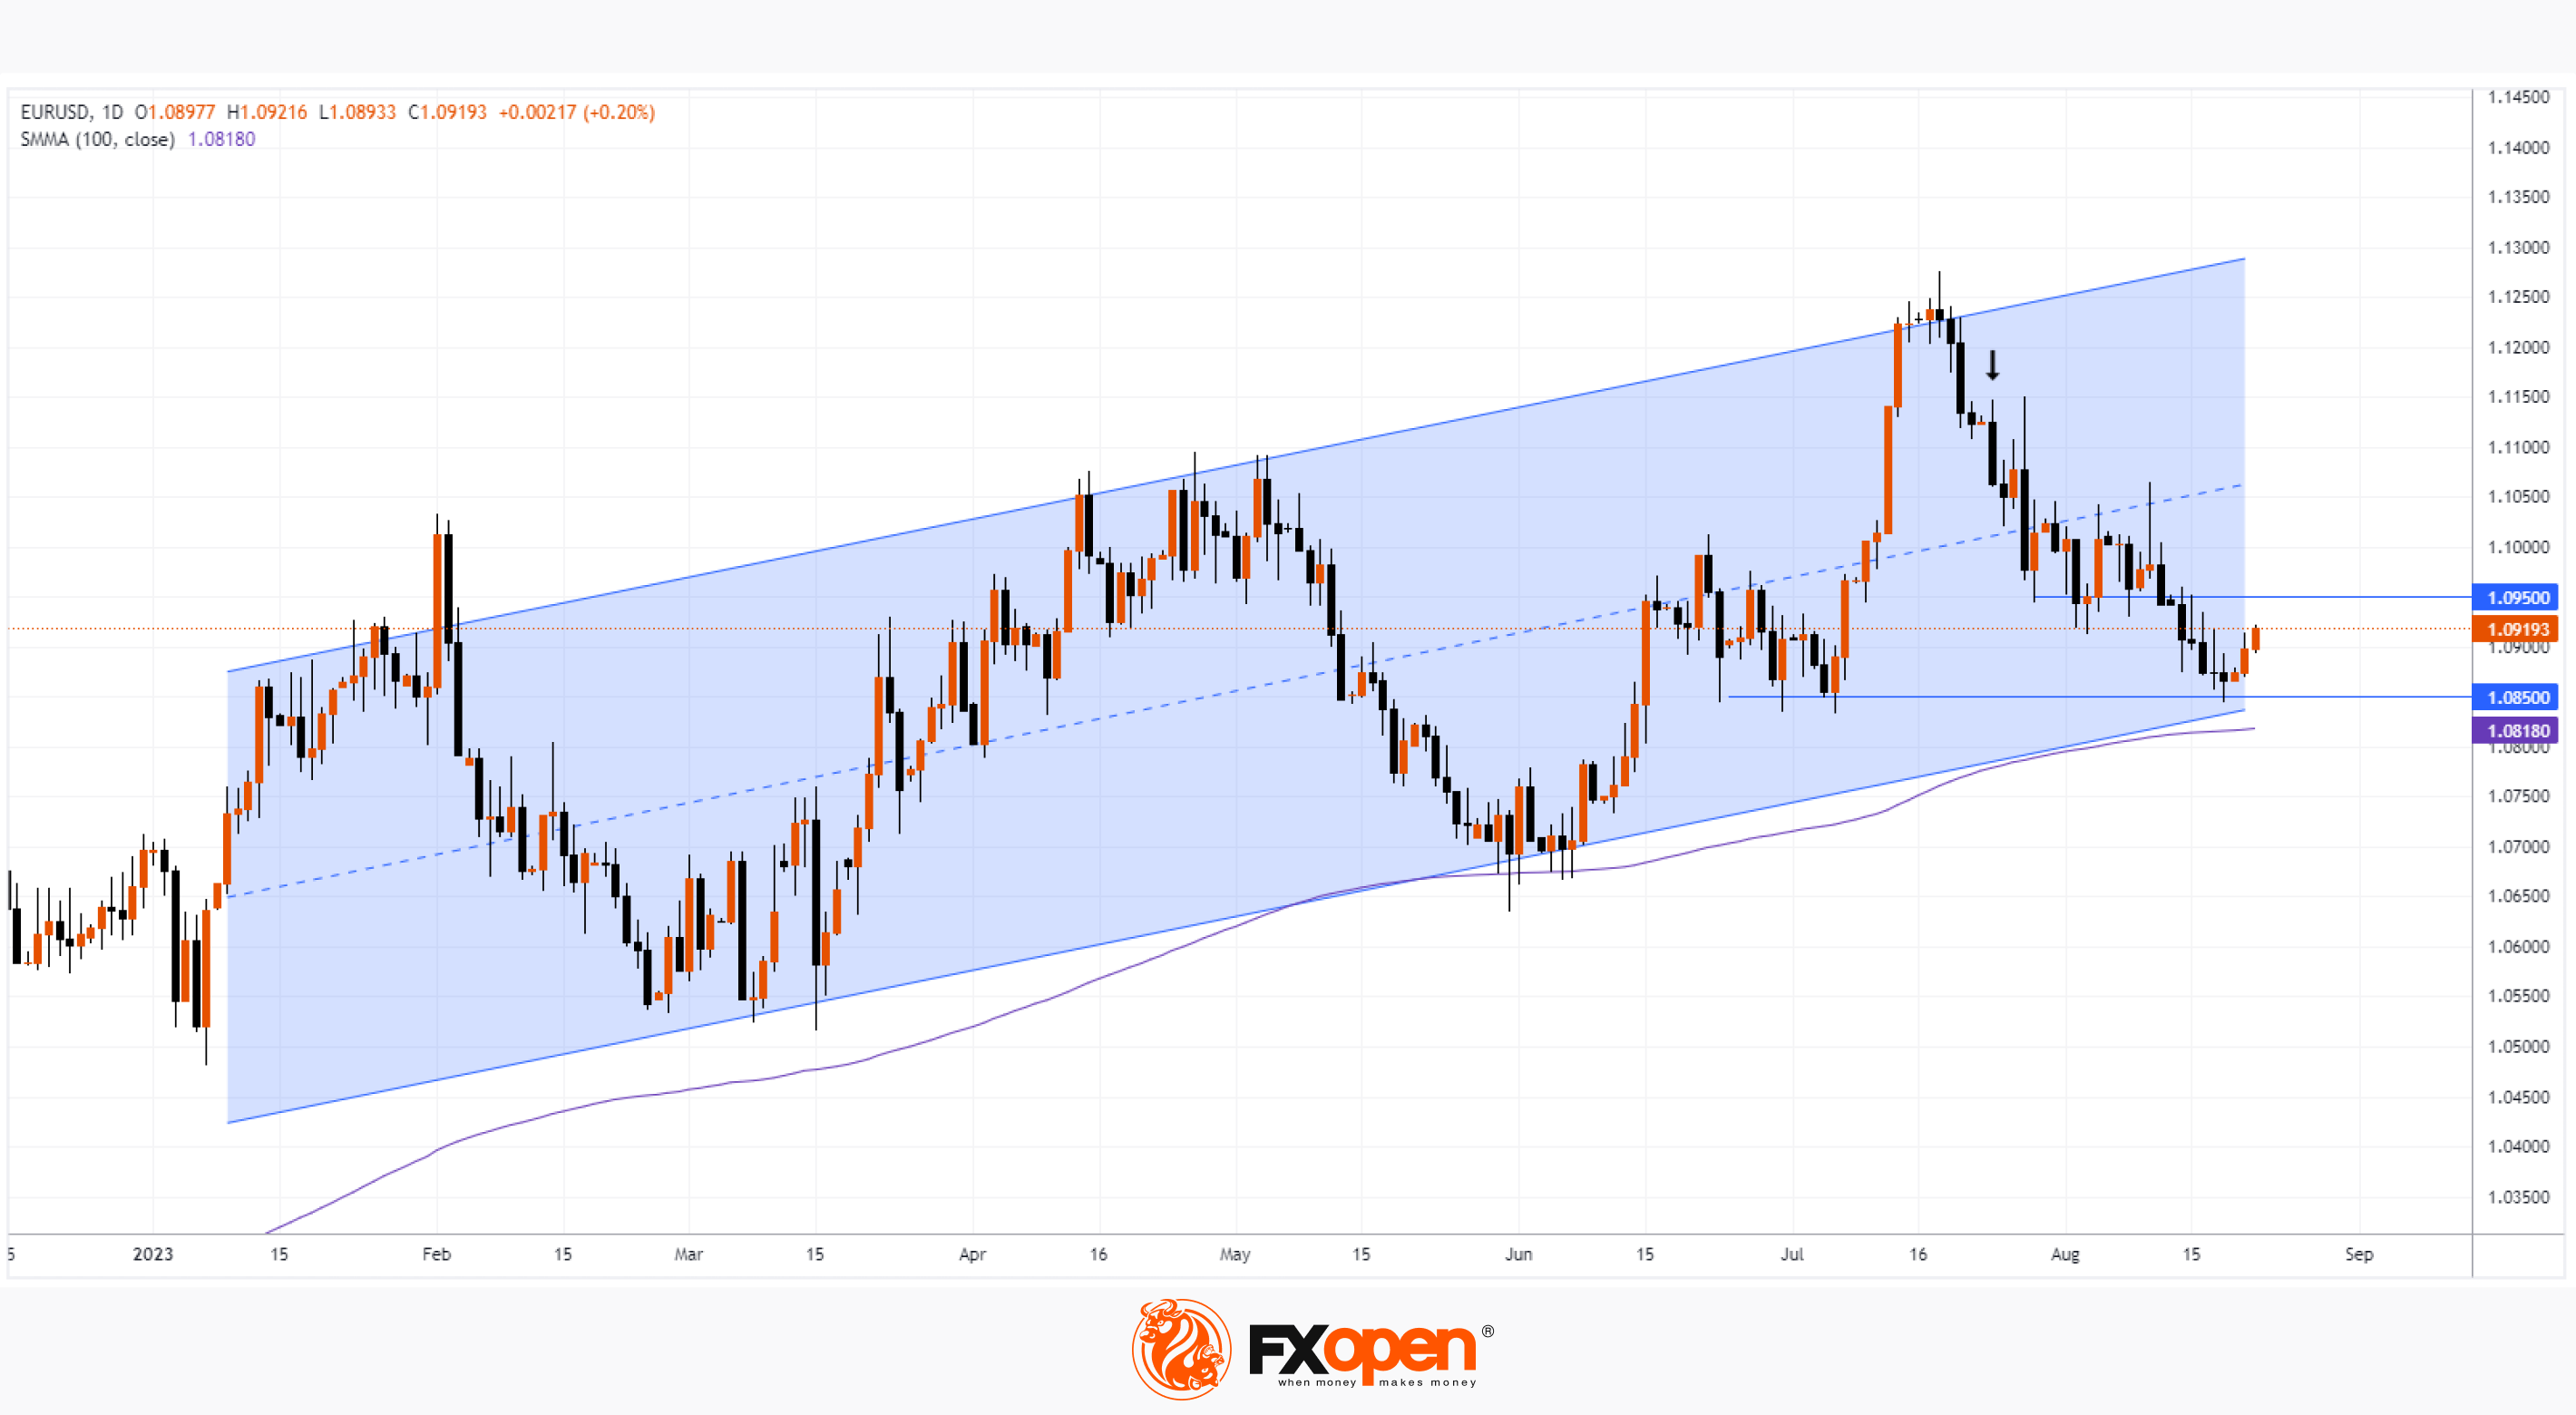
From the high of the year, set on July 18 near the level of 1.125, the price of EUR/USD fell in 1 month to the support of 1.085 (-3.4%). Today, the EUR/USD chart shows that the market is forming a rebound from this support, which has been in place since mid-June. What will be the further development?
Bullish arguments:
→ The market is in an uptrend (indicated by the blue channel) in 2023 and its lower boundary, which forms a powerful block of support at the level of 1.085, can help the bounce develop into a meaningful swing.
→ Support may come from SMA (100).
Bearish arguments:
→ The higher the price of EUR/USD rises, the closer the level of 1.095 becomes, which acted as support; but after the pin bar on August 10, the level was broken, and now resistance can be expected from it. If this is indeed the case, the market will form a weak bounce from the block of supports in the 1.085 area — a threatening sign for the current ascending channel.
Fundamental background:
→ Tomorrow morning (between 10:15 am and 11:00 am GMT+3) economic data from the Eurozone will be published, including the Purchasing Managers' Index (PMI), which is considered a leading indicator of the state of the economy. Last month, PMI values set multi-month lows, showing a slowdown in the economy in Europe, which led to a fall in the EUR/USD rate (shown by the arrow). It is possible that the market will get a new reason for a bearish momentum.
→ The media are writing about the weakening of the dollar on the eve of the symposium in Jackson Hole, where Powell is scheduled to speak on August 25. If the head of the Fed is clearly leaving the doors open for new rate hikes, this will allow the dollar to strengthen and put pressure on the EUR/USD rate.
To benefit from the rise and fall of the EUR/USD rate, consider enlisting the services of a trusted broker like FXOpen.
CFDs are complex instruments and come with a high risk of losing your money.
This article represents the opinion of the Companies operating under the FXOpen brand only. It is not to be construed as an offer, solicitation, or recommendation with respect to products and services provided by the Companies operating under the FXOpen brand, nor is it to be considered financial advice.
EURUSD Analysis: Price is Forming a Rebound from the Support of 1.085
From the high of the year, set on July 18 near the level of 1.125, the price of EUR/USD fell in 1 month to the support of 1.085 (-3.4%). Today, the EUR/USD chart shows that the market is forming a rebound from this support, which has been in place since mid-June. What will be the further development?
Bullish arguments:
→ The market is in an uptrend (indicated by the blue channel) in 2023 and its lower boundary, which forms a powerful block of support at the level of 1.085, can help the bounce develop into a meaningful swing.
→ Support may come from SMA (100).
Bearish arguments:
→ The higher the price of EUR/USD rises, the closer the level of 1.095 becomes, which acted as support; but after the pin bar on August 10, the level was broken, and now resistance can be expected from it. If this is indeed the case, the market will form a weak bounce from the block of supports in the 1.085 area — a threatening sign for the current ascending channel.
Fundamental background:
→ Tomorrow morning (between 10:15 am and 11:00 am GMT+3) economic data from the Eurozone will be published, including the Purchasing Managers' Index (PMI), which is considered a leading indicator of the state of the economy. Last month, PMI values set multi-month lows, showing a slowdown in the economy in Europe, which led to a fall in the EUR/USD rate (shown by the arrow). It is possible that the market will get a new reason for a bearish momentum.
→ The media are writing about the weakening of the dollar on the eve of the symposium in Jackson Hole, where Powell is scheduled to speak on August 25. If the head of the Fed is clearly leaving the doors open for new rate hikes, this will allow the dollar to strengthen and put pressure on the EUR/USD rate.
To benefit from the rise and fall of the EUR/USD rate, consider enlisting the services of a trusted broker like FXOpen.
CFDs are complex instruments and come with a high risk of losing your money.
This article represents the opinion of the Companies operating under the FXOpen brand only. It is not to be construed as an offer, solicitation, or recommendation with respect to products and services provided by the Companies operating under the FXOpen brand, nor is it to be considered financial advice.
#tsla #stockmarket #marketanalysis
TSLA Analysis: Share Price Leads Stock Market Growth
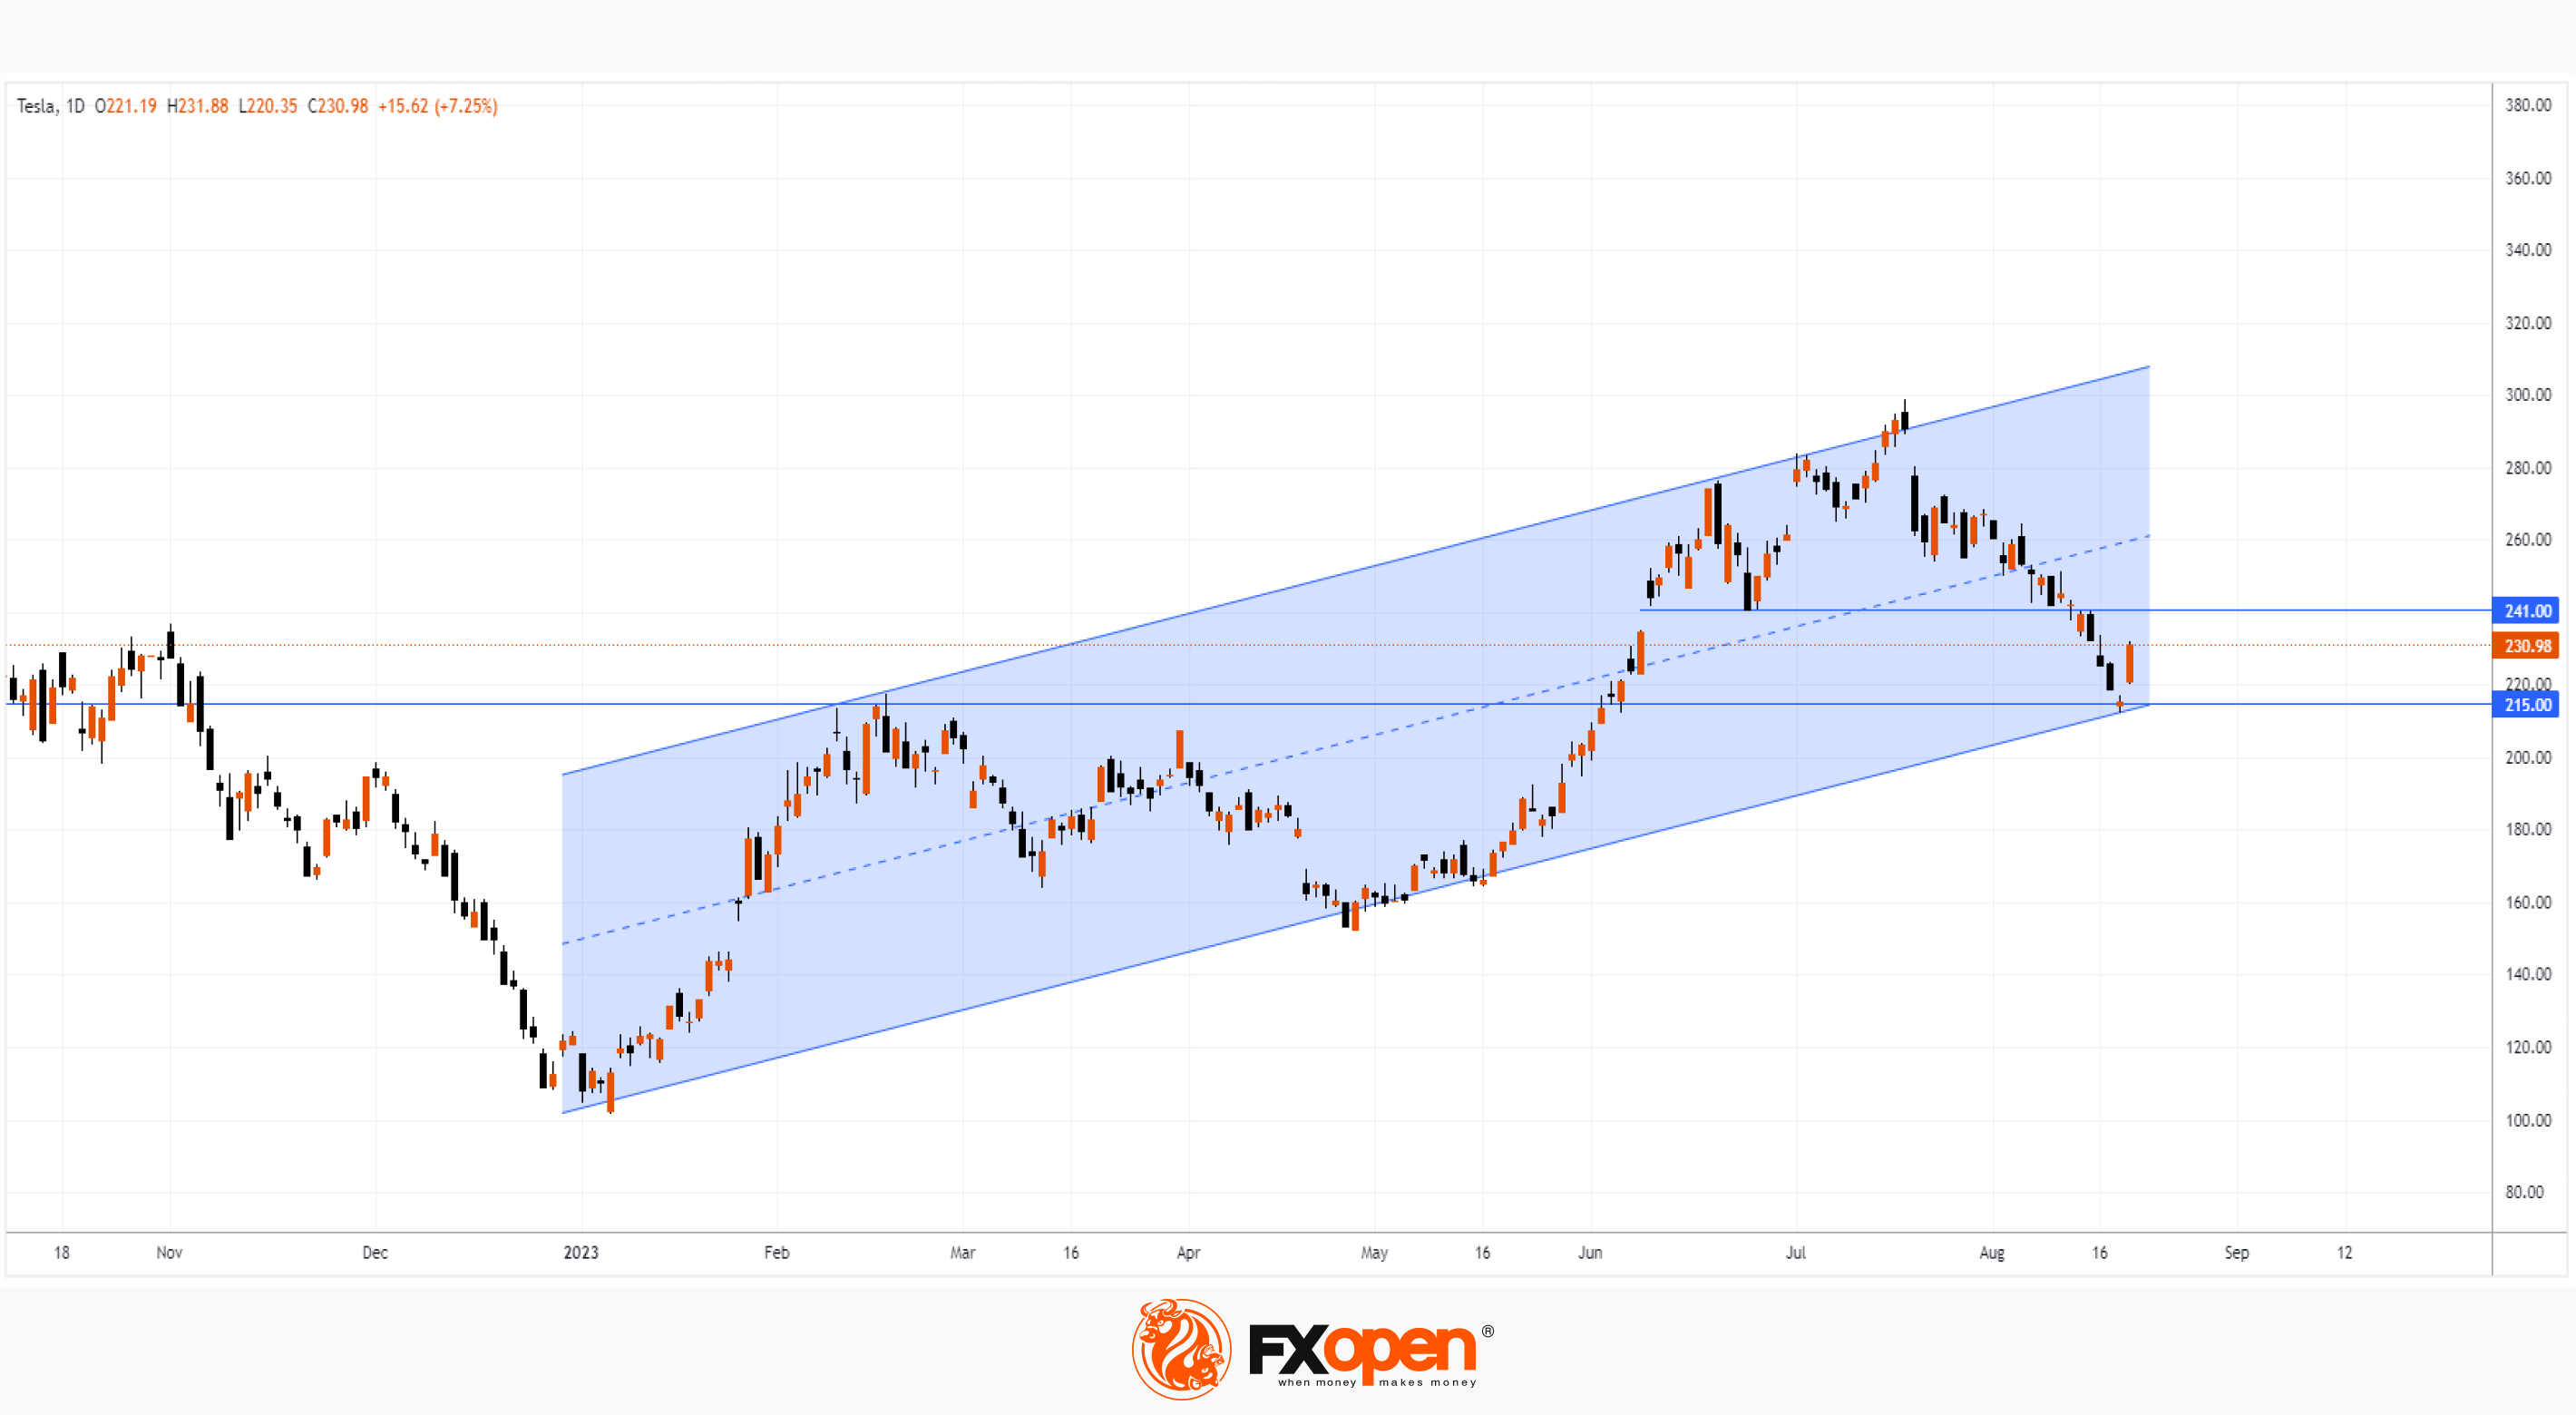
Yesterday, TSLA's share price rose 7%, while the S&P 500 index also started the week positively, showing an increase of approximately 0.7%.
According to the media, the reason for the upward momentum was the fact that investment company Baird noted a number of positive factors that await Tesla in the 2nd half of the year, including the launch of Cybertruck. The company's analysts have set a Buy rating on TSLA shares with a target price of USD 300, which represents about 32% upside from Monday's closing price.
Bullish arguments:
→ The price of TSLA bounced off the support block formed by the lower border of the rising channel and the level of USD 215, which served as resistance in February.
→ The August 18 doji candle indicated that the market may have found an equilibrium of supply and demand after a series of bearish candles.
→ The price of the S&P 500 index found support near the lower border of the rising channel (see its construction, for example, in this post).
→ Yesterday's bullish momentum is the strongest since March this year, so it could spread to the following days.
Bearish arguments:
→ Former support at USD 241 looks capable of resisting the rising price of TSLA shares.
To benefit from the rise and fall of the TSLA share price, consider enlisting the services of a trusted broker like FXOpen.
CFDs are complex instruments and come with a high risk of losing your money.
This article represents the opinion of the Companies operating under the FXOpen brand only. It is not to be construed as an offer, solicitation, or recommendation with respect to products and services provided by the Companies operating under the FXOpen brand, nor is it to be considered financial advice.
TSLA Analysis: Share Price Leads Stock Market Growth
Yesterday, TSLA's share price rose 7%, while the S&P 500 index also started the week positively, showing an increase of approximately 0.7%.
According to the media, the reason for the upward momentum was the fact that investment company Baird noted a number of positive factors that await Tesla in the 2nd half of the year, including the launch of Cybertruck. The company's analysts have set a Buy rating on TSLA shares with a target price of USD 300, which represents about 32% upside from Monday's closing price.
Bullish arguments:
→ The price of TSLA bounced off the support block formed by the lower border of the rising channel and the level of USD 215, which served as resistance in February.
→ The August 18 doji candle indicated that the market may have found an equilibrium of supply and demand after a series of bearish candles.
→ The price of the S&P 500 index found support near the lower border of the rising channel (see its construction, for example, in this post).
→ Yesterday's bullish momentum is the strongest since March this year, so it could spread to the following days.
Bearish arguments:
→ Former support at USD 241 looks capable of resisting the rising price of TSLA shares.
To benefit from the rise and fall of the TSLA share price, consider enlisting the services of a trusted broker like FXOpen.
CFDs are complex instruments and come with a high risk of losing your money.
This article represents the opinion of the Companies operating under the FXOpen brand only. It is not to be construed as an offer, solicitation, or recommendation with respect to products and services provided by the Companies operating under the FXOpen brand, nor is it to be considered financial advice.
#marketanalysis #BTCUSD #bitcoin #crypto
BTC/USD Price Analysis: RSI Drops to Lowest Since March 2020
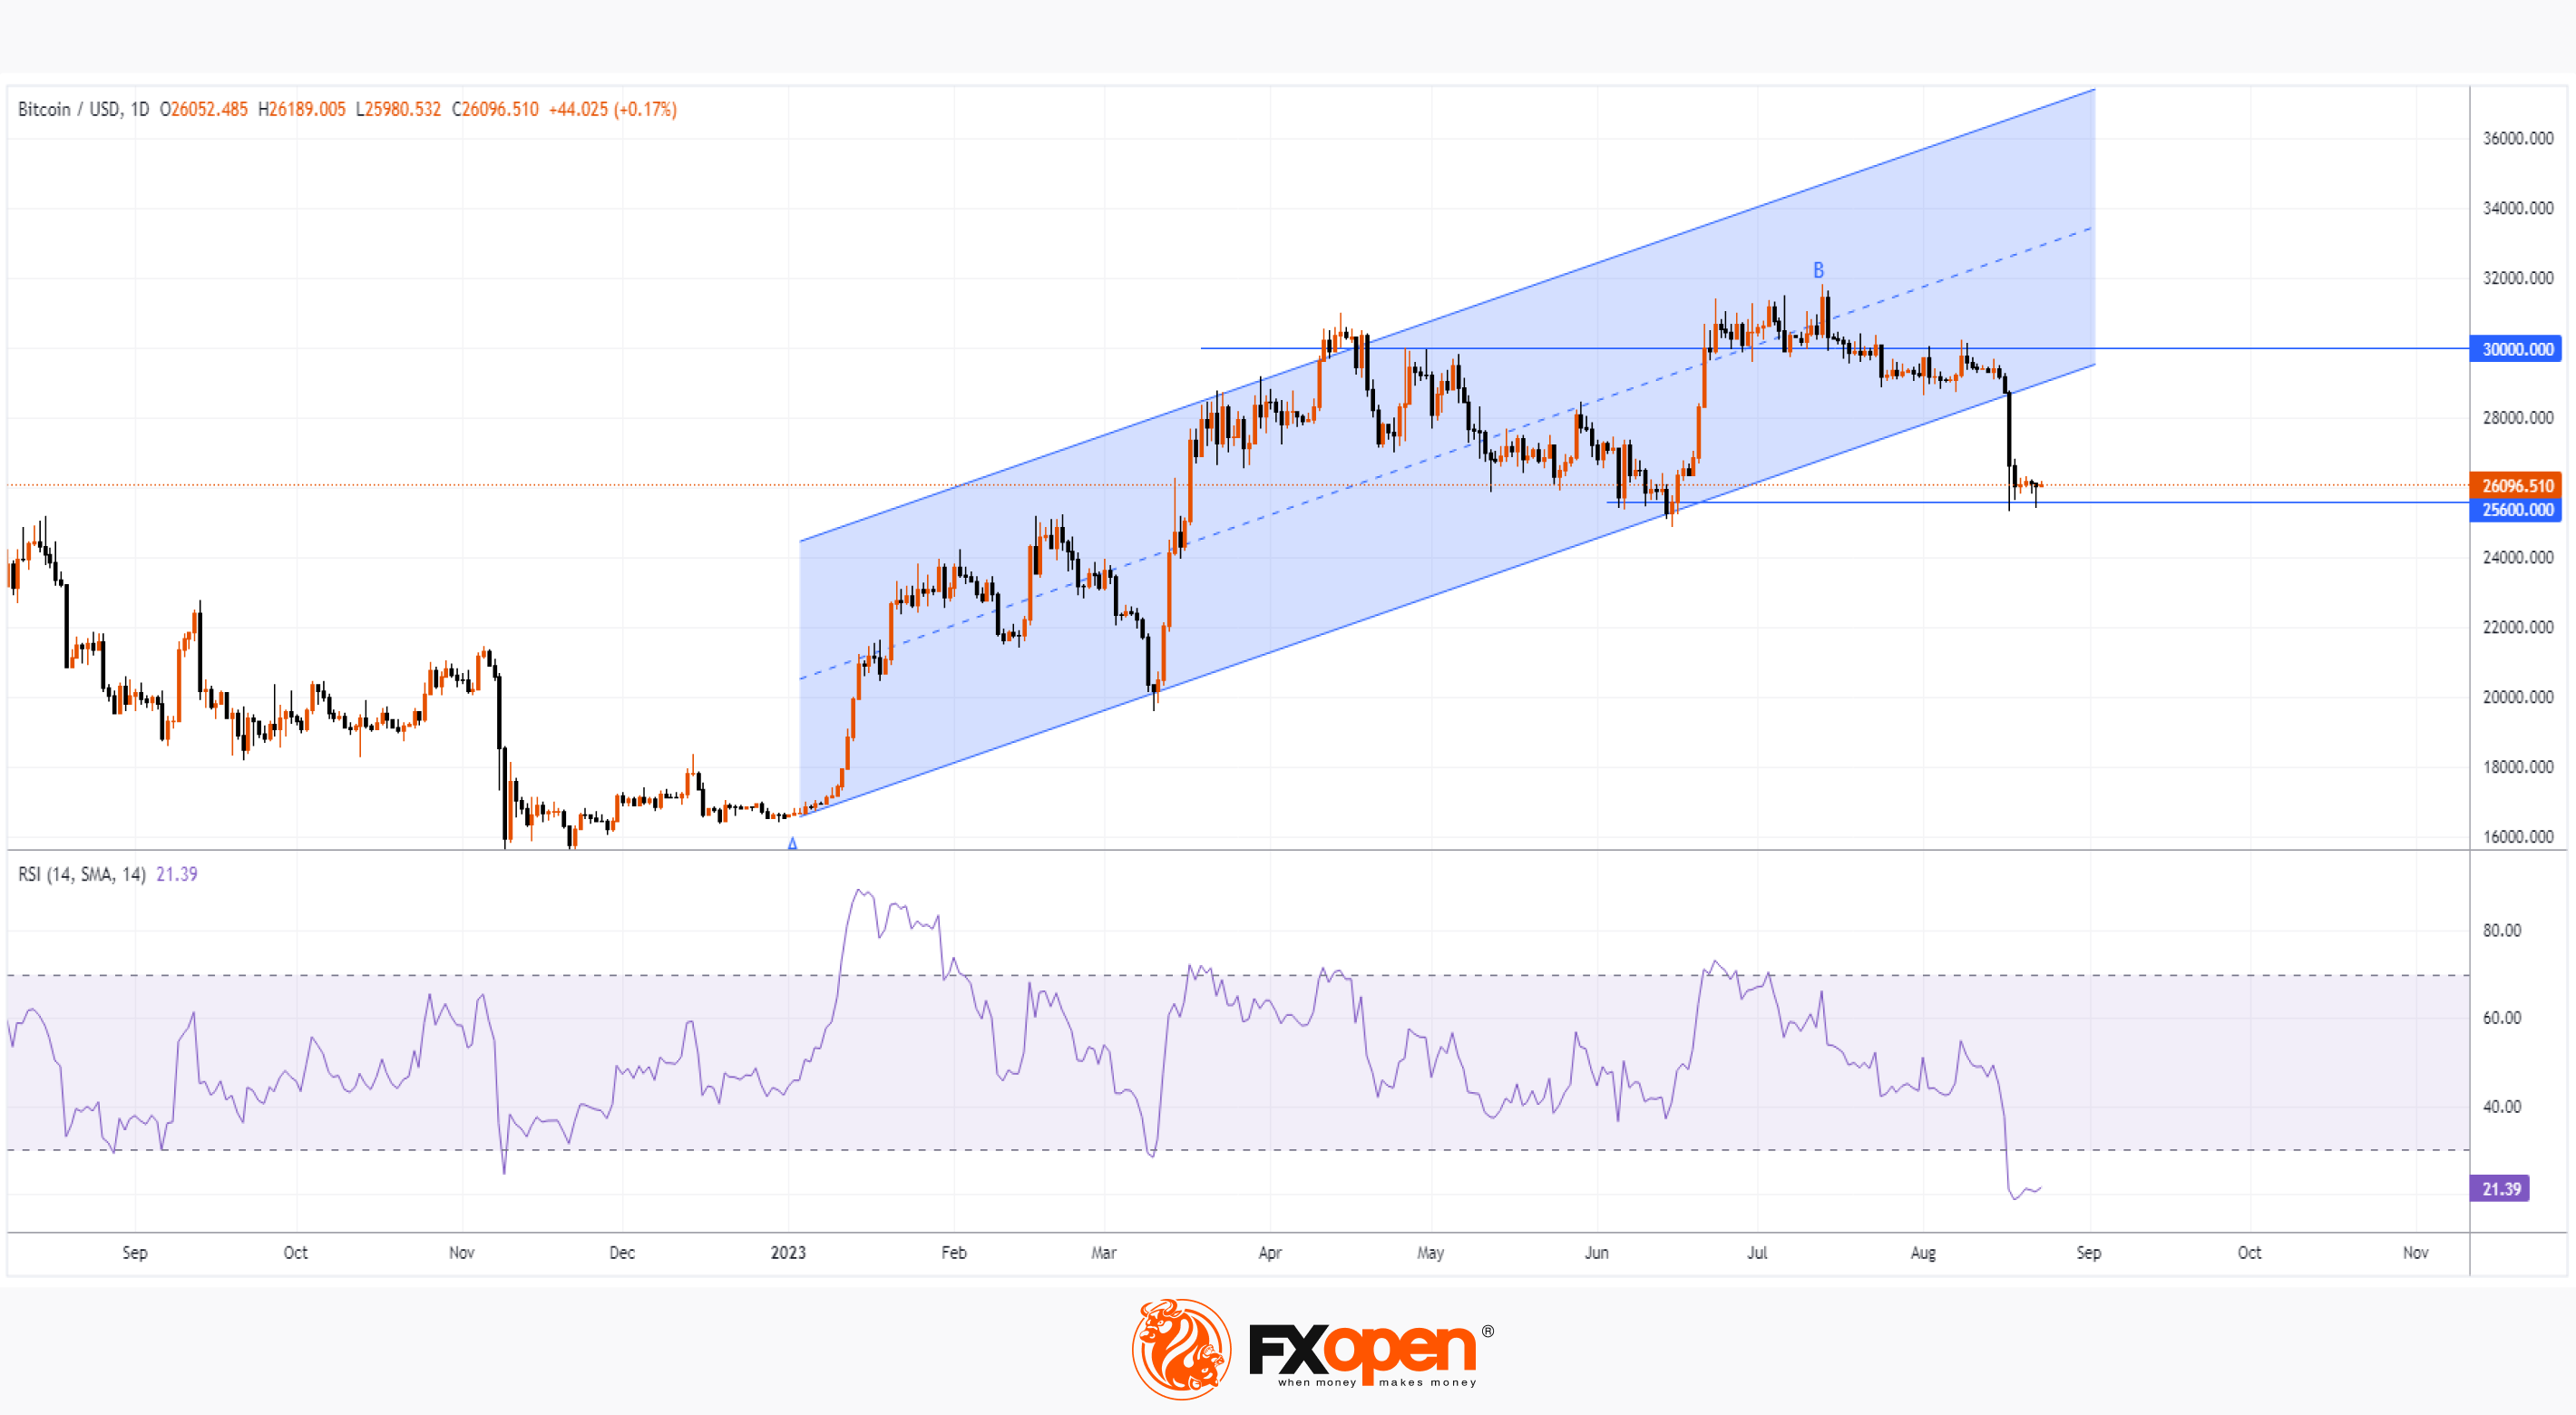
The last time this classic indicator dropped below the 20.0 level was in March 2020, when the world panicked due to the spread of the coronavirus.
The extremely low RSI values indicate an extremely oversold market — it was formed as a result of the collapse of the BTC/USD rate on August 17, the reasons for which are not clear. Among the versions are:
→ SpaceX's decision to sell bitcoins from its balance sheet;
→ high yields of US government bonds (10-year bonds are at a 14-year high);
→ the collapse of the Chinese developer Evergrande.
Be that as it may, the decline of RSI below the level of 20.0 should not be interpreted as a signal to open a long position, although there is evidence for this.
Bullish arguments:
→ a long lower shadow on yesterday's candle on the daily bitcoin price chart confirms the aggressiveness of the bulls defending the 25.6k level;
→ this level approximately coincides with the Fibo level at 0.38 for a rollback from the growth of A→B;
→ the bitcoin market may follow the stock market — after all, the S&P 500 is at the lower boundary of the rising channel, which operates in 2023.
Bearish arguments:
→ The price of bitcoin has broken through the upward channel of 2023, which may mean a radical change in sentiment. The USD 30,000 level proved to be a difficult barrier for the bulls.
→ Intraday charts show that bitcoin fell especially rapidly in the 26,800-27,500 range. Therefore, this area of seller dominance could become resistance to a recovery if it follows the RSI's spring 2020 lows.
To benefit from the rise and fall of the price of bitcoin, consider enlisting the services of a trusted broker like FXOpen.
CFDs are complex instruments and come with a high risk of losing your money.
This article represents the opinion of the Companies operating under the FXOpen brand only. It is not to be construed as an offer, solicitation, or recommendation with respect to products and services provided by the Companies operating under the FXOpen brand, nor is it to be considered financial advice.
At FXOpen UK and FXOpen AU, Cryptocurrency CFDs are only available for trading by those clients categorised as Professional clients under FCA Rules and Professional clients under ASIC Rules, respectively. They are not available for trading by Retail clients.
BTC/USD Price Analysis: RSI Drops to Lowest Since March 2020
The last time this classic indicator dropped below the 20.0 level was in March 2020, when the world panicked due to the spread of the coronavirus.
The extremely low RSI values indicate an extremely oversold market — it was formed as a result of the collapse of the BTC/USD rate on August 17, the reasons for which are not clear. Among the versions are:
→ SpaceX's decision to sell bitcoins from its balance sheet;
→ high yields of US government bonds (10-year bonds are at a 14-year high);
→ the collapse of the Chinese developer Evergrande.
Be that as it may, the decline of RSI below the level of 20.0 should not be interpreted as a signal to open a long position, although there is evidence for this.
Bullish arguments:
→ a long lower shadow on yesterday's candle on the daily bitcoin price chart confirms the aggressiveness of the bulls defending the 25.6k level;
→ this level approximately coincides with the Fibo level at 0.38 for a rollback from the growth of A→B;
→ the bitcoin market may follow the stock market — after all, the S&P 500 is at the lower boundary of the rising channel, which operates in 2023.
Bearish arguments:
→ The price of bitcoin has broken through the upward channel of 2023, which may mean a radical change in sentiment. The USD 30,000 level proved to be a difficult barrier for the bulls.
→ Intraday charts show that bitcoin fell especially rapidly in the 26,800-27,500 range. Therefore, this area of seller dominance could become resistance to a recovery if it follows the RSI's spring 2020 lows.
To benefit from the rise and fall of the price of bitcoin, consider enlisting the services of a trusted broker like FXOpen.
CFDs are complex instruments and come with a high risk of losing your money.
This article represents the opinion of the Companies operating under the FXOpen brand only. It is not to be construed as an offer, solicitation, or recommendation with respect to products and services provided by the Companies operating under the FXOpen brand, nor is it to be considered financial advice.
At FXOpen UK and FXOpen AU, Cryptocurrency CFDs are only available for trading by those clients categorised as Professional clients under FCA Rules and Professional clients under ASIC Rules, respectively. They are not available for trading by Retail clients.
#marketanalysis #stockmarket #NVDA
NVDA Analysis: Share Price Rises after Positive Report
Postmarket, NVDA jumped +9% to break the USD 500-per-share psychological level for the first time, supported by strong Q2 data:
→ earnings per share: USD 2.70 (expected USD 2.08);
→ company revenue: USD 13.5 bn (expected USD 11.2 bn);
→ 3Q revenue forecast: USD 16 billion
Nvidia also unveiled a USD 25 billion share buyback plan. Demand for NVDA shares also boosted stock prices of other AI-related tech giants: MSFT, GOOG, AMD.
Bullish arguments:
→ the report showed that interest in the topic of AI remains, and NVDA can be the main beneficiary of this progress. By some estimates, over the next 10 years, companies will spend USD 800 billion building and training their models.
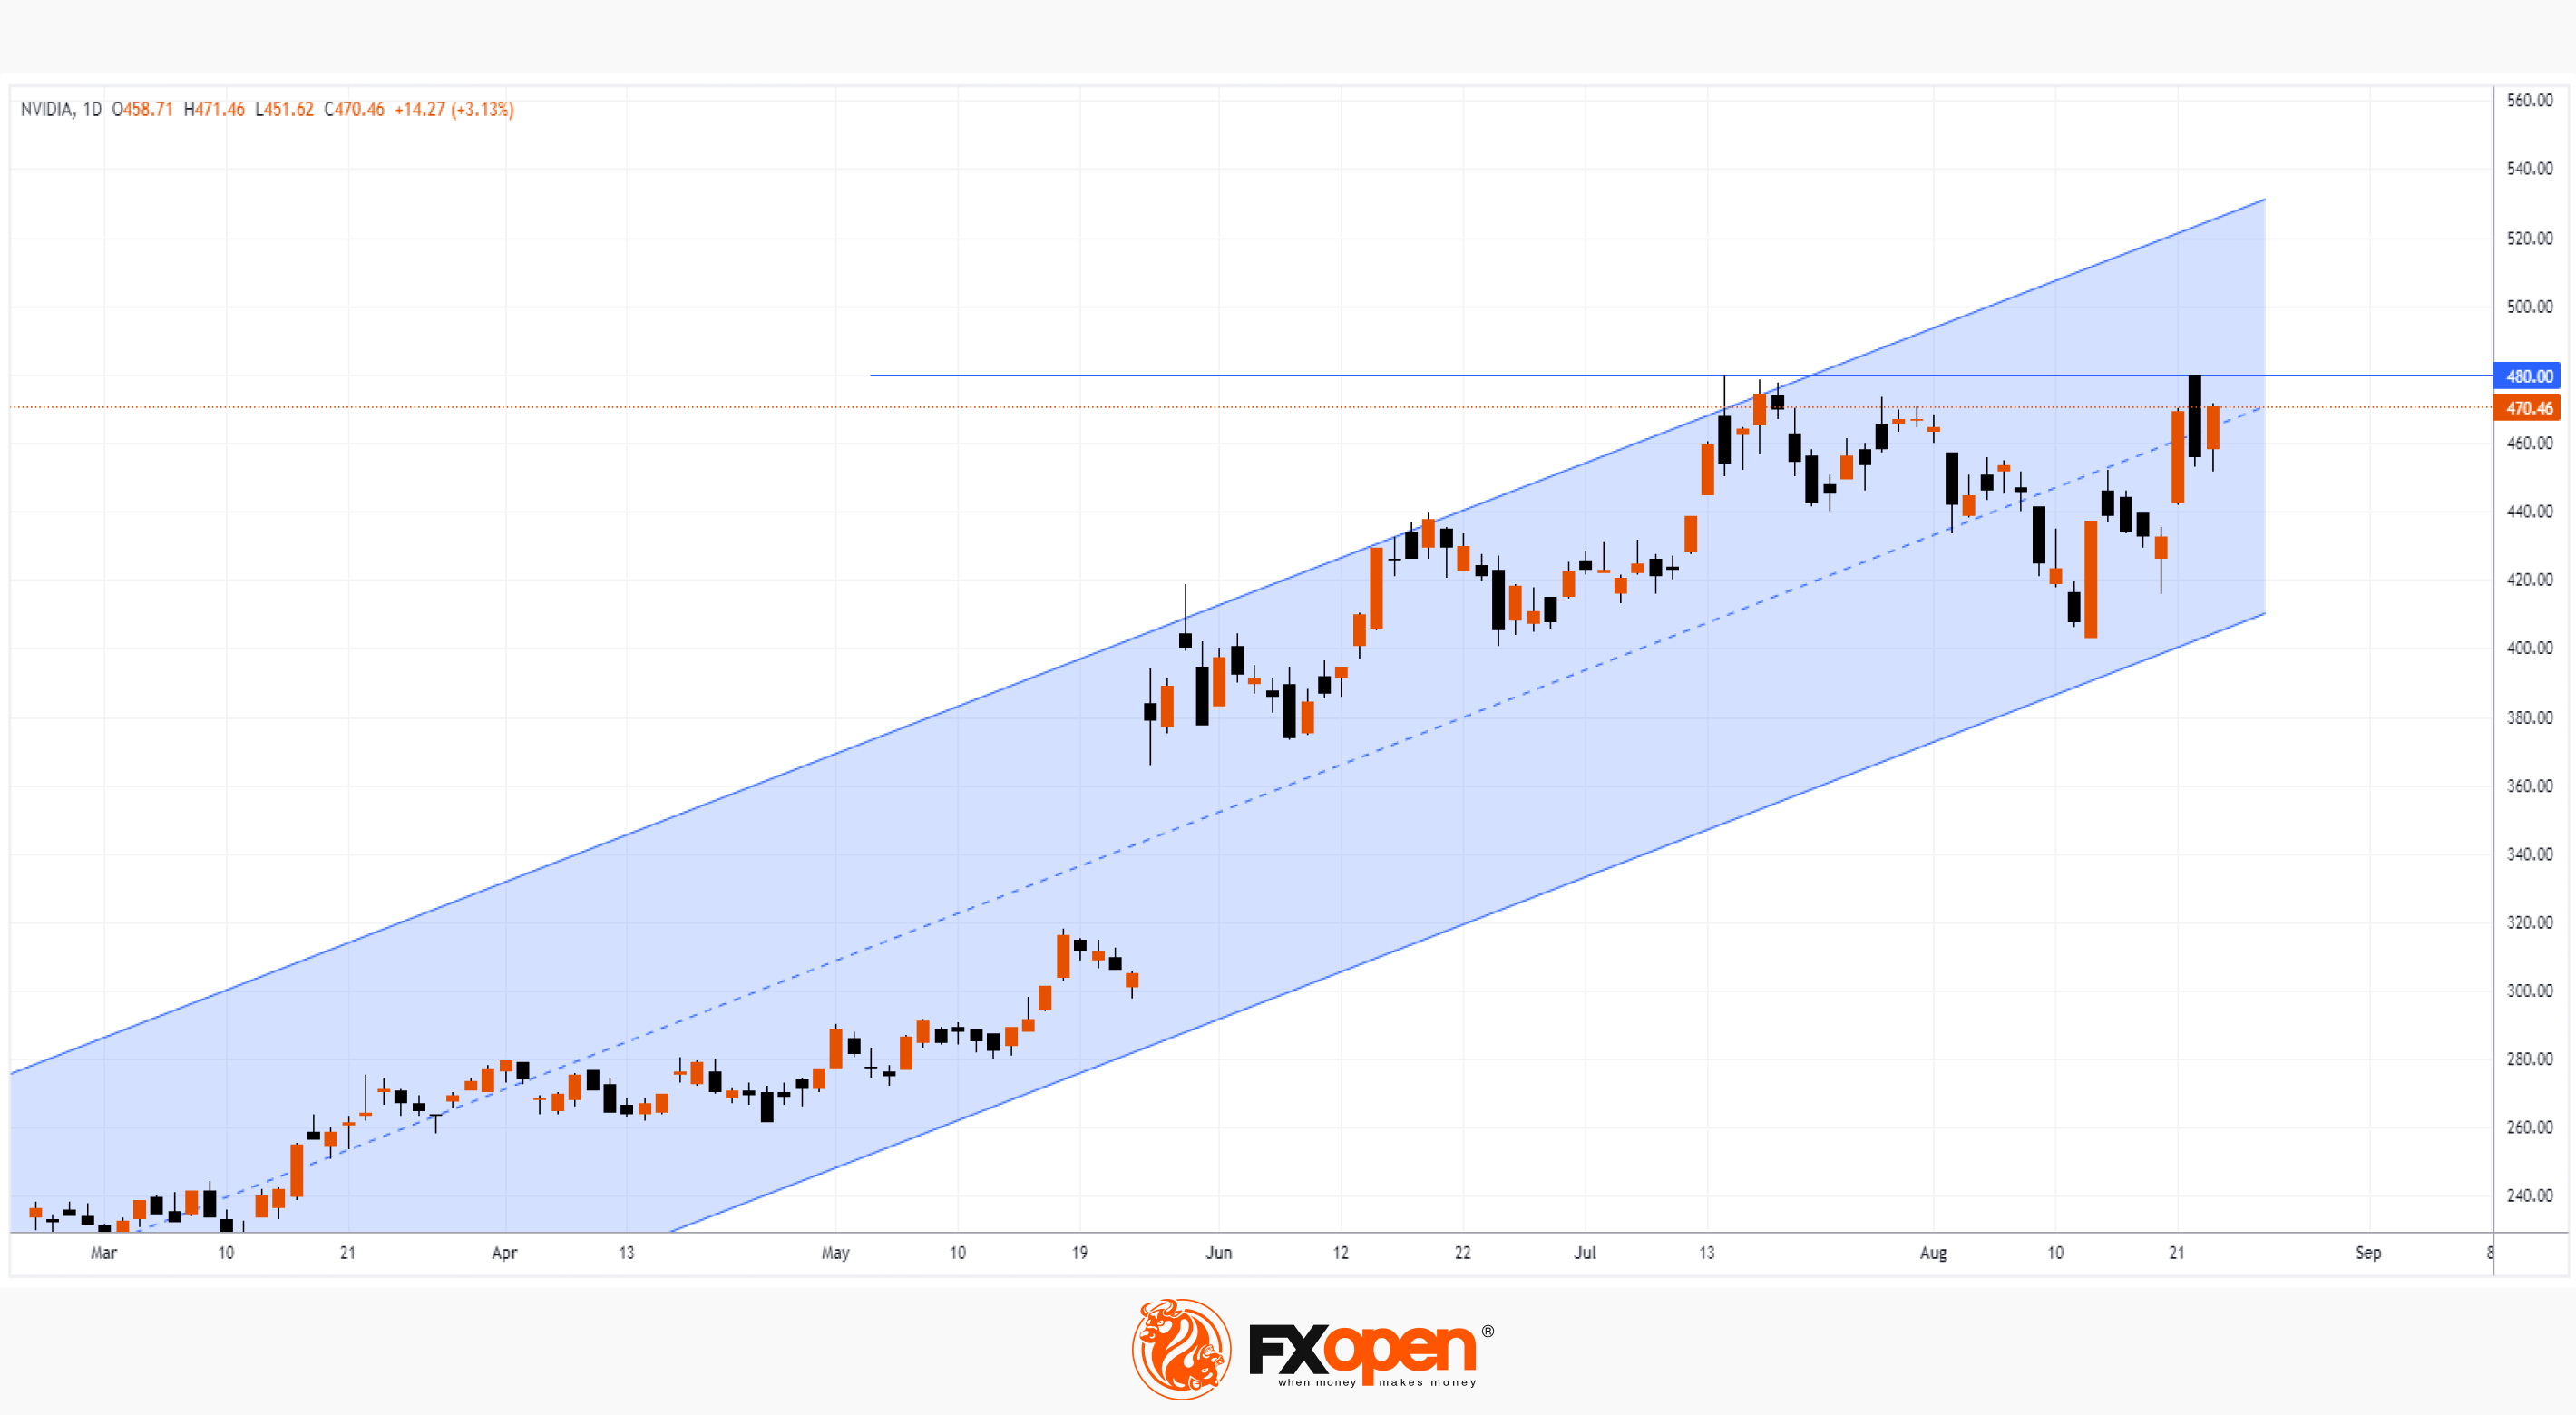
→ the price of NVDA shares exceeded the level of USD 480, which previously served as resistance. Now support can be expected at this level.
→ Also, a gap, which should be formed at the opening of today's session, will certainly be able to provide support.
Bearish arguments:
→ resistance to the growth of the NVDA share price may be provided by the upper limit of the rising channel. It is possible that after the emotions from the strong report subside, there will be a correction — as an option, with a test of the psychological level of USD 500 per share.
To benefit from rising tech stock prices in the age of AI, consider enlisting the services of a trusted broker like FXOpen.
CFDs are complex instruments and come with a high risk of losing your money.
This article represents the opinion of the Companies operating under the FXOpen brand only. It is not to be construed as an offer, solicitation, or recommendation with respect to products and services provided by the Companies operating under the FXOpen brand, nor is it to be considered financial advice.
NVDA Analysis: Share Price Rises after Positive Report
Postmarket, NVDA jumped +9% to break the USD 500-per-share psychological level for the first time, supported by strong Q2 data:
→ earnings per share: USD 2.70 (expected USD 2.08);
→ company revenue: USD 13.5 bn (expected USD 11.2 bn);
→ 3Q revenue forecast: USD 16 billion
Nvidia also unveiled a USD 25 billion share buyback plan. Demand for NVDA shares also boosted stock prices of other AI-related tech giants: MSFT, GOOG, AMD.
Bullish arguments:
→ the report showed that interest in the topic of AI remains, and NVDA can be the main beneficiary of this progress. By some estimates, over the next 10 years, companies will spend USD 800 billion building and training their models.
→ the price of NVDA shares exceeded the level of USD 480, which previously served as resistance. Now support can be expected at this level.
→ Also, a gap, which should be formed at the opening of today's session, will certainly be able to provide support.
Bearish arguments:
→ resistance to the growth of the NVDA share price may be provided by the upper limit of the rising channel. It is possible that after the emotions from the strong report subside, there will be a correction — as an option, with a test of the psychological level of USD 500 per share.
To benefit from rising tech stock prices in the age of AI, consider enlisting the services of a trusted broker like FXOpen.
CFDs are complex instruments and come with a high risk of losing your money.
This article represents the opinion of the Companies operating under the FXOpen brand only. It is not to be construed as an offer, solicitation, or recommendation with respect to products and services provided by the Companies operating under the FXOpen brand, nor is it to be considered financial advice.
#oilprices #oilindustry #MarketNews
Market Analysis: The Price of WTI Oil Falls to August Minimum
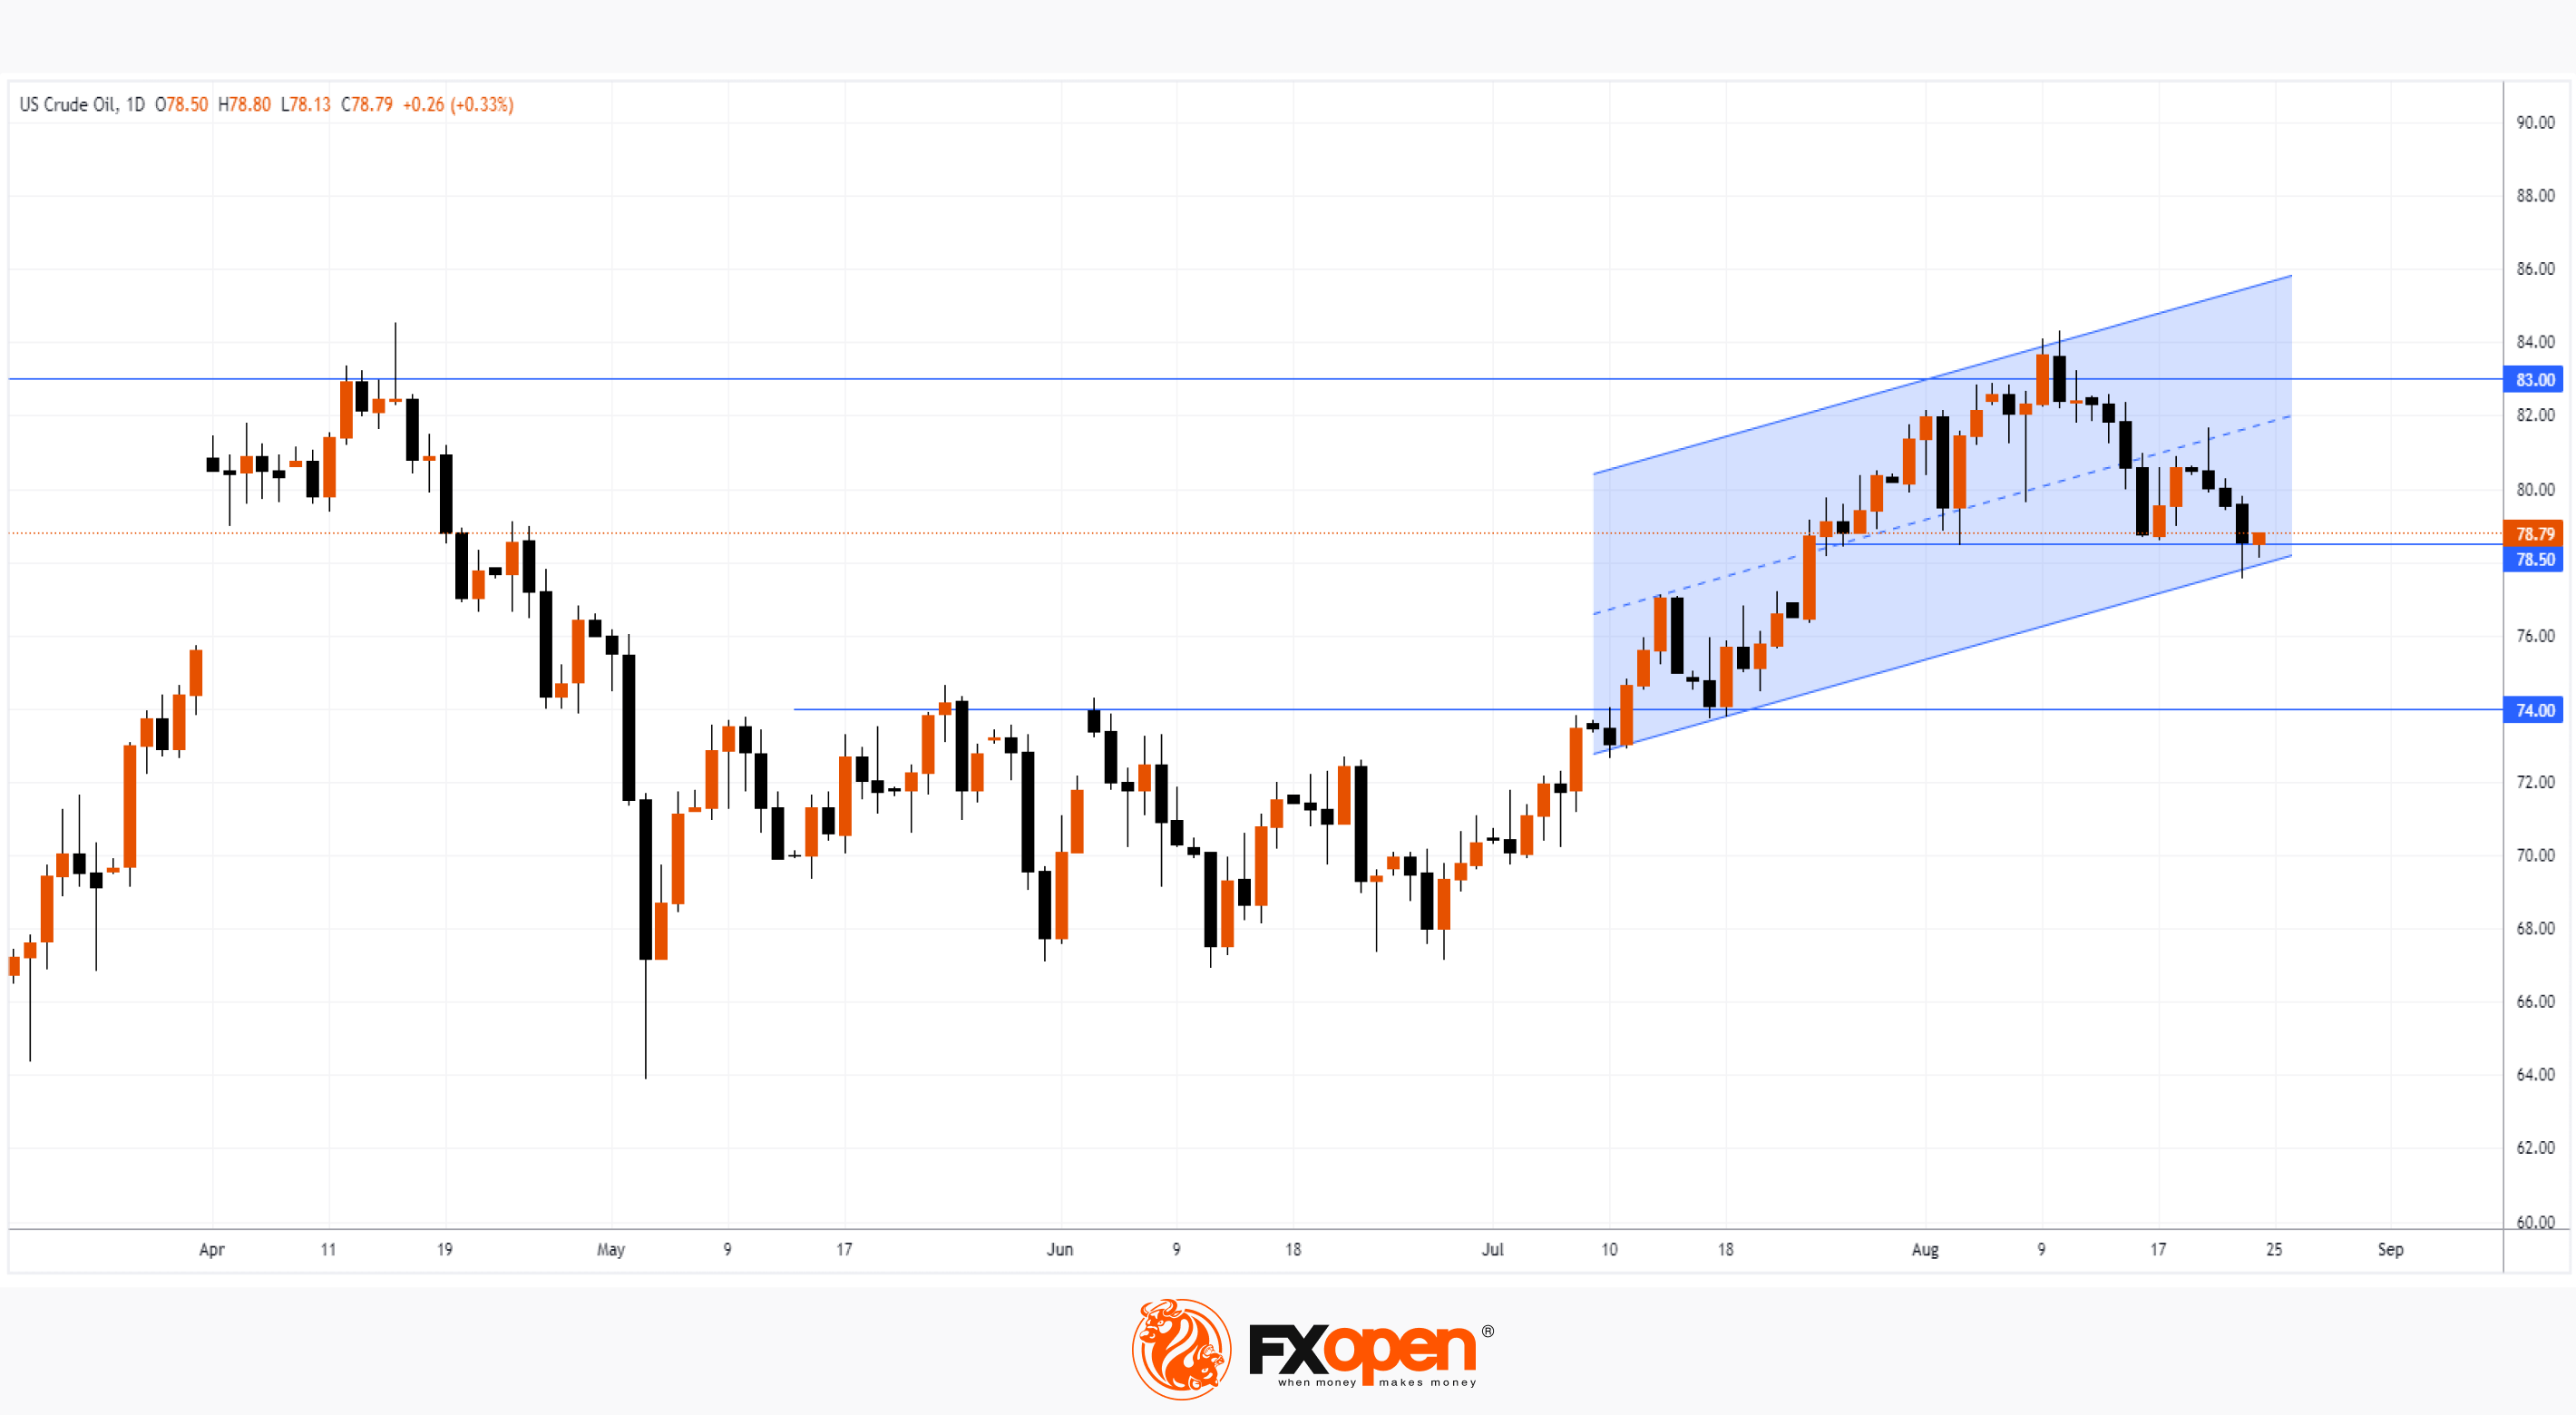
As the chart shows, US Crude Oil fell below USD 78 yesterday for the first time since July 25. This was facilitated by:
→ fears of a crisis that could follow from the collapse of the Chinese property developer Evergrande;
→ alarming PMI data from different economies. Japan reported a contraction in manufacturing activity for the third month in a row. Business activity in the euro area also fell more than expected, especially in Germany. Business activity in the US in August approached the point of stagnation, while growth was the weakest since February.
Bullish arguments:
→ The market has been bullish since July. And the current rollback from the top of July is just a correction.
→ The price of WTI Crude may find support from the lower border of the rising channel, as well as from the level of USD 78.50, from which the price has already formed bullish reversals in August.
→ The level of USD 74 looks like a reliable support.
Bearish arguments:
→ The USD 83 level has served as strong resistance throughout the year. This may be due to the fact that increasing the price above is not beneficial for governments and central banks that are fighting inflation.
→ A candle with a long upper shadow on August 21 (followed by 2 more bearish candles) indicates bearish activity.
To benefit from fluctuations in the price of WTI oil, consider enlisting the services of a trusted broker like FXOpen.
CFDs are complex instruments and come with a high risk of losing your money.
This article represents the opinion of the Companies operating under the FXOpen brand only. It is not to be construed as an offer, solicitation, or recommendation with respect to products and services provided by the Companies operating under the FXOpen brand, nor is it to be considered financial advice.
Market Analysis: The Price of WTI Oil Falls to August Minimum
As the chart shows, US Crude Oil fell below USD 78 yesterday for the first time since July 25. This was facilitated by:
→ fears of a crisis that could follow from the collapse of the Chinese property developer Evergrande;
→ alarming PMI data from different economies. Japan reported a contraction in manufacturing activity for the third month in a row. Business activity in the euro area also fell more than expected, especially in Germany. Business activity in the US in August approached the point of stagnation, while growth was the weakest since February.
Bullish arguments:
→ The market has been bullish since July. And the current rollback from the top of July is just a correction.
→ The price of WTI Crude may find support from the lower border of the rising channel, as well as from the level of USD 78.50, from which the price has already formed bullish reversals in August.
→ The level of USD 74 looks like a reliable support.
Bearish arguments:
→ The USD 83 level has served as strong resistance throughout the year. This may be due to the fact that increasing the price above is not beneficial for governments and central banks that are fighting inflation.
→ A candle with a long upper shadow on August 21 (followed by 2 more bearish candles) indicates bearish activity.
To benefit from fluctuations in the price of WTI oil, consider enlisting the services of a trusted broker like FXOpen.
CFDs are complex instruments and come with a high risk of losing your money.
This article represents the opinion of the Companies operating under the FXOpen brand only. It is not to be construed as an offer, solicitation, or recommendation with respect to products and services provided by the Companies operating under the FXOpen brand, nor is it to be considered financial advice.
#gbpusd #forexmarket #tradingforex
Market Analysis: GBP/USD Bounces Back after Falling 1% in One Day
The publication of news on the UK PMI index yesterday signaled an acceleration of the downturn in business activity. The index value was 42.5 (values below 50 indicate a slowdown in the economy). This is the thirteenth consecutive reading of the index below 50, with readings below 42.5 last recorded during the height of the pandemic in the spring of 2020.
The first reaction to the news was a sharp drop in the GBP/USD rate, but by the end of the trading session, the rate recovered, which can be considered evidence of strong demand.
More bullish arguments are given by the analysis of the volumes of trading in futures for the British pound on the CME exchange:
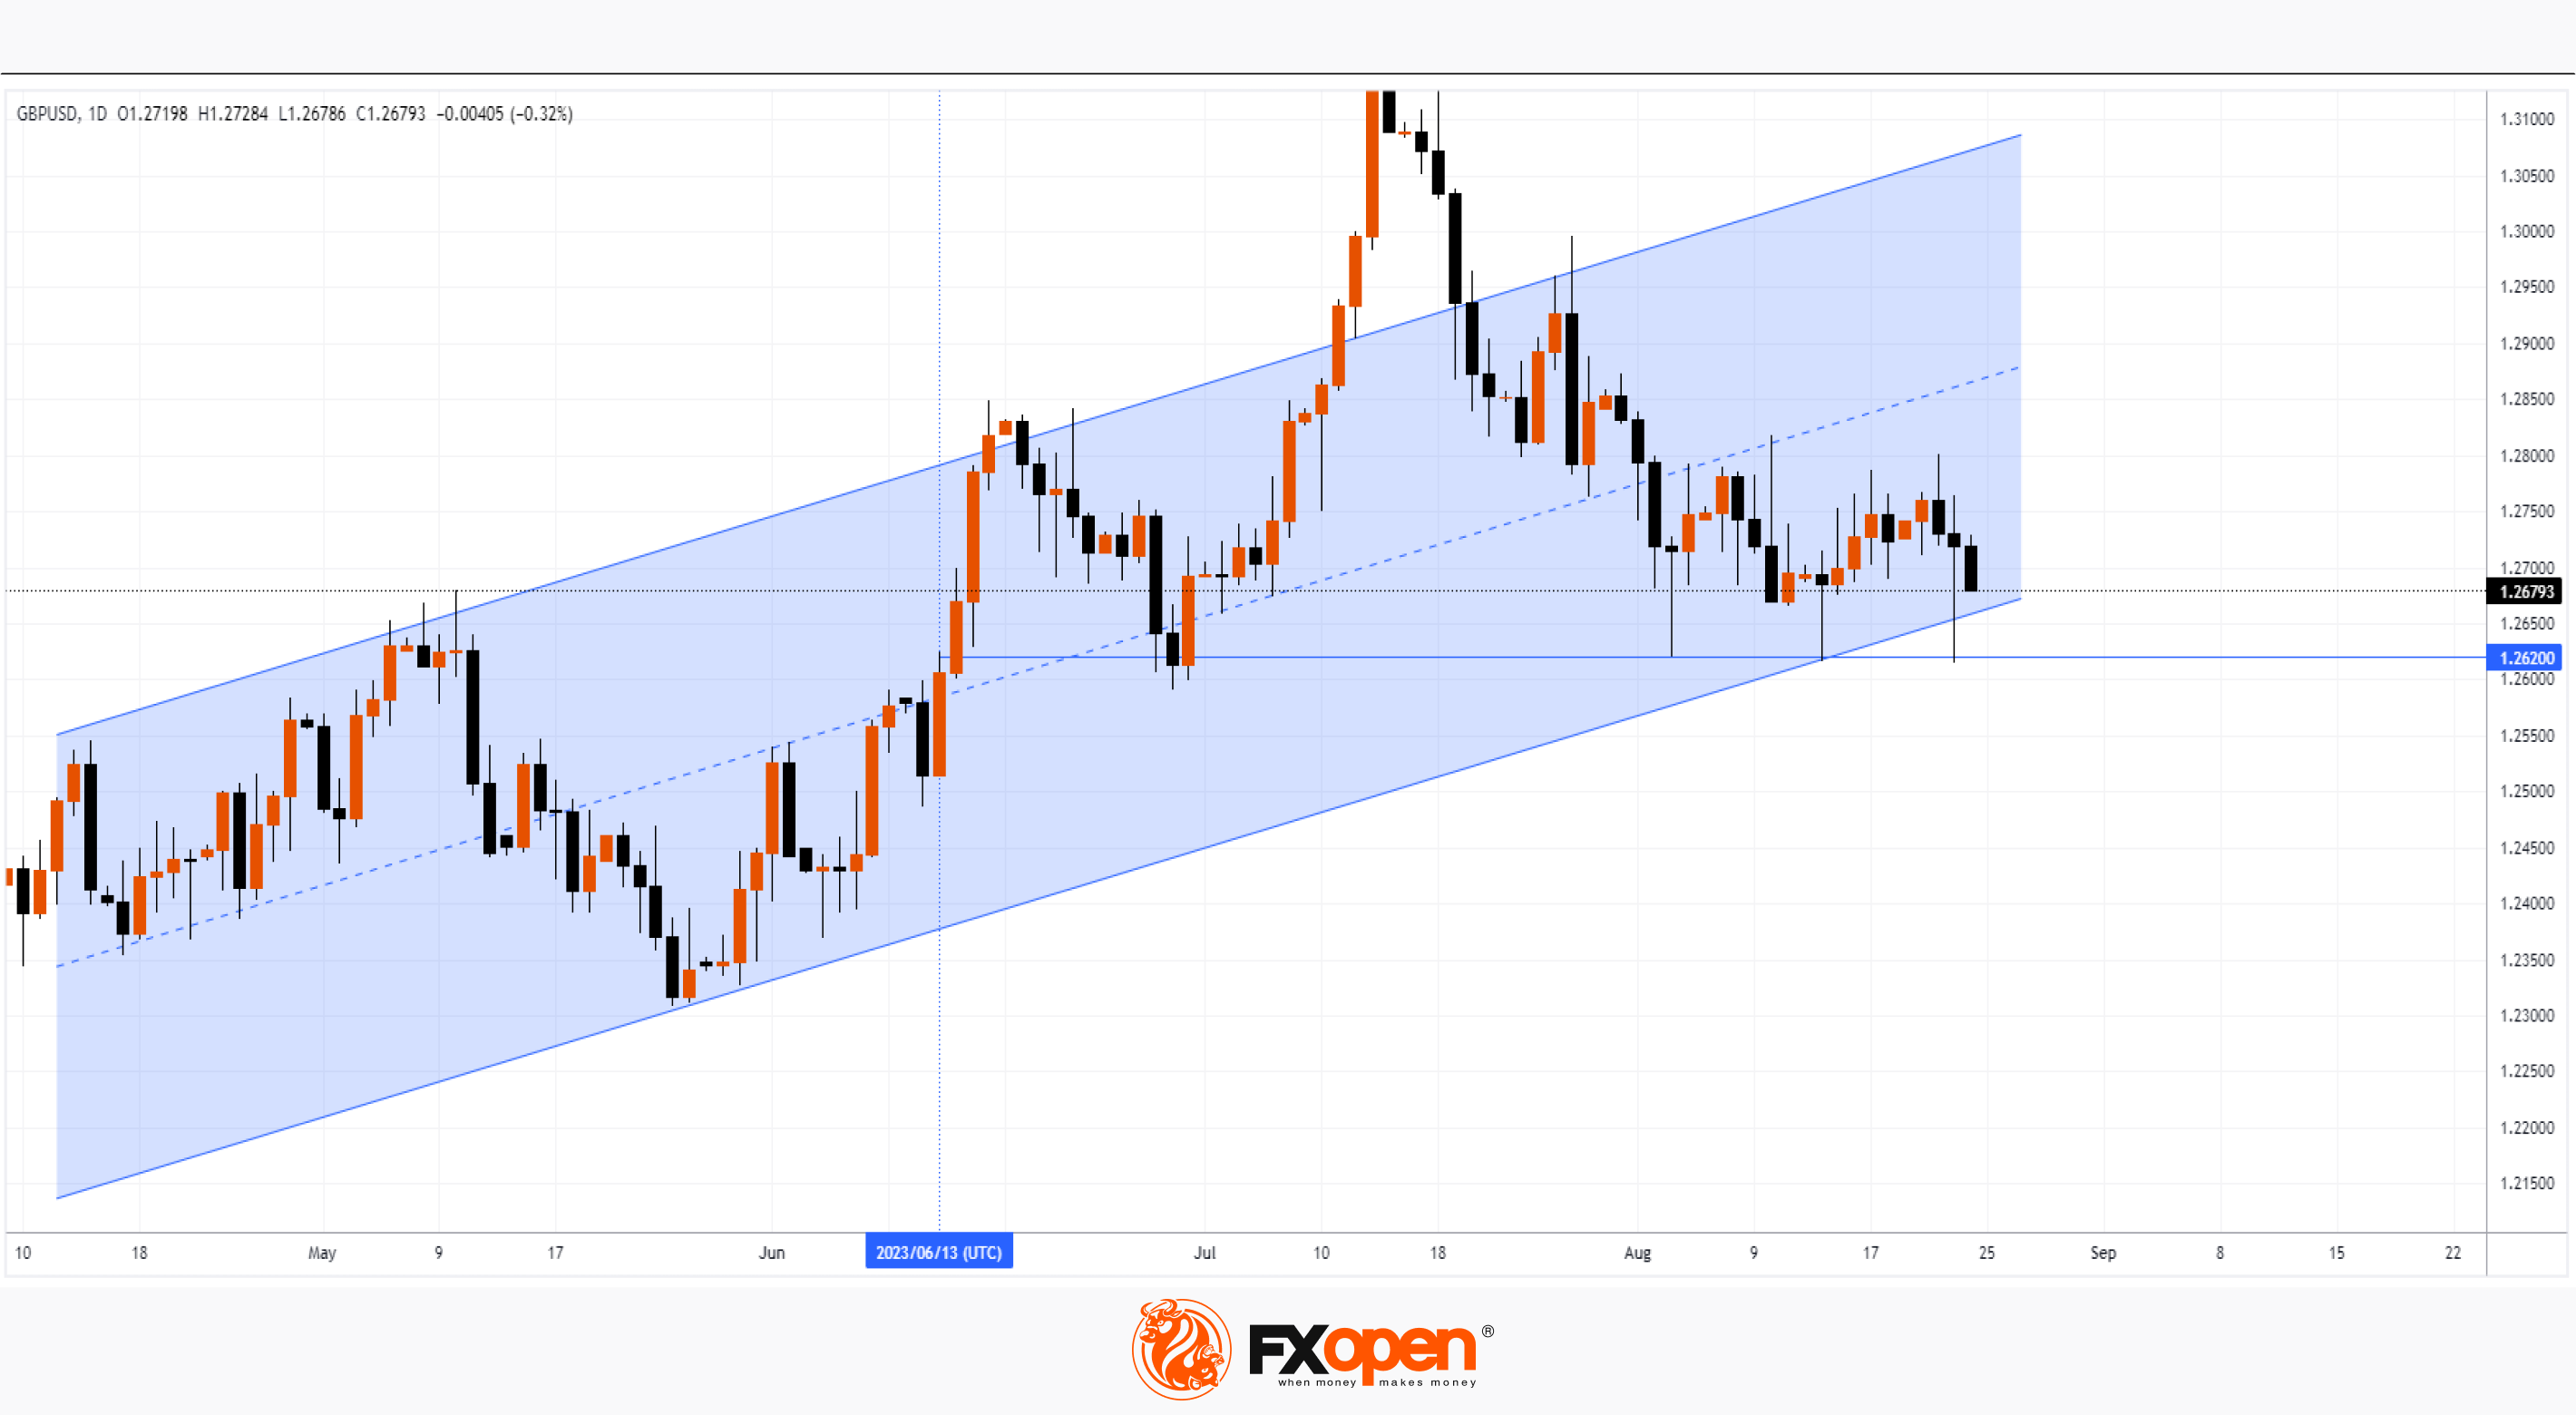
→ the largest trading volumes for the year were recorded on June 13 (more than 240k contracts were traded at an average of about 100k per day). If you draw a horizontal level from the high of this candle at 1.262, you will see how it acts as support;
→ yesterday, extremely high volumes (more than 155k contracts) were recorded again on a candle with a long lower shadow. That is, high volumes, reflecting the activity of large players, may indicate the relevance of demand for the pound at a price of 1.262.
Moreover, the pound is near the lower border of the rising channel.
Bearish arguments:
→ Since mid-July, the GBP/USD rate has shown a bearish trend. And if there is a breakdown of the level of 1.262, where large volumes were noticed, this will be an important confirmation of the superiority of sellers.
→ Fundamentally, the UK economy looks weaker than the rest, including due to higher inflation rates, which makes the prospects for the pound vague.
To benefit from the fluctuations in the GBP/USD rate, consider enlisting the services of a trusted broker like FXOpen.
CFDs are complex instruments and come with a high risk of losing your money.
This article represents the opinion of the Companies operating under the FXOpen brand only. It is not to be construed as an offer, solicitation, or recommendation with respect to products and services provided by the Companies operating under the FXOpen brand, nor is it to be considered financial advice.
Market Analysis: GBP/USD Bounces Back after Falling 1% in One Day
The publication of news on the UK PMI index yesterday signaled an acceleration of the downturn in business activity. The index value was 42.5 (values below 50 indicate a slowdown in the economy). This is the thirteenth consecutive reading of the index below 50, with readings below 42.5 last recorded during the height of the pandemic in the spring of 2020.
The first reaction to the news was a sharp drop in the GBP/USD rate, but by the end of the trading session, the rate recovered, which can be considered evidence of strong demand.
More bullish arguments are given by the analysis of the volumes of trading in futures for the British pound on the CME exchange:
→ the largest trading volumes for the year were recorded on June 13 (more than 240k contracts were traded at an average of about 100k per day). If you draw a horizontal level from the high of this candle at 1.262, you will see how it acts as support;
→ yesterday, extremely high volumes (more than 155k contracts) were recorded again on a candle with a long lower shadow. That is, high volumes, reflecting the activity of large players, may indicate the relevance of demand for the pound at a price of 1.262.
Moreover, the pound is near the lower border of the rising channel.
Bearish arguments:
→ Since mid-July, the GBP/USD rate has shown a bearish trend. And if there is a breakdown of the level of 1.262, where large volumes were noticed, this will be an important confirmation of the superiority of sellers.
→ Fundamentally, the UK economy looks weaker than the rest, including due to higher inflation rates, which makes the prospects for the pound vague.
To benefit from the fluctuations in the GBP/USD rate, consider enlisting the services of a trusted broker like FXOpen.
CFDs are complex instruments and come with a high risk of losing your money.
This article represents the opinion of the Companies operating under the FXOpen brand only. It is not to be construed as an offer, solicitation, or recommendation with respect to products and services provided by the Companies operating under the FXOpen brand, nor is it to be considered financial advice.
#marketanalysis #gasprice #naturalgas
Market Analysis: Is the Price of Natural Gas Forming a New Trend?
The US Energy Information Administration said on Thursday that natural gas inventories in US storage rose by 18 billion cubic feet in the week ended Aug. 18. That was below the 29 billion cubic feet increase forecast by analysts polled by S&P Global Commodity Insights.
It is possible that market participants thought that insufficient filling of storage facilities will lead to a rise in gas prices in the coming winter. According to the forecast of the International Energy Agency (IEA), the price of gas will peak at USD 3.44/MMBtu in December 2023 (approximately +36% from current levels).
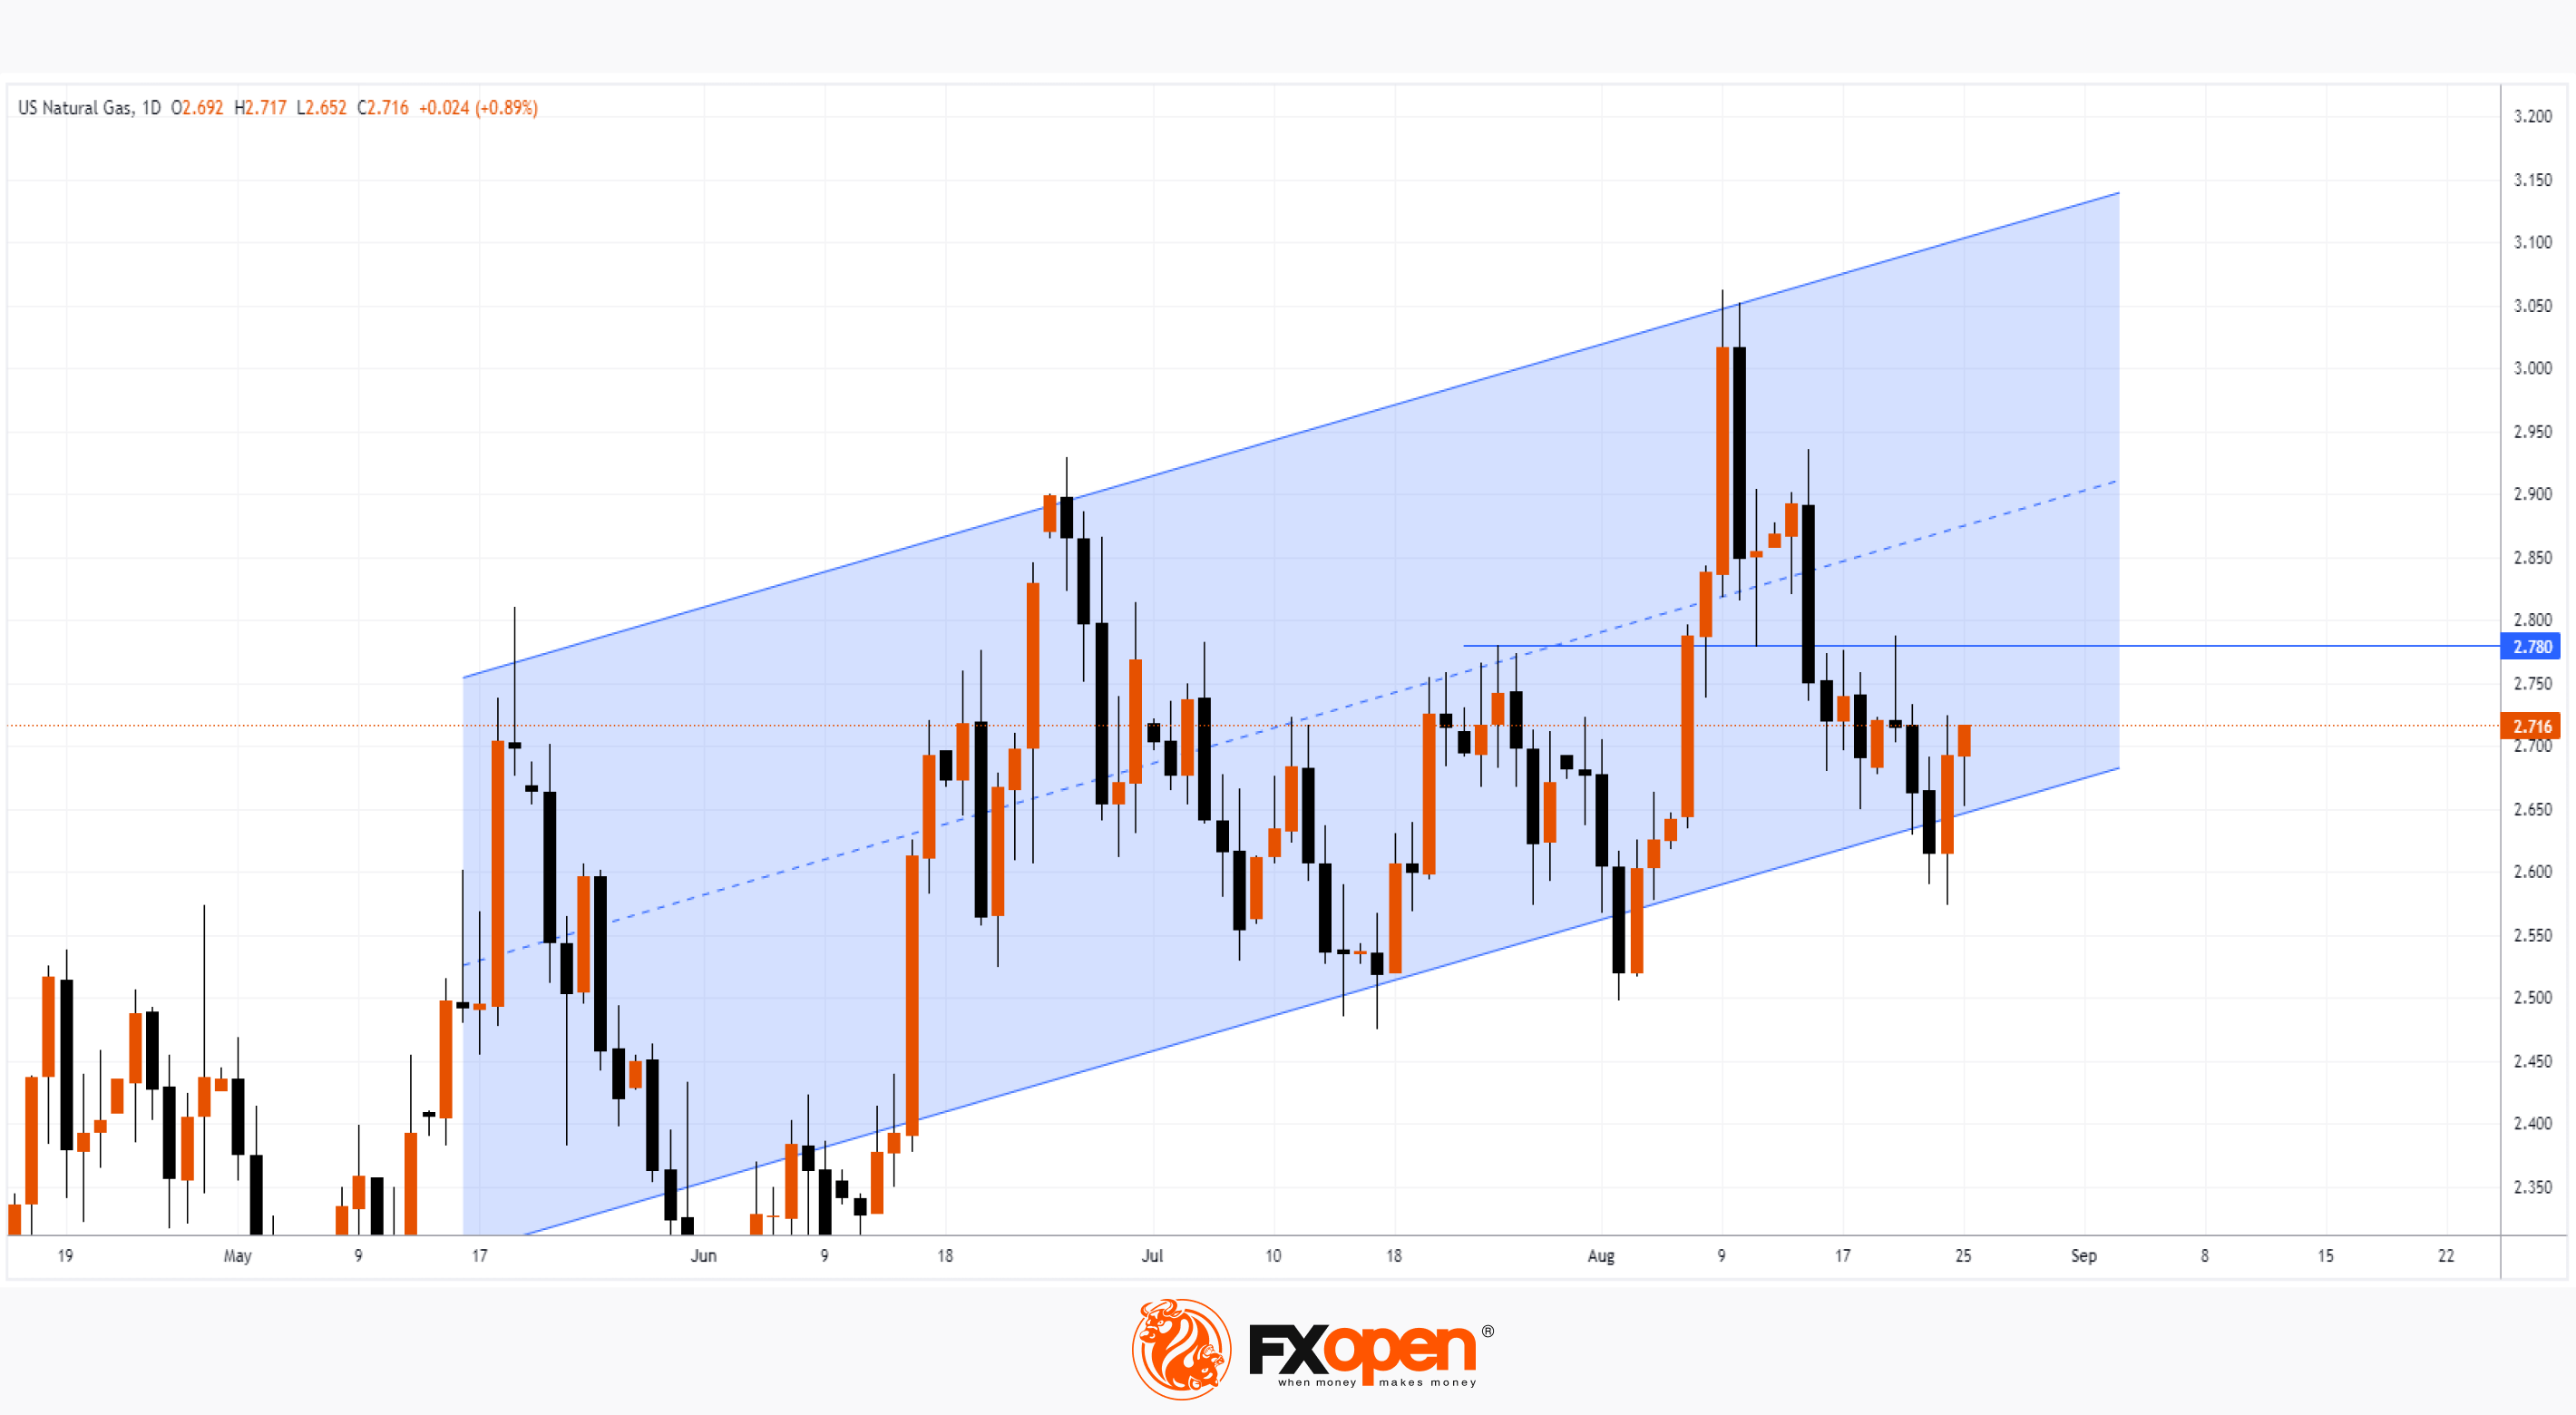
The natural gas price chart shows that:
→ in July-August, a series of rising supports was formed;
→ the peak of August is higher than the peak of June, which in turn is higher than the peak of May.
A sequence of higher extremes could indicate that the market is in an uptrend that could bring the price closer to the IEA's price targets. The nearest resistance on this way is the level of 2.78, which in July-August repeatedly influenced the price dynamics.
To benefit from the fluctuations in the cost of natural gas, consider enlisting the services of a trusted broker like FXOpen.
CFDs are complex instruments and come with a high risk of losing your money.
This article represents the opinion of the Companies operating under the FXOpen brand only. It is not to be construed as an offer, solicitation, or recommendation with respect to products and services provided by the Companies operating under the FXOpen brand, nor is it to be considered financial advice.
Market Analysis: Is the Price of Natural Gas Forming a New Trend?
The US Energy Information Administration said on Thursday that natural gas inventories in US storage rose by 18 billion cubic feet in the week ended Aug. 18. That was below the 29 billion cubic feet increase forecast by analysts polled by S&P Global Commodity Insights.
It is possible that market participants thought that insufficient filling of storage facilities will lead to a rise in gas prices in the coming winter. According to the forecast of the International Energy Agency (IEA), the price of gas will peak at USD 3.44/MMBtu in December 2023 (approximately +36% from current levels).
The natural gas price chart shows that:
→ in July-August, a series of rising supports was formed;
→ the peak of August is higher than the peak of June, which in turn is higher than the peak of May.
A sequence of higher extremes could indicate that the market is in an uptrend that could bring the price closer to the IEA's price targets. The nearest resistance on this way is the level of 2.78, which in July-August repeatedly influenced the price dynamics.
To benefit from the fluctuations in the cost of natural gas, consider enlisting the services of a trusted broker like FXOpen.
CFDs are complex instruments and come with a high risk of losing your money.
This article represents the opinion of the Companies operating under the FXOpen brand only. It is not to be construed as an offer, solicitation, or recommendation with respect to products and services provided by the Companies operating under the FXOpen brand, nor is it to be considered financial advice.
#marketnews #eurusd #stocktrading #gbpusd
Weekly Market Wrap With Gary Thomson: EUR/USD, GBP/USD, NVDA SHARE PRICE RISES, WTI OIL GO MINIMUM
Get the latest scoop on the week's hottest headlines, all in one convenient video. Join Gary Thomson, the COO of FXOpen UK, as he breaks down the most significant news reports and shares his expert insights.
🔸 EUR/USD: Price is forming a rebound from the support of 1.085
🔸 NVDA share price rises after positive report
🔸 The price of WTI oil falls to August minimum
🔸 GBP/USD bounces back after falling 1% in one day
Stay in the know and empower yourself with our short, yet power-packed video. Watch it now and stay updated with FXOpen.
Don't miss out on this invaluable opportunity to sharpen your trading skills and make informed decisions.
https://cutt.ly/pwjE19FS
To take advantage of price fluctuations in the foreign exchange markets, consider enlisting the services of a reliable broker like FXOpen.
⚠️
This forecast represents FXOpen Companies opinion only, it should not be construed as an offer, invitation or recommendation in respect to FXOpen Companies products and services or as financial advice
Weekly Market Wrap With Gary Thomson: EUR/USD, GBP/USD, NVDA SHARE PRICE RISES, WTI OIL GO MINIMUM
Get the latest scoop on the week's hottest headlines, all in one convenient video. Join Gary Thomson, the COO of FXOpen UK, as he breaks down the most significant news reports and shares his expert insights.
🔸 EUR/USD: Price is forming a rebound from the support of 1.085
🔸 NVDA share price rises after positive report
🔸 The price of WTI oil falls to August minimum
🔸 GBP/USD bounces back after falling 1% in one day
Stay in the know and empower yourself with our short, yet power-packed video. Watch it now and stay updated with FXOpen.
Don't miss out on this invaluable opportunity to sharpen your trading skills and make informed decisions.
https://cutt.ly/pwjE19FS
To take advantage of price fluctuations in the foreign exchange markets, consider enlisting the services of a reliable broker like FXOpen.
⚠️
This forecast represents FXOpen Companies opinion only, it should not be construed as an offer, invitation or recommendation in respect to FXOpen Companies products and services or as financial advice
YouTube
Weekly Market Wrap With Gary Thomson: EUR/USD, GBP/USD, NVDA SHARE PRICE RISES, WTI OIL GO MINIMUM
Get the latest scoop on the week's hottest headlines, all in one convenient video. Join Gary Thomson, the COO of FXOpen UK, as he breaks down the most significant news reports and shares his expert insights.
- EUR/USD: Price is forming a rebound from the…
- EUR/USD: Price is forming a rebound from the…
#MarketNews #sp500 #stockmarket
Market Analysis: E-mini S&P 500 Reacts Positively to Powell's Speech
According to the head of the Fed's Friday words:
→ Strengthening the economy may lead to rising inflation and require new increases;
→ the Fed will tread lightly in upcoming meetings;
→ the Fed is ready to continue raising rates if necessary.
Overall, there were no surprises and the surge in financial market volatility was relatively minor. The dollar index rose sharply, but then by the end of the trading week it gradually decreased — the fact that the bulls could not keep the progress made can be interpreted as a bearish sign due to the emotions of market participants during the speech of the head of the Fed.
And gold, on the contrary, decreased in price, but then won back the losses. The stock market works in a similar way.
The S&P 500 Index chart shows that:
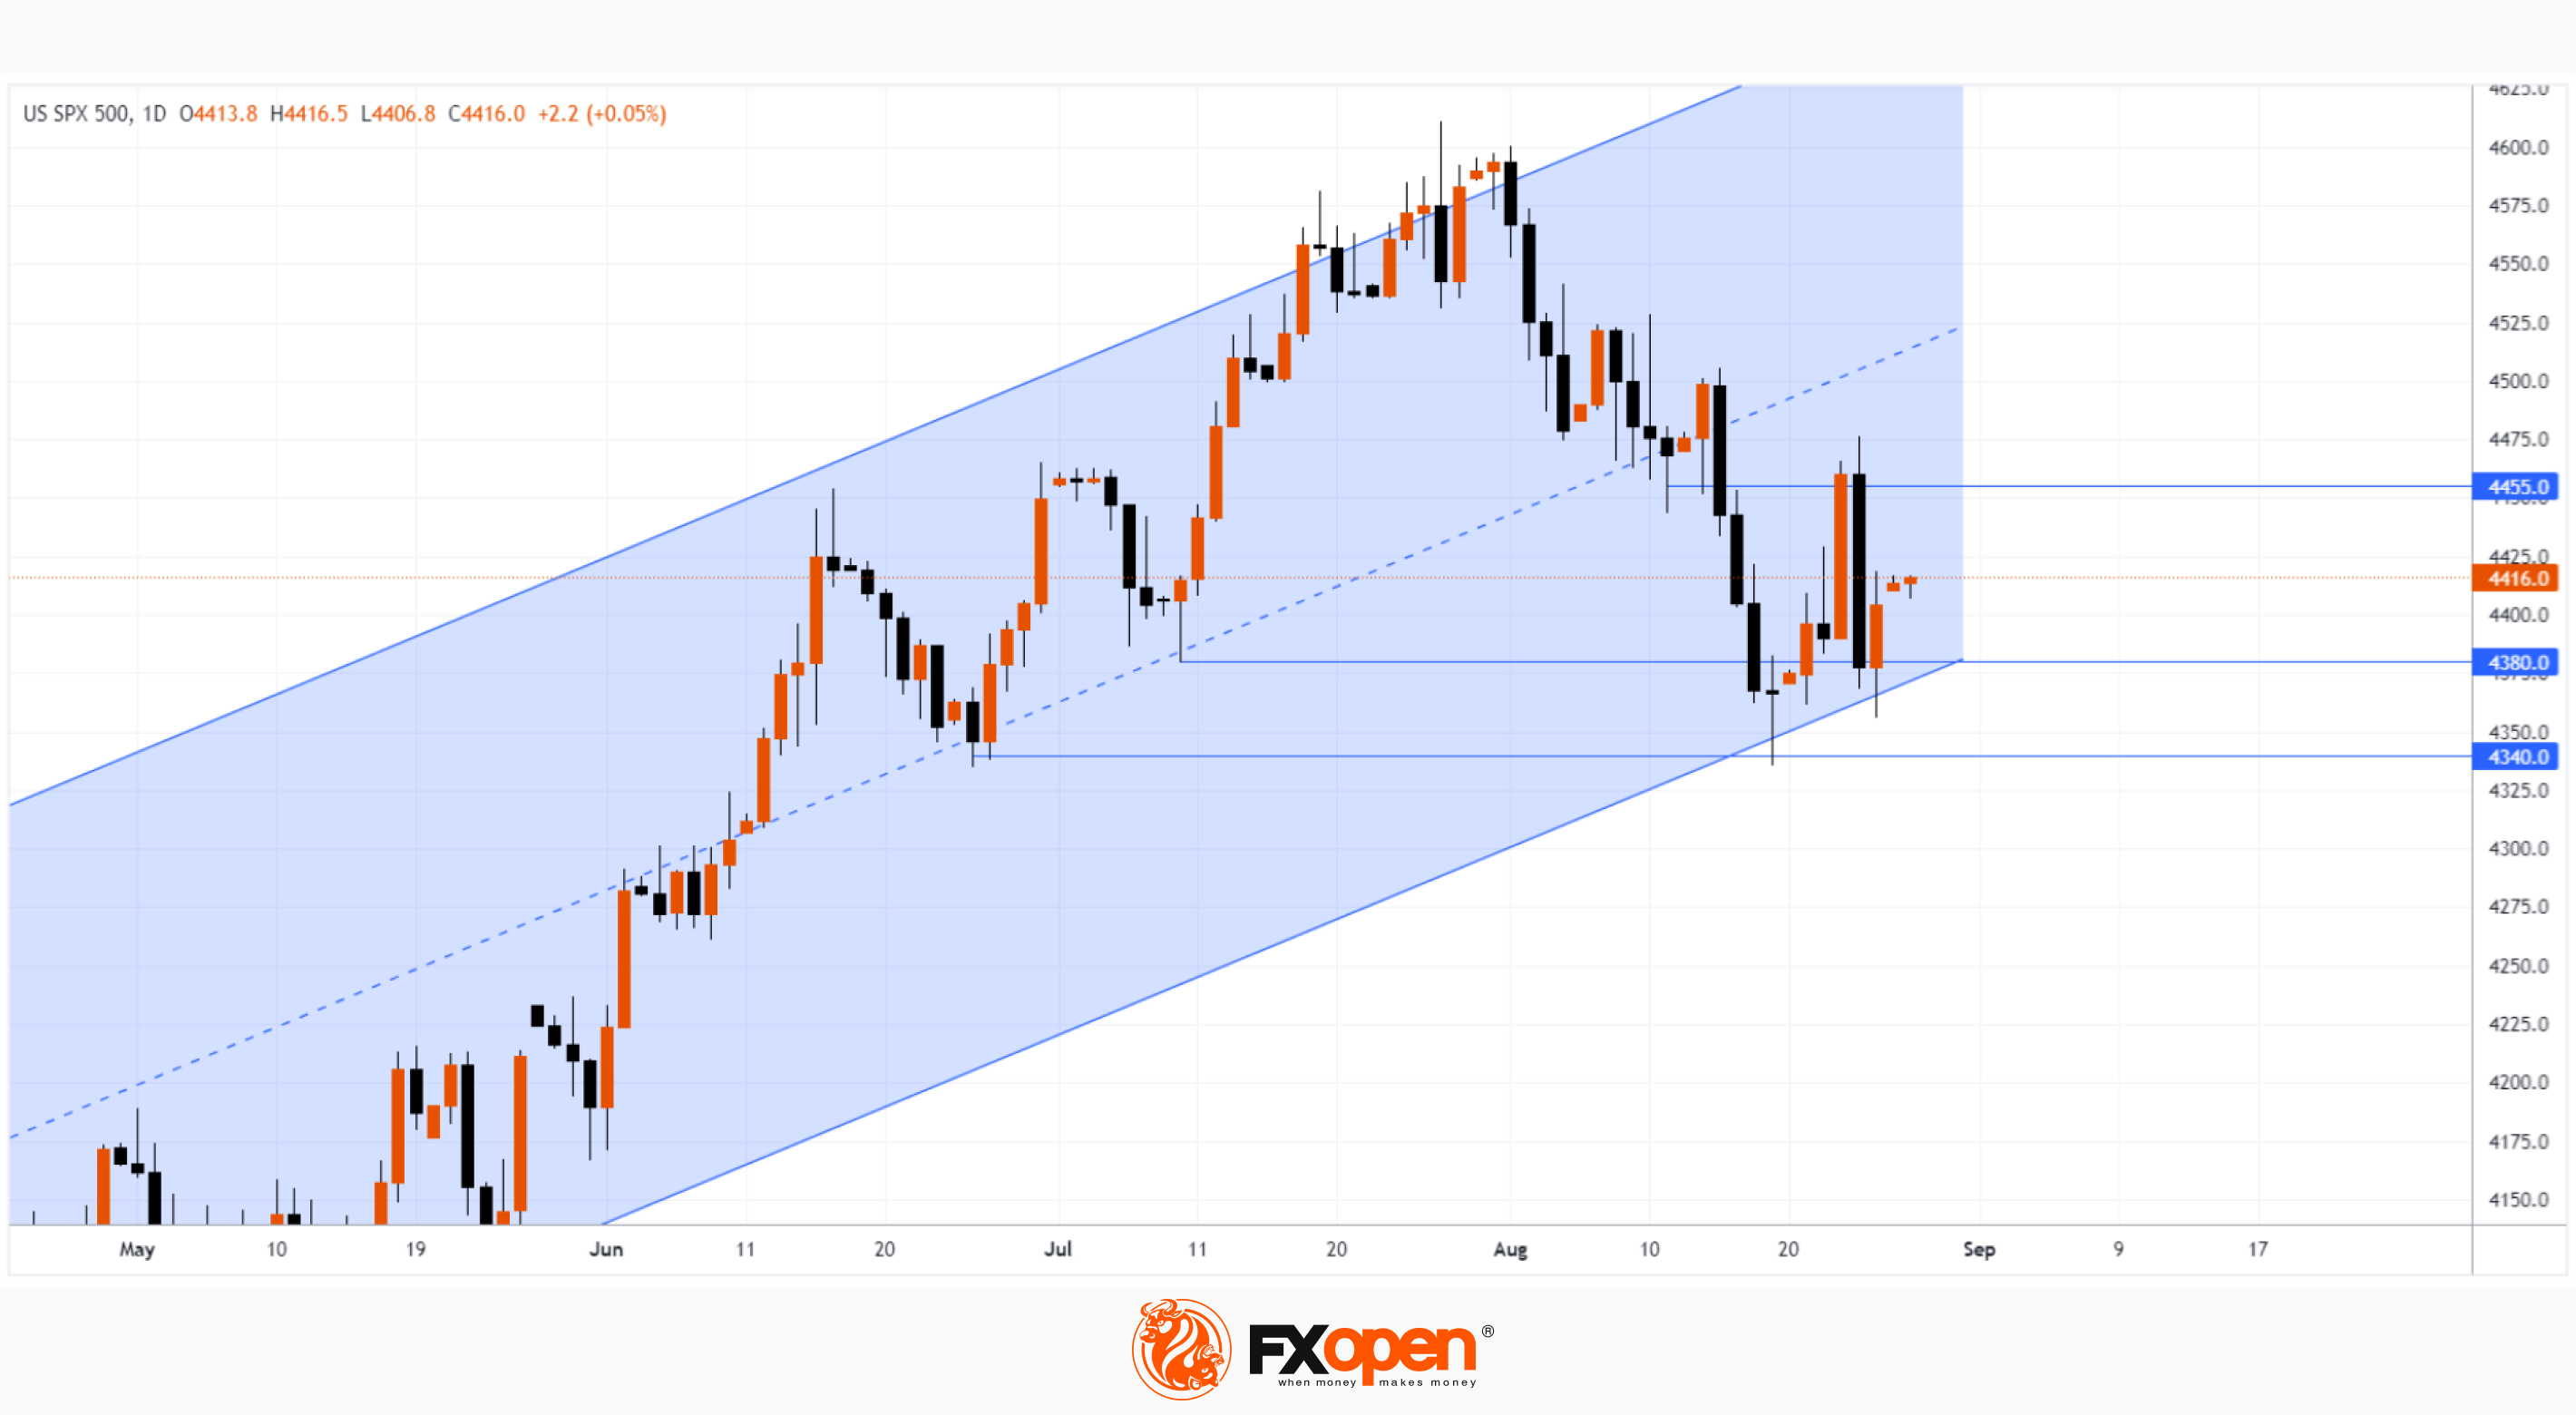
→ the price of the index finds support in the 4,340-4,380 zone, where the June-July lows were formed;
→ price support is also noticeable from the lower border of the rising channel, which has been operating all summer;
→ the week started near Friday's high – that is, after the weekend, market participants find positivity after the Friday speech of the head of the Fed.
However, the overall picture is thickening with broad bearish impulses:
→ August 15-18;
→ 24th August.
It is possible that supply and demand can find a balance so that the price of the S&P 500 index will consolidate within the range, which is limited by the 4,340-4,380 zone from below and the resistance level of 4,455 from above.
To benefit from the fluctuations in the price of the S&P 500 index, consider enlisting the services of a trusted broker like FXOpen.
CFDs are complex instruments and come with a high risk of losing your money.
This article represents the opinion of the Companies operating under the FXOpen brand only. It is not to be construed as an offer, solicitation, or recommendation with respect to products and services provided by the Companies operating under the FXOpen brand, nor is it to be considered financial advice.
Market Analysis: E-mini S&P 500 Reacts Positively to Powell's Speech
According to the head of the Fed's Friday words:
→ Strengthening the economy may lead to rising inflation and require new increases;
→ the Fed will tread lightly in upcoming meetings;
→ the Fed is ready to continue raising rates if necessary.
Overall, there were no surprises and the surge in financial market volatility was relatively minor. The dollar index rose sharply, but then by the end of the trading week it gradually decreased — the fact that the bulls could not keep the progress made can be interpreted as a bearish sign due to the emotions of market participants during the speech of the head of the Fed.
And gold, on the contrary, decreased in price, but then won back the losses. The stock market works in a similar way.
The S&P 500 Index chart shows that:
→ the price of the index finds support in the 4,340-4,380 zone, where the June-July lows were formed;
→ price support is also noticeable from the lower border of the rising channel, which has been operating all summer;
→ the week started near Friday's high – that is, after the weekend, market participants find positivity after the Friday speech of the head of the Fed.
However, the overall picture is thickening with broad bearish impulses:
→ August 15-18;
→ 24th August.
It is possible that supply and demand can find a balance so that the price of the S&P 500 index will consolidate within the range, which is limited by the 4,340-4,380 zone from below and the resistance level of 4,455 from above.
To benefit from the fluctuations in the price of the S&P 500 index, consider enlisting the services of a trusted broker like FXOpen.
CFDs are complex instruments and come with a high risk of losing your money.
This article represents the opinion of the Companies operating under the FXOpen brand only. It is not to be construed as an offer, solicitation, or recommendation with respect to products and services provided by the Companies operating under the FXOpen brand, nor is it to be considered financial advice.
#forextrading #USDJPY #marketanalysis
Market Analysis: USD/JPY Rate Updates the High of the Year
Yesterday, USD/JPY hit 146.74 for the first time since November 2022. The rise in the rate is facilitated by the growing gap in the policies of central banks: while the Bank of Japan has kept the rate below zero since 2016, the Fed has been raising rates since the spring of 2022.
Moreover, on Friday, Powell said the Fed is ready to continue to remain tough in the fight against inflation. According to CME's FedWatch tool, there is now a 62% chance of a rate hike at the Fed's November meeting, up from 42% a week earlier.
However, the limiting factor for the USD/JPY rate is the power of the Japanese Ministry of Finance. Last year, when the market was at current levels, the authorities intervened in the foreign exchange market, lowering the rate to 140 yen per US dollar.
The USD/JPY chart shows that:
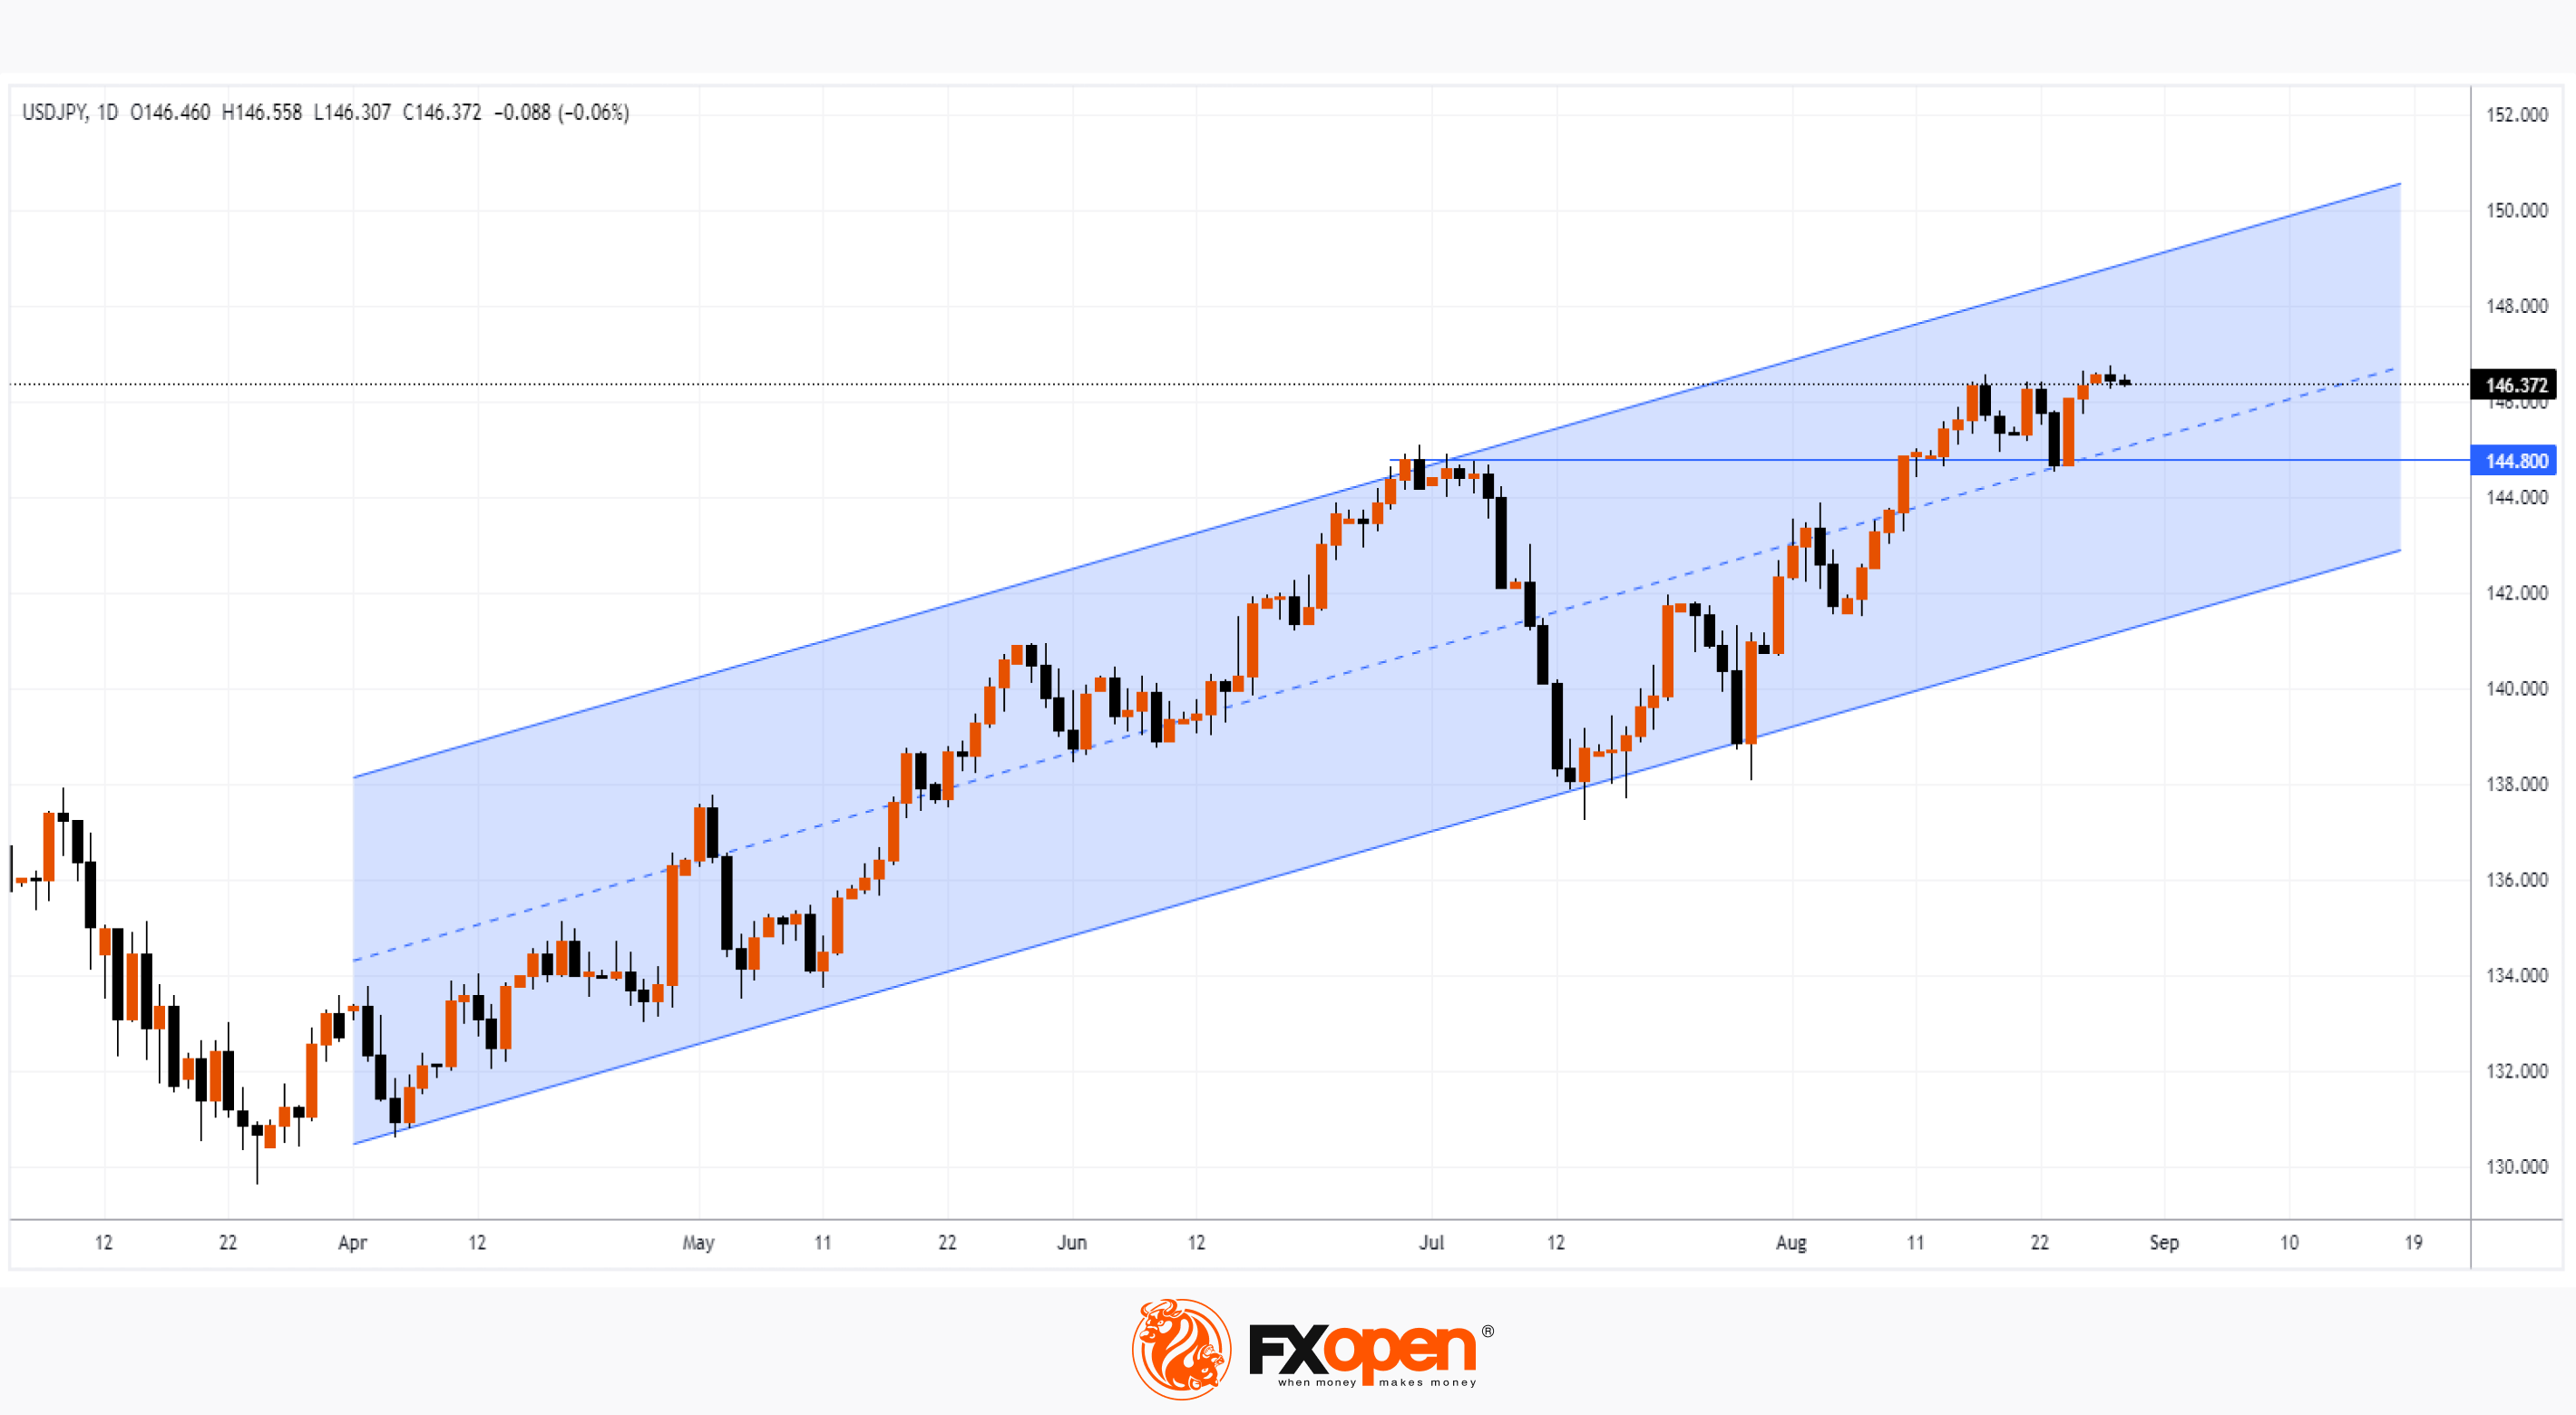
→ the price continues to move within the ascending channel;
→ on Friday, during Powell's speech, the median line was tested, confirming its influence as a support;
→ former resistance at 144.8 also provides support;
→ if the trend continues, the rate may reach the upper limit of the channel — that is, the psychological mark of 150 yen per US dollar.
However, if we analyze the progress of the bulls when reaching the tops, then we can assume that the bullish momentum is depleted: after all, bullish candles do not have a wide body when they reach the highs, but on the contrary, they shrink. For sure, the strength of buyers is limited by fears of new interventions. Therefore, it is possible that a series of cautious renewal of the highs of the year may be interrupted when the Japanese authorities have their say.
According to analysts at Goldman Sachs, the yen may weaken to 155 per US dollar if the Bank of Japan continues to adhere to its ultra-soft position.
To benefit from trends in the currency markets, consider enlisting the services of a trusted broker like FXOpen.
CFDs are complex instruments and come with a high risk of losing your money.
This article represents the opinion of the Companies operating under the FXOpen brand only. It is not to be construed as an offer, solicitation, or recommendation with respect to products and services provided by the Companies operating under the FXOpen brand, nor is it to be considered financial advice.
Market Analysis: USD/JPY Rate Updates the High of the Year
Yesterday, USD/JPY hit 146.74 for the first time since November 2022. The rise in the rate is facilitated by the growing gap in the policies of central banks: while the Bank of Japan has kept the rate below zero since 2016, the Fed has been raising rates since the spring of 2022.
Moreover, on Friday, Powell said the Fed is ready to continue to remain tough in the fight against inflation. According to CME's FedWatch tool, there is now a 62% chance of a rate hike at the Fed's November meeting, up from 42% a week earlier.
However, the limiting factor for the USD/JPY rate is the power of the Japanese Ministry of Finance. Last year, when the market was at current levels, the authorities intervened in the foreign exchange market, lowering the rate to 140 yen per US dollar.
The USD/JPY chart shows that:
→ the price continues to move within the ascending channel;
→ on Friday, during Powell's speech, the median line was tested, confirming its influence as a support;
→ former resistance at 144.8 also provides support;
→ if the trend continues, the rate may reach the upper limit of the channel — that is, the psychological mark of 150 yen per US dollar.
However, if we analyze the progress of the bulls when reaching the tops, then we can assume that the bullish momentum is depleted: after all, bullish candles do not have a wide body when they reach the highs, but on the contrary, they shrink. For sure, the strength of buyers is limited by fears of new interventions. Therefore, it is possible that a series of cautious renewal of the highs of the year may be interrupted when the Japanese authorities have their say.
According to analysts at Goldman Sachs, the yen may weaken to 155 per US dollar if the Bank of Japan continues to adhere to its ultra-soft position.
To benefit from trends in the currency markets, consider enlisting the services of a trusted broker like FXOpen.
CFDs are complex instruments and come with a high risk of losing your money.
This article represents the opinion of the Companies operating under the FXOpen brand only. It is not to be construed as an offer, solicitation, or recommendation with respect to products and services provided by the Companies operating under the FXOpen brand, nor is it to be considered financial advice.
#BTCUSD #BTC #marketnews
Bitcoin Trading Volumes Fell to a Minimum of 4 Years
CNBC, citing CryptoQuant agency, reports that:
→ the total volume of bitcoins held on all cryptocurrency exchanges is at its lowest level since 2019;
→ as of August 26, the volume of bitcoin trading on all exchanges was about 130k BTC;
→ a maximum of 3.5 million BTC were traded in 1 day.
Perhaps the decrease in trading volumes is due to a drop in interest due to the uncertainty with the regulation of cryptocurrencies, or the fading of the bullish trend that began from the early days of 2023.
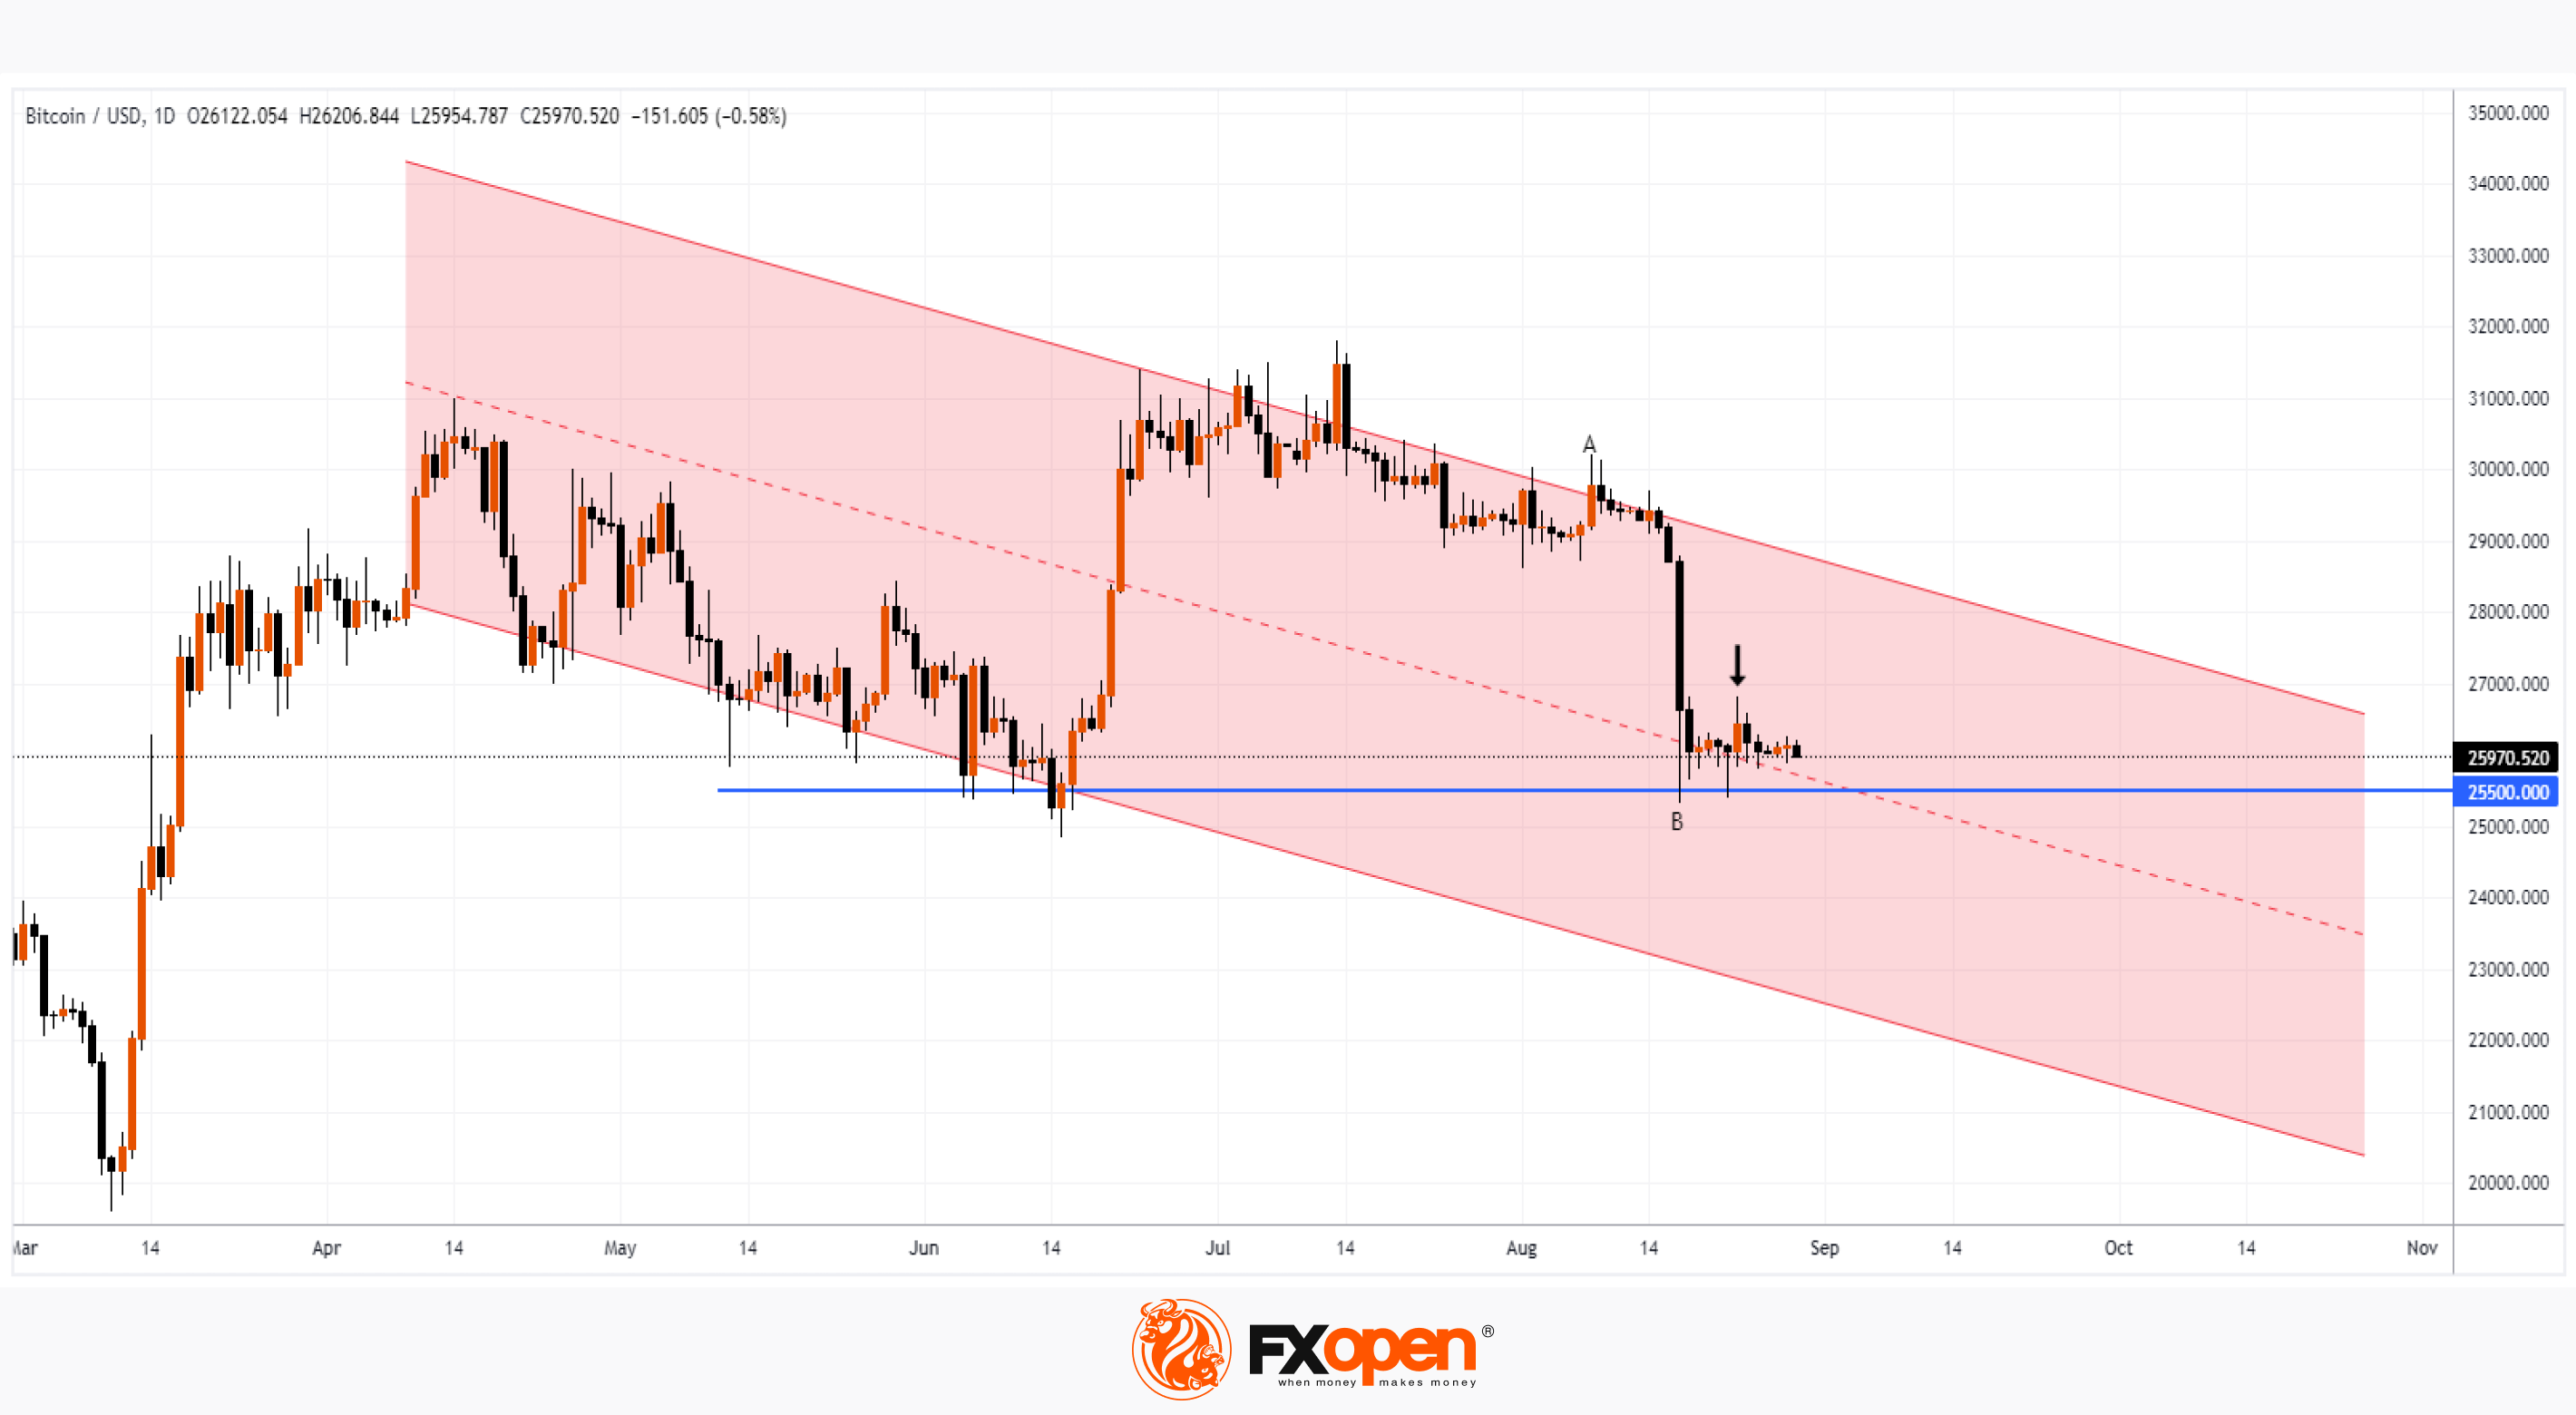
According to JP Morgan analysts, a decrease in open interest may indicate that the price of bitcoin is near a significant low, but the BTC/USD chart suggests that the bearish trend may continue. This is indicated by the descending channel, the outlines of which are becoming clearer.
The analysis shows that:
→ today, the price is near the median line of the descending channel. There are high chances that supply and demand will balance each other. And the price will be in a flat — then the trading volumes may decrease even more;
→ the level 25,500 continues to work as support;
→ an attempt to rise from this level on August 23 (shown by the arrow) failed, indicating the dominance of the bears;
→ the fact that the price of bitcoin is below 50% of the decline in A→B is bearish.
The bullish catalyst could be the approval of the SEC's applications for the creation of ETFs based on bitcoin. But if there are no drivers for growth, the bears can push through the level of 25,500 — then it is possible that it will become resistance.
To benefit from the rise and fall of the price of bitcoin and other cryptocurrencies, consider enlisting the services of a trusted broker like FXOpen.
CFDs are complex instruments and come with a high risk of losing your money.
This article represents the opinion of the Companies operating under the FXOpen brand only. It is not to be construed as an offer, solicitation, or recommendation with respect to products and services provided by the Companies operating under the FXOpen brand, nor is it to be considered financial advice.
At FXOpen UK and FXOpen AU, Cryptocurrency CFDs are only available for trading by those clients categorised as Professional clients under FCA Rules and Professional clients under ASIC Rules, respectively. They are not available for trading by Retail clients.
Bitcoin Trading Volumes Fell to a Minimum of 4 Years
CNBC, citing CryptoQuant agency, reports that:
→ the total volume of bitcoins held on all cryptocurrency exchanges is at its lowest level since 2019;
→ as of August 26, the volume of bitcoin trading on all exchanges was about 130k BTC;
→ a maximum of 3.5 million BTC were traded in 1 day.
Perhaps the decrease in trading volumes is due to a drop in interest due to the uncertainty with the regulation of cryptocurrencies, or the fading of the bullish trend that began from the early days of 2023.
According to JP Morgan analysts, a decrease in open interest may indicate that the price of bitcoin is near a significant low, but the BTC/USD chart suggests that the bearish trend may continue. This is indicated by the descending channel, the outlines of which are becoming clearer.
The analysis shows that:
→ today, the price is near the median line of the descending channel. There are high chances that supply and demand will balance each other. And the price will be in a flat — then the trading volumes may decrease even more;
→ the level 25,500 continues to work as support;
→ an attempt to rise from this level on August 23 (shown by the arrow) failed, indicating the dominance of the bears;
→ the fact that the price of bitcoin is below 50% of the decline in A→B is bearish.
The bullish catalyst could be the approval of the SEC's applications for the creation of ETFs based on bitcoin. But if there are no drivers for growth, the bears can push through the level of 25,500 — then it is possible that it will become resistance.
To benefit from the rise and fall of the price of bitcoin and other cryptocurrencies, consider enlisting the services of a trusted broker like FXOpen.
CFDs are complex instruments and come with a high risk of losing your money.
This article represents the opinion of the Companies operating under the FXOpen brand only. It is not to be construed as an offer, solicitation, or recommendation with respect to products and services provided by the Companies operating under the FXOpen brand, nor is it to be considered financial advice.
At FXOpen UK and FXOpen AU, Cryptocurrency CFDs are only available for trading by those clients categorised as Professional clients under FCA Rules and Professional clients under ASIC Rules, respectively. They are not available for trading by Retail clients.
#MarketNews #EURUSD #tradingtips
Market Analysis: EUR/USD Accelerates Gains from 2.5-month Low
This was facilitated by disappointing data on the US labor market. According to the Bureau of Labor Statistics, the number of new vacancies has fallen sharply: actual — 8.8 million, forecast — 9.4 million new vacancies. The last time the value of the indicator fell below 9 million was in the spring of 2021.
The news came as a big surprise, which sent the dollar index down sharply. Accordingly, USD-denominated shares and gold rose, as well as exchange rates traded against the dollar.
The EUR/USD chart shows that:
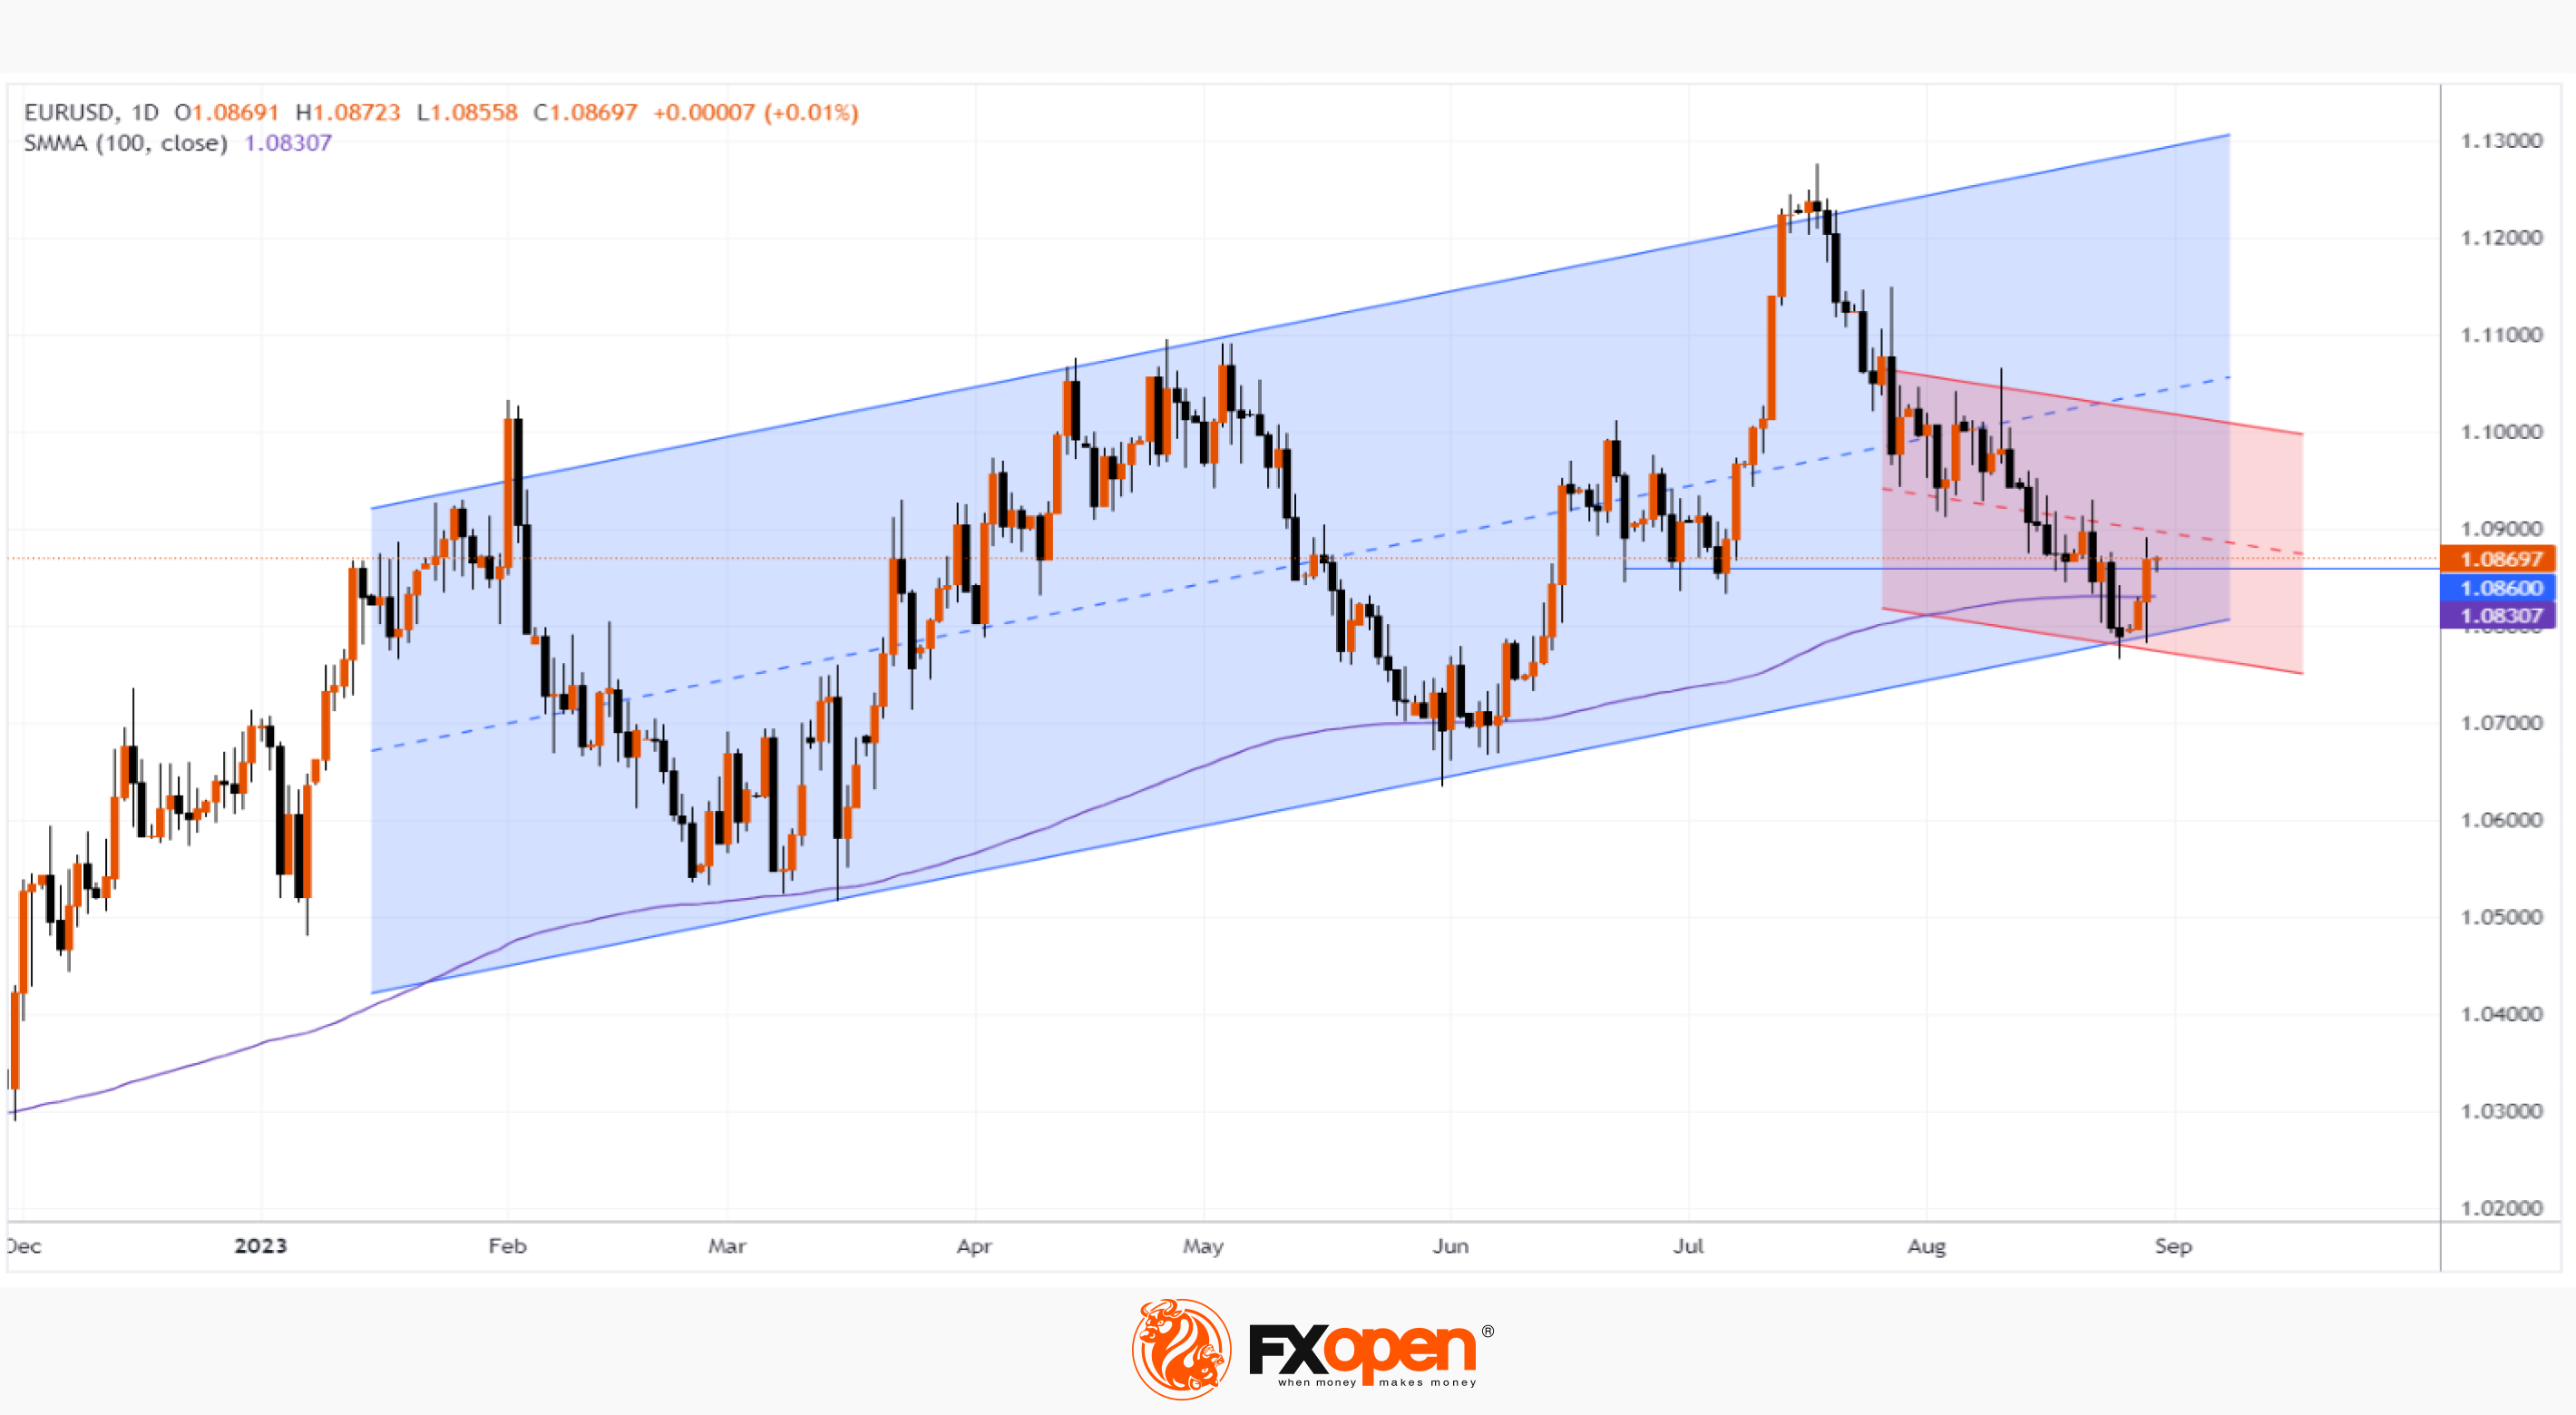
→ the price accelerated yesterday's rise from the 2.5-month low set on August 25;
→ the price continues to be supported by the lower line of the rising channel;
→ the price continues to be supported by SMA (100);
→ the presence of bears may appear near the lines of the descending channel (shown in red).
The bulls will consolidate their success if they manage to keep the price of EUR/USD above the level of 1.086, from which resistance can be expected. Decrease in the number of vacancies is a leading indicator of the state of the economy. If market participants receive more signals about the slowdown in the US economy, this could lower the USD against other currencies even more.
To benefit from trends in the currency markets, consider enlisting the services of a trusted broker like FXOpen.
CFDs are complex instruments and come with a high risk of losing your money.
This article represents the opinion of the Companies operating under the FXOpen brand only. It is not to be construed as an offer, solicitation, or recommendation with respect to products and services provided by the Companies operating under the FXOpen brand, nor is it to be considered financial advice.
Market Analysis: EUR/USD Accelerates Gains from 2.5-month Low
This was facilitated by disappointing data on the US labor market. According to the Bureau of Labor Statistics, the number of new vacancies has fallen sharply: actual — 8.8 million, forecast — 9.4 million new vacancies. The last time the value of the indicator fell below 9 million was in the spring of 2021.
The news came as a big surprise, which sent the dollar index down sharply. Accordingly, USD-denominated shares and gold rose, as well as exchange rates traded against the dollar.
The EUR/USD chart shows that:
→ the price accelerated yesterday's rise from the 2.5-month low set on August 25;
→ the price continues to be supported by the lower line of the rising channel;
→ the price continues to be supported by SMA (100);
→ the presence of bears may appear near the lines of the descending channel (shown in red).
The bulls will consolidate their success if they manage to keep the price of EUR/USD above the level of 1.086, from which resistance can be expected. Decrease in the number of vacancies is a leading indicator of the state of the economy. If market participants receive more signals about the slowdown in the US economy, this could lower the USD against other currencies even more.
To benefit from trends in the currency markets, consider enlisting the services of a trusted broker like FXOpen.
CFDs are complex instruments and come with a high risk of losing your money.
This article represents the opinion of the Companies operating under the FXOpen brand only. It is not to be construed as an offer, solicitation, or recommendation with respect to products and services provided by the Companies operating under the FXOpen brand, nor is it to be considered financial advice.
#marketnews #BTCUSD #bitcoin
BTC/USD Analysis: Bulls Lose Progress Amid SEC Defeat
On Tuesday, the price of bitcoin rose sharply from around USD 26,000 to USD 28,000 per coin. This was due to a ruling by the US District of Columbia Court of Appeals that said the Securities and Exchange Commission (SEC) was wrong to reject Grayscale's application to convert its Bitcoin Trust (GBTC) into a BTC Spot Exchange-traded Fund (ETF). A spot ETF would allow investors to access the leading cryptocurrency without actually holding BTC.
The SEC has repeatedly rejected Bitcoin spot ETF applications in the past, citing market manipulation concerns. But the court said the SEC failed to adequately explain its refusal to grant Grayscale's ETF bid, to the delight of the cryptocurrency community.
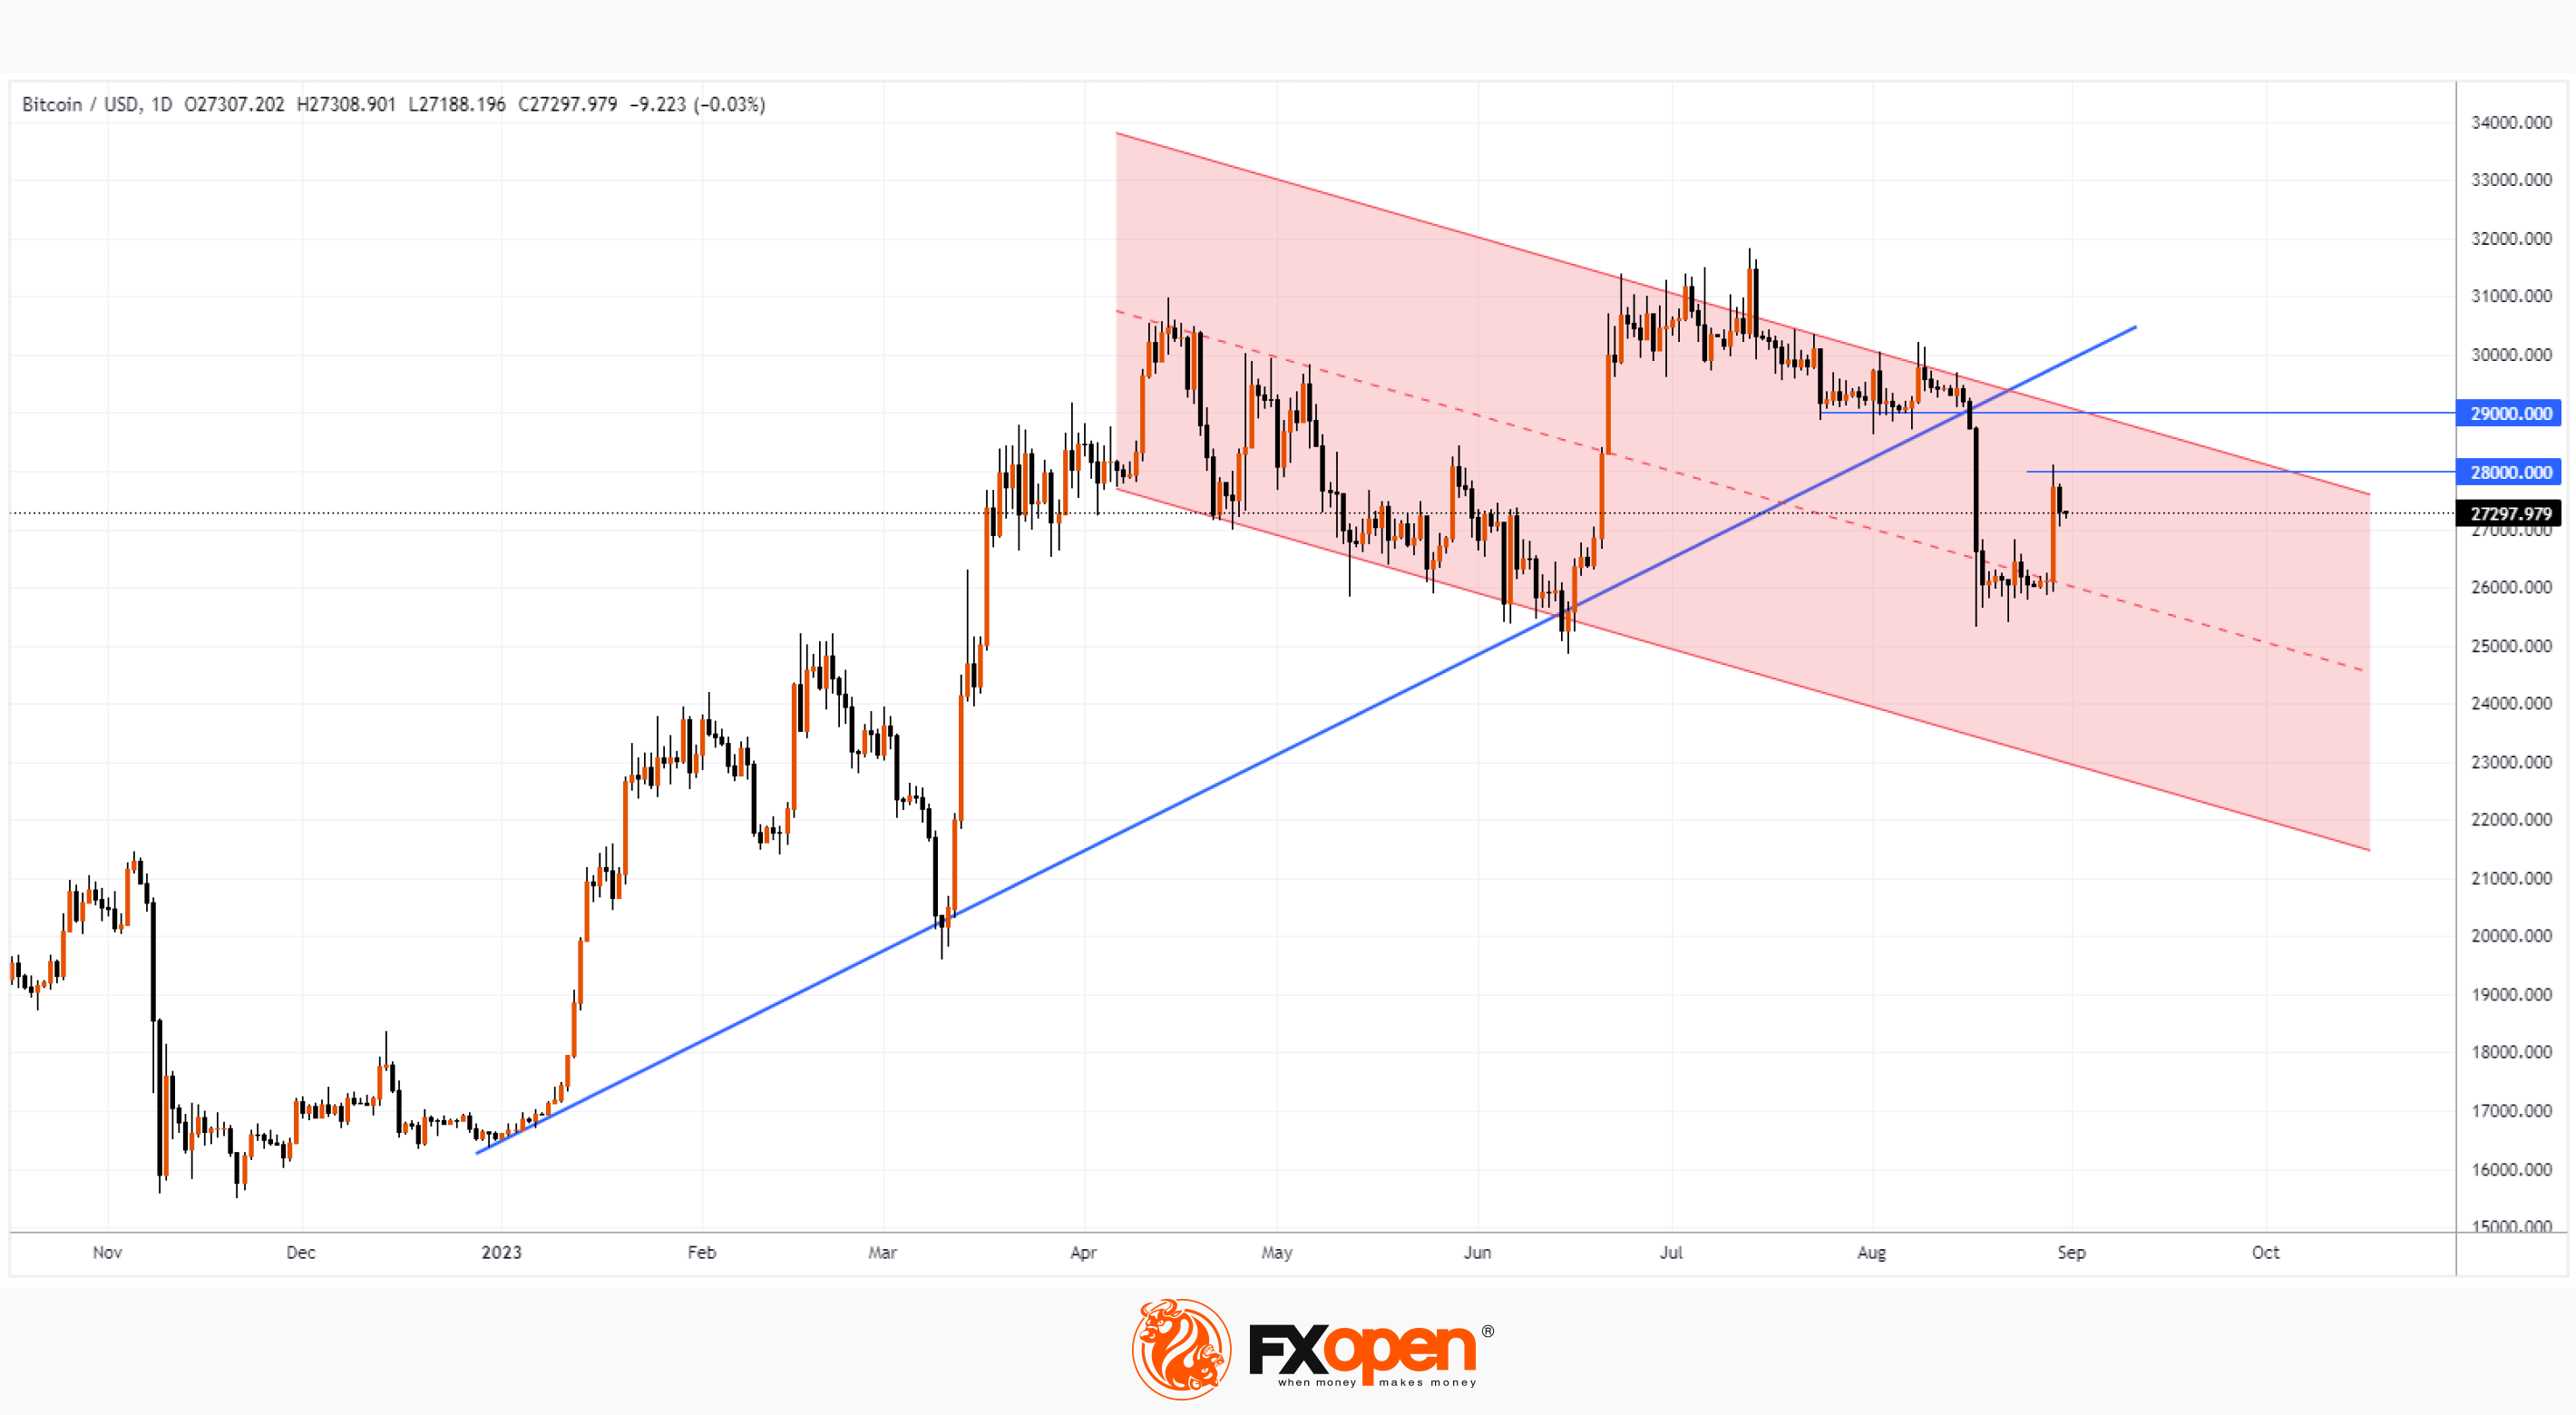
However, already on Wednesday, the rate rolled back to 27,200. Why do the bears' positions remain strong? From the point of view of technical analysis of the BTC/USD chart:
→ the bullish trend line (shown in blue) has been confidently broken;
→ the price of bitcoin remains below the level of its breakdown in the 29k region, which can provide serious resistance;
→ the price of bitcoin just broke through the 28k level, indicating that the bears are in control of this round level;
→ the descending channel (shown in red) can be a roadmap for the price of bitcoin in the coming months, and its upper limit is an obstacle for the bulls.
By the way, the SEC has 45 days to appeal the judge's decision. It is possible that the filing of an appeal by the SEC will offset the positive news from Tuesday.
To benefit from the rise and fall of the BTC price in dollars, consider enlisting the services of a trusted broker like FXOpen.
CFDs are complex instruments and come with a high risk of losing your money.
This article represents the opinion of the Companies operating under the FXOpen brand only. It is not to be construed as an offer, solicitation, or recommendation with respect to products and services provided by the Companies operating under the FXOpen brand, nor is it to be considered financial advice.
At FXOpen UK and FXOpen AU, Cryptocurrency CFDs are only available for trading by those clients categorised as Professional clients under FCA Rules and Professional clients under ASIC Rules, respectively. They are not available for trading by Retail clients.
BTC/USD Analysis: Bulls Lose Progress Amid SEC Defeat
On Tuesday, the price of bitcoin rose sharply from around USD 26,000 to USD 28,000 per coin. This was due to a ruling by the US District of Columbia Court of Appeals that said the Securities and Exchange Commission (SEC) was wrong to reject Grayscale's application to convert its Bitcoin Trust (GBTC) into a BTC Spot Exchange-traded Fund (ETF). A spot ETF would allow investors to access the leading cryptocurrency without actually holding BTC.
The SEC has repeatedly rejected Bitcoin spot ETF applications in the past, citing market manipulation concerns. But the court said the SEC failed to adequately explain its refusal to grant Grayscale's ETF bid, to the delight of the cryptocurrency community.
However, already on Wednesday, the rate rolled back to 27,200. Why do the bears' positions remain strong? From the point of view of technical analysis of the BTC/USD chart:
→ the bullish trend line (shown in blue) has been confidently broken;
→ the price of bitcoin remains below the level of its breakdown in the 29k region, which can provide serious resistance;
→ the price of bitcoin just broke through the 28k level, indicating that the bears are in control of this round level;
→ the descending channel (shown in red) can be a roadmap for the price of bitcoin in the coming months, and its upper limit is an obstacle for the bulls.
By the way, the SEC has 45 days to appeal the judge's decision. It is possible that the filing of an appeal by the SEC will offset the positive news from Tuesday.
To benefit from the rise and fall of the BTC price in dollars, consider enlisting the services of a trusted broker like FXOpen.
CFDs are complex instruments and come with a high risk of losing your money.
This article represents the opinion of the Companies operating under the FXOpen brand only. It is not to be construed as an offer, solicitation, or recommendation with respect to products and services provided by the Companies operating under the FXOpen brand, nor is it to be considered financial advice.
At FXOpen UK and FXOpen AU, Cryptocurrency CFDs are only available for trading by those clients categorised as Professional clients under FCA Rules and Professional clients under ASIC Rules, respectively. They are not available for trading by Retail clients.
#marketnews #BTCUSD #bitcoin
BTC/USD Analysis: Bulls Lose Progress Amid SEC Defeat
On Tuesday, the price of bitcoin rose sharply from around USD 26,000 to USD 28,000 per coin. This was due to a ruling by the US District of Columbia Court of Appeals that said the Securities and Exchange Commission (SEC) was wrong to reject Grayscale's application to convert its Bitcoin Trust (GBTC) into a BTC Spot Exchange-traded Fund (ETF). A spot ETF would allow investors to access the leading cryptocurrency without actually holding BTC.
The SEC has repeatedly rejected Bitcoin spot ETF applications in the past, citing market manipulation concerns. But the court said the SEC failed to adequately explain its refusal to grant Grayscale's ETF bid, to the delight of the cryptocurrency community.
However, already on Wednesday, the rate rolled back to 27,200. Why do the bears' positions remain strong? From the point of view of technical analysis of the BTC/USD chart:
→ the bullish trend line (shown in blue) has been confidently broken;
→ the price of bitcoin remains below the level of its breakdown in the 29k region, which can provide serious resistance;
→ the price of bitcoin just broke through the 28k level, indicating that the bears are in control of this round level;
→ the descending channel (shown in red) can be a roadmap for the price of bitcoin in the coming months, and its upper limit is an obstacle for the bulls.
By the way, the SEC has 45 days to appeal the judge's decision. It is possible that the filing of an appeal by the SEC will offset the positive news from Tuesday.
To benefit from the rise and fall of the BTC price in dollars, consider enlisting the services of a trusted broker like FXOpen.
CFDs are complex instruments and come with a high risk of losing your money.
This article represents the opinion of the Companies operating under the FXOpen brand only. It is not to be construed as an offer, solicitation, or recommendation with respect to products and services provided by the Companies operating under the FXOpen brand, nor is it to be considered financial advice.
At FXOpen UK and FXOpen AU, Cryptocurrency CFDs are only available for trading by those clients categorised as Professional clients under FCA Rules and Professional clients under ASIC Rules, respectively. They are not available for trading by Retail clients.
BTC/USD Analysis: Bulls Lose Progress Amid SEC Defeat
On Tuesday, the price of bitcoin rose sharply from around USD 26,000 to USD 28,000 per coin. This was due to a ruling by the US District of Columbia Court of Appeals that said the Securities and Exchange Commission (SEC) was wrong to reject Grayscale's application to convert its Bitcoin Trust (GBTC) into a BTC Spot Exchange-traded Fund (ETF). A spot ETF would allow investors to access the leading cryptocurrency without actually holding BTC.
The SEC has repeatedly rejected Bitcoin spot ETF applications in the past, citing market manipulation concerns. But the court said the SEC failed to adequately explain its refusal to grant Grayscale's ETF bid, to the delight of the cryptocurrency community.
However, already on Wednesday, the rate rolled back to 27,200. Why do the bears' positions remain strong? From the point of view of technical analysis of the BTC/USD chart:
→ the bullish trend line (shown in blue) has been confidently broken;
→ the price of bitcoin remains below the level of its breakdown in the 29k region, which can provide serious resistance;
→ the price of bitcoin just broke through the 28k level, indicating that the bears are in control of this round level;
→ the descending channel (shown in red) can be a roadmap for the price of bitcoin in the coming months, and its upper limit is an obstacle for the bulls.
By the way, the SEC has 45 days to appeal the judge's decision. It is possible that the filing of an appeal by the SEC will offset the positive news from Tuesday.
To benefit from the rise and fall of the BTC price in dollars, consider enlisting the services of a trusted broker like FXOpen.
CFDs are complex instruments and come with a high risk of losing your money.
This article represents the opinion of the Companies operating under the FXOpen brand only. It is not to be construed as an offer, solicitation, or recommendation with respect to products and services provided by the Companies operating under the FXOpen brand, nor is it to be considered financial advice.
At FXOpen UK and FXOpen AU, Cryptocurrency CFDs are only available for trading by those clients categorised as Professional clients under FCA Rules and Professional clients under ASIC Rules, respectively. They are not available for trading by Retail clients.
#marketanalysis #goldprice #XAUUSD
Market Analysis: The Price of Gold Rose by 3% in 10 Days
Back on August 21, gold was trading below USD 1,890 an ounce, but to date, its price has risen by about 3%. This was helped by published data on the number of vacancies in the US, which fell to the lowest level in almost 2.5 years in July. This and other signals of a slowdown in the US economy may influence the Fed's decision to continue raising interest rates further, which weakens the US dollar and supports the price of gold.
Bullish arguments:
→ the psychological barrier of USD 1,900 serves as an important support. The price of gold was there for only a few days, after which a steady increase followed.
→ The USD 1,920 resistance level was taken under control by the bulls after the breakdown on August 28-29. Now we can expect that there will be support here.
→ If a moderate decline on low volumes follows in the coming days, this will be a sign of a normal correction in a bull market.
Bearish arguments:
→ Expect resistance from USD 1,950. It is possible that if an attack follows it, it will turn into a false breakdown.
→ Gold is within a descending channel (shown in red) and its upside price may be resisting gold's uptrend.
Be prepared for a surge in volatility today at 15:30 GMT+3, at which time Personal Consumption Expenditure (PCE) and monthly employment figures are released, important indicators of the economy in terms of impact on US interest rates.
To benefit from the rise and fall in the price of gold, consider enlisting the services of a trusted broker like FXOpen.
CFDs are complex instruments and come with a high risk of losing your money.
This article represents the opinion of the Companies operating under the FXOpen brand only. It is not to be construed as an offer, solicitation, or recommendation with respect to products and services provided by the Companies operating under the FXOpen brand, nor is it to be considered financial advice.
Market Analysis: The Price of Gold Rose by 3% in 10 Days
Back on August 21, gold was trading below USD 1,890 an ounce, but to date, its price has risen by about 3%. This was helped by published data on the number of vacancies in the US, which fell to the lowest level in almost 2.5 years in July. This and other signals of a slowdown in the US economy may influence the Fed's decision to continue raising interest rates further, which weakens the US dollar and supports the price of gold.
Bullish arguments:
→ the psychological barrier of USD 1,900 serves as an important support. The price of gold was there for only a few days, after which a steady increase followed.
→ The USD 1,920 resistance level was taken under control by the bulls after the breakdown on August 28-29. Now we can expect that there will be support here.
→ If a moderate decline on low volumes follows in the coming days, this will be a sign of a normal correction in a bull market.
Bearish arguments:
→ Expect resistance from USD 1,950. It is possible that if an attack follows it, it will turn into a false breakdown.
→ Gold is within a descending channel (shown in red) and its upside price may be resisting gold's uptrend.
Be prepared for a surge in volatility today at 15:30 GMT+3, at which time Personal Consumption Expenditure (PCE) and monthly employment figures are released, important indicators of the economy in terms of impact on US interest rates.
To benefit from the rise and fall in the price of gold, consider enlisting the services of a trusted broker like FXOpen.
CFDs are complex instruments and come with a high risk of losing your money.
This article represents the opinion of the Companies operating under the FXOpen brand only. It is not to be construed as an offer, solicitation, or recommendation with respect to products and services provided by the Companies operating under the FXOpen brand, nor is it to be considered financial advice.