#MarketNews #marketanalysis #USDCNH
Market Analysis: USD/CNH Falls Amid Chinese Economic Stimulus
Since January, the Chinese yuan has weakened more than 9% against the US dollar due to problems in the Chinese economy, as evidenced by statistics, as well as the bankruptcy of the developer Evergrande.
And today, the People's Bank of China announced that it will reduce the required foreign exchange reserve ratio to 4% from 6%, starting September 15. The move is seen as aimed at slowing down the yuan's fall.
Also, 5 major banks in China are cutting mortgage rates, possibly to reduce the risks of Country Garden going bankrupt.
According to analysts reported by Reuters, the measures taken may be only a temporary solution, but will lead to an increase in problems in the long term.
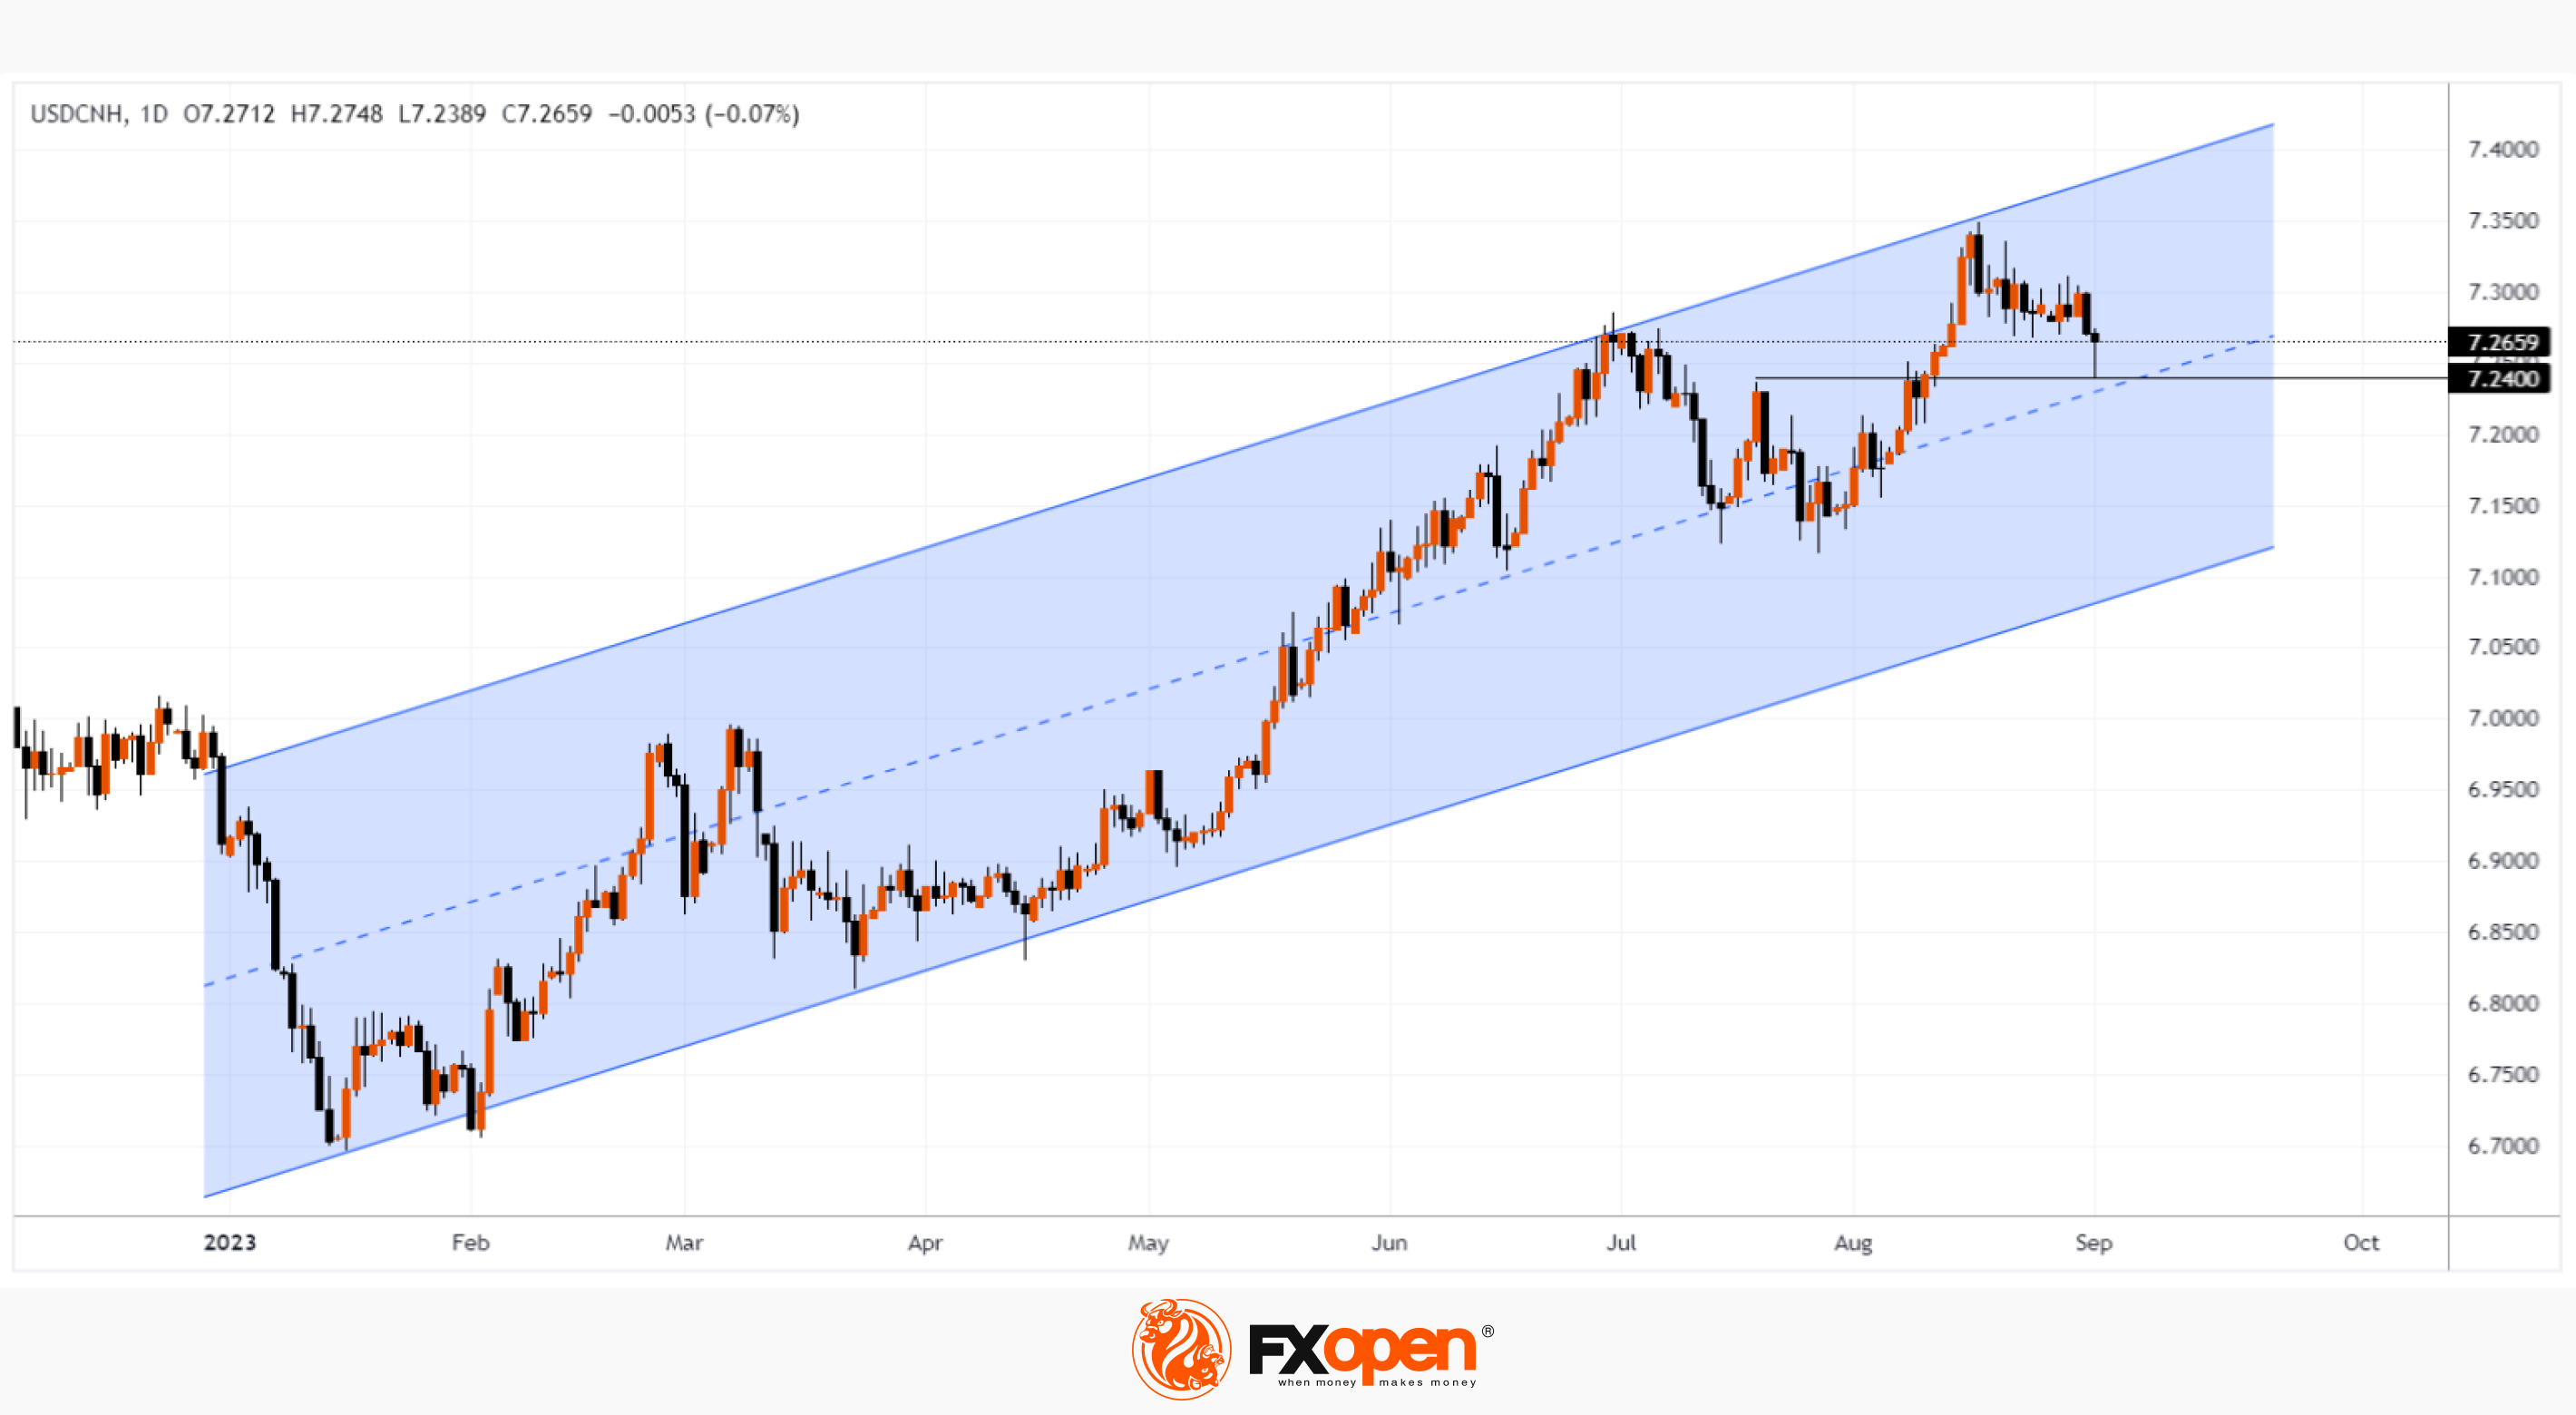
The chart shows that the USD/CNH rate has declined from the highs of April by approximately 1.4%, while:
→ the price of the US dollar against the yuan is in an uptrend and its median and bottom line can provide support;
→ the rate has support from the level of 7.24, which previously worked as a resistance;
→ the fact that on the first day of September the rate is below the lows of August may be due to the weakening of the US dollar index due to negative trends in the US labor market.
It is possible that the level of 7.24 will become a reliable base for the bulls, from which they will try to resume the main uptrend if the incentives from the Chinese authorities are not enough. Note that the last time the US dollar traded for 7.4 yuan was in 2007.
To benefit from trends in the currency markets, consider enlisting the services of a trusted broker like FXOpen.
CFDs are complex instruments and come with a high risk of losing your money.
This article represents the opinion of the Companies operating under the FXOpen brand only. It is not to be construed as an offer, solicitation, or recommendation with respect to products and services provided by the Companies operating under the FXOpen brand, nor is it to be considered financial advice.
Market Analysis: USD/CNH Falls Amid Chinese Economic Stimulus
Since January, the Chinese yuan has weakened more than 9% against the US dollar due to problems in the Chinese economy, as evidenced by statistics, as well as the bankruptcy of the developer Evergrande.
And today, the People's Bank of China announced that it will reduce the required foreign exchange reserve ratio to 4% from 6%, starting September 15. The move is seen as aimed at slowing down the yuan's fall.
Also, 5 major banks in China are cutting mortgage rates, possibly to reduce the risks of Country Garden going bankrupt.
According to analysts reported by Reuters, the measures taken may be only a temporary solution, but will lead to an increase in problems in the long term.
The chart shows that the USD/CNH rate has declined from the highs of April by approximately 1.4%, while:
→ the price of the US dollar against the yuan is in an uptrend and its median and bottom line can provide support;
→ the rate has support from the level of 7.24, which previously worked as a resistance;
→ the fact that on the first day of September the rate is below the lows of August may be due to the weakening of the US dollar index due to negative trends in the US labor market.
It is possible that the level of 7.24 will become a reliable base for the bulls, from which they will try to resume the main uptrend if the incentives from the Chinese authorities are not enough. Note that the last time the US dollar traded for 7.4 yuan was in 2007.
To benefit from trends in the currency markets, consider enlisting the services of a trusted broker like FXOpen.
CFDs are complex instruments and come with a high risk of losing your money.
This article represents the opinion of the Companies operating under the FXOpen brand only. It is not to be construed as an offer, solicitation, or recommendation with respect to products and services provided by the Companies operating under the FXOpen brand, nor is it to be considered financial advice.
🤔1
#sp500 #marketanalysis #stockmarket
Market Analysis: S&P 500 Declines in August after 5 Consecutive Months of Gains
According to statistics over the past 25 years, the average growth of the S&P 500 index is 7.8% per year. But from the beginning of 2023 to August 1, the index rose by about 19%, so a noticeable correction in size was overdue.
The decline from August 1st to the month's low was about 2/3 of the previous rise — a perfectly acceptable proportion to blow off steam from the market, which was indicated by the RSI overbought in July (while forming a divergence pattern warning that the rally has exhausted ).
An important result of the summer was that analysts in the media began to mention the recession scenario less and less – market participants believe in a “soft landing” and that the Fed is controlling the situation with high inflation, given the alarming signals from the labor market.
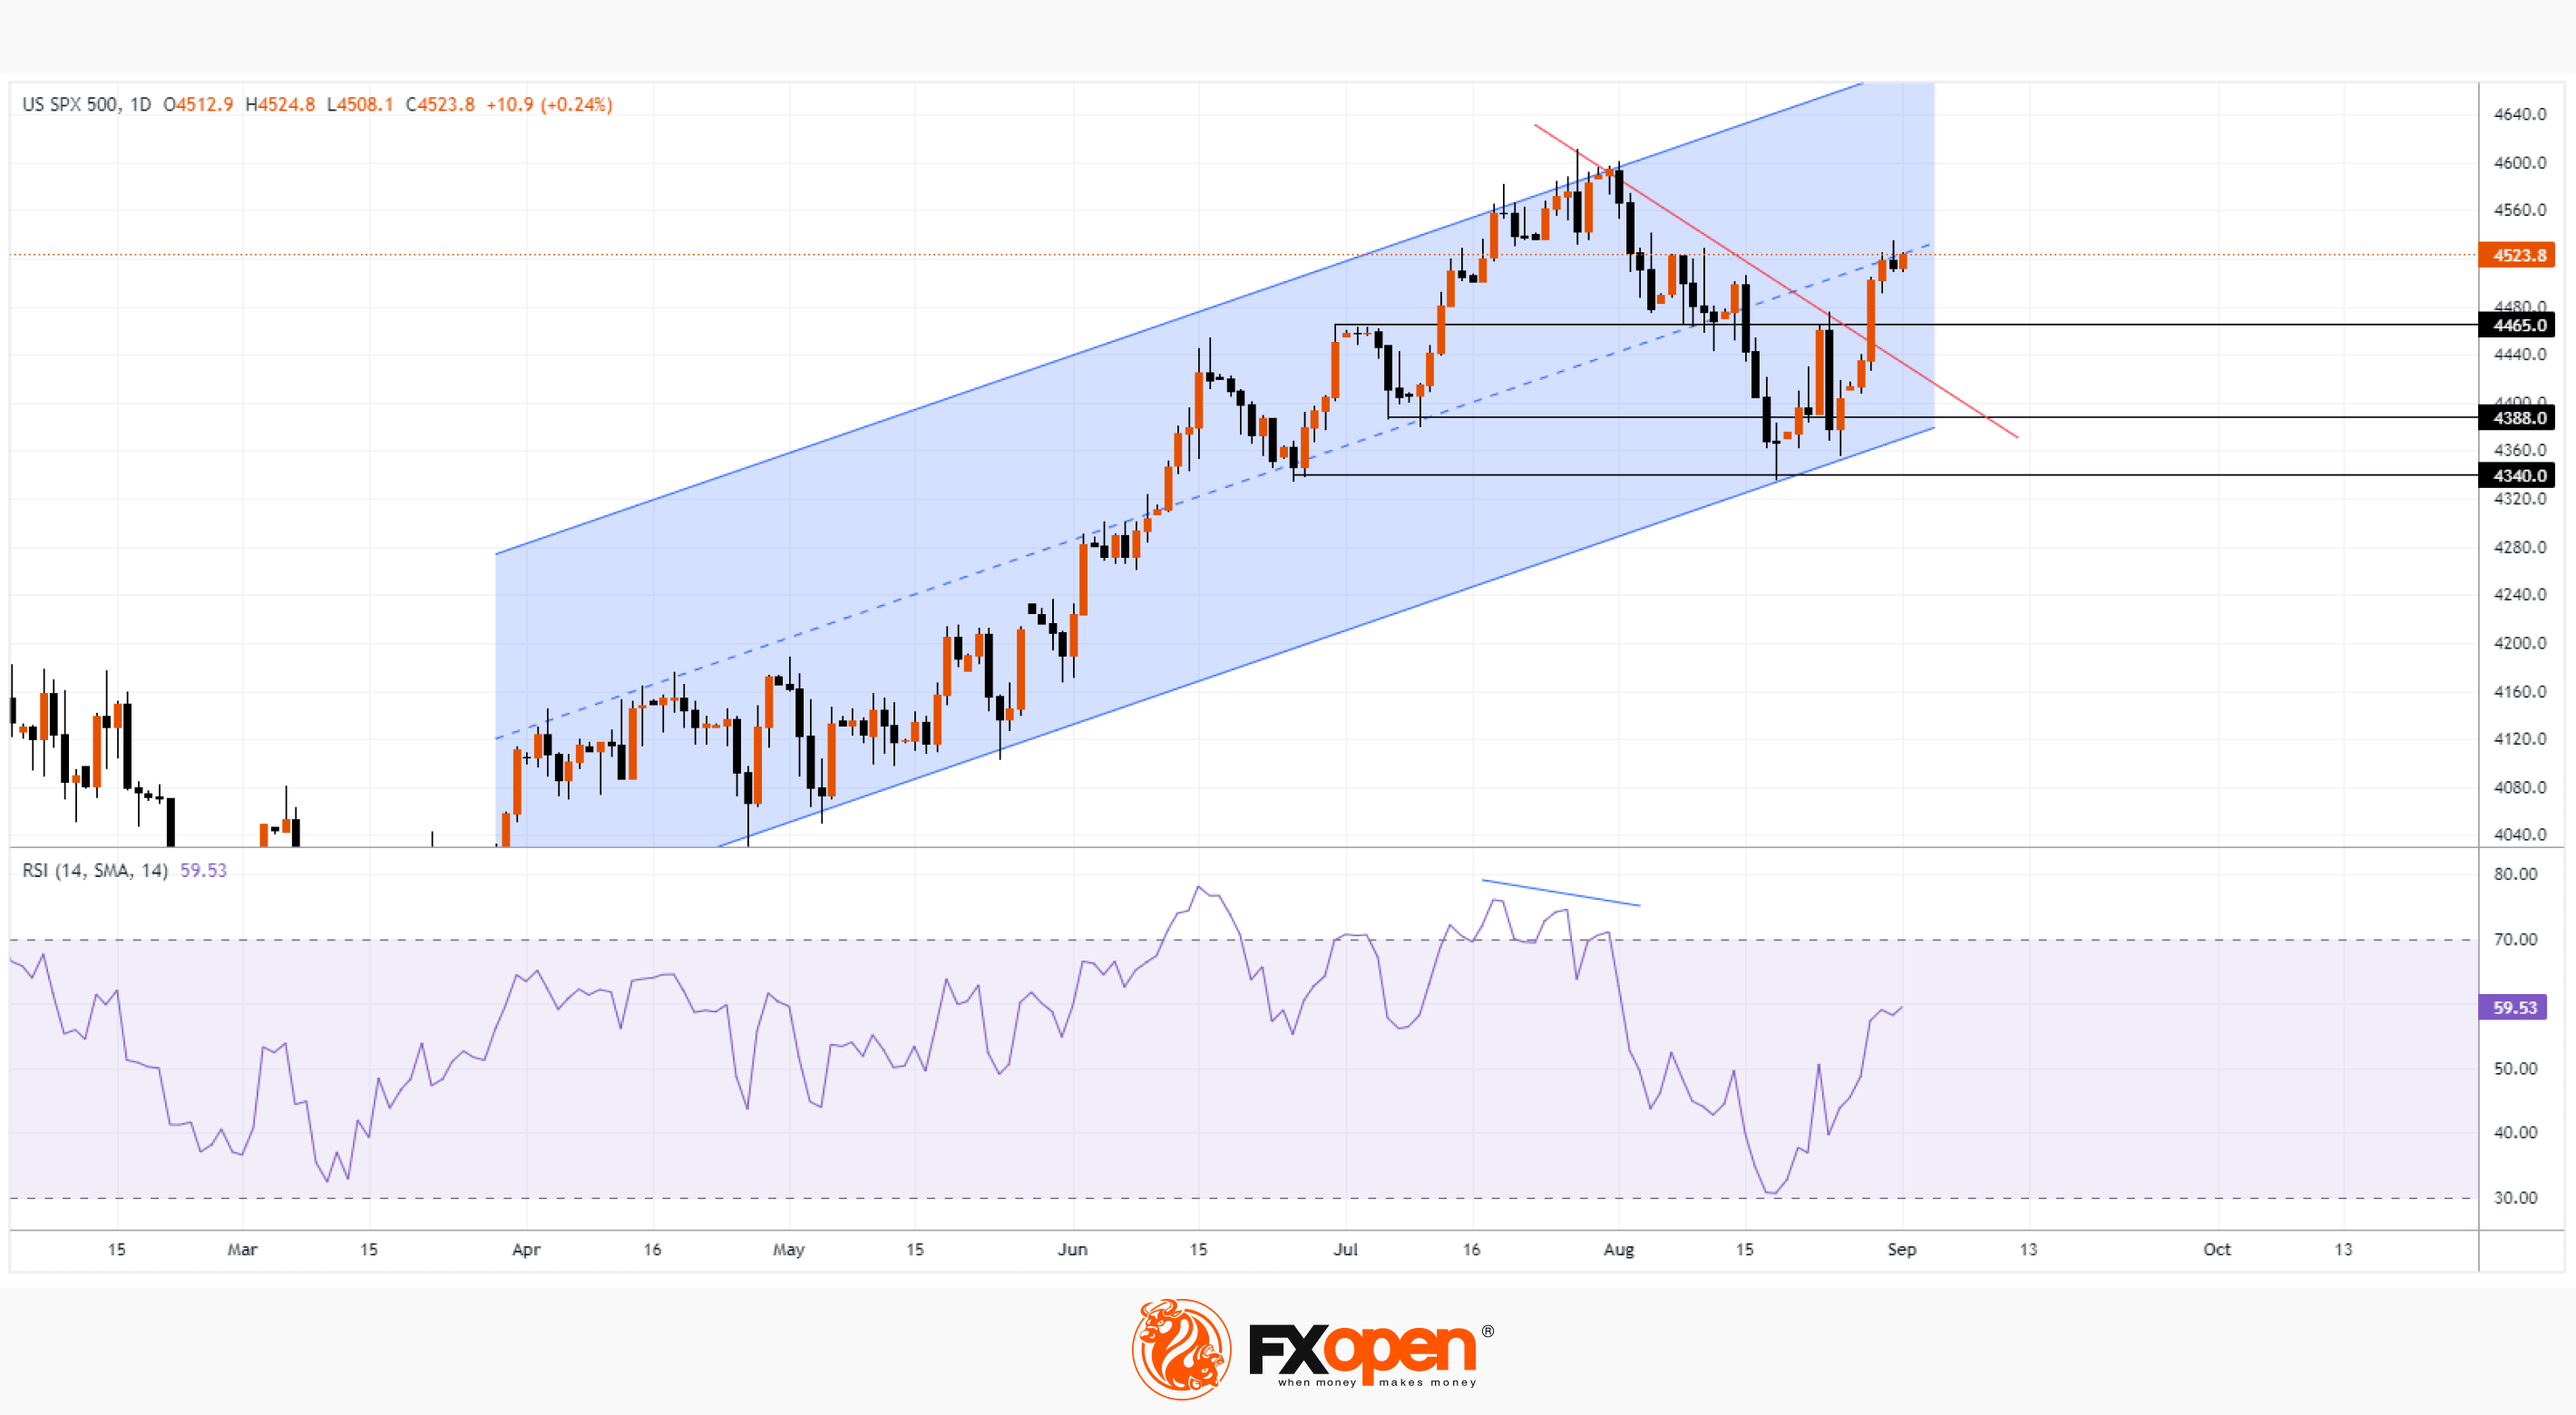
What will happen in autumn? Traditionally, these are months of high volatility, with the S&P 500 having chances to try to hit a new high for the year after a correction that appears to have formed in August. This is indicated by bullish facts from the chart:
→ The price of the S&P 500 has found support at the lower boundary of the parallel channel.
→ The price rebounded from the support level of 4,340.
→ The price is above significant levels 4,388 and 4,465.
→ The price has broken the bearish trend line (shown in red).
→ The price may consolidate near the median line of the channel, where supply and demand may balance each other in total before the September Fed meeting.
To benefit from the rise and fall of stock indices, consider enlisting the services of a trusted broker like FXOpen.
CFDs are complex instruments and come with a high risk of losing your money.
This article represents the opinion of the Companies operating under the FXOpen brand only. It is not to be construed as an offer, solicitation, or recommendation with respect to products and services provided by the Companies operating under the FXOpen brand, nor is it to be considered financial advice.
Market Analysis: S&P 500 Declines in August after 5 Consecutive Months of Gains
According to statistics over the past 25 years, the average growth of the S&P 500 index is 7.8% per year. But from the beginning of 2023 to August 1, the index rose by about 19%, so a noticeable correction in size was overdue.
The decline from August 1st to the month's low was about 2/3 of the previous rise — a perfectly acceptable proportion to blow off steam from the market, which was indicated by the RSI overbought in July (while forming a divergence pattern warning that the rally has exhausted ).
An important result of the summer was that analysts in the media began to mention the recession scenario less and less – market participants believe in a “soft landing” and that the Fed is controlling the situation with high inflation, given the alarming signals from the labor market.
What will happen in autumn? Traditionally, these are months of high volatility, with the S&P 500 having chances to try to hit a new high for the year after a correction that appears to have formed in August. This is indicated by bullish facts from the chart:
→ The price of the S&P 500 has found support at the lower boundary of the parallel channel.
→ The price rebounded from the support level of 4,340.
→ The price is above significant levels 4,388 and 4,465.
→ The price has broken the bearish trend line (shown in red).
→ The price may consolidate near the median line of the channel, where supply and demand may balance each other in total before the September Fed meeting.
To benefit from the rise and fall of stock indices, consider enlisting the services of a trusted broker like FXOpen.
CFDs are complex instruments and come with a high risk of losing your money.
This article represents the opinion of the Companies operating under the FXOpen brand only. It is not to be construed as an offer, solicitation, or recommendation with respect to products and services provided by the Companies operating under the FXOpen brand, nor is it to be considered financial advice.
#MarketNews #BTCUSD #bitcoin #ftse100
Weekly Market Wrap With Gary Thomson: FTSE 100, RATE HIKES, BTC, HPQ
Get the latest scoop on the week's hottest headlines, all in one convenient video. Join Gary Thomson, the COO of FXOpen UK, as he breaks down the most significant news reports and shares his expert insights.
🔸Bitcoin trading volumes fell to a minimum of 4 years
🔸 When will the rate hikes stop? The Fed ploughs on at Jackson Hole despite economic progress
🔸 FTSE 100 goes on massive rebound! Marks & Spencer's resurgence sparks optimism
🔸 Shares of HPQ fall sharply after report
Stay in the know and empower yourself with our short, yet power-packed video. Watch it now and stay updated with FXOpen.
Don't miss out on this invaluable opportunity to sharpen your trading skills and make informed decisions.
https://cutt.ly/LwkCLscp
To take advantage of price fluctuations in the foreign exchange markets, consider enlisting the services of a reliable broker like FXOpen.
⚠️
This forecast represents FXOpen Companies opinion only, it should not be construed as an offer, invitation or recommendation in respect to FXOpen Companies products and services or as financial advice
Weekly Market Wrap With Gary Thomson: FTSE 100, RATE HIKES, BTC, HPQ
Get the latest scoop on the week's hottest headlines, all in one convenient video. Join Gary Thomson, the COO of FXOpen UK, as he breaks down the most significant news reports and shares his expert insights.
🔸Bitcoin trading volumes fell to a minimum of 4 years
🔸 When will the rate hikes stop? The Fed ploughs on at Jackson Hole despite economic progress
🔸 FTSE 100 goes on massive rebound! Marks & Spencer's resurgence sparks optimism
🔸 Shares of HPQ fall sharply after report
Stay in the know and empower yourself with our short, yet power-packed video. Watch it now and stay updated with FXOpen.
Don't miss out on this invaluable opportunity to sharpen your trading skills and make informed decisions.
https://cutt.ly/LwkCLscp
To take advantage of price fluctuations in the foreign exchange markets, consider enlisting the services of a reliable broker like FXOpen.
⚠️
This forecast represents FXOpen Companies opinion only, it should not be construed as an offer, invitation or recommendation in respect to FXOpen Companies products and services or as financial advice
YouTube
Weekly Market Wrap With Gary Thomson: FTSE 100, RATE HIKES, BTC, HPQ
Get the latest scoop on the week's hottest headlines, all in one convenient video. Join Gary Thomson, the COO of FXOpen UK, as he breaks down the most significant news reports and shares his expert insights.
- FTSE 100 Goes on Massive Rebound! Marks & Spencer's…
- FTSE 100 Goes on Massive Rebound! Marks & Spencer's…
😱1
FXOpen official pinned «#MarketNews #BTCUSD #bitcoin #ftse100 Weekly Market Wrap With Gary Thomson: FTSE 100, RATE HIKES, BTC, HPQ Get the latest scoop on the week's hottest headlines, all in one convenient video. Join Gary Thomson, the COO of FXOpen UK, as he breaks down the most…»
#marketanalysis #MarketNews #stockmarket
Hang Seng Index Analysis: Price Recovers from Year's Low
While today the world’s first economy is celebrating Labor Day (so due to the bank holiday in the US, financial markets will most likely have below average volatility), the second world’s economy is recovering. From the low of the year reached on August 22, the Hang Seng index has already risen by more than 6%, as we suggested in the post on August 17th.
The point is to stimulate the Chinese economy by the authorities with special support for the real estate sector. So, in August:
→ the Ministry of Finance introduced tax incentives for small businesses and rural households;
→ the People's Bank of China lowered the base annual rate on loans;
→ the State Council approved housing planning and construction guidelines;
→ citizens were allowed to take soft loans to buy their first home, regardless of their credit history. Other restrictions are also planned to be lifted.
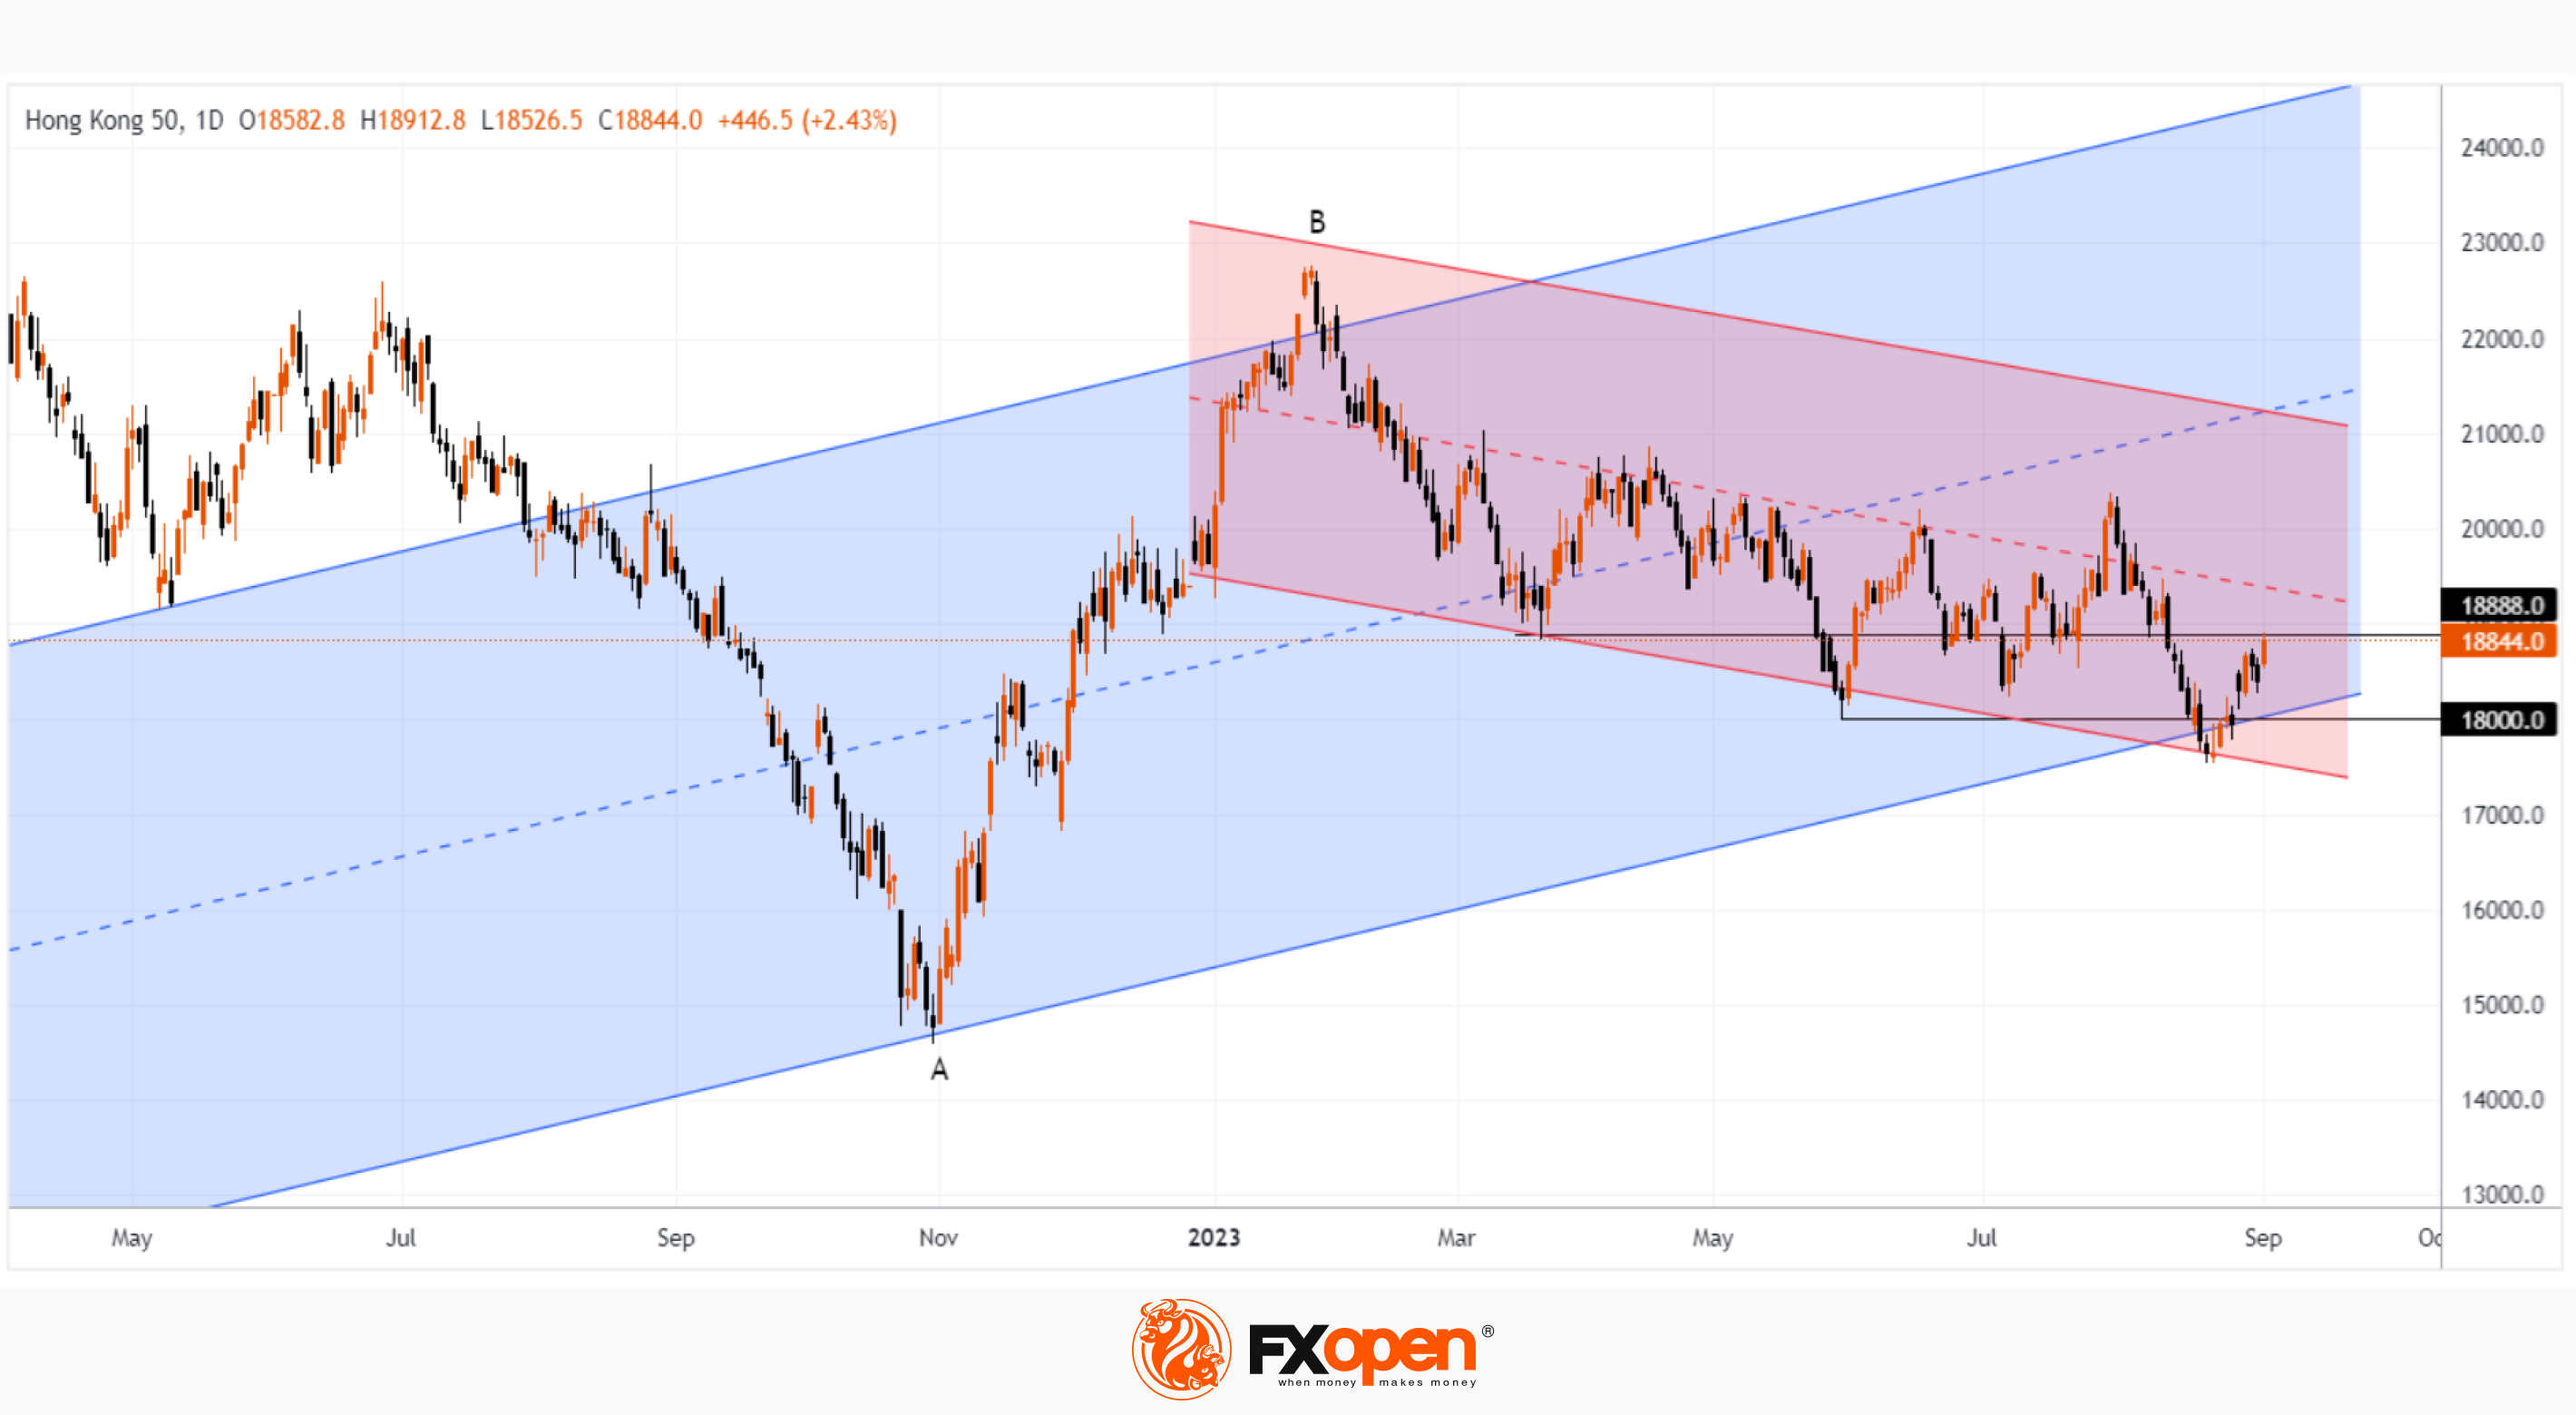
For sure, September will bring more news about stimulating the Chinese economy, and the chart shows the optimism of market participants:
→ The price of the index rose briefly below the psychological level of 18,000.
→ The price of the index has returned to the ascending channel shown in blue.
→ The price is near the lower line of the descending channel shown in red.
→ The price worked out the level of 50% of the growth A→B.
However, the bears may show their presence in the near future, as the price is near the level of 18,888, which has influenced it more than once in the summer. Also, the market may feel resistance from the median line of the channel shown in red.
To benefit from fluctuations in the world's stock indices, consider enlisting the services of a trusted broker like FXOpen.
CFDs are complex instruments and come with a high risk of losing your money.
This article represents the opinion of the Companies operating under the FXOpen brand only. It is not to be construed as an offer, solicitation, or recommendation with respect to products and services provided by the Companies operating under the FXOpen brand, nor is it to be considered financial advice.
Hang Seng Index Analysis: Price Recovers from Year's Low
While today the world’s first economy is celebrating Labor Day (so due to the bank holiday in the US, financial markets will most likely have below average volatility), the second world’s economy is recovering. From the low of the year reached on August 22, the Hang Seng index has already risen by more than 6%, as we suggested in the post on August 17th.
The point is to stimulate the Chinese economy by the authorities with special support for the real estate sector. So, in August:
→ the Ministry of Finance introduced tax incentives for small businesses and rural households;
→ the People's Bank of China lowered the base annual rate on loans;
→ the State Council approved housing planning and construction guidelines;
→ citizens were allowed to take soft loans to buy their first home, regardless of their credit history. Other restrictions are also planned to be lifted.
For sure, September will bring more news about stimulating the Chinese economy, and the chart shows the optimism of market participants:
→ The price of the index rose briefly below the psychological level of 18,000.
→ The price of the index has returned to the ascending channel shown in blue.
→ The price is near the lower line of the descending channel shown in red.
→ The price worked out the level of 50% of the growth A→B.
However, the bears may show their presence in the near future, as the price is near the level of 18,888, which has influenced it more than once in the summer. Also, the market may feel resistance from the median line of the channel shown in red.
To benefit from fluctuations in the world's stock indices, consider enlisting the services of a trusted broker like FXOpen.
CFDs are complex instruments and come with a high risk of losing your money.
This article represents the opinion of the Companies operating under the FXOpen brand only. It is not to be construed as an offer, solicitation, or recommendation with respect to products and services provided by the Companies operating under the FXOpen brand, nor is it to be considered financial advice.
#marketanalysis #oilprices
Market Analysis: The Price of Oil Sets Maximum of the Year
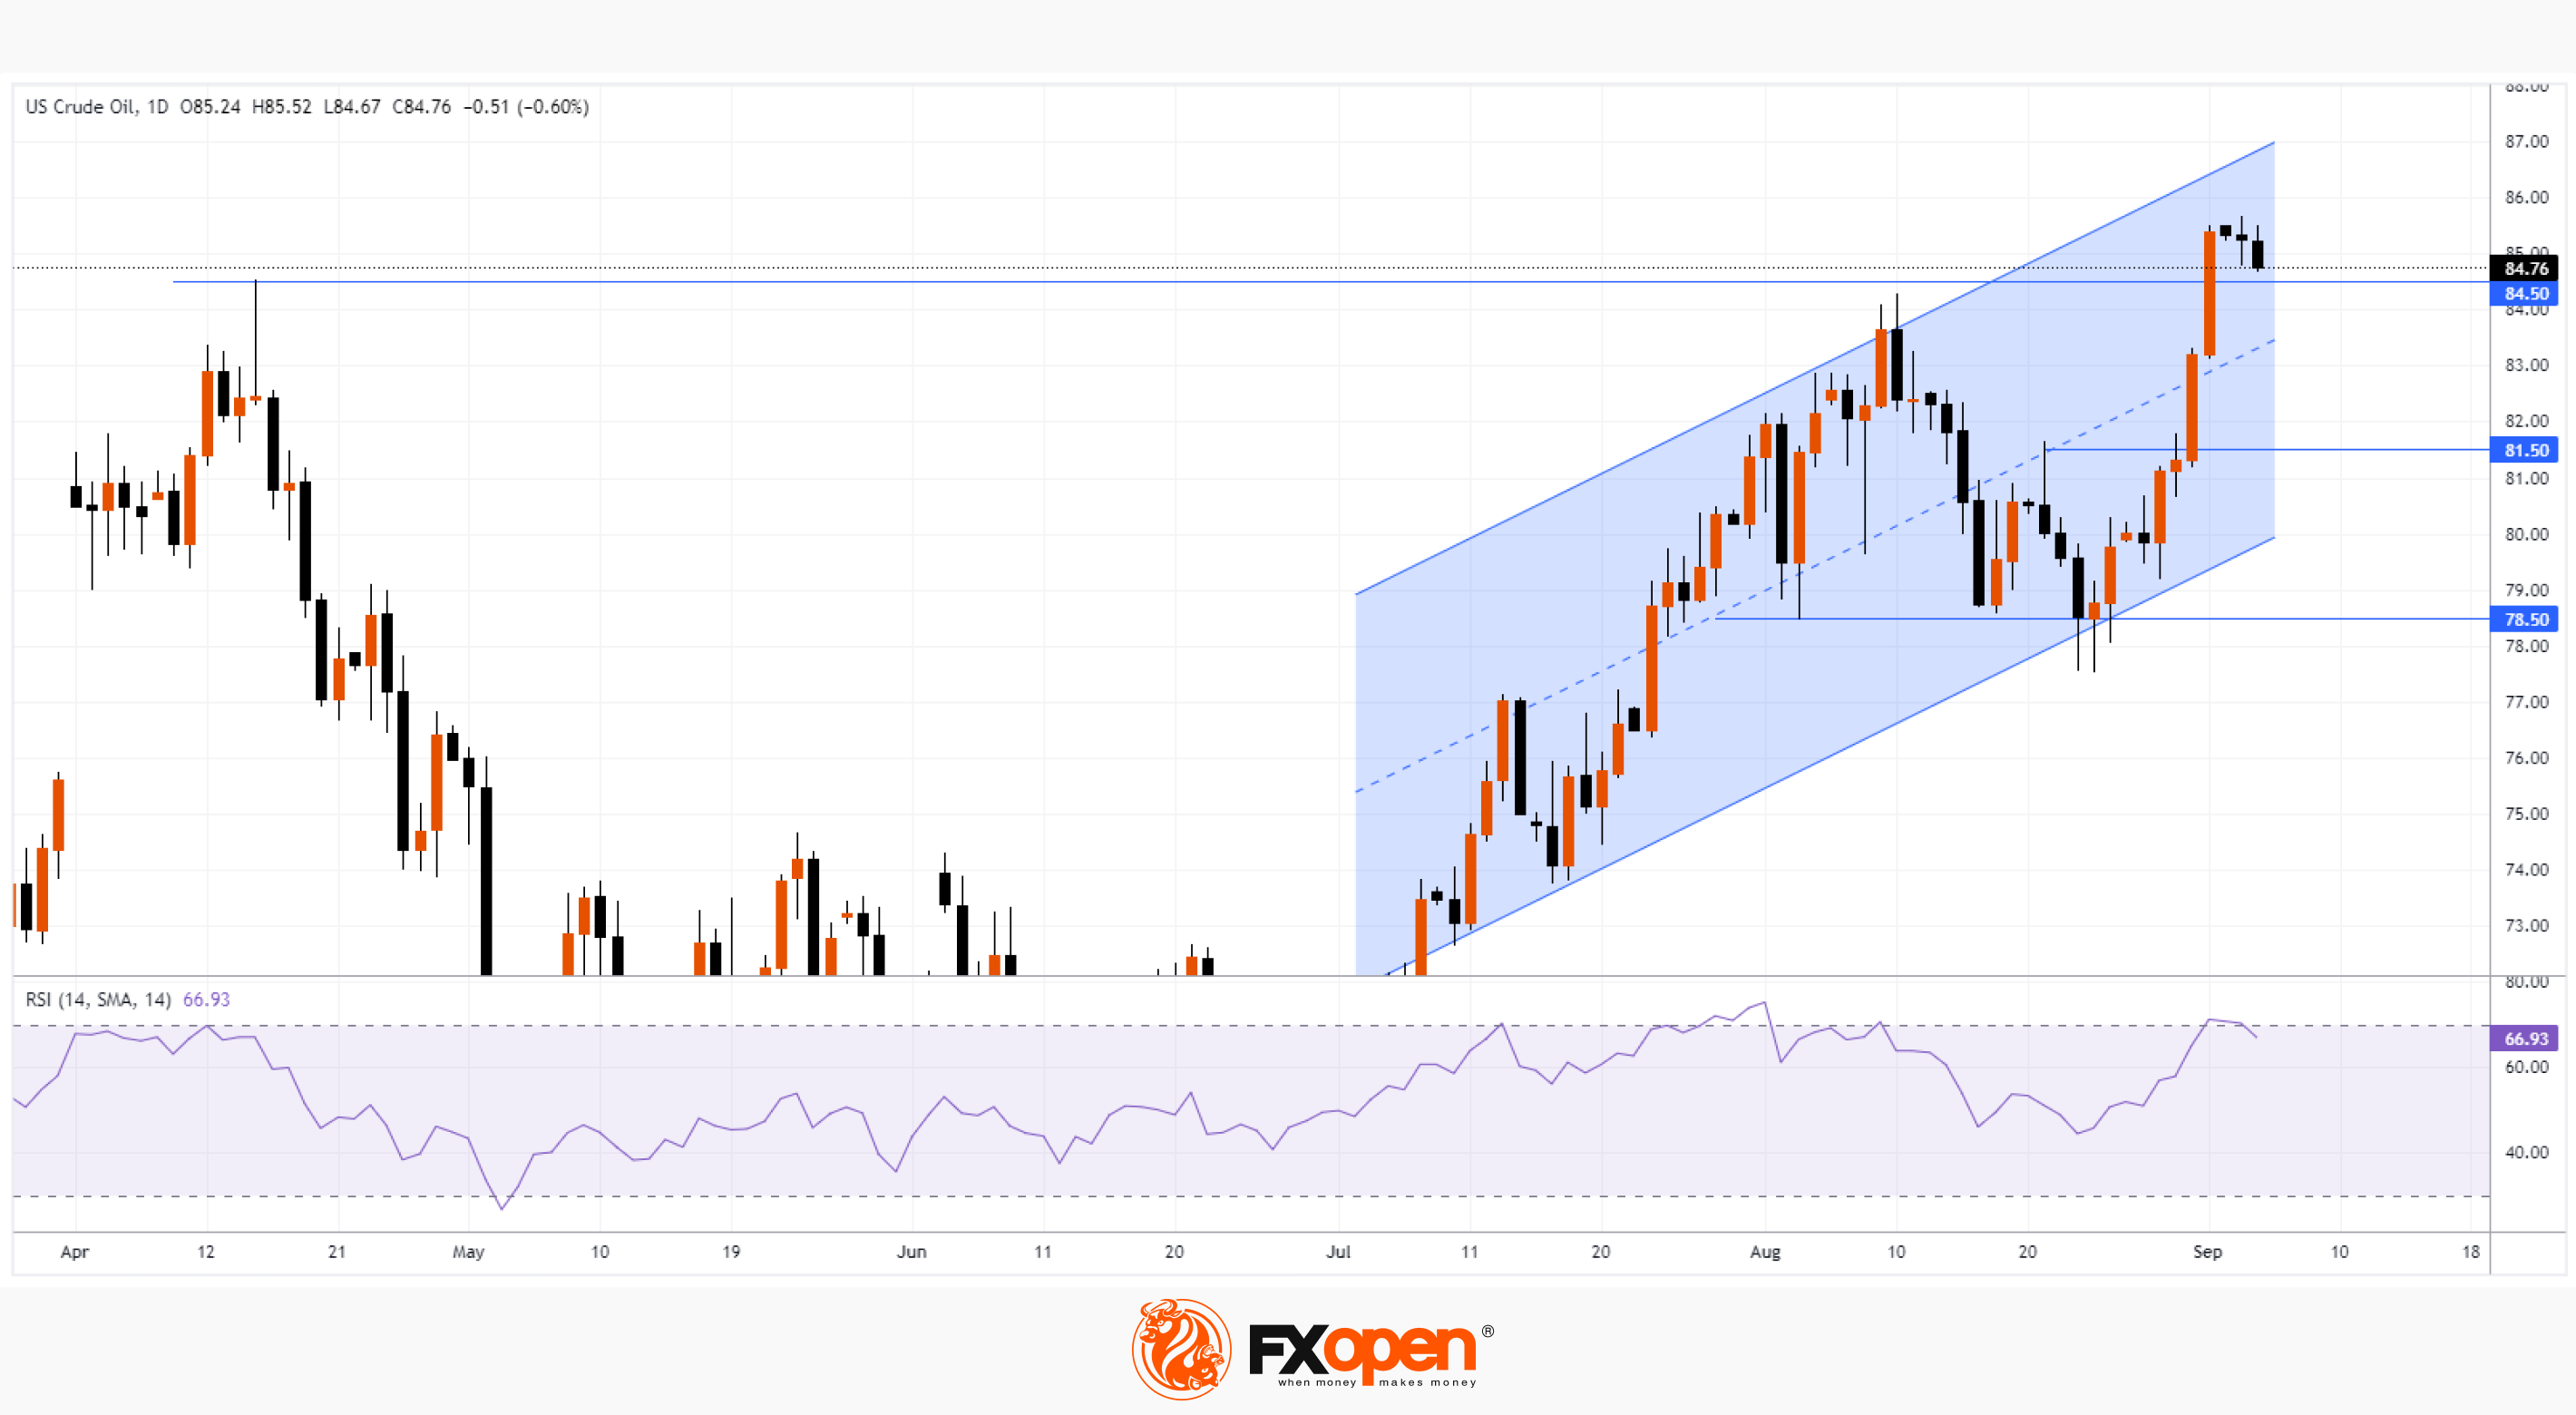
Yesterday, the price of WTI oil rose above USD 85.50 per barrel. This has not happened since November 2022.
On August 24, we wrote that the price of oil could find support for growth from the lower border of the rising channel, as well as from the level of USD 78.50. Since then, the price of WTI oil has risen by more than 9%. Fundamentally this contributed to:
→ the policy of limiting production by OPEC+ countries;
→ expectations that the Chinese economy will recover thanks to the incentives of the authorities.
According to Trafigura, a large company trading mainly in metals and energy resources, investment in the development of the oil industry is not enough, and a price of up to USD 88 can be considered fair in the current circumstances.
Bullish arguments:
→ the price of oil has not yet reached the upper limit of the rising channel, leaving the potential for updating the highs of the year;
→ the level at 81.50, which worked as a resistance, can now provide support;
→ support can also be provided by the median line of the uplink.
Bearish arguments:
→ rising oil prices are unfavorable for large economies, including the United States, which are struggling with high inflation. We can expect steps from governments aimed at lowering prices;
→ after 2 weeks of rapid growth (and especially on August 31 and September 1), a pullback would be a logical development for a market that is “overheated”. The RSI indicator indicates overbought.
To benefit from fluctuations in oil prices, consider enlisting the services of a trusted broker like FXOpen.
CFDs are complex instruments and come with a high risk of losing your money.
This article represents the opinion of the Companies operating under the FXOpen brand only. It is not to be construed as an offer, solicitation, or recommendation with respect to products and services provided by the Companies operating under the FXOpen brand, nor is it to be considered financial advice.
Market Analysis: The Price of Oil Sets Maximum of the Year
Yesterday, the price of WTI oil rose above USD 85.50 per barrel. This has not happened since November 2022.
On August 24, we wrote that the price of oil could find support for growth from the lower border of the rising channel, as well as from the level of USD 78.50. Since then, the price of WTI oil has risen by more than 9%. Fundamentally this contributed to:
→ the policy of limiting production by OPEC+ countries;
→ expectations that the Chinese economy will recover thanks to the incentives of the authorities.
According to Trafigura, a large company trading mainly in metals and energy resources, investment in the development of the oil industry is not enough, and a price of up to USD 88 can be considered fair in the current circumstances.
Bullish arguments:
→ the price of oil has not yet reached the upper limit of the rising channel, leaving the potential for updating the highs of the year;
→ the level at 81.50, which worked as a resistance, can now provide support;
→ support can also be provided by the median line of the uplink.
Bearish arguments:
→ rising oil prices are unfavorable for large economies, including the United States, which are struggling with high inflation. We can expect steps from governments aimed at lowering prices;
→ after 2 weeks of rapid growth (and especially on August 31 and September 1), a pullback would be a logical development for a market that is “overheated”. The RSI indicator indicates overbought.
To benefit from fluctuations in oil prices, consider enlisting the services of a trusted broker like FXOpen.
CFDs are complex instruments and come with a high risk of losing your money.
This article represents the opinion of the Companies operating under the FXOpen brand only. It is not to be construed as an offer, solicitation, or recommendation with respect to products and services provided by the Companies operating under the FXOpen brand, nor is it to be considered financial advice.
#marketanalysis #tradingforex
Market Analysis: AUD/USD Falls Sharply after the Decision of the Reserve Bank of Australia
The Reserve Bank of Australia (RBA) kept interest rates at 4.10% for the third month today, fueling rumors that the tightening cycle is over. Although according to Reuters, the majority of economists polled by the agency expect another increase by the end of the year after the release of the inflation report for the third quarter.
In the words of RBA chief Philip Lowe today:
→ data indicate that inflation could return to the 2-3% target range at the end of 2025;
→ the labor market remains strong and the economy operates at a high level of capacity utilization, although its development has slowed down;
→ further tightening is still acceptable if inflation is to be suppressed, which stands at 4.9% in July (at an 18-month low).
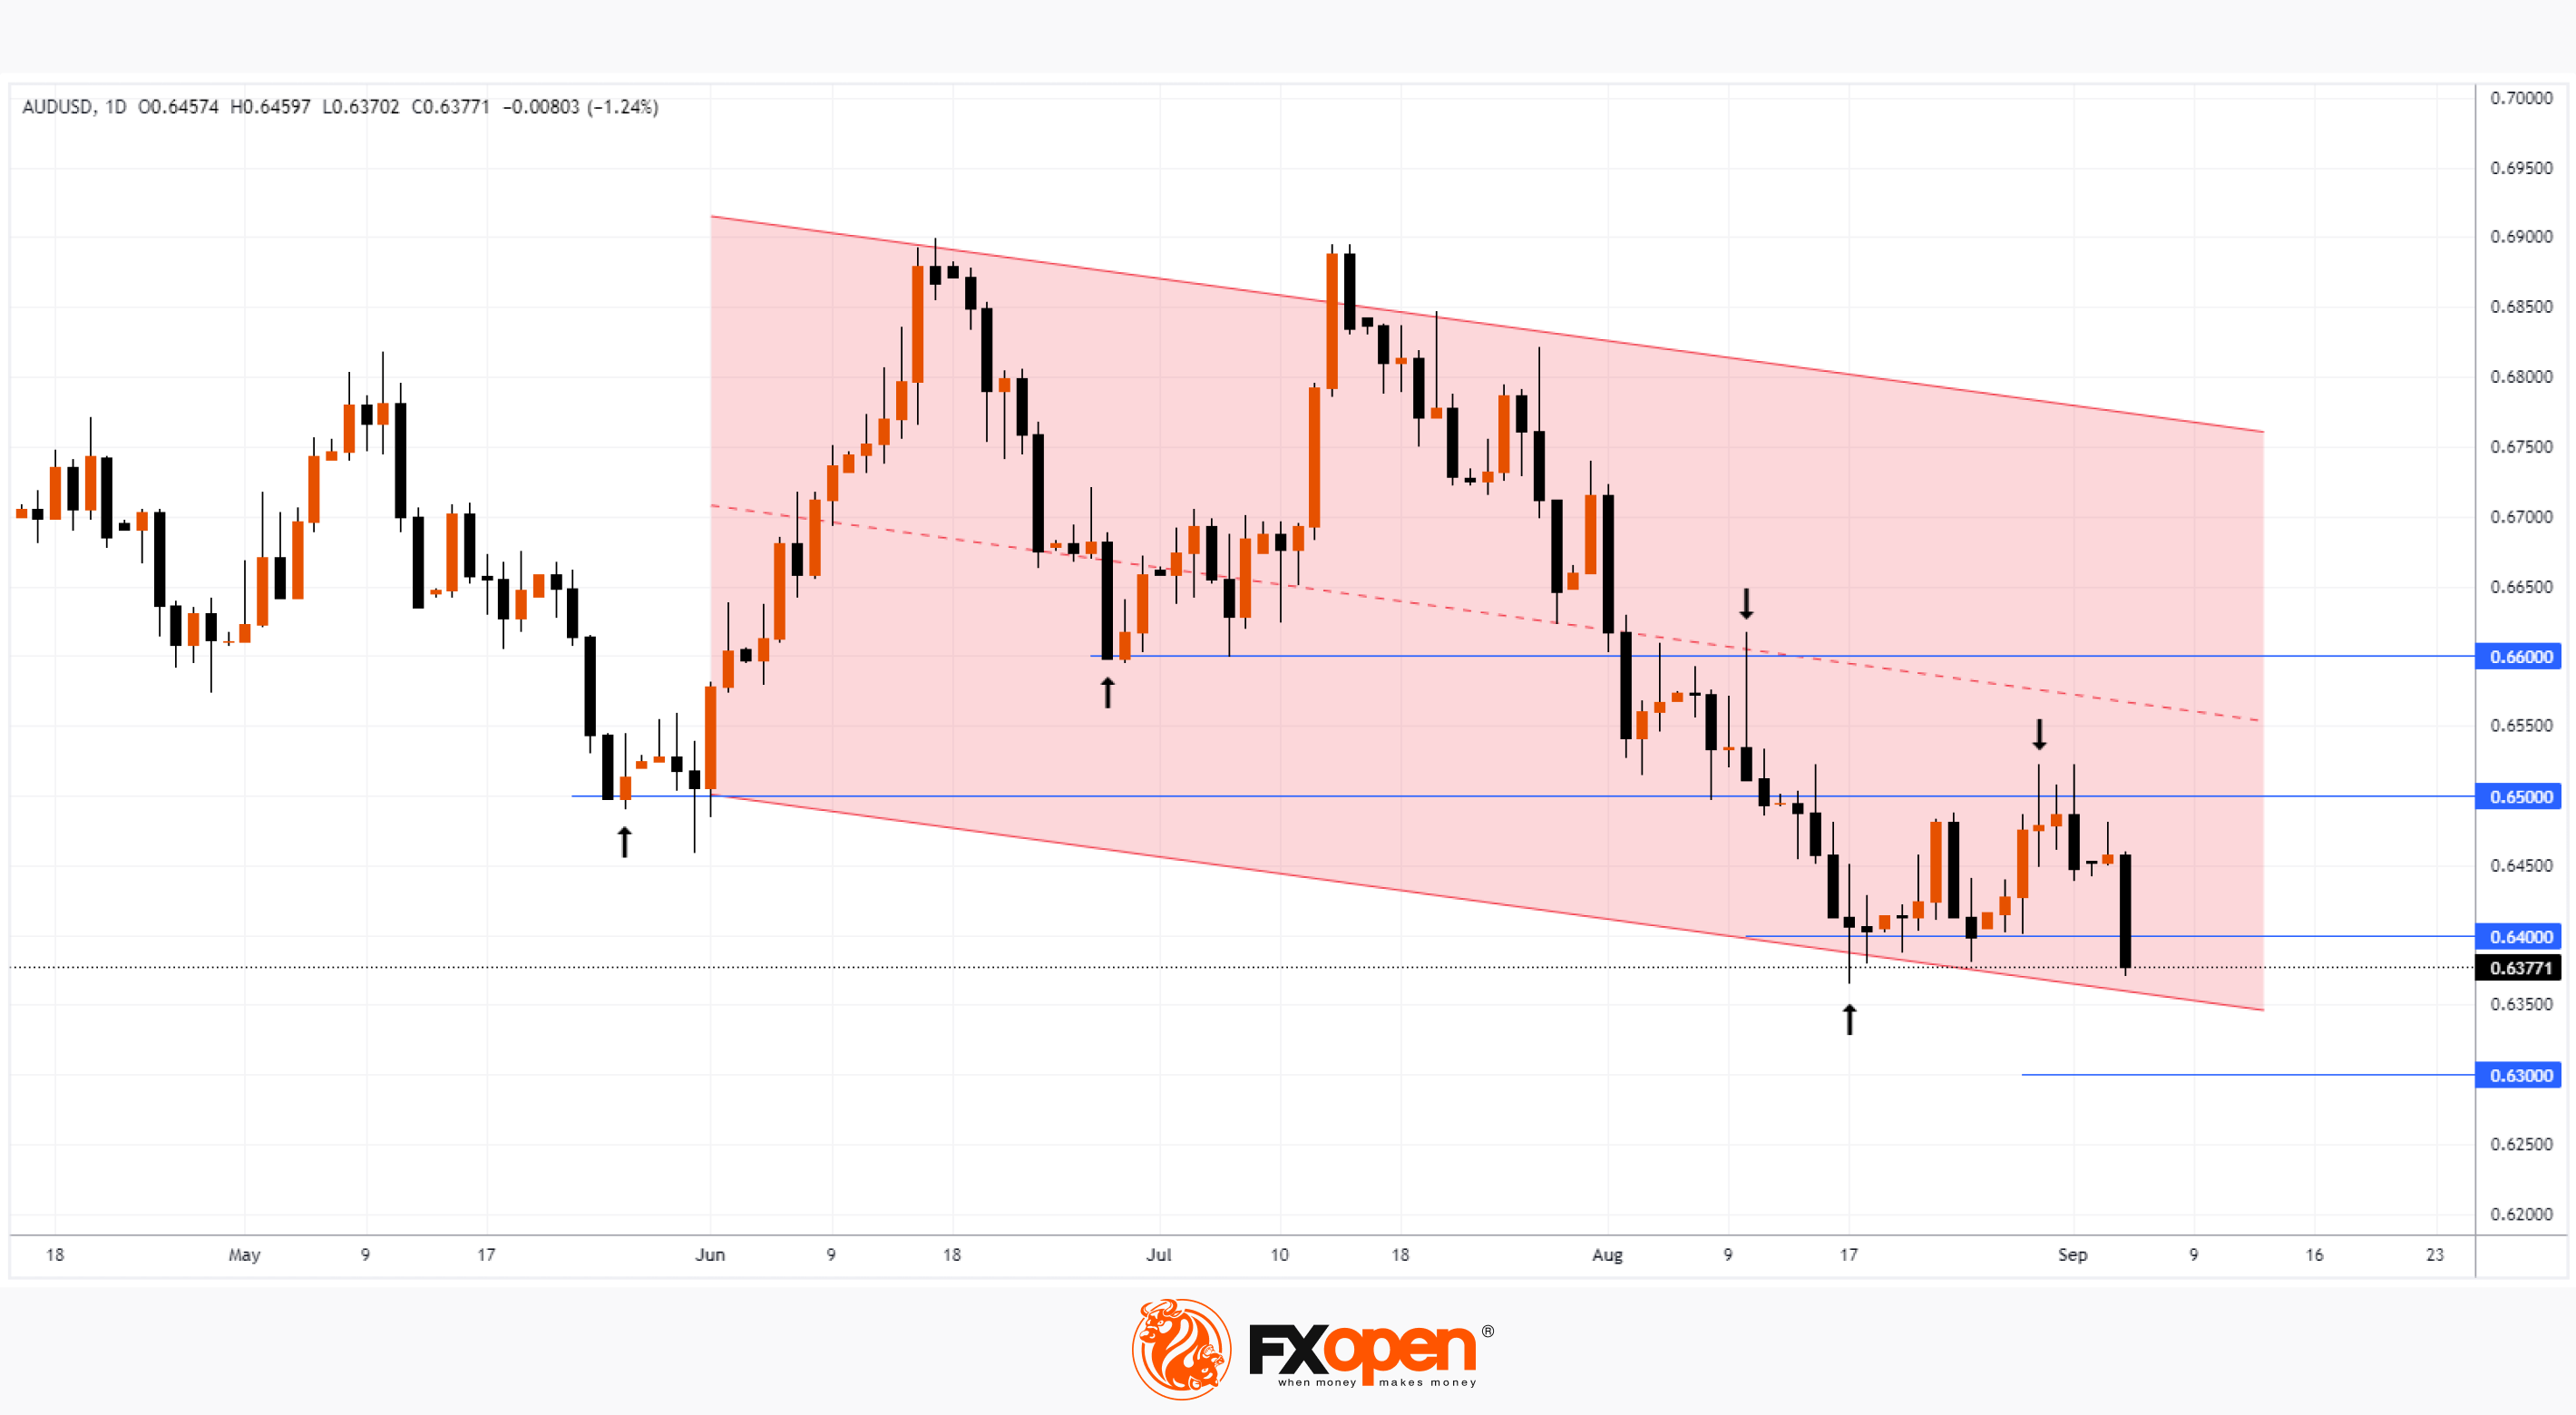
Reacting to the results of the RBA meeting, the AUD/USD rate fell to the lows of the year, to the level of 0.637.
The bullish argument is that the market may find support for the lower boundary of the descending channel. However, the price fell below the 0.64 level. It is possible that now it will work as a resistance on the principle of mirror levels — the chart shows that this was the case with the levels of 0.66 and 0.65. Following this sequence, the next bearish target is 0.63.
To benefit from trends in the currency markets, consider enlisting the services of a trusted broker like FXOpen.
CFDs are complex instruments and come with a high risk of losing your money.
This article represents the opinion of the Companies operating under the FXOpen brand only. It is not to be construed as an offer, solicitation, or recommendation with respect to products and services provided by the Companies operating under the FXOpen brand, nor is it to be considered financial advice.
Market Analysis: AUD/USD Falls Sharply after the Decision of the Reserve Bank of Australia
The Reserve Bank of Australia (RBA) kept interest rates at 4.10% for the third month today, fueling rumors that the tightening cycle is over. Although according to Reuters, the majority of economists polled by the agency expect another increase by the end of the year after the release of the inflation report for the third quarter.
In the words of RBA chief Philip Lowe today:
→ data indicate that inflation could return to the 2-3% target range at the end of 2025;
→ the labor market remains strong and the economy operates at a high level of capacity utilization, although its development has slowed down;
→ further tightening is still acceptable if inflation is to be suppressed, which stands at 4.9% in July (at an 18-month low).
Reacting to the results of the RBA meeting, the AUD/USD rate fell to the lows of the year, to the level of 0.637.
The bullish argument is that the market may find support for the lower boundary of the descending channel. However, the price fell below the 0.64 level. It is possible that now it will work as a resistance on the principle of mirror levels — the chart shows that this was the case with the levels of 0.66 and 0.65. Following this sequence, the next bearish target is 0.63.
To benefit from trends in the currency markets, consider enlisting the services of a trusted broker like FXOpen.
CFDs are complex instruments and come with a high risk of losing your money.
This article represents the opinion of the Companies operating under the FXOpen brand only. It is not to be construed as an offer, solicitation, or recommendation with respect to products and services provided by the Companies operating under the FXOpen brand, nor is it to be considered financial advice.
#marketanalysis #usdollar #tradingforex
Market Analysis: The US Dollar Strengthens to a Maximum of Six Months
On Tuesday, financial market participants received a piece of data that gives signs of a slowdown in economies in different countries. Namely, the PMI index (an index of purchasing managers, which is considered a leading economic indicator) showed a negative trend in China and a number of European countries.
This led to a decrease in exchange rates against the US dollar.
Today, the US PMI data will be released, which is likely to affect the current strength of the US dollar index, as well as provide important information for the Fed's interest rate decision. The next meeting will be held on September 19-20.
According to the CME FEDWatch tool, there is a 7% chance that rates will be raised in September. However, the probability that it will be increased by the end of the year is about 45%.
“I can well imagine, from what I see so far, that we might have to go a bit higher, that we might have to raise the policy rate a bit more,” Cleveland Fed President Loretta Mester said in an interview with German newspaper Börsen-Zeitung published on Tuesday.
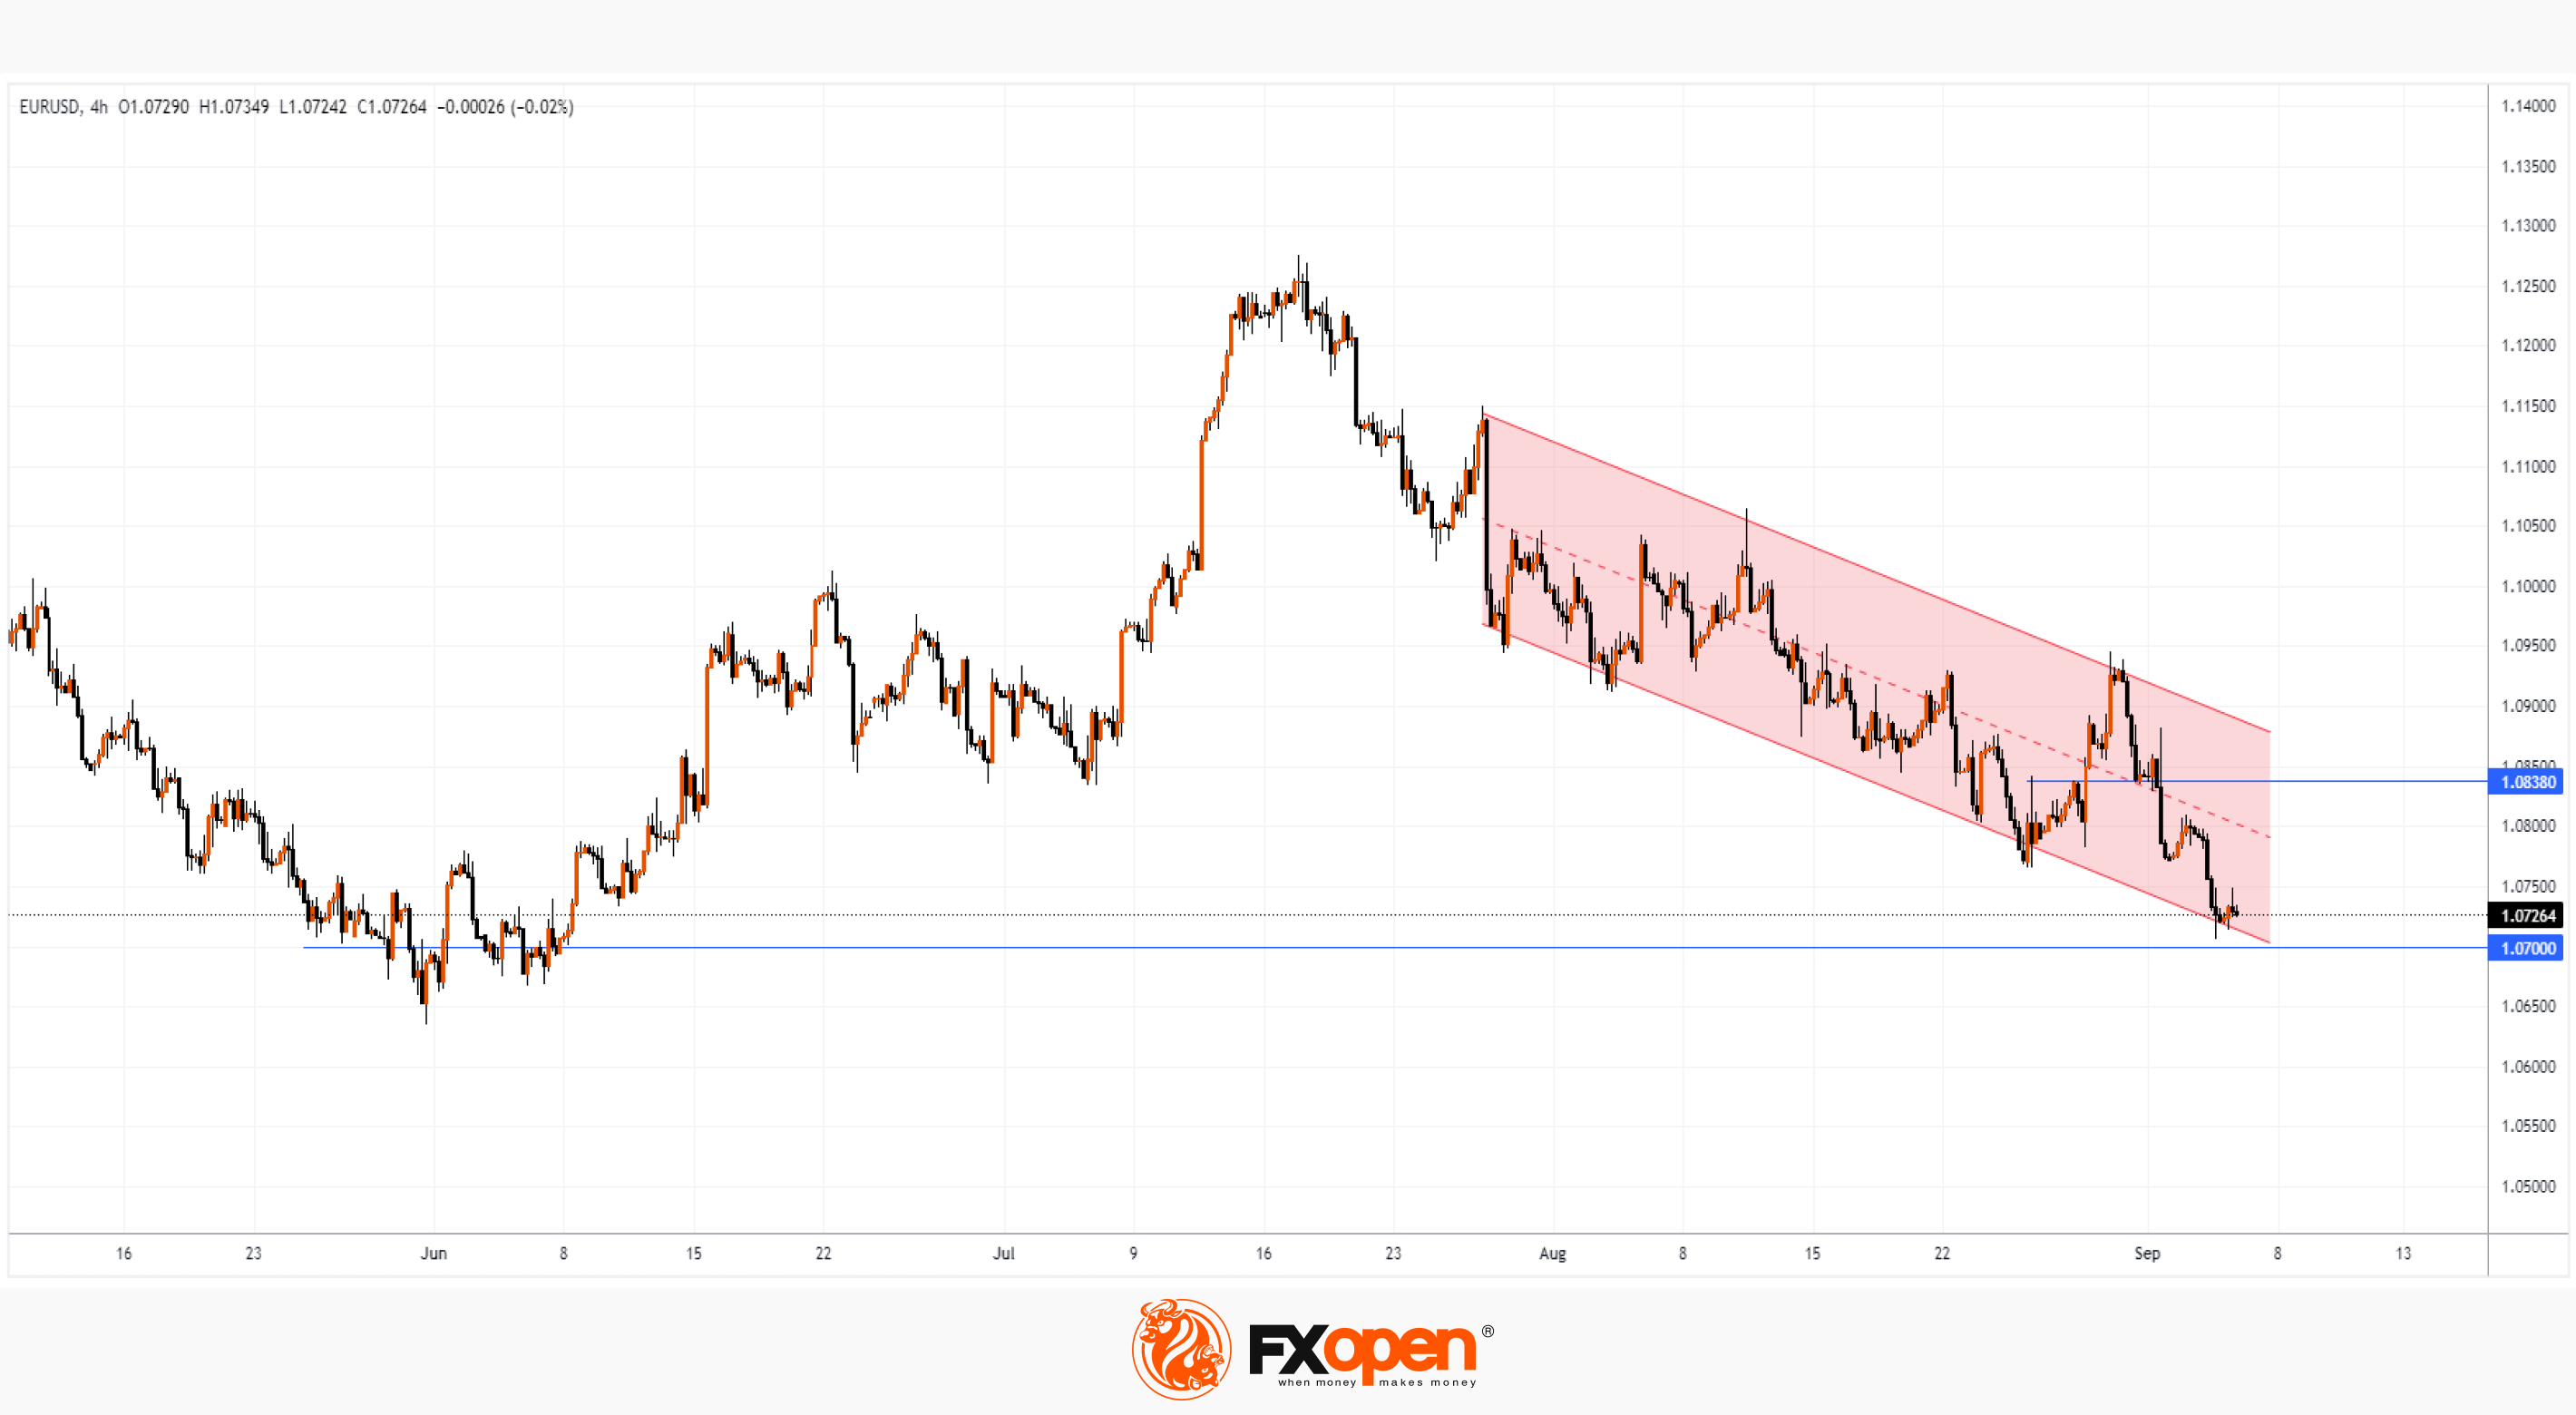
The EUR/USD chart shows that the rate is approaching an important support — the level of 1.07.
Bearish arguments:
→ throughout August, the EUR/USD rate was in a downtrend. And trends can last longer than market participants think. Growth resistance can be expected from the median line of the channel and its upper border.
→ PMI data in the US may be stronger than in Europe, and this will further strengthen the dollar against the euro.
→ level 1.0838 is seen as a local resistance.
Bulls can look to the 1.07 level, an important support that reversed the bearish momentum in the summer. It is possible that something similar will happen again in the fall. In case of a bearish breakout, the 1.07 level will become an important resistance.
To benefit from trends in the currency markets, consider enlisting the services of a trusted broker like FXOpen.
CFDs are complex instruments and come with a high risk of losing your money.
This article represents the opinion of the Companies operating under the FXOpen brand only. It is not to be construed as an offer, solicitation, or recommendation with respect to products and services provided by the Companies operating under the FXOpen brand, nor is it to be considered financial advice.
Market Analysis: The US Dollar Strengthens to a Maximum of Six Months
On Tuesday, financial market participants received a piece of data that gives signs of a slowdown in economies in different countries. Namely, the PMI index (an index of purchasing managers, which is considered a leading economic indicator) showed a negative trend in China and a number of European countries.
This led to a decrease in exchange rates against the US dollar.
Today, the US PMI data will be released, which is likely to affect the current strength of the US dollar index, as well as provide important information for the Fed's interest rate decision. The next meeting will be held on September 19-20.
According to the CME FEDWatch tool, there is a 7% chance that rates will be raised in September. However, the probability that it will be increased by the end of the year is about 45%.
“I can well imagine, from what I see so far, that we might have to go a bit higher, that we might have to raise the policy rate a bit more,” Cleveland Fed President Loretta Mester said in an interview with German newspaper Börsen-Zeitung published on Tuesday.
The EUR/USD chart shows that the rate is approaching an important support — the level of 1.07.
Bearish arguments:
→ throughout August, the EUR/USD rate was in a downtrend. And trends can last longer than market participants think. Growth resistance can be expected from the median line of the channel and its upper border.
→ PMI data in the US may be stronger than in Europe, and this will further strengthen the dollar against the euro.
→ level 1.0838 is seen as a local resistance.
Bulls can look to the 1.07 level, an important support that reversed the bearish momentum in the summer. It is possible that something similar will happen again in the fall. In case of a bearish breakout, the 1.07 level will become an important resistance.
To benefit from trends in the currency markets, consider enlisting the services of a trusted broker like FXOpen.
CFDs are complex instruments and come with a high risk of losing your money.
This article represents the opinion of the Companies operating under the FXOpen brand only. It is not to be construed as an offer, solicitation, or recommendation with respect to products and services provided by the Companies operating under the FXOpen brand, nor is it to be considered financial advice.
#marketanalysis #stockmarket #nikkei225
Market Analysis: Nikkei 225 Reaches Psychological Level at 33,000
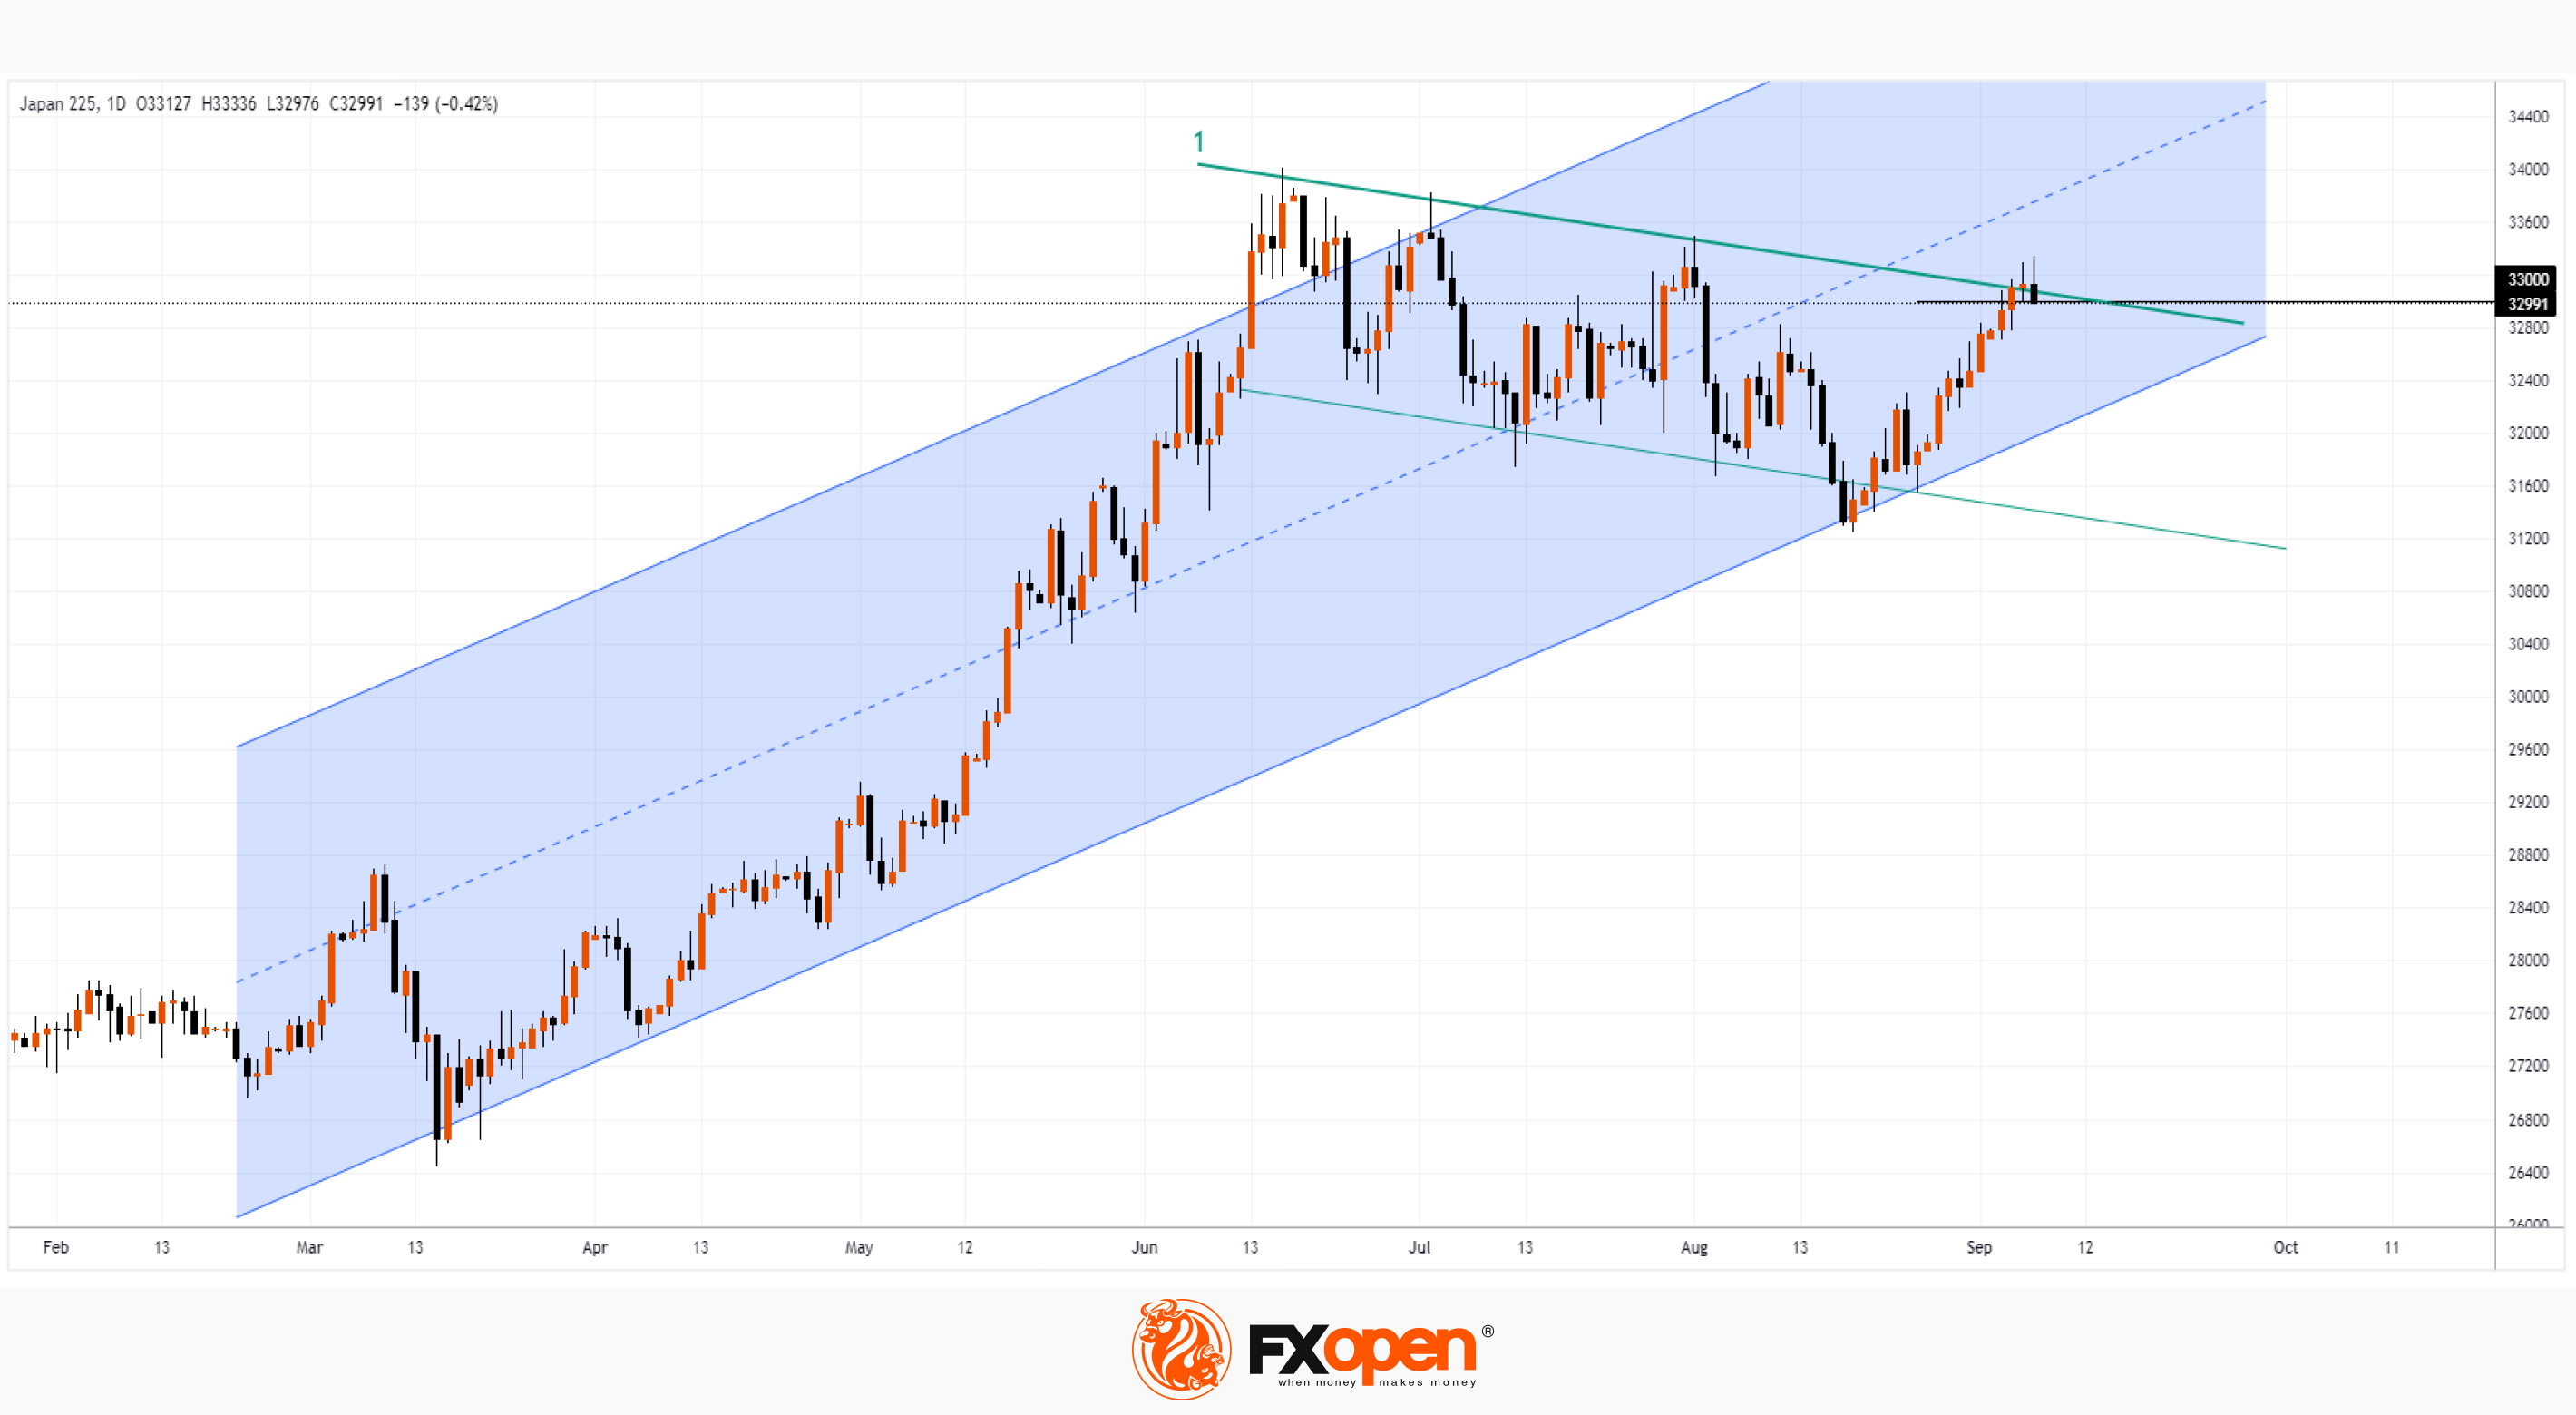
In 2023, Japan's stock market is in a bullish trend (shown by the blue channel) as the country has an ultra-loose monetary policy (unlike other G7 countries that are fighting inflation). As a result, the cheap yen helps Japanese companies, which are largely export-oriented, to develop. According to the Cabinet of Japan, GDP in the second quarter of 2023 increased by 2% compared to the same quarter of the previous year.
The growth of the Japanese stock market from the beginning of the year to today is about 28%. And on Sept. 5, the Nikkei 225 closed above the psychological 33,000 level. Yahoo Finance reports that Kenji Abe, Daiwa Securities equity strategist, predicts the Nikkei could gradually rise to 35,000 after a strong reporting season this summer.
Bearish arguments:
→ the level of 33,000 points can serve as psychological resistance. After the Doji candle on September 6 (which can be interpreted as the uncertainty of market participants in the continuation of growth), the price dropped on the morning of September 7, which confirms the weakening of demand.
→ line (1), built on the highs of summer, can provide resistance.
However, the bullish argument is that the line (1) is an element of the flag technical analysis pattern. If the pattern works, then we should expect its breakdown and the continuation of the trend in 2023. How likely this scenario is can be judged by the depth of the rollback from the line (1), which is already looming on the chart.
To benefit from fluctuations in stock markets, consider enlisting the services of a trusted broker like FXOpen.
CFDs are complex instruments and come with a high risk of losing your money.
This article represents the opinion of the Companies operating under the FXOpen brand only. It is not to be construed as an offer, solicitation, or recommendation with respect to products and services provided by the Companies operating under the FXOpen brand, nor is it to be considered financial advice.
Market Analysis: Nikkei 225 Reaches Psychological Level at 33,000
In 2023, Japan's stock market is in a bullish trend (shown by the blue channel) as the country has an ultra-loose monetary policy (unlike other G7 countries that are fighting inflation). As a result, the cheap yen helps Japanese companies, which are largely export-oriented, to develop. According to the Cabinet of Japan, GDP in the second quarter of 2023 increased by 2% compared to the same quarter of the previous year.
The growth of the Japanese stock market from the beginning of the year to today is about 28%. And on Sept. 5, the Nikkei 225 closed above the psychological 33,000 level. Yahoo Finance reports that Kenji Abe, Daiwa Securities equity strategist, predicts the Nikkei could gradually rise to 35,000 after a strong reporting season this summer.
Bearish arguments:
→ the level of 33,000 points can serve as psychological resistance. After the Doji candle on September 6 (which can be interpreted as the uncertainty of market participants in the continuation of growth), the price dropped on the morning of September 7, which confirms the weakening of demand.
→ line (1), built on the highs of summer, can provide resistance.
However, the bullish argument is that the line (1) is an element of the flag technical analysis pattern. If the pattern works, then we should expect its breakdown and the continuation of the trend in 2023. How likely this scenario is can be judged by the depth of the rollback from the line (1), which is already looming on the chart.
To benefit from fluctuations in stock markets, consider enlisting the services of a trusted broker like FXOpen.
CFDs are complex instruments and come with a high risk of losing your money.
This article represents the opinion of the Companies operating under the FXOpen brand only. It is not to be construed as an offer, solicitation, or recommendation with respect to products and services provided by the Companies operating under the FXOpen brand, nor is it to be considered financial advice.
#MarketNews #forex #forextrading
USD/CAD Analysis: How the Bank of Canada Decision Affected the National Currency
Yesterday it became known that the Bank of Canada (BOC) decided to keep the rate at 5% — the highest level in 22 years.
Here are the key takeaways from CEO Tiff Macklem's press conference:
→ excess demand is declining, but the BOC is remaining concerned about persistence of high inflation;
→ the labor market is gradually calming down, but wage growth remains high;
→ second-quarter GDP contraction attributed to a noticeable slowdown in consumption growth, a slowdown in housing market growth and the impact of wildfires across the country.
Although the decision to leave the rate unchanged is a move that economists expected in a Bloomberg survey, there has been some spike in volatility in the foreign exchange market. The first emotional reaction of market participants led to the depreciation of the CAD against other currencies. But at the end of the day, the Canadian dollar strengthened — apparently, market participants still see positive in the prospects of the Canadian economy, taking into account the statements of the head of the Bank of Canada.
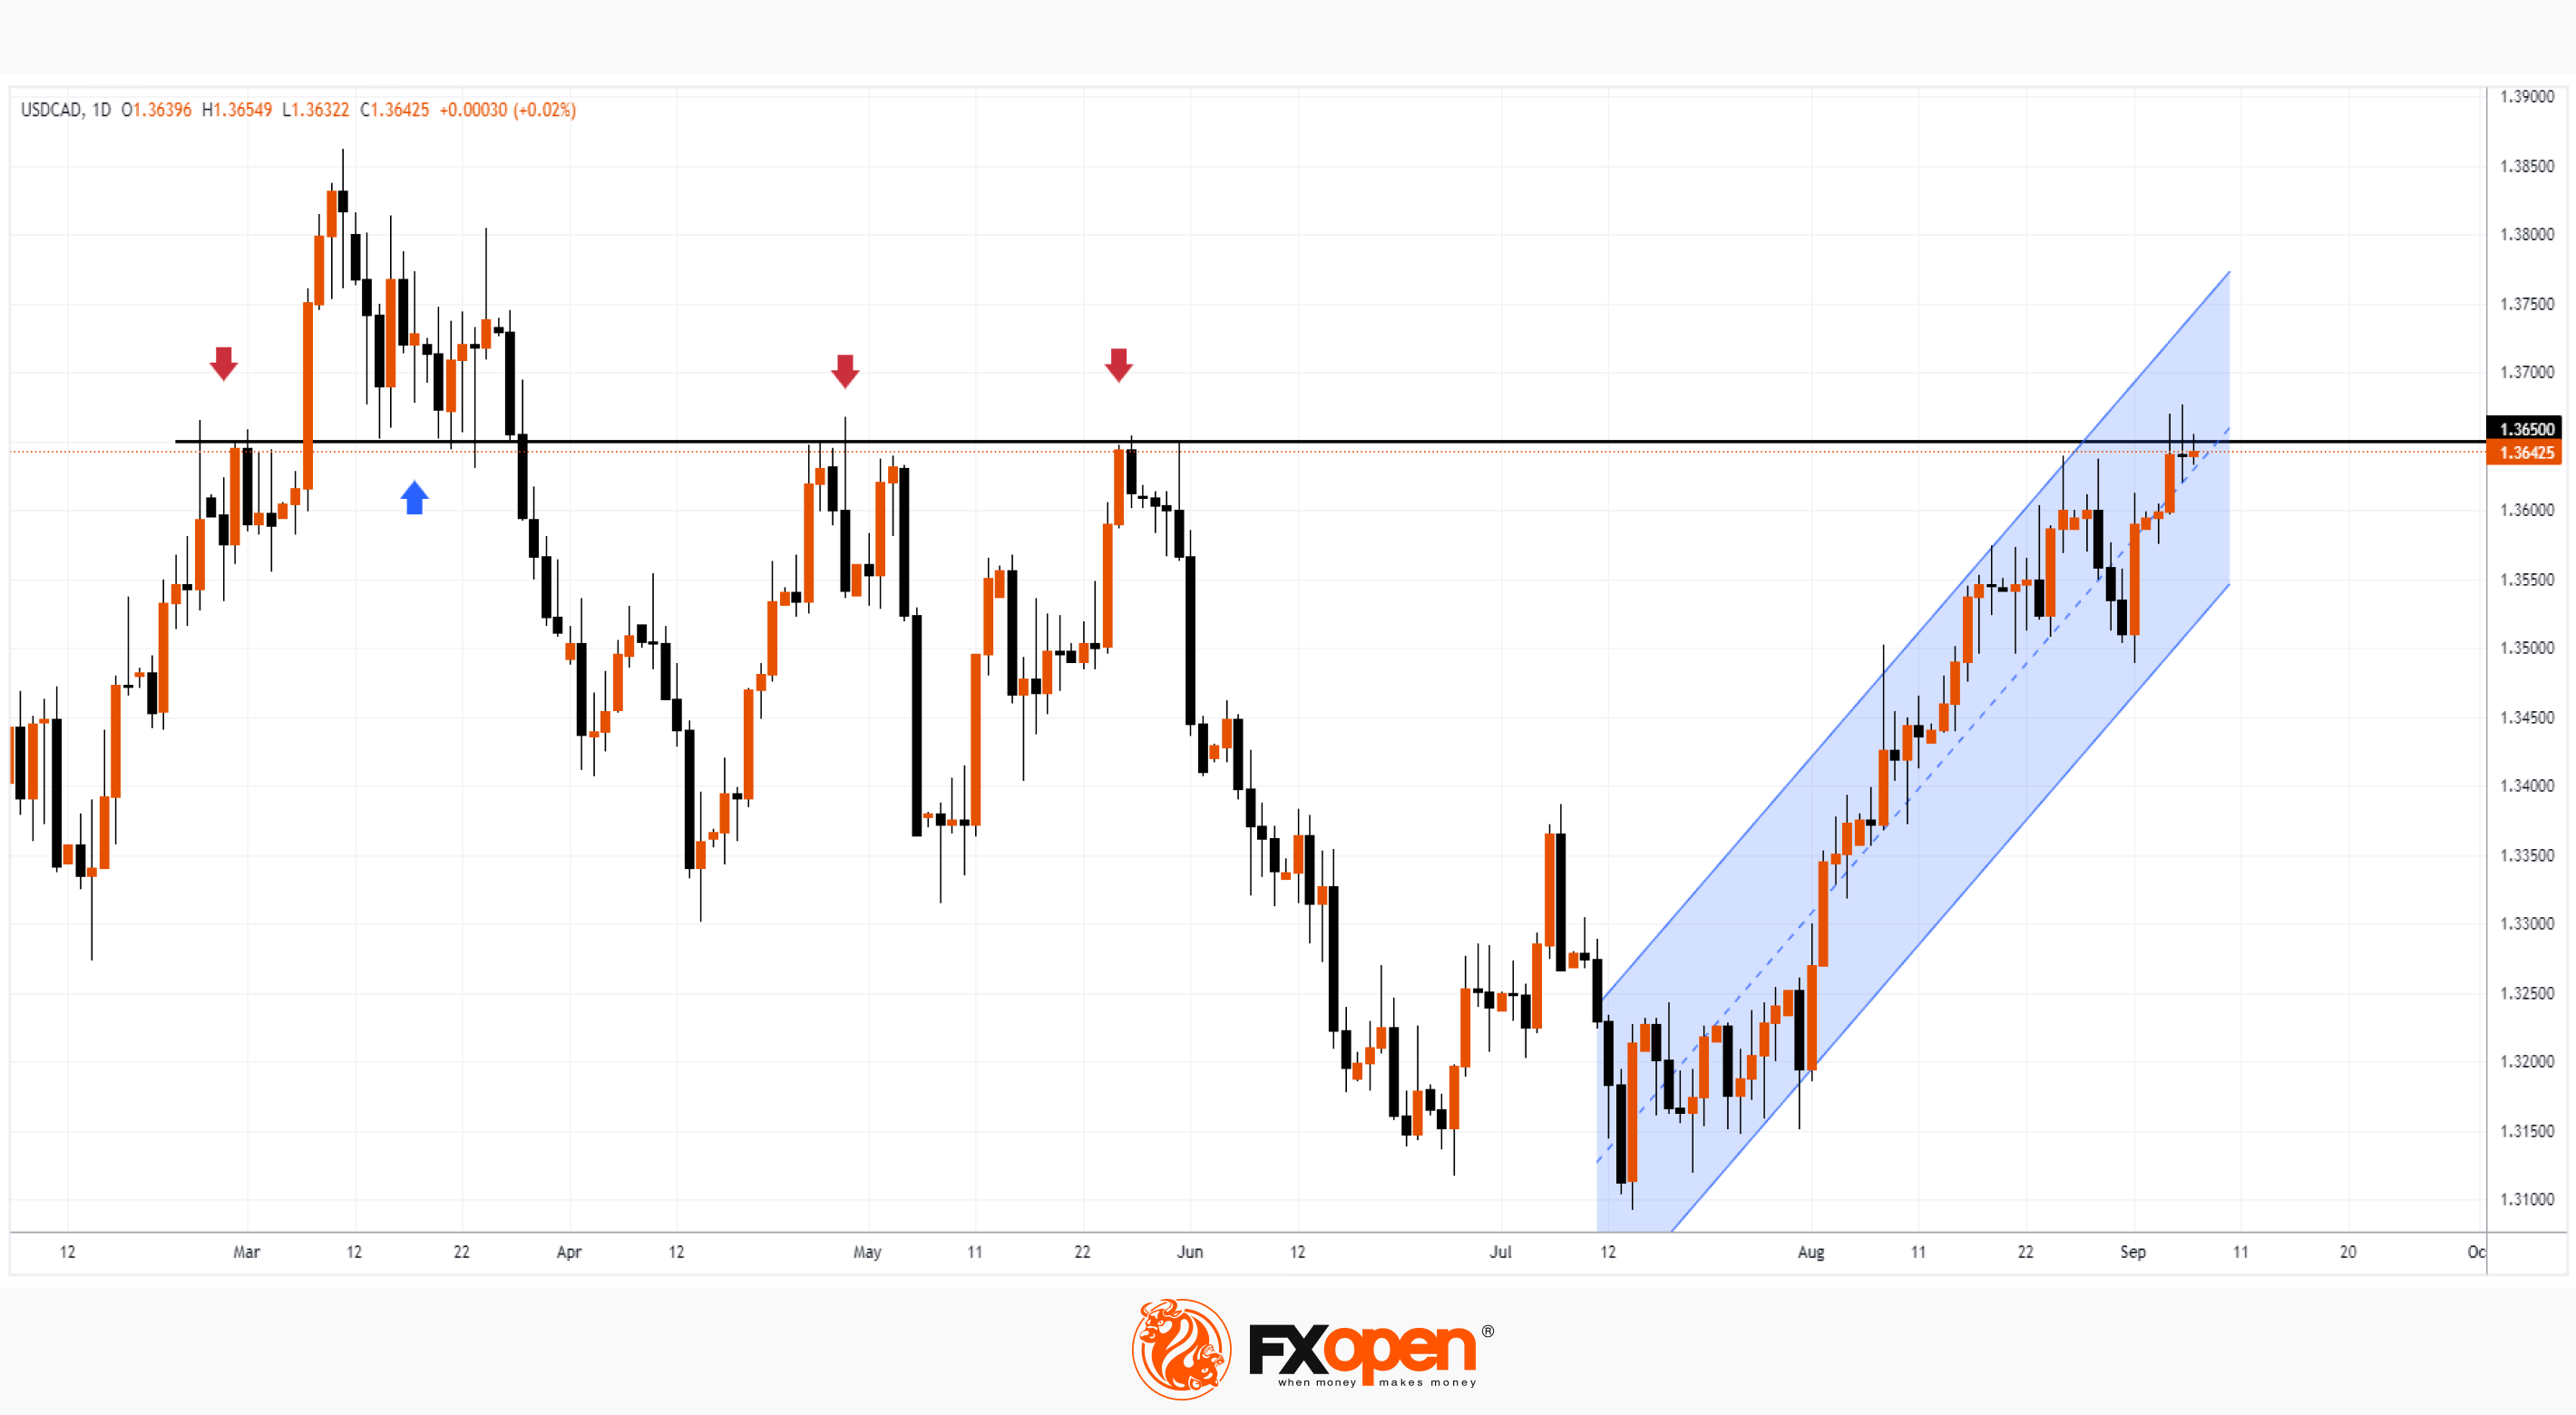
At the same time, an interesting situation is emerging on the USD/CAD chart – the rate has declined from the important level of 1.365, from which reversals were repeatedly formed earlier this year (as the arrows show). What can we say about the formation of another bearish reversal?
→ Long upper shadows on candles on September 5-6;
→ the two tops inside yesterday only slightly exceeded the top on September 5, which may indicate demand exhaustion and bear traps.
However, USD/CAD is in an uptrend (shown by the blue channel). And a scenario is not ruled out, in which the resistance of 1.365 will only cause a rollback within the channel. In this case, testing of its lower bound may occur.
To benefit from currency fluctuations, consider enlisting the services of a trusted broker like FXOpen.
CFDs are complex instruments and come with a high risk of losing your money.
This article represents the opinion of the Companies operating under the FXOpen brand only. It is not to be construed as an offer, solicitation, or recommendation with respect to products and services provided by the Companies operating under the FXOpen brand, nor is it to be considered financial advice.
USD/CAD Analysis: How the Bank of Canada Decision Affected the National Currency
Yesterday it became known that the Bank of Canada (BOC) decided to keep the rate at 5% — the highest level in 22 years.
Here are the key takeaways from CEO Tiff Macklem's press conference:
→ excess demand is declining, but the BOC is remaining concerned about persistence of high inflation;
→ the labor market is gradually calming down, but wage growth remains high;
→ second-quarter GDP contraction attributed to a noticeable slowdown in consumption growth, a slowdown in housing market growth and the impact of wildfires across the country.
Although the decision to leave the rate unchanged is a move that economists expected in a Bloomberg survey, there has been some spike in volatility in the foreign exchange market. The first emotional reaction of market participants led to the depreciation of the CAD against other currencies. But at the end of the day, the Canadian dollar strengthened — apparently, market participants still see positive in the prospects of the Canadian economy, taking into account the statements of the head of the Bank of Canada.
At the same time, an interesting situation is emerging on the USD/CAD chart – the rate has declined from the important level of 1.365, from which reversals were repeatedly formed earlier this year (as the arrows show). What can we say about the formation of another bearish reversal?
→ Long upper shadows on candles on September 5-6;
→ the two tops inside yesterday only slightly exceeded the top on September 5, which may indicate demand exhaustion and bear traps.
However, USD/CAD is in an uptrend (shown by the blue channel). And a scenario is not ruled out, in which the resistance of 1.365 will only cause a rollback within the channel. In this case, testing of its lower bound may occur.
To benefit from currency fluctuations, consider enlisting the services of a trusted broker like FXOpen.
CFDs are complex instruments and come with a high risk of losing your money.
This article represents the opinion of the Companies operating under the FXOpen brand only. It is not to be construed as an offer, solicitation, or recommendation with respect to products and services provided by the Companies operating under the FXOpen brand, nor is it to be considered financial advice.
#marketanalysis #AAPL #stockmarket
Apple in Trouble: Shares Fall More Than 3.5%
As a result of yesterday's trading, AAPL shares fell more than 3.5%.
The reason is in the news that came from China:
→ According to the WSJ, Chinese central government officials have been ordered not to use iPhones or bring them to the office. Apple's business is very vulnerable to tensions between China and the US, as most of the US company's products are made in China.
→ Chinese Huawei has developed a new high-speed phone that can become a serious competitor to the iPhone. The first batch of the phone, the Mate 60 Pro, priced at USD 960 on a limited pre-order basis, sold out in a matter of hours, causing a sensation on Chinese social media.
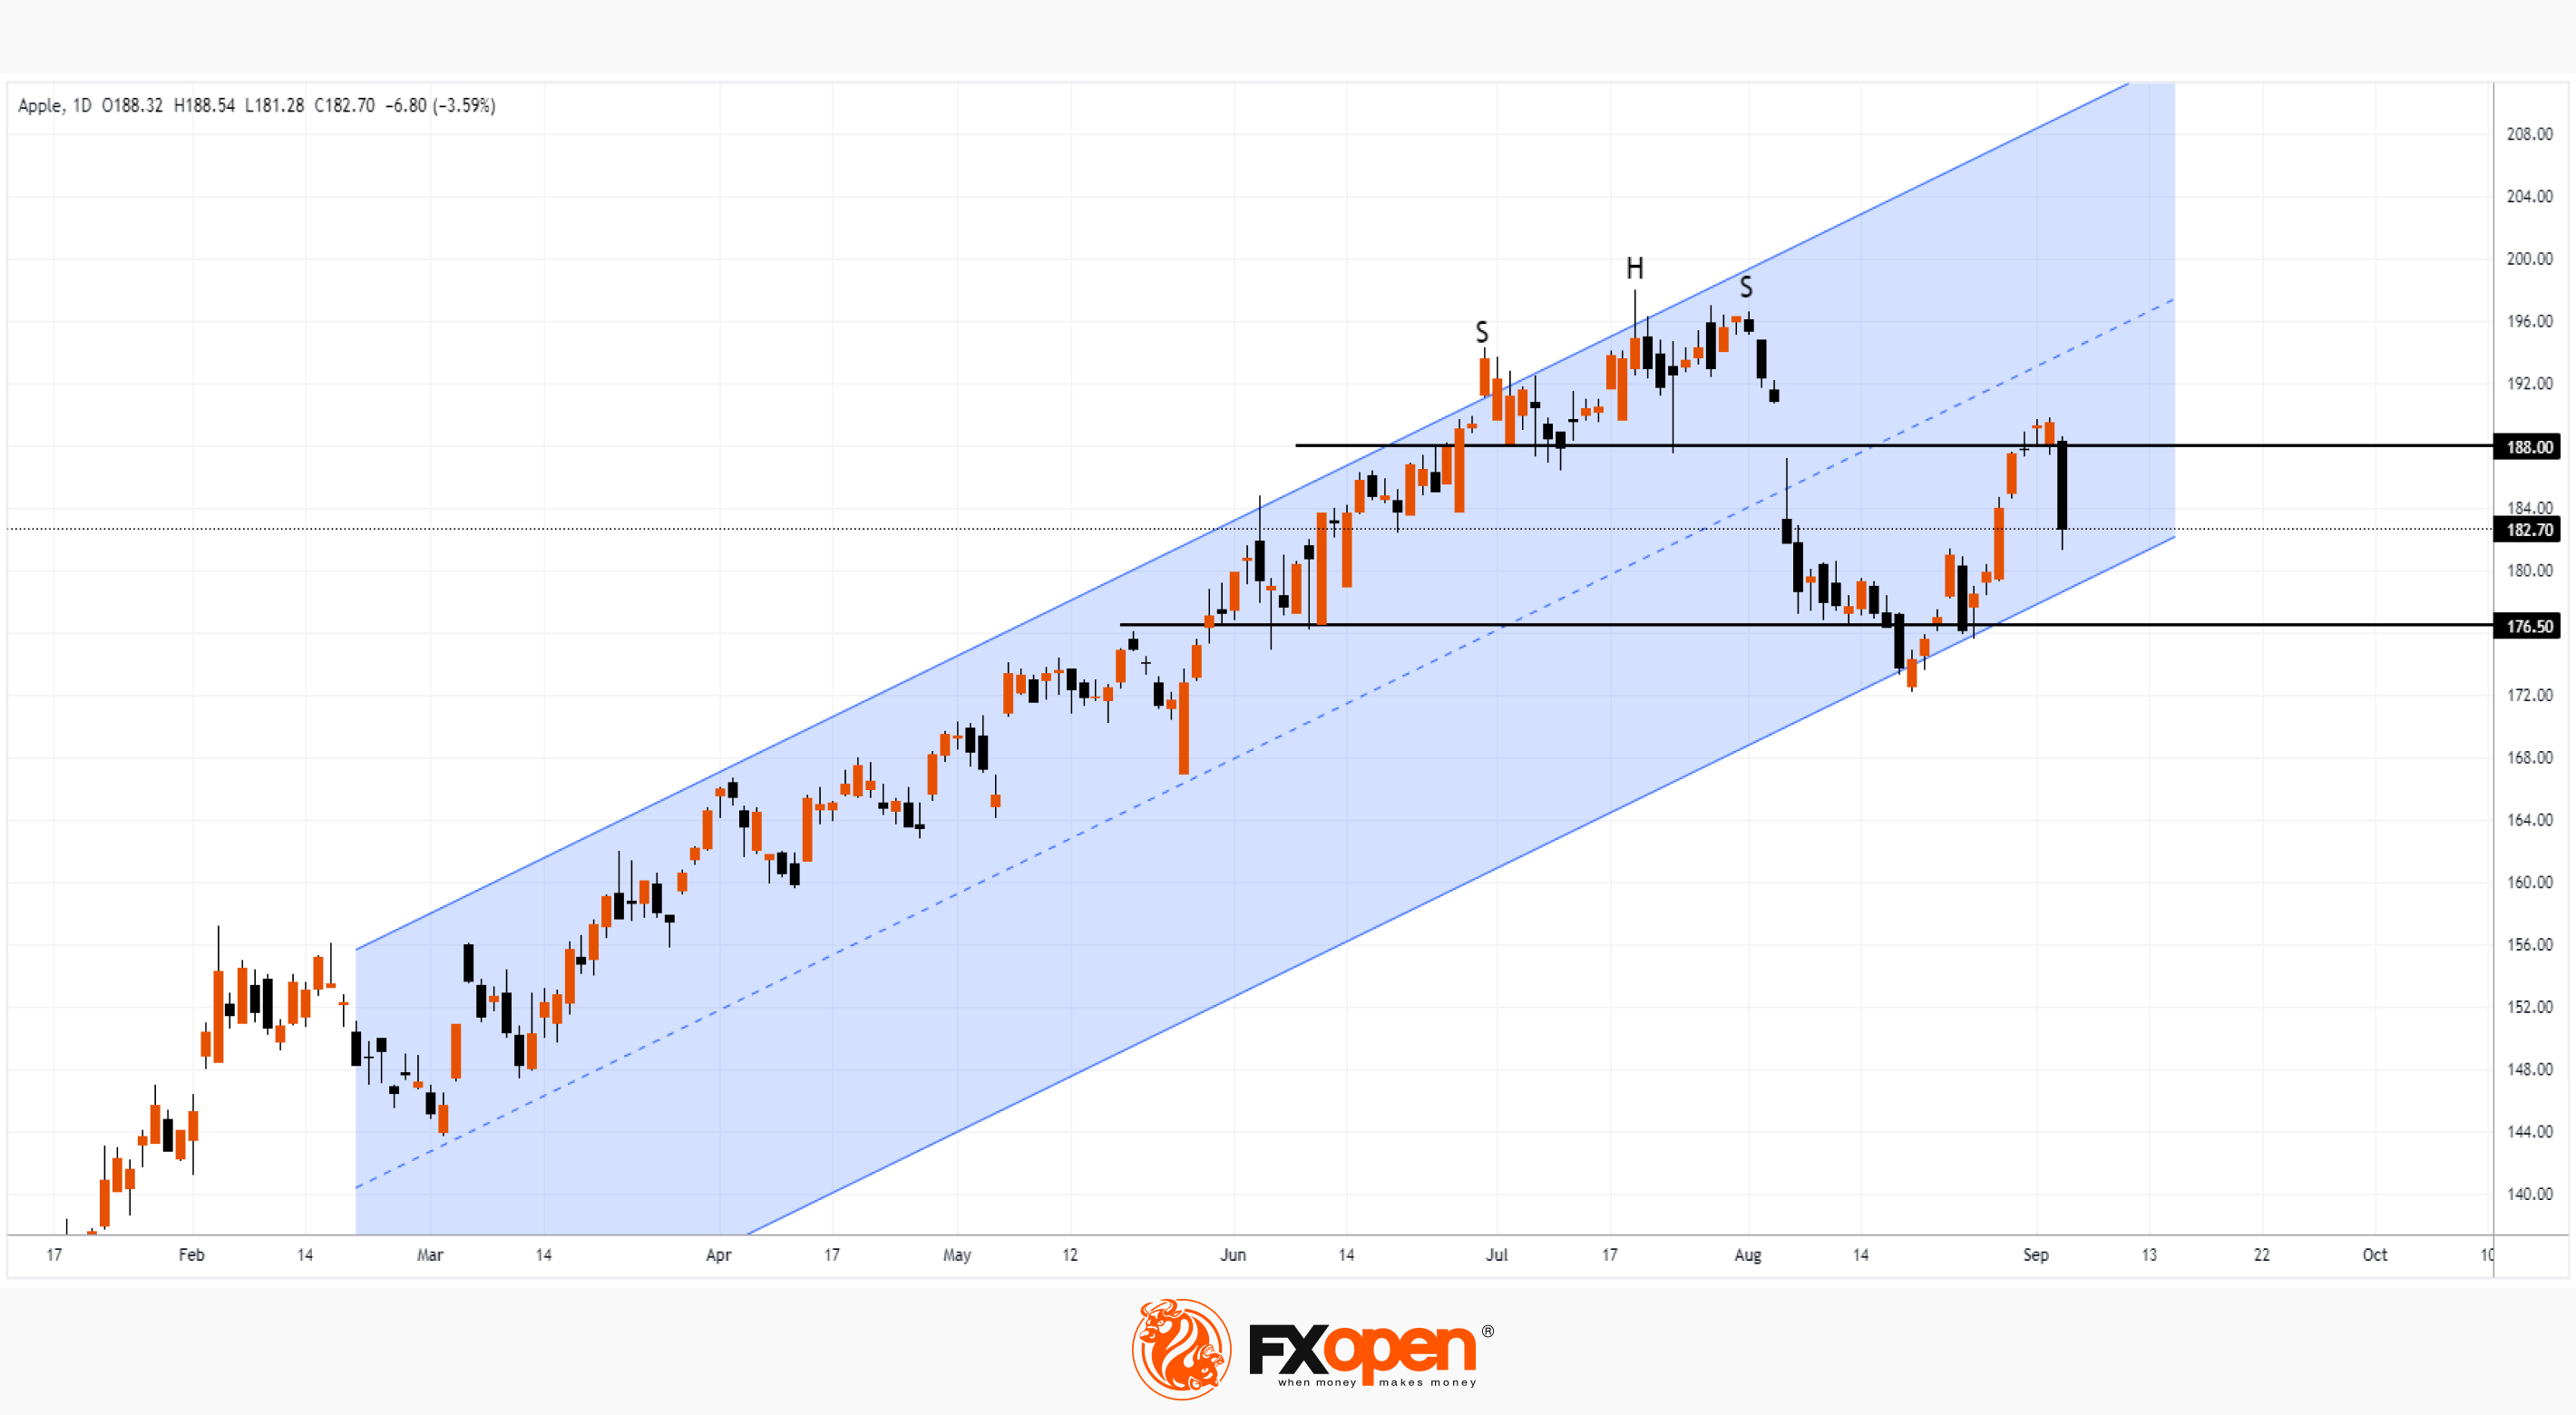
With the SHS pattern in the background, AAPL shares are technically weak:
→ the price has tested the bearish gap formed at the beginning of August;
→ USD 188/share AAPL, which acted as support in July, now appears to be resisting;
→ after the August reversal from the lower border of the channel (shown in blue), the bulls failed to return to the upper half of the channel.
Bulls can oppose a serious argument — the price is in an upward channel. And AAPL is one of the leaders in the NASDAQ Technology Index, which is rising on the AI-related boom.
However, AAPL's share price continued to decline in premarket trading, dropping below the USD 180 level, and thus threatening a bearish breakdown of the rising channel in 2023. The nearest support is the level of 176.50, where earlier the price slowed down the fall or turned up.
To benefit from the rise and fall of AAPL stock and/or other technology stocks, consider enlisting the services of a trusted broker like FXOpen.
CFDs are complex instruments and come with a high risk of losing your money.
This article represents the opinion of the Companies operating under the FXOpen brand only. It is not to be construed as an offer, solicitation, or recommendation with respect to products and services provided by the Companies operating under the FXOpen brand, nor is it to be considered financial advice.
Apple in Trouble: Shares Fall More Than 3.5%
As a result of yesterday's trading, AAPL shares fell more than 3.5%.
The reason is in the news that came from China:
→ According to the WSJ, Chinese central government officials have been ordered not to use iPhones or bring them to the office. Apple's business is very vulnerable to tensions between China and the US, as most of the US company's products are made in China.
→ Chinese Huawei has developed a new high-speed phone that can become a serious competitor to the iPhone. The first batch of the phone, the Mate 60 Pro, priced at USD 960 on a limited pre-order basis, sold out in a matter of hours, causing a sensation on Chinese social media.
With the SHS pattern in the background, AAPL shares are technically weak:
→ the price has tested the bearish gap formed at the beginning of August;
→ USD 188/share AAPL, which acted as support in July, now appears to be resisting;
→ after the August reversal from the lower border of the channel (shown in blue), the bulls failed to return to the upper half of the channel.
Bulls can oppose a serious argument — the price is in an upward channel. And AAPL is one of the leaders in the NASDAQ Technology Index, which is rising on the AI-related boom.
However, AAPL's share price continued to decline in premarket trading, dropping below the USD 180 level, and thus threatening a bearish breakdown of the rising channel in 2023. The nearest support is the level of 176.50, where earlier the price slowed down the fall or turned up.
To benefit from the rise and fall of AAPL stock and/or other technology stocks, consider enlisting the services of a trusted broker like FXOpen.
CFDs are complex instruments and come with a high risk of losing your money.
This article represents the opinion of the Companies operating under the FXOpen brand only. It is not to be construed as an offer, solicitation, or recommendation with respect to products and services provided by the Companies operating under the FXOpen brand, nor is it to be considered financial advice.
#marketanalysis #MarketNews
Market Analysis: Chinese Yuan Falls to Year's Low
Why is the yuan falling?
→ Strong US dollar. Yesterday it became known that the number of applications for unemployment benefits in the US amounted to 216k for the week — below the forecast of 232k applications. This is the lowest level since February.
→ Worsening problems in the Chinese economy. Yesterday's data from the General Administration of Customs of the People's Republic of China showed that the volume of exports in August decreased by 8.8% in annual terms — the decline in exports is recorded for the fourth month in a row.
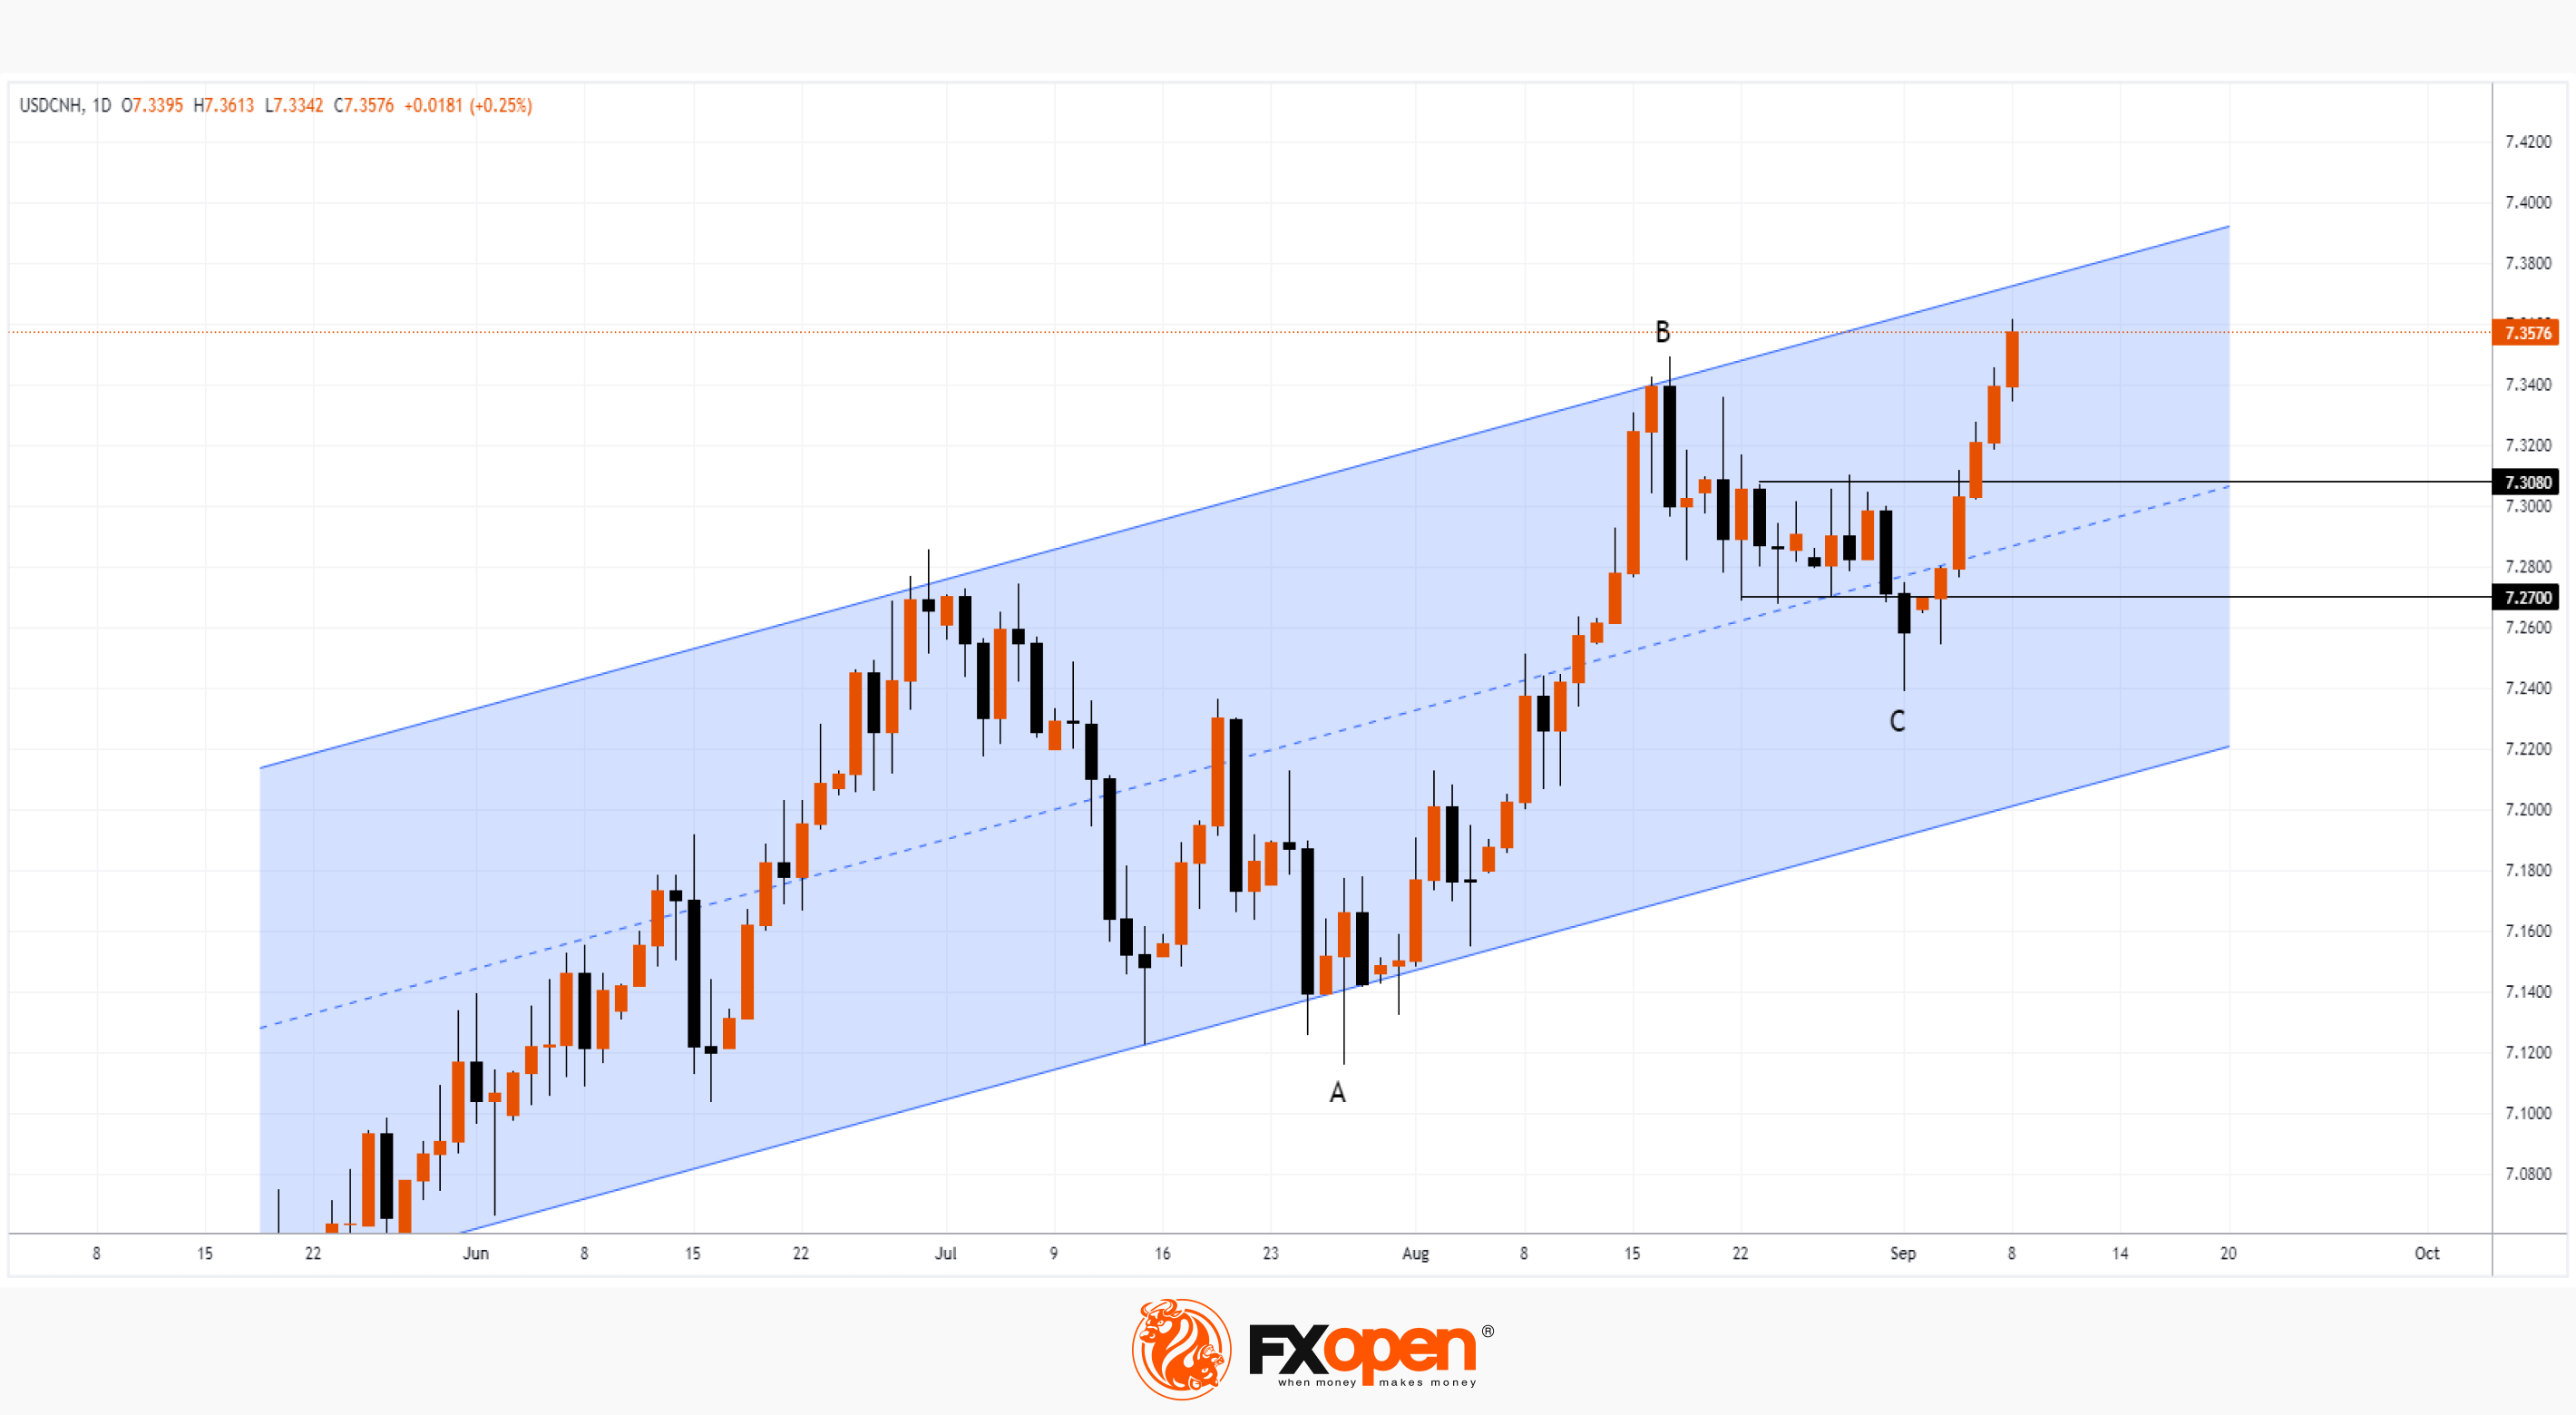
As the chart shows, the USD/CNH rate reached 7.36 today. According to some sources, this is not only the minimum for the yuan for 2023, but also the minimum for 16 years (it depends on whether the 2022 low is considered broken).
Bullish arguments:
→ The price is within the ascending channel. The dynamics develop in its upper part, which indicates the strength of the trend.
→ The price fell below 7.27 only for 1 day, forming a candle with a long lower shadow. The recovery occurred quickly, indicating the strength of demand.
→ The size of the B-C retracement corresponds to the size of 50% of the A-B impulse. This is the proportion for a normal correction within a stable trend.
→ 3 candles on September 5-7 can be classified as a bullish 3 White Soldiers pattern. Statistically, after the formation of the pattern, we should expect continued growth.
Bearish arguments:
→ If the trend continues, the rate may reach the upper boundary of the upper channel. There, the bulls can take profits, which will weaken the trend.
→ The FT reports the words of Ken Cheng, chief FX strategist for Asia at Mizuho Bank: “there is a growing likelihood that the People's Bank of China will adjust the currency band.” That is, as in the case of the yen, one should be prepared for government intervention in order to protect the currency.
To benefit from changes in exchange rates, consider enlisting the services of a trusted broker like FXOpen.
CFDs are complex instruments and come with a high risk of losing your money.
This article represents the opinion of the Companies operating under the FXOpen brand only. It is not to be construed as an offer, solicitation, or recommendation with respect to products and services provided by the Companies operating under the FXOpen brand, nor is it to be considered financial advice.
Market Analysis: Chinese Yuan Falls to Year's Low
Why is the yuan falling?
→ Strong US dollar. Yesterday it became known that the number of applications for unemployment benefits in the US amounted to 216k for the week — below the forecast of 232k applications. This is the lowest level since February.
→ Worsening problems in the Chinese economy. Yesterday's data from the General Administration of Customs of the People's Republic of China showed that the volume of exports in August decreased by 8.8% in annual terms — the decline in exports is recorded for the fourth month in a row.
As the chart shows, the USD/CNH rate reached 7.36 today. According to some sources, this is not only the minimum for the yuan for 2023, but also the minimum for 16 years (it depends on whether the 2022 low is considered broken).
Bullish arguments:
→ The price is within the ascending channel. The dynamics develop in its upper part, which indicates the strength of the trend.
→ The price fell below 7.27 only for 1 day, forming a candle with a long lower shadow. The recovery occurred quickly, indicating the strength of demand.
→ The size of the B-C retracement corresponds to the size of 50% of the A-B impulse. This is the proportion for a normal correction within a stable trend.
→ 3 candles on September 5-7 can be classified as a bullish 3 White Soldiers pattern. Statistically, after the formation of the pattern, we should expect continued growth.
Bearish arguments:
→ If the trend continues, the rate may reach the upper boundary of the upper channel. There, the bulls can take profits, which will weaken the trend.
→ The FT reports the words of Ken Cheng, chief FX strategist for Asia at Mizuho Bank: “there is a growing likelihood that the People's Bank of China will adjust the currency band.” That is, as in the case of the yen, one should be prepared for government intervention in order to protect the currency.
To benefit from changes in exchange rates, consider enlisting the services of a trusted broker like FXOpen.
CFDs are complex instruments and come with a high risk of losing your money.
This article represents the opinion of the Companies operating under the FXOpen brand only. It is not to be construed as an offer, solicitation, or recommendation with respect to products and services provided by the Companies operating under the FXOpen brand, nor is it to be considered financial advice.
#tradingtips #forexeducation #investingtips
📚 Enhance Your Trading Proficiency with Top Educational Resources!
At FXOpen, we believe that knowledge is the key to success in the financial markets. That’s why in this article, we will list the best websites, books, online trading classes, and other information sources that can help traders succeed.
We have curated a list of:
🔸 The Best Educational Resources for Traders;
🔸 Top Trading Courses to Be Aware Of;
🔸 Websites That Publish Economic News;
🔸 Books by Famous Traders
At FXOpen, we regularly update our blog with market analysis and educational articles for traders with any level of experience.
Follow us for regular updates, expert insights, and exclusive content that will propel your trading career to new heights! 🚀
https://cutt.ly/YwzorUnb
To take advantage of price fluctuations in the foreign exchange markets, consider enlisting the services of a reliable broker like FXOpen.
📚 Enhance Your Trading Proficiency with Top Educational Resources!
At FXOpen, we believe that knowledge is the key to success in the financial markets. That’s why in this article, we will list the best websites, books, online trading classes, and other information sources that can help traders succeed.
We have curated a list of:
🔸 The Best Educational Resources for Traders;
🔸 Top Trading Courses to Be Aware Of;
🔸 Websites That Publish Economic News;
🔸 Books by Famous Traders
At FXOpen, we regularly update our blog with market analysis and educational articles for traders with any level of experience.
Follow us for regular updates, expert insights, and exclusive content that will propel your trading career to new heights! 🚀
https://cutt.ly/YwzorUnb
To take advantage of price fluctuations in the foreign exchange markets, consider enlisting the services of a reliable broker like FXOpen.
Market Pulse
Educational Resources for Traders | FXOpen
Discover the best educational resources for traders, including trading classes. Find the most suitable online trading course for you and improve your skills.
#marketanalysis #BTCUSD #bitcoin
Market Analysis: Bitcoin Sets September High
The price of the main cryptocurrency rose above the level of 26k US dollars. This was fueled by the news that Ark Invest and 21Shares filed applications with the US Securities and Exchange Commission (SEC) for a spot ETF on Ethereum.
Some say recent verdicts in favor of cryptocurrency firms Grayscale and Ripple Labs in lawsuits against the SEC increase the chances that ETF applications for Ethereum will be approved. We also note that applications for bitcoin ETFs from BlackRock and other funds are being reviewed by the SEC, but the deadlines for these applications, originally set for early September, have been postponed to a later date.
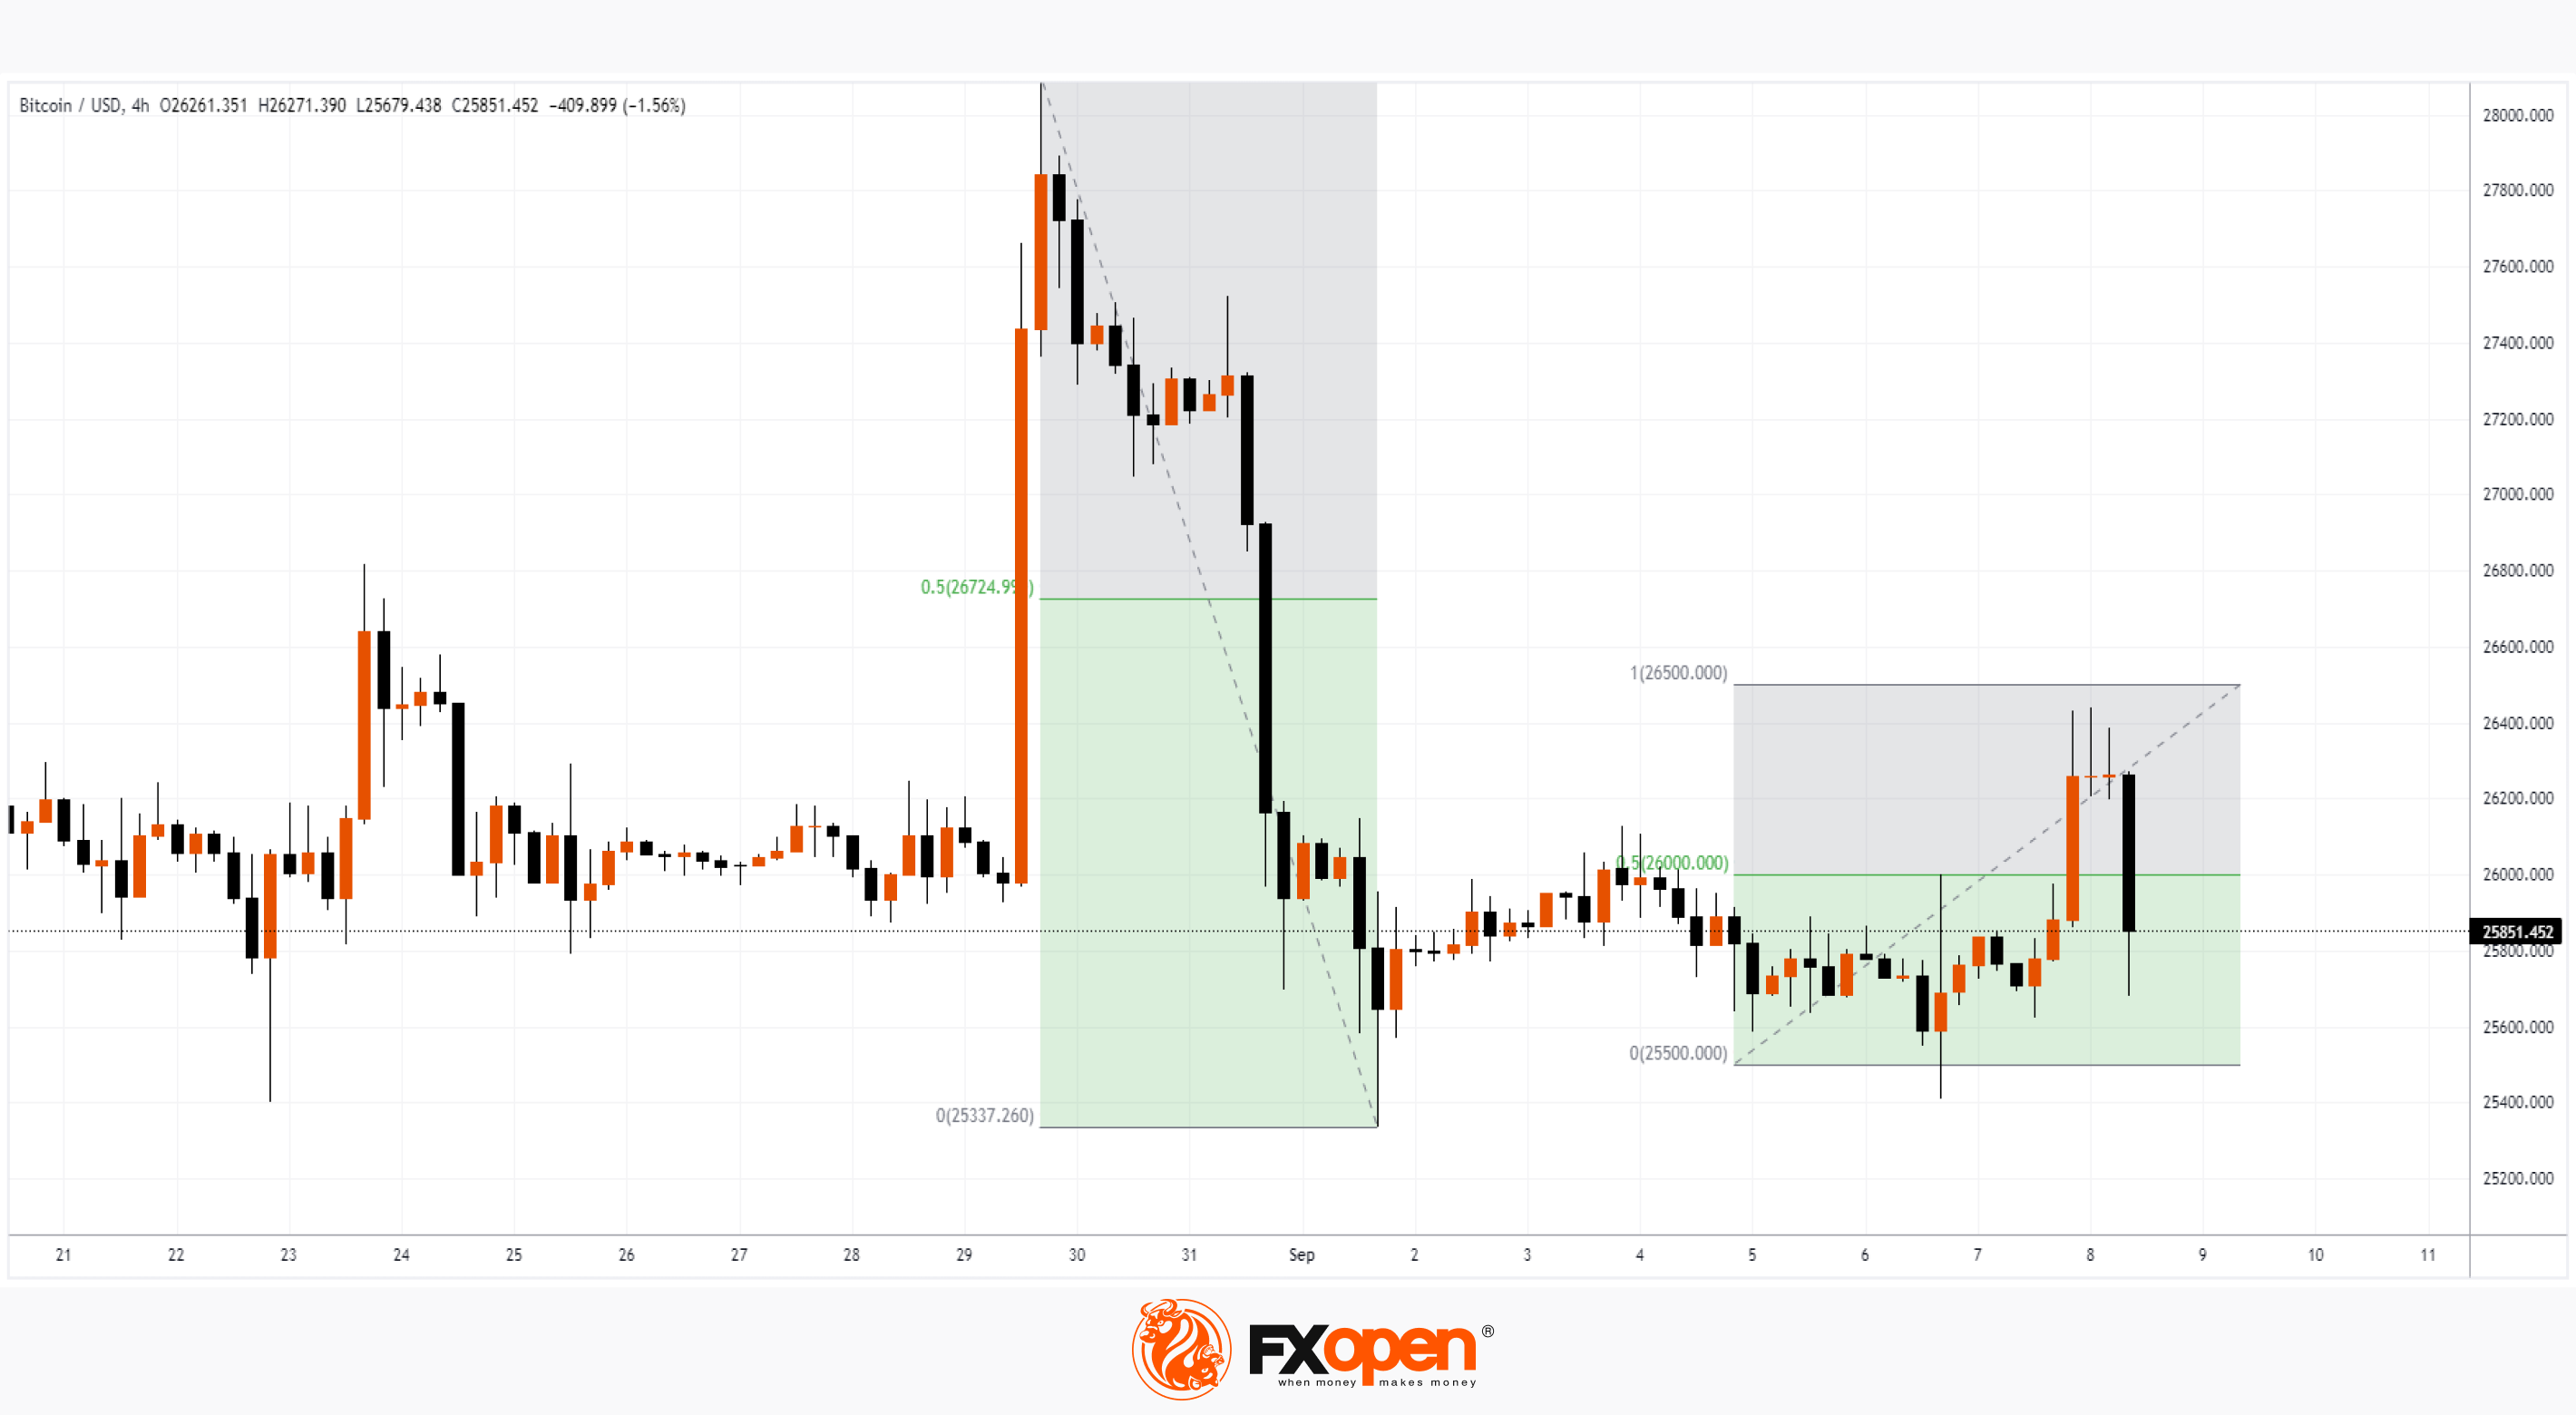
Meanwhile, Barrons writes that the NASDAQ exchange is preparing infrastructure for cryptocurrency trading, which is causing bullish sentiment among cryptocurrency enthusiasts. But the BTC/USD chart gives reason to doubt.
Bearish arguments:
→ The price of bitcoin did not exceed 50% of the sharp decline in late August and early September.
→ The price of bitcoin has not reached the target, which is built after the breakout based on the height of the previous consolidation zone (on the chart it is 25,500-26,000).
→ Long upper shadows have formed on the last candles, indicating the strength of offers above the 26k level.
It is reasonable to assume that future bid approvals will generate strong bullish momentum. The rally could also be caused by the hype around the halving and the easing of the Fed’s policy in 2024. But so far there are no strong drivers for growth, and, according to Coindesk data, the volume of spot cryptocurrency trading in August set a minimum for more than 4.5 years.
To benefit from the rise and fall of cryptocurrency prices, consider enlisting the services of a trusted broker like FXOpen.
CFDs are complex instruments and come with a high risk of losing your money.
This article represents the opinion of the Companies operating under the FXOpen brand only. It is not to be construed as an offer, solicitation, or recommendation with respect to products and services provided by the Companies operating under the FXOpen brand, nor is it to be considered financial advice.
At FXOpen UK and FXOpen AU, Cryptocurrency CFDs are only available for trading by those clients categorised as Professional clients under FCA Rules and Professional clients under ASIC Rules, respectively. They are not available for trading by Retail clients.
Market Analysis: Bitcoin Sets September High
The price of the main cryptocurrency rose above the level of 26k US dollars. This was fueled by the news that Ark Invest and 21Shares filed applications with the US Securities and Exchange Commission (SEC) for a spot ETF on Ethereum.
Some say recent verdicts in favor of cryptocurrency firms Grayscale and Ripple Labs in lawsuits against the SEC increase the chances that ETF applications for Ethereum will be approved. We also note that applications for bitcoin ETFs from BlackRock and other funds are being reviewed by the SEC, but the deadlines for these applications, originally set for early September, have been postponed to a later date.
Meanwhile, Barrons writes that the NASDAQ exchange is preparing infrastructure for cryptocurrency trading, which is causing bullish sentiment among cryptocurrency enthusiasts. But the BTC/USD chart gives reason to doubt.
Bearish arguments:
→ The price of bitcoin did not exceed 50% of the sharp decline in late August and early September.
→ The price of bitcoin has not reached the target, which is built after the breakout based on the height of the previous consolidation zone (on the chart it is 25,500-26,000).
→ Long upper shadows have formed on the last candles, indicating the strength of offers above the 26k level.
It is reasonable to assume that future bid approvals will generate strong bullish momentum. The rally could also be caused by the hype around the halving and the easing of the Fed’s policy in 2024. But so far there are no strong drivers for growth, and, according to Coindesk data, the volume of spot cryptocurrency trading in August set a minimum for more than 4.5 years.
To benefit from the rise and fall of cryptocurrency prices, consider enlisting the services of a trusted broker like FXOpen.
CFDs are complex instruments and come with a high risk of losing your money.
This article represents the opinion of the Companies operating under the FXOpen brand only. It is not to be construed as an offer, solicitation, or recommendation with respect to products and services provided by the Companies operating under the FXOpen brand, nor is it to be considered financial advice.
At FXOpen UK and FXOpen AU, Cryptocurrency CFDs are only available for trading by those clients categorised as Professional clients under FCA Rules and Professional clients under ASIC Rules, respectively. They are not available for trading by Retail clients.
#MarketNews #stockmarket #AAPL #nikkei225 #usdollar
Weekly Market Wrap With Gary Thomson: APPLE IN TROUBLE, DOLLAR STRENGTHENED, USD/CAD, NIKKEI 225
Get the latest scoop on the week's hottest headlines, all in one convenient video. Join Gary Thomson, the COO of FXOpen UK, as he breaks down the most significant news reports and shares his expert insights.
🔸The dollar strengthened to a maximum in six months
🔸Nikkei 225 reaches psychological level at 33,000
🔸USD/CAD analysis: how the decision of the Bank of Canada affected the national currency
🔸Apple in trouble: shares fall more than 3.5%
Stay in the know and empower yourself with our short, yet power-packed video. Watch it now and stay updated with FXOpen.
Don't miss out on this invaluable opportunity to sharpen your trading skills and make informed decisions.
https://cutt.ly/Jwzs7L1Y
To take advantage of price fluctuations in the foreign exchange markets, consider enlisting the services of a reliable broker like FXOpen.
⚠️
This forecast represents FXOpen Companies opinion only, it should not be construed as an offer, invitation or recommendation in respect to FXOpen Companies products and services or as financial advice
Weekly Market Wrap With Gary Thomson: APPLE IN TROUBLE, DOLLAR STRENGTHENED, USD/CAD, NIKKEI 225
Get the latest scoop on the week's hottest headlines, all in one convenient video. Join Gary Thomson, the COO of FXOpen UK, as he breaks down the most significant news reports and shares his expert insights.
🔸The dollar strengthened to a maximum in six months
🔸Nikkei 225 reaches psychological level at 33,000
🔸USD/CAD analysis: how the decision of the Bank of Canada affected the national currency
🔸Apple in trouble: shares fall more than 3.5%
Stay in the know and empower yourself with our short, yet power-packed video. Watch it now and stay updated with FXOpen.
Don't miss out on this invaluable opportunity to sharpen your trading skills and make informed decisions.
https://cutt.ly/Jwzs7L1Y
To take advantage of price fluctuations in the foreign exchange markets, consider enlisting the services of a reliable broker like FXOpen.
⚠️
This forecast represents FXOpen Companies opinion only, it should not be construed as an offer, invitation or recommendation in respect to FXOpen Companies products and services or as financial advice
YouTube
Weekly Market Wrap With Gary Thomson: APPLE IN TROUBLE, DOLLAR STRENGTHENED, USD/CAD, NIKKEI 225
Get the latest scoop on the week's hottest headlines, all in one convenient video. Join Gary Thomson, the COO of FXOpen UK, as he breaks down the most significant news reports and shares his expert insights.
- The dollar strengthened to a maximum in six…
- The dollar strengthened to a maximum in six…
#marketanalysis #USDJPY #forextrading
USD/JPY Analysis: Yen Rises Sharply after Hawkish Government Announcements
Since 2016, the interest rate in Japan has been in the negative zone and has remained unchanged — for more than 7 years it has been -0.10%. This makes Japan fundamentally different from other countries. But over the weekend the Yomiuri newspaper published an interview with Bank of Japan CEO Kazuo Ueda. He said the central bank could end the era of negative interest rates once it becomes clear that the 2% inflation target has been achieved.
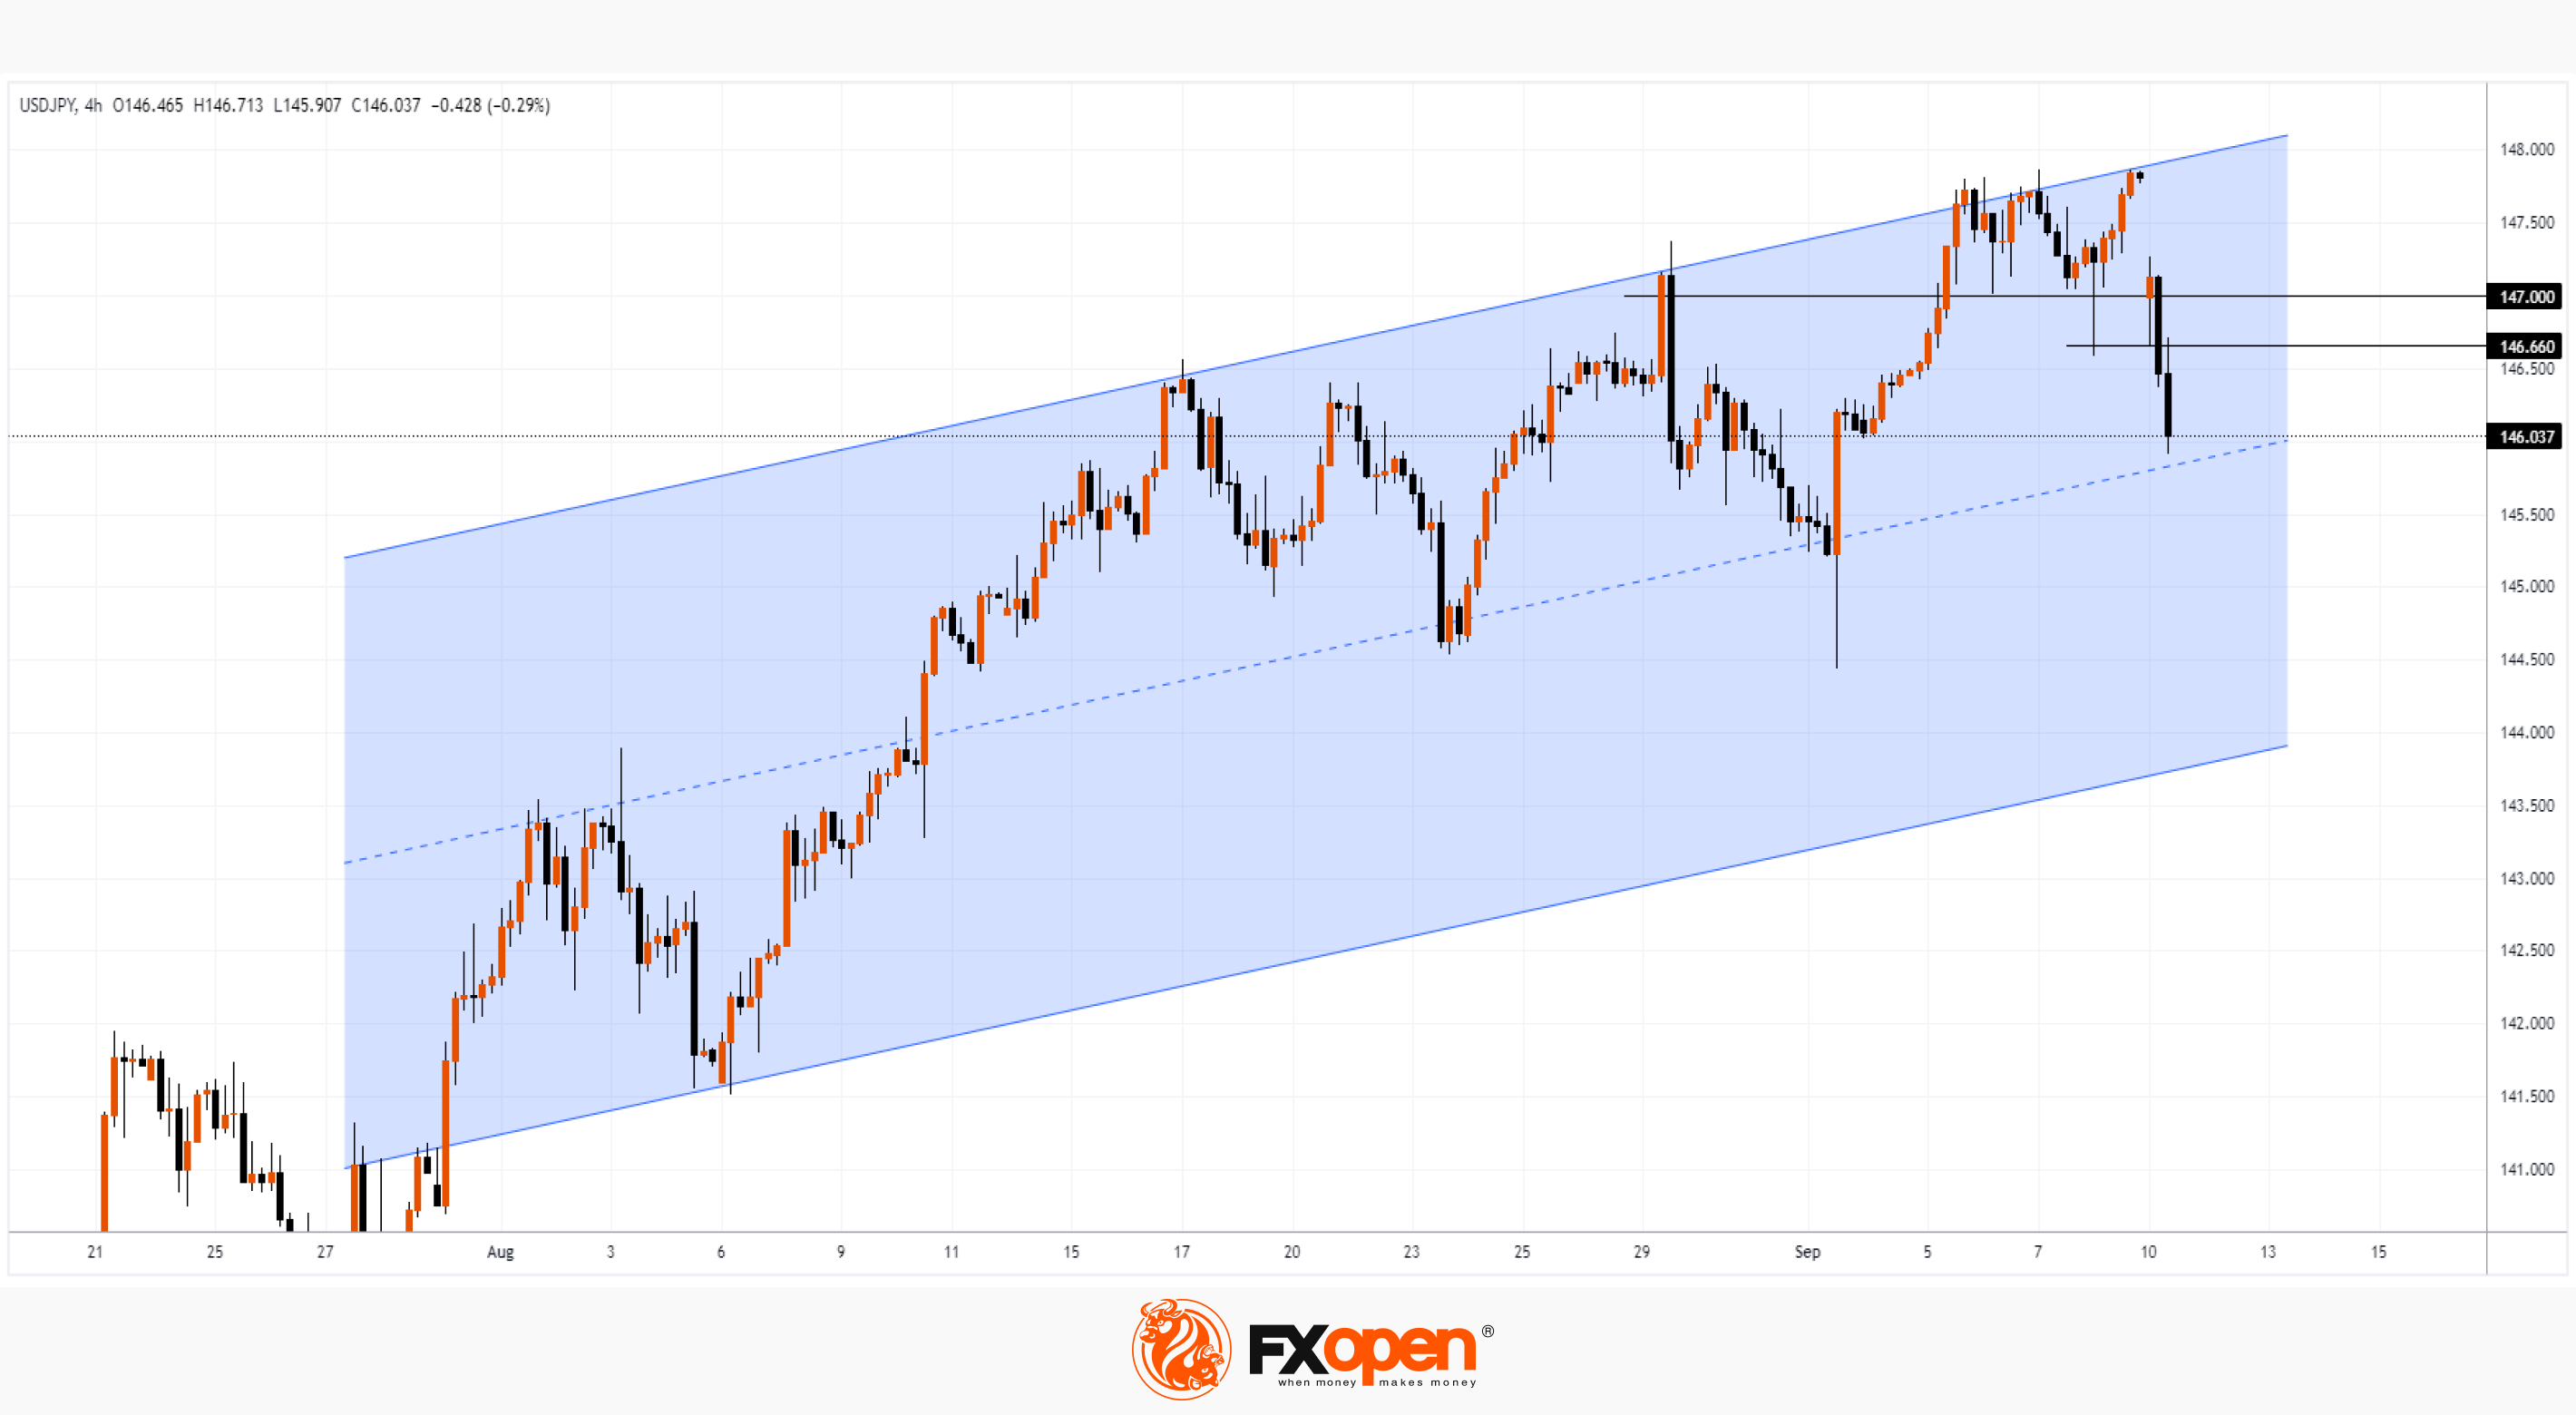
Suppose these words may not be a declaration of intentions that will become reality, but just a verbal intervention aimed at supporting the yen. One way or another, the USD/JPY chart clearly shows signs of a change in sentiment:
→ last week, the bulls put pressure on the upper boundary of the ascending channel (shown in blue), increasing the likelihood of reaching the psychological level of 150 yen per US dollar;
→ last week’s close was near the high, but the current week began with a bearish gap, after which the yen weakened by 0.8% within just a few hours;
→ level 146.66, which served as support last week, now appears to be offering resistance. A similar action can be expected from the level of 147 yen per US dollar.
In the near future, the price may realize a scenario where it reaches important support from the median line of the ascending channel with a subsequent rebound from it. If this rebound does form, but it is no more than 50% of the unfolding decline, then we will have more arguments that bears are taking more control in the USD/JPY market amid government announcements.
To benefit from fluctuations in the foreign exchange markets, use the services of a reliable broker FXOpen.
To benefit from the rise and fall of cryptocurrency prices, consider enlisting the services of a trusted broker like FXOpen.
CFDs are complex instruments and come with a high risk of losing your money.
USD/JPY Analysis: Yen Rises Sharply after Hawkish Government Announcements
Since 2016, the interest rate in Japan has been in the negative zone and has remained unchanged — for more than 7 years it has been -0.10%. This makes Japan fundamentally different from other countries. But over the weekend the Yomiuri newspaper published an interview with Bank of Japan CEO Kazuo Ueda. He said the central bank could end the era of negative interest rates once it becomes clear that the 2% inflation target has been achieved.
Suppose these words may not be a declaration of intentions that will become reality, but just a verbal intervention aimed at supporting the yen. One way or another, the USD/JPY chart clearly shows signs of a change in sentiment:
→ last week, the bulls put pressure on the upper boundary of the ascending channel (shown in blue), increasing the likelihood of reaching the psychological level of 150 yen per US dollar;
→ last week’s close was near the high, but the current week began with a bearish gap, after which the yen weakened by 0.8% within just a few hours;
→ level 146.66, which served as support last week, now appears to be offering resistance. A similar action can be expected from the level of 147 yen per US dollar.
In the near future, the price may realize a scenario where it reaches important support from the median line of the ascending channel with a subsequent rebound from it. If this rebound does form, but it is no more than 50% of the unfolding decline, then we will have more arguments that bears are taking more control in the USD/JPY market amid government announcements.
To benefit from fluctuations in the foreign exchange markets, use the services of a reliable broker FXOpen.
To benefit from the rise and fall of cryptocurrency prices, consider enlisting the services of a trusted broker like FXOpen.
CFDs are complex instruments and come with a high risk of losing your money.
#marketanalysis #oilprices #oilindustry
Market Analysis: Oil Price Stabilizes Near Year's Highs
Last week, the Russian Federation and Saudi Arabia confirmed plans to reduce production by the end of the year, which contributed to an increase in oil prices.
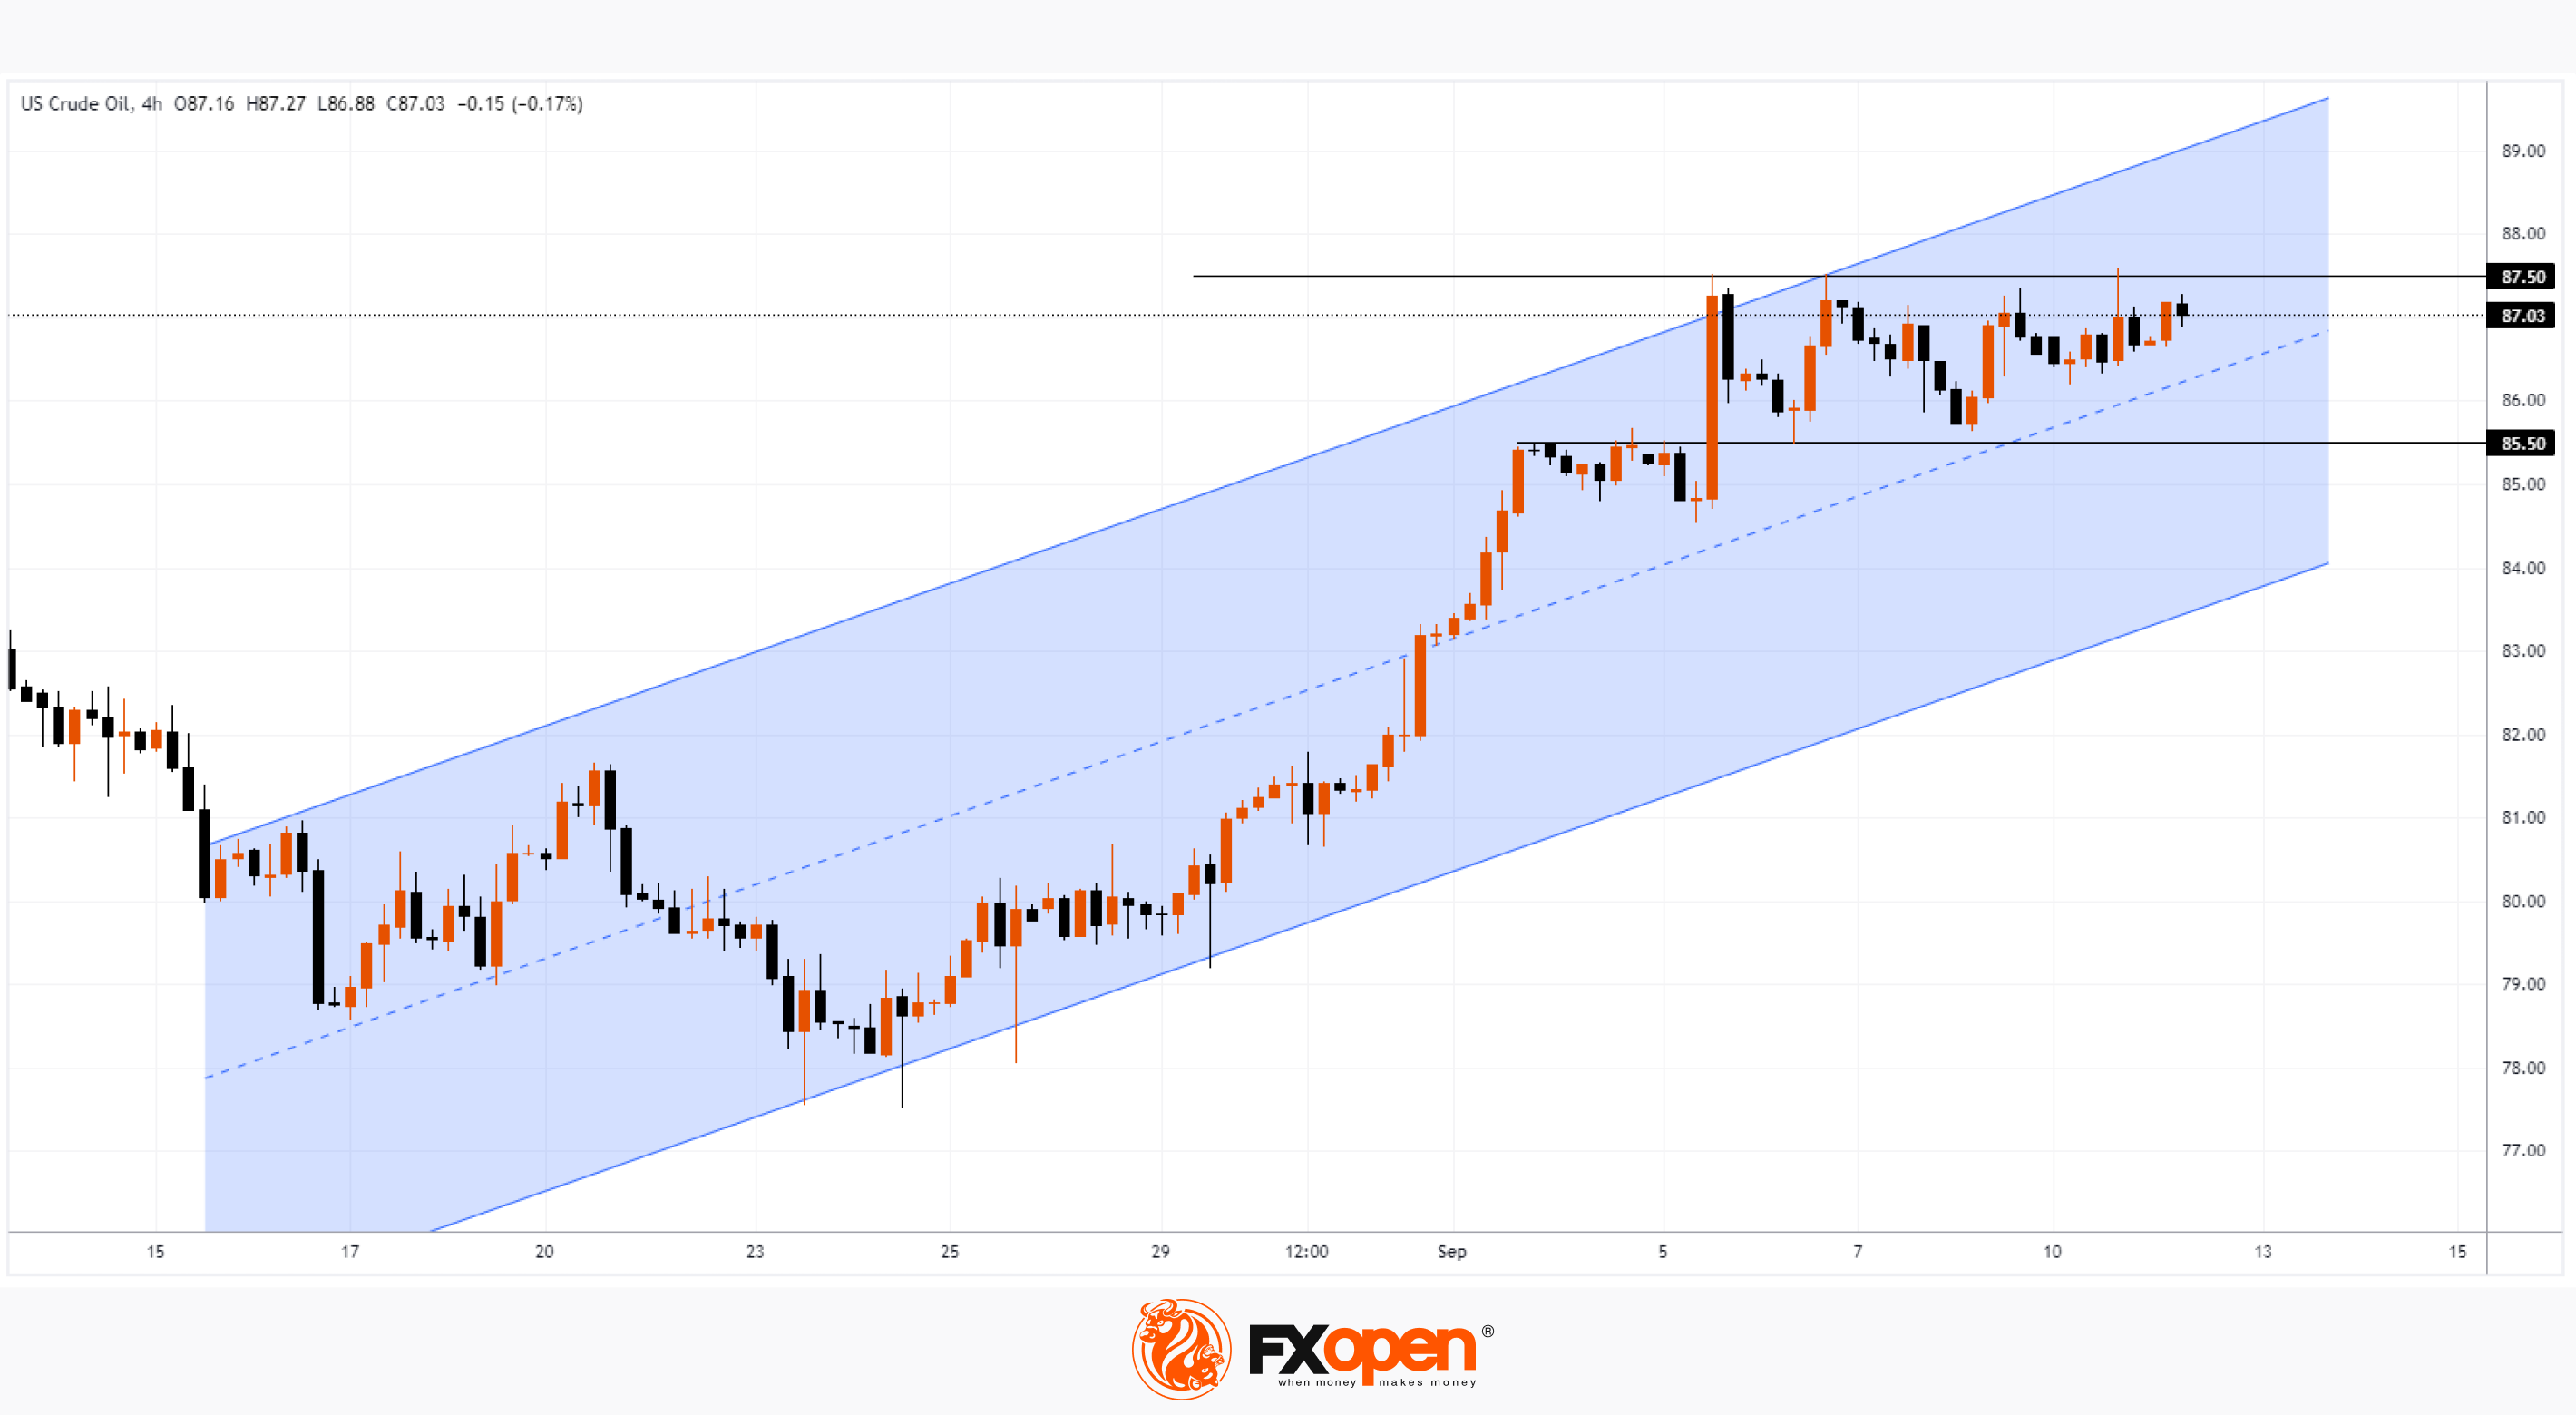
At the beginning of this week, the WTI price stabilized in the range of 85.50 - 87.50. Will the upward trend continue, which will benefit oil producers?
On Tuesday morning, the price is within the triangle formed from the median line of the ascending channel (shown in blue) and the level of 87.50. A breakout of this triangle can occur in both directions.
Bullish arguments:
→ The price is within the ascending channels, both short-term (built on the 1h and 4h charts) and long-term (built on the daily chart).
→ A series of rising lows is forming on the chart, indicating that demand is active.
→ Technically, the market may be supported by the level of 85.50, which previously served as resistance.
→ Oil supplies may be disrupted due to various storms. For example, in eastern Libya, 4 ports were closed due to flooding and a storm, which killed about 2,000 people.
Bearish arguments:
→ News about economic slowdown in various regions (China, Europe) should weaken demand.
→ On September 11, the price of oil renewed its multi-month high, but retreated very quickly. The behavior was similar to a bull trap — a sign of a weak market that could be a harbinger of downward momentum.
→ High oil prices are unprofitable for governments of countries (including the United States) struggling with high inflation.
Tomorrow, at 11:00 GMT+3, the publication of a monthly report on oil prices from the International Energy Agency is scheduled, which could greatly affect the current exchange rate and disrupt the consolidation triangle that is currently in effect.
To benefit from fluctuations in oil and gas prices, use the services of a reliable broker FXOpen.
To benefit from the rise and fall of cryptocurrency prices, consider enlisting the services of a trusted broker like FXOpen.
CFDs are complex instruments and come with a high risk of losing your money.
This article represents the opinion of the Companies operating under the FXOpen brand only. It is not to be construed as an offer, solicitation, or recommendation with respect to products and services provided by the Companies operating under the FXOpen brand, nor is it to be considered financial advice.
Market Analysis: Oil Price Stabilizes Near Year's Highs
Last week, the Russian Federation and Saudi Arabia confirmed plans to reduce production by the end of the year, which contributed to an increase in oil prices.
At the beginning of this week, the WTI price stabilized in the range of 85.50 - 87.50. Will the upward trend continue, which will benefit oil producers?
On Tuesday morning, the price is within the triangle formed from the median line of the ascending channel (shown in blue) and the level of 87.50. A breakout of this triangle can occur in both directions.
Bullish arguments:
→ The price is within the ascending channels, both short-term (built on the 1h and 4h charts) and long-term (built on the daily chart).
→ A series of rising lows is forming on the chart, indicating that demand is active.
→ Technically, the market may be supported by the level of 85.50, which previously served as resistance.
→ Oil supplies may be disrupted due to various storms. For example, in eastern Libya, 4 ports were closed due to flooding and a storm, which killed about 2,000 people.
Bearish arguments:
→ News about economic slowdown in various regions (China, Europe) should weaken demand.
→ On September 11, the price of oil renewed its multi-month high, but retreated very quickly. The behavior was similar to a bull trap — a sign of a weak market that could be a harbinger of downward momentum.
→ High oil prices are unprofitable for governments of countries (including the United States) struggling with high inflation.
Tomorrow, at 11:00 GMT+3, the publication of a monthly report on oil prices from the International Energy Agency is scheduled, which could greatly affect the current exchange rate and disrupt the consolidation triangle that is currently in effect.
To benefit from fluctuations in oil and gas prices, use the services of a reliable broker FXOpen.
To benefit from the rise and fall of cryptocurrency prices, consider enlisting the services of a trusted broker like FXOpen.
CFDs are complex instruments and come with a high risk of losing your money.
This article represents the opinion of the Companies operating under the FXOpen brand only. It is not to be construed as an offer, solicitation, or recommendation with respect to products and services provided by the Companies operating under the FXOpen brand, nor is it to be considered financial advice.
#marketanalysis #tsla #stockmarket
Market Analysis: TSLA Share Price Soars 10%
The reason for the growth is the increase in the target price for TSLA shares by analysts at Morgan Stanley from USD 250 to USD 400 (about +45% from current levels).
Analysts see huge potential in Tesla Dojo — this supercomputer is capable of processing millions of terabytes of video of real-life situations captured from more than 4 million Tesla vehicles. It is designed to train artificial intelligence models to ultimately help the driver drive a car (Full Self-Driving, FSD system). Analysts say Dojo could serve as the same catalyst as AWS services that helped drive Amazon stock higher.
After analysts at Morgan Stanley upgraded their rating, TSLA's price soared 10%, exceeding USD 270 per share.
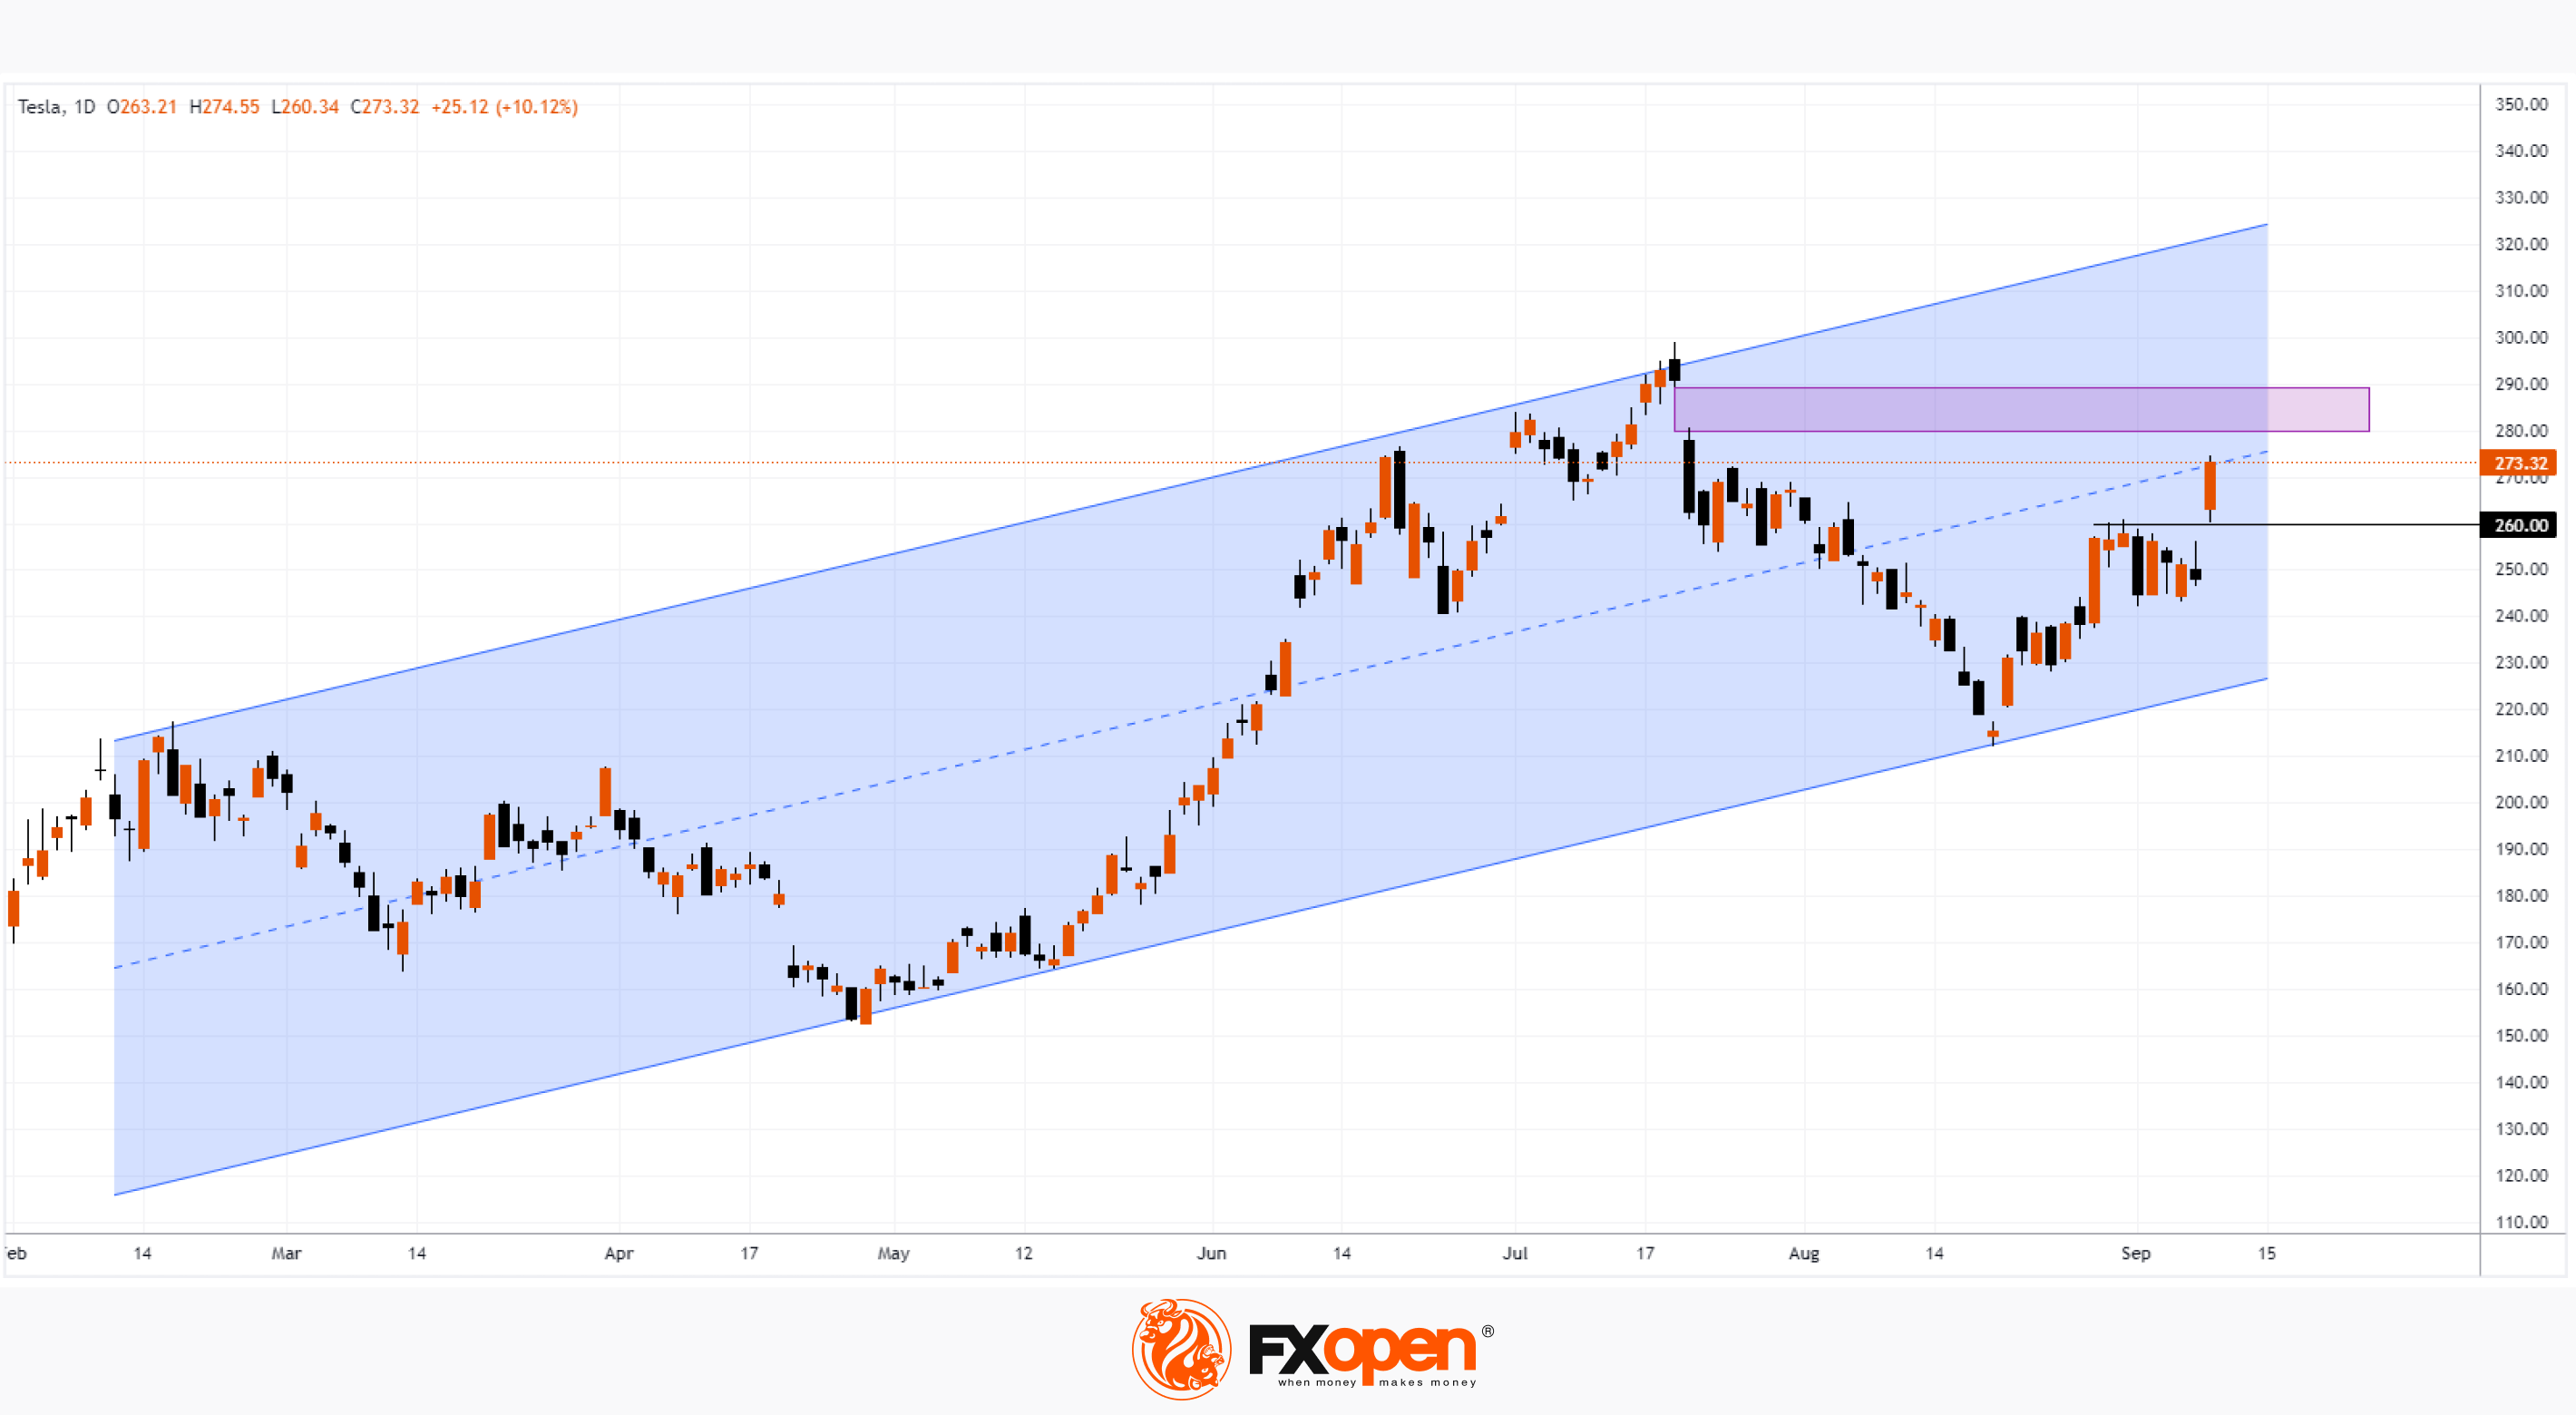
This momentum could help develop the current bullish trend that describes the trend channel in the provided chart of TSLA stock, with:
→ the level of USD 260, overcome with a gap, can now provide support;
→ after overcoming this resistance, the price reached the median line of the channel. Here, supply and demand tend to balance out — this could help the bulls gain a foothold above the breakout level of USD 260.
Bearish argument:
→ TSLA stock price has approached the bearish gap formed at the end of July. The USD 280-USD 290 area, where sell offers dominated a month and a half ago, could at least slow down the current bullish momentum.
In the coming days, the price of TSLA shares, like the entire US stock market, will be affected by news about inflation:
→ Core Price Index is scheduled to be published on Wednesday, 15:30 GMT+3.
→ The Producer Price Index is scheduled to be published on Thursday, 15:30 GMT+3. Retail sales data will also be published at this time. Be prepared for spikes in volatility.
To benefit from fluctuations in popular US stock prices, use the services of a reliable broker FXOpen.
To benefit from the rise and fall of cryptocurrency prices, consider enlisting the services of a trusted broker like FXOpen.
CFDs are complex instruments and come with a high risk of losing your money.
This article represents the opinion of the Companies operating under the FXOpen brand only. It is not to be construed as an offer, solicitation, or recommendation with respect to products and services provided by the Companies operating under the FXOpen brand, nor is it to be considered financial advice.
Market Analysis: TSLA Share Price Soars 10%
The reason for the growth is the increase in the target price for TSLA shares by analysts at Morgan Stanley from USD 250 to USD 400 (about +45% from current levels).
Analysts see huge potential in Tesla Dojo — this supercomputer is capable of processing millions of terabytes of video of real-life situations captured from more than 4 million Tesla vehicles. It is designed to train artificial intelligence models to ultimately help the driver drive a car (Full Self-Driving, FSD system). Analysts say Dojo could serve as the same catalyst as AWS services that helped drive Amazon stock higher.
After analysts at Morgan Stanley upgraded their rating, TSLA's price soared 10%, exceeding USD 270 per share.
This momentum could help develop the current bullish trend that describes the trend channel in the provided chart of TSLA stock, with:
→ the level of USD 260, overcome with a gap, can now provide support;
→ after overcoming this resistance, the price reached the median line of the channel. Here, supply and demand tend to balance out — this could help the bulls gain a foothold above the breakout level of USD 260.
Bearish argument:
→ TSLA stock price has approached the bearish gap formed at the end of July. The USD 280-USD 290 area, where sell offers dominated a month and a half ago, could at least slow down the current bullish momentum.
In the coming days, the price of TSLA shares, like the entire US stock market, will be affected by news about inflation:
→ Core Price Index is scheduled to be published on Wednesday, 15:30 GMT+3.
→ The Producer Price Index is scheduled to be published on Thursday, 15:30 GMT+3. Retail sales data will also be published at this time. Be prepared for spikes in volatility.
To benefit from fluctuations in popular US stock prices, use the services of a reliable broker FXOpen.
To benefit from the rise and fall of cryptocurrency prices, consider enlisting the services of a trusted broker like FXOpen.
CFDs are complex instruments and come with a high risk of losing your money.
This article represents the opinion of the Companies operating under the FXOpen brand only. It is not to be construed as an offer, solicitation, or recommendation with respect to products and services provided by the Companies operating under the FXOpen brand, nor is it to be considered financial advice.
#MarketNews #marketanalysis #GBPUSD
GBP/USD Analysis: Price Sets a Minimum of 3 Months After GDP News
Disappointing UK economic data was released this morning. According to the Office for National Statistics, real gross domestic product fell by 0.5% in July 2023, with declines occurring across a range of sectors. The last time a decline of this magnitude occurred was in February of this year.
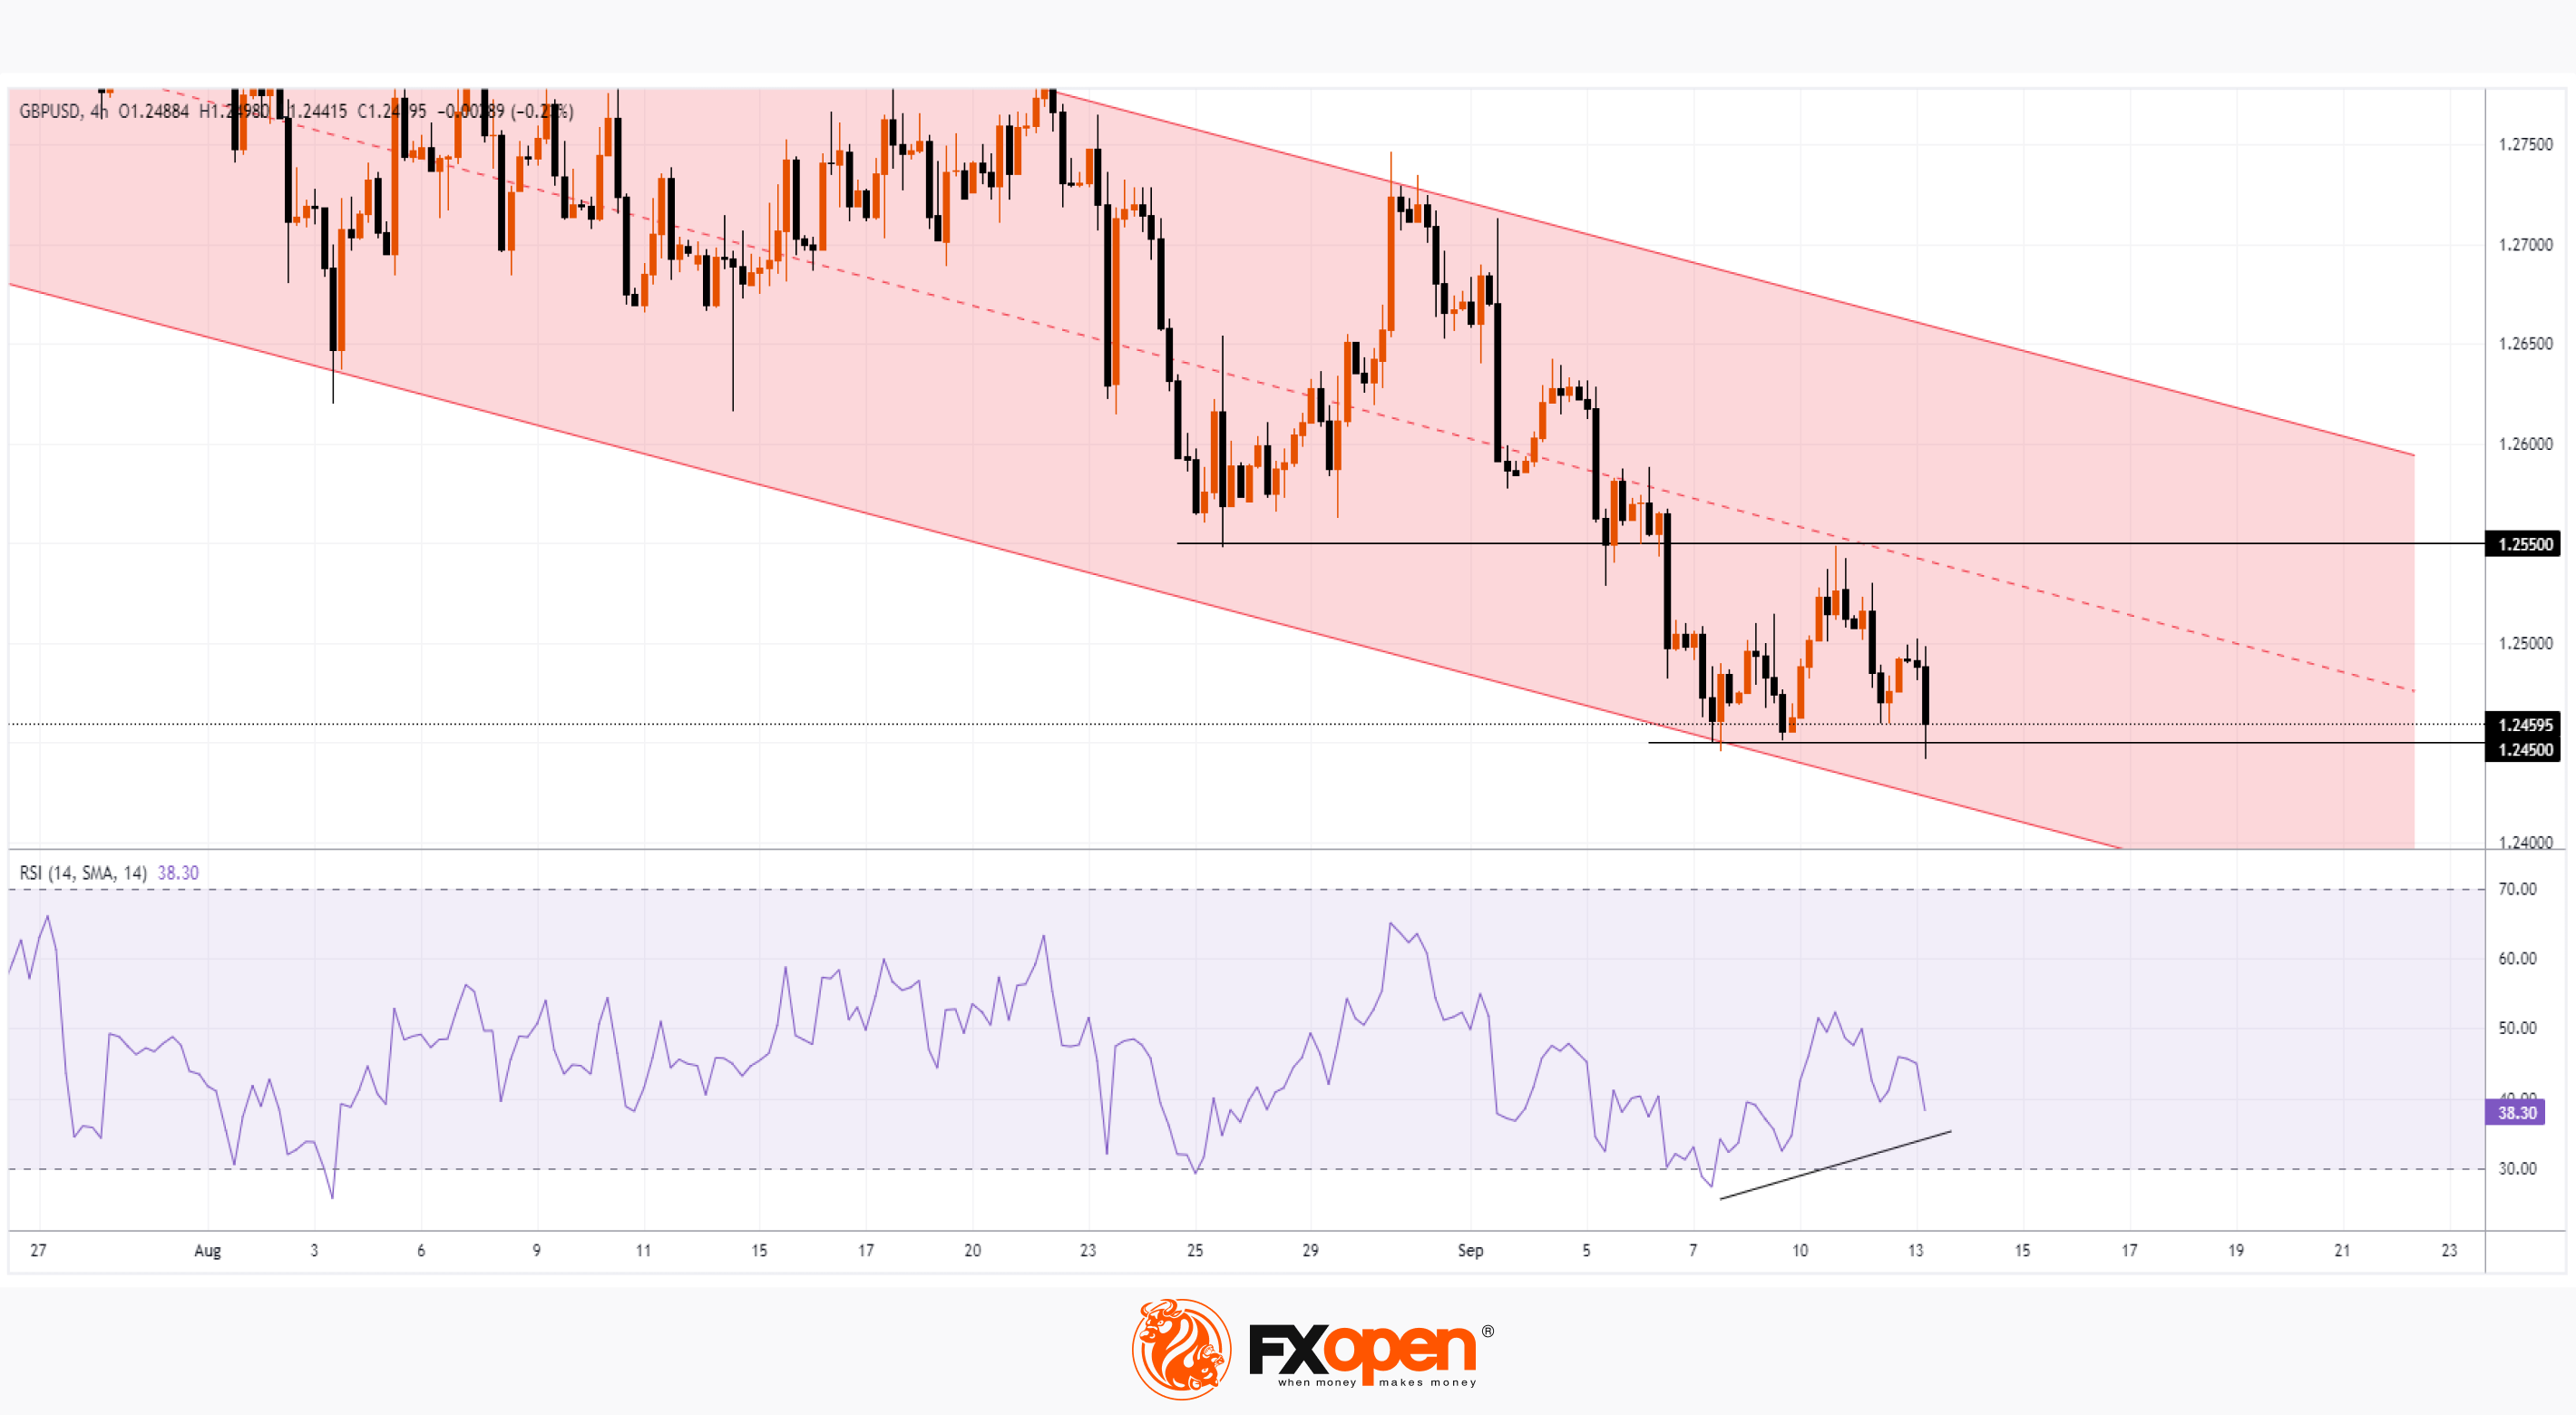
As a result of the publication, the GBP/USD rate dropped sharply. At the same time, it fell below the previous low set on September 7. Bears are putting pressure on the level of 1.245. Let us note that the last time one pound was given was 1.2443 dollars in June of this year.
Bearish arguments:
→ The UK has the highest inflation among Western countries. And the Bank of England is forced to keep rates high in order to lower them, thereby creating the preconditions for a further decline in GDP.
→ In case of a successful bearish breakdown of the level of 1.245, which provided support in September, this level may become resistance. As was the case with the level of 1.255.
→ The GBP/USD rate has been in a downward trend since mid-July, as shown by the red channel. And the median line may put pressure on the pound exchange rate in the near future.
Bullish arguments:
→ After the first reaction, the rate was restored. It is important. A bearish breakout pattern at the 1.245 level may form on the chart.
→ There is a chance that the RSI indicator will form a bullish divergence, indicating that the downtrend is exhausting.
→ The price of the pound may be supported by the lower border of the current downward channel.
Be sure to pay attention: today at 15:30 GMT+3 US inflation data will be published, which will certainly cause a surge in volatility in financial markets, including the GBP/USD pair.
To track the latest changes in the GBP/USD exchange rate, as well as benefit from trends in the foreign exchange markets, consider enlisting the services of a trusted broker like FXOpen.
CFDs are complex instruments and come with a high risk of losing your money.
This article represents the opinion of the Companies operating under the FXOpen brand only. It is not to be construed as an offer, solicitation, or recommendation with respect to products and services provided by the Companies operating under the FXOpen brand, nor is it to be considered financial advice.
GBP/USD Analysis: Price Sets a Minimum of 3 Months After GDP News
Disappointing UK economic data was released this morning. According to the Office for National Statistics, real gross domestic product fell by 0.5% in July 2023, with declines occurring across a range of sectors. The last time a decline of this magnitude occurred was in February of this year.
As a result of the publication, the GBP/USD rate dropped sharply. At the same time, it fell below the previous low set on September 7. Bears are putting pressure on the level of 1.245. Let us note that the last time one pound was given was 1.2443 dollars in June of this year.
Bearish arguments:
→ The UK has the highest inflation among Western countries. And the Bank of England is forced to keep rates high in order to lower them, thereby creating the preconditions for a further decline in GDP.
→ In case of a successful bearish breakdown of the level of 1.245, which provided support in September, this level may become resistance. As was the case with the level of 1.255.
→ The GBP/USD rate has been in a downward trend since mid-July, as shown by the red channel. And the median line may put pressure on the pound exchange rate in the near future.
Bullish arguments:
→ After the first reaction, the rate was restored. It is important. A bearish breakout pattern at the 1.245 level may form on the chart.
→ There is a chance that the RSI indicator will form a bullish divergence, indicating that the downtrend is exhausting.
→ The price of the pound may be supported by the lower border of the current downward channel.
Be sure to pay attention: today at 15:30 GMT+3 US inflation data will be published, which will certainly cause a surge in volatility in financial markets, including the GBP/USD pair.
To track the latest changes in the GBP/USD exchange rate, as well as benefit from trends in the foreign exchange markets, consider enlisting the services of a trusted broker like FXOpen.
CFDs are complex instruments and come with a high risk of losing your money.
This article represents the opinion of the Companies operating under the FXOpen brand only. It is not to be construed as an offer, solicitation, or recommendation with respect to products and services provided by the Companies operating under the FXOpen brand, nor is it to be considered financial advice.
#MarketNews #marketanalysis #sp500 #stockmarket
Market Analysis: S&P 500 Rises After Inflation News
The CPI index values published yesterday showed that inflation in the US has increased slightly, but increased: actual = 3.7% in annual terms (expected = 3.6%, last month = 3.2%). According to the FT, the main reason is rising energy prices.
Recent data shows that the Fed's fight against inflation is becoming more difficult. Nevertheless, the markets perceived the event positively, as:
→ during a surge in volatility, the price of E-mini S&P 500 futures dropped to a minimum of the week, but the day closed at its maximum;
→ in the early hours of Thursday, the price increased.
Perhaps market participants believe that the Fed will be able to make a “soft landing.” By the way, Bank of America analysts, in a report dated September 11, wrote that the fall in the stock index from July highs represents a correction within the bull market that has been ongoing since the end of 2022.
On the other hand, Morgan Stanley analysts believe the S&P 500 could fall 25% if investors feel fearful as US stocks look risky and expensive. But BlackRock writes that the risk of recession remains high, since companies need to take out loans for business development at higher rates. And this will ultimately worsen financial reporting.
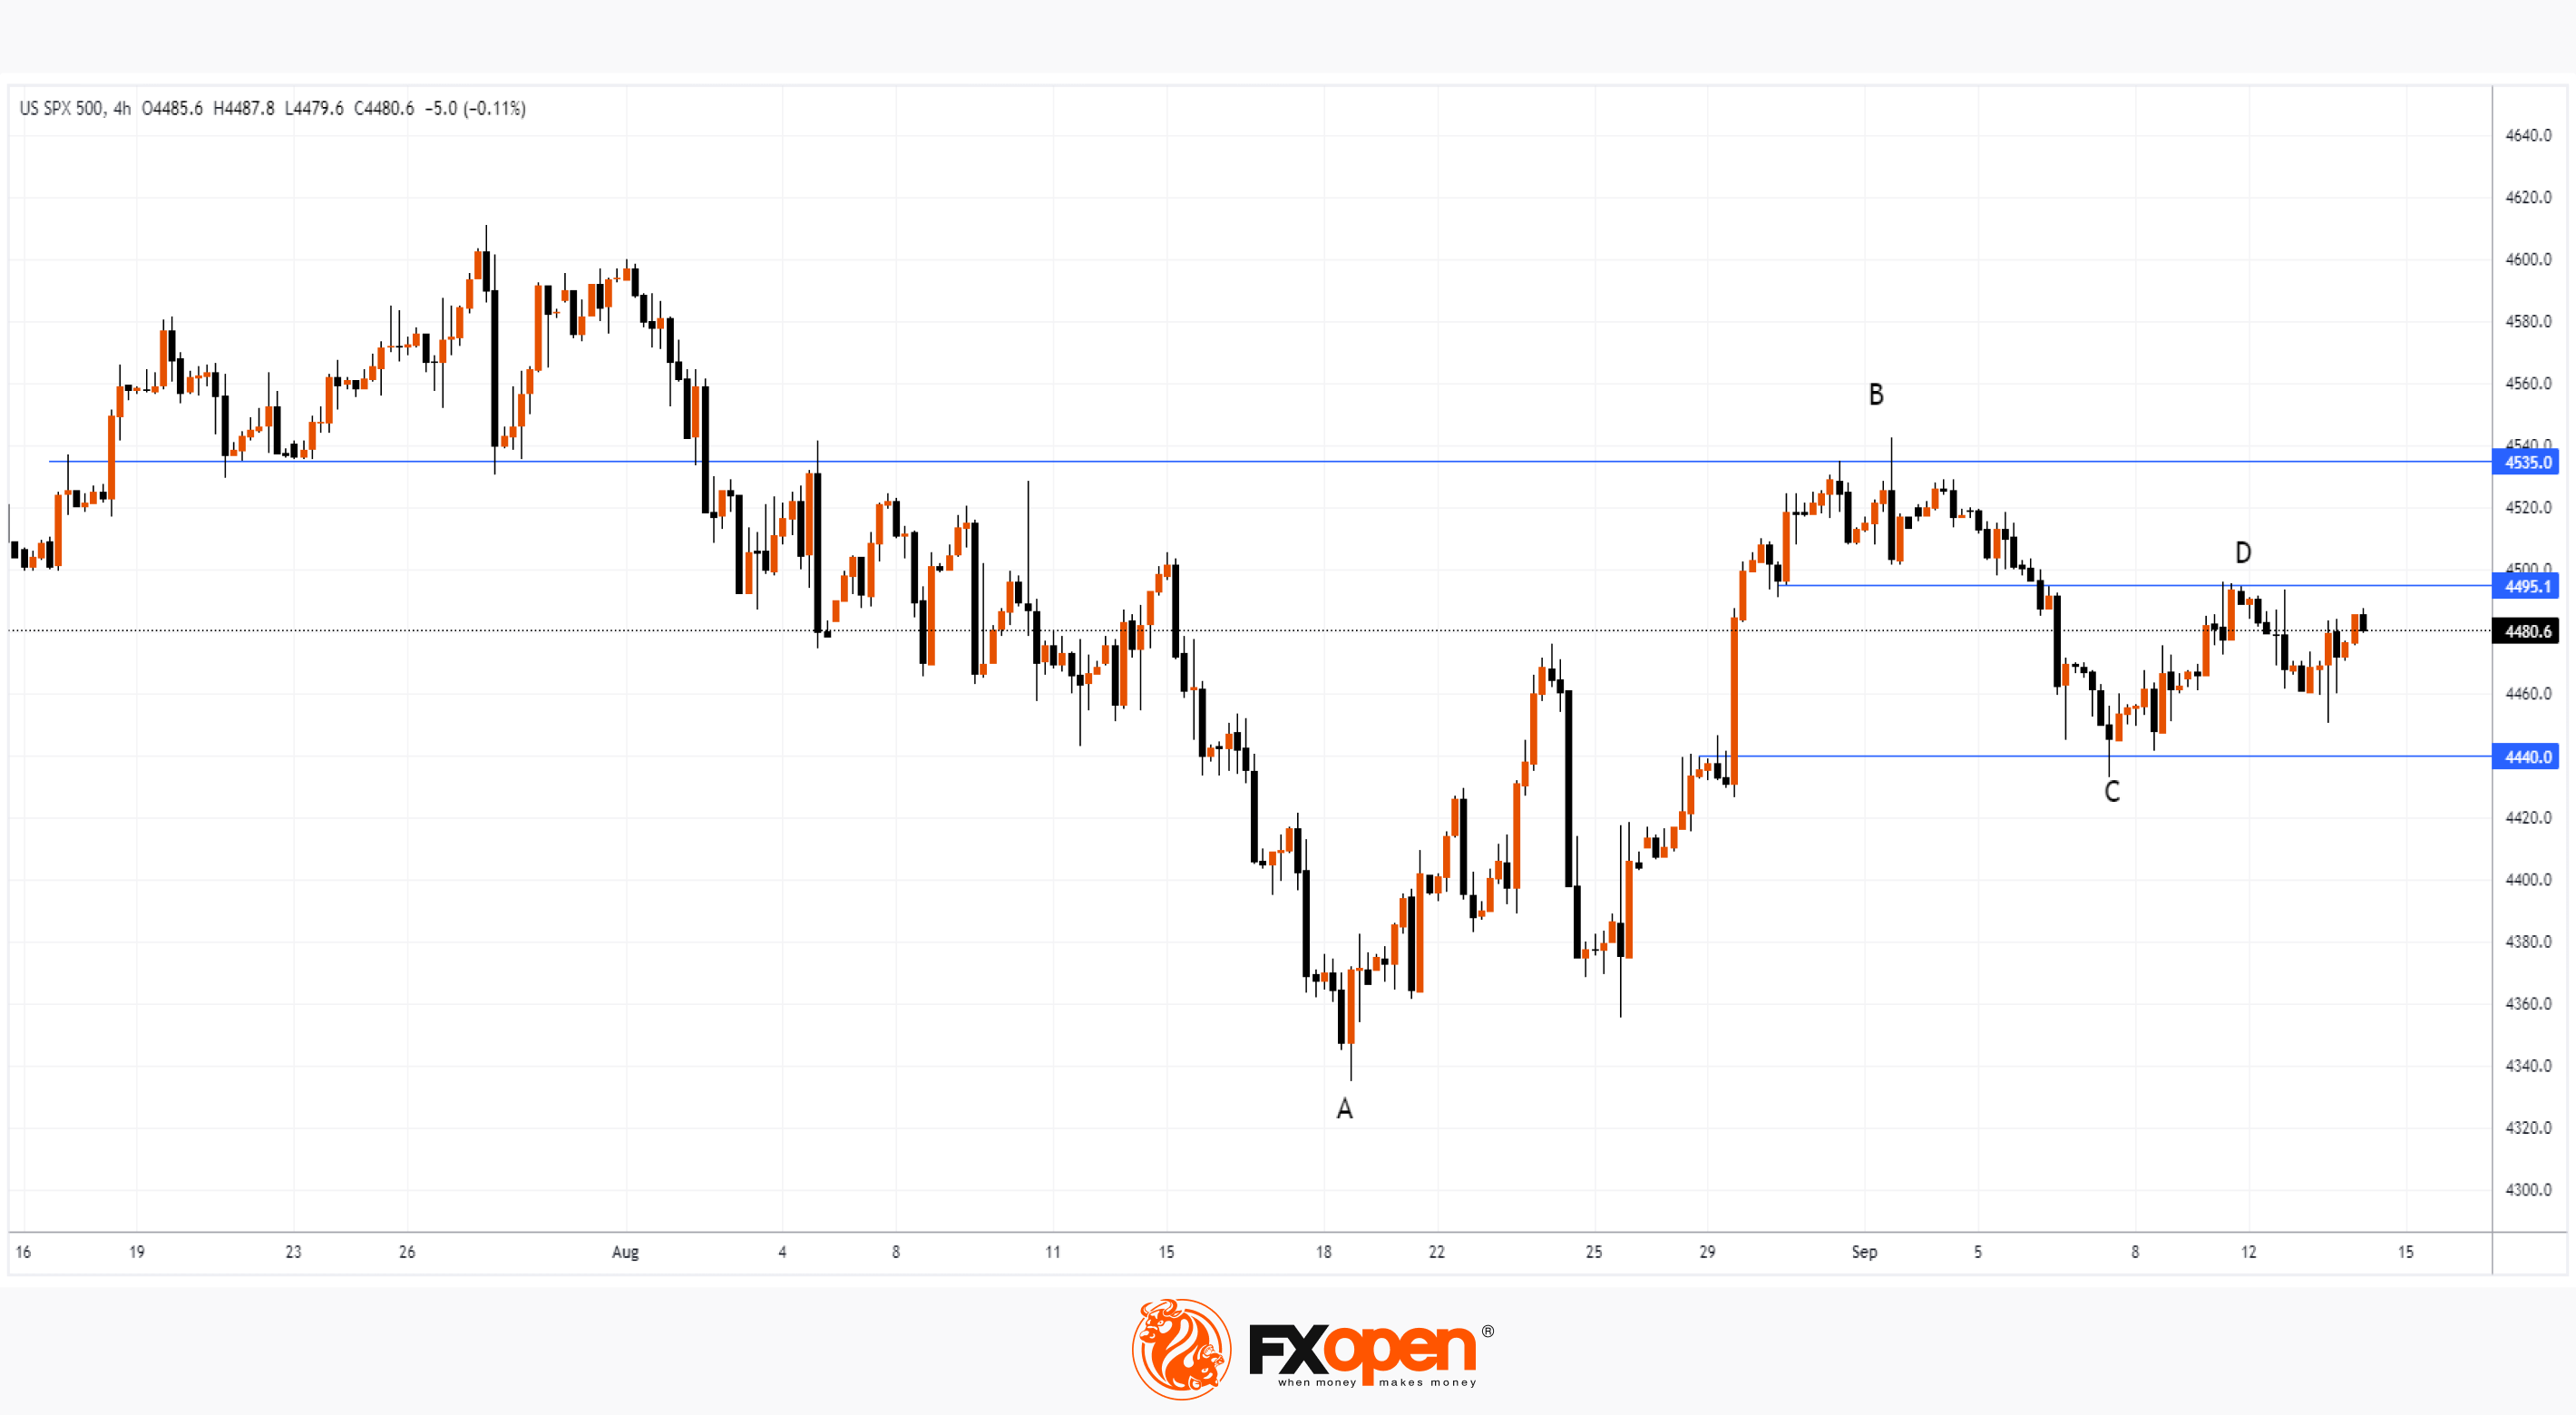
The difference in opinions is reflected in the chart, which suggests that the market is entering (or has already entered) a consolidation (flat) stage, since:
→ the decrease in B→C to the support line 4,440 is approximately 50% of the growth impulse A→B to the resistance line 4,535;
→ the growth of C→D to the resistance line 4,495 is approximately 50% of the declining impulse of A→B.
The damping of volatility can be interpreted in such a way that supply and demand balance each other. But September is traditionally a stormy month for stock markets. Let's see what its second half will be like - we are waiting for the meeting of central banks, the decisions of which will be announced next week.
To benefit from the rise and fall of stock markets, consider enlisting the services of a trusted broker like FXOpen.
CFDs are complex instruments and come with a high risk of losing your money.
This article represents the opinion of the Companies operating under the FXOpen brand only. It is not to be construed as an offer, solicitation, or recommendation with respect to products and services provided by the Companies operating under the FXOpen brand, nor is it to be considered financial advice.
Market Analysis: S&P 500 Rises After Inflation News
The CPI index values published yesterday showed that inflation in the US has increased slightly, but increased: actual = 3.7% in annual terms (expected = 3.6%, last month = 3.2%). According to the FT, the main reason is rising energy prices.
Recent data shows that the Fed's fight against inflation is becoming more difficult. Nevertheless, the markets perceived the event positively, as:
→ during a surge in volatility, the price of E-mini S&P 500 futures dropped to a minimum of the week, but the day closed at its maximum;
→ in the early hours of Thursday, the price increased.
Perhaps market participants believe that the Fed will be able to make a “soft landing.” By the way, Bank of America analysts, in a report dated September 11, wrote that the fall in the stock index from July highs represents a correction within the bull market that has been ongoing since the end of 2022.
On the other hand, Morgan Stanley analysts believe the S&P 500 could fall 25% if investors feel fearful as US stocks look risky and expensive. But BlackRock writes that the risk of recession remains high, since companies need to take out loans for business development at higher rates. And this will ultimately worsen financial reporting.
The difference in opinions is reflected in the chart, which suggests that the market is entering (or has already entered) a consolidation (flat) stage, since:
→ the decrease in B→C to the support line 4,440 is approximately 50% of the growth impulse A→B to the resistance line 4,535;
→ the growth of C→D to the resistance line 4,495 is approximately 50% of the declining impulse of A→B.
The damping of volatility can be interpreted in such a way that supply and demand balance each other. But September is traditionally a stormy month for stock markets. Let's see what its second half will be like - we are waiting for the meeting of central banks, the decisions of which will be announced next week.
To benefit from the rise and fall of stock markets, consider enlisting the services of a trusted broker like FXOpen.
CFDs are complex instruments and come with a high risk of losing your money.
This article represents the opinion of the Companies operating under the FXOpen brand only. It is not to be construed as an offer, solicitation, or recommendation with respect to products and services provided by the Companies operating under the FXOpen brand, nor is it to be considered financial advice.