#marketanalysis #oilprices #oilindustry
Market Analysis: Oil Surges to a New High of the Year
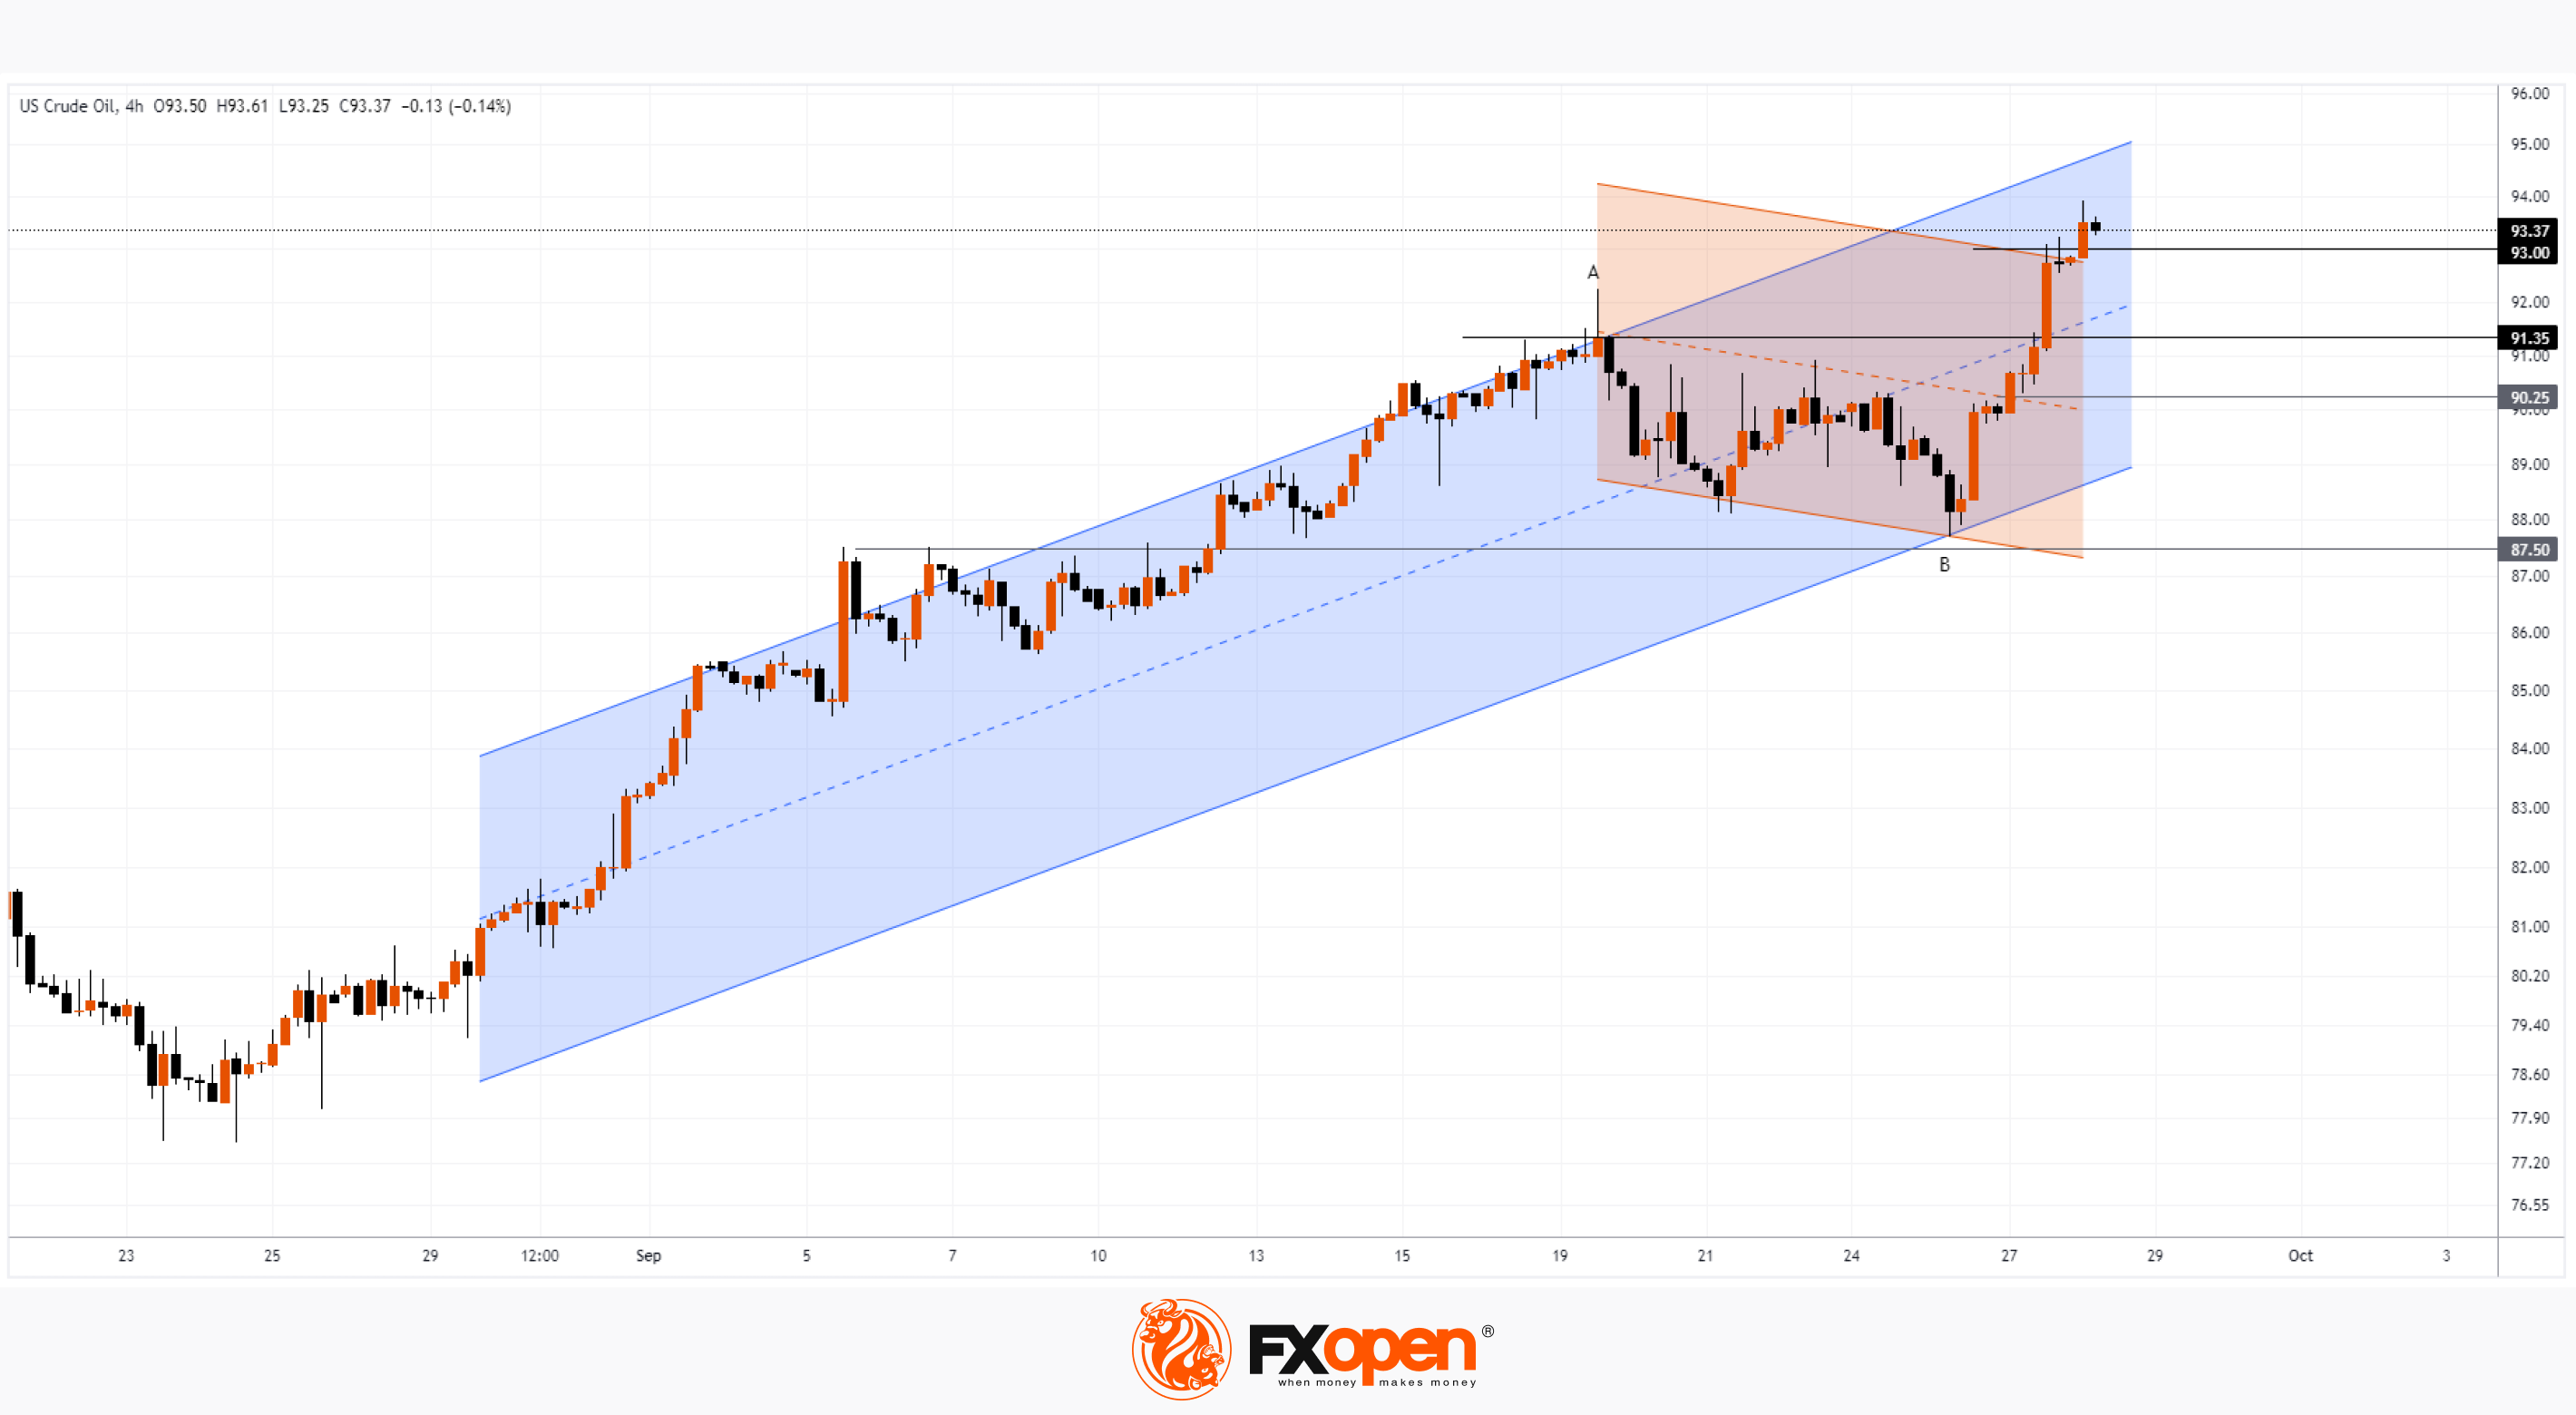
As the chart shows, the day before yesterday, a barrel of WTI cost USD 87.87, but this morning, the price exceeded the level of USD 93. That is, the growth was more than 6% in just 2 days.
The main driver of such growth remains the voluntary reduction in oil production by OPEC+ countries. Added to this was the market's reaction to yesterday's news about the reduction in oil reserves in the United States (expected = -0.7 million barrels, actual = -2.2 million). Inventories are approaching historical lows, according to Reuters. Probably, the US authorities, by releasing oil from storage, are trying to reduce the impact of its high price on inflation, but the graph shows that these efforts are unlikely to give the desired result.
The A→B decline in oil prices observed since September 19 was merely a correction (shown in red) within a longer-term uptrend (shown in blue). Wherein:
→ the price sharply pushed off from the lower border of the blue channel around 87.5 - we wrote about this scenario earlier;
→ after a short respite, it broke through the median line of the red channel at around 90.25;
→ confidently overcame the level of 91.35, where growth clearly slowed down 10 days ago when approaching point A;
→ exceeded the upper limit of the red channel.
Now it is important for the bulls to gain a foothold at the achieved highs around USD 93. But if the upward impulse has not exhausted itself, then we may witness continued growth towards the upper border of the blue channel.
On the other hand: overbought market, the desire to lock in profits from long positions before the weekend, a possible reaction at the level of statements from the US authorities — all these can become factors contributing to the formation of a correction (for example, to the median line of the blue channel).
To benefit from the rise and fall of oil and gas prices, consider enlisting the services of a trusted broker like FXOpen.
CFDs are complex instruments and come with a high risk of losing your money.
This article represents the opinion of the Companies operating under the FXOpen brand only. It is not to be construed as an offer, solicitation, or recommendation with respect to products and services provided by the Companies operating under the FXOpen brand, nor is it to be considered financial advice.
Market Analysis: Oil Surges to a New High of the Year
As the chart shows, the day before yesterday, a barrel of WTI cost USD 87.87, but this morning, the price exceeded the level of USD 93. That is, the growth was more than 6% in just 2 days.
The main driver of such growth remains the voluntary reduction in oil production by OPEC+ countries. Added to this was the market's reaction to yesterday's news about the reduction in oil reserves in the United States (expected = -0.7 million barrels, actual = -2.2 million). Inventories are approaching historical lows, according to Reuters. Probably, the US authorities, by releasing oil from storage, are trying to reduce the impact of its high price on inflation, but the graph shows that these efforts are unlikely to give the desired result.
The A→B decline in oil prices observed since September 19 was merely a correction (shown in red) within a longer-term uptrend (shown in blue). Wherein:
→ the price sharply pushed off from the lower border of the blue channel around 87.5 - we wrote about this scenario earlier;
→ after a short respite, it broke through the median line of the red channel at around 90.25;
→ confidently overcame the level of 91.35, where growth clearly slowed down 10 days ago when approaching point A;
→ exceeded the upper limit of the red channel.
Now it is important for the bulls to gain a foothold at the achieved highs around USD 93. But if the upward impulse has not exhausted itself, then we may witness continued growth towards the upper border of the blue channel.
On the other hand: overbought market, the desire to lock in profits from long positions before the weekend, a possible reaction at the level of statements from the US authorities — all these can become factors contributing to the formation of a correction (for example, to the median line of the blue channel).
To benefit from the rise and fall of oil and gas prices, consider enlisting the services of a trusted broker like FXOpen.
CFDs are complex instruments and come with a high risk of losing your money.
This article represents the opinion of the Companies operating under the FXOpen brand only. It is not to be construed as an offer, solicitation, or recommendation with respect to products and services provided by the Companies operating under the FXOpen brand, nor is it to be considered financial advice.
#bitcoin #BTCUSD #crypto
Bitcoin Cash Analysis: Promising Resistance Breakout
Yesterday, the head of the SEC regulator, Gary Gensler, answered questions for 4 hours before the Financial Services Committee of the US House of Representatives, which, among other things, related to cryptocurrencies.
What has become known:
→ on the eve of the hearing, Gary Gensler was sent a letter from four members of the US Congress demanding approval of applications for ETFs based on cryptocurrencies;
→ the head of the SEC avoided answering questions about the timing of decisions on these applications, although he noted that if the agency’s work was stopped on October 1 (like other government agencies), this would slow down the process;
→ for participants in the cryptocurrency market, the event could have given a positive impetus if Gensler’s words had contained hints of positivity, but he once again spoke out about the dangerous prohibited practices that crypto firms use.
However, a source of positivity in the market could be the strong price action in the Bitcoin Cash market. As the BCH/USD chart shows:
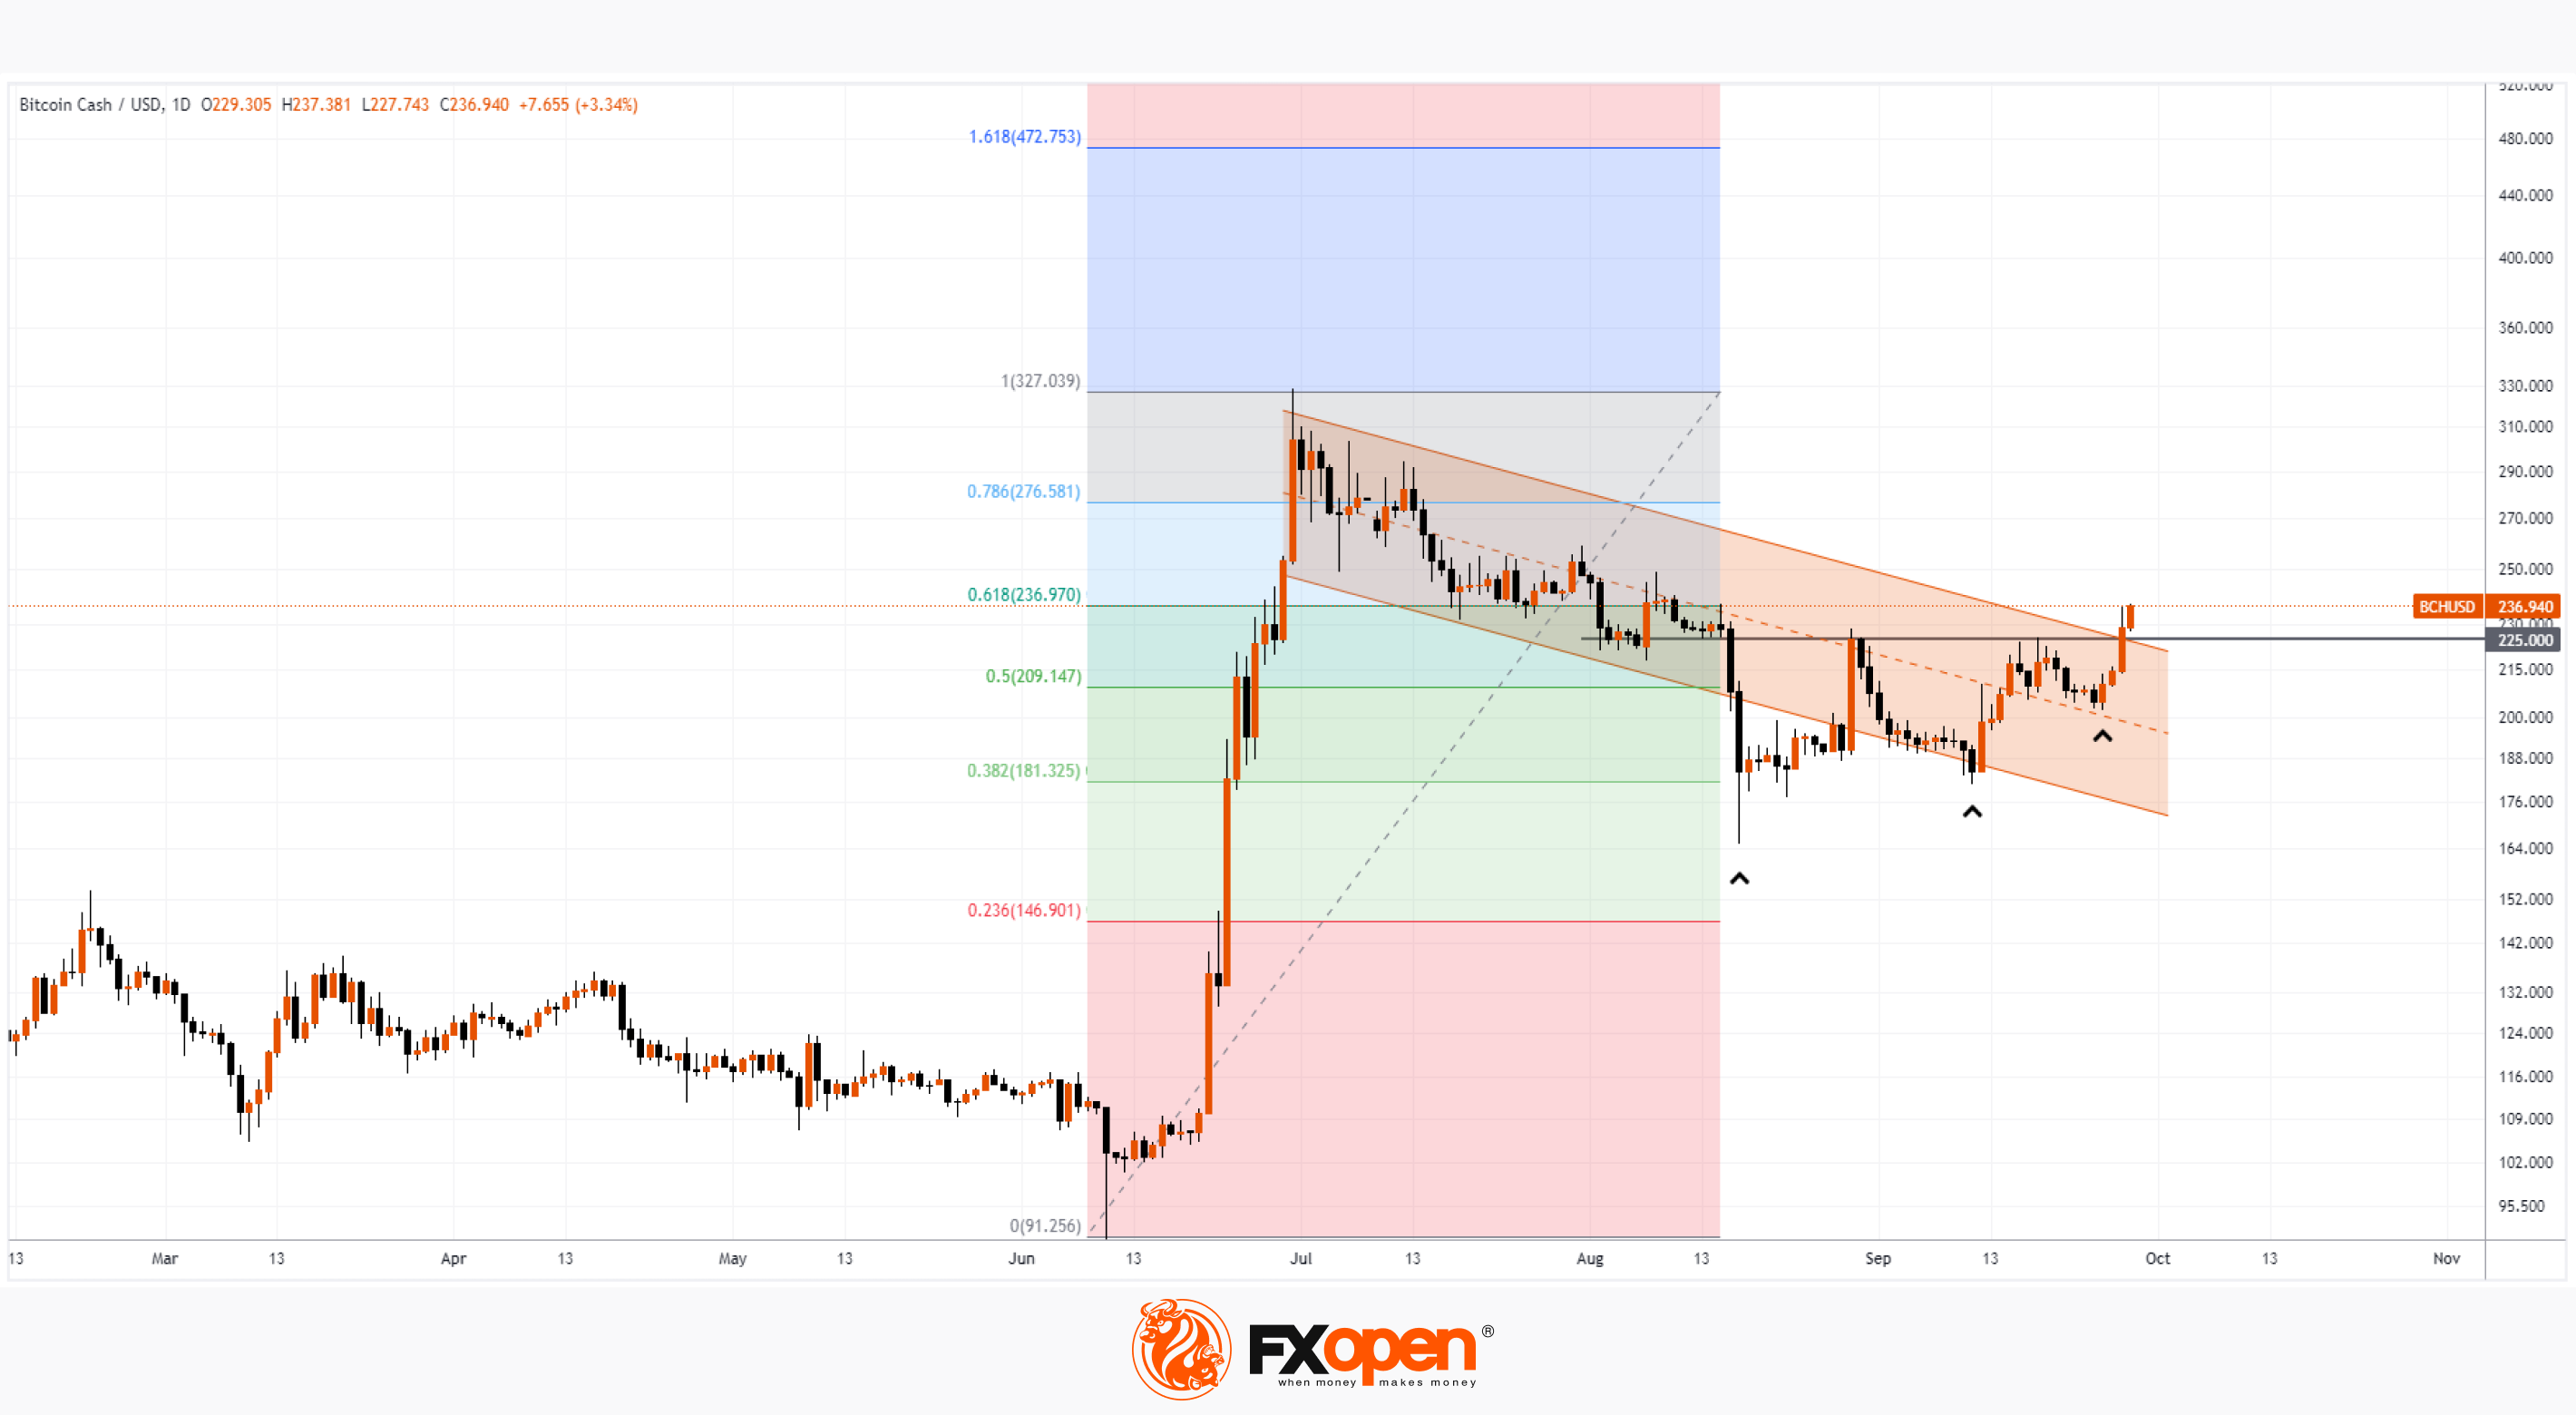
→ the price broke through the important level of USD 225, which served as resistance;
→ before the breakdown, a series of rising lows was formed (shown by marks), which can be interpreted as demand pressure. The dynamics are similar to the bullish cup-and-handle pattern;
→ the price went up from the downward channel (shown in red);
→ the price movement from the summer high can be considered a pullback, which found support at the Fibo level of 0.382.
The above bullish arguments suggest that the BCH price may resume its upward trend after a protracted pullback. Then it is possible that the price of Bitcoin Cash will be able to reach its summer high.
To benefit from the rise and fall of cryptocurrencies, use the services of a reliable broker FXOpen.
To benefit from the rise and fall of oil and gas prices, consider enlisting the services of a trusted broker like FXOpen.
CFDs are complex instruments and come with a high risk of losing your money.
This article represents the opinion of the Companies operating under the FXOpen brand only. It is not to be construed as an offer, solicitation, or recommendation with respect to products and services provided by the Companies operating under the FXOpen brand, nor is it to be considered financial advice.
At FXOpen UK and FXOpen AU, Cryptocurrency CFDs are only available for trading by those clients categorised as Professional clients under FCA Rules and Professional clients under ASIC Rules, respectively. They are not available for trading by Retail clients.
Bitcoin Cash Analysis: Promising Resistance Breakout
Yesterday, the head of the SEC regulator, Gary Gensler, answered questions for 4 hours before the Financial Services Committee of the US House of Representatives, which, among other things, related to cryptocurrencies.
What has become known:
→ on the eve of the hearing, Gary Gensler was sent a letter from four members of the US Congress demanding approval of applications for ETFs based on cryptocurrencies;
→ the head of the SEC avoided answering questions about the timing of decisions on these applications, although he noted that if the agency’s work was stopped on October 1 (like other government agencies), this would slow down the process;
→ for participants in the cryptocurrency market, the event could have given a positive impetus if Gensler’s words had contained hints of positivity, but he once again spoke out about the dangerous prohibited practices that crypto firms use.
However, a source of positivity in the market could be the strong price action in the Bitcoin Cash market. As the BCH/USD chart shows:
→ the price broke through the important level of USD 225, which served as resistance;
→ before the breakdown, a series of rising lows was formed (shown by marks), which can be interpreted as demand pressure. The dynamics are similar to the bullish cup-and-handle pattern;
→ the price went up from the downward channel (shown in red);
→ the price movement from the summer high can be considered a pullback, which found support at the Fibo level of 0.382.
The above bullish arguments suggest that the BCH price may resume its upward trend after a protracted pullback. Then it is possible that the price of Bitcoin Cash will be able to reach its summer high.
To benefit from the rise and fall of cryptocurrencies, use the services of a reliable broker FXOpen.
To benefit from the rise and fall of oil and gas prices, consider enlisting the services of a trusted broker like FXOpen.
CFDs are complex instruments and come with a high risk of losing your money.
This article represents the opinion of the Companies operating under the FXOpen brand only. It is not to be construed as an offer, solicitation, or recommendation with respect to products and services provided by the Companies operating under the FXOpen brand, nor is it to be considered financial advice.
At FXOpen UK and FXOpen AU, Cryptocurrency CFDs are only available for trading by those clients categorised as Professional clients under FCA Rules and Professional clients under ASIC Rules, respectively. They are not available for trading by Retail clients.
#marketanalysis #XAUUSD #goldprice
Market Analysis: The Price of Gold Drops Below $1,900
The decline in the price of the asset considered a safe haven was facilitated by rising bond yields, which are becoming more attractive for investment in a high-interest environment. According to top Federal Reserve officials, new increases are possible to achieve inflation targets.
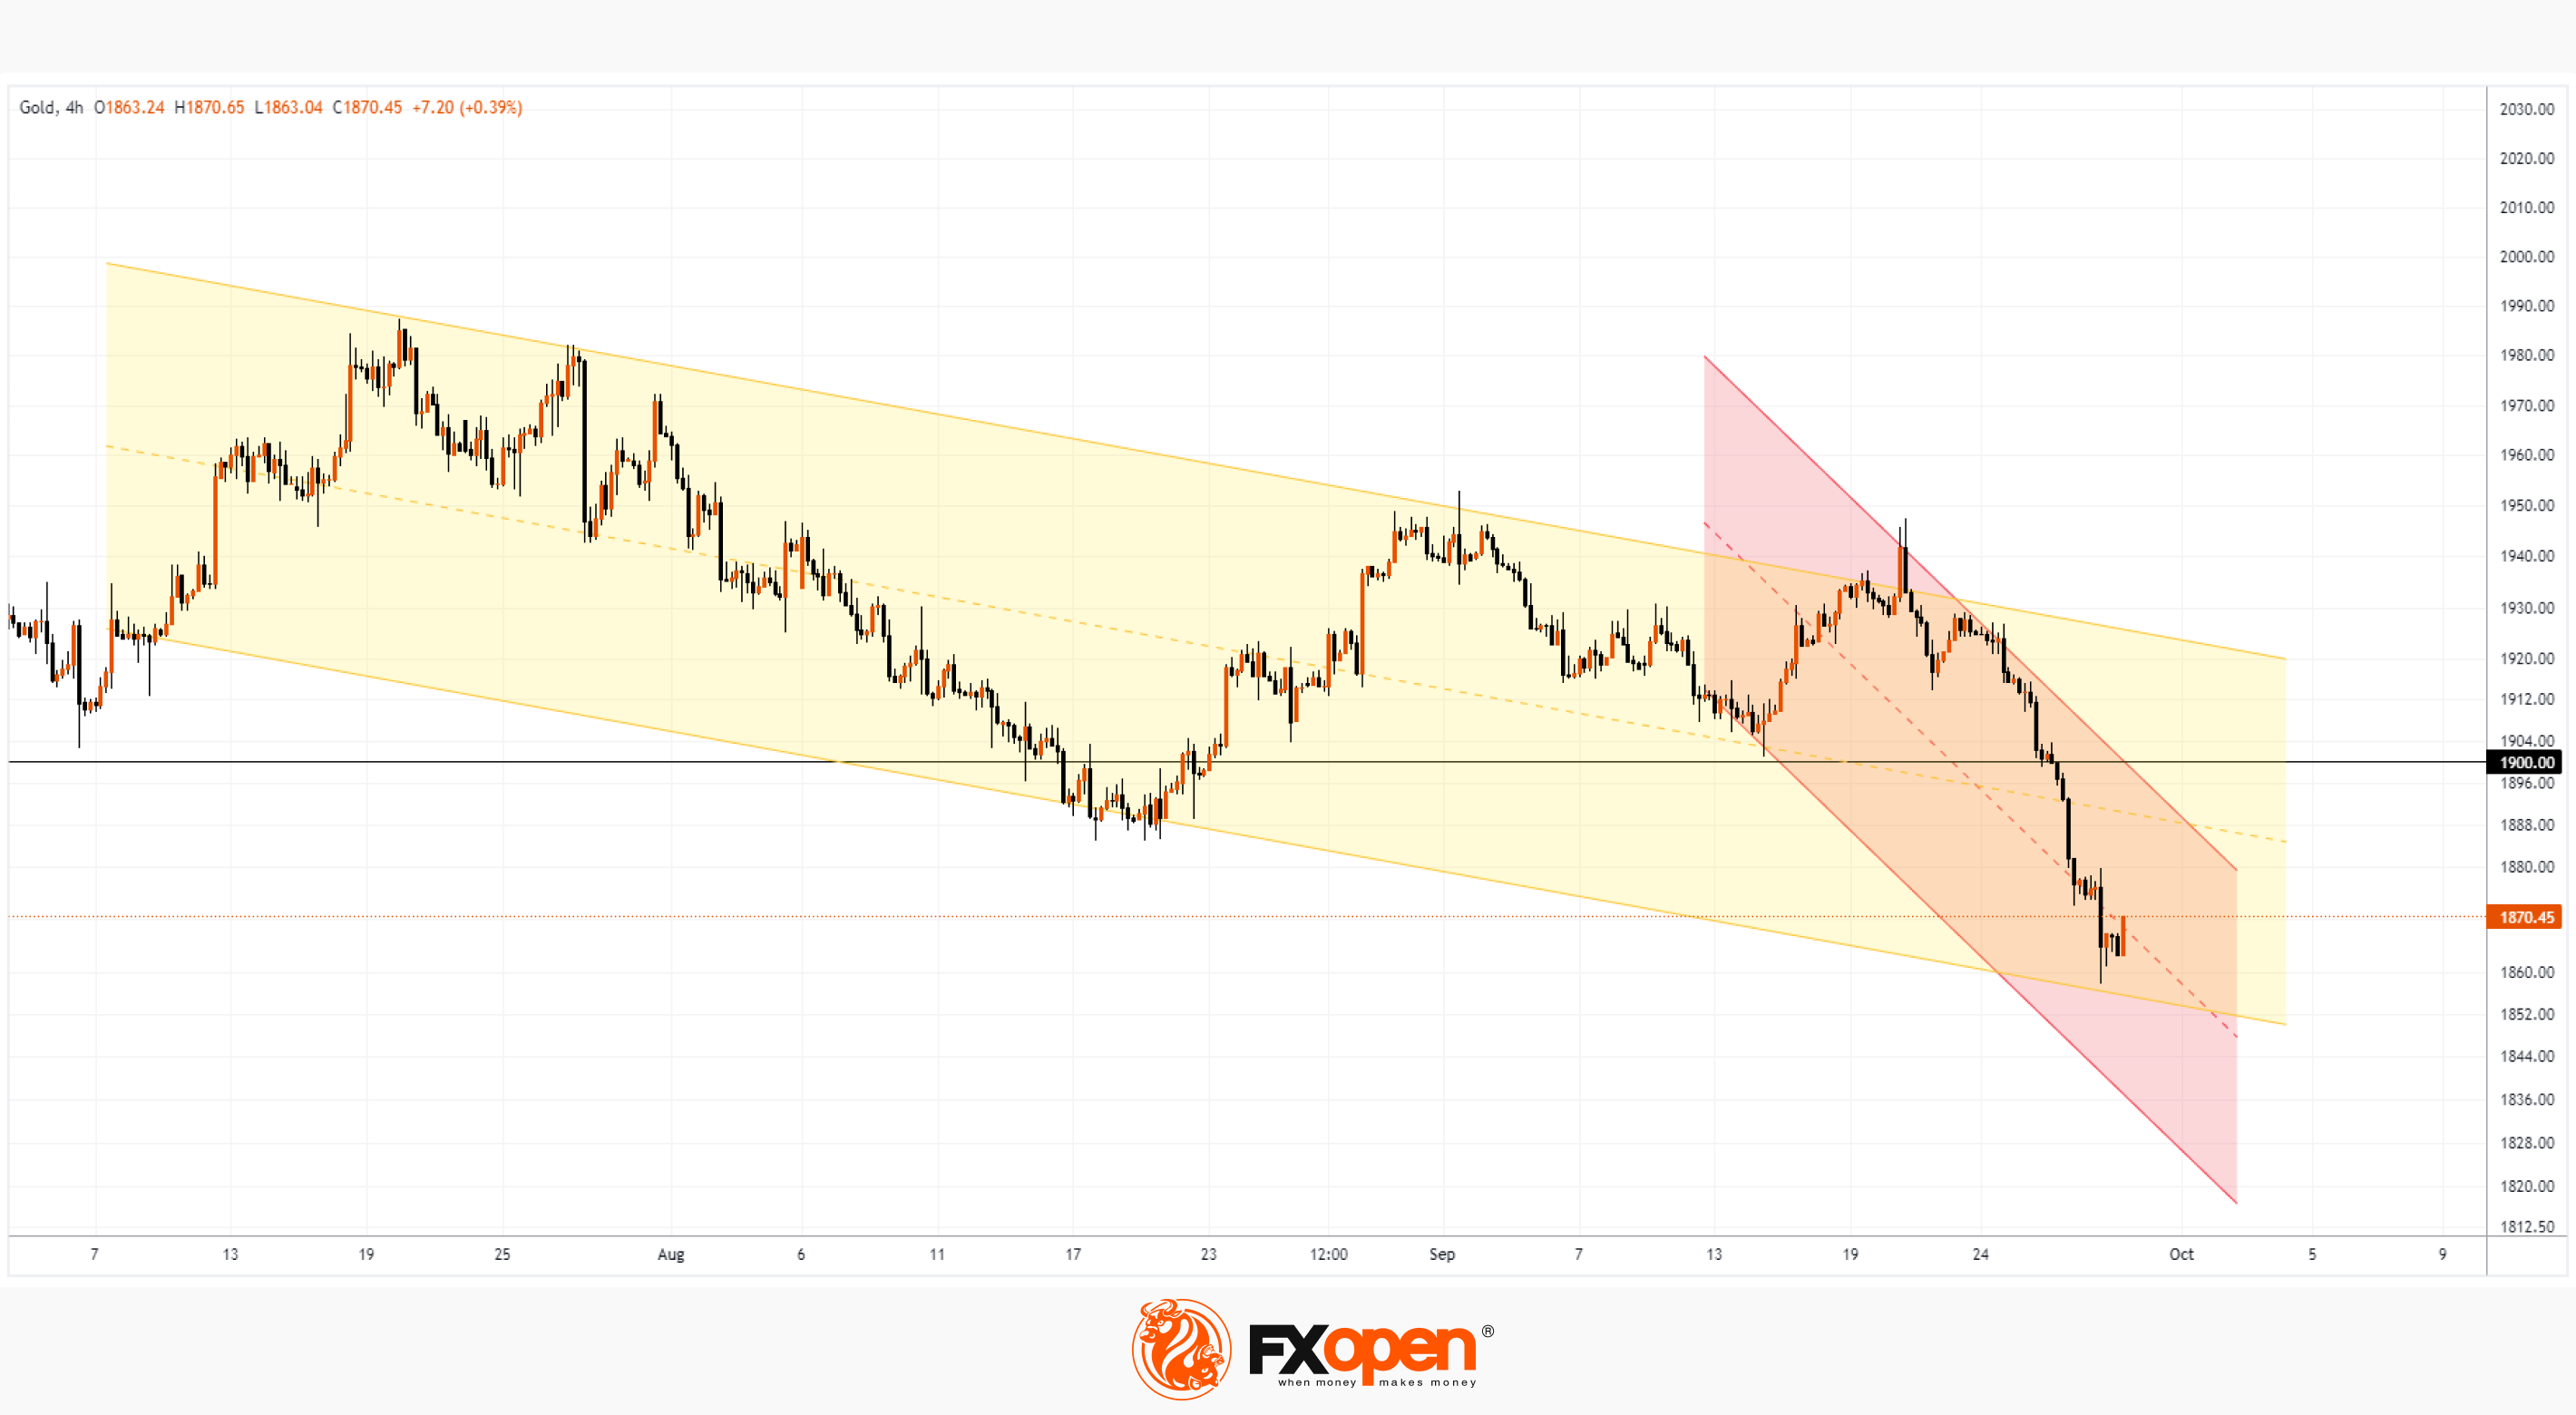
At yesterday's low, the price fell below 1,860 per ounce for the first time since March 2023. Will the fall continue? The XAU/USD chart on the 4-hour time frame provides valuable information for thought.
Bearish arguments:
→ Falling tops above the 1,900 level, which formed during August-September, indicate a steady decline in demand.
→ The price is within the local downward channel (shown in red), its upper limit can serve as resistance for recovery and/or a factor for the formation of a new downward impulse.
→ After breaking through the 1,900 level, the price accelerated its decline, which indicates the bears’ confidence.
Bullish arguments:
→ The price has reached the lower border of the channel shown in yellow. This line may provide support, which is already noticeable by the price rebound from yesterday’s low and the positive dynamics in the Asian session today.
→ At the low of the day yesterday, large volumes of trading in gold futures took place on the CME, which may indicate the interest of large players in buying out short positions or even establishing long positions for long-term portfolios.
To benefit from fluctuations in gold prices, consider enlisting the services of a trusted broker like FXOpen.
CFDs are complex instruments and come with a high risk of losing your money.
This article represents the opinion of the Companies operating under the FXOpen brand only. It is not to be construed as an offer, solicitation, or recommendation with respect to products and services provided by the Companies operating under the FXOpen brand, nor is it to be considered financial advice.
Market Analysis: The Price of Gold Drops Below $1,900
The decline in the price of the asset considered a safe haven was facilitated by rising bond yields, which are becoming more attractive for investment in a high-interest environment. According to top Federal Reserve officials, new increases are possible to achieve inflation targets.
At yesterday's low, the price fell below 1,860 per ounce for the first time since March 2023. Will the fall continue? The XAU/USD chart on the 4-hour time frame provides valuable information for thought.
Bearish arguments:
→ Falling tops above the 1,900 level, which formed during August-September, indicate a steady decline in demand.
→ The price is within the local downward channel (shown in red), its upper limit can serve as resistance for recovery and/or a factor for the formation of a new downward impulse.
→ After breaking through the 1,900 level, the price accelerated its decline, which indicates the bears’ confidence.
Bullish arguments:
→ The price has reached the lower border of the channel shown in yellow. This line may provide support, which is already noticeable by the price rebound from yesterday’s low and the positive dynamics in the Asian session today.
→ At the low of the day yesterday, large volumes of trading in gold futures took place on the CME, which may indicate the interest of large players in buying out short positions or even establishing long positions for long-term portfolios.
To benefit from fluctuations in gold prices, consider enlisting the services of a trusted broker like FXOpen.
CFDs are complex instruments and come with a high risk of losing your money.
This article represents the opinion of the Companies operating under the FXOpen brand only. It is not to be construed as an offer, solicitation, or recommendation with respect to products and services provided by the Companies operating under the FXOpen brand, nor is it to be considered financial advice.
#MarketNews #stockmarket #stocktrading
US 30 Analysis: Dow Jones Finds Support
September is likely to be the second month in a row that the Dow Jones (US 30) stock market index declined. The last time this happened was... also in September, a year ago.
Important economic data was published yesterday:
→ According to a revised report released by the Bureau of Economic Analysis, US real GDP increased 2.1% year over year in the second quarter. This reduces the risk of recession.
→ The number of applications for unemployment benefits amounted to 204k for a week, which continues the downward trend that has emerged since June of this year.
Today, fresh data on the PCE inflation index will be published, it can provide evidence that inflation is slowly subsiding as long as the economy remains resilient.
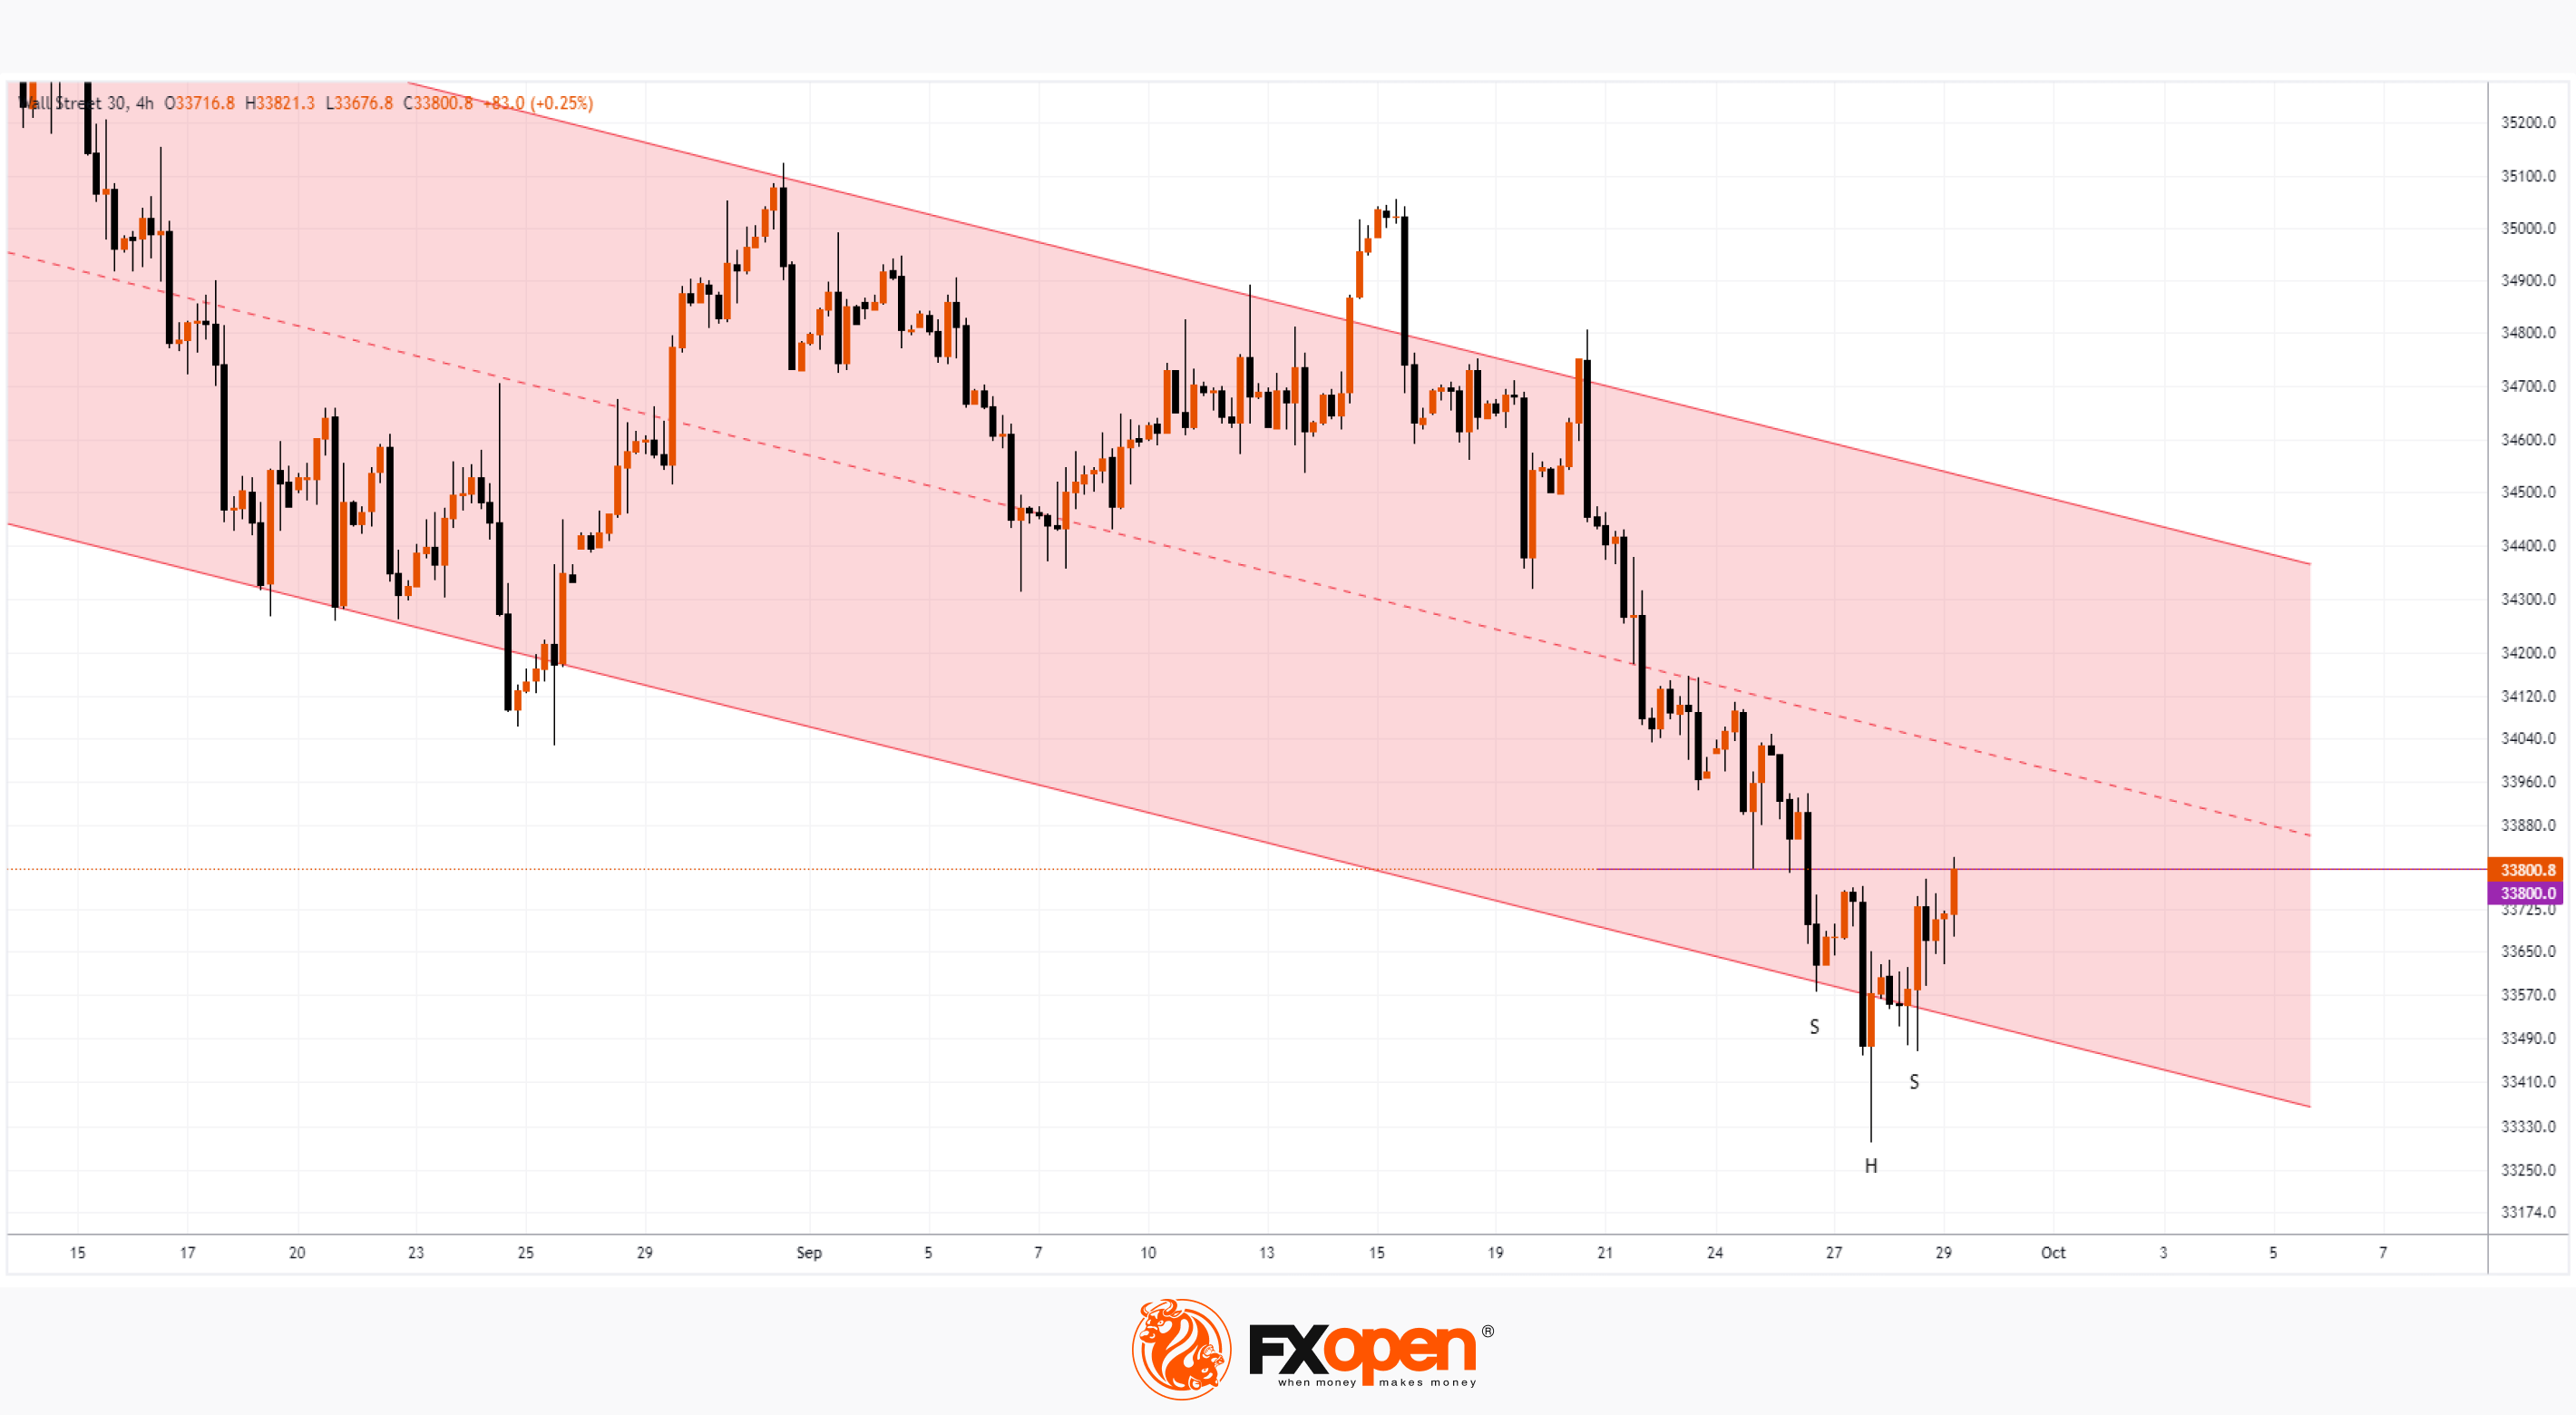
More bullish arguments for displaying cautious optimism are provided by the Dow Jones index chart:
→ the price of US 30 has formed an inverted head-and-shoulders pattern (SHS);
→ this bullish pattern formed near the lower border of the descending channel — which indicates support from this line;
→ after Wednesday, when the bearish acceleration was noticeable, the price recovered — this is a sign that if there were panic sentiments, they have exhausted themselves.
→ On Thursday, the bears’ attempts to resume the decline failed, and Friday morning looks optimistic – during the Asian session the price exceeded Thursday’s high.
The market will receive more bullish arguments if the price can consolidate above the resistance of 33,800, which is the neck line of SHS.
Perhaps the tone for the rally is being set by insiders who have information that the risk of a government shutdown in the US is being minimized. If the emerging optimism continues for a longer period of time, then October will be able to interrupt the pattern of 2 bearish candles on the monthly chart, as was the case last year.
To benefit from trends in the world's stock markets, consider enlisting the services of a trusted broker like FXOpen.
CFDs are complex instruments and come with a high risk of losing your money.
This article represents the opinion of the Companies operating under the FXOpen brand only. It is not to be construed as an offer, solicitation, or recommendation with respect to products and services provided by the Companies operating under the FXOpen brand, nor is it to be considered financial advice.
US 30 Analysis: Dow Jones Finds Support
September is likely to be the second month in a row that the Dow Jones (US 30) stock market index declined. The last time this happened was... also in September, a year ago.
Important economic data was published yesterday:
→ According to a revised report released by the Bureau of Economic Analysis, US real GDP increased 2.1% year over year in the second quarter. This reduces the risk of recession.
→ The number of applications for unemployment benefits amounted to 204k for a week, which continues the downward trend that has emerged since June of this year.
Today, fresh data on the PCE inflation index will be published, it can provide evidence that inflation is slowly subsiding as long as the economy remains resilient.
More bullish arguments for displaying cautious optimism are provided by the Dow Jones index chart:
→ the price of US 30 has formed an inverted head-and-shoulders pattern (SHS);
→ this bullish pattern formed near the lower border of the descending channel — which indicates support from this line;
→ after Wednesday, when the bearish acceleration was noticeable, the price recovered — this is a sign that if there were panic sentiments, they have exhausted themselves.
→ On Thursday, the bears’ attempts to resume the decline failed, and Friday morning looks optimistic – during the Asian session the price exceeded Thursday’s high.
The market will receive more bullish arguments if the price can consolidate above the resistance of 33,800, which is the neck line of SHS.
Perhaps the tone for the rally is being set by insiders who have information that the risk of a government shutdown in the US is being minimized. If the emerging optimism continues for a longer period of time, then October will be able to interrupt the pattern of 2 bearish candles on the monthly chart, as was the case last year.
To benefit from trends in the world's stock markets, consider enlisting the services of a trusted broker like FXOpen.
CFDs are complex instruments and come with a high risk of losing your money.
This article represents the opinion of the Companies operating under the FXOpen brand only. It is not to be construed as an offer, solicitation, or recommendation with respect to products and services provided by the Companies operating under the FXOpen brand, nor is it to be considered financial advice.
#inflation #stockmarket #sp500 #EURUSD
Weekly Market Wrap With Gary Thomson: Inflation, EUR/USD, S&P 500, OIL
Get the latest scoop on the week's hottest headlines, all in one convenient video. Join Gary Thomson, the COO of FXOpen UK, as he breaks down the most significant news reports and shares his expert insights.
🔸 Oil surged to a new high for the year #Oil
🔸 EUR/USD Takes Hit While USD/CHF Surges #eurusd #usdchf
🔸 Inflation still dogs the economy: What are the central banks doing about it? #inflation #centralbanks
Stay in the know and empower yourself with our short, yet power-packed video. Watch it now and stay updated with FXOpen.
Don't miss out on this invaluable opportunity to sharpen your trading skills and make informed decisions.
https://cutt.ly/iwbv4Ql4
To take advantage of price fluctuations in the foreign exchange markets, consider enlisting the services of a reliable broker like FXOpen.
⚠️
This forecast represents FXOpen Companies opinion only, it should not be construed as an offer, invitation or recommendation in respect to FXOpen Companies products and services or as financial advice
Weekly Market Wrap With Gary Thomson: Inflation, EUR/USD, S&P 500, OIL
Get the latest scoop on the week's hottest headlines, all in one convenient video. Join Gary Thomson, the COO of FXOpen UK, as he breaks down the most significant news reports and shares his expert insights.
🔸 Oil surged to a new high for the year #Oil
🔸 EUR/USD Takes Hit While USD/CHF Surges #eurusd #usdchf
🔸 Inflation still dogs the economy: What are the central banks doing about it? #inflation #centralbanks
Stay in the know and empower yourself with our short, yet power-packed video. Watch it now and stay updated with FXOpen.
Don't miss out on this invaluable opportunity to sharpen your trading skills and make informed decisions.
https://cutt.ly/iwbv4Ql4
To take advantage of price fluctuations in the foreign exchange markets, consider enlisting the services of a reliable broker like FXOpen.
⚠️
This forecast represents FXOpen Companies opinion only, it should not be construed as an offer, invitation or recommendation in respect to FXOpen Companies products and services or as financial advice
YouTube
Weekly Market Wrap With Gary Thomson: Inflation, EUR/USD, S&P 500, OIL
Get the latest scoop on the week's hottest headlines, all in one convenient video. Join Gary Thomson, the COO of FXOpen UK, as he breaks down the most significant news reports and shares his expert insights.
- Inflation Still Dogs the Economy: What Are the…
- Inflation Still Dogs the Economy: What Are the…
#marketanalysis #XAGUSD #silverprice
XAG/USD Analysis: Silver Price Quickly Drops by Approximately 7.5%
On Friday, silver was trading at USD 23.5 per ounce, but on Monday morning it dropped below USD 21.7 – a difference of 7.5%.
Fundamental influencing factors are not clearly identified, but it can be assumed that the sharp drop was facilitated by:
→ the fact that a shutdown of US government agencies was avoided, since the authorities reached a budget agreement – albeit a temporary one;
→ high yield on bonds;
→ at the end of the Q3, the long-term portfolios of large market participants were rebalanced.
Factors could put pressure on gold (it also shows a negative trend, falling below USD 1,850 per ounce for the first time since March of this year), and more volatile silver rushed after gold.
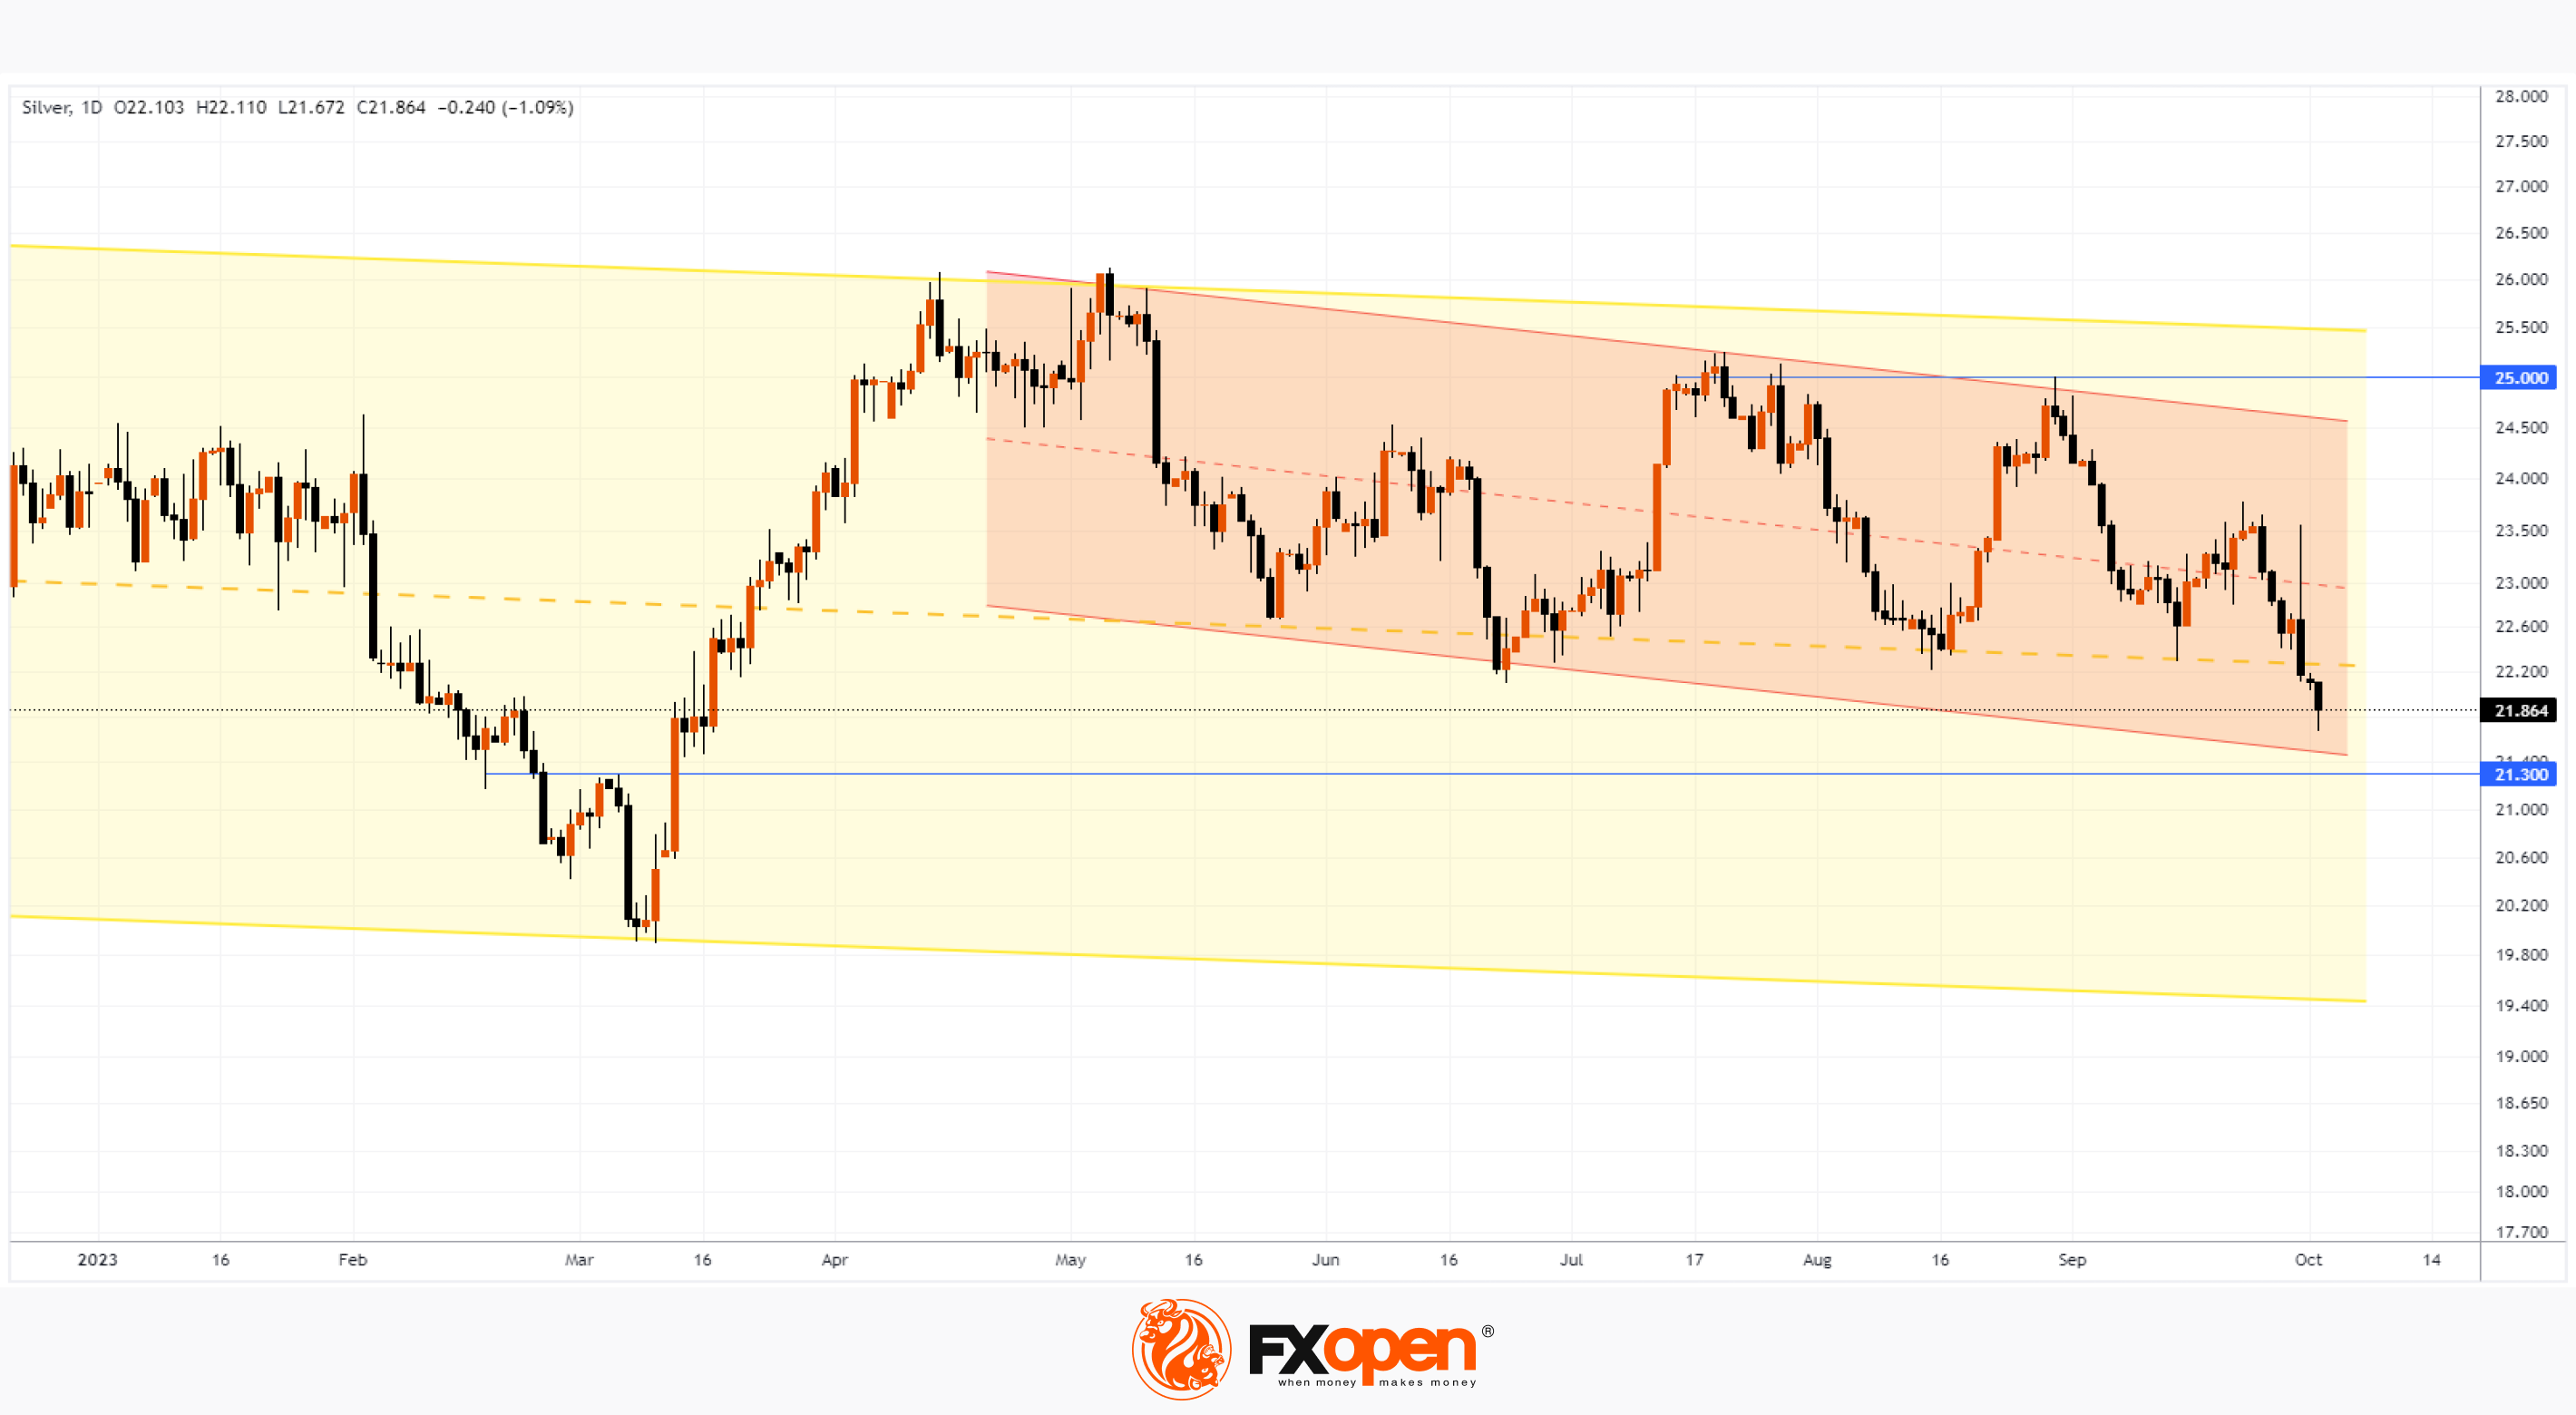
Technical analysis adds more information about the nature of the fall. In mid-July, we wrote that the price of gold had approached the upper limit of the long-term downward channel (shown in yellow), from which resistance could be expected.
However, the strength of demand was exhausted earlier, around the level of USD 25 per ounce, it turned out to be an unbearable barrier for the bulls, which is noticeable in the price action in July and August.
But what next?
Bearish arguments:
→ a long upper shadow on the Friday candle indicates strong selling pressure;
→ the price has dropped below the median line of the long-term yellow channel – now it can act as resistance (after serving as support in September);
→ resistance may also come from the median line of the red channel, where the psychological level of USD 23 per ounce also passes.
Bullish arguments:
→ the psychological level of USD 21 can provide support;
→ also in this area there is the lower border of the red channel;
→ after a sharp drop, the market looks oversold, and if sellers want to take profits, this should bring positivity to the price action.
The level of 21.30, which dates back to March, also looks strong. The emergence of fundamental factors contributing to
To benefit from the rise and fall of gold and silver prices, consider enlisting the services of a trusted broker like FXOpen.
CFDs are complex instruments and come with a high risk of losing your money.
This article represents the opinion of the Companies operating under the FXOpen brand only. It is not to be construed as an offer, solicitation, or recommendation with respect to products and services provided by the Companies operating under the FXOpen brand, nor is it to be considered financial advice.
XAG/USD Analysis: Silver Price Quickly Drops by Approximately 7.5%
On Friday, silver was trading at USD 23.5 per ounce, but on Monday morning it dropped below USD 21.7 – a difference of 7.5%.
Fundamental influencing factors are not clearly identified, but it can be assumed that the sharp drop was facilitated by:
→ the fact that a shutdown of US government agencies was avoided, since the authorities reached a budget agreement – albeit a temporary one;
→ high yield on bonds;
→ at the end of the Q3, the long-term portfolios of large market participants were rebalanced.
Factors could put pressure on gold (it also shows a negative trend, falling below USD 1,850 per ounce for the first time since March of this year), and more volatile silver rushed after gold.
Technical analysis adds more information about the nature of the fall. In mid-July, we wrote that the price of gold had approached the upper limit of the long-term downward channel (shown in yellow), from which resistance could be expected.
However, the strength of demand was exhausted earlier, around the level of USD 25 per ounce, it turned out to be an unbearable barrier for the bulls, which is noticeable in the price action in July and August.
But what next?
Bearish arguments:
→ a long upper shadow on the Friday candle indicates strong selling pressure;
→ the price has dropped below the median line of the long-term yellow channel – now it can act as resistance (after serving as support in September);
→ resistance may also come from the median line of the red channel, where the psychological level of USD 23 per ounce also passes.
Bullish arguments:
→ the psychological level of USD 21 can provide support;
→ also in this area there is the lower border of the red channel;
→ after a sharp drop, the market looks oversold, and if sellers want to take profits, this should bring positivity to the price action.
The level of 21.30, which dates back to March, also looks strong. The emergence of fundamental factors contributing to
To benefit from the rise and fall of gold and silver prices, consider enlisting the services of a trusted broker like FXOpen.
CFDs are complex instruments and come with a high risk of losing your money.
This article represents the opinion of the Companies operating under the FXOpen brand only. It is not to be construed as an offer, solicitation, or recommendation with respect to products and services provided by the Companies operating under the FXOpen brand, nor is it to be considered financial advice.
#marketanalysis #meta #stockmarket
META Analysis: Price Target Raised to $390
Last week, the Meta Connect event took place, where the following were presented:
→ new Ray-Ban Meta Smart Glasses with a camera and microphones, including for broadcasting on social networks. The price of the gadget is USD 299;
→ Meta Quest 3 virtual reality helmet priced at USD 499;
→ AI characters for social networks, as well as Meta AI chatbot.
Overall, the products were received favourably. And now analysts are making predictions about how this will affect the stock price. Thus, Truist Securities analyst Youssef Squali raised his target price to USD 390 per META share, expecting that:
→ revenue will increase by 21% year on year;
→ the company will receive many benefits through the implementation of AI (for example, Emu — an image generation model; Studio AI — a platform for developers that allows one to create new and customized AI).
Add to this that the increase in revenue should be facilitated by the company’s intention to offer a subscription fee of USD 14 per month for using Instagram and Facebook, which will allow one to disable advertising.
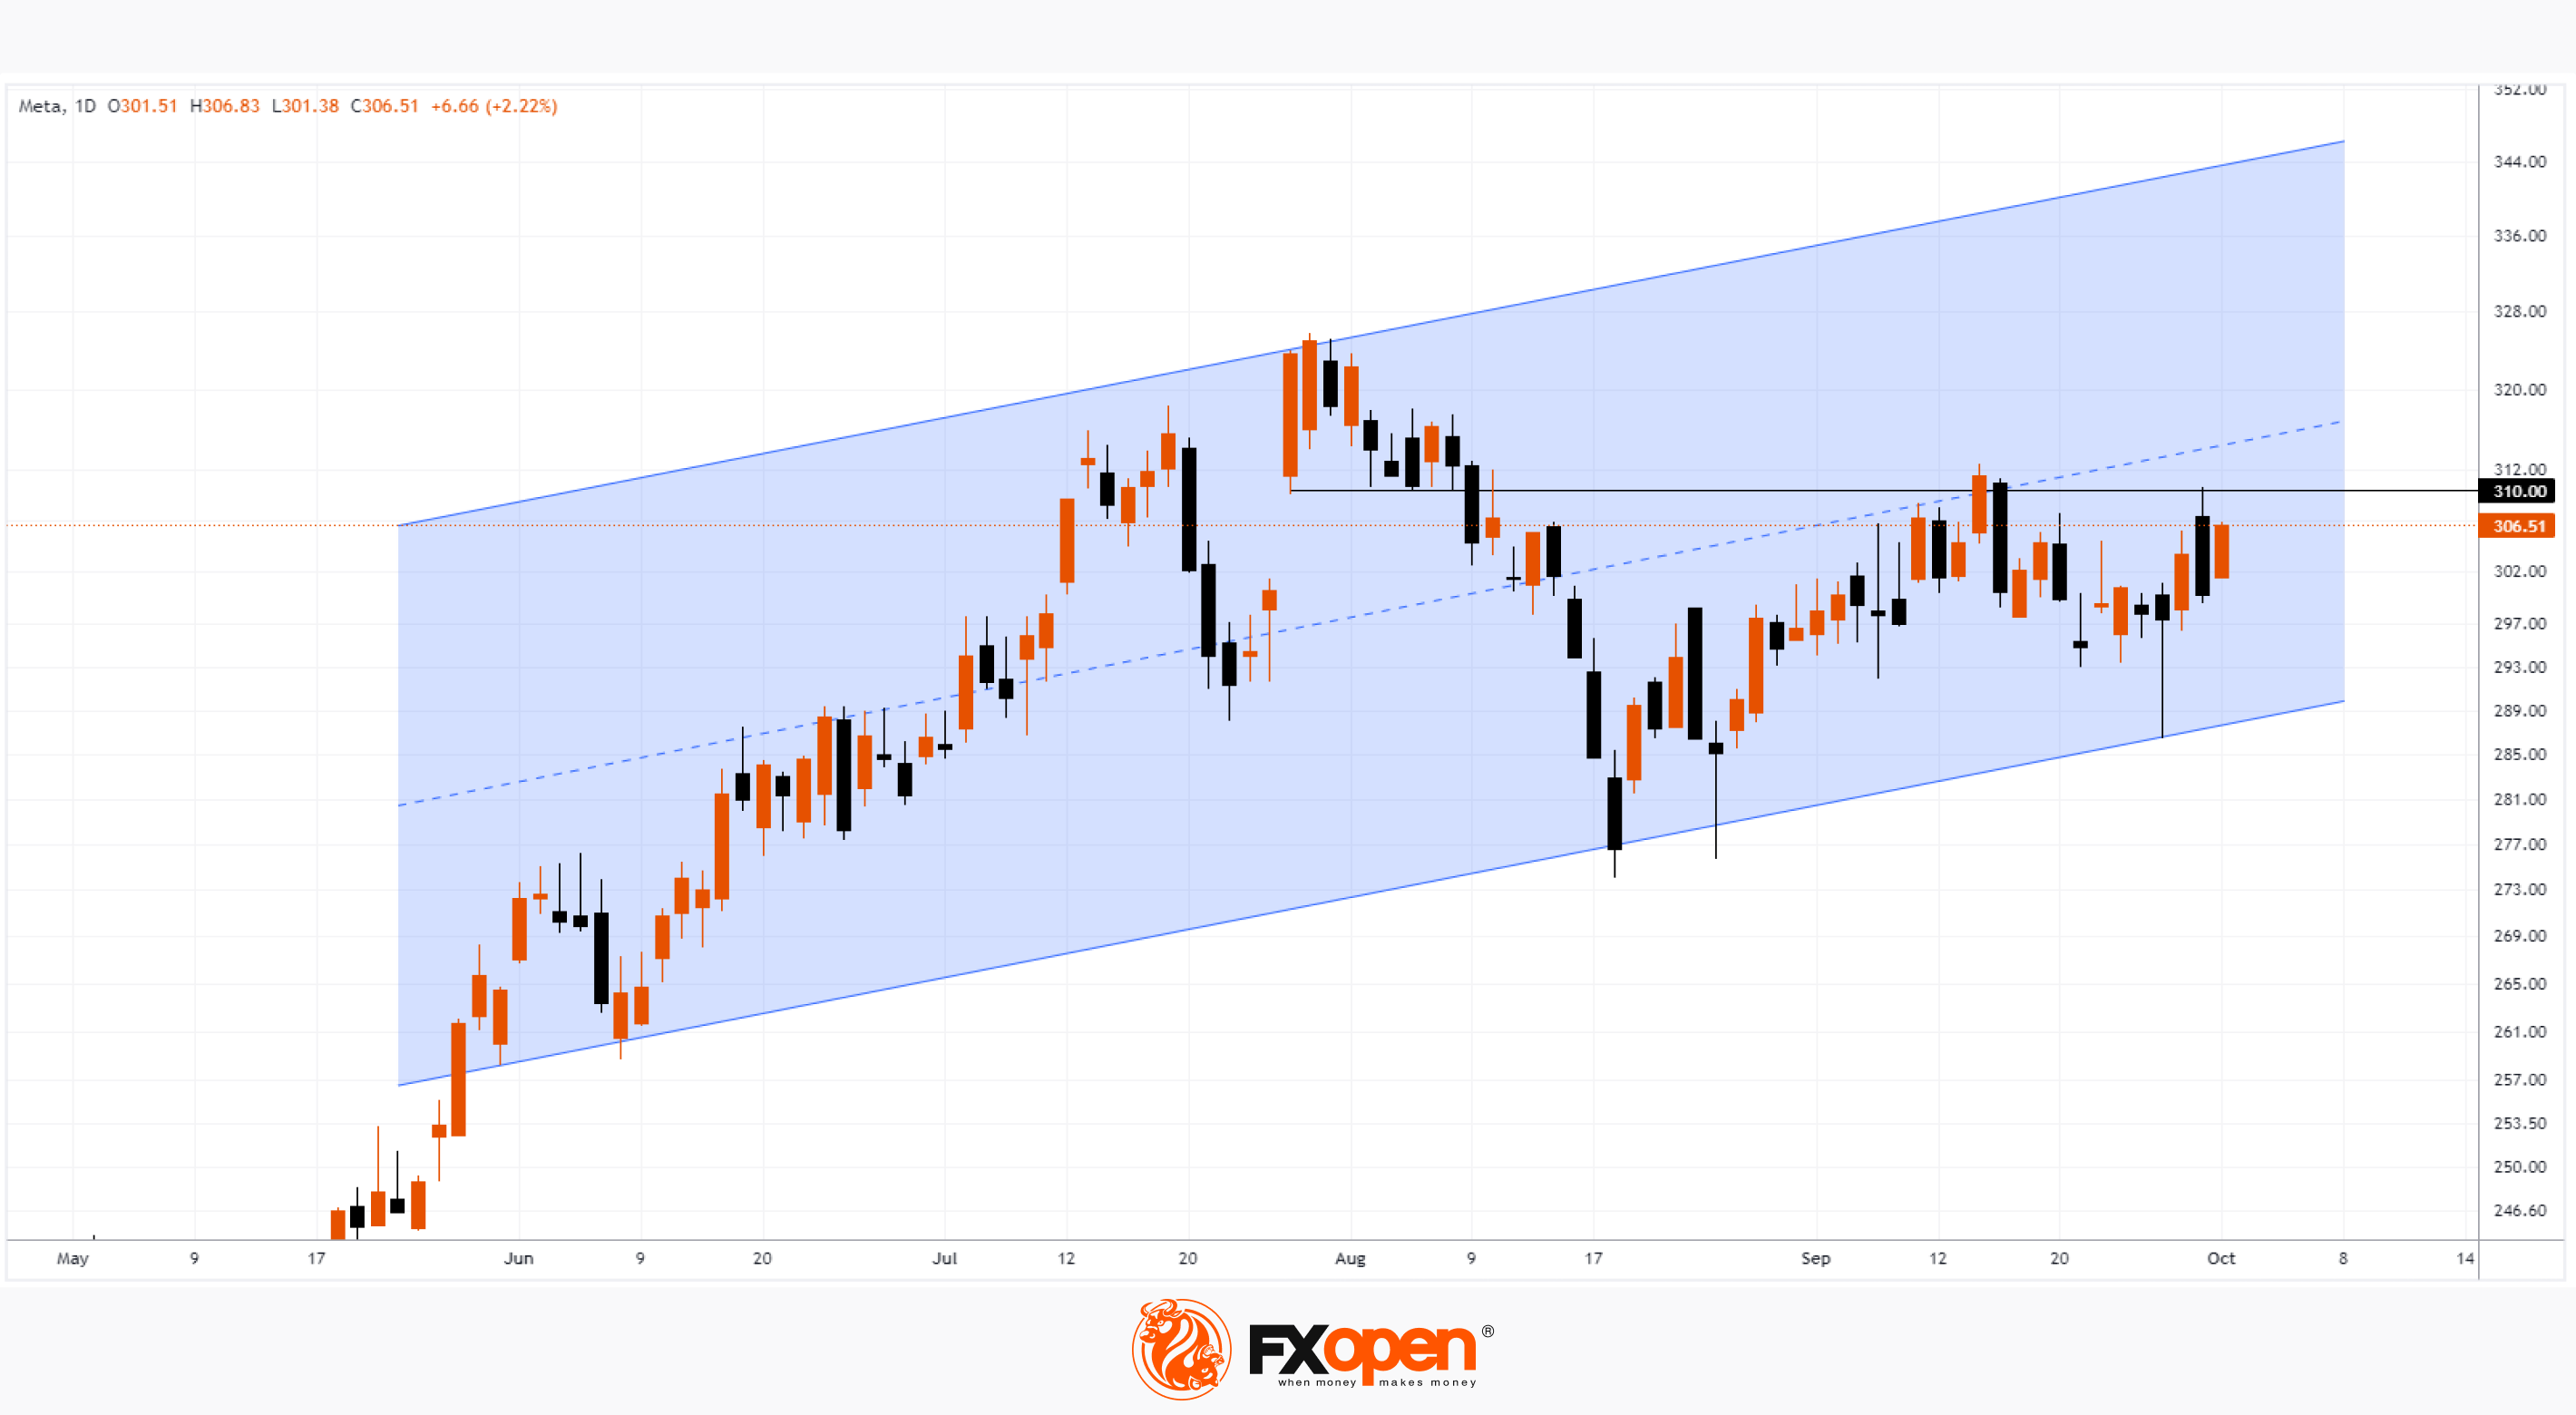
The daily chart of META stock, meanwhile, shows a mixed picture.
Bullish arguments:
→ META stock is stronger than the S&P 500 market;
→ the price forms a movement within the ascending channel;
→ the price formed quick energetic rebounds from the lower border of the channel, thereby indicating the strength of demand.
Bearish arguments:
→ On July 27, when the high of the year was formed, extremely high volumes were recorded on the NASDAQ exchange. They can be interpreted as the desire of large players to fix profits from long positions. Since then, the July 27 candle area has acted as resistance. Price action near the USD 310 level (roughly the low of the July 27 candlestick) confirms bearish activity.
It is possible that in the coming weeks, the forces of supply and demand will balance out in the market, however, if the fundamental backdrop for META stock remains strong, it will help the bulls prove their superiority in the long term.
To benefit from the rise and fall of popular stock prices, consider enlisting the services of a trusted broker like FXOpen.
CFDs are complex instruments and come with a high risk of losing your money.
This article represents the opinion of the Companies operating under the FXOpen brand only. It is not to be construed as an offer, solicitation, or recommendation with respect to products and services provided by the Companies operating under the FXOpen brand, nor is it to be considered financial advice.
META Analysis: Price Target Raised to $390
Last week, the Meta Connect event took place, where the following were presented:
→ new Ray-Ban Meta Smart Glasses with a camera and microphones, including for broadcasting on social networks. The price of the gadget is USD 299;
→ Meta Quest 3 virtual reality helmet priced at USD 499;
→ AI characters for social networks, as well as Meta AI chatbot.
Overall, the products were received favourably. And now analysts are making predictions about how this will affect the stock price. Thus, Truist Securities analyst Youssef Squali raised his target price to USD 390 per META share, expecting that:
→ revenue will increase by 21% year on year;
→ the company will receive many benefits through the implementation of AI (for example, Emu — an image generation model; Studio AI — a platform for developers that allows one to create new and customized AI).
Add to this that the increase in revenue should be facilitated by the company’s intention to offer a subscription fee of USD 14 per month for using Instagram and Facebook, which will allow one to disable advertising.
The daily chart of META stock, meanwhile, shows a mixed picture.
Bullish arguments:
→ META stock is stronger than the S&P 500 market;
→ the price forms a movement within the ascending channel;
→ the price formed quick energetic rebounds from the lower border of the channel, thereby indicating the strength of demand.
Bearish arguments:
→ On July 27, when the high of the year was formed, extremely high volumes were recorded on the NASDAQ exchange. They can be interpreted as the desire of large players to fix profits from long positions. Since then, the July 27 candle area has acted as resistance. Price action near the USD 310 level (roughly the low of the July 27 candlestick) confirms bearish activity.
It is possible that in the coming weeks, the forces of supply and demand will balance out in the market, however, if the fundamental backdrop for META stock remains strong, it will help the bulls prove their superiority in the long term.
To benefit from the rise and fall of popular stock prices, consider enlisting the services of a trusted broker like FXOpen.
CFDs are complex instruments and come with a high risk of losing your money.
This article represents the opinion of the Companies operating under the FXOpen brand only. It is not to be construed as an offer, solicitation, or recommendation with respect to products and services provided by the Companies operating under the FXOpen brand, nor is it to be considered financial advice.
#marketanalysis #EURUSD #trading
EUR/USD Analysis: The Rate Updates Its Multi-month Low
Never in its history has the euro fallen for 11 weeks in a row against the dollar, but it happened. The minimum has been set for 2023.
The reason seems to be that in an environment where central banks are raising rates to combat inflation, the US economy appears to be favored. Yesterday's batch of news confirmed this:
→ US ISM Manufacturing PMI index turned out to be higher than expected (actual = 49.0; forecast = 47.8; previous value = 47.6).
→ In his speech at a roundtable in Pennsylvania, the Fed chairman said: “Lots of good things happen,” commenting on the strong labor market. Today, by the way, at 17:00 GMT+3 JOLTS data on the number of vacancies will be released, which can confirm the stability of the economy.
The attractiveness of USD is also affected by rising US government bond yields, as investors need dollars to buy them.
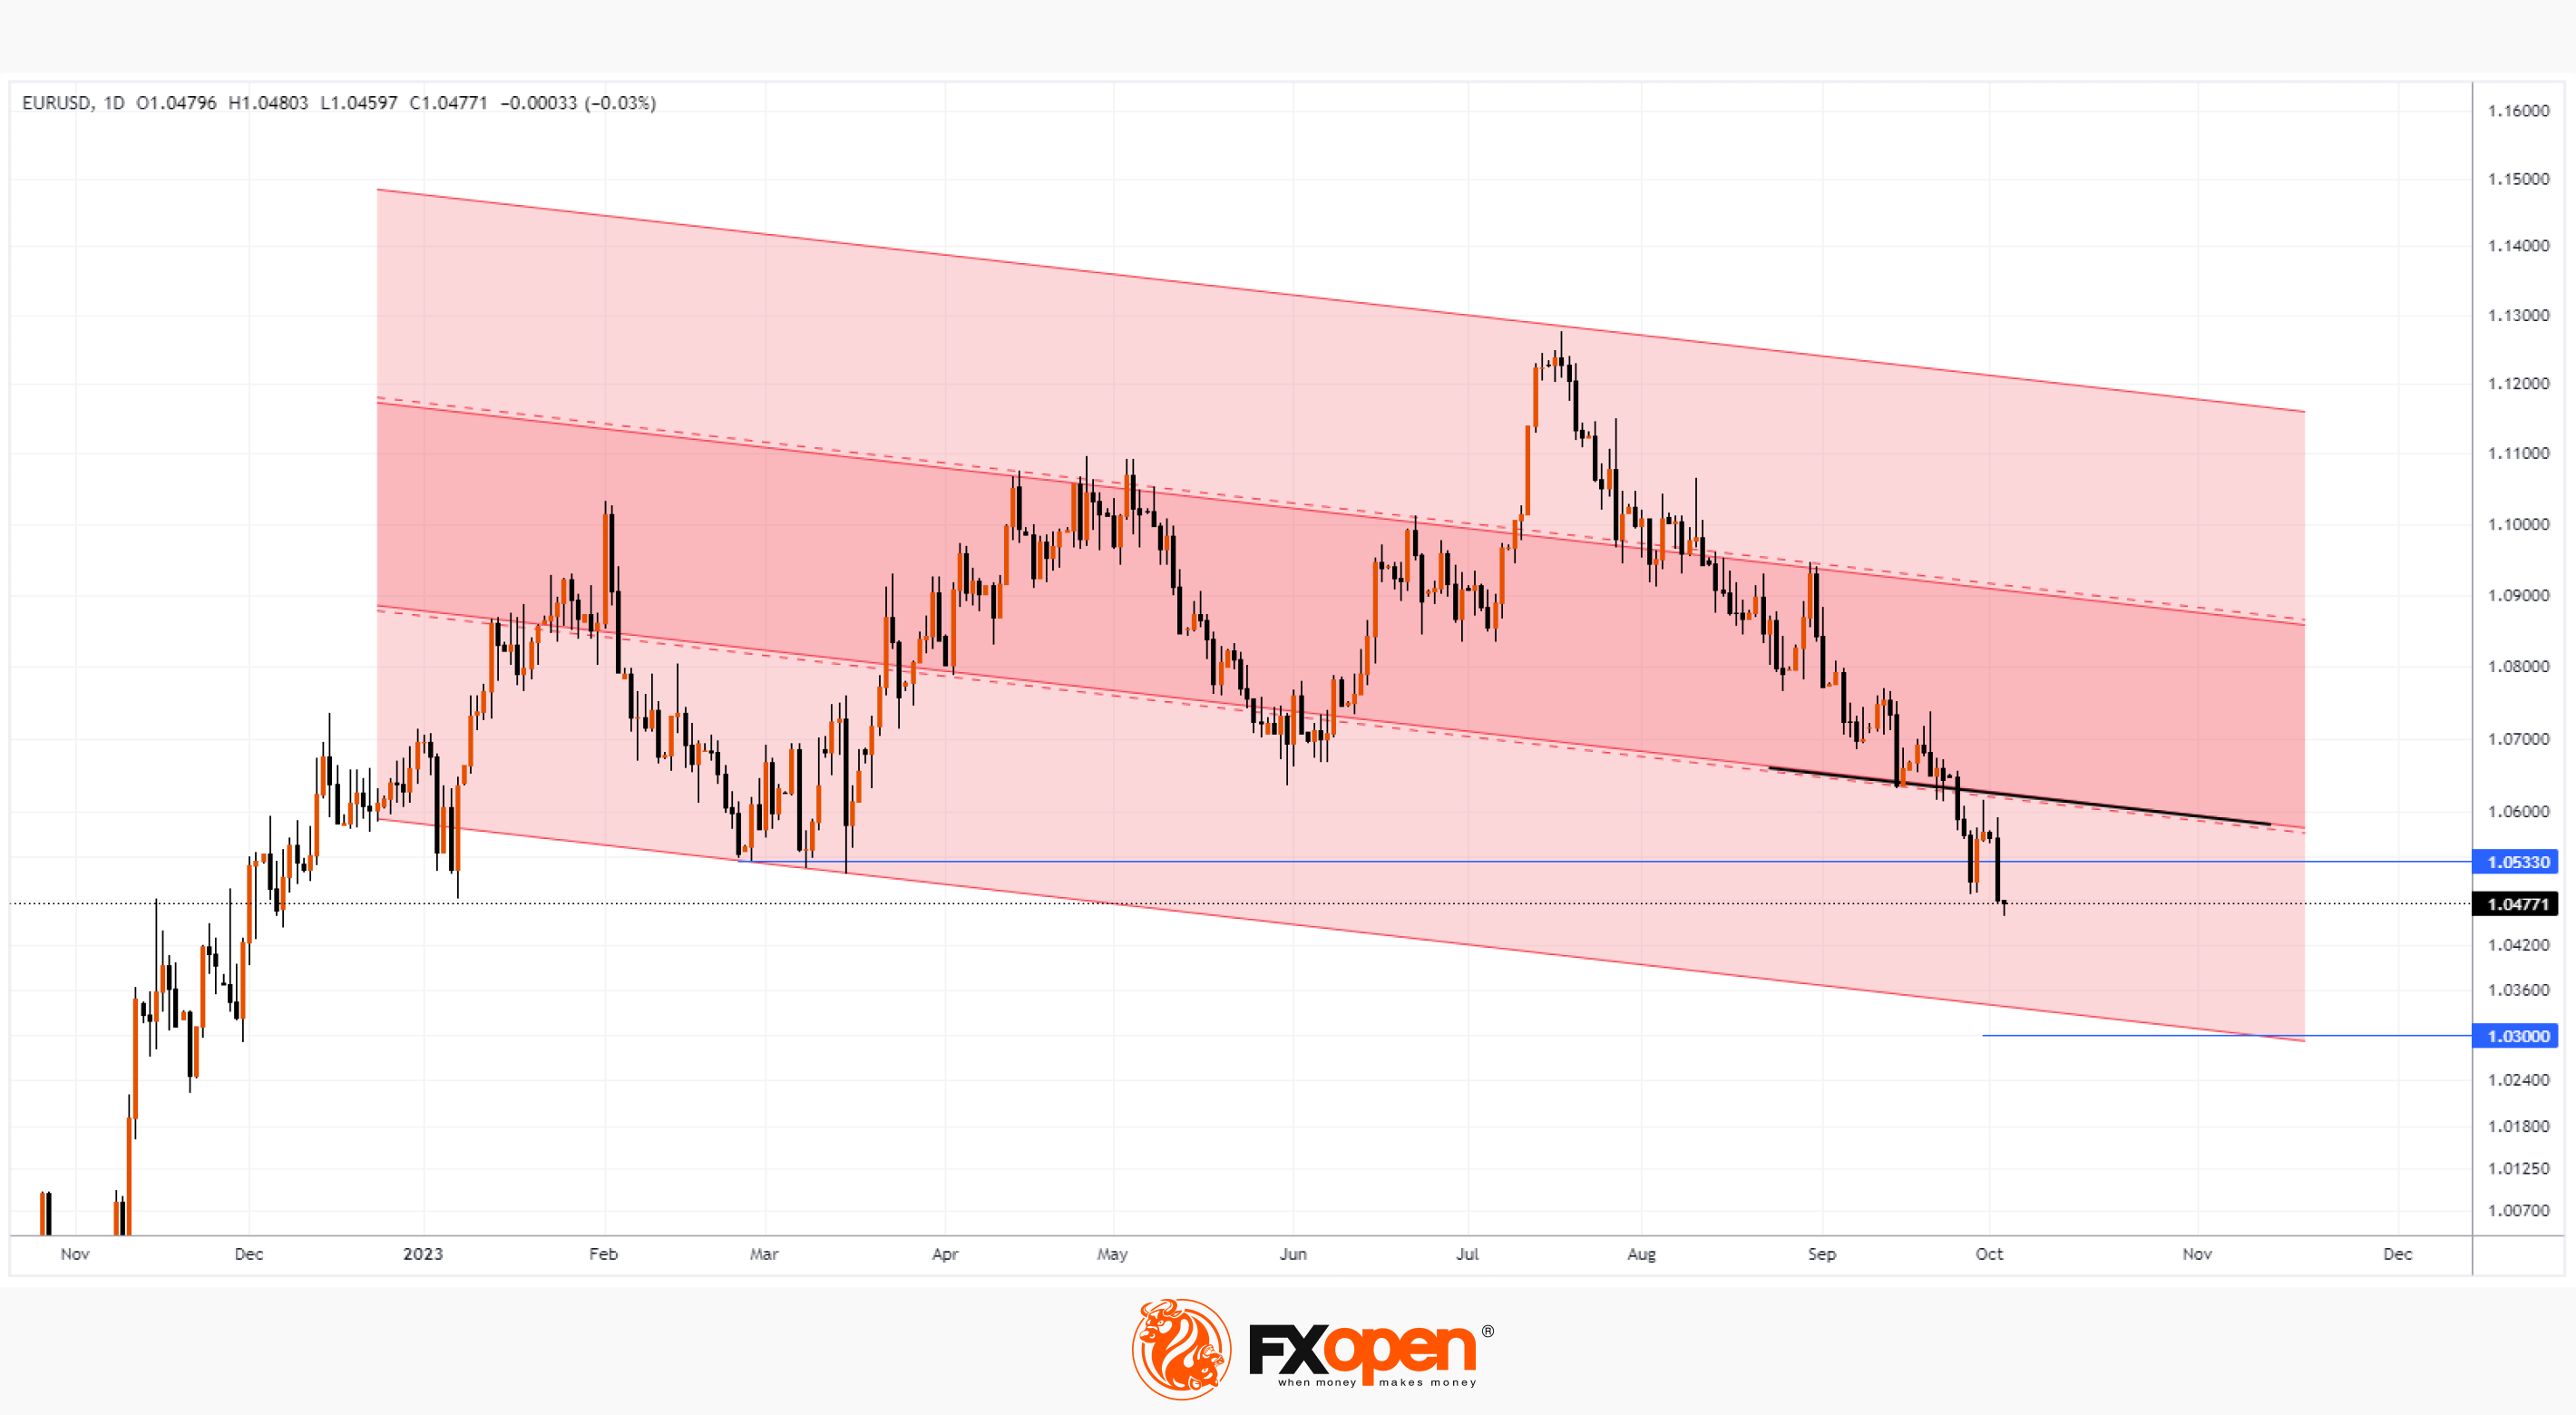
How long can the fall of the euro continue, which is already “settled” below the level of 1.05?
If the fundamental balance of power between the economies of Europe and the United States remains unchanged, the rate may reach the lower boundary of the bearish channel (shown in red).
Looking ahead to the last quarter of the year, this could mean 1.03 euros per US dollar.
At the same time, technically:
→ spikes in volatility over the past 7 days may be due to the fact that the euro dropped below spring lows around 1.0533, which led to the rebalancing of large portfolios;
→ the line shown in black may resist recovery attempts.
To benefit from price fluctuations in the currency markets, consider enlisting the services of a trusted broker like FXOpen.
CFDs are complex instruments and come with a high risk of losing your money.
This article represents the opinion of the Companies operating under the FXOpen brand only. It is not to be construed as an offer, solicitation, or recommendation with respect to products and services provided by the Companies operating under the FXOpen brand, nor is it to be considered financial advice.
EUR/USD Analysis: The Rate Updates Its Multi-month Low
Never in its history has the euro fallen for 11 weeks in a row against the dollar, but it happened. The minimum has been set for 2023.
The reason seems to be that in an environment where central banks are raising rates to combat inflation, the US economy appears to be favored. Yesterday's batch of news confirmed this:
→ US ISM Manufacturing PMI index turned out to be higher than expected (actual = 49.0; forecast = 47.8; previous value = 47.6).
→ In his speech at a roundtable in Pennsylvania, the Fed chairman said: “Lots of good things happen,” commenting on the strong labor market. Today, by the way, at 17:00 GMT+3 JOLTS data on the number of vacancies will be released, which can confirm the stability of the economy.
The attractiveness of USD is also affected by rising US government bond yields, as investors need dollars to buy them.
How long can the fall of the euro continue, which is already “settled” below the level of 1.05?
If the fundamental balance of power between the economies of Europe and the United States remains unchanged, the rate may reach the lower boundary of the bearish channel (shown in red).
Looking ahead to the last quarter of the year, this could mean 1.03 euros per US dollar.
At the same time, technically:
→ spikes in volatility over the past 7 days may be due to the fact that the euro dropped below spring lows around 1.0533, which led to the rebalancing of large portfolios;
→ the line shown in black may resist recovery attempts.
To benefit from price fluctuations in the currency markets, consider enlisting the services of a trusted broker like FXOpen.
CFDs are complex instruments and come with a high risk of losing your money.
This article represents the opinion of the Companies operating under the FXOpen brand only. It is not to be construed as an offer, solicitation, or recommendation with respect to products and services provided by the Companies operating under the FXOpen brand, nor is it to be considered financial advice.
#marketanalysis #sp500 #stocktrading
Market Analysis: E-mini S&P 500 Falls to Lowest Since Early Summer
Job openings rose to 9.6 million in August, the highest level since April, the US Bureau of Labor Statistics reported yesterday. That's nearly 700,000 more than in July and well above the Dow Jones forecast of 8.8 million.
A strong labor market may indicate a growing economy, but why did E-mini S&P 500 futures fall to their lowest level since early summer? It's about the Fed's high rates.
A strong labor market makes the case for keeping rates high for longer to slow inflation to the 2% target. And high rates mean a decrease in the profitability of companies' businesses; accordingly, we see the development of bearish sentiment in the stock market. We wrote about this scenario in an analytical review on September 19, before the last FOMC meeting took place.
In addition, high Federal Reserve rates make bonds more attractive and portfolio managers, it can be assumed, are transferring capital from the stock market to bonds, as well as to cash (the dollar index hit a new high of the year yesterday).
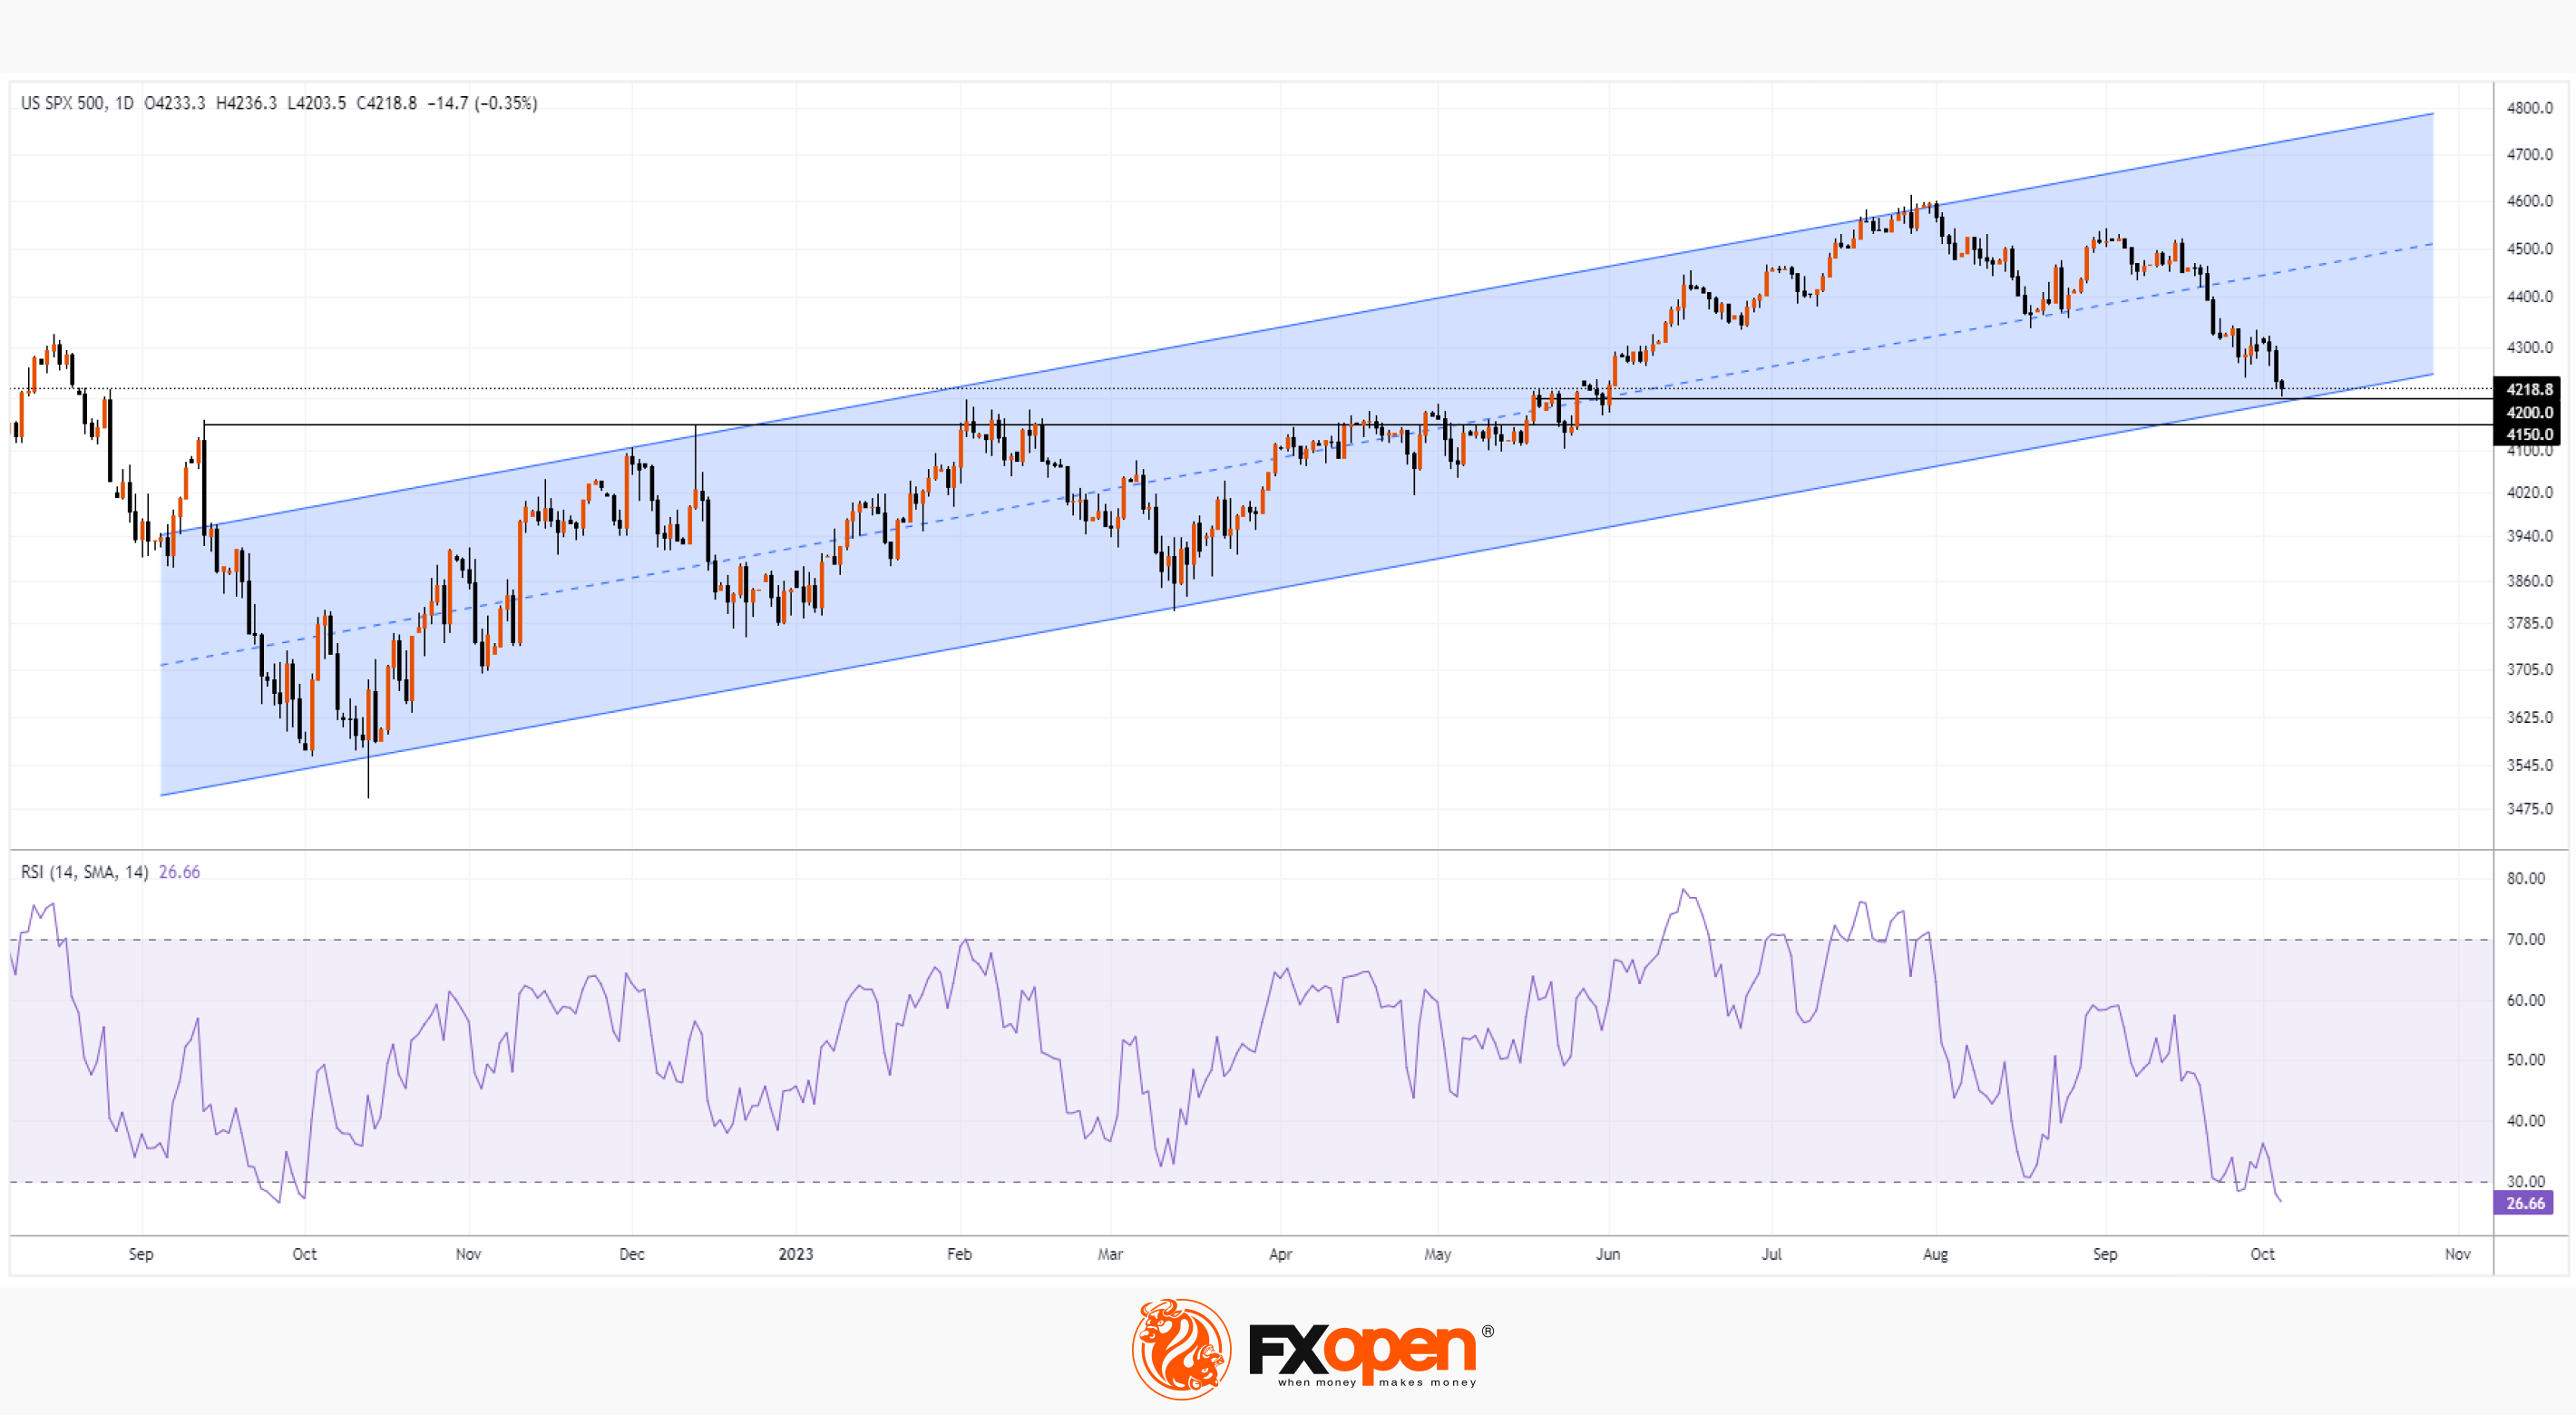
How long can a bearish trend in the S&P-500 market continue? The likelihood of at least a slowdown in the rate of decline is indicated by bullish arguments from technical analysis of the S&P 500 chart:
→ The price of the S&P 500 is near the lower border of the ascending channel (shown in blue). By the way, this line is part of a larger channel that originates from the bottom of the coronavirus panic.
→ The zone 4,150-4,200 can become a support for the bulls, since it has served as resistance since the fall of 2022.
→ RSI fell to its minimum in 12 months. This significant oversold market increases the likelihood of a rebound from the block of supports mentioned above.
To benefit from stock market trends, consider enlisting the services of a trusted broker like FXOpen.
CFDs are complex instruments and come with a high risk of losing your money.
This article represents the opinion of the Companies operating under the FXOpen brand only. It is not to be construed as an offer, solicitation, or recommendation with respect to products and services provided by the Companies operating under the FXOpen brand, nor is it to be considered financial advice.
Market Analysis: E-mini S&P 500 Falls to Lowest Since Early Summer
Job openings rose to 9.6 million in August, the highest level since April, the US Bureau of Labor Statistics reported yesterday. That's nearly 700,000 more than in July and well above the Dow Jones forecast of 8.8 million.
A strong labor market may indicate a growing economy, but why did E-mini S&P 500 futures fall to their lowest level since early summer? It's about the Fed's high rates.
A strong labor market makes the case for keeping rates high for longer to slow inflation to the 2% target. And high rates mean a decrease in the profitability of companies' businesses; accordingly, we see the development of bearish sentiment in the stock market. We wrote about this scenario in an analytical review on September 19, before the last FOMC meeting took place.
In addition, high Federal Reserve rates make bonds more attractive and portfolio managers, it can be assumed, are transferring capital from the stock market to bonds, as well as to cash (the dollar index hit a new high of the year yesterday).
How long can a bearish trend in the S&P-500 market continue? The likelihood of at least a slowdown in the rate of decline is indicated by bullish arguments from technical analysis of the S&P 500 chart:
→ The price of the S&P 500 is near the lower border of the ascending channel (shown in blue). By the way, this line is part of a larger channel that originates from the bottom of the coronavirus panic.
→ The zone 4,150-4,200 can become a support for the bulls, since it has served as resistance since the fall of 2022.
→ RSI fell to its minimum in 12 months. This significant oversold market increases the likelihood of a rebound from the block of supports mentioned above.
To benefit from stock market trends, consider enlisting the services of a trusted broker like FXOpen.
CFDs are complex instruments and come with a high risk of losing your money.
This article represents the opinion of the Companies operating under the FXOpen brand only. It is not to be construed as an offer, solicitation, or recommendation with respect to products and services provided by the Companies operating under the FXOpen brand, nor is it to be considered financial advice.
#marketanalysis #oilprices #oilindustry
WTI Oil Analysis: Price Falls 10% in Less Than a Week
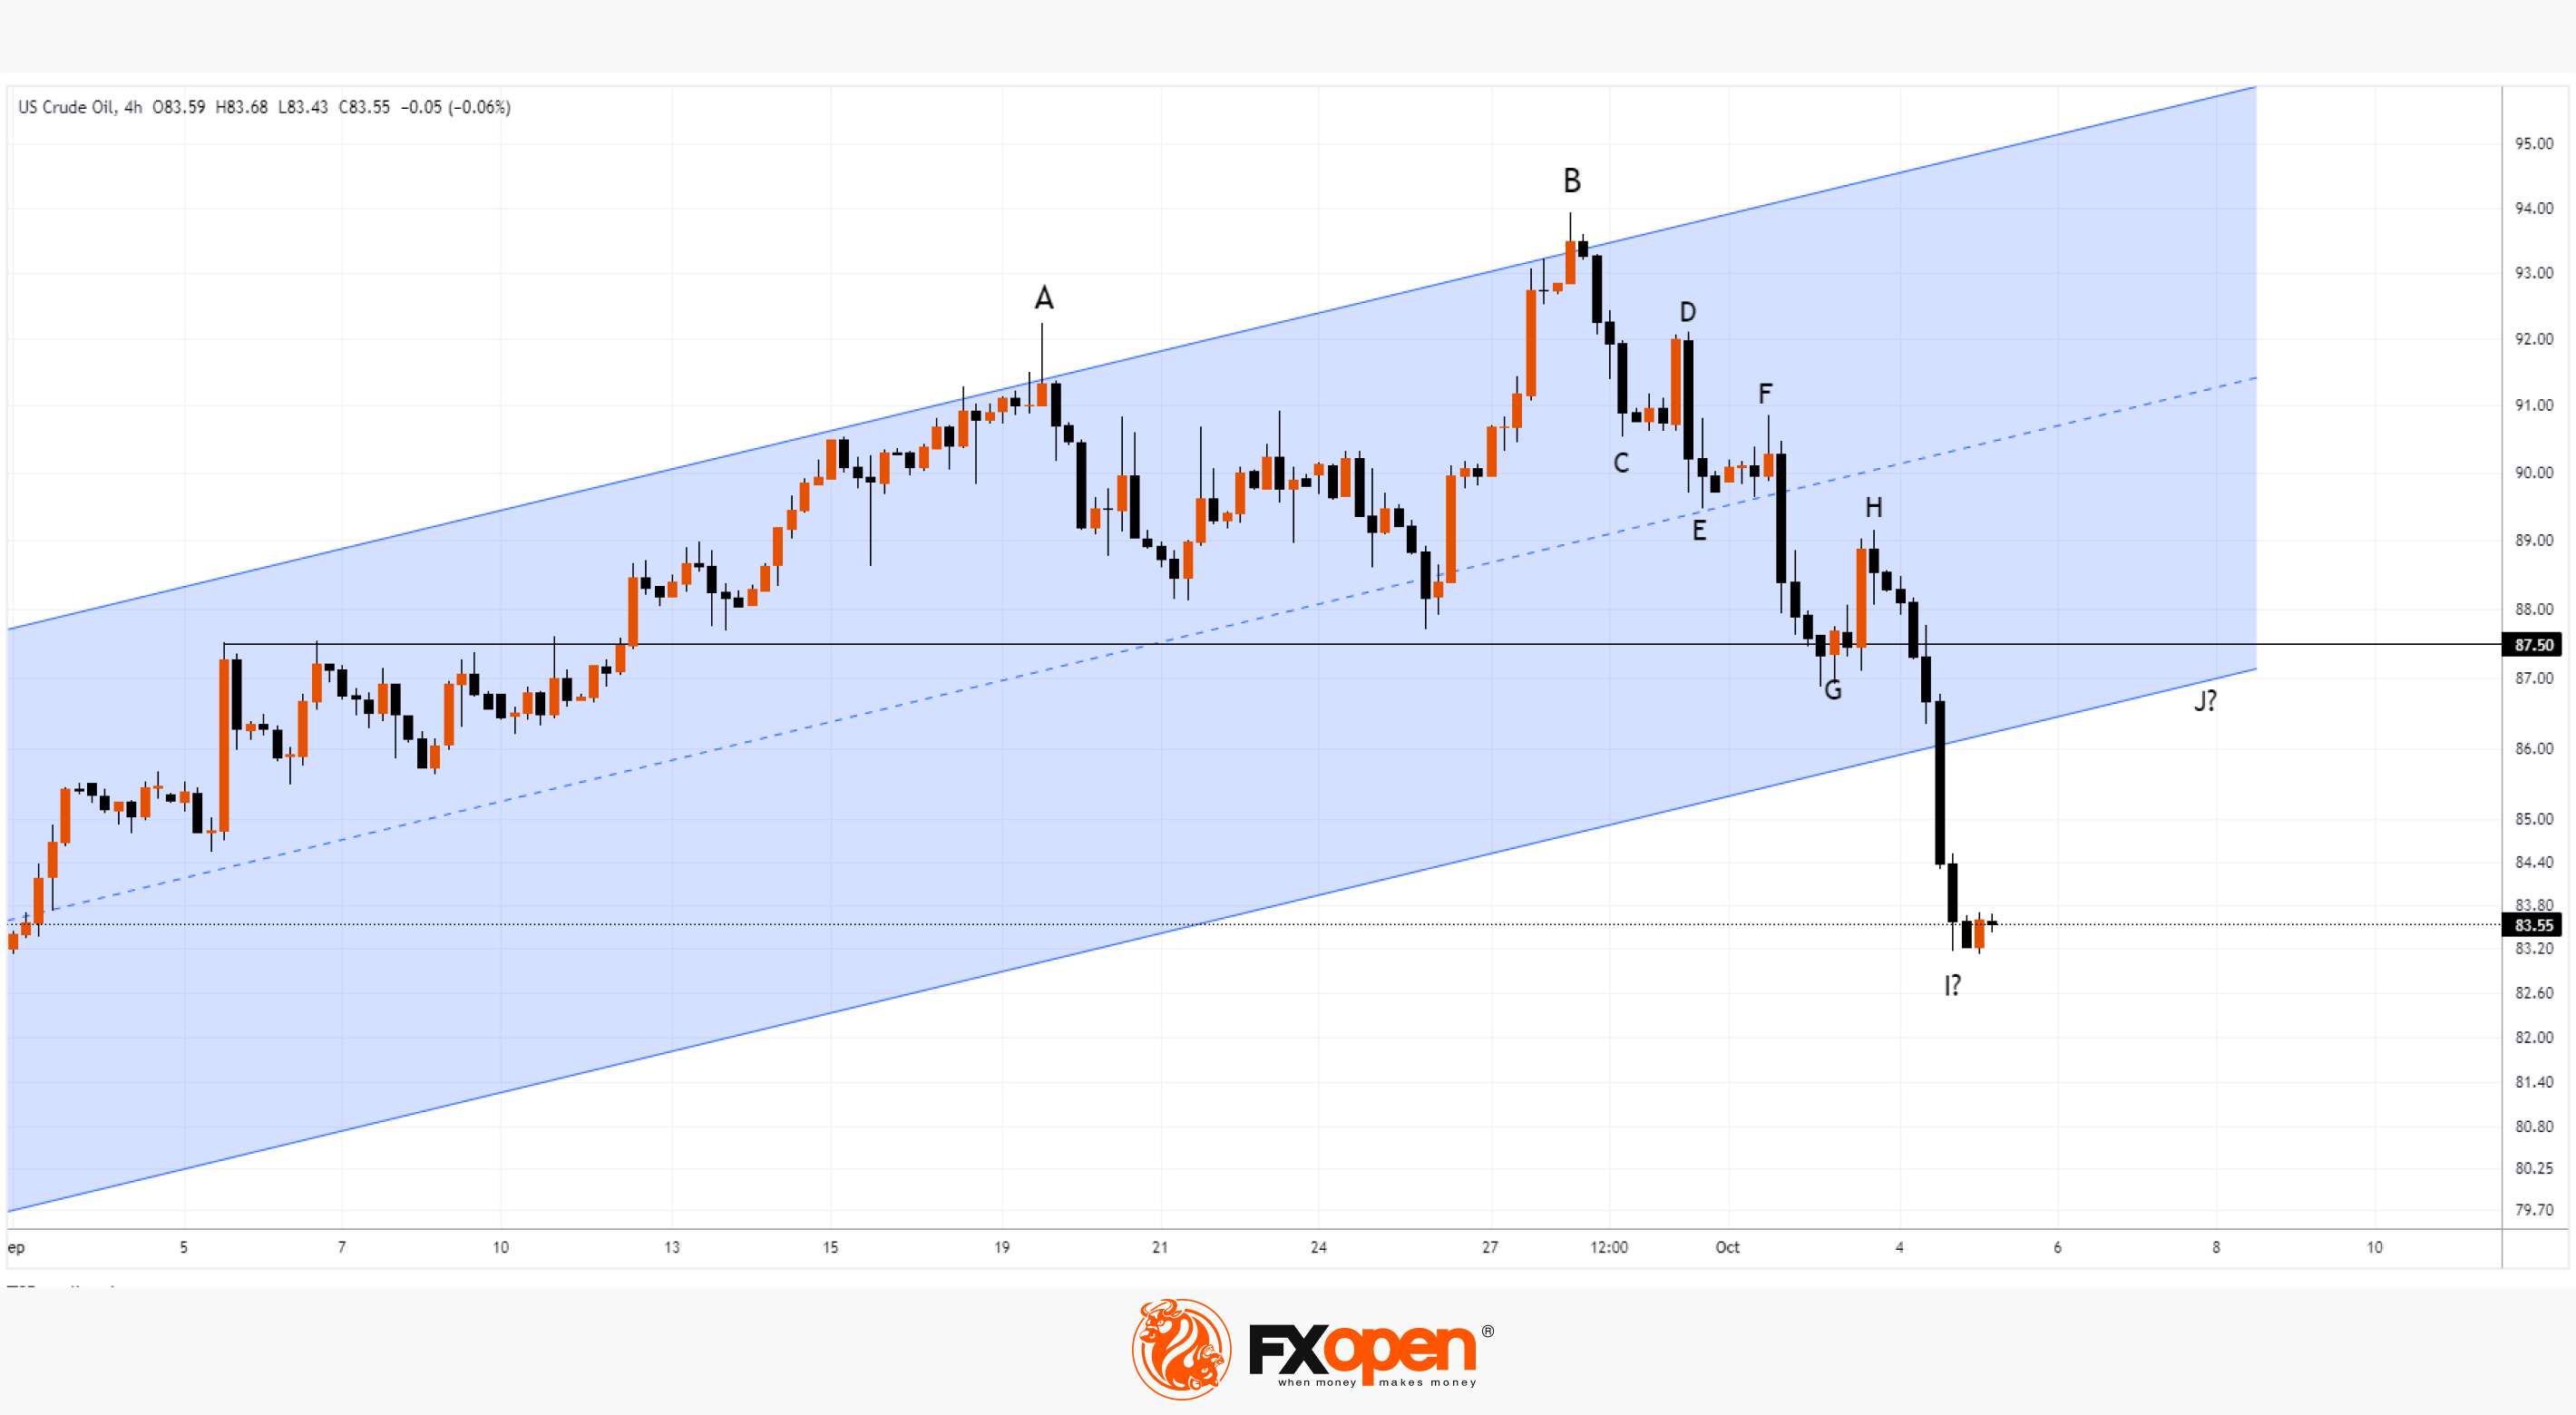
In our article “Oil Analysis: Finally, A Bearish Reversal?” on September 21, we drew attention to emerging signs that the initiative was shifting to the bears. This was noticeable in the changes in the dynamics of impulses and corrections, as well as in the analysis of the interaction between trading volumes and prices.
Since then, the bulls were able to update the high of the year on September 28, but the price did not stay there for long, falling sharply in the following days. Three bearish candles formed on the chart, which confirmed the problems of the bulls, and the double top pattern (A-B) also became relevant.
Another principle of technical analysis that emphasized the dominance of supply over demand is that each upward move was approximately 2 times weaker than the downward move. This can be seen in the consistent structure characteristic of a bearish trend:
→ the C→D move is approximately 50% of the B→C bearish momentum;
→ the rebound from the median line of the ascending channel E→F is approximately 50% of the bearish impulse D→E;
→ the bounce from the (now former) support line 87.50 G→H is approximately 50% of the bearish momentum F→G.
Yesterday, the US Energy Information Administration (EIA) reported that supplies of finished motor gasoline, reflecting demand, fell to about 8 million barrels per day, the lowest since the beginning of this year. The news contributed to the formation of a new bearish impulse, which broke through the ascending channel (shown in blue).
It is possible that another I→J rollback will follow. If so, then the formation of top J may be facilitated by resistance from the level of 87.50, the lower border of the ascending channel and the 50% Fibo level.
To benefit from trends in energy markets, consider enlisting the services of a trusted broker like FXOpen.
CFDs are complex instruments and come with a high risk of losing your money.
This article represents the opinion of the Companies operating under the FXOpen brand only. It is not to be construed as an offer, solicitation, or recommendation with respect to products and services provided by the Companies operating under the FXOpen brand, nor is it to be considered financial advice.
WTI Oil Analysis: Price Falls 10% in Less Than a Week
In our article “Oil Analysis: Finally, A Bearish Reversal?” on September 21, we drew attention to emerging signs that the initiative was shifting to the bears. This was noticeable in the changes in the dynamics of impulses and corrections, as well as in the analysis of the interaction between trading volumes and prices.
Since then, the bulls were able to update the high of the year on September 28, but the price did not stay there for long, falling sharply in the following days. Three bearish candles formed on the chart, which confirmed the problems of the bulls, and the double top pattern (A-B) also became relevant.
Another principle of technical analysis that emphasized the dominance of supply over demand is that each upward move was approximately 2 times weaker than the downward move. This can be seen in the consistent structure characteristic of a bearish trend:
→ the C→D move is approximately 50% of the B→C bearish momentum;
→ the rebound from the median line of the ascending channel E→F is approximately 50% of the bearish impulse D→E;
→ the bounce from the (now former) support line 87.50 G→H is approximately 50% of the bearish momentum F→G.
Yesterday, the US Energy Information Administration (EIA) reported that supplies of finished motor gasoline, reflecting demand, fell to about 8 million barrels per day, the lowest since the beginning of this year. The news contributed to the formation of a new bearish impulse, which broke through the ascending channel (shown in blue).
It is possible that another I→J rollback will follow. If so, then the formation of top J may be facilitated by resistance from the level of 87.50, the lower border of the ascending channel and the 50% Fibo level.
To benefit from trends in energy markets, consider enlisting the services of a trusted broker like FXOpen.
CFDs are complex instruments and come with a high risk of losing your money.
This article represents the opinion of the Companies operating under the FXOpen brand only. It is not to be construed as an offer, solicitation, or recommendation with respect to products and services provided by the Companies operating under the FXOpen brand, nor is it to be considered financial advice.
#marketanalysis #forex #forextrading
USD/CHF Analysis: Rate Rises to Its Highest in Six Months
This happened against the backdrop of rising US bond yields. Reuters writes that it is in the region of a 16-year high. It is reasonable to assume that big capital was balancing its defensive portfolio by selling the franc, considered a safe haven, and buying dollars to invest in American bonds, which also have high-quality status.
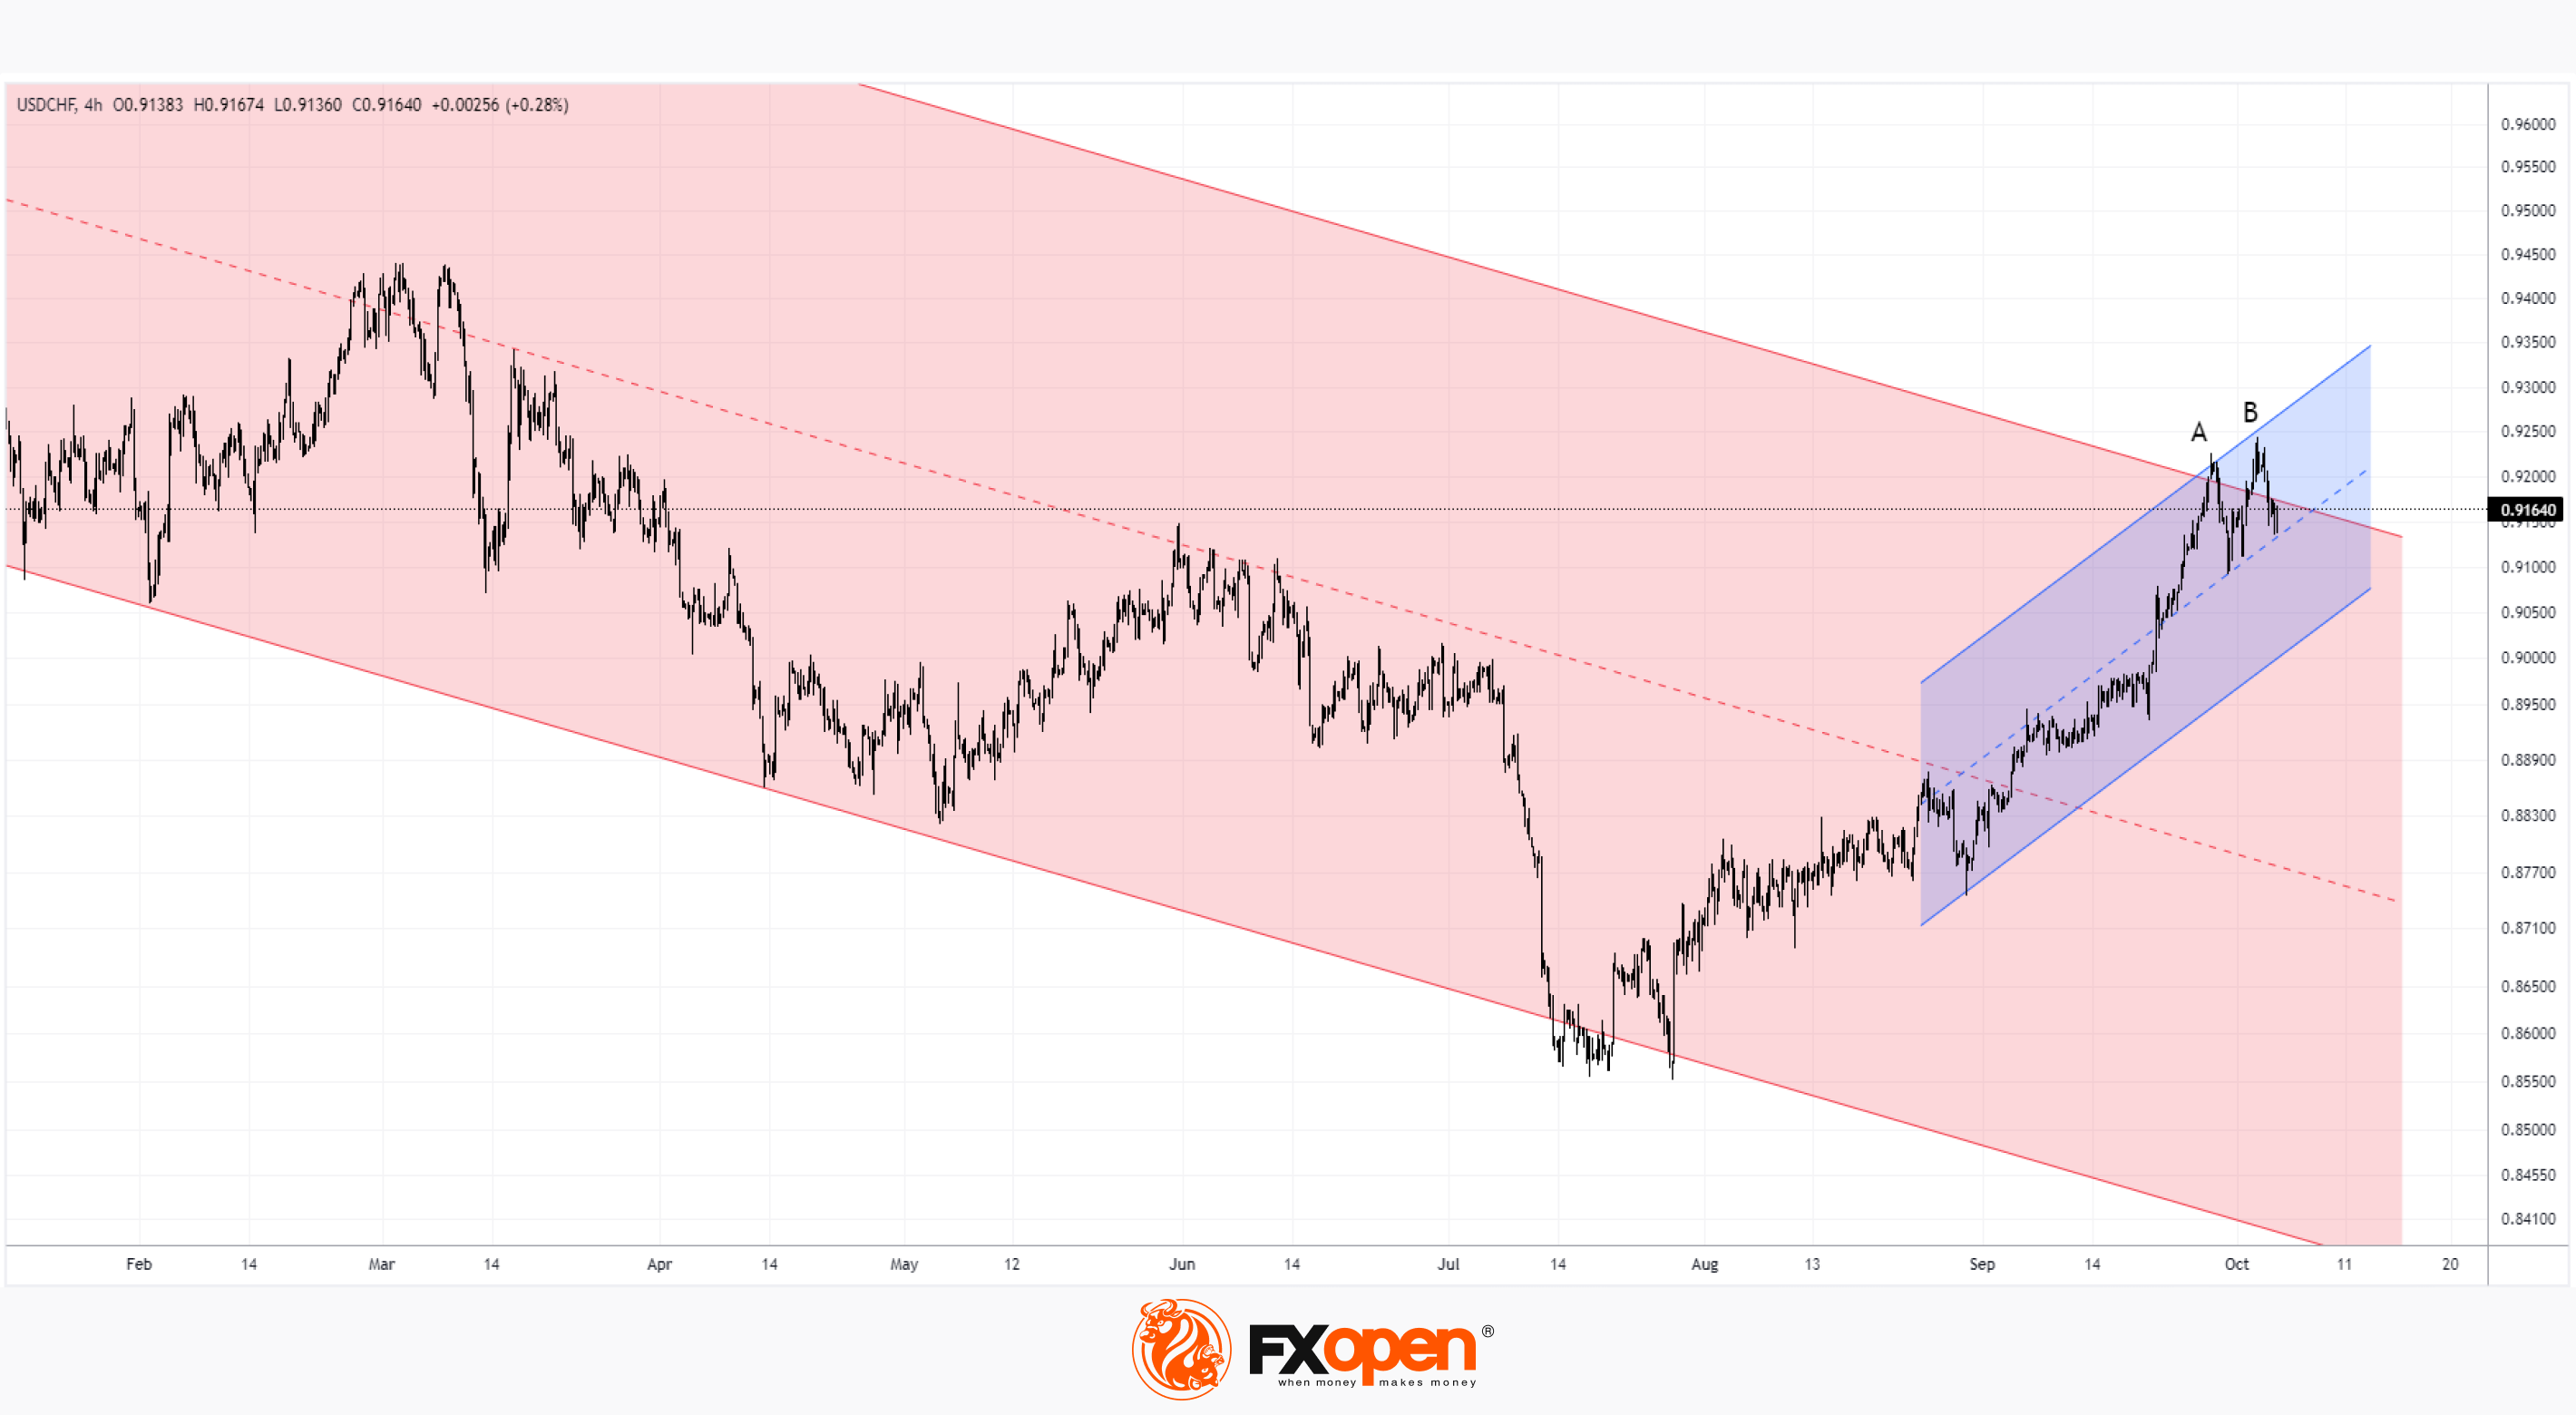
On July 13, we wrote that the franc could rebound from the lower line of the channel (shown in red). This was supposed to be facilitated by hawkish rhetoric from Fed officials and, as a result, the strengthening of the dollar.
However, now the situation has reversed. The USD/CHF rate expanded the range of a larger downward channel and reached its upper limit. It even tried to break out of it on October 3 (but without noticeable success).
Will the bullish trend described by the rising channel (shown in blue) continue?
Signs of technical analysis provide grounds for doubt:
→ extremes A and B are similar to the double-top pattern. Moreover, the fact that the second peak is higher than the first can be interpreted as a bull trap;
→ the formation of divergence on indicators – as an indication of weakening demand for the dollar;
→ bearish activity may intensify as the listed signs are formed near the upper border of the red channel.
Thus, the likelihood of a decline to the lower border of the blue channel increases, and in the longer term, attempts at its bearish breakout.
To benefit from trends in the foreign exchange markets, consider enlisting the services of a trusted broker like FXOpen.
CFDs are complex instruments and come with a high risk of losing your money.
This article represents the opinion of the Companies operating under the FXOpen brand only. It is not to be construed as an offer, solicitation, or recommendation with respect to products and services provided by the Companies operating under the FXOpen brand, nor is it to be considered financial advice.
USD/CHF Analysis: Rate Rises to Its Highest in Six Months
This happened against the backdrop of rising US bond yields. Reuters writes that it is in the region of a 16-year high. It is reasonable to assume that big capital was balancing its defensive portfolio by selling the franc, considered a safe haven, and buying dollars to invest in American bonds, which also have high-quality status.
On July 13, we wrote that the franc could rebound from the lower line of the channel (shown in red). This was supposed to be facilitated by hawkish rhetoric from Fed officials and, as a result, the strengthening of the dollar.
However, now the situation has reversed. The USD/CHF rate expanded the range of a larger downward channel and reached its upper limit. It even tried to break out of it on October 3 (but without noticeable success).
Will the bullish trend described by the rising channel (shown in blue) continue?
Signs of technical analysis provide grounds for doubt:
→ extremes A and B are similar to the double-top pattern. Moreover, the fact that the second peak is higher than the first can be interpreted as a bull trap;
→ the formation of divergence on indicators – as an indication of weakening demand for the dollar;
→ bearish activity may intensify as the listed signs are formed near the upper border of the red channel.
Thus, the likelihood of a decline to the lower border of the blue channel increases, and in the longer term, attempts at its bearish breakout.
To benefit from trends in the foreign exchange markets, consider enlisting the services of a trusted broker like FXOpen.
CFDs are complex instruments and come with a high risk of losing your money.
This article represents the opinion of the Companies operating under the FXOpen brand only. It is not to be construed as an offer, solicitation, or recommendation with respect to products and services provided by the Companies operating under the FXOpen brand, nor is it to be considered financial advice.
👍1
#marketanalysis #USDJPY #tradingforex
USD/JPY Analysis: Psychological Level Changes the Price Sharply
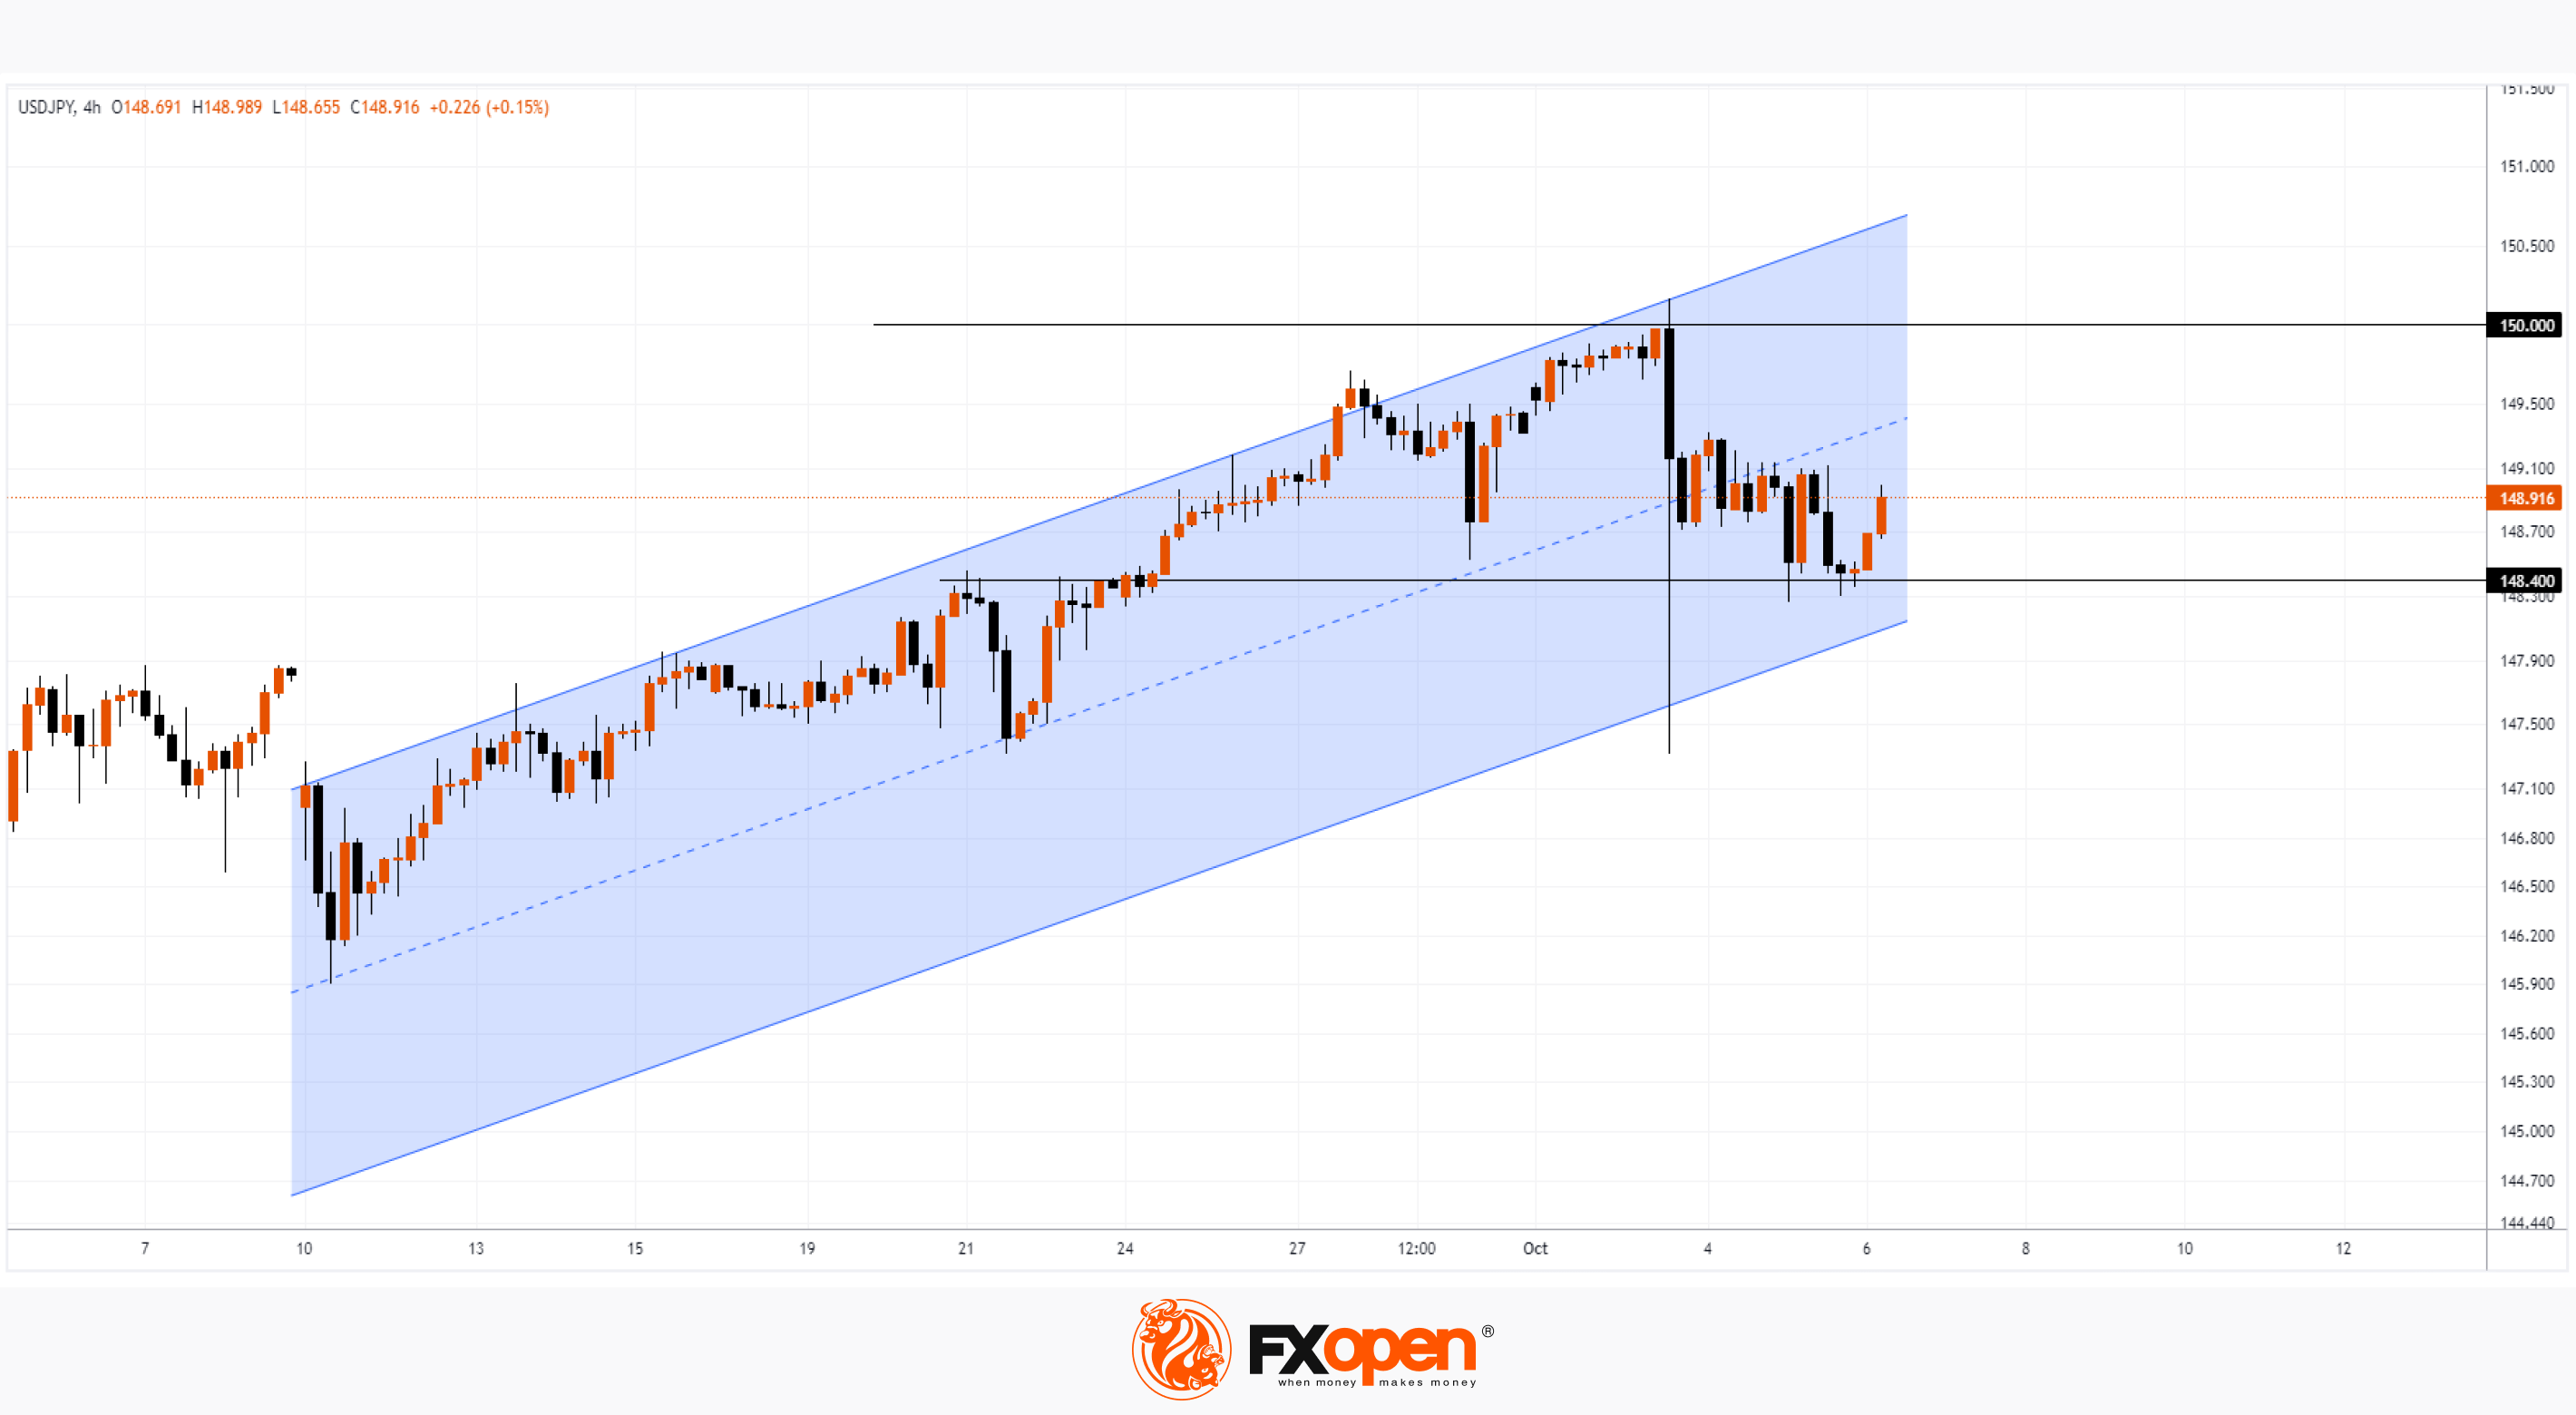
On Tuesday, the US dollar rose above the psychological level of 150 for the first time since October 2022 before falling sharply to a low of 147.30 as the yen rose.
The media are discussing whether this movement confirms the fact of intervention on the part of the Japanese authorities.
On the one hand, there are opinions that the yen's movement on Tuesday was much smaller (about 1.7%) than when the authorities intervened last year (the change was about 4%) to support the yen.
On the other hand, there are no clear explanations about the reasons for the sharp movement — except as a manifestation of the authorities’ interest in preventing excessive weakening of the national currency. Perhaps only about the influence of psychology when reaching and short-term exceeding the round figure — an effect that, by the way, is characteristic of the cryptocurrency market.
What are the possible scenarios for further development in the USD/JPY market?
Bullish arguments:
→ The price is within the uptrend (shown by the blue channel). Tuesday's move expanded it on a parallel channel basis. A sharp rebound from the lower boundary indicates the strength of demand.
→ After a sharp impulse, the price found support at the former resistance level of 148.4.
Bearish arguments:
→ When approaching the level of 150 yen per US dollar, psychological factors may again come into play. The memory of Tuesday's sharp momentum, reinforced by the broader momentum of last year, will keep market participants from expecting prices to rise above the round level.
→ It is acceptable to assume that the median line of the channel will now pose an obstacle if the price rises to it.
To benefit from trends in the foreign exchange markets, consider enlisting the services of a trusted broker like FXOpen.
CFDs are complex instruments and come with a high risk of losing your money.
This article represents the opinion of the Companies operating under the FXOpen brand only. It is not to be construed as an offer, solicitation, or recommendation with respect to products and services provided by the Companies operating under the FXOpen brand, nor is it to be considered financial advice.
USD/JPY Analysis: Psychological Level Changes the Price Sharply
On Tuesday, the US dollar rose above the psychological level of 150 for the first time since October 2022 before falling sharply to a low of 147.30 as the yen rose.
The media are discussing whether this movement confirms the fact of intervention on the part of the Japanese authorities.
On the one hand, there are opinions that the yen's movement on Tuesday was much smaller (about 1.7%) than when the authorities intervened last year (the change was about 4%) to support the yen.
On the other hand, there are no clear explanations about the reasons for the sharp movement — except as a manifestation of the authorities’ interest in preventing excessive weakening of the national currency. Perhaps only about the influence of psychology when reaching and short-term exceeding the round figure — an effect that, by the way, is characteristic of the cryptocurrency market.
What are the possible scenarios for further development in the USD/JPY market?
Bullish arguments:
→ The price is within the uptrend (shown by the blue channel). Tuesday's move expanded it on a parallel channel basis. A sharp rebound from the lower boundary indicates the strength of demand.
→ After a sharp impulse, the price found support at the former resistance level of 148.4.
Bearish arguments:
→ When approaching the level of 150 yen per US dollar, psychological factors may again come into play. The memory of Tuesday's sharp momentum, reinforced by the broader momentum of last year, will keep market participants from expecting prices to rise above the round level.
→ It is acceptable to assume that the median line of the channel will now pose an obstacle if the price rises to it.
To benefit from trends in the foreign exchange markets, consider enlisting the services of a trusted broker like FXOpen.
CFDs are complex instruments and come with a high risk of losing your money.
This article represents the opinion of the Companies operating under the FXOpen brand only. It is not to be construed as an offer, solicitation, or recommendation with respect to products and services provided by the Companies operating under the FXOpen brand, nor is it to be considered financial advice.
👍1
#stockmarket #stocktrading #NFLX
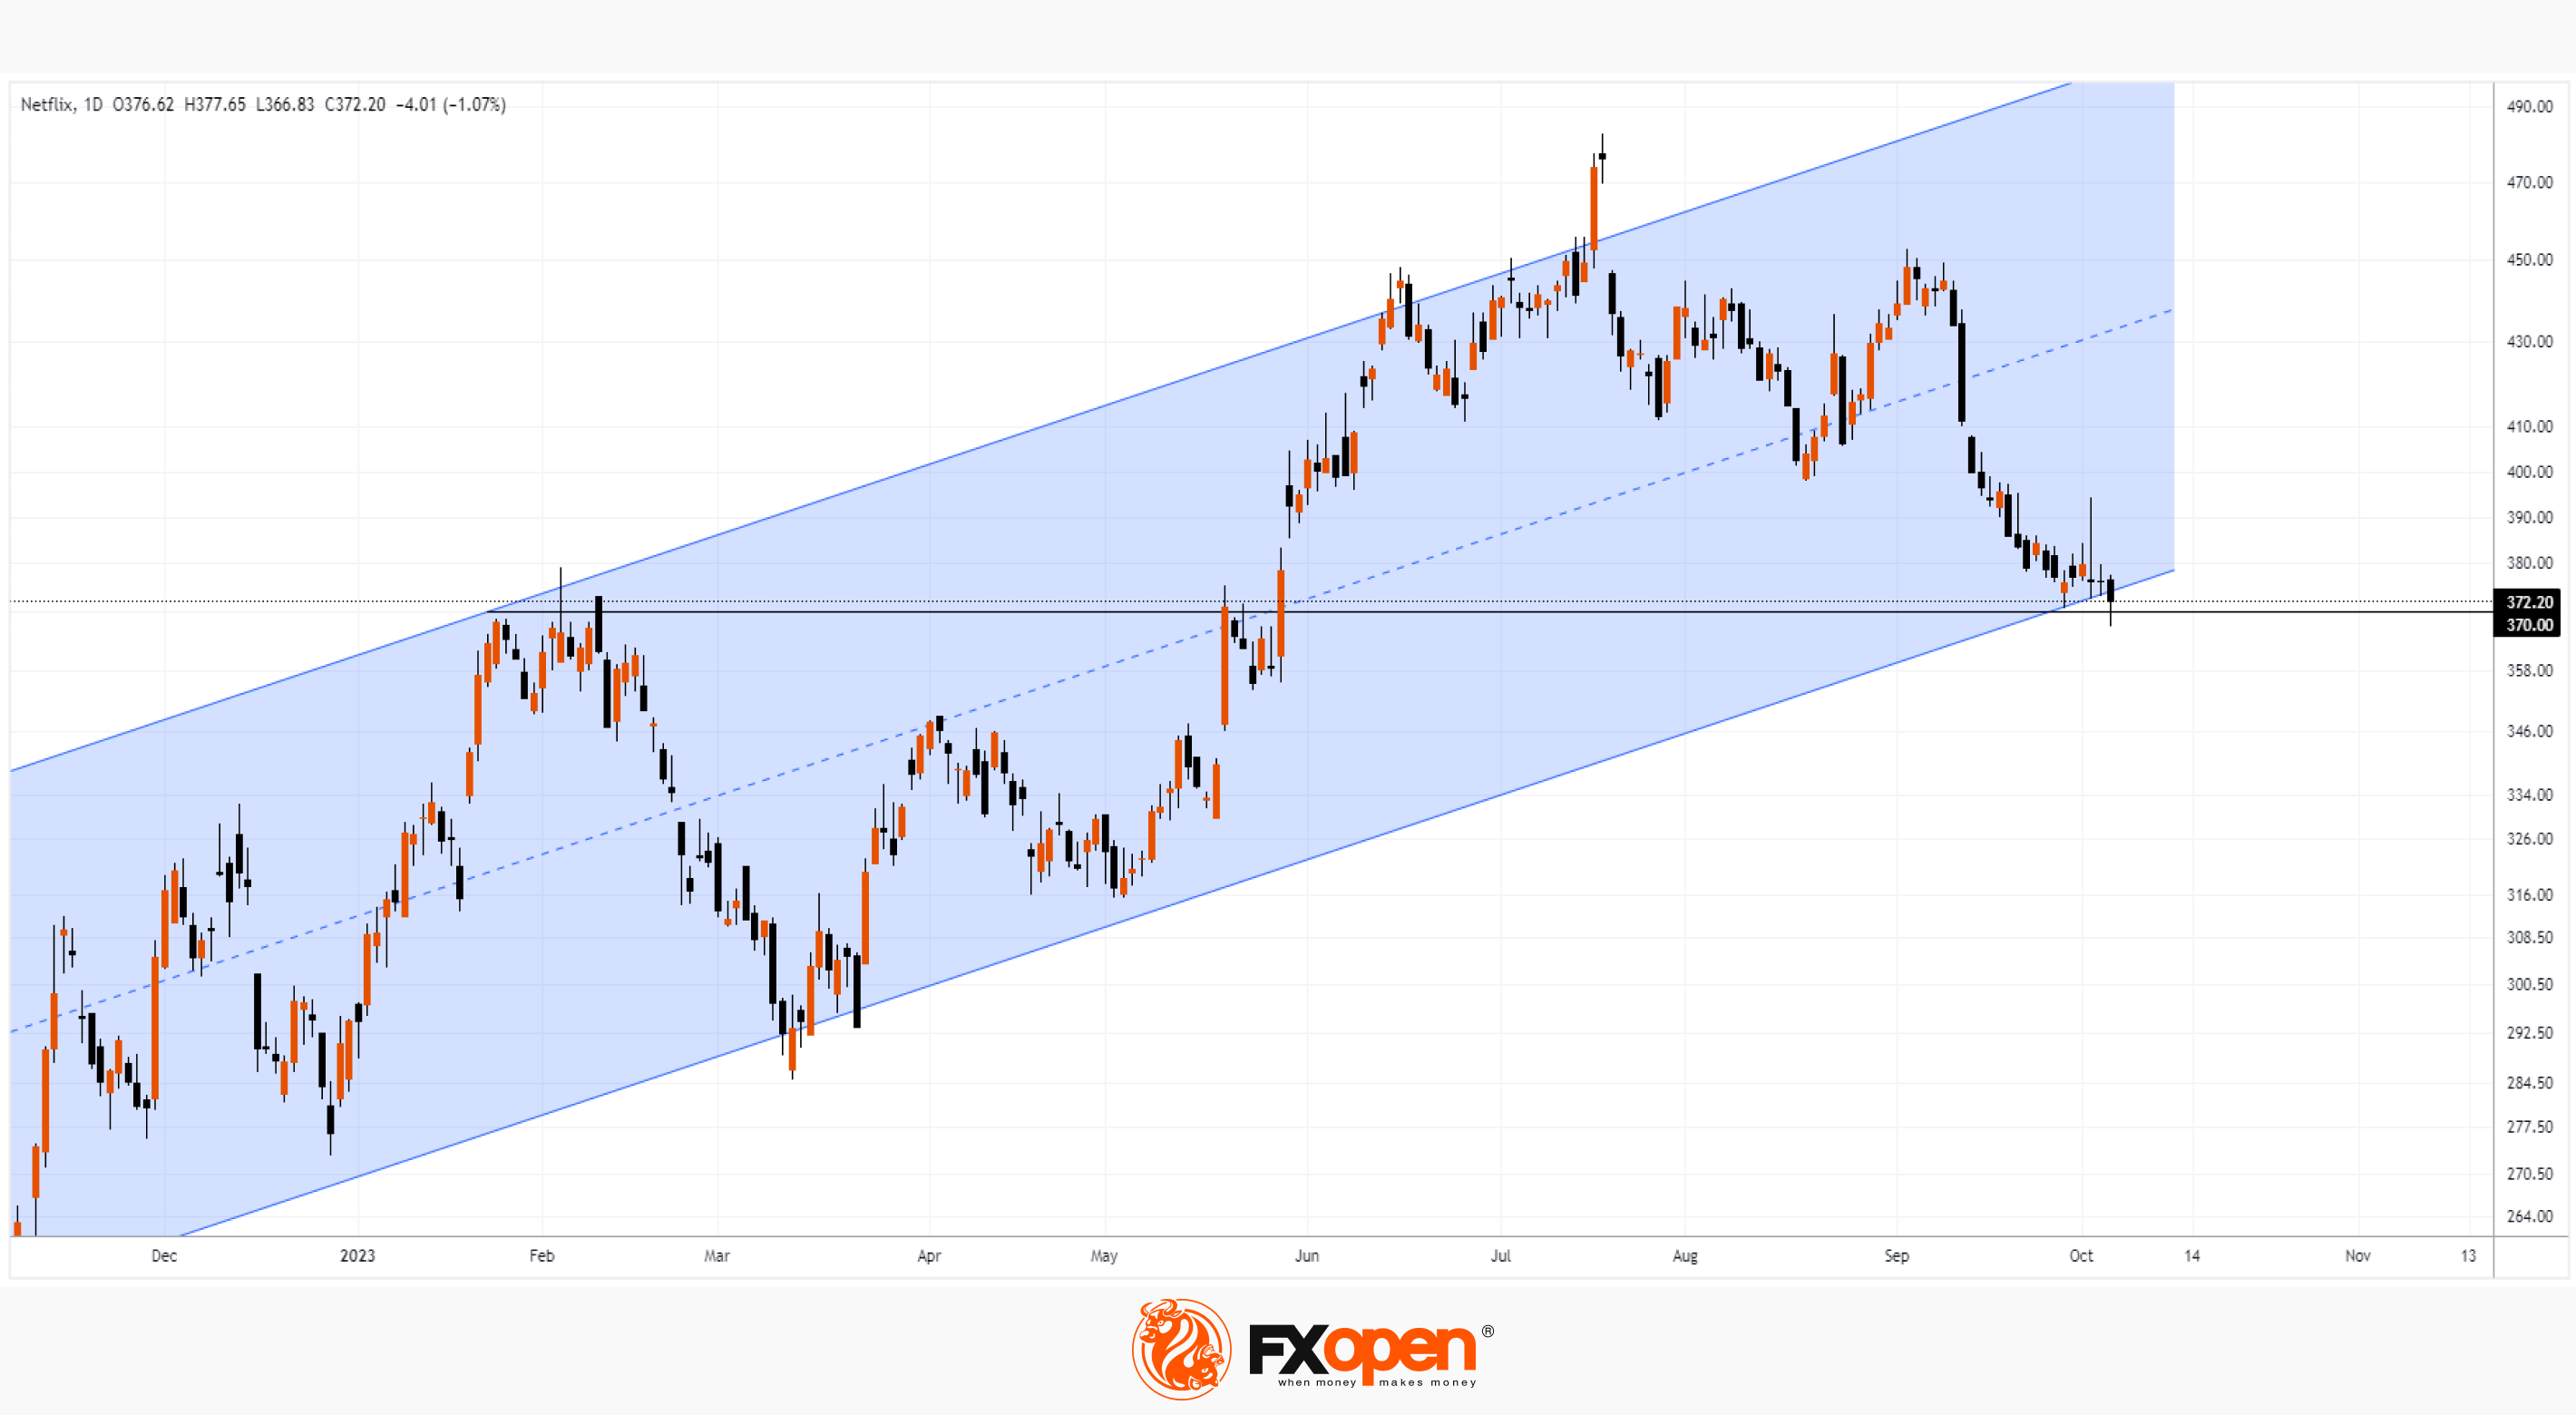
NFLX Analysis: Changes in Management, Price at Minimum
Yesterday, the NFLX share price dropped below USD 370, the lowest since late May of this year, and about -22% from the July peak.
Note that on July 6, we wrote that the NFLX stock price could meet resistance at USD 450 per share, and the signals from the chart gave bearish warnings. Just since July, the stock price began to perform worse than the broad S&P 500 market index.
Perhaps the company knows better about the reasons for the emerging negative dynamics and is making changes in management. This week it became known about the appointment of Amy Reinhard to the post of president of the company's advertising business. New product directors and technical directors were also appointed.
Will new executives help the stock return to its upward trajectory?
Bearish arguments:
→ a long upper shadow on the October 3 candle may indicate the strength of sellers in the stock market;
→ Thursday’s bearish candle may become an element of a breakout of the long-term channel (shown in blue);
→ pressure on the price of NFLX shares may be exerted by a negative trend in the stock market due to the tough policy of the Federal Reserve.
Bullish arguments:
→ a breakdown of the lower border of the ascending channel may turn out to be false;
→ support may come from the level of USD 370, which previously had an impact on the price.
The approaching earnings season may have a strong impact on the price. Already on October 18, we will learn the results of NFLX for the past quarter.
To benefit from trends in the popular stock markets, consider enlisting the services of a trusted broker like FXOpen.
CFDs are complex instruments and come with a high risk of losing your money.
This article represents the opinion of the Companies operating under the FXOpen brand only. It is not to be construed as an offer, solicitation, or recommendation with respect to products and services provided by the Companies operating under the FXOpen brand, nor is it to be considered financial advice.
NFLX Analysis: Changes in Management, Price at Minimum
Yesterday, the NFLX share price dropped below USD 370, the lowest since late May of this year, and about -22% from the July peak.
Note that on July 6, we wrote that the NFLX stock price could meet resistance at USD 450 per share, and the signals from the chart gave bearish warnings. Just since July, the stock price began to perform worse than the broad S&P 500 market index.
Perhaps the company knows better about the reasons for the emerging negative dynamics and is making changes in management. This week it became known about the appointment of Amy Reinhard to the post of president of the company's advertising business. New product directors and technical directors were also appointed.
Will new executives help the stock return to its upward trajectory?
Bearish arguments:
→ a long upper shadow on the October 3 candle may indicate the strength of sellers in the stock market;
→ Thursday’s bearish candle may become an element of a breakout of the long-term channel (shown in blue);
→ pressure on the price of NFLX shares may be exerted by a negative trend in the stock market due to the tough policy of the Federal Reserve.
Bullish arguments:
→ a breakdown of the lower border of the ascending channel may turn out to be false;
→ support may come from the level of USD 370, which previously had an impact on the price.
The approaching earnings season may have a strong impact on the price. Already on October 18, we will learn the results of NFLX for the past quarter.
To benefit from trends in the popular stock markets, consider enlisting the services of a trusted broker like FXOpen.
CFDs are complex instruments and come with a high risk of losing your money.
This article represents the opinion of the Companies operating under the FXOpen brand only. It is not to be construed as an offer, solicitation, or recommendation with respect to products and services provided by the Companies operating under the FXOpen brand, nor is it to be considered financial advice.
#marketanalysis #oilprices #Israel
Market Analysis: Israel Under Attack, Oil Prices Rise Sharply
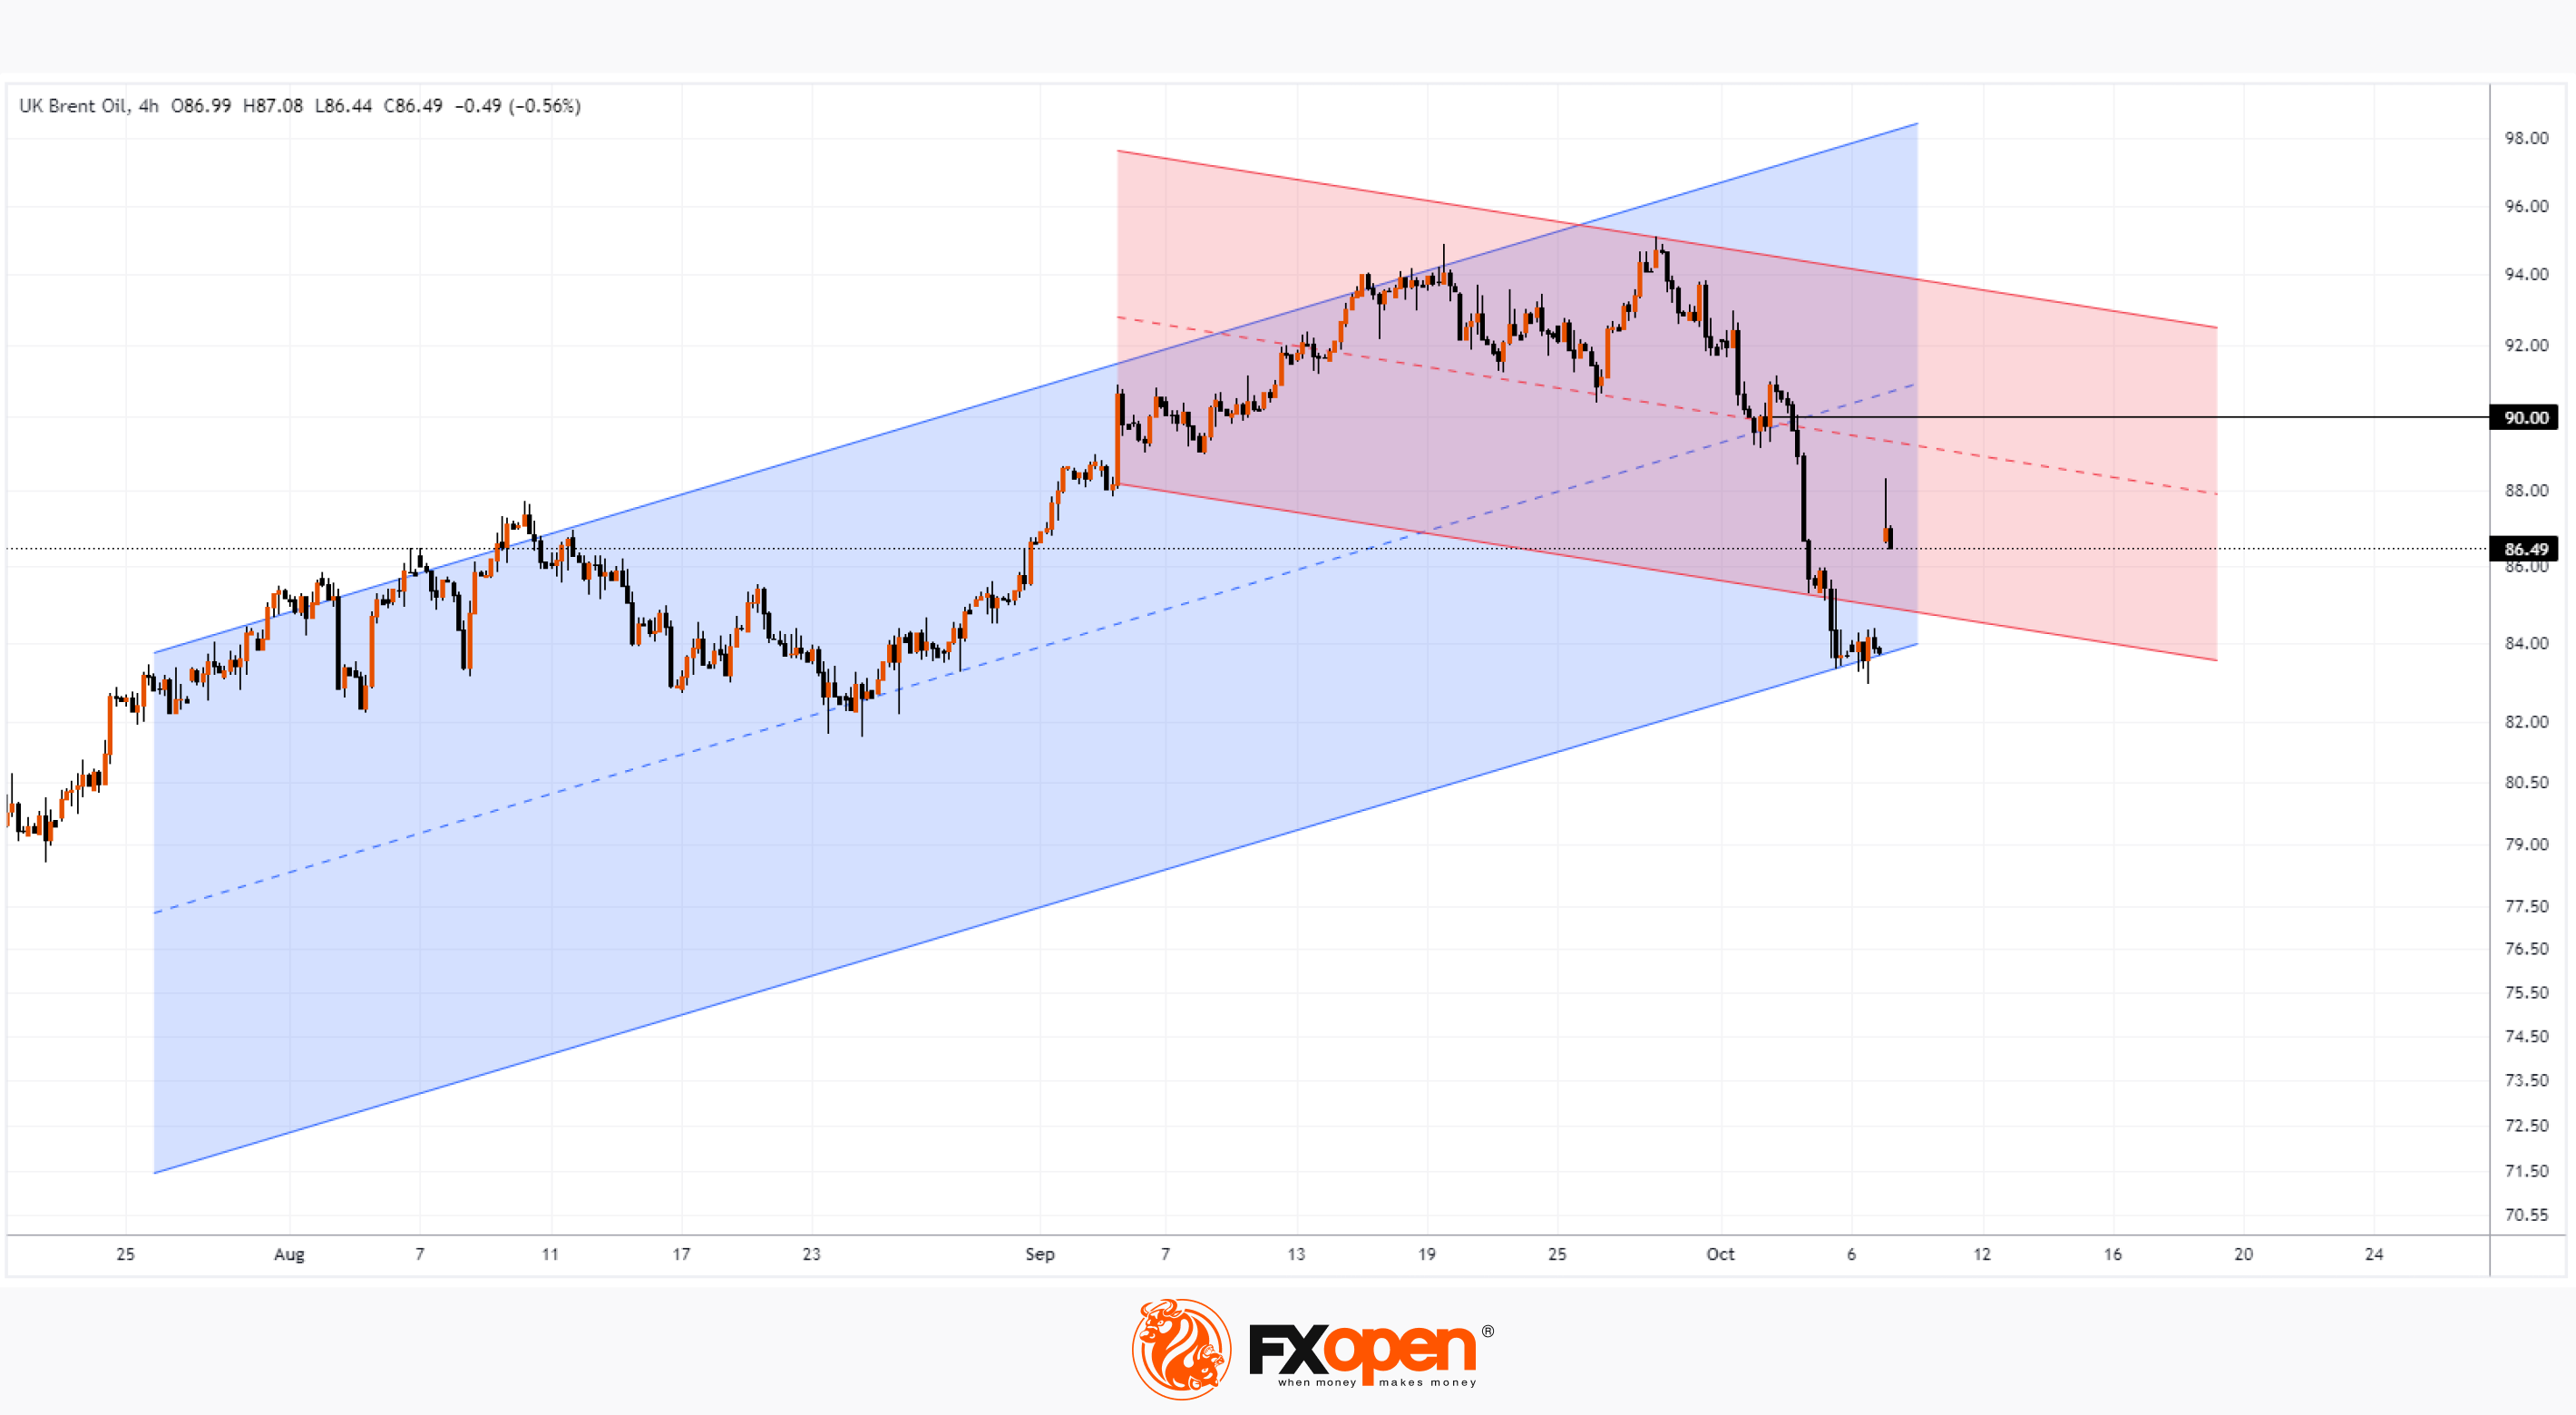
On Friday, trading in WTI oil futures on the NYMEX closed at USD 82.81 per barrel. And on Monday morning, they opened at a price of USD 85.25 and began to quickly rise in price, reaching 87.24. Natural gas prices have also risen sharply.
The reason is Saturday's attack on Israel. And, of course, associations arise with the oil crisis of 1973, when Arab oil-producing countries refused to supply raw materials to the United States and other allies that supported Israel. Then the price of a barrel rose from USD 3 to 12 in six months.
Is such a 4-fold increase possible after 50 years? The rise in oil prices seems to hint at this possibility. Nothing can be ruled out. Although the US created a strategic reserve as a result of the oil crisis, it was greatly depleted due to the fight against inflation.
Technical analysis of the WTI oil price market shows that:
→ the price pushed off the lower border of the blue ascending channel, finding support around USD 84;
→ the price may fall to the lower border of the downward red channel to close the gap;
→ resistance to growth can be provided by both the median line of the red descending channel and the psychological level of USD 90.
However, the main price driver should be expected to be news related to Israel and the position of Arab oil producers.
To benefit from trends in energy markets, consider enlisting the services of a trusted broker like FXOpen.
CFDs are complex instruments and come with a high risk of losing your money.
This article represents the opinion of the Companies operating under the FXOpen brand only. It is not to be construed as an offer, solicitation, or recommendation with respect to products and services provided by the Companies operating under the FXOpen brand, nor is it to be considered financial advice.
Market Analysis: Israel Under Attack, Oil Prices Rise Sharply
On Friday, trading in WTI oil futures on the NYMEX closed at USD 82.81 per barrel. And on Monday morning, they opened at a price of USD 85.25 and began to quickly rise in price, reaching 87.24. Natural gas prices have also risen sharply.
The reason is Saturday's attack on Israel. And, of course, associations arise with the oil crisis of 1973, when Arab oil-producing countries refused to supply raw materials to the United States and other allies that supported Israel. Then the price of a barrel rose from USD 3 to 12 in six months.
Is such a 4-fold increase possible after 50 years? The rise in oil prices seems to hint at this possibility. Nothing can be ruled out. Although the US created a strategic reserve as a result of the oil crisis, it was greatly depleted due to the fight against inflation.
Technical analysis of the WTI oil price market shows that:
→ the price pushed off the lower border of the blue ascending channel, finding support around USD 84;
→ the price may fall to the lower border of the downward red channel to close the gap;
→ resistance to growth can be provided by both the median line of the red descending channel and the psychological level of USD 90.
However, the main price driver should be expected to be news related to Israel and the position of Arab oil producers.
To benefit from trends in energy markets, consider enlisting the services of a trusted broker like FXOpen.
CFDs are complex instruments and come with a high risk of losing your money.
This article represents the opinion of the Companies operating under the FXOpen brand only. It is not to be construed as an offer, solicitation, or recommendation with respect to products and services provided by the Companies operating under the FXOpen brand, nor is it to be considered financial advice.
#marketanalysis #gasprice
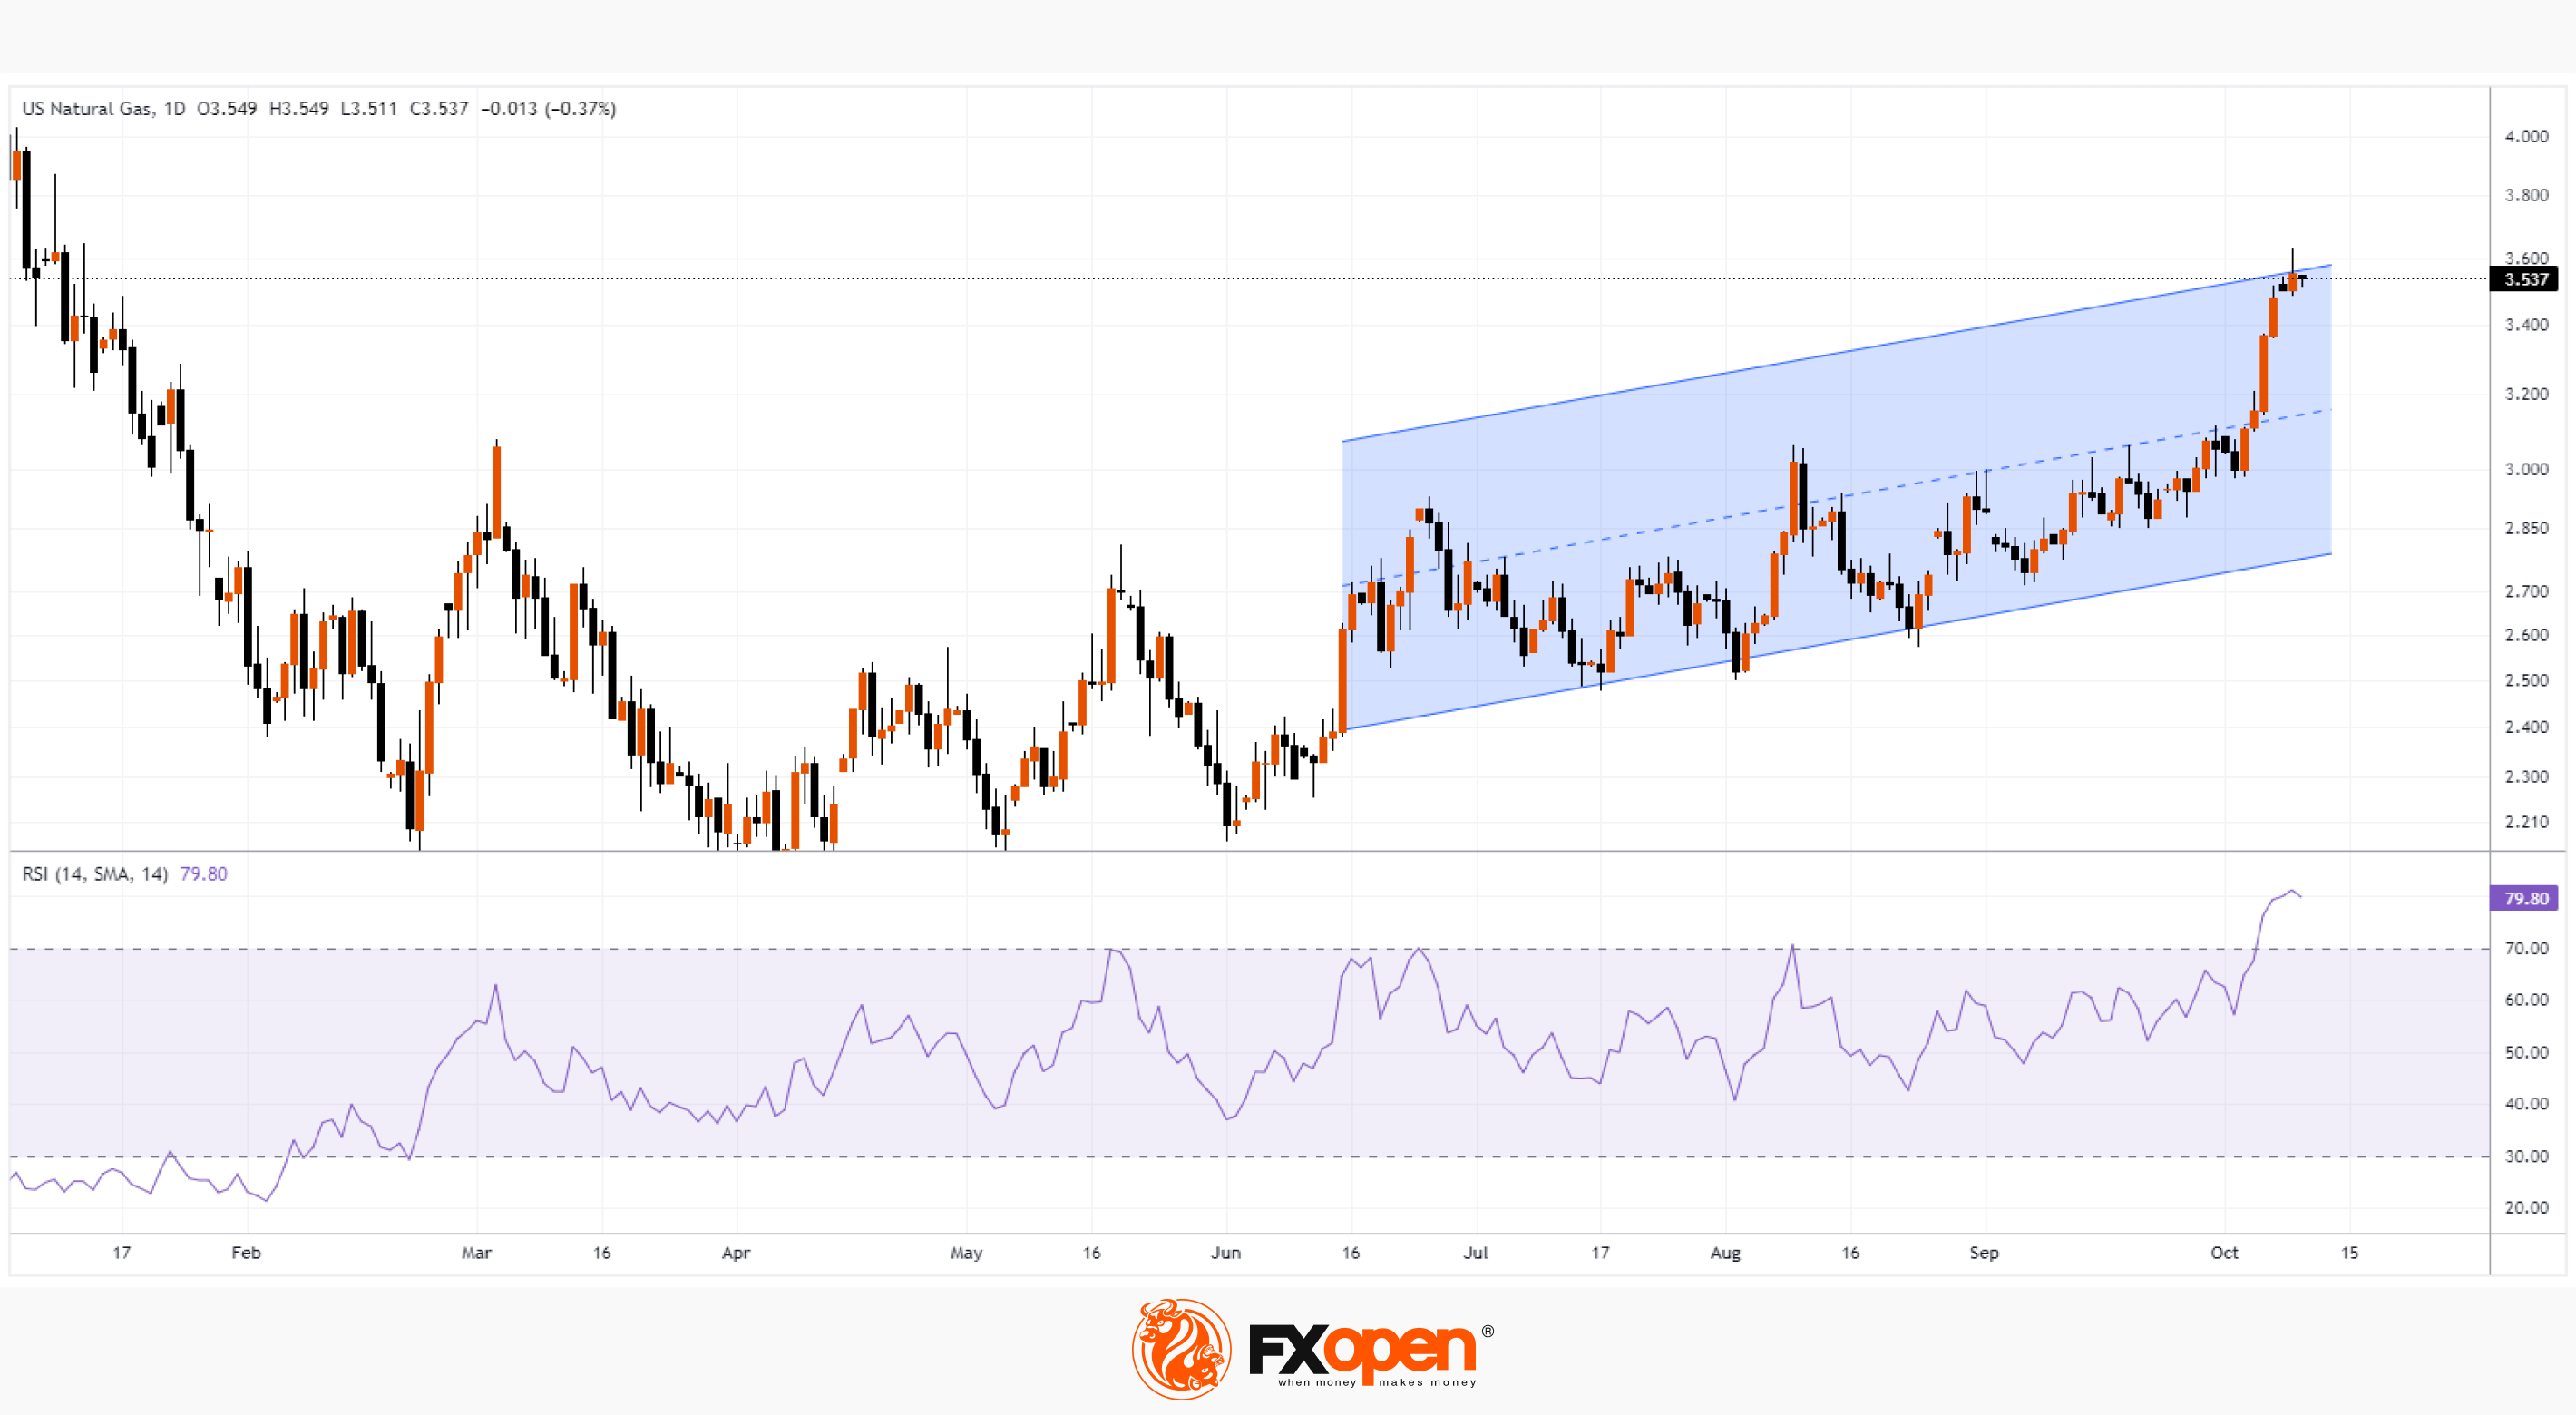
Market Analysis: Natural Gas Price Reaches 8-month High
As the chart shows, yesterday, the price of gas rose above USD 3.60 for the first time since January of this year.
It can be assumed that events in Israel contributed to the price increase, since the Middle East is an important supplier of gas.
However, note that the bullish momentum started much earlier — gas prices have risen approximately 20% since the October 3 low. This confirms our assumptions about the bullish trend, which we published in the review on August 25th.
Perhaps the price of gas is influenced by seasonal factors and fears that weather conditions in the coming winter will be difficult.
Should we count on the continuation of the bullish trend?
If forecasters’ predictions worsen and the conflict in the Middle East flares up, this will certainly increase the likelihood of further price increases.
But in the short term, there are prerequisites for the formation of a rollback, since:
→ RSI indicates severe overbought;
→ the price has reached the upper limit of the parallel channel;
→ the tapering candles of the last days and the beginning of Tuesday demonstrate the presence of sellers — it is permissible to assume that buyers are taking profits.
Please note that on Thursday at 17:30 GMT+3, gas reserves data will be published — this may affect the current balance of supply and demand.
To benefit from the rise and fall of gas prices, consider enlisting the services of a trusted broker like FXOpen.
CFDs are complex instruments and come with a high risk of losing your money.
This article represents the opinion of the Companies operating under the FXOpen brand only. It is not to be construed as an offer, solicitation, or recommendation with respect to products and services provided by the Companies operating under the FXOpen brand, nor is it to be considered financial advice.
Market Analysis: Natural Gas Price Reaches 8-month High
As the chart shows, yesterday, the price of gas rose above USD 3.60 for the first time since January of this year.
It can be assumed that events in Israel contributed to the price increase, since the Middle East is an important supplier of gas.
However, note that the bullish momentum started much earlier — gas prices have risen approximately 20% since the October 3 low. This confirms our assumptions about the bullish trend, which we published in the review on August 25th.
Perhaps the price of gas is influenced by seasonal factors and fears that weather conditions in the coming winter will be difficult.
Should we count on the continuation of the bullish trend?
If forecasters’ predictions worsen and the conflict in the Middle East flares up, this will certainly increase the likelihood of further price increases.
But in the short term, there are prerequisites for the formation of a rollback, since:
→ RSI indicates severe overbought;
→ the price has reached the upper limit of the parallel channel;
→ the tapering candles of the last days and the beginning of Tuesday demonstrate the presence of sellers — it is permissible to assume that buyers are taking profits.
Please note that on Thursday at 17:30 GMT+3, gas reserves data will be published — this may affect the current balance of supply and demand.
To benefit from the rise and fall of gas prices, consider enlisting the services of a trusted broker like FXOpen.
CFDs are complex instruments and come with a high risk of losing your money.
This article represents the opinion of the Companies operating under the FXOpen brand only. It is not to be construed as an offer, solicitation, or recommendation with respect to products and services provided by the Companies operating under the FXOpen brand, nor is it to be considered financial advice.
#marketanalysis #bitcoin #BTCUSD
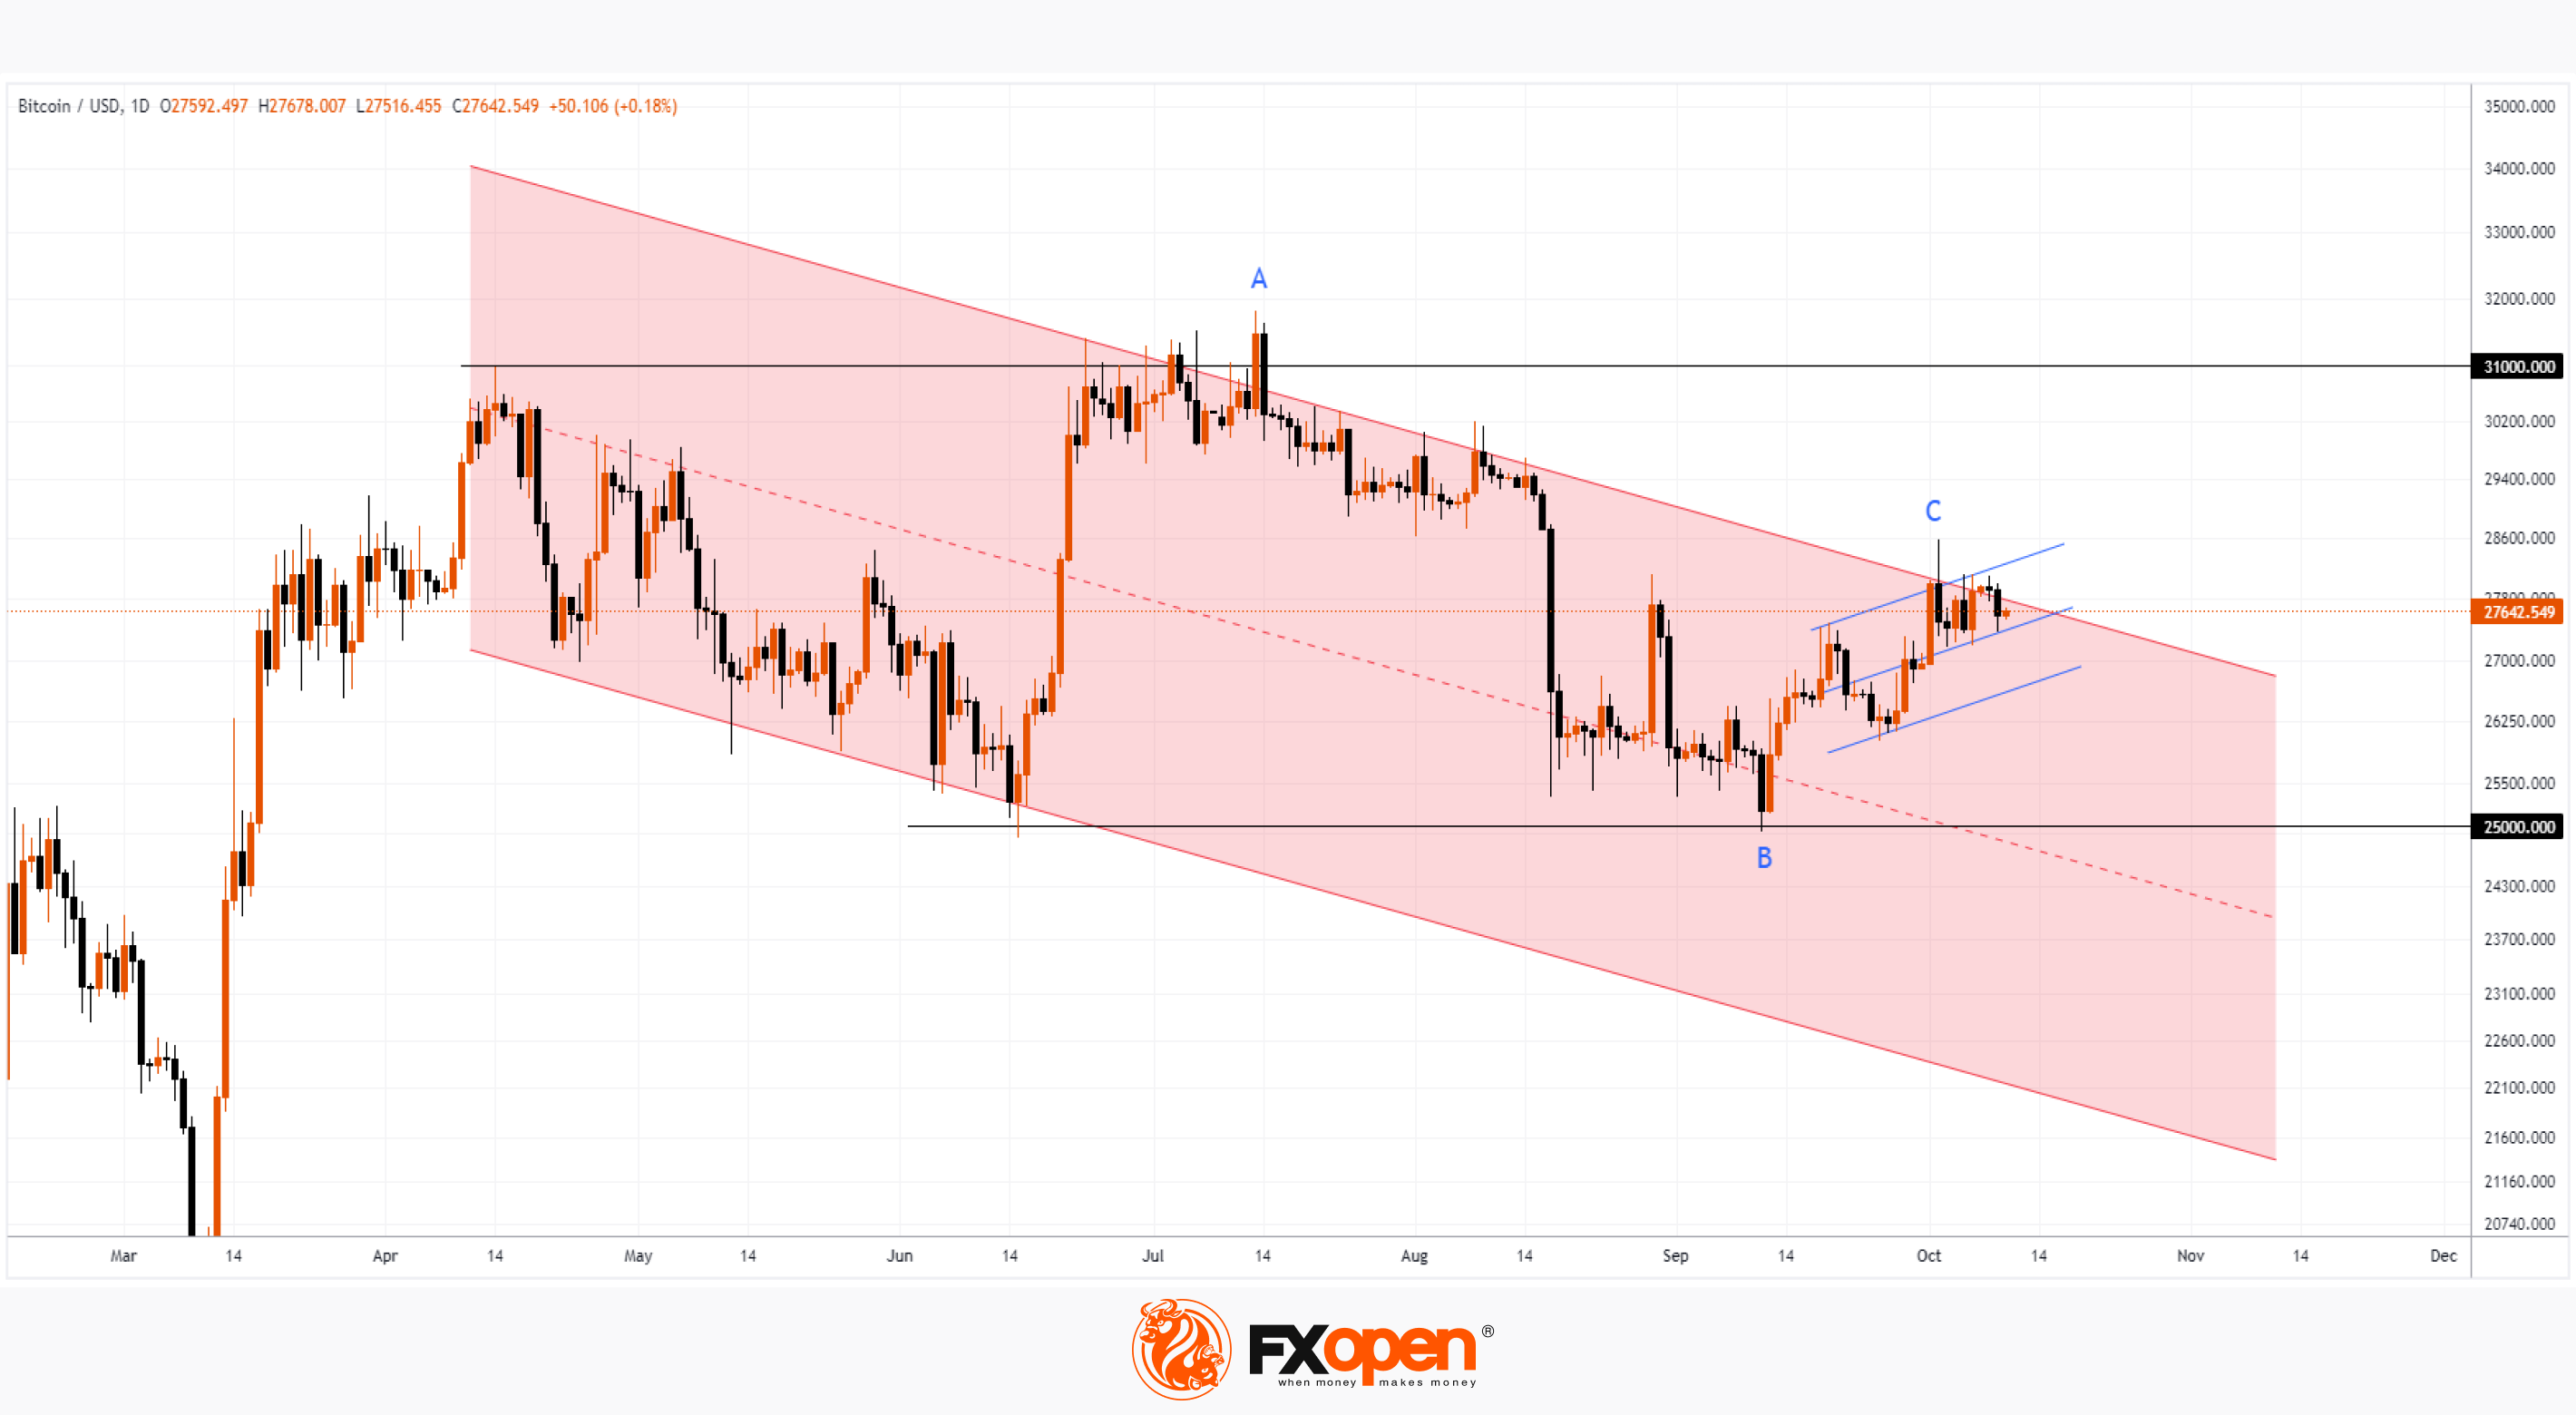
Market Analysis: Bitcoin Price Cannot Stay above $28k
The first day of October coincided with the first attempt of the bulls to overcome the resistance level of USD 28,000 per coin, but on the 2nd of October, the sellers showed their presence. Since that time, the price has repeatedly exceeded the level of 28k, but each time not for long, after which a decline followed.
Yesterday, there was another such decline. As the BTC/USD chart shows today, the rate is around 27,600. And it seems that the bulls may no longer have the strength to make a new attempt.
Analyzing the bitcoin market on September 8, we pointed out a list of bearish arguments that give reason to doubt the positive prospects for bitcoin. The described price action of about 28k is another bearish argument in this list.
Moreover:
→ the growth of B→C is approximately 50% Fibo of the decline of A→B;
→ the top of early October provides more support for building a downward channel (shown in red). It is possible that the price may now move from its upper border to its lower border.
In the short term, longs can expect the rising trendline structure (shown in blue lines) to help push the price above the psychological USD 30k level. But, let’s say, if this does not happen, then the market will again fall to the key support zone of USD 25-25.5k. Will it be able to support bullish momentum for the third time (as it did in September and June)?
99-year-old Charlie Munger gives the hint. At October's Zoomtopia conference, he again railed against investing in digital assets, saying it was the "stupidest investment” because “[m]ost of those investments are going to zero.”
To benefit from the rise and fall of cryptocurrency prices, consider enlisting the services of a trusted broker like FXOpen.
CFDs are complex instruments and come with a high risk of losing your money.
This article represents the opinion of the Companies operating under the FXOpen brand only. It is not to be construed as an offer, solicitation, or recommendation with respect to products and services provided by the Companies operating under the FXOpen brand, nor is it to be considered financial advice.
At FXOpen UK and FXOpen AU, Cryptocurrency CFDs are only available for trading by those clients categorised as Professional clients under FCA Rules and Professional clients under ASIC Rules, respectively. They are not available for trading by Retail clients.
Market Analysis: Bitcoin Price Cannot Stay above $28k
The first day of October coincided with the first attempt of the bulls to overcome the resistance level of USD 28,000 per coin, but on the 2nd of October, the sellers showed their presence. Since that time, the price has repeatedly exceeded the level of 28k, but each time not for long, after which a decline followed.
Yesterday, there was another such decline. As the BTC/USD chart shows today, the rate is around 27,600. And it seems that the bulls may no longer have the strength to make a new attempt.
Analyzing the bitcoin market on September 8, we pointed out a list of bearish arguments that give reason to doubt the positive prospects for bitcoin. The described price action of about 28k is another bearish argument in this list.
Moreover:
→ the growth of B→C is approximately 50% Fibo of the decline of A→B;
→ the top of early October provides more support for building a downward channel (shown in red). It is possible that the price may now move from its upper border to its lower border.
In the short term, longs can expect the rising trendline structure (shown in blue lines) to help push the price above the psychological USD 30k level. But, let’s say, if this does not happen, then the market will again fall to the key support zone of USD 25-25.5k. Will it be able to support bullish momentum for the third time (as it did in September and June)?
99-year-old Charlie Munger gives the hint. At October's Zoomtopia conference, he again railed against investing in digital assets, saying it was the "stupidest investment” because “[m]ost of those investments are going to zero.”
To benefit from the rise and fall of cryptocurrency prices, consider enlisting the services of a trusted broker like FXOpen.
CFDs are complex instruments and come with a high risk of losing your money.
This article represents the opinion of the Companies operating under the FXOpen brand only. It is not to be construed as an offer, solicitation, or recommendation with respect to products and services provided by the Companies operating under the FXOpen brand, nor is it to be considered financial advice.
At FXOpen UK and FXOpen AU, Cryptocurrency CFDs are only available for trading by those clients categorised as Professional clients under FCA Rules and Professional clients under ASIC Rules, respectively. They are not available for trading by Retail clients.
#marketanalysis #forex #forextrading
NZD/USD Analysis: The Rate Reaches a 2-month High
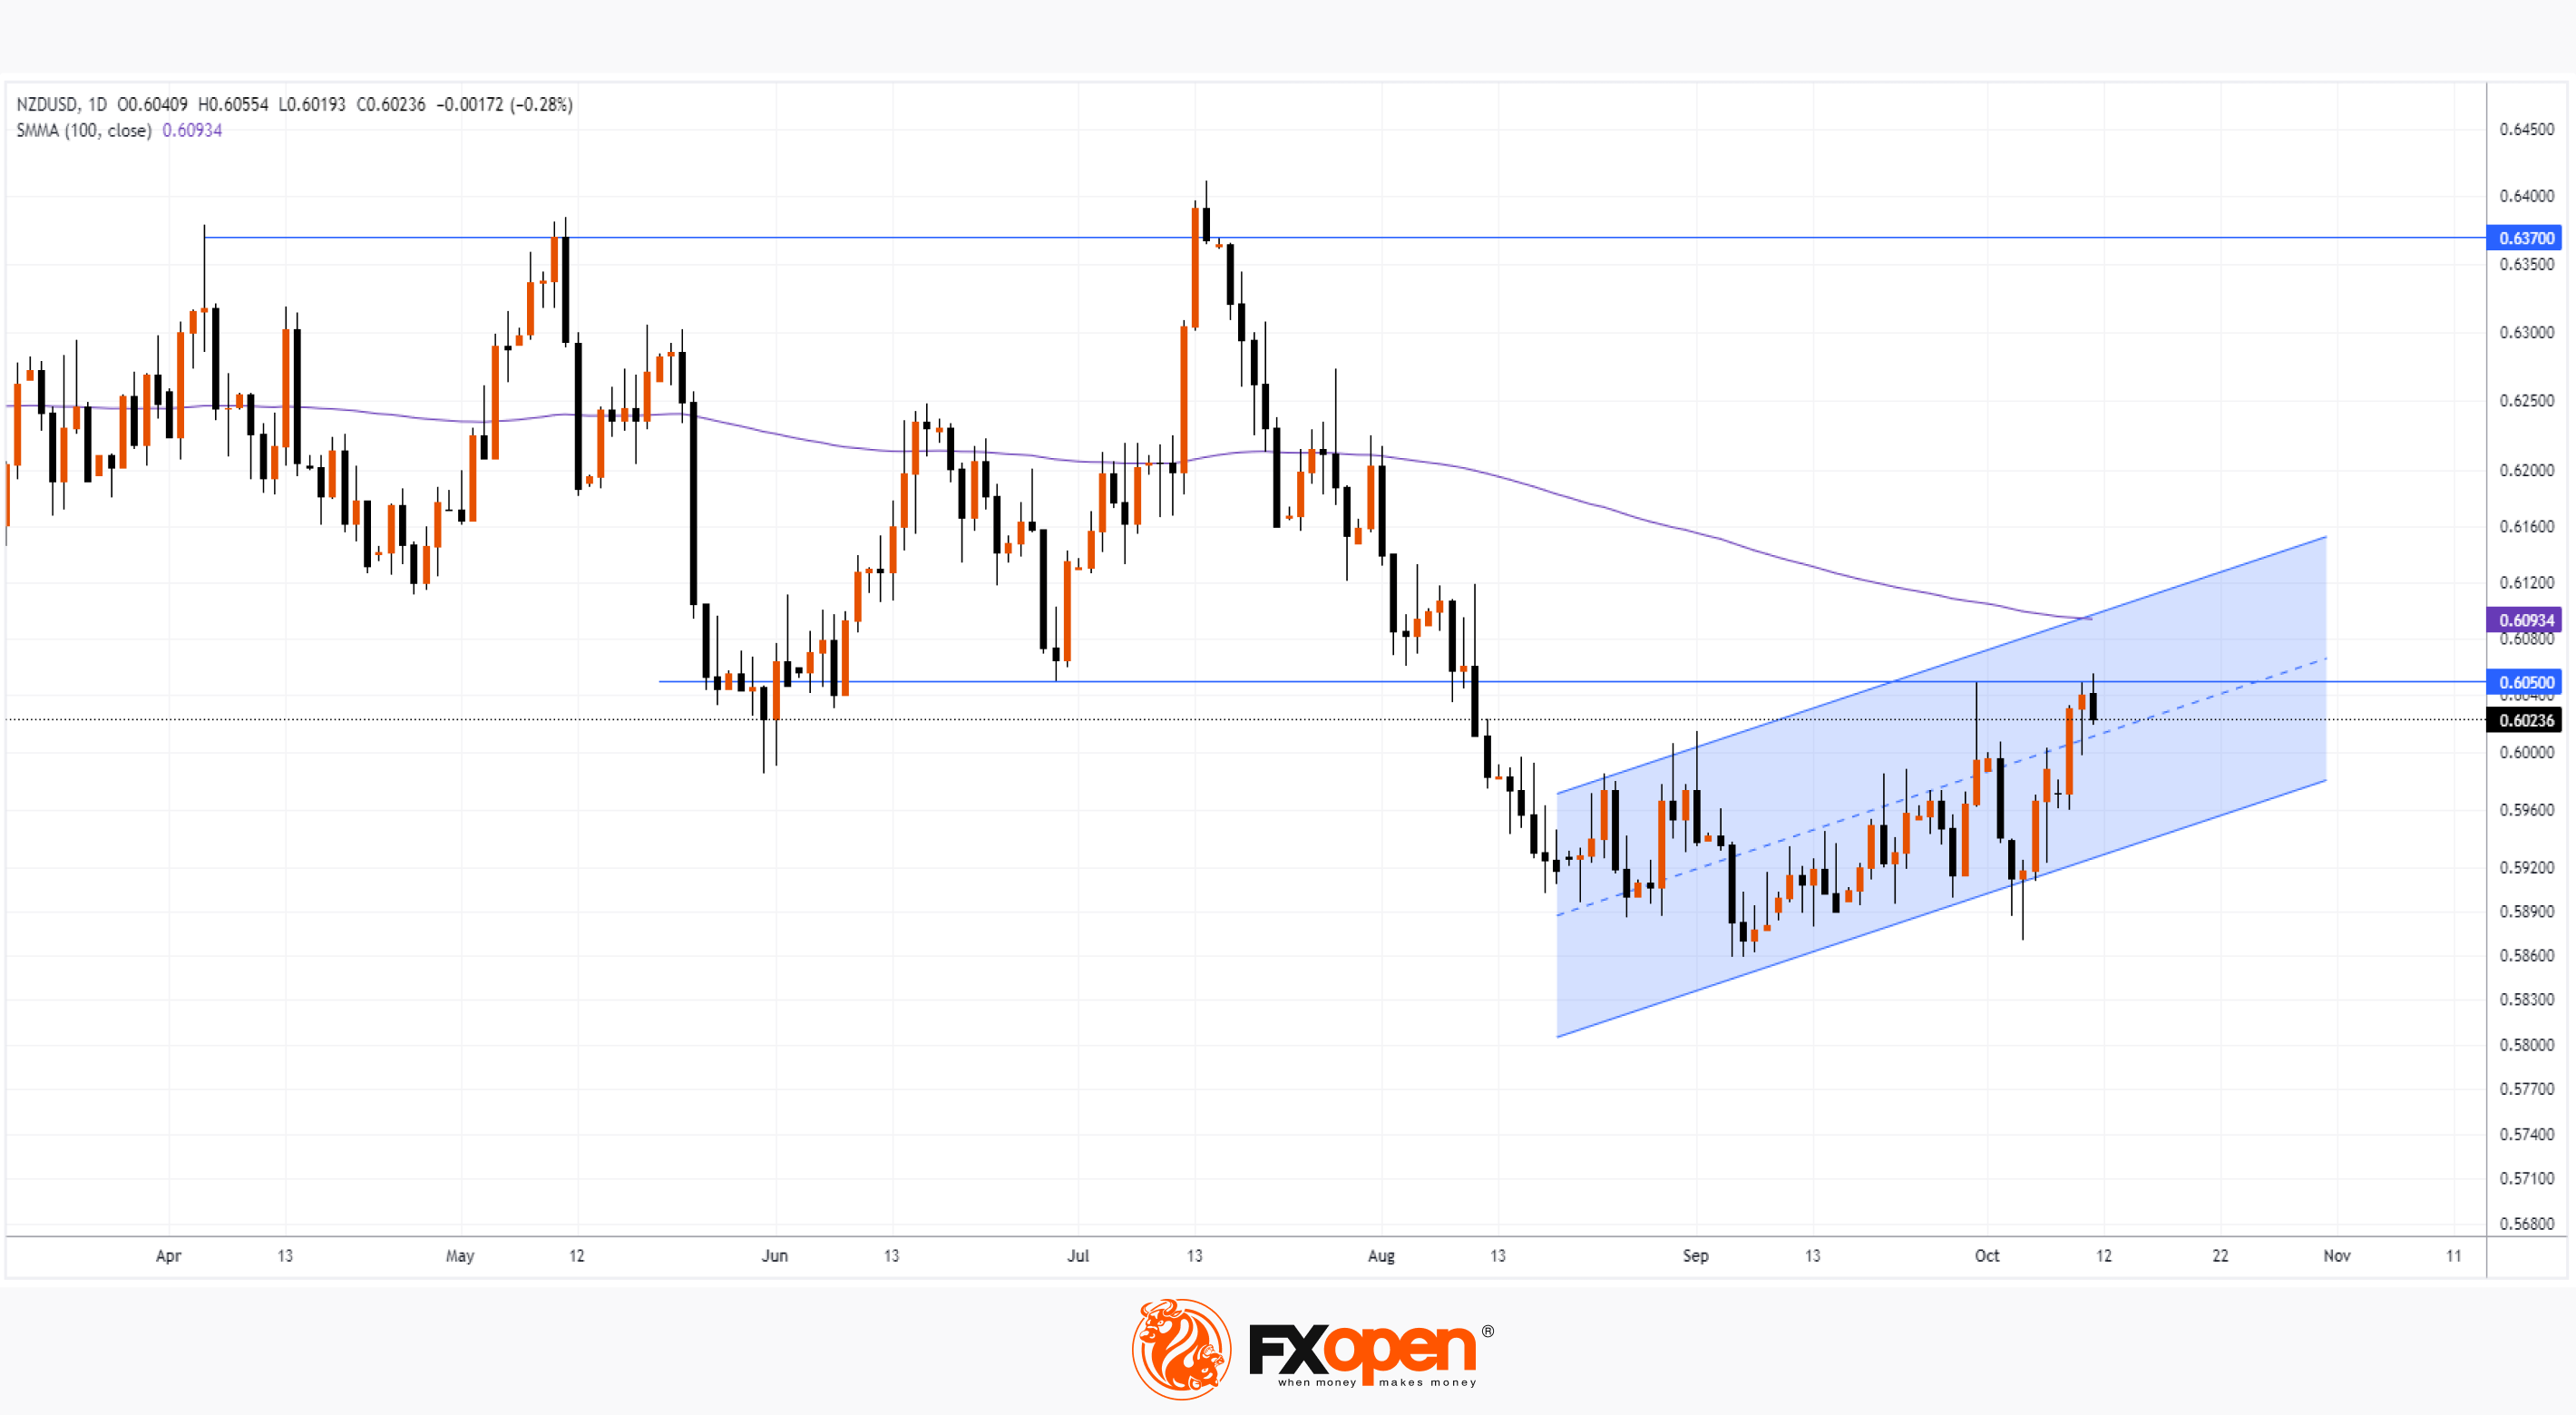
This morning, as the NZD/USD chart shows, one USD was worth 0.605 New Zealand dollar, for the first time since August 10.
The strengthening of NZD was facilitated by:
→ rumours that China is planning a major stimulus package to boost the economy amid the real estate crisis. And the Australian and New Zealand dollars, as one can see, are showing growth against the backdrop of positive news from China;
→ the weakness of the US dollar due to the fact that Fed members make it clear in their statements that it is no longer worth raising rates further.
Will the NZD/USD pair continue its upward trend?
The chart points to important bearish arguments:
→ the level of 0.605 previously served as long-term support. This can be seen from the price action in the spring-summer of this year. After the bearish breakout in the first half of August, this level has already shown its role as resistance, as seen in the September 29th candle;
→ exceeding the 0.605 level today, as well as the high on September 29, could be a trap for the bulls. A similar phenomenon can be seen on July 13-14, when the price exceeded previous local highs for only a short time. And, note, the current excess of the 0.605 level may also be very fleeting;
→ SMA (100) slopes down, indicating that bearish sentiment prevails over the long term.
News from the United States can have an important impact on the current situation. Statements by FOMC members are scheduled for today at 21:00 GMT+3 — be careful, spikes in volatility are likely.
To benefit from trends in the foreign exchange market, consider enlisting the services of a trusted broker like FXOpen.
CFDs are complex instruments and come with a high risk of losing your money.
This article represents the opinion of the Companies operating under the FXOpen brand only. It is not to be construed as an offer, solicitation, or recommendation with respect to products and services provided by the Companies operating under the FXOpen brand, nor is it to be considered financial advice.
NZD/USD Analysis: The Rate Reaches a 2-month High
This morning, as the NZD/USD chart shows, one USD was worth 0.605 New Zealand dollar, for the first time since August 10.
The strengthening of NZD was facilitated by:
→ rumours that China is planning a major stimulus package to boost the economy amid the real estate crisis. And the Australian and New Zealand dollars, as one can see, are showing growth against the backdrop of positive news from China;
→ the weakness of the US dollar due to the fact that Fed members make it clear in their statements that it is no longer worth raising rates further.
Will the NZD/USD pair continue its upward trend?
The chart points to important bearish arguments:
→ the level of 0.605 previously served as long-term support. This can be seen from the price action in the spring-summer of this year. After the bearish breakout in the first half of August, this level has already shown its role as resistance, as seen in the September 29th candle;
→ exceeding the 0.605 level today, as well as the high on September 29, could be a trap for the bulls. A similar phenomenon can be seen on July 13-14, when the price exceeded previous local highs for only a short time. And, note, the current excess of the 0.605 level may also be very fleeting;
→ SMA (100) slopes down, indicating that bearish sentiment prevails over the long term.
News from the United States can have an important impact on the current situation. Statements by FOMC members are scheduled for today at 21:00 GMT+3 — be careful, spikes in volatility are likely.
To benefit from trends in the foreign exchange market, consider enlisting the services of a trusted broker like FXOpen.
CFDs are complex instruments and come with a high risk of losing your money.
This article represents the opinion of the Companies operating under the FXOpen brand only. It is not to be construed as an offer, solicitation, or recommendation with respect to products and services provided by the Companies operating under the FXOpen brand, nor is it to be considered financial advice.
#marketanalysis #sp500 #stocks
Market Analysis: E-mini S&P 500 Positive Ahead of Earnings Season
As we wrote in our October 8 market analysis, the S&P 500 chart made bullish arguments, including:
→ the S&P 500 price has reached the lower boundary of the ascending channel (shown in blue);
→ RSI fell to its minimum in 12 months.
Technically, these factors were justified, because today, the S&P 500 has strengthened, the price is near the psychological level of 4,400. Yesterday’s news also contributed to this:
→ inflation suddenly accelerated. The Producer Price Index (PPI) was 0.5%, although 0.3% was expected. The acceleration of inflation was influenced by the September peak in the oil market. But with the price of oil already back more than 10% from its peak, traders are not expected to be too worried about the PPI rise;
→ a "majority" of Fed officials thought another rate hike would "likely be appropriate" to help cool demand and bring inflation closer to its 2% inflation target over the next two years, while "some" said “no". “Participants generally noted that it was important to balance the risk of overtightening against the risk of insufficient tightening,” the minutes said.
As a result, as of Thursday morning, the price of the S&P 500 is at a high of the week, which indicates that, according to the consolidated view, the Fed is in control of the fight against inflation in a market that is experiencing positivity ahead of the reporting season.
Corporate performance will weigh heavily on the S&P 500 price in the coming weeks, with bullish momentum forming a rebound from the lower boundary of the ascending channel likely to be hampered by:
→ psychological level 4400, in the area of which Fibo 50% of the decline in A→B occurs;
→ level 4,450 – as the arrows show, it has affected the price more than once since June 2022.
To benefit from the rise and fall of the S&P 500 price, consider enlisting the services of a trusted broker like FXOpen.
CFDs are complex instruments and come with a high risk of losing your money.
This article represents the opinion of the Companies operating under the FXOpen brand only. It is not to be construed as an offer, solicitation, or recommendation with respect to products and services provided by the Companies operating under the FXOpen brand, nor is it to be considered financial advice.
Market Analysis: E-mini S&P 500 Positive Ahead of Earnings Season
As we wrote in our October 8 market analysis, the S&P 500 chart made bullish arguments, including:
→ the S&P 500 price has reached the lower boundary of the ascending channel (shown in blue);
→ RSI fell to its minimum in 12 months.
Technically, these factors were justified, because today, the S&P 500 has strengthened, the price is near the psychological level of 4,400. Yesterday’s news also contributed to this:
→ inflation suddenly accelerated. The Producer Price Index (PPI) was 0.5%, although 0.3% was expected. The acceleration of inflation was influenced by the September peak in the oil market. But with the price of oil already back more than 10% from its peak, traders are not expected to be too worried about the PPI rise;
→ a "majority" of Fed officials thought another rate hike would "likely be appropriate" to help cool demand and bring inflation closer to its 2% inflation target over the next two years, while "some" said “no". “Participants generally noted that it was important to balance the risk of overtightening against the risk of insufficient tightening,” the minutes said.
As a result, as of Thursday morning, the price of the S&P 500 is at a high of the week, which indicates that, according to the consolidated view, the Fed is in control of the fight against inflation in a market that is experiencing positivity ahead of the reporting season.
Corporate performance will weigh heavily on the S&P 500 price in the coming weeks, with bullish momentum forming a rebound from the lower boundary of the ascending channel likely to be hampered by:
→ psychological level 4400, in the area of which Fibo 50% of the decline in A→B occurs;
→ level 4,450 – as the arrows show, it has affected the price more than once since June 2022.
To benefit from the rise and fall of the S&P 500 price, consider enlisting the services of a trusted broker like FXOpen.
CFDs are complex instruments and come with a high risk of losing your money.
This article represents the opinion of the Companies operating under the FXOpen brand only. It is not to be construed as an offer, solicitation, or recommendation with respect to products and services provided by the Companies operating under the FXOpen brand, nor is it to be considered financial advice.
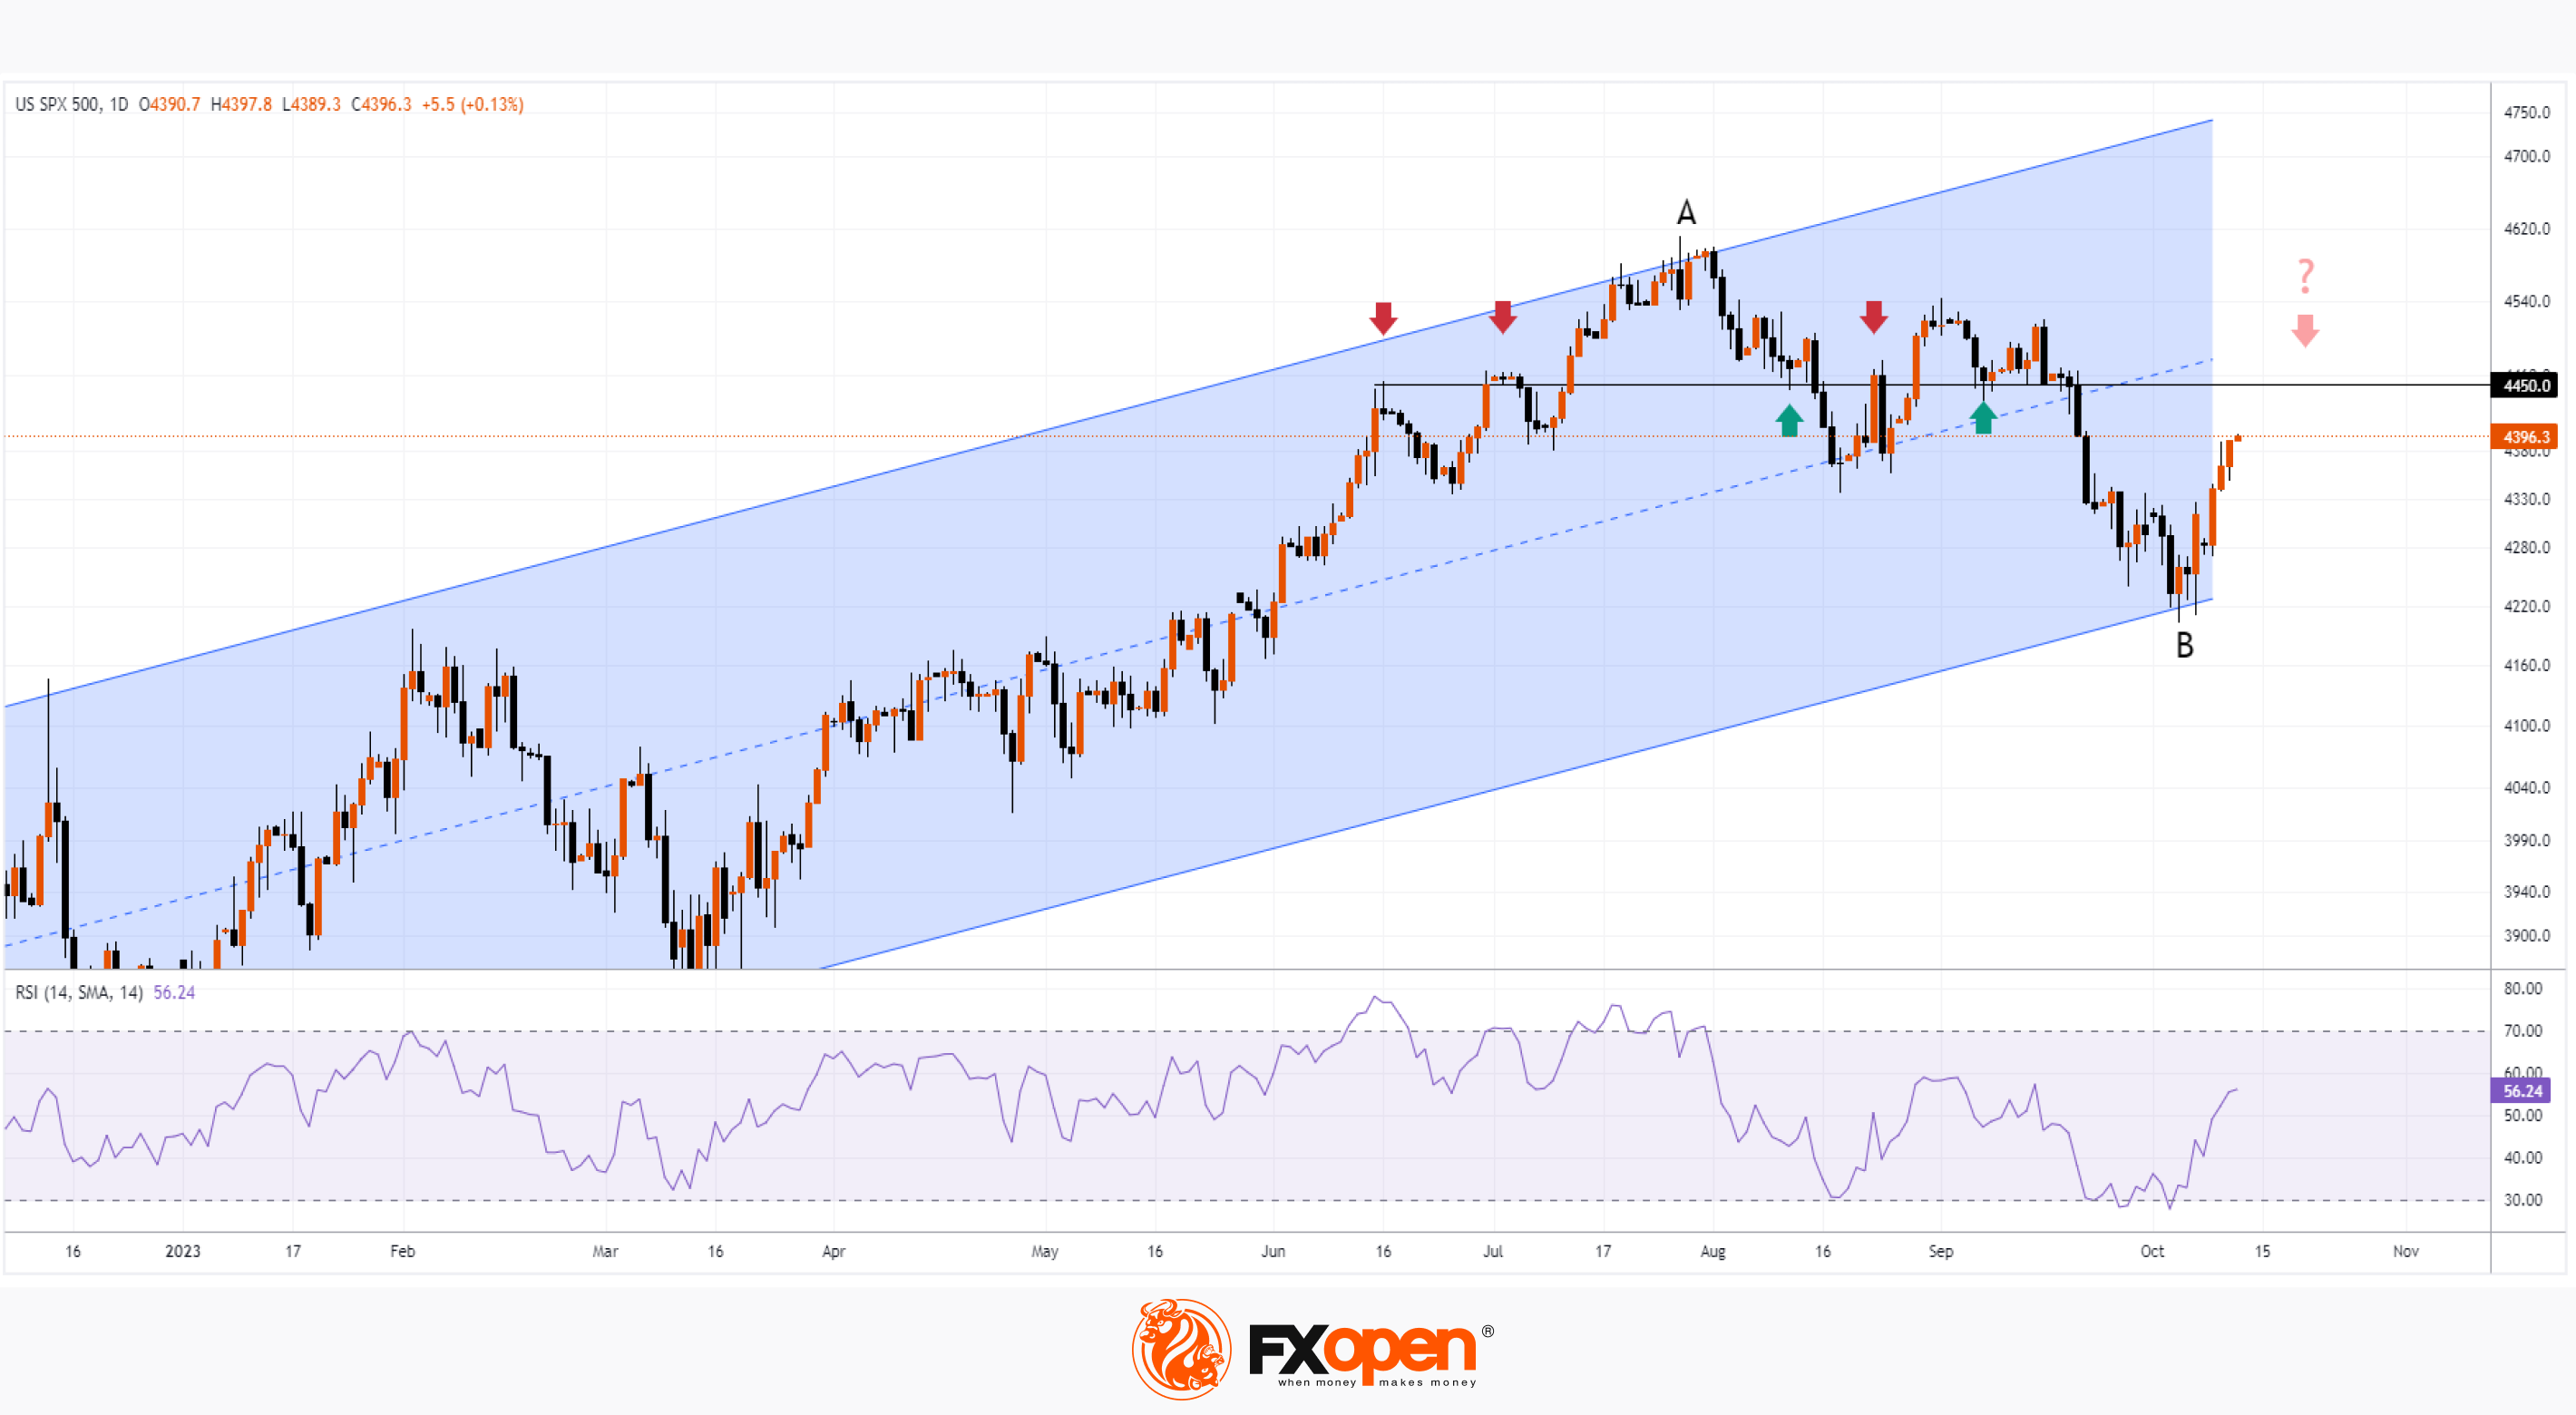
#marketanalysis #forextrading #tradingtips
GBP/USD Analysis: The Rate Is Near October Highs
In early October, the GBP/USD decline exceeded 10% from its summer high, which was very worrying. However, the weakening of the US dollar and changes in sentiment in the US government bond market allowed the pound to strengthen.
Important news about UK GDP was published this morning:
→ The Office for National Statistics estimates that real gross domestic product (GDP) rose 0.2% in August 2023, after falling 0.6% in July 2023;
→ production of services grew by 0.4% in August 2023 and became the main driver of GDP growth;
→ the construction sector performed worse than others, falling 0.5% in August 2023 after falling 0.4% in July 2023.
In general, although the UK GDP picture gives reason for some optimism, the GBP/USD rate today reacted with a decline to the publication of this news. Perhaps influencing factors that are noticeable to technical analysis are coming into play?
→ The GBP/USD rate rose to the level of 1.234. After breaking through it in the second half of September, the bears accelerated the decline, so the price may demonstrate that they have some control.
→ The GBP/USD rate rose to the upper border of the downward channel.
Bulls may hope that the 1.225 level (which served as resistance) will help them maintain the progress made in October. It is possible that if the forces of supply and demand balance each other, we will see exchange rate fluctuations between 1.234 and 1.225 in the coming days.
To benefit from the rise and fall of currency rates, consider enlisting the services of a trusted broker like FXOpen.
CFDs are complex instruments and come with a high risk of losing your money.
This article represents the opinion of the Companies operating under the FXOpen brand only. It is not to be construed as an offer, solicitation, or recommendation with respect to products and services provided by the Companies operating under the FXOpen brand, nor is it to be considered financial advice.
GBP/USD Analysis: The Rate Is Near October Highs
In early October, the GBP/USD decline exceeded 10% from its summer high, which was very worrying. However, the weakening of the US dollar and changes in sentiment in the US government bond market allowed the pound to strengthen.
Important news about UK GDP was published this morning:
→ The Office for National Statistics estimates that real gross domestic product (GDP) rose 0.2% in August 2023, after falling 0.6% in July 2023;
→ production of services grew by 0.4% in August 2023 and became the main driver of GDP growth;
→ the construction sector performed worse than others, falling 0.5% in August 2023 after falling 0.4% in July 2023.
In general, although the UK GDP picture gives reason for some optimism, the GBP/USD rate today reacted with a decline to the publication of this news. Perhaps influencing factors that are noticeable to technical analysis are coming into play?
→ The GBP/USD rate rose to the level of 1.234. After breaking through it in the second half of September, the bears accelerated the decline, so the price may demonstrate that they have some control.
→ The GBP/USD rate rose to the upper border of the downward channel.
Bulls may hope that the 1.225 level (which served as resistance) will help them maintain the progress made in October. It is possible that if the forces of supply and demand balance each other, we will see exchange rate fluctuations between 1.234 and 1.225 in the coming days.
To benefit from the rise and fall of currency rates, consider enlisting the services of a trusted broker like FXOpen.
CFDs are complex instruments and come with a high risk of losing your money.
This article represents the opinion of the Companies operating under the FXOpen brand only. It is not to be construed as an offer, solicitation, or recommendation with respect to products and services provided by the Companies operating under the FXOpen brand, nor is it to be considered financial advice.
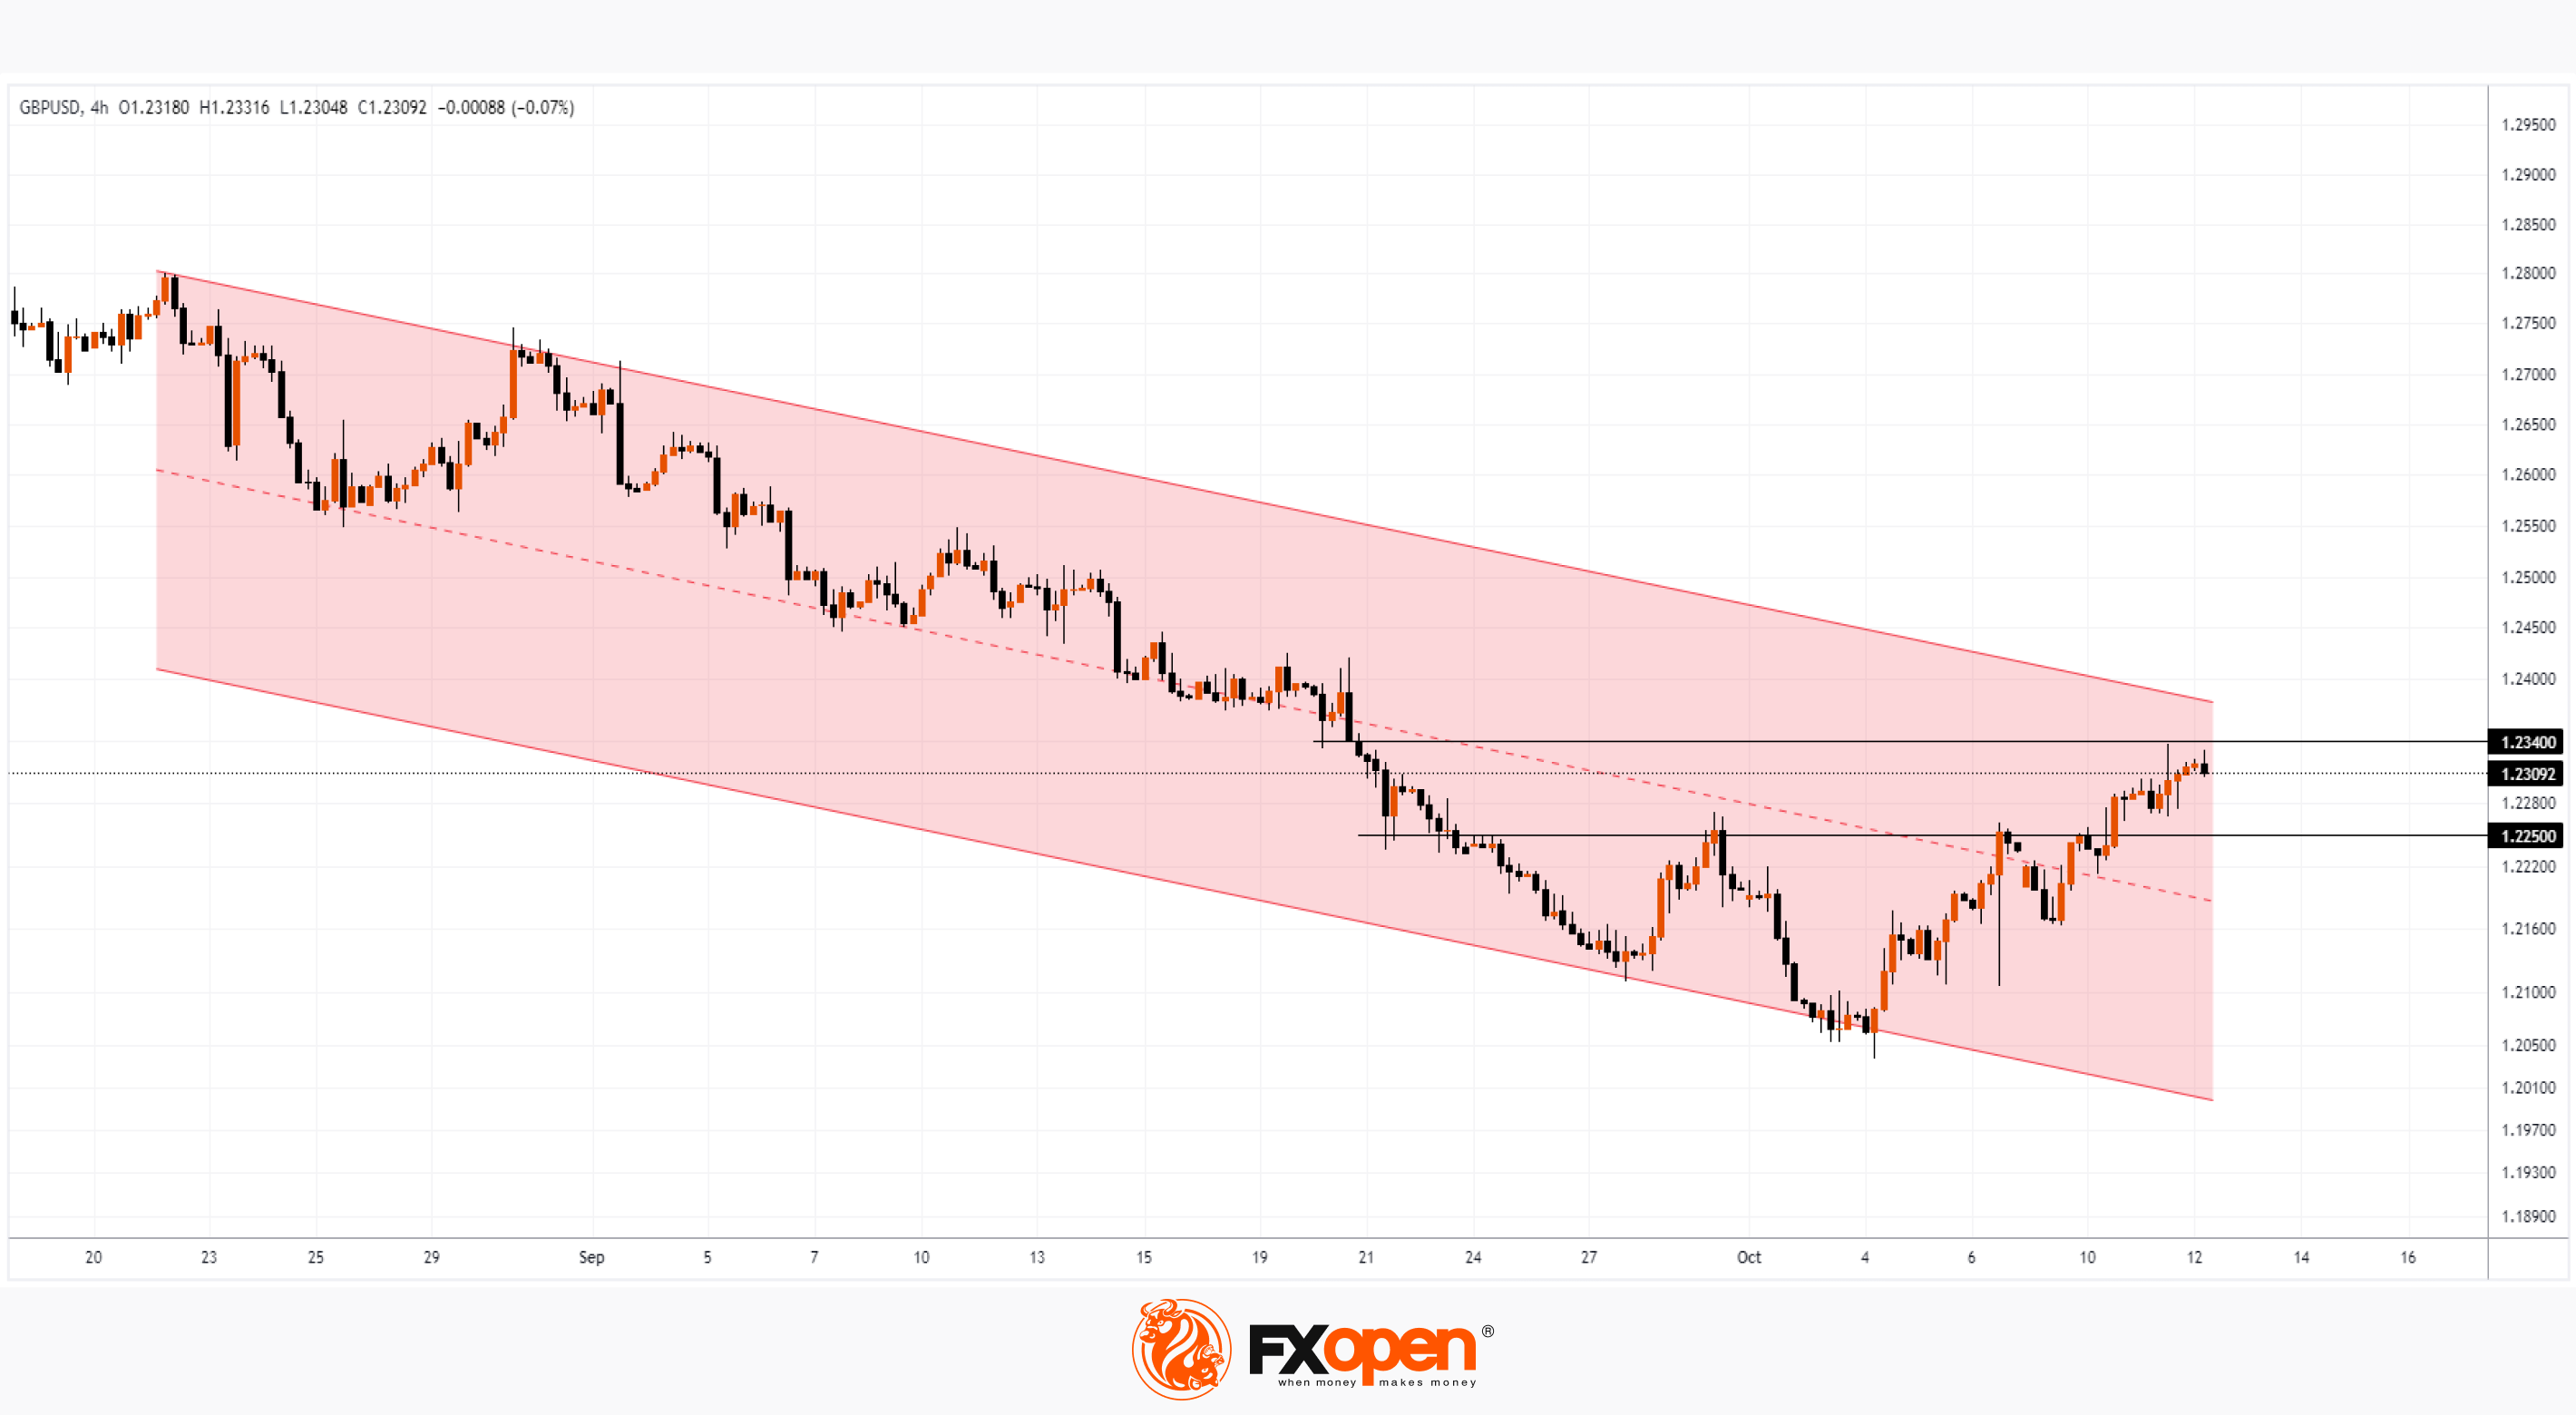
#marketanalysis #goldprice #XAUUSD
Market Analysis: The Price of Gold Rises More Than 5% Since Last Friday
The rise in the price of the (considered a safe haven) asset was driven by:
→ escalation of geopolitical conflicts;
→ increasing US government debt and rising bond prices make gold a more attractive option for a defensive portfolio.
Also, according to Business Insider, global central banks are buying gold in an effort to diversify reserves away from the dollar.
Thanks to the bullish momentum, the price of XAU/USD has risen into the upper half of the downward channel that has been in effect in the market since late spring. If the bulls are able to reach its upper limit in a relatively short amount of time, this will be a prerequisite to consider that the channel is losing its relevance.
From a technical point of view, the price increase was facilitated by:
→ lower border of the channel;
→ level 1,820, where the bulls had control in March and confirmed it in October.
Can the rally continue? This will be prevented by:
→ desires of buyers to secure profits from a sharp impulse;
→ level 1,888 (former support);
→ psychological level 1,900 (for the same reason).
→ at current levels a sharp decline was recorded on September 27, so the imbalance in favor of offers may persist here.
To benefit from fluctuations in gold prices, consider enlisting the services of a trusted broker like FXOpen.
CFDs are complex instruments and come with a high risk of losing your money.
This article represents the opinion of the Companies operating under the FXOpen brand only. It is not to be construed as an offer, solicitation, or recommendation with respect to products and services provided by the Companies operating under the FXOpen brand, nor is it to be considered financial advice.
Market Analysis: The Price of Gold Rises More Than 5% Since Last Friday
The rise in the price of the (considered a safe haven) asset was driven by:
→ escalation of geopolitical conflicts;
→ increasing US government debt and rising bond prices make gold a more attractive option for a defensive portfolio.
Also, according to Business Insider, global central banks are buying gold in an effort to diversify reserves away from the dollar.
Thanks to the bullish momentum, the price of XAU/USD has risen into the upper half of the downward channel that has been in effect in the market since late spring. If the bulls are able to reach its upper limit in a relatively short amount of time, this will be a prerequisite to consider that the channel is losing its relevance.
From a technical point of view, the price increase was facilitated by:
→ lower border of the channel;
→ level 1,820, where the bulls had control in March and confirmed it in October.
Can the rally continue? This will be prevented by:
→ desires of buyers to secure profits from a sharp impulse;
→ level 1,888 (former support);
→ psychological level 1,900 (for the same reason).
→ at current levels a sharp decline was recorded on September 27, so the imbalance in favor of offers may persist here.
To benefit from fluctuations in gold prices, consider enlisting the services of a trusted broker like FXOpen.
CFDs are complex instruments and come with a high risk of losing your money.
This article represents the opinion of the Companies operating under the FXOpen brand only. It is not to be construed as an offer, solicitation, or recommendation with respect to products and services provided by the Companies operating under the FXOpen brand, nor is it to be considered financial advice.