#marketanalysis #forex #forextrading
Market Analysis: EUR/AUD Approaches Important Support Zone
Euro currency traders are focused on the ECB meeting, the decision of which will be published today at 15:15 GMT+3. There will be a press conference at 3:45 p.m.
According to Reuters, the probability of a rate hike is about 60%. The figure stood at 50% at the start of the week as the ECB's updated forecasts expect inflation to remain above 3% next year, well above its 2% target.
At the same time, Australian dollar traders experienced a spike in volatility this morning following the release of strong labor market data in Australia. Last month, the number of employed people increased by almost 65,000 people — the second highest figure in 2023.
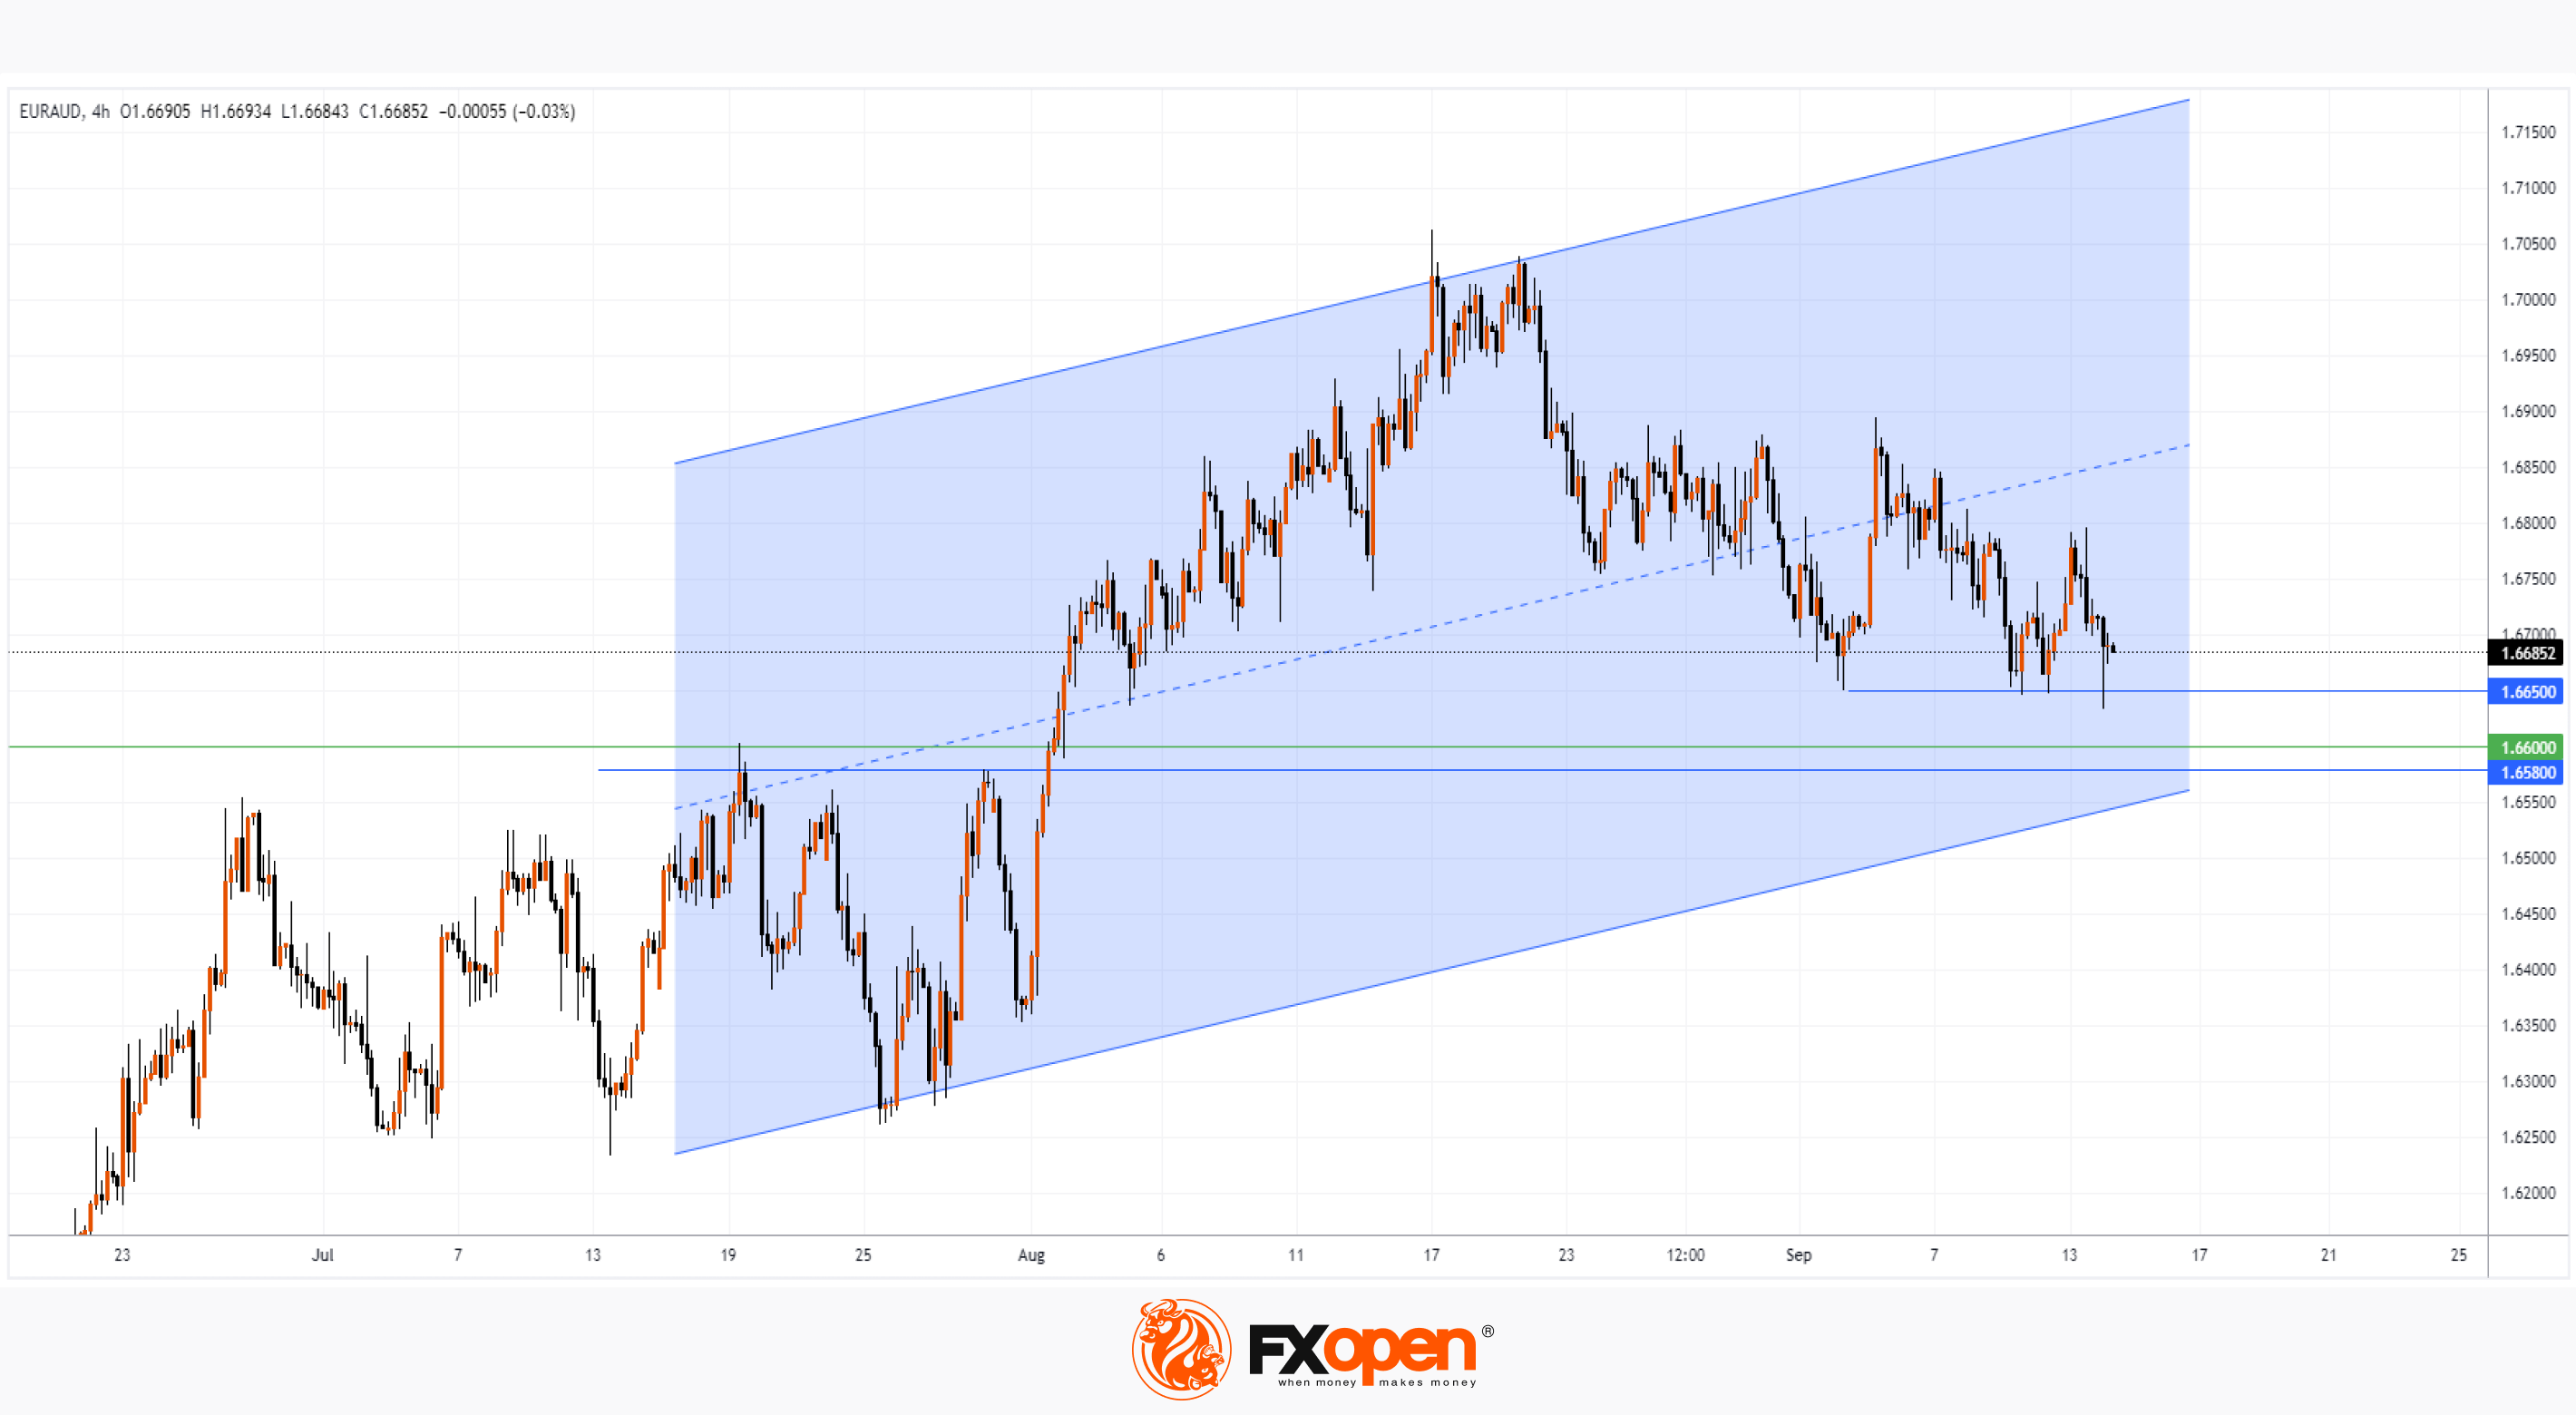
Today, the EUR/AUD chart forms an interesting picture from the point of view of technical analysis — the price has approached an important support zone formed by the levels 1.658-1.665:
→ The level of 1.665 has already shown its impact on the rate in September. Moreover, the long lower shadow on the last bearish candle with a false breakout indicates demand in this zone.
→ The 1.658 level is a former resistance that worked effectively in June-July, and after the breakout in August, the EUR/AUD price has not yet tested it.
→ The psychological level of 1.66 can provide support.
→ The lower boundary of the ascending channel (shown in blue) may also provide support.
And it is possible that if the price falls inside the zone, the bulls will try to take advantage of the chances and resume the upward trend.
To benefit from trends in the currency market, consider enlisting the services of a trusted broker like FXOpen.
CFDs are complex instruments and come with a high risk of losing your money.
This article represents the opinion of the Companies operating under the FXOpen brand only. It is not to be construed as an offer, solicitation, or recommendation with respect to products and services provided by the Companies operating under the FXOpen brand, nor is it to be considered financial advice.
Market Analysis: EUR/AUD Approaches Important Support Zone
Euro currency traders are focused on the ECB meeting, the decision of which will be published today at 15:15 GMT+3. There will be a press conference at 3:45 p.m.
According to Reuters, the probability of a rate hike is about 60%. The figure stood at 50% at the start of the week as the ECB's updated forecasts expect inflation to remain above 3% next year, well above its 2% target.
At the same time, Australian dollar traders experienced a spike in volatility this morning following the release of strong labor market data in Australia. Last month, the number of employed people increased by almost 65,000 people — the second highest figure in 2023.
Today, the EUR/AUD chart forms an interesting picture from the point of view of technical analysis — the price has approached an important support zone formed by the levels 1.658-1.665:
→ The level of 1.665 has already shown its impact on the rate in September. Moreover, the long lower shadow on the last bearish candle with a false breakout indicates demand in this zone.
→ The 1.658 level is a former resistance that worked effectively in June-July, and after the breakout in August, the EUR/AUD price has not yet tested it.
→ The psychological level of 1.66 can provide support.
→ The lower boundary of the ascending channel (shown in blue) may also provide support.
And it is possible that if the price falls inside the zone, the bulls will try to take advantage of the chances and resume the upward trend.
To benefit from trends in the currency market, consider enlisting the services of a trusted broker like FXOpen.
CFDs are complex instruments and come with a high risk of losing your money.
This article represents the opinion of the Companies operating under the FXOpen brand only. It is not to be construed as an offer, solicitation, or recommendation with respect to products and services provided by the Companies operating under the FXOpen brand, nor is it to be considered financial advice.
#MarketNews #stockmarket #nvidia
NVDA Stock Analysis: Reversal Pattern Forming on the Chart
NVDA stock has been a stock market leader throughout 2023 amid the AI boom. NVDA's share price rose by more than 200%, allowing NVidia's capitalization to exceed USD 1 trillion.
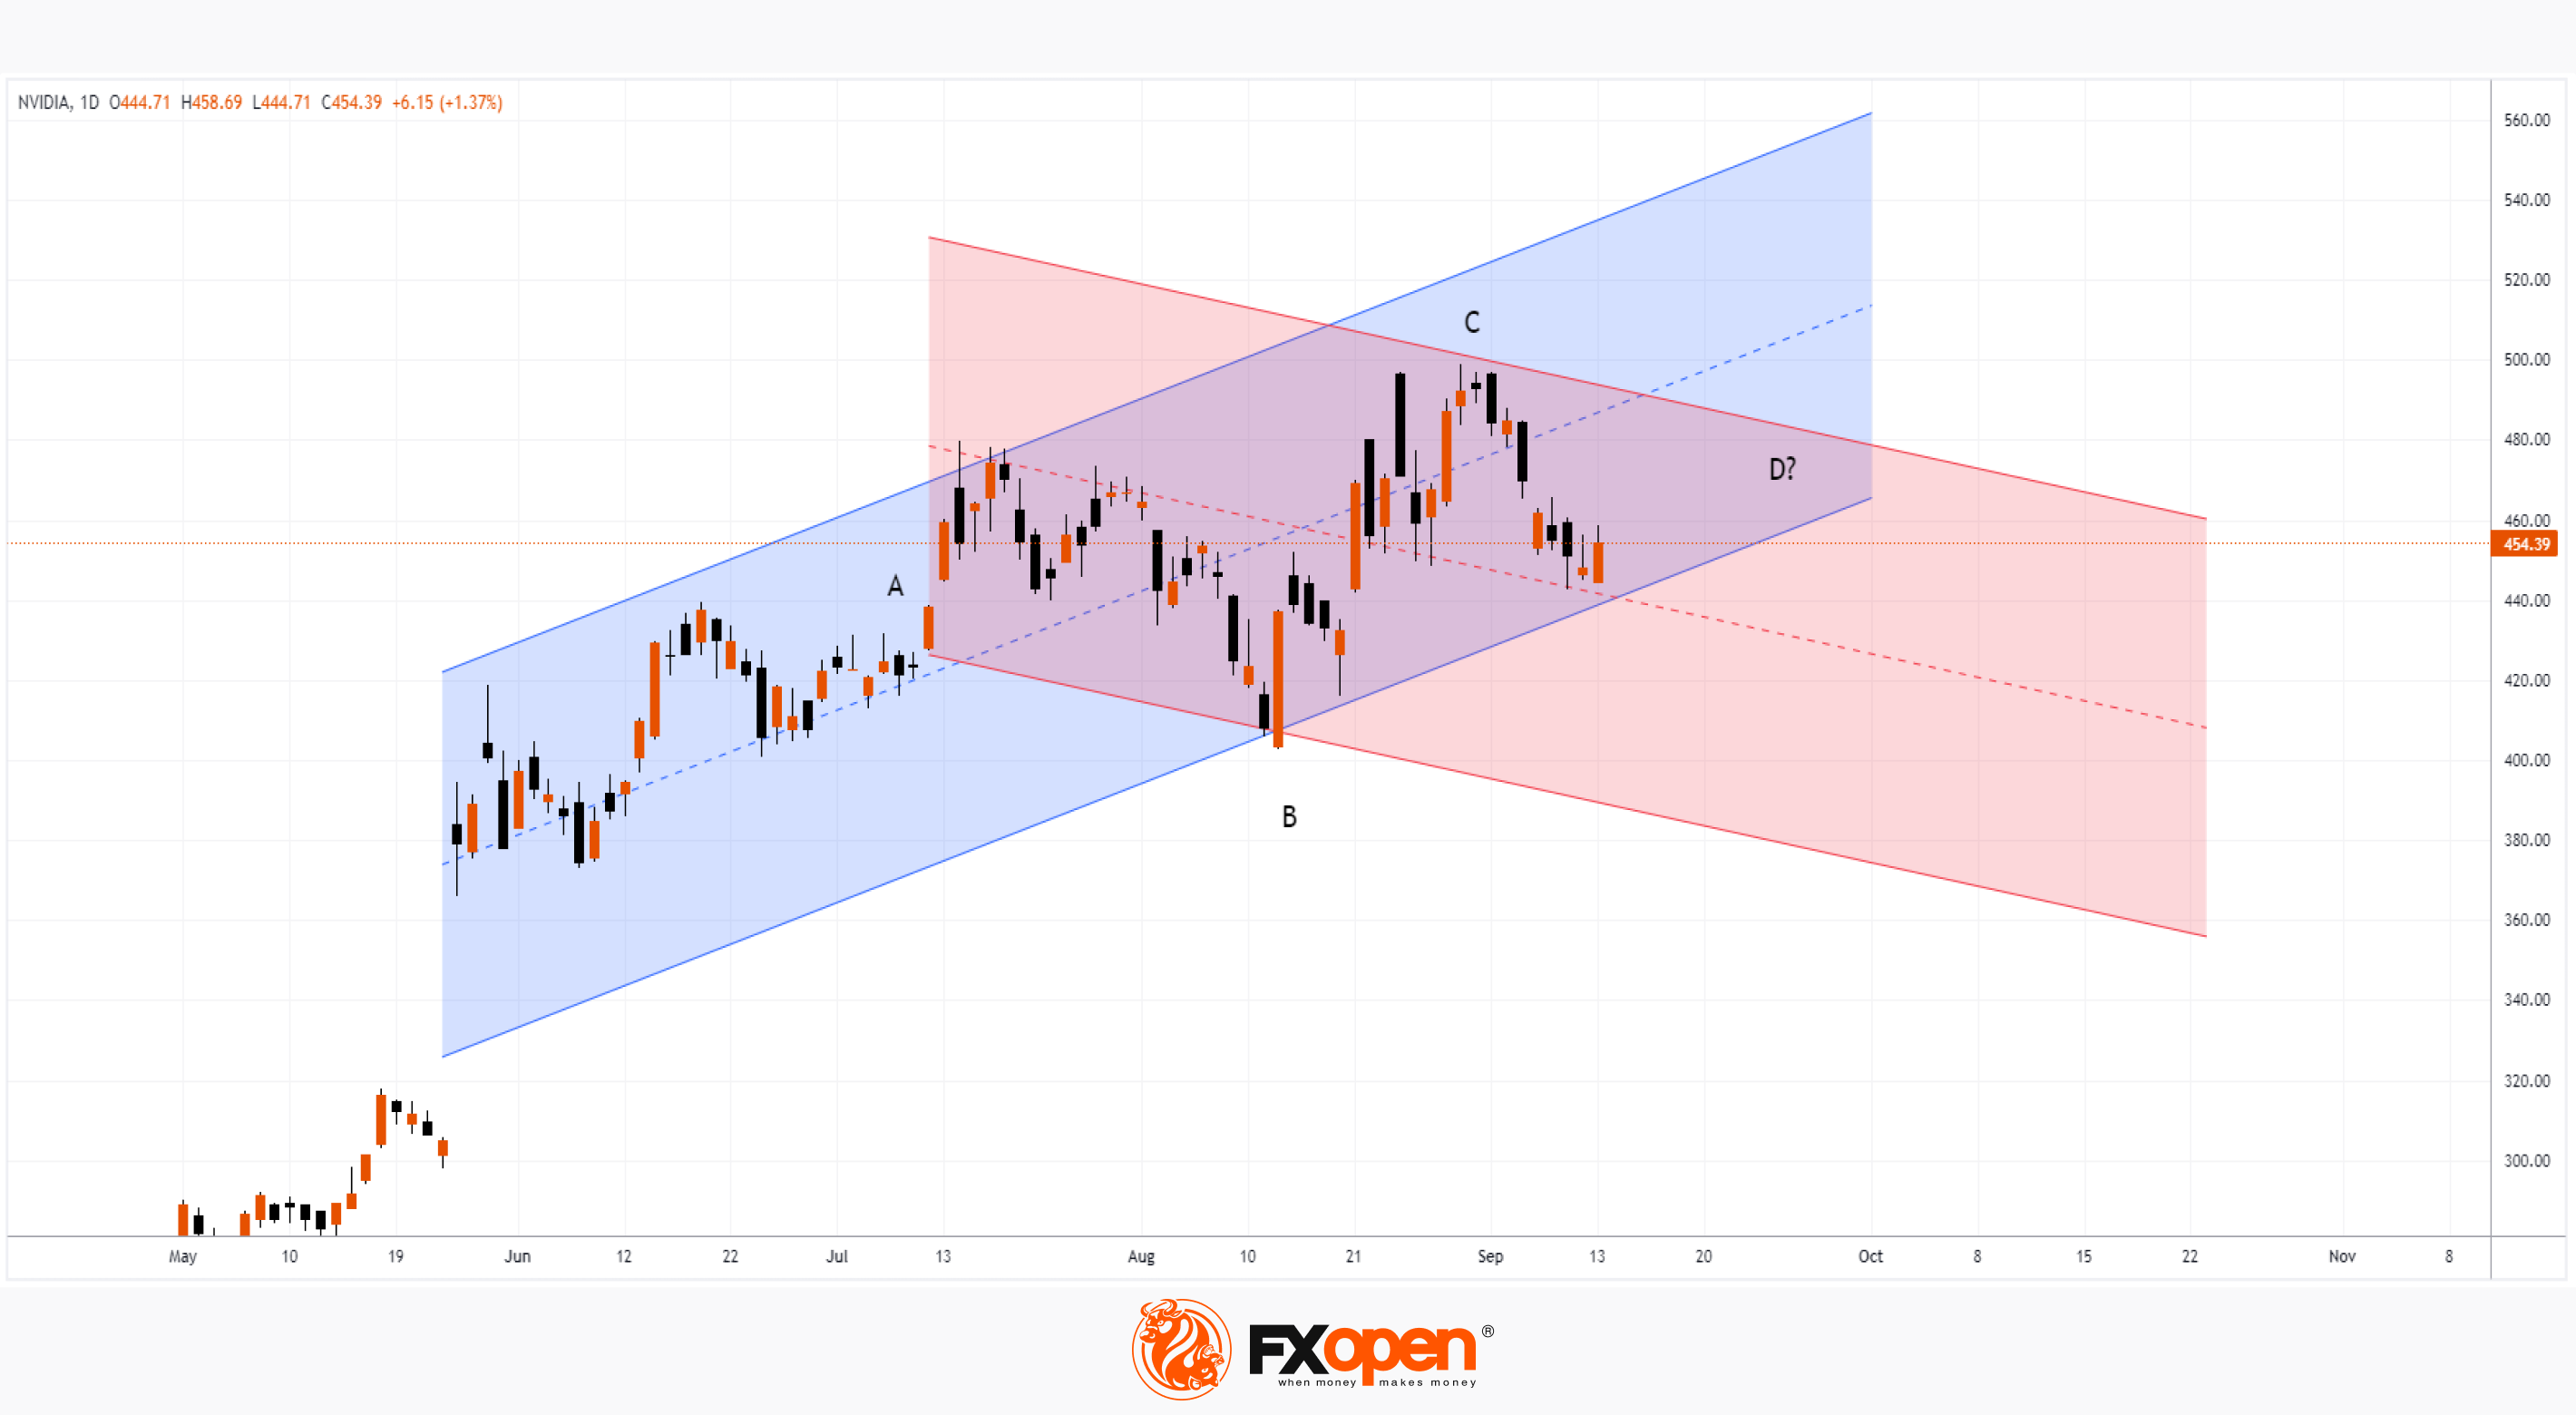
However, a pattern is forming on the chart, warning that NVDA's share price may decline. This is a diamond pattern A-B-C-D (determining the position of point D still takes time), which is formed from intersecting parallel lines of support and resistance. They are shown on the chart using ascending and descending channels.
Even though this instance of the pattern is far from the standard, it deserves attention.
Arguments confirming that the pattern can work:
→ in September, NVDA stock performed weaker than the S&P 500 index;
→ at the top of the diamond, there were high trading volumes, according to the NASDAQ exchange. The current price is below the levels at which high-volume transactions were recorded at the end of August. This can be interpreted as the fact that large market participants are taking profits (and/or even taking a short position);
→ the media is disseminating information that NVDA shares were sold by Berkshire (managed by Buffett) and the company's president Jen Huang herself — according to Yahoo Finance, on September 11, she sold about 30k shares.
Could the AI boom be winding down? According to investor Rob Arnott, Nvidia stock is a bubble. And if it bursts, it could trigger a collapse of the entire stock market.
To benefit from the rise and fall of popular stocks, consider enlisting the services of a trusted broker like FXOpen.
CFDs are complex instruments and come with a high risk of losing your money.
This article represents the opinion of the Companies operating under the FXOpen brand only. It is not to be construed as an offer, solicitation, or recommendation with respect to products and services provided by the Companies operating under the FXOpen brand, nor is it to be considered financial advice.
NVDA Stock Analysis: Reversal Pattern Forming on the Chart
NVDA stock has been a stock market leader throughout 2023 amid the AI boom. NVDA's share price rose by more than 200%, allowing NVidia's capitalization to exceed USD 1 trillion.
However, a pattern is forming on the chart, warning that NVDA's share price may decline. This is a diamond pattern A-B-C-D (determining the position of point D still takes time), which is formed from intersecting parallel lines of support and resistance. They are shown on the chart using ascending and descending channels.
Even though this instance of the pattern is far from the standard, it deserves attention.
Arguments confirming that the pattern can work:
→ in September, NVDA stock performed weaker than the S&P 500 index;
→ at the top of the diamond, there were high trading volumes, according to the NASDAQ exchange. The current price is below the levels at which high-volume transactions were recorded at the end of August. This can be interpreted as the fact that large market participants are taking profits (and/or even taking a short position);
→ the media is disseminating information that NVDA shares were sold by Berkshire (managed by Buffett) and the company's president Jen Huang herself — according to Yahoo Finance, on September 11, she sold about 30k shares.
Could the AI boom be winding down? According to investor Rob Arnott, Nvidia stock is a bubble. And if it bursts, it could trigger a collapse of the entire stock market.
To benefit from the rise and fall of popular stocks, consider enlisting the services of a trusted broker like FXOpen.
CFDs are complex instruments and come with a high risk of losing your money.
This article represents the opinion of the Companies operating under the FXOpen brand only. It is not to be construed as an offer, solicitation, or recommendation with respect to products and services provided by the Companies operating under the FXOpen brand, nor is it to be considered financial advice.
#MarketNews #marketanalysis #ECB
Market Reaction to the ECB's Decision to Raise Rates to 4.5%
According to the ECB report, published yesterday:
→ Inflation in Europe continues to decline, but will remain too high for too long.
→ Average inflation is forecast at 5.6% in 2023, 3.2% in 2024 and 2.1% in 2025. This is an upward revision for 2023 and 2024, which mainly reflects rising energy prices.
→ The eurozone economy is forecast to grow by 0.7% in 2023, 1.0% in 2024 and 1.5% in 2025.
In order to combat inflation, the ECB decided to raise the key interest rate by 25 basis points to 4.5%, which was a surprise, since it was expected to remain at 4.25%. At the same time, the deposit rate reached a historical maximum.
Importantly, the ECB noted that "interest rates have reached levels that, maintained for a sufficiently long duration, will make a substantial contribution to the timely return of inflation to the target” — this was perceived by market participants as a signal that the growth cycle (10 rate increases in a row) is completed.
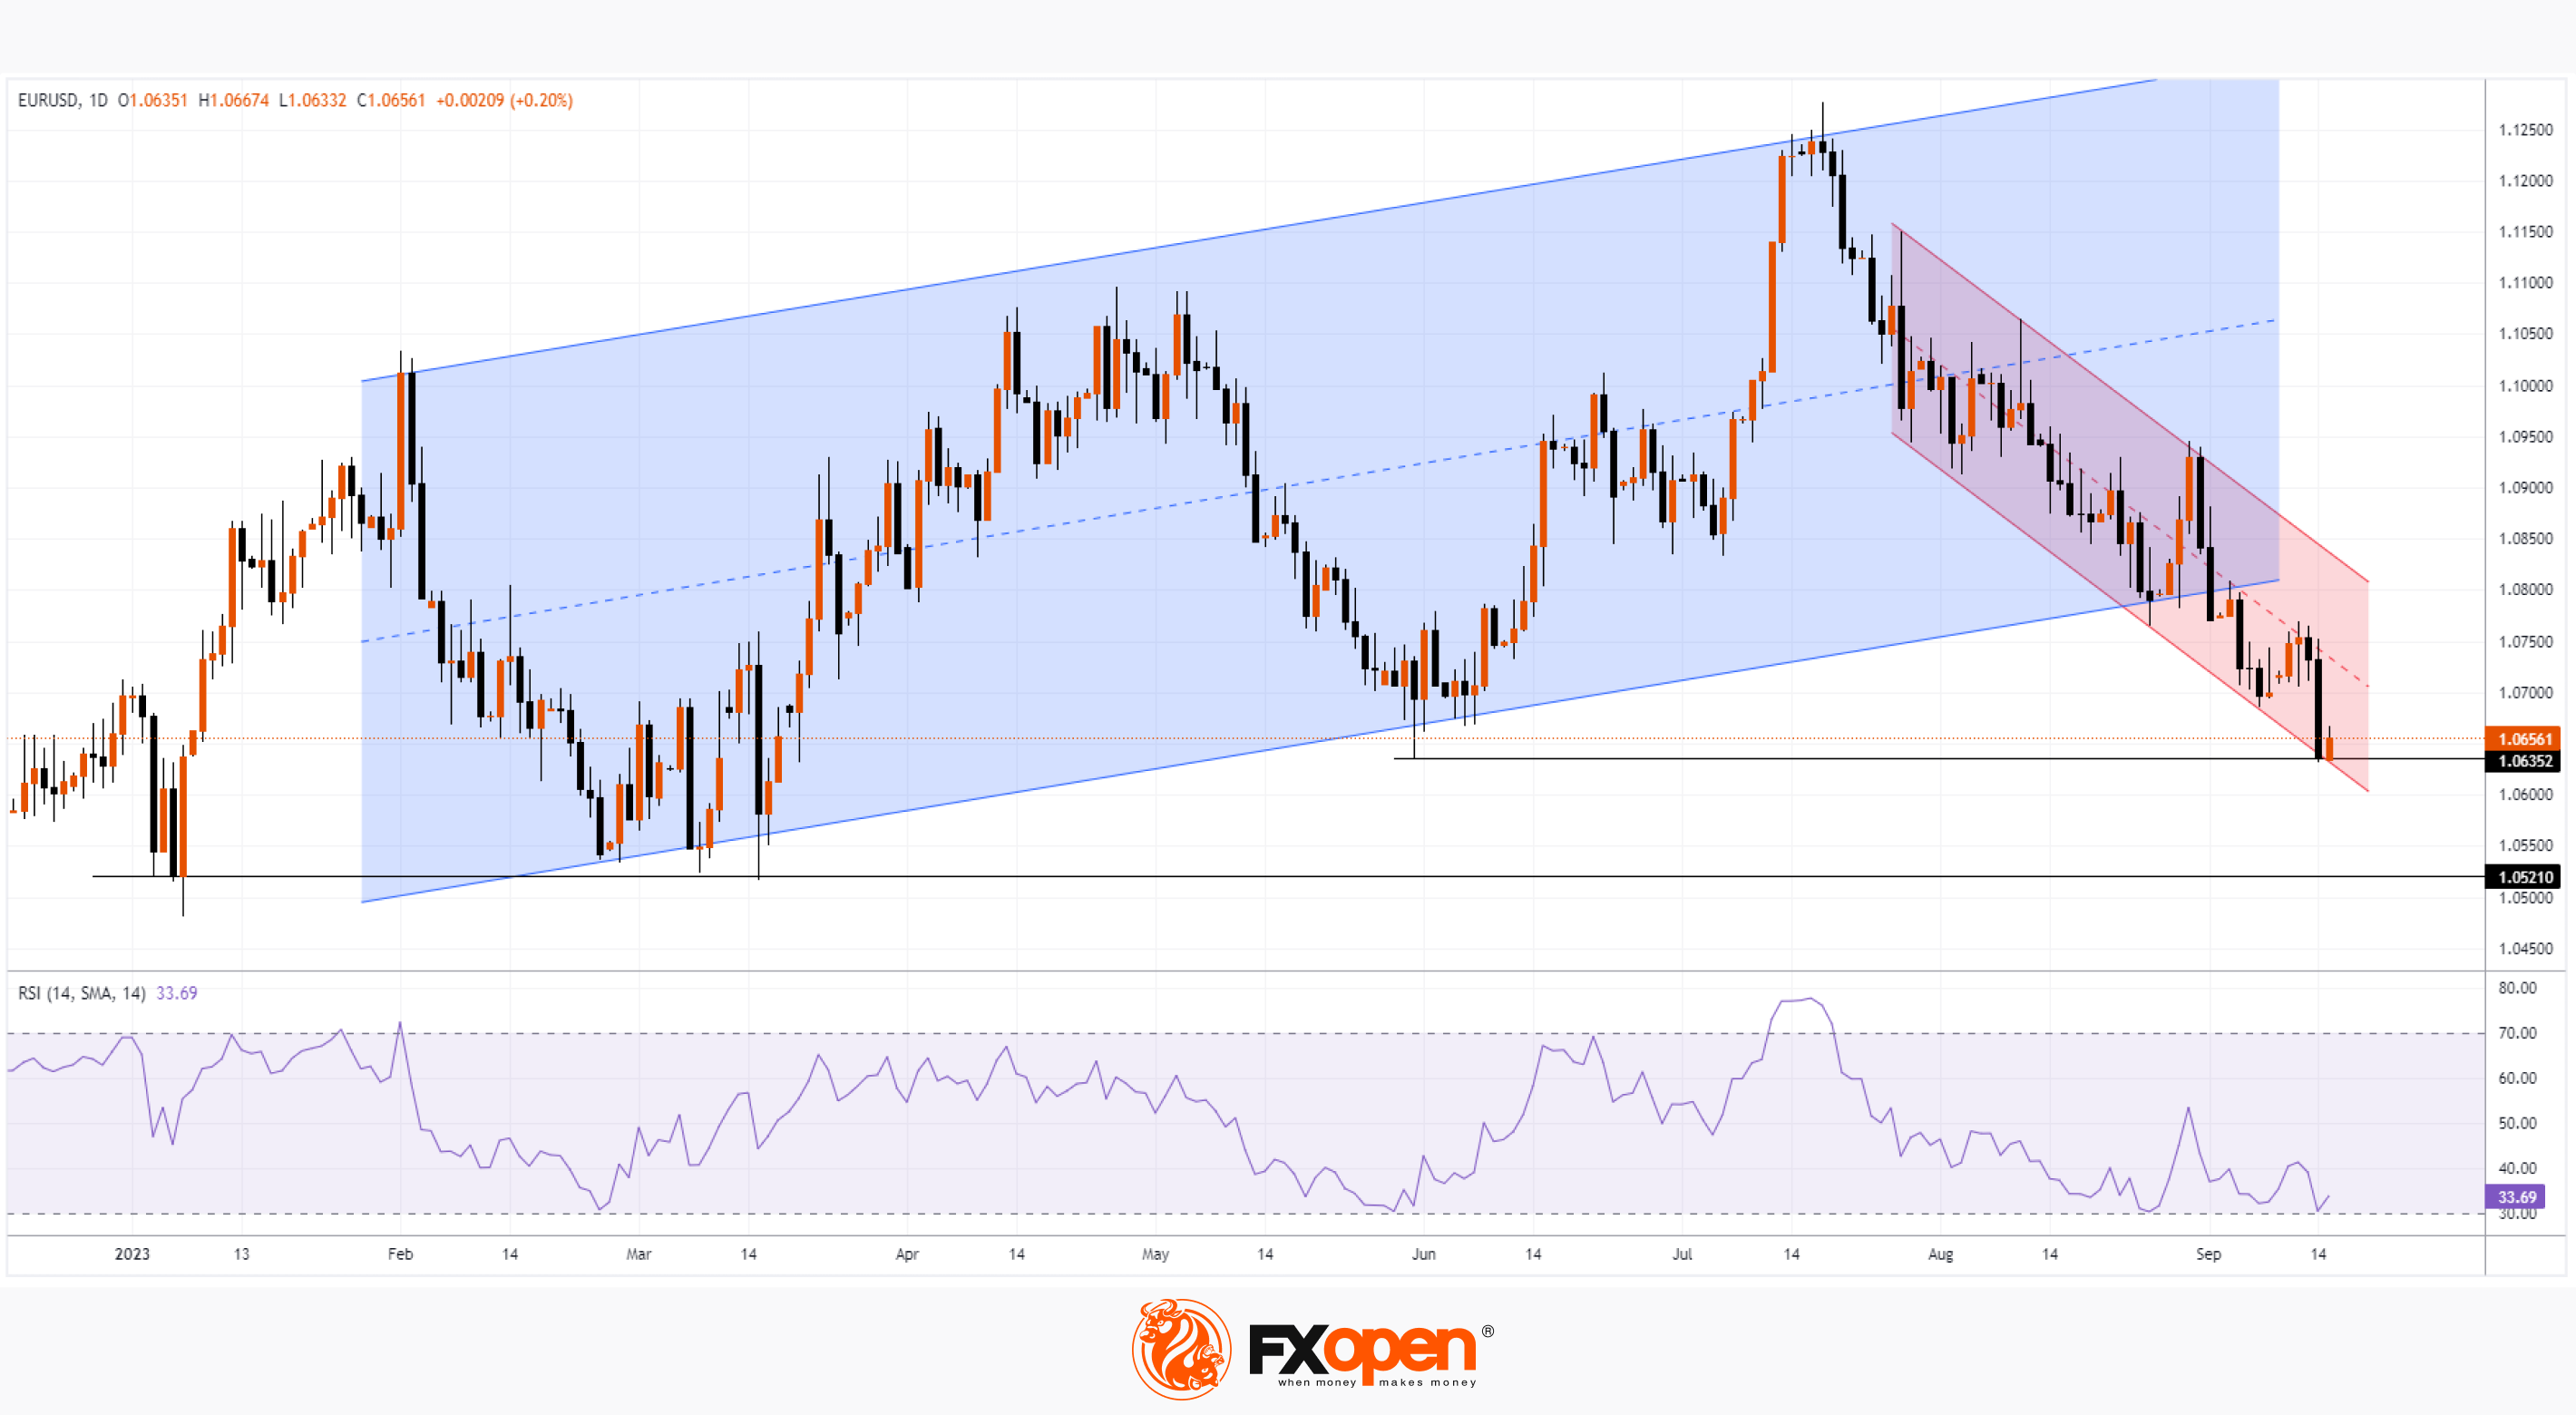
As a result, the euro fell in price. As the chart shows, at yesterday's low, the EUR/USD rate fell below the previous low set on May 31 at 1.06352. The sharp downward momentum was also supported by strong data on the US dollar (the dollar index yesterday reached its highest since the beginning of March):
→ retail sales increased by 0.6% (expected +0.4%);
→ the number of unemployment applications for the month amounted to 220k (226k were expected).
The ascending channel, shown in blue, looks completely broken. And the price fits more and more into the downward channel (shown in red). Will the euro be able to recover from yesterday's fall?
Bullish arguments:
→ oscillators indicate that the market is oversold. For example, the RSI is near the 30 level;
→ the price may be supported by the lower border of the descending channel;
→ the price also approached the support at 1.0521, which affected the price twice this year.
Although if inflation in Europe remains high, given rising energy prices, then bullish arguments may not be enough to change the bearish price dynamics.
To benefit from price fluctuations in the foreign exchange markets, consider enlisting the services of a trusted broker like FXOpen.
CFDs are complex instruments and come with a high risk of losing your money.
This article represents the opinion of the Companies operating under the FXOpen brand only. It is not to be construed as an offer, solicitation, or recommendation with respect to products and services provided by the Companies operating under the FXOpen brand, nor is it to be considered financial advice.
Market Reaction to the ECB's Decision to Raise Rates to 4.5%
According to the ECB report, published yesterday:
→ Inflation in Europe continues to decline, but will remain too high for too long.
→ Average inflation is forecast at 5.6% in 2023, 3.2% in 2024 and 2.1% in 2025. This is an upward revision for 2023 and 2024, which mainly reflects rising energy prices.
→ The eurozone economy is forecast to grow by 0.7% in 2023, 1.0% in 2024 and 1.5% in 2025.
In order to combat inflation, the ECB decided to raise the key interest rate by 25 basis points to 4.5%, which was a surprise, since it was expected to remain at 4.25%. At the same time, the deposit rate reached a historical maximum.
Importantly, the ECB noted that "interest rates have reached levels that, maintained for a sufficiently long duration, will make a substantial contribution to the timely return of inflation to the target” — this was perceived by market participants as a signal that the growth cycle (10 rate increases in a row) is completed.
As a result, the euro fell in price. As the chart shows, at yesterday's low, the EUR/USD rate fell below the previous low set on May 31 at 1.06352. The sharp downward momentum was also supported by strong data on the US dollar (the dollar index yesterday reached its highest since the beginning of March):
→ retail sales increased by 0.6% (expected +0.4%);
→ the number of unemployment applications for the month amounted to 220k (226k were expected).
The ascending channel, shown in blue, looks completely broken. And the price fits more and more into the downward channel (shown in red). Will the euro be able to recover from yesterday's fall?
Bullish arguments:
→ oscillators indicate that the market is oversold. For example, the RSI is near the 30 level;
→ the price may be supported by the lower border of the descending channel;
→ the price also approached the support at 1.0521, which affected the price twice this year.
Although if inflation in Europe remains high, given rising energy prices, then bullish arguments may not be enough to change the bearish price dynamics.
To benefit from price fluctuations in the foreign exchange markets, consider enlisting the services of a trusted broker like FXOpen.
CFDs are complex instruments and come with a high risk of losing your money.
This article represents the opinion of the Companies operating under the FXOpen brand only. It is not to be construed as an offer, solicitation, or recommendation with respect to products and services provided by the Companies operating under the FXOpen brand, nor is it to be considered financial advice.
#MarketNews #marketanalysis
Market Analysis: Yuan Retreats from Multi-year Highs on Strong Economic Data
The US dollar index hit its highest level since early March this week, but the yuan is one of the few currencies to rise against the USD over the period.
This was facilitated, among other things, by strong economic data published today:
→ Industrial production growth in August amounted to +4.5% in annual terms (expected +3.9). This is the strongest progress in 1 month since autumn 2022.
→ Retail sales in August increased by 4.6% year on year (expected +3.0%).
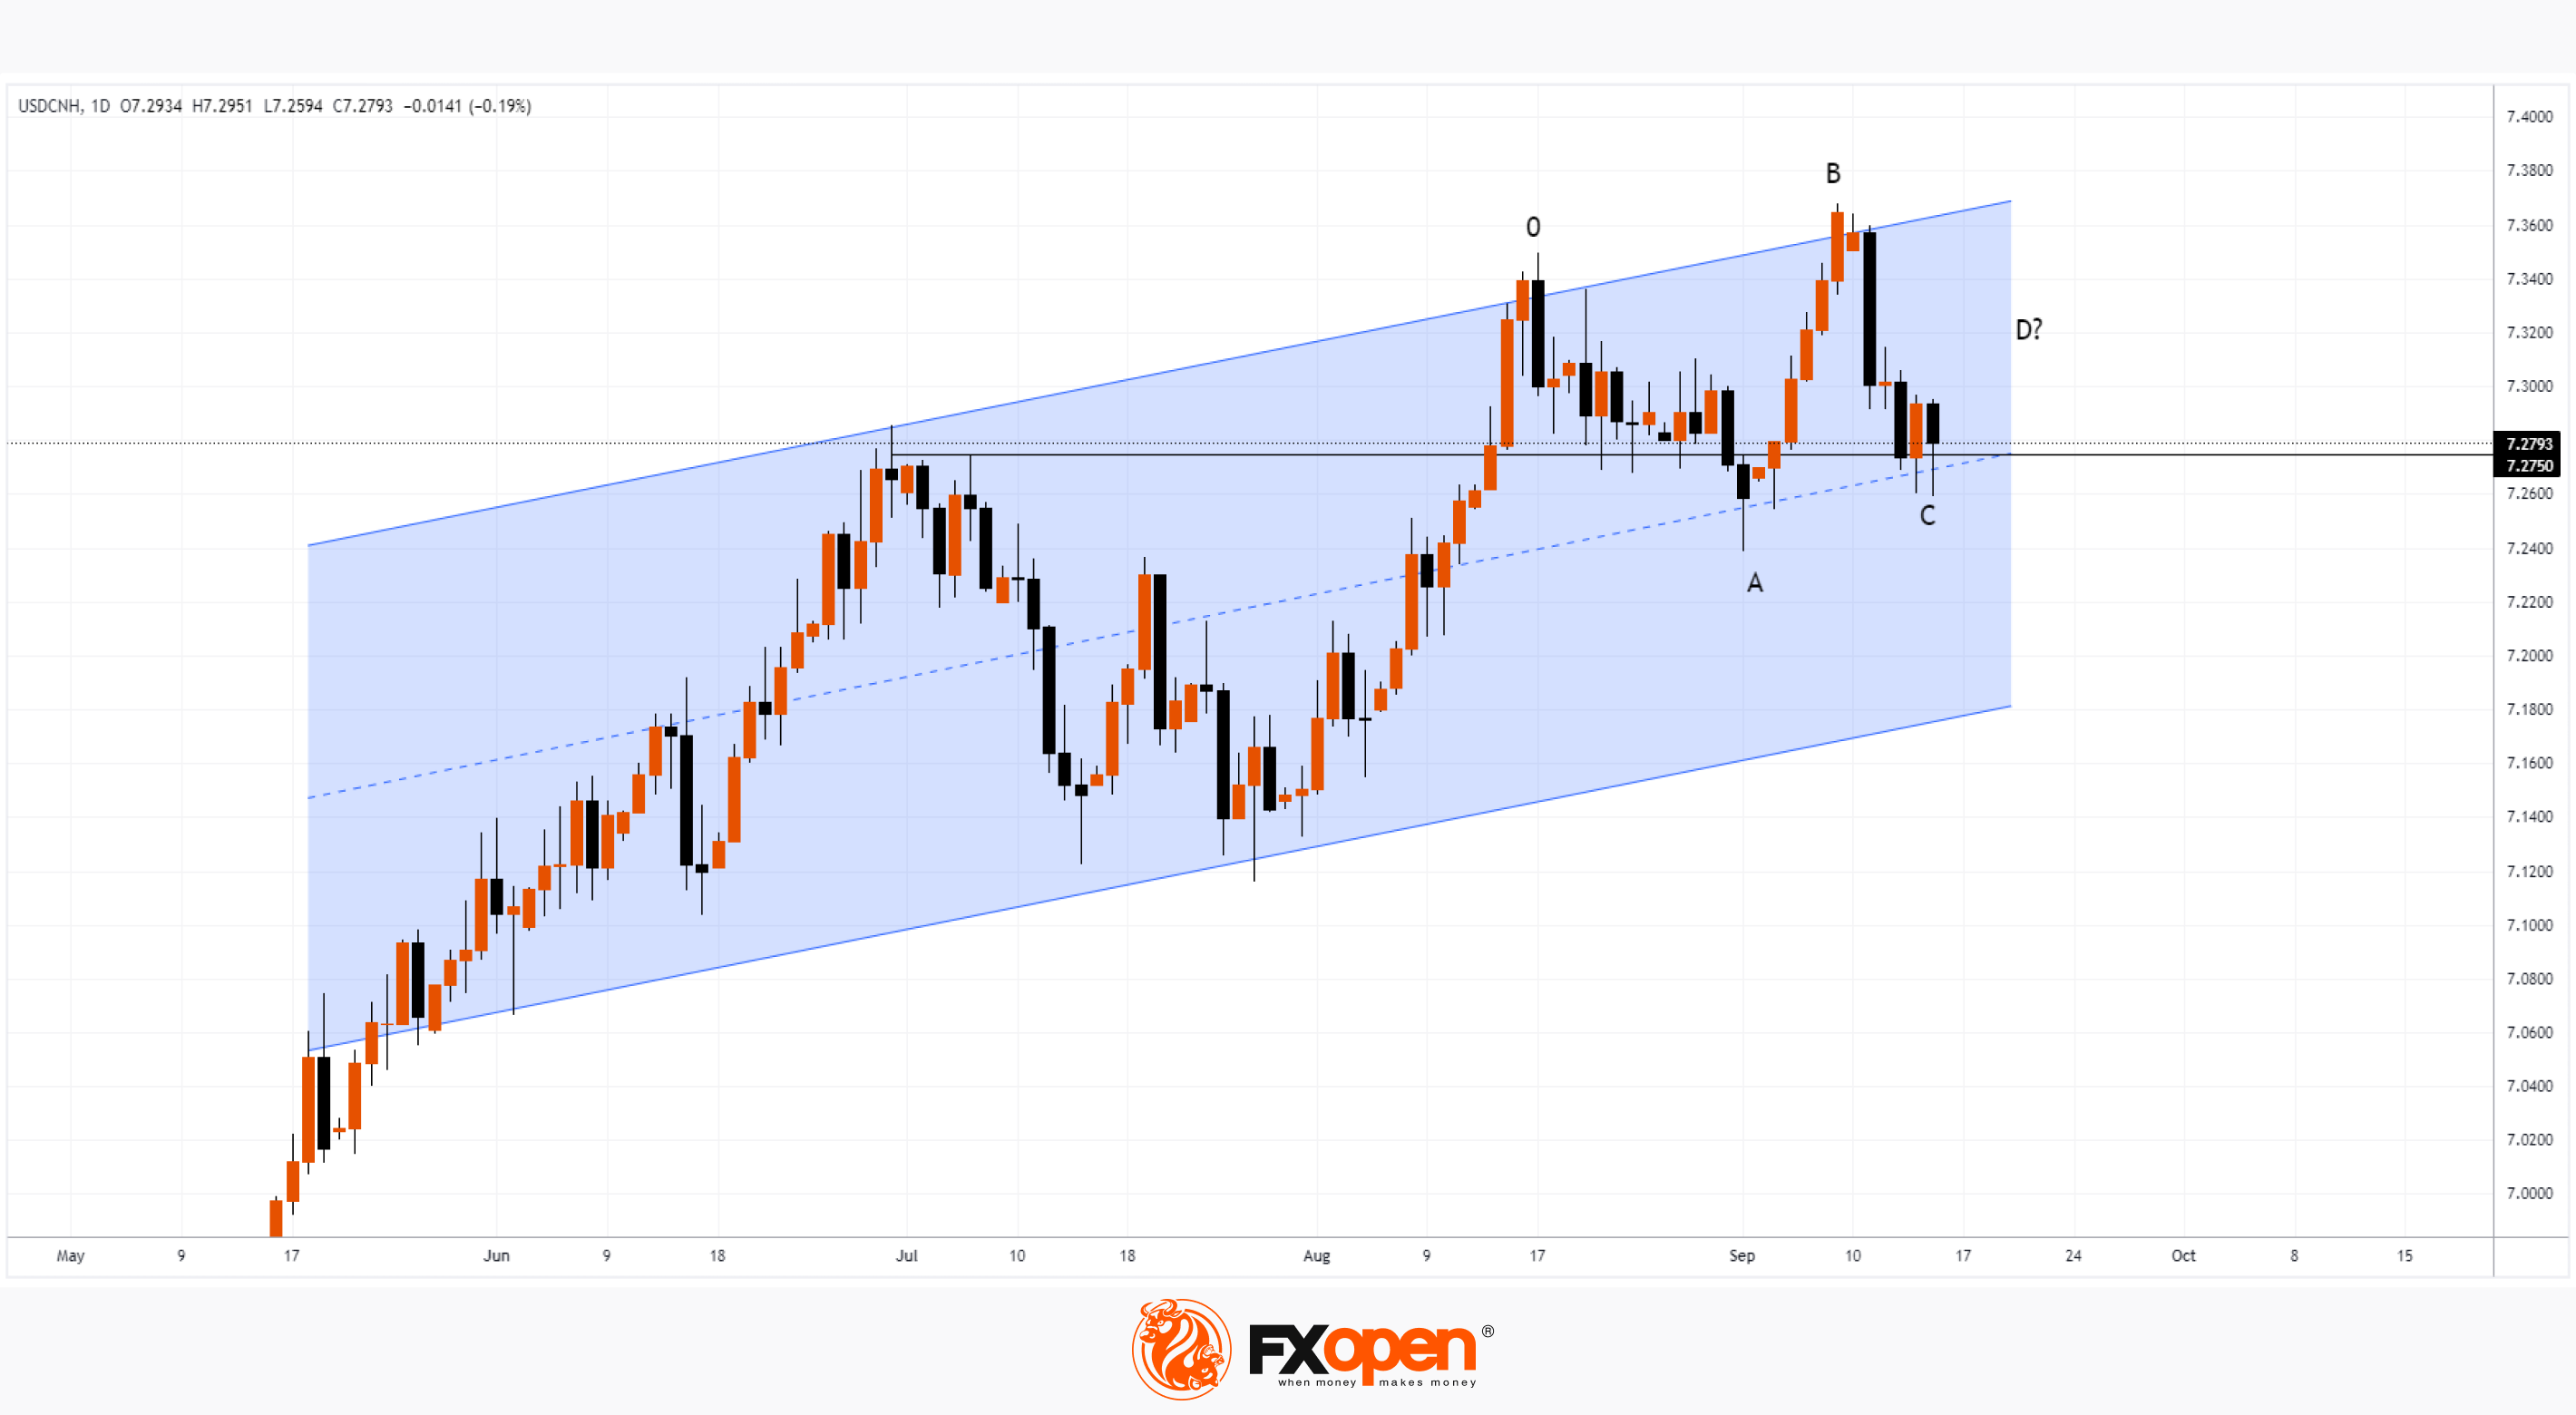
The chart shows that after a multi-year high (B) of about USD 7.36 per yuan set on September 8, the rate has retreated sharply. That is, sales of dollars (B→C) for yuan increased. And the sharp increase in A→B is completely leveled out. This is a bearish sign, indicating that the bulls have completely retreated.
Now the price is near the median line of the channel. Here one can expect support, which is also strengthened by the level of 7.275, which previously served as resistance.
Let’s say that if a rebound C→D occurs (its probability is indicated by the long lower shadows on the candles on September 14-15), then by its dynamics it will be possible to judge the sustainability of the initiative that the bears have taken. If the rebound is 50% of the momentum (B→C), this will confirm the change in sentiment to bearish, and then we can expect that sellers will be able to put pressure on the rate so that it will decline to the lower border of the channel.
And then the picture will be even more bearish, because a head-and-shoulders pattern will form on the chart along the 0-B-D vertices. Provided the positive news background regarding the Chinese economy continues, we will be able to witness the formation of a stable bearish trend in favor of the yuan.
To benefit from currency fluctuations, consider enlisting the services of a trusted broker like FXOpen.
CFDs are complex instruments and come with a high risk of losing your money.
This article represents the opinion of the Companies operating under the FXOpen brand only. It is not to be construed as an offer, solicitation, or recommendation with respect to products and services provided by the Companies operating under the FXOpen brand, nor is it to be considered financial advice.
Market Analysis: Yuan Retreats from Multi-year Highs on Strong Economic Data
The US dollar index hit its highest level since early March this week, but the yuan is one of the few currencies to rise against the USD over the period.
This was facilitated, among other things, by strong economic data published today:
→ Industrial production growth in August amounted to +4.5% in annual terms (expected +3.9). This is the strongest progress in 1 month since autumn 2022.
→ Retail sales in August increased by 4.6% year on year (expected +3.0%).
The chart shows that after a multi-year high (B) of about USD 7.36 per yuan set on September 8, the rate has retreated sharply. That is, sales of dollars (B→C) for yuan increased. And the sharp increase in A→B is completely leveled out. This is a bearish sign, indicating that the bulls have completely retreated.
Now the price is near the median line of the channel. Here one can expect support, which is also strengthened by the level of 7.275, which previously served as resistance.
Let’s say that if a rebound C→D occurs (its probability is indicated by the long lower shadows on the candles on September 14-15), then by its dynamics it will be possible to judge the sustainability of the initiative that the bears have taken. If the rebound is 50% of the momentum (B→C), this will confirm the change in sentiment to bearish, and then we can expect that sellers will be able to put pressure on the rate so that it will decline to the lower border of the channel.
And then the picture will be even more bearish, because a head-and-shoulders pattern will form on the chart along the 0-B-D vertices. Provided the positive news background regarding the Chinese economy continues, we will be able to witness the formation of a stable bearish trend in favor of the yuan.
To benefit from currency fluctuations, consider enlisting the services of a trusted broker like FXOpen.
CFDs are complex instruments and come with a high risk of losing your money.
This article represents the opinion of the Companies operating under the FXOpen brand only. It is not to be construed as an offer, solicitation, or recommendation with respect to products and services provided by the Companies operating under the FXOpen brand, nor is it to be considered financial advice.
#MarketNews #marketanalysis #XAUUSD
Weekly Market Wrap With Gary Thomson: GBP/USD, DOLLAR TRYING TO UPWARD, GOLD PRICE EYES RECOVERY.
Get the latest scoop on the week's hottest headlines, all in one convenient video. Join Gary Thomson, the COO of FXOpen UK, as he breaks down the most significant news reports and shares his expert insights.
🔸 GBP/USD analysis: Price sets a minimum of 3 months after GDP news
🔸 Dollar trying to resume upward movement after rise in core CPI
🔸 Gold price eyes recovery while crude oil price surges
🔸 Market reaction to the ECB's decision to raise rates to 4.5%
Stay in the know and empower yourself with our short, yet power-packed video. Watch it now and stay updated with FXOpen.
Don't miss out on this invaluable opportunity to sharpen your trading skills and make informed decisions.
https://cutt.ly/BwxZyZDb
To take advantage of price fluctuations in the foreign exchange markets, consider enlisting the services of a reliable broker like FXOpen.
⚠️
This forecast represents FXOpen Companies opinion only, it should not be construed as an offer, invitation or recommendation in respect to FXOpen Companies products and services or as financial advice
Weekly Market Wrap With Gary Thomson: GBP/USD, DOLLAR TRYING TO UPWARD, GOLD PRICE EYES RECOVERY.
Get the latest scoop on the week's hottest headlines, all in one convenient video. Join Gary Thomson, the COO of FXOpen UK, as he breaks down the most significant news reports and shares his expert insights.
🔸 GBP/USD analysis: Price sets a minimum of 3 months after GDP news
🔸 Dollar trying to resume upward movement after rise in core CPI
🔸 Gold price eyes recovery while crude oil price surges
🔸 Market reaction to the ECB's decision to raise rates to 4.5%
Stay in the know and empower yourself with our short, yet power-packed video. Watch it now and stay updated with FXOpen.
Don't miss out on this invaluable opportunity to sharpen your trading skills and make informed decisions.
https://cutt.ly/BwxZyZDb
To take advantage of price fluctuations in the foreign exchange markets, consider enlisting the services of a reliable broker like FXOpen.
⚠️
This forecast represents FXOpen Companies opinion only, it should not be construed as an offer, invitation or recommendation in respect to FXOpen Companies products and services or as financial advice
YouTube
Weekly Market Wrap With Gary Thomson: GBP/USD, DOLLAR TRYING TO UPWARD, GOLD PRICE EYES RECOVERY.
Get the latest scoop on the week's hottest headlines, all in one convenient video. Join Gary Thomson, the COO of FXOpen UK, as he breaks down the most significant news reports and shares his expert insights.
- GBP/USD analysis: Price sets a minimum of 3…
- GBP/USD analysis: Price sets a minimum of 3…
#MarketNews #marketanalysis #tradingforex
USD/CAD Analysis: Canadian Dollar Strengthens Ahead of Inflation News
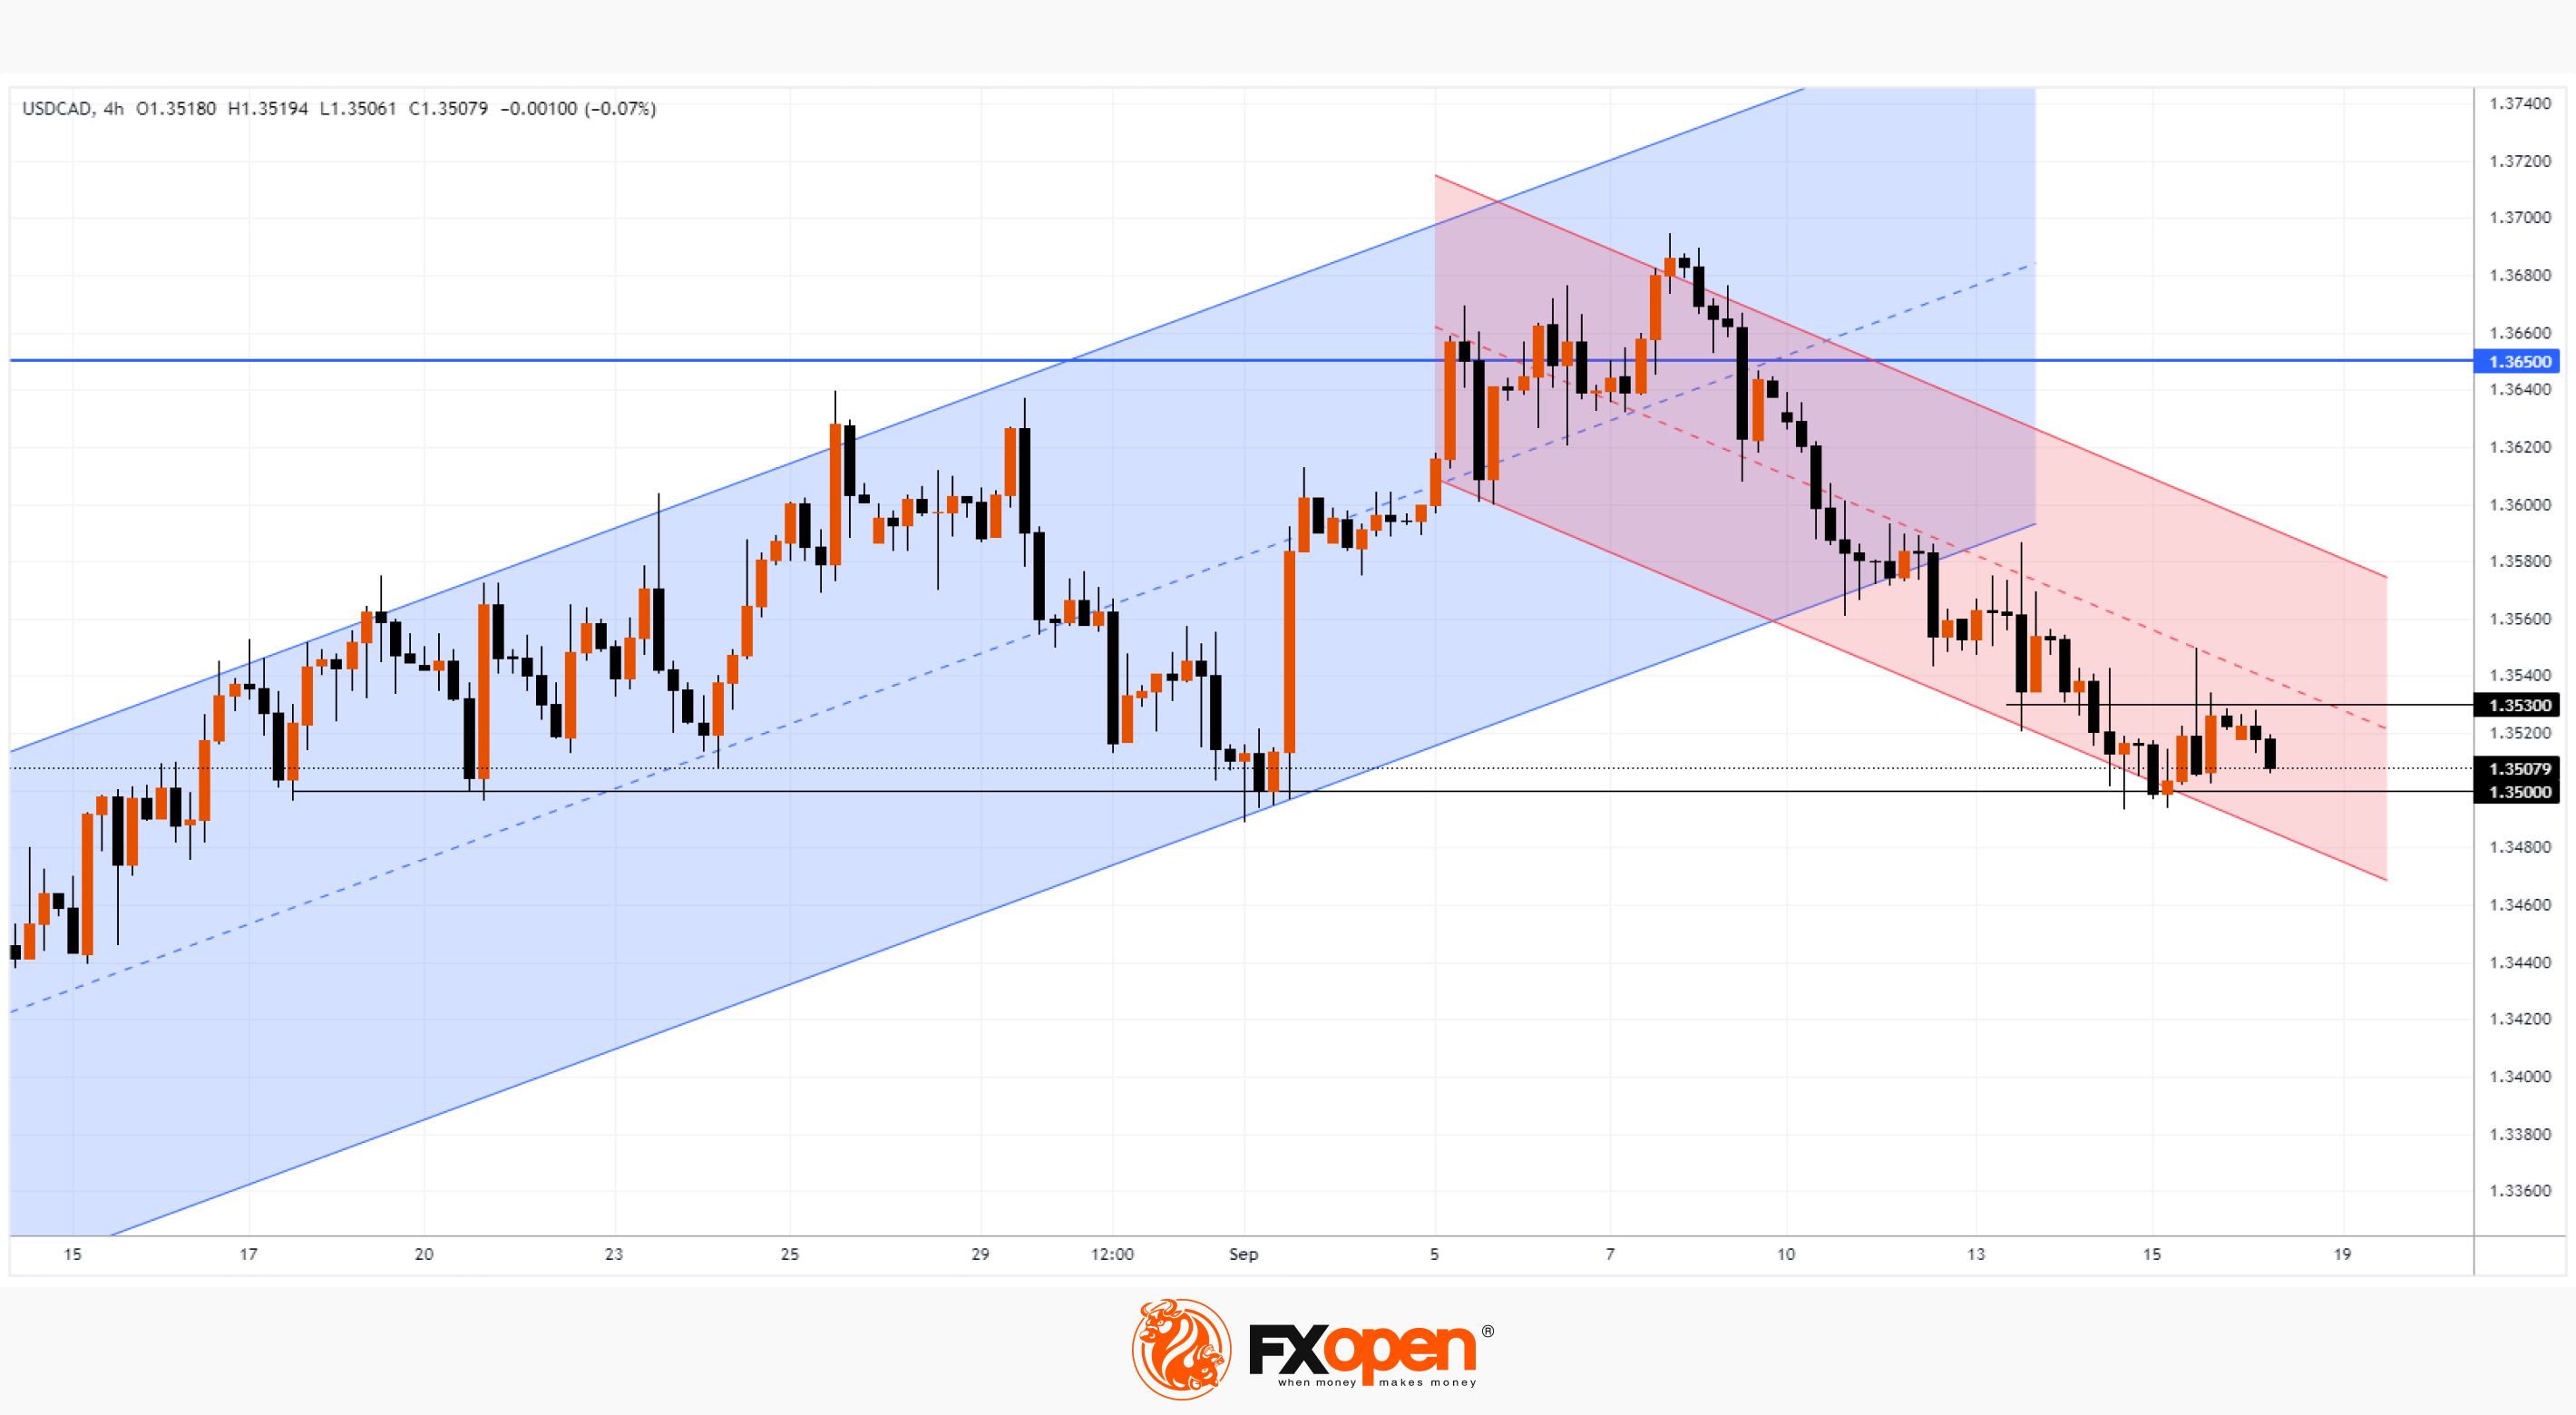
On September 7, we wrote that the level of 1.365 could serve as resistance, from which the price will form a bearish reversal.
As the USD/CAD chart shows, the rate dropped from this resistance to the psychological level of 1.3500, which served as support.
Wherein:
→ The bullish trend (shown by the blue channel) is broken. Facing resistance at 1.365, the bulls failed to reach the upper boundary of the channel, which was a sign of weakening uptrend. One could also observe bearish divergences on a number of indicators.
→ The price at the beginning of the week is in a downward trend, which is shown by the red channel.
→ The price formed a rebound from the psychological level of 1.3500 at the end of last week, but the momentum on the rebound quickly faded. And a return to support at 1.35 means the inability of the bulls to seize the initiative and the unrelenting pressure of the bears.
→ Level 1.353, which served as local support, now resists price growth. The long upper shadow on the September 15 candle confirms bearish pressure.
Thus, support 1.35 is in danger of being broken. And perhaps a successful bear attack will occur tomorrow at 15:30 GMT+3, when news on inflation in Canada will be published. It is expected to remain at 3.7%, however, given the significant increase in energy prices in August, surprises may occur that will affect the current balance of supply and demand in the USD/CAD market.
To benefit from trends in the currency markets, consider enlisting the services of a trusted broker like FXOpen.
CFDs are complex instruments and come with a high risk of losing your money.
This article represents the opinion of the Companies operating under the FXOpen brand only. It is not to be construed as an offer, solicitation, or recommendation with respect to products and services provided by the Companies operating under the FXOpen brand, nor is it to be considered financial advice.
USD/CAD Analysis: Canadian Dollar Strengthens Ahead of Inflation News
On September 7, we wrote that the level of 1.365 could serve as resistance, from which the price will form a bearish reversal.
As the USD/CAD chart shows, the rate dropped from this resistance to the psychological level of 1.3500, which served as support.
Wherein:
→ The bullish trend (shown by the blue channel) is broken. Facing resistance at 1.365, the bulls failed to reach the upper boundary of the channel, which was a sign of weakening uptrend. One could also observe bearish divergences on a number of indicators.
→ The price at the beginning of the week is in a downward trend, which is shown by the red channel.
→ The price formed a rebound from the psychological level of 1.3500 at the end of last week, but the momentum on the rebound quickly faded. And a return to support at 1.35 means the inability of the bulls to seize the initiative and the unrelenting pressure of the bears.
→ Level 1.353, which served as local support, now resists price growth. The long upper shadow on the September 15 candle confirms bearish pressure.
Thus, support 1.35 is in danger of being broken. And perhaps a successful bear attack will occur tomorrow at 15:30 GMT+3, when news on inflation in Canada will be published. It is expected to remain at 3.7%, however, given the significant increase in energy prices in August, surprises may occur that will affect the current balance of supply and demand in the USD/CAD market.
To benefit from trends in the currency markets, consider enlisting the services of a trusted broker like FXOpen.
CFDs are complex instruments and come with a high risk of losing your money.
This article represents the opinion of the Companies operating under the FXOpen brand only. It is not to be construed as an offer, solicitation, or recommendation with respect to products and services provided by the Companies operating under the FXOpen brand, nor is it to be considered financial advice.
#MarketNews #ripple #crypto
Cryptocurrency Prices Rise on SEC Rumours
Various media outlets report the opinion that SEC Chairman Gary Gensler expressed in a personal conversation. He allegedly intends to approve applications for the creation of ETFs related to the cryptocurrency spot markets. Such applications were submitted by BlackRock, Invesco, WisdomTree, Valkyrie and other respectable funds. But for now, the SEC's decision on the applications has been delayed.
At the same time, it is reported that by giving the go-ahead to applications, Gary Gensler can thereby gain loyalty from the funds, and after the end of his period as head of the SEC, go to work for one of them.
Against the backdrop of the information mentioned, the crypto markets perked up — the prices of bitcoin, Ether and other assets rose by approximately 3% in a few hours. However, it is unlikely that such rumors can become a driver for creating a sustainable trend.
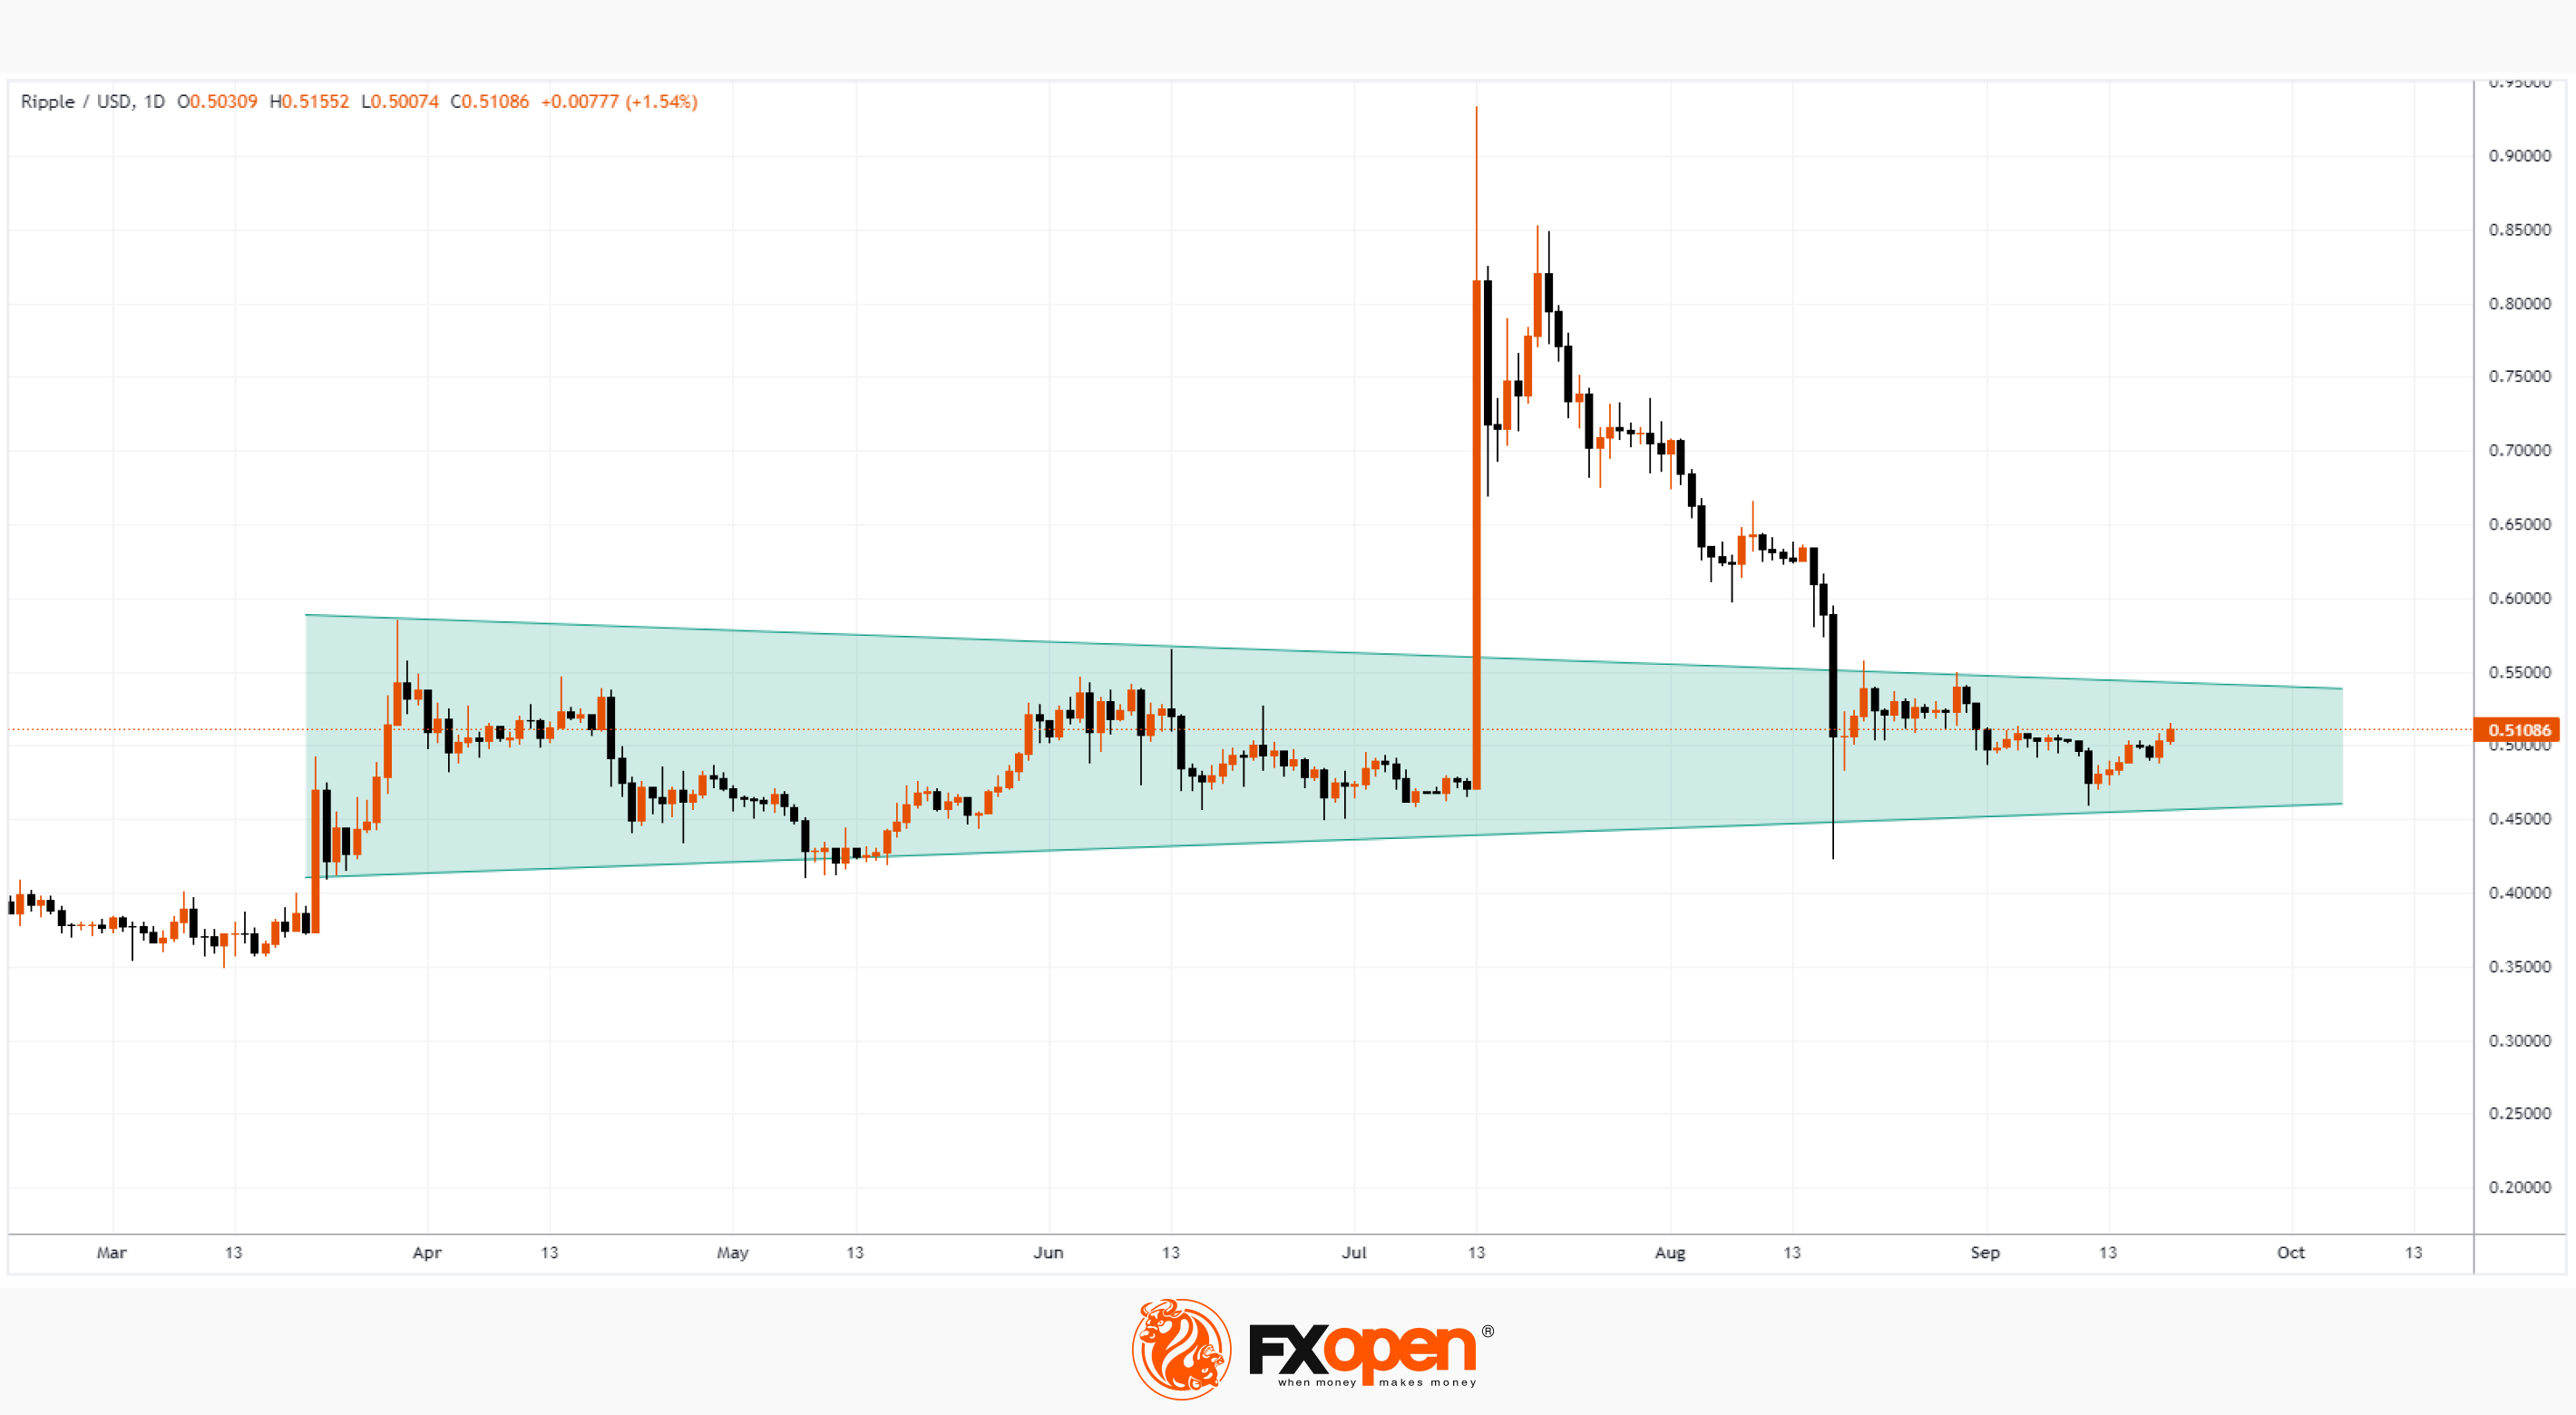
Pay attention to the XRP/USD chart. After the court ruling in favour of Ripple Labs in a dispute with the SEC, the price of the XRP token soared to 0.9. However, when the strong positive emotions dissipated, the price of the token again returned to the area from which it took off. At the same time, at the moment the price even dropped below that area, piercing the level of 0.45 (constituting about 50% of the price recorded at the peak of growth), which probably led to the activation of a large number of stop losses set under the wide bullish candle.
This course of events indicates that, under the influence of faith, hope and news, the price of an exchange asset can make significant deviations from its fair intrinsic value. But when the momentum fades, the pendulum will swing in the opposite direction, which is quite clearly evident in the cryptocurrency markets.
Regarding XRP/USD, the price of the token may continue its consolidation movement within the triangle shown in green. Perhaps the half-dollar level for XRP is close to the current fair value of the asset.
To benefit from fluctuations in cryptocurrency prices, consider enlisting the services of a trusted broker like FXOpen.
CFDs are complex instruments and come with a high risk of losing your money.
This article represents the opinion of the Companies operating under the FXOpen brand only. It is not to be construed as an offer, solicitation, or recommendation with respect to products and services provided by the Companies operating under the FXOpen brand, nor is it to be considered financial advice.
At FXOpen UK and FXOpen AU, Cryptocurrency CFDs are only available for trading by those clients categorised as Professional clients under FCA Rules and Professional clients under ASIC Rules, respectively. They are not available for trading by Retail clients.
Cryptocurrency Prices Rise on SEC Rumours
Various media outlets report the opinion that SEC Chairman Gary Gensler expressed in a personal conversation. He allegedly intends to approve applications for the creation of ETFs related to the cryptocurrency spot markets. Such applications were submitted by BlackRock, Invesco, WisdomTree, Valkyrie and other respectable funds. But for now, the SEC's decision on the applications has been delayed.
At the same time, it is reported that by giving the go-ahead to applications, Gary Gensler can thereby gain loyalty from the funds, and after the end of his period as head of the SEC, go to work for one of them.
Against the backdrop of the information mentioned, the crypto markets perked up — the prices of bitcoin, Ether and other assets rose by approximately 3% in a few hours. However, it is unlikely that such rumors can become a driver for creating a sustainable trend.
Pay attention to the XRP/USD chart. After the court ruling in favour of Ripple Labs in a dispute with the SEC, the price of the XRP token soared to 0.9. However, when the strong positive emotions dissipated, the price of the token again returned to the area from which it took off. At the same time, at the moment the price even dropped below that area, piercing the level of 0.45 (constituting about 50% of the price recorded at the peak of growth), which probably led to the activation of a large number of stop losses set under the wide bullish candle.
This course of events indicates that, under the influence of faith, hope and news, the price of an exchange asset can make significant deviations from its fair intrinsic value. But when the momentum fades, the pendulum will swing in the opposite direction, which is quite clearly evident in the cryptocurrency markets.
Regarding XRP/USD, the price of the token may continue its consolidation movement within the triangle shown in green. Perhaps the half-dollar level for XRP is close to the current fair value of the asset.
To benefit from fluctuations in cryptocurrency prices, consider enlisting the services of a trusted broker like FXOpen.
CFDs are complex instruments and come with a high risk of losing your money.
This article represents the opinion of the Companies operating under the FXOpen brand only. It is not to be construed as an offer, solicitation, or recommendation with respect to products and services provided by the Companies operating under the FXOpen brand, nor is it to be considered financial advice.
At FXOpen UK and FXOpen AU, Cryptocurrency CFDs are only available for trading by those clients categorised as Professional clients under FCA Rules and Professional clients under ASIC Rules, respectively. They are not available for trading by Retail clients.
#marketanalysis #sp500 #stockmarket
Market Analysis: S&P 500 under Pressure ahead of Federal Reserve Meeting
The decision on the base interest rate will be published tomorrow at 21:00 GMT+3, and Powell will hold a press conference at 21:30. Although most experts, as reported by the media, expect that the current rate will remain, market participants will closely monitor the Federal Reserve's assessment of the current situation, which includes new data on inflation and the labour market. It is possible that there will be another rate increase before the end of the year.
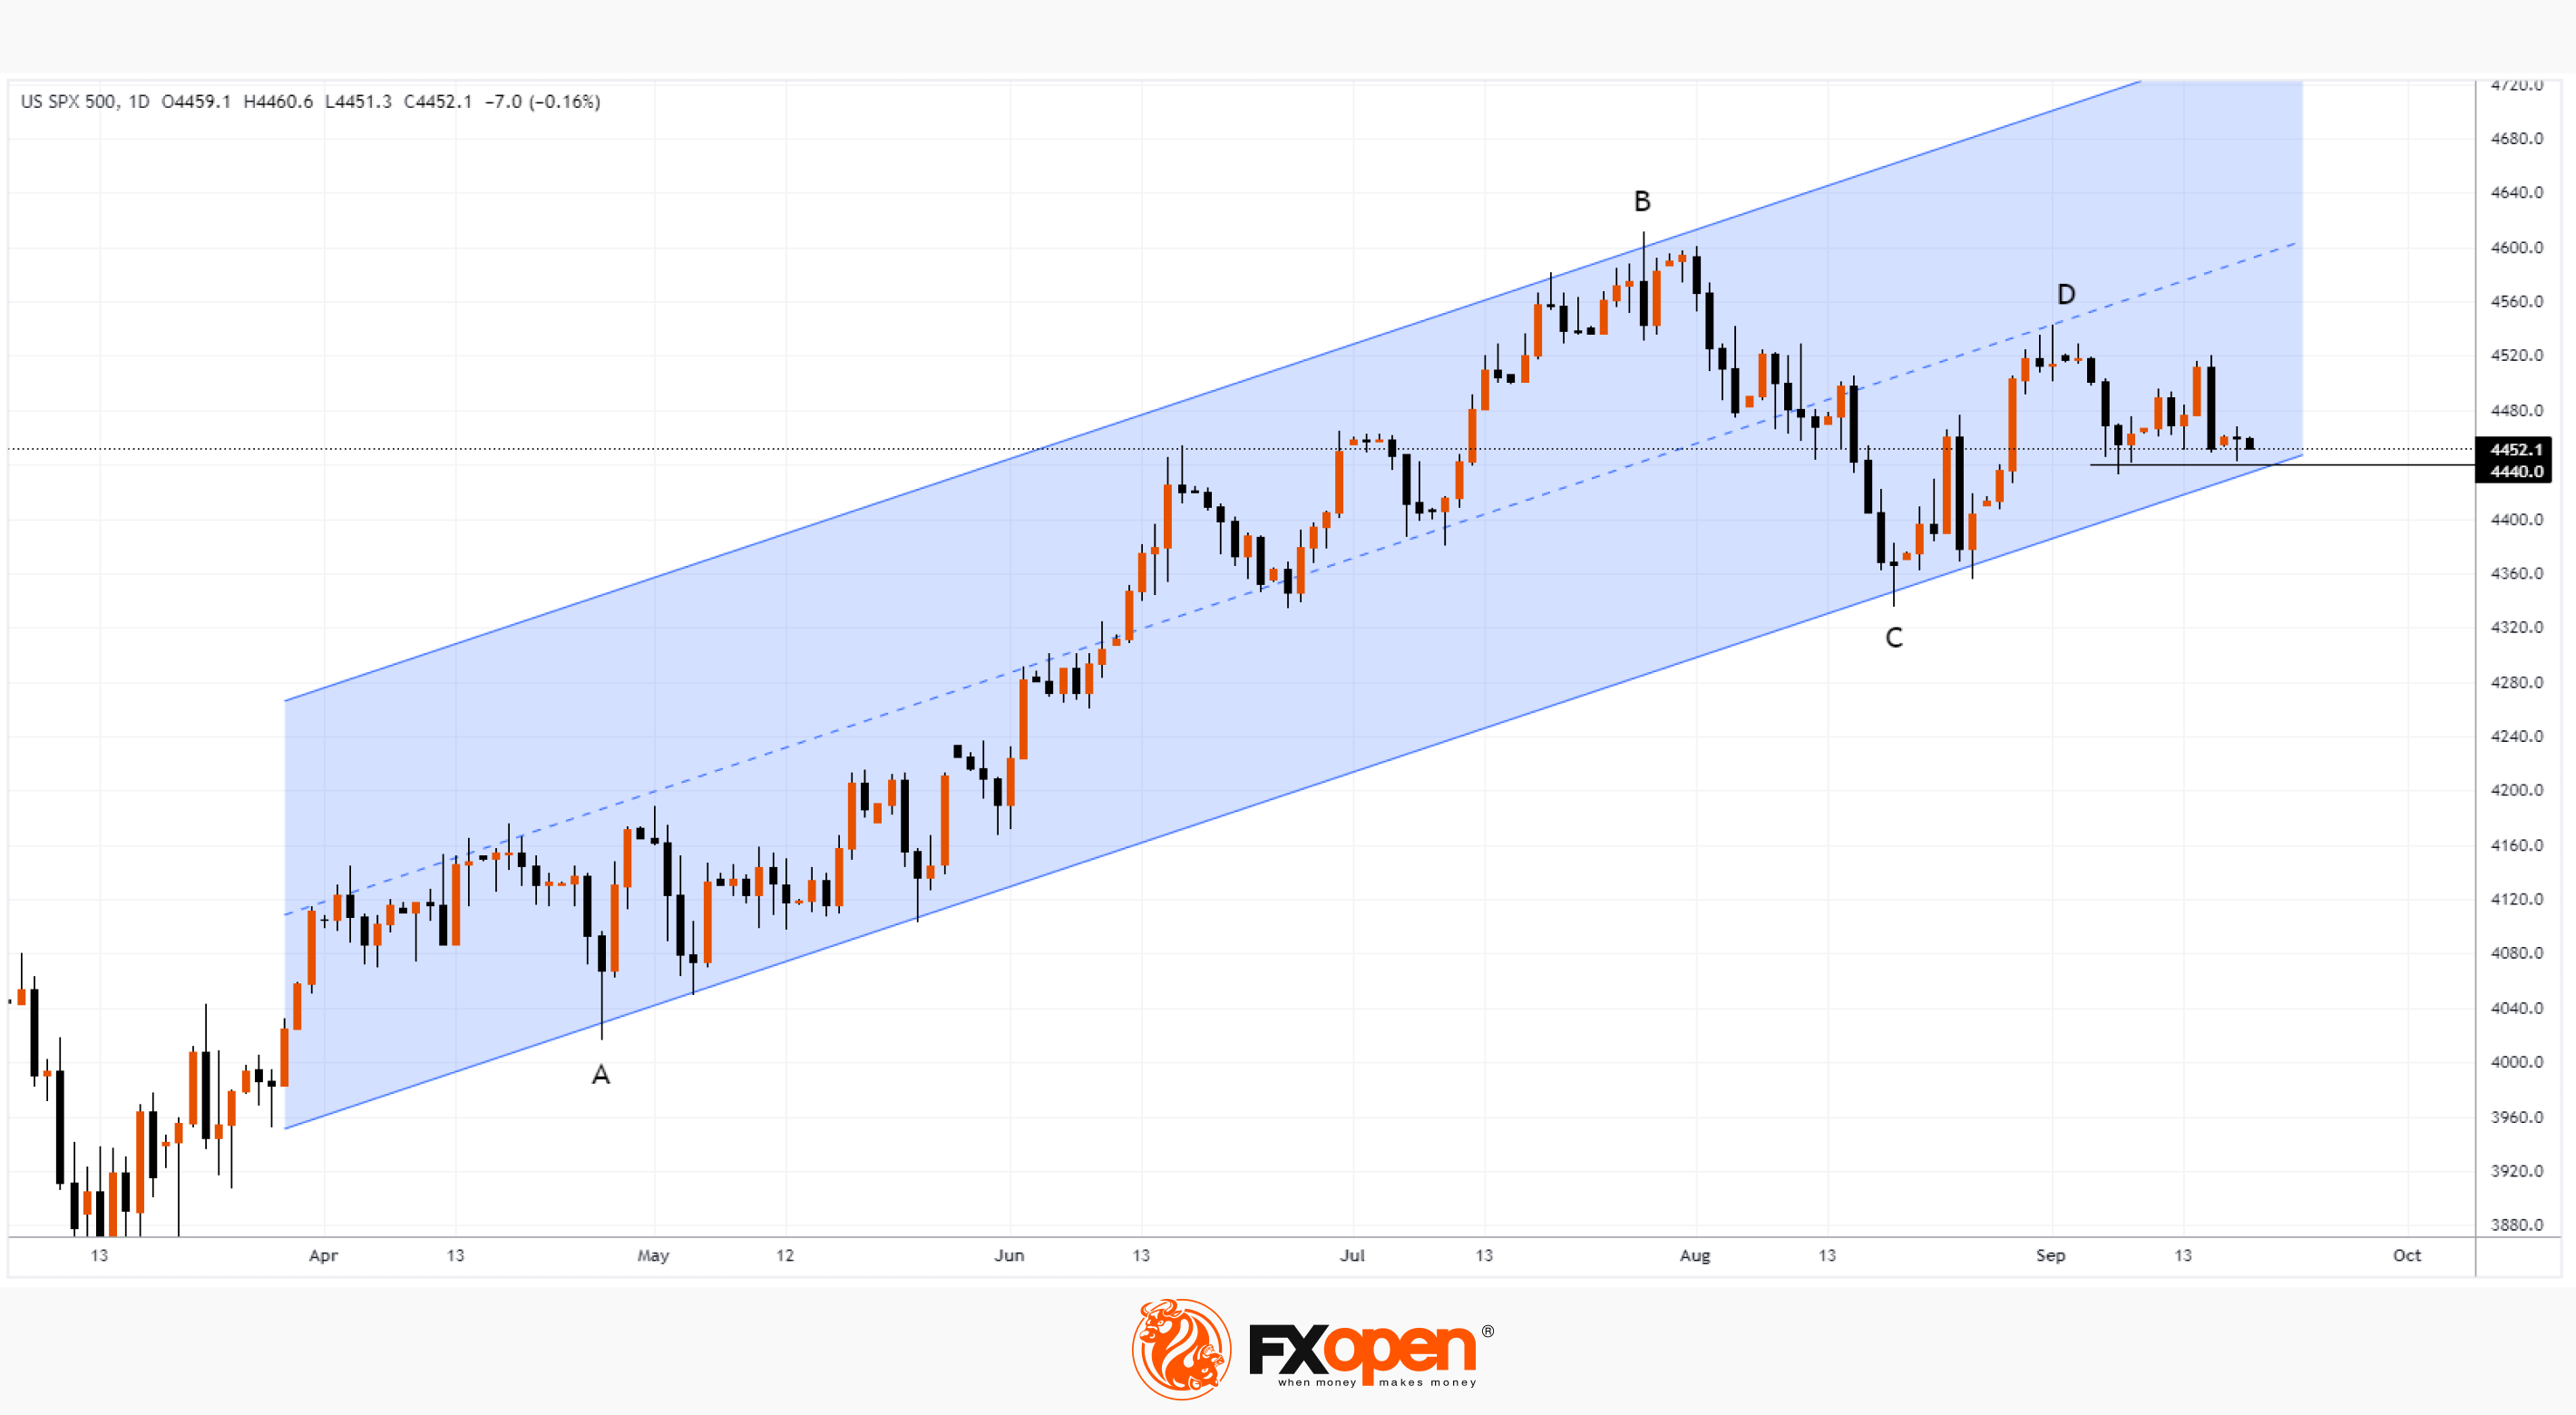
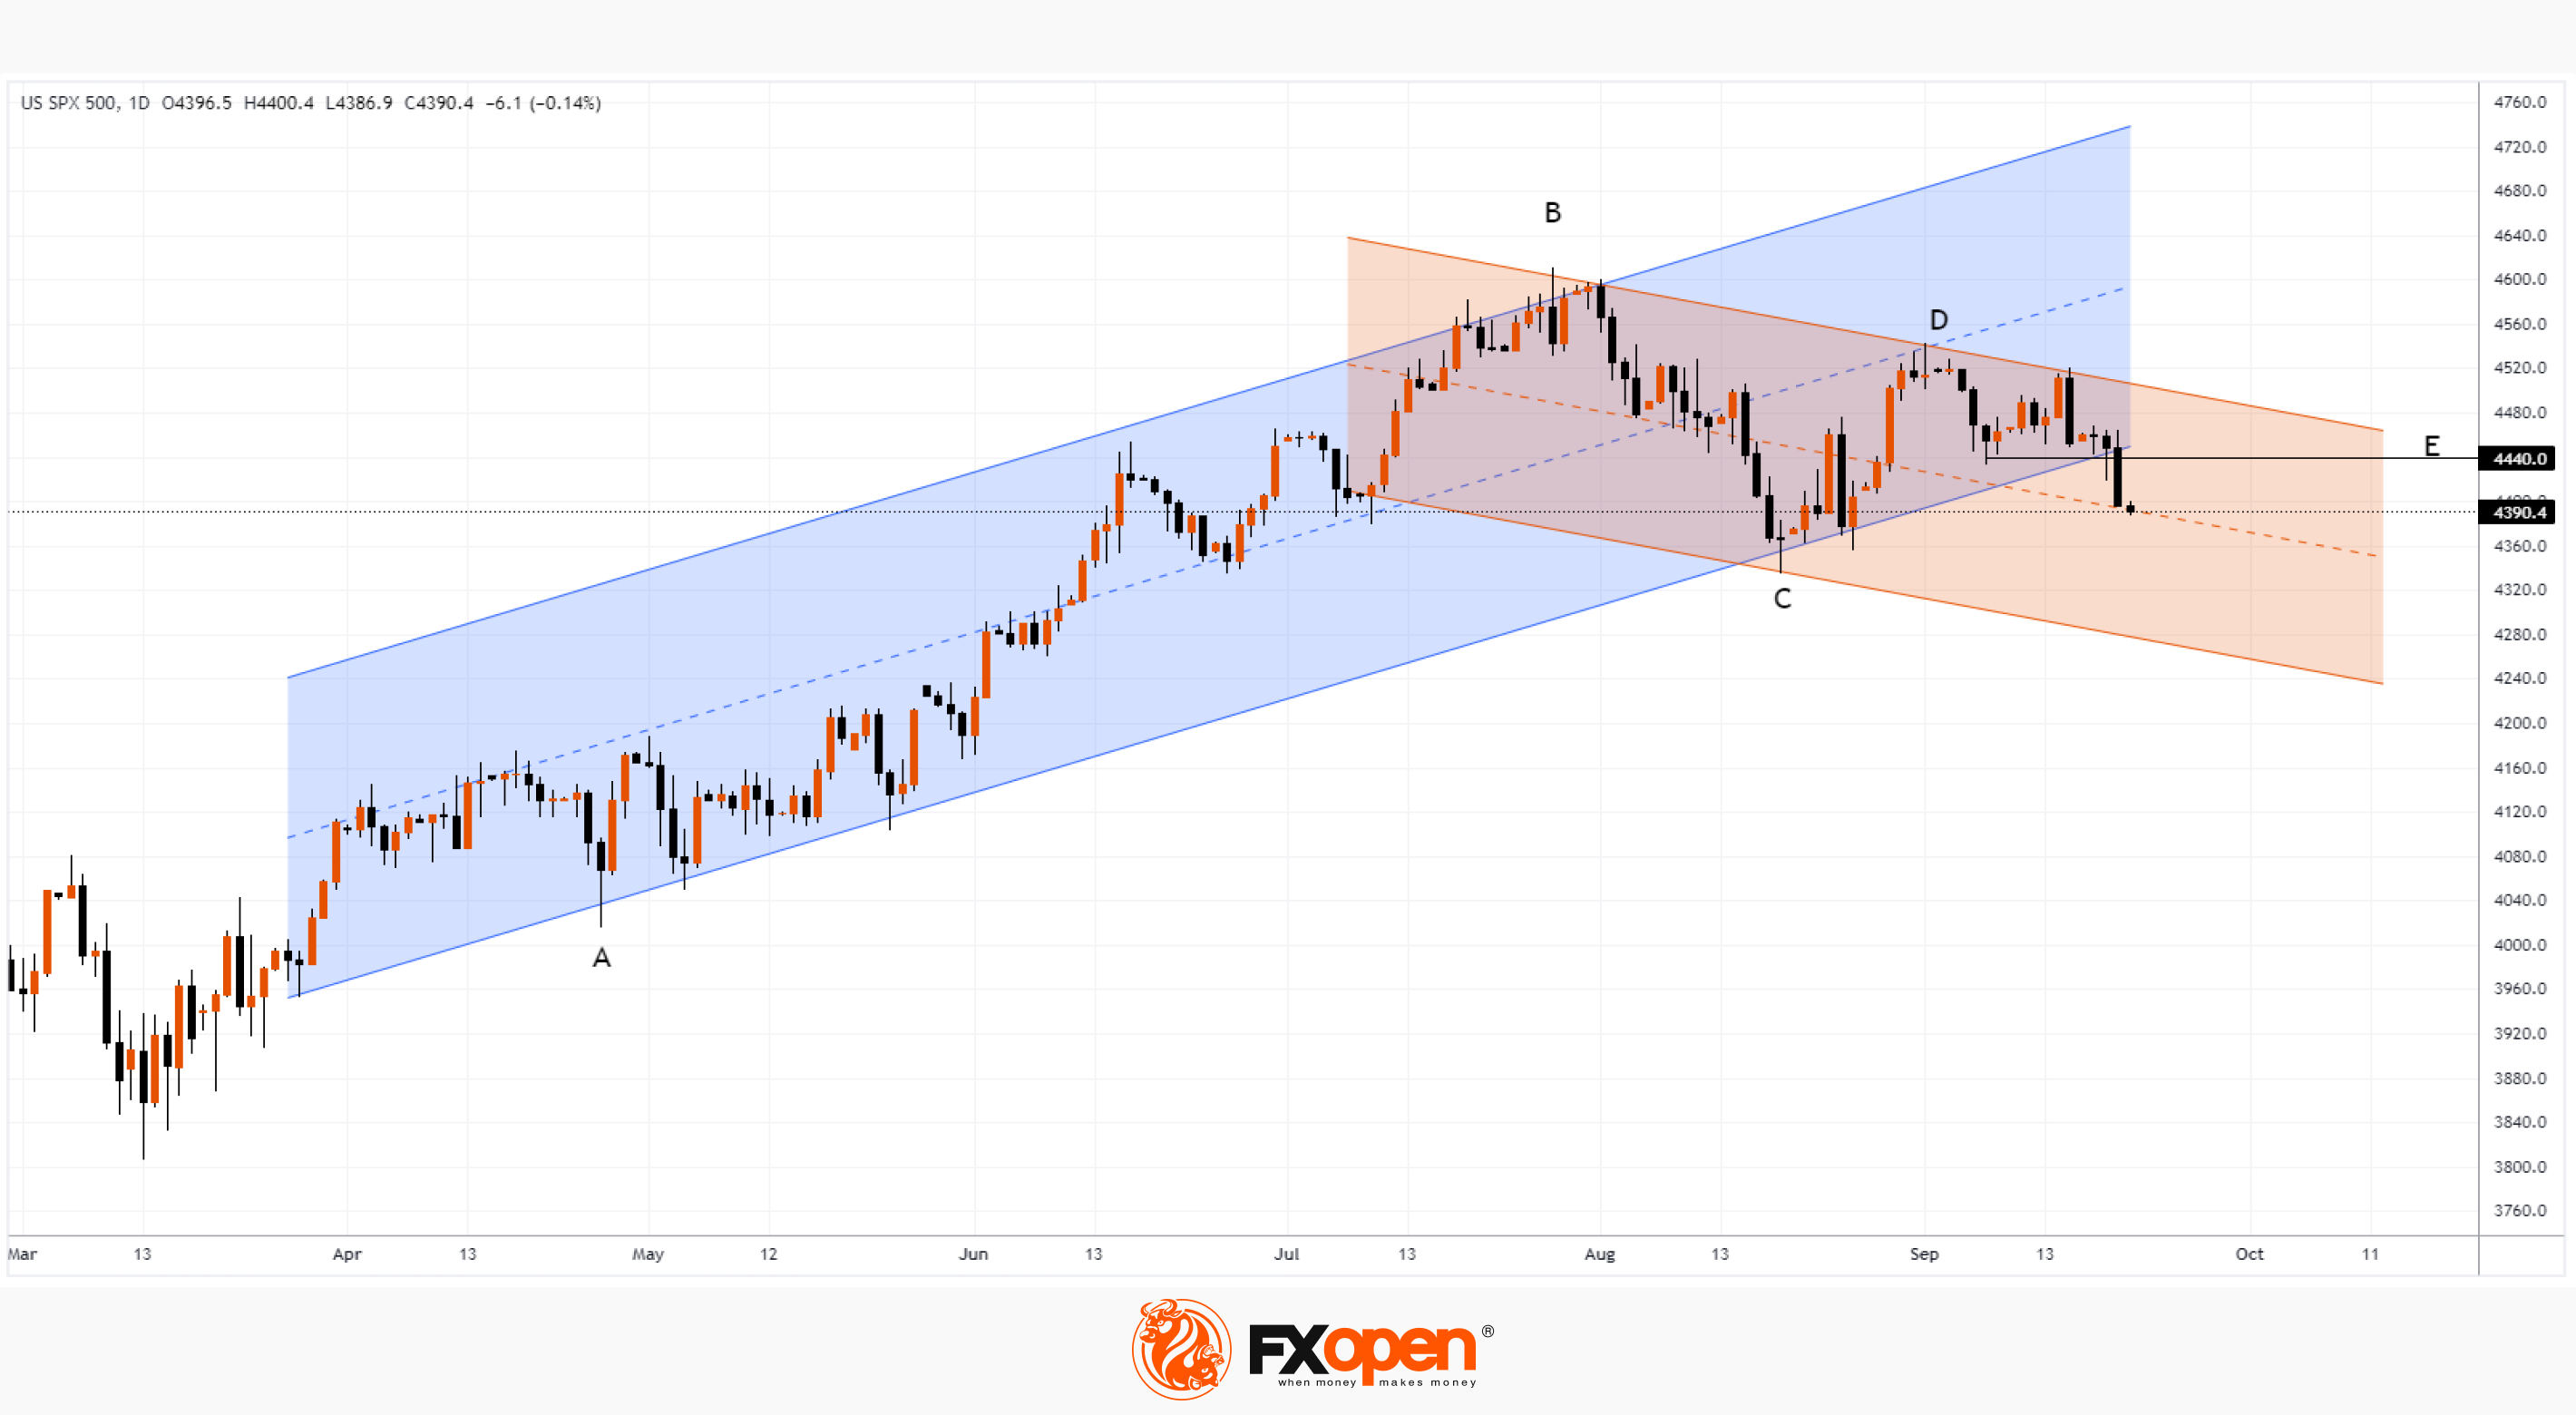
Meanwhile, the S&P 500 chart shows the market under pressure in mid-September, although the overall picture appears balanced.
The balance of supply and demand is indicated by the fact that the movement B→C is approximately 50% of the movement A→B. And the C→D movement is approximately 50% of the B→C movement. That is, fluctuations die out as buyers and sellers converge.
The price is still within the ascending channel (shown in blue), but it is possible that during tomorrow's news announcement from the Federal Reserve there will be an attempt by the bears to break through it.
Bearish arguments:
→ On August 31 - September 1, on the CME exchange, where E-mini futures for the S&P 500 index are traded, volumes below average were recorded, after which the price decreased with an increase in volumes on September 6 — this can be interpreted as if above 4,560 the market is experiencing a shortage of demand. And the revival of the market with a decrease in price is a sign of bearish sentiment.
→ Level 4,560 was tested last week, on Thursday. After which there was a sharp decline with an increase in volume on Friday. Similar dynamics indicating that the market is under bearish pressure ahead of the meeting.
If the pressure leads to a new downward impulse, the 4,440 level could become resistance for the bulls' attempts to return the price to the ascending channel.
To benefit from price fluctuations in global financial markets, consider enlisting the services of a trusted broker like FXOpen.
CFDs are complex instruments and come with a high risk of losing your money.
This article represents the opinion of the Companies operating under the FXOpen brand only. It is not to be construed as an offer, solicitation, or recommendation with respect to products and services provided by the Companies operating under the FXOpen brand, nor is it to be considered financial advice.
Market Analysis: S&P 500 under Pressure ahead of Federal Reserve Meeting
The decision on the base interest rate will be published tomorrow at 21:00 GMT+3, and Powell will hold a press conference at 21:30. Although most experts, as reported by the media, expect that the current rate will remain, market participants will closely monitor the Federal Reserve's assessment of the current situation, which includes new data on inflation and the labour market. It is possible that there will be another rate increase before the end of the year.
Meanwhile, the S&P 500 chart shows the market under pressure in mid-September, although the overall picture appears balanced.
The balance of supply and demand is indicated by the fact that the movement B→C is approximately 50% of the movement A→B. And the C→D movement is approximately 50% of the B→C movement. That is, fluctuations die out as buyers and sellers converge.
The price is still within the ascending channel (shown in blue), but it is possible that during tomorrow's news announcement from the Federal Reserve there will be an attempt by the bears to break through it.
Bearish arguments:
→ On August 31 - September 1, on the CME exchange, where E-mini futures for the S&P 500 index are traded, volumes below average were recorded, after which the price decreased with an increase in volumes on September 6 — this can be interpreted as if above 4,560 the market is experiencing a shortage of demand. And the revival of the market with a decrease in price is a sign of bearish sentiment.
→ Level 4,560 was tested last week, on Thursday. After which there was a sharp decline with an increase in volume on Friday. Similar dynamics indicating that the market is under bearish pressure ahead of the meeting.
If the pressure leads to a new downward impulse, the 4,440 level could become resistance for the bulls' attempts to return the price to the ascending channel.
To benefit from price fluctuations in global financial markets, consider enlisting the services of a trusted broker like FXOpen.
CFDs are complex instruments and come with a high risk of losing your money.
This article represents the opinion of the Companies operating under the FXOpen brand only. It is not to be construed as an offer, solicitation, or recommendation with respect to products and services provided by the Companies operating under the FXOpen brand, nor is it to be considered financial advice.
#marketanalysis #stockmarket #inflation
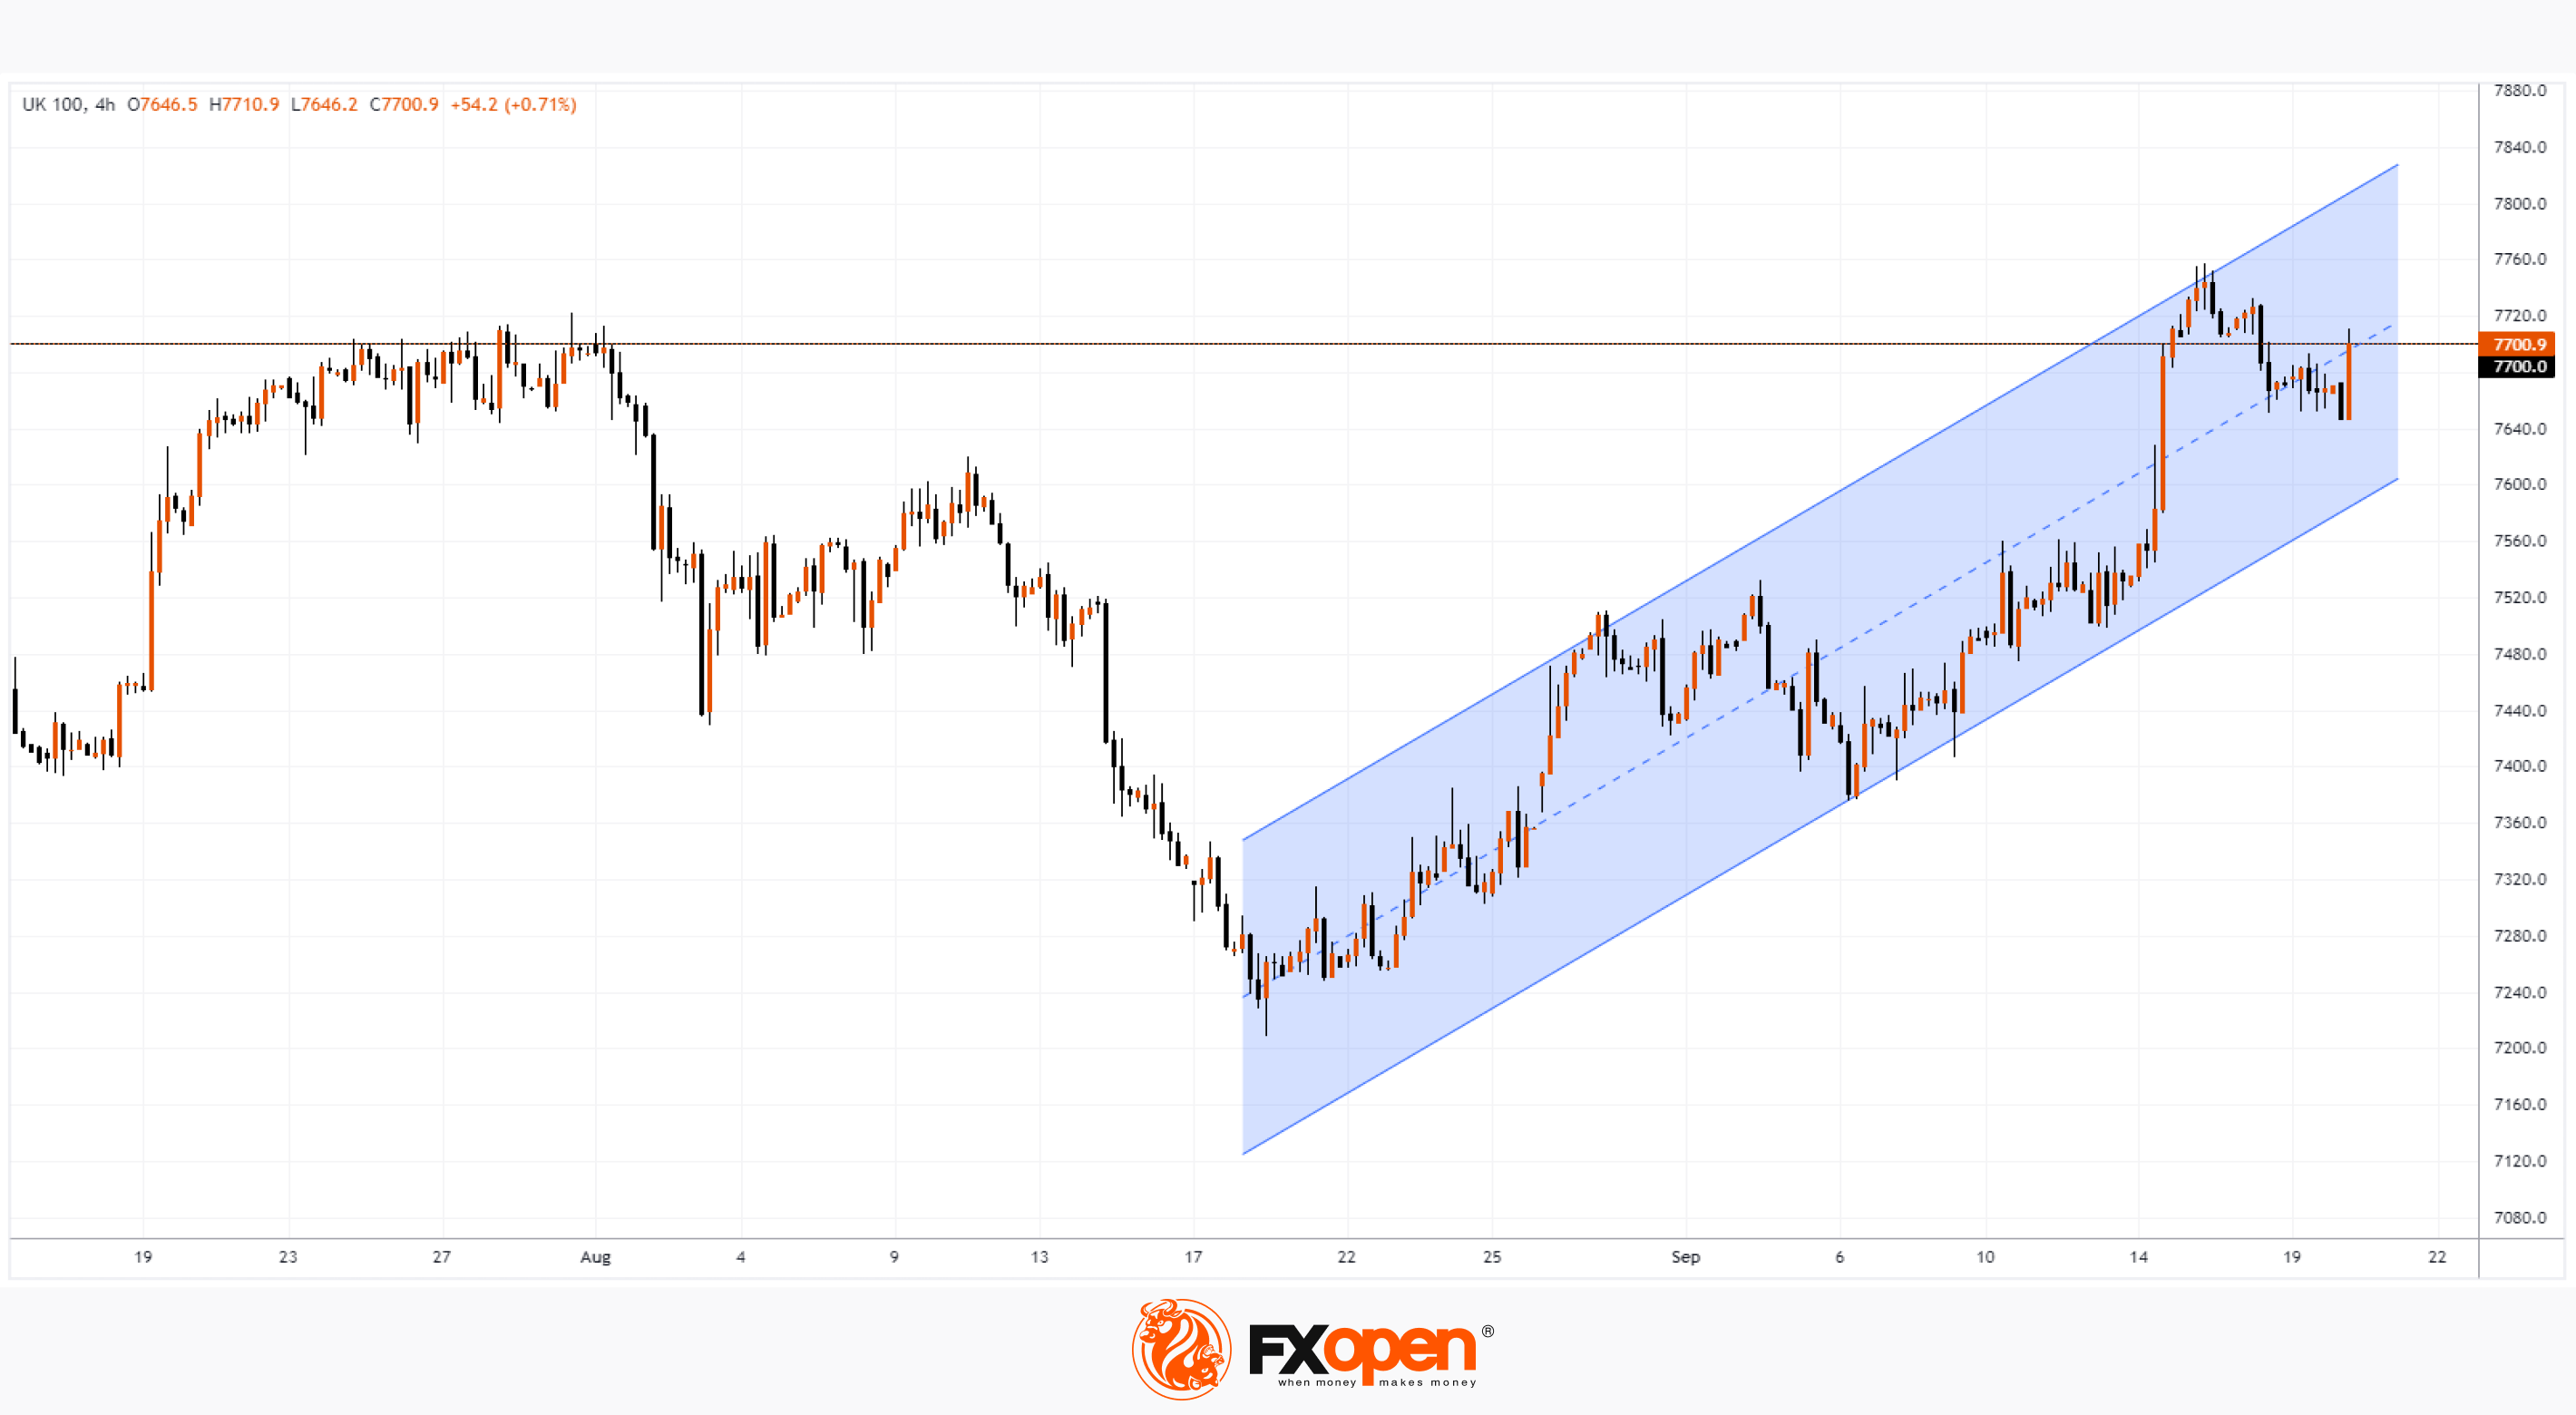
Market Analysis: UK Stock Market Rises amid Inflation News
According to data published this morning for August from the UK Office for National Statistics, the CPI index amounted to 6.7% in annual terms (expected 7.0%, value a month ago = 6.8%).
That is, the data shows that although inflation remains high (above other G7 countries), the trend points to a slowdown. This is the 6th CPI value in a row that has either decreased or remained the same.
However, there is still a long way to go before reaching the target values (a value of about 2% is considered normal).
Here’s how markets reacted to inflation news:
→ depreciation of the GBP/USD exchange rate to another September low. The rate approached an important low at the end of May;
→ growth of the UK FTSE stock index (the 4-hour chart of which is presented for analysis).
Bullish arguments:
→ news about declining inflation will help the bulls gain a foothold above the psychological level of 7,700
→ the price is within the ascending channel (shown in blue). A confident return of the price to its upper half will indicate the strength of demand.
Bearish arguments:
→ Level 7,700 still offers resistance. At the end of July, the bears won a landslide victory here.
→ Exceeding the July high may be just a false breakout. It is possible that after the initial positive reaction to lower inflation, market consensus will indicate that the fair price for the FTSE (UK100) index is still below 7,700. This will be similar to how the stock index of 50 European shares reacted to the ECB decision last week (quick exhaustion of bullish momentum followed by bearish momentum).
Be prepared for a surge in volatility today at 21:00 GMT+3 amid the publication of news from the Federal Reserve.
To benefit from fluctuations in financial markets, consider enlisting the services of a trusted broker like FXOpen.
CFDs are complex instruments and come with a high risk of losing your money.
This article represents the opinion of the Companies operating under the FXOpen brand only. It is not to be construed as an offer, solicitation, or recommendation with respect to products and services provided by the Companies operating under the FXOpen brand, nor is it to be considered financial advice.
Market Analysis: UK Stock Market Rises amid Inflation News
According to data published this morning for August from the UK Office for National Statistics, the CPI index amounted to 6.7% in annual terms (expected 7.0%, value a month ago = 6.8%).
That is, the data shows that although inflation remains high (above other G7 countries), the trend points to a slowdown. This is the 6th CPI value in a row that has either decreased or remained the same.
However, there is still a long way to go before reaching the target values (a value of about 2% is considered normal).
Here’s how markets reacted to inflation news:
→ depreciation of the GBP/USD exchange rate to another September low. The rate approached an important low at the end of May;
→ growth of the UK FTSE stock index (the 4-hour chart of which is presented for analysis).
Bullish arguments:
→ news about declining inflation will help the bulls gain a foothold above the psychological level of 7,700
→ the price is within the ascending channel (shown in blue). A confident return of the price to its upper half will indicate the strength of demand.
Bearish arguments:
→ Level 7,700 still offers resistance. At the end of July, the bears won a landslide victory here.
→ Exceeding the July high may be just a false breakout. It is possible that after the initial positive reaction to lower inflation, market consensus will indicate that the fair price for the FTSE (UK100) index is still below 7,700. This will be similar to how the stock index of 50 European shares reacted to the ECB decision last week (quick exhaustion of bullish momentum followed by bearish momentum).
Be prepared for a surge in volatility today at 21:00 GMT+3 amid the publication of news from the Federal Reserve.
To benefit from fluctuations in financial markets, consider enlisting the services of a trusted broker like FXOpen.
CFDs are complex instruments and come with a high risk of losing your money.
This article represents the opinion of the Companies operating under the FXOpen brand only. It is not to be construed as an offer, solicitation, or recommendation with respect to products and services provided by the Companies operating under the FXOpen brand, nor is it to be considered financial advice.
#marketanalysis #sp500 #stockmarket
Market Analysis: S&P 500 Falls amid News from the Fed
Yesterday was an important evening that had an impact on many financial markets. The Federal Reserve (as expected) kept the rate at the same level. According to Powell:
→ The full effect of tightening the monetary policy has yet to be felt.
→ [They] will continue to act cautiously, basing further decisions on incoming statistical data.
→ Inflation is much higher than the target.
Will the Fed tighten monetary policy further? Opinions are divided. JP Morgan analysts believe that the rate hike cycle is over. On the contrary, Vanguard analysts believe that rates will have to be raised again (and even more than once).
Perhaps the Fed's repeated rhetoric no longer looks like a sign of confidence? One way or another, the US stock market fell sharply, making the recession scenario more pressing.
On September 19, we wrote that the market was under bearish pressure ahead of the FOMC meeting. The graph shows that they managed to realize their advantage.
Bears' arguments:
→ resistance should now be expected from the level 4,440;
→ the rising channel is broken, which not only confirms the weakness of the bulls, but may also signal the end of the boom associated with the spread of AI;
→ the decrease in the amplitude of oscillations A→B→C→D (each subsequent movement is 50% of the previous one), which was observed since the end of spring, seems to have ended, since movement below level E gives the initiative to the bears. And to remember the statistics, according to which the end of September is traditionally the worst period for the stock market.
Bulls' arguments:
→ the price of the S&P 500 may find support near the median line of the descending channel;
→ the price may find support from the 4,350 level, where the bulls had an advantage this summer.
To benefit from trends in financial markets, consider enlisting the services of a trusted broker like FXOpen.
CFDs are complex instruments and come with a high risk of losing your money.
This article represents the opinion of the Companies operating under the FXOpen brand only. It is not to be construed as an offer, solicitation, or recommendation with respect to products and services provided by the Companies operating under the FXOpen brand, nor is it to be considered financial advice.
Market Analysis: S&P 500 Falls amid News from the Fed
Yesterday was an important evening that had an impact on many financial markets. The Federal Reserve (as expected) kept the rate at the same level. According to Powell:
→ The full effect of tightening the monetary policy has yet to be felt.
→ [They] will continue to act cautiously, basing further decisions on incoming statistical data.
→ Inflation is much higher than the target.
Will the Fed tighten monetary policy further? Opinions are divided. JP Morgan analysts believe that the rate hike cycle is over. On the contrary, Vanguard analysts believe that rates will have to be raised again (and even more than once).
Perhaps the Fed's repeated rhetoric no longer looks like a sign of confidence? One way or another, the US stock market fell sharply, making the recession scenario more pressing.
On September 19, we wrote that the market was under bearish pressure ahead of the FOMC meeting. The graph shows that they managed to realize their advantage.
Bears' arguments:
→ resistance should now be expected from the level 4,440;
→ the rising channel is broken, which not only confirms the weakness of the bulls, but may also signal the end of the boom associated with the spread of AI;
→ the decrease in the amplitude of oscillations A→B→C→D (each subsequent movement is 50% of the previous one), which was observed since the end of spring, seems to have ended, since movement below level E gives the initiative to the bears. And to remember the statistics, according to which the end of September is traditionally the worst period for the stock market.
Bulls' arguments:
→ the price of the S&P 500 may find support near the median line of the descending channel;
→ the price may find support from the 4,350 level, where the bulls had an advantage this summer.
To benefit from trends in financial markets, consider enlisting the services of a trusted broker like FXOpen.
CFDs are complex instruments and come with a high risk of losing your money.
This article represents the opinion of the Companies operating under the FXOpen brand only. It is not to be construed as an offer, solicitation, or recommendation with respect to products and services provided by the Companies operating under the FXOpen brand, nor is it to be considered financial advice.
#MarketNews #XAUUSD #goldprice
Central Bank Week Shakes Up Gold Market
Yesterday, the main event of the week took place — the Federal Reserve meeting, which had a noticeable impact on the market of assets denominated in US dollars. But besides the Fed meeting, there are a number of other events this week related to central banks:
→ today at 10:30, a meeting of the Swiss National Bank took place. The interest rate remained at 1.75%, although there was a significant possibility of its increase to 2%.
→ today at 14:00 GMT+3, a decision on the Bank of England interest rate is expected;
→ news from the Central Bank of Japan is planned for tomorrow morning — there may be surprises.
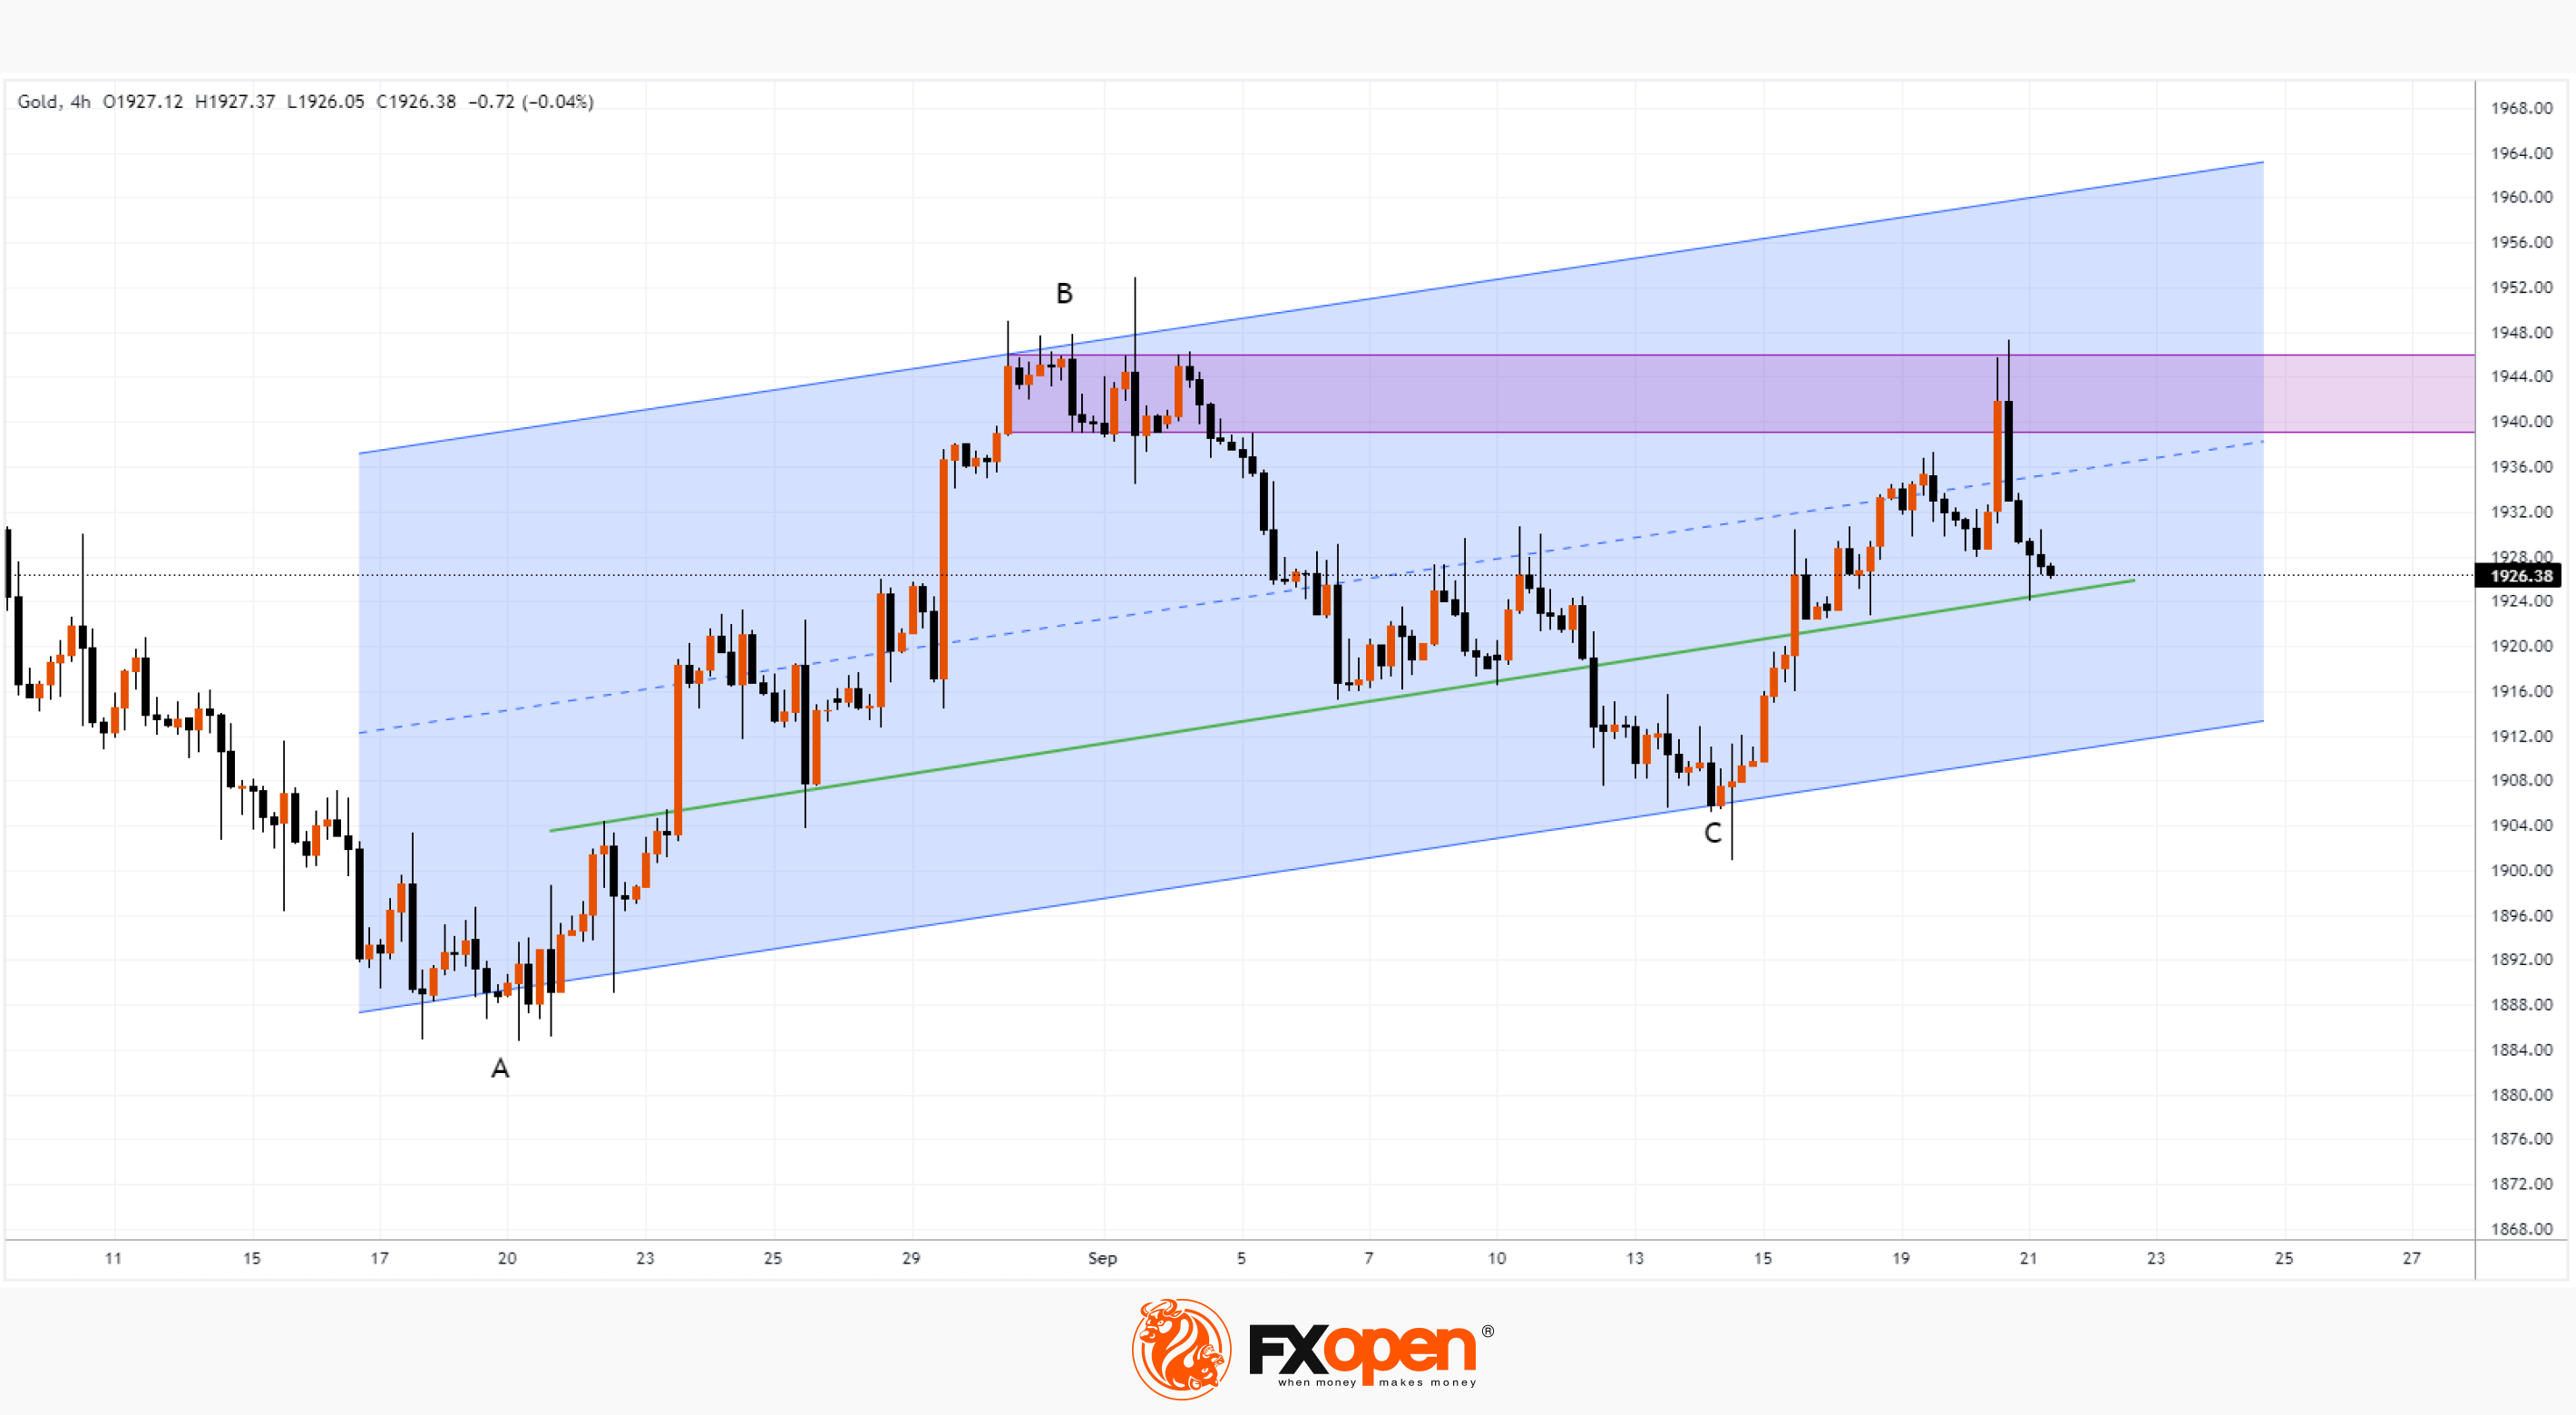
An important asset that is affected by the decisions of central banks is gold. And it is not surprising that the XAU/USD chart showed a surge in volatility yesterday; moreover, new impulses may appear before the end of the week.
Bearish arguments:
→ the price tested the 1,939-1,946 area, which formed in late August - early September. Sellers asserted their dominance in that area, and yesterday the price sharply turned down, attempting to rise into this area;
→ the median line of the ascending channel can now provide resistance to the rise in gold price.
Bullish arguments:
→ rising A and C peaks are a sign of an uptrend, and the lower border of the channel can resist the onslaught of bears;
→ there is a psychological basis to expect support at USD 1,900.
So far, the bulls are holding the line near the trend line, shown in green. And if a weak rebound occurs from it, which does not exceed 50% of the downward momentum that began at yesterday's high, the bears can gain even more confidence in their superiority.
To benefit from fluctuations in the gold market, consider enlisting the services of a trusted broker like FXOpen.
CFDs are complex instruments and come with a high risk of losing your money.
This article represents the opinion of the Companies operating under the FXOpen brand only. It is not to be construed as an offer, solicitation, or recommendation with respect to products and services provided by the Companies operating under the FXOpen brand, nor is it to be considered financial advice.
Central Bank Week Shakes Up Gold Market
Yesterday, the main event of the week took place — the Federal Reserve meeting, which had a noticeable impact on the market of assets denominated in US dollars. But besides the Fed meeting, there are a number of other events this week related to central banks:
→ today at 10:30, a meeting of the Swiss National Bank took place. The interest rate remained at 1.75%, although there was a significant possibility of its increase to 2%.
→ today at 14:00 GMT+3, a decision on the Bank of England interest rate is expected;
→ news from the Central Bank of Japan is planned for tomorrow morning — there may be surprises.
An important asset that is affected by the decisions of central banks is gold. And it is not surprising that the XAU/USD chart showed a surge in volatility yesterday; moreover, new impulses may appear before the end of the week.
Bearish arguments:
→ the price tested the 1,939-1,946 area, which formed in late August - early September. Sellers asserted their dominance in that area, and yesterday the price sharply turned down, attempting to rise into this area;
→ the median line of the ascending channel can now provide resistance to the rise in gold price.
Bullish arguments:
→ rising A and C peaks are a sign of an uptrend, and the lower border of the channel can resist the onslaught of bears;
→ there is a psychological basis to expect support at USD 1,900.
So far, the bulls are holding the line near the trend line, shown in green. And if a weak rebound occurs from it, which does not exceed 50% of the downward momentum that began at yesterday's high, the bears can gain even more confidence in their superiority.
To benefit from fluctuations in the gold market, consider enlisting the services of a trusted broker like FXOpen.
CFDs are complex instruments and come with a high risk of losing your money.
This article represents the opinion of the Companies operating under the FXOpen brand only. It is not to be construed as an offer, solicitation, or recommendation with respect to products and services provided by the Companies operating under the FXOpen brand, nor is it to be considered financial advice.
#MarketNews #oilprices #marketanalysis
Oil Analysis: Finally, A Bearish Reversal?
The policy of OPEC+ countries to voluntarily reduce oil production was one of the drivers thanks to which the price of WTI oil increased by approximately 40% from its low in June. In such cases, it is appropriate to use the phrase “correction is overdue.”
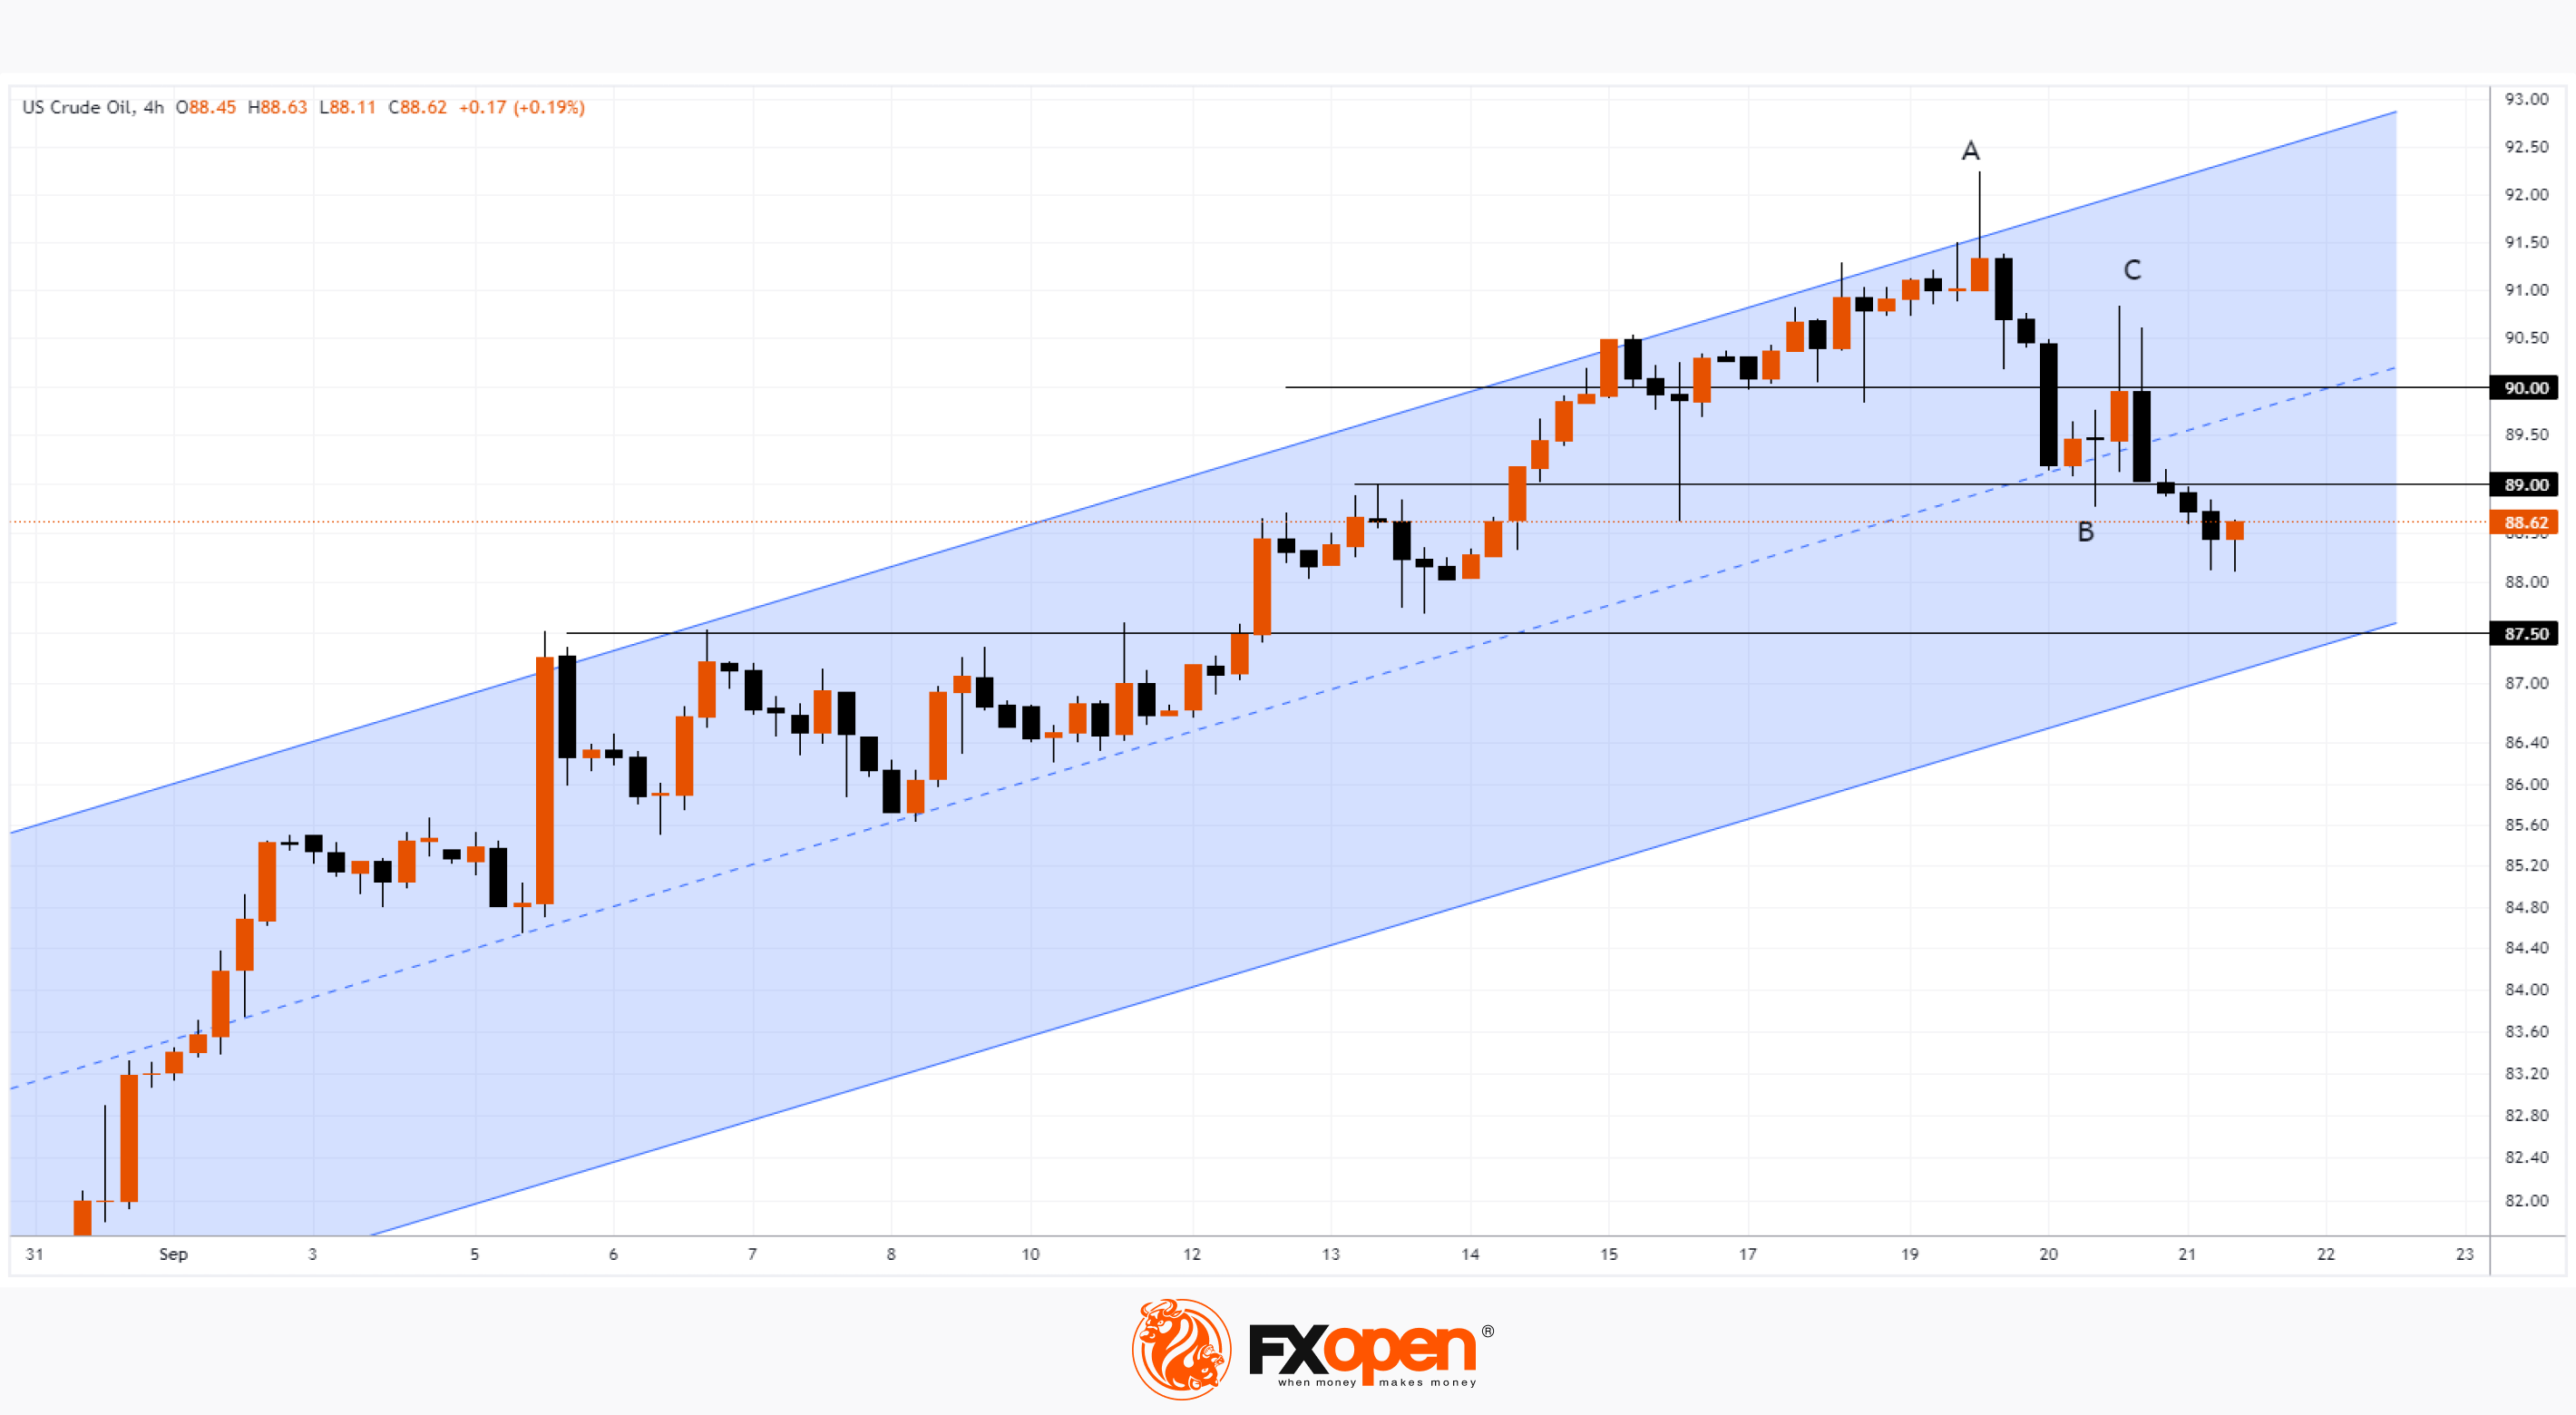
So a decline from the week's high above USD 92 to current levels seems natural. Note that the reversal began with the appearance of extremely high trading volumes in oil futures on the NYMEX exchange on Tuesday — but what if capital associated with governments of countries that do not benefit from high oil prices, which are fueling already high inflation, entered the market? If so, then WTI oil prices above 90-91 can be considered a “red line” for them.
Bearish arguments:
→ the price increase B→C is near the Fibonacci level of 31.8% of the decrease A→B, which is acceptable for a natural rollback;
→ the psychological level of USD 90 (above which the rate of price growth has slowed down) can now act as resistance;
→ the price has broken through the median line of the uptrend — now resistance can be expected from it;
→ the level of USD 89 has also been broken by the bears — it is possible that it, in turn, will slow down the bulls’ attempts to win back, if any, occur. The rate of decline is being recorded too rapidly this week.
Bulls can expect the market to find support around USD 87.5 per barrel — there is a support line (former resistance that restrained price growth at the beginning of the month), supported by the lower channel line.
Hope for a resumption of the upward trend can be given by an article in the FT that hedge funds are aiming for the price to reach USD 100 per barrel, but given the sharp change in sentiment, which is indicated by volumes and the assessment of impulse movements, they cast doubt on the achievement of this goal.
To benefit from trends in energy markets, consider enlisting the services of a trusted broker like FXOpen.
CFDs are complex instruments and come with a high risk of losing your money.
This article represents the opinion of the Companies operating under the FXOpen brand only. It is not to be construed as an offer, solicitation, or recommendation with respect to products and services provided by the Companies operating under the FXOpen brand, nor is it to be considered financial advice.
Oil Analysis: Finally, A Bearish Reversal?
The policy of OPEC+ countries to voluntarily reduce oil production was one of the drivers thanks to which the price of WTI oil increased by approximately 40% from its low in June. In such cases, it is appropriate to use the phrase “correction is overdue.”
So a decline from the week's high above USD 92 to current levels seems natural. Note that the reversal began with the appearance of extremely high trading volumes in oil futures on the NYMEX exchange on Tuesday — but what if capital associated with governments of countries that do not benefit from high oil prices, which are fueling already high inflation, entered the market? If so, then WTI oil prices above 90-91 can be considered a “red line” for them.
Bearish arguments:
→ the price increase B→C is near the Fibonacci level of 31.8% of the decrease A→B, which is acceptable for a natural rollback;
→ the psychological level of USD 90 (above which the rate of price growth has slowed down) can now act as resistance;
→ the price has broken through the median line of the uptrend — now resistance can be expected from it;
→ the level of USD 89 has also been broken by the bears — it is possible that it, in turn, will slow down the bulls’ attempts to win back, if any, occur. The rate of decline is being recorded too rapidly this week.
Bulls can expect the market to find support around USD 87.5 per barrel — there is a support line (former resistance that restrained price growth at the beginning of the month), supported by the lower channel line.
Hope for a resumption of the upward trend can be given by an article in the FT that hedge funds are aiming for the price to reach USD 100 per barrel, but given the sharp change in sentiment, which is indicated by volumes and the assessment of impulse movements, they cast doubt on the achievement of this goal.
To benefit from trends in energy markets, consider enlisting the services of a trusted broker like FXOpen.
CFDs are complex instruments and come with a high risk of losing your money.
This article represents the opinion of the Companies operating under the FXOpen brand only. It is not to be construed as an offer, solicitation, or recommendation with respect to products and services provided by the Companies operating under the FXOpen brand, nor is it to be considered financial advice.
#MarketNews #marketanalysis #USDJPY
USD/JPY Analysis: Rate Reaches Maximum of the Year
This morning, the Bank of Japan's decision on the interest rate, which has been kept at -0.1% since 2016, became known. The rate size remained unchanged.
Although surprises could occur due to the fact that inflation is still above the central bank's target of 2% for the 17th month in a row. So a tightening of policy is becoming more and more likely. CNBC writes that the Bank of Japan may be prompted to take this step by the weakness of the national currency.
This morning, as the chart shows, the rate has risen very close to the highs of the year. It is possible that it will be updated during the day today.
Bullish arguments:
→ The continuing difference in the monetary policies of the United States and Japan contributes to the growth of the exchange rate even higher.
→ The border of the current bullish channel has not been reached, the potential for growth remains.
→ Rising lows this week indicate stronger demand.
→ Even if the yen strengthens, the trend can be supported by both the median and the lower border of the ascending channel.
Bearish arguments:
→ Market participants' fear of intervention by the Japanese authorities around the level of 150 yen per US dollar, which is considered critical, may weaken the upward trend.
→ If the US dollar index, which rose close to the highs of the year, rolls back, this will strengthen the yen.
To benefit from fluctuations in the foreign exchange market, consider enlisting the services of a trusted broker like FXOpen.
CFDs are complex instruments and come with a high risk of losing your money.
This article represents the opinion of the Companies operating under the FXOpen brand only. It is not to be construed as an offer, solicitation, or recommendation with respect to products and services provided by the Companies operating under the FXOpen brand, nor is it to be considered financial advice.
USD/JPY Analysis: Rate Reaches Maximum of the Year
This morning, the Bank of Japan's decision on the interest rate, which has been kept at -0.1% since 2016, became known. The rate size remained unchanged.
Although surprises could occur due to the fact that inflation is still above the central bank's target of 2% for the 17th month in a row. So a tightening of policy is becoming more and more likely. CNBC writes that the Bank of Japan may be prompted to take this step by the weakness of the national currency.
This morning, as the chart shows, the rate has risen very close to the highs of the year. It is possible that it will be updated during the day today.
Bullish arguments:
→ The continuing difference in the monetary policies of the United States and Japan contributes to the growth of the exchange rate even higher.
→ The border of the current bullish channel has not been reached, the potential for growth remains.
→ Rising lows this week indicate stronger demand.
→ Even if the yen strengthens, the trend can be supported by both the median and the lower border of the ascending channel.
Bearish arguments:
→ Market participants' fear of intervention by the Japanese authorities around the level of 150 yen per US dollar, which is considered critical, may weaken the upward trend.
→ If the US dollar index, which rose close to the highs of the year, rolls back, this will strengthen the yen.
To benefit from fluctuations in the foreign exchange market, consider enlisting the services of a trusted broker like FXOpen.
CFDs are complex instruments and come with a high risk of losing your money.
This article represents the opinion of the Companies operating under the FXOpen brand only. It is not to be construed as an offer, solicitation, or recommendation with respect to products and services provided by the Companies operating under the FXOpen brand, nor is it to be considered financial advice.
#MarketNews #marketanalysis #EURUSD
EUR/USD Analysis: Key Support Zone Resists Selling Pressure
Today, fresh monthly values of the PMI index, which is considered a leading indicator of the state of the economy, have become known:
→ France: actual 43.6, expected 46.2. This is the worst economic contraction since the coronavirus.
→ Germany: actual 39.8, expected 39.5.
As a reminder, values below 50 indicate a slowing economy.
Thus, the PMI witnessed the worsening economic problems in the European Union. And not only. The PMI indicator for the UK also published today was 44.2, which, although higher than the previous value 42.5, is still below 50.
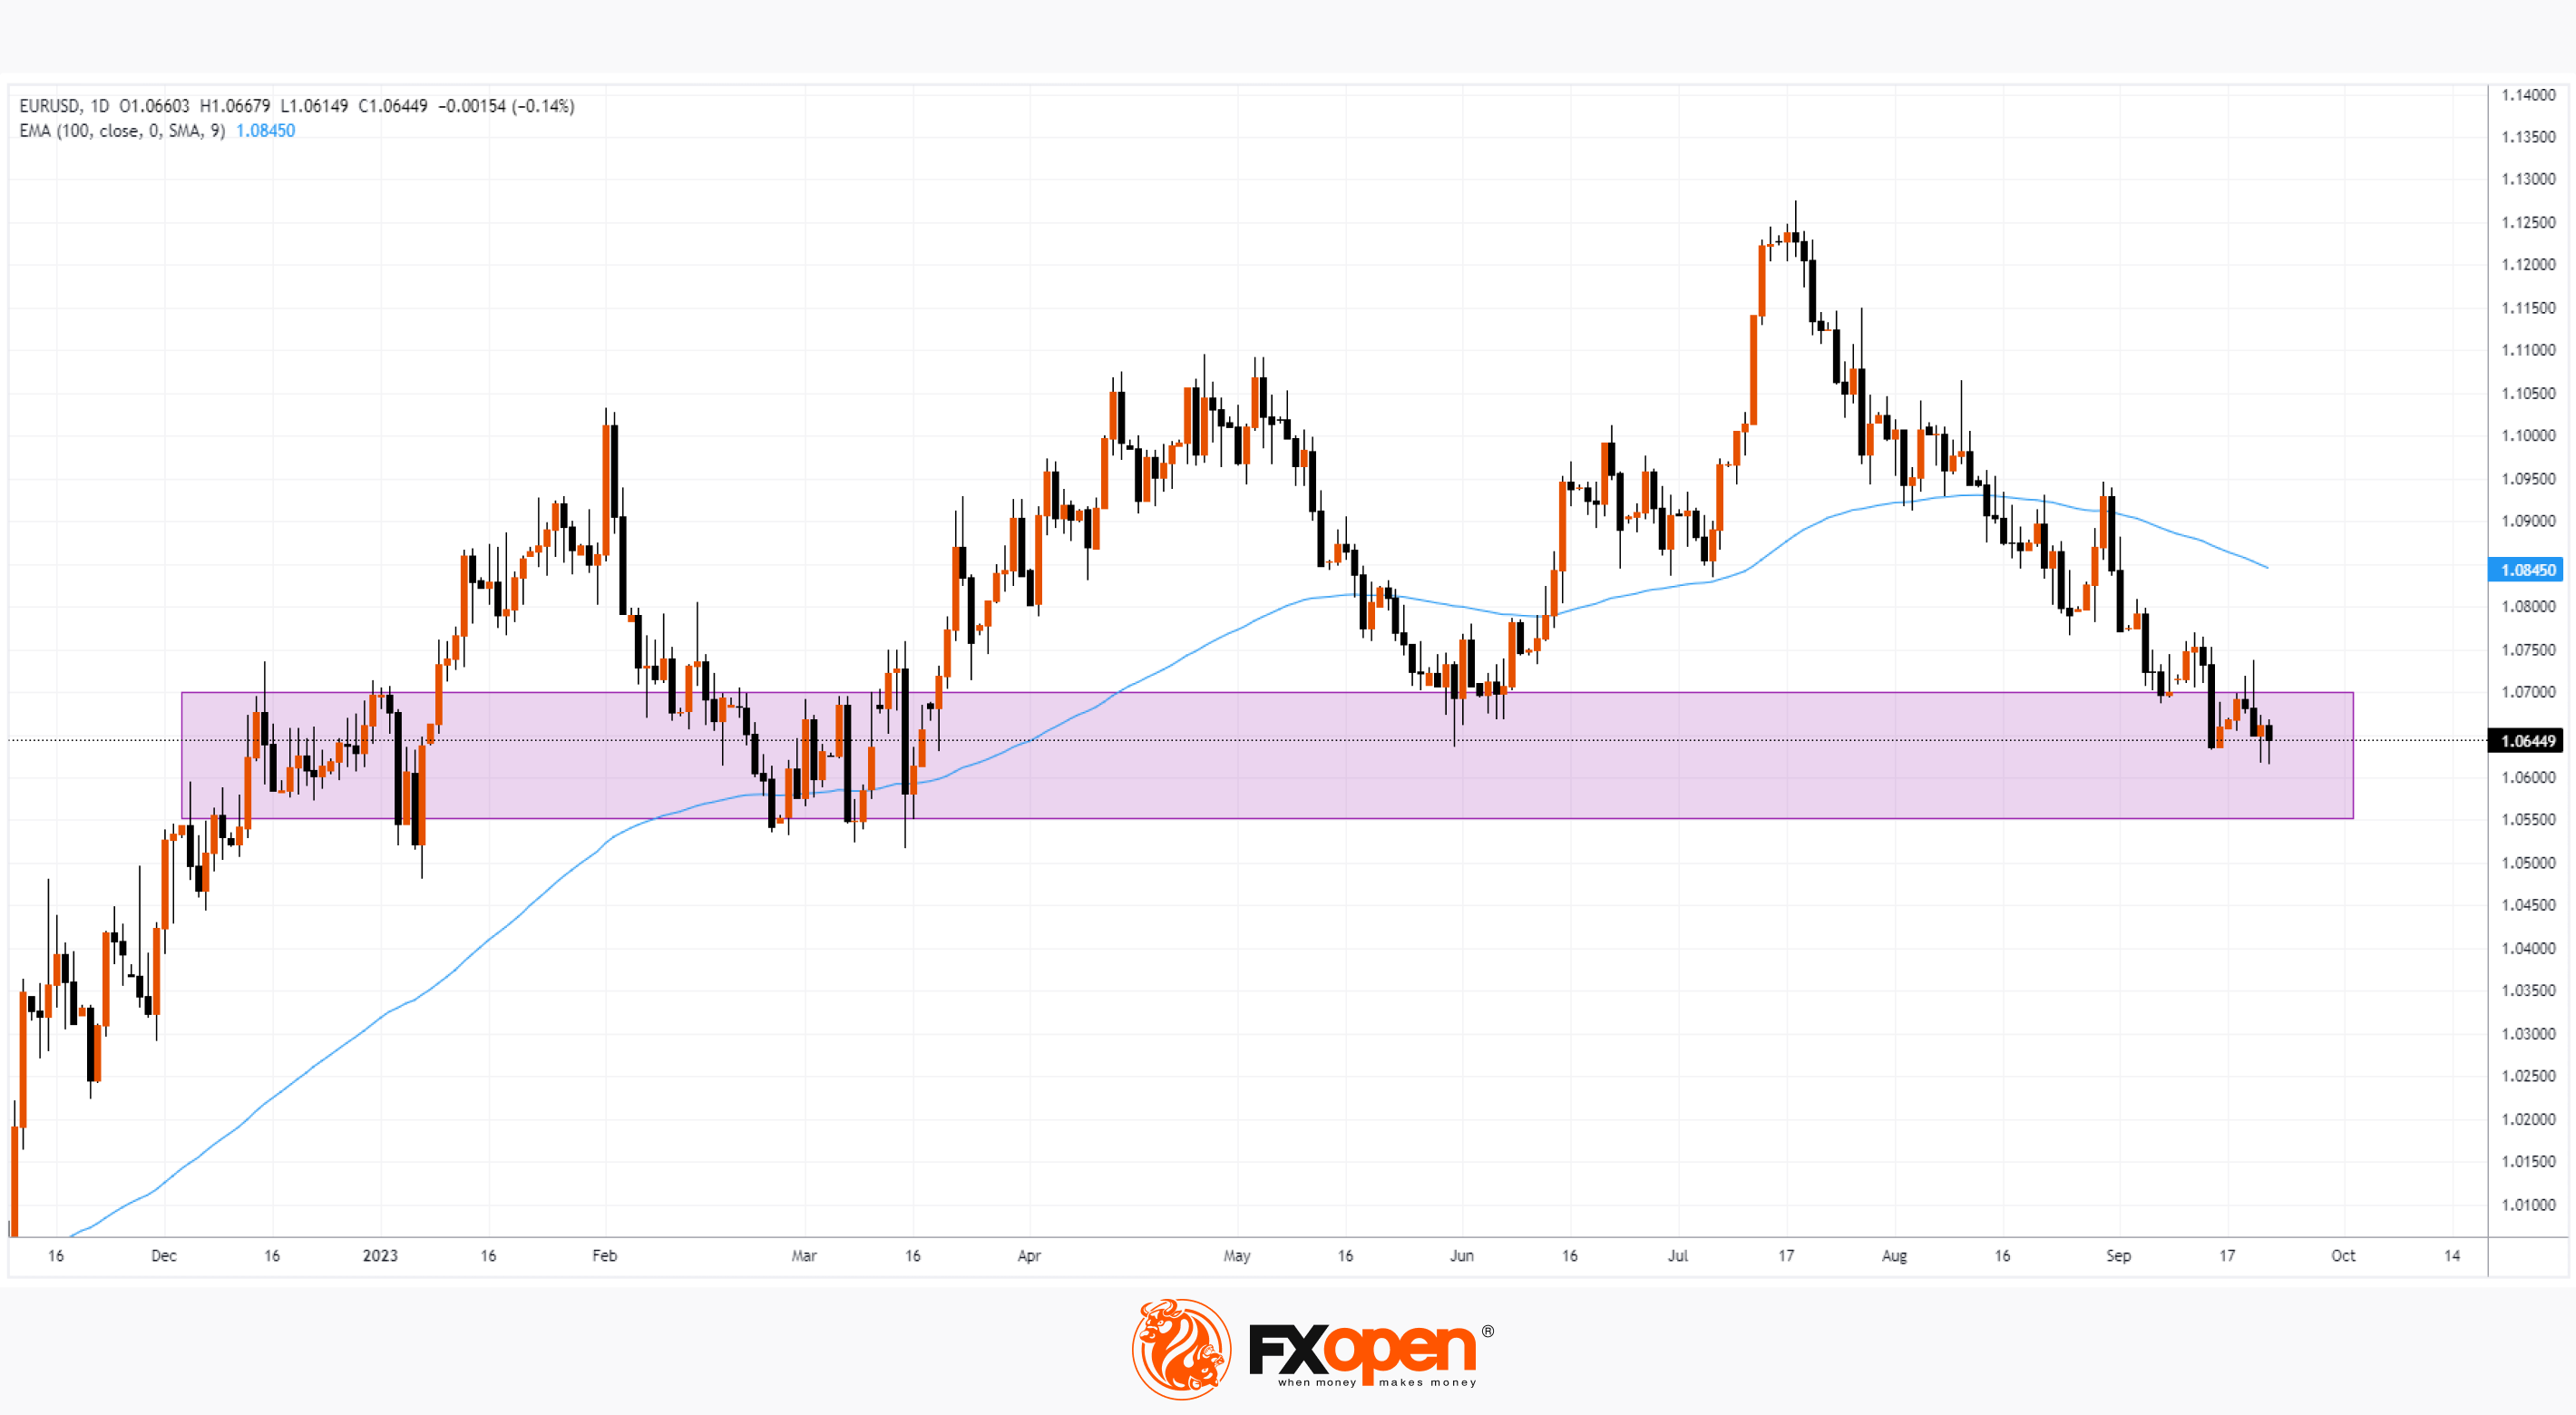
The euro immediately reacted to the disappointing news. The exchange rate against the dollar fell to its lowest level in six months. However, then an encouraging recovery followed — apparently, the proximity of the rate to the key support zone had an effect.
Bullish arguments:
→ The price is in a range that has started in the first half of the year. There, the bears had several attempts to establish a downward trend, but failed. The price has been holding above this zone since the end of March.
→ Yesterday’s candlestick was formed with a long lower shadow – evidence of bullish activity in the indicated zone.
→ The downward trend has been maintained since mid-July – the rate dropped by 5.5%. As they say, an upward correction is overdue. That is, the bears could have lost their pressure and wanted to take profits.
Bearish arguments:
→ The price is below the EMA (100), which is directed downward and may resist growth attempts.
→ The state of the economy in the United States is more favorable according to the latest data, which is confirmed by the dynamics of the exchange rate. However, the balance of opinions may change today – news on the PMI index in the US is expected this afternoon at 16:45 GMT+3.
Benefit from currency fluctuations with the trusted broker FXOpen.
To benefit from fluctuations in the foreign exchange market, consider enlisting the services of a trusted broker like FXOpen.
CFDs are complex instruments and come with a high risk of losing your money.
This article represents the opinion of the Companies operating under the FXOpen brand only. It is not to be construed as an offer, solicitation, or recommendation with respect to products and services provided by the Companies operating under the FXOpen brand, nor is it to be considered financial advice.
EUR/USD Analysis: Key Support Zone Resists Selling Pressure
Today, fresh monthly values of the PMI index, which is considered a leading indicator of the state of the economy, have become known:
→ France: actual 43.6, expected 46.2. This is the worst economic contraction since the coronavirus.
→ Germany: actual 39.8, expected 39.5.
As a reminder, values below 50 indicate a slowing economy.
Thus, the PMI witnessed the worsening economic problems in the European Union. And not only. The PMI indicator for the UK also published today was 44.2, which, although higher than the previous value 42.5, is still below 50.
The euro immediately reacted to the disappointing news. The exchange rate against the dollar fell to its lowest level in six months. However, then an encouraging recovery followed — apparently, the proximity of the rate to the key support zone had an effect.
Bullish arguments:
→ The price is in a range that has started in the first half of the year. There, the bears had several attempts to establish a downward trend, but failed. The price has been holding above this zone since the end of March.
→ Yesterday’s candlestick was formed with a long lower shadow – evidence of bullish activity in the indicated zone.
→ The downward trend has been maintained since mid-July – the rate dropped by 5.5%. As they say, an upward correction is overdue. That is, the bears could have lost their pressure and wanted to take profits.
Bearish arguments:
→ The price is below the EMA (100), which is directed downward and may resist growth attempts.
→ The state of the economy in the United States is more favorable according to the latest data, which is confirmed by the dynamics of the exchange rate. However, the balance of opinions may change today – news on the PMI index in the US is expected this afternoon at 16:45 GMT+3.
Benefit from currency fluctuations with the trusted broker FXOpen.
To benefit from fluctuations in the foreign exchange market, consider enlisting the services of a trusted broker like FXOpen.
CFDs are complex instruments and come with a high risk of losing your money.
This article represents the opinion of the Companies operating under the FXOpen brand only. It is not to be construed as an offer, solicitation, or recommendation with respect to products and services provided by the Companies operating under the FXOpen brand, nor is it to be considered financial advice.
Weekly Market Wrap With Gary Thomson: UK STOCK MARKET RISES, S&P 500 FALLS, OIL ANALYSIS, EUR/GBP
Get the latest scoop on the week's hottest headlines, all in one convenient video. Join Gary Thomson, the COO of FXOpen UK, as he breaks down the most significant news reports and shares his expert insights.
🔸 UK stock market rises amid inflation news #UKStockMarket #UKinflation
🔸 S&P 500 falls amid news from the Fed #sp500 #Fed
🔸 Oil analysis: Finally, a bearish reversal? #oilprices
🔸 Will stagflation persist in the UK? EUR/GBP volatility may be an indicator #EURGBP #stagflation
Stay in the know and empower yourself with our short, yet power-packed video. Watch it now and stay updated with FXOpen.
Don't miss out on this invaluable opportunity to sharpen your trading skills and make informed decisions.
https://cutt.ly/mwvoJSbA
CFDs are complex instruments and come with a high risk of losing your money.
Get the latest scoop on the week's hottest headlines, all in one convenient video. Join Gary Thomson, the COO of FXOpen UK, as he breaks down the most significant news reports and shares his expert insights.
🔸 UK stock market rises amid inflation news #UKStockMarket #UKinflation
🔸 S&P 500 falls amid news from the Fed #sp500 #Fed
🔸 Oil analysis: Finally, a bearish reversal? #oilprices
🔸 Will stagflation persist in the UK? EUR/GBP volatility may be an indicator #EURGBP #stagflation
Stay in the know and empower yourself with our short, yet power-packed video. Watch it now and stay updated with FXOpen.
Don't miss out on this invaluable opportunity to sharpen your trading skills and make informed decisions.
https://cutt.ly/mwvoJSbA
CFDs are complex instruments and come with a high risk of losing your money.
YouTube
Weekly Market Wrap With Gary Thomson: UK STOCK MARKET RISES, S&P 500 FALLS, OIL ANALYSIS, EUR/GBP
Get the latest scoop on the week's hottest headlines, all in one convenient video. Join Gary Thomson, the COO of FXOpen UK, as he breaks down the most significant news reports and shares his expert insights.
- UK stock market rises amid inflation news #UKStockMarket…
- UK stock market rises amid inflation news #UKStockMarket…
#marketanalysis #stockmarket
Financial Markets Waking Up after a Turbulent Week: Important News
The main event of last week was information from the Fed. Jerome Powell once again demonstrated his determination to maintain a tough political stance, which caused:
→ increase in bond yields. Yields on 10-year securities reached their highest since 2009;
→ the dollar index jumped to its highs of the year;
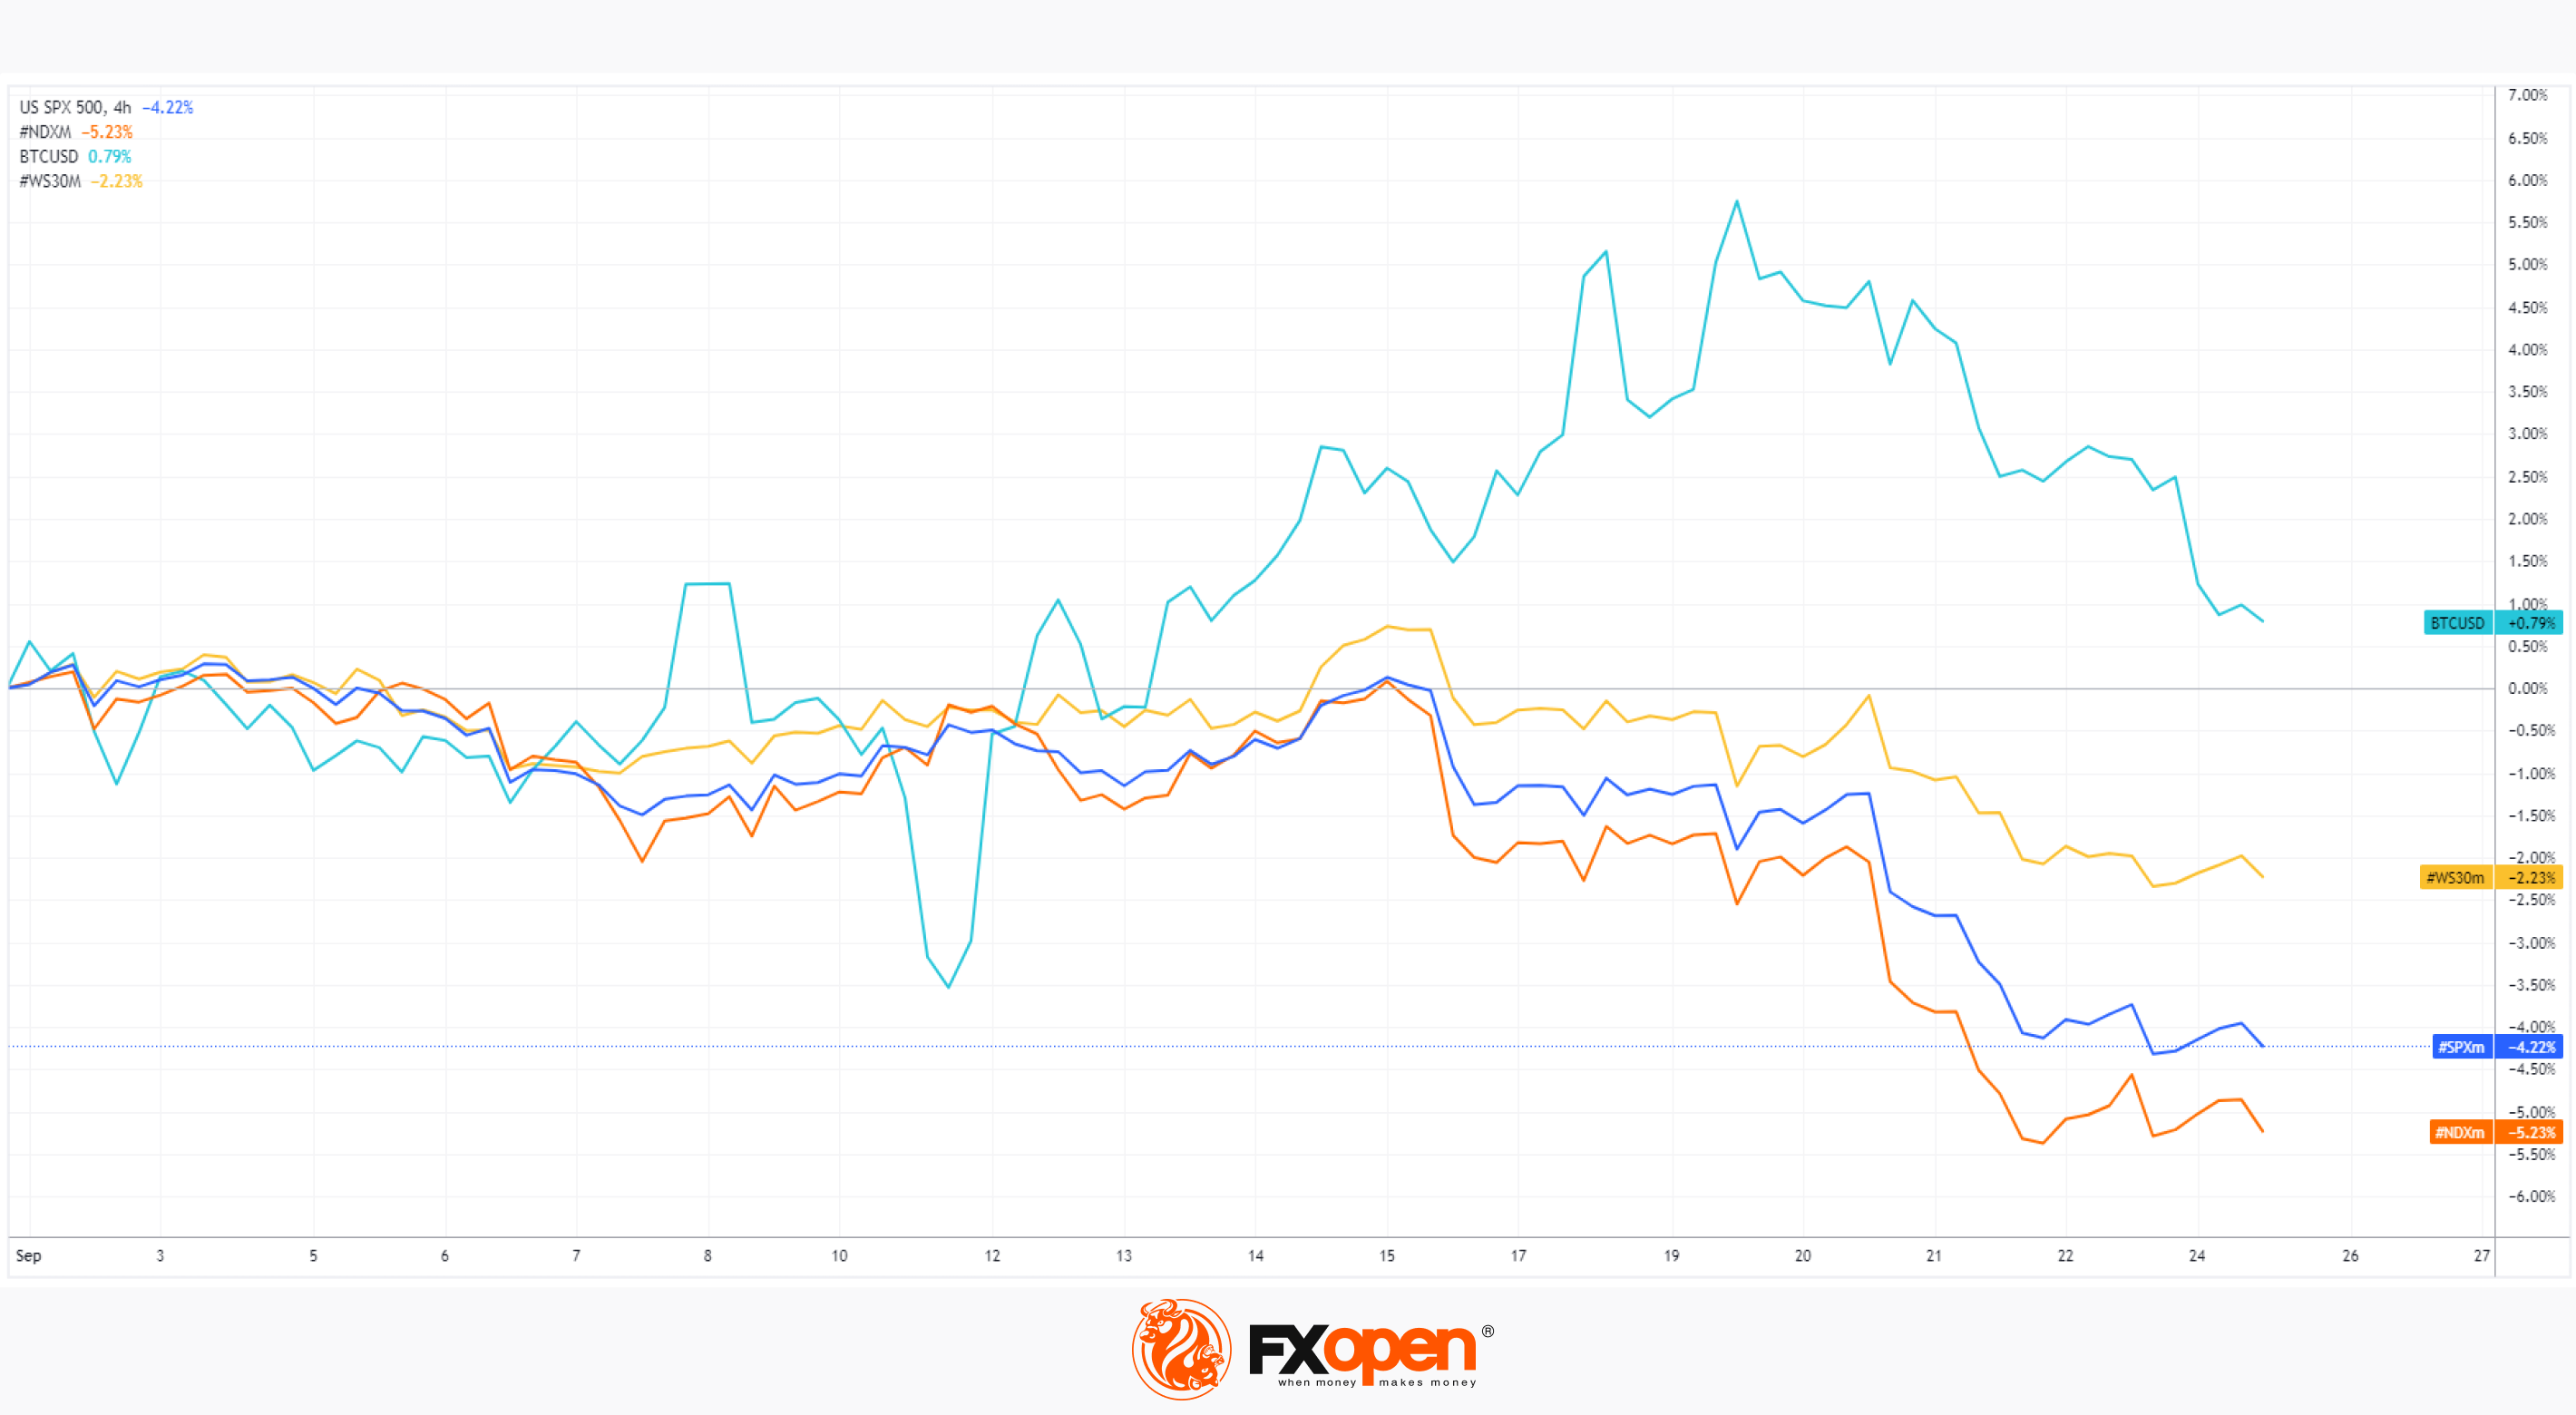
→ stock markets fell — especially NASDAQ. This increases the belief that the AI boom has run its course. The resilience of the Dow Jones index indicates that investors are preferring more defensive assets;
→ fall of cryptocurrencies. At the same time, the price of bitcoin returned to the flat range in which it was at the end of August. Thus, the wave of positivity associated, among other things, with rumours that the head of the SEC wants to approve applications from funds to launch a crypto ETF, has exhausted itself.
Note that on Thursday:
→ news from the US on unemployment and GDP will be released at 15:30 GMT+3;
→ Powell is scheduled to speak at 23:00 GMT+3.
A scenario cannot be ruled out in which if the beginning of this week is marked by attempts by the bulls to adjust the stock market after last week’s fall, then these attempts could be radically disrupted on Thursday.
To benefit from trends in financial markets, consider enlisting the services of a trusted broker like FXOpen.
CFDs are complex instruments and come with a high risk of losing your money.
This article represents the opinion of the Companies operating under the FXOpen brand only. It is not to be construed as an offer, solicitation, or recommendation with respect to products and services provided by the Companies operating under the FXOpen brand, nor is it to be considered financial advice.
Financial Markets Waking Up after a Turbulent Week: Important News
The main event of last week was information from the Fed. Jerome Powell once again demonstrated his determination to maintain a tough political stance, which caused:
→ increase in bond yields. Yields on 10-year securities reached their highest since 2009;
→ the dollar index jumped to its highs of the year;
→ stock markets fell — especially NASDAQ. This increases the belief that the AI boom has run its course. The resilience of the Dow Jones index indicates that investors are preferring more defensive assets;
→ fall of cryptocurrencies. At the same time, the price of bitcoin returned to the flat range in which it was at the end of August. Thus, the wave of positivity associated, among other things, with rumours that the head of the SEC wants to approve applications from funds to launch a crypto ETF, has exhausted itself.
Note that on Thursday:
→ news from the US on unemployment and GDP will be released at 15:30 GMT+3;
→ Powell is scheduled to speak at 23:00 GMT+3.
A scenario cannot be ruled out in which if the beginning of this week is marked by attempts by the bulls to adjust the stock market after last week’s fall, then these attempts could be radically disrupted on Thursday.
To benefit from trends in financial markets, consider enlisting the services of a trusted broker like FXOpen.
CFDs are complex instruments and come with a high risk of losing your money.
This article represents the opinion of the Companies operating under the FXOpen brand only. It is not to be construed as an offer, solicitation, or recommendation with respect to products and services provided by the Companies operating under the FXOpen brand, nor is it to be considered financial advice.
#MarketNews #XAUUSD #goldprice
Market Analysis: Rising Bond Yields Are Driving Down Price of Gold
The yield on 10-year bonds exceeded 4.5% per annum – a 16-year high. The demand for them was promoted by:
→ tough statements from the Fed last week that the high base interest rate will remain as long as necessary. Moreover, Minneapolis Fed President Neel Kashkari said he expects another increase;
→ concerns related to the likelihood of a US government shutdown on October 1. At the same time, Moody's issued a stern warning, jeopardizing the country's triple-A rating.
It can be assumed that investors choose bonds when forming a portfolio of protective assets. This puts pressure on the gold, which “loses its shine” in their eyes.
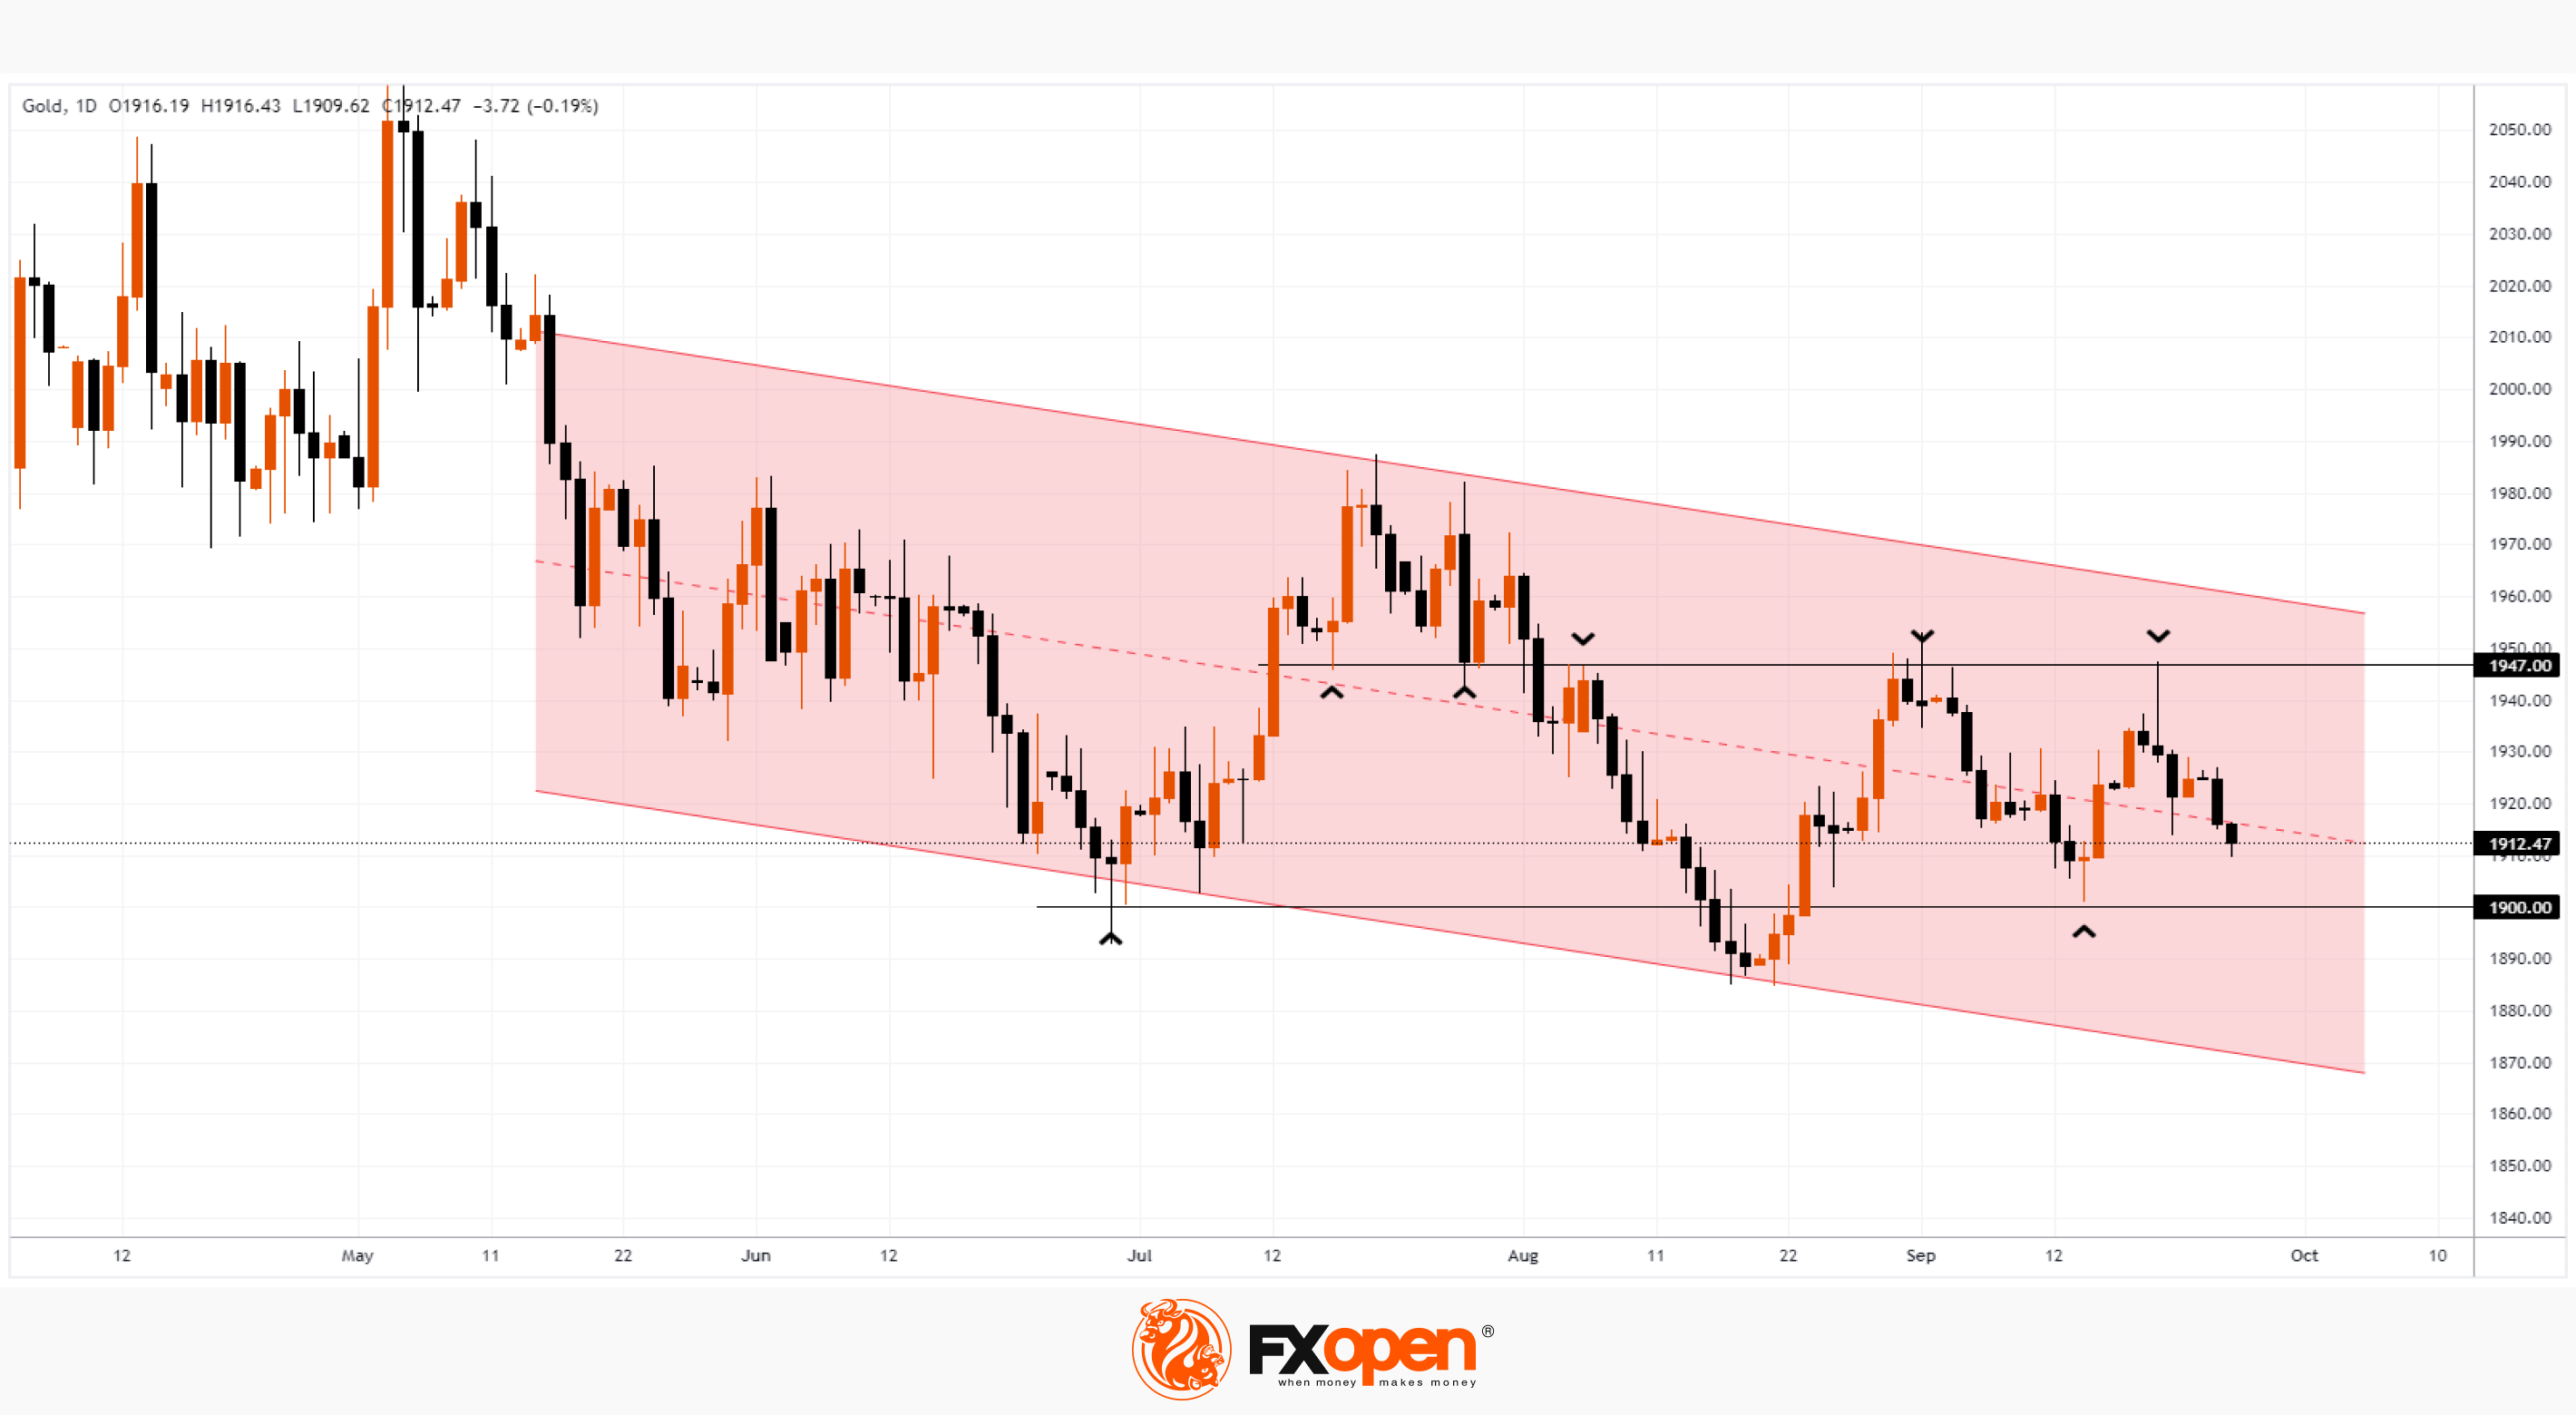
Thus, the XAU/USD daily chart shows that the price of gold continues the downward trend that has been going on since spring. Wherein:
→ the price of gold actively interacts with the level of 1,947. In July, this level acted as support, but in August this status changed. And the candle of September 20 confirms the dominance of the bears — the price failed to stay at the achieved heights. It was more like an intraday emotional movement that did not reflect the intrinsic value of gold;
→ so far, the price is near the median line of the channel, where supply and demand tend to balance, so this reduces the likelihood of sharp spikes in volatility;
→ But the psychological level of USD 1,900 per ounce is getting closer. But if in July the price rebounded sharply from it, then in August it made a delay, falling below 1,900. If the pressure on gold continues, then the bears may attempt a new attack on the psychological level and it is possible that the price may drop to the lower limit by the end of the year downward channel.
To benefit from trends in the gold market, consider enlisting the services of a trusted broker like FXOpen.
CFDs are complex instruments and come with a high risk of losing your money.
This article represents the opinion of the Companies operating under the FXOpen brand only. It is not to be construed as an offer, solicitation, or recommendation with respect to products and services provided by the Companies operating under the FXOpen brand, nor is it to be considered financial advice.
Market Analysis: Rising Bond Yields Are Driving Down Price of Gold
The yield on 10-year bonds exceeded 4.5% per annum – a 16-year high. The demand for them was promoted by:
→ tough statements from the Fed last week that the high base interest rate will remain as long as necessary. Moreover, Minneapolis Fed President Neel Kashkari said he expects another increase;
→ concerns related to the likelihood of a US government shutdown on October 1. At the same time, Moody's issued a stern warning, jeopardizing the country's triple-A rating.
It can be assumed that investors choose bonds when forming a portfolio of protective assets. This puts pressure on the gold, which “loses its shine” in their eyes.
Thus, the XAU/USD daily chart shows that the price of gold continues the downward trend that has been going on since spring. Wherein:
→ the price of gold actively interacts with the level of 1,947. In July, this level acted as support, but in August this status changed. And the candle of September 20 confirms the dominance of the bears — the price failed to stay at the achieved heights. It was more like an intraday emotional movement that did not reflect the intrinsic value of gold;
→ so far, the price is near the median line of the channel, where supply and demand tend to balance, so this reduces the likelihood of sharp spikes in volatility;
→ But the psychological level of USD 1,900 per ounce is getting closer. But if in July the price rebounded sharply from it, then in August it made a delay, falling below 1,900. If the pressure on gold continues, then the bears may attempt a new attack on the psychological level and it is possible that the price may drop to the lower limit by the end of the year downward channel.
To benefit from trends in the gold market, consider enlisting the services of a trusted broker like FXOpen.
CFDs are complex instruments and come with a high risk of losing your money.
This article represents the opinion of the Companies operating under the FXOpen brand only. It is not to be construed as an offer, solicitation, or recommendation with respect to products and services provided by the Companies operating under the FXOpen brand, nor is it to be considered financial advice.
#marketanalysis #USDJPY #forextrading
USD/JPY Analysis: For the First Time This Year, the Rate Exceeds 149 Yen Per Dollar
The reason for the stable trend, as we have repeatedly pointed out, is the difference in the monetary policy of the USA and Japan. Inflation in Japan has been above 2% for more than a year, and the media are increasingly publishing expert opinions that the Bank of Japan will raise short-term interest rates from the current -0.1% at the end of this year. However, today Reuters published the opinion of Mr. Makoto Sakurai, the former head of the Bank of Japan. According to him:
→ the Bank of Japan may delay ending negative interest rates until around April next year;
→ the abolition of negative rates, which have been in place since 2016, will not harm the economy;
→ uncertainty about the economic prospects of the United States and China also gives the Bank of Japan a reason to delay raising rates, Sakurai added.
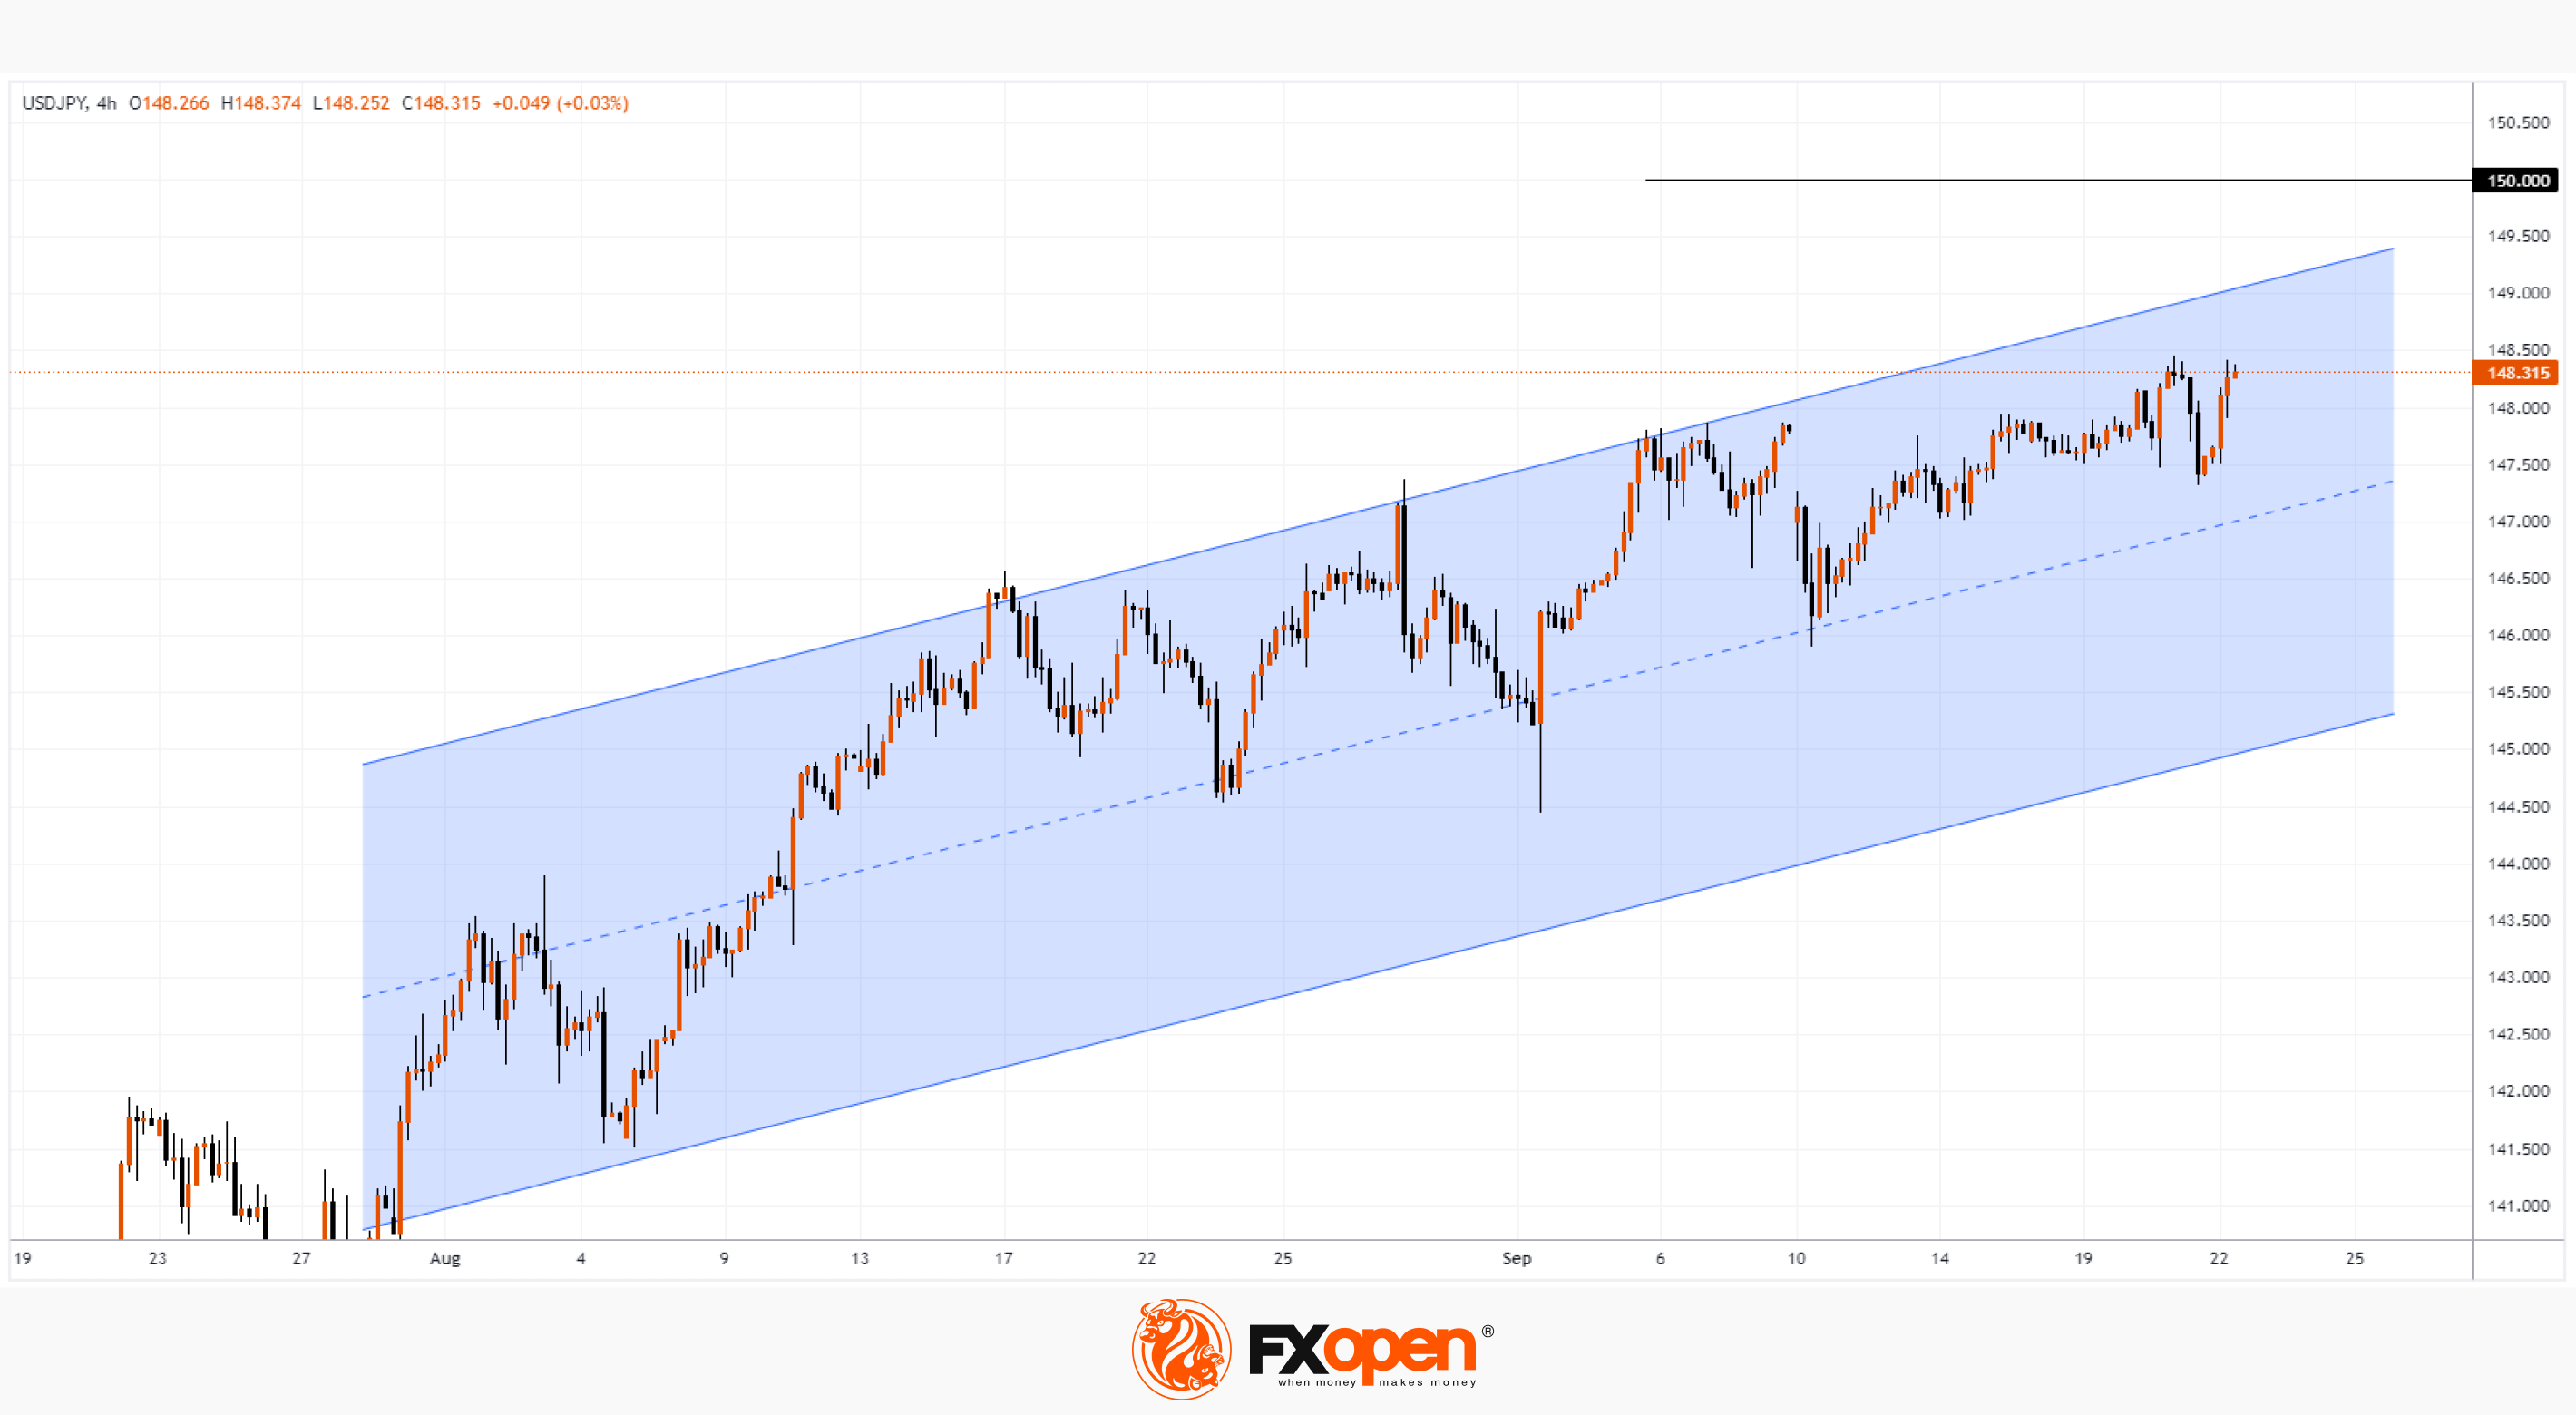
That is, the existing gap in monetary policy may continue for another six months, which will push the USD/JPY rate higher and higher. And it is not surprising that, as the chart shows, today the rate exceeded 149 yen per US dollar for the first time in a year, further increasing the likelihood of reaching the psychological level of 150 yen.
Wherein:
→ before breaking through the level of 148.5 yen, the price tested the level of 147.5. Judging by the rapid recovery on September 22, demand has confidently outstripped supply;
→ the price has reached the upper limit of the ascending channel - it is permissible to assume that demand will weaken, as the bulls will want to take profit. Moreover, the RSI indicator shows it is overbought;
→ the weakening demand is facilitated by fears that exceeding the level of 150 yen will force the Ministry of Finance to intervene (as it did last fall).
If we witness even verbal concern from the Japanese financial authorities, this could rapidly lower the rate at the lower border of the channel shown by the blue lines.
To benefit from trends in financial markets, consider enlisting the services of a trusted broker like FXOpen.
CFDs are complex instruments and come with a high risk of losing your money.
This article represents the opinion of the Companies operating under the FXOpen brand only. It is not to be construed as an offer, solicitation, or recommendation with respect to products and services provided by the Companies operating under the FXOpen brand, nor is it to be considered financial advice.
USD/JPY Analysis: For the First Time This Year, the Rate Exceeds 149 Yen Per Dollar
The reason for the stable trend, as we have repeatedly pointed out, is the difference in the monetary policy of the USA and Japan. Inflation in Japan has been above 2% for more than a year, and the media are increasingly publishing expert opinions that the Bank of Japan will raise short-term interest rates from the current -0.1% at the end of this year. However, today Reuters published the opinion of Mr. Makoto Sakurai, the former head of the Bank of Japan. According to him:
→ the Bank of Japan may delay ending negative interest rates until around April next year;
→ the abolition of negative rates, which have been in place since 2016, will not harm the economy;
→ uncertainty about the economic prospects of the United States and China also gives the Bank of Japan a reason to delay raising rates, Sakurai added.
That is, the existing gap in monetary policy may continue for another six months, which will push the USD/JPY rate higher and higher. And it is not surprising that, as the chart shows, today the rate exceeded 149 yen per US dollar for the first time in a year, further increasing the likelihood of reaching the psychological level of 150 yen.
Wherein:
→ before breaking through the level of 148.5 yen, the price tested the level of 147.5. Judging by the rapid recovery on September 22, demand has confidently outstripped supply;
→ the price has reached the upper limit of the ascending channel - it is permissible to assume that demand will weaken, as the bulls will want to take profit. Moreover, the RSI indicator shows it is overbought;
→ the weakening demand is facilitated by fears that exceeding the level of 150 yen will force the Ministry of Finance to intervene (as it did last fall).
If we witness even verbal concern from the Japanese financial authorities, this could rapidly lower the rate at the lower border of the channel shown by the blue lines.
To benefit from trends in financial markets, consider enlisting the services of a trusted broker like FXOpen.
CFDs are complex instruments and come with a high risk of losing your money.
This article represents the opinion of the Companies operating under the FXOpen brand only. It is not to be construed as an offer, solicitation, or recommendation with respect to products and services provided by the Companies operating under the FXOpen brand, nor is it to be considered financial advice.
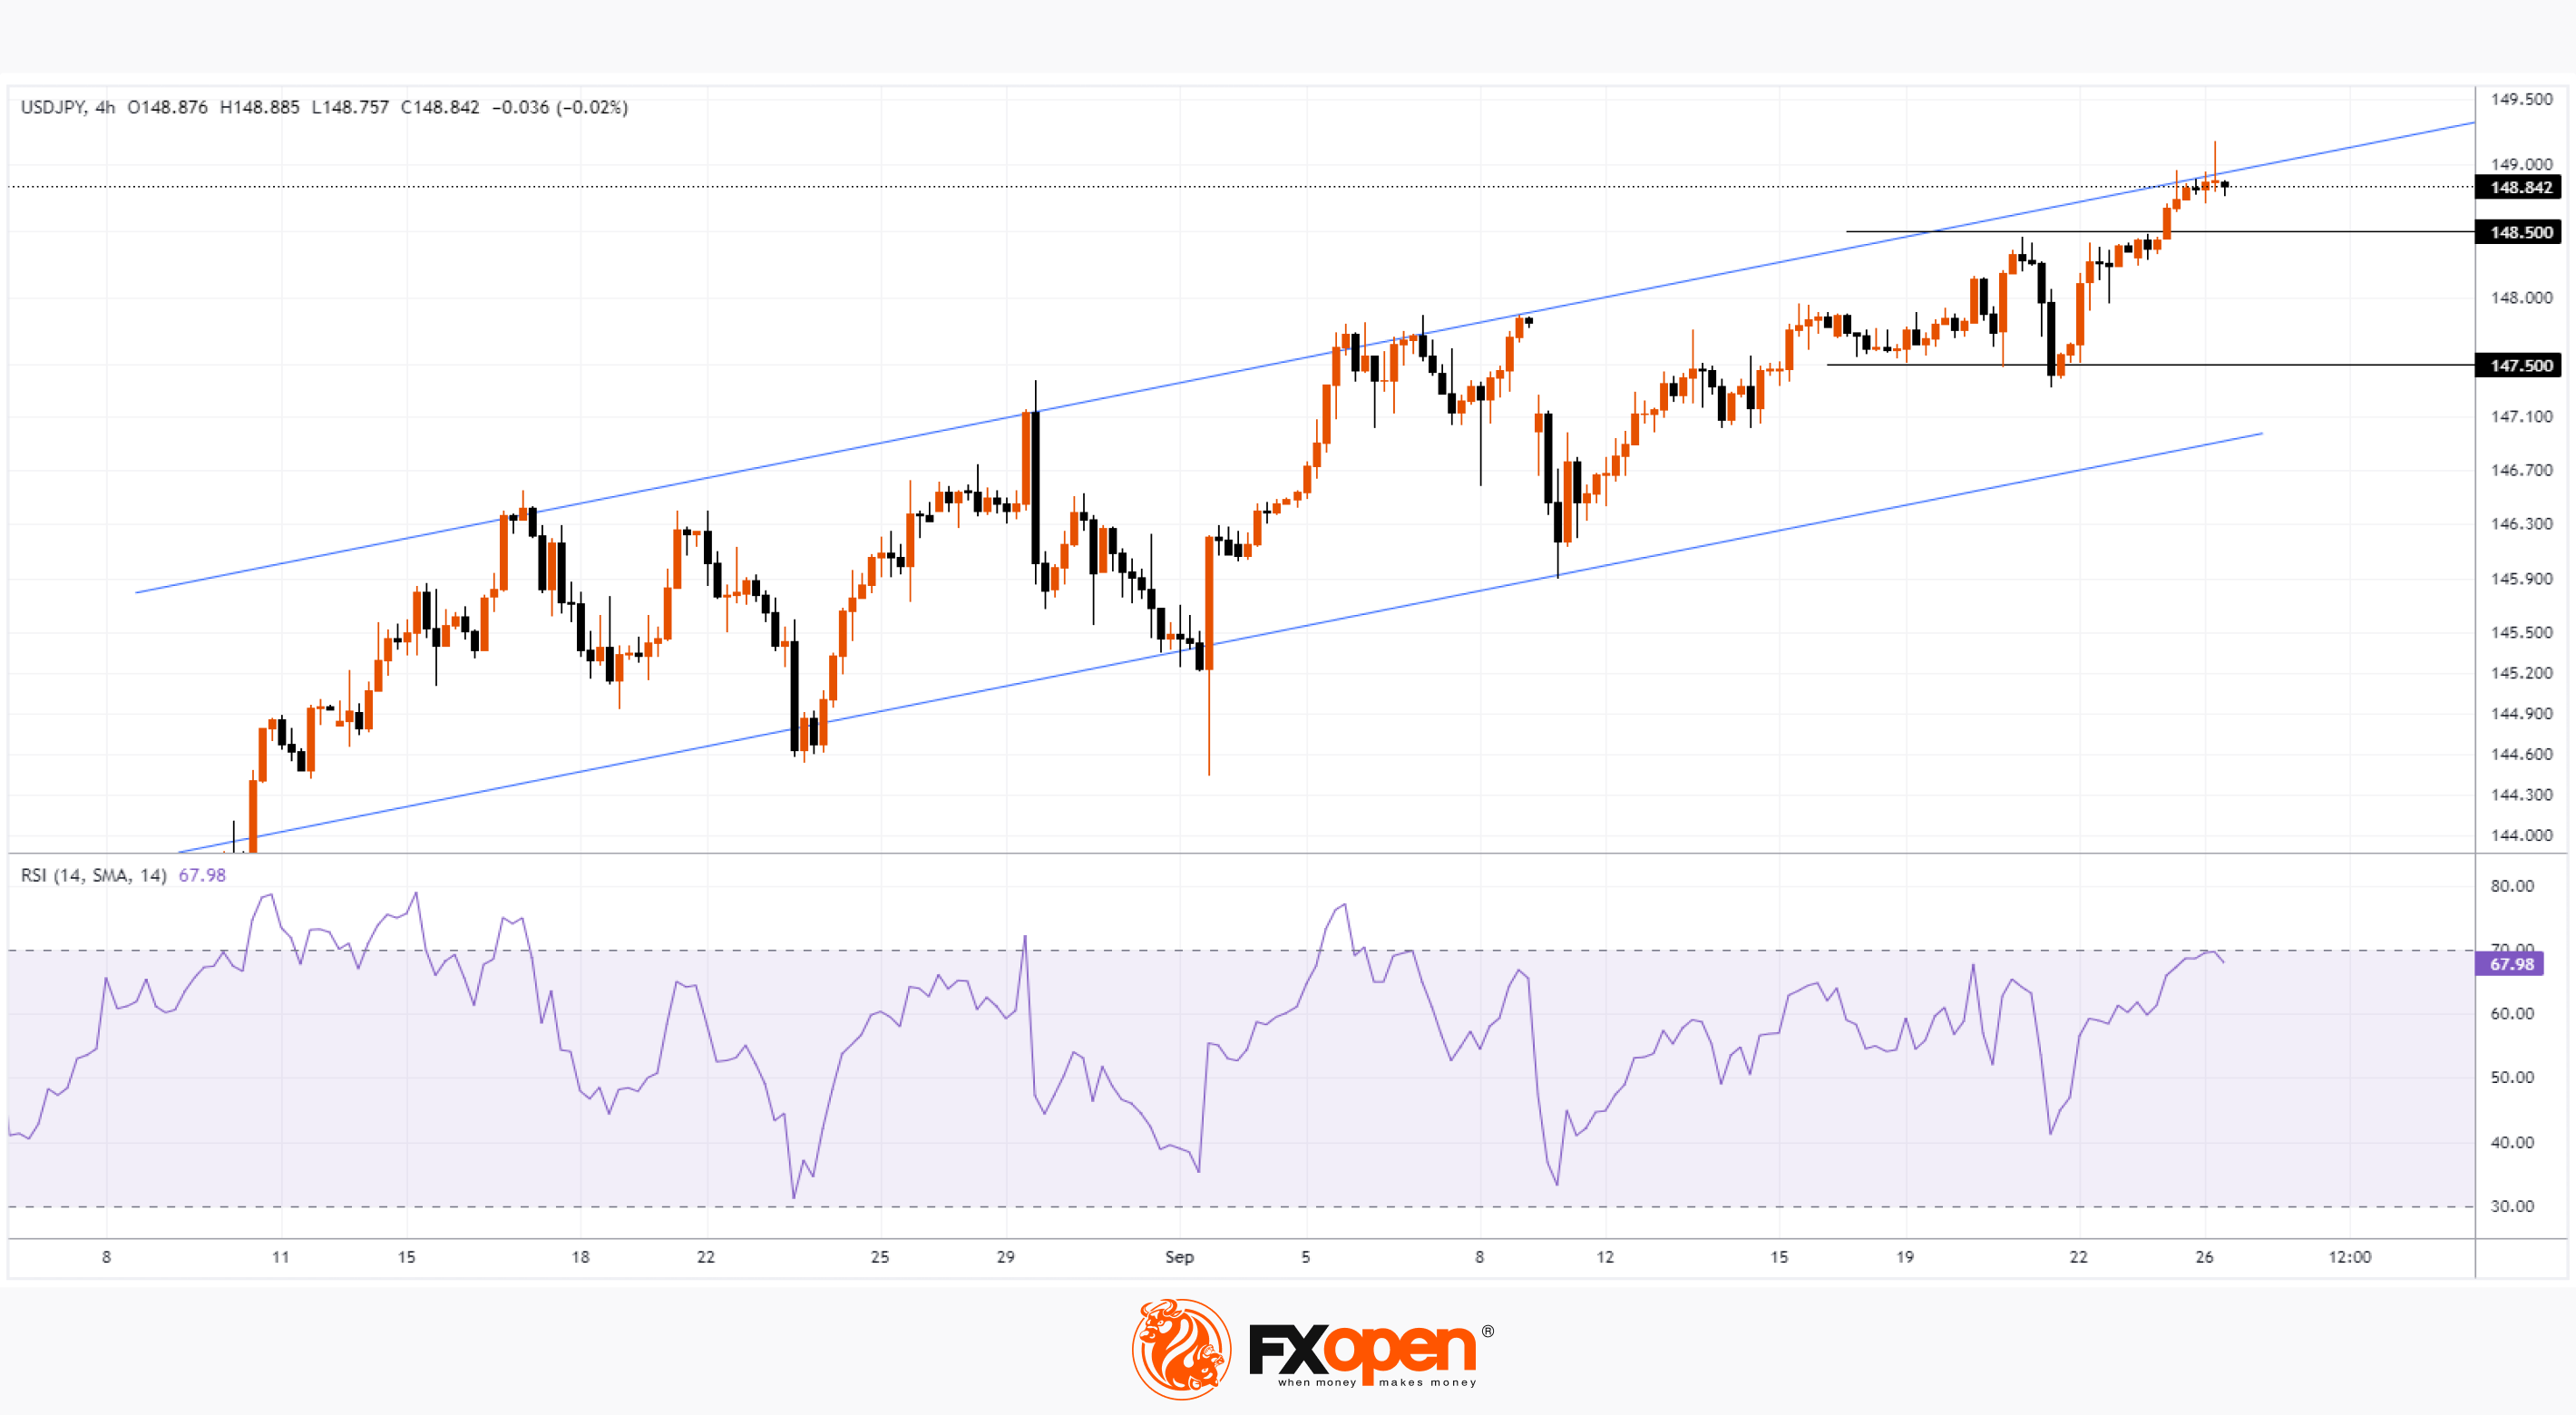
#tradingforex #trading #tradingterminal
New contest: TickTrader Challenge-2. Join and will up to USD200!
FXOpen announces a new competition for FXOpen forum participants, open to clients of FXOpen International (FXOpen Markets Limited), TickTrader Challenge-2, with a larger prize fund of USD 600.
Attention: This competition is open to clients of FXOpen International (FXOpen Markets Limited).
The contest starts on October 9 and ends on October 27, 2023. Registration is already open and will last until October 26, 2023.
Join the Contest!
https://shorturl.at/gyAC4
To take advantage of price fluctuations in the foreign exchange markets, consider enlisting the services of a reliable broker like FXOpen.
New contest: TickTrader Challenge-2. Join and will up to USD200!
FXOpen announces a new competition for FXOpen forum participants, open to clients of FXOpen International (FXOpen Markets Limited), TickTrader Challenge-2, with a larger prize fund of USD 600.
Attention: This competition is open to clients of FXOpen International (FXOpen Markets Limited).
The contest starts on October 9 and ends on October 27, 2023. Registration is already open and will last until October 26, 2023.
Join the Contest!
https://shorturl.at/gyAC4
To take advantage of price fluctuations in the foreign exchange markets, consider enlisting the services of a reliable broker like FXOpen.
#MarketNews #stockmarket #amzn
AMZN Stock Analysis: 4 Reasons to Doubt the Bullish Outlook
After the Fed signaled last week that rates may be higher for longer than expected, the US stock market has received a strong bearish boost. And among the most vulnerable assets were technology stocks (considered risky). The NASDAQ index has already fallen by about 6% since last Wednesday (when the FOMC meeting took place). And the negative backdrop from the Fed is one of the 4 issues that give reason to doubt the bullish outlook for AMZN stock.
The second reason is that AMZN has fallen 9% in value since last Wednesday. That is, AMZN is falling faster than the overall market. And this problem is not new. Compare the dynamics of the index and Amazon shares on a weekly timeframe and you will see that the shares have been performing weaker than the index since the summer of 2020. That is, the leadership status that was held for many years has been lost.
The third reason is that yesterday, it became known that the Federal Trade Commission and 17 states sued Amazon, claiming that its online commerce policies illegally stifle competition. The litigation could put further pressure on the stock price.
The fourth reason is volume analysis. The last two spikes in large volumes of trading in AMZN shares on the NASDAQ exchange were recorded on August 4 and September 15. After the first surge, the price stopped growing as part of a bullish trend that has lasted since the beginning of 2023. After the second, it began to decline. Perhaps large players took profits from the rally and reversed positions in anticipation of lower prices?
It is also worth noting that the 2023 rally did not reach the level of 50% of the A→B decline, so the level of USD 126 per share of AMZN (providing support in July) may be broken against the backdrop of these problems, opening the way to the psychological mark of 100 USD per share.
To benefit from the rise and fall of popular stocks, consider enlisting the services of a trusted broker like FXOpen.
CFDs are complex instruments and come with a high risk of losing your money.
This article represents the opinion of the Companies operating under the FXOpen brand only. It is not to be construed as an offer, solicitation, or recommendation with respect to products and services provided by the Companies operating under the FXOpen brand, nor is it to be considered financial advice.
AMZN Stock Analysis: 4 Reasons to Doubt the Bullish Outlook
After the Fed signaled last week that rates may be higher for longer than expected, the US stock market has received a strong bearish boost. And among the most vulnerable assets were technology stocks (considered risky). The NASDAQ index has already fallen by about 6% since last Wednesday (when the FOMC meeting took place). And the negative backdrop from the Fed is one of the 4 issues that give reason to doubt the bullish outlook for AMZN stock.
The second reason is that AMZN has fallen 9% in value since last Wednesday. That is, AMZN is falling faster than the overall market. And this problem is not new. Compare the dynamics of the index and Amazon shares on a weekly timeframe and you will see that the shares have been performing weaker than the index since the summer of 2020. That is, the leadership status that was held for many years has been lost.
The third reason is that yesterday, it became known that the Federal Trade Commission and 17 states sued Amazon, claiming that its online commerce policies illegally stifle competition. The litigation could put further pressure on the stock price.
The fourth reason is volume analysis. The last two spikes in large volumes of trading in AMZN shares on the NASDAQ exchange were recorded on August 4 and September 15. After the first surge, the price stopped growing as part of a bullish trend that has lasted since the beginning of 2023. After the second, it began to decline. Perhaps large players took profits from the rally and reversed positions in anticipation of lower prices?
It is also worth noting that the 2023 rally did not reach the level of 50% of the A→B decline, so the level of USD 126 per share of AMZN (providing support in July) may be broken against the backdrop of these problems, opening the way to the psychological mark of 100 USD per share.
To benefit from the rise and fall of popular stocks, consider enlisting the services of a trusted broker like FXOpen.
CFDs are complex instruments and come with a high risk of losing your money.
This article represents the opinion of the Companies operating under the FXOpen brand only. It is not to be construed as an offer, solicitation, or recommendation with respect to products and services provided by the Companies operating under the FXOpen brand, nor is it to be considered financial advice.