
#nvidia #NVDA #stocktrading #stockmarket #MarketUpdates #marketanalysis
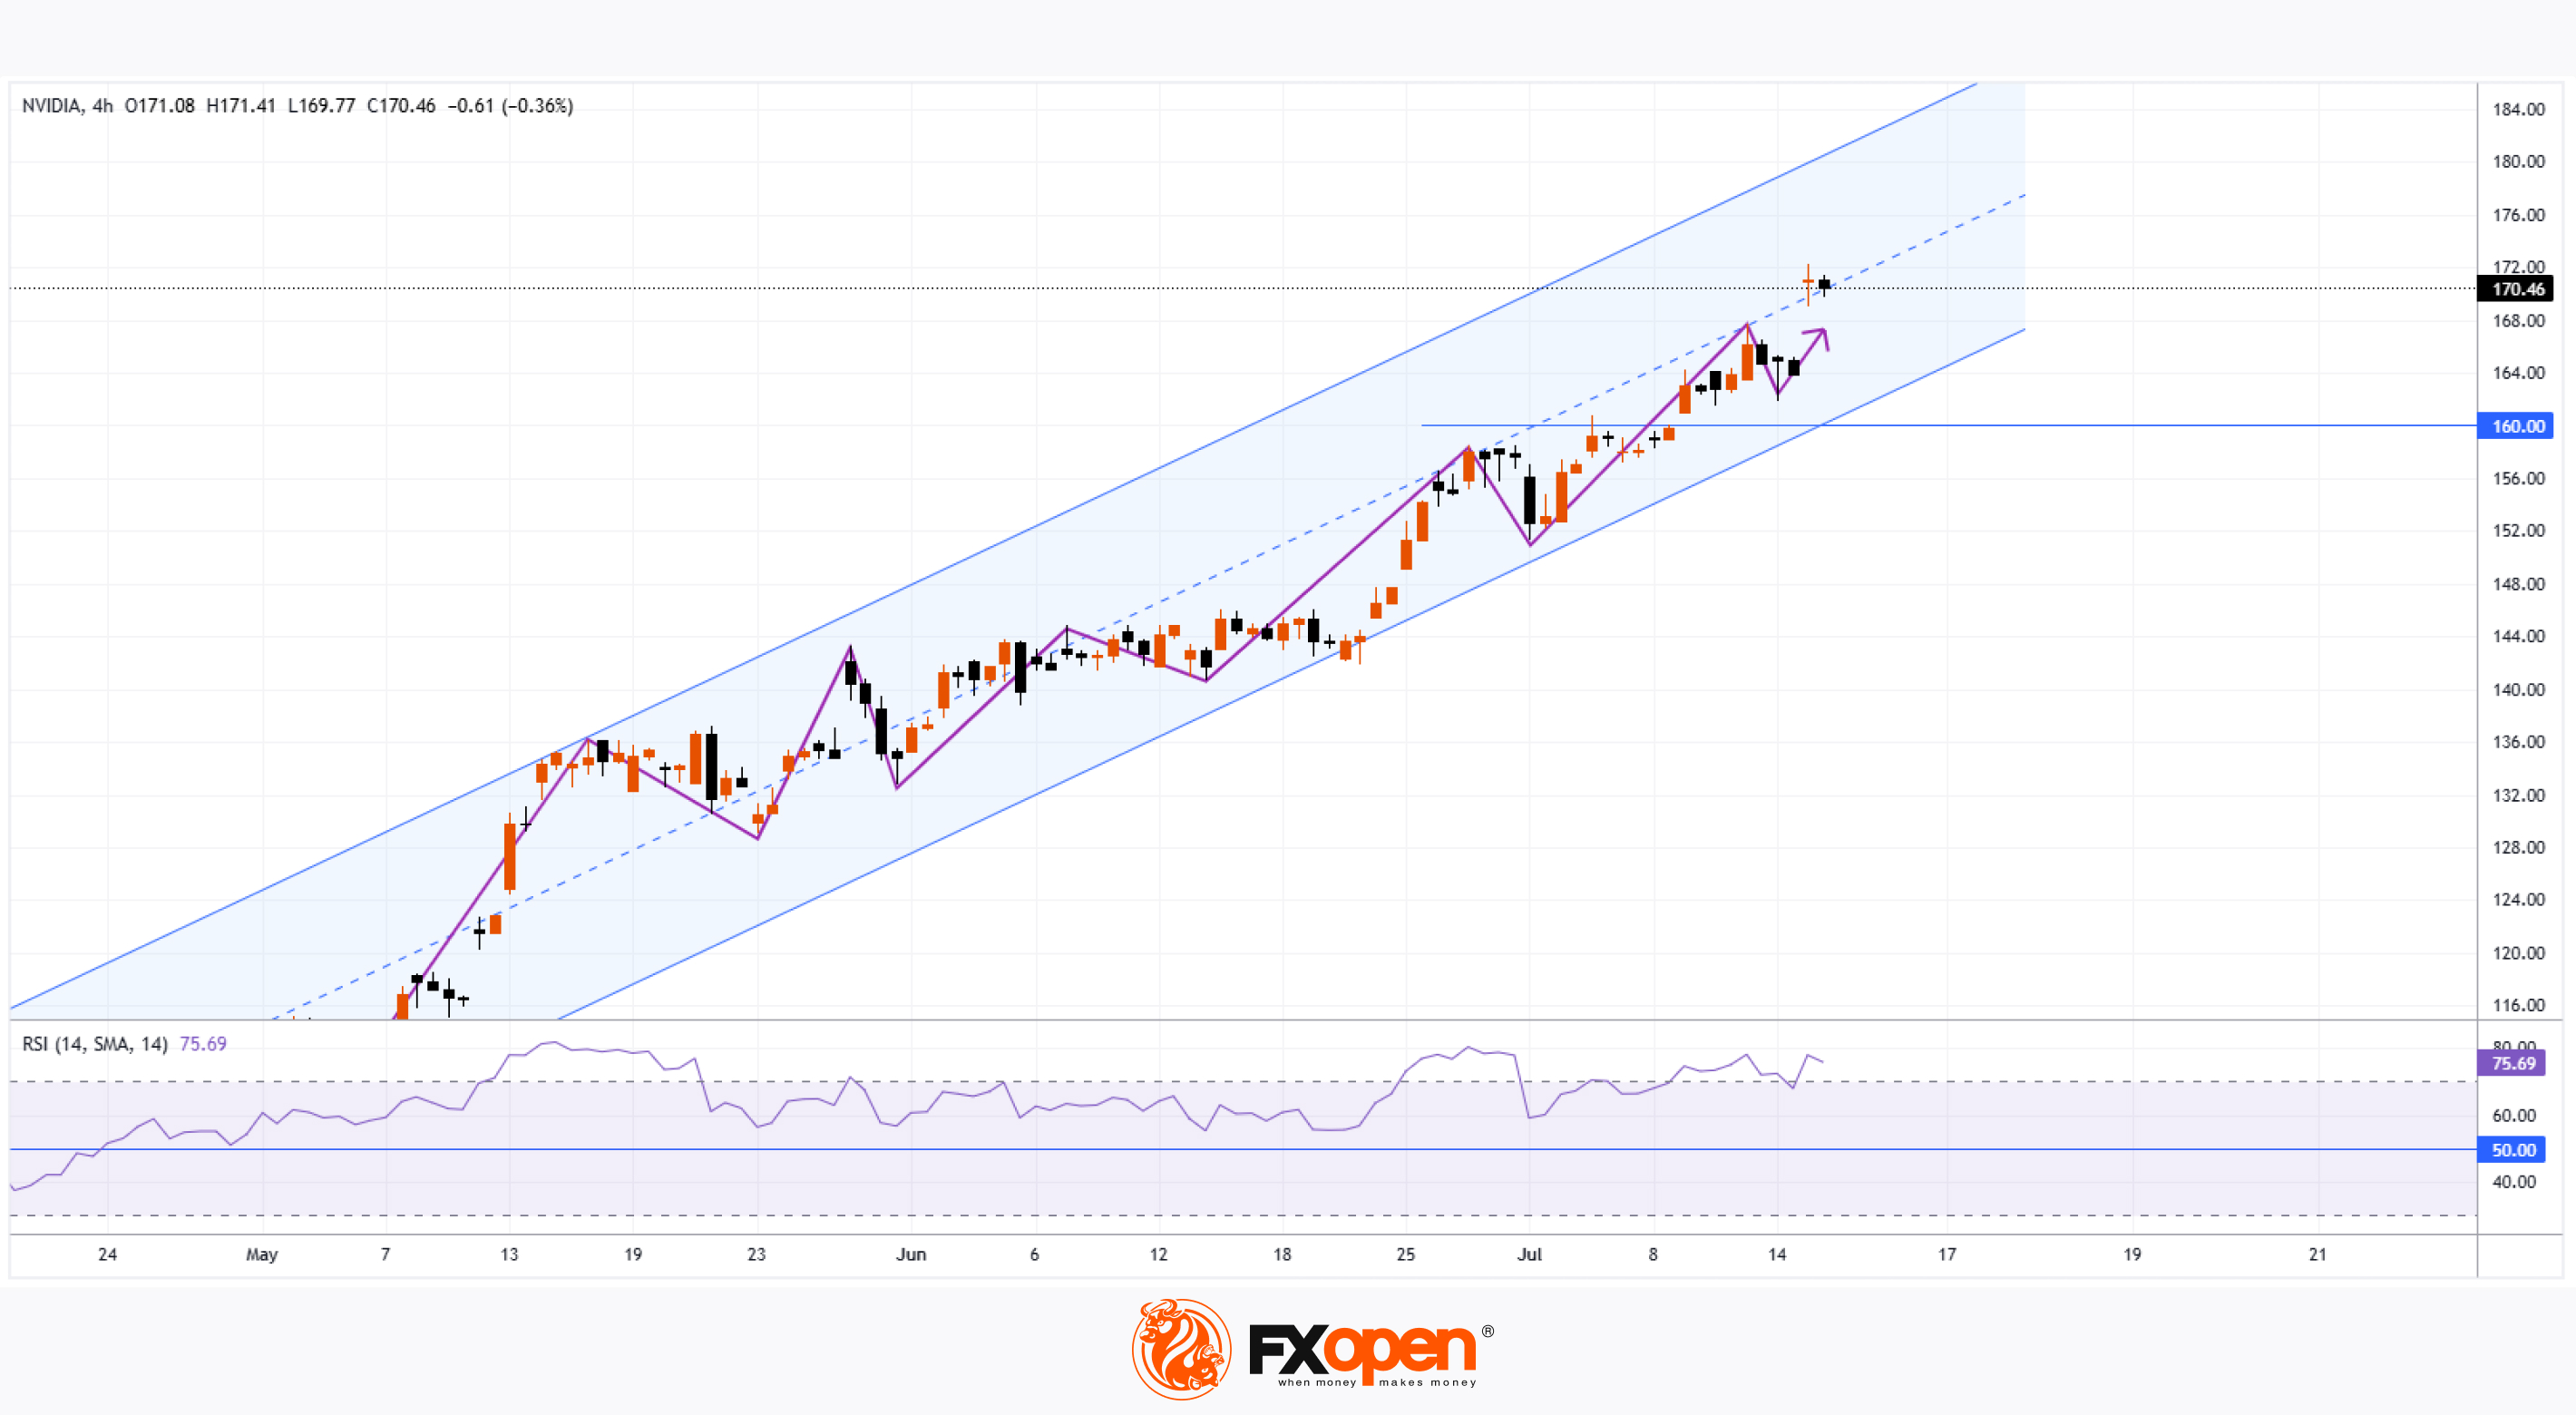
Nvidia (NVDA) Share Price Surges Above $170
Yesterday, Nvidia’s (NVDA) share price rose by more than 4%, with the following developments:
→ It surpassed the psychological level of $170 per share;
→ Reached another all-time high;
→ Gained more than 9% since the beginning of the month.
The bullish sentiment is driven by Nvidia CEO Jensen Huang’s visit to China shortly after meeting with US President Trump. At the same time:
→ US Secretary of Commerce Howard Lutnick stated that the planned resumption of sales of Nvidia H20 AI chips in China is part of the US negotiations on rare earth metals.
→ The head of Nvidia stated that he was assured licences would be granted very quickly, and that a large number of orders for H20 chip deliveries had already been received from Chinese companies.
Market participants are viewing the situation with strong optimism, and analysts are raising their valuations for NVDA shares:
→ Morningstar analysts raised their fair value estimate for Nvidia shares from $140 to $170.
→ Oppenheimer analysts increased their target price from $170 to $200.
Technical Analysis of the NVDA Chart
The price trajectory of NVDA shares fully reflects the exceptionally strong demand:
→ The price is moving within an ascending channel with a steep growth angle;
→ Since early May, the RSI indicator on the 4-hour chart has not fallen below the 50 level;
→ Yesterday’s trading session opened with a large bullish gap.
The chart also shows the formation of a stable bullish market structure (shown with a purple broken line), expressed through a sequence of higher highs and higher lows.
Given the above, it is difficult to imagine what might cause a sharp shift from positive to negative sentiment. If a correction begins (for example, with a test of the $160 level), traders should watch for signs of its completion — this could present an opportunity to join the emerging rally.
Trade global index CFDs with zero commission and tight spreads. Open your FXOpen account now or learn more about trading index CFDs with FXOpen.
CFDs are complex instruments and come with a high risk of losing your money.
This article represents the opinion of the Companies operating under the FXOpen brand only. It is not to be construed as an offer, solicitation, or recommendation with respect to products and services provided by the Companies operating under the FXOpen brand, nor is it to be considered financial advice.
👍2
#nvidia #NVDA #stocktrading #marketanalysis #MarketNews
Nvidia (NVDA) Share Price Growth Slows
Equity markets are on the rise:
→ The S&P 500 index (US SPX 500 mini on FXOpen) has reached a new all-time high;
→ The Nikkei 225 (Japan 225 on FXOpen) hit a fresh record high yesterday;
→ Gains are also seen across other assets — for example, Ethereum has climbed to its highest level since November 2021.
The CNN Fear & Greed Index indicates market “greed”, but it is worth noting that one of the market leaders, Nvidia (NVDA), is not matching the broader bullish momentum.
Technical Analysis of Nvidia (NVDA)
Although NVDA’s share price remains within a long-term ascending channel (shown in blue), holders have valid reasons for concern.
The NVDA chart shows that price growth is capped by the $183 resistance level, with a series of bearish signals emerging (as indicated by the arrows):
→ Following a bullish gap in late July, the price failed to sustain its highs and quickly retreated, erasing the upbeat sentiment;
→ A bearish engulfing pattern on 7 August suggests that the median line of the ascending channel is acting as resistance;
→ The RSI indicator peaked on 29 July, but subsequent price increases have not been accompanied by higher RSI highs — a sign of bearish divergence.
As a result, NVDA price is consolidating within a narrowing triangle:
→ On the one hand, higher lows indicate that buyers are still supporting the price;
→ On the other hand, the $183 level continues to cap the advance of this market leader despite the broader bullish environment.
Bulls need to show determination soon to break through the key $183 resistance; otherwise, the ascending channel in place since early July risks being breached. In that scenario, the August low near $172 could be retested.
Trade global index CFDs with zero commission and tight spreads. Open your FXOpen account now or learn more about trading index CFDs with FXOpen.
CFDs are complex instruments and come with a high risk of losing your money.
This article represents the opinion of the Companies operating under the FXOpen brand only. It is not to be construed as an offer, solicitation, or recommendation with respect to products and services provided by the Companies operating under the FXOpen brand, nor is it to be considered financial advice.

👍2
#nvidia #NVDA #stockmarket #stocktrading #marketanalysis
Nvidia (NVDA) Upcoming Earnings Report
Tomorrow after hours, Nvidia will release its quarterly report, attracting heightened attention given its position as:
→ the world’s largest company (market capitalisation of around $4.39 trillion);
→ a leader in the development of AI-related industries;
→ strong stock price performance — approximately +33% year-to-date, +108% from the yearly low.
Bullish Expectations
Analysts anticipate Nvidia will report revenue of around $46 billion, more than 50% higher than the same period last year.
Investors are counting on confirmation of robust demand for Nvidia’s chips from tech giants such as Microsoft, Google, Amazon, and Meta, all of which continue to expand capital expenditure on data centres to power AI workloads.
Further support for NVDA’s share price could come from positive news about demand for the new Blackwell chips and the resumption of sales in China following a recent agreement with the US government.
Bearish Concerns
Even strong results may fall short of “sky-high” optimistic expectations, potentially triggering profit-taking and a decline in Nvidia’s (NVDA) stock price. The stock trades at a high P/E multiple (price-to-earnings ratio), making it vulnerable to any negative news or even a minor miss against forecasts.
The primary concern is that Nvidia’s forward guidance might point to a slowdown in AI infrastructure spending growth by its key clients. Any hint of this could negatively affect not only Nvidia’s shares but also the broader technology sector.
Technical Analysis of Nvidia (NVDA) Chart
NVDA’s share price remains within an upward channel (shown in blue), with the following configuration:
→ until mid-August, the price remained within the upper half of the channel;
→ in August, the price declined towards the lower boundary (point A).
The $170 level appears to be a key support:
→ it is a round psychological level;
→ the low at point A looks like an aggressive test of this level, after which the price reversed upward.
From a bullish perspective:
→ support is provided by the lower boundary of the channel;
→ a long bullish candlestick (2) signals persistent demand.
From a bearish perspective, the $183 level looks like key resistance: NVDA’s share price slowed its advance here in early August, with repeated unsuccessful attempts to break higher.
Given the above, we could assume that the bulls may attempt to push through the $183 resistance on the back of the earnings release, but to do so, Nvidia’s results and guidance must at least meet the market’s extremely optimistic expectations.
Trade global index CFDs with zero commission and tight spreads. Open your FXOpen account now or learn more about trading index CFDs with FXOpen.
CFDs are complex instruments and come with a high risk of losing your money.
This article represents the opinion of the Companies operating under the FXOpen brand only. It is not to be construed as an offer, solicitation, or recommendation with respect to products and services provided by the Companies operating under the FXOpen brand, nor is it to be considered financial advice.
👍2
#nvidia #NVDA #stockmarket #stocktrading #marketanalysis #MarketNews
Nvidia (NVDA) Shows Bearish Signs After Earnings Release
On Wednesday, Nvidia published a fairly strong quarterly report:
→ Revenue for the second quarter came in at $46.74 billion (record), up 56% compared with the same period last year;
→ Adjusted earnings per share (EPS) were $1.05, a 54% year-on-year increase and above analysts’ expectations of $1.01–$1.02.
However, in the Data Centre segment (closely watched by the market), results fell slightly short of Wall Street forecasts, which may suggest a slowdown in capital flows into AI infrastructure. This factor could explain why Nvidia (NVDA) underperformed the index later in the week: for instance, the S&P 500 hit a record high on Thursday, while NVDA closed lower.
Technical analysis of Nvidia (NVDA) chart
Six days ago, we:
→ Drew an upward channel (shown in blue), capturing NVDA’s price swings after the bullish surge at the end of June;
→ Highlighted the importance of support at $170 and resistance at $183.
Indeed, $183 looks like a solid barrier:
→ The numbers (1, 2, 3) mark failed attempts by the bulls to break through this resistance, giving grounds to view the chart in the context of a triple top pattern.
→ The third peak only slightly exceeds the previous highs, which resembles a bull trap and the Upthrust After Distribution (UTAD) pattern in Richard Wyckoff’s methodology, signalling the prospect of lower prices. A bearish gap the following day (shown by the red arrow) and a weak Friday close underline the bears’ aggression.
Given the above, we could assume that the bulls may try to keep the price within the channel, relying on support at its lower boundary. Yet the mentioned signals suggest that the bears are intensifying pressure. If we see only a weak rebound from the lower boundary at the start of September, the current channel could be at risk. In the event of a bearish breakout, a move down to test the $170 support could happen.
Trade global index CFDs with zero commission and tight spreads. Learn more about trading index CFDs with FXOpen.
CFDs are complex instruments and come with a high risk of losing your money.
This article represents the opinion of the Companies operating under the FXOpen brand only. It is not to be construed as an offer, solicitation, or recommendation with respect to products and services provided by the Companies operating under the FXOpen brand, nor is it to be considered financial advice.
👍2
#NVDA #nvidia #stockmarket #stocktrading #marketanalysis #MarketUpdates
Nvidia (NVDA) Shares Surpass $200 for the First Time
Yesterday, Nvidia’s (NVDA) share price climbed above the psychological threshold of $200 for the first time, pushing the company’s market capitalisation close to $5 trillion.
Why Are NVDA Shares Rising Today?
Several bullish factors are driving Nvidia’s share price higher:
→ Massive order backlog: The company reported pre-orders for its AI processors totalling an astonishing $500 billion.
→ Strategic partnership with the US government: CEO Jensen Huang announced plans to build seven AI supercomputers for the US Department of Energy.
→ Expansion into telecoms: Nvidia has invested $1 billion in Nokia, acquiring a 2.9% stake in the Finnish company to jointly develop AI-RAN and 6G technologies.
Technical Analysis of Nvidia (NVDA)
Back on 23 September, our analysis of the NVDA chart identified:
→ an upward channel outlining the stock’s price movements this autumn;
→ a breakout from a Bullish Flag pattern (shown in red);
→ a projection that strong fundamentals, the rapid advance of AI technology, and expectations of a Fed rate cut could enable bulls to overcome the $183 resistance level and target the psychological $200 mark.
That projection has materialised since:
→ the Bullish Flag breakout level has acted as support (marked with a bold blue line);
→ NVDA price swings have provided anchor points to refine the current channel.
What’s Next for Nvidia Shares?
Note the bullish gaps (highlighted by arrows) that indicate a demand imbalance. The rapidly strengthening upward momentum could drive NVDA’s share price towards the upper boundary of the channel, particularly as several major events approach today:
→ the Federal Reserve’s interest rate decision and subsequent press conference;
→ quarterly earnings releases from Microsoft (MSFT), Alphabet (GOOGL), and Meta Platforms (META), all of which are expected to reaffirm their commitment to AI development.
Trade global index CFDs with zero commission and tight spreads. Learn more about trading index CFDs with FXOpen.
CFDs are complex instruments and come with a high risk of losing your money.
This article represents the opinion of the Companies operating under the FXOpen brand only. It is not to be construed as an offer, solicitation, or recommendation with respect to products and services provided by the Companies operating under the FXOpen brand, nor is it to be considered financial advice.
👍2
#NVDA #nvidia #stockmarket #stocktrading #marketanalysis
Ahead of Nvidia’s (NVDA) Earnings: How the Price Could Move
On Wednesday, after the close of the main US trading session, Nvidia will release its quarterly results — a report seen not merely as another batch of corporate data but as a crucial test for the entire AI-driven bull run.
NVDA shares are up more than 40% since the start of the year, and the company must now prove that this surge is justified and that the AI revolution is still accelerating. According to media reports, Wall Street analysts remain optimistic:
→ Revenue: forecast around $54.9bn, implying roughly 56% year-on-year growth.
→ Earnings per share (EPS): about $1.25 (previous quarter: $1.05).
What should investors focus on?
Of particular importance will be:
→ data on Data Centre revenue, a key indicator of whether the AI boom remains intact;
→ forward guidance, as the market is looking for reassurance that Big Tech will continue to spend heavily on AI.
Technical Analysis of the Nvidia (NVDA) Chart
Recent price action in NVDA points to a sequence that can be interpreted as bearish:
→ 28 October: a strong rally above the psychological $200 level;
→ a failure to hold above that barrier;
→ a pullback on rising volumes (Nasdaq data) with expanding candles in early November.
In the broader market context, it is notable that early November has seen NVDA underperforming major equity indices, signalling firm resistance from sellers around $200.
From a bullish perspective, the decline from the all-time high resembles a correction pattern (shown in red) within a larger uptrend.
However, there is a risk that the market’s high expectations will not be met when the earnings report is published. If that happens, NVDA could extend its decline towards the lower boundary of the rising channel, where support lies near $165.
Trade global index CFDs with zero commission and tight spreads. Learn more about trading index CFDs with FXOpen.
CFDs are complex instruments and come with a high risk of losing your money.
This article represents the opinion of the Companies operating under the FXOpen brand only. It is not to be construed as an offer, solicitation, or recommendation with respect to products and services provided by the Companies operating under the FXOpen brand, nor is it to be considered financial advice.
👍3
#NVDA #nvidia #stockmarket #AI #stocks #marketanalysis #MarketNews
Tech Stocks Rally After Nvidia’s Earnings Report
As the chart shows, the Nasdaq 100 index (US Tech 100 mini on FXOpen) is displaying positive momentum today. A strong catalyst for growth arrived with the release of Nvidia’s quarterly report, which exceeded Wall Street’s optimistic expectations.
Nvidia reported quarterly revenue of $57bn (vs. the expected $54.9bn), and earnings per share of $1.30 (forecast: $1.26). Meanwhile, CEO Jensen Huang stated that demand for the new Blackwell chips is “off the charts”.
Nvidia’s strong report revived “risk appetite” in the tech sector and eased concerns about a potential AI bubble.
Technical Analysis of the Nasdaq 100 Chart
Analysing the hourly chart of the Nasdaq 100 (US Tech 100 mini on FXOpen) two days earlier, we:
→ noted that the previously active upward channel had broadened downwards;
→ suggested a scenario in which the bulls might attempt to return the index to an upward trajectory if Nvidia’s quarterly results were strong.
Yesterday’s report from the equity market leader confirmed that demand for artificial intelligence infrastructure remains enormous, paving the way for the tech-sector rally to continue.
From the standpoint of supply pressure, resistance may come from:
→ the upper red line drawn through the lower November highs;
→ the 25,400 level, which had acted as local support but was decisively broken by a large bearish candle.
On the other hand:
→ the decline towards 24,400 once again activated buying interest;
→ the November drop may prove to be only an intermediate correction, after which the upward trend could resume.
Whether the bulls can maintain positive momentum in the Nasdaq 100 (US Tech 100 mini on FXOpen) following Nvidia’s strong quarterly figures will depend largely on the outcome of the delayed September US employment report, postponed due to the shutdown.
Trade global index CFDs with zero commission and tight spreads. Learn more about trading index CFDs with FXOpen.
CFDs are complex instruments and come with a high risk of losing your money.
This article represents the opinion of the Companies operating under the FXOpen brand only. It is not to be construed as an offer, solicitation, or recommendation with respect to products and services provided by the Companies operating under the FXOpen brand, nor is it to be considered financial advice.
👍1
#nvidia #NVDA #stockmarket #stocktrading #marketanalysis #MarketNews
Analysis of the Nvidia (NVDA) Share Chart
Last week, we published a post titled “Ahead of Nvidia’s (NVDA) Earnings: How the Price Could Move”, in which we:
→ Drew an ascending channel (shown in blue);
→ Suggested that market participants’ overly high expectations would likely not be met when earnings were released, leading to a decline in NVDA’s price towards the lower boundary of the ascending channel, where support lies at $165.
In reality, the earnings report turned out to be very strong:
→ Gross revenue: actual = $57bn, forecast = ~$54.9bn.
→ Earnings per share (EPS): actual = $1.30, forecast = $1.26 (previous quarter = $1.05).
The surge in price with a bullish gap towards point A reflected the initial reaction to the strong figures, but the share price then began to fall (reaching a two-month low), thereby confirming our expectations.
Technical Analysis of the Nvidia (NVDA) Chart
An analysis of NVDA’s price action suggests that the current situation can be viewed as a correction (shown with red lines), forming within an expanded ascending channel.
If NVDA’s share price declines towards the $165 level, where the lower boundary of the channel lies, this could encourage the bulls to attempt to resume the 2025 uptrend and mount a new push towards the psychological $200 mark.
Trade global index CFDs with zero commission and tight spreads. Learn more about trading index CFDs with FXOpen.
CFDs are complex instruments and come with a high risk of losing your money.
This article represents the opinion of the Companies operating under the FXOpen brand only. It is not to be construed as an offer, solicitation, or recommendation with respect to products and services provided by the Companies operating under the FXOpen brand, nor is it to be considered financial advice.
👍3
#nvidia #NVDA #stockmarket #AI #marketanalysis #MarketNews
Nvidia (NVDA) Shares Rise On Potential Chip Shipments to China
According to Reuters sources, Nvidia has informed Chinese clients of plans to begin shipments of its H200 chips by mid-February 2026. This has been made possible by a recent change in US export policy, which allows the sale of advanced technologies provided a special 25% duty is paid.
NVDA shares reacted positively to the news, as the ability to legally sell high-performance chips — which are roughly six times more powerful than the previously approved, cut-down H20 versions — to major players such as Alibaba and ByteDance could significantly boost Nvidia’s revenues.
Technical Analysis of Nvidia (NVDA)
In November, we identified an ascending price channel, which remains intact.
Today, the NVDA chart shows clear signs of demand dominance:
→ the price reversed higher (as indicated by the arrow) before reaching the lower boundary of the channel, with the $170 level acting as support;
→ bullish gaps were formed at the open of the last two sessions.
Particular attention should be paid to the candle of 19 December:
→ trading volumes were exceptionally high;
→ the candle body was wide, with the session opening at the low and closing at the high.
If the decline from the all-time high is viewed as a corrective “bull flag” pattern (marked in red), it is notable that the price is now testing the upper boundary of that flag. In this context, it is reasonable to assume that if buying pressure remains strong, the price could break out of the correction and move towards the median of the long-term uptrend that has been in place throughout 2025.
Trade global index CFDs with zero commission and tight spreads*. Learn more about trading index CFDs with FXOpen. *Additional fees may apply.
CFDs are complex instruments and come with a high risk of losing money rapidly due to leverage. You should consider whether you understand how CFDs work, and whether you can afford to take the high risk of losing your money. You can find the full disclaimer here: www.fxopen.com
This article represents the opinion of the Companies operating under the FXOpen brand only. It is not to be construed as an offer, solicitation, or recommendation with respect to products and services provided by the Companies operating under the FXOpen brand, nor is it to be considered financial advice.
👍2
#nvidia #NVDA #stockmarket #stocktrading #marketanalysis #MarketNews
Nvidia (NVDA) Shares Fall to a Year-to-Date Low
As the Nvidia (NVDA) share price chart shows, the stock fell below $177 during yesterday’s session, marking its lowest level since the start of 2026.
Negative market sentiment is largely driven by uncertainty surrounding supplies to China. According to the Financial Times, Nvidia’s sales of H200 chips to China are still awaiting final approval from US authorities.
Yesterday’s statement from AMD, noting that the scale of its own shipments to China remains uncertain, reinforced these concerns and added further pressure to Nvidia shares. Previously, NVDA had been supported by expectations that deliveries of H200 chips to Chinese partners would begin in early 2026.
In addition, some media reports suggest that the stock is facing extra pressure from news of delayed investment in OpenAI, which is reportedly exploring alternative suppliers.
Technical Analysis of the Nvidia (NVDA) Chart
On 23 December, when analysing NVDA price action, we:
→ reaffirmed the long-term ascending channel, which remains intact;
→ suggested that bulls might attempt to break out of the corrective pattern (shown in red) in order to reach the channel median.
As expected (indicated by the black arrow), the price reached this target. However, January’s price behaviour offers little evidence that the uptrend has resumed with renewed strength.
Moreover, the red arrows highlight several bearish signals:
→ the median acted as clear resistance;
→ the 30 January peak (the highest level since the start of the year) formed with a long upper shadow, resulting in a false break of the previous high — a classic “bull trap”.
While bearish momentum appears to be in control, it is worth noting that:
→ the break below the 20 January low could also prove to be false;
→ the lower boundary of the channel, which has acted as key support for many months, is nearby.
Taking all of this into account, it is reasonable to assume that NVDA may find a period of consolidation in the lower quarter of the channel. A potential catalyst for the next major move could be the company’s earnings release scheduled for 25 February.
Trade global index CFDs with zero commission and tight spreads*. Learn more about trading index CFDs with FXOpen. *Additional fees may apply.
CFDs are complex instruments and come with a high risk of losing money rapidly due to leverage. You should consider whether you understand how CFDs work, and whether you can afford to take the high risk of losing your money. You can find the full disclaimer here: www.fxopen.com
This article represents the opinion of the Companies operating under the FXOpen brand only. It is not to be construed as an offer, solicitation, or recommendation with respect to products and services provided by the Companies operating under the FXOpen brand, nor is it to be considered financial advice.
👍2
#NVDA #nvidia #stockmarket #stocktrading #MarketNews #marketanalysis
Nvidia (NVDA) Shares Rise Towards a Key Resistance Level
As the Nvidia (NVDA) share chart shows, during yesterday’s trading session the price advanced towards a key resistance area around $192.50, where notable peaks were formed in December 2025 and January 2026. The move was supported by several factors that boosted optimism:
→ Comments from company management. Nvidia CEO Jensen Huang stated that rising spending on AI is justified and reflects a long-term growth phase for the industry.
→ Goldman Sachs analyst Jim Schneider expects Nvidia’s fourth-quarter revenue to exceed forecasts and surpass $67 billion, and also anticipates strong sales and profit figures in the first quarter of the 2026 financial year.
Technical Analysis of the Nvidia (NVDA) Chart
On the morning of 4 February, when analysing NVDA price movements, we:
→ updated the long-term ascending channel, which remains intact;
→ noted the proximity of its lower boundary, which had acted as a key support level for many months;
→ suggested that NVDA’s price could stabilise in the lower quarter of the channel.
Since then:
→ between 4 and 6 February, the price moved sideways near the lower boundary of the channel, reflecting a balance between supply and demand;
→ following a false break below the December low, the share price staged a sharp rebound, signalling the dominance of buying pressure.
It is reasonable to assume that:
→ the initiative is currently on the side of the bulls, who appear determined to resume the long-term upward trend;
→ if another attempt is made to break through the aforementioned resistance level, it is likely to succeed, opening the way for NVDA shares to move towards the psychological $200 mark.
The realisation of this scenario could be supported by positive sentiment ahead of Nvidia’s earnings release on 25 February and the GTC 2025 conference in mid-March, when new product announcements may be made.
Trade global index CFDs with zero commission and tight spreads*. Learn more about trading index CFDs with FXOpen. *Additional fees may apply.
CFDs are complex instruments and come with a high risk of losing money rapidly due to leverage. You should consider whether you understand how CFDs work, and whether you can afford to take the high risk of losing your money. You can find the full disclaimer here: www.fxopen.com
This article represents the opinion of the Companies operating under the FXOpen brand only. It is not to be construed as an offer, solicitation, or recommendation with respect to products and services provided by the Companies operating under the FXOpen brand, nor is it to be considered financial advice.
👍2🔥1
Media is too big
VIEW IN TELEGRAM
Daily Market News with FXOpen - 26 February 2026
🔸 Dow, S&P 500, Nasdaq futures wobble after Nvidia's big earnings, forecast beats;
🔸 Asian shares mostly rise after Nvidia earnings beat expectations;
🔸 Yen recovers against dollar with BoJ policy in view.
CFDs are complex instruments and come with a high risk of losing money rapidly due to leverage. You should consider whether you understand how CFDs work, and whether you can afford to take the high risk of losing your money. You can find the full disclaimer here: www.fxopen.com.
#StockMarket #WallStreet #SP500 #Nasdaq #DowJones #Nvidia #AsianMarkets #AIStocks #ForexMarket
👍2
#NVDA #nvidia #stockmarket #stocktrading #marketanalysis #MarketNews
Nvidia (NVDA) Shares Surpass $200 in After-Hours Trading Following Earnings Report
Yesterday, the world’s most valuable company, Nvidia, released its quarterly earnings, which exceeded expectations:
→ Earnings per share: actual = $1.62 (forecast = $1.53);
→ Revenue: actual = $68.13 billion (forecast = $66.13 billion).
Sentiment was further supported by the chipmaker’s guidance for first-quarter revenue above market estimates, reflecting continued heavy spending by major technology companies on artificial intelligence processors.
As the Nvidia (NVDA) share price chart shows, the stock rose above the psychological $200 level in after-hours trading, but subsequently pulled back, which may point to excessive optimism and aggressive selling pressure.
Technical Analysis of the Nvidia (NVDA) Chart
On 10 February, when analysing NVDA price movements, we:
→ reaffirmed the validity of the long-term ascending channel (which remains intact) and highlighted the importance of the $192.50 resistance level;
→ suggested that the initiative was on the side of the bulls, who were aiming to resume the long-term uptrend towards the psychological $200 mark.
Since then:
→ NVDA formed a pullback from the указанного resistance level towards the 50–61.8% Fibonacci retracement zone;
→ on 17 February, it resumed its advance, supported by a short-term ascending channel (marked in black), ultimately reaching $200.
Overall, the picture appears constructive, and the next potential target for NVDA may be the median line of the long-term channel. However, it is worth recalling the recent experience of other technology giants whose shares rallied briefly after earnings before turning lower (for example, Meta). The sharp reversal from above the $200 mark lends weight to this scenario.
Therefore, if bulls are to confirm control over NVDA shares, it is important for the price to hold above the $192.50 level.
Trade global index CFDs with zero commission and tight spreads*. Learn more about trading index CFDs with FXOpen. *Additional fees may apply.
CFDs are complex instruments and come with a high risk of losing money rapidly due to leverage. You should consider whether you understand how CFDs work, and whether you can afford to take the high risk of losing your money. You can find the full disclaimer here: www.fxopen.com
This article represents the opinion of the Companies operating under the FXOpen brand only. It is not to be construed as an offer, solicitation, or recommendation with respect to products and services provided by the Companies operating under the FXOpen brand, nor is it to be considered financial advice.
👍3
Media is too big
VIEW IN TELEGRAM
Daily Market News with FXOpen - 27 February 2026
🔸 Netflix drops Warner Bros. bid, leaving Paramount the winner;
🔸 Dow, S&P 500, Nasdaq futures slide after Nvidia-led slump dampens AI mood again;
🔸 Gold inches higher as US and Iran agree to prolong nuclear talks.
CFDs are complex instruments and come with a high risk of losing money rapidly due to leverage. You should consider whether you understand how CFDs work, and whether you can afford to take the high risk of losing your money. You can find the full disclaimer here: www.fxopen.com.
#StockMarket #WallStreet #Nasdaq #DowJones #Nvidia #Netflix #Paramount #GoldPrices #Geopolitics
👍3
#NVDA #nvidia #stockmarket #stocktrading #marketanalysis #MarketNews
Nvidia (NVDA) Shares Set a March High
Nvidia shares experienced heightened volatility yesterday, with the price jumping to a March high during the Nvidia GTC 2026 conference, where Jensen Huang made several major announcements. According to media reports:
→ Nvidia unveiled a next-generation platform named after the astronomer Vera Rubin. The new chips are designed for “agentic AI” (AI agents).
→ The company expects total orders for current-generation AI systems (Blackwell) and next-generation systems (Vera Rubin) to reach $1 trillion by 2027. This is double the company’s previous $500 billion forecast announced earlier.
→ Huang also noted that market demand is shifting. While chips were previously purchased mainly for training AI models, demand is now increasingly driven by companies such as OpenAI, Meta and Anthropic, which must serve hundreds of millions of users in real time.
As the NVDA chart shows, the share price rose above the $188.50 level, but later pulled back, which may suggest excessive optimism among buyers and aggressive selling pressure.
Technical Analysis of Nvidia (NVDA)
On the morning of 26 February, while analysing NVDA price movements following the quarterly earnings release, we:
→ updated the long-term ascending channel (which remains intact);
→ pointed to the negative experience of other tech giants earlier in 2026, whose shares rallied briefly after earnings before turning lower (for example, Meta);
→ suggested that if bulls wanted to confirm control of NVDA, it would be important to keep the price above the $192.50 level.
During the main trading session that same day, the $192.50 level was broken by bears on a wide candle accompanied by rising volumes, confirming these concerns. Moreover, the downward momentum continued the following day, eventually leading to the A→B swing.
Overall, bulls still have reasons to remain calm, as:
→ the fundamental backdrop remains optimistic;
→ the lower boundary of the ascending channel continues to act as strong support.
However, the NVDA price chart also presents some warning signs:
→ peak A may represent a bull trap;
→ yesterday’s candle with a long upper shadow could also signal a similar trap.
If this proves to be the case, a test of the lower boundary of the channel would be a logical next step. Such a scenario could significantly alter sentiment in the NVDA stock market.
Trade global index CFDs with zero commission and tight spreads*. Learn more about trading index CFDs with FXOpen. *Additional fees may apply.
CFDs are complex instruments and come with a high risk of losing money rapidly due to leverage. You should consider whether you understand how CFDs work, and whether you can afford to take the high risk of losing your money. You can find the full disclaimer here: www.fxopen.com
This article represents the opinion of the Companies operating under the FXOpen brand only. It is not to be construed as an offer, solicitation, or recommendation with respect to products and services provided by the Companies operating under the FXOpen brand, nor is it to be considered financial advice.
👍1
21_05.mp4
93.9 MB
Daily Market News with FXOpen - 21 May 2026
🔸 Stocks Climb on Nvidia Earnings, Samsung Strike Suspension;
🔸 European Markets Open Lower as Oil Prices Fall Below $100;
🔸 Gold Eases on Higher Yields, Firm Dollar; US-Iran Talks in Focus.
CFDs are complex instruments and come with a high risk of losing money rapidly due to leverage. You should consider whether you understand how CFDs work, and whether you can afford to take the high risk of losing your money. You can find the full disclaimer here: www.fxopen.com.
#StockMarket #Nvidia #Samsung #Trading #Investing #Gold #OilPrices #Forex #MarketNews
👍2
#nvidia #NVDA #stockmarket #stocktrading #stocks #MarketNews
NVIDIA: Record Revenue Sustains Interest, but Shares Remain Under Pressure
NVIDIA's revenue for the first quarter of fiscal year 2027 surged by 85% to $81.62 billion, marking another record quarter for the company. Adjusted earnings per share came in at $1.87, exceeding the Wall Street consensus forecast of $1.76. The primary driver of growth remains the data centre segment based on the Blackwell architecture, which accounts for approximately 92% of the company's total revenue.
At the same time, uncertainty surrounding the Chinese market persists. Although small batches of H200 chips intended for Chinese customers received approval from US regulators, the company has yet to recognise any revenue from these shipments. Regulatory considerations therefore remain a key source of caution in investor assessments.
Technical Outlook
On the four-hour chart, an upward structure has been evident since April. The share price advanced from lows around 165 to May highs near 236, forming a series of higher lows. The ascending trendline drawn through the key support points of this move is currently being tested, with the price attempting to break below it.
The red resistance level around 232 and the green support level near 205 represent the nearest reference points within the current trading range. The Point of Control (POC) zone at 221–222 and the upper boundary of the volume profile around 225 could serve as intermediate targets should a recovery develop.
The price is currently trading below the lower boundary of the volume profile, which may act as the nearest stabilisation area if retested. The RSI indicator and moving averages are showing readings of 41, 48 and 50 respectively. The oscillator remains below the neutral zone, although the indicator's average lines do not yet confirm the emergence of a clear directional trend.
Key Takeaways
The record earnings report was not enough to prevent a correction in NVIDIA shares, suggesting that the market had been anticipating even stronger results. Meanwhile, regulatory uncertainty regarding shipments to China remains in place. Future price performance will largely depend on how resilient demand from hyperscalers proves to be in the absence of meaningful revenue contributions from the Chinese market.
Trade global index CFDs with zero commission and tight spreads*. Learn more about trading index CFDs with FXOpen. *Additional fees may apply.
CFDs are complex instruments and come with a high risk of losing money rapidly due to leverage. You should consider whether you understand how CFDs work, and whether you can afford to take the high risk of losing your money. You can find the full disclaimer here: www.fxopen.com
This article represents the opinion of the Companies operating under the FXOpen brand only. It is not to be construed as an offer, solicitation, or recommendation with respect to products and services provided by the Companies operating under the FXOpen brand, nor is it to be considered financial advice.
👍1
#nvidia #NVDA #stockmarket #stocktrading #marketanalysis #MarketNews
NVIDIA: Kyber NVL144 Dispute Weighs on the Stock
NVIDIA shares found themselves at the centre of debate over the future of the Kyber NVL144 system. On 6 July, CNBC, citing research firm SemiAnalysis, reported that the project could be delayed by more than a year—from 2027 to 2028—due to manufacturing issues involving a specialised printed circuit board (PCB). NVIDIA firmly denied the claims, helping the stock recover more than 1%.
Sentiment was also supported by a Goldman Sachs note, which described NVIDIA's forward P/E ratio of 21.7 as attractive compared with its historical average (estimated by secondary sources at around 72). According to SemiAnalysis, a delay could provide competitors such as AMD and Google with a temporary opportunity to narrow the technology gap. However, the market's reaction suggests investors are, for now, placing greater confidence in NVIDIA's denial than in the reported production concerns.
Technical Outlook
On the H4 chart, NVIDIA (NVDA) had been trading within a descending corrective channel that developed after the mid-May peak near $236. Recently, however, the price attempted to break above the channel's upper boundary. Combined with a move above the upper edge of the current Market Profile at $202, this increases the possibility that the corrective structure is beginning to reverse.
If the bullish scenario unfolds, the next significant resistance levels could be located around $215 and $232. Below the current price, the Point of Control (POC) remains near $195, followed by two important support levels: the lower boundary of the Market Profile at $192 and the green support zone around $190.
It is also worth noting that vertical trading volume declined noticeably during the second half of the corrective channel, which may indicate weakening market participation. As a result, the move above the Market Profile could prove temporary unless supported by stronger buying activity. Meanwhile, the RSI + MAs indicator currently reads 52, 52, and 48, with all three lines clustered in neutral territory and not yet providing confirmation of the potential upside breakout.
Summary
The break above the descending channel is technically encouraging, but without stronger volume confirmation it could still prove to be a temporary move within a broader correction. The stock's next directional move will likely depend on whether the debate surrounding the Kyber NVL144 project develops further or gradually fades from investors' attention.
Trade global index CFDs with zero commission and tight spreads*. Learn more about trading index CFDs with FXOpen. *Additional fees may apply.
CFDs are complex instruments and come with a high risk of losing money rapidly due to leverage. You should consider whether you understand how CFDs work, and whether you can afford to take the high risk of losing your money. You can find the full disclaimer here: www.fxopen.com
This article represents the opinion of the Companies operating under the FXOpen brand only. It is not to be construed as an offer, solicitation, or recommendation with respect to products and services provided by the Companies operating under the FXOpen brand, nor is it to be considered financial advice.
👍1🔥1
#NVDA #nvidia #marketanalysis #stockmarket #stocks
Nvidia Earnings: Beating Isn't Enough — The Chart Wants More
All eyes turn to Wednesday, when Nvidia reports fiscal Q2 2027 earnings in what may be the single most consequential release of the quarter for the entire tech sector. Wall Street expects revenue of between $93–95 billion, implying year-over-year growth of as much as 67–100%, driven largely by demand for the company's Blackwell architecture and the early ramp-up of its next-generation Vera Rubin chips. With Nvidia commanding an estimated 80–81% share of the AI accelerator market, the report functions less like a single-company event and more like a health check for the entire AI infrastructure trade, historically moving shares of AMD, Broadcom, and Marvell in sympathy.
The stakes are amplified by timing: earnings land squarely alongside the Jackson Hole Economic Symposium, where Fed Chair Kevin Warsh's remarks could reshape rate expectations just as investors digest Nvidia's guidance. That combination matters because Nvidia's premium valuation, trading well above the broader semiconductor sector on a forward basis, leaves the stock unusually sensitive to shifts in the discount rate.
With shares up nearly 18% year-to-date but price targets still implying meaningful upside, the market has already priced in near-perfection. The real question isn't whether Nvidia beats, but whether beating is enough.
Technical Analysis of Nvidia
As the Nvidia chart shows, the stock has been compressing into a symmetrical triangle since April, with a descending trendline from the 236.31 high converging with an ascending trendline off the 164.45 low, both meeting right around the current price near 205–209, exactly where the 0.382 Fibonacci retracement sits at 208.86.
Bullish Scenario
Should buyers defend the ascending trendline and break decisively above the 0.382 retracement, the path would open toward a retest of the 220–228 highs from mid-August, with a stronger earnings reaction potentially targeting the 236.31 level, the origin of the entire pullback.
Bearish Scenario
Conversely, a break below the ascending trendline and the 0.382 level would expose the 0.5 retracement near 200.38, with a deeper slide risking a retest of the 0.618 level around 191.90 if the earnings reaction disappoints.
With price coiled right at the apex of this five-month triangle, sitting exactly on the 0.382 confluence just one day before earnings, Nvidia looks primed for one of its most decisive moves of the year. Will Wednesday's report finally resolve months of consolidation, or extend the standoff into September?
Trade global index CFDs with zero commission and tight spreads*. Learn more about trading index CFDs with FXOpen. *Additional fees may apply.
CFDs are complex instruments and come with a high risk of losing money rapidly due to leverage. You should consider whether you understand how CFDs work, and whether you can afford to take the high risk of losing your money. You can find the full disclaimer here: www.fxopen.com
This article represents the opinion of the Companies operating under the FXOpen brand only. It is not to be construed as an offer, solicitation, or recommendation with respect to products and services provided by the Companies operating under the FXOpen brand, nor is it to be considered financial advice.
👍3
#nvidia #NVDA #marketanalysis #MarketNews #stockmarket #stocks
NVIDIA Analysis: Attempted Rising Wedge Breakout Amid Pressure on the AI Sector
Nvidia’s short-term fundamental backdrop has deteriorated. On 14 September, the company’s shares fell 3.4% amid a sell-off in AI-related stocks driven by concerns over a potential slowdown in the pace of artificial intelligence development. However, Nvidia’s business outlook remains strong, with the company forecasting revenue growth of around 70% in fiscal 2028. An additional risk factor is a US Department of Justice investigation into Nvidia’s $17 billion agreement with Groq over potential attempts to circumvent antitrust oversight.
NVIDIA Technical Analysis
On the NVDA four-hour chart, a corrective phase developed following a pronounced uptrend. After the correction ended, the price resumed its advance and formed a pattern resembling a rising wedge. The price subsequently broke below not only the wedge but also the current profile boundary around $220.00 and is now attempting to establish itself below this level. If the price manages to hold below the profile, the next potential target could be the green support level at $207.00.
If the price returns to the market profile, attention could shift to the Point of Control (POC) at $225.50, followed by the upper part of the profile at $230.50. Above the profile, at the top of the pattern, lies the red resistance level at $234.00. The RSI + MAs indicator shows readings of 35, 50 and 50. The RSI has moved out of the neutral zone, while both moving averages remain within it, meaning it is still too early to confirm the breakout.
Key Takeaways
The price has broken below the rising wedge, but the RSI + MAs indicator has yet to confirm further downside. At the same time, the short-term fundamental backdrop remains mixed: pressure on the AI sector has increased, although Nvidia’s business outlook remains strong.
Trade global index CFDs with zero commission and tight spreads*. Learn more about trading index CFDs with FXOpen. *Additional fees may apply.
CFDs are complex instruments and come with a high risk of losing money rapidly due to leverage. You should consider whether you understand how CFDs work, and whether you can afford to take the high risk of losing your money. You can find the full disclaimer here: www.fxopen.com
This article represents the opinion of the Companies operating under the FXOpen brand only. It is not to be construed as an offer, solicitation, or recommendation with respect to products and services provided by the Companies operating under the FXOpen brand, nor is it to be considered financial advice.
👍2