#bitcoin #crypto #BTCUSD
Sharp Change in BTC/USD Price: Causes and Consequences
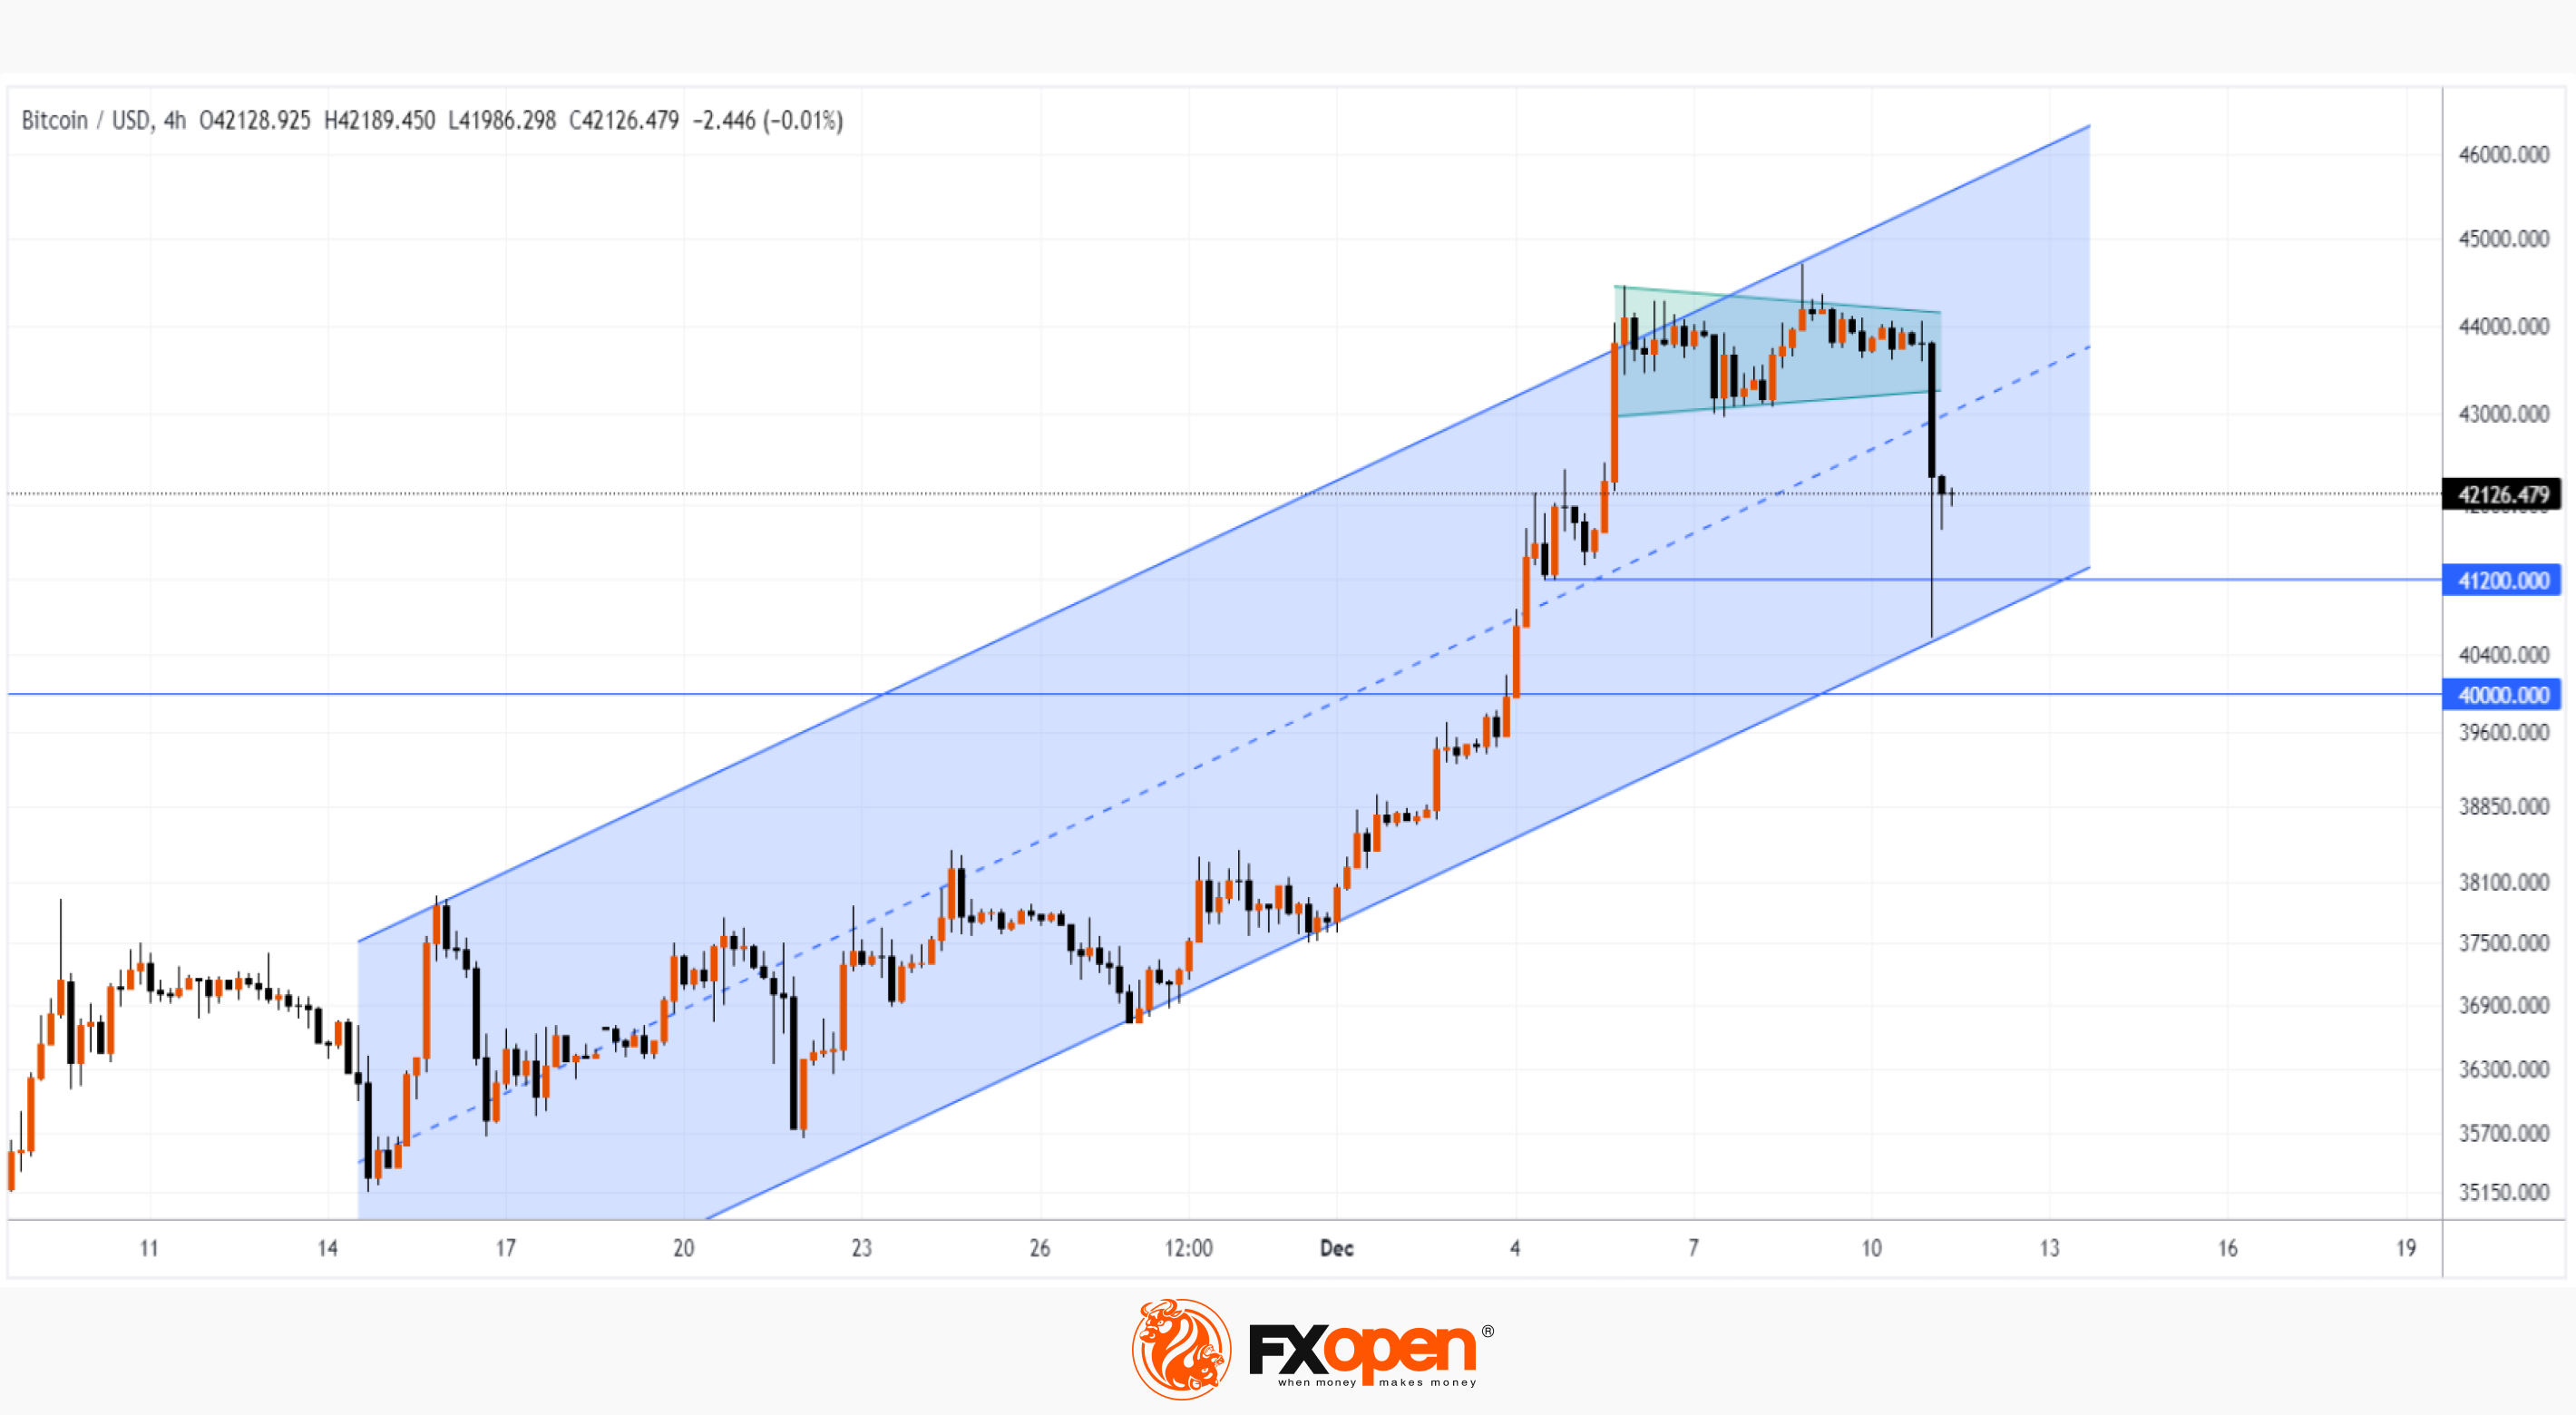
On Monday morning, the price of bitcoin fell sharply. As the chart shows, the BTC/USD rate fell below 42,000 on Monday during the Asian session. According to Coinglass, the decline resulted in about $400 million worth of positions being liquidated by about 100,000 traders on cryptocurrency exchanges. So far, the price has found support around the 41,200 level, where the lower border of the ascending channel lies (shown in blue).
What are the reasons for such a sharp decline? From a fundamental point of view, there are no triggers with the media associated with, for example, statements by officials. What then?
First of all, the idea comes with low liquidity in the financial markets at the beginning of Monday in the Asian session. A recent example is the gold market, when the price of the metal jumped at the opening of trading to $2,130, but then quickly fell to $2,060. By the way, we wrote on Tuesday that the bears may try to push the price of gold below the psychological level of $2,000. The scenario is still coming true.
What will happen to bitcoin? The graph shows that:
→ the price was within consolidation for some time (shown in green);
→ On December 8, the year’s maximum was updated, which in fact turned out to be a trap, a false bullish breakout of the consolidation zone (a bearish sign);
→ this morning, there was a bearish breakdown of the consolidation zone.
After 8 weeks of gains, we can assume that the market is overbought and today's decline is an overdue correction after a rally of more than 70% from the September lows.
But corrections, as a rule, are characterized by smoother declines with decreasing volumes. And if we analyze the nature of the decline on Monday morning, it looks more like an impulse.
Of course, given the high leverage that is applied in the poorly regulated crypto market, it is reasonable to assume that the correction took this form due to the cascading triggering of buyers’ stop losses. On the other hand, what if insiders are actively selling bitcoin, knowing that the coming week will bring a dose of negativity on the fundamental background?
One way or another, if the price of bitcoin reaches a psychological level, then analyzing the patterns on the chart will provide important information. It is possible that the price will break below the $40k level, and it will provoke an upward rebound — the nature of which will provide valuable material for reasoning about whether the current decline is an overdue correction or a bearish reversal.
To benefit from the rise and fall of cryptocurrency prices, consider enlisting the services of a trusted broker like FXOpen.
CFDs are complex instruments and come with a high risk of losing your money.
This article represents the opinion of the Companies operating under the FXOpen brand only. It is not to be construed as an offer, solicitation, or recommendation with respect to products and services provided by the Companies operating under the FXOpen brand, nor is it to be considered financial advice.
At FXOpen UK and FXOpen AU, Cryptocurrency CFDs are only available for trading by those clients categorised as Professional clients under FCA Rules and Professional clients under ASIC Rules, respectively. They are not available for trading by Retail clients.
Sharp Change in BTC/USD Price: Causes and Consequences
On Monday morning, the price of bitcoin fell sharply. As the chart shows, the BTC/USD rate fell below 42,000 on Monday during the Asian session. According to Coinglass, the decline resulted in about $400 million worth of positions being liquidated by about 100,000 traders on cryptocurrency exchanges. So far, the price has found support around the 41,200 level, where the lower border of the ascending channel lies (shown in blue).
What are the reasons for such a sharp decline? From a fundamental point of view, there are no triggers with the media associated with, for example, statements by officials. What then?
First of all, the idea comes with low liquidity in the financial markets at the beginning of Monday in the Asian session. A recent example is the gold market, when the price of the metal jumped at the opening of trading to $2,130, but then quickly fell to $2,060. By the way, we wrote on Tuesday that the bears may try to push the price of gold below the psychological level of $2,000. The scenario is still coming true.
What will happen to bitcoin? The graph shows that:
→ the price was within consolidation for some time (shown in green);
→ On December 8, the year’s maximum was updated, which in fact turned out to be a trap, a false bullish breakout of the consolidation zone (a bearish sign);
→ this morning, there was a bearish breakdown of the consolidation zone.
After 8 weeks of gains, we can assume that the market is overbought and today's decline is an overdue correction after a rally of more than 70% from the September lows.
But corrections, as a rule, are characterized by smoother declines with decreasing volumes. And if we analyze the nature of the decline on Monday morning, it looks more like an impulse.
Of course, given the high leverage that is applied in the poorly regulated crypto market, it is reasonable to assume that the correction took this form due to the cascading triggering of buyers’ stop losses. On the other hand, what if insiders are actively selling bitcoin, knowing that the coming week will bring a dose of negativity on the fundamental background?
One way or another, if the price of bitcoin reaches a psychological level, then analyzing the patterns on the chart will provide important information. It is possible that the price will break below the $40k level, and it will provoke an upward rebound — the nature of which will provide valuable material for reasoning about whether the current decline is an overdue correction or a bearish reversal.
To benefit from the rise and fall of cryptocurrency prices, consider enlisting the services of a trusted broker like FXOpen.
CFDs are complex instruments and come with a high risk of losing your money.
This article represents the opinion of the Companies operating under the FXOpen brand only. It is not to be construed as an offer, solicitation, or recommendation with respect to products and services provided by the Companies operating under the FXOpen brand, nor is it to be considered financial advice.
At FXOpen UK and FXOpen AU, Cryptocurrency CFDs are only available for trading by those clients categorised as Professional clients under FCA Rules and Professional clients under ASIC Rules, respectively. They are not available for trading by Retail clients.
👍1
#marketanalysis #tradingforex #financialmarkets #EURUSD
Market Analysis: Financial Markets Waiting for Important News
Get ready for a surge in volatility in the coming days, because:
→ today at 16:30 GMT+3: news will be published on inflation in the USA;
→ tomorrow at 22:00-22:30 GMT+3: news from the Federal Reserve on the interest rate will be published;
→ on Thursday: news from the central banks of Europe, Great Britain, Switzerland will be published.
Add in geopolitical tensions, the possibility of Biden's impeachment, news on unemployment and retail sales in the US and other factors affecting prices — this week is likely to be very turbulent before financial market participants go on holiday.
The greatest optimism reigns in the stock market. The S&P 500 index updated its maximum for the year. Because investors believe that inflation will continue to cool, and over time the Federal Reserve will cut rates, giving new impetus to corporate growth. This expectation is probably already factored into the current price, so deviations from expectations can trigger unexpected price movements.
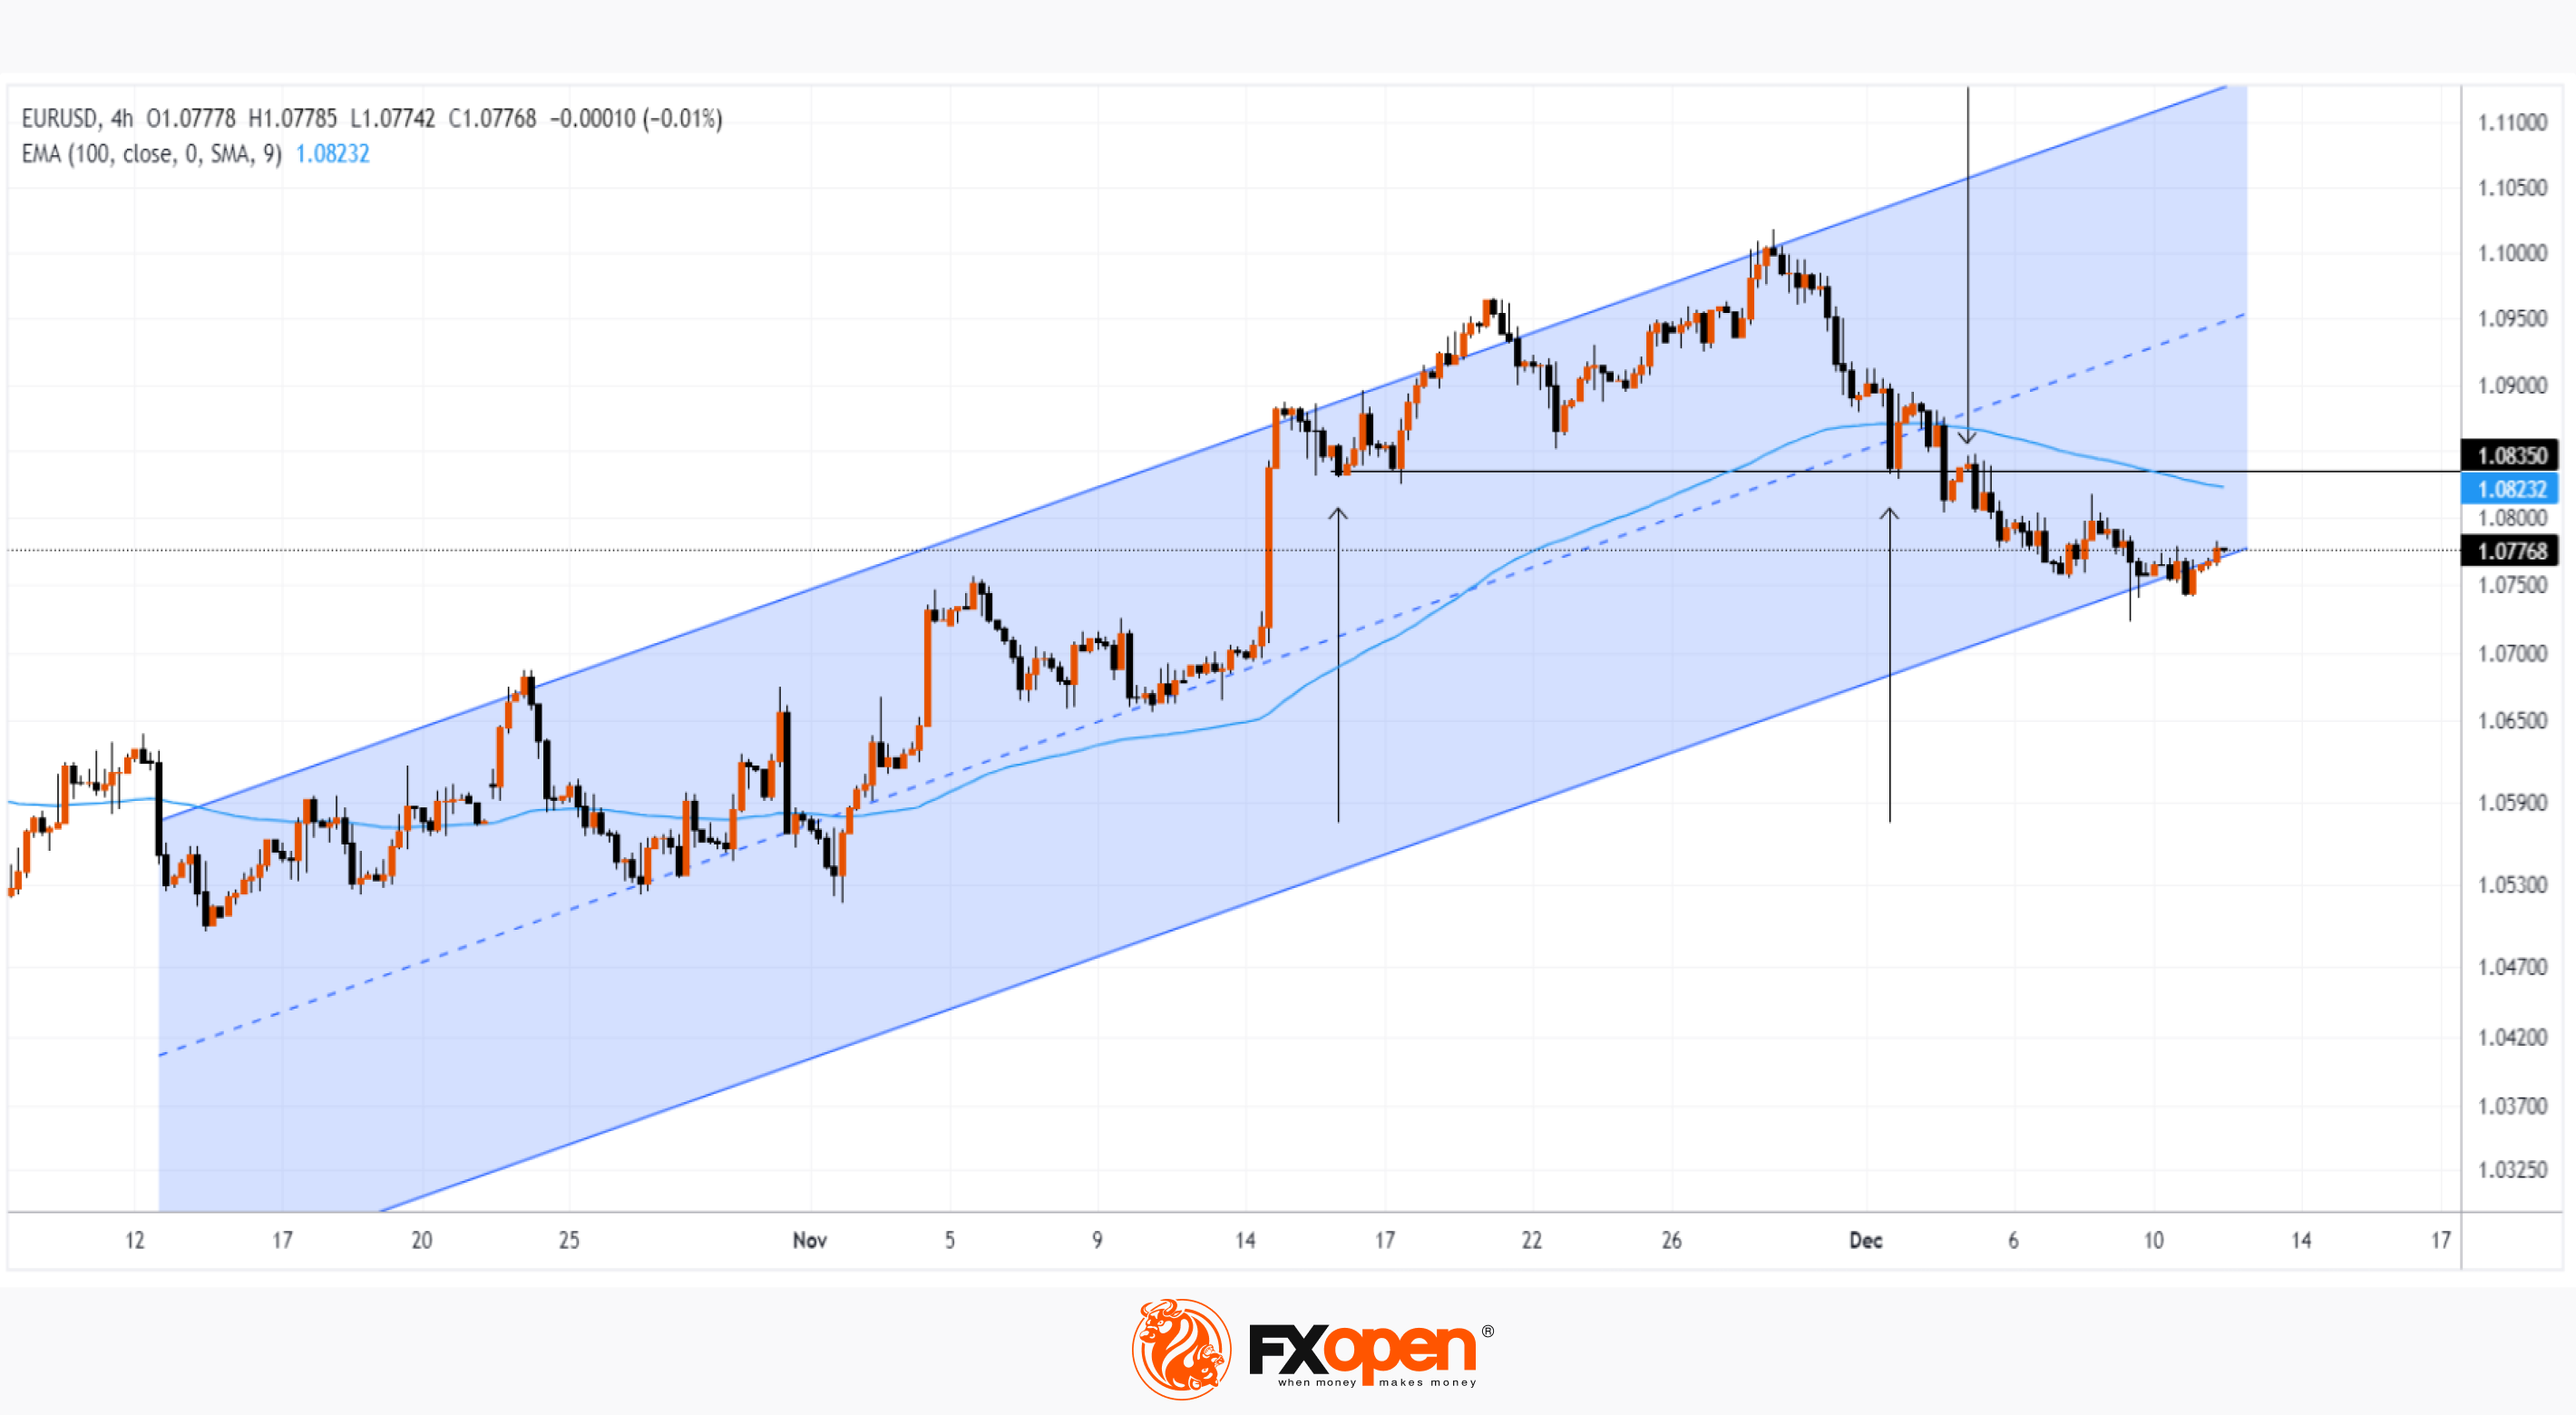
Assessing the EUR/USD chart, we can note that:
→ the psychological level of 1.100 worked as resistance, as we expected on November 29;
→ the rate is near the lower border of the ascending channel, however, energetic price rebounds, which are typical when touching the lower border in strong bullish markets, are not observed;
→ level 1.0835 changed its action from support to resistance (as the arrows show).
In general, it is very likely that the reaction to each subsequent news can adjust the reaction to each previous one. Therefore, the likelihood of falling into a trap in the EUR/USD market increases, for example, in a likely scenario of a false rebound from the lower border of the ascending channel followed by its bearish breakdown, which will support the strengthening of the USD, which unfolds in December, as indicated by EMA(100).
To benefit from the rise and fall of financial instrument prices, use the services of a reliable broker FXOpen.
To benefit from the rise and fall of cryptocurrency prices, consider enlisting the services of a trusted broker like FXOpen.
CFDs are complex instruments and come with a high risk of losing your money.
This article represents the opinion of the Companies operating under the FXOpen brand only. It is not to be construed as an offer, solicitation, or recommendation with respect to products and services provided by the Companies operating under the FXOpen brand, nor is it to be considered financial advice.
Market Analysis: Financial Markets Waiting for Important News
Get ready for a surge in volatility in the coming days, because:
→ today at 16:30 GMT+3: news will be published on inflation in the USA;
→ tomorrow at 22:00-22:30 GMT+3: news from the Federal Reserve on the interest rate will be published;
→ on Thursday: news from the central banks of Europe, Great Britain, Switzerland will be published.
Add in geopolitical tensions, the possibility of Biden's impeachment, news on unemployment and retail sales in the US and other factors affecting prices — this week is likely to be very turbulent before financial market participants go on holiday.
The greatest optimism reigns in the stock market. The S&P 500 index updated its maximum for the year. Because investors believe that inflation will continue to cool, and over time the Federal Reserve will cut rates, giving new impetus to corporate growth. This expectation is probably already factored into the current price, so deviations from expectations can trigger unexpected price movements.
Assessing the EUR/USD chart, we can note that:
→ the psychological level of 1.100 worked as resistance, as we expected on November 29;
→ the rate is near the lower border of the ascending channel, however, energetic price rebounds, which are typical when touching the lower border in strong bullish markets, are not observed;
→ level 1.0835 changed its action from support to resistance (as the arrows show).
In general, it is very likely that the reaction to each subsequent news can adjust the reaction to each previous one. Therefore, the likelihood of falling into a trap in the EUR/USD market increases, for example, in a likely scenario of a false rebound from the lower border of the ascending channel followed by its bearish breakdown, which will support the strengthening of the USD, which unfolds in December, as indicated by EMA(100).
To benefit from the rise and fall of financial instrument prices, use the services of a reliable broker FXOpen.
To benefit from the rise and fall of cryptocurrency prices, consider enlisting the services of a trusted broker like FXOpen.
CFDs are complex instruments and come with a high risk of losing your money.
This article represents the opinion of the Companies operating under the FXOpen brand only. It is not to be construed as an offer, solicitation, or recommendation with respect to products and services provided by the Companies operating under the FXOpen brand, nor is it to be considered financial advice.
👍2
#marketanalysis #GBPUSD #forextrading
GBP/USD Analysis: Price Approaches Important Support
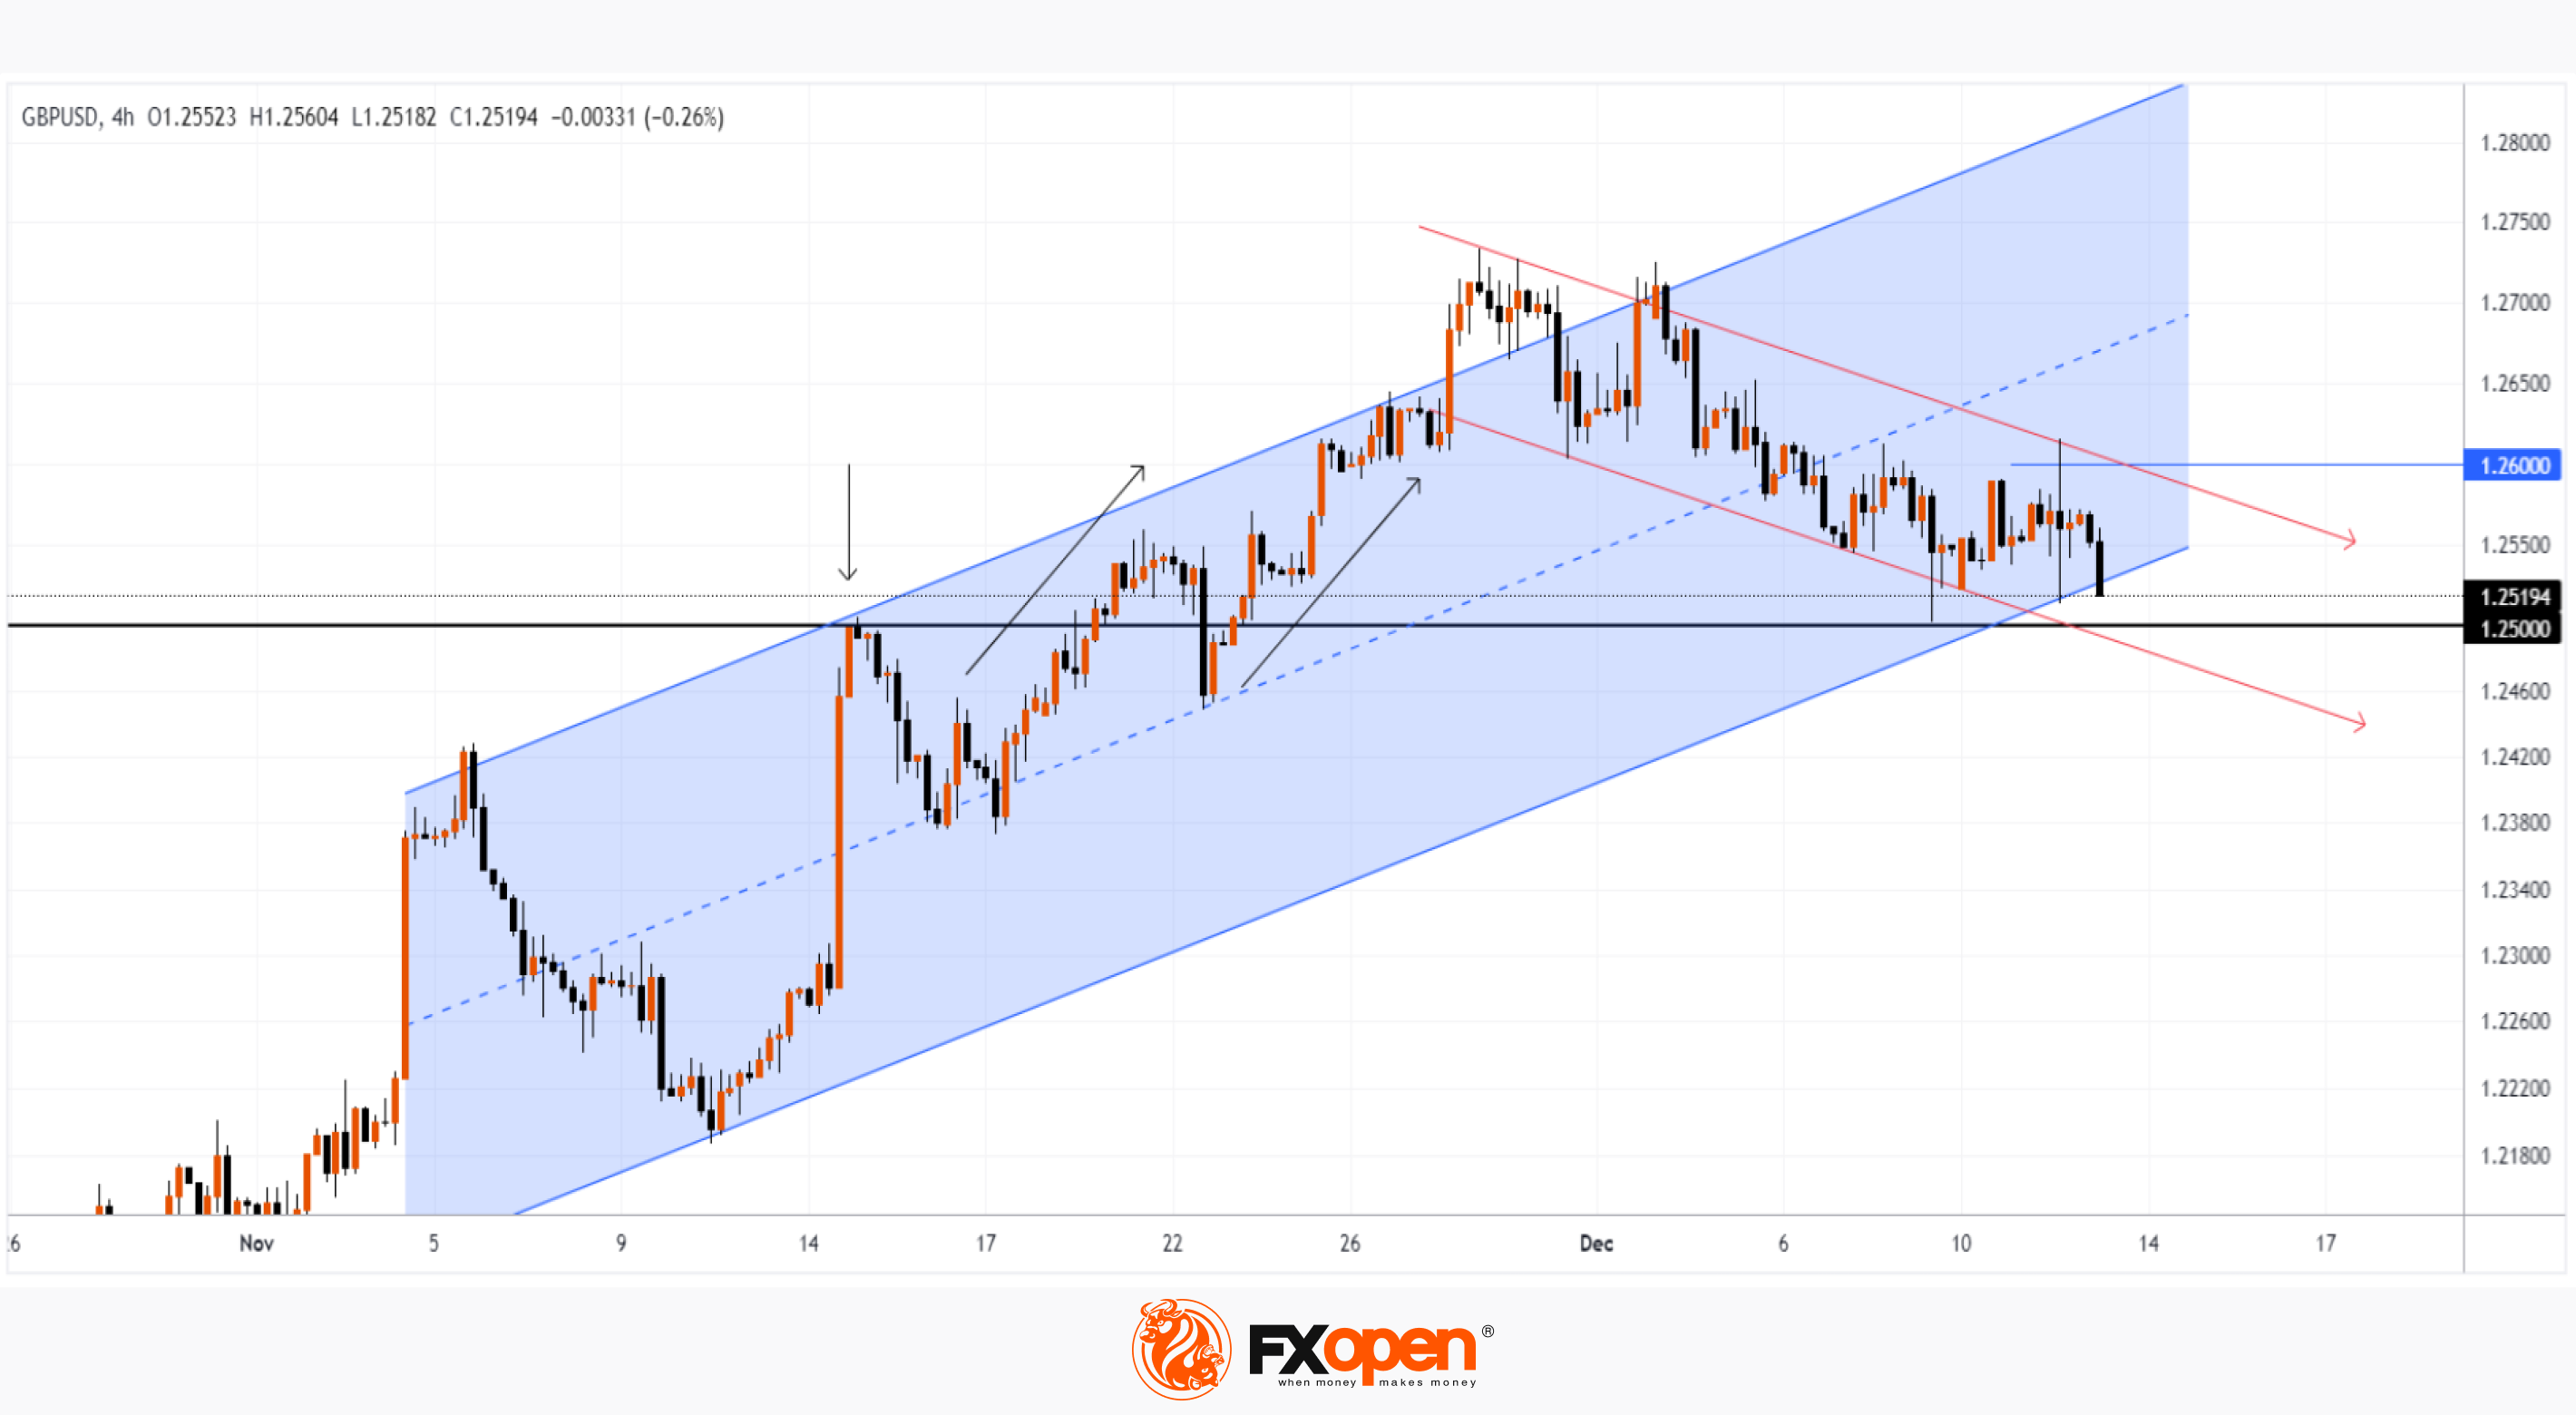
In November, the 1.25 level acted as resistance, but after a bullish breakout, it began to provide support (as shown by the black arrows).
However, recent events are increasing bearish pressure. Among them:
→ yesterday's news on inflation in the US, the values of which were in line with expectations. It is worth paying attention to Core CPI MoM, the values of which remain equal to 0.3%, or 3.6% in annual terms. This category includes prices for services where inflation is difficult to overcome. So Powell's oft-repeated words that “the path to 2% will be difficult” take on more relevance. Today, by the way, another speech by the head of the Fed is scheduled for 22:30 GMT+3. It will take place after the announcement of interest rates at 22:00 GMT+3, which is expected to remain unchanged.
→ news today that the UK economy contracted in October. GDP decreased by -0.3%, although -0.1% was expected. This could strengthen the case that the Bank of England at its meeting (tomorrow at 15:00 GMT+3) will signal a faster rate cut than in other countries.
The chart shows that the dollar continues to strengthen. The situation is similar to what is happening on the EUR/USD market, which we wrote about yesterday.
→ the GBP/USD rate is still in an ascending channel (shown in blue), but the bears are trying to push it;
→ the bulls can be supported by the psychological level of 1.25;
→ level 1.26 yesterday worked as resistance.
If the price consolidates below 1.25, this could indicate an important change in market sentiment and an increase in the likelihood of a bearish scenario, as indicated by the red arrows.
To benefit from the rise and fall of the foreign exchange markets, use the services of a reliable broker FXOpen.
To benefit from the rise and fall of cryptocurrency prices, consider enlisting the services of a trusted broker like FXOpen.
CFDs are complex instruments and come with a high risk of losing your money.
GBP/USD Analysis: Price Approaches Important Support
In November, the 1.25 level acted as resistance, but after a bullish breakout, it began to provide support (as shown by the black arrows).
However, recent events are increasing bearish pressure. Among them:
→ yesterday's news on inflation in the US, the values of which were in line with expectations. It is worth paying attention to Core CPI MoM, the values of which remain equal to 0.3%, or 3.6% in annual terms. This category includes prices for services where inflation is difficult to overcome. So Powell's oft-repeated words that “the path to 2% will be difficult” take on more relevance. Today, by the way, another speech by the head of the Fed is scheduled for 22:30 GMT+3. It will take place after the announcement of interest rates at 22:00 GMT+3, which is expected to remain unchanged.
→ news today that the UK economy contracted in October. GDP decreased by -0.3%, although -0.1% was expected. This could strengthen the case that the Bank of England at its meeting (tomorrow at 15:00 GMT+3) will signal a faster rate cut than in other countries.
The chart shows that the dollar continues to strengthen. The situation is similar to what is happening on the EUR/USD market, which we wrote about yesterday.
→ the GBP/USD rate is still in an ascending channel (shown in blue), but the bears are trying to push it;
→ the bulls can be supported by the psychological level of 1.25;
→ level 1.26 yesterday worked as resistance.
If the price consolidates below 1.25, this could indicate an important change in market sentiment and an increase in the likelihood of a bearish scenario, as indicated by the red arrows.
To benefit from the rise and fall of the foreign exchange markets, use the services of a reliable broker FXOpen.
To benefit from the rise and fall of cryptocurrency prices, consider enlisting the services of a trusted broker like FXOpen.
CFDs are complex instruments and come with a high risk of losing your money.
#marketanalysis #MarketNews #usdollar
Market Analysis: Powell's Speech Weakens USD
Yesterday, the Federal Reserve published a unanimous decision to leave the base rate unchanged for the third time in a row, which coincided with the expectations of most market participants. At the conference that followed, Powell's rhetoric was not as harsh as before. According to him:
→ economic activity is slowing, but the labor market remains strong;
→ inflation is still high, the Fed is committed to achieving the 2% target;
→ rates may rise if the US economy grows above expectations;
→ during discussions within the Fed, the topic of lowering rates becomes more relevant.
As a result, the increasingly clear prospect of rate cuts weakened the dollar greatly:
→ increased currency price relative to USD. The pound rose in price from the important support of 1.25, which we wrote about yesterday.
→ gold rose in price, again rising above the psychological level of $2,000 per ounce, as we expected in the analysis of December 5;
→ US stock indices rose in price.
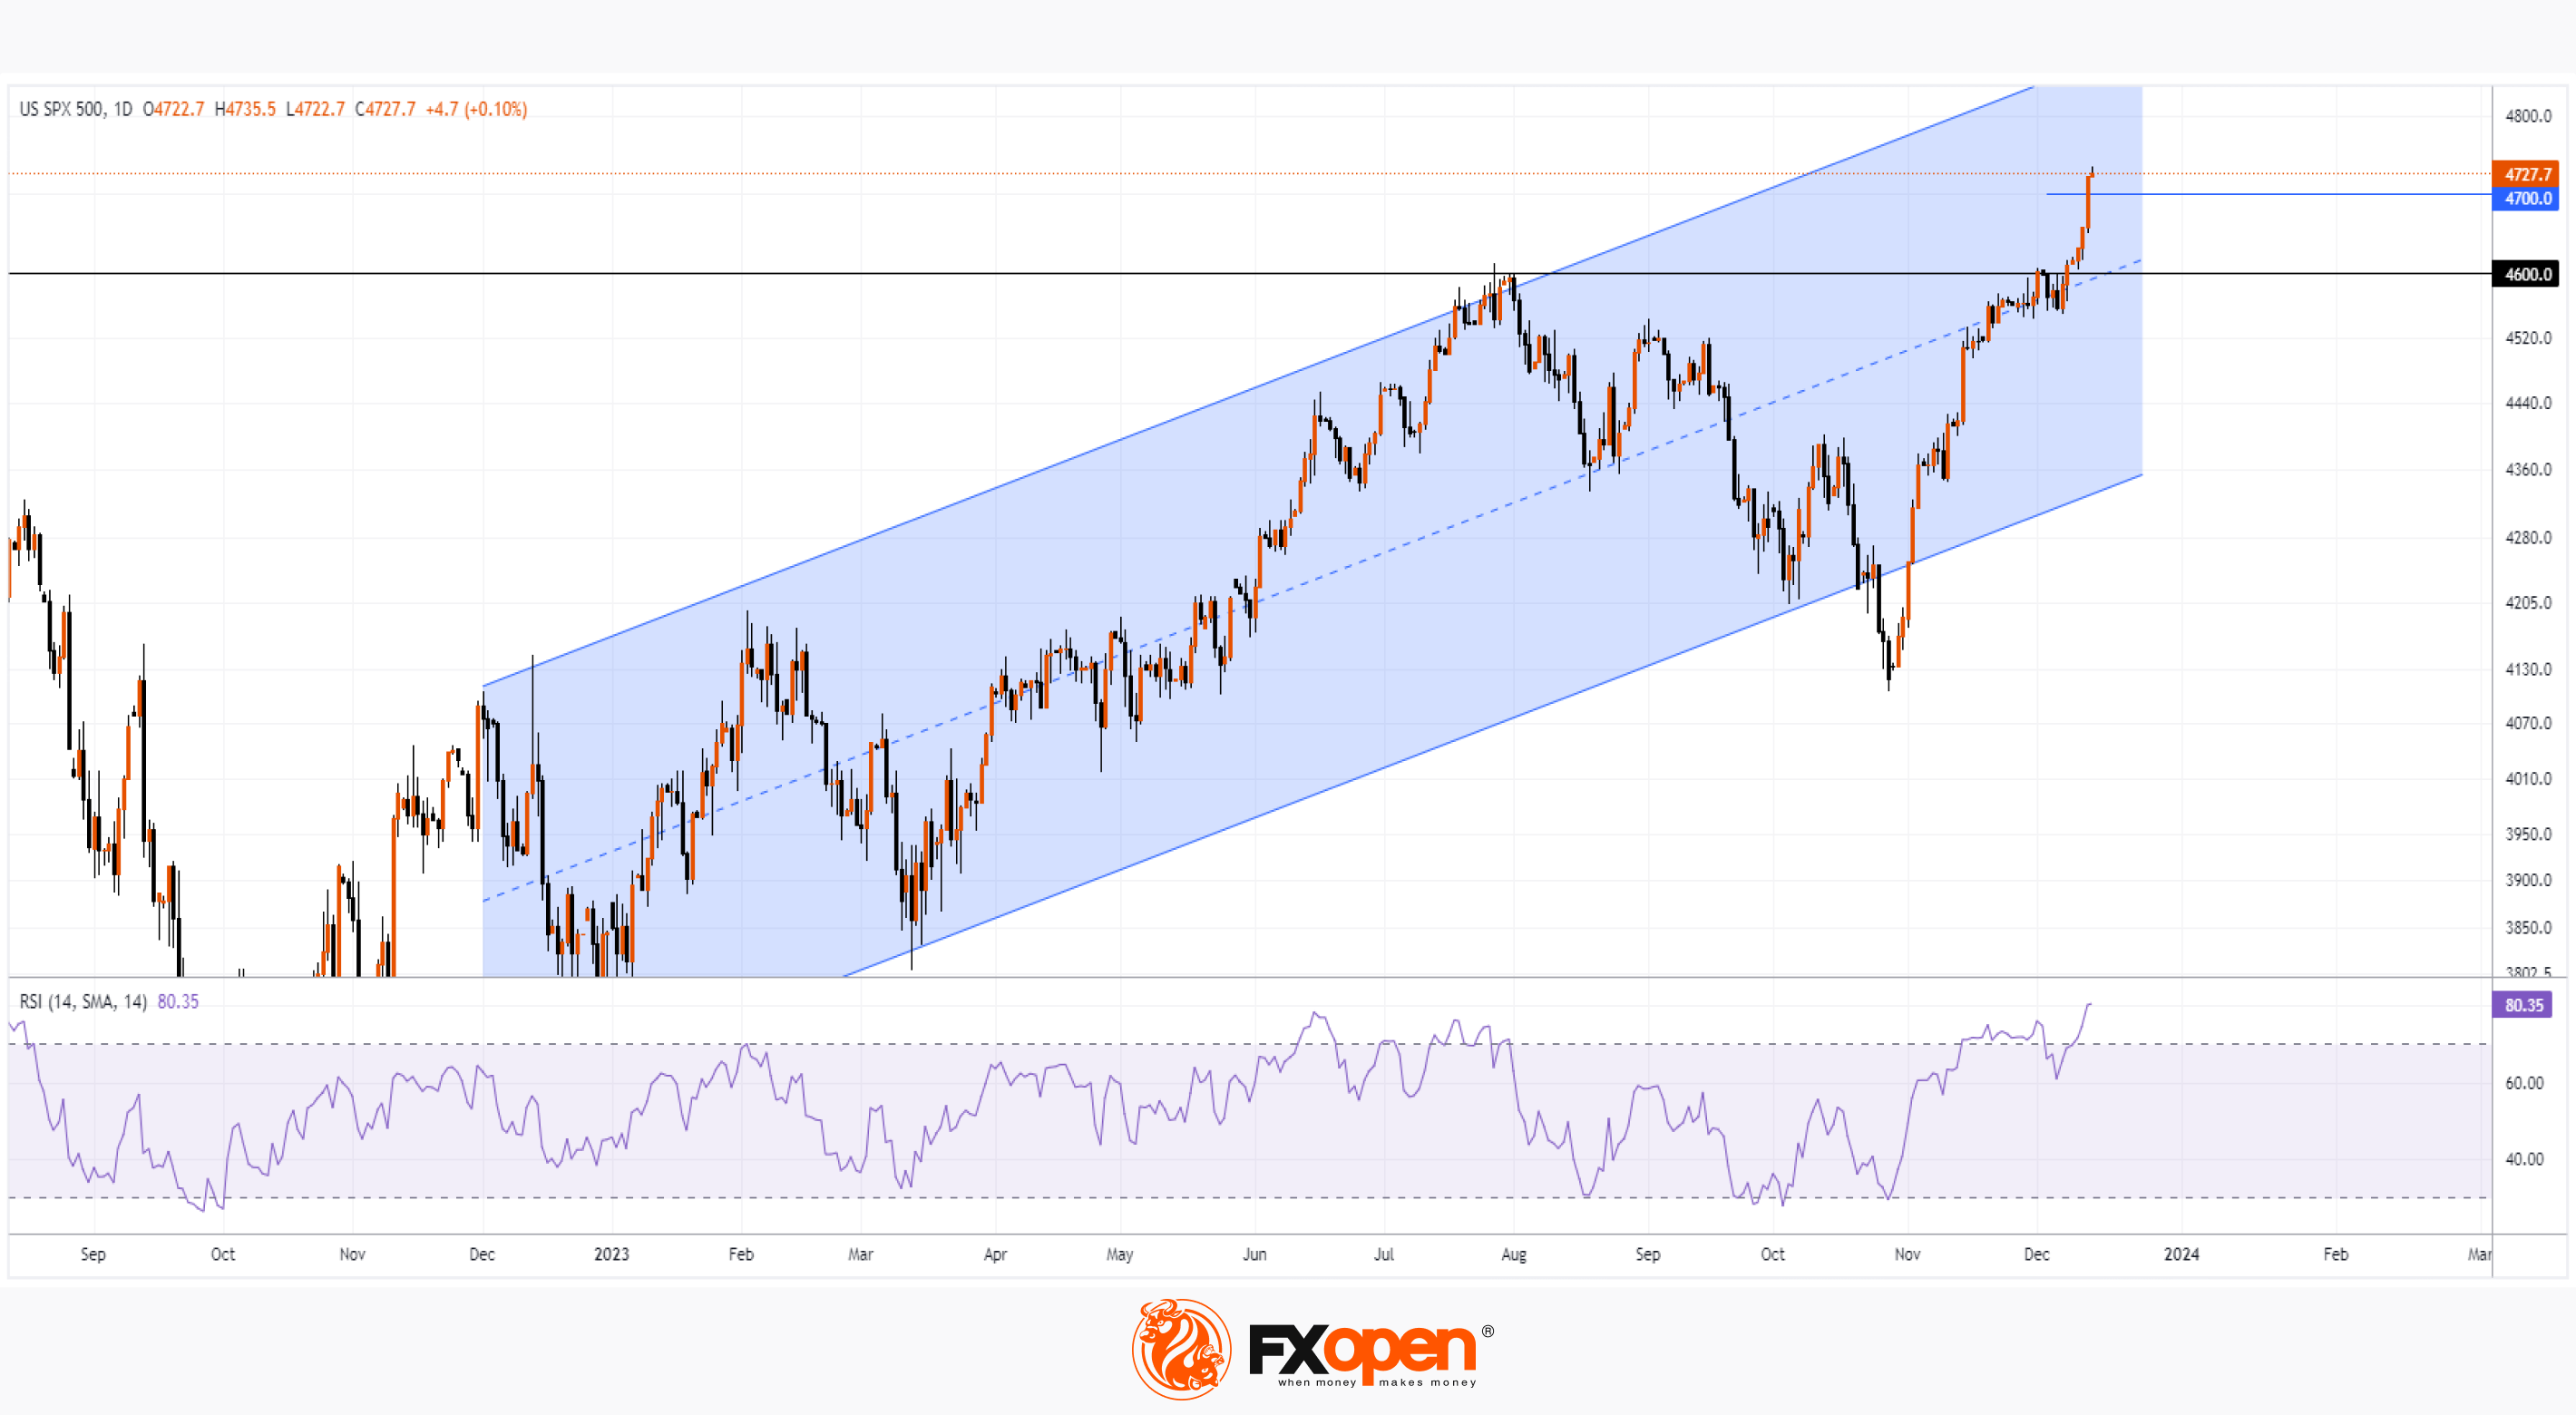
In particular, the Dow Jones index set a historical maximum, and the S&P 500 is close to it. The graph shows that:
→ the price of the S&P 500 forms an ascending channel (shown in blue). The bearish breakout at the end of October turned out to be false;
→ after yesterday’s events, the price rose to the upper half of the channel, indicating positive sentiment in the market;
→ if the trend continues, the price may reach the upper boundary of the channel — while setting a historical maximum;
→ the resistance at 4,600 has been confidently broken, in the future it can serve as support;
→ RSI is in the overbought zone – the highest this year on the daily time frame;
→ it is possible that after a stormy week the S&P 500 will cool down – that is, consolidate, with the probability of testing the level of 4,700.
To benefit from fluctuations in the world's stock indices, consider enlisting the services of a trusted broker like FXOpen.
CFDs are complex instruments and come with a high risk of losing your money.
This article represents the opinion of the Companies operating under the FXOpen brand only. It is not to be construed as an offer, solicitation, or recommendation with respect to products and services provided by the Companies operating under the FXOpen brand, nor is it to be considered financial advice.
Market Analysis: Powell's Speech Weakens USD
Yesterday, the Federal Reserve published a unanimous decision to leave the base rate unchanged for the third time in a row, which coincided with the expectations of most market participants. At the conference that followed, Powell's rhetoric was not as harsh as before. According to him:
→ economic activity is slowing, but the labor market remains strong;
→ inflation is still high, the Fed is committed to achieving the 2% target;
→ rates may rise if the US economy grows above expectations;
→ during discussions within the Fed, the topic of lowering rates becomes more relevant.
As a result, the increasingly clear prospect of rate cuts weakened the dollar greatly:
→ increased currency price relative to USD. The pound rose in price from the important support of 1.25, which we wrote about yesterday.
→ gold rose in price, again rising above the psychological level of $2,000 per ounce, as we expected in the analysis of December 5;
→ US stock indices rose in price.
In particular, the Dow Jones index set a historical maximum, and the S&P 500 is close to it. The graph shows that:
→ the price of the S&P 500 forms an ascending channel (shown in blue). The bearish breakout at the end of October turned out to be false;
→ after yesterday’s events, the price rose to the upper half of the channel, indicating positive sentiment in the market;
→ if the trend continues, the price may reach the upper boundary of the channel — while setting a historical maximum;
→ the resistance at 4,600 has been confidently broken, in the future it can serve as support;
→ RSI is in the overbought zone – the highest this year on the daily time frame;
→ it is possible that after a stormy week the S&P 500 will cool down – that is, consolidate, with the probability of testing the level of 4,700.
To benefit from fluctuations in the world's stock indices, consider enlisting the services of a trusted broker like FXOpen.
CFDs are complex instruments and come with a high risk of losing your money.
This article represents the opinion of the Companies operating under the FXOpen brand only. It is not to be construed as an offer, solicitation, or recommendation with respect to products and services provided by the Companies operating under the FXOpen brand, nor is it to be considered financial advice.
#marketanalysis #MarketNews #gasprices
Market Analysis: Natural Gas Prices Recover from 6-month Lows
Since November 1, the price of natural gas has fallen by more than 30%. This was facilitated by:
→ relatively mild weather at the beginning of the winter period;
→ record volumes of liquefied gas production, as reported by Reuters. Analysts estimate there is currently about 7.8% more gas in storage than normal for this time of year.
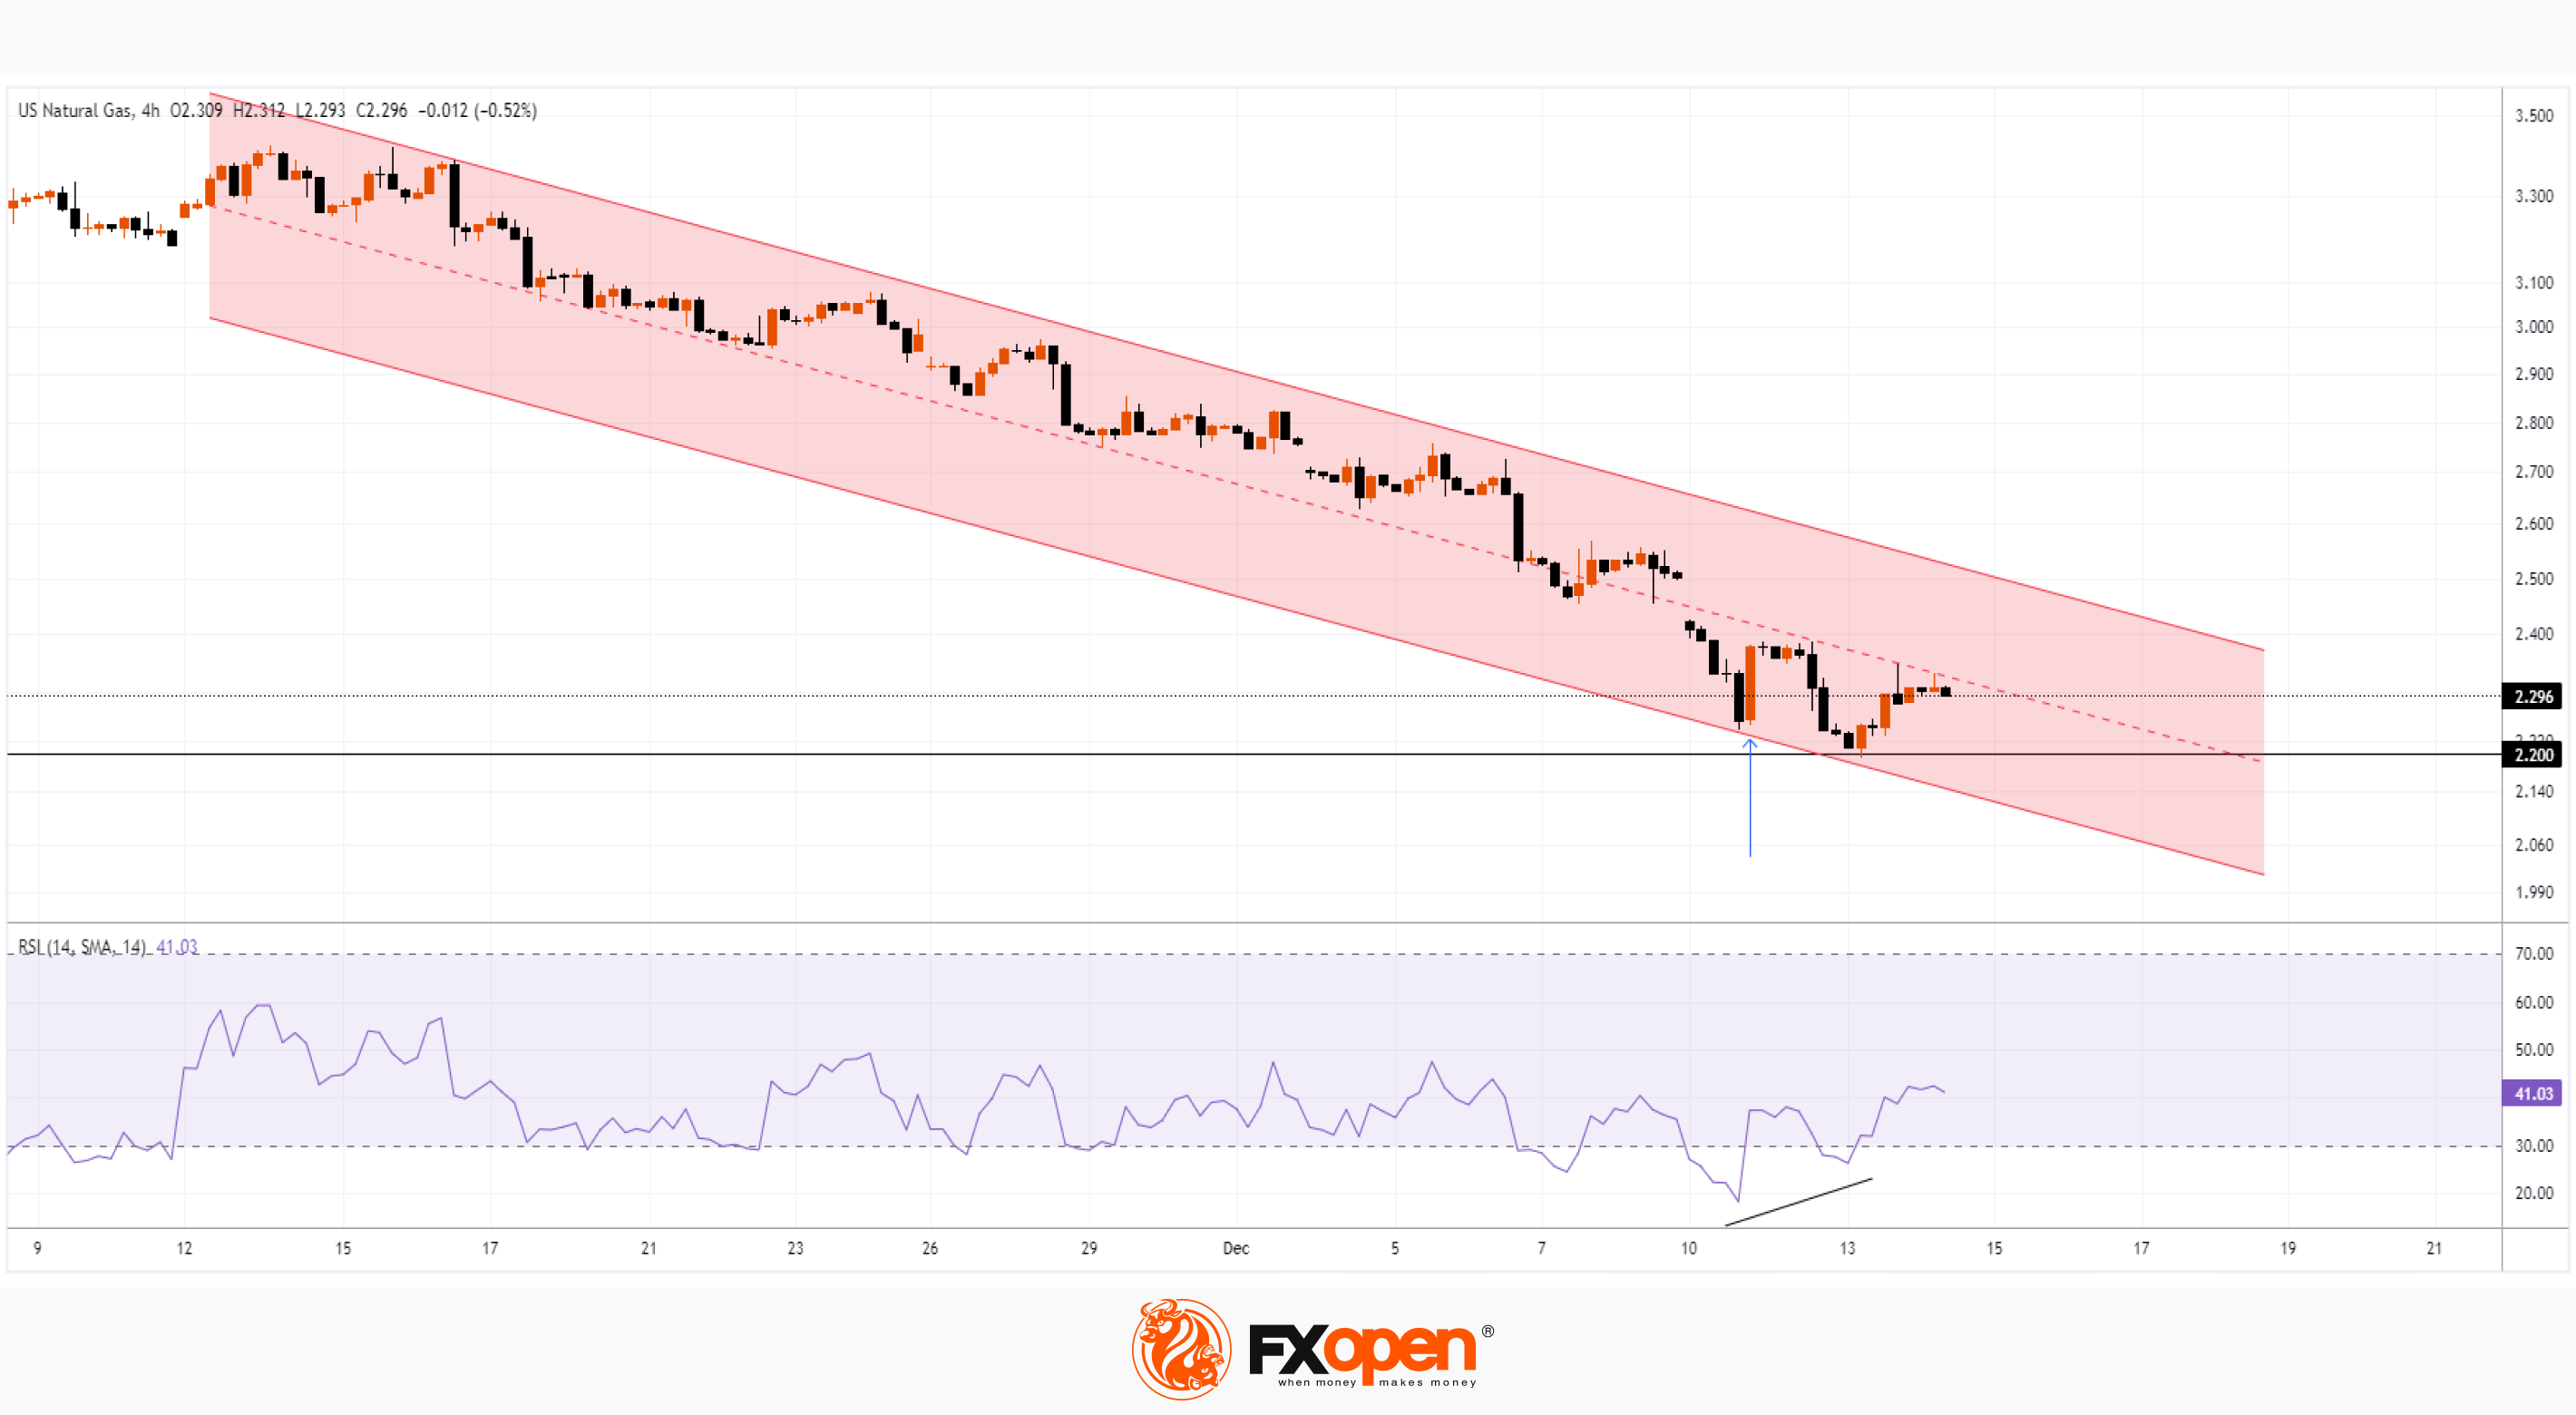
On December 13, the price of natural gas dropped below 2.20 for the first time since the beginning of June. This level may provide support given how price has interacted with it throughout 2023.
At the same time, the graph shows that the price of natural gas:
→ is within a downward trend (shown in red);
→ On December 11, a surge in demand was noticed on the market (shown by the arrow) — it is possible that it was caused by a low price and the expectation that in the future the price of gas could rise until the end of winter;
→ the median line still offers resistance;
→ RSI forms divergence.
Thus, there are reasons to believe that the level of 2.20 may be able to stop the downward trend. And even to provide support for a rebound if the weather becomes colder and causes an increase in gas consumption.
To benefit from price fluctuations, consider enlisting the services of a trusted broker like FXOpen.
CFDs are complex instruments and come with a high risk of losing your money.
This article represents the opinion of the Companies operating under the FXOpen brand only. It is not to be construed as an offer, solicitation, or recommendation with respect to products and services provided by the Companies operating under the FXOpen brand, nor is it to be considered financial advice.
Market Analysis: Natural Gas Prices Recover from 6-month Lows
Since November 1, the price of natural gas has fallen by more than 30%. This was facilitated by:
→ relatively mild weather at the beginning of the winter period;
→ record volumes of liquefied gas production, as reported by Reuters. Analysts estimate there is currently about 7.8% more gas in storage than normal for this time of year.
On December 13, the price of natural gas dropped below 2.20 for the first time since the beginning of June. This level may provide support given how price has interacted with it throughout 2023.
At the same time, the graph shows that the price of natural gas:
→ is within a downward trend (shown in red);
→ On December 11, a surge in demand was noticed on the market (shown by the arrow) — it is possible that it was caused by a low price and the expectation that in the future the price of gas could rise until the end of winter;
→ the median line still offers resistance;
→ RSI forms divergence.
Thus, there are reasons to believe that the level of 2.20 may be able to stop the downward trend. And even to provide support for a rebound if the weather becomes colder and causes an increase in gas consumption.
To benefit from price fluctuations, consider enlisting the services of a trusted broker like FXOpen.
CFDs are complex instruments and come with a high risk of losing your money.
This article represents the opinion of the Companies operating under the FXOpen brand only. It is not to be construed as an offer, solicitation, or recommendation with respect to products and services provided by the Companies operating under the FXOpen brand, nor is it to be considered financial advice.
#marketanalysis #MarketNews #tradingforex
EUR/USD: Price Is Again Testing Psychological Level of 1.10
An eventful news background creates increased volatility in financial markets.
Unlike the Fed, whose rhetoric is becoming softer, Europe's central banks are sticking to plans to maintain tight policies. The ECB said yesterday that policy easing was not even discussed at its two-day meeting, the Bank of England said rates would remain high for an "extended period," and Norway's central bank even raised rates.
This caused the pound and euro to rise sharply yesterday against a weakened USD.
However, today is the day of publication of PMI indices in Europe, which show that the economy in Europe is in a difficult situation, as the values are below = 50:
→ French Flash Manufacturing PMI: actual = 42.0, expected = 43.3, previously = 42.9;
→ German Flash Services PMI: actual = 48.4, expected = 49.1, previously = 49.6.
The publication of PMI values today led to a sharp depreciation of the euro against the dollar, thus a correction occurred after a rally of two days.
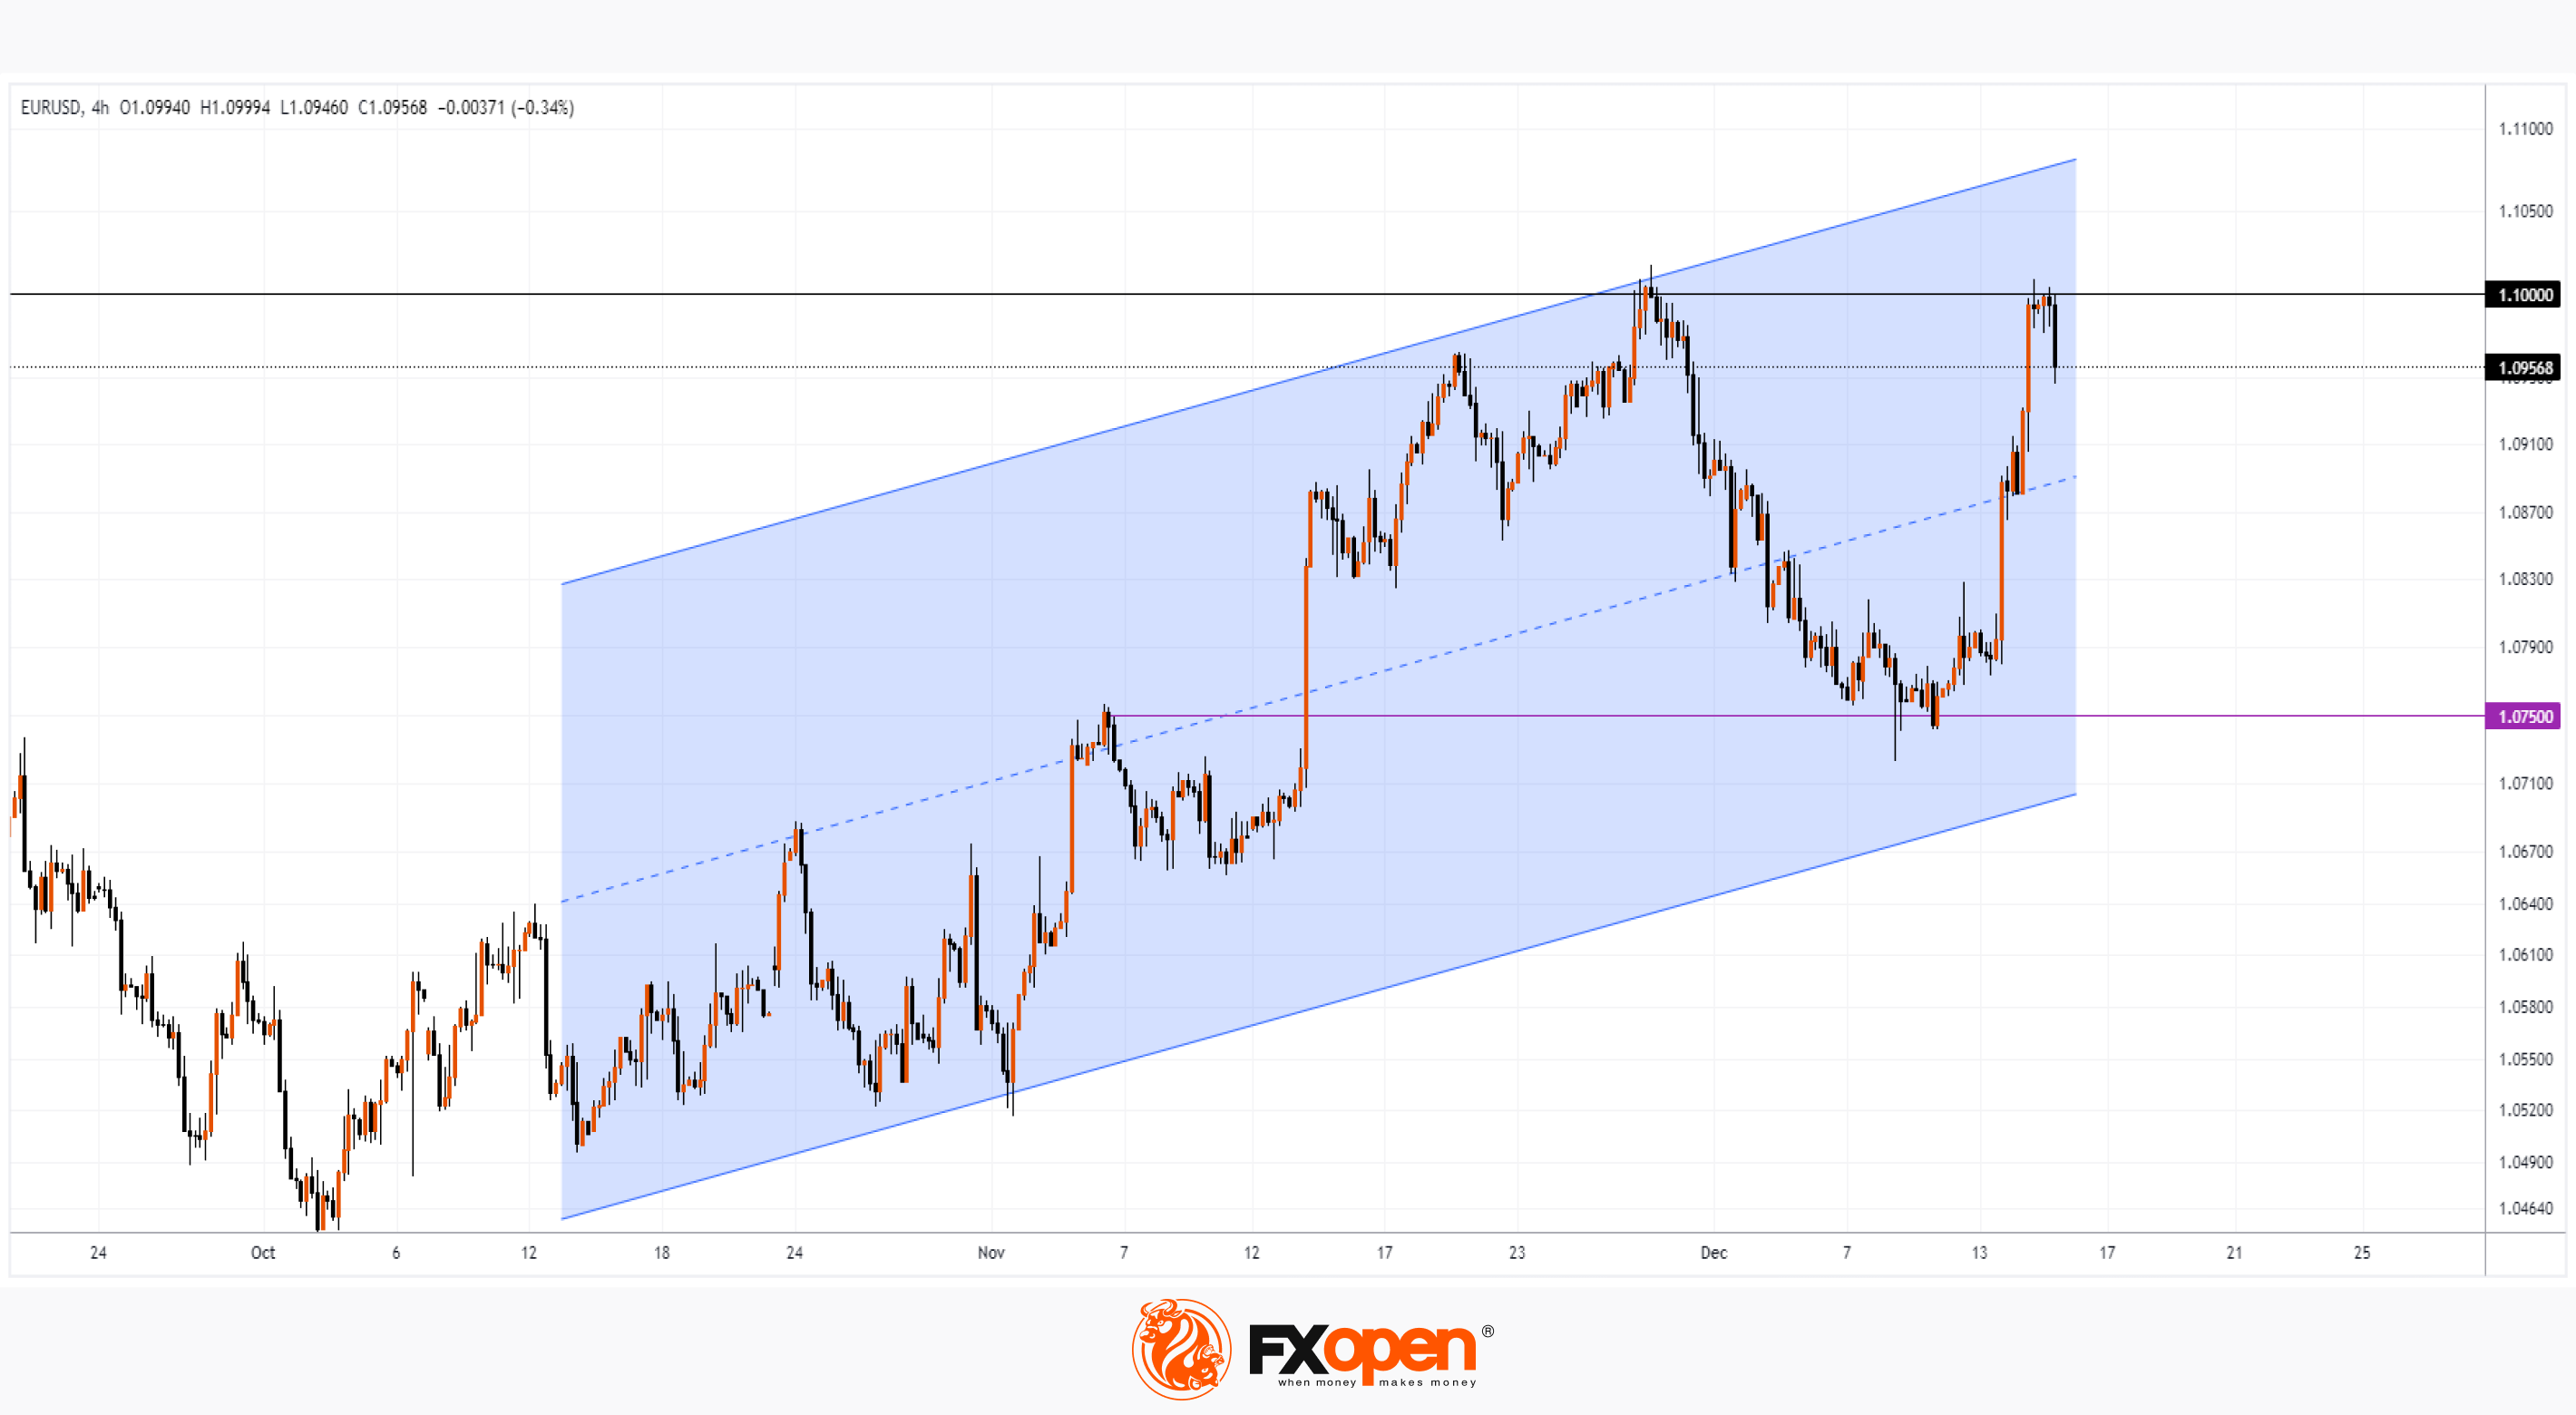
At the same time, the EUR/USD chart shows that:
→ the price tested the psychological level of 1.10 for the second time. We wrote about the first puncture in the review on November 29;
→ the EUR/USD rate has been within the ascending channel (shown in blue) since October, however, the level of 1.10 creates an obstacle for the bulls, who probably see the goal of reaching the upper boundary of the channel;
→ the important level 1.075 acted as support. Bulls can also count on support from the median line of the ascending channel.
Tonight at 17:45 GMT+3 US PMI data will be published. Also in the US derivatives market, expirations of about $5.3 trillion are expected, which could provoke additional turbulence.
It is possible that we may see the formation of rising lows, which can be interpreted as efforts of the bulls to overcome the level of 1.10.
To benefit from price fluctuations in the foreign exchange market, consider enlisting the services of a trusted broker like FXOpen.
EUR/USD: Price Is Again Testing Psychological Level of 1.10
An eventful news background creates increased volatility in financial markets.
Unlike the Fed, whose rhetoric is becoming softer, Europe's central banks are sticking to plans to maintain tight policies. The ECB said yesterday that policy easing was not even discussed at its two-day meeting, the Bank of England said rates would remain high for an "extended period," and Norway's central bank even raised rates.
This caused the pound and euro to rise sharply yesterday against a weakened USD.
However, today is the day of publication of PMI indices in Europe, which show that the economy in Europe is in a difficult situation, as the values are below = 50:
→ French Flash Manufacturing PMI: actual = 42.0, expected = 43.3, previously = 42.9;
→ German Flash Services PMI: actual = 48.4, expected = 49.1, previously = 49.6.
The publication of PMI values today led to a sharp depreciation of the euro against the dollar, thus a correction occurred after a rally of two days.
At the same time, the EUR/USD chart shows that:
→ the price tested the psychological level of 1.10 for the second time. We wrote about the first puncture in the review on November 29;
→ the EUR/USD rate has been within the ascending channel (shown in blue) since October, however, the level of 1.10 creates an obstacle for the bulls, who probably see the goal of reaching the upper boundary of the channel;
→ the important level 1.075 acted as support. Bulls can also count on support from the median line of the ascending channel.
Tonight at 17:45 GMT+3 US PMI data will be published. Also in the US derivatives market, expirations of about $5.3 trillion are expected, which could provoke additional turbulence.
It is possible that we may see the formation of rising lows, which can be interpreted as efforts of the bulls to overcome the level of 1.10.
To benefit from price fluctuations in the foreign exchange market, consider enlisting the services of a trusted broker like FXOpen.
#marketanalysis #MarketNews #tradingforex
USD/CAD Analysis: Rate Reaches Its Minimum in 4 Months
On Friday, the rate dropped below 1.366 for the first time since the beginning of August. This was facilitated by fundamental drivers:
→ The US dollar weakens after the Federal Reserve meeting, which signaled the possibility of lowering interest rates next year. Powell said monetary tightening is likely complete and discussions about cuts are "on the horizon."
→ On the contrary, the Bank of Canada remains more hawkish. In a speech on Friday, its chief Tiff Macklem said it was too early to consider cutting interest rates as inflation remained stubbornly above target.
Also, the weakening of the US dollar could have been influenced by disappointing news about Flash Manufacturing PMI values in the US: actual = 48.2, expectations = 49.5, a month earlier = 49.4.
We wrote about bearish signs on the chart back on December 1st.
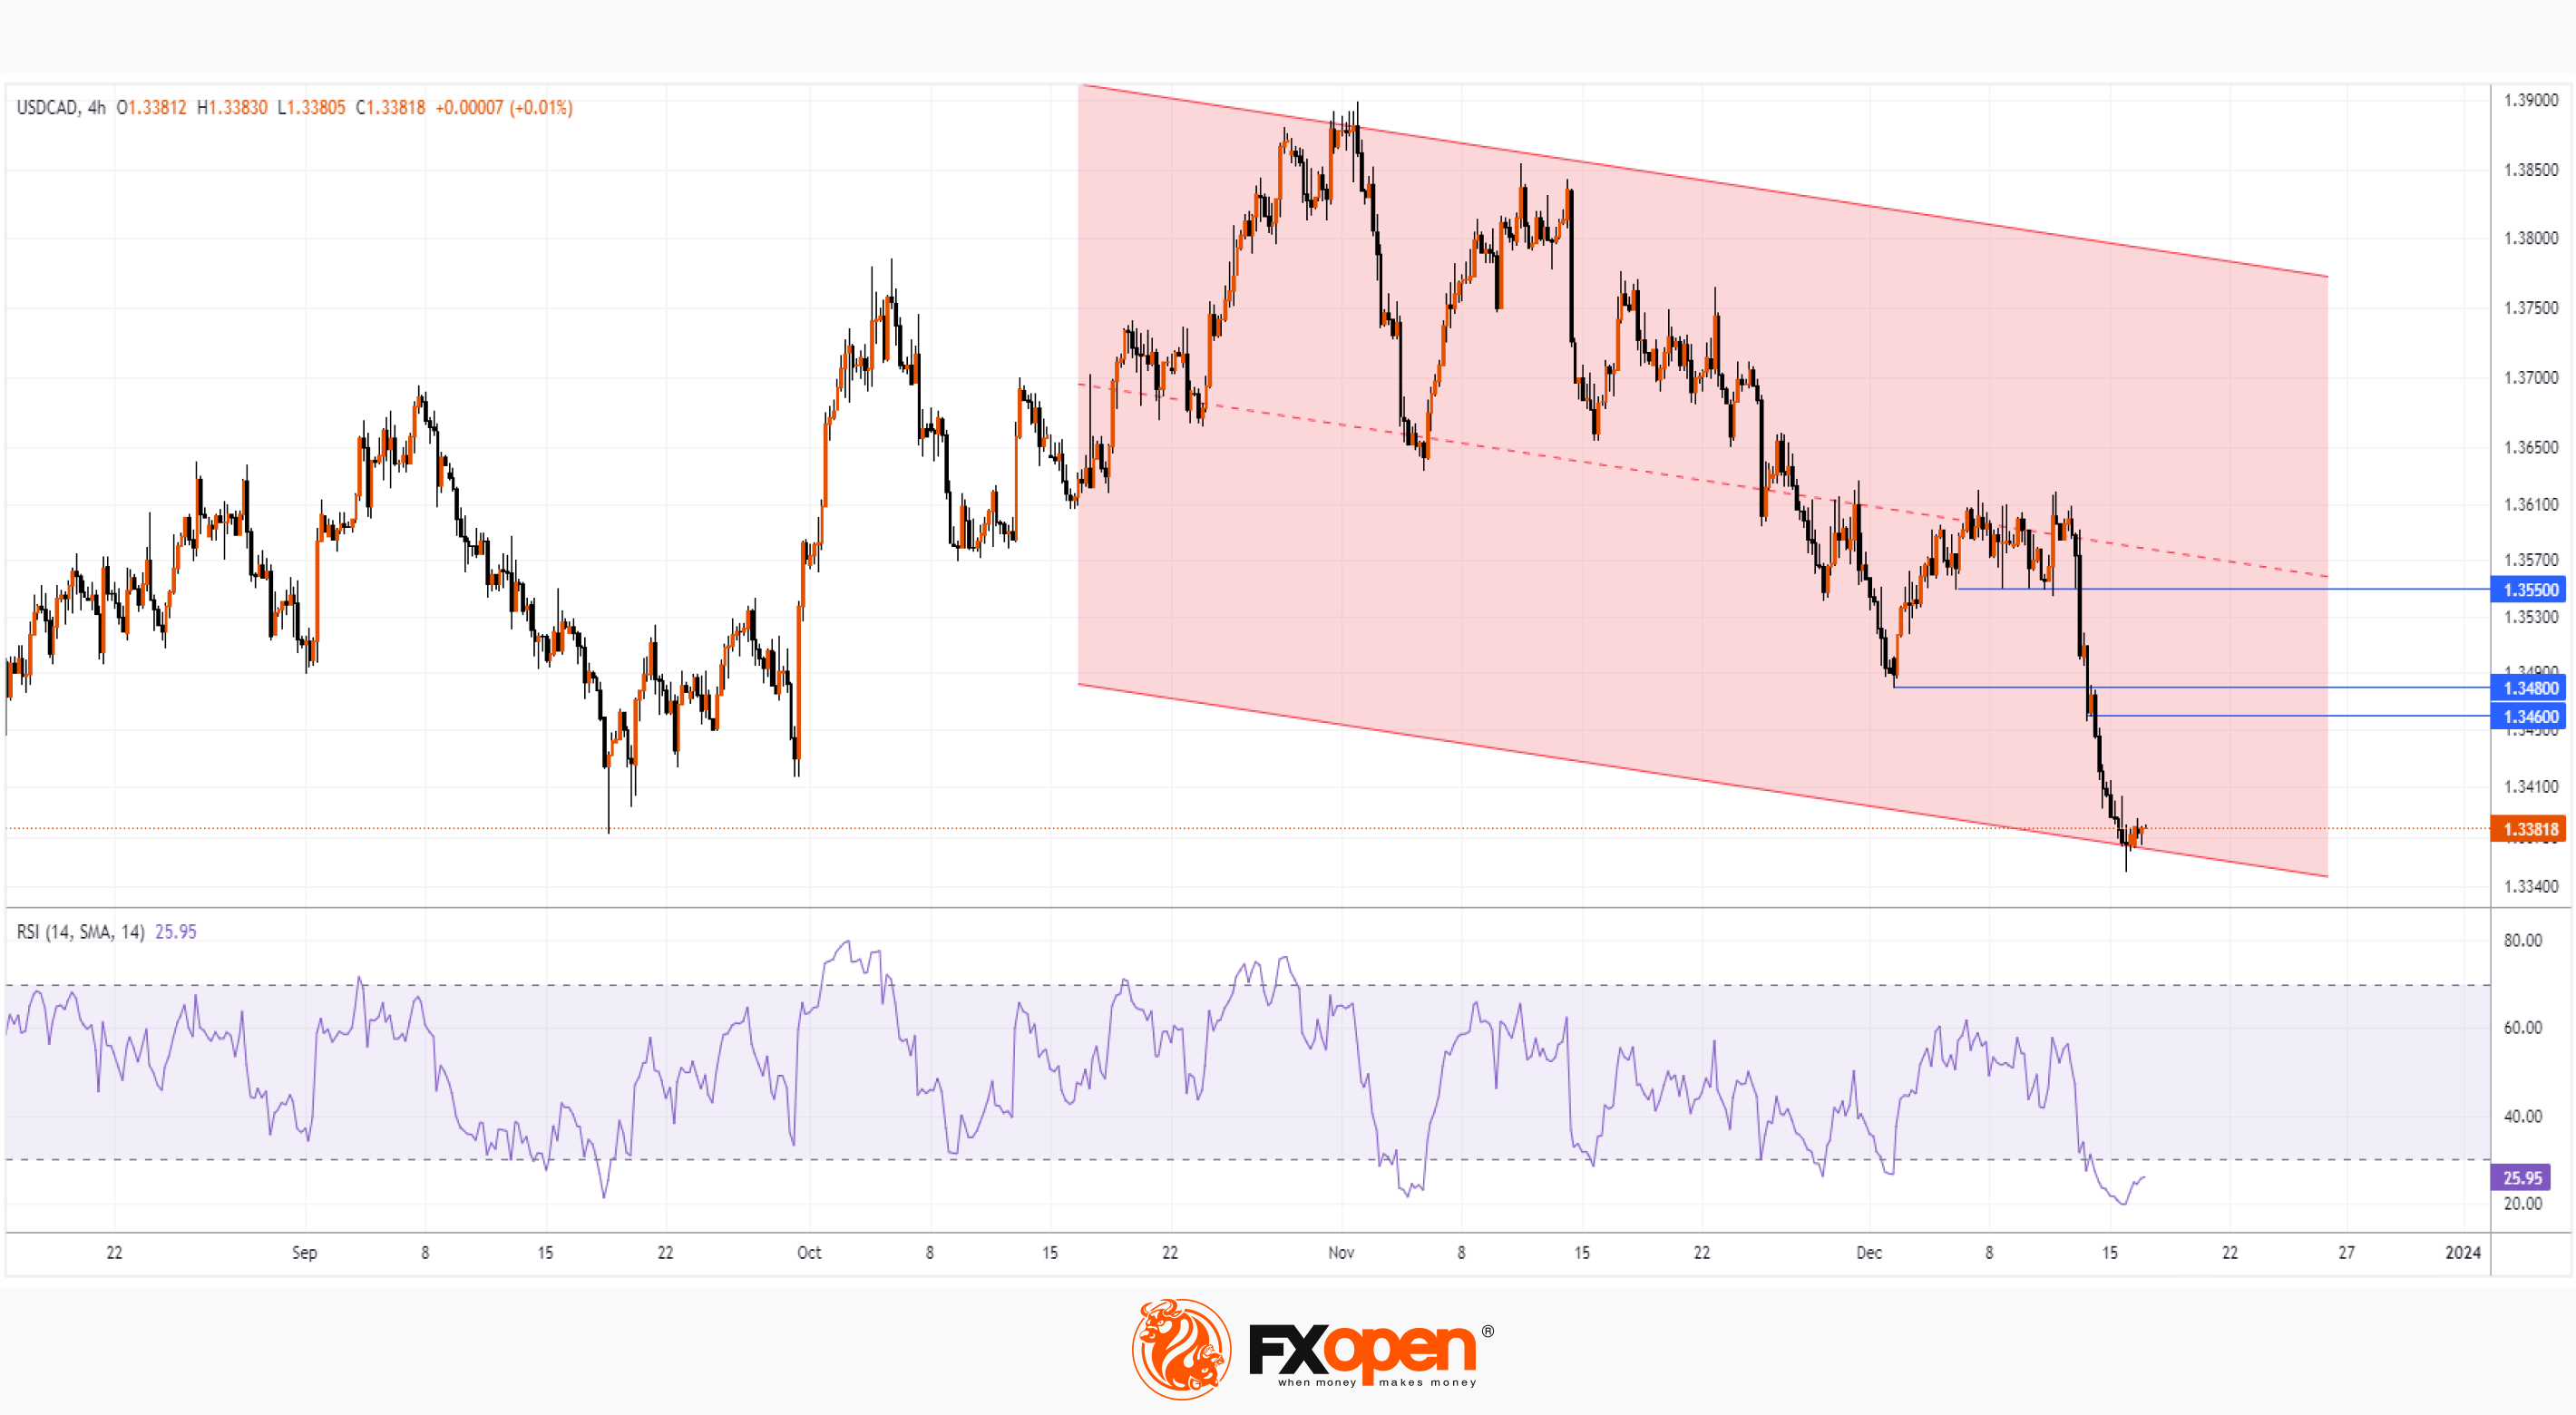
The current 4-hour chart shows that:
→ the USD/CAD price forms a downward channel (shown in red). What is noteworthy is that the price dropped to its lower limit (potential support);
→ the RSI indicator indicates a strong oversold market;
→ the price only dropped slightly below the September low, and then consolidated intraday - forcing attention to the formation of a false breakout of the low.
Taking into account the above arguments, it is worth assuming a scenario of a rebound from the lower border of the channel. For example, it is possible that the price will test the area 1.346-1.348, or the former support 1.355, resistance from which may be strengthened by the median line of the channel.
To benefit from price fluctuations in the USD/CAD market, consider enlisting the services of a trusted broker like FXOpen.
CFDs are complex instruments and come with a high risk of losing your money.
This article represents the opinion of the Companies operating under the FXOpen brand only. It is not to be construed as an offer, solicitation, or recommendation with respect to products and services provided by the Companies operating under the FXOpen brand, nor is it to be considered financial advice.
USD/CAD Analysis: Rate Reaches Its Minimum in 4 Months
On Friday, the rate dropped below 1.366 for the first time since the beginning of August. This was facilitated by fundamental drivers:
→ The US dollar weakens after the Federal Reserve meeting, which signaled the possibility of lowering interest rates next year. Powell said monetary tightening is likely complete and discussions about cuts are "on the horizon."
→ On the contrary, the Bank of Canada remains more hawkish. In a speech on Friday, its chief Tiff Macklem said it was too early to consider cutting interest rates as inflation remained stubbornly above target.
Also, the weakening of the US dollar could have been influenced by disappointing news about Flash Manufacturing PMI values in the US: actual = 48.2, expectations = 49.5, a month earlier = 49.4.
We wrote about bearish signs on the chart back on December 1st.
The current 4-hour chart shows that:
→ the USD/CAD price forms a downward channel (shown in red). What is noteworthy is that the price dropped to its lower limit (potential support);
→ the RSI indicator indicates a strong oversold market;
→ the price only dropped slightly below the September low, and then consolidated intraday - forcing attention to the formation of a false breakout of the low.
Taking into account the above arguments, it is worth assuming a scenario of a rebound from the lower border of the channel. For example, it is possible that the price will test the area 1.346-1.348, or the former support 1.355, resistance from which may be strengthened by the median line of the channel.
To benefit from price fluctuations in the USD/CAD market, consider enlisting the services of a trusted broker like FXOpen.
CFDs are complex instruments and come with a high risk of losing your money.
This article represents the opinion of the Companies operating under the FXOpen brand only. It is not to be construed as an offer, solicitation, or recommendation with respect to products and services provided by the Companies operating under the FXOpen brand, nor is it to be considered financial advice.
#marketanalysis #stockmarket #MarketNews
Market Analysis: USD/JPY and NIKKEI React to Bank of Japan Decision
This morning, the Bank of Japan decided to leave interest rates unchanged at -0.10%. Its head, Kazuo Ueda, stated that:
→ the chances that the current ultra-loose monetary policy will change in January are very small;
→ further decisions of the Bank of Japan will be based on incoming economic information.
Thus, rumors that the Bank of Japan might raise rates from the negative zone did not come true. As a result, the NIKKEI index rose to November highs, and the yen weakened.
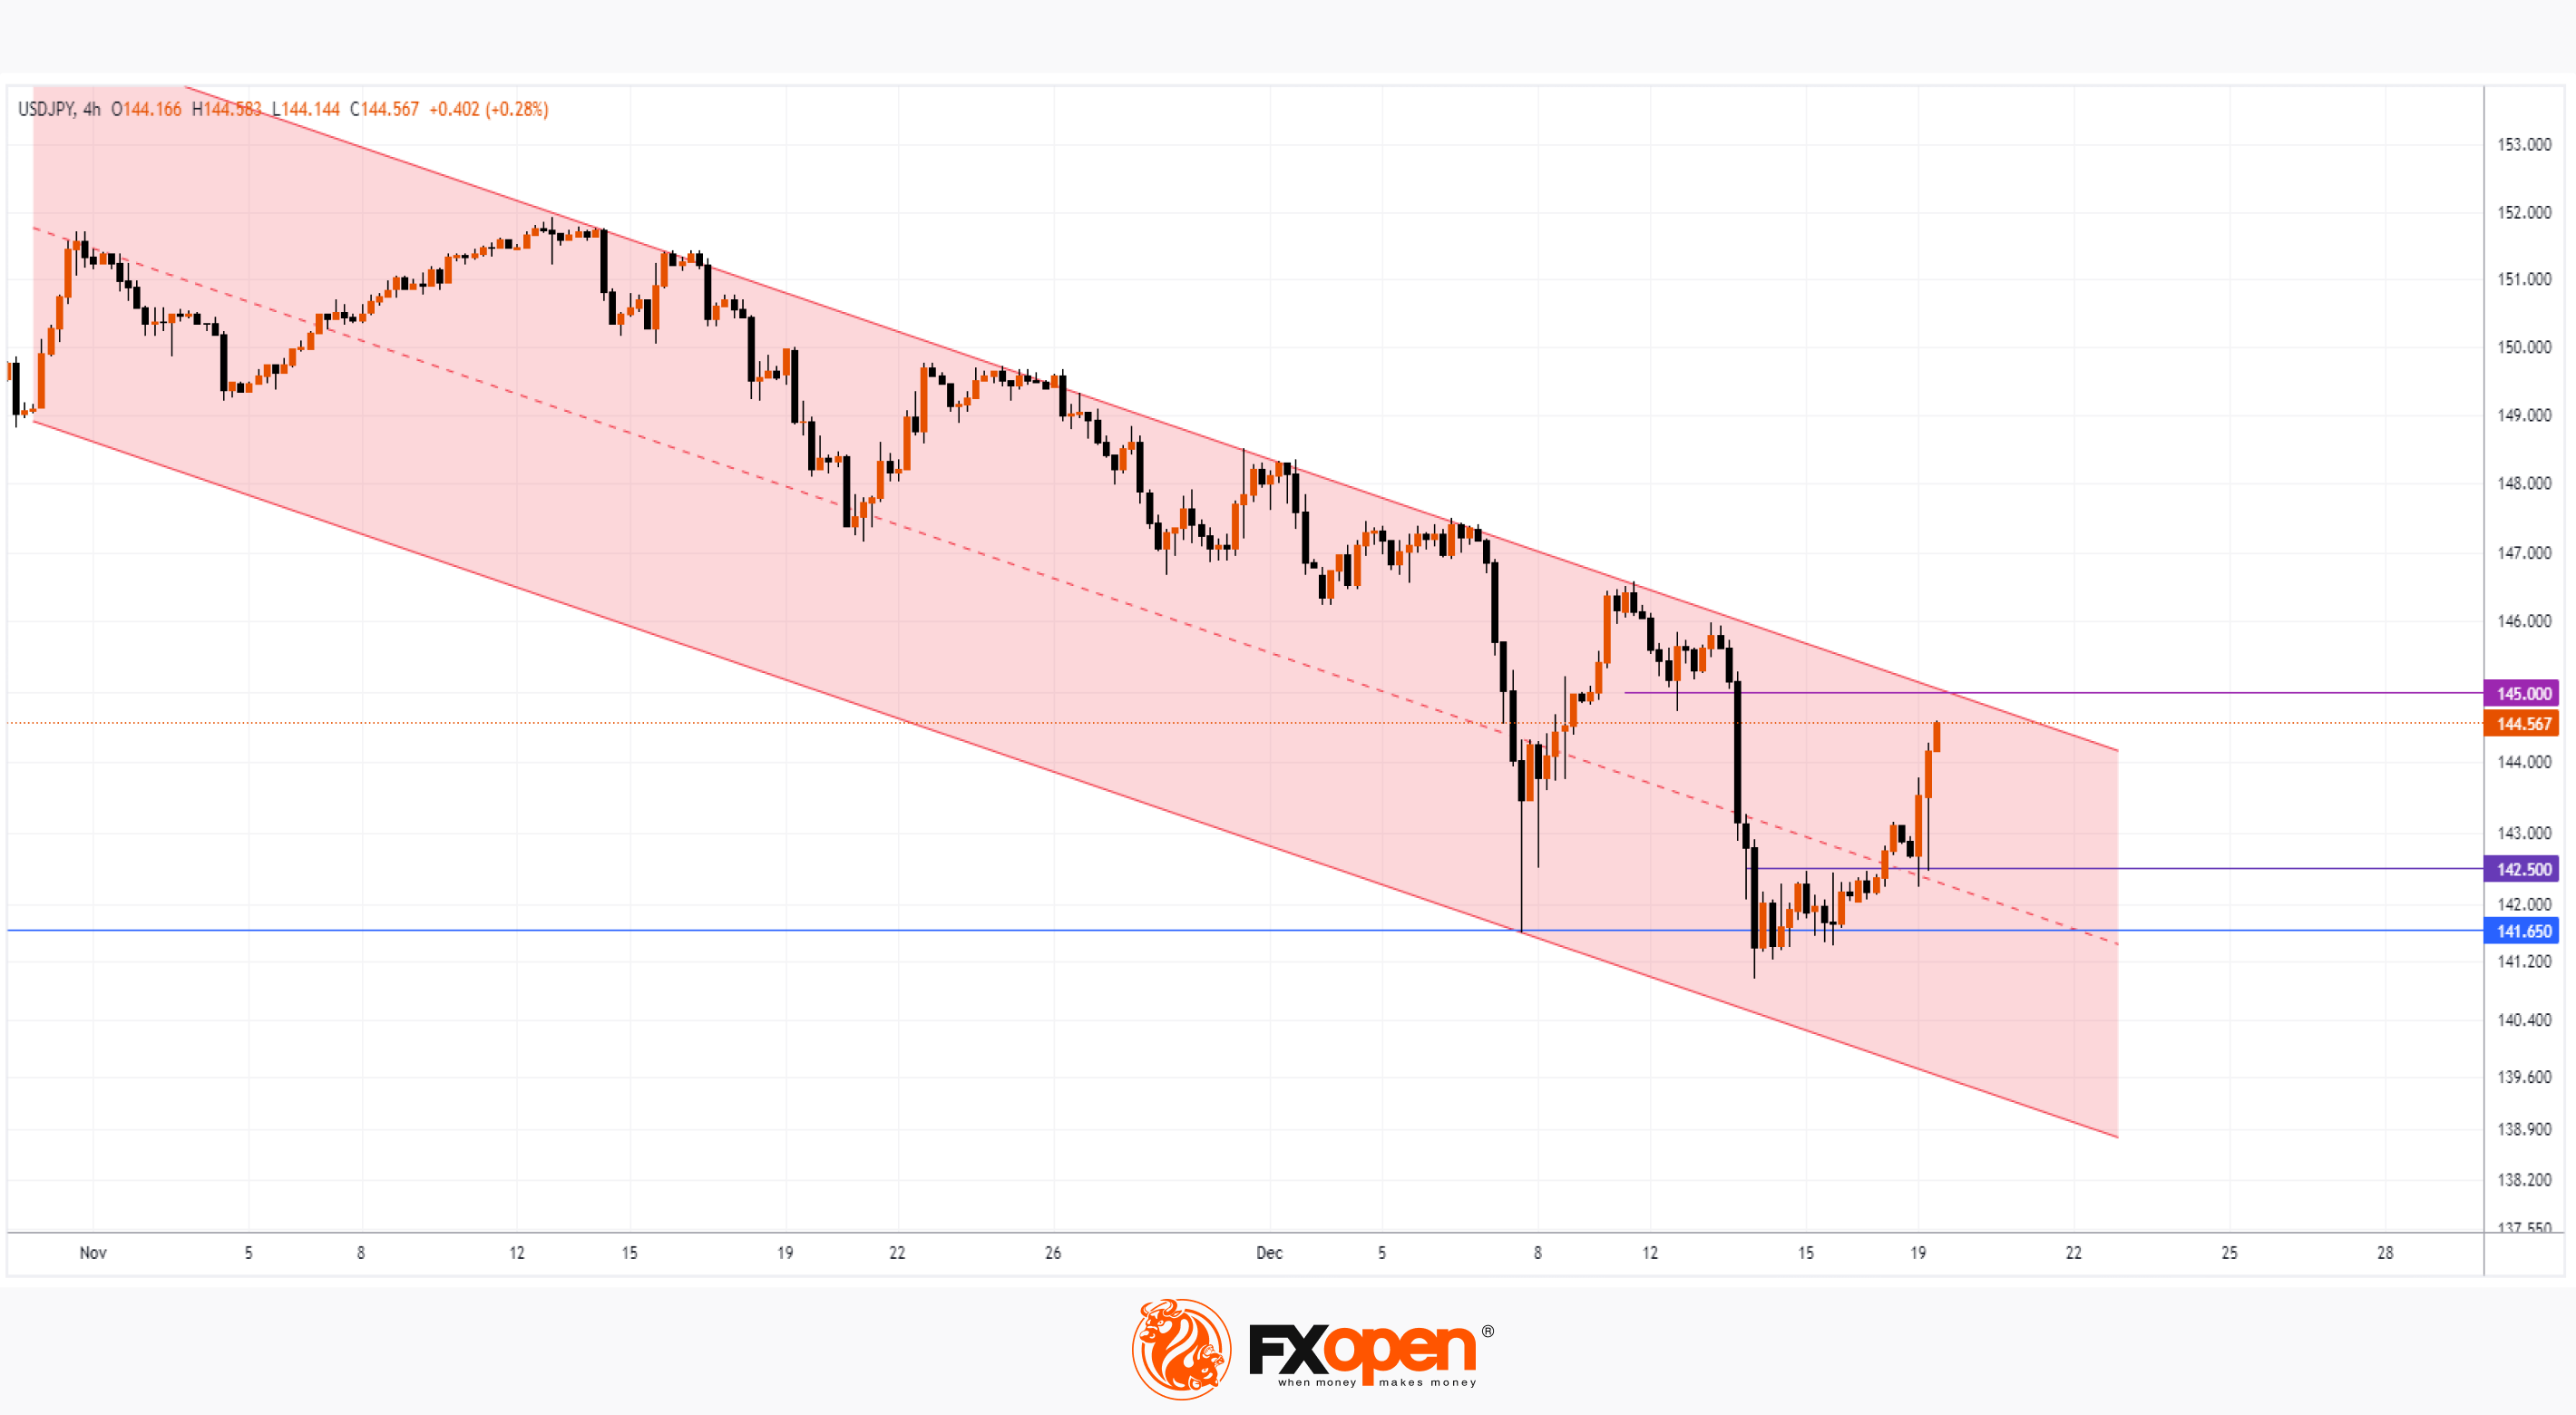
The 4 hour USD/JPY chart shows that:
→ The price forms a downward channel (shown in red). The strengthening of the yen against the US dollar, observed since November, was caused by both rumors related to the Bank of Japan and the prospect of a rate cut by the Federal Reserve.
→ The lower border of the channel pushed the price upward on December 7, indicating support at 141.65.
→ On December 14, there was an attempt at a bearish breakdown of this support. But instead of developing a downward movement to another touch with the lower border of the channel, the price entered into consolidation (an early bullish sign), which lasted until the end of last week and marked the resistance level of 142.5.
→ The closer the Bank of Japan's decision was, the stronger the bulls became. After breaking through the level of 142.5, it was tested. Moreover, not only the level of 142.5, but also the median line of the channel showed its support role.
The upward momentum that the USD/JPY market has received may develop during today's American session. It is possible that the quote will reach resistance at 145 yen per dollar, which is strengthened by the upper boundary of the downward channel.
To benefit from fluctuations in the global currency markets, consider enlisting the services of a trusted broker like FXOpen.
Market Analysis: USD/JPY and NIKKEI React to Bank of Japan Decision
This morning, the Bank of Japan decided to leave interest rates unchanged at -0.10%. Its head, Kazuo Ueda, stated that:
→ the chances that the current ultra-loose monetary policy will change in January are very small;
→ further decisions of the Bank of Japan will be based on incoming economic information.
Thus, rumors that the Bank of Japan might raise rates from the negative zone did not come true. As a result, the NIKKEI index rose to November highs, and the yen weakened.
The 4 hour USD/JPY chart shows that:
→ The price forms a downward channel (shown in red). The strengthening of the yen against the US dollar, observed since November, was caused by both rumors related to the Bank of Japan and the prospect of a rate cut by the Federal Reserve.
→ The lower border of the channel pushed the price upward on December 7, indicating support at 141.65.
→ On December 14, there was an attempt at a bearish breakdown of this support. But instead of developing a downward movement to another touch with the lower border of the channel, the price entered into consolidation (an early bullish sign), which lasted until the end of last week and marked the resistance level of 142.5.
→ The closer the Bank of Japan's decision was, the stronger the bulls became. After breaking through the level of 142.5, it was tested. Moreover, not only the level of 142.5, but also the median line of the channel showed its support role.
The upward momentum that the USD/JPY market has received may develop during today's American session. It is possible that the quote will reach resistance at 145 yen per dollar, which is strengthened by the upper boundary of the downward channel.
To benefit from fluctuations in the global currency markets, consider enlisting the services of a trusted broker like FXOpen.
#marketanalysis #stockmarket #AMZN #stocks
AMZN: Stock Price Ends Year Stronger Than S&P 500
Amazon shares are up approximately 79% year to date in 2023, outperforming the S&P 500. This reflects the company's strong fundamentals:
→ Amazon's third-quarter results beat Wall Street estimates, helped by growth in its cloud and advertising businesses. According to Barchart, analysts are forecasting AMZN's earnings growth of 35% in fiscal 2024, as well as revenue growth of 11%.
→ Positive forecasts are associated with the activation of retail trade. In the past three months alone, the SPDR S&P Retail ETF has gained 16.4%, significantly outpacing the S&P 500's 6.8% gain over the same period, according to FactSet data. Therefore, AMZN could benefit significantly from the holiday shopping season.
→ Analysts are praising the prospects of the Prime platform, which will soon broadcast games involving 40 major league teams in baseball, basketball and hockey.
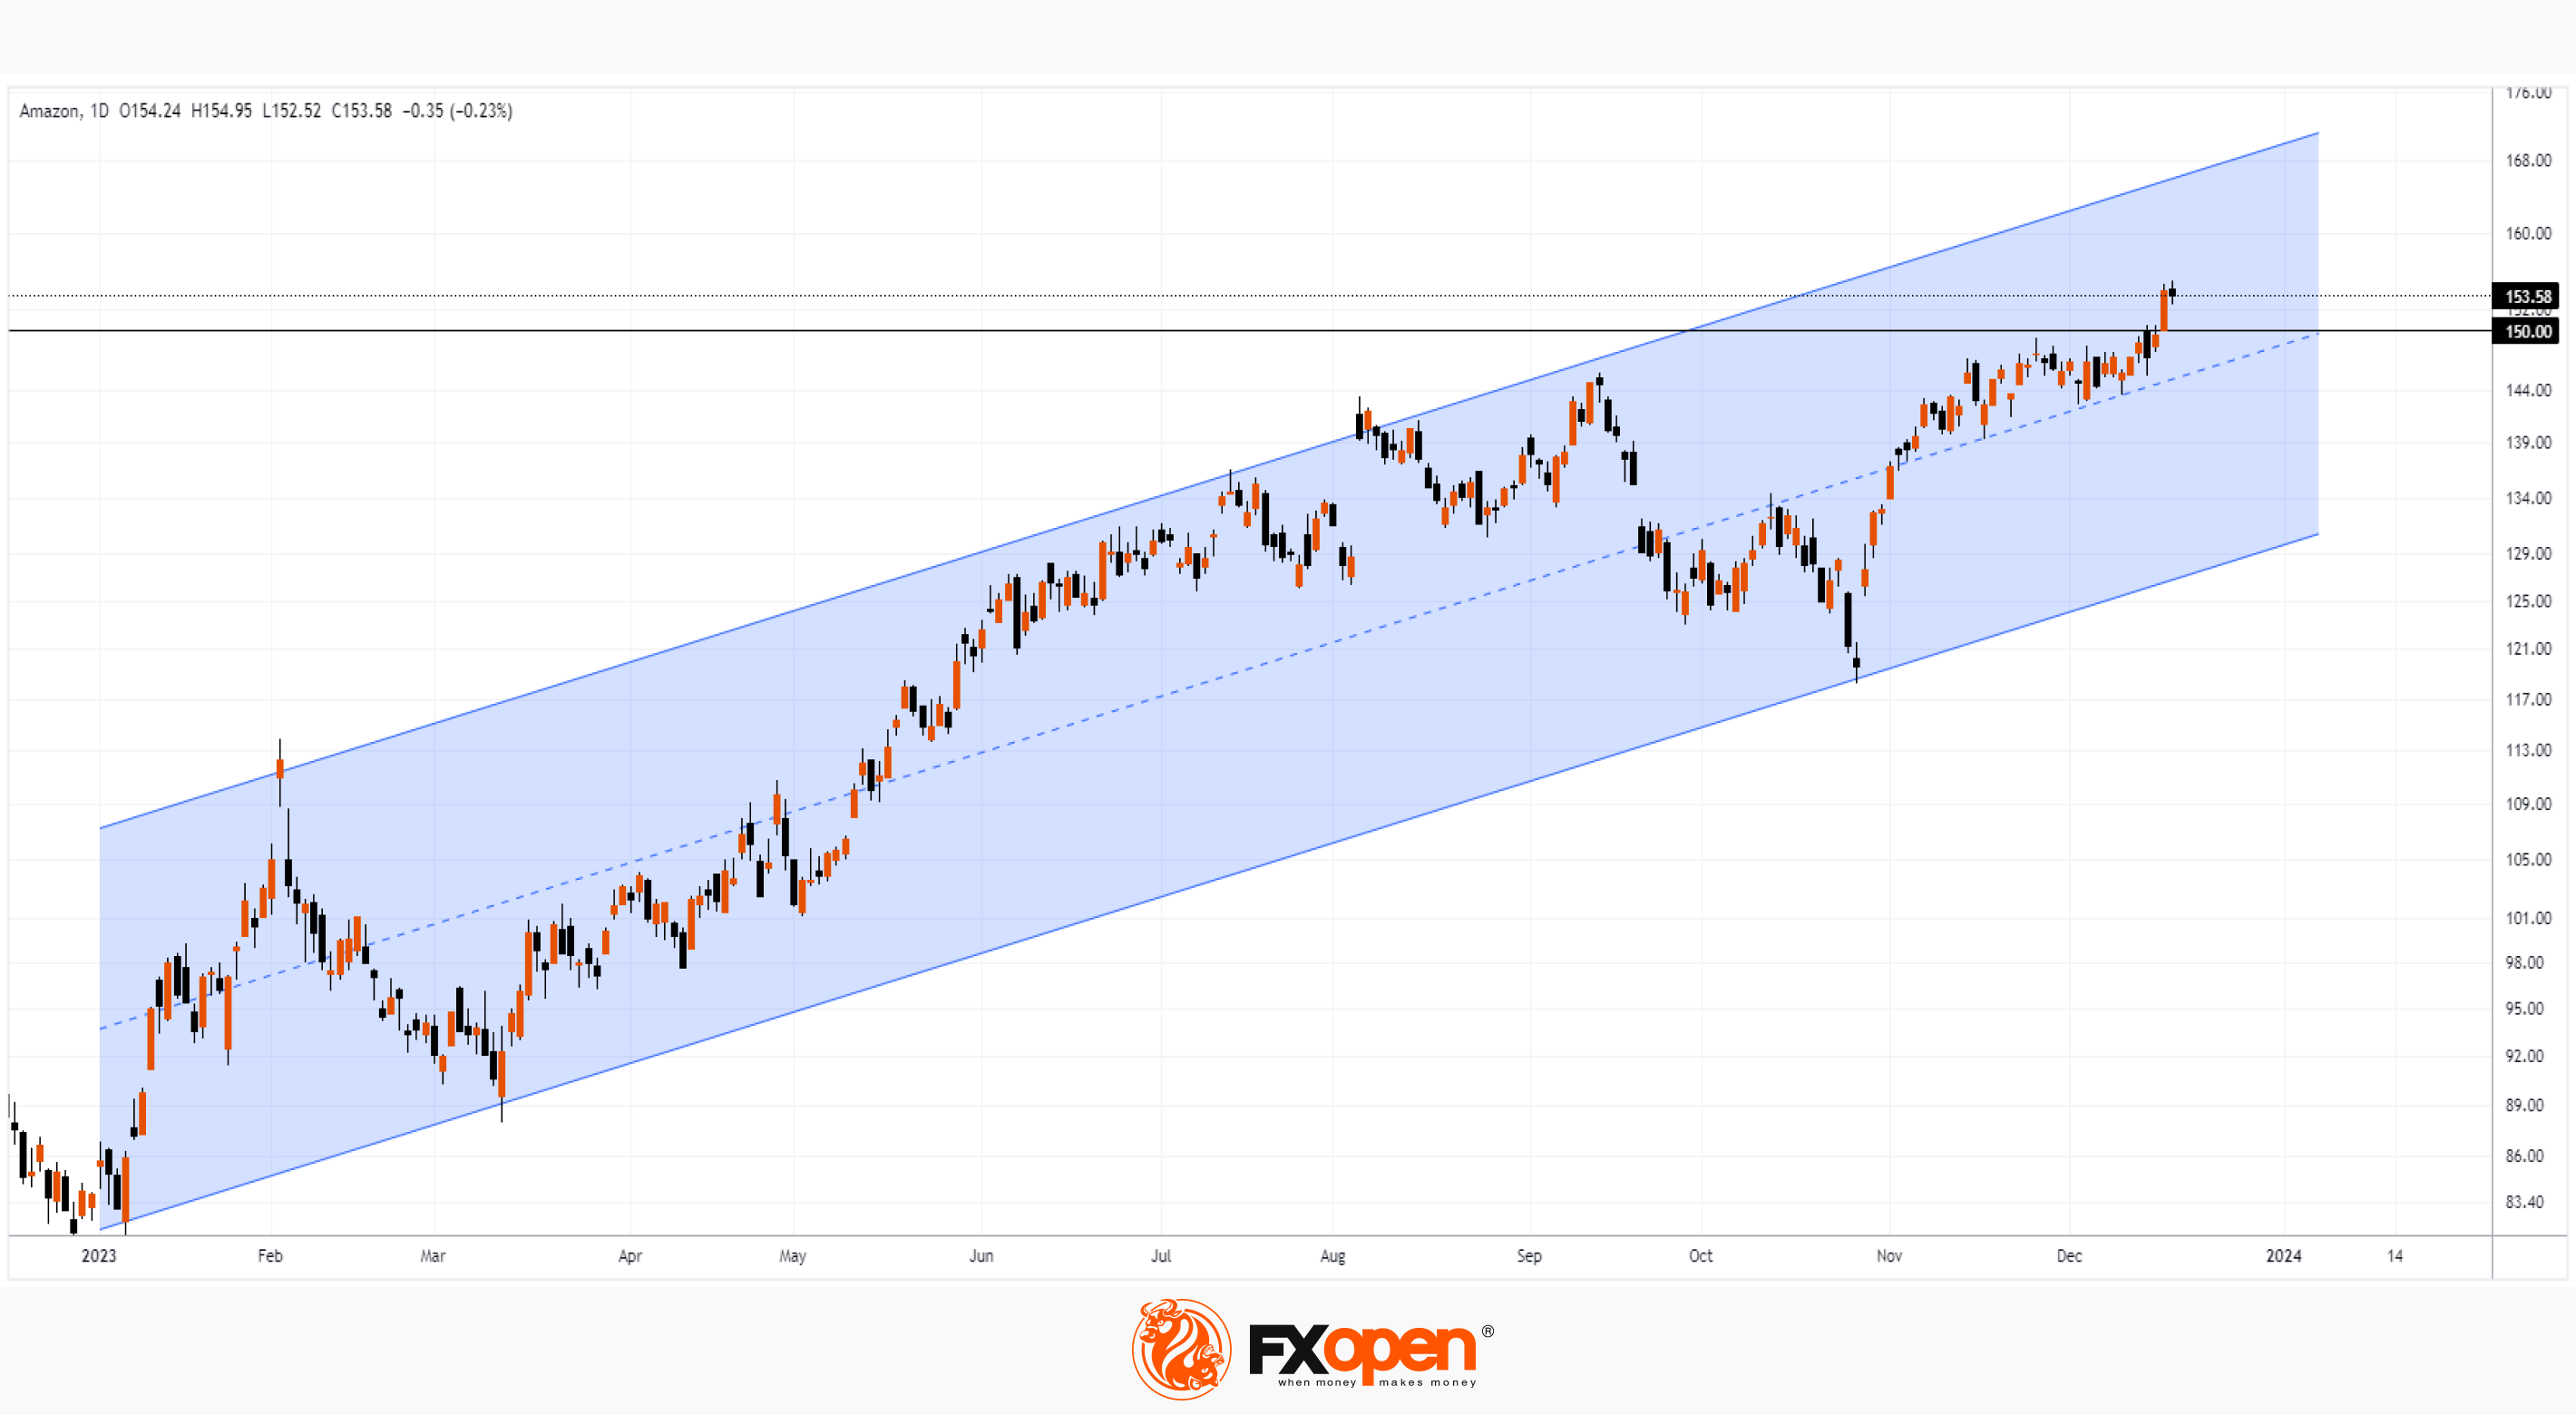
The chart shows that the AMZN stock price is moving steadily within the ascending channel (shown in blue). Wherein:
→ the price quickly rebounded from its lower border at the end of October - a sign of strong demand;
→ the price is able to stay in the upper half of the channel, using its median line as support and forming rising lows in December;
→ at the beginning of the new week, the price exceeded the psychological level of USD 150, setting a high of the year.
Now the bulls need to consolidate the progress made and keep the price above the psychological level — it is possible that we will see a test of the USD 150 level, which previously acted as resistance, therefore, there is reason to expect that it will serve as support. It is possible that the bulls will try to update the fresh high of the year.
To benefit from fluctuations in the prices of the most popular companies, consider enlisting the services of a trusted broker like FXOpen.
AMZN: Stock Price Ends Year Stronger Than S&P 500
Amazon shares are up approximately 79% year to date in 2023, outperforming the S&P 500. This reflects the company's strong fundamentals:
→ Amazon's third-quarter results beat Wall Street estimates, helped by growth in its cloud and advertising businesses. According to Barchart, analysts are forecasting AMZN's earnings growth of 35% in fiscal 2024, as well as revenue growth of 11%.
→ Positive forecasts are associated with the activation of retail trade. In the past three months alone, the SPDR S&P Retail ETF has gained 16.4%, significantly outpacing the S&P 500's 6.8% gain over the same period, according to FactSet data. Therefore, AMZN could benefit significantly from the holiday shopping season.
→ Analysts are praising the prospects of the Prime platform, which will soon broadcast games involving 40 major league teams in baseball, basketball and hockey.
The chart shows that the AMZN stock price is moving steadily within the ascending channel (shown in blue). Wherein:
→ the price quickly rebounded from its lower border at the end of October - a sign of strong demand;
→ the price is able to stay in the upper half of the channel, using its median line as support and forming rising lows in December;
→ at the beginning of the new week, the price exceeded the psychological level of USD 150, setting a high of the year.
Now the bulls need to consolidate the progress made and keep the price above the psychological level — it is possible that we will see a test of the USD 150 level, which previously acted as resistance, therefore, there is reason to expect that it will serve as support. It is possible that the bulls will try to update the fresh high of the year.
To benefit from fluctuations in the prices of the most popular companies, consider enlisting the services of a trusted broker like FXOpen.
#xau #XAUUSD #xauusdgold #goldprice
Market Analysis: Gold Price Eyes Breakout, Crude Oil Price Recovers
🔸 Gold price started a decent increase from the $1,975 zone against the US Dollar.
🔸 A connecting bullish trend line is forming with support near $2,030 on the hourly chart of gold at FXOpen.
🔸 Crude oil prices rallied above the $71.00 and $73.00 resistance levels.
🔸 There is a key bullish trend line forming with support near $73.00 on the hourly chart of XTI/USD at FXOpen.
🔗 Learn more: https://cutt.ly/WwDgvzUF
To take advantage of price fluctuations in the foreign exchange markets, consider enlisting the services of a reliable broker like FXOpen.
⚠️
This forecast represents FXOpen Companies opinion only, it should not be construed as an offer, invitation or recommendation in respect to FXOpen Companies products and services or as financial advice
Market Analysis: Gold Price Eyes Breakout, Crude Oil Price Recovers
🔸 Gold price started a decent increase from the $1,975 zone against the US Dollar.
🔸 A connecting bullish trend line is forming with support near $2,030 on the hourly chart of gold at FXOpen.
🔸 Crude oil prices rallied above the $71.00 and $73.00 resistance levels.
🔸 There is a key bullish trend line forming with support near $73.00 on the hourly chart of XTI/USD at FXOpen.
🔗 Learn more: https://cutt.ly/WwDgvzUF
To take advantage of price fluctuations in the foreign exchange markets, consider enlisting the services of a reliable broker like FXOpen.
⚠️
This forecast represents FXOpen Companies opinion only, it should not be construed as an offer, invitation or recommendation in respect to FXOpen Companies products and services or as financial advice
Market Pulse
Market Analysis: Gold Price Eyes Breakout, Crude Oil Price Recovers
Gold price gained traction and climbed above the $2,030 resistance level. Crude oil price is recovering, and it could climb further higher toward the $78 resistance.
#sp500 #MarketNews #stockmarket
S&P 500: Worst Day since September
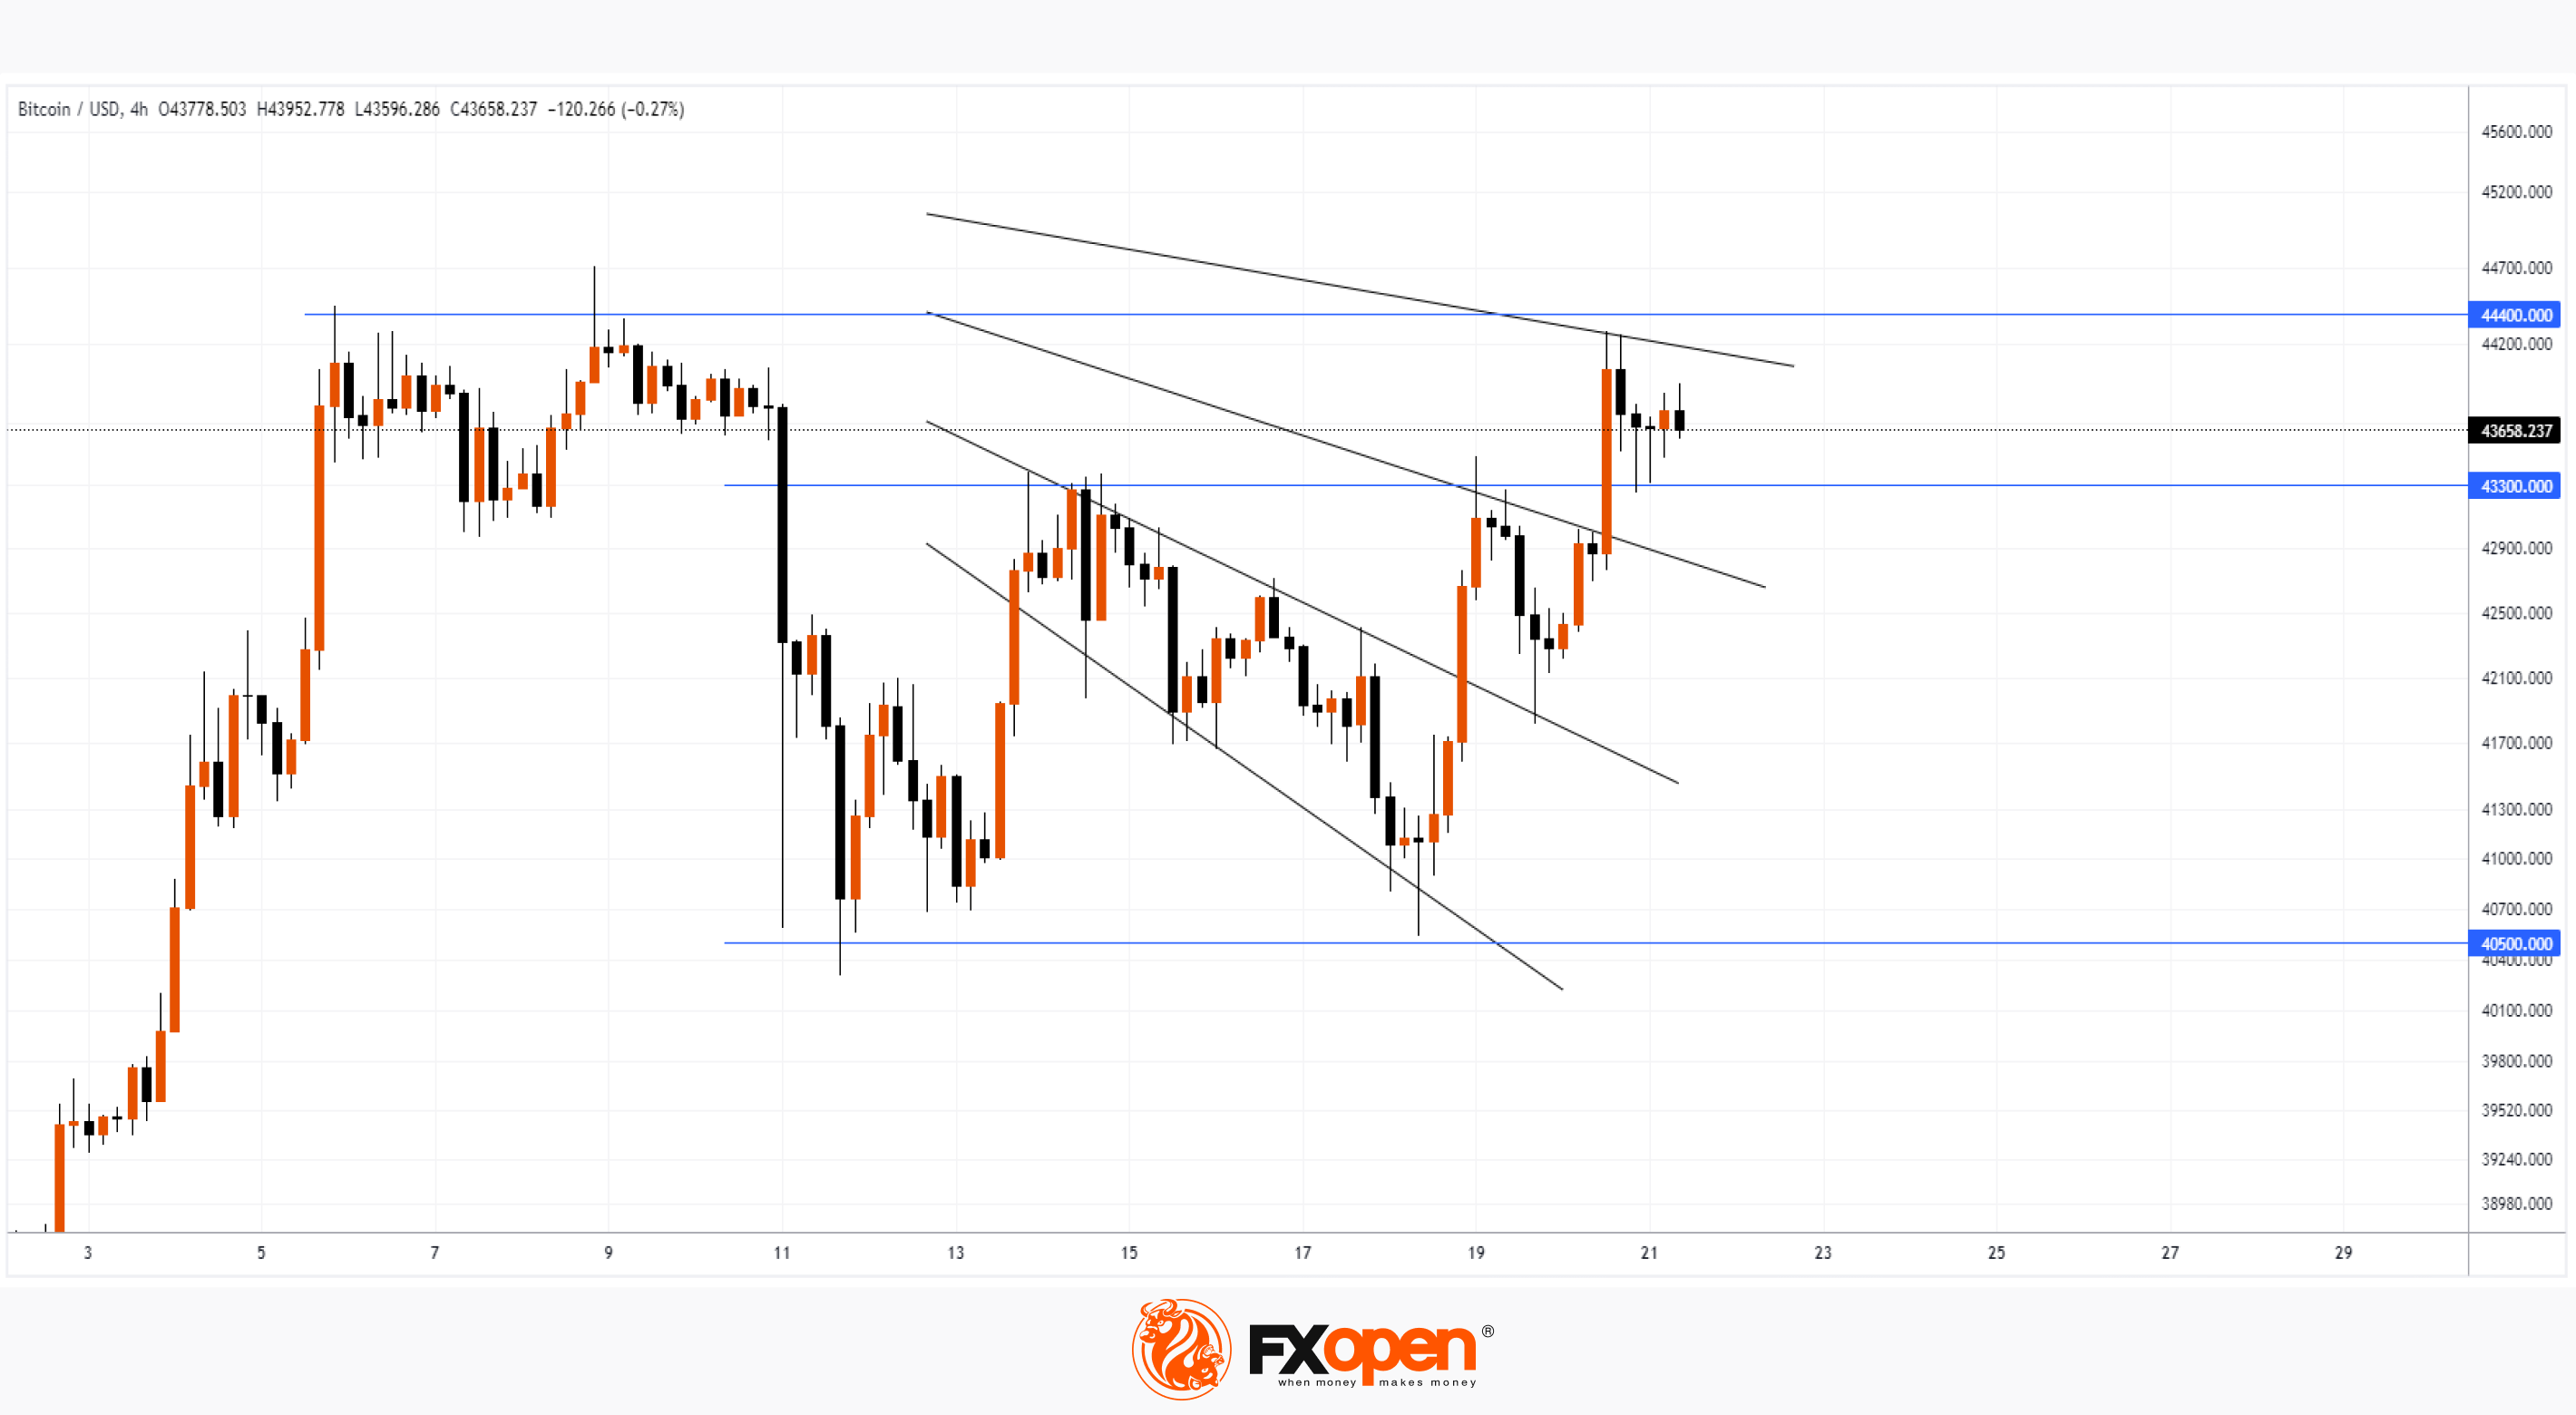
The S&P 500 fell 70.02 points, or 1.47%, to 4,698.35 yesterday, according to Dow Jones Newswires. This is the largest one-day point decline since Thursday, September 21, 2023.
Of the 500 stocks in the index, only 19 closed in the green. Of these, Google shares, as the company announced plans to reorganize its advertising department, which employs 30 thousand people.
From a fundamental perspective, there were no obvious triggers that carried enough weight to cause the sharp decline. Moreover, the Consumer Confidence indicator was published yesterday, which showed that consumer confidence has increased the most since the beginning of 2021.
From the point of view of behavioral psychology and technical analysis, the sharp decline has reasonable explanations:
→ from the low of late October to the beginning of yesterday's session, the S&P 500 index grew by 16%. This is an impressive rally, fueled by expectations of easing inflation and interest rate cuts in 2024. A significant correction is a logical development of events.
→ The market was overbought, as indicated by the RSI indicator. The indicator also pointed to divergence – a sign of weakening demand.
→ Buyers might want to lock in profits. And as yesterday's decline progressed, they could have rushed to do so, thereby accelerating the decline. It is logical to want to withdraw money and not hold positions during the holiday period.
It is important to take into account that the price of the S&P 500 was near important resistances:
→ near the historical maximum (by the way, the E-mini S&P 500 futures market exceeded the maximum);
→ near the upper border of the ascending channel (shown in blue).
Thus, the price of the S&P 500 dropped to support around 4,700. But it is possible that after yesterday’s decline, the market may receive additional bearish impulse at the opening of the American session. If the bears maintain the initiative shown yesterday, it is possible that they will be able to lower the price of the S&P 500 to the median line of the ascending channel.
To benefit from fluctuations in the stock markets, consider enlisting the services of a trusted broker like FXOpen.
CFDs are complex instruments and come with a high risk of losing your money.
This article represents the opinion of the Companies operating under the FXOpen brand only. It is not to be construed as an offer, solicitation, or recommendation with respect to products and services provided by the Companies operating under the FXOpen brand, nor is it to be considered financial advice.
S&P 500: Worst Day since September
The S&P 500 fell 70.02 points, or 1.47%, to 4,698.35 yesterday, according to Dow Jones Newswires. This is the largest one-day point decline since Thursday, September 21, 2023.
Of the 500 stocks in the index, only 19 closed in the green. Of these, Google shares, as the company announced plans to reorganize its advertising department, which employs 30 thousand people.
From a fundamental perspective, there were no obvious triggers that carried enough weight to cause the sharp decline. Moreover, the Consumer Confidence indicator was published yesterday, which showed that consumer confidence has increased the most since the beginning of 2021.
From the point of view of behavioral psychology and technical analysis, the sharp decline has reasonable explanations:
→ from the low of late October to the beginning of yesterday's session, the S&P 500 index grew by 16%. This is an impressive rally, fueled by expectations of easing inflation and interest rate cuts in 2024. A significant correction is a logical development of events.
→ The market was overbought, as indicated by the RSI indicator. The indicator also pointed to divergence – a sign of weakening demand.
→ Buyers might want to lock in profits. And as yesterday's decline progressed, they could have rushed to do so, thereby accelerating the decline. It is logical to want to withdraw money and not hold positions during the holiday period.
It is important to take into account that the price of the S&P 500 was near important resistances:
→ near the historical maximum (by the way, the E-mini S&P 500 futures market exceeded the maximum);
→ near the upper border of the ascending channel (shown in blue).
Thus, the price of the S&P 500 dropped to support around 4,700. But it is possible that after yesterday’s decline, the market may receive additional bearish impulse at the opening of the American session. If the bears maintain the initiative shown yesterday, it is possible that they will be able to lower the price of the S&P 500 to the median line of the ascending channel.
To benefit from fluctuations in the stock markets, consider enlisting the services of a trusted broker like FXOpen.
CFDs are complex instruments and come with a high risk of losing your money.
This article represents the opinion of the Companies operating under the FXOpen brand only. It is not to be construed as an offer, solicitation, or recommendation with respect to products and services provided by the Companies operating under the FXOpen brand, nor is it to be considered financial advice.
#bitcoin #BTCUSD #btcprice #crypto
BTC/USD: News Reports Encourage Bulls to Attack the $44k Level
Optimism associated with the SEC regulator's approval of applications to launch BTC-ETF is the main driver of Bitcoin price growth.
Coindesk reports that representatives from BlackRock, Nasdaq and the Securities and Exchange Commission (SEC) met for the second time in a month to discuss rule changes required for the listing of an exchange-traded BTC-ETF.
And companies like Bitwise and Hashdex have already launched advertising campaigns to attract attention to the BTC-ETF — apparently demonstrating confidence that applications will be approved.
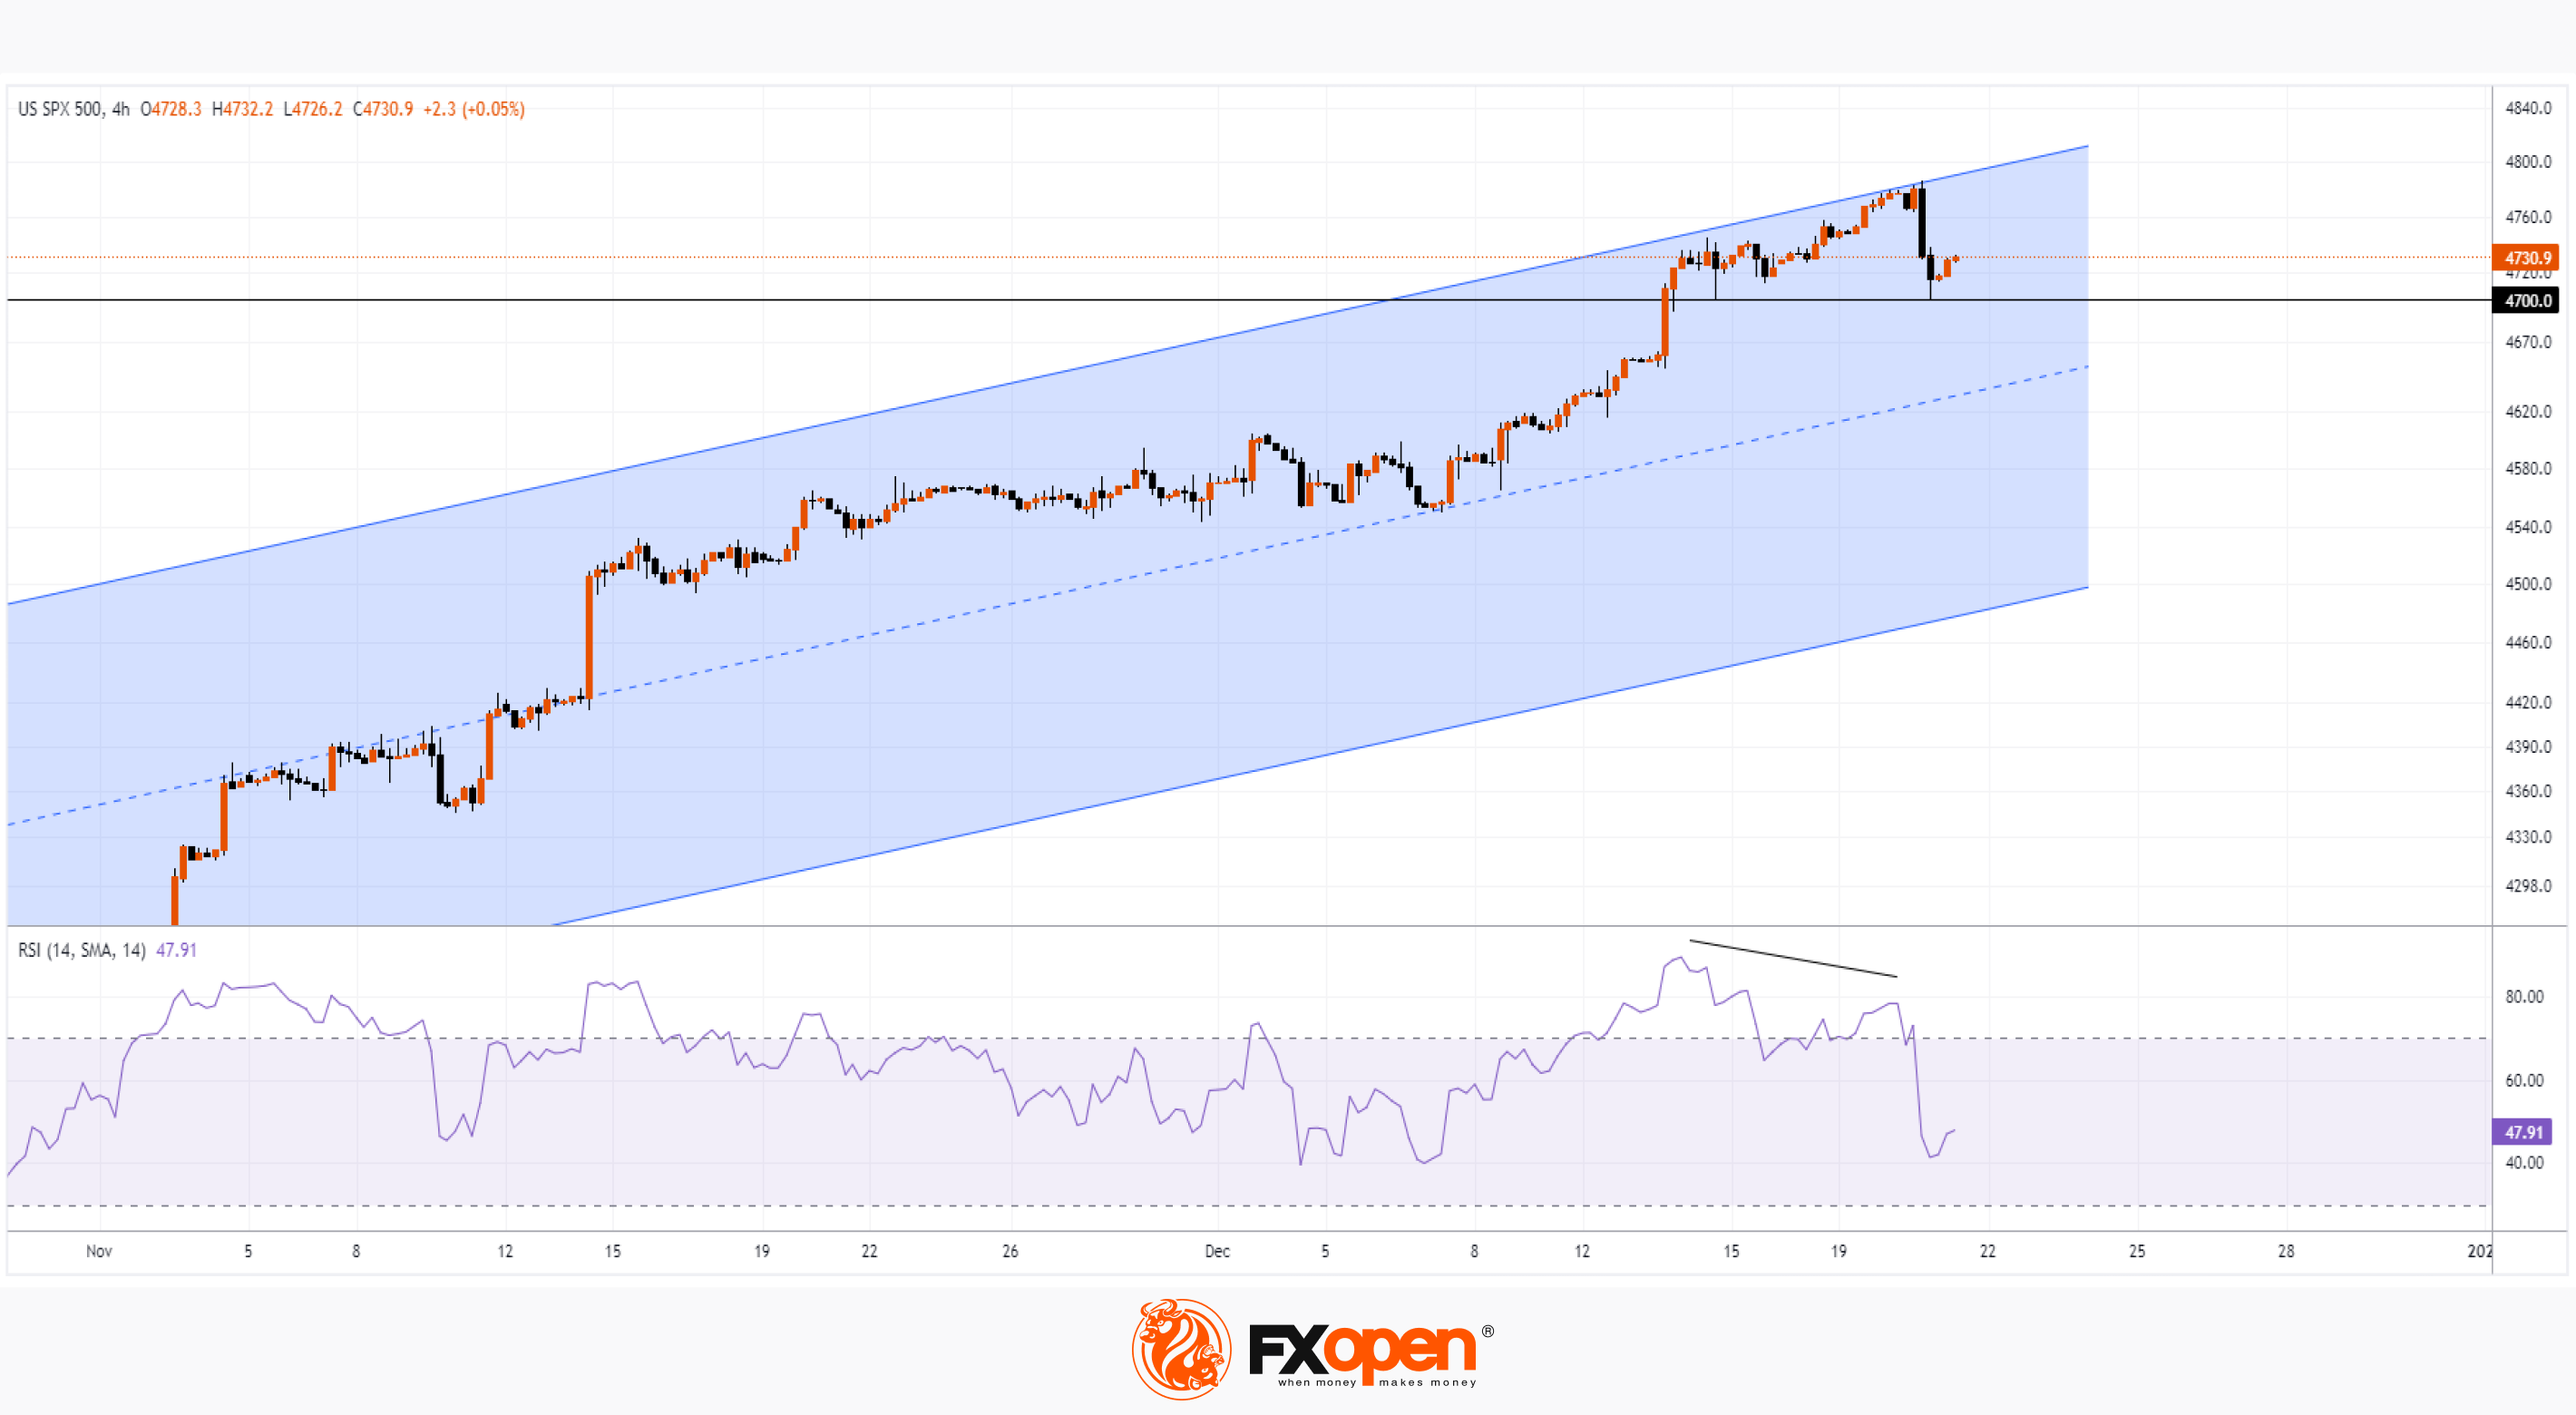
The graph shows that:
→ the price of BTC/USD has recovered after a strong fall on December 11 - this is a sign of the strength of demand in the market. The level of 40,500 served as a reliable support for the recovery, which was tested on November 18th.
→ On December 20, the bulls were able to overcome the level of 43,300, which provided resistance on December 13-14 and 19. This level is now showing signs of support.
→ There is an important obstacle in front of the bulls. It is formed from the $44k level and the upper black line, forming some structure similar to a Gann fan and having a noticeable impact on the price of Bitcoin this month.
The media is increasingly citing January 10 as a possible date by which the SEC's decision, believed to approve the launch of the ETF, will be published. It is possible that as we approach this date, the bulls will be able to overcome the $44k resistance.
To benefit from the rise and fall of cryptocurrency rates, consider enlisting the services of a trusted broker like FXOpen.
CFDs are complex instruments and come with a high risk of losing your money.
This article represents the opinion of the Companies operating under the FXOpen brand only. It is not to be construed as an offer, solicitation, or recommendation with respect to products and services provided by the Companies operating under the FXOpen brand, nor is it to be considered financial advice.
At FXOpen UK and FXOpen AU, Cryptocurrency CFDs are only available for trading by those clients categorised as Professional clients under FCA Rules and Professional clients under ASIC Rules, respectively. They are not available for trading by Retail clients.
BTC/USD: News Reports Encourage Bulls to Attack the $44k Level
Optimism associated with the SEC regulator's approval of applications to launch BTC-ETF is the main driver of Bitcoin price growth.
Coindesk reports that representatives from BlackRock, Nasdaq and the Securities and Exchange Commission (SEC) met for the second time in a month to discuss rule changes required for the listing of an exchange-traded BTC-ETF.
And companies like Bitwise and Hashdex have already launched advertising campaigns to attract attention to the BTC-ETF — apparently demonstrating confidence that applications will be approved.
The graph shows that:
→ the price of BTC/USD has recovered after a strong fall on December 11 - this is a sign of the strength of demand in the market. The level of 40,500 served as a reliable support for the recovery, which was tested on November 18th.
→ On December 20, the bulls were able to overcome the level of 43,300, which provided resistance on December 13-14 and 19. This level is now showing signs of support.
→ There is an important obstacle in front of the bulls. It is formed from the $44k level and the upper black line, forming some structure similar to a Gann fan and having a noticeable impact on the price of Bitcoin this month.
The media is increasingly citing January 10 as a possible date by which the SEC's decision, believed to approve the launch of the ETF, will be published. It is possible that as we approach this date, the bulls will be able to overcome the $44k resistance.
To benefit from the rise and fall of cryptocurrency rates, consider enlisting the services of a trusted broker like FXOpen.
CFDs are complex instruments and come with a high risk of losing your money.
This article represents the opinion of the Companies operating under the FXOpen brand only. It is not to be construed as an offer, solicitation, or recommendation with respect to products and services provided by the Companies operating under the FXOpen brand, nor is it to be considered financial advice.
At FXOpen UK and FXOpen AU, Cryptocurrency CFDs are only available for trading by those clients categorised as Professional clients under FCA Rules and Professional clients under ASIC Rules, respectively. They are not available for trading by Retail clients.
#marketanalysis #MarketNews #XAUUSD #goldprice
Price of Gold on the Rise amid US GDP Slowdown
Yesterday's data for last quarter showed that US GDP growth was estimated at 4.9% year-on-year, although GDP growth was expected to remain unchanged at 5.2%.
This disappointing performance could put pressure on the Fed to cut rates. After data is published:
→ the market has increased the likelihood of a rate cut by March to 83% from 79%, as evidenced by FedWatch;
→ the dollar index fell.
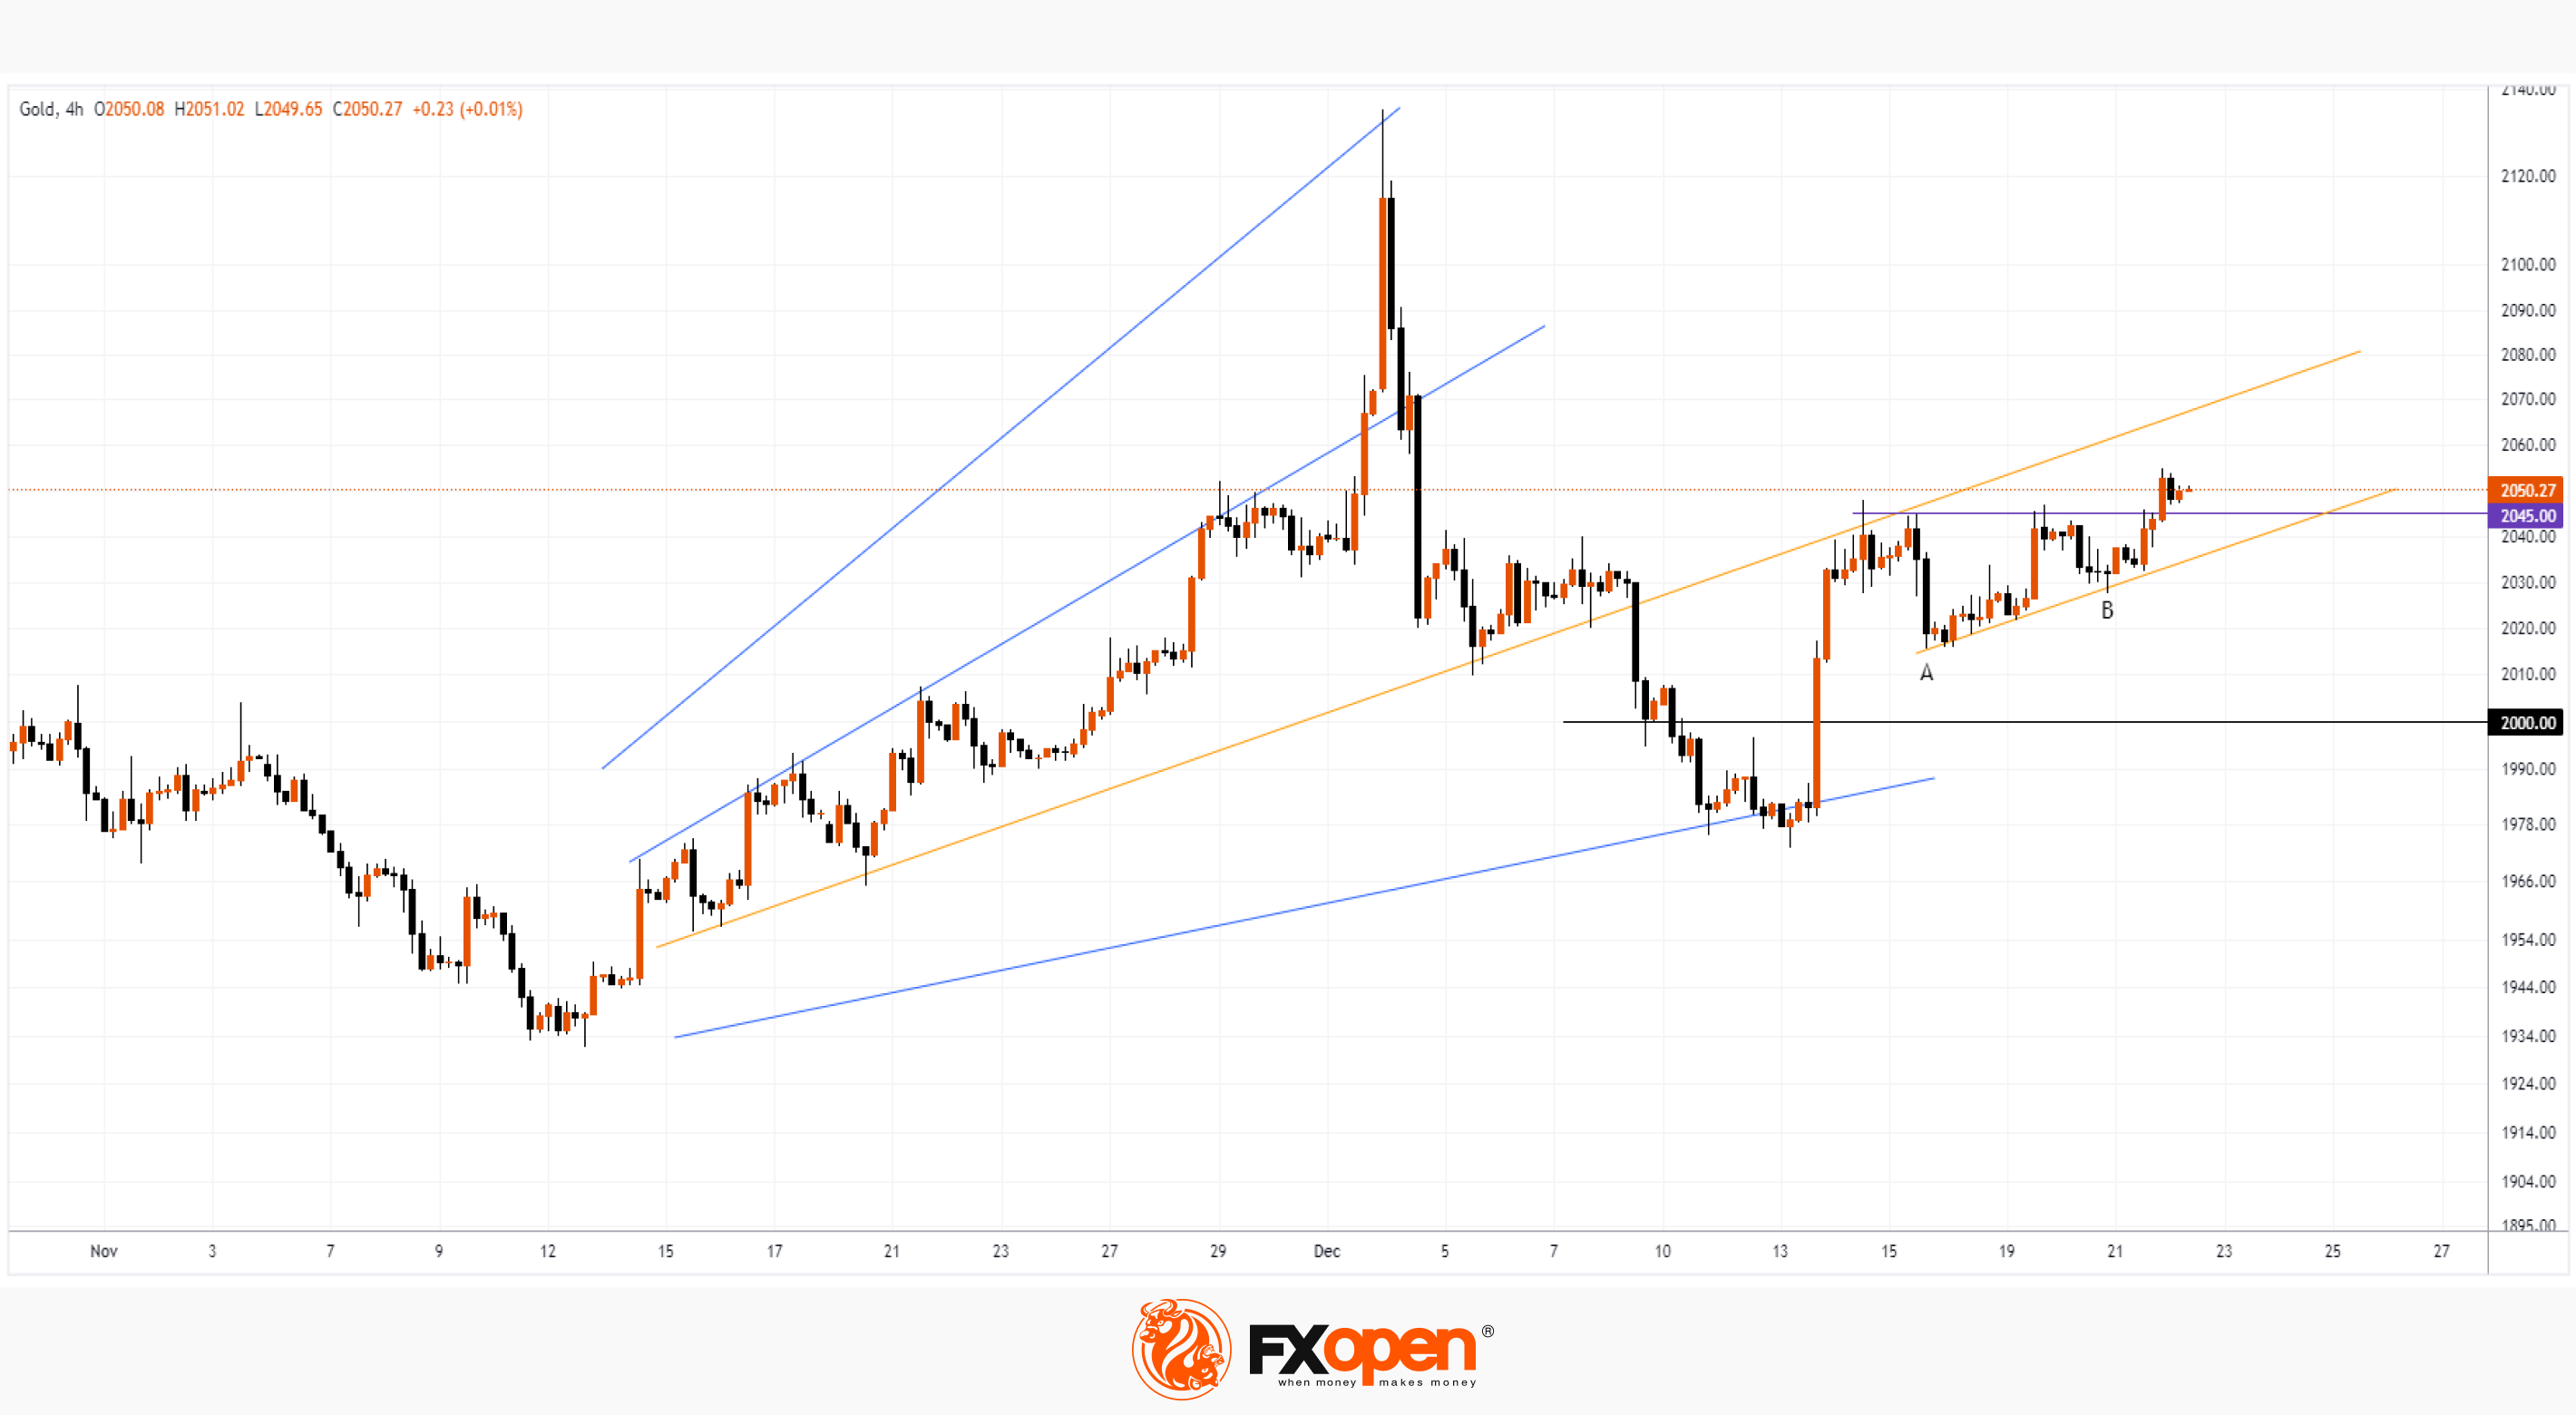
At the same time, the weakening dollar gave a bullish impetus to the price of gold, which exceeded the USD 2,050 level for the first time since December 4. By the way, returning to the analysis that we did on December 5, we note that the fan-shaped structure of trend lines remains relevant.
As predicted at the beginning of the month, the price broke below the USD 2,000 level and tested the lower line of the structure, followed by a price return above the psychological level.
As the graph shows:
→ before breaking through the resistance at USD 2,045, the price formed a bullish cup- and-handle pattern. Rising A-B lows may indicate increased buying pressure;
→ the price may continue to develop within the channel shown by the yellow lines.
Further developments will most likely be influenced by the publication of Core PCE Price Index data (today at 16:30 GMT+3). It is possible that the bulls will try to reach the upper yellow line.
To benefit from fluctuations in gold prices, consider enlisting the services of a trusted broker like FXOpen.
CFDs are complex instruments and come with a high risk of losing your money.
This article represents the opinion of the Companies operating under the FXOpen brand only. It is not to be construed as an offer, solicitation, or recommendation with respect to products and services provided by the Companies operating under the FXOpen brand, nor is it to be considered financial advice.
Price of Gold on the Rise amid US GDP Slowdown
Yesterday's data for last quarter showed that US GDP growth was estimated at 4.9% year-on-year, although GDP growth was expected to remain unchanged at 5.2%.
This disappointing performance could put pressure on the Fed to cut rates. After data is published:
→ the market has increased the likelihood of a rate cut by March to 83% from 79%, as evidenced by FedWatch;
→ the dollar index fell.
At the same time, the weakening dollar gave a bullish impetus to the price of gold, which exceeded the USD 2,050 level for the first time since December 4. By the way, returning to the analysis that we did on December 5, we note that the fan-shaped structure of trend lines remains relevant.
As predicted at the beginning of the month, the price broke below the USD 2,000 level and tested the lower line of the structure, followed by a price return above the psychological level.
As the graph shows:
→ before breaking through the resistance at USD 2,045, the price formed a bullish cup- and-handle pattern. Rising A-B lows may indicate increased buying pressure;
→ the price may continue to develop within the channel shown by the yellow lines.
Further developments will most likely be influenced by the publication of Core PCE Price Index data (today at 16:30 GMT+3). It is possible that the bulls will try to reach the upper yellow line.
To benefit from fluctuations in gold prices, consider enlisting the services of a trusted broker like FXOpen.
CFDs are complex instruments and come with a high risk of losing your money.
This article represents the opinion of the Companies operating under the FXOpen brand only. It is not to be construed as an offer, solicitation, or recommendation with respect to products and services provided by the Companies operating under the FXOpen brand, nor is it to be considered financial advice.
#MarketNews #oilprices #inflation #stockmarket #techstocks
Yearly Market Wrap With Gary Thomson: INDICES, OIL, TECH STOCKS, CURRENCIES, BANKS INFLATION
Get the latest scoop on the year's hottest happenings, all in one convenient video. Join Gary Thomson, the COO of FXOpen UK, as he breaks down the most significant news reports and shares his expert insights.📊
🔸Inflation
🔸 Indices market - S&P 500, Nasdaq
🔸Commodities - Oil market
🔸Equities - Tech stocks
🔸Currencies - AUD/USD, GBP/USD, EUR/USD
🔸Bank demises
🔸Monetary policy - Interest rates
Stay in the know and empower yourself with our short, yet power-packed video. Watch it now and stay updated with FXOpen. Don't miss out on this invaluable opportunity to sharpen your trading skills and make informed decisions.📈
https://cutt.ly/3wDXxw5Y
To take advantage of price fluctuations in the foreign exchange markets, consider enlisting the services of a reliable broker like FXOpen.
⚠️
This forecast represents FXOpen Companies opinion only, it should not be construed as an offer, invitation or recommendation in respect to FXOpen Companies products and services or as financial advice
Yearly Market Wrap With Gary Thomson: INDICES, OIL, TECH STOCKS, CURRENCIES, BANKS INFLATION
Get the latest scoop on the year's hottest happenings, all in one convenient video. Join Gary Thomson, the COO of FXOpen UK, as he breaks down the most significant news reports and shares his expert insights.📊
🔸Inflation
🔸 Indices market - S&P 500, Nasdaq
🔸Commodities - Oil market
🔸Equities - Tech stocks
🔸Currencies - AUD/USD, GBP/USD, EUR/USD
🔸Bank demises
🔸Monetary policy - Interest rates
Stay in the know and empower yourself with our short, yet power-packed video. Watch it now and stay updated with FXOpen. Don't miss out on this invaluable opportunity to sharpen your trading skills and make informed decisions.📈
https://cutt.ly/3wDXxw5Y
To take advantage of price fluctuations in the foreign exchange markets, consider enlisting the services of a reliable broker like FXOpen.
⚠️
This forecast represents FXOpen Companies opinion only, it should not be construed as an offer, invitation or recommendation in respect to FXOpen Companies products and services or as financial advice
YouTube
Yearly Market Wrap With Gary Thomson: INDICES, OIL, TECH STOCKS, CURRENCIES, BANKS INFLATION
Trading on leveraged products involves a high level of risk
Get the latest scoop on the year's hottest happenings, all in one convenient video. Join Gary Thomson, the COO of FXOpen UK, as he breaks down the most significant news reports and shares his expert…
Get the latest scoop on the year's hottest happenings, all in one convenient video. Join Gary Thomson, the COO of FXOpen UK, as he breaks down the most significant news reports and shares his expert…
#MarketNews #oilprices #oilindustry
Brent Oil Price Reaches New December High
Financial markets are experiencing a traditional decline in trading activity associated with the holiday period. Notable events:
→ the S&P-500 and NASDAQ-100 stock indices updated their maximum for the year after the holiday Monday, thereby confirming the idea that the decline on Wednesday, September 20, was in the nature of a correction. Santa and his rally do not disappoint.
→ The dollar index drops to six-month lows due to expectations of an interest rate cut in March 2024.
→ The price of oil reached a new high in December.
The rise in oil prices is caused by geopolitical tensions:
→ WSJ: Iran-backed militias fire at US bases in the Middle East.
→ Bloomberg: Continued Houthi attacks on shipping and US strikes on targets in Iraq raise the risk of the war expanding in the Middle East.
→ Reuters: The war in Gaza will last several months. Concerns about the spread of the conflict are growing.
→ Barron's: Dispute between Venezuela and Guyana could threaten oil production and higher prices.
If military action disrupts the production and supply of oil, this could sharply increase its price.
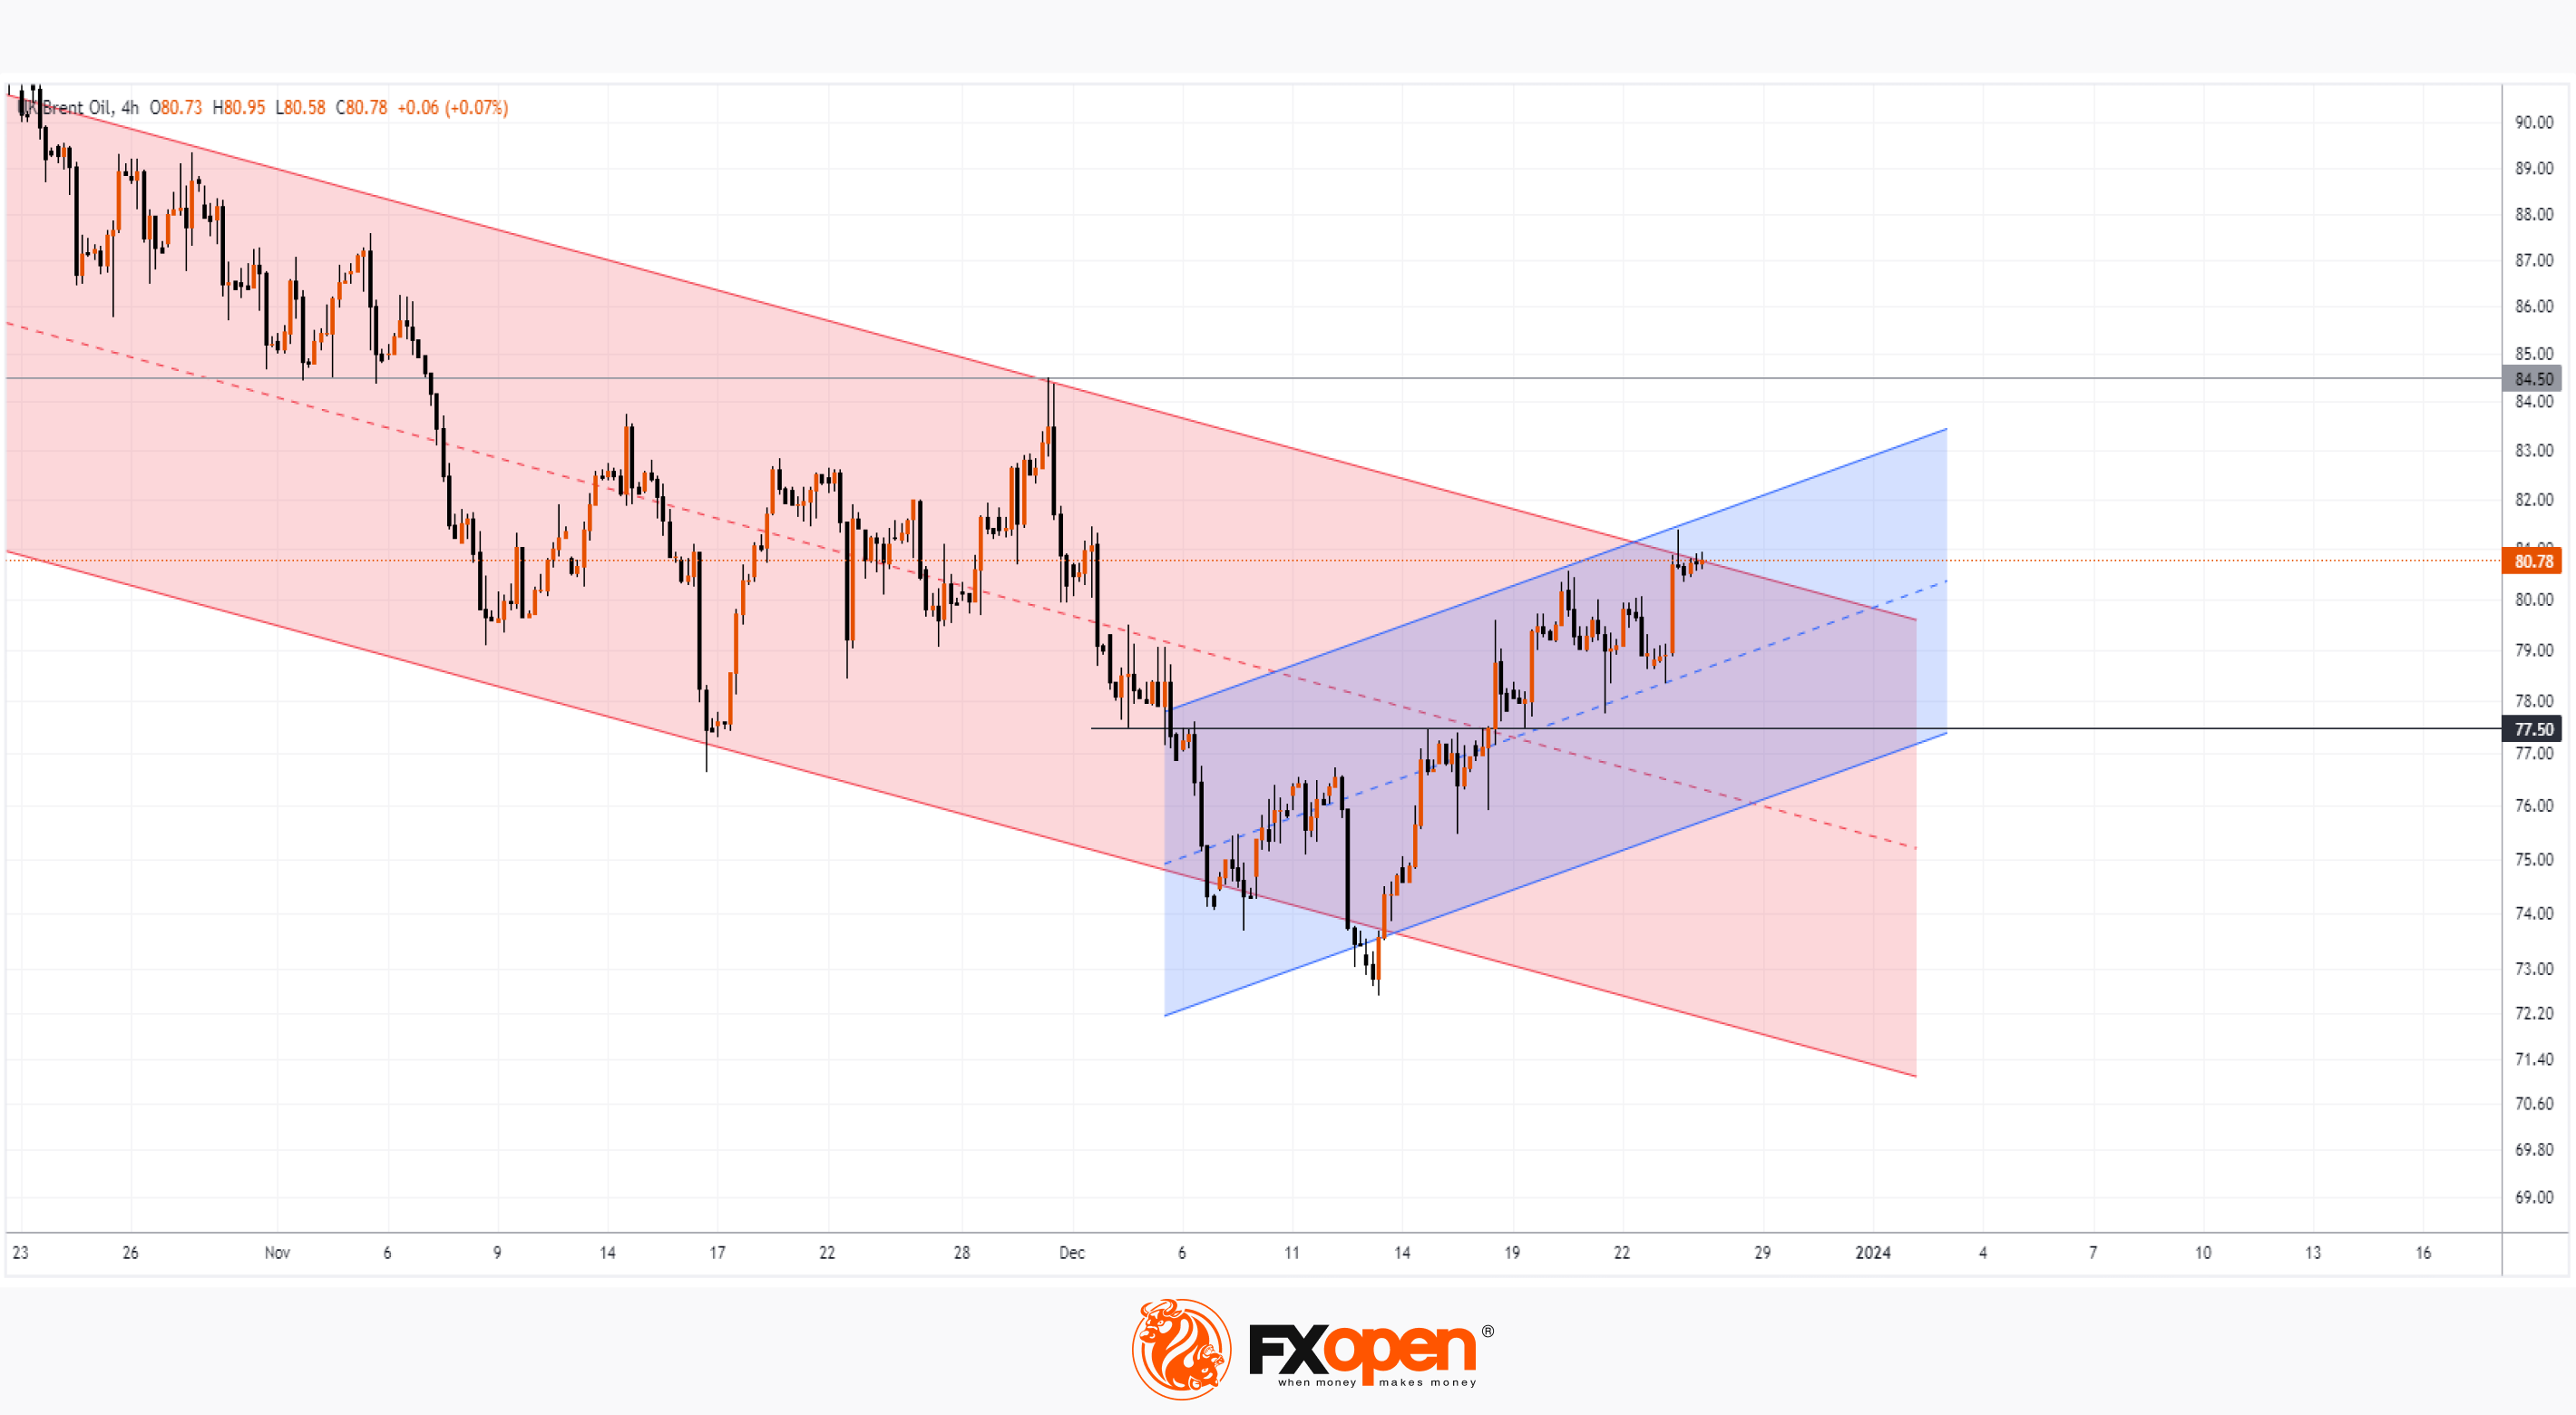
The XBR/USD chart shows that:
→ the price is still in a downtrend (as shown by the red channel);
→ moving within the ascending channel (shown in blue) in December, the price has reached the upper limit of the red channel, and is now in a vulnerable position.
On the one hand, bears may try to resume the downward trend. On the other hand, if demand forces truly dominate the market, then only a minor pullback from the upper boundary of the red channel can be expected. Note the 77.50 level, which acted as resistance but changed its role after the breakout. Around this level there is a value of 50% of the price increase from the December low. So as long as the price is above 77.50, it is acceptable to assume that the chances of an attempt at a bullish breakout of the red channel will remain high.
To benefit from the rise and fall of oil prices, consider enlisting the services of a trusted broker like FXOpen.
CFDs are complex instruments and come with a high risk of losing your money.
This article represents the opinion of the Companies operating under the FXOpen brand only. It is not to be construed as an offer, solicitation, or recommendation with respect to products and services provided by the Companies operating under the FXOpen brand, nor is it to be considered financial advice.
Brent Oil Price Reaches New December High
Financial markets are experiencing a traditional decline in trading activity associated with the holiday period. Notable events:
→ the S&P-500 and NASDAQ-100 stock indices updated their maximum for the year after the holiday Monday, thereby confirming the idea that the decline on Wednesday, September 20, was in the nature of a correction. Santa and his rally do not disappoint.
→ The dollar index drops to six-month lows due to expectations of an interest rate cut in March 2024.
→ The price of oil reached a new high in December.
The rise in oil prices is caused by geopolitical tensions:
→ WSJ: Iran-backed militias fire at US bases in the Middle East.
→ Bloomberg: Continued Houthi attacks on shipping and US strikes on targets in Iraq raise the risk of the war expanding in the Middle East.
→ Reuters: The war in Gaza will last several months. Concerns about the spread of the conflict are growing.
→ Barron's: Dispute between Venezuela and Guyana could threaten oil production and higher prices.
If military action disrupts the production and supply of oil, this could sharply increase its price.
The XBR/USD chart shows that:
→ the price is still in a downtrend (as shown by the red channel);
→ moving within the ascending channel (shown in blue) in December, the price has reached the upper limit of the red channel, and is now in a vulnerable position.
On the one hand, bears may try to resume the downward trend. On the other hand, if demand forces truly dominate the market, then only a minor pullback from the upper boundary of the red channel can be expected. Note the 77.50 level, which acted as resistance but changed its role after the breakout. Around this level there is a value of 50% of the price increase from the December low. So as long as the price is above 77.50, it is acceptable to assume that the chances of an attempt at a bullish breakout of the red channel will remain high.
To benefit from the rise and fall of oil prices, consider enlisting the services of a trusted broker like FXOpen.
CFDs are complex instruments and come with a high risk of losing your money.
This article represents the opinion of the Companies operating under the FXOpen brand only. It is not to be construed as an offer, solicitation, or recommendation with respect to products and services provided by the Companies operating under the FXOpen brand, nor is it to be considered financial advice.
#crypto #forextrading #ETH
ETH/USD Analysis: New Record of the Year
Today, the price of Ethereum exceeded the level of 2,440 per token, thereby setting a new high for 2023. It is noteworthy that the price of Bitcoin did not support the bullish sentiment, continuing to fluctuate around the USD 43,000 level for the fifth day.
What is the reason for the growth of ETH/USD from a fundamental point of view? There is no obvious trigger in the media, so we can only make assumptions:
→ market participants considered ETH an undervalued asset against the backdrop of the growth of Bitcoin and Solana;
→ perhaps buyers assume that after the expected approval of applications for the BTC ETF, the ETH ETF story will be next?
→ Santa's rally and the positive sentiment associated with it.
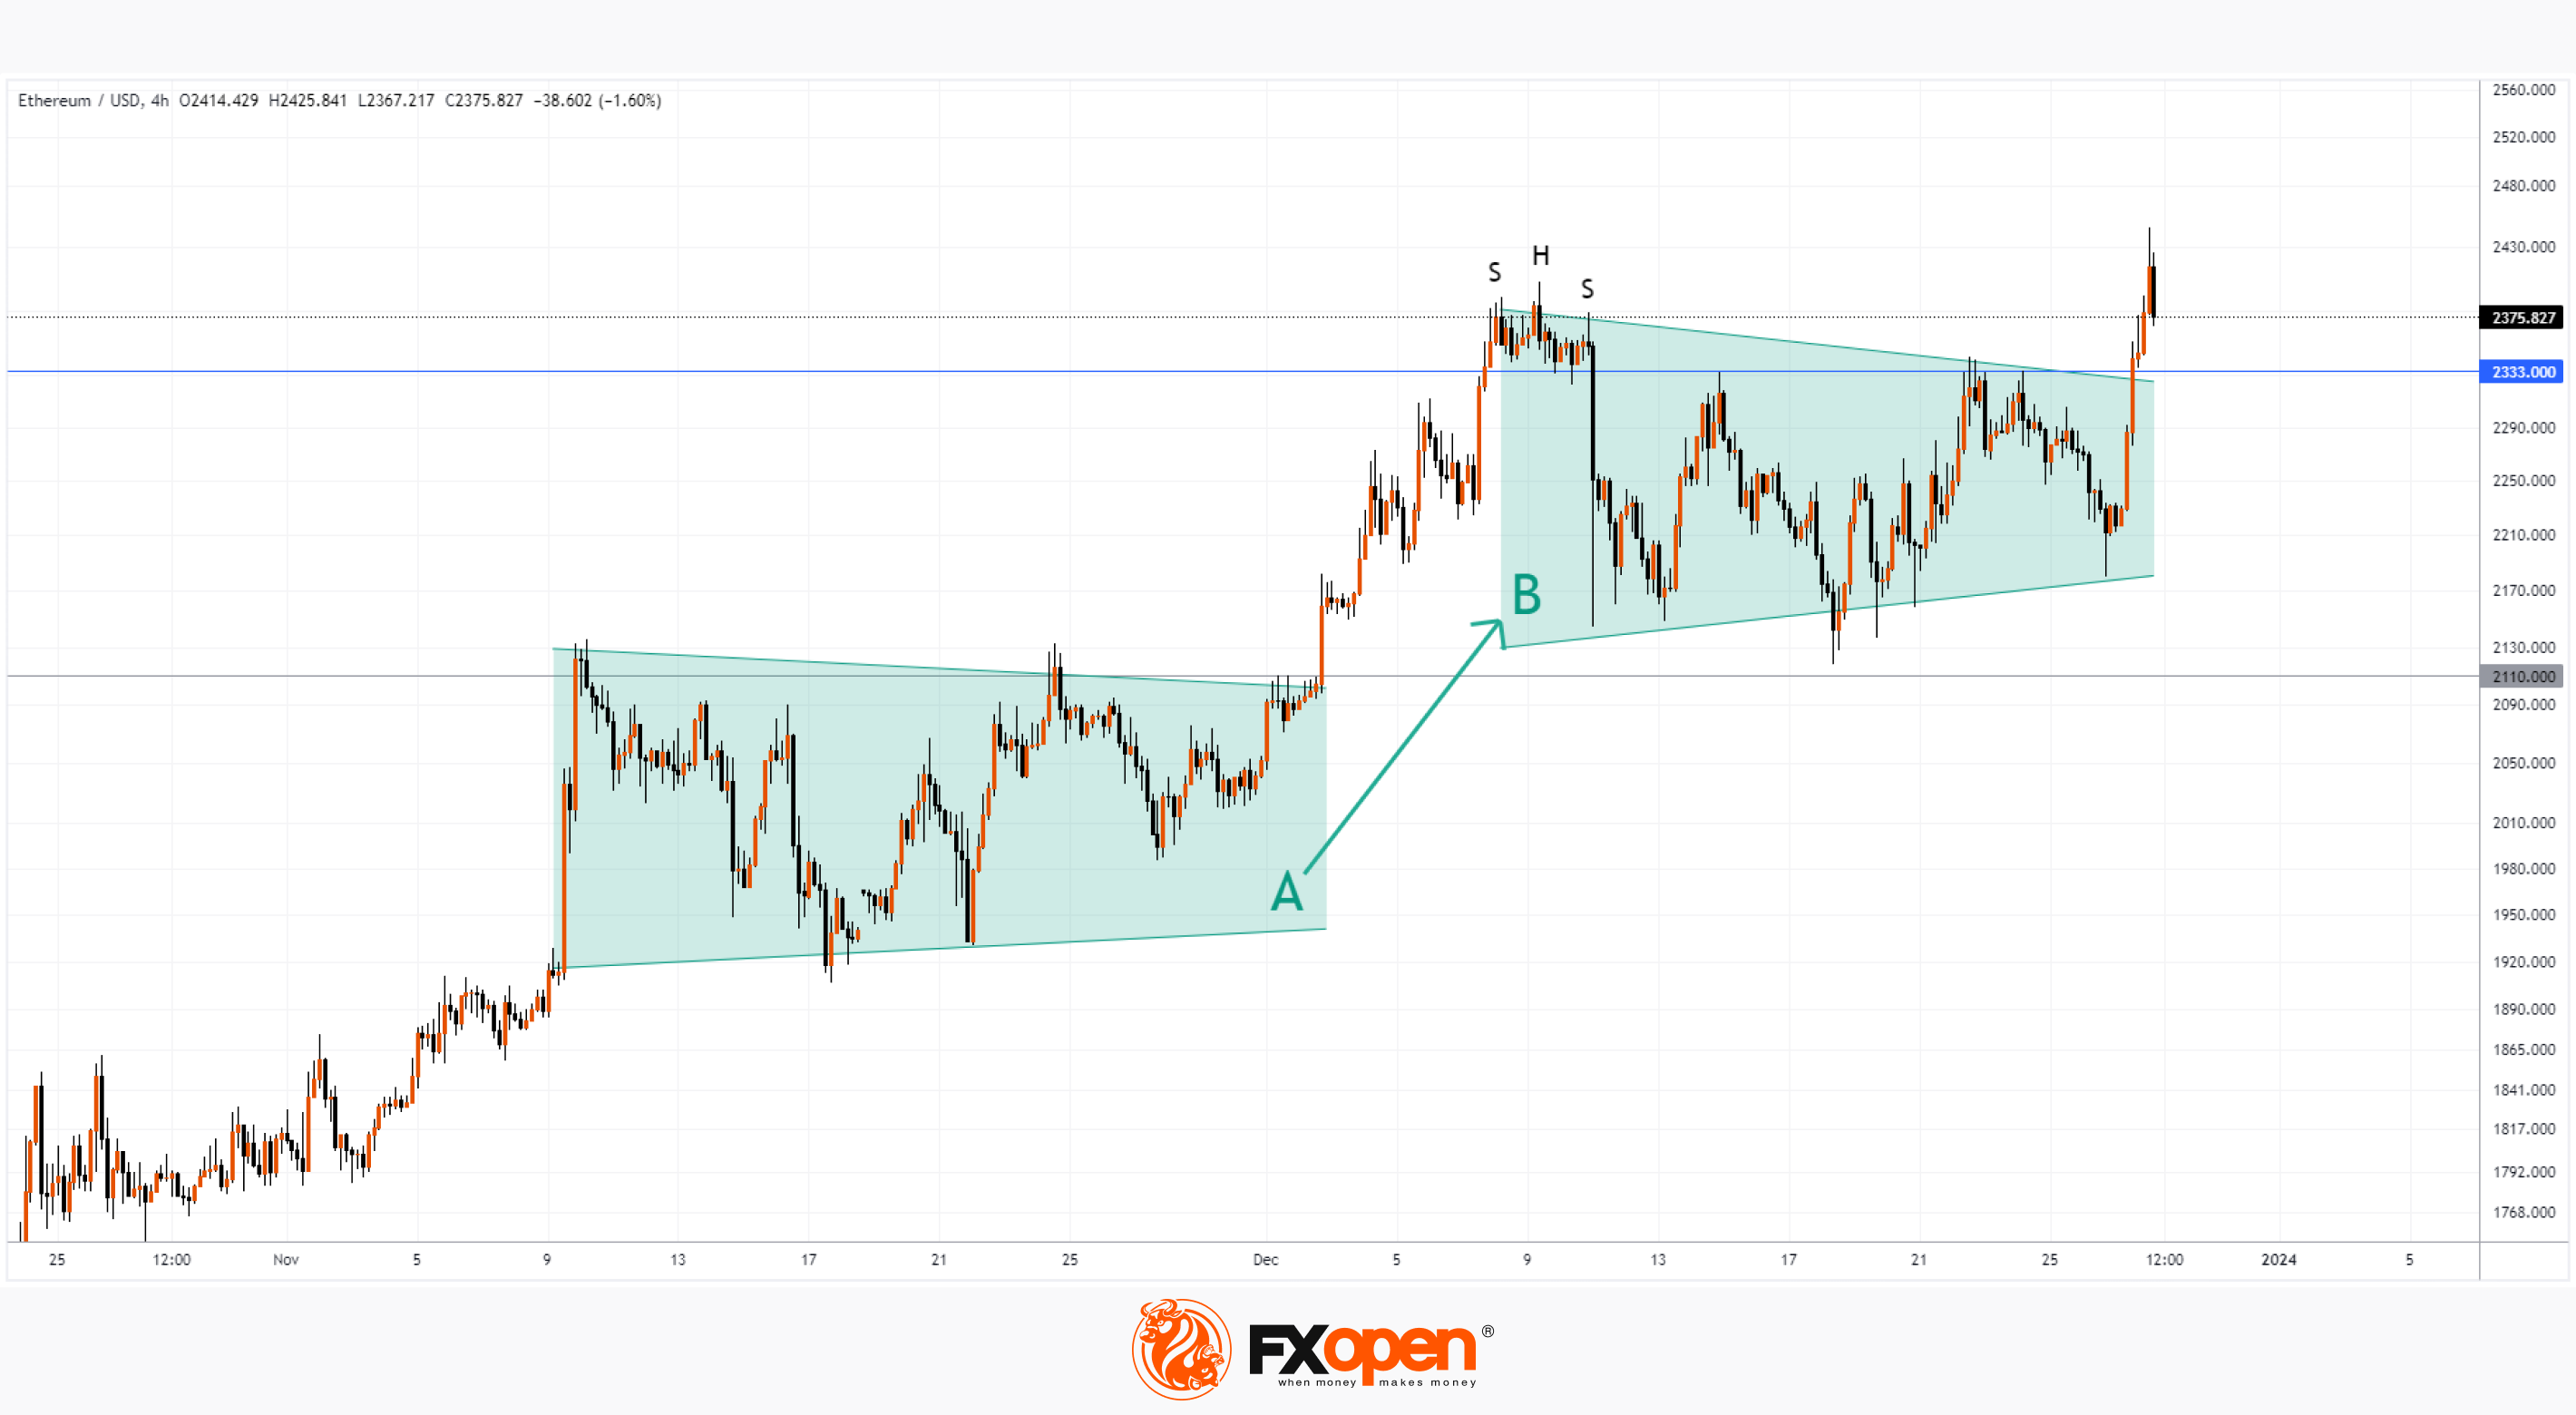
From a technical point of view, the price of ETH/USD moved up beyond the balance period “B”, where the forces of supply and demand were balanced. The bullish momentum was maintained, with upward momentum above the 2,333 level attracting followers and forcing short sellers to take losses. According to on-chain analytical platforms, in just one hour, at the peak of growth, USD 14 million of bearish positions were liquidated on cryptocurrency exchanges—there was a short squeeze in the market to some extent.
What's next? Will the price be able to form a new balance period “C”, which will be above the period “B” (similar to the trend “A” → “B”)?
This morning, on the 4-hour chart, a bearish engulfing pattern is forming, which may result in a false breakout of the previous top on December 9, when the SHS pattern was formed — this is not a very optimistic development of events.
However, as long as the price remains above the level of 2,333, there is reason to believe that the market is on the way to forming a balance “C”, which is above the balance “B” - similar to what happened with the level of 2,110. A bearish breakdown of the level of 2,333 and a return to the zone balance “B” will mean an alarming signal: buyers have lost strength, and therefore the next breakdown of balance “B” may occur in a downward direction.
To benefit from the rise and fall of cryptocurrency prices, consider enlisting the services of a trusted broker like FXOpen.
CFDs are complex instruments and come with a high risk of losing your money.
At FXOpen UK and FXOpen AU, Cryptocurrency CFDs are only available for trading by those clients categorised as Professional clients under FCA Rules and Professional clients under ASIC Rules, respectively. They are not available for trading by Retail clients.
This article represents the opinion of the Companies operating under the FXOpen brand only. It is not to be construed as an offer, solicitation, or recommendation with respect to products and services provided by the Companies operating under the FXOpen brand, nor is it to be considered financial advice.
ETH/USD Analysis: New Record of the Year
Today, the price of Ethereum exceeded the level of 2,440 per token, thereby setting a new high for 2023. It is noteworthy that the price of Bitcoin did not support the bullish sentiment, continuing to fluctuate around the USD 43,000 level for the fifth day.
What is the reason for the growth of ETH/USD from a fundamental point of view? There is no obvious trigger in the media, so we can only make assumptions:
→ market participants considered ETH an undervalued asset against the backdrop of the growth of Bitcoin and Solana;
→ perhaps buyers assume that after the expected approval of applications for the BTC ETF, the ETH ETF story will be next?
→ Santa's rally and the positive sentiment associated with it.
From a technical point of view, the price of ETH/USD moved up beyond the balance period “B”, where the forces of supply and demand were balanced. The bullish momentum was maintained, with upward momentum above the 2,333 level attracting followers and forcing short sellers to take losses. According to on-chain analytical platforms, in just one hour, at the peak of growth, USD 14 million of bearish positions were liquidated on cryptocurrency exchanges—there was a short squeeze in the market to some extent.
What's next? Will the price be able to form a new balance period “C”, which will be above the period “B” (similar to the trend “A” → “B”)?
This morning, on the 4-hour chart, a bearish engulfing pattern is forming, which may result in a false breakout of the previous top on December 9, when the SHS pattern was formed — this is not a very optimistic development of events.
However, as long as the price remains above the level of 2,333, there is reason to believe that the market is on the way to forming a balance “C”, which is above the balance “B” - similar to what happened with the level of 2,110. A bearish breakdown of the level of 2,333 and a return to the zone balance “B” will mean an alarming signal: buyers have lost strength, and therefore the next breakdown of balance “B” may occur in a downward direction.
To benefit from the rise and fall of cryptocurrency prices, consider enlisting the services of a trusted broker like FXOpen.
CFDs are complex instruments and come with a high risk of losing your money.
At FXOpen UK and FXOpen AU, Cryptocurrency CFDs are only available for trading by those clients categorised as Professional clients under FCA Rules and Professional clients under ASIC Rules, respectively. They are not available for trading by Retail clients.
This article represents the opinion of the Companies operating under the FXOpen brand only. It is not to be construed as an offer, solicitation, or recommendation with respect to products and services provided by the Companies operating under the FXOpen brand, nor is it to be considered financial advice.
#stockmarket #stocktrading #stocks
European Stock Index Shows Signs of Weakness
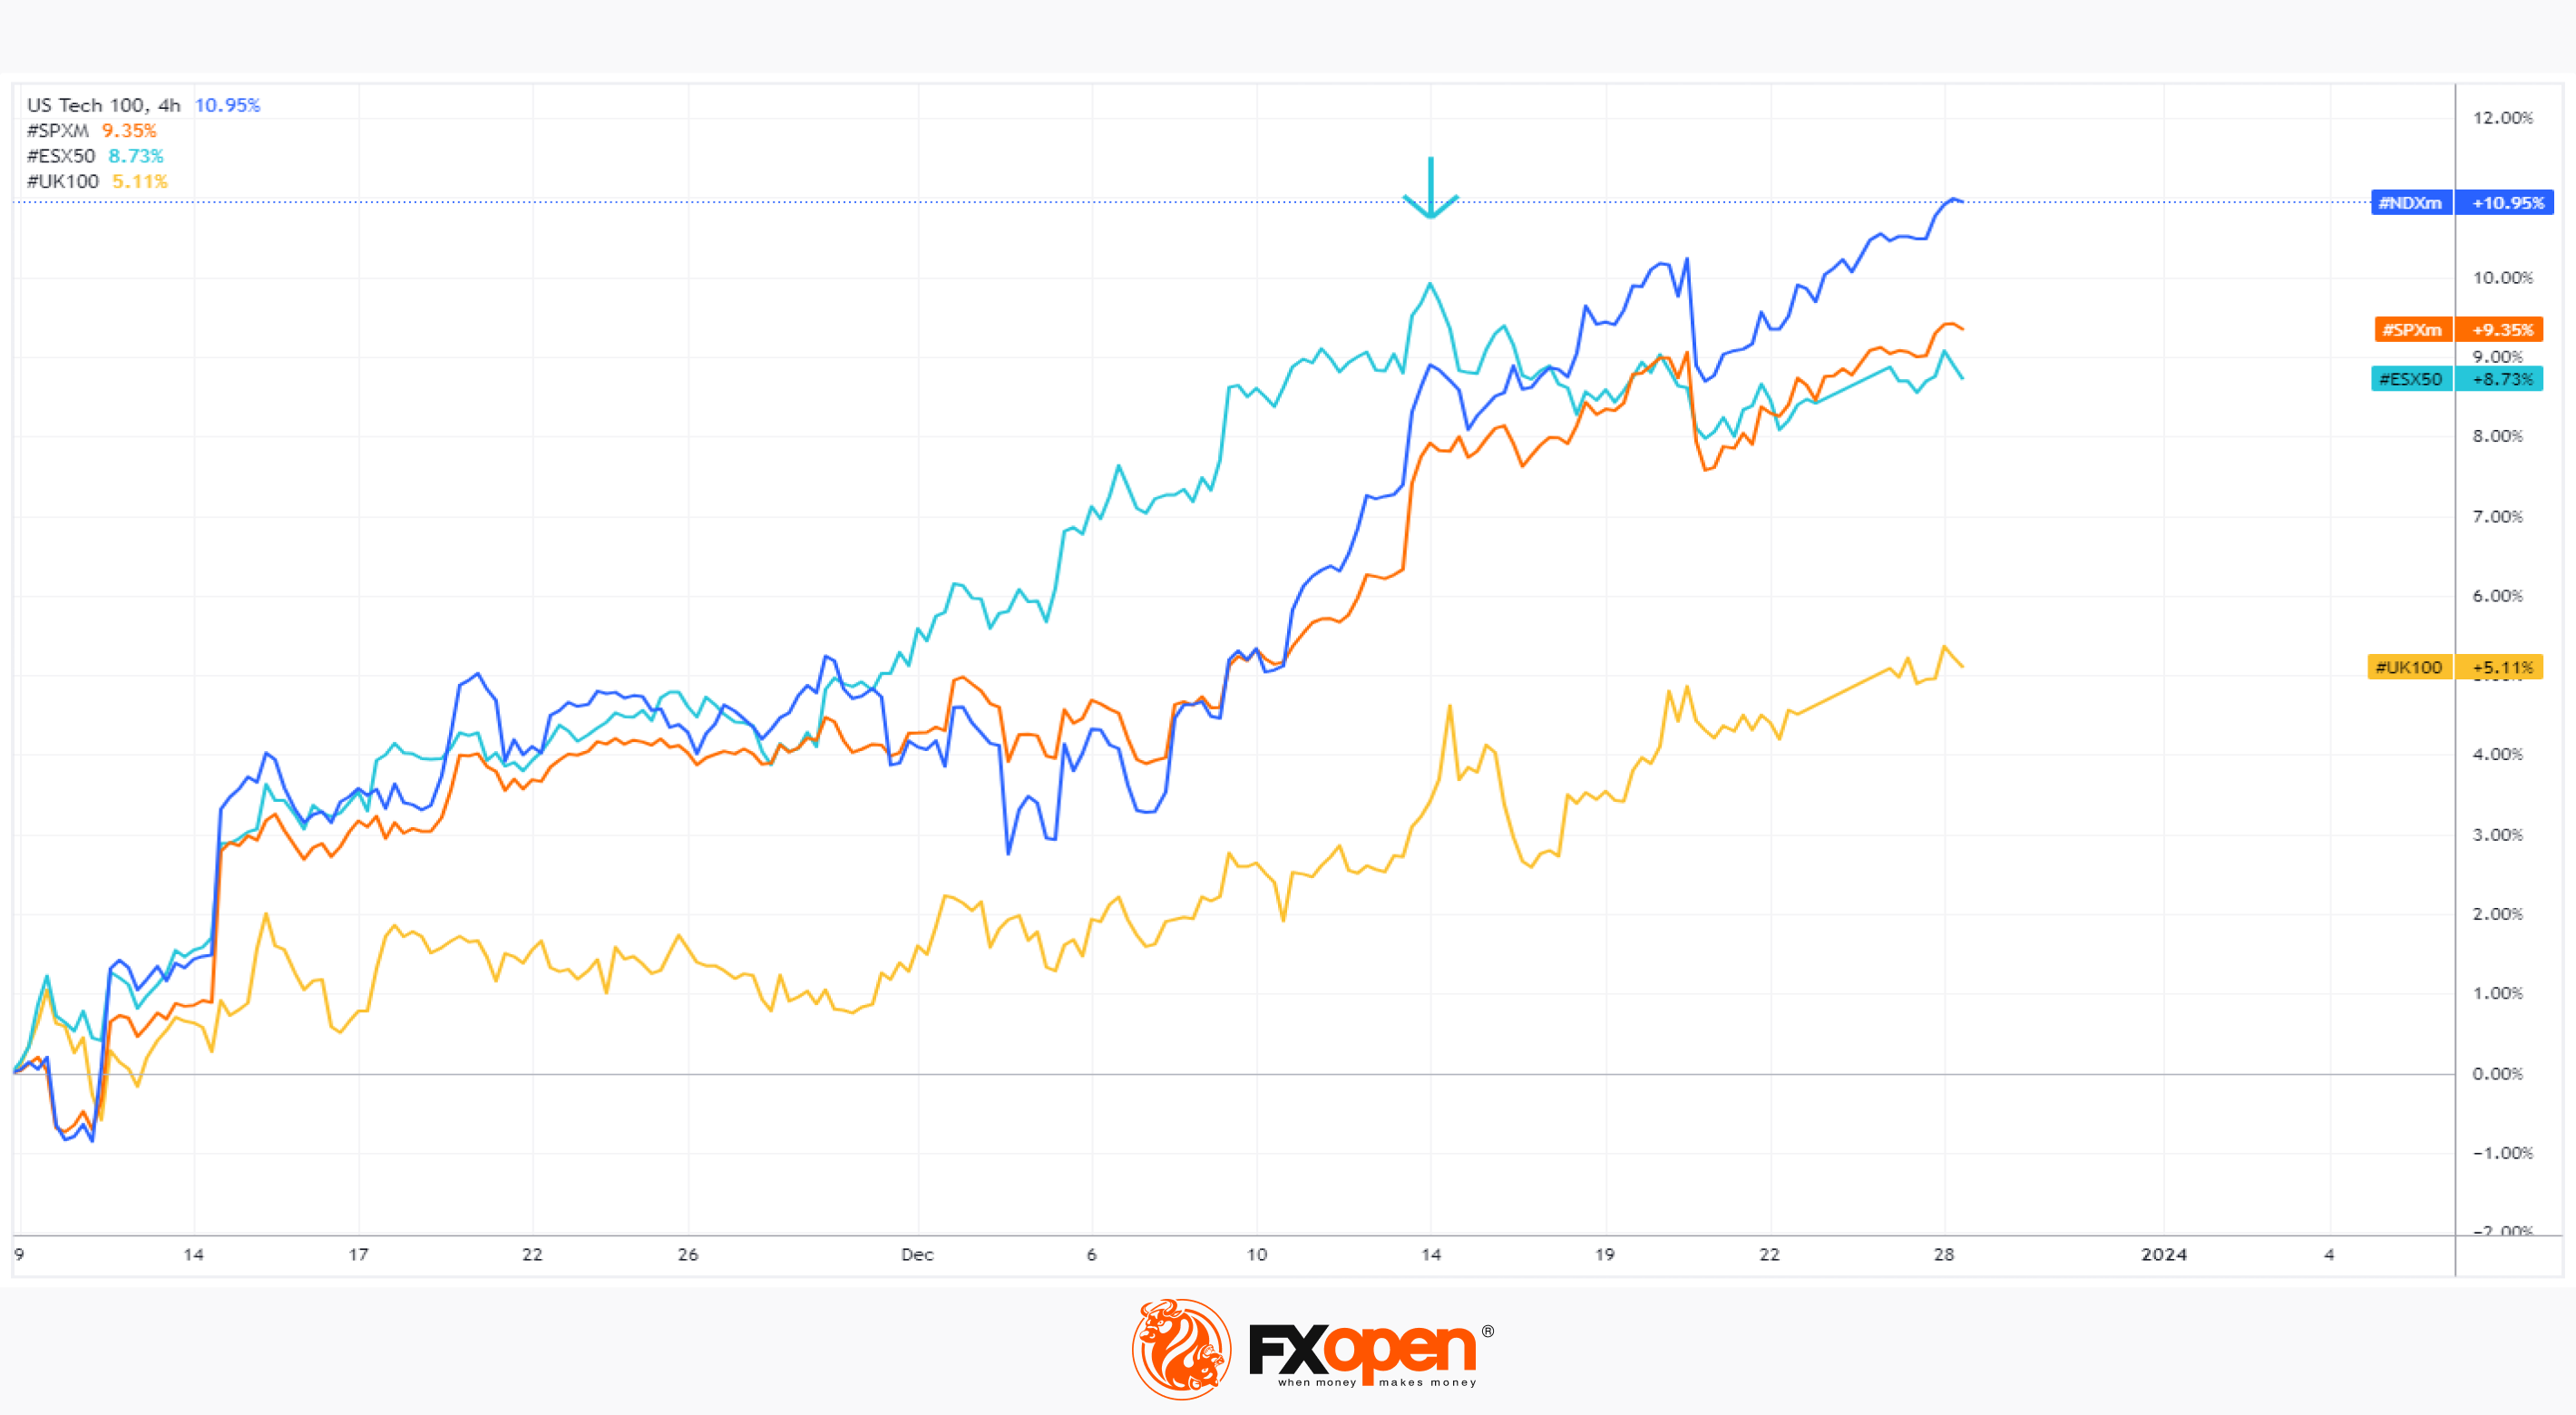
As the comparison chart shows, the ESX50 lags behind the US500. And this trend has been observed since mid-December, a period when central banks around the world published interest rate decisions and set expectations for the future. The divergence suggests that Europe's central bankers are in no rush to join the US turn to lower interest rates — even as investors continue to insist that they will have to accept easier monetary policy soon enough.
According to Bloomberg, after Federal Reserve Chairman Jerome Powell signalled that the focus is now on lowering borrowing costs, colleagues from Frankfurt to London said that a further slowdown in inflation cannot be taken for granted. That is, for now in Europe, policy easing is not yet on the agenda.
“We should absolutely not lower our guard,” European Central Bank President Christine Lagarde told reporters in December, while her Bank of England counterpart Andrew Bailey noted there was “still work to be done” in the fight to rein in consumer prices.
The chart shows that overall Western stock markets were positive in December, but a comparative analysis allows us to make interesting observations:
the ESX50 index was the top gainer in December;
but after a series of central bank meetings in the middle of the month (shown by the arrow), the lead was lost. While the S&P 500 is in close proximity to an all-time high, European stocks have lost bullish momentum.
It is possible that the mid-December highs will prove to be important resistance. And if a correction occurs in the stock market (which will be a reason to write about the end of the Santa rally), then the ESX50 will again be a leader, but in a downward trend.
To benefit from the rise and fall of stock markets around the world, consider enlisting the services of a trusted broker like FXOpen.
CFDs are complex instruments and come with a high risk of losing your money.
This article represents the opinion of the Companies operating under the FXOpen brand only. It is not to be construed as an offer, solicitation, or recommendation with respect to products and services provided by the Companies operating under the FXOpen brand, nor is it to be considered financial advice.
European Stock Index Shows Signs of Weakness
As the comparison chart shows, the ESX50 lags behind the US500. And this trend has been observed since mid-December, a period when central banks around the world published interest rate decisions and set expectations for the future. The divergence suggests that Europe's central bankers are in no rush to join the US turn to lower interest rates — even as investors continue to insist that they will have to accept easier monetary policy soon enough.
According to Bloomberg, after Federal Reserve Chairman Jerome Powell signalled that the focus is now on lowering borrowing costs, colleagues from Frankfurt to London said that a further slowdown in inflation cannot be taken for granted. That is, for now in Europe, policy easing is not yet on the agenda.
“We should absolutely not lower our guard,” European Central Bank President Christine Lagarde told reporters in December, while her Bank of England counterpart Andrew Bailey noted there was “still work to be done” in the fight to rein in consumer prices.
The chart shows that overall Western stock markets were positive in December, but a comparative analysis allows us to make interesting observations:
the ESX50 index was the top gainer in December;
but after a series of central bank meetings in the middle of the month (shown by the arrow), the lead was lost. While the S&P 500 is in close proximity to an all-time high, European stocks have lost bullish momentum.
It is possible that the mid-December highs will prove to be important resistance. And if a correction occurs in the stock market (which will be a reason to write about the end of the Santa rally), then the ESX50 will again be a leader, but in a downward trend.
To benefit from the rise and fall of stock markets around the world, consider enlisting the services of a trusted broker like FXOpen.
CFDs are complex instruments and come with a high risk of losing your money.
This article represents the opinion of the Companies operating under the FXOpen brand only. It is not to be construed as an offer, solicitation, or recommendation with respect to products and services provided by the Companies operating under the FXOpen brand, nor is it to be considered financial advice.
#marketanalysis #MarketNews #tradingforex
USD/JPY Analysis: Outlook for 2024
The Japanese yen has been one of the worst performing currencies over the past couple of years. The situation could improve in 2024, writes WSJ.
The yen has lost about 20% against the dollar since the end of 2021, underperforming other major currencies. The reason is that Japan's central bank kept interest rates ultra-low while most of its peers raised them aggressively. This was possible because it did not grow so rapidly in Japan. Japan's core inflation rate, which does not include fresh produce, was 2.5% in November. Although this is already above its 2% inflation target, the Bank of Japan is reluctant to raise interest rates too quickly for fear of a hit to the economy.
But the situation may change in 2024. The central bank has already made several changes to its “yield curve control” policy in the bond market. And the yen has risen about 7% against the dollar since mid-November, partly because traders expect the Bank of Japan to continue reforms. On the other hand, the dollar may weaken, including due to the expected easing of Fed policy.
From a technical analysis point of view:
→ the price is within the ascending channel (shown in blue);
→ in 2022 and 2023, 2 peaks were formed near the psychological mark of 150 yen per dollar. Both times the price tried to break higher, but was unsuccessful - which confirms the importance of this level;
→ when the second top was formed, the price also tested the median line, which acted as resistance;
→ at the end of the year the price is at the lower limit - support may be expected from it.
Thus, there is a scenario in which there will be a technical rebound from the lower line of the channel - it describes an important trend lasting from 2021. If the rebound is weak (for example, no higher than 50% of the decline in A→B), then the threat of a bearish breakout of this line may increase. Please note that growth towards top A occurs at a slow pace, and as it falls towards point B, the candles expand - a potential bearish sign.
To benefit from the rise and fall of currency rates, consider enlisting the services of a trusted broker like FXOpen.
CFDs are complex instruments and come with a high risk of losing your money.
USD/JPY Analysis: Outlook for 2024
The Japanese yen has been one of the worst performing currencies over the past couple of years. The situation could improve in 2024, writes WSJ.
The yen has lost about 20% against the dollar since the end of 2021, underperforming other major currencies. The reason is that Japan's central bank kept interest rates ultra-low while most of its peers raised them aggressively. This was possible because it did not grow so rapidly in Japan. Japan's core inflation rate, which does not include fresh produce, was 2.5% in November. Although this is already above its 2% inflation target, the Bank of Japan is reluctant to raise interest rates too quickly for fear of a hit to the economy.
But the situation may change in 2024. The central bank has already made several changes to its “yield curve control” policy in the bond market. And the yen has risen about 7% against the dollar since mid-November, partly because traders expect the Bank of Japan to continue reforms. On the other hand, the dollar may weaken, including due to the expected easing of Fed policy.
From a technical analysis point of view:
→ the price is within the ascending channel (shown in blue);
→ in 2022 and 2023, 2 peaks were formed near the psychological mark of 150 yen per dollar. Both times the price tried to break higher, but was unsuccessful - which confirms the importance of this level;
→ when the second top was formed, the price also tested the median line, which acted as resistance;
→ at the end of the year the price is at the lower limit - support may be expected from it.
Thus, there is a scenario in which there will be a technical rebound from the lower line of the channel - it describes an important trend lasting from 2021. If the rebound is weak (for example, no higher than 50% of the decline in A→B), then the threat of a bearish breakout of this line may increase. Please note that growth towards top A occurs at a slow pace, and as it falls towards point B, the candles expand - a potential bearish sign.
To benefit from the rise and fall of currency rates, consider enlisting the services of a trusted broker like FXOpen.
CFDs are complex instruments and come with a high risk of losing your money.
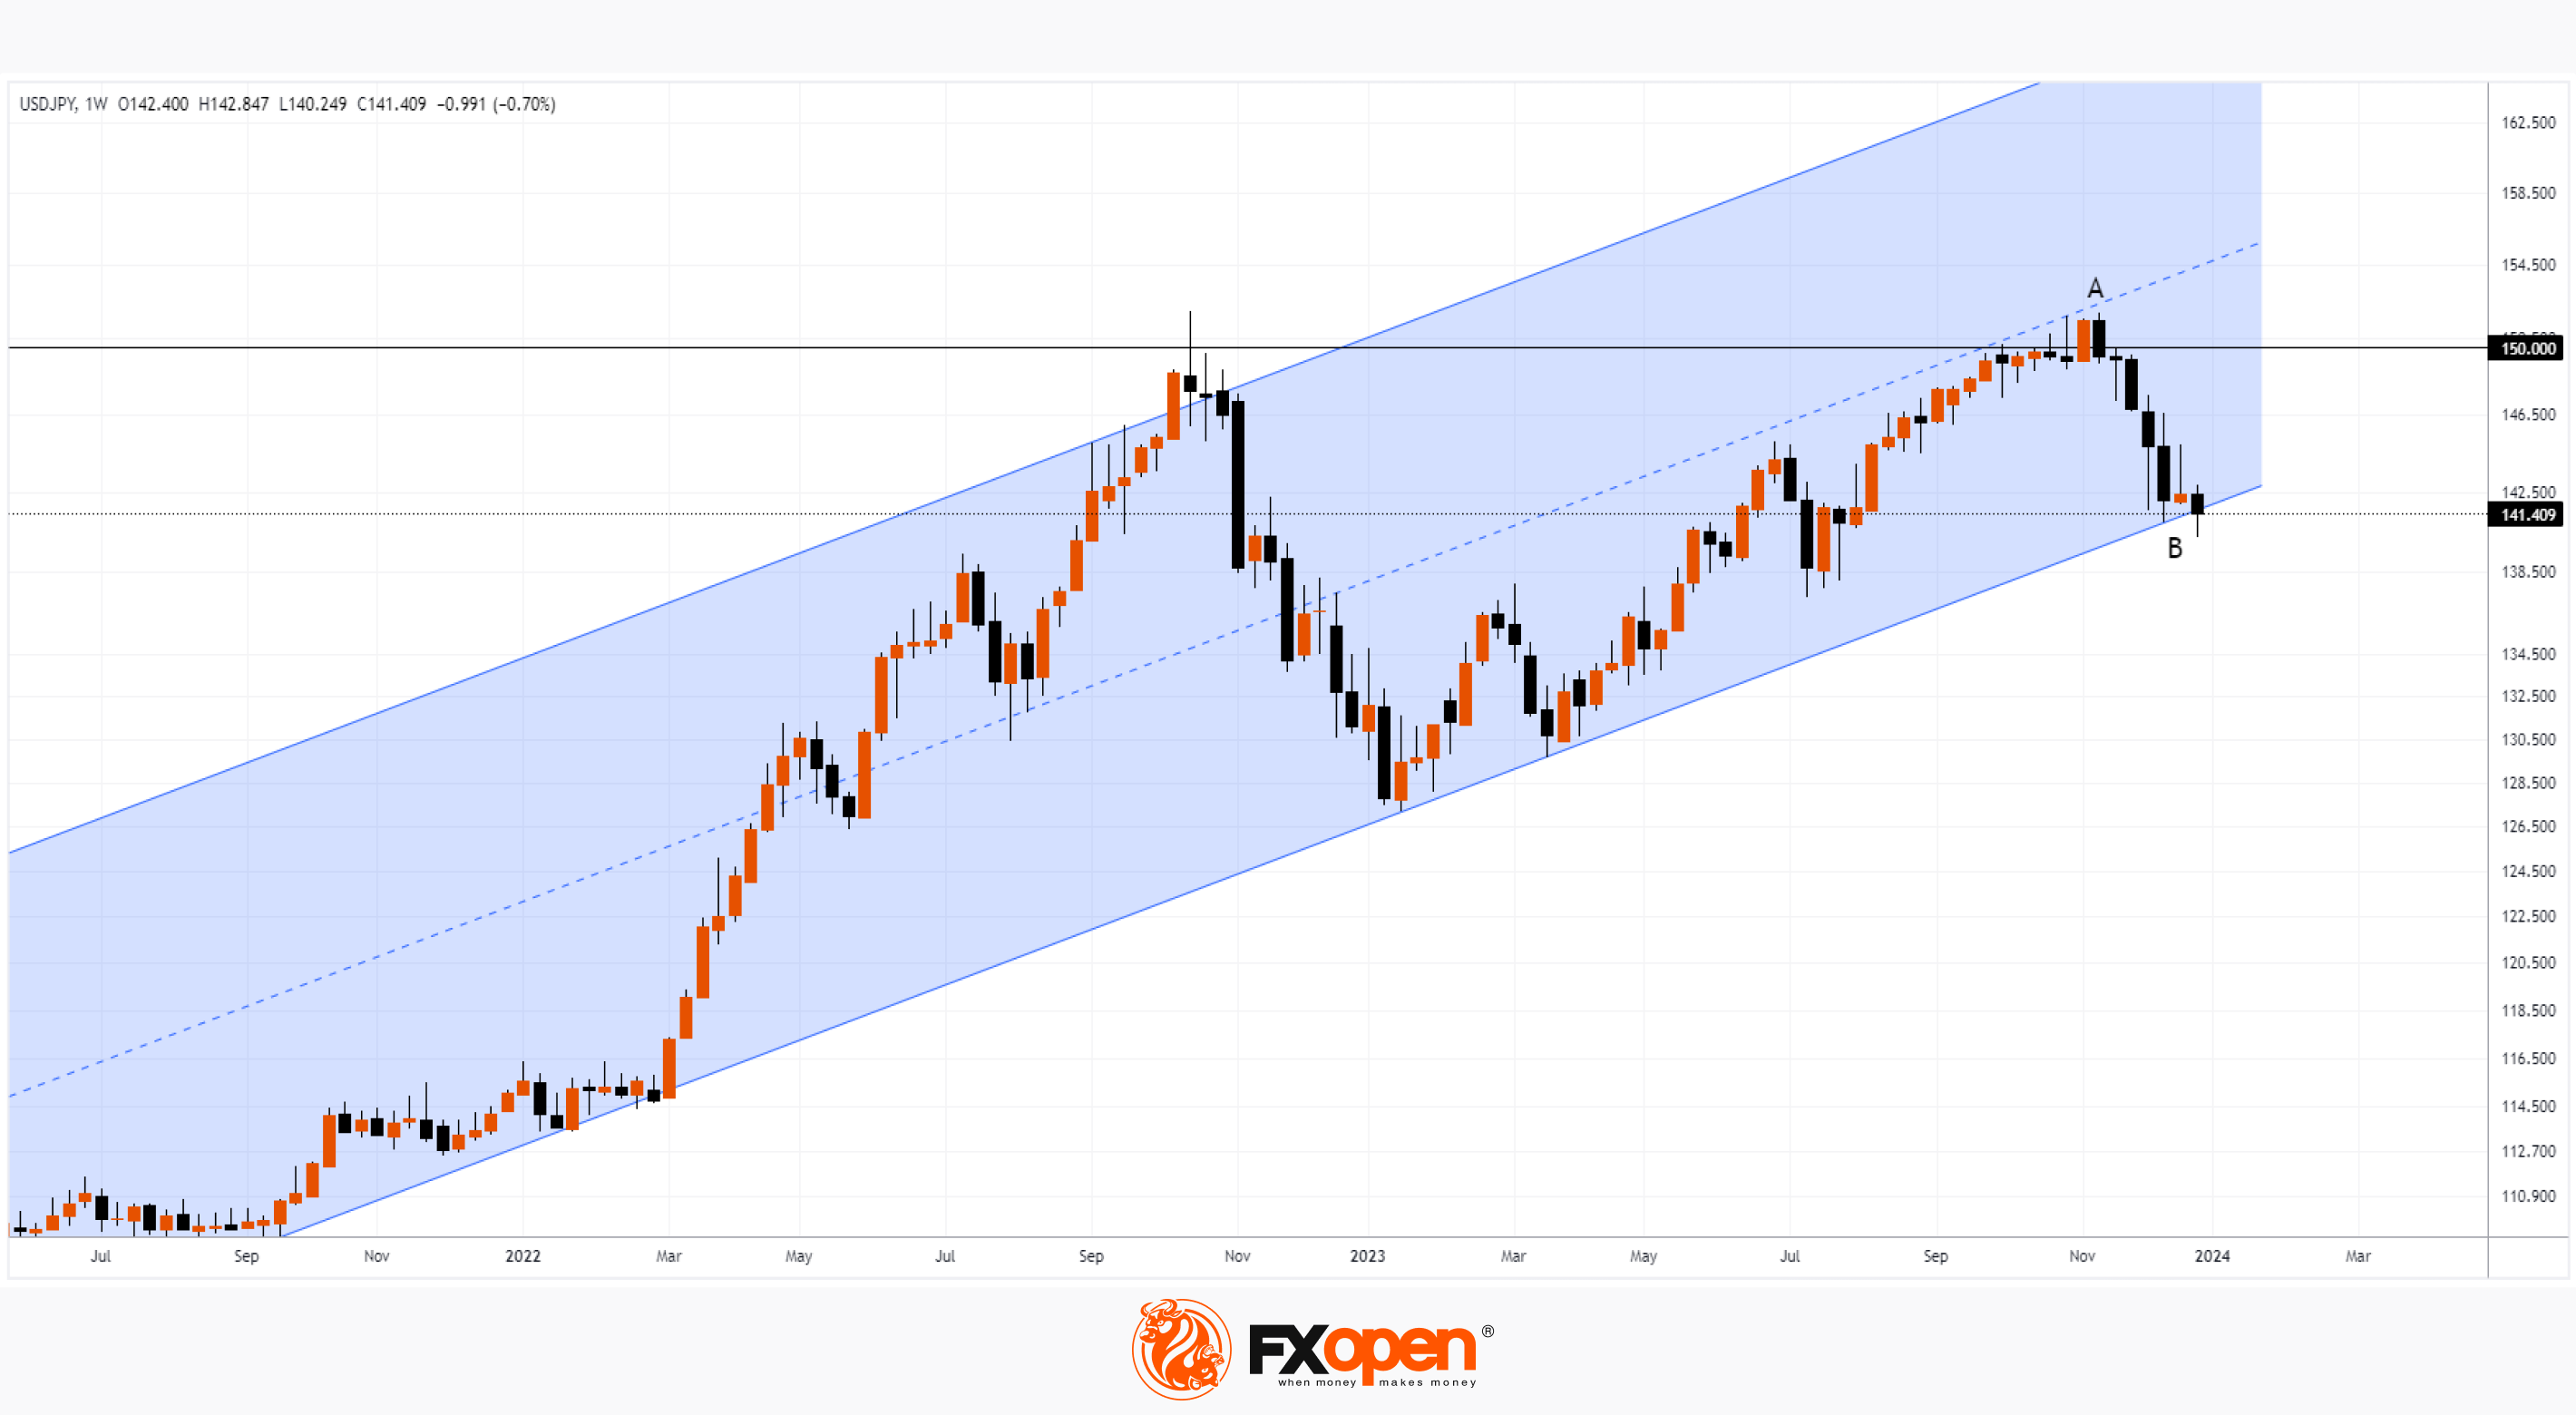
#marketanalysis #currencymarket #tradingtips
Market Analysis: AUD/USD and NZD/USD Regain Strength
🔸The Aussie Dollar started a fresh increase above the 0.6760 and 0.6800 levels against the US Dollar.
🔸There is a bullish flag forming with resistance near 0.6845 on the hourly chart of AUD/USD at FXOpen.
🔸NZD/USD is gaining bullish momentum above the 0.6320 support.
🔸There is a short-term contracting triangle forming with support near 0.6320 on the hourly chart of NZD/USD at FXOpen.
🔗Read the full analysis: https://cutt.ly/3wF5cNEl
To benefit from the rise and fall of currency rates, consider enlisting the services of a trusted broker like FXOpen.
CFDs are complex instruments and come with a high risk of losing your money.
Market Analysis: AUD/USD and NZD/USD Regain Strength
🔸The Aussie Dollar started a fresh increase above the 0.6760 and 0.6800 levels against the US Dollar.
🔸There is a bullish flag forming with resistance near 0.6845 on the hourly chart of AUD/USD at FXOpen.
🔸NZD/USD is gaining bullish momentum above the 0.6320 support.
🔸There is a short-term contracting triangle forming with support near 0.6320 on the hourly chart of NZD/USD at FXOpen.
🔗Read the full analysis: https://cutt.ly/3wF5cNEl
To benefit from the rise and fall of currency rates, consider enlisting the services of a trusted broker like FXOpen.
CFDs are complex instruments and come with a high risk of losing your money.
Market Pulse
Market Analysis: AUD/USD and NZD/USD Regain Strength
AUD/USD is moving higher and might climb further above 0.6870. NZD/USD is also rising and could extend its increase above the 0.6370 resistance zone. Important Takeaways for AUD USD and NZD USD Analysis TodayThe Aussie Dollar started a fresh increase above…
#marketanalysis #bitcoin #crypto #BTCUSD
Bitcoin Price Starts the Year with Bullish Sentiment
The first Bitcoin block, also known as the genesis block, was mined on January 3, 2009 at 18:15:05 UTC. 15 years have passed and the value of Bitcoin is in the tens of thousands of US dollars.
In the first days of 2023, bitcoin was worth about $16,600 — and, as it turned out, this was the minimum. After all, then the BTC/USD rate went up and by the end of 2023 reached $44,000. The change was more than +150%!
On January 3, 2024, the price was already above $45,000, giving hope to the bulls that 2024 will be no less successful. If in the coming 2024 BTC/USD repeats the progress of last year, this will mean exceeding the psychological mark of USD 100,000 per coin!
What will influence the price of Bitcoin in the first half of the year?
→ Expected approval of applications for BTC ETF by the SEC regulator. On the one hand, approval will allow a wide range of people to simply invest in Bitcoin, which should increase demand. On the other hand, waiting for approval takes too long. And if it happens, it is possible that a price reduction may occur according to the “buy rumours, sell facts” principle.
→ Approximately, halving will occur in April. This will happen after the 210,000th block is mined. After the halving, miners' block rewards will be reduced from 6.25 BTC to 3.125 BTC. It is believed that this should reduce the supply of coins on the market — accordingly, the price of BTC/USD may rise (and history suggests this).
→ Fed rate cut. Easing monetary policy can serve as a driver for the growth of investment in risky assets, which is Bitcoin.
The BTC/USD daily chart shows that:
→ the price of Bitcoin is within the ascending channel;
→ the price broke through the resistance level of $44,400 per coin.
In this case, a comparison with the recent breakdown of the level of 38,000 is appropriate. If the price acts in the same bullish manner, it may consolidate above 44,400, without even testing this former resistance level.
If the demand for Bitcoin does not exhaust itself, the price may reach the upper boundary of the channel and drift towards the psychological mark of $50k. A return below the $44,000 level will mean a big setback for the bulls and will give reason to consider bearish scenarios, up to a breakdown of the current channel.
To benefit from the rise and fall of crypto prices, consider enlisting the services of a trusted broker like FXOpen.
CFDs are complex instruments and come with a high risk of losing your money.
This article represents the opinion of the Companies operating under the FXOpen brand only. It is not to be construed as an offer, solicitation, or recommendation with respect to products and services provided by the Companies operating under the FXOpen brand, nor is it to be considered financial advice.
At FXOpen UK and FXOpen AU, Cryptocurrency CFDs are only available for trading by those clients categorised as Professional clients under FCA Rules and Professional clients under ASIC Rules, respectively. They are not available for trading by Retail clients.
Bitcoin Price Starts the Year with Bullish Sentiment
The first Bitcoin block, also known as the genesis block, was mined on January 3, 2009 at 18:15:05 UTC. 15 years have passed and the value of Bitcoin is in the tens of thousands of US dollars.
In the first days of 2023, bitcoin was worth about $16,600 — and, as it turned out, this was the minimum. After all, then the BTC/USD rate went up and by the end of 2023 reached $44,000. The change was more than +150%!
On January 3, 2024, the price was already above $45,000, giving hope to the bulls that 2024 will be no less successful. If in the coming 2024 BTC/USD repeats the progress of last year, this will mean exceeding the psychological mark of USD 100,000 per coin!
What will influence the price of Bitcoin in the first half of the year?
→ Expected approval of applications for BTC ETF by the SEC regulator. On the one hand, approval will allow a wide range of people to simply invest in Bitcoin, which should increase demand. On the other hand, waiting for approval takes too long. And if it happens, it is possible that a price reduction may occur according to the “buy rumours, sell facts” principle.
→ Approximately, halving will occur in April. This will happen after the 210,000th block is mined. After the halving, miners' block rewards will be reduced from 6.25 BTC to 3.125 BTC. It is believed that this should reduce the supply of coins on the market — accordingly, the price of BTC/USD may rise (and history suggests this).
→ Fed rate cut. Easing monetary policy can serve as a driver for the growth of investment in risky assets, which is Bitcoin.
The BTC/USD daily chart shows that:
→ the price of Bitcoin is within the ascending channel;
→ the price broke through the resistance level of $44,400 per coin.
In this case, a comparison with the recent breakdown of the level of 38,000 is appropriate. If the price acts in the same bullish manner, it may consolidate above 44,400, without even testing this former resistance level.
If the demand for Bitcoin does not exhaust itself, the price may reach the upper boundary of the channel and drift towards the psychological mark of $50k. A return below the $44,000 level will mean a big setback for the bulls and will give reason to consider bearish scenarios, up to a breakdown of the current channel.
To benefit from the rise and fall of crypto prices, consider enlisting the services of a trusted broker like FXOpen.
CFDs are complex instruments and come with a high risk of losing your money.
This article represents the opinion of the Companies operating under the FXOpen brand only. It is not to be construed as an offer, solicitation, or recommendation with respect to products and services provided by the Companies operating under the FXOpen brand, nor is it to be considered financial advice.
At FXOpen UK and FXOpen AU, Cryptocurrency CFDs are only available for trading by those clients categorised as Professional clients under FCA Rules and Professional clients under ASIC Rules, respectively. They are not available for trading by Retail clients.