
#marketanalysis #stockmarket #nvidia #oilprices
Weekly Market Wrap With Gary Thomson: NASDAQ’S NEW TOP OF THE YEAR, USD/CAD NEWS, WTI OIL, NVDA SHARES DECLINE
Get the latest scoop on the week's hottest headlines, all in one convenient video. Join Gary Thomson, the COO of FXOpen UK, as he breaks down the most significant news reports and shares his expert insights.
🔸NASDAQ: New Top of the Year
🔸USD/CAD: The Rate Approaching Important Support
🔸The Price of WTI Oil Forming a Reversal Pattern
🔸NVDA shares decline after strong report
Stay in the know and empower yourself with our short, yet power-packed video. Watch it now and stay updated with FXOpen.
Don't miss out on this invaluable opportunity to sharpen your trading skills and make informed decisions.
https://cutt.ly/swITXqyJ
To take advantage of price fluctuations in the foreign exchange markets, consider enlisting the services of a reliable broker like FXOpen.
⚠️
This forecast represents FXOpen Companies opinion only, it should not be construed as an offer, invitation or recommendation in respect to FXOpen Companies products and services or as financial advice
Weekly Market Wrap With Gary Thomson: NASDAQ’S NEW TOP OF THE YEAR, USD/CAD NEWS, WTI OIL, NVDA SHARES DECLINE
Get the latest scoop on the week's hottest headlines, all in one convenient video. Join Gary Thomson, the COO of FXOpen UK, as he breaks down the most significant news reports and shares his expert insights.
🔸NASDAQ: New Top of the Year
🔸USD/CAD: The Rate Approaching Important Support
🔸The Price of WTI Oil Forming a Reversal Pattern
🔸NVDA shares decline after strong report
Stay in the know and empower yourself with our short, yet power-packed video. Watch it now and stay updated with FXOpen.
Don't miss out on this invaluable opportunity to sharpen your trading skills and make informed decisions.
https://cutt.ly/swITXqyJ
To take advantage of price fluctuations in the foreign exchange markets, consider enlisting the services of a reliable broker like FXOpen.
⚠️
This forecast represents FXOpen Companies opinion only, it should not be construed as an offer, invitation or recommendation in respect to FXOpen Companies products and services or as financial advice
YouTube
Weekly Market Wrap With Gary Thomson: NASDAQ’S NEW TOP, USD/CAD NEWS, WTI OIL, NVDA SHARES DECLINE
Get the latest scoop on the week's hottest headlines, all in one convenient video. Join Gary Thomson, the COO of FXOpen UK, as he breaks down the most significant news reports and shares his expert insights.
NASDAQ: New Top of the Year #NASDAQ
USD/CAD: The…
NASDAQ: New Top of the Year #NASDAQ
USD/CAD: The…
#marketanalysis #MarketNews
Market Analysis: Results of Black Friday in Financial Markets
As CNN reports, Black Friday brought single-day sales records in the United States. According to Mastercard SpendingPulse, offline sales increased by 1%, and online sales by 8.5%. According to Sensormatic Solutions, store traffic increased by 4.6% year on year. Shopify reported record sales growth of 22% year over year to $4 billion worldwide.
The activity of buyers indicates the stability of the US economy, which is reflected in the stock markets — the S&P 500 index is near the highs of the year. However, the beginning of the week may bring an unpleasant surprise: on Thursday, the publication of the values of the PME indicator, which is closely monitored by the Federal Reserve to assess inflation in the United States, will take place.
https://cutt.ly/rwI4EaSM
To take advantage of price fluctuations in the foreign exchange markets, consider enlisting the services of a reliable broker like FXOpen.
⚠️
This forecast represents FXOpen Companies opinion only, it should not be construed as an offer, invitation or recommendation in respect to FXOpen Companies products and services or as financial advice
Market Analysis: Results of Black Friday in Financial Markets
As CNN reports, Black Friday brought single-day sales records in the United States. According to Mastercard SpendingPulse, offline sales increased by 1%, and online sales by 8.5%. According to Sensormatic Solutions, store traffic increased by 4.6% year on year. Shopify reported record sales growth of 22% year over year to $4 billion worldwide.
The activity of buyers indicates the stability of the US economy, which is reflected in the stock markets — the S&P 500 index is near the highs of the year. However, the beginning of the week may bring an unpleasant surprise: on Thursday, the publication of the values of the PME indicator, which is closely monitored by the Federal Reserve to assess inflation in the United States, will take place.
https://cutt.ly/rwI4EaSM
To take advantage of price fluctuations in the foreign exchange markets, consider enlisting the services of a reliable broker like FXOpen.
⚠️
This forecast represents FXOpen Companies opinion only, it should not be construed as an offer, invitation or recommendation in respect to FXOpen Companies products and services or as financial advice
Market Pulse
Market Analysis: Results of Black Friday in Financial Markets
As CNN reports, Black Friday brought single-day sales records in the United States.
#marketanalysis #MarketNews #tradingforex
Market Analysis: Australian Dollar Reaches Its Highest Since Early August
Important events regarding AUD took place this morning:
→ the level of retail sales for the month in Australia unexpectedly fell: actual = -0.2%, expected = +0.1%, a month earlier = +0.9%.
→ a press conference was held by the head of the RBA, Michelle Bullock, according to whom inflation in Australia follows the path of overseas countries. That is, inflation is decreasing, as in the USA and Great Britain.
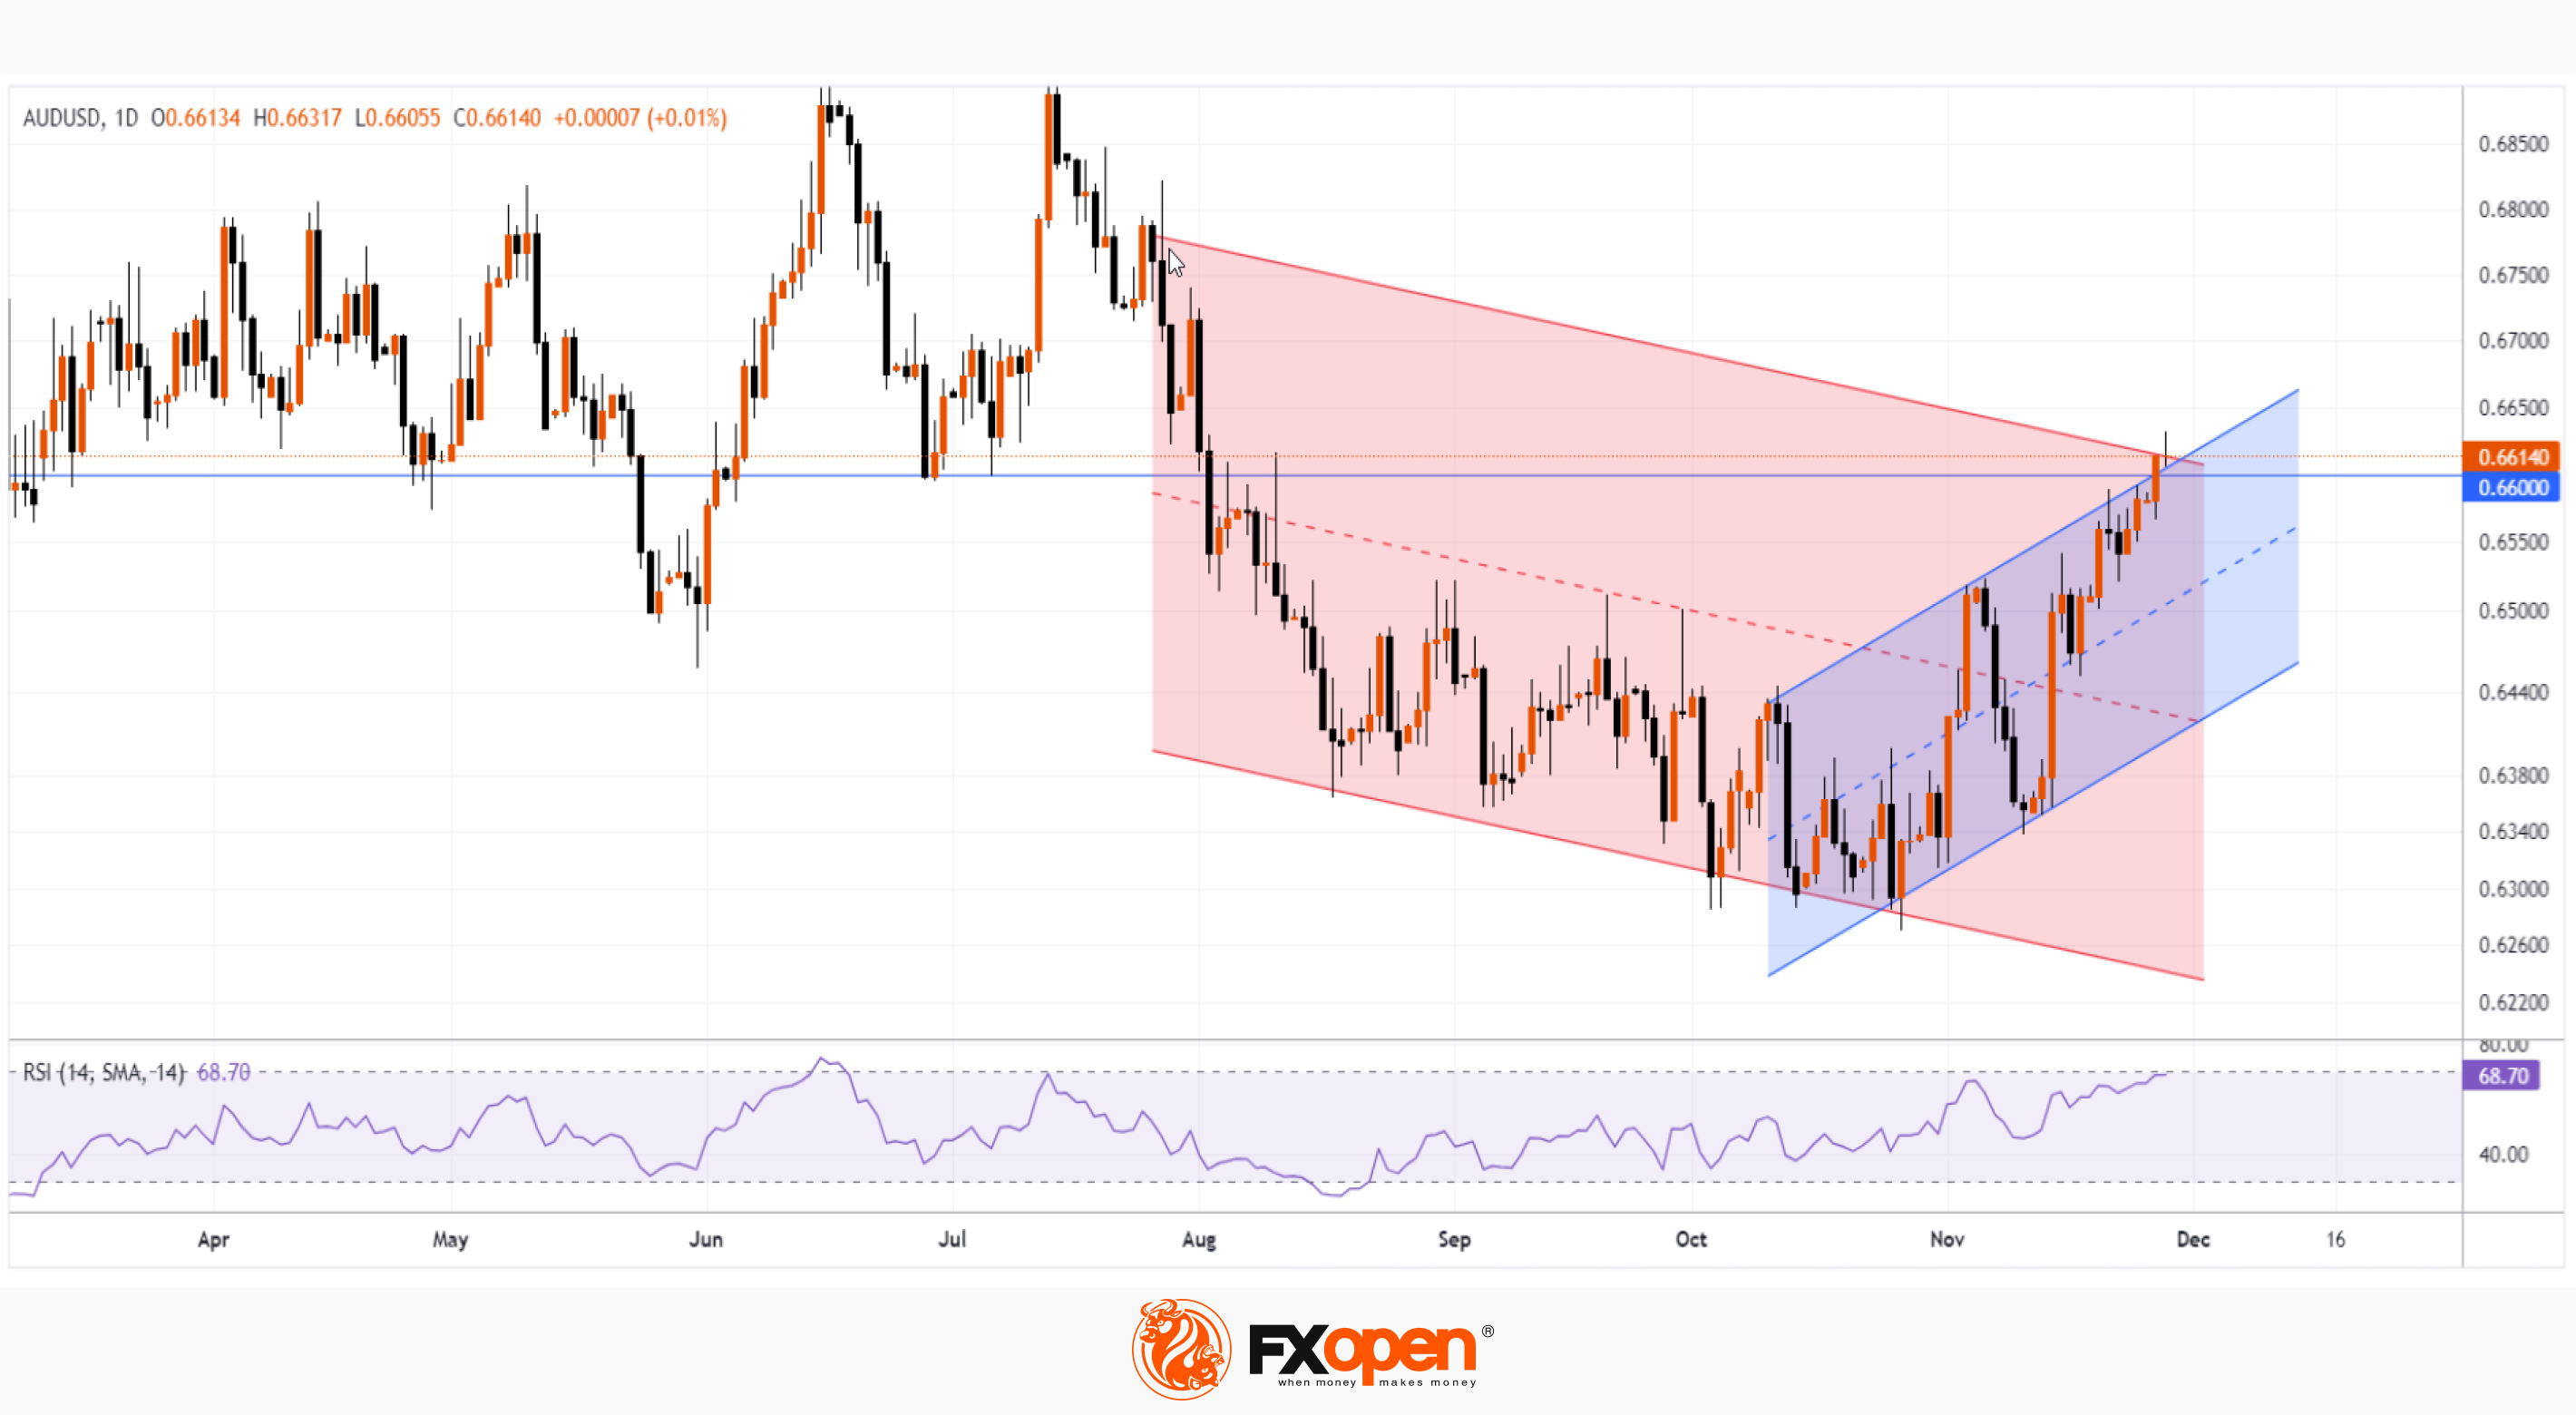
Against the background of these events, the AUD/USD rate exceeded the level of 0.663 for the first time since the beginning of August. The rally from the late October low is already about 5.5%. However, this upward trend has 3 important obstacles:
1) The upper limit of the November ascending channel (shown in blue).
2) The upper limit of the longer-term parallel channel (shown in red).
3) Level 0.660. During 2023, it worked as support once. Therefore, from the point of view of technical analysis, there is reason to expect that it will provide resistance.
And although the price of AUD/USD today exceeded these levels, it can hardly be said with confidence that it has consolidated there. Also pay attention to the RSI indicator, which is on the border of the overbought zone.
Taking into account the above factors, it is acceptable to expect a pullback in the market. The trigger could be news about the CPI values for Australia, which will be published tomorrow.
To benefit from the rise and fall of currency rates, consider enlisting the services of a trusted broker like FXOpen.
CFDs are complex instruments and come with a high risk of losing your money.
This article represents the opinion of the Companies operating under the FXOpen brand only. It is not to be construed as an offer, solicitation, or recommendation with respect to products and services provided by the Companies operating under the FXOpen brand, nor is it to be considered financial advice.
Market Analysis: Australian Dollar Reaches Its Highest Since Early August
Important events regarding AUD took place this morning:
→ the level of retail sales for the month in Australia unexpectedly fell: actual = -0.2%, expected = +0.1%, a month earlier = +0.9%.
→ a press conference was held by the head of the RBA, Michelle Bullock, according to whom inflation in Australia follows the path of overseas countries. That is, inflation is decreasing, as in the USA and Great Britain.
Against the background of these events, the AUD/USD rate exceeded the level of 0.663 for the first time since the beginning of August. The rally from the late October low is already about 5.5%. However, this upward trend has 3 important obstacles:
1) The upper limit of the November ascending channel (shown in blue).
2) The upper limit of the longer-term parallel channel (shown in red).
3) Level 0.660. During 2023, it worked as support once. Therefore, from the point of view of technical analysis, there is reason to expect that it will provide resistance.
And although the price of AUD/USD today exceeded these levels, it can hardly be said with confidence that it has consolidated there. Also pay attention to the RSI indicator, which is on the border of the overbought zone.
Taking into account the above factors, it is acceptable to expect a pullback in the market. The trigger could be news about the CPI values for Australia, which will be published tomorrow.
To benefit from the rise and fall of currency rates, consider enlisting the services of a trusted broker like FXOpen.
CFDs are complex instruments and come with a high risk of losing your money.
This article represents the opinion of the Companies operating under the FXOpen brand only. It is not to be construed as an offer, solicitation, or recommendation with respect to products and services provided by the Companies operating under the FXOpen brand, nor is it to be considered financial advice.
#marketanalysis #MarketNews #gasprices
Market Analysis: Natural Gas Prices Fall to More than 2-month Lows
Yesterday, XNG/USD quotes dropped below the 2,900 level for the first time since mid-September. This was helped by the fact that the NatGasWeather weather forecasting model late last week showed a cooling trend in December in the US, but this was replaced by warming over the weekend.
According to analyst forecasts from Analysts Tudor, Pickering, Holt & Co., published on Monday:
→ natural gas reserves at the end of winter could be 2 trillion cubic feet (previously forecast 1.9 trillion);
→ price could be USD 2.75 (previous forecast was USD 3 or less).
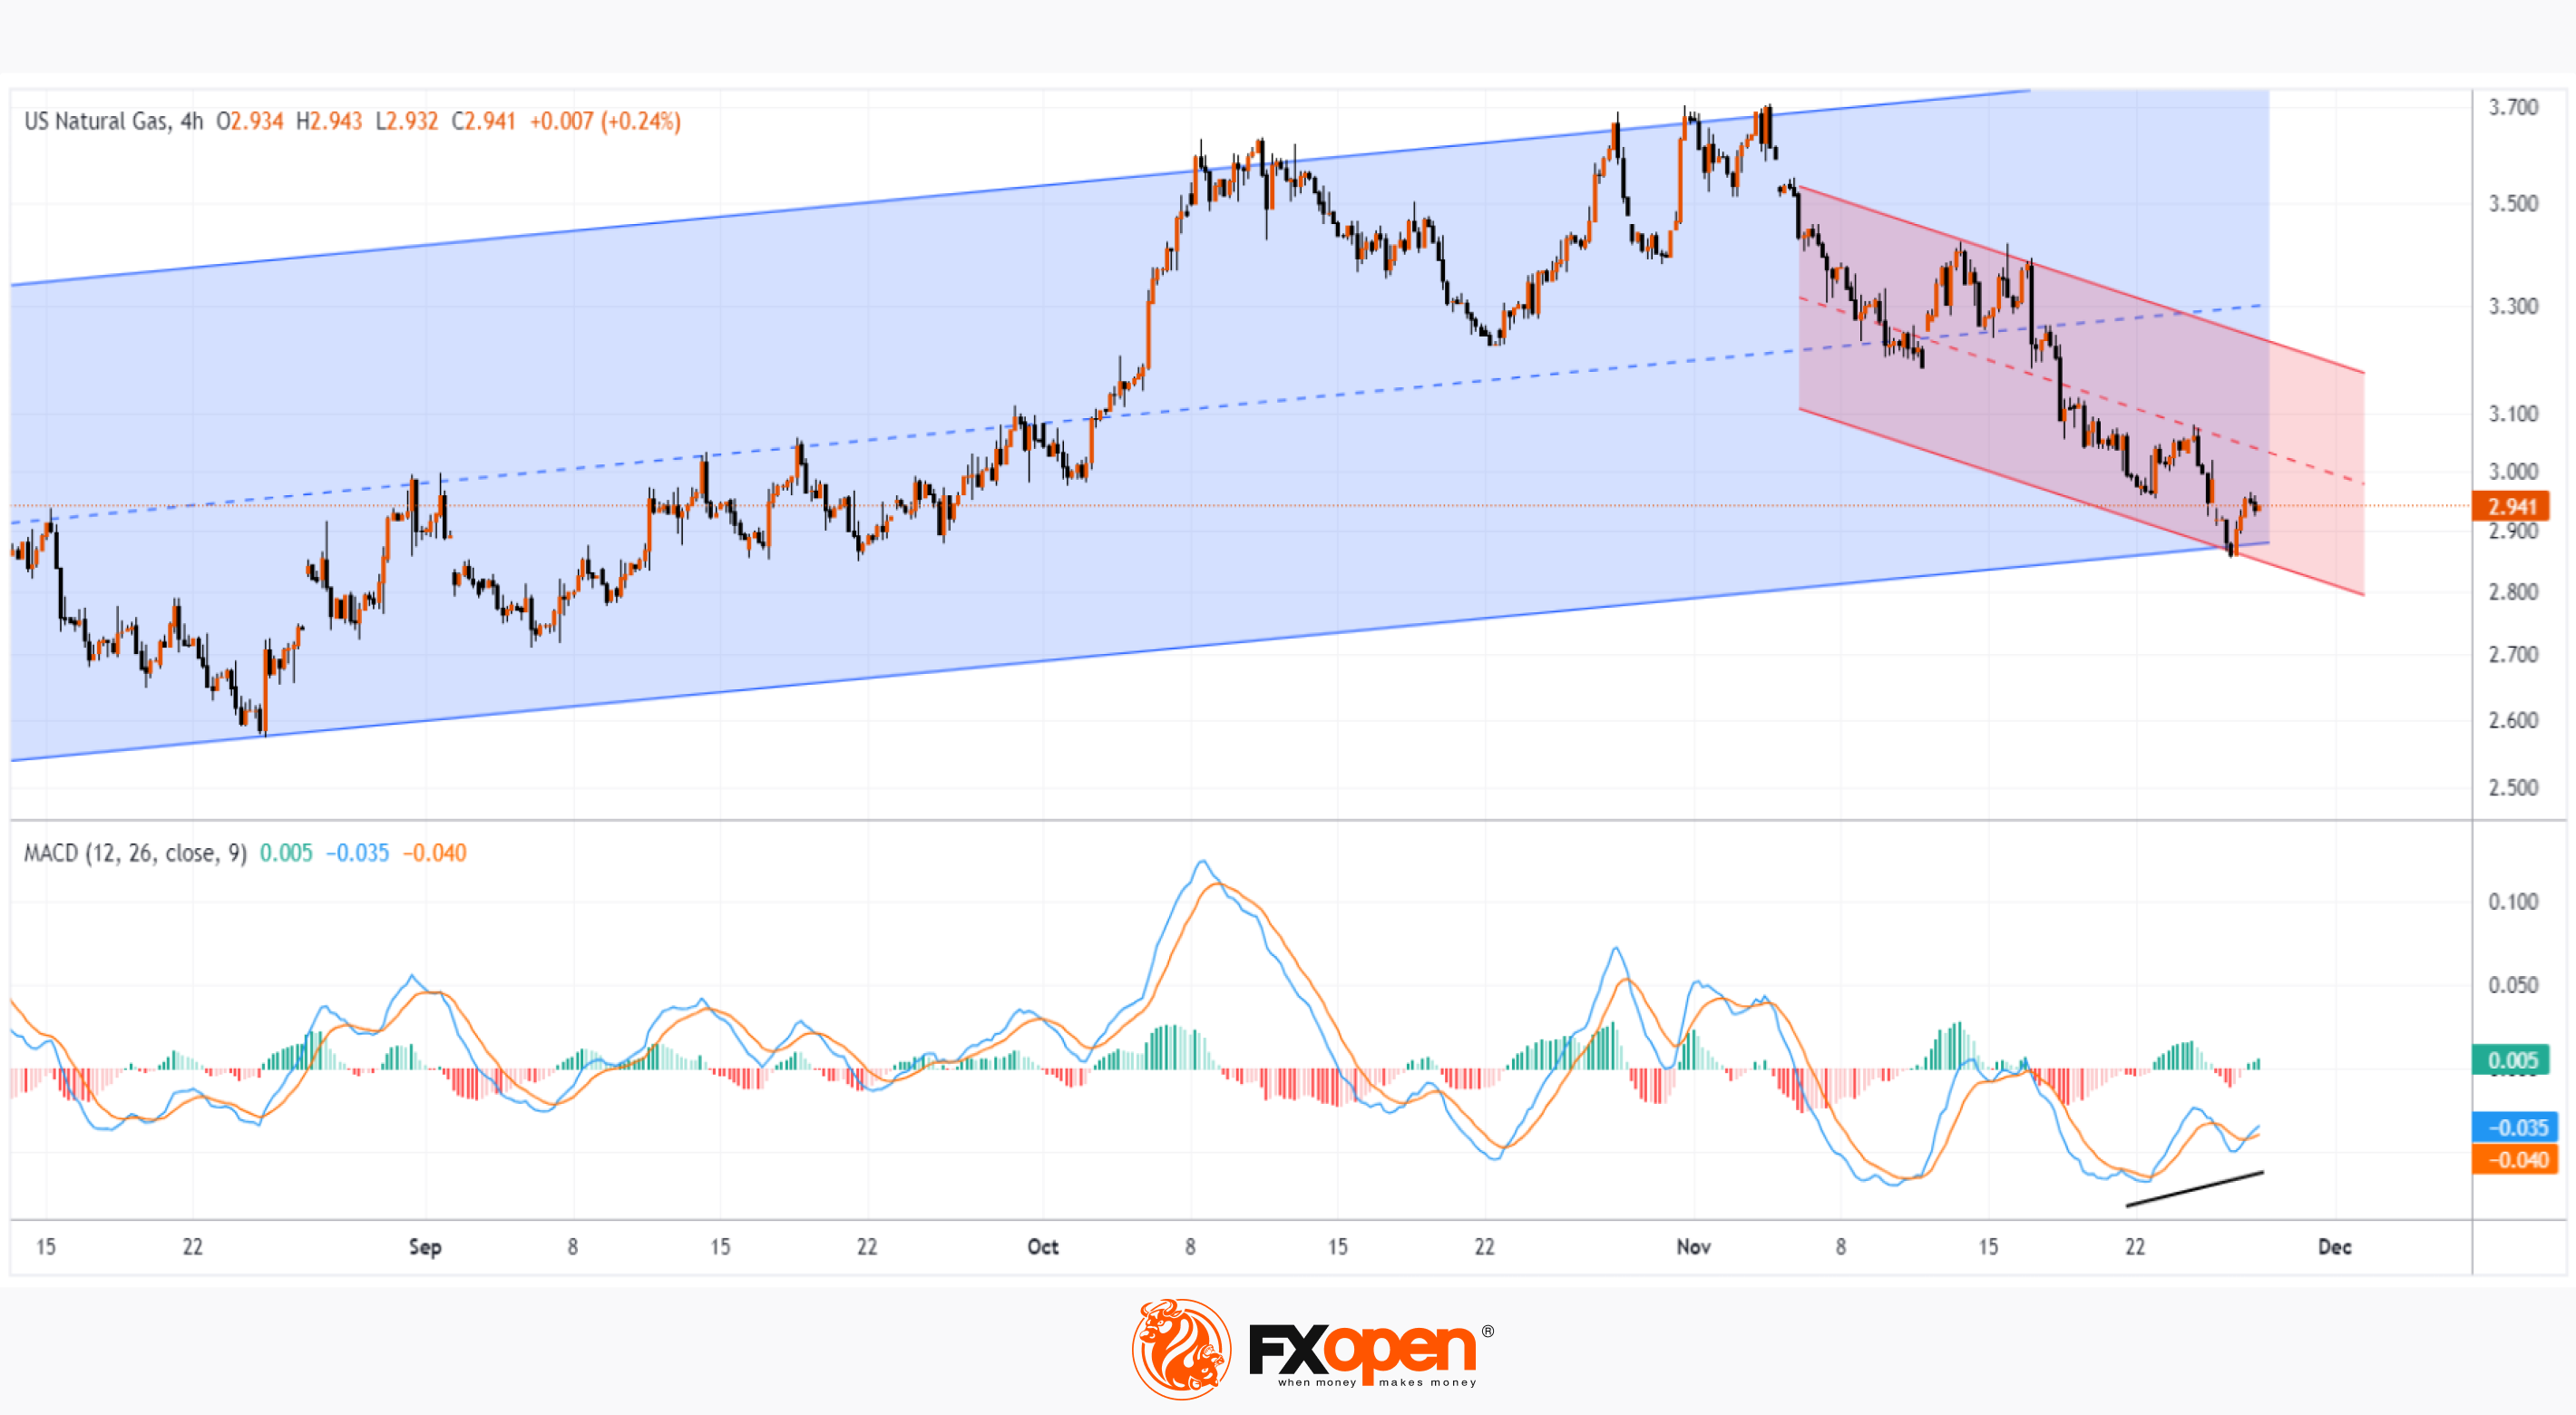
Meanwhile, the US Natural Gas price chart shows that:
→ the price of natural gas is near the lower border of the channel (shown in blue), which can provide support;
→ the MACD indicator indicates divergence (a sign of weakening selling pressure).
Thus, although the market has been in a bearish trend since the beginning of November (shown in red), the chart shows bullish signs — it is possible that the price in the short term may rise to the upper limit of the red channel. The likelihood of this scenario will increase if the weather forecasting model indicates a cold snap.
To benefit from price fluctuations in the energy markets, consider enlisting the services of a trusted broker like FXOpen.
CFDs are complex instruments and come with a high risk of losing your money.
This article represents the opinion of the Companies operating under the FXOpen brand only. It is not to be construed as an offer, solicitation, or recommendation with respect to products and services provided by the Companies operating under the FXOpen brand, nor is it to be considered financial advice.
Market Analysis: Natural Gas Prices Fall to More than 2-month Lows
Yesterday, XNG/USD quotes dropped below the 2,900 level for the first time since mid-September. This was helped by the fact that the NatGasWeather weather forecasting model late last week showed a cooling trend in December in the US, but this was replaced by warming over the weekend.
According to analyst forecasts from Analysts Tudor, Pickering, Holt & Co., published on Monday:
→ natural gas reserves at the end of winter could be 2 trillion cubic feet (previously forecast 1.9 trillion);
→ price could be USD 2.75 (previous forecast was USD 3 or less).
Meanwhile, the US Natural Gas price chart shows that:
→ the price of natural gas is near the lower border of the channel (shown in blue), which can provide support;
→ the MACD indicator indicates divergence (a sign of weakening selling pressure).
Thus, although the market has been in a bearish trend since the beginning of November (shown in red), the chart shows bullish signs — it is possible that the price in the short term may rise to the upper limit of the red channel. The likelihood of this scenario will increase if the weather forecasting model indicates a cold snap.
To benefit from price fluctuations in the energy markets, consider enlisting the services of a trusted broker like FXOpen.
CFDs are complex instruments and come with a high risk of losing your money.
This article represents the opinion of the Companies operating under the FXOpen brand only. It is not to be construed as an offer, solicitation, or recommendation with respect to products and services provided by the Companies operating under the FXOpen brand, nor is it to be considered financial advice.
#tradingforex #forextrading #trading
New contest: TickTrader Challenge-3. Join and win up to USD250!
FXOpen is pleased to introduce the TickTrader Challenge-3, a new competition for members of the FXOpen forum that is available to clients of FXOpen International (FXOpen Markets Limited) and has a greater prize pool of USD 650.
Attention: This competition is open to clients of FXOpen International (FXOpen Markets Limited).
The contest starts on December 4 and ends on December 15, 2023. Registration is already open and will last until December 15, 2023.
Learn more: https://cutt.ly/zwOitjcl
To take advantage of price fluctuations in the foreign exchange markets, consider enlisting the services of a reliable broker like FXOpen.
New contest: TickTrader Challenge-3. Join and win up to USD250!
FXOpen is pleased to introduce the TickTrader Challenge-3, a new competition for members of the FXOpen forum that is available to clients of FXOpen International (FXOpen Markets Limited) and has a greater prize pool of USD 650.
Attention: This competition is open to clients of FXOpen International (FXOpen Markets Limited).
The contest starts on December 4 and ends on December 15, 2023. Registration is already open and will last until December 15, 2023.
Learn more: https://cutt.ly/zwOitjcl
To take advantage of price fluctuations in the foreign exchange markets, consider enlisting the services of a reliable broker like FXOpen.
Forex, Stocks, Crypto CFDs trading with FXOpen INT: A True ECN Forex Broker
New contest: TickTrader Challenge-3. Join and win up to USD250!
FXOpen is pleased to introduce the TickTrader Challenge-3, a new competition for members of the FXOpen forum that is available to clients of FXOpen International (FXOpen Markets Limited) and has a greater prize pool of USD 650. Attention: This competition…
#marketanalysis #EURUSD #tradingforex
EUR/USD Analysis: Price Reaches the Level of 1.1000
Before yesterday's trading session, the last time 1 euro was 1.1 USD was in the first half of August.
The growth of the rate was facilitated by the weakening of the dollar, which occurred against the background of the words of Christopher Waller, a member of the Fed Board of Governors, who is known for his hawkish policies. But he has already softened his position.
"I am increasingly confident that policy is currently well positioned to slow the economy and get inflation back to 2 percent," he said yesterday, however, adding that if the decline in inflation continues “for a few more months... three months, four months, five months... we can start reducing the discount rate just because inflation is lower.”
The expected rate cut could mark the beginning of a new period of looser monetary policy. Therefore, financial markets reacted by increasing the prices of currencies relative to the dollar — in particular, the euro reached a psychological level.
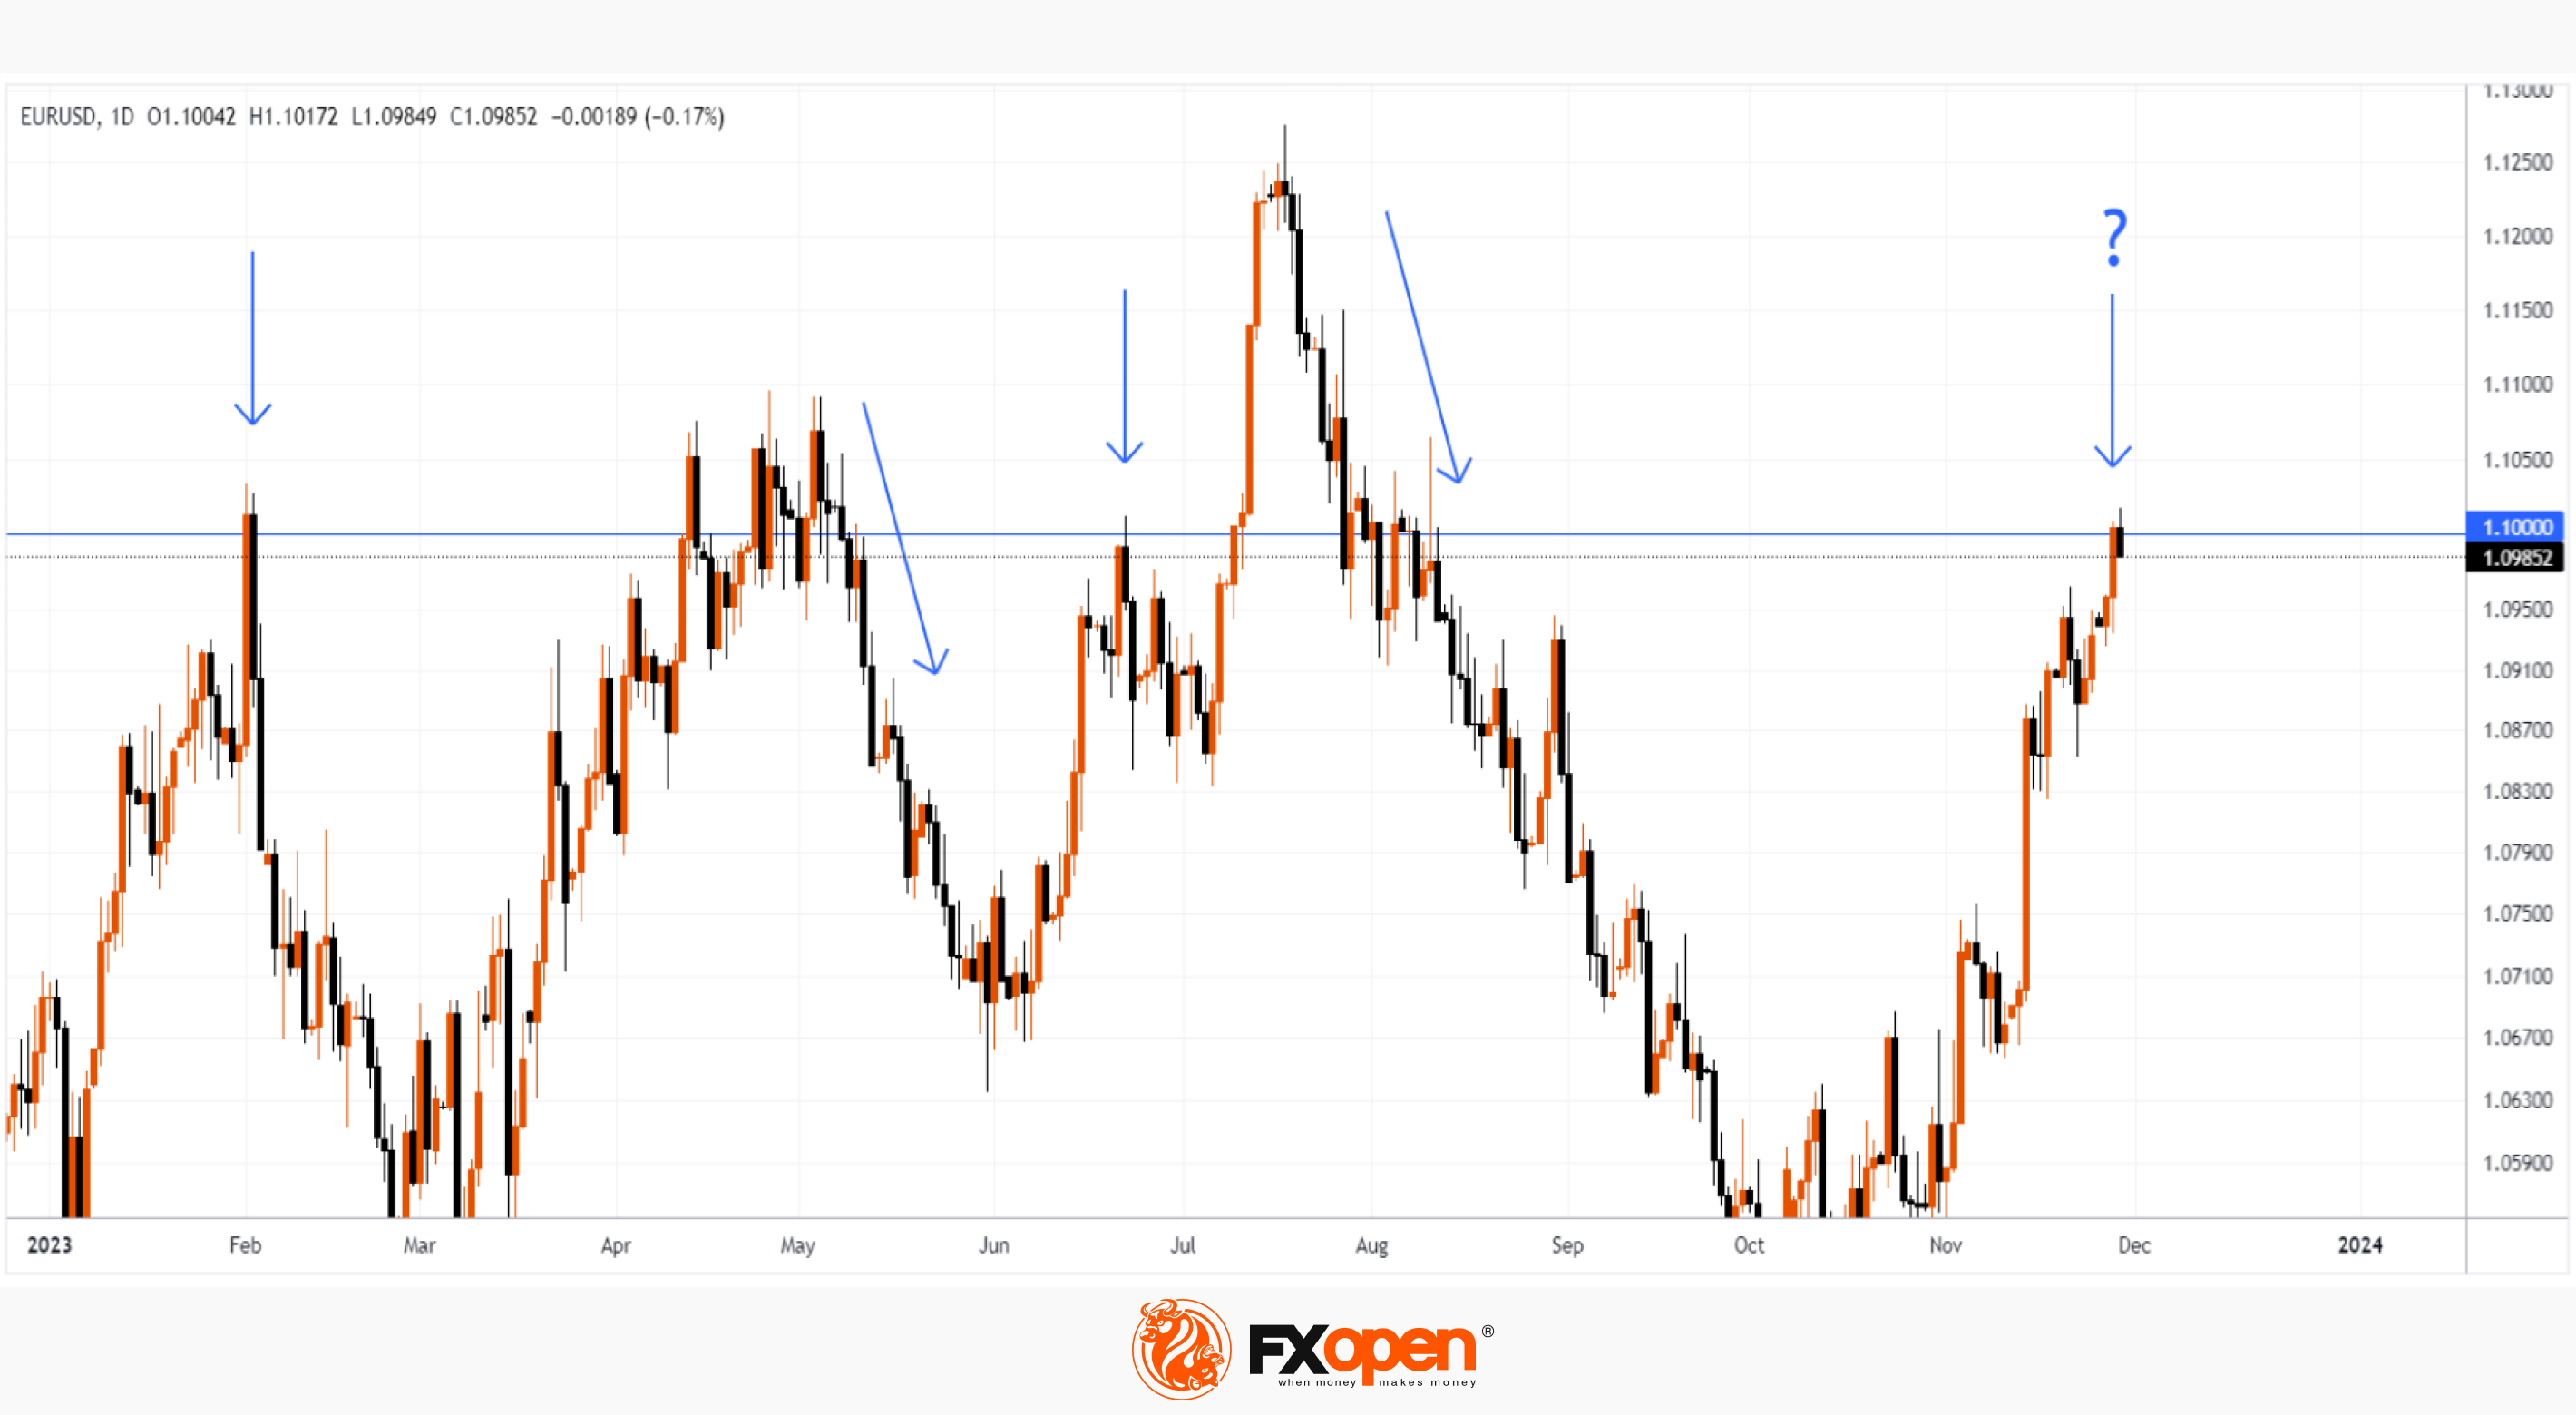
The chart shows that in 2023 the price of EUR/USD interacted with it several times, which caused, among other things, trend reversals. As the arrows show:
→ a bearish reversal took place in February;
→ in May the price entered consolidation, but exited it in a downward direction;
→ the level worked as a resistance in June.
The sharp rise in July above the 1.100 level turned into an equally rapid fall.
Taking into account the above facts, there is reason to assume a scenario in which the level of 1.100 will once again in 2023 resist the appreciation of the euro. Moreover, this is already noticeable, since on Wednesday the price exceeded Tuesday’s high and turned down (a sign of a false bullish breakout).
To benefit from price fluctuations in the foreign exchange markets, consider enlisting the services of a trusted broker like FXOpen.
CFDs are complex instruments and come with a high risk of losing your money.
This article represents the opinion of the Companies operating under the FXOpen brand only. It is not to be construed as an offer, solicitation, or recommendation with respect to products and services provided by the Companies operating under the FXOpen brand, nor is it to be considered financial advice.
EUR/USD Analysis: Price Reaches the Level of 1.1000
Before yesterday's trading session, the last time 1 euro was 1.1 USD was in the first half of August.
The growth of the rate was facilitated by the weakening of the dollar, which occurred against the background of the words of Christopher Waller, a member of the Fed Board of Governors, who is known for his hawkish policies. But he has already softened his position.
"I am increasingly confident that policy is currently well positioned to slow the economy and get inflation back to 2 percent," he said yesterday, however, adding that if the decline in inflation continues “for a few more months... three months, four months, five months... we can start reducing the discount rate just because inflation is lower.”
The expected rate cut could mark the beginning of a new period of looser monetary policy. Therefore, financial markets reacted by increasing the prices of currencies relative to the dollar — in particular, the euro reached a psychological level.
The chart shows that in 2023 the price of EUR/USD interacted with it several times, which caused, among other things, trend reversals. As the arrows show:
→ a bearish reversal took place in February;
→ in May the price entered consolidation, but exited it in a downward direction;
→ the level worked as a resistance in June.
The sharp rise in July above the 1.100 level turned into an equally rapid fall.
Taking into account the above facts, there is reason to assume a scenario in which the level of 1.100 will once again in 2023 resist the appreciation of the euro. Moreover, this is already noticeable, since on Wednesday the price exceeded Tuesday’s high and turned down (a sign of a false bullish breakout).
To benefit from price fluctuations in the foreign exchange markets, consider enlisting the services of a trusted broker like FXOpen.
CFDs are complex instruments and come with a high risk of losing your money.
This article represents the opinion of the Companies operating under the FXOpen brand only. It is not to be construed as an offer, solicitation, or recommendation with respect to products and services provided by the Companies operating under the FXOpen brand, nor is it to be considered financial advice.
#marketanalysis #MarketNews #oilprices #opec
Market Analysis: Today OPEC+ May Announce New Oil Production Cuts
According to WSJ, the reduction could be 1 million barrels per day. Saudi Arabia is in favor of cuts, but the idea causes disagreements among other members of the organization.
In anticipation of news about the OPEC+ decision, the price of oil is rising - this indicates that market participants assess the possibility of new production cuts as quite real, even if we are not talking about 1 million barrels per day. The price is approaching its maximum for November.
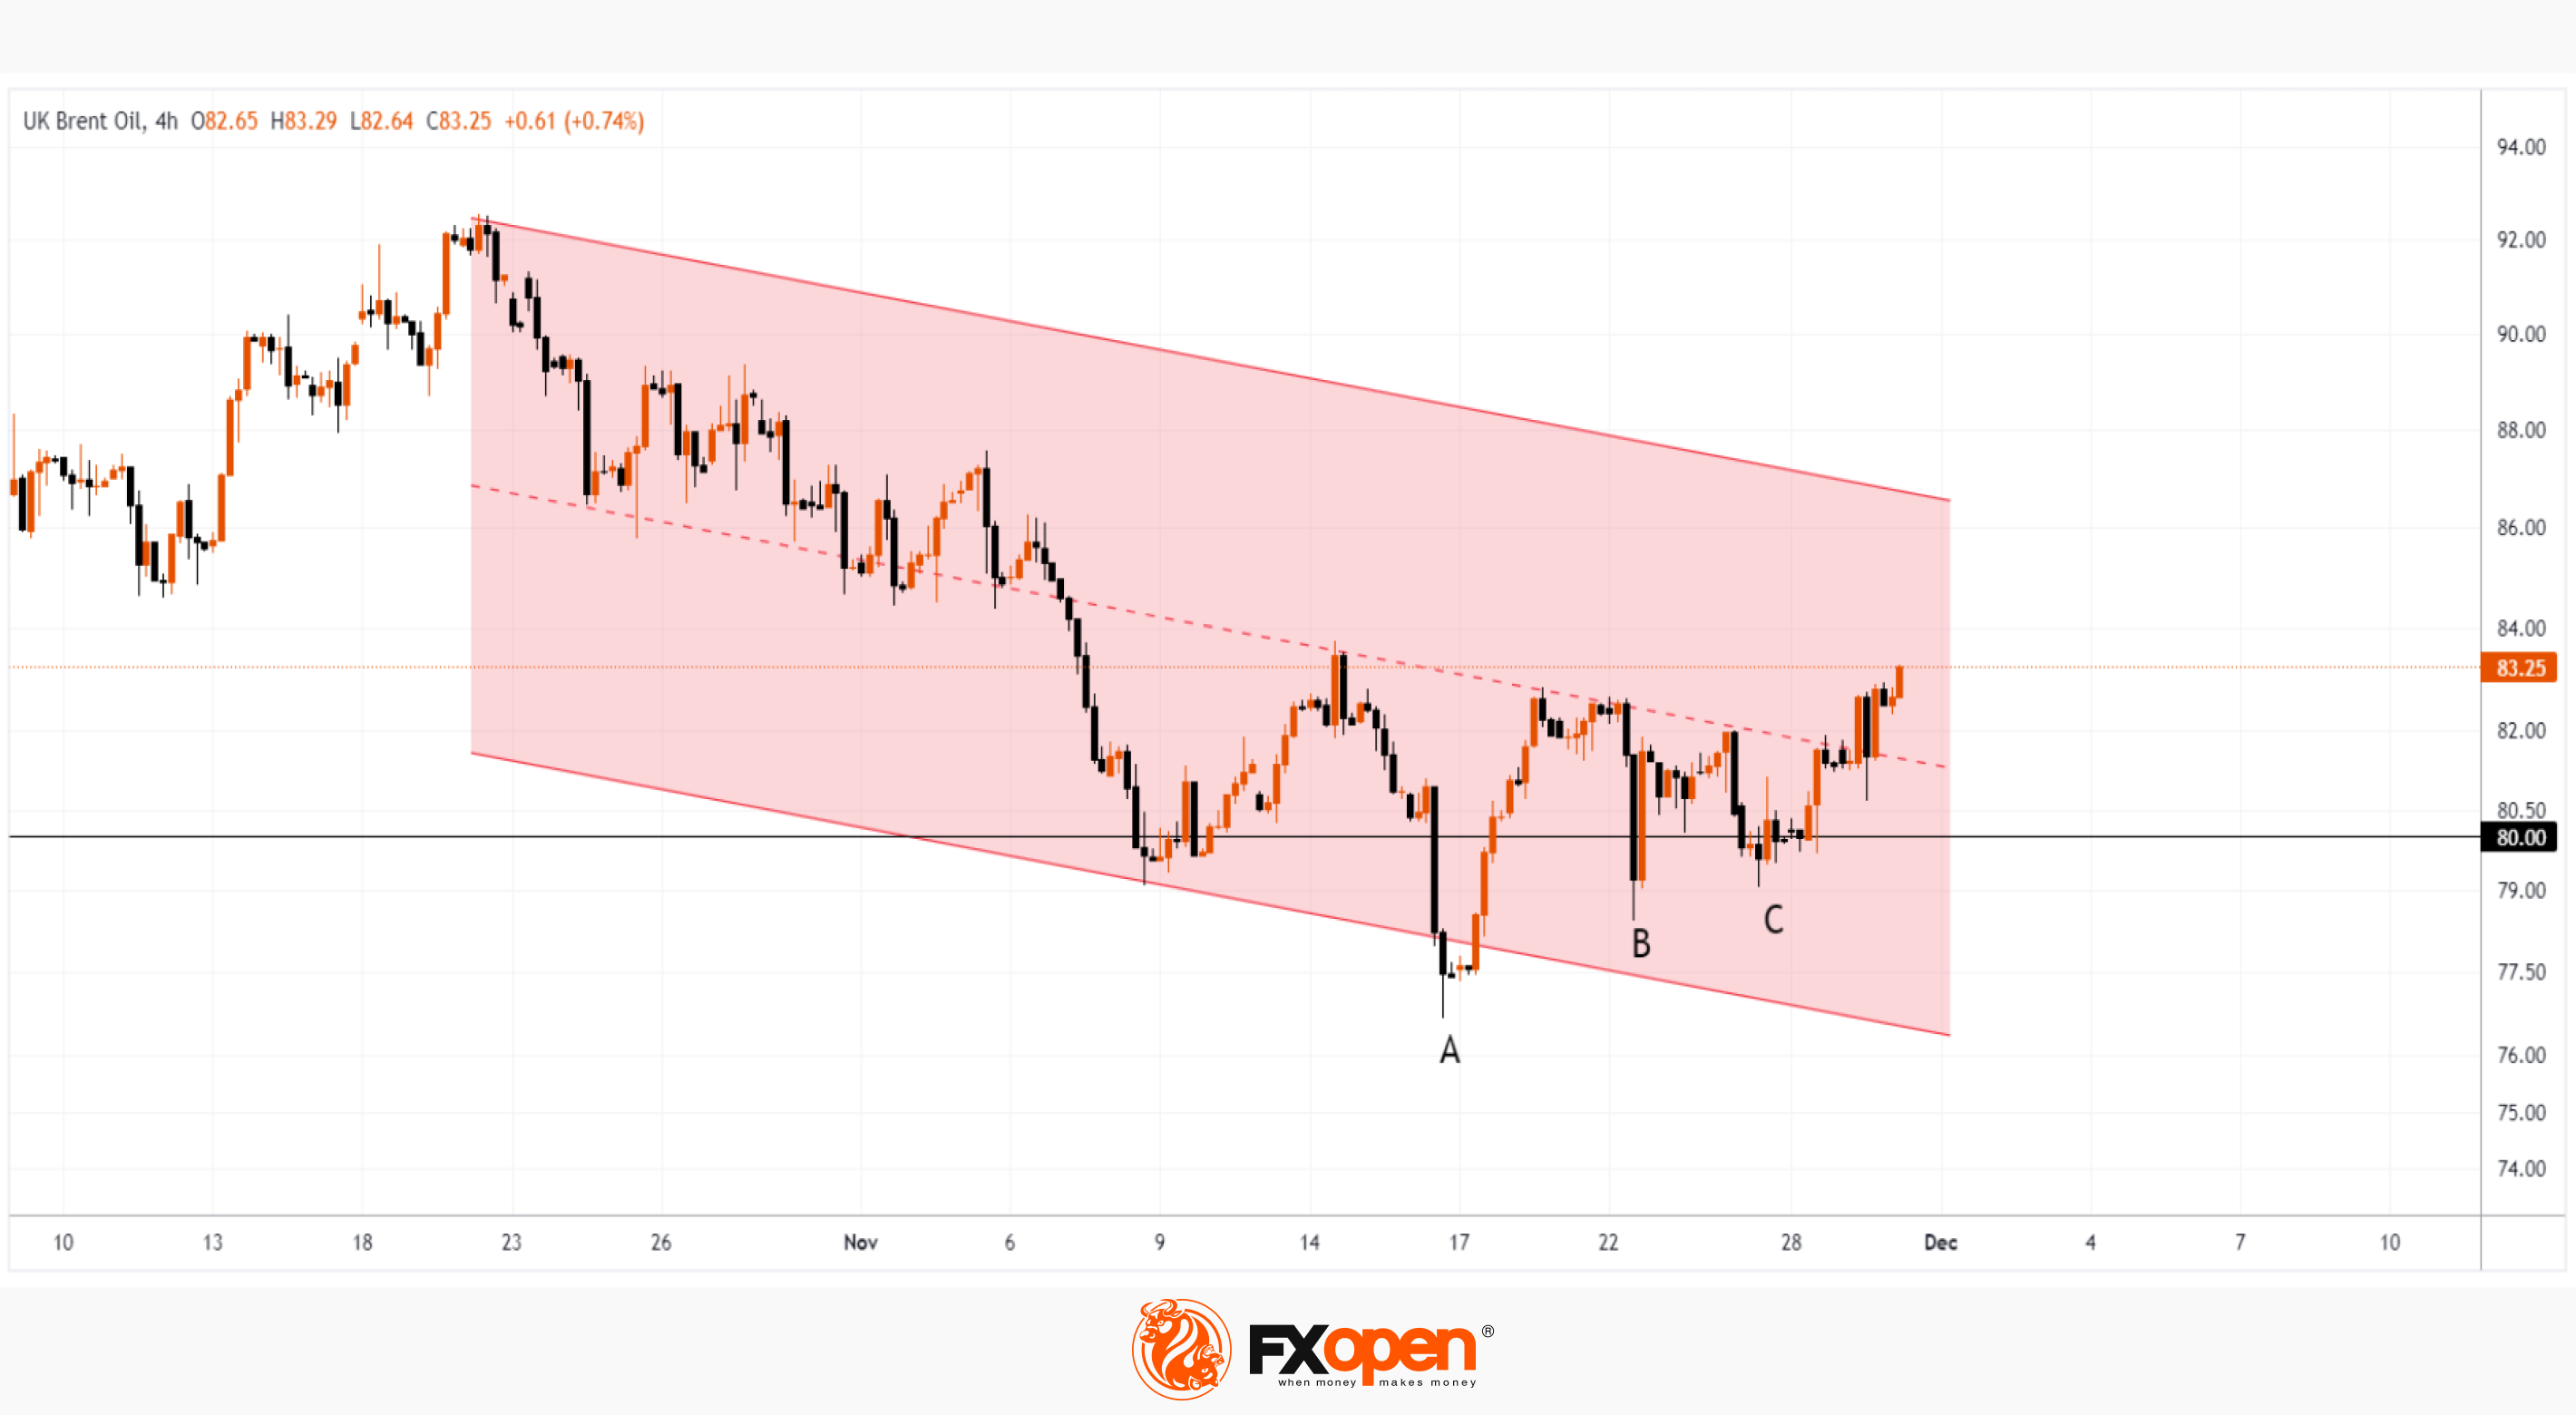
The Brent oil price chart shows that:
→ the level of 80 dollars per barrel acts as support. In the twenties, the price dropped to the level more than once, but each time the bulls found the strength to recover;
→ rising lows A-B-C indicate the predominance of demand around the mentioned psychological level;
→ the price has been within the descending channel (shown in red) for more than a month, but is trying to consolidate above the median line. This is another sign of the bulls' persistence.
However, it should be recognized that the current bullish sentiment could easily change if OPEC+ fails to reach a consensus on significant restrictions on oil production aimed at supporting commodity prices.
To benefit from the rise and fall of energy prices, consider enlisting the services of a trusted broker like FXOpen.
CFDs are complex instruments and come with a high risk of losing your money.
This article represents the opinion of the Companies operating under the FXOpen brand only. It is not to be construed as an offer, solicitation, or recommendation with respect to products and services provided by the Companies operating under the FXOpen brand, nor is it to be considered financial advice.
Market Analysis: Today OPEC+ May Announce New Oil Production Cuts
According to WSJ, the reduction could be 1 million barrels per day. Saudi Arabia is in favor of cuts, but the idea causes disagreements among other members of the organization.
In anticipation of news about the OPEC+ decision, the price of oil is rising - this indicates that market participants assess the possibility of new production cuts as quite real, even if we are not talking about 1 million barrels per day. The price is approaching its maximum for November.
The Brent oil price chart shows that:
→ the level of 80 dollars per barrel acts as support. In the twenties, the price dropped to the level more than once, but each time the bulls found the strength to recover;
→ rising lows A-B-C indicate the predominance of demand around the mentioned psychological level;
→ the price has been within the descending channel (shown in red) for more than a month, but is trying to consolidate above the median line. This is another sign of the bulls' persistence.
However, it should be recognized that the current bullish sentiment could easily change if OPEC+ fails to reach a consensus on significant restrictions on oil production aimed at supporting commodity prices.
To benefit from the rise and fall of energy prices, consider enlisting the services of a trusted broker like FXOpen.
CFDs are complex instruments and come with a high risk of losing your money.
This article represents the opinion of the Companies operating under the FXOpen brand only. It is not to be construed as an offer, solicitation, or recommendation with respect to products and services provided by the Companies operating under the FXOpen brand, nor is it to be considered financial advice.
#marketanalysis #bitcoin #BTCUSD
BTC/USD Analysis: New High for the Year Shows Bulls Are Indecisive
During November, the price of bitcoin increased by approximately 10% in anticipation of the launch of a bitcoin ETF. But the positive sentiment of crypto investors is seriously overshadowed by news regarding Binance:
→ Changpeng Zhao resigned as head of Binance.US, pleading guilty to money laundering charges. He also agreed to pay $50 million in a lawsuit from the US Department of Justice, and his company will have to pay $4.3 billion. This fine to Binance was one of the largest in the history of punishment of corporations. In addition, Zhao faces up to 10 years in prison. The judges banned him from leaving the United States until the proceedings are completed.
→ Cristiano Ronaldo was sued for $1 billion for advertising Binance. This was done by people who claim they suffered losses by buying unregistered securities that the sports star was promoting.
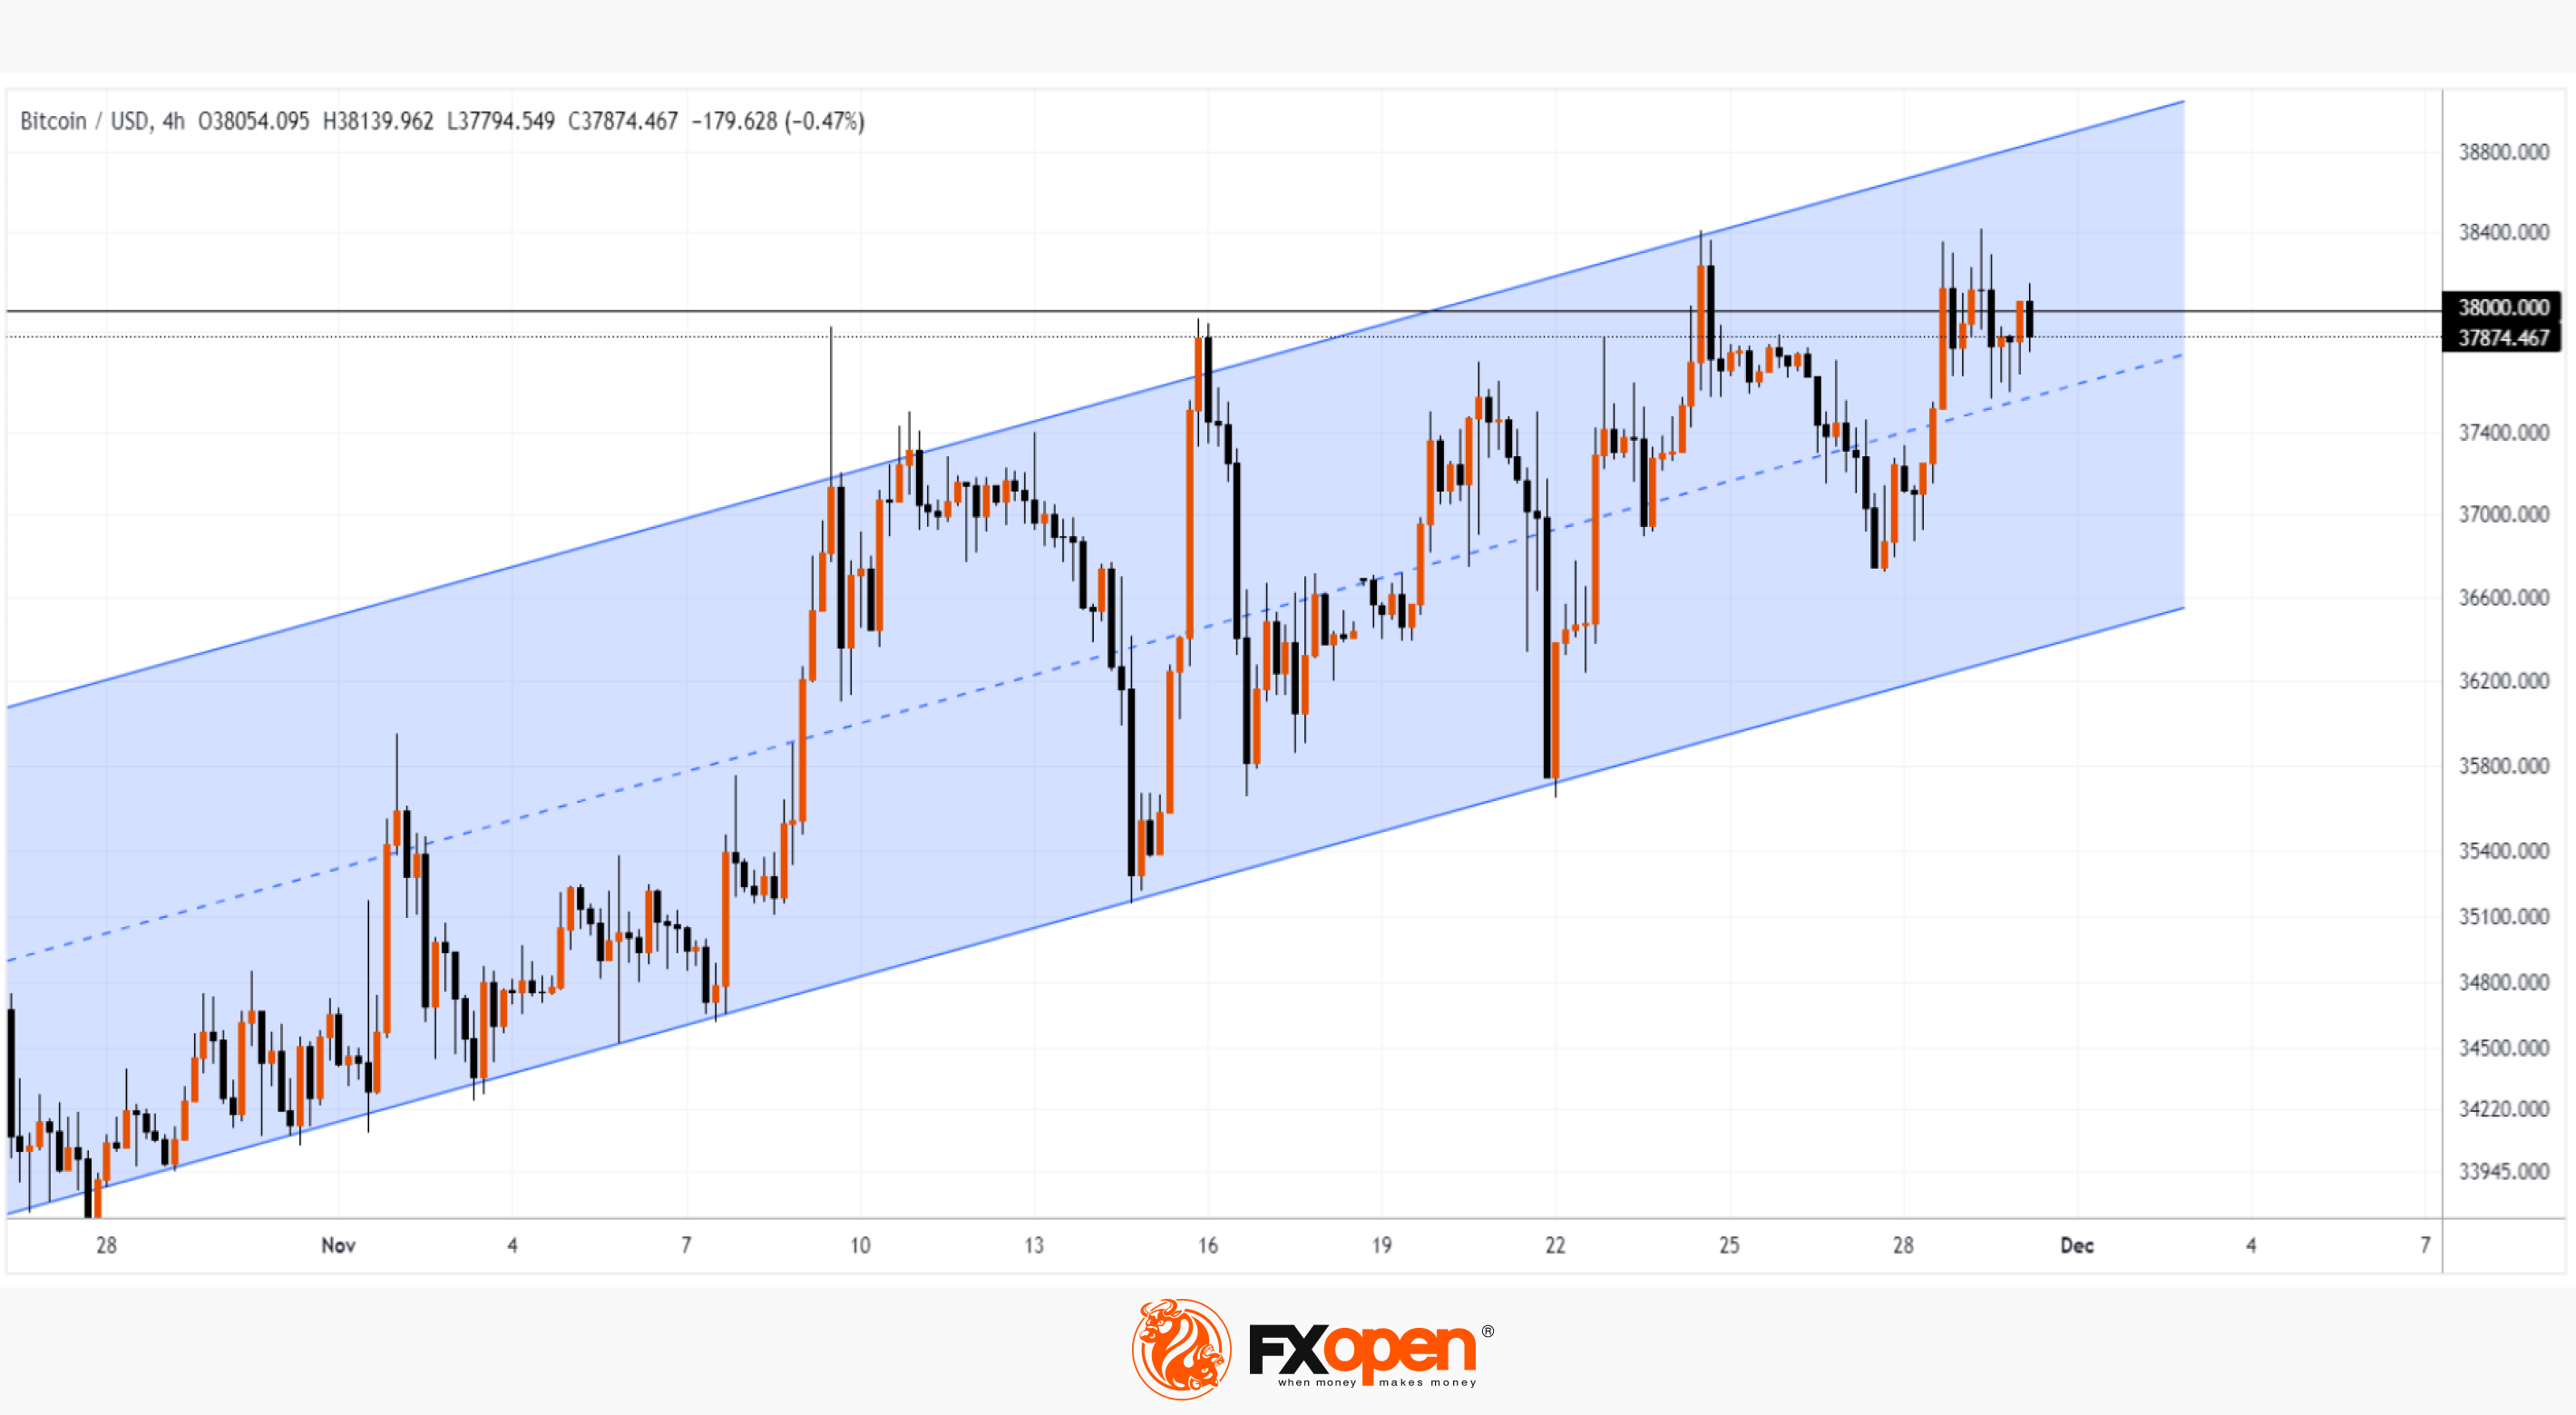
Meanwhile, the BTC/USD chart shows signs that demand forces are losing confidence, although the price is moving within an ascending channel (shown in blue).
Notice that the November 29 top was only a few dollars higher than the previous November 24 top. This short-term excess suggests that there is no sustainable predominance of demand over supply in the market around the level of $38 thousand per Bitcoin, and the top on November 29 is nothing more than a bull trap.
In such conditions, perhaps more attention should be paid to the idea of testing the lower boundary of the current channel.
To benefit from the rise and fall in the price of crypto assets, consider enlisting the services of a trusted broker like FXOpen.
CFDs are complex instruments and come with a high risk of losing your money.
This article represents the opinion of the Companies operating under the FXOpen brand only. It is not to be construed as an offer, solicitation, or recommendation with respect to products and services provided by the Companies operating under the FXOpen brand, nor is it to be considered financial advice.
At FXOpen UK and FXOpen AU, Cryptocurrency CFDs are only available for trading by those clients categorised as Professional clients under FCA Rules and Professional clients under ASIC Rules, respectively. They are not available for trading by Retail clients.
BTC/USD Analysis: New High for the Year Shows Bulls Are Indecisive
During November, the price of bitcoin increased by approximately 10% in anticipation of the launch of a bitcoin ETF. But the positive sentiment of crypto investors is seriously overshadowed by news regarding Binance:
→ Changpeng Zhao resigned as head of Binance.US, pleading guilty to money laundering charges. He also agreed to pay $50 million in a lawsuit from the US Department of Justice, and his company will have to pay $4.3 billion. This fine to Binance was one of the largest in the history of punishment of corporations. In addition, Zhao faces up to 10 years in prison. The judges banned him from leaving the United States until the proceedings are completed.
→ Cristiano Ronaldo was sued for $1 billion for advertising Binance. This was done by people who claim they suffered losses by buying unregistered securities that the sports star was promoting.
Meanwhile, the BTC/USD chart shows signs that demand forces are losing confidence, although the price is moving within an ascending channel (shown in blue).
Notice that the November 29 top was only a few dollars higher than the previous November 24 top. This short-term excess suggests that there is no sustainable predominance of demand over supply in the market around the level of $38 thousand per Bitcoin, and the top on November 29 is nothing more than a bull trap.
In such conditions, perhaps more attention should be paid to the idea of testing the lower boundary of the current channel.
To benefit from the rise and fall in the price of crypto assets, consider enlisting the services of a trusted broker like FXOpen.
CFDs are complex instruments and come with a high risk of losing your money.
This article represents the opinion of the Companies operating under the FXOpen brand only. It is not to be construed as an offer, solicitation, or recommendation with respect to products and services provided by the Companies operating under the FXOpen brand, nor is it to be considered financial advice.
At FXOpen UK and FXOpen AU, Cryptocurrency CFDs are only available for trading by those clients categorised as Professional clients under FCA Rules and Professional clients under ASIC Rules, respectively. They are not available for trading by Retail clients.
#marketanalysis #MarketNews #stockmarket #stocktrading
Market Analysis: Stock Market Reaction to US GDP News
According to data released yesterday, the US economy is growing at a stronger pace than expected. Thus, US GDP in the 3rd quarter increased by 5.3% in annual terms (an increase of 4.9% was expected).
Combined with softening rhetoric from the Federal Reserve, this is a positive signal for US stock markets, which have shown impressive performance: in November, the S&P 500 and Nasdaq Composite indices rose by 8.5% and 11%, respectively (the final figure will be known later, since today – last day of the month), which is the best month since July 2022.
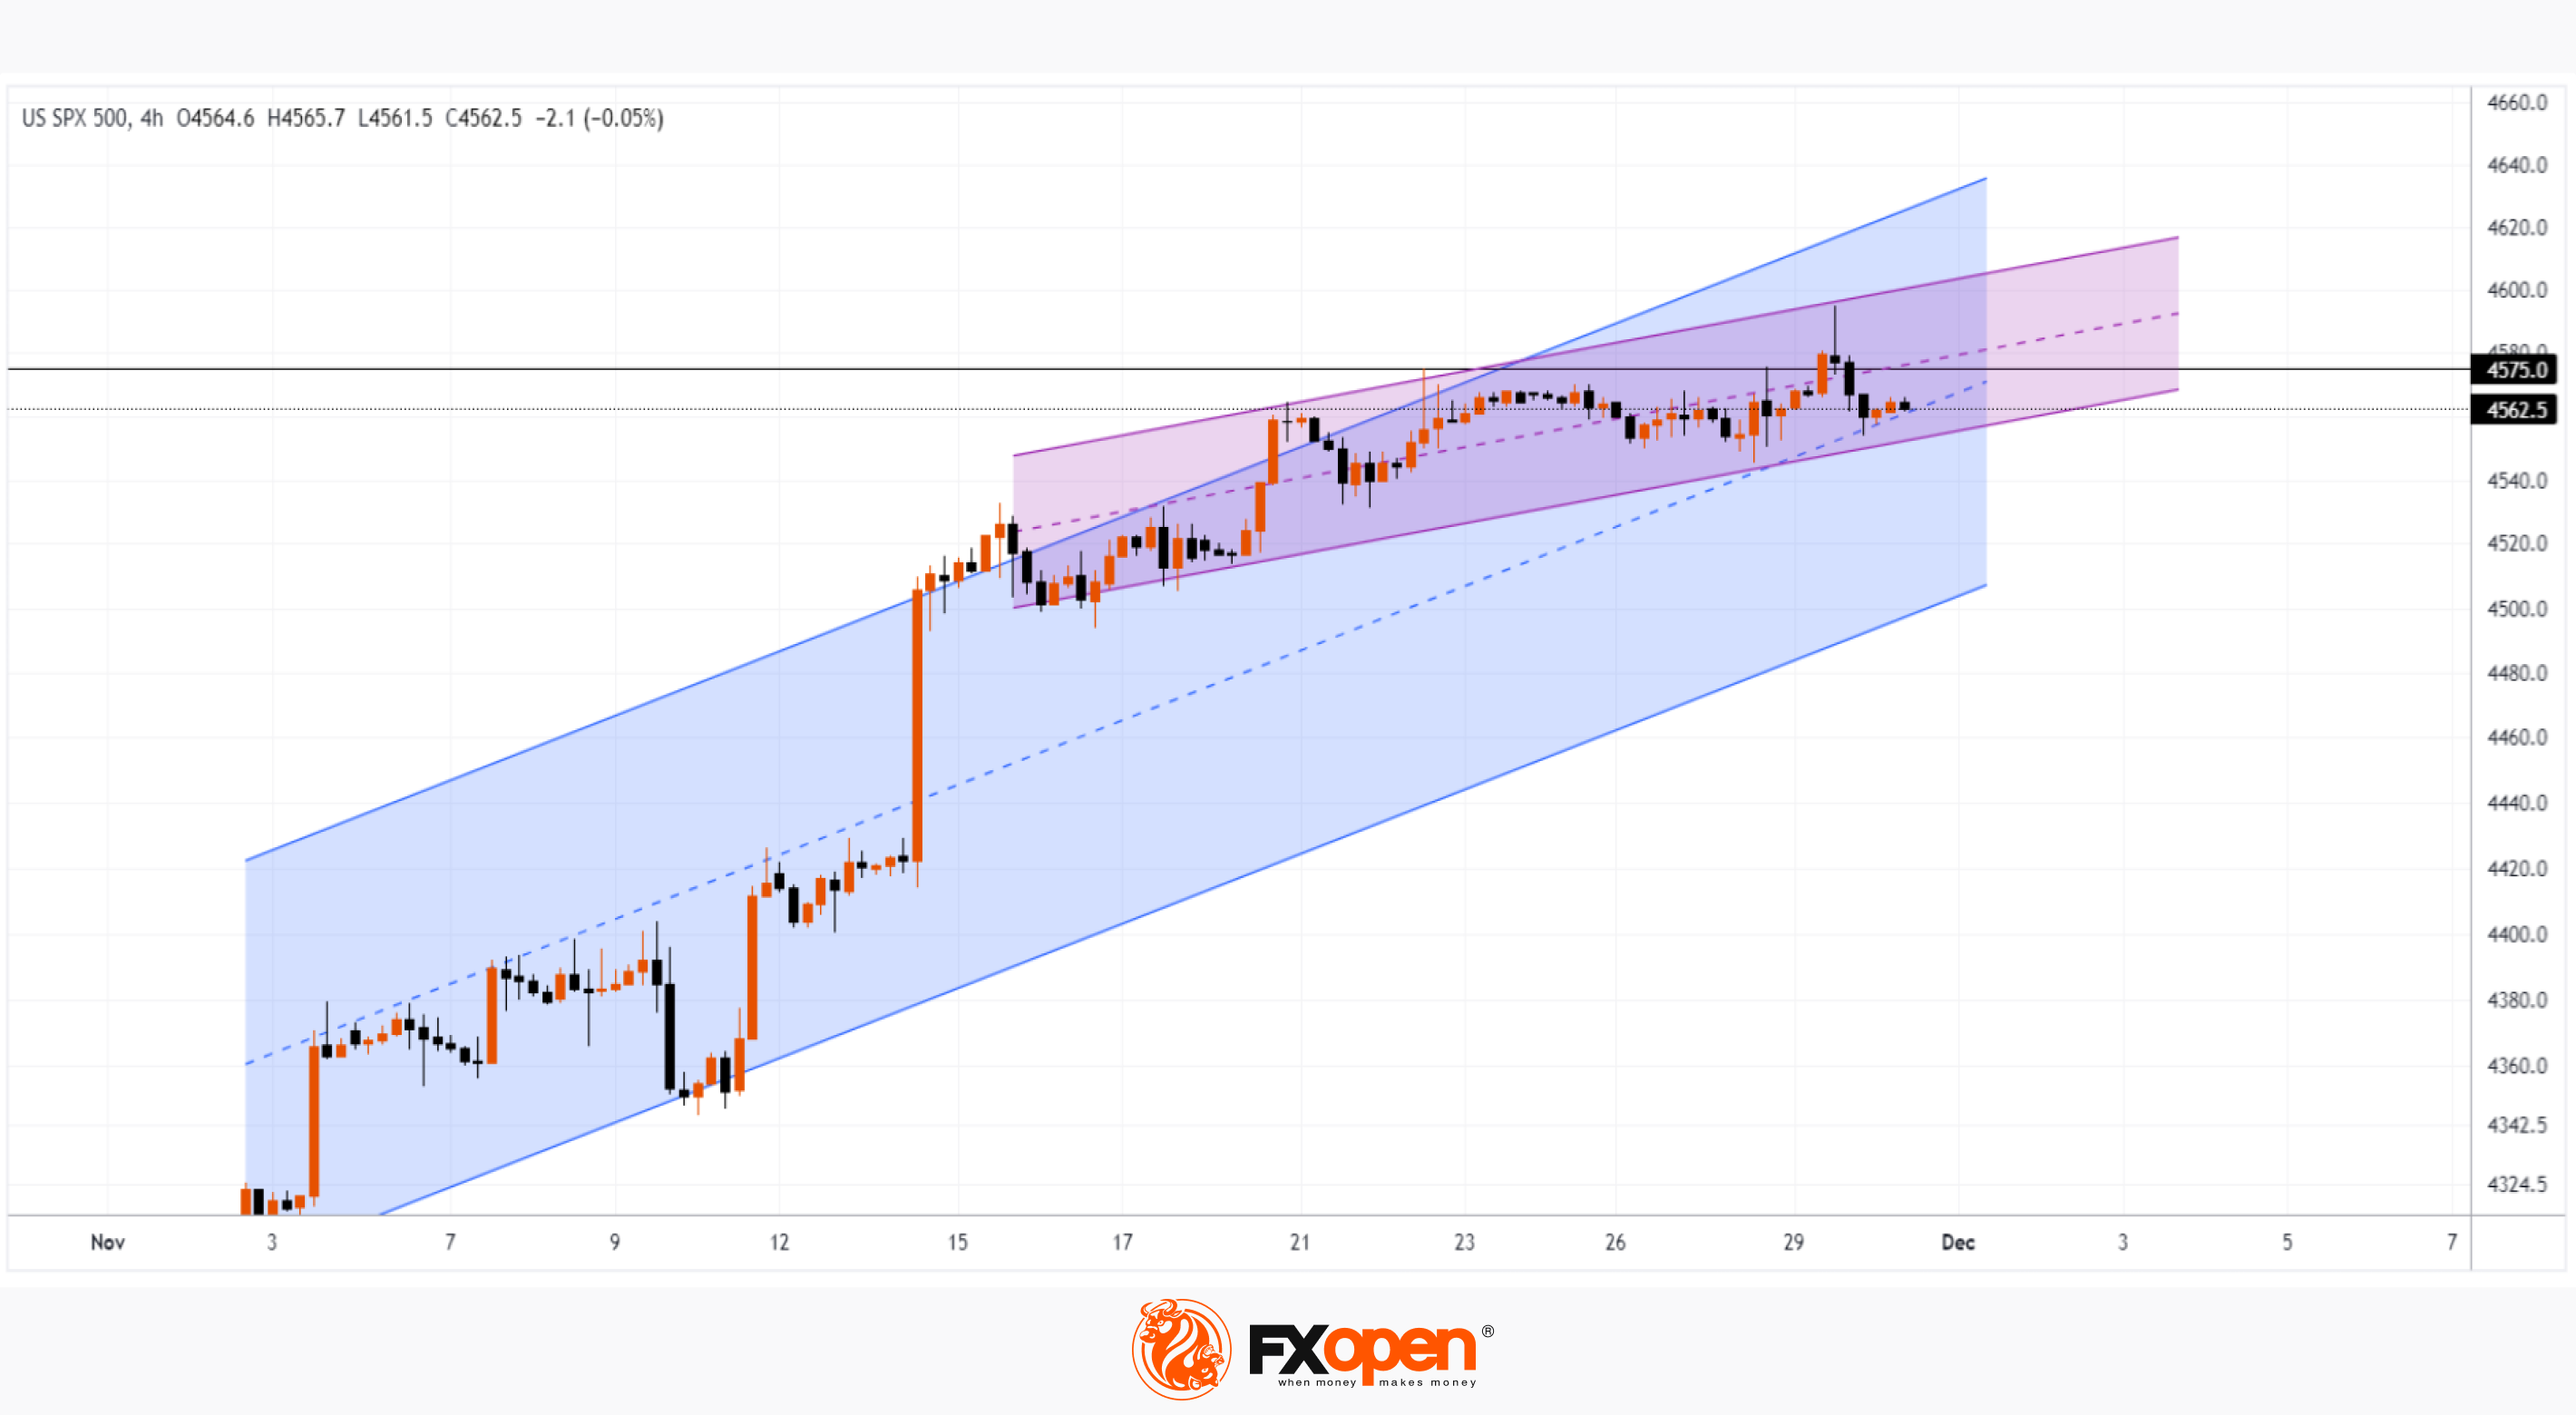
Against the background of this news, the S&P 500 index yesterday rose closer to the highs of the year. However, the chart shows that the November rally may not continue into December. Note:
→ Most of November's progress was achieved in the first half of the month. In the second half, growth slowed down, as evidenced by the change in the angle of inclination of the purple channel relative to the blue channel.
→ Level 4,575 effectively provides resistance.
→ After the formation of yesterday’s top (against the backdrop of news), sellers were able to sharply lower the price - thus forming a false breakout of the 4575 level.
Of course, the upward trend has not yet been formally broken - the market may find support from the median line of the ascending channel and then try to set the year's high for the S&P 500. But it seems that the price is already taking into account all possible positive influence factors. And if any negative factors arrive, this will lead to a correction in November growth.
By the way, JP Morgan analysts released their forecast that the price of the S&P 500 will fall to 4200 next year amid a “challenging macroeconomic backdrop.”
To benefit from stock market trends in the US and other countries, consider enlisting the services of a trusted broker like FXOpen.
CFDs are complex instruments and come with a high risk of losing your money.
This article represents the opinion of the Companies operating under the FXOpen brand only. It is not to be construed as an offer, solicitation, or recommendation with respect to products and services provided by the Companies operating under the FXOpen brand, nor is it to be considered financial advice.
Market Analysis: Stock Market Reaction to US GDP News
According to data released yesterday, the US economy is growing at a stronger pace than expected. Thus, US GDP in the 3rd quarter increased by 5.3% in annual terms (an increase of 4.9% was expected).
Combined with softening rhetoric from the Federal Reserve, this is a positive signal for US stock markets, which have shown impressive performance: in November, the S&P 500 and Nasdaq Composite indices rose by 8.5% and 11%, respectively (the final figure will be known later, since today – last day of the month), which is the best month since July 2022.
Against the background of this news, the S&P 500 index yesterday rose closer to the highs of the year. However, the chart shows that the November rally may not continue into December. Note:
→ Most of November's progress was achieved in the first half of the month. In the second half, growth slowed down, as evidenced by the change in the angle of inclination of the purple channel relative to the blue channel.
→ Level 4,575 effectively provides resistance.
→ After the formation of yesterday’s top (against the backdrop of news), sellers were able to sharply lower the price - thus forming a false breakout of the 4575 level.
Of course, the upward trend has not yet been formally broken - the market may find support from the median line of the ascending channel and then try to set the year's high for the S&P 500. But it seems that the price is already taking into account all possible positive influence factors. And if any negative factors arrive, this will lead to a correction in November growth.
By the way, JP Morgan analysts released their forecast that the price of the S&P 500 will fall to 4200 next year amid a “challenging macroeconomic backdrop.”
To benefit from stock market trends in the US and other countries, consider enlisting the services of a trusted broker like FXOpen.
CFDs are complex instruments and come with a high risk of losing your money.
This article represents the opinion of the Companies operating under the FXOpen brand only. It is not to be construed as an offer, solicitation, or recommendation with respect to products and services provided by the Companies operating under the FXOpen brand, nor is it to be considered financial advice.
#tradingforex #forextrading
FXOpen is happy to announce FXOpen TickTrader - Catch ZERO Spreads Contest - Season 15.
How to take part?
You have to catch a ZERO spreads screenshot and submit it by posting your entry into the contest thread on the forum. Note that the screenshot must be of a TickTrader terminal. The screenshot must also be shared via any social network and the sharing link given below the screenshot.
TickTrader is a brand new trading platform which allows clients to trade five of the most popular asset classes — forex, stocks, commodities, indices, and cryptocurrencies — via one trading account.
🔗 Learn more: https://cutt.ly/zwORCm2i
To take advantage of price fluctuations in the foreign exchange markets, consider enlisting the services of a reliable broker like FXOpen.
⚠️
This forecast represents FXOpen Companies opinion only, it should not be construed as an offer, invitation or recommendation in respect to FXOpen Companies products and services or as financial advice
FXOpen is happy to announce FXOpen TickTrader - Catch ZERO Spreads Contest - Season 15.
How to take part?
You have to catch a ZERO spreads screenshot and submit it by posting your entry into the contest thread on the forum. Note that the screenshot must be of a TickTrader terminal. The screenshot must also be shared via any social network and the sharing link given below the screenshot.
TickTrader is a brand new trading platform which allows clients to trade five of the most popular asset classes — forex, stocks, commodities, indices, and cryptocurrencies — via one trading account.
🔗 Learn more: https://cutt.ly/zwORCm2i
To take advantage of price fluctuations in the foreign exchange markets, consider enlisting the services of a reliable broker like FXOpen.
⚠️
This forecast represents FXOpen Companies opinion only, it should not be construed as an offer, invitation or recommendation in respect to FXOpen Companies products and services or as financial advice
Forex Game ☑️ Forex Demo Contests 2023 and Free Trading Competitions
FXOpen is happy to announce FXOpen TickTrader - Catch ZERO Spreads Contest - Season 15.
Dear Forex traders,
FXOpen is happy to announce FXOpen TickTrader - Catch ZERO Spreads Contest - Season 15.
How to take part?
You have to catch a ZERO spreads screenshot and submit it by posting your entry into the contest thread on the forum. Note…
FXOpen is happy to announce FXOpen TickTrader - Catch ZERO Spreads Contest - Season 15.
How to take part?
You have to catch a ZERO spreads screenshot and submit it by posting your entry into the contest thread on the forum. Note…
#marketanalysis #MarketNews #tradingforex
Market Analysis: The USD/CAD Rate Drops to Its Minimum of 2 Months
This morning, 1 USD was selling for less than 1.354 Canadian dollars – for the first time since October 1st.
The strengthening of the Canadian dollar and the weakening of the USD was facilitated by the news published yesterday:
→ Canada's real gross domestic product (GDP) grew by 0.1% in September, which exceeded analysts' expectations and reduced the relevance of the recession scenario in Canada.
→ The number of applications for unemployment benefits in the US for the week amounted to 218k (a week earlier it was 211k), which may indicate a cooling of the US economy.
→ The price index for personal consumption expenditures (PCE) fell to 3% from the previous value of 3.4%. While 3% remains too high to declare victory over inflation, it marks a new series low that is sure to reduce the likelihood of a Fed rate hike.
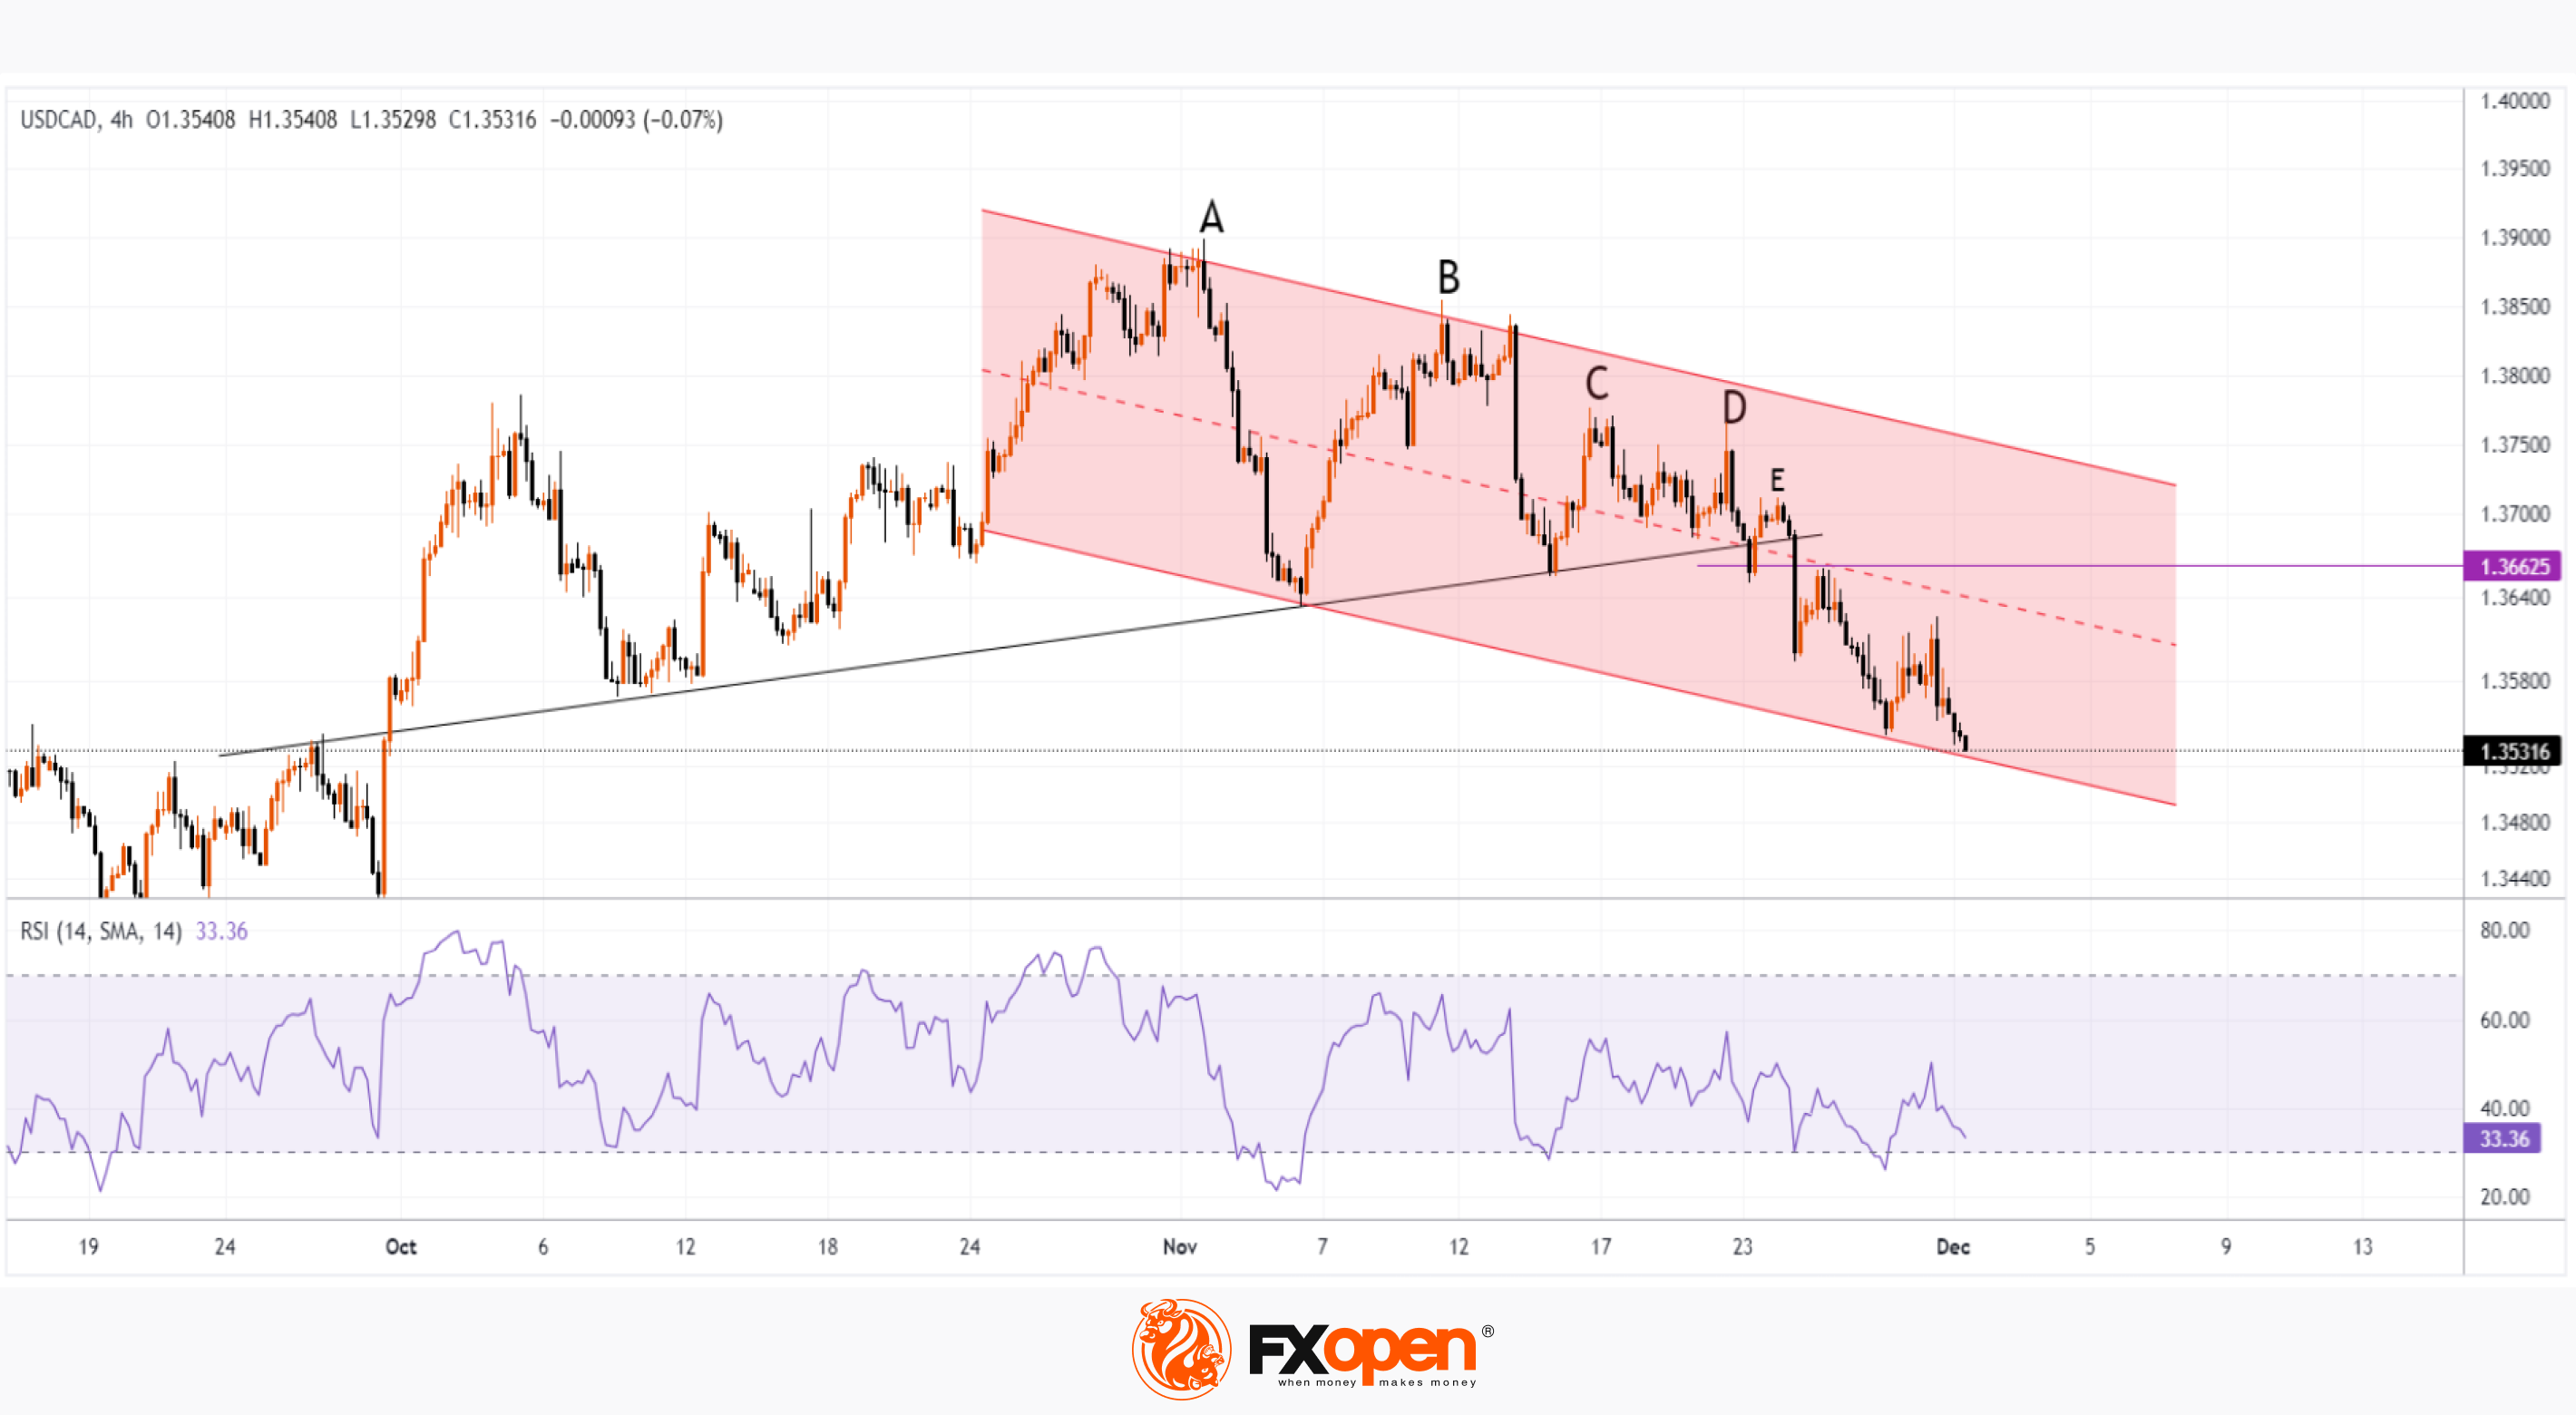
In our previous analysis of the USD/CAD market, we wrote that the price could form a rebound from support in the area of 1.36625. However, the rebound to point E was very weak, and after the breakdown, the level 1.36625 showed resistance properties.
At the same time, the situation on the chart looks bearish:
→ price dynamics formed decreasing lows A-B-C-D;
→ the bullish trend line (shown in black) is broken;
→ price dynamics form new lows and a downward channel (shown in red).
If we assume that the market will recover from oversold conditions (the RSI indicator is close to going below the 0.3 level), the USD/CAD rate in this case may find resistance from the median line of the channel and the level of 1.36625.
To benefit from price fluctuations in the foreign exchange market, consider enlisting the services of a trusted broker like FXOpen.
CFDs are complex instruments and come with a high risk of losing your money.
This article represents the opinion of the Companies operating under the FXOpen brand only. It is not to be construed as an offer, solicitation, or recommendation with respect to products and services provided by the Companies operating under the FXOpen brand, nor is it to be considered financial advice.
Market Analysis: The USD/CAD Rate Drops to Its Minimum of 2 Months
This morning, 1 USD was selling for less than 1.354 Canadian dollars – for the first time since October 1st.
The strengthening of the Canadian dollar and the weakening of the USD was facilitated by the news published yesterday:
→ Canada's real gross domestic product (GDP) grew by 0.1% in September, which exceeded analysts' expectations and reduced the relevance of the recession scenario in Canada.
→ The number of applications for unemployment benefits in the US for the week amounted to 218k (a week earlier it was 211k), which may indicate a cooling of the US economy.
→ The price index for personal consumption expenditures (PCE) fell to 3% from the previous value of 3.4%. While 3% remains too high to declare victory over inflation, it marks a new series low that is sure to reduce the likelihood of a Fed rate hike.
In our previous analysis of the USD/CAD market, we wrote that the price could form a rebound from support in the area of 1.36625. However, the rebound to point E was very weak, and after the breakdown, the level 1.36625 showed resistance properties.
At the same time, the situation on the chart looks bearish:
→ price dynamics formed decreasing lows A-B-C-D;
→ the bullish trend line (shown in black) is broken;
→ price dynamics form new lows and a downward channel (shown in red).
If we assume that the market will recover from oversold conditions (the RSI indicator is close to going below the 0.3 level), the USD/CAD rate in this case may find resistance from the median line of the channel and the level of 1.36625.
To benefit from price fluctuations in the foreign exchange market, consider enlisting the services of a trusted broker like FXOpen.
CFDs are complex instruments and come with a high risk of losing your money.
This article represents the opinion of the Companies operating under the FXOpen brand only. It is not to be construed as an offer, solicitation, or recommendation with respect to products and services provided by the Companies operating under the FXOpen brand, nor is it to be considered financial advice.
#marketanalysis #stockmarket #MarketNews
Market Analysis: UK100 Shows Bullish Signs
On the morning of Friday, December 1, the UK stock market index rose to its November highs. This was facilitated by the fundamental background:
→ among the UK100 growth leaders are shares of companies mining ore and other resources. As metal prices rise and industry in China shows signs of recovery;
→ general sentiment on the world's stock markets due to the fact that the policy of raising rates pursued by the central banks of Western countries has come to an end. Fed Chairman Powell is expected to speak this evening, which could provide more evidence of this.
→ Since the UK100 index has performed weaker relative to other indices (due to higher inflation in the UK), it may be undervalued.
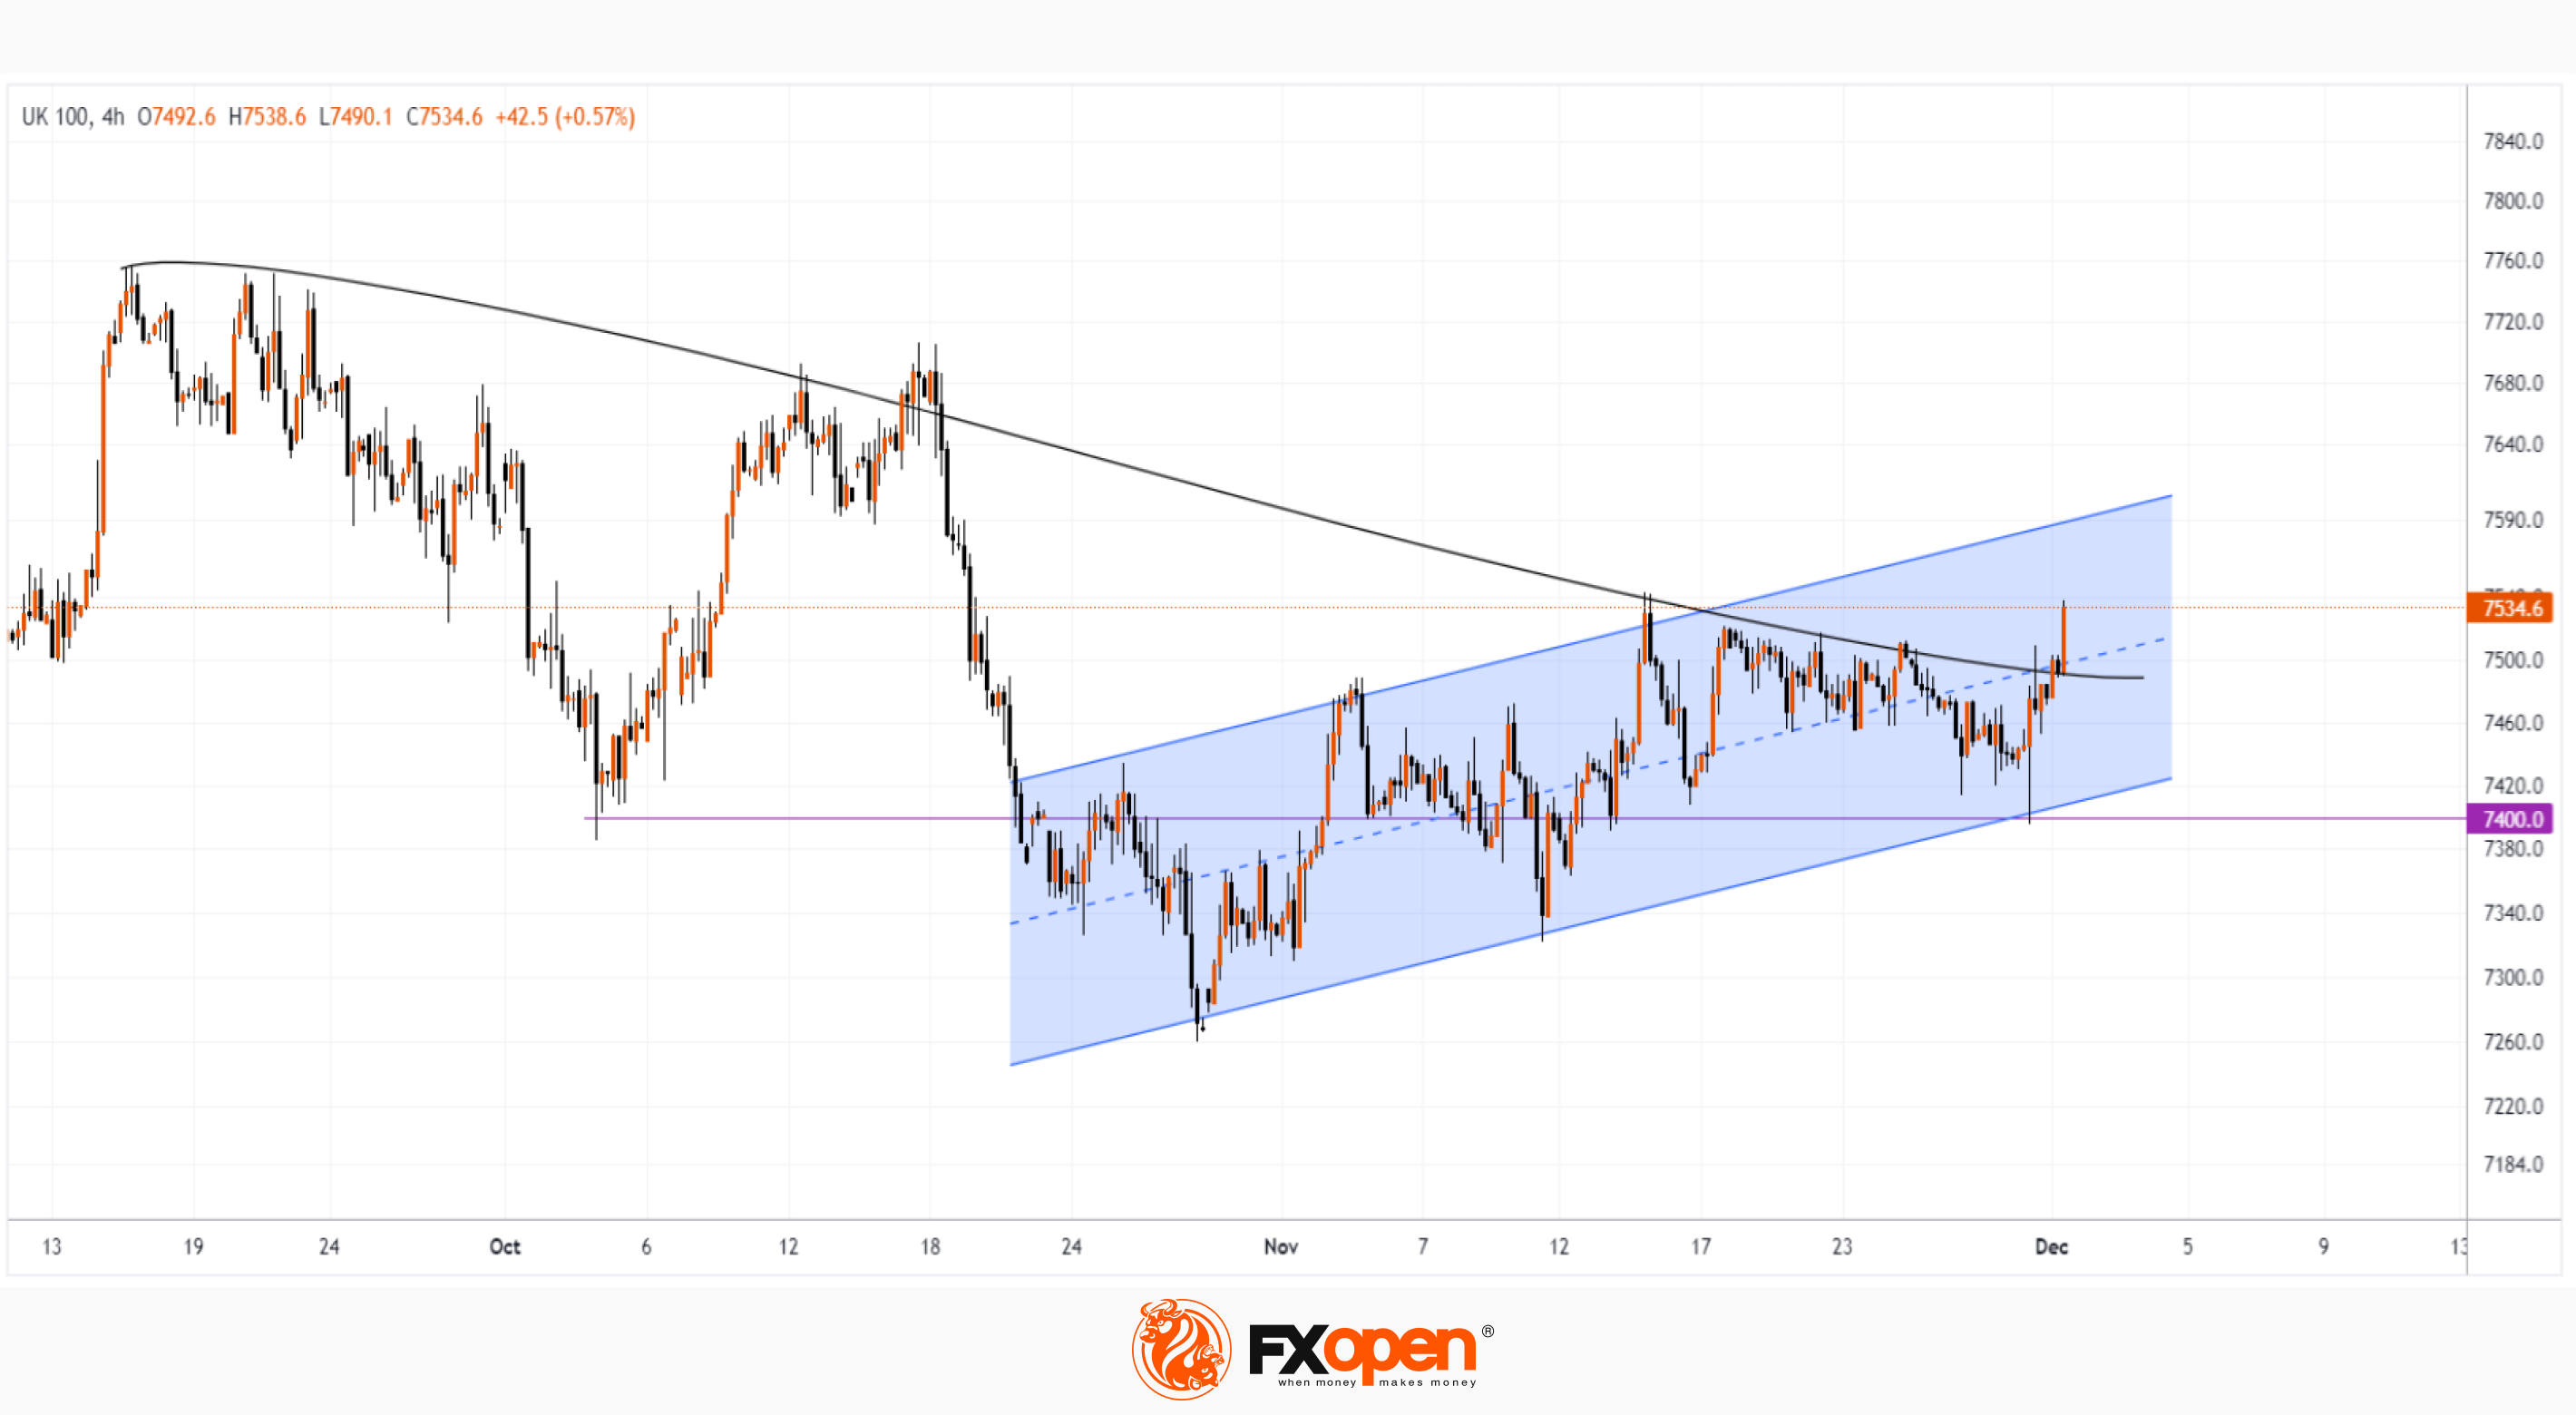
The UK100 Index chart shows signs of bullish activity:
→ on the last day of November, the price tested the psychological level of 7400, forming a long lower shadow (a sign of demand strength);
→ the price continues to develop dynamics within the November ascending channel (shown in blue). It is possible that in December we will see the price rise to its upper limit.
→ a breakdown of the black line, dating back to September, may confirm important changes in market sentiment.
To benefit from fluctuations in the world's stock markets, consider enlisting the services of a trusted broker like FXOpen.
CFDs are complex instruments and come with a high risk of losing your money.
This article represents the opinion of the Companies operating under the FXOpen brand only. It is not to be construed as an offer, solicitation, or recommendation with respect to products and services provided by the Companies operating under the FXOpen brand, nor is it to be considered financial advice.
Market Analysis: UK100 Shows Bullish Signs
On the morning of Friday, December 1, the UK stock market index rose to its November highs. This was facilitated by the fundamental background:
→ among the UK100 growth leaders are shares of companies mining ore and other resources. As metal prices rise and industry in China shows signs of recovery;
→ general sentiment on the world's stock markets due to the fact that the policy of raising rates pursued by the central banks of Western countries has come to an end. Fed Chairman Powell is expected to speak this evening, which could provide more evidence of this.
→ Since the UK100 index has performed weaker relative to other indices (due to higher inflation in the UK), it may be undervalued.
The UK100 Index chart shows signs of bullish activity:
→ on the last day of November, the price tested the psychological level of 7400, forming a long lower shadow (a sign of demand strength);
→ the price continues to develop dynamics within the November ascending channel (shown in blue). It is possible that in December we will see the price rise to its upper limit.
→ a breakdown of the black line, dating back to September, may confirm important changes in market sentiment.
To benefit from fluctuations in the world's stock markets, consider enlisting the services of a trusted broker like FXOpen.
CFDs are complex instruments and come with a high risk of losing your money.
This article represents the opinion of the Companies operating under the FXOpen brand only. It is not to be construed as an offer, solicitation, or recommendation with respect to products and services provided by the Companies operating under the FXOpen brand, nor is it to be considered financial advice.
#oilprices #opec #gasprices #currencymarket #marketnews
Weekly Market Wrap With Gary Thomson: EUROPEAN CURRENCIES, US GDP NEWS, OPEC+, NATURAL GAS PRICES
Get the latest scoop on the week's hottest headlines, all in one convenient video. Join Gary Thomson, the COO of -FXOpen UK, as he breaks down the most significant news reports and shares his expert insights.
🔸 European Currencies at Strategic Levels
🔸 Stock Market Reaction to US GDP News
🔸 Today OPEC+ May Announce New Oil Production Cuts
🔸 Natural Gas Prices Fall to More than 2-month Lows
Stay in the know and empower yourself with our short, yet power-packed video. Watch it now and stay updated with FXOpen.
Don't miss out on this invaluable opportunity to sharpen your trading skills and make informed decisions.
https://www.youtube.com/watch?v=FOdY5ttoS2U
To take advantage of price fluctuations in the foreign exchange markets, consider enlisting the services of a reliable broker like FXOpen.
⚠️
This forecast represents FXOpen Companies opinion only, it should not be construed as an offer, invitation or recommendation in respect to FXOpen Companies products and services or as financial advice
Weekly Market Wrap With Gary Thomson: EUROPEAN CURRENCIES, US GDP NEWS, OPEC+, NATURAL GAS PRICES
Get the latest scoop on the week's hottest headlines, all in one convenient video. Join Gary Thomson, the COO of -FXOpen UK, as he breaks down the most significant news reports and shares his expert insights.
🔸 European Currencies at Strategic Levels
🔸 Stock Market Reaction to US GDP News
🔸 Today OPEC+ May Announce New Oil Production Cuts
🔸 Natural Gas Prices Fall to More than 2-month Lows
Stay in the know and empower yourself with our short, yet power-packed video. Watch it now and stay updated with FXOpen.
Don't miss out on this invaluable opportunity to sharpen your trading skills and make informed decisions.
https://www.youtube.com/watch?v=FOdY5ttoS2U
To take advantage of price fluctuations in the foreign exchange markets, consider enlisting the services of a reliable broker like FXOpen.
⚠️
This forecast represents FXOpen Companies opinion only, it should not be construed as an offer, invitation or recommendation in respect to FXOpen Companies products and services or as financial advice
YouTube
Weekly Market Wrap With Gary Thomson: EUROPEAN CURRENCIES, US GDP NEWS, OPEC+, NATURAL GAS PRICES
Get the latest scoop on the week's hottest headlines, all in one convenient video. Join Gary Thomson, the COO of FXOpen UK, as he breaks down the most significant news reports and shares his expert insights.
- European Currencies at Strategic Levels #EUROCurrencies…
- European Currencies at Strategic Levels #EUROCurrencies…
#marketanalysis #bitcoin #bitcoinprice #BTCUSD
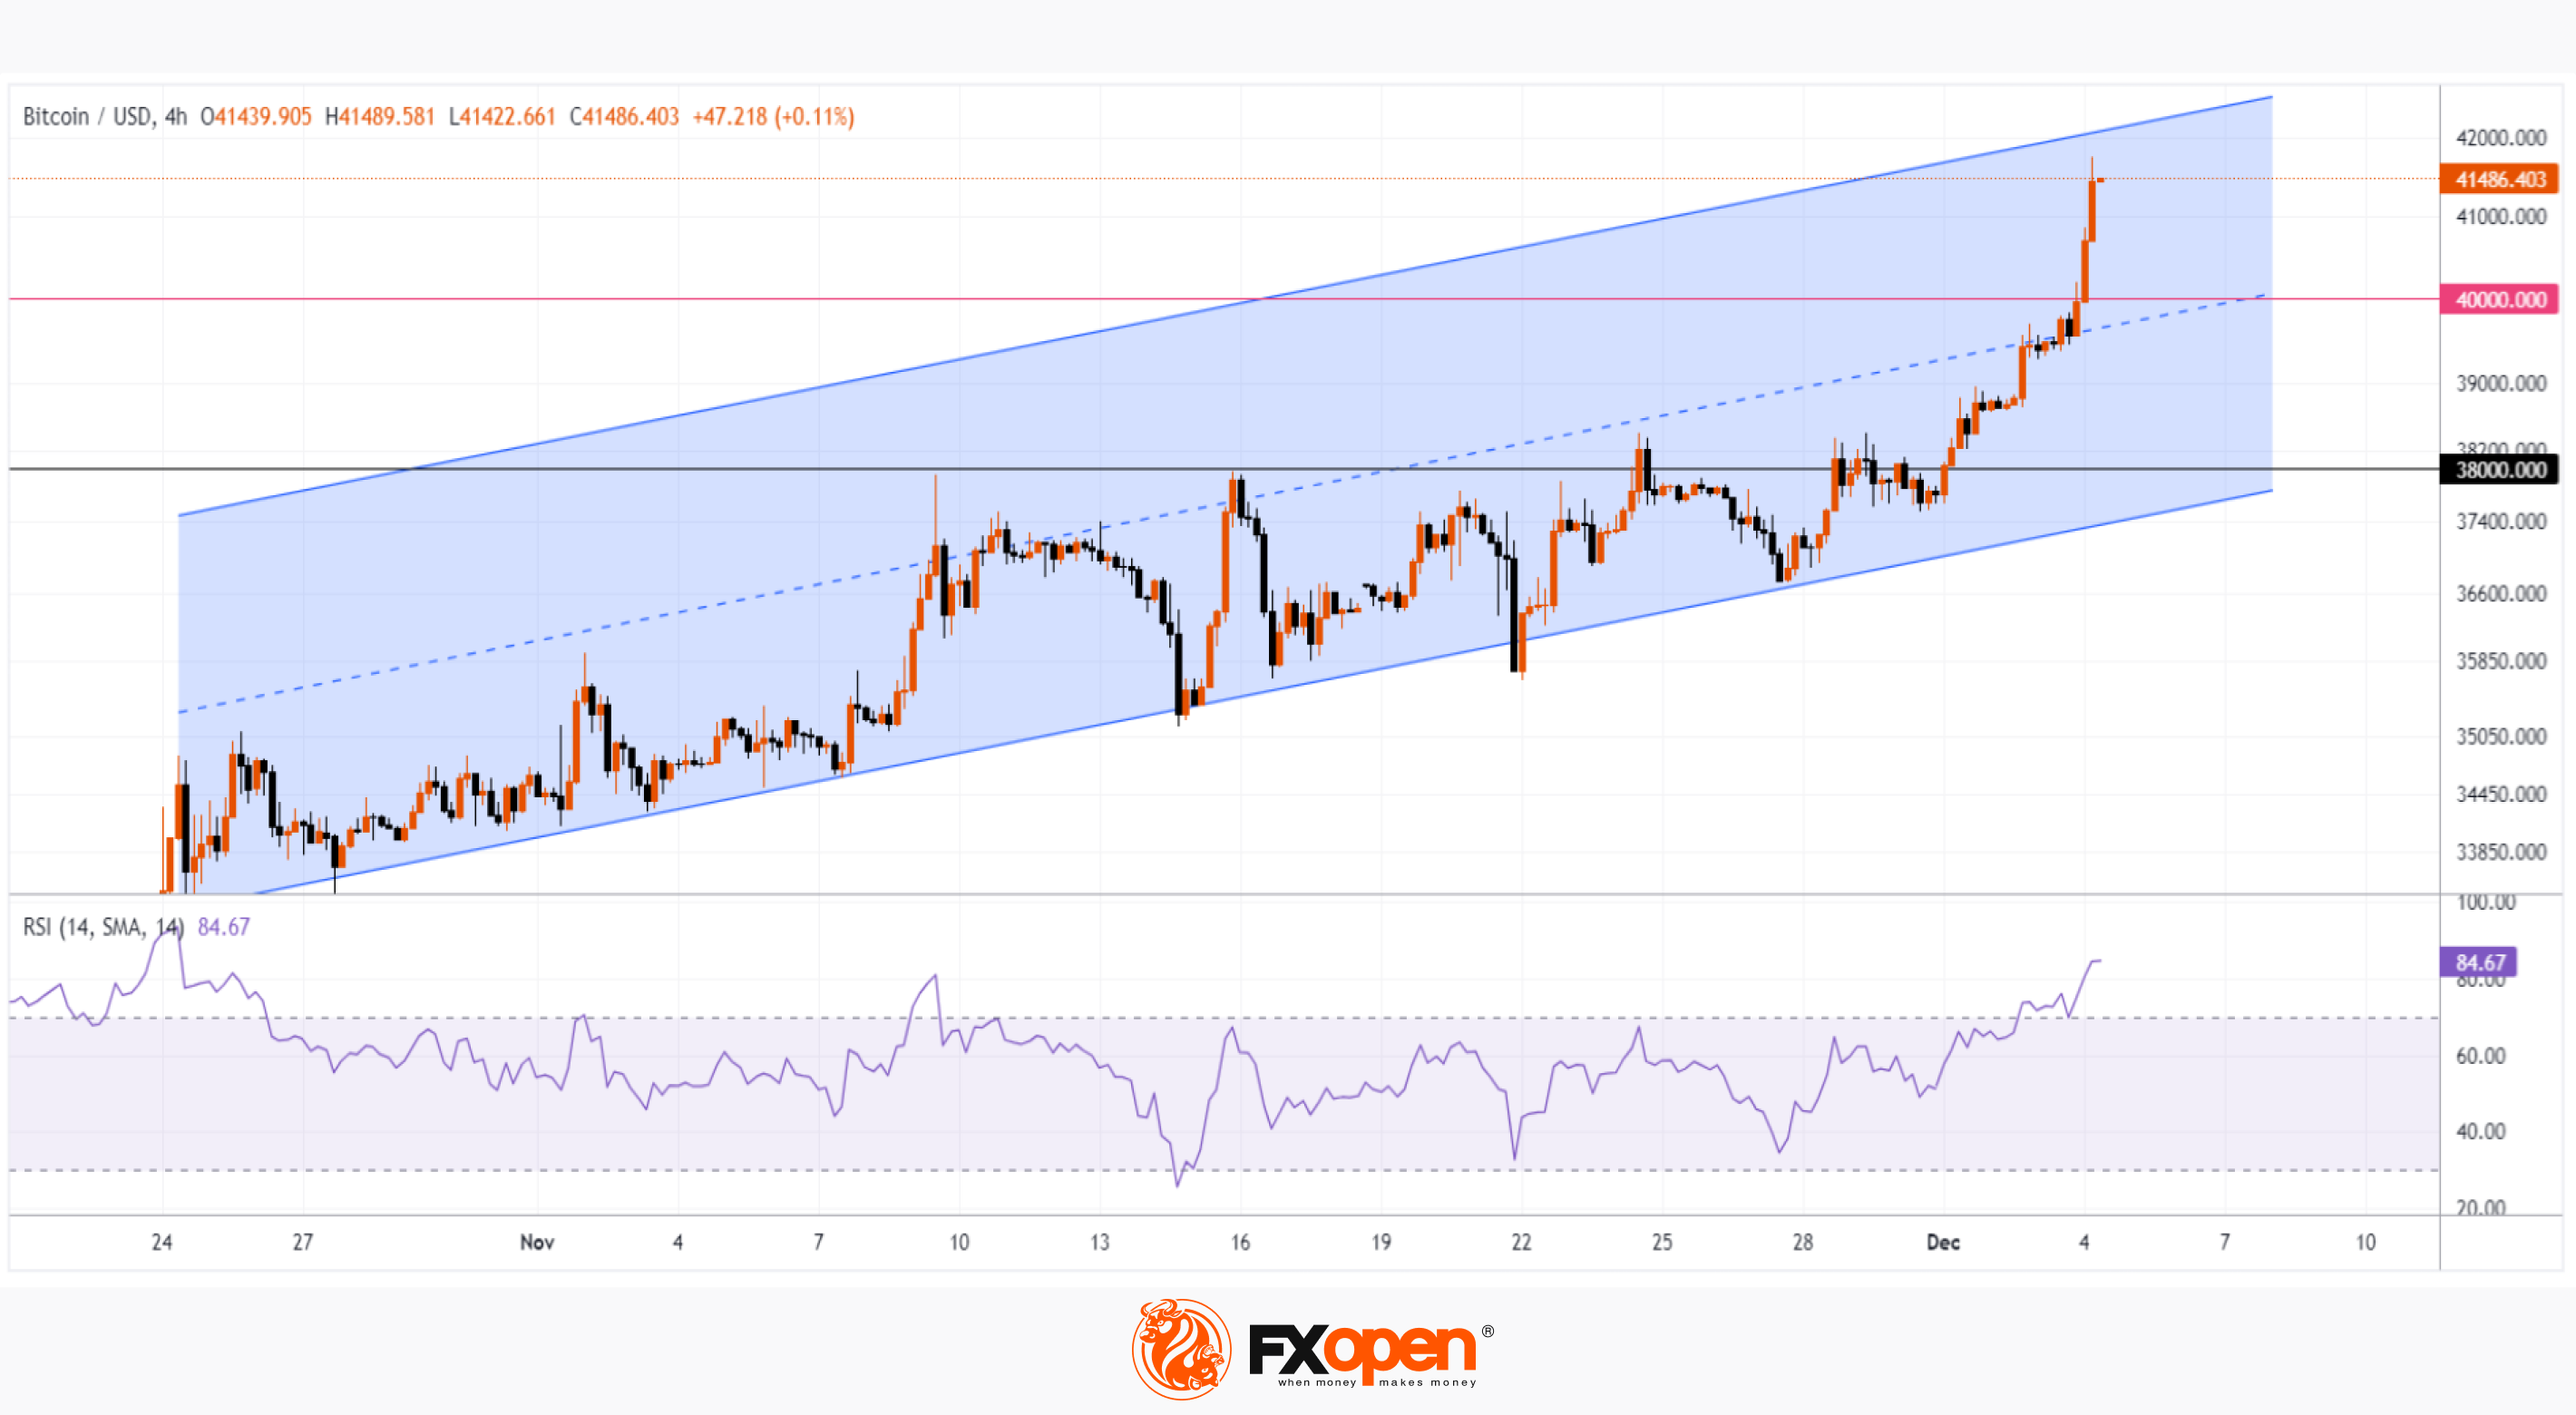
Market Analysis: Bitcoin Surpasses $40,000 Per Coin
December begins extremely optimistically for the cryptocurrency market, resembling:
→ December 2020, when bitcoin grew by 46.9%;
→ December 2017, when bitcoin grew by 38.9%;
→ December 2016, when bitcoin grew by 30.8%.
If there are psychological patterns in the increase in demand on the eve of the holidays, then perhaps they come into force, since on the morning of December 4, the price of Bitcoin exceeded the psychological barrier of 40k and reached 41,700 per coin — for the first time since April 2022.
Fundamentally, demand is based on expectations of the approval of several Bitcoin ETFs. The fear and greed index reached a value of 74, indicating growing greed. Another driver is expectations of Fed rate cuts, which leads to more affordable loans and, accordingly, increased demand for risky assets.
Technically, the price was in a consolidation zone in November. Buyers overcame resistance around the level of 38,000. The pressure of demand is evidenced by growing lows. When the resistance was behind, buyers did not encounter any tangible obstacles, which is noticeable in the width of the bullish candles.
Presumably, the price of bitcoin may consolidate near the upper boundary of the parallel channel — bulls will be motivated to take profits. But buying bitcoin now may mean trying to jump on a ship that has sailed away too far.
It is acceptable to assume that the market is in an overbought state, judging by the readings of the RSI indicator. Therefore, it is possible that the price of bitcoin may reach the upper limit of the channel and then correct.
To benefit from the rise and fall of cryptocurrency prices, consider enlisting the services of a trusted broker like FXOpen.
CFDs are complex instruments and come with a high risk of losing your money.
This article represents the opinion of the Companies operating under the FXOpen brand only. It is not to be construed as an offer, solicitation, or recommendation with respect to products and services provided by the Companies operating under the FXOpen brand, nor is it to be considered financial advice.
At FXOpen UK and FXOpen AU, Cryptocurrency CFDs are only available for trading by those clients categorised as Professional clients under FCA Rules and Professional clients under ASIC Rules, respectively. They are not available for trading by Retail clients.
Market Analysis: Bitcoin Surpasses $40,000 Per Coin
December begins extremely optimistically for the cryptocurrency market, resembling:
→ December 2020, when bitcoin grew by 46.9%;
→ December 2017, when bitcoin grew by 38.9%;
→ December 2016, when bitcoin grew by 30.8%.
If there are psychological patterns in the increase in demand on the eve of the holidays, then perhaps they come into force, since on the morning of December 4, the price of Bitcoin exceeded the psychological barrier of 40k and reached 41,700 per coin — for the first time since April 2022.
Fundamentally, demand is based on expectations of the approval of several Bitcoin ETFs. The fear and greed index reached a value of 74, indicating growing greed. Another driver is expectations of Fed rate cuts, which leads to more affordable loans and, accordingly, increased demand for risky assets.
Technically, the price was in a consolidation zone in November. Buyers overcame resistance around the level of 38,000. The pressure of demand is evidenced by growing lows. When the resistance was behind, buyers did not encounter any tangible obstacles, which is noticeable in the width of the bullish candles.
Presumably, the price of bitcoin may consolidate near the upper boundary of the parallel channel — bulls will be motivated to take profits. But buying bitcoin now may mean trying to jump on a ship that has sailed away too far.
It is acceptable to assume that the market is in an overbought state, judging by the readings of the RSI indicator. Therefore, it is possible that the price of bitcoin may reach the upper limit of the channel and then correct.
To benefit from the rise and fall of cryptocurrency prices, consider enlisting the services of a trusted broker like FXOpen.
CFDs are complex instruments and come with a high risk of losing your money.
This article represents the opinion of the Companies operating under the FXOpen brand only. It is not to be construed as an offer, solicitation, or recommendation with respect to products and services provided by the Companies operating under the FXOpen brand, nor is it to be considered financial advice.
At FXOpen UK and FXOpen AU, Cryptocurrency CFDs are only available for trading by those clients categorised as Professional clients under FCA Rules and Professional clients under ASIC Rules, respectively. They are not available for trading by Retail clients.
#marketanalysis #MarketNews #goldprice #XAUUSD
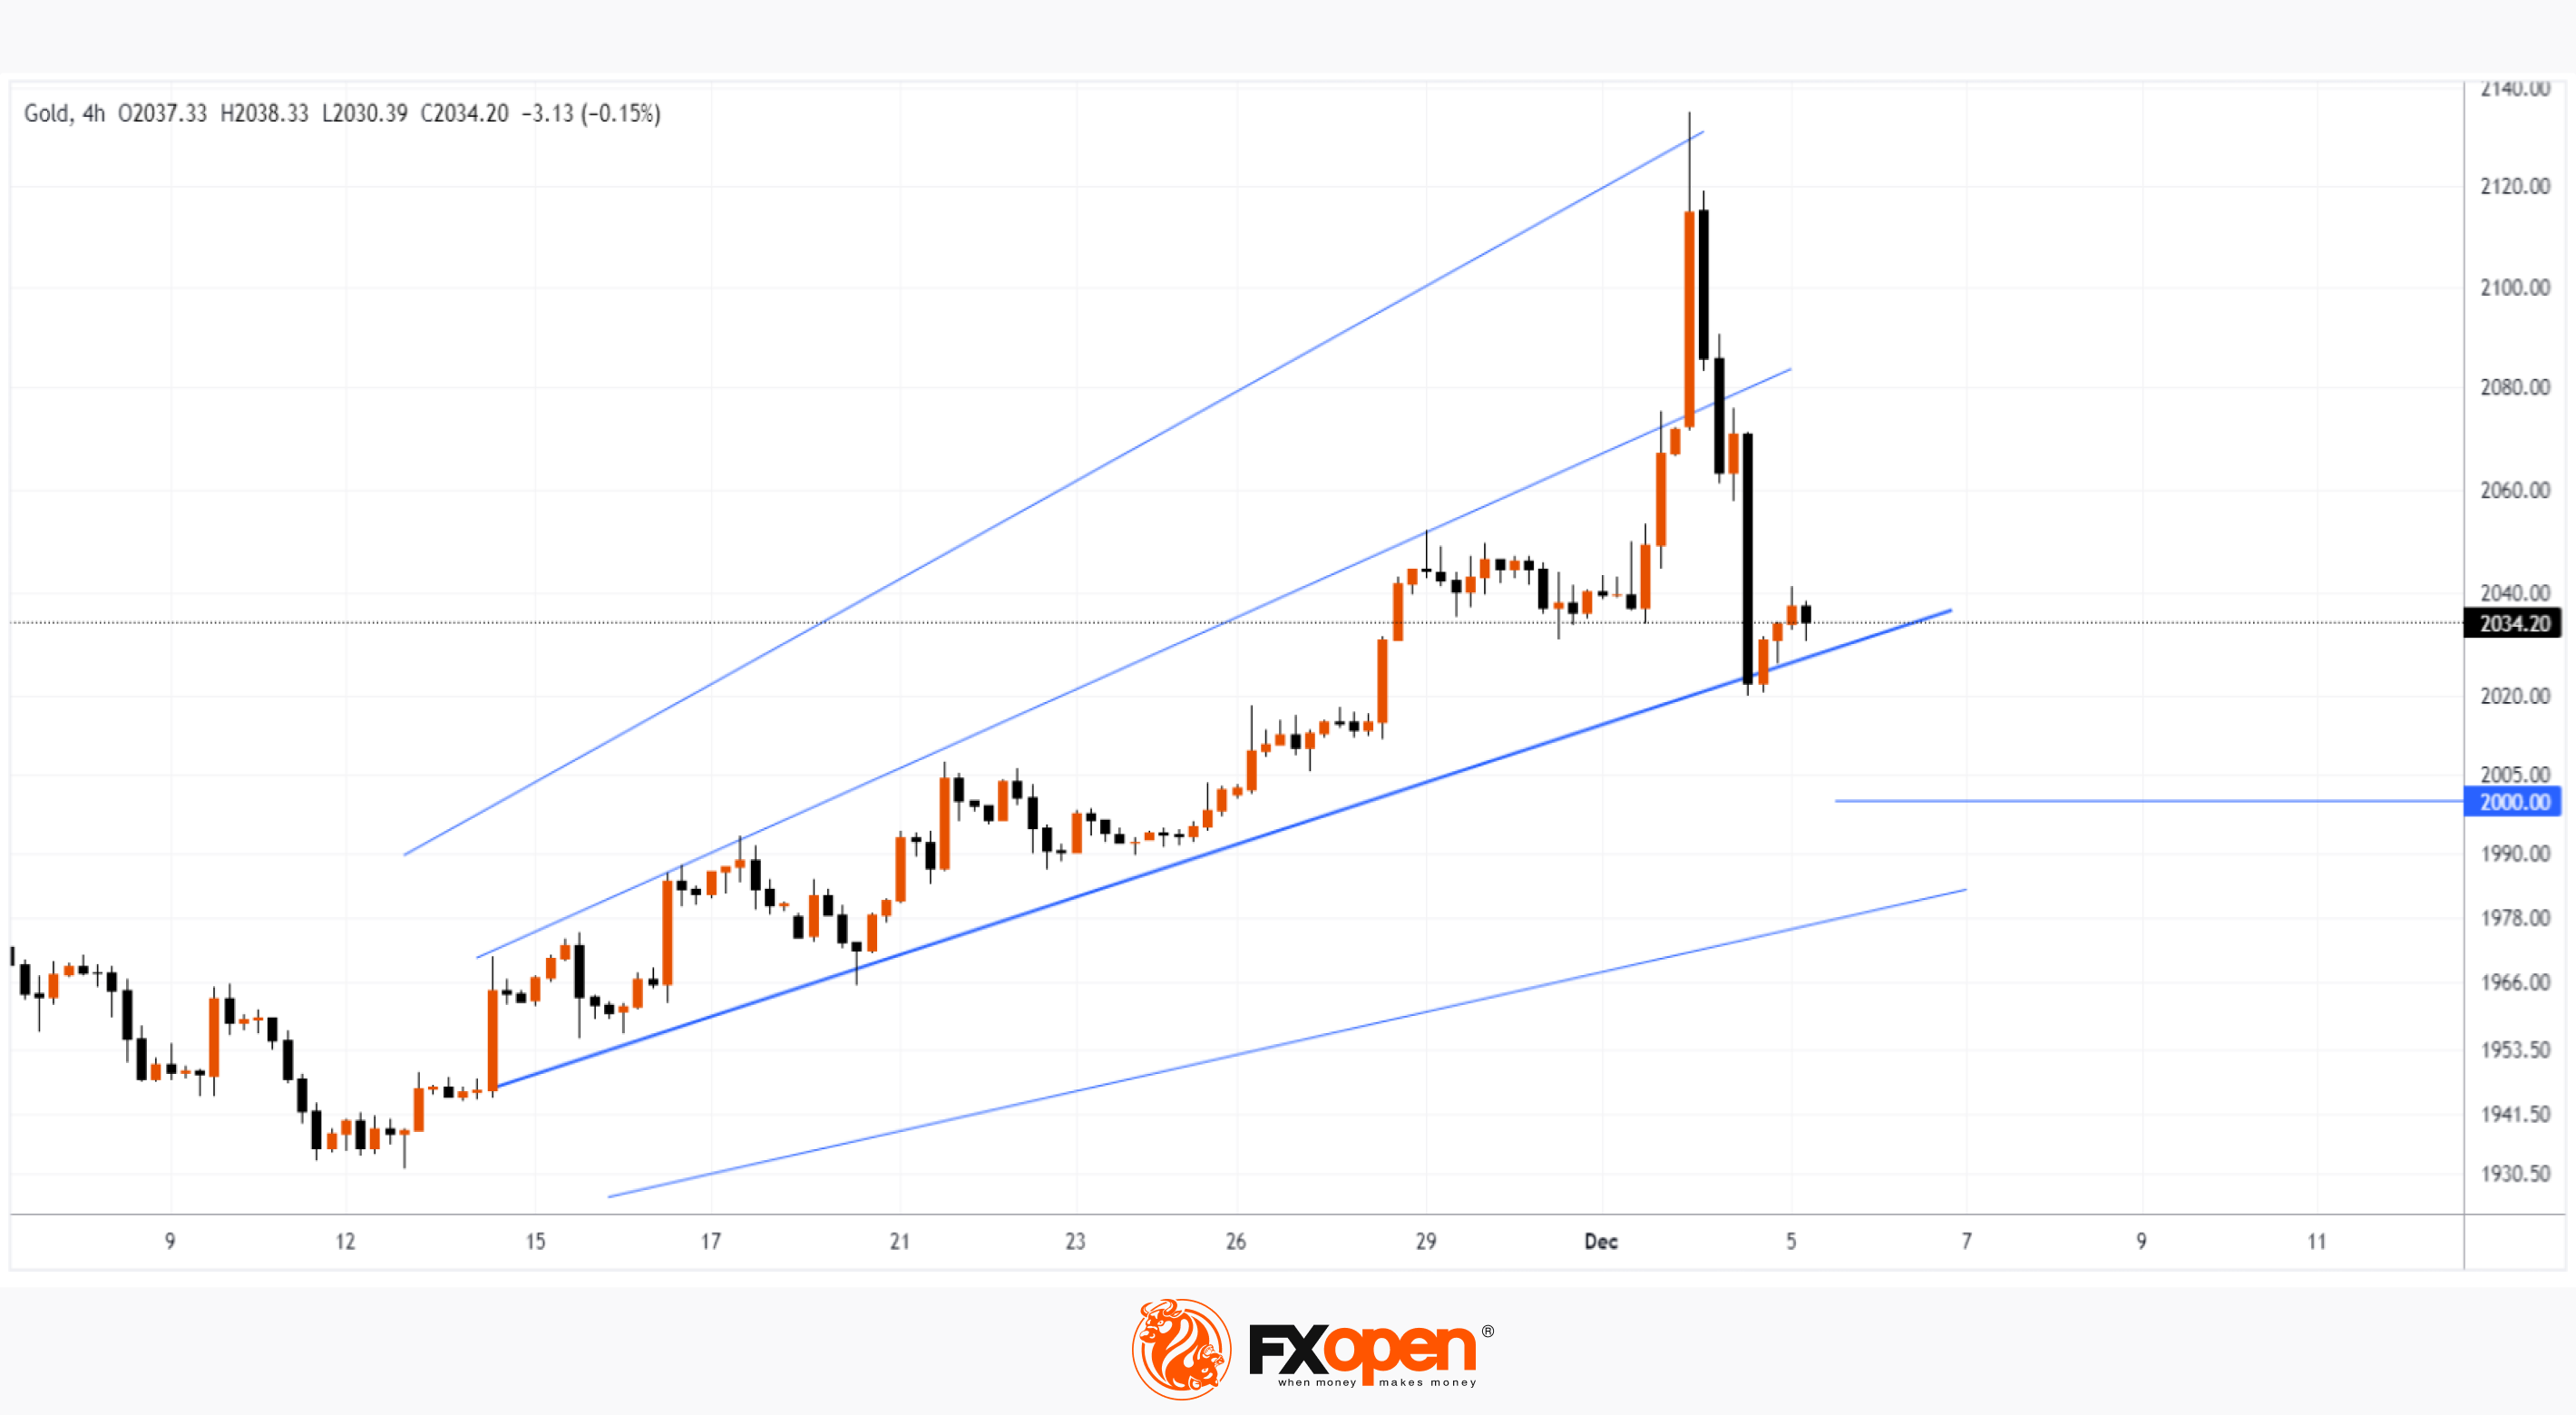
Market Analysis: Gold Falls from Record High by $100 in 1 Day
The record high of about USD 2,130 an ounce was set just after the weekend in low-liquid Asian markets. By the nature of the movement, it looked more like a cascading triggering of sellers’ stop losses, rather than finding a stable balance between supply and demand, since after the candle with a long upper tail, the quote began to fall. During the European session it fell to 2,060, and during the American session it fell to 2,030. So in less than a day, the price of gold fell about USD 100, making Monday's close further from the record top than Friday's close — essentially similar to a change in market sentiment, in which a bearish engulfing pattern is formed.
From a fundamental point of view, the gold market is influenced by:
→ Jerome Powell's words that expectations of a rate cut may be “premature”;
→ positioning traders at the beginning of the working week. Important news on the US labor market is expected on Friday.
From a technical point of view, the gold price chart has a structure of trend lines that resemble a Gann fan. The price found support near one of them (shown in double thickness), thereby stopping Monday's fall. It is possible that if the bounces from this line are weak, the downward momentum may resume. In this case, the bears may try to break through the psychological level of USD 2,000 to test the next line from the mentioned structure.
To benefit from the rise and fall of the gold price, consider enlisting the services of a trusted broker like FXOpen.
CFDs are complex instruments and come with a high risk of losing your money.
This article represents the opinion of the Companies operating under the FXOpen brand only. It is not to be construed as an offer, solicitation, or recommendation with respect to products and services provided by the Companies operating under the FXOpen brand, nor is it to be considered financial advice.
Market Analysis: Gold Falls from Record High by $100 in 1 Day
The record high of about USD 2,130 an ounce was set just after the weekend in low-liquid Asian markets. By the nature of the movement, it looked more like a cascading triggering of sellers’ stop losses, rather than finding a stable balance between supply and demand, since after the candle with a long upper tail, the quote began to fall. During the European session it fell to 2,060, and during the American session it fell to 2,030. So in less than a day, the price of gold fell about USD 100, making Monday's close further from the record top than Friday's close — essentially similar to a change in market sentiment, in which a bearish engulfing pattern is formed.
From a fundamental point of view, the gold market is influenced by:
→ Jerome Powell's words that expectations of a rate cut may be “premature”;
→ positioning traders at the beginning of the working week. Important news on the US labor market is expected on Friday.
From a technical point of view, the gold price chart has a structure of trend lines that resemble a Gann fan. The price found support near one of them (shown in double thickness), thereby stopping Monday's fall. It is possible that if the bounces from this line are weak, the downward momentum may resume. In this case, the bears may try to break through the psychological level of USD 2,000 to test the next line from the mentioned structure.
To benefit from the rise and fall of the gold price, consider enlisting the services of a trusted broker like FXOpen.
CFDs are complex instruments and come with a high risk of losing your money.
This article represents the opinion of the Companies operating under the FXOpen brand only. It is not to be construed as an offer, solicitation, or recommendation with respect to products and services provided by the Companies operating under the FXOpen brand, nor is it to be considered financial advice.
#marketanalysis #oilprices #oilindustry
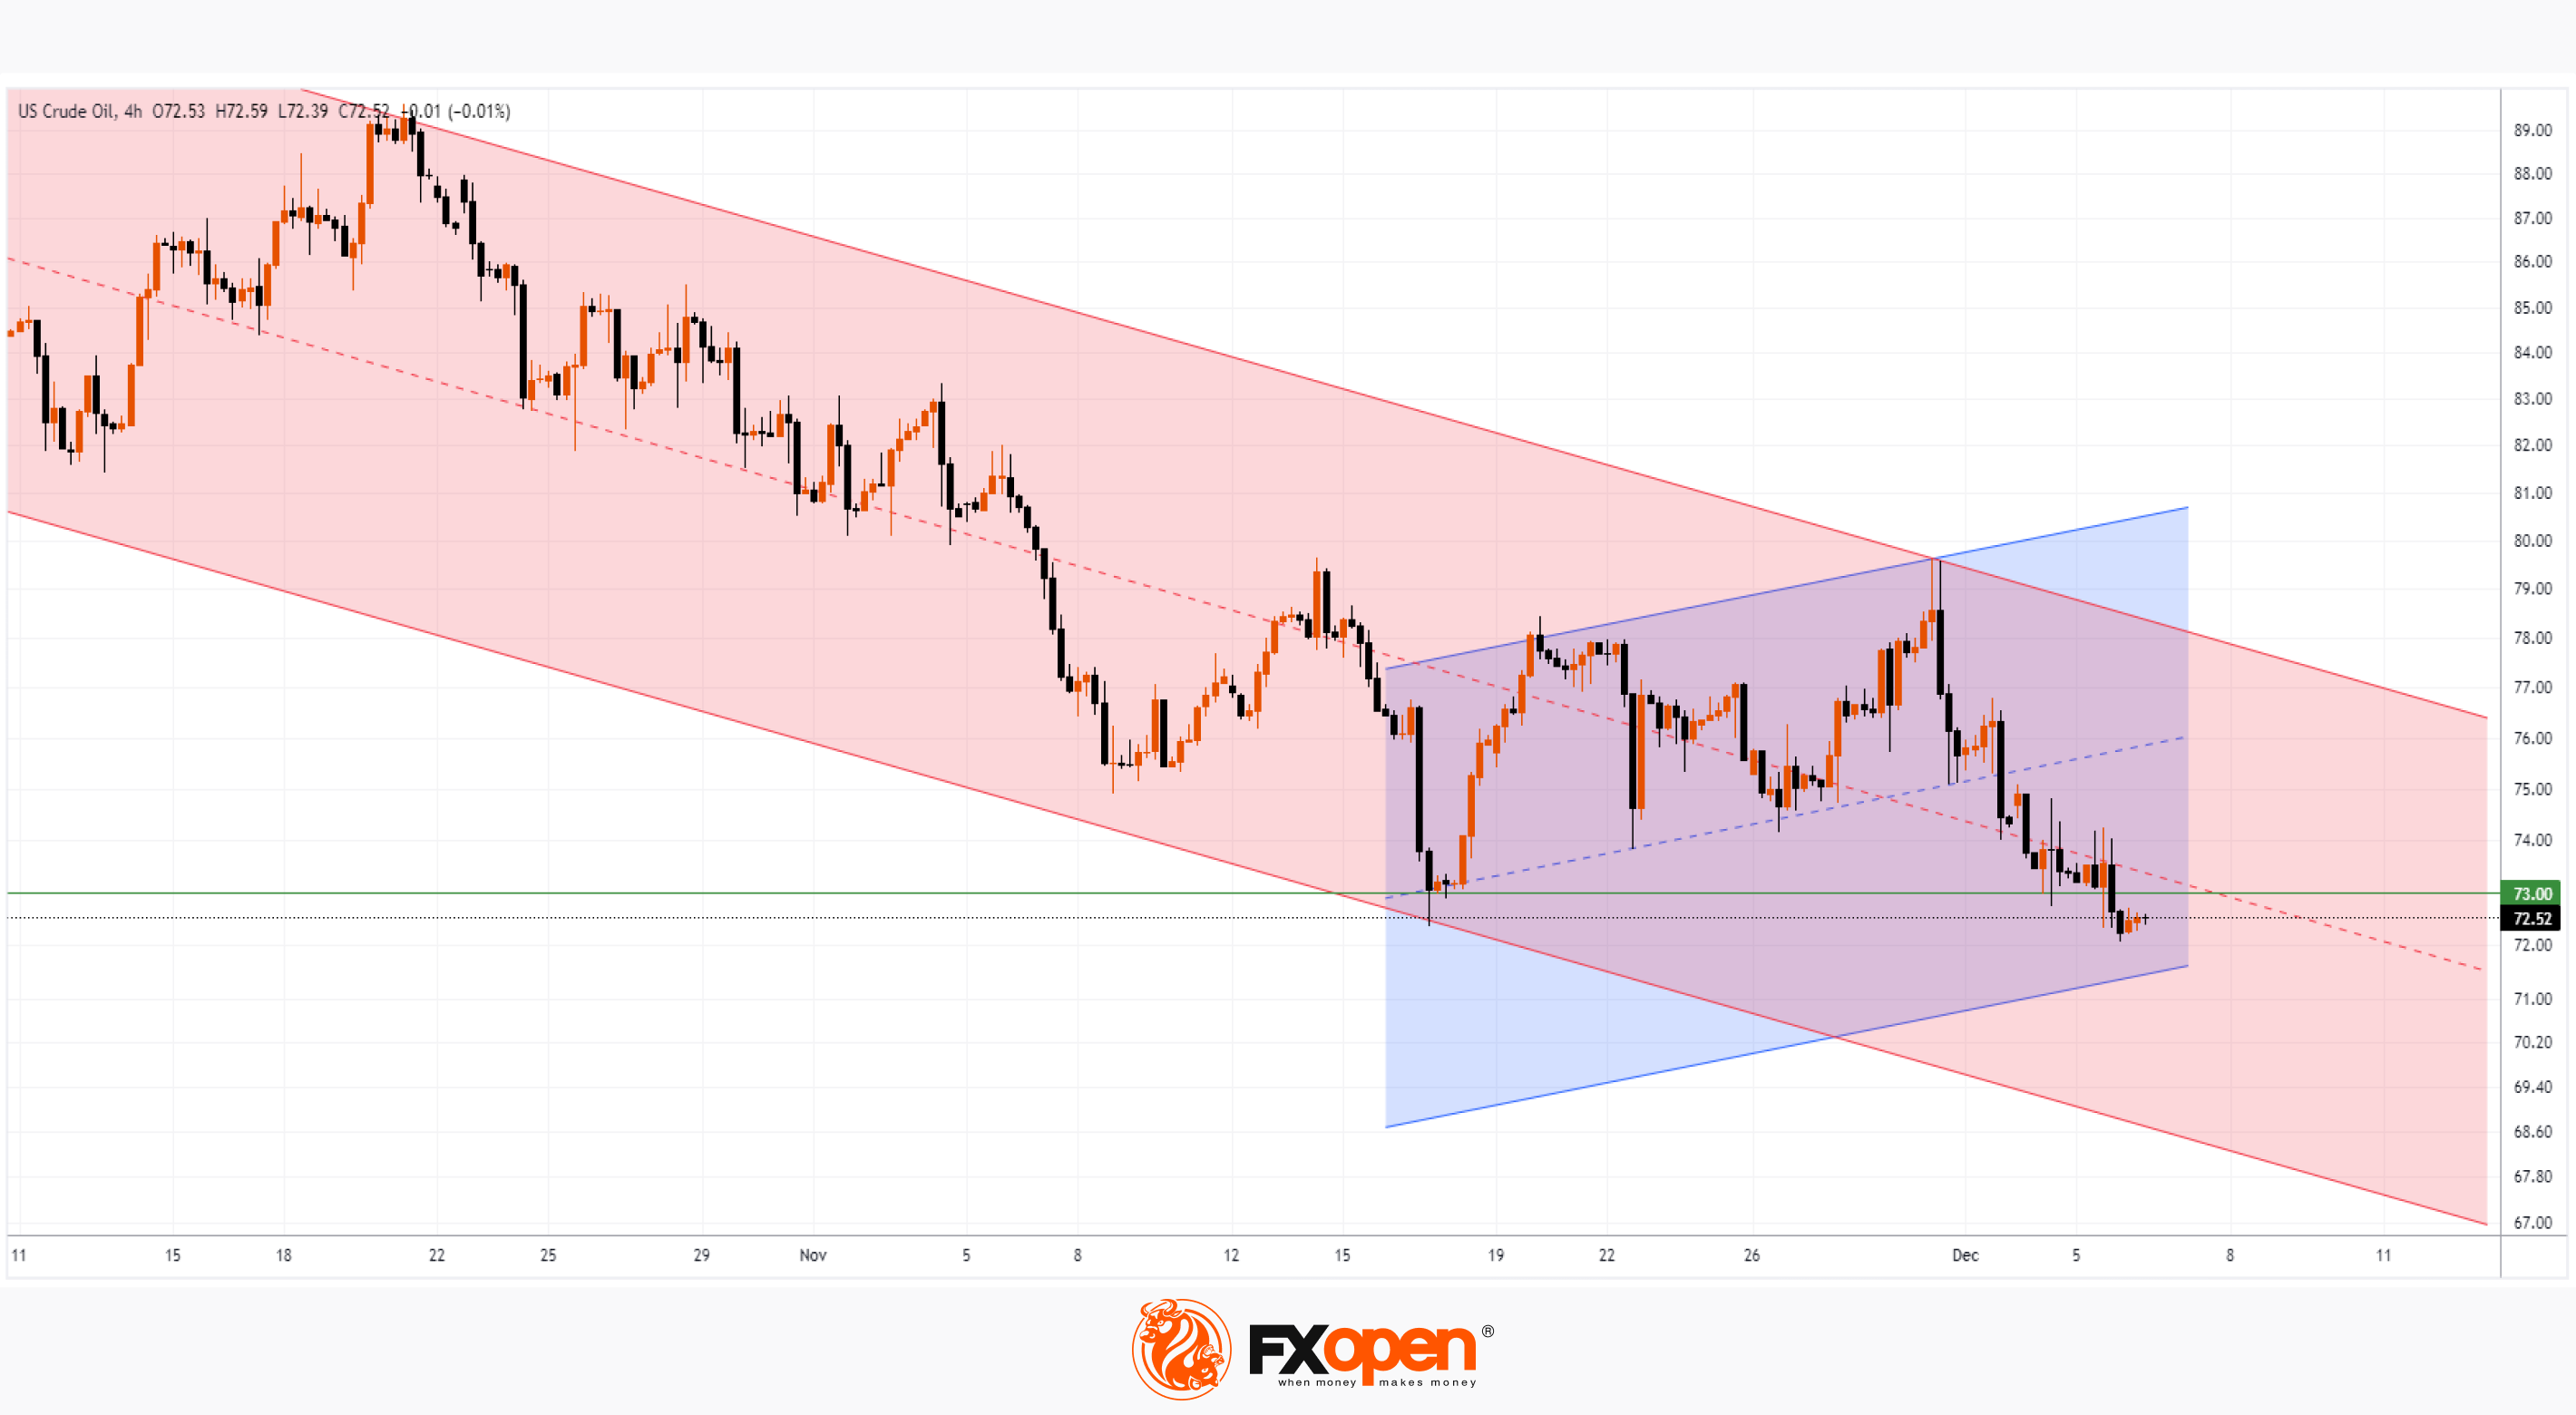
Market Analysis: WTI Oil Price Drops to Lowest Level Since July
As the chart shows, the price of a barrel of US crude oil dropped below 72.10 per barrel yesterday for the first time since July 2023.
Fundamentally, this happened against the backdrop of:
→ Statistics showing that US oil exports are increasing. Volume is approaching a record 6 million barrels per day, with flows to Europe and Asia showing steady growth.
→ Previously announced measures to reduce oil production by OPEC+. However, either the price has already taken these statements into account in advance, or market participants are not confident that the reduction in OPEC+ supplies will be fully implemented — one way or another, so far the OPEC+ countries have not achieved the desired increase in oil prices. Perhaps, in order to discuss the oil market, Russian President Putin is flying to the UAE and Saudi Arabia today. And Deputy Prime Minister Alexander Novak said OPEC+ is ready to deepen oil production cuts in the first quarter of 2024 to eliminate “speculation and volatility” if existing production reduction measures are not enough.
From a technical analysis point of view:
→ the price of oil continues to develop its dynamics within the descending channel (shown in red);
→ the rising channel (shown in blue) looks like an intermediate correction within a larger decline. The lower boundary of the parallel channel may provide support for the current decline;
→ yesterday's update to the low was very small, it looks like a false breakout of the November low. The bears seem unsure, but they may make a new attempt if there is a successful test of the level of $73 per barrel, which worked as support in early December, but today may provide resistance. Also pay attention to the lower boundary of the downward channel, where sellers can take profits from short positions.
To benefit from fluctuations in oil and gas exchange prices, consider enlisting the services of a trusted broker like FXOpen.
CFDs are complex instruments and come with a high risk of losing your money.
This article represents the opinion of the Companies operating under the FXOpen brand only. It is not to be construed as an offer, solicitation, or recommendation with respect to products and services provided by the Companies operating under the FXOpen brand, nor is it to be considered financial advice.
CFDs are complex instruments and come with a high risk of losing your money.
This article represents the opinion of the Companies operating under the FXOpen brand only. It is not to be construed as an offer, solicitation, or recommendation with respect to products and services provided by the Companies operating under the FXOpen brand, nor is it to be considered financial advice.
Market Analysis: WTI Oil Price Drops to Lowest Level Since July
As the chart shows, the price of a barrel of US crude oil dropped below 72.10 per barrel yesterday for the first time since July 2023.
Fundamentally, this happened against the backdrop of:
→ Statistics showing that US oil exports are increasing. Volume is approaching a record 6 million barrels per day, with flows to Europe and Asia showing steady growth.
→ Previously announced measures to reduce oil production by OPEC+. However, either the price has already taken these statements into account in advance, or market participants are not confident that the reduction in OPEC+ supplies will be fully implemented — one way or another, so far the OPEC+ countries have not achieved the desired increase in oil prices. Perhaps, in order to discuss the oil market, Russian President Putin is flying to the UAE and Saudi Arabia today. And Deputy Prime Minister Alexander Novak said OPEC+ is ready to deepen oil production cuts in the first quarter of 2024 to eliminate “speculation and volatility” if existing production reduction measures are not enough.
From a technical analysis point of view:
→ the price of oil continues to develop its dynamics within the descending channel (shown in red);
→ the rising channel (shown in blue) looks like an intermediate correction within a larger decline. The lower boundary of the parallel channel may provide support for the current decline;
→ yesterday's update to the low was very small, it looks like a false breakout of the November low. The bears seem unsure, but they may make a new attempt if there is a successful test of the level of $73 per barrel, which worked as support in early December, but today may provide resistance. Also pay attention to the lower boundary of the downward channel, where sellers can take profits from short positions.
To benefit from fluctuations in oil and gas exchange prices, consider enlisting the services of a trusted broker like FXOpen.
CFDs are complex instruments and come with a high risk of losing your money.
This article represents the opinion of the Companies operating under the FXOpen brand only. It is not to be construed as an offer, solicitation, or recommendation with respect to products and services provided by the Companies operating under the FXOpen brand, nor is it to be considered financial advice.
CFDs are complex instruments and come with a high risk of losing your money.
This article represents the opinion of the Companies operating under the FXOpen brand only. It is not to be construed as an offer, solicitation, or recommendation with respect to products and services provided by the Companies operating under the FXOpen brand, nor is it to be considered financial advice.
#stockmarket #sp500 #stocktrading #marketanalysis
S&P 500 Analysis: Why Santa May Have Problems Rallying
It is traditionally believed that the Santa Rally occurs at the end of December and the first days of January, but according to many opinions it is acceptable to think that it begins much earlier.
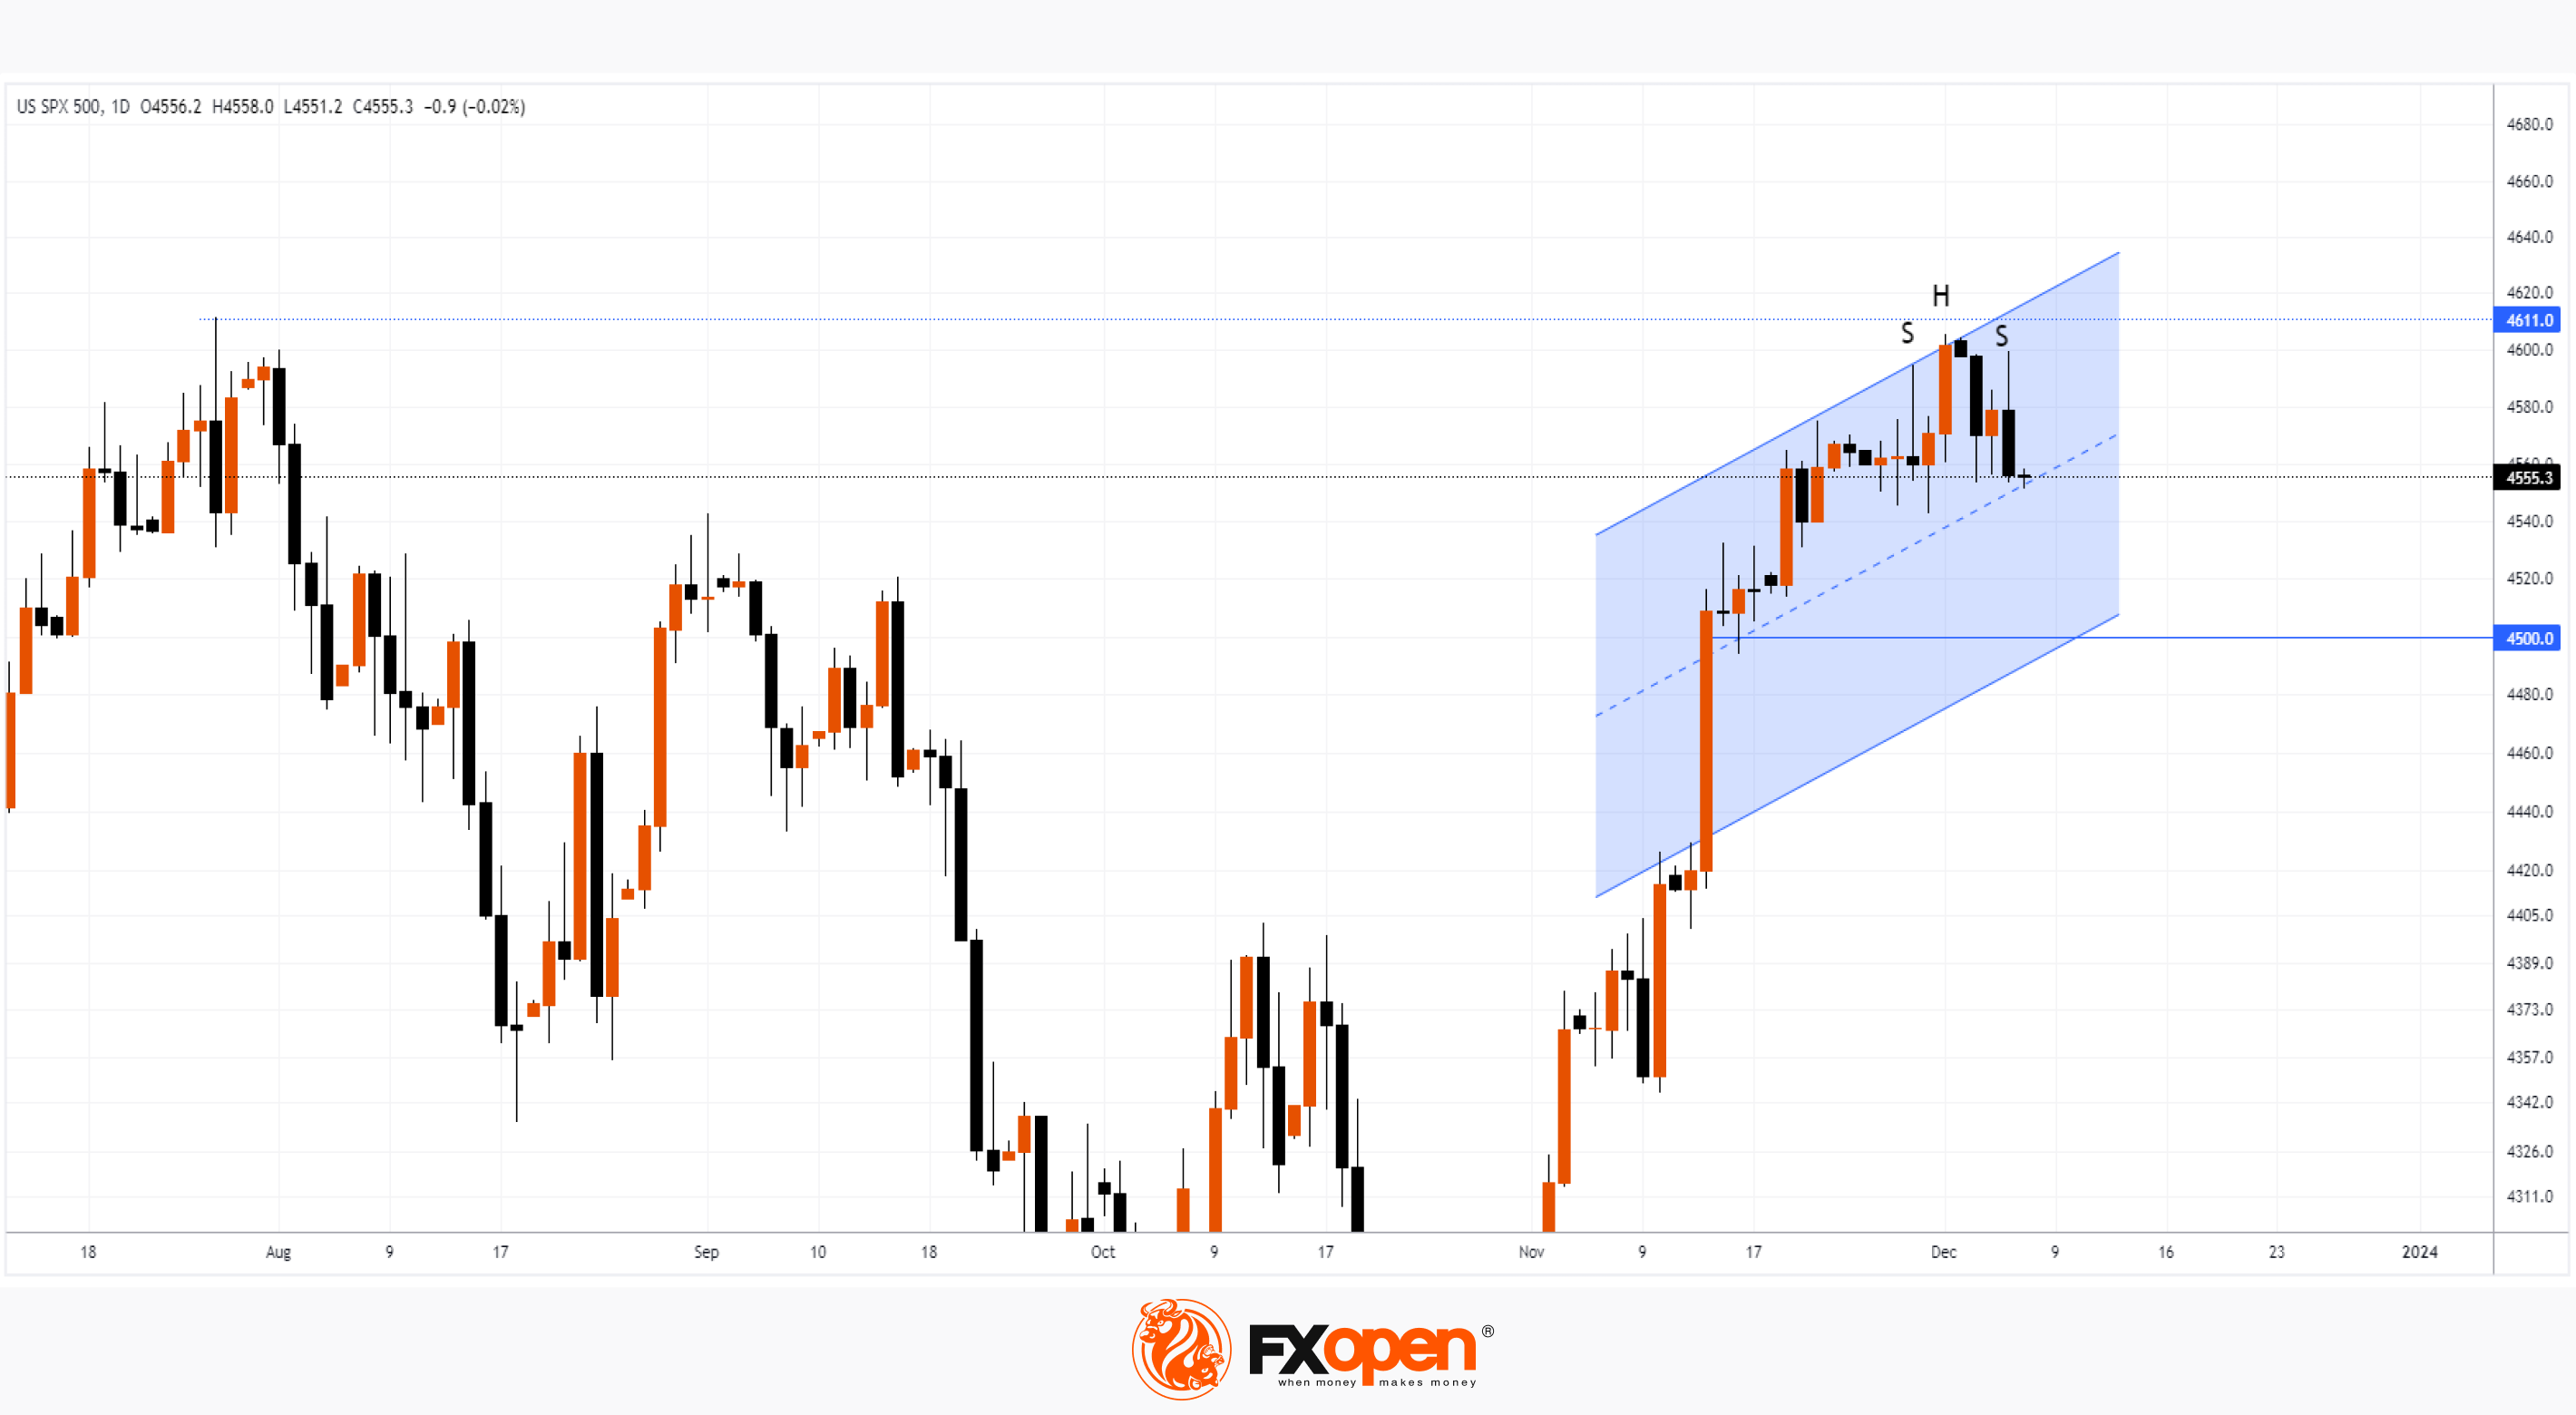
At the beginning of December, the values of the S&P 500 index came close to the highs of the year in the area of 4,611, but have declined to date, forming a number of bearish signs:
→ the candle on November 29 has a long upper shadow — a sign of seller activity;
→ the same can be said about yesterday’s candle;
→ candles on December 1-4 form a bearish engulfing pattern;
→ all of the listed candles form a head-and-shoulders pattern (shown by the letters SHS).
That is, the chart indicates activation of sellers near the yearly high — and this is a problem that can affect the so-called Santa Claus rally (the active channel, shown in blue, actualizes the theme associated with the rally).
The mentioned signs of increased supply forces give reason to assume that the values of the S&P 500 index may roll back to the lower border of the parallel channel, approximately the psychological level of 4,500, which can work as support. By the way, this level already provided support during the formation of consolidation on November 15-17.
Fundamentally, tomorrow's news (issued at 16:30 GMT+3) from the US labor market could serve as a trigger for a rollback. On the other hand, it is possible that the news will give impetus to the bulls to attack the level of the year's high.
Today's session will be interesting from the point of view of the market's ability to form a rebound from the median line of the blue channel. Price action will indicate current sentiment ahead of important news.
To benefit from fluctuations in the world's stock indices, consider enlisting the services of a trusted broker like FXOpen.
CFDs are complex instruments and come with a high risk of losing your money.
This article represents the opinion of the Companies operating under the FXOpen brand only. It is not to be construed as an offer, solicitation, or recommendation with respect to products and services provided by the Companies operating under the FXOpen brand, nor is it to be considered financial advice.
S&P 500 Analysis: Why Santa May Have Problems Rallying
It is traditionally believed that the Santa Rally occurs at the end of December and the first days of January, but according to many opinions it is acceptable to think that it begins much earlier.
At the beginning of December, the values of the S&P 500 index came close to the highs of the year in the area of 4,611, but have declined to date, forming a number of bearish signs:
→ the candle on November 29 has a long upper shadow — a sign of seller activity;
→ the same can be said about yesterday’s candle;
→ candles on December 1-4 form a bearish engulfing pattern;
→ all of the listed candles form a head-and-shoulders pattern (shown by the letters SHS).
That is, the chart indicates activation of sellers near the yearly high — and this is a problem that can affect the so-called Santa Claus rally (the active channel, shown in blue, actualizes the theme associated with the rally).
The mentioned signs of increased supply forces give reason to assume that the values of the S&P 500 index may roll back to the lower border of the parallel channel, approximately the psychological level of 4,500, which can work as support. By the way, this level already provided support during the formation of consolidation on November 15-17.
Fundamentally, tomorrow's news (issued at 16:30 GMT+3) from the US labor market could serve as a trigger for a rollback. On the other hand, it is possible that the news will give impetus to the bulls to attack the level of the year's high.
Today's session will be interesting from the point of view of the market's ability to form a rebound from the median line of the blue channel. Price action will indicate current sentiment ahead of important news.
To benefit from fluctuations in the world's stock indices, consider enlisting the services of a trusted broker like FXOpen.
CFDs are complex instruments and come with a high risk of losing your money.
This article represents the opinion of the Companies operating under the FXOpen brand only. It is not to be construed as an offer, solicitation, or recommendation with respect to products and services provided by the Companies operating under the FXOpen brand, nor is it to be considered financial advice.
#marketanalysis #tradingforex #forextrading
AUD/JPY Analysis: Rate Falls to Important Support
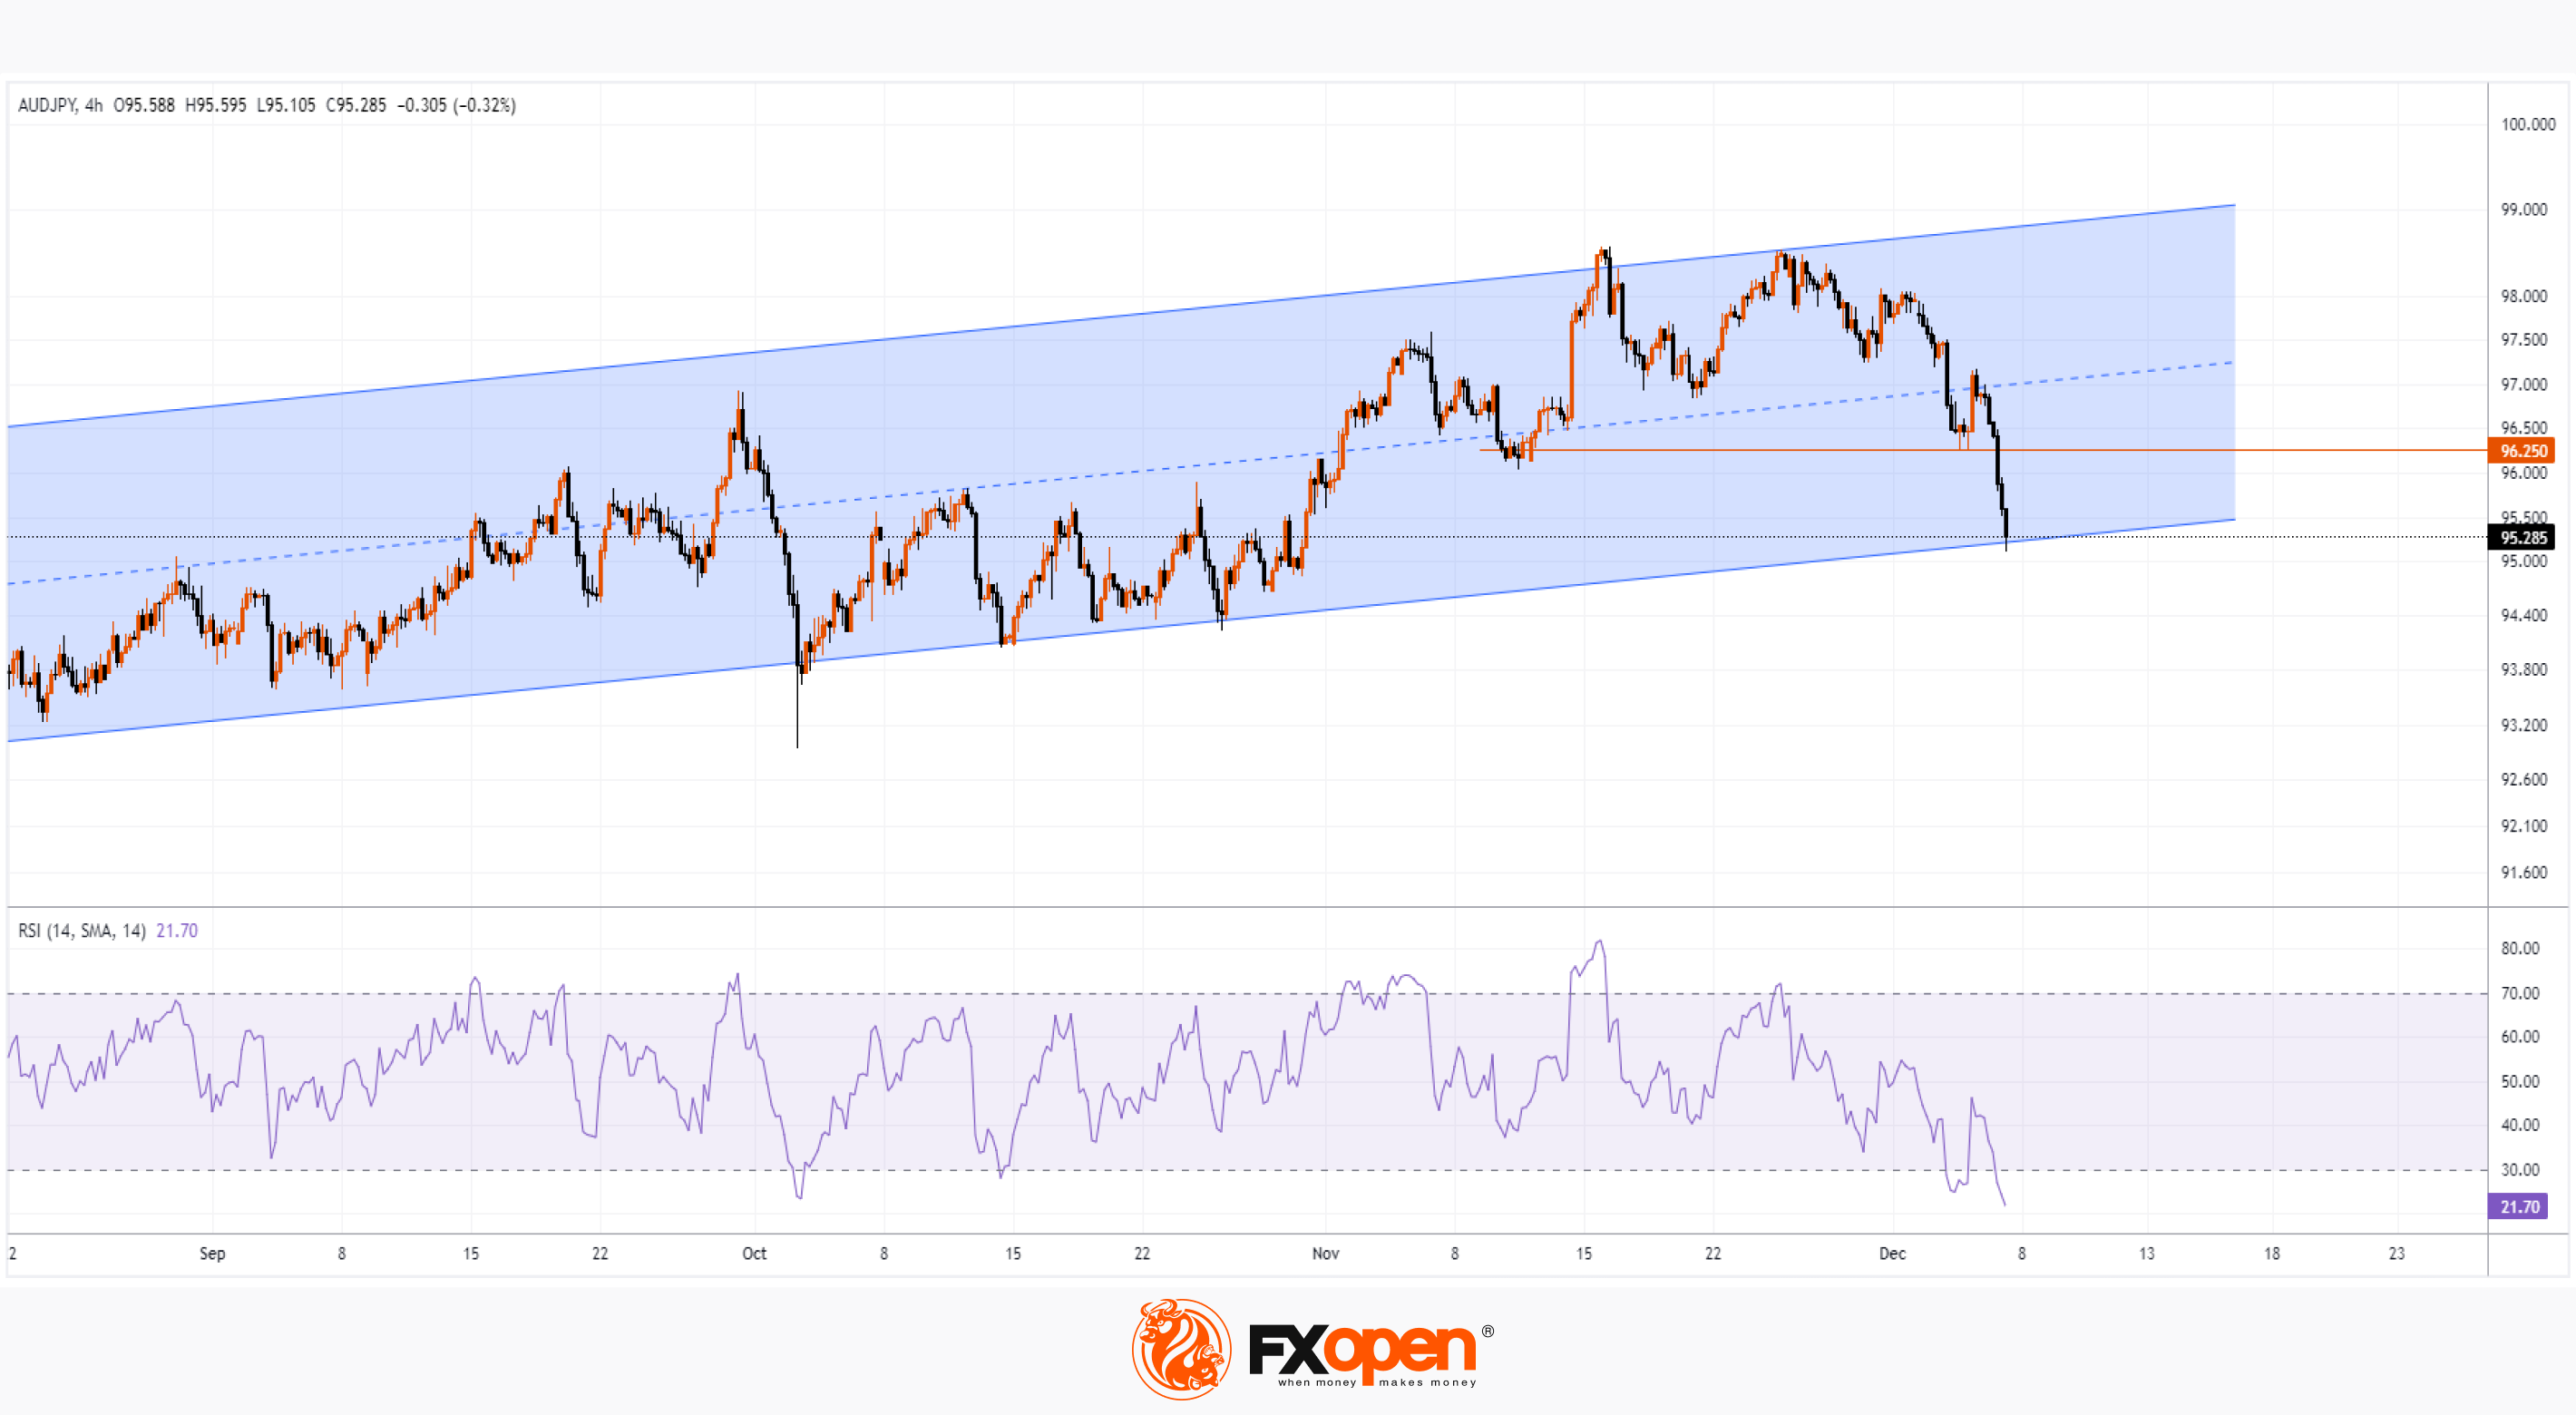
This morning, the AUD/JPY rate dropped below 95.2 yen per Australian dollar for the first time since late October.
The weakening of the AUD was contributed by:
→ negative news regarding the Chinese economy. The Hang Seng Index set its 2023 low yesterday;
→ Australian GDP data published yesterday, which is growing at a weaker-than-expected pace.
And the strengthening of the yen occurs against the backdrop of expectations of an increase in interest rates in Japan, which intensified according to the statement of the head of the Bank of Japan. Kazuo Ueda said yesterday the central bank has several options for targeting interest rates once it gets short-term borrowing costs out of negative territory.
At the same time, the AUD/JPY chart shows that:
→ the rate has reached important support from the lower border of the channel shown in blue;
→ the rate has broken through the level of 96.25, and now the level may act as resistance;
→ RSI dropped into the extreme oversold zone. This increases the temptation for bears to take profits.
Given these factors, it is reasonable to assume that the market is vulnerable to a short-term bullish correction after a strong downward impulse. However, if the current fundamental background does not change, it is possible that the strengthening yen will break through important support in the pair against AUD in December (which is also true for other currencies).
To benefit from the rise and fall of currency rates, consider enlisting the services of a trusted broker like FXOpen.
CFDs are complex instruments and come with a high risk of losing your money.
This article represents the opinion of the Companies operating under the FXOpen brand only. It is not to be construed as an offer, solicitation, or recommendation with respect to products and services provided by the Companies operating under the FXOpen brand, nor is it to be considered financial advice.
AUD/JPY Analysis: Rate Falls to Important Support
This morning, the AUD/JPY rate dropped below 95.2 yen per Australian dollar for the first time since late October.
The weakening of the AUD was contributed by:
→ negative news regarding the Chinese economy. The Hang Seng Index set its 2023 low yesterday;
→ Australian GDP data published yesterday, which is growing at a weaker-than-expected pace.
And the strengthening of the yen occurs against the backdrop of expectations of an increase in interest rates in Japan, which intensified according to the statement of the head of the Bank of Japan. Kazuo Ueda said yesterday the central bank has several options for targeting interest rates once it gets short-term borrowing costs out of negative territory.
At the same time, the AUD/JPY chart shows that:
→ the rate has reached important support from the lower border of the channel shown in blue;
→ the rate has broken through the level of 96.25, and now the level may act as resistance;
→ RSI dropped into the extreme oversold zone. This increases the temptation for bears to take profits.
Given these factors, it is reasonable to assume that the market is vulnerable to a short-term bullish correction after a strong downward impulse. However, if the current fundamental background does not change, it is possible that the strengthening yen will break through important support in the pair against AUD in December (which is also true for other currencies).
To benefit from the rise and fall of currency rates, consider enlisting the services of a trusted broker like FXOpen.
CFDs are complex instruments and come with a high risk of losing your money.
This article represents the opinion of the Companies operating under the FXOpen brand only. It is not to be construed as an offer, solicitation, or recommendation with respect to products and services provided by the Companies operating under the FXOpen brand, nor is it to be considered financial advice.
#MarketNews #stockmarket #stocktrading
NIKKEI Analysis: Japanese Stock Market Outlook
In the first half of 2023, the Japanese stock market was dominated by bullish sentiment due to (still) negative interest rates — while the rest of the G7 countries raised their rates to combat inflation.
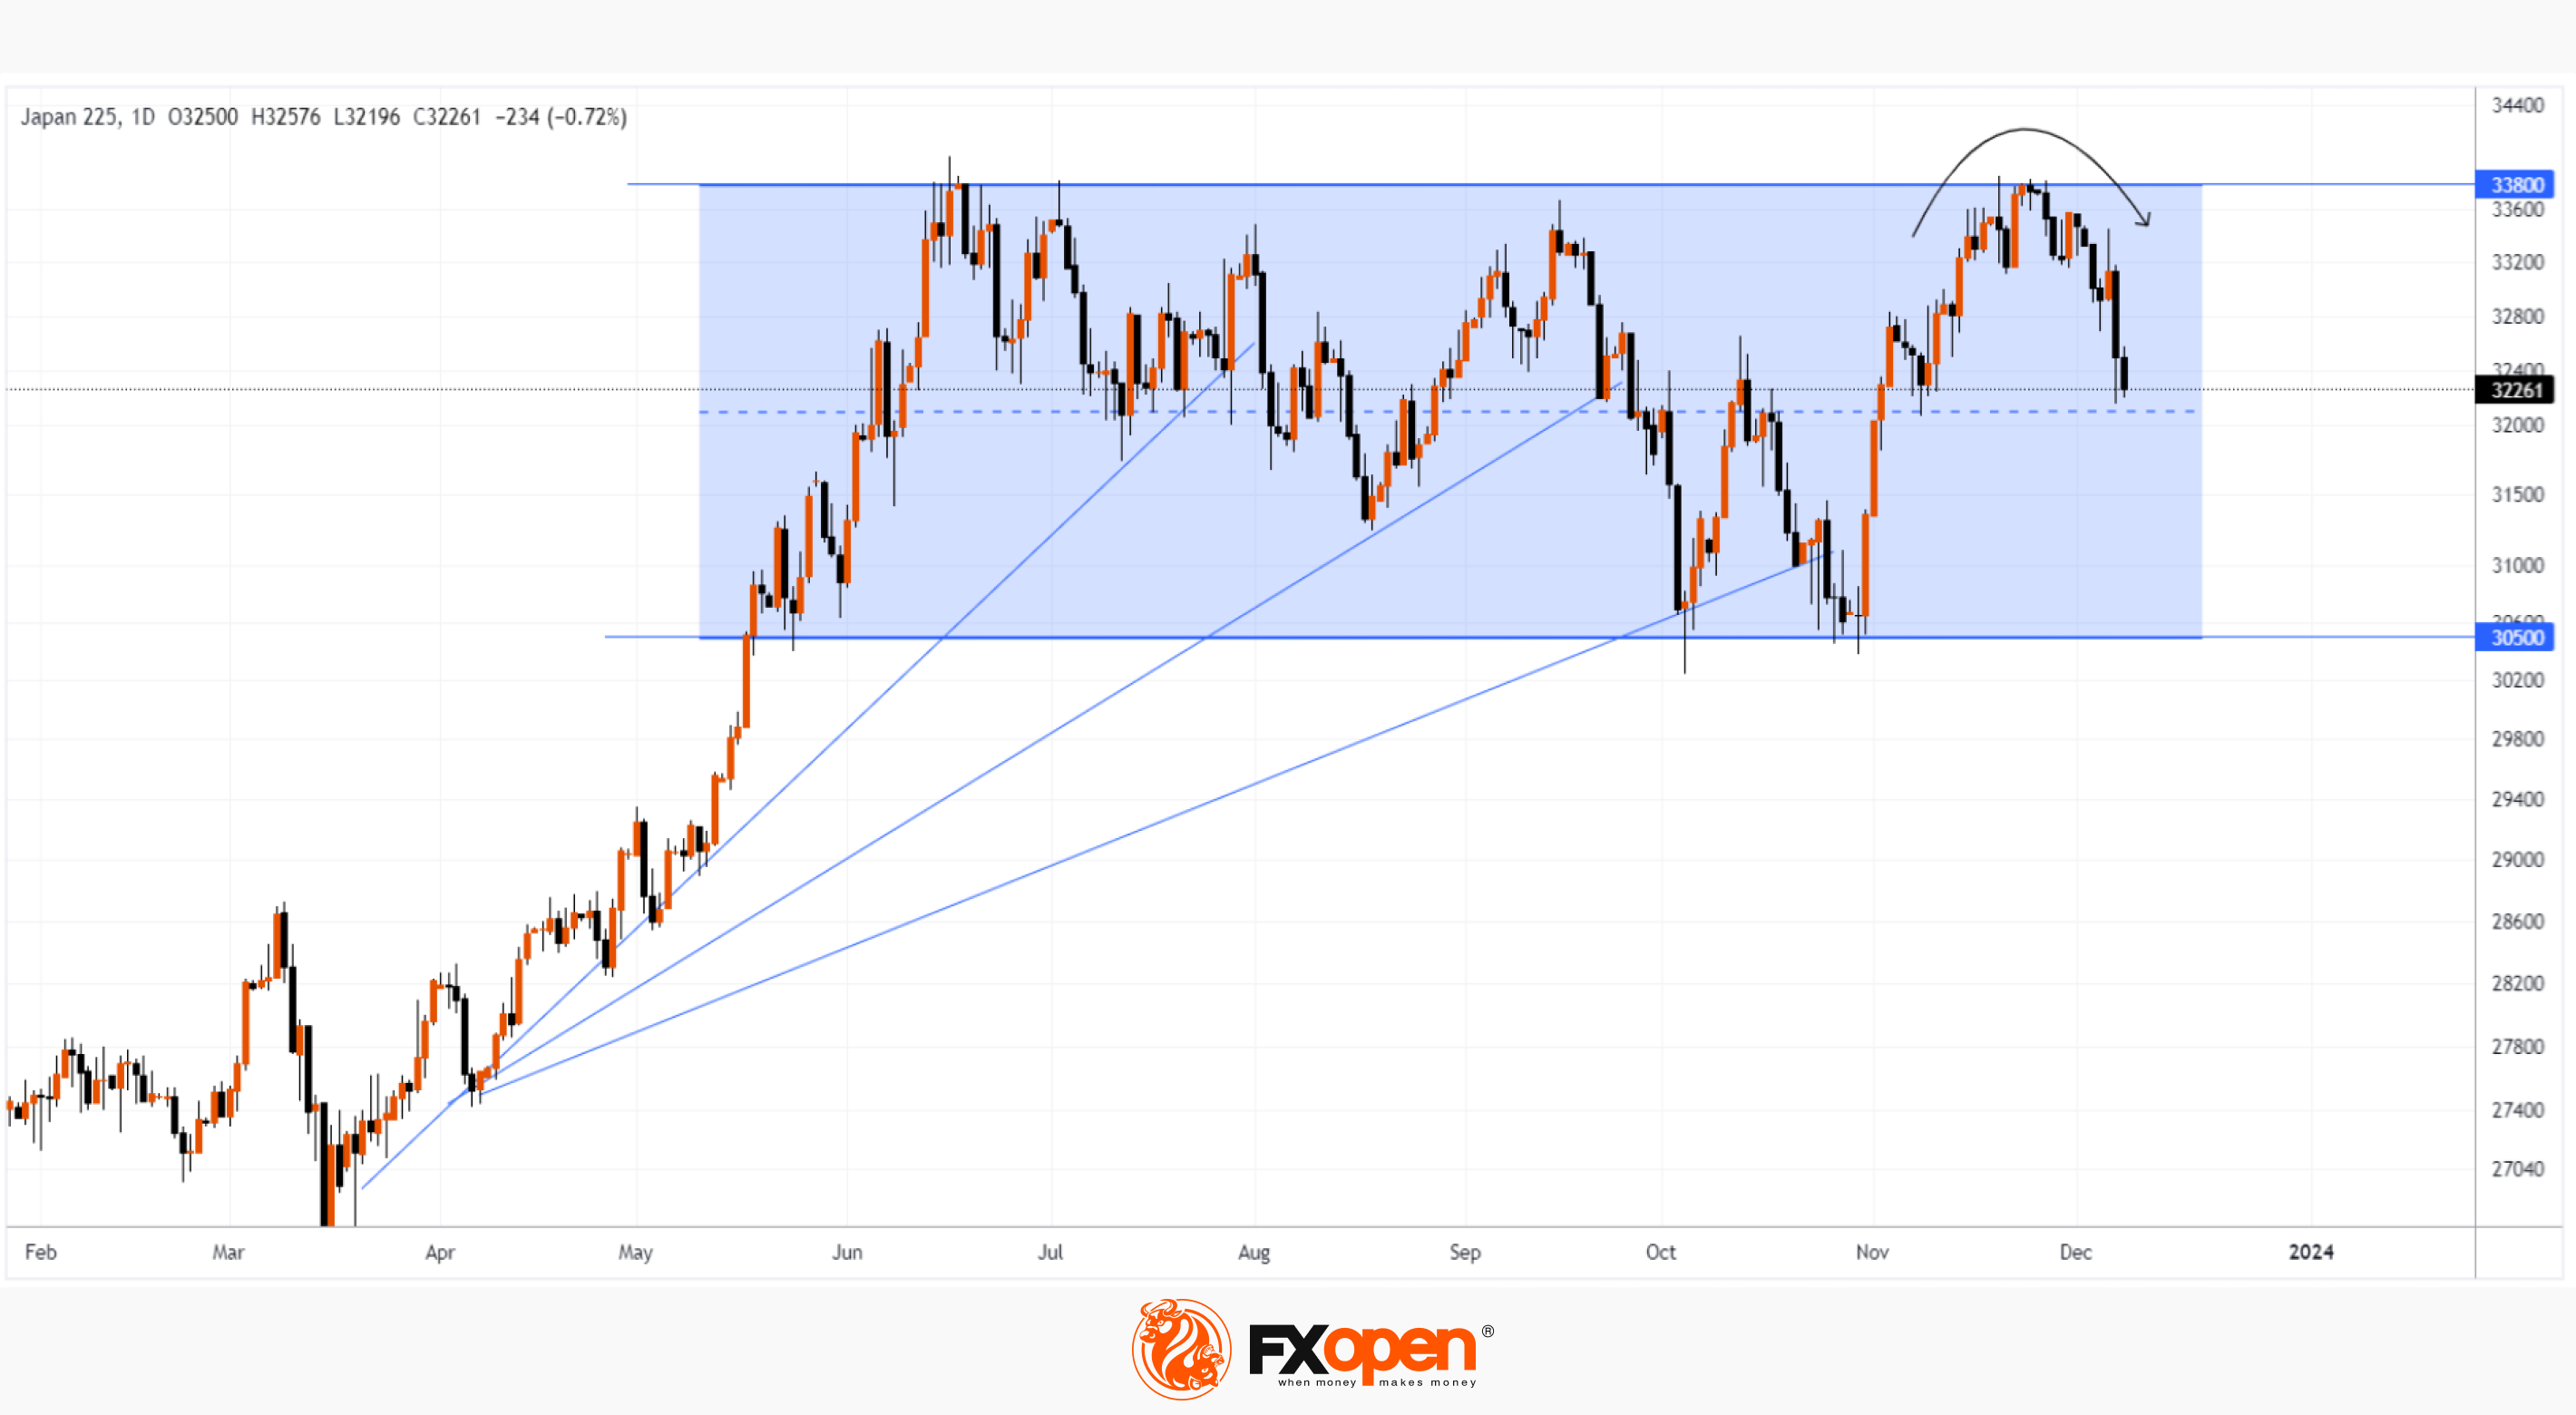
The NIKKEI-225 index grew by 30% in the first half of the year. But then the balance of supply and demand was achieved, judging by the daily chart, where a range was formed (shown in blue), framing the index’s fluctuations in the second half of the year. Judging by the change in the slope of the bullish trend lines, demand was sufficient to maintain the price at the lower limit of the range, but not enough to go beyond the upper limit.
The situation is fundamentally reversed. While interest rates in the US, Europe and elsewhere are thought to be near the top, there is growing talk in Japan that the central bank will begin raising them after years of being stuck in negative territory:
→ Bloomberg: The next meeting of the Bank of Japan will be held on December 19 – speculation is growing that the Bank will move away from negative interest rates as early as this month.
→ Reuters: 22 of 26 economists (85%) surveyed in November believe the Bank of Japan will abandon its negative interest rate policy by the end of next year.
The winding down of ultra-loose monetary policy could have a negative impact on the growth of Japanese companies - accordingly, the growing bearish sentiment is reflected in the index quote. Since the end of November, the NIKKEI 225 has dropped almost 5%.
The chart shows that the November top:
→ did not exceed the annual maximum set in June;
→ only slightly exceeded the September high – in fact, a false breakout;
→ the price forms a rounding (shown by an arrow) - a sign of gradual depletion of demand, which is replaced by the dominance of supply.
It is possible that the bears, which are gaining power, will be able to form a breakdown of the median line of the blue channel as early as December.
To benefit from fluctuations in the world's stock markets, consider enlisting the services of a trusted broker like FXOpen.
CFDs are complex instruments and come with a high risk of losing your money.
This article represents the opinion of the Companies operating under the FXOpen brand only. It is not to be construed as an offer, solicitation, or recommendation with respect to products and services provided by the Companies operating under the FXOpen brand, nor is it to be considered financial advice.
NIKKEI Analysis: Japanese Stock Market Outlook
In the first half of 2023, the Japanese stock market was dominated by bullish sentiment due to (still) negative interest rates — while the rest of the G7 countries raised their rates to combat inflation.
The NIKKEI-225 index grew by 30% in the first half of the year. But then the balance of supply and demand was achieved, judging by the daily chart, where a range was formed (shown in blue), framing the index’s fluctuations in the second half of the year. Judging by the change in the slope of the bullish trend lines, demand was sufficient to maintain the price at the lower limit of the range, but not enough to go beyond the upper limit.
The situation is fundamentally reversed. While interest rates in the US, Europe and elsewhere are thought to be near the top, there is growing talk in Japan that the central bank will begin raising them after years of being stuck in negative territory:
→ Bloomberg: The next meeting of the Bank of Japan will be held on December 19 – speculation is growing that the Bank will move away from negative interest rates as early as this month.
→ Reuters: 22 of 26 economists (85%) surveyed in November believe the Bank of Japan will abandon its negative interest rate policy by the end of next year.
The winding down of ultra-loose monetary policy could have a negative impact on the growth of Japanese companies - accordingly, the growing bearish sentiment is reflected in the index quote. Since the end of November, the NIKKEI 225 has dropped almost 5%.
The chart shows that the November top:
→ did not exceed the annual maximum set in June;
→ only slightly exceeded the September high – in fact, a false breakout;
→ the price forms a rounding (shown by an arrow) - a sign of gradual depletion of demand, which is replaced by the dominance of supply.
It is possible that the bears, which are gaining power, will be able to form a breakdown of the median line of the blue channel as early as December.
To benefit from fluctuations in the world's stock markets, consider enlisting the services of a trusted broker like FXOpen.
CFDs are complex instruments and come with a high risk of losing your money.
This article represents the opinion of the Companies operating under the FXOpen brand only. It is not to be construed as an offer, solicitation, or recommendation with respect to products and services provided by the Companies operating under the FXOpen brand, nor is it to be considered financial advice.
#sp500 #AUDJPY #stockmarket #oilprices
Weekly Market Wrap With Gary Thomson: AUD/JPY, RATE HIKES, S&P 500, WTI Oil
Get the latest scoop on the week's hottest headlines, all in one convenient video. Join Gary Thomson, the COO of -FXOpen UK, as he breaks down the most significant news reports and shares his expert insights.
🔸 AUD/JPY: Rate Falls to Important Support
🔸 Will rate hikes end when 2023 ends?
🔸 S&P 500: Why Santa May Have Problems Rallying
🔸 WTI oil price drops to lowest level since July
Stay in the know and empower yourself with our short, yet power-packed video. Watch it now and stay updated with FXOpen.
Don't miss out on this invaluable opportunity to sharpen your trading skills and make informed decisions.
https://cutt.ly/2wAuerr5
To take advantage of price fluctuations in the foreign exchange markets, consider enlisting the services of a reliable broker like FXOpen.
⚠️
This forecast represents FXOpen Companies opinion only, it should not be construed as an offer, invitation or recommendation in respect to FXOpen Companies products and services or as financial advice
Weekly Market Wrap With Gary Thomson: AUD/JPY, RATE HIKES, S&P 500, WTI Oil
Get the latest scoop on the week's hottest headlines, all in one convenient video. Join Gary Thomson, the COO of -FXOpen UK, as he breaks down the most significant news reports and shares his expert insights.
🔸 AUD/JPY: Rate Falls to Important Support
🔸 Will rate hikes end when 2023 ends?
🔸 S&P 500: Why Santa May Have Problems Rallying
🔸 WTI oil price drops to lowest level since July
Stay in the know and empower yourself with our short, yet power-packed video. Watch it now and stay updated with FXOpen.
Don't miss out on this invaluable opportunity to sharpen your trading skills and make informed decisions.
https://cutt.ly/2wAuerr5
To take advantage of price fluctuations in the foreign exchange markets, consider enlisting the services of a reliable broker like FXOpen.
⚠️
This forecast represents FXOpen Companies opinion only, it should not be construed as an offer, invitation or recommendation in respect to FXOpen Companies products and services or as financial advice
YouTube
Weekly Market Wrap With Gary Thomson: AUD/JPY, RATE HIKES, S&P 500, WTI Oil
Get the latest scoop on the week's hottest headlines, all in one convenient video. Join Gary Thomson, the COO of FXOpen UK, as he breaks down the most significant news reports and shares his expert insights.
00:37 - AUD/JPY: Rate Falls to Important Support…
00:37 - AUD/JPY: Rate Falls to Important Support…