
#goldprice #stockmarket #sp500 #oilprices #xauusd
Weekly Market Wrap With Gary Thomson: OIL FALLS, S&P500’s BEST WEEK, GOLD DROPS, EUR/JPY: NEW HIGH
Get the latest scoop on the week's hottest headlines, all in one convenient video. Join Gary Thomson, the COO of FXOpen UK, as he breaks down the most significant news reports and shares his expert insights.
🔸 Oil Prices Fall to Lowest Level since July
🔸 S&P 500: Best Week of the Year, Despite Bad News from Labour Market
🔸 Price of Gold Drops Below $1,950
🔸 EUR/JPY: New High of the Year
Don't miss out on this invaluable opportunity to sharpen your trading skills and make informed decisions.
https://cutt.ly/KwT957q4
To take advantage of price fluctuations in the foreign exchange markets, consider enlisting the services of a reliable broker like FXOpen.
⚠️
This forecast represents FXOpen Companies opinion only, it should not be construed as an offer, invitation or recommendation in respect to FXOpen Companies products and services or as financial advice
At FXOpen UK and FXOpen AU, Cryptocurrency CFDs are only available for trading by those clients categorised as Professional clients under FCA Rules and Professional clients under ASIC Rules respectively. They are not available for trading by Retail clients.
Weekly Market Wrap With Gary Thomson: OIL FALLS, S&P500’s BEST WEEK, GOLD DROPS, EUR/JPY: NEW HIGH
Get the latest scoop on the week's hottest headlines, all in one convenient video. Join Gary Thomson, the COO of FXOpen UK, as he breaks down the most significant news reports and shares his expert insights.
🔸 Oil Prices Fall to Lowest Level since July
🔸 S&P 500: Best Week of the Year, Despite Bad News from Labour Market
🔸 Price of Gold Drops Below $1,950
🔸 EUR/JPY: New High of the Year
Don't miss out on this invaluable opportunity to sharpen your trading skills and make informed decisions.
https://cutt.ly/KwT957q4
To take advantage of price fluctuations in the foreign exchange markets, consider enlisting the services of a reliable broker like FXOpen.
⚠️
This forecast represents FXOpen Companies opinion only, it should not be construed as an offer, invitation or recommendation in respect to FXOpen Companies products and services or as financial advice
At FXOpen UK and FXOpen AU, Cryptocurrency CFDs are only available for trading by those clients categorised as Professional clients under FCA Rules and Professional clients under ASIC Rules respectively. They are not available for trading by Retail clients.
YouTube
Weekly Market Wrap With Gary Thomson: OIL FALLS, S&P500’s BEST WEEK, GOLD DROPS, EUR/JPY: NEW HIGH
Get the latest scoop on the week's hottest headlines, all in one convenient video. Join Gary Thomson, the COO of FXOpen UK, as he breaks down the most significant news reports and shares his expert insights.
- Oil Prices Fall to Lowest Level since July #Oil…
- Oil Prices Fall to Lowest Level since July #Oil…
#marketanalysis #MarketNews #forextrading
EUR/GBP Analysis: Price Reaches 6-month High
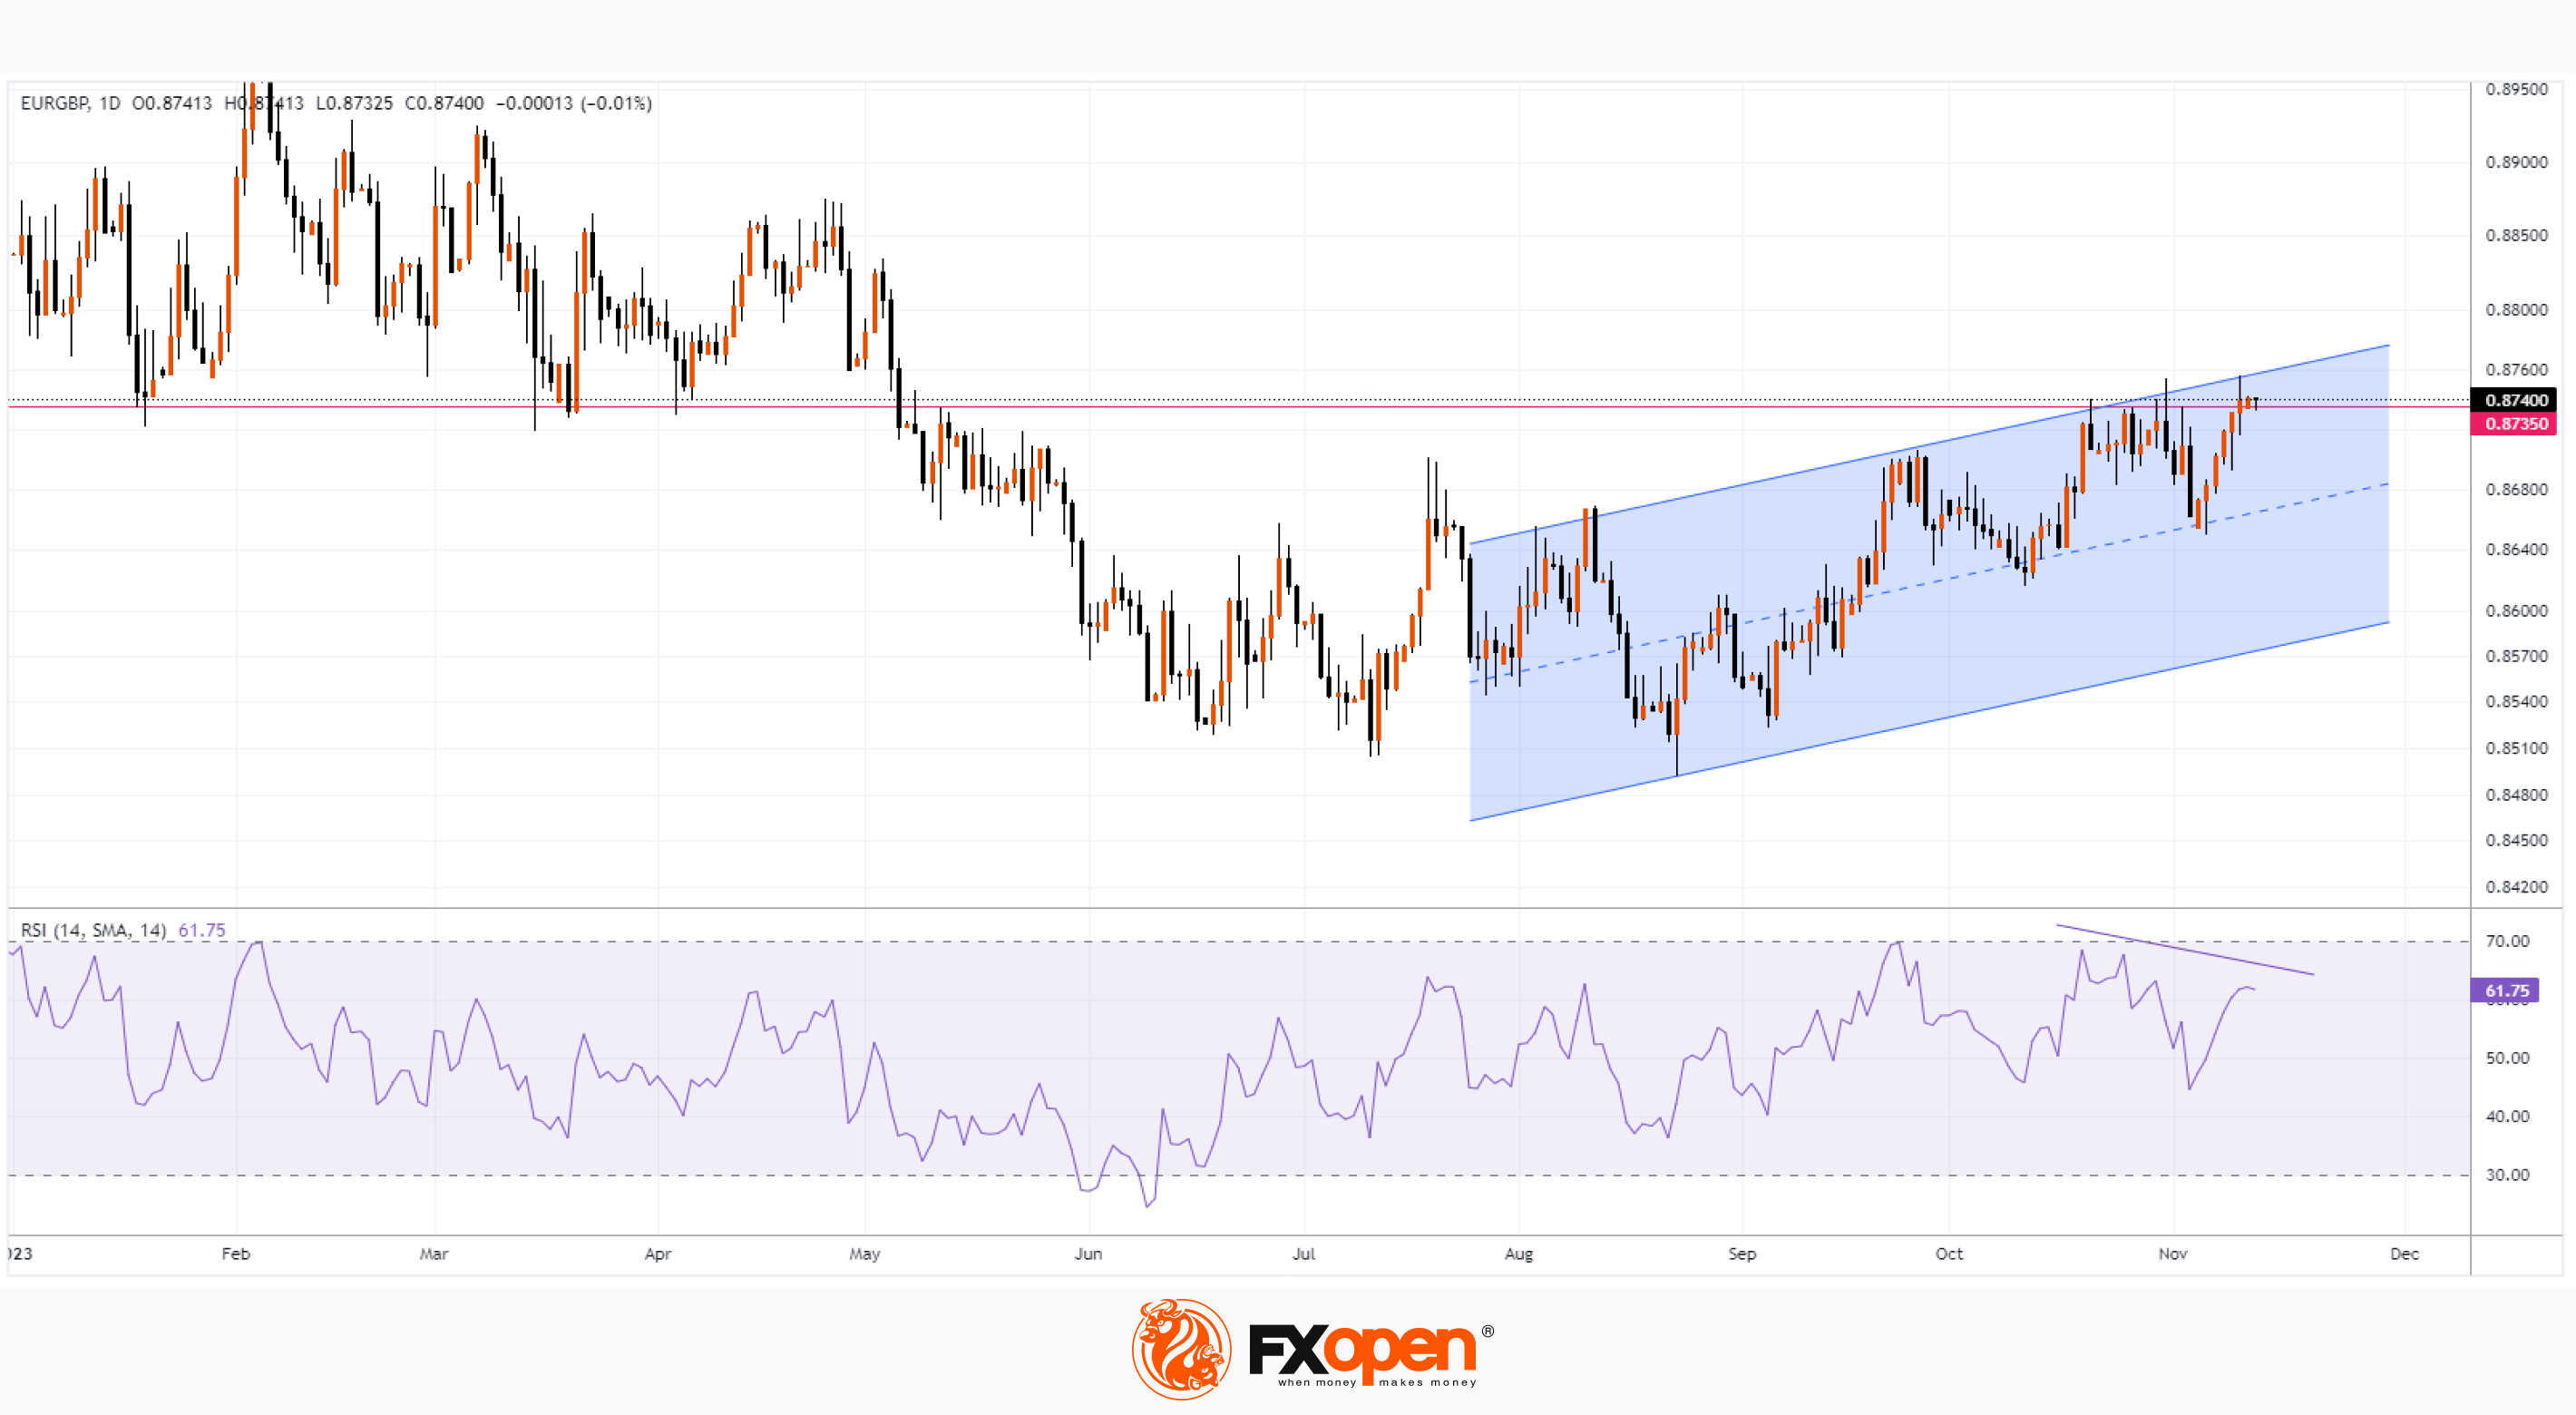
In the fall of 2023, bullish sentiment developed in the EUR/GBP market: since September 1, the rate has risen by more than 2%, price dynamics have formed an ascending channel (shown in blue). Moreover, on Friday, the price reached its highest in approximately 6 months.
Growth drivers, among other things, are news related to the policies of the Bank of England and the ECB aimed at combating high inflation, and what signals the economy gives in such conditions.
The latest news about UK GDP turned out to be better than expected (actual = +0.2% for the 3rd quarter, expectations = +0.1%), but the pound sterling did not show a positive reaction, for two reasons from a fundamental point of view:
→ Firstly, the details show that a significant contribution to GDP growth came from imports, a category that tends to be quite volatile between quarters. Other key areas — notably consumption and business investment — posted negative results in the quarter.
→ Secondly, GDP may decline due to the fact that the high rate policy pursued by the Bank of England should be more fully felt in the coming 2024.
If the pound didn't strengthen on Friday on the GDP news, could the bullish trend continue?
An important factor to note here from a technical analysis point of view is that the EUR/GBP price is near the key resistance of 0.8735. In the past, the level acted as support, holding its course in the first 4 months of the year. Now the level can act as resistance.
→ Divergence on the RSI indicator shows that the bullish momentum is weakening.
→ Resistance from the upper border of the ascending channel has not yet been broken.
These factors indicate that the EUR/GBP rate may be vulnerable to a pullback within the ascending channel.
To benefit from trends in the foreign exchange markets, consider enlisting the services of a trusted broker like FXOpen.
CFDs are complex instruments and come with a high risk of losing your money.
This article represents the opinion of the Companies operating under the FXOpen brand only. It is not to be construed as an offer, solicitation, or recommendation with respect to products and services provided by the Companies operating under the FXOpen brand, nor is it to be considered financial advice.
EUR/GBP Analysis: Price Reaches 6-month High
In the fall of 2023, bullish sentiment developed in the EUR/GBP market: since September 1, the rate has risen by more than 2%, price dynamics have formed an ascending channel (shown in blue). Moreover, on Friday, the price reached its highest in approximately 6 months.
Growth drivers, among other things, are news related to the policies of the Bank of England and the ECB aimed at combating high inflation, and what signals the economy gives in such conditions.
The latest news about UK GDP turned out to be better than expected (actual = +0.2% for the 3rd quarter, expectations = +0.1%), but the pound sterling did not show a positive reaction, for two reasons from a fundamental point of view:
→ Firstly, the details show that a significant contribution to GDP growth came from imports, a category that tends to be quite volatile between quarters. Other key areas — notably consumption and business investment — posted negative results in the quarter.
→ Secondly, GDP may decline due to the fact that the high rate policy pursued by the Bank of England should be more fully felt in the coming 2024.
If the pound didn't strengthen on Friday on the GDP news, could the bullish trend continue?
An important factor to note here from a technical analysis point of view is that the EUR/GBP price is near the key resistance of 0.8735. In the past, the level acted as support, holding its course in the first 4 months of the year. Now the level can act as resistance.
→ Divergence on the RSI indicator shows that the bullish momentum is weakening.
→ Resistance from the upper border of the ascending channel has not yet been broken.
These factors indicate that the EUR/GBP rate may be vulnerable to a pullback within the ascending channel.
To benefit from trends in the foreign exchange markets, consider enlisting the services of a trusted broker like FXOpen.
CFDs are complex instruments and come with a high risk of losing your money.
This article represents the opinion of the Companies operating under the FXOpen brand only. It is not to be construed as an offer, solicitation, or recommendation with respect to products and services provided by the Companies operating under the FXOpen brand, nor is it to be considered financial advice.
#marketanalysis #bitcoin #BTCUSD
BTC/USD Analysis: JP Morgan Analysts Warn of a Possible Correction
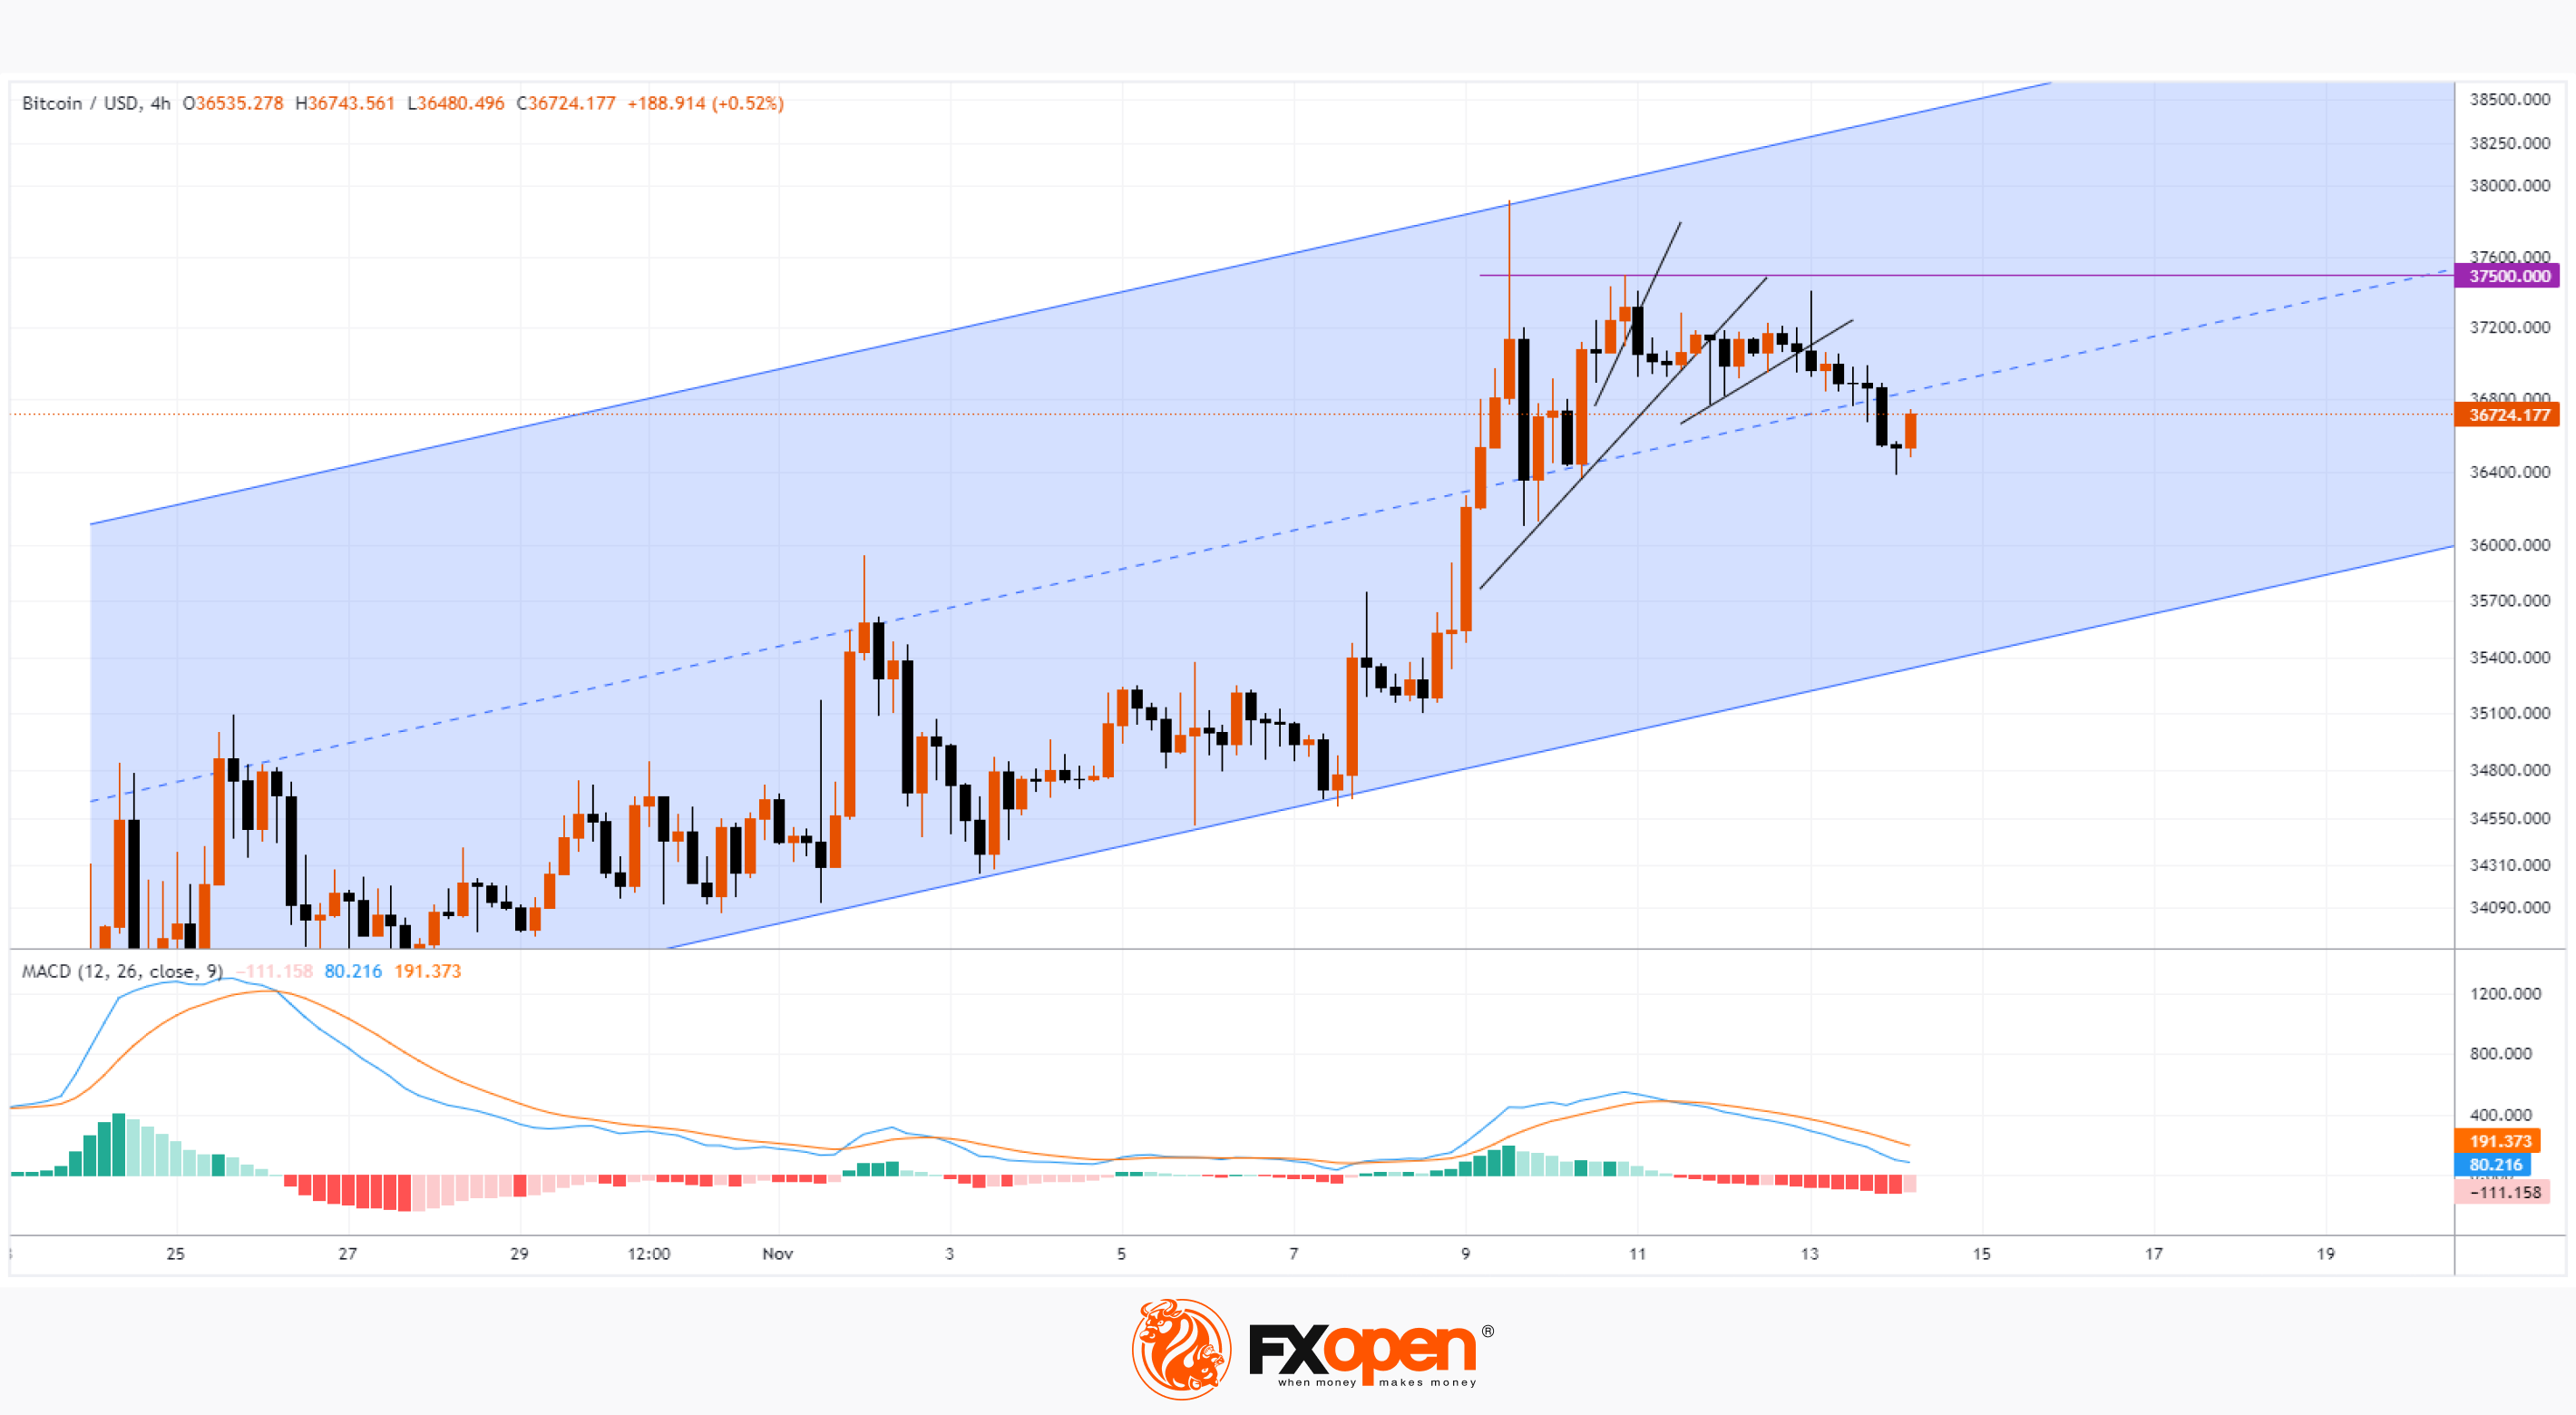
Last week, the BTC/USD rate rose to the level of USD 38k per coin on the excitement associated with the expected launch of a spot Bitcoin ETF.
However, as the week begins, bitcoin price performance shows signs that the hype appears to be waning:
→ the speed with which the price dropped from the upper boundary of the channel and the high of the year to the middle of the channel (about -USD 1,700 in a few hours) indicates the aggressiveness of sellers;
→ the price tried to resume its upward trend, but failed. This can be seen from the downward reversals from the level of 37,500
→ the fact that the slopes of trend lines (shown in black) become less sharp is also a sign of weakening bullish sentiment.
It turns out that after a pronounced surge last week, the price has already dropped below the median line of the channel, and the MACD remains in the red zone.
Moreover, JP Morgan analysts point to fundamental reasons why a correction may follow the hype. Among them:
→ The fact that spot Bitcoin ETFs are already active in Switzerland and Canada. If they really wanted to, investors could invest in them rather than wait for approval from the US SEC. Therefore, if the regulator gives the go-ahead, this will not mean a sharp influx of capital from buyers.
→ That the approval of spot Bitcoin ETFs in the US may already be priced in.
→ The assumption that court decisions in favor of crypto companies in disputes with the SEC will do little to clarify the regulation of cryptocurrencies in the United States.
Nevertheless, there is still potential for the price of bitcoin to rise to the psychological level of 40,000, if only because the ascending blue channel has not yet been broken.
To benefit from the rise and fall of prices in the cryptocurrency markets, consider enlisting the services of a trusted broker like FXOpen.
CFDs are complex instruments and come with a high risk of losing your money.
This article represents the opinion of the Companies operating under the FXOpen brand only. It is not to be construed as an offer, solicitation, or recommendation with respect to products and services provided by the Companies operating under the FXOpen brand, nor is it to be considered financial advice.
At FXOpen UK and FXOpen AU, Cryptocurrency CFDs are only available for trading by those clients categorised as Professional clients under FCA Rules and Professional clients under ASIC Rules, respectively. They are not available for trading by Retail clients.
BTC/USD Analysis: JP Morgan Analysts Warn of a Possible Correction
Last week, the BTC/USD rate rose to the level of USD 38k per coin on the excitement associated with the expected launch of a spot Bitcoin ETF.
However, as the week begins, bitcoin price performance shows signs that the hype appears to be waning:
→ the speed with which the price dropped from the upper boundary of the channel and the high of the year to the middle of the channel (about -USD 1,700 in a few hours) indicates the aggressiveness of sellers;
→ the price tried to resume its upward trend, but failed. This can be seen from the downward reversals from the level of 37,500
→ the fact that the slopes of trend lines (shown in black) become less sharp is also a sign of weakening bullish sentiment.
It turns out that after a pronounced surge last week, the price has already dropped below the median line of the channel, and the MACD remains in the red zone.
Moreover, JP Morgan analysts point to fundamental reasons why a correction may follow the hype. Among them:
→ The fact that spot Bitcoin ETFs are already active in Switzerland and Canada. If they really wanted to, investors could invest in them rather than wait for approval from the US SEC. Therefore, if the regulator gives the go-ahead, this will not mean a sharp influx of capital from buyers.
→ That the approval of spot Bitcoin ETFs in the US may already be priced in.
→ The assumption that court decisions in favor of crypto companies in disputes with the SEC will do little to clarify the regulation of cryptocurrencies in the United States.
Nevertheless, there is still potential for the price of bitcoin to rise to the psychological level of 40,000, if only because the ascending blue channel has not yet been broken.
To benefit from the rise and fall of prices in the cryptocurrency markets, consider enlisting the services of a trusted broker like FXOpen.
CFDs are complex instruments and come with a high risk of losing your money.
This article represents the opinion of the Companies operating under the FXOpen brand only. It is not to be construed as an offer, solicitation, or recommendation with respect to products and services provided by the Companies operating under the FXOpen brand, nor is it to be considered financial advice.
At FXOpen UK and FXOpen AU, Cryptocurrency CFDs are only available for trading by those clients categorised as Professional clients under FCA Rules and Professional clients under ASIC Rules, respectively. They are not available for trading by Retail clients.
#marketanalysis #sp500 #stocktrading #stockmarket
Market Analysis: Morgan Stanley Analysts Raise Forecasts for S&P 500
According to them:
→ the price of the S&P 500 index will reach 4,500 at the end of the year (previous forecast = 4,200);
→ the dollar will continue to remain strong.
According to Goldman Sachs analysts, published yesterday, the price of the S&P 500 index will fluctuate around current levels, forming a consolidation zone.
That is, a decline in the S&P 500 is not a priority scenario. An important test that will provide more important information about current market sentiment will occur today: US inflation data will be published at 16:30 GMT+3. According to forecasts, it will slow down from 3.7% to 3.3%.
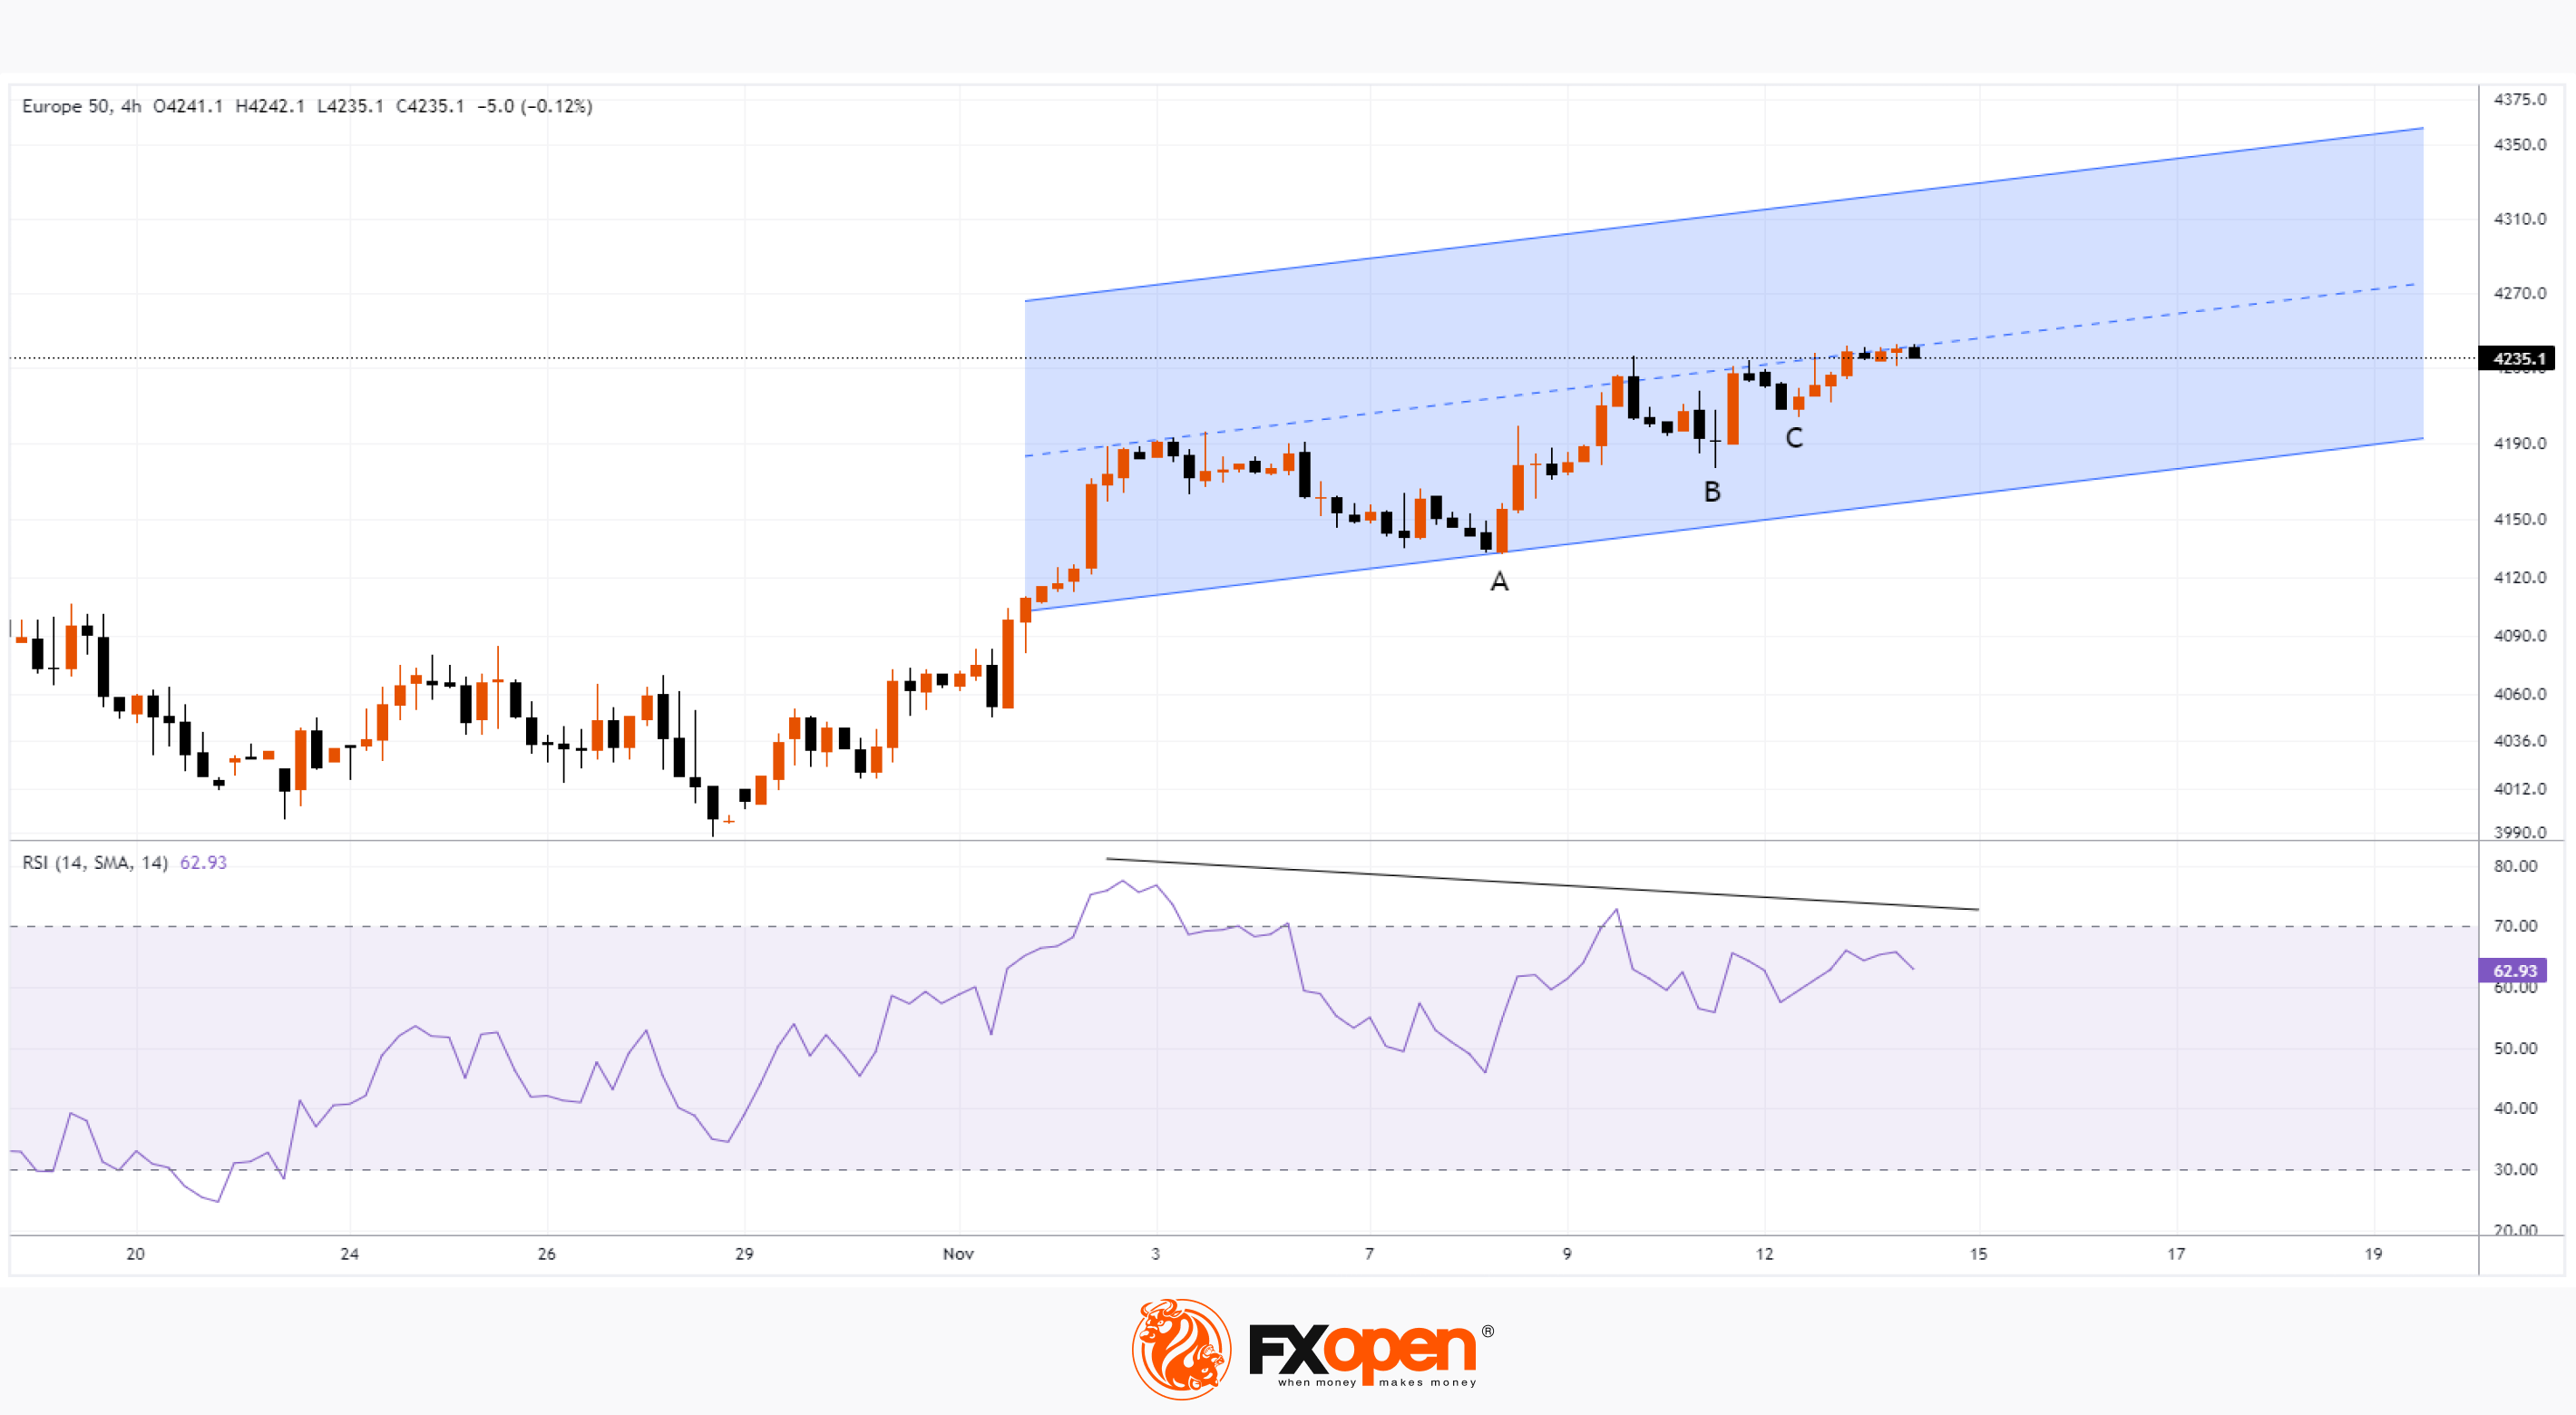
In anticipation of news, E-mini S&P 500 index futures are showing reduced volatility. If inflation data gives rise to bullish momentum, it is possible that the price of the S&P 500 will move up, pushing off from the median line of the ascending channel (shown in blue). Then, justifying the forecasts of MS analysts, the price may reach the upper limit of the channel this month.
Also worth paying attention to:
→ increasing local minima A, B, C show signs of demand strength;
→ RSI indicates non-divergence, increasing the likelihood of a movement to the lower border of the channel.
To benefit from trends in the world's stock markets, consider enlisting the services of a trusted broker like FXOpen.
CFDs are complex instruments and come with a high risk of losing your money.
This article represents the opinion of the Companies operating under the FXOpen brand only. It is not to be construed as an offer, solicitation, or recommendation with respect to products and services provided by the Companies operating under the FXOpen brand, nor is it to be considered financial advice.
Market Analysis: Morgan Stanley Analysts Raise Forecasts for S&P 500
According to them:
→ the price of the S&P 500 index will reach 4,500 at the end of the year (previous forecast = 4,200);
→ the dollar will continue to remain strong.
According to Goldman Sachs analysts, published yesterday, the price of the S&P 500 index will fluctuate around current levels, forming a consolidation zone.
That is, a decline in the S&P 500 is not a priority scenario. An important test that will provide more important information about current market sentiment will occur today: US inflation data will be published at 16:30 GMT+3. According to forecasts, it will slow down from 3.7% to 3.3%.
In anticipation of news, E-mini S&P 500 index futures are showing reduced volatility. If inflation data gives rise to bullish momentum, it is possible that the price of the S&P 500 will move up, pushing off from the median line of the ascending channel (shown in blue). Then, justifying the forecasts of MS analysts, the price may reach the upper limit of the channel this month.
Also worth paying attention to:
→ increasing local minima A, B, C show signs of demand strength;
→ RSI indicates non-divergence, increasing the likelihood of a movement to the lower border of the channel.
To benefit from trends in the world's stock markets, consider enlisting the services of a trusted broker like FXOpen.
CFDs are complex instruments and come with a high risk of losing your money.
This article represents the opinion of the Companies operating under the FXOpen brand only. It is not to be construed as an offer, solicitation, or recommendation with respect to products and services provided by the Companies operating under the FXOpen brand, nor is it to be considered financial advice.
#marketanalysis #inflation #financialmarkets
Market Analysis: Important News on US Inflation Rock Financial Markets
According to data published yesterday, the actual CPI value was = 3.2%, expected = 3.3%, previous value = 3.7%. The Core CPI value also dropped from the previous value = 0.2% to the current value = 0.1%.
Thus, inflation in the United States is confidently approaching the target of 2%, which minimises the likelihood of further tightening of monetary policy.
The news was followed by a sharp weakening of the dollar as market participants believe the rate hike cycle is over. Now the topic of discussion “when the Fed will start cutting rates” is becoming more relevant. It is expected that monetary policy easing is just around the corner, and a more affordable dollar will create conditions for business development.
As a result, US dollar-denominated financial assets rose sharply in price amid news of falling inflation:
→ gold rose in price by approximately 1.2% to the resistance level of 1,970;
→ shares went up in price. The S&P 500 index even broke through the upper boundary of the channel, which we indicated in yesterday's analysis, indicating signals of increased demand;
→ currencies rose in price paired with the dollar.
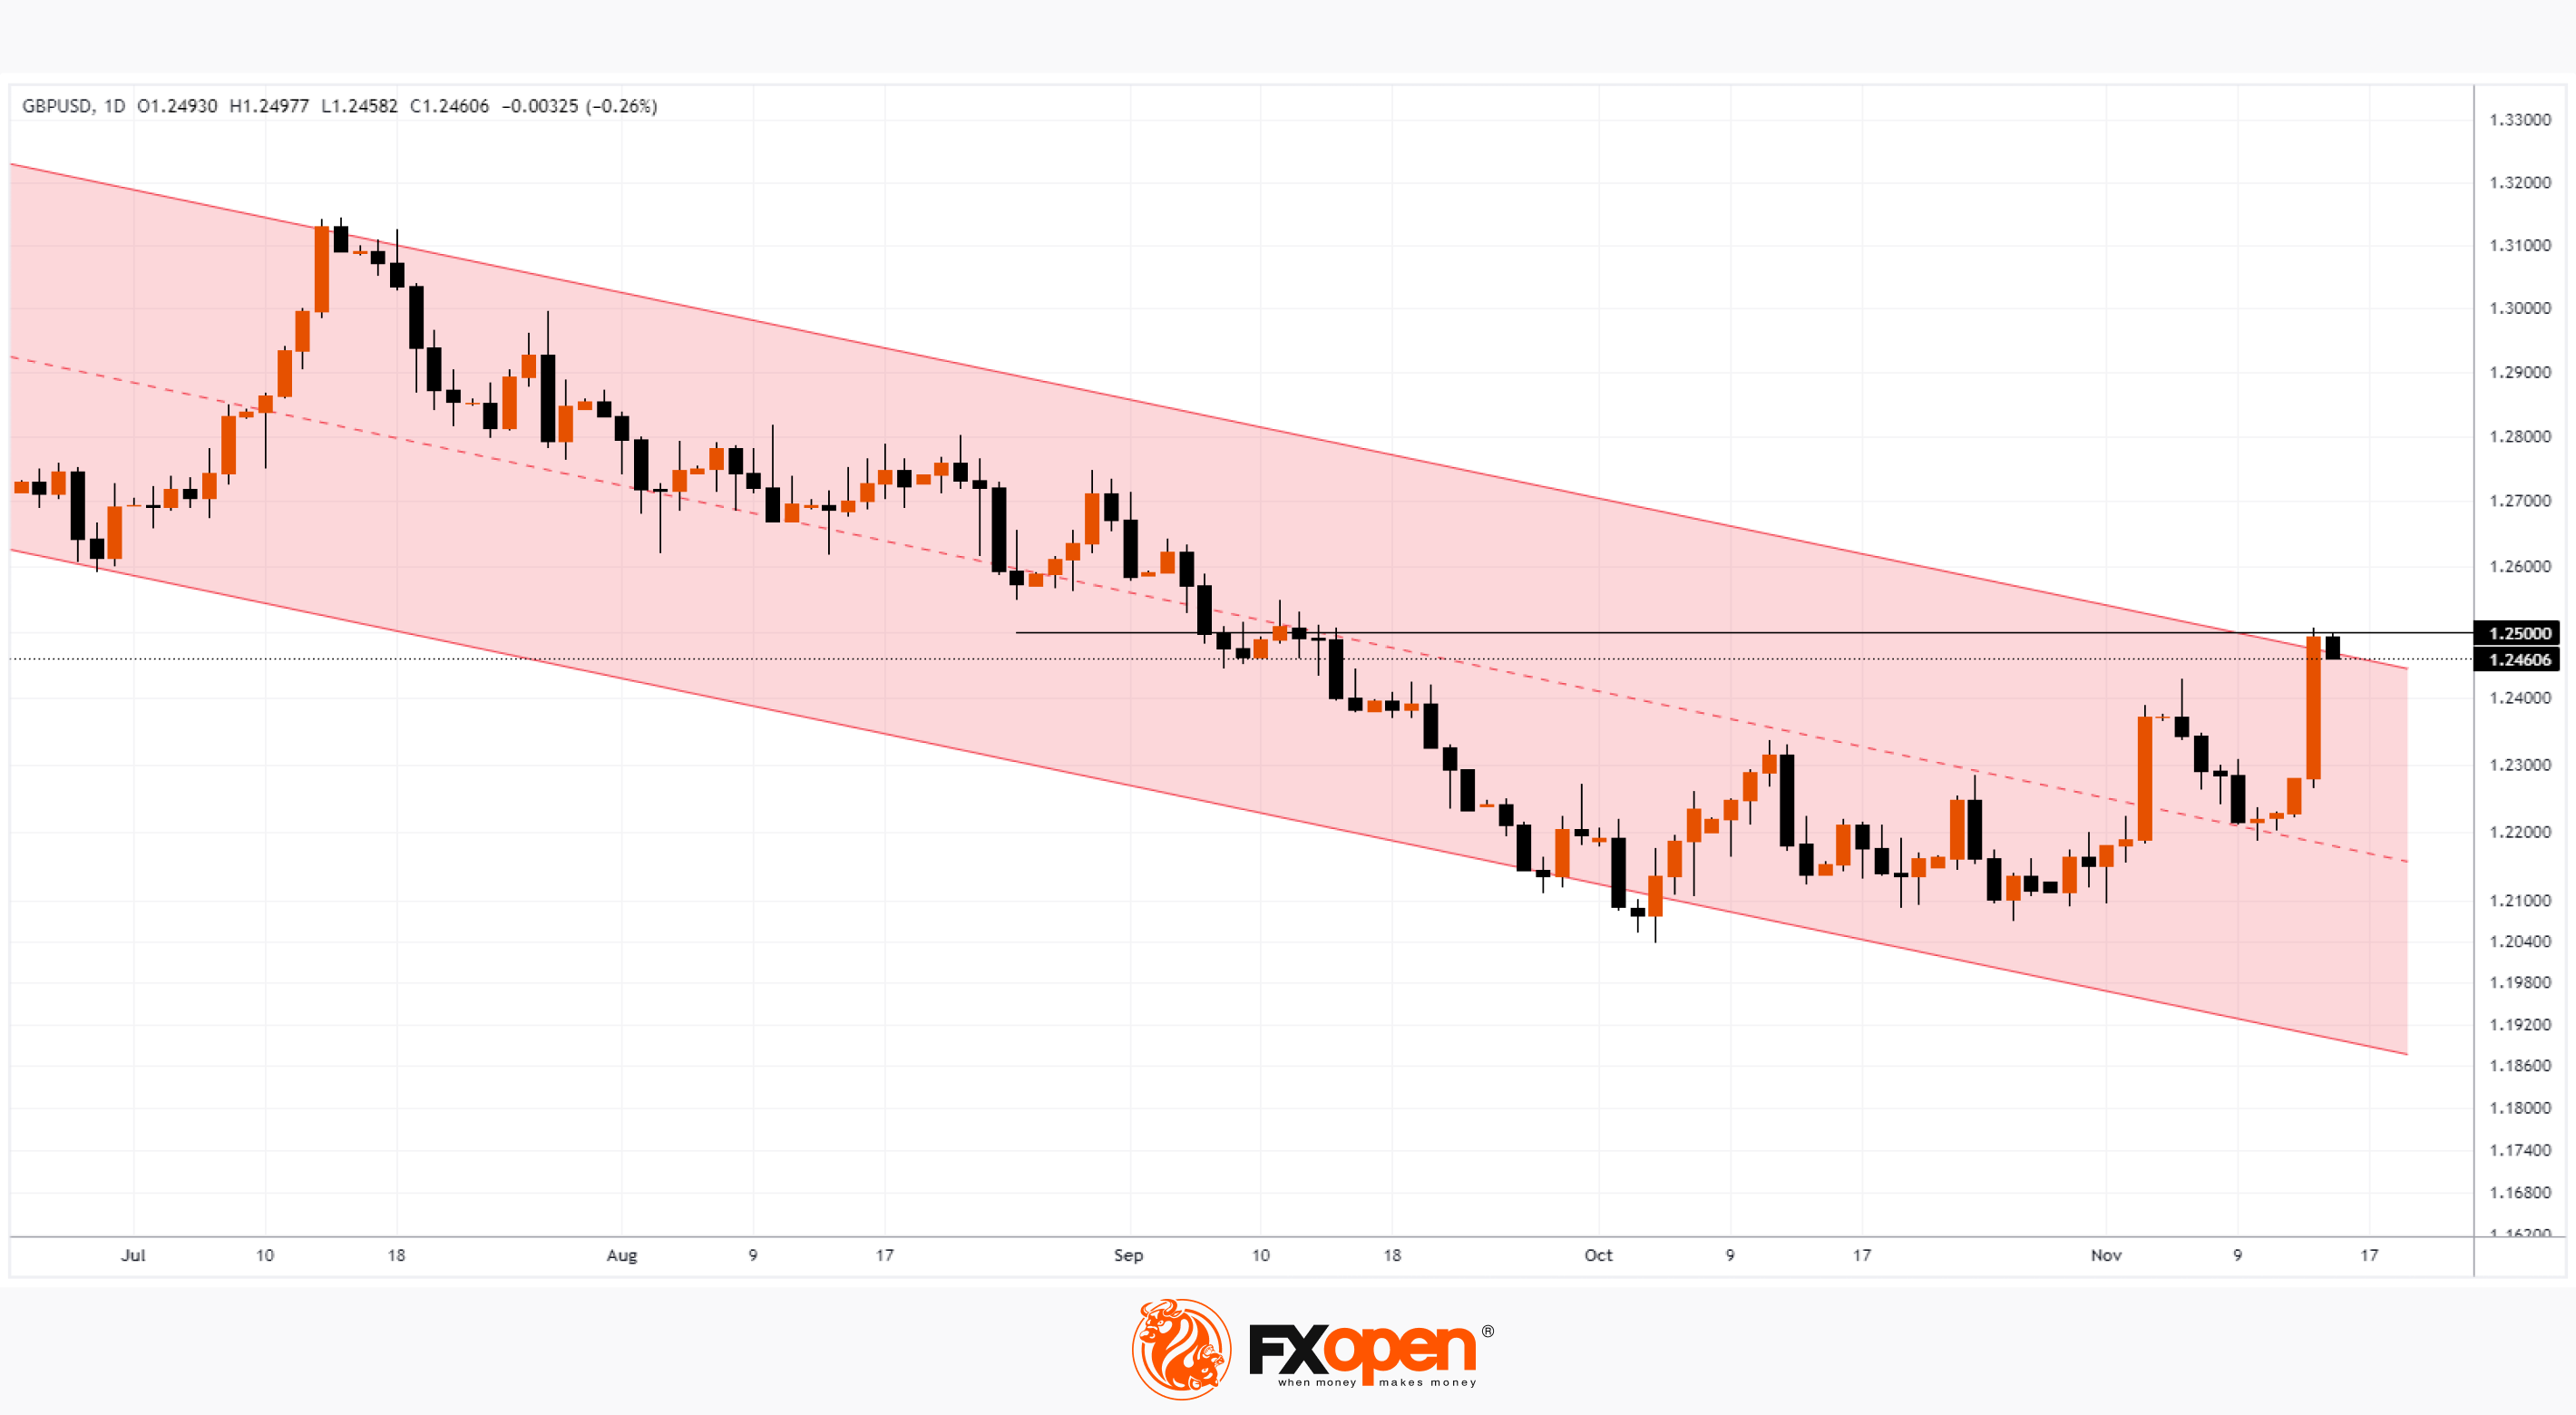
The GBP/USD rate rose yesterday to a 2-month high.
However, today there was news about the level of inflation now from the UK. The CPI index was: actual = 4.6%, expected = 4.7%, previous value = 6.7%.
That is, the fight against inflation in the UK is also yielding results, although it will most likely take longer to achieve the target indicators than in the USA.
The reaction to today's news was a slight decline in GBP/USD after yesterday's rise.
Moreover, the daily chart shows that technically, a rollback can develop into a more significant movement, since:
→ the rate is near the upper border of an important downward channel (shown in red);
→ the resistance level for GBP/USD could be the psychological level of 1.25 pounds per US dollar.
To benefit from fluctuations in the foreign exchange markets, consider enlisting the services of a trusted broker like FXOpen.
CFDs are complex instruments and come with a high risk of losing your money.
This article represents the opinion of the Companies operating under the FXOpen brand only. It is not to be construed as an offer, solicitation, or recommendation with respect to products and services provided by the Companies operating under the FXOpen brand, nor is it to be considered financial advice.
Market Analysis: Important News on US Inflation Rock Financial Markets
According to data published yesterday, the actual CPI value was = 3.2%, expected = 3.3%, previous value = 3.7%. The Core CPI value also dropped from the previous value = 0.2% to the current value = 0.1%.
Thus, inflation in the United States is confidently approaching the target of 2%, which minimises the likelihood of further tightening of monetary policy.
The news was followed by a sharp weakening of the dollar as market participants believe the rate hike cycle is over. Now the topic of discussion “when the Fed will start cutting rates” is becoming more relevant. It is expected that monetary policy easing is just around the corner, and a more affordable dollar will create conditions for business development.
As a result, US dollar-denominated financial assets rose sharply in price amid news of falling inflation:
→ gold rose in price by approximately 1.2% to the resistance level of 1,970;
→ shares went up in price. The S&P 500 index even broke through the upper boundary of the channel, which we indicated in yesterday's analysis, indicating signals of increased demand;
→ currencies rose in price paired with the dollar.
The GBP/USD rate rose yesterday to a 2-month high.
However, today there was news about the level of inflation now from the UK. The CPI index was: actual = 4.6%, expected = 4.7%, previous value = 6.7%.
That is, the fight against inflation in the UK is also yielding results, although it will most likely take longer to achieve the target indicators than in the USA.
The reaction to today's news was a slight decline in GBP/USD after yesterday's rise.
Moreover, the daily chart shows that technically, a rollback can develop into a more significant movement, since:
→ the rate is near the upper border of an important downward channel (shown in red);
→ the resistance level for GBP/USD could be the psychological level of 1.25 pounds per US dollar.
To benefit from fluctuations in the foreign exchange markets, consider enlisting the services of a trusted broker like FXOpen.
CFDs are complex instruments and come with a high risk of losing your money.
This article represents the opinion of the Companies operating under the FXOpen brand only. It is not to be construed as an offer, solicitation, or recommendation with respect to products and services provided by the Companies operating under the FXOpen brand, nor is it to be considered financial advice.
#MarketNews #marketanalysis #oilmarket #oilprices
Market Analysis: Citi Analysts Expect Brent to Reach $73 in 2024
Since the beginning of November, the price of Brent oil has decreased by more than 5%. This is due, among other things, to easing concerns about the escalation of the military conflict in the Middle East. According to the latest news:
→ Reuters: Iran does not plan to fight with Israel on the side of Hamas;
→ the UN Security Council adopted a resolution regarding the conflict.
Data on the growth of oil reserves in the United States above expectations also contributed to the price decline. Commercial crude oil inventories rose 4% to 439.4 million barrels from 421.9 million barrels last week, according to the Energy Information Administration. This is the highest inventory level since August.
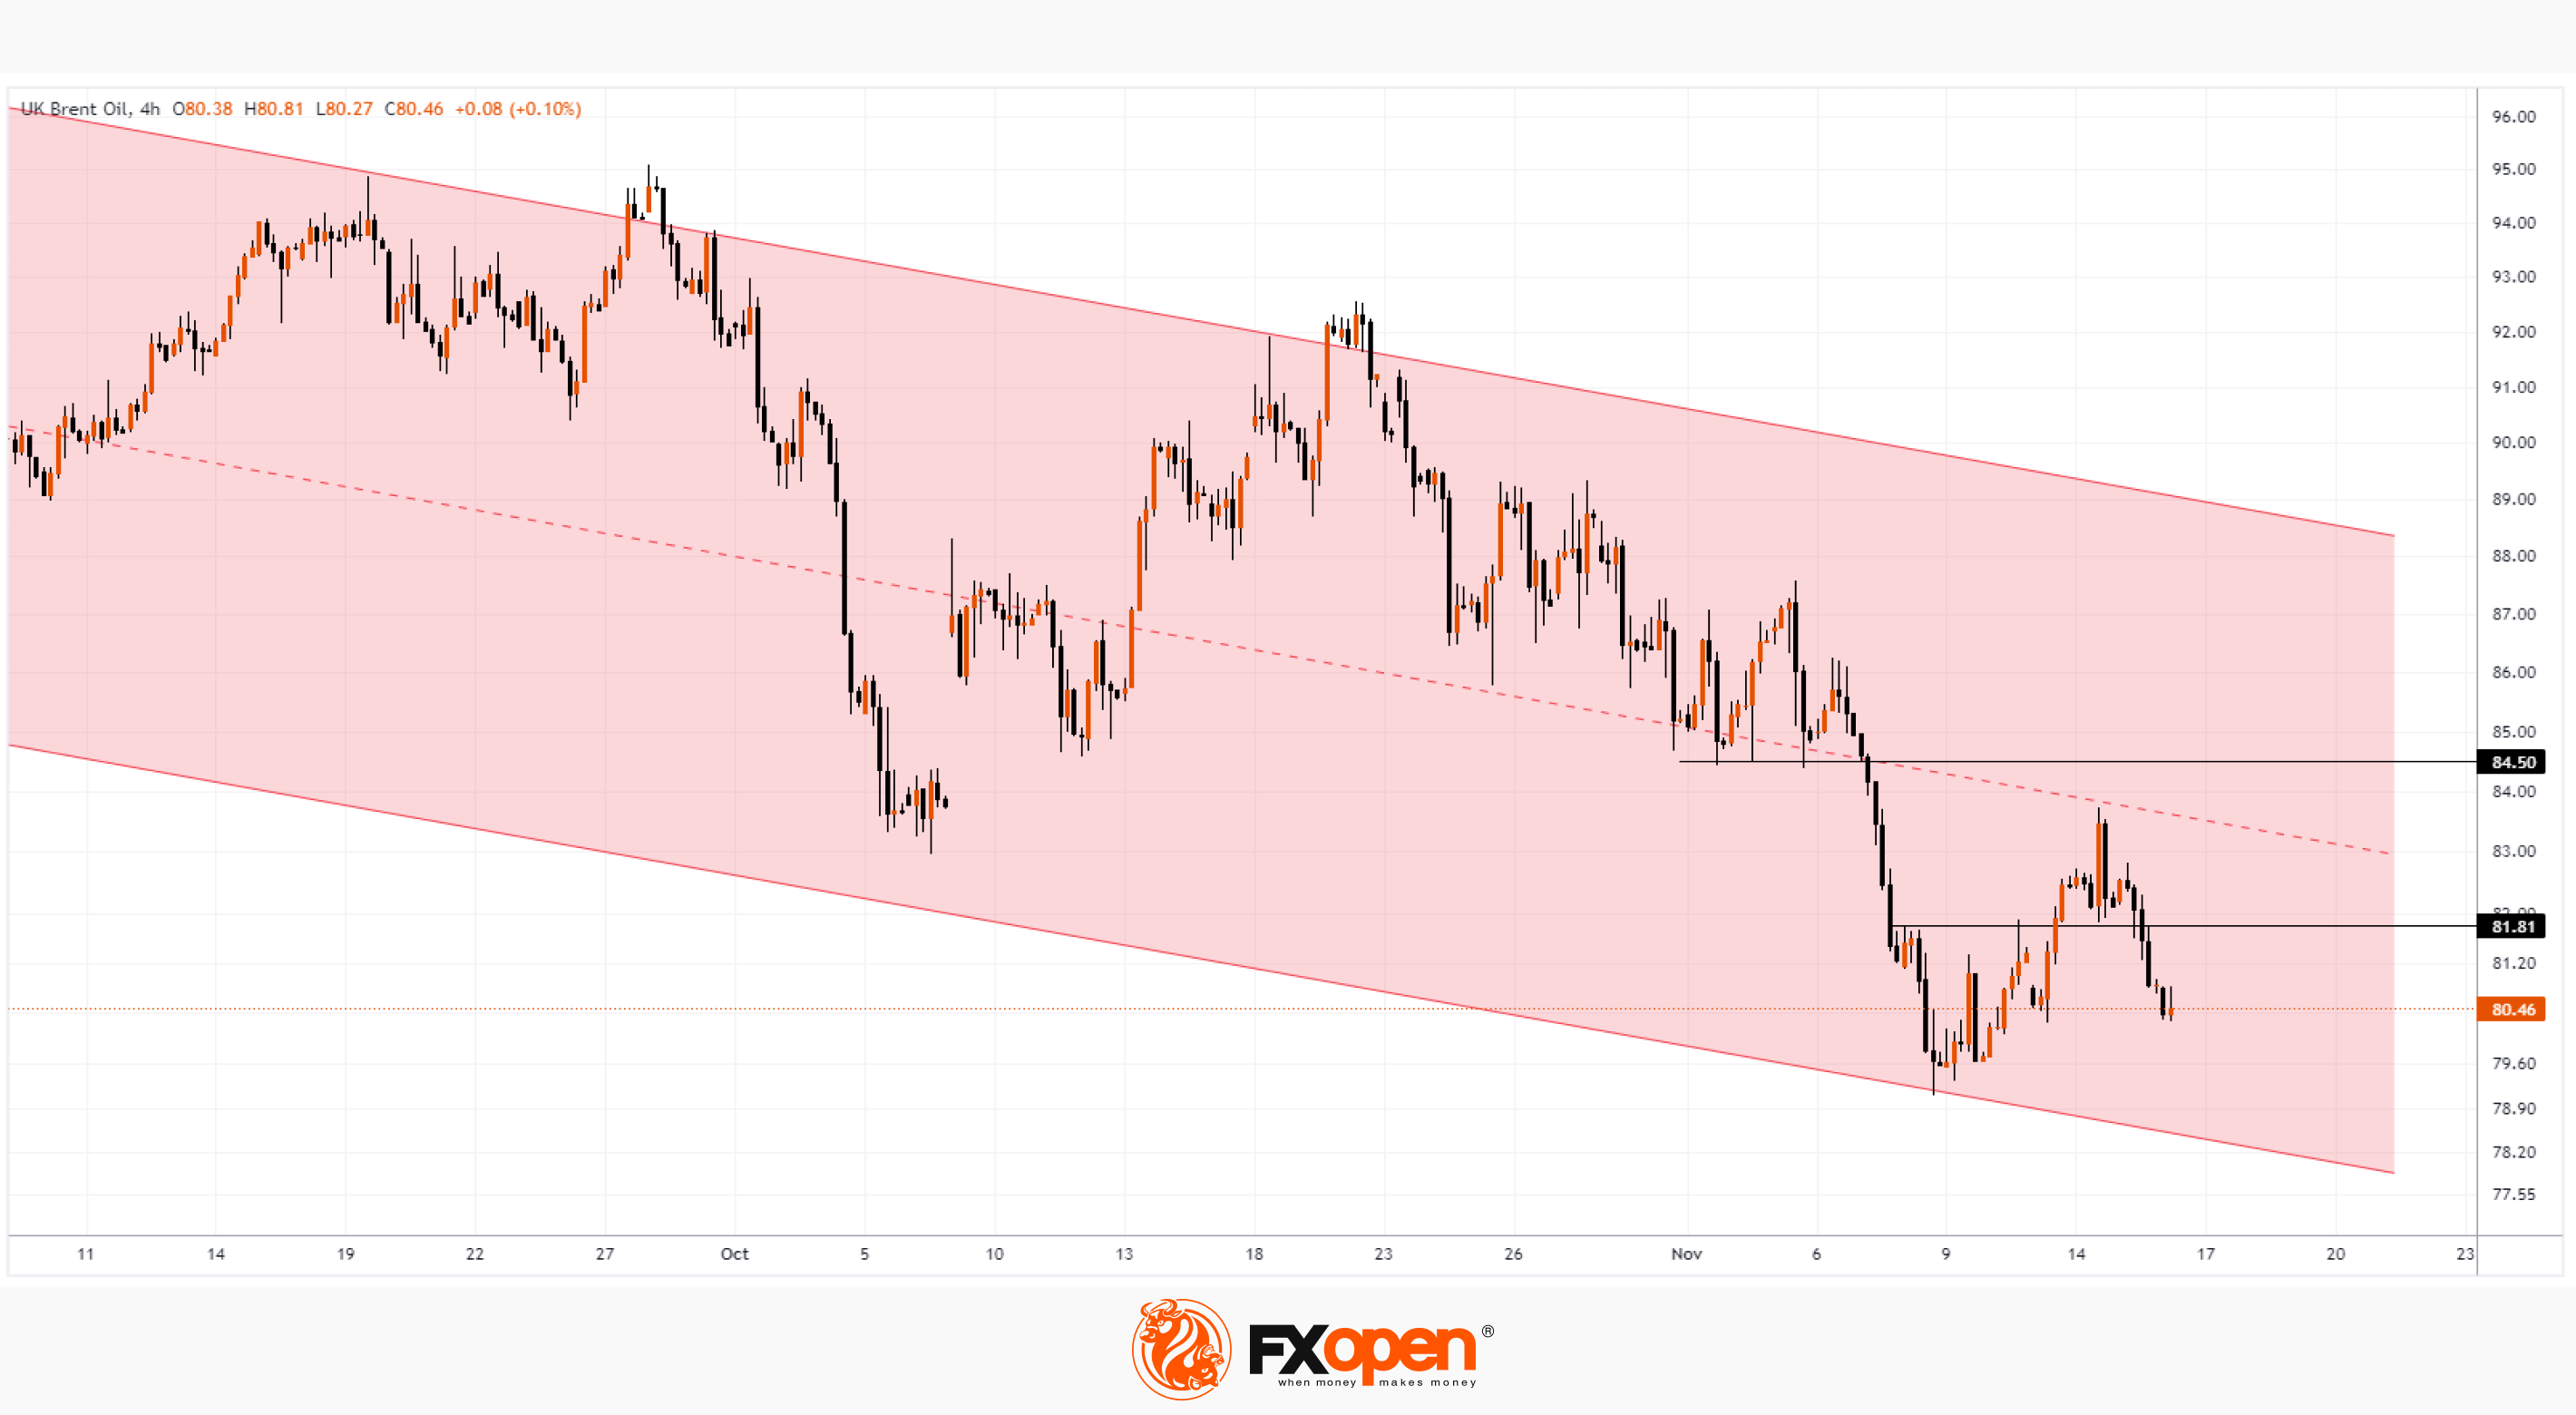
Technically, the price of Brent oil is in a downtrend (shown by red lines). Moreover:
→ on November 14, the Brent price tested the median line, which acted as resistance;
→ during this test, a bearish engulfing pattern was formed, which confirms the aggressiveness of sellers;
→ USD 81.81 may now serve as immediate resistance while another important level of USD 84.50 appears out of reach – at least in November.
If sellers strengthen their control, it is possible that the price of Brent oil may reach the lower line of the channel and thereby get closer to the forecasts of Citi analysts. In their opinion:
→ the forecast Brent price is USD 73 by the second quarter of 2024;
→ the forecast Brent price at the end of 2024 is at USD 68 per barrel.
To benefit from fluctuating energy prices, consider enlisting the services of a trusted broker like FXOpen.
CFDs are complex instruments and come with a high risk of losing your money.
This article represents the opinion of the Companies operating under the FXOpen brand only. It is not to be construed as an offer, solicitation, or recommendation with respect to products and services provided by the Companies operating under the FXOpen brand, nor is it to be considered financial advice.
Market Analysis: Citi Analysts Expect Brent to Reach $73 in 2024
Since the beginning of November, the price of Brent oil has decreased by more than 5%. This is due, among other things, to easing concerns about the escalation of the military conflict in the Middle East. According to the latest news:
→ Reuters: Iran does not plan to fight with Israel on the side of Hamas;
→ the UN Security Council adopted a resolution regarding the conflict.
Data on the growth of oil reserves in the United States above expectations also contributed to the price decline. Commercial crude oil inventories rose 4% to 439.4 million barrels from 421.9 million barrels last week, according to the Energy Information Administration. This is the highest inventory level since August.
Technically, the price of Brent oil is in a downtrend (shown by red lines). Moreover:
→ on November 14, the Brent price tested the median line, which acted as resistance;
→ during this test, a bearish engulfing pattern was formed, which confirms the aggressiveness of sellers;
→ USD 81.81 may now serve as immediate resistance while another important level of USD 84.50 appears out of reach – at least in November.
If sellers strengthen their control, it is possible that the price of Brent oil may reach the lower line of the channel and thereby get closer to the forecasts of Citi analysts. In their opinion:
→ the forecast Brent price is USD 73 by the second quarter of 2024;
→ the forecast Brent price at the end of 2024 is at USD 68 per barrel.
To benefit from fluctuating energy prices, consider enlisting the services of a trusted broker like FXOpen.
CFDs are complex instruments and come with a high risk of losing your money.
This article represents the opinion of the Companies operating under the FXOpen brand only. It is not to be construed as an offer, solicitation, or recommendation with respect to products and services provided by the Companies operating under the FXOpen brand, nor is it to be considered financial advice.
#marketanalysis #tradingforex #currencytrading
Market Analysis: EUR/JPY: New High for 2023
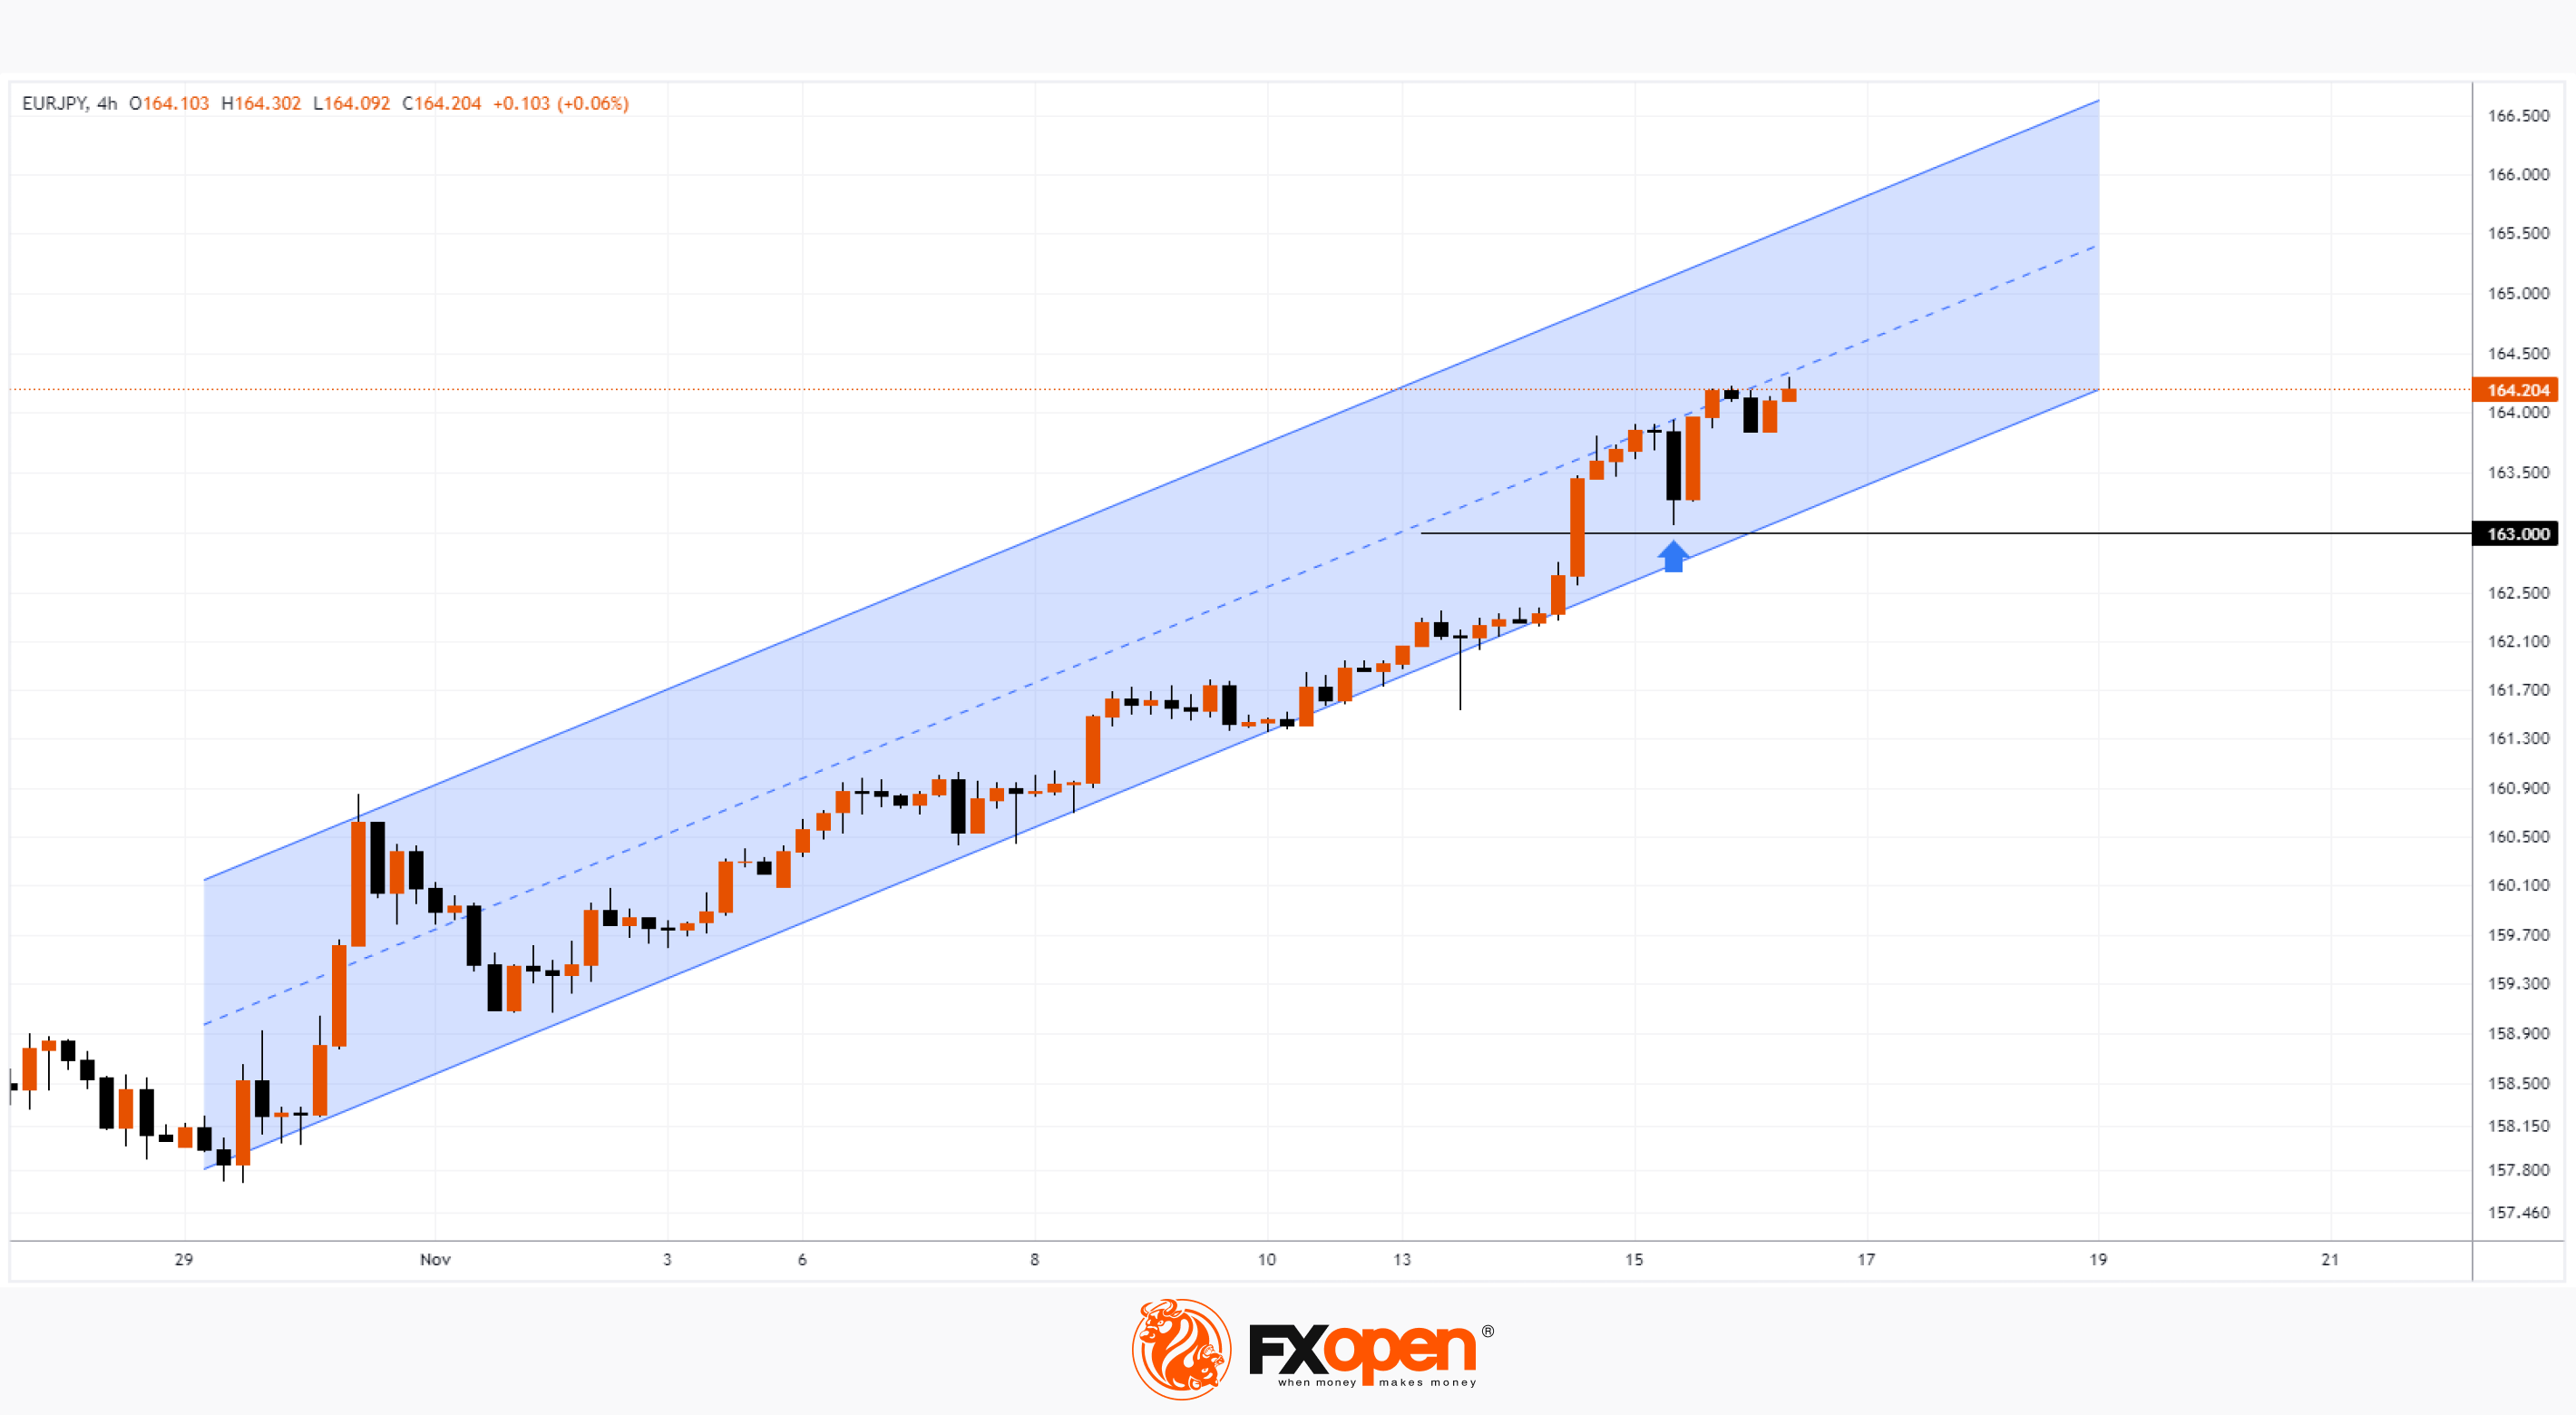
This morning on Forex one euro was given 164.25 yen - the last time this happened was back in 2008, at the height of the financial crisis. The growth of EUR/JPY since the beginning of 2023 is already about 17%.
How far can the rate rise?
From a fundamental point of view, the growth of the exchange rate is due to the difference in the policies of the ECB and the Bank of Japan. However, this may change. “The Bank of Japan is probably now in the process of looking for the right time to raise interest rates,” a source told Reuters. Insiders say the Bank of Japan's tightening tone is preparing markets for an end to negative interest rates, which could happen in the first few months of next year.
From a technical point of view, the bulls have a clear advantage:
→ the price confidently broke through the level of 163 yen per euro, after which a test of the breakdown occurred - the bears tried to lower the price to the round level, but their pressure quickly dried up (shown by the arrow). The price rose sharply indicating that this was only a short-term correction.
→ if the dominance of demand continues, the price may reach the upper limit of the ascending channel, which will mean a rise in the euro to 165 or even 166 yen.
In such a situation, when the rate updates its highs of the year every week, the idea of a long position may be too obvious. What if the accelerating growth of the EUR/JPY exchange rate is the initial stage of a stock exchange bubble, which may burst against the backdrop of decisions from the Bank of Japan?
Bank of Japan Governor Kazuo Ueda said last week that it would not be necessary to wait for real wages to become positive to phase out stimulus. What is this if not a hint at an end to the monetary policy pursued by the bank's previous head, Haruhiko Kuroda (who is blamed for a host of problems, including the sharp fall of the yen)?
Exercise caution when benefiting from fluctuations in the foreign exchange market with a trusted broker like FXOpen.
CFDs are complex instruments and come with a high risk of losing your money.
This article represents the opinion of the Companies operating under the FXOpen brand only. It is not to be construed as an offer, solicitation, or recommendation with respect to products and services provided by the Companies operating under the FXOpen brand, nor is it to be considered financial advice.
Market Analysis: EUR/JPY: New High for 2023
This morning on Forex one euro was given 164.25 yen - the last time this happened was back in 2008, at the height of the financial crisis. The growth of EUR/JPY since the beginning of 2023 is already about 17%.
How far can the rate rise?
From a fundamental point of view, the growth of the exchange rate is due to the difference in the policies of the ECB and the Bank of Japan. However, this may change. “The Bank of Japan is probably now in the process of looking for the right time to raise interest rates,” a source told Reuters. Insiders say the Bank of Japan's tightening tone is preparing markets for an end to negative interest rates, which could happen in the first few months of next year.
From a technical point of view, the bulls have a clear advantage:
→ the price confidently broke through the level of 163 yen per euro, after which a test of the breakdown occurred - the bears tried to lower the price to the round level, but their pressure quickly dried up (shown by the arrow). The price rose sharply indicating that this was only a short-term correction.
→ if the dominance of demand continues, the price may reach the upper limit of the ascending channel, which will mean a rise in the euro to 165 or even 166 yen.
In such a situation, when the rate updates its highs of the year every week, the idea of a long position may be too obvious. What if the accelerating growth of the EUR/JPY exchange rate is the initial stage of a stock exchange bubble, which may burst against the backdrop of decisions from the Bank of Japan?
Bank of Japan Governor Kazuo Ueda said last week that it would not be necessary to wait for real wages to become positive to phase out stimulus. What is this if not a hint at an end to the monetary policy pursued by the bank's previous head, Haruhiko Kuroda (who is blamed for a host of problems, including the sharp fall of the yen)?
Exercise caution when benefiting from fluctuations in the foreign exchange market with a trusted broker like FXOpen.
CFDs are complex instruments and come with a high risk of losing your money.
This article represents the opinion of the Companies operating under the FXOpen brand only. It is not to be construed as an offer, solicitation, or recommendation with respect to products and services provided by the Companies operating under the FXOpen brand, nor is it to be considered financial advice.
#MarketNews #stockmarket #stocktrading
Market Analysis: MarketWatch Warns of Stock Market Trap
According to statistics since 1971, when the Nasdaq Index was created, the index price has been within the bullish trend approximately 75% of the days and 25% of the days within the bearish trend. But what’s interesting is that if you take the 100 largest bullish candles during this time, then 80% of them will occur during those periods when the market was in a bearish trend. A similar pattern can be observed for the S&P 500 index, which has a deeper history.
It turns out that the strongest one-day rallies occur during downturns — why is that so? The reasons may be:
→ emotions of market participants who strive to take long positions at the very beginning of the rally;
→ properties of bear markets, which are inherently more volatile than bull markets.
How does this relate to the current situation?
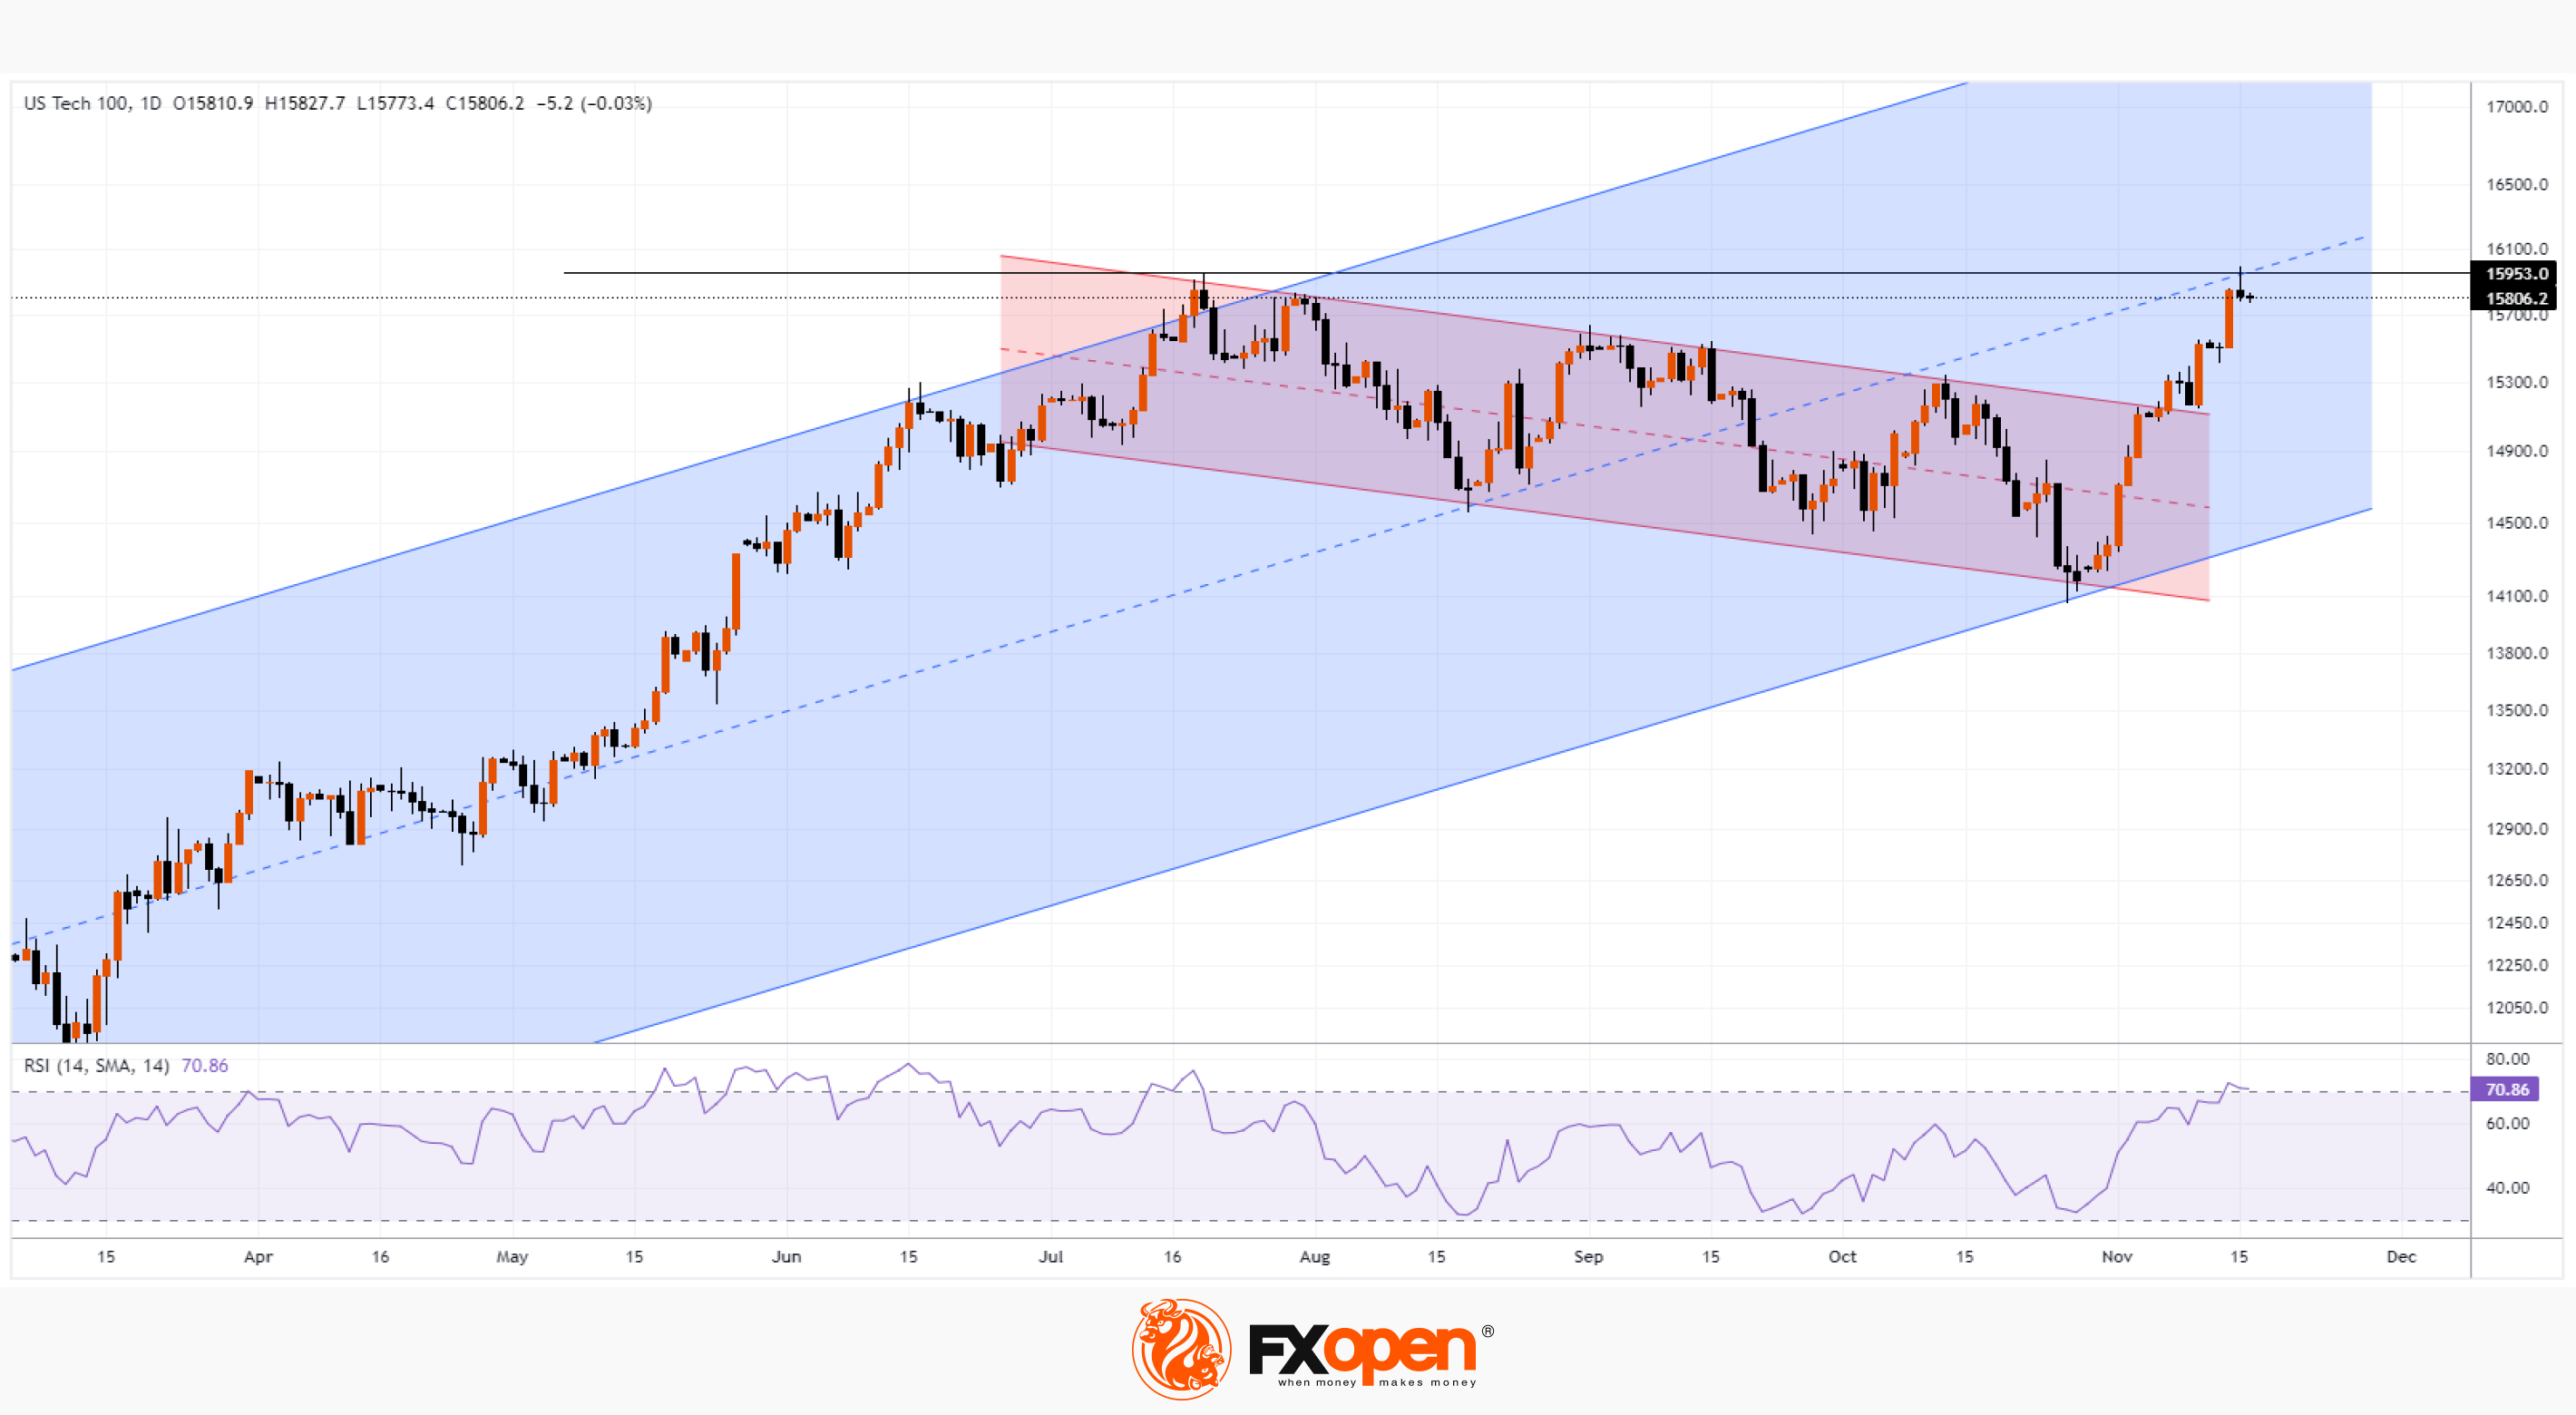
Of course, it is difficult to call the current market bearish. However, the MarketWatch article may be relevant due to the signals of weakness that the chart shows:
→ On Tuesday, there was a sharp rally against the backdrop of the release of favorable news about inflation. At the same time, the price moved away from the downward red correction channel, which was drawn within the current upward trend of 2023;
→ yesterday, as the chart shows, the index set the maximum of the year in the area of 15953 — but at the same time, the shape of the candle shows that the bears were active: since the candle closed at the lows with a long upper tail;
→ the price tested the median line of the ascending blue channel from bottom to top – it showed itself as resistance;
→ the RSI indicator entered the overbought zone for the first time since July.
The listed facts can be considered arguments to expect a correction in the index price after a noticeable increase from the lows set at the end of October.
To benefit from stock market fluctuations, consider enlisting the services of a trusted broker like FXOpen.
CFDs are complex instruments and come with a high risk of losing your money.
This article represents the opinion of the Companies operating under the FXOpen brand only. It is not to be construed as an offer, solicitation, or recommendation with respect to products and services provided by the Companies operating under the FXOpen brand, nor is it to be considered financial advice.
Market Analysis: MarketWatch Warns of Stock Market Trap
According to statistics since 1971, when the Nasdaq Index was created, the index price has been within the bullish trend approximately 75% of the days and 25% of the days within the bearish trend. But what’s interesting is that if you take the 100 largest bullish candles during this time, then 80% of them will occur during those periods when the market was in a bearish trend. A similar pattern can be observed for the S&P 500 index, which has a deeper history.
It turns out that the strongest one-day rallies occur during downturns — why is that so? The reasons may be:
→ emotions of market participants who strive to take long positions at the very beginning of the rally;
→ properties of bear markets, which are inherently more volatile than bull markets.
How does this relate to the current situation?
Of course, it is difficult to call the current market bearish. However, the MarketWatch article may be relevant due to the signals of weakness that the chart shows:
→ On Tuesday, there was a sharp rally against the backdrop of the release of favorable news about inflation. At the same time, the price moved away from the downward red correction channel, which was drawn within the current upward trend of 2023;
→ yesterday, as the chart shows, the index set the maximum of the year in the area of 15953 — but at the same time, the shape of the candle shows that the bears were active: since the candle closed at the lows with a long upper tail;
→ the price tested the median line of the ascending blue channel from bottom to top – it showed itself as resistance;
→ the RSI indicator entered the overbought zone for the first time since July.
The listed facts can be considered arguments to expect a correction in the index price after a noticeable increase from the lows set at the end of October.
To benefit from stock market fluctuations, consider enlisting the services of a trusted broker like FXOpen.
CFDs are complex instruments and come with a high risk of losing your money.
This article represents the opinion of the Companies operating under the FXOpen brand only. It is not to be construed as an offer, solicitation, or recommendation with respect to products and services provided by the Companies operating under the FXOpen brand, nor is it to be considered financial advice.
#marketanalysis #stockmarket #stockprice #MSFT
MSFT Analysis: New All-time High
Yesterday, Microsoft's share price exceeded USD 375 for the first time ever. This happened against the backdrop of news about the company’s activities, which was favorably received by investors:
→ Microsoft introduced its own Maia 100 chip for cloud computing and AI programs that create content. The company is also testing Maia 100 for Bing and Office.
→ The company also presented Cobalt — a server processor,
→ and more: new AI tools from the Copilot series. For example, Copilot for Azure is an AI assistant for clients of a cloud computing service that works in chat mode.
Expectations that the Fed will cut rates, which intensified following Tuesday's inflation news, is another factor contributing to the bullish sentiment in Microsoft shares.
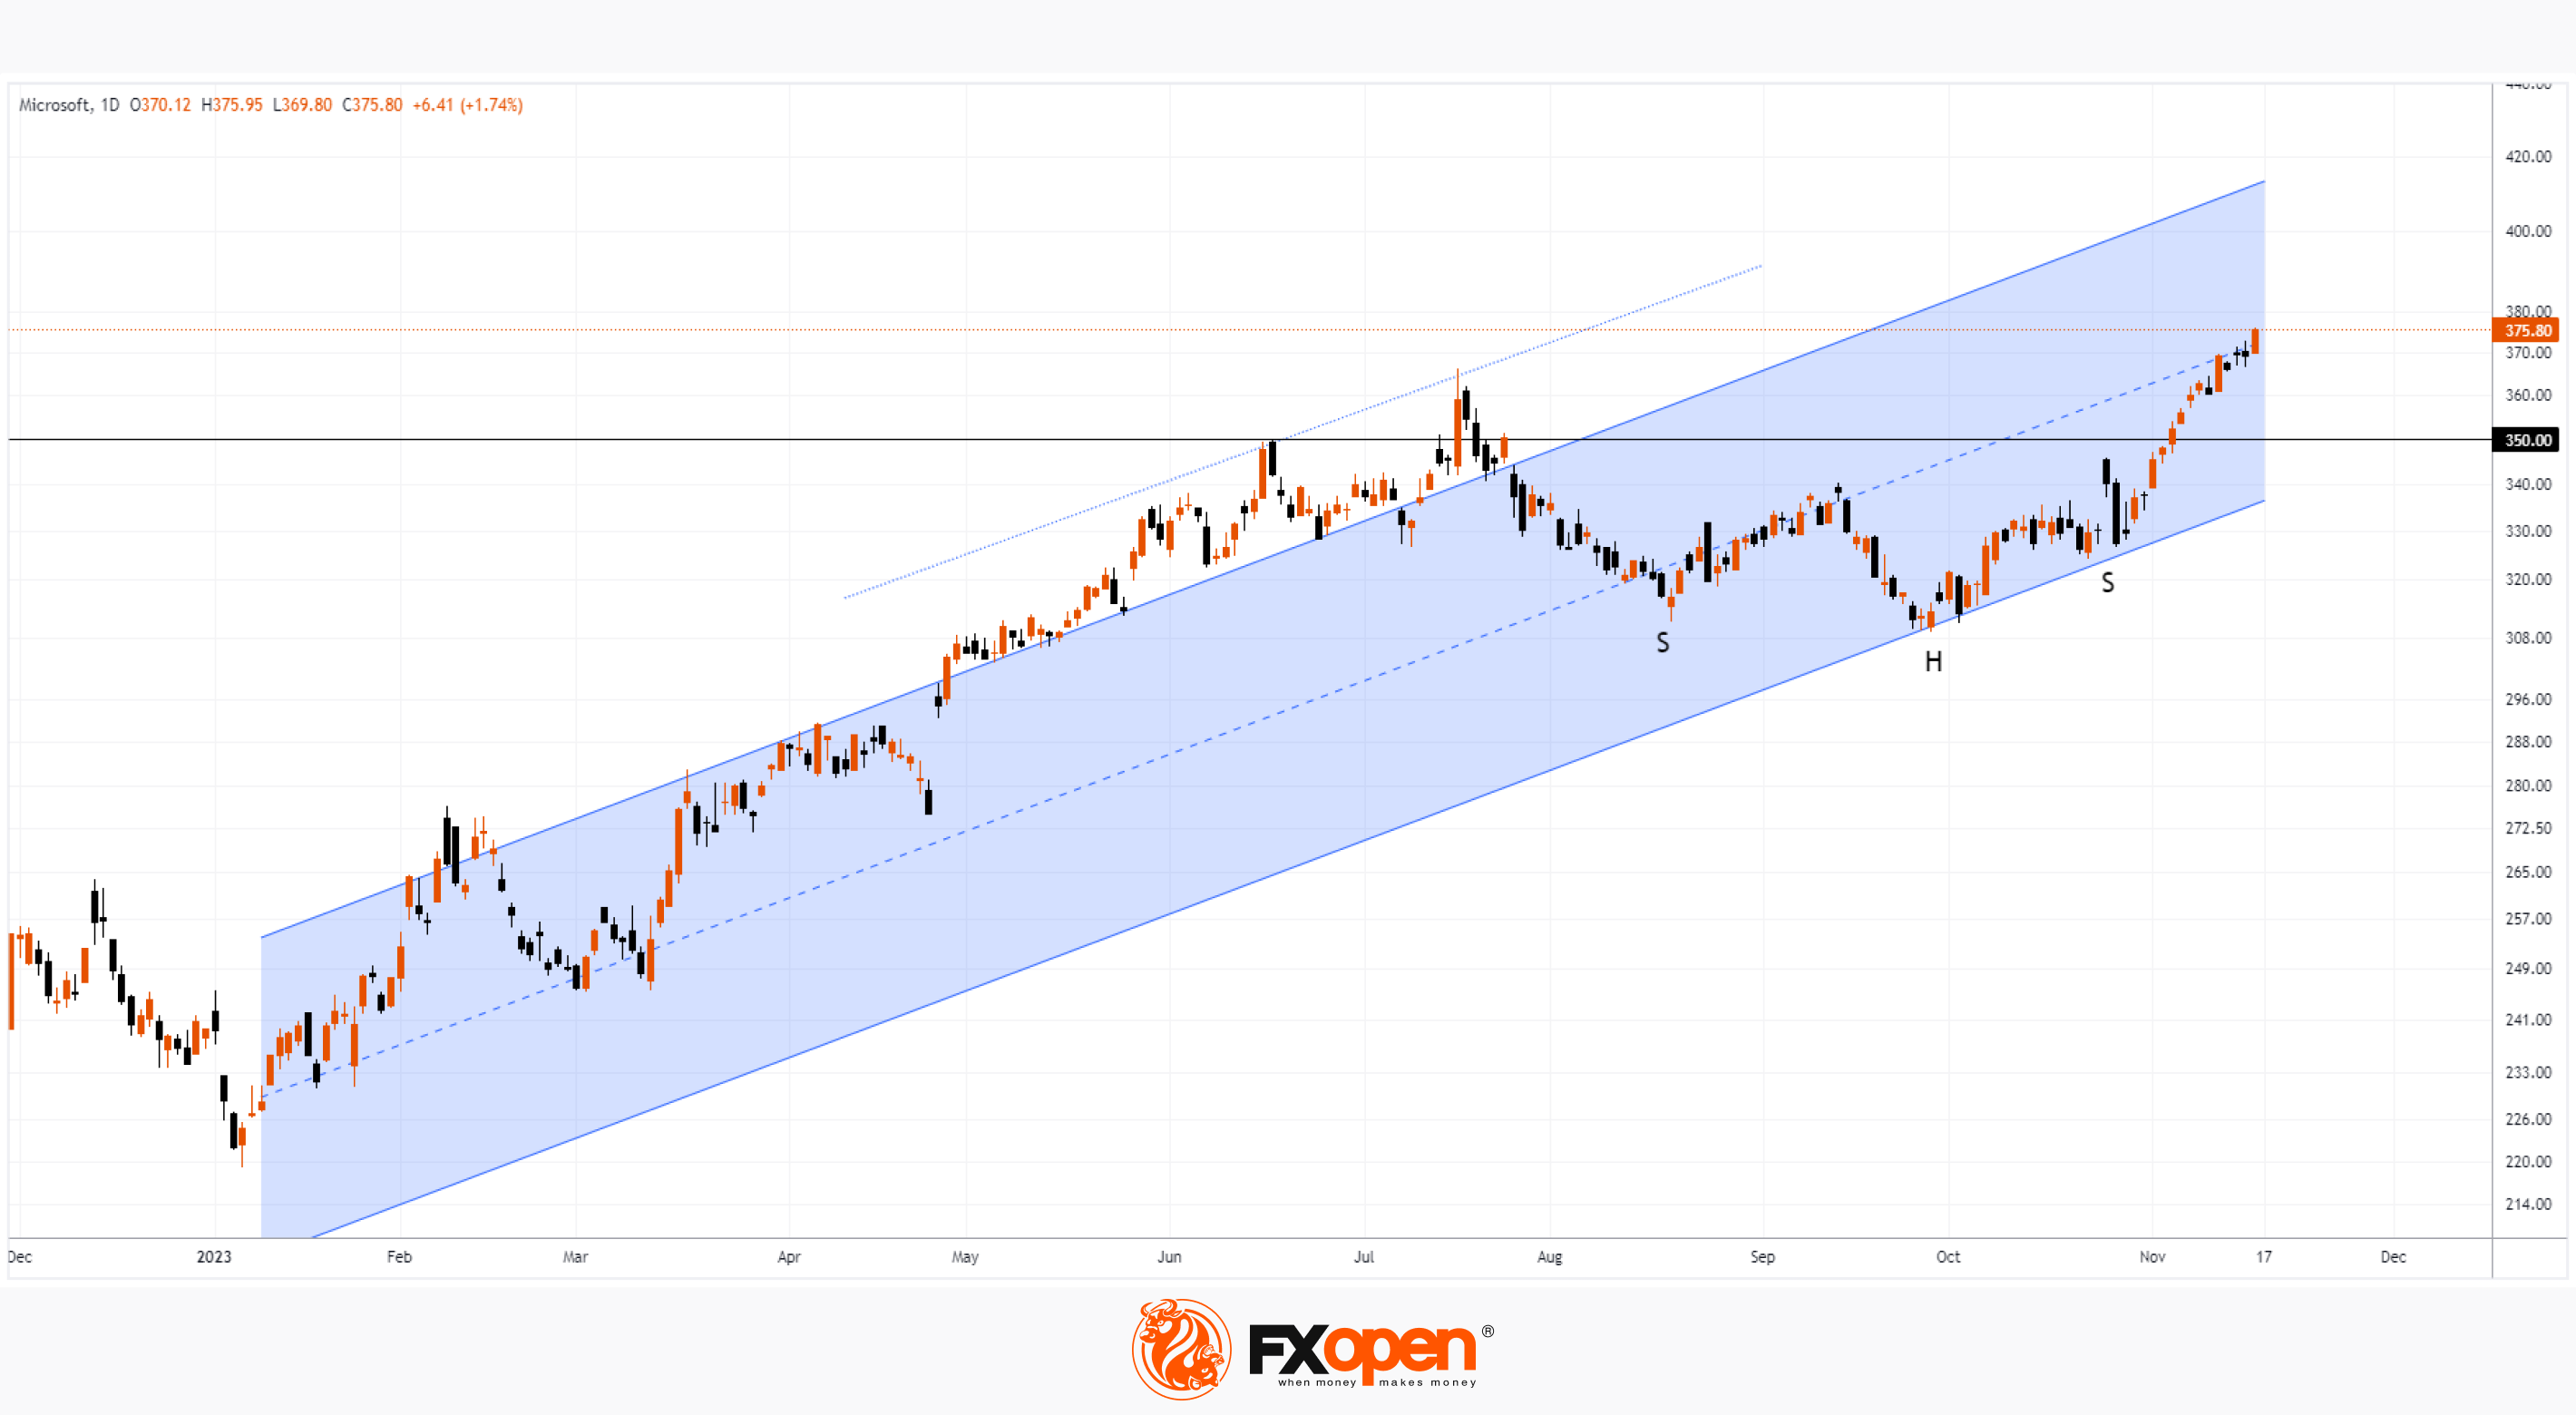
The graph shows that:
→ the level of USD 350 per share, which served as resistance, has been broken. Now you can expect support from him;
→ an inverted head-and-shoulders formation remains below.
→ MSFT price is near the median line of the rising channel (shown in blue), where supply and demand tend to balance out, so some consolidation after the November rally looks in order.
To benefit from the fluctuations in share prices of the world's most popular companies, consider enlisting the services of a trusted broker like FXOpen.
CFDs are complex instruments and come with a high risk of losing your money.
This article represents the opinion of the Companies operating under the FXOpen brand only. It is not to be construed as an offer, solicitation, or recommendation with respect to products and services provided by the Companies operating under the FXOpen brand, nor is it to be considered financial advice.
MSFT Analysis: New All-time High
Yesterday, Microsoft's share price exceeded USD 375 for the first time ever. This happened against the backdrop of news about the company’s activities, which was favorably received by investors:
→ Microsoft introduced its own Maia 100 chip for cloud computing and AI programs that create content. The company is also testing Maia 100 for Bing and Office.
→ The company also presented Cobalt — a server processor,
→ and more: new AI tools from the Copilot series. For example, Copilot for Azure is an AI assistant for clients of a cloud computing service that works in chat mode.
Expectations that the Fed will cut rates, which intensified following Tuesday's inflation news, is another factor contributing to the bullish sentiment in Microsoft shares.
The graph shows that:
→ the level of USD 350 per share, which served as resistance, has been broken. Now you can expect support from him;
→ an inverted head-and-shoulders formation remains below.
→ MSFT price is near the median line of the rising channel (shown in blue), where supply and demand tend to balance out, so some consolidation after the November rally looks in order.
To benefit from the fluctuations in share prices of the world's most popular companies, consider enlisting the services of a trusted broker like FXOpen.
CFDs are complex instruments and come with a high risk of losing your money.
This article represents the opinion of the Companies operating under the FXOpen brand only. It is not to be construed as an offer, solicitation, or recommendation with respect to products and services provided by the Companies operating under the FXOpen brand, nor is it to be considered financial advice.
#marketanalysis #crypto #BTCUSD #bitcoin
BTC/USD Analysis: Bears Aggressively Defending 37,500 Level
The cryptocurrency market continues to be dominated by expectations for SEC approval of Bitcoin ETFs. A decision is expected by January 10. Although expectations alone do not seem to be enough at the moment to overcome the resistance level of 37,500, which became obvious this week.
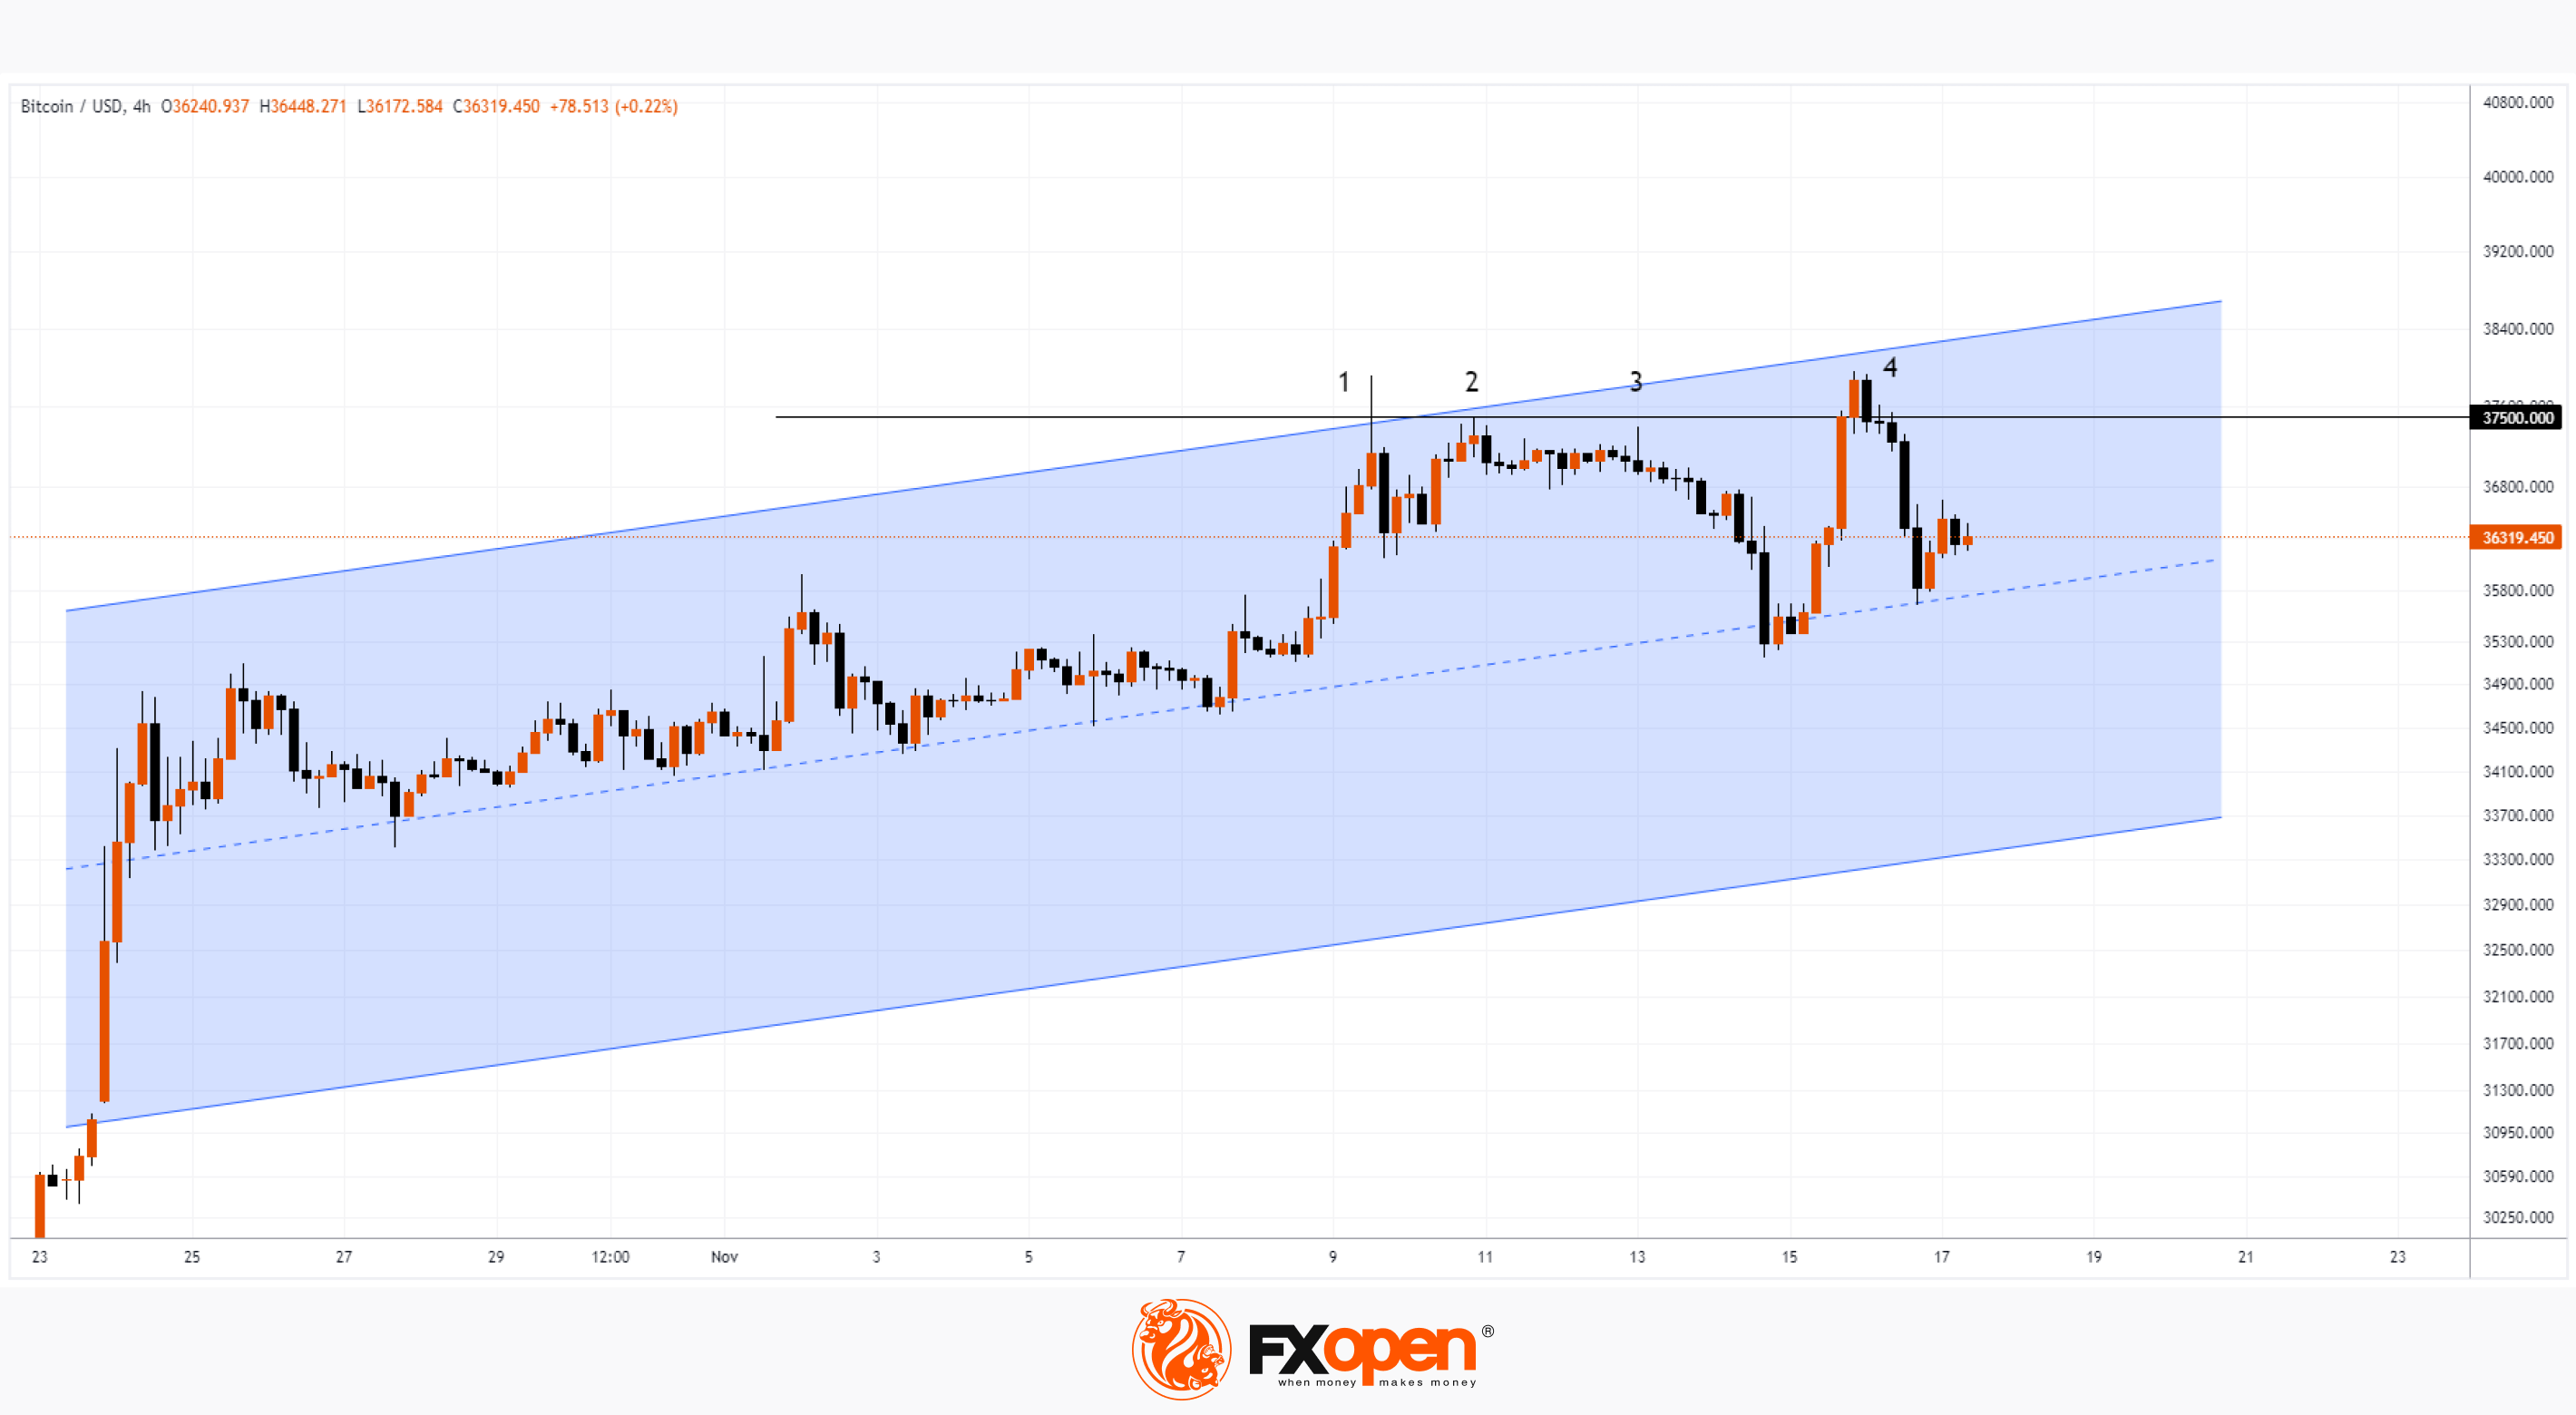
The BTC/USD chart today shows that the bulls attacked the level 4 times.
At the same time, attempts 1-2-3 indicate a gradual weakening of the impulse.
Attempt number 4 had new fuel, as the growth rate was impressive. Moreover, the bulls even managed to overcome the level of 37,500. However, as the chart shows, not for long. The bears successfully coped with the attack and not only prevented the price from consolidating above 37,500, but also pushed it back to the lines from which the attack began.
Moreover, attempt number 4 brought an update to the maximum of the year, but the form in which it was made raises concerns. Because short-term exceeding top 1 is a bull trap.
According to the latest data, the price of bitcoin fluctuates around the median line of the ascending channel, which serves as support on Friday morning. However, if the bears, against the backdrop of the inability of the bulls to overcome resistance, take the initiative, then the price may roll back to the lower border of the parallel channel.
To benefit from the rise and fall in the price of cryptocurrencies, consider enlisting the services of a trusted broker like FXOpen.
CFDs are complex instruments and come with a high risk of losing your money.
This article represents the opinion of the Companies operating under the FXOpen brand only. It is not to be construed as an offer, solicitation, or recommendation with respect to products and services provided by the Companies operating under the FXOpen brand, nor is it to be considered financial advice.
At FXOpen UK and FXOpen AU, Cryptocurrency CFDs are only available for trading by those clients categorised as Professional clients under FCA Rules and Professional clients under ASIC Rules, respectively. They are not available for trading by Retail clients.
BTC/USD Analysis: Bears Aggressively Defending 37,500 Level
The cryptocurrency market continues to be dominated by expectations for SEC approval of Bitcoin ETFs. A decision is expected by January 10. Although expectations alone do not seem to be enough at the moment to overcome the resistance level of 37,500, which became obvious this week.
The BTC/USD chart today shows that the bulls attacked the level 4 times.
At the same time, attempts 1-2-3 indicate a gradual weakening of the impulse.
Attempt number 4 had new fuel, as the growth rate was impressive. Moreover, the bulls even managed to overcome the level of 37,500. However, as the chart shows, not for long. The bears successfully coped with the attack and not only prevented the price from consolidating above 37,500, but also pushed it back to the lines from which the attack began.
Moreover, attempt number 4 brought an update to the maximum of the year, but the form in which it was made raises concerns. Because short-term exceeding top 1 is a bull trap.
According to the latest data, the price of bitcoin fluctuates around the median line of the ascending channel, which serves as support on Friday morning. However, if the bears, against the backdrop of the inability of the bulls to overcome resistance, take the initiative, then the price may roll back to the lower border of the parallel channel.
To benefit from the rise and fall in the price of cryptocurrencies, consider enlisting the services of a trusted broker like FXOpen.
CFDs are complex instruments and come with a high risk of losing your money.
This article represents the opinion of the Companies operating under the FXOpen brand only. It is not to be construed as an offer, solicitation, or recommendation with respect to products and services provided by the Companies operating under the FXOpen brand, nor is it to be considered financial advice.
At FXOpen UK and FXOpen AU, Cryptocurrency CFDs are only available for trading by those clients categorised as Professional clients under FCA Rules and Professional clients under ASIC Rules, respectively. They are not available for trading by Retail clients.
#inflation #MarketNews #sp500 #stockmarket #oilprices
Weekly Market Wrap With Gary Thomson: EUR/GBP’s NEW HIGH, US INFLATION NEWS, S&P 500 FORECASTS, BRENT CRUDE
Get the latest scoop on the week's hottest headlines, all in one convenient video. Join Gary Thomson, the COO of FXOpen UK, as he breaks down the most significant news reports and shares his expert insights.
🔸 EUR/GBP: Price Reaches 6-month High
🔸 Important News on US Inflation Rock Financial Markets
🔸 Morgan Stanley Analysts Raise Forecasts for S&P 500
🔸 Citi Analysts Expect Brent to Reach $73 in 2024
Stay in the know and empower yourself with our short, yet power-packed video. Watch it now and stay updated with FXOpen.
Don't miss out on this invaluable opportunity to sharpen your trading skills and make informed decisions.
https://cutt.ly/5wUdxlkw
To take advantage of price fluctuations in the foreign exchange markets, consider enlisting the services of a reliable broker like FXOpen.
⚠️
This forecast represents FXOpen Companies opinion only, it should not be construed as an offer, invitation or recommendation in respect to FXOpen Companies products and services or as financial advice.
Weekly Market Wrap With Gary Thomson: EUR/GBP’s NEW HIGH, US INFLATION NEWS, S&P 500 FORECASTS, BRENT CRUDE
Get the latest scoop on the week's hottest headlines, all in one convenient video. Join Gary Thomson, the COO of FXOpen UK, as he breaks down the most significant news reports and shares his expert insights.
🔸 EUR/GBP: Price Reaches 6-month High
🔸 Important News on US Inflation Rock Financial Markets
🔸 Morgan Stanley Analysts Raise Forecasts for S&P 500
🔸 Citi Analysts Expect Brent to Reach $73 in 2024
Stay in the know and empower yourself with our short, yet power-packed video. Watch it now and stay updated with FXOpen.
Don't miss out on this invaluable opportunity to sharpen your trading skills and make informed decisions.
https://cutt.ly/5wUdxlkw
To take advantage of price fluctuations in the foreign exchange markets, consider enlisting the services of a reliable broker like FXOpen.
⚠️
This forecast represents FXOpen Companies opinion only, it should not be construed as an offer, invitation or recommendation in respect to FXOpen Companies products and services or as financial advice.
YouTube
Weekly Market Wrap With Gary Thomson: EUR/GBP’s NEW HIGH, US INFLATION, S&P500 FORECAST, BRENT CRUDE
Get the latest scoop on the week's hottest headlines, all in one convenient video. Join Gary Thomson, the COO of FXOpen UK, as he breaks down the most significant news reports and shares his expert insights.
- EUR/GBP: Price Reaches 6-month High #EURGBP…
- EUR/GBP: Price Reaches 6-month High #EURGBP…
#stockmarket #nikkei225 #stocks
NIKKEI Analysis: High of 33 Years
The Japanese stock market index, made up of shares of 225 companies, is showing high volatility today, attempting to break through the September high. Reuters wrote that the index had reached its highest level since 1990. The record is due to low rates from the Bank of Japan, which are helping the country's export-oriented industry (in particular, the automobile industry) and financial sector to grow.
At the same time, in various financial markets, Nikkei-related instruments may not have recorded a maximum in 33 years — the reason is liquidity and what appears to be the top of the market:
→ there was a massive liquidation of short positions;
→ major market participants recorded profits.
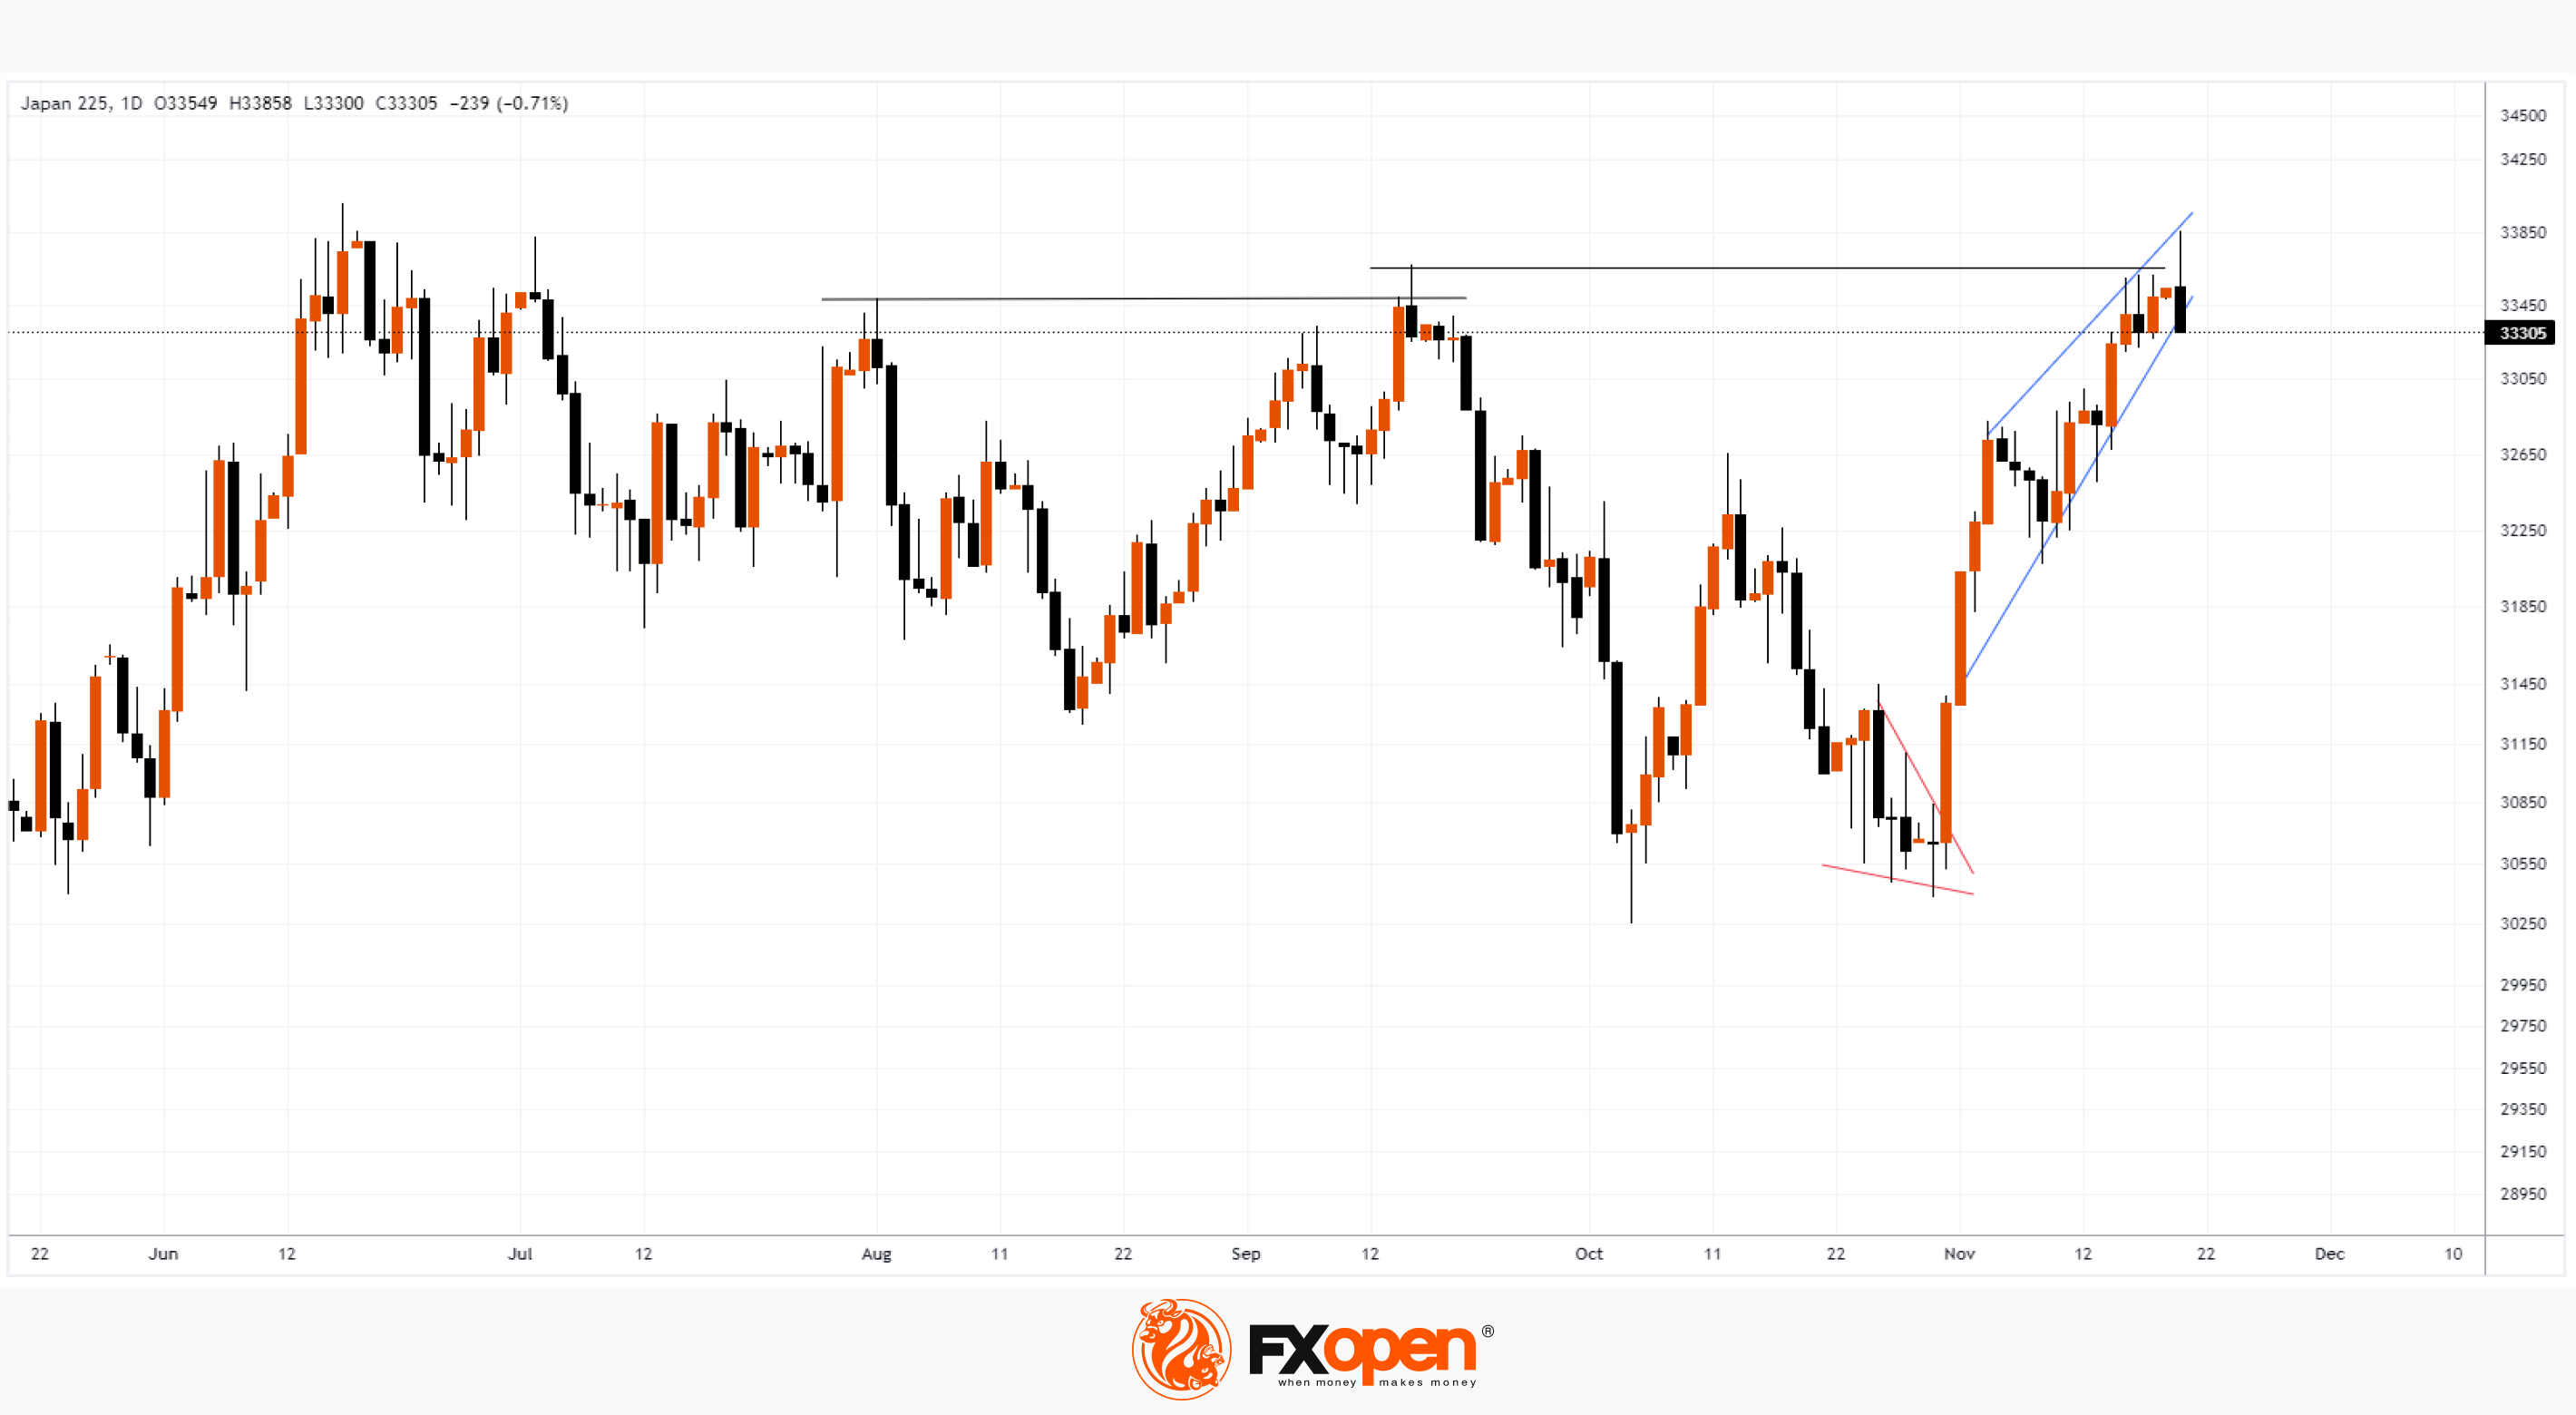
Therefore, the daily candlestick on European Monday morning has a long upper shadow. Note that today's high could be a false breakout of the September top, which in turn is a false breakout of the August top.
The chart shows that the price of NIKKEI is forming a tapering wedge pattern (shown with blue lines) pointing upward. A bearish breakout of this pattern could lead to the development of a downtrend.
Something similar (but in a mirror image) was recorded at the end of October, when a downward wedge formed on the chart (shown by red lines, more clearly visible on the 4-hour chart). The breakout of this wedge led to a rally of over 9%.
If the NIKKEI enters a downtrend, it could be fueled by rumors of an end to the low rate policy. Experts in the media are increasingly predicting this move by the Bank of Japan.
To benefit from the rise and fall of stock markets in Japan and other countries, consider enlisting the services of a trusted broker like FXOpen.
CFDs are complex instruments and come with a high risk of losing your money.
This article represents the opinion of the Companies operating under the FXOpen brand only. It is not to be construed as an offer, solicitation, or recommendation with respect to products and services provided by the Companies operating under the FXOpen brand, nor is it to be considered financial advice.
NIKKEI Analysis: High of 33 Years
The Japanese stock market index, made up of shares of 225 companies, is showing high volatility today, attempting to break through the September high. Reuters wrote that the index had reached its highest level since 1990. The record is due to low rates from the Bank of Japan, which are helping the country's export-oriented industry (in particular, the automobile industry) and financial sector to grow.
At the same time, in various financial markets, Nikkei-related instruments may not have recorded a maximum in 33 years — the reason is liquidity and what appears to be the top of the market:
→ there was a massive liquidation of short positions;
→ major market participants recorded profits.
Therefore, the daily candlestick on European Monday morning has a long upper shadow. Note that today's high could be a false breakout of the September top, which in turn is a false breakout of the August top.
The chart shows that the price of NIKKEI is forming a tapering wedge pattern (shown with blue lines) pointing upward. A bearish breakout of this pattern could lead to the development of a downtrend.
Something similar (but in a mirror image) was recorded at the end of October, when a downward wedge formed on the chart (shown by red lines, more clearly visible on the 4-hour chart). The breakout of this wedge led to a rally of over 9%.
If the NIKKEI enters a downtrend, it could be fueled by rumors of an end to the low rate policy. Experts in the media are increasingly predicting this move by the Bank of Japan.
To benefit from the rise and fall of stock markets in Japan and other countries, consider enlisting the services of a trusted broker like FXOpen.
CFDs are complex instruments and come with a high risk of losing your money.
This article represents the opinion of the Companies operating under the FXOpen brand only. It is not to be construed as an offer, solicitation, or recommendation with respect to products and services provided by the Companies operating under the FXOpen brand, nor is it to be considered financial advice.
#marketanalysis #bitcoin #BTCUSD #crypto
BTC/USD Analysis: Bulls Preparing New Assault on 37,500 Level?
The news backdrop for the cryptocurrency market continues to focus on the approval of a Bitcoin ETF, which already seems inevitable. At the same time, some of the funds that filed applications with the SEC have already even shared the amount of commissions that will apply to clients who wish to invest in bitcoin through ETFs. Thus, Ark and 21Shares plan to charge a commission of 0.8% for a spot bitcoin ETF. If the SEC approves all applications at once, the size of the commissions will influence the choice of investors.
That is, the funds are already competing, although the applications have not yet been approved.
Meanwhile, the SEC itself has once again demonstrated its critical attitude towards the cryptocurrency industry, accusing the Kraken exchange of operating as an unregistered securities exchange. But this has a small impact on the sentiment of cryptocurrency market participants, which continues to remain more positive.
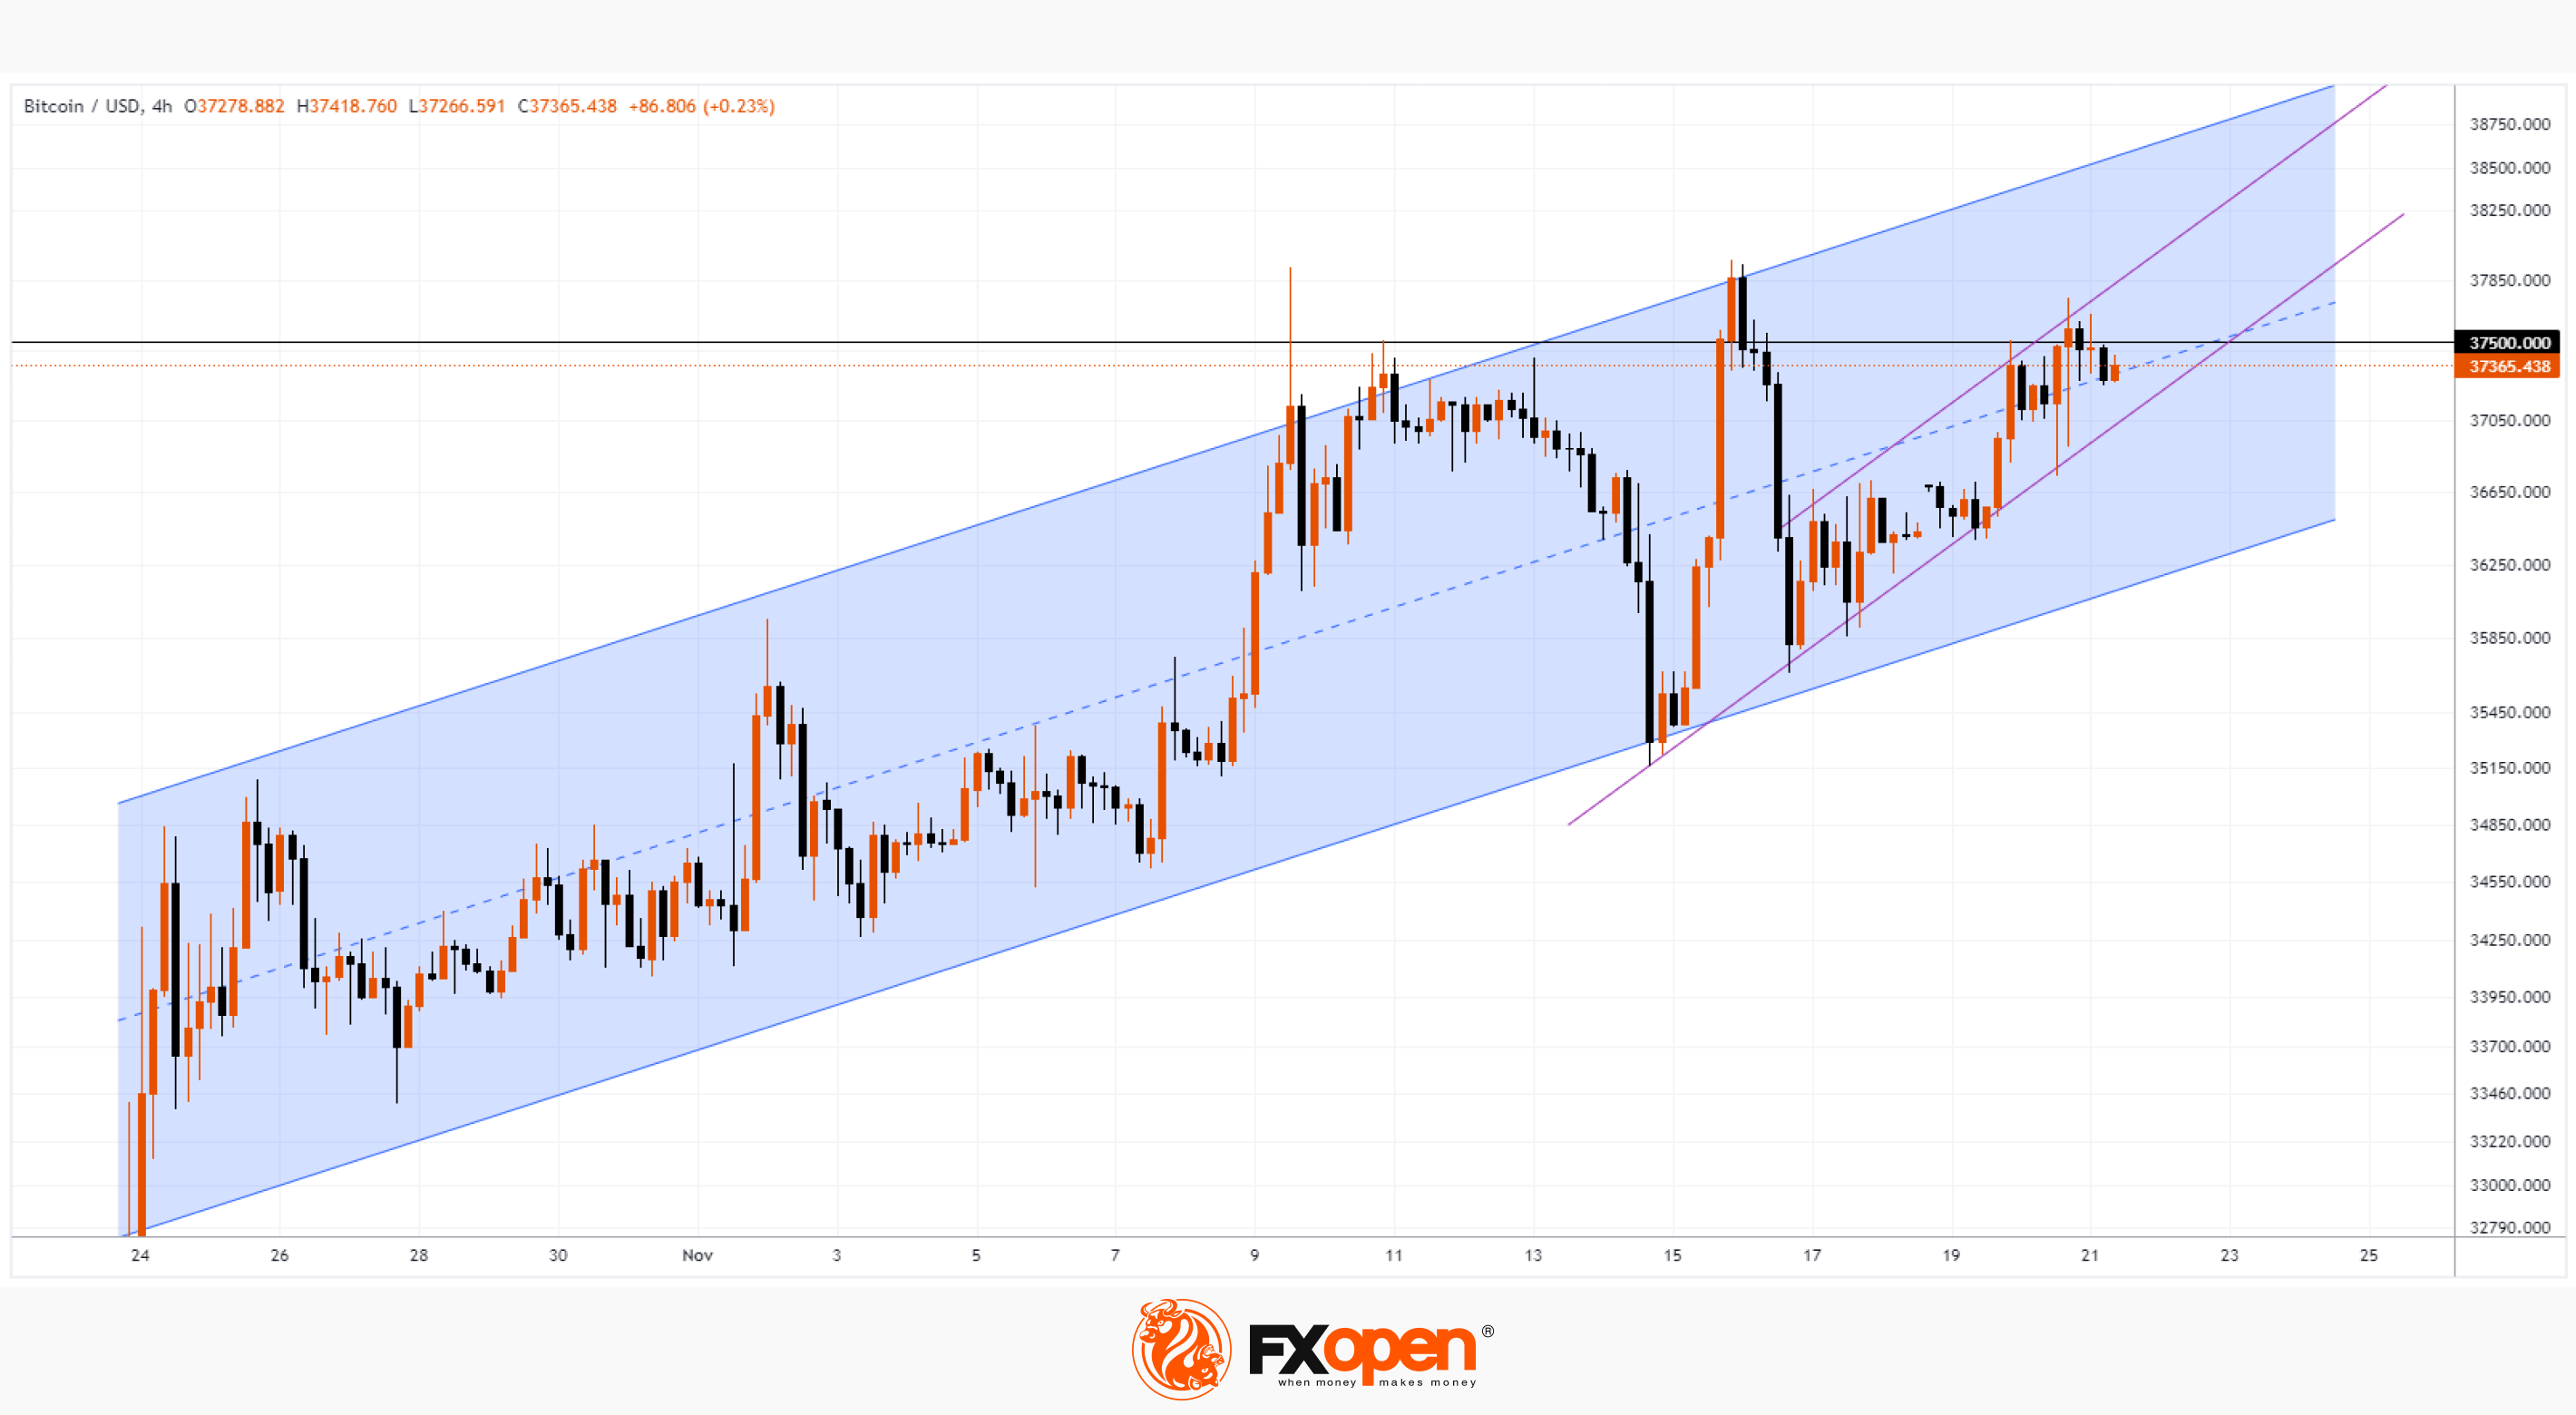
The BTC/USD chart shows that the price of Bitcoin has risen again to the key level of USD 37,500 per coin. We wrote about how bears are aggressively defending this level in the Bitcoin price analysis for November 17th.
As of November 21:
→ Bitcoin price continues to fluctuate in an ascending channel (shown in blue);
→ an increase in the degree of optimism among market participants confirms the rally of recent days (shown by purple lines);
→ this rally encountered resistance (expected) around the level of 37,500.
The bulls are not giving up, if they manage to break through the 37,500 level (for example, against the backdrop of some news confirming the imminent approval of applications for a bitcoin ETF), then it may begin to act as support on the way for the price to the psychological mark of 40k.
To benefit from the rise and fall in value of bitcoin and other cryptocurrencies, consider enlisting the services of a trusted broker like FXOpen.
BTC/USD Analysis: Bulls Preparing New Assault on 37,500 Level?
The news backdrop for the cryptocurrency market continues to focus on the approval of a Bitcoin ETF, which already seems inevitable. At the same time, some of the funds that filed applications with the SEC have already even shared the amount of commissions that will apply to clients who wish to invest in bitcoin through ETFs. Thus, Ark and 21Shares plan to charge a commission of 0.8% for a spot bitcoin ETF. If the SEC approves all applications at once, the size of the commissions will influence the choice of investors.
That is, the funds are already competing, although the applications have not yet been approved.
Meanwhile, the SEC itself has once again demonstrated its critical attitude towards the cryptocurrency industry, accusing the Kraken exchange of operating as an unregistered securities exchange. But this has a small impact on the sentiment of cryptocurrency market participants, which continues to remain more positive.
The BTC/USD chart shows that the price of Bitcoin has risen again to the key level of USD 37,500 per coin. We wrote about how bears are aggressively defending this level in the Bitcoin price analysis for November 17th.
As of November 21:
→ Bitcoin price continues to fluctuate in an ascending channel (shown in blue);
→ an increase in the degree of optimism among market participants confirms the rally of recent days (shown by purple lines);
→ this rally encountered resistance (expected) around the level of 37,500.
The bulls are not giving up, if they manage to break through the 37,500 level (for example, against the backdrop of some news confirming the imminent approval of applications for a bitcoin ETF), then it may begin to act as support on the way for the price to the psychological mark of 40k.
To benefit from the rise and fall in value of bitcoin and other cryptocurrencies, consider enlisting the services of a trusted broker like FXOpen.
#marketanalysis #NASDAQ #stockmarket #stocks
NASDAQ Analysis: New Top of the Year
For the first time in 2023, the index of technology stocks exceeded the level of 16,000.
The rally comes amid news surrounding Sam Altman, the now former head of OpenAI, the company behind ChatGPT and other groundbreaking products. If you don't know:
→ Sam Altman, co-founder and former CEO of OpenAI, was fired from his position on November 18, 2023. The company's board of directors said Altman was not forthcoming in his interactions with the board, which interfered with his ability to perform his duties.
→ Following Altman's resignation, several senior OpenAI employees also announced their departure. Altman himself stated that he did not agree with the decision of the board of directors and considered it unfounded.
→ Microsoft, which invested $14 billion in OpenAI earlier this year, was also outraged. Moreover, it rushed... to hire Sam Altman. He is now the head of Microsoft's AI division.
→ OpenAI employees consider the board of directors incompetent and ask to return Altman, or they may themselves leave for Microsoft.
Although the conflict situation may interfere with the development of projects, perhaps market participants believed that in this case Microsoft and AI technologies will receive more long-term benefits — shares of MSFT and NVDA also reached highs yesterday.
In addition, Fed policy has an important impact on market sentiment. It is not expected to raise rates again, so investors are actively exiting the cash — and the fact that the NASDAQ is performing stronger than the S&P 500 indicates that technology stocks are among the desired buys.
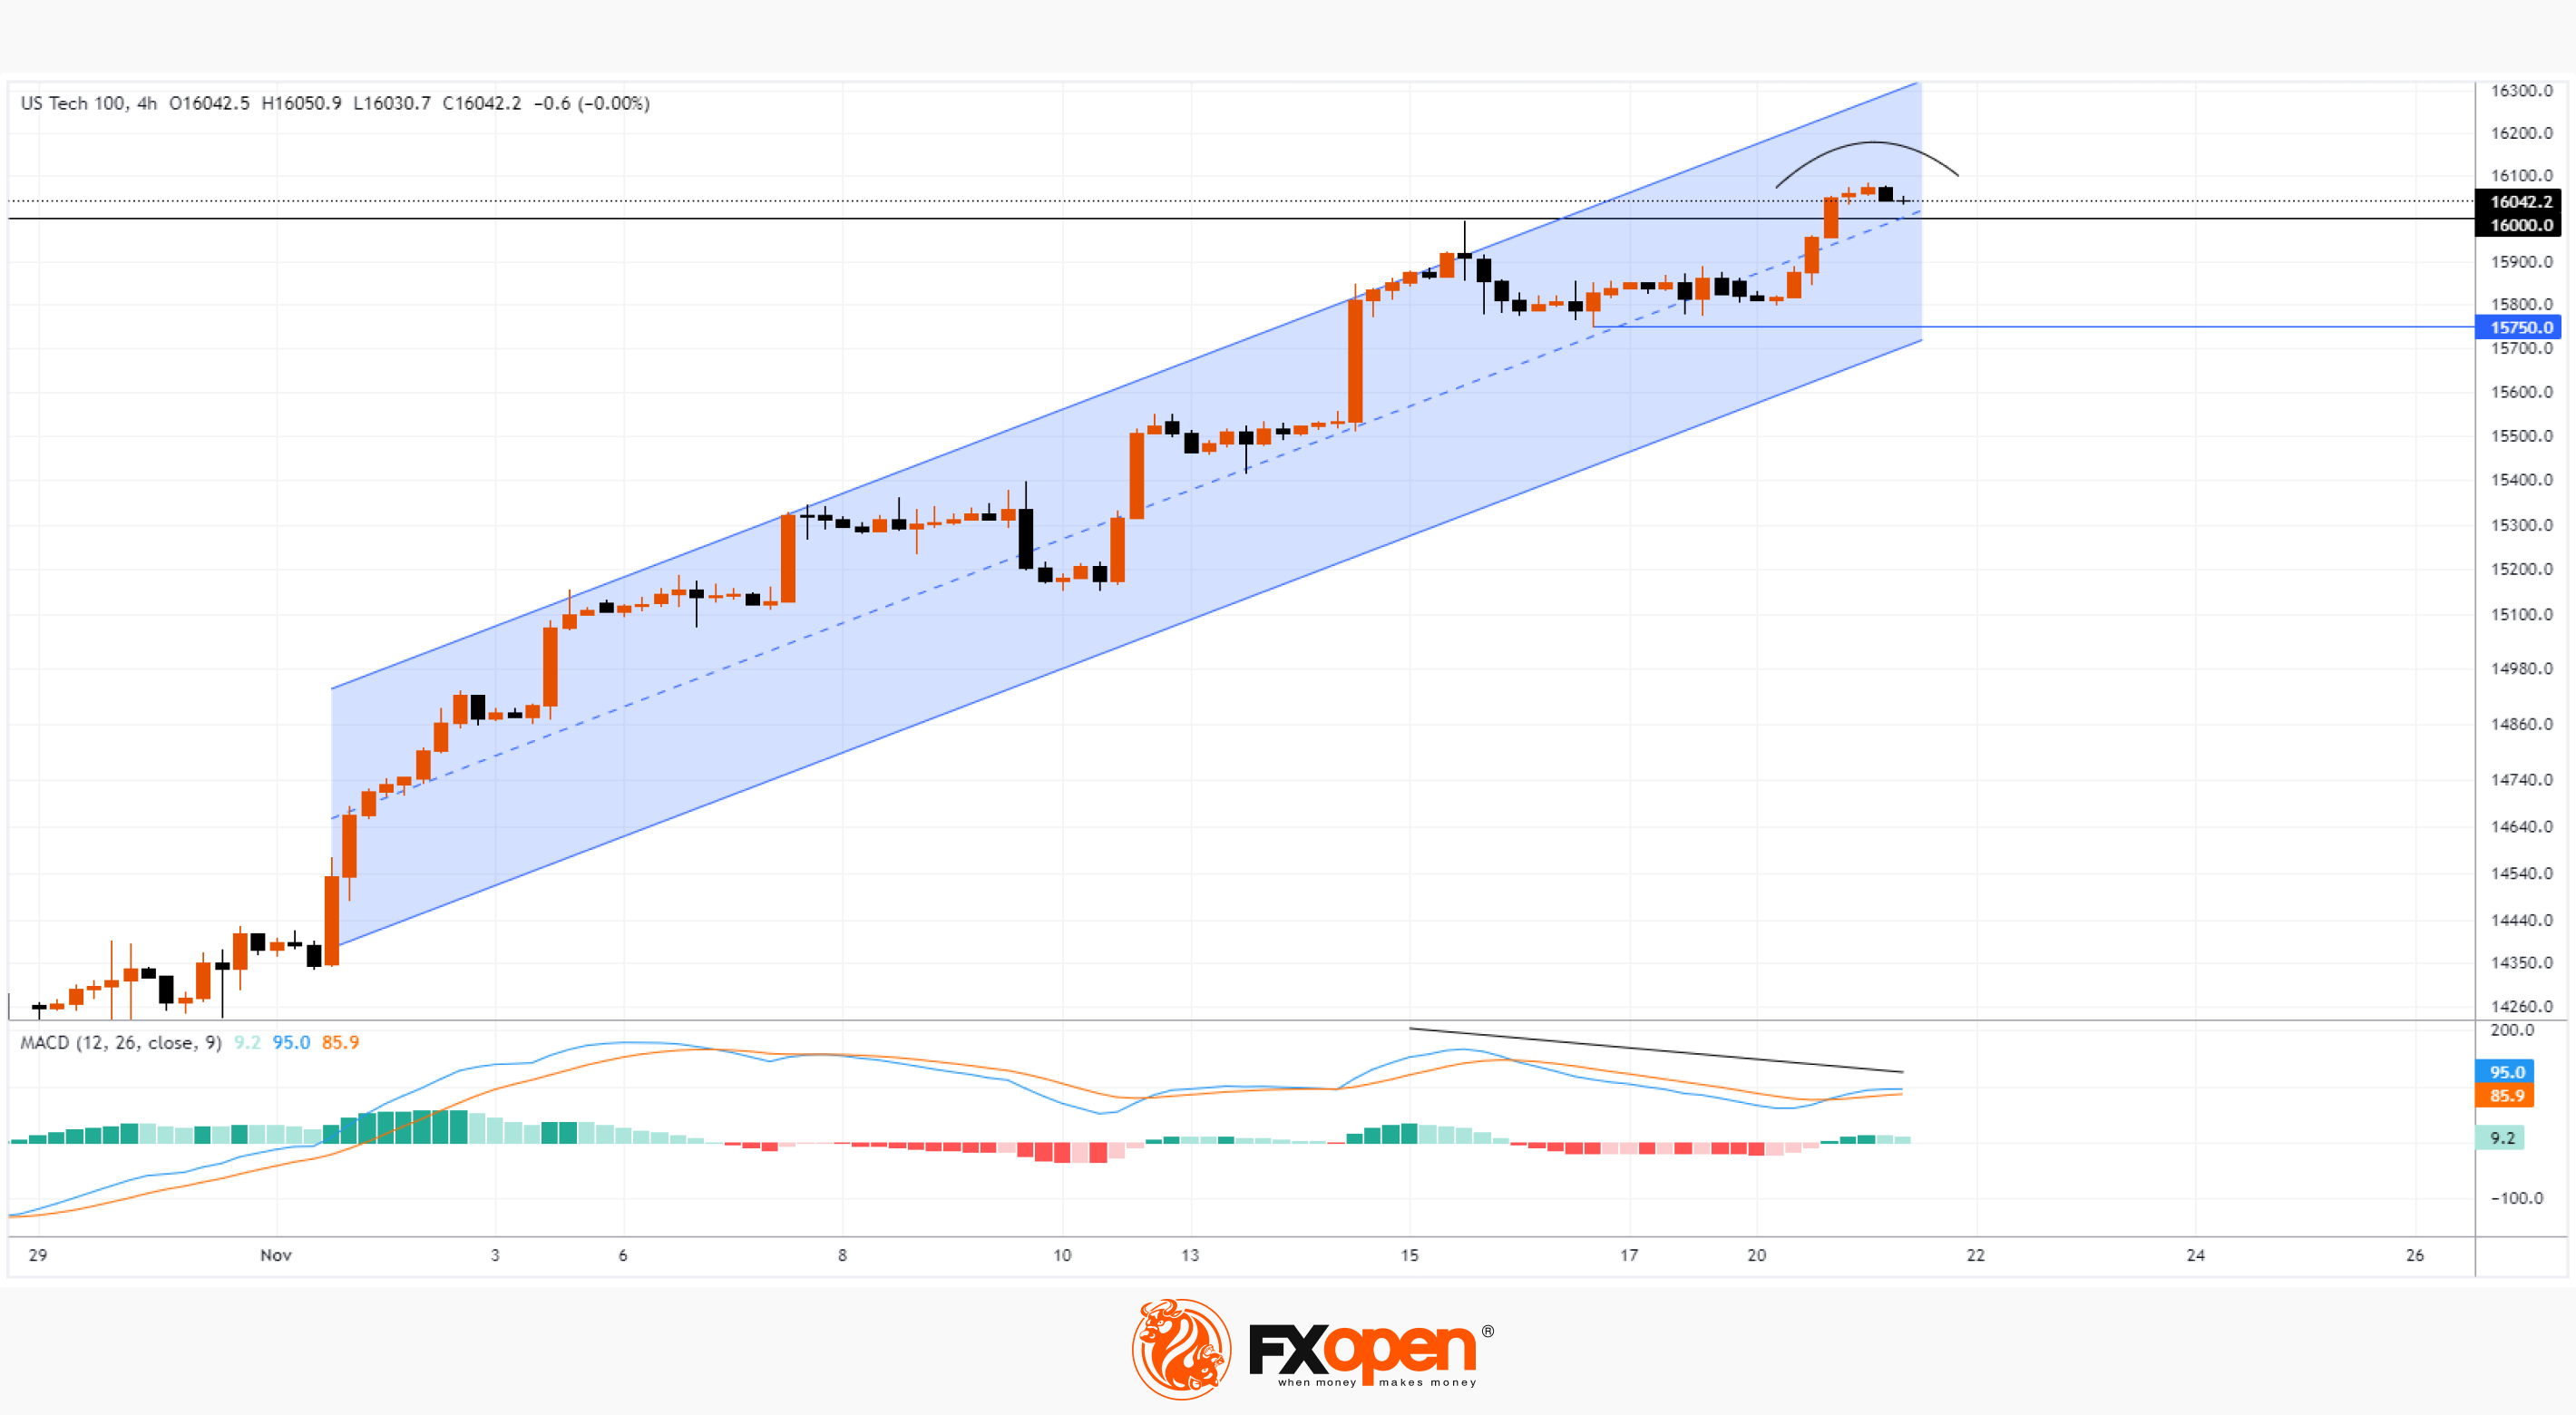
The NASDAQ 100 chart shows the bulls losing momentum:
→ MACD forms potential divergence;
→ price dynamics in the evening of November 20 and the morning of November 21 form a rounding, which can be interpreted as a weakening of bulls’ confidence before the FOMC meeting, which will take place today at 22:00 GMT+3.
It is possible that there will be a surge in volatility, in which the NASDAQ price will test the strength of the support at 15,750.
To benefit from the rise and fall of stock market prices, consider enlisting the services of a trusted broker like FXOpen.
CFDs are complex instruments and come with a high risk of losing your money.
This article represents the opinion of the Companies operating under the FXOpen brand only. It is not to be construed as an offer, solicitation, or recommendation with respect to products and services provided by the Companies operating under the FXOpen brand, nor is it to be considered financial advice.
NASDAQ Analysis: New Top of the Year
For the first time in 2023, the index of technology stocks exceeded the level of 16,000.
The rally comes amid news surrounding Sam Altman, the now former head of OpenAI, the company behind ChatGPT and other groundbreaking products. If you don't know:
→ Sam Altman, co-founder and former CEO of OpenAI, was fired from his position on November 18, 2023. The company's board of directors said Altman was not forthcoming in his interactions with the board, which interfered with his ability to perform his duties.
→ Following Altman's resignation, several senior OpenAI employees also announced their departure. Altman himself stated that he did not agree with the decision of the board of directors and considered it unfounded.
→ Microsoft, which invested $14 billion in OpenAI earlier this year, was also outraged. Moreover, it rushed... to hire Sam Altman. He is now the head of Microsoft's AI division.
→ OpenAI employees consider the board of directors incompetent and ask to return Altman, or they may themselves leave for Microsoft.
Although the conflict situation may interfere with the development of projects, perhaps market participants believed that in this case Microsoft and AI technologies will receive more long-term benefits — shares of MSFT and NVDA also reached highs yesterday.
In addition, Fed policy has an important impact on market sentiment. It is not expected to raise rates again, so investors are actively exiting the cash — and the fact that the NASDAQ is performing stronger than the S&P 500 indicates that technology stocks are among the desired buys.
The NASDAQ 100 chart shows the bulls losing momentum:
→ MACD forms potential divergence;
→ price dynamics in the evening of November 20 and the morning of November 21 form a rounding, which can be interpreted as a weakening of bulls’ confidence before the FOMC meeting, which will take place today at 22:00 GMT+3.
It is possible that there will be a surge in volatility, in which the NASDAQ price will test the strength of the support at 15,750.
To benefit from the rise and fall of stock market prices, consider enlisting the services of a trusted broker like FXOpen.
CFDs are complex instruments and come with a high risk of losing your money.
This article represents the opinion of the Companies operating under the FXOpen brand only. It is not to be construed as an offer, solicitation, or recommendation with respect to products and services provided by the Companies operating under the FXOpen brand, nor is it to be considered financial advice.
#marketanalysis #tradingforex #tradingtips
AUD/USD Analysis: Price at Important Resistance Block
Yesterday's news from the FOMC is unlikely to have much impact on participants' views that the Fed's tightening cycle is over. According to published protocols:
→ The Fed will act cautiously;
→ all FOMC participants considered it appropriate to keep rates at current levels;
→ everyone also agreed that they would raise interest rates only if progress in controlling inflation slowed. In doing so, they left the door open to the possibility of further tightening, even as data showed a sustained slowdown in inflation.
Market participants are almost confident that the Fed will keep rates at its December meeting, while estimating the likelihood of a rate cut as early as March at about 30%, according to CME's FedWatch Tool.
The reaction of the foreign exchange market was a slight strengthening of the dollar index relative to other currencies, in particular AUD/USD.
By the way, yesterday, the head of the Reserve Bank of Australia, Michelle Bullock, warned that wages are growing at a pace that cannot be sustained without reversing the decline in productivity in the country, which indicates the possibility of another rate hike to suppress inflation.
“Inflation will be the most important issue in the next one to two years,” she said on Tuesday.
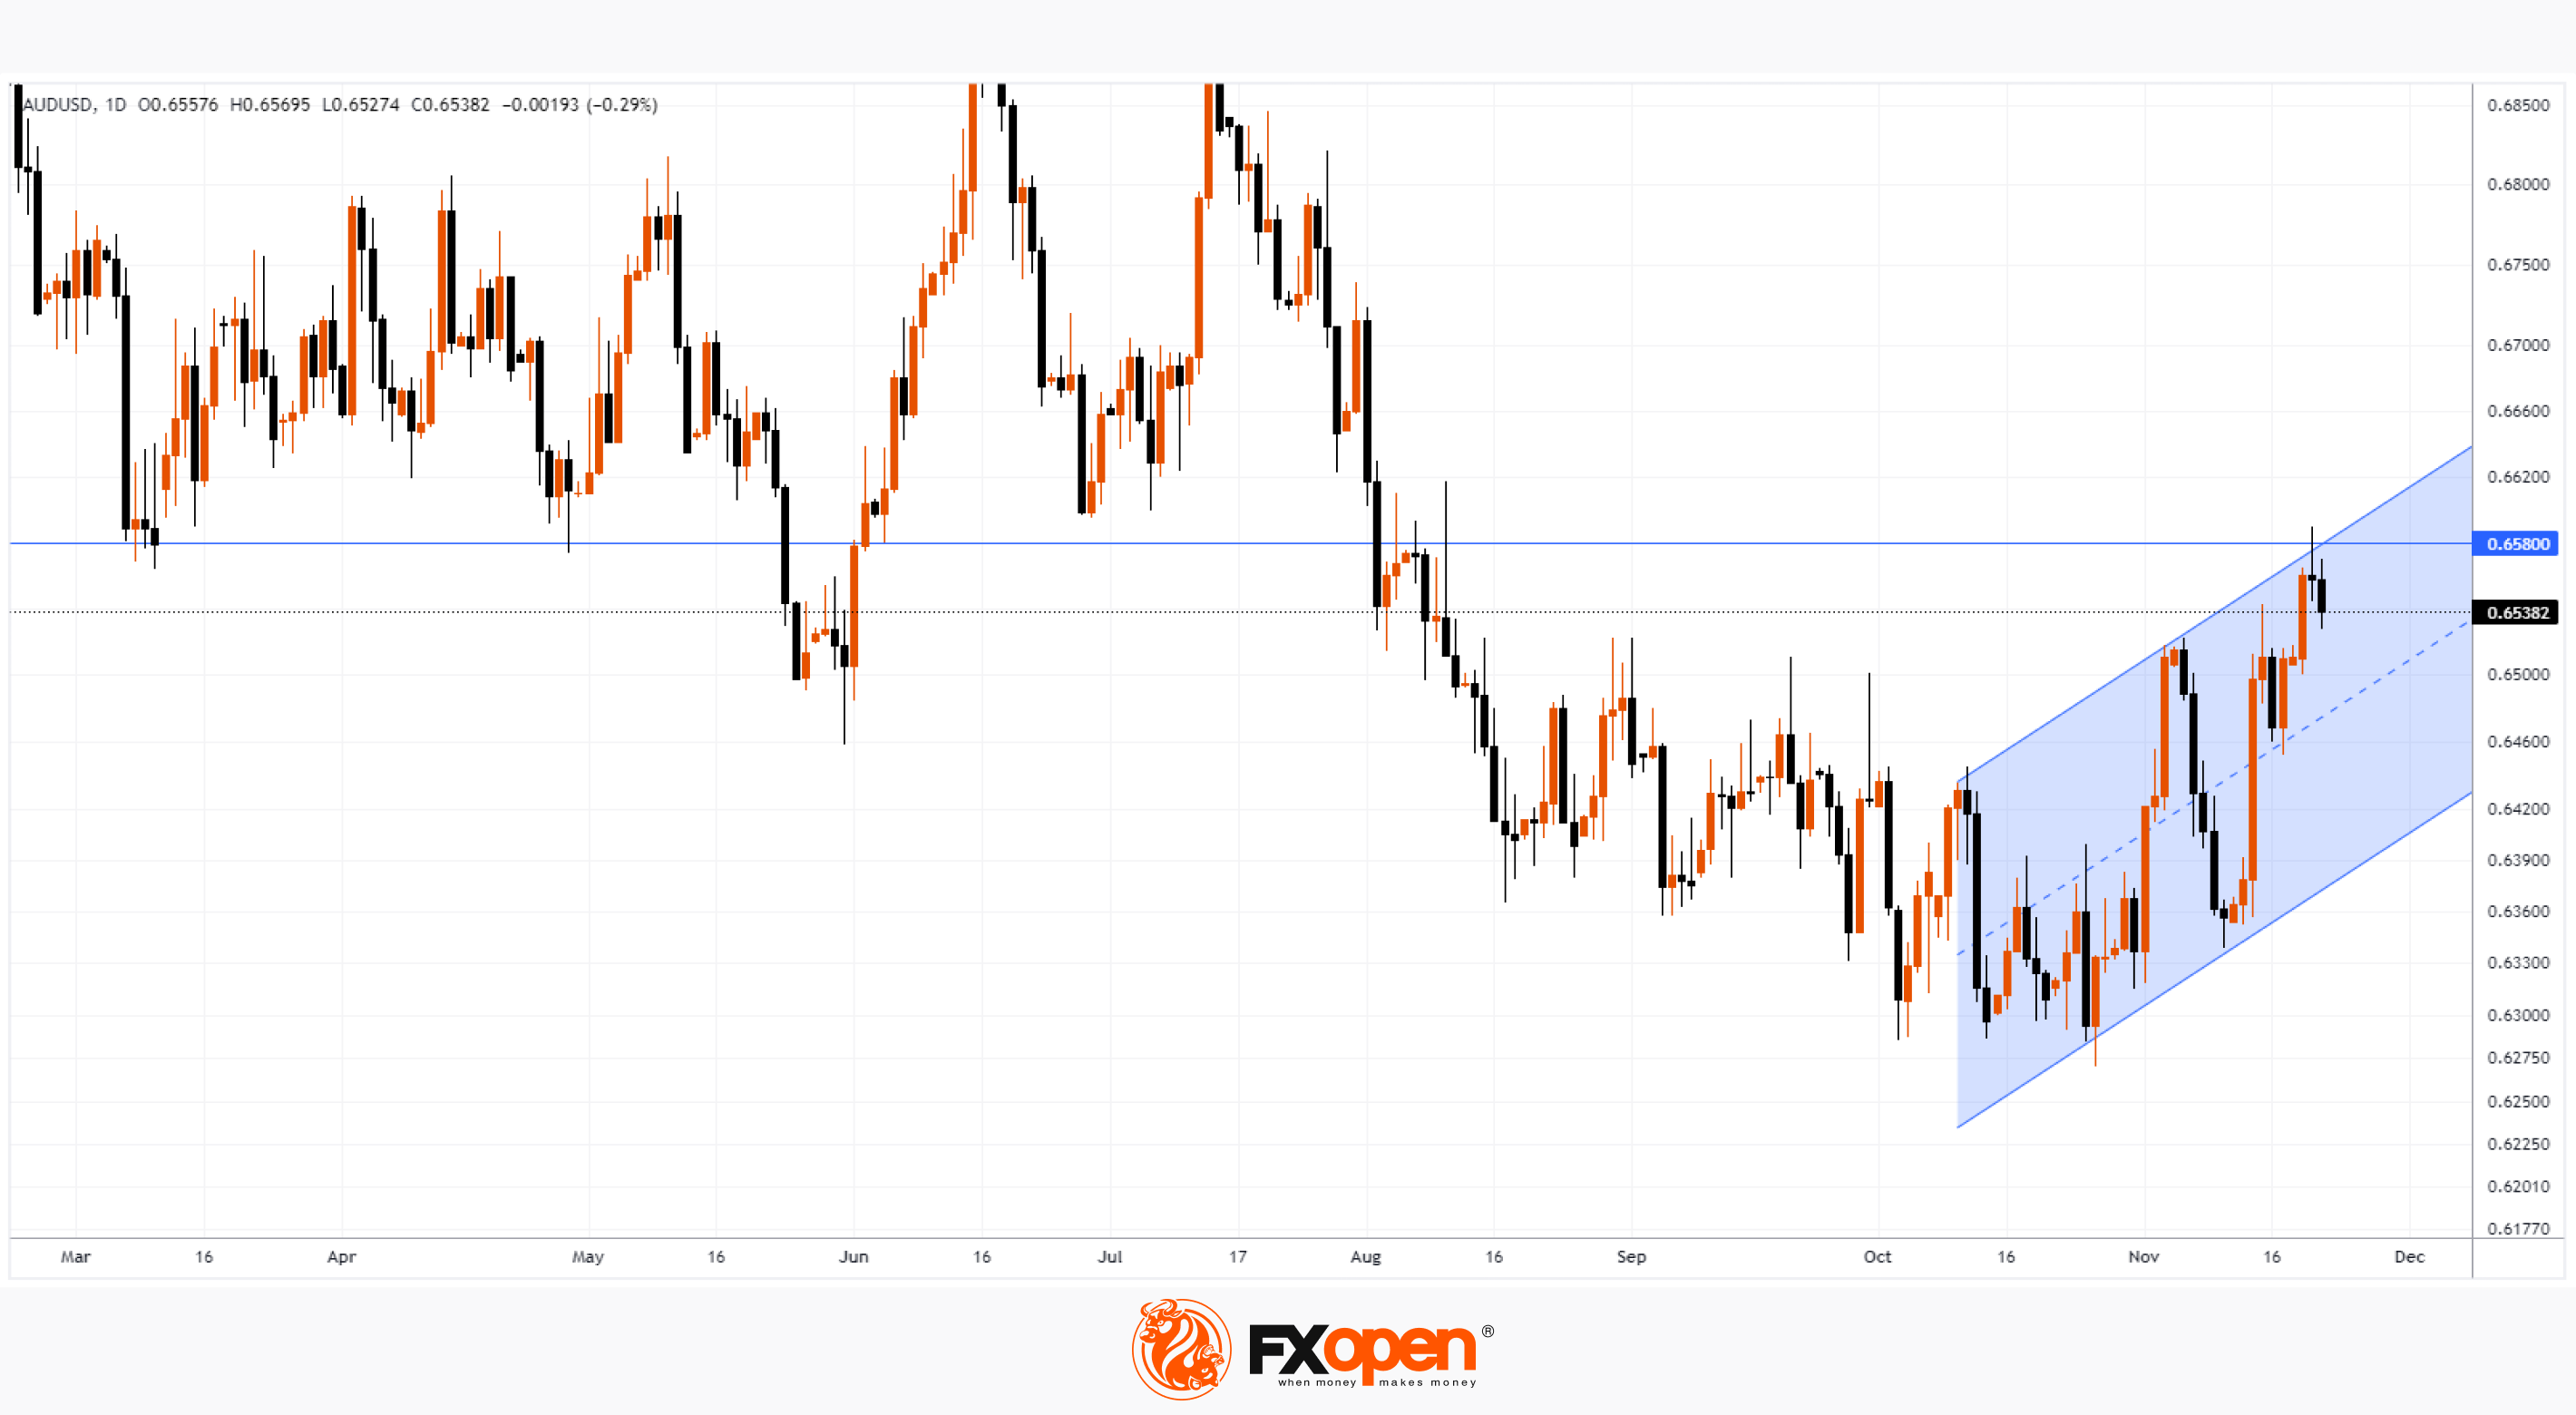
The AUD/USD chart meanwhile shows that:
→ the rate is at an important resistance of 0.658 – the rate has repeatedly formed reversals from this level;
→ the upper boundary of the ascending channel (shown in blue) may increase resistance;
→ the upper long shadow on yesterday's candle indicates the activation of sellers.
With AUD/USD up over 5% from the October lows, some correction from the above resistance levels looks like a worthwhile scenario.
To benefit from the rise and fall of prices in the foreign exchange markets, consider enlisting the services of a trusted broker like FXOpen.
CFDs are complex instruments and come with a high risk of losing your money.
This article represents the opinion of the Companies operating under the FXOpen brand only. It is not to be construed as an offer, solicitation, or recommendation with respect to products and services provided by the Companies operating under the FXOpen brand, nor is it to be considered financial advice.
AUD/USD Analysis: Price at Important Resistance Block
Yesterday's news from the FOMC is unlikely to have much impact on participants' views that the Fed's tightening cycle is over. According to published protocols:
→ The Fed will act cautiously;
→ all FOMC participants considered it appropriate to keep rates at current levels;
→ everyone also agreed that they would raise interest rates only if progress in controlling inflation slowed. In doing so, they left the door open to the possibility of further tightening, even as data showed a sustained slowdown in inflation.
Market participants are almost confident that the Fed will keep rates at its December meeting, while estimating the likelihood of a rate cut as early as March at about 30%, according to CME's FedWatch Tool.
The reaction of the foreign exchange market was a slight strengthening of the dollar index relative to other currencies, in particular AUD/USD.
By the way, yesterday, the head of the Reserve Bank of Australia, Michelle Bullock, warned that wages are growing at a pace that cannot be sustained without reversing the decline in productivity in the country, which indicates the possibility of another rate hike to suppress inflation.
“Inflation will be the most important issue in the next one to two years,” she said on Tuesday.
The AUD/USD chart meanwhile shows that:
→ the rate is at an important resistance of 0.658 – the rate has repeatedly formed reversals from this level;
→ the upper boundary of the ascending channel (shown in blue) may increase resistance;
→ the upper long shadow on yesterday's candle indicates the activation of sellers.
With AUD/USD up over 5% from the October lows, some correction from the above resistance levels looks like a worthwhile scenario.
To benefit from the rise and fall of prices in the foreign exchange markets, consider enlisting the services of a trusted broker like FXOpen.
CFDs are complex instruments and come with a high risk of losing your money.
This article represents the opinion of the Companies operating under the FXOpen brand only. It is not to be construed as an offer, solicitation, or recommendation with respect to products and services provided by the Companies operating under the FXOpen brand, nor is it to be considered financial advice.
👍1
#marketanalysis #stockmarket #stocks #nvidia
Market Analysis: NVDA Shares Decline after Strong Report
The previous historical record and maximum for 2023 (USD 502.66 per share) was set on August 24 against the backdrop of the publication of the 2nd quarter report.
This week, NVidia published its report for the Q3, and again the price set a record high, as the report turned out to be better than expected:
→ earnings per share: actual = USD 4.02, forecast = USD 3.37;
→ gross revenue: actual = USD 18.12 billion, forecast = USD 16.18 billion.
However, after the publication of the report, the NVDA share price shows bearish dynamics — perhaps the information from the company disappointed overly optimistic investors. Or perhaps some market participants used the excitement associated with the publication of the report in order to lock in profits from the 2023 rally.
However, NVDA shares fell 2.6% yesterday after CFO Colette Kress said sales to China, impacted by recent US government export controls, would decline significantly in the fourth quarter.
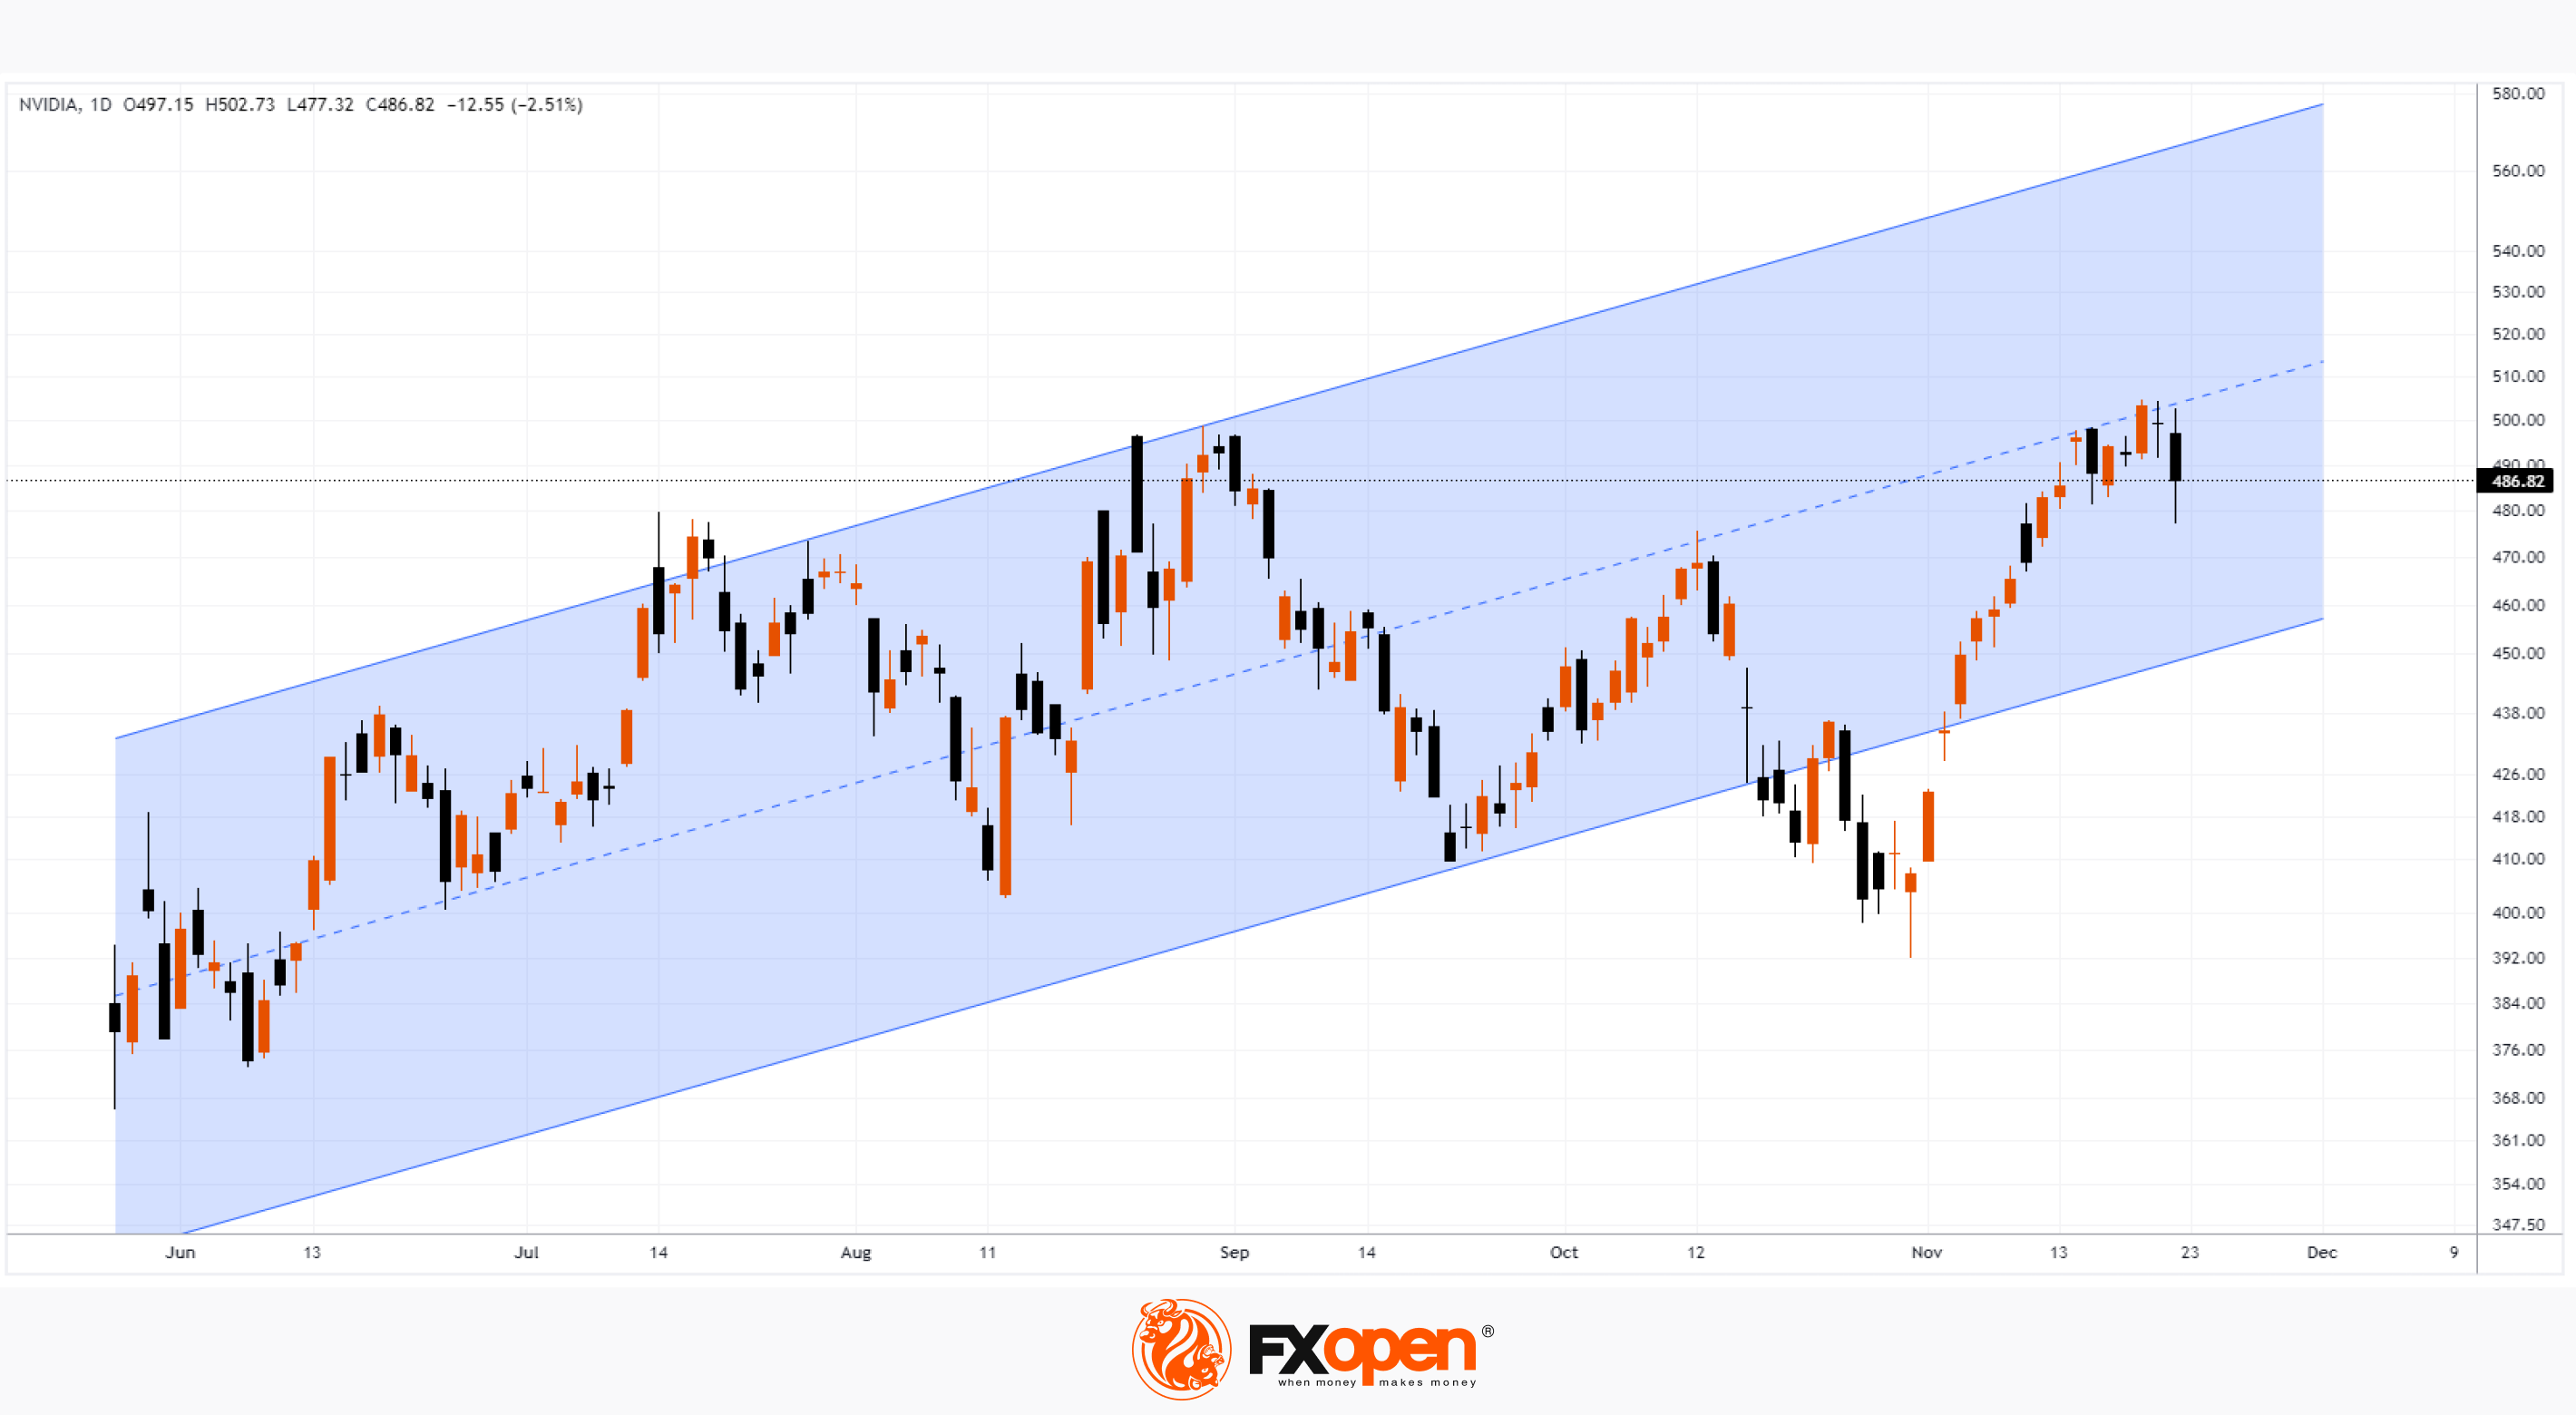
Thus, the chart of NVDA shares develops a picture that may worry the bulls:
→ The price fell below USD 480 per share yesterday, despite the recently published good report.
→ The price is near the median line of the ascending channel, which describes the market dynamics starting from the gap on May 25 (excluding the second half of October). Moreover, the events of this week show that the median line acts as resistance.
If the price is able to hold above the USD 480 level, this could mean that the CFO's statement caused only a short-term correction, then a gradual increase along the median line would be a sign of a strong market. Otherwise, the price may continue to decline to the lower border of the channel, acting bearishly after the publication of a strong report — just like 3 months earlier.
To benefit from the rise and fall of the world's hottest stock prices, consider enlisting the services of a trusted broker like FXOpen.
CFDs are complex instruments and come with a high risk of losing your money.
This article represents the opinion of the Companies operating under the FXOpen brand only. It is not to be construed as an offer, solicitation, or recommendation with respect to products and services provided by the Companies operating under the FXOpen brand, nor is it to be considered financial advice.
Market Analysis: NVDA Shares Decline after Strong Report
The previous historical record and maximum for 2023 (USD 502.66 per share) was set on August 24 against the backdrop of the publication of the 2nd quarter report.
This week, NVidia published its report for the Q3, and again the price set a record high, as the report turned out to be better than expected:
→ earnings per share: actual = USD 4.02, forecast = USD 3.37;
→ gross revenue: actual = USD 18.12 billion, forecast = USD 16.18 billion.
However, after the publication of the report, the NVDA share price shows bearish dynamics — perhaps the information from the company disappointed overly optimistic investors. Or perhaps some market participants used the excitement associated with the publication of the report in order to lock in profits from the 2023 rally.
However, NVDA shares fell 2.6% yesterday after CFO Colette Kress said sales to China, impacted by recent US government export controls, would decline significantly in the fourth quarter.
Thus, the chart of NVDA shares develops a picture that may worry the bulls:
→ The price fell below USD 480 per share yesterday, despite the recently published good report.
→ The price is near the median line of the ascending channel, which describes the market dynamics starting from the gap on May 25 (excluding the second half of October). Moreover, the events of this week show that the median line acts as resistance.
If the price is able to hold above the USD 480 level, this could mean that the CFO's statement caused only a short-term correction, then a gradual increase along the median line would be a sign of a strong market. Otherwise, the price may continue to decline to the lower border of the channel, acting bearishly after the publication of a strong report — just like 3 months earlier.
To benefit from the rise and fall of the world's hottest stock prices, consider enlisting the services of a trusted broker like FXOpen.
CFDs are complex instruments and come with a high risk of losing your money.
This article represents the opinion of the Companies operating under the FXOpen brand only. It is not to be construed as an offer, solicitation, or recommendation with respect to products and services provided by the Companies operating under the FXOpen brand, nor is it to be considered financial advice.
#marketanalysis #forextrading #forex
USD/CAD Analysis: the Rate Approaching Important Support
Bank of Canada Governor Tiff Macklem said yesterday that enough may have been done to curb inflation. As follows from his words, current policies can lead to inflation returning to the target of 2%.
The announcement fueled market and economist expectations that interest rates had peaked. It is acceptable to assume that the Bank of Canada instilled confidence in market participants, and therefore the Canadian dollar strengthened yesterday relative to other currencies.
Including relative to USD. Yesterday, by the way, data on the number of unemployment applications was published. They did not bring any surprises - the labour market continues to remain strong in the US (the actual number of applications was = 209k for the week, expected = 226k, a week ago = 233k). The news gave a reason to strengthen the USD, but overall the US dollar index is in a downward trend amid expectations of easing Fed policy.
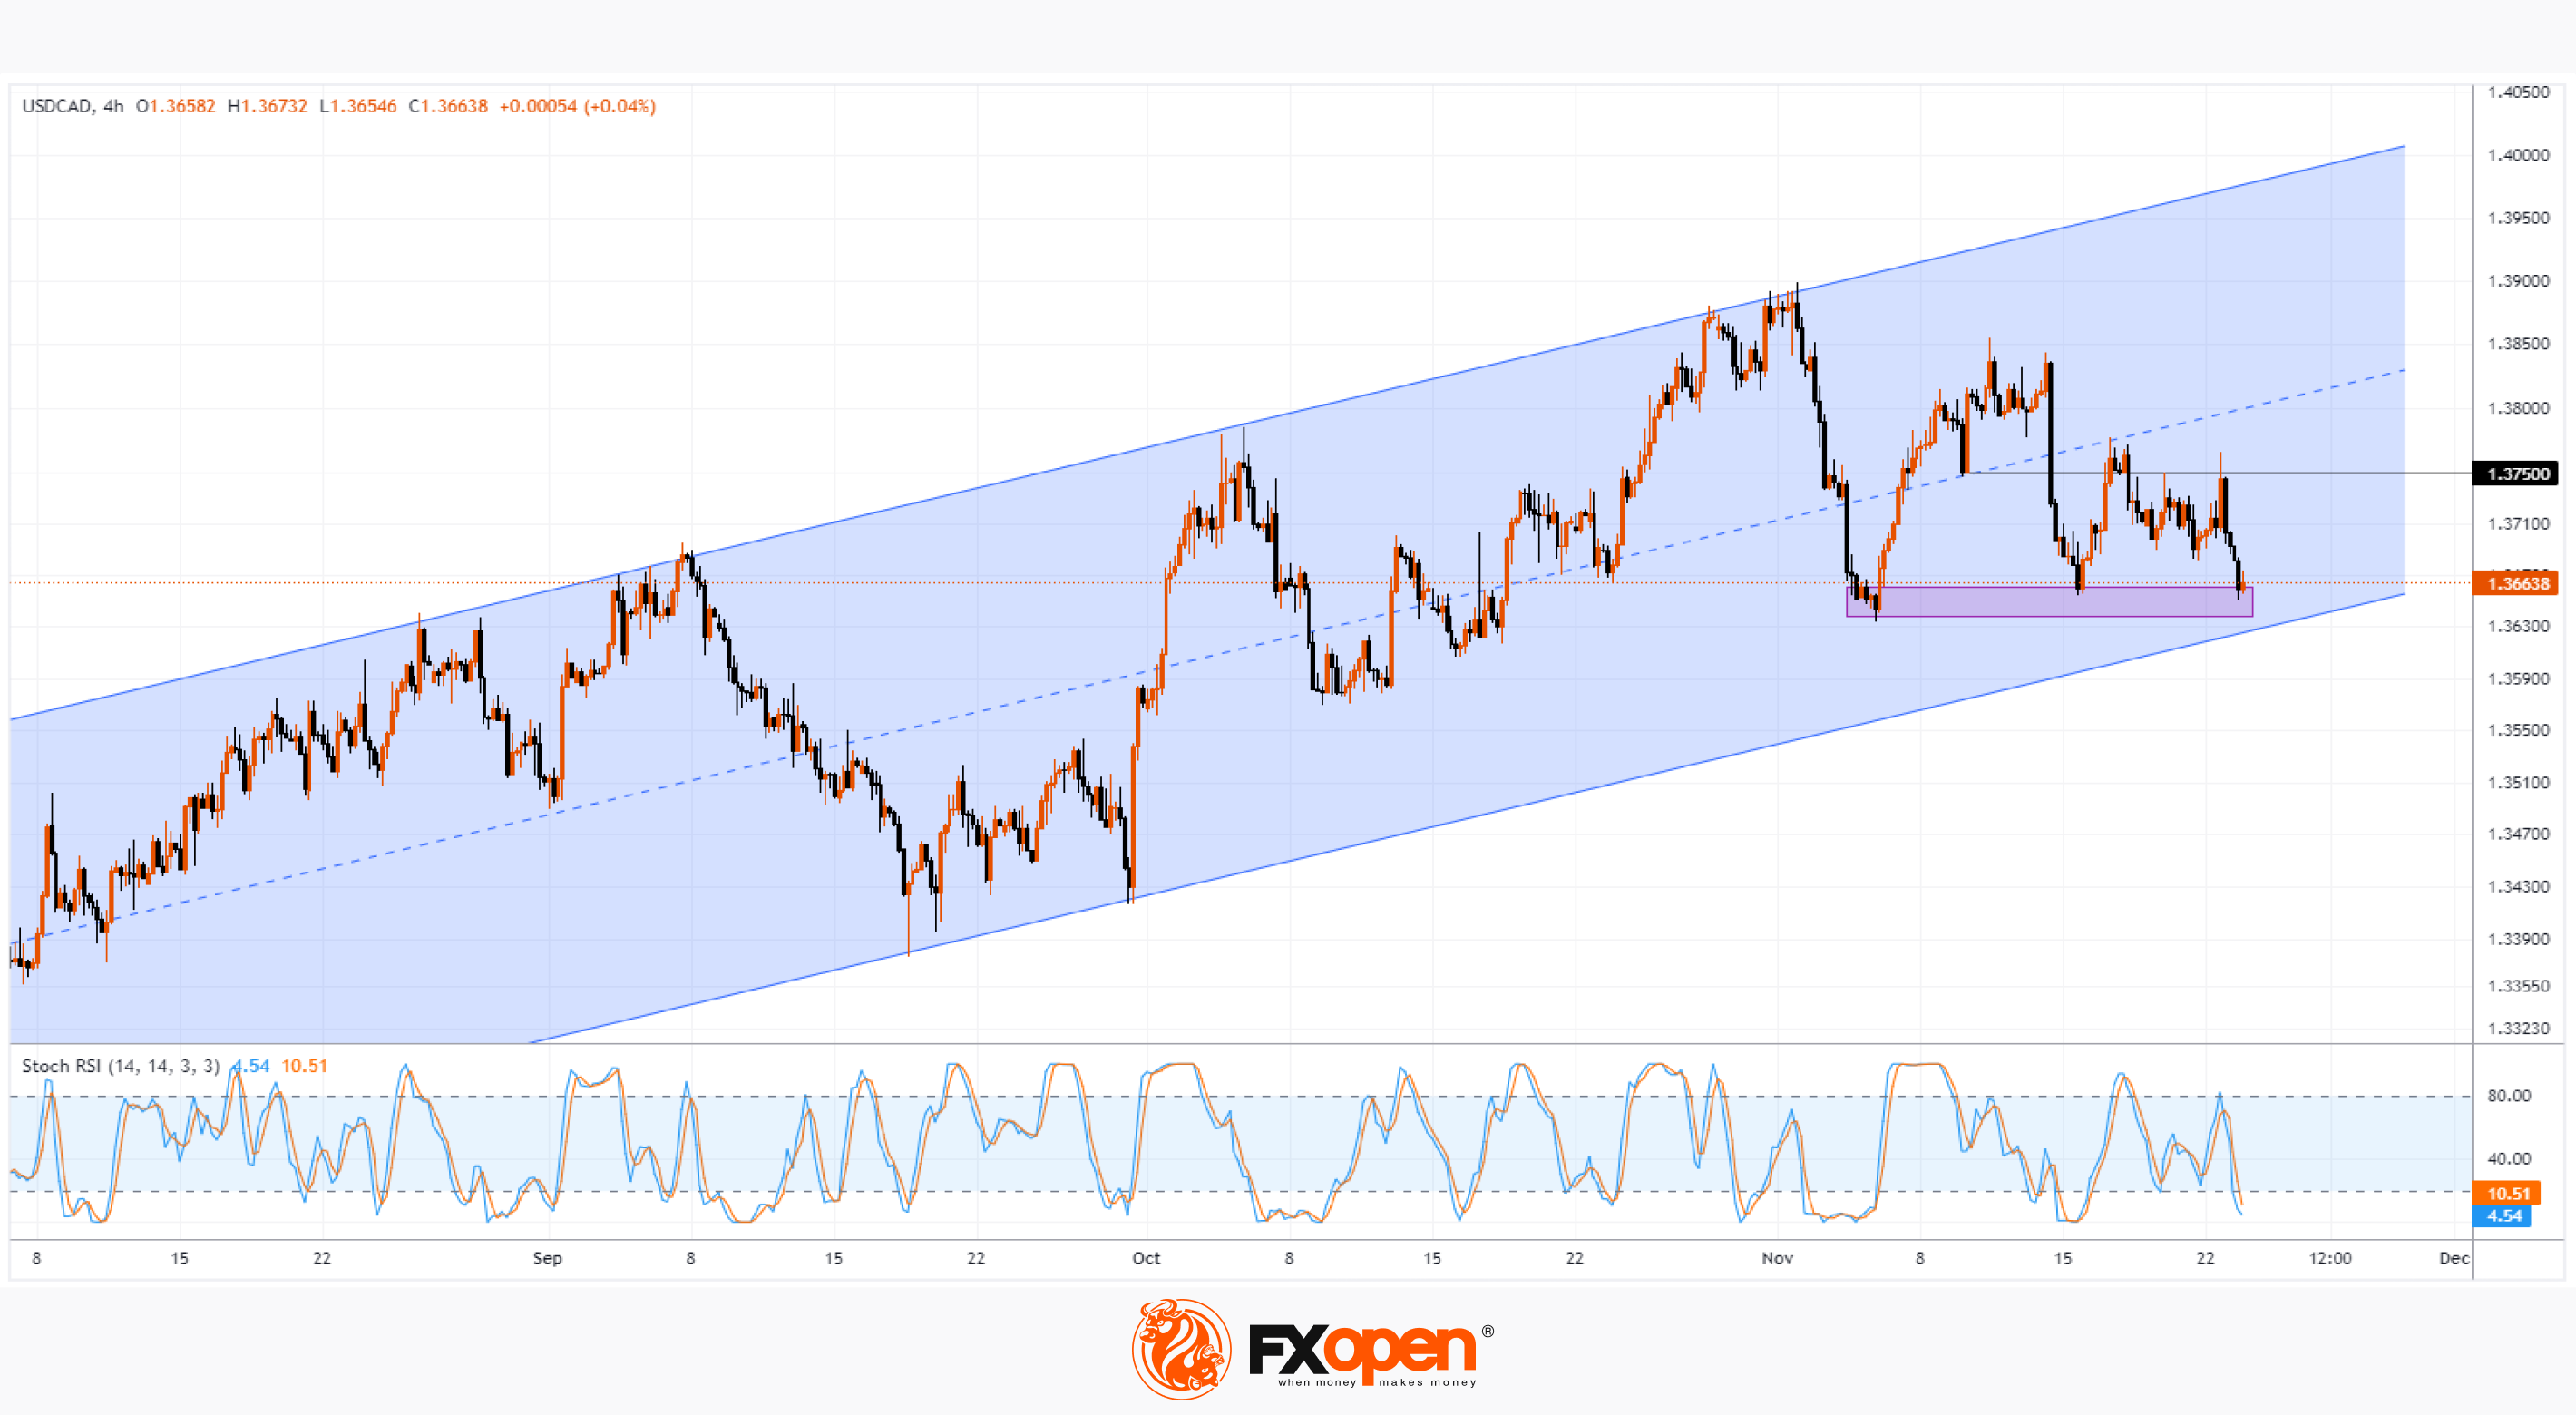
Meanwhile, the USD/CAD chart shows that the strengthening Canadian dollar has pushed the rate closer to an important support zone; it is formed by:
→ the lower line of the ascending channel (shown in blue), in which the rate has been since August;
→ as well as the support area (shown in purple) around the level of 1.364.
At the same time, the Stoch RSI indicator dropped into the oversold zone. From the point of view of technical analysis, the chart shows the prerequisites for the formation of a rebound. If it is strong enough, the price will be able to reach the resistance of 1.375.
To benefit from rising and falling rates, consider enlisting the services of a trusted broker like FXOpen.
CFDs are complex instruments and come with a high risk of losing your money.
This article represents the opinion of the Companies operating under the FXOpen brand only. It is not to be construed as an offer, solicitation, or recommendation with respect to products and services provided by the Companies operating under the FXOpen brand, nor is it to be considered financial advice.
USD/CAD Analysis: the Rate Approaching Important Support
Bank of Canada Governor Tiff Macklem said yesterday that enough may have been done to curb inflation. As follows from his words, current policies can lead to inflation returning to the target of 2%.
The announcement fueled market and economist expectations that interest rates had peaked. It is acceptable to assume that the Bank of Canada instilled confidence in market participants, and therefore the Canadian dollar strengthened yesterday relative to other currencies.
Including relative to USD. Yesterday, by the way, data on the number of unemployment applications was published. They did not bring any surprises - the labour market continues to remain strong in the US (the actual number of applications was = 209k for the week, expected = 226k, a week ago = 233k). The news gave a reason to strengthen the USD, but overall the US dollar index is in a downward trend amid expectations of easing Fed policy.
Meanwhile, the USD/CAD chart shows that the strengthening Canadian dollar has pushed the rate closer to an important support zone; it is formed by:
→ the lower line of the ascending channel (shown in blue), in which the rate has been since August;
→ as well as the support area (shown in purple) around the level of 1.364.
At the same time, the Stoch RSI indicator dropped into the oversold zone. From the point of view of technical analysis, the chart shows the prerequisites for the formation of a rebound. If it is strong enough, the price will be able to reach the resistance of 1.375.
To benefit from rising and falling rates, consider enlisting the services of a trusted broker like FXOpen.
CFDs are complex instruments and come with a high risk of losing your money.
This article represents the opinion of the Companies operating under the FXOpen brand only. It is not to be construed as an offer, solicitation, or recommendation with respect to products and services provided by the Companies operating under the FXOpen brand, nor is it to be considered financial advice.
#marketanalysis #oilprices #oilindustry
Market Analysis: The Price of WTI Oil Forming a Reversal Pattern
In our analysis of the price of WTI oil dated November 8, we wrote that the price could recover to the level of USD 80 per barrel.
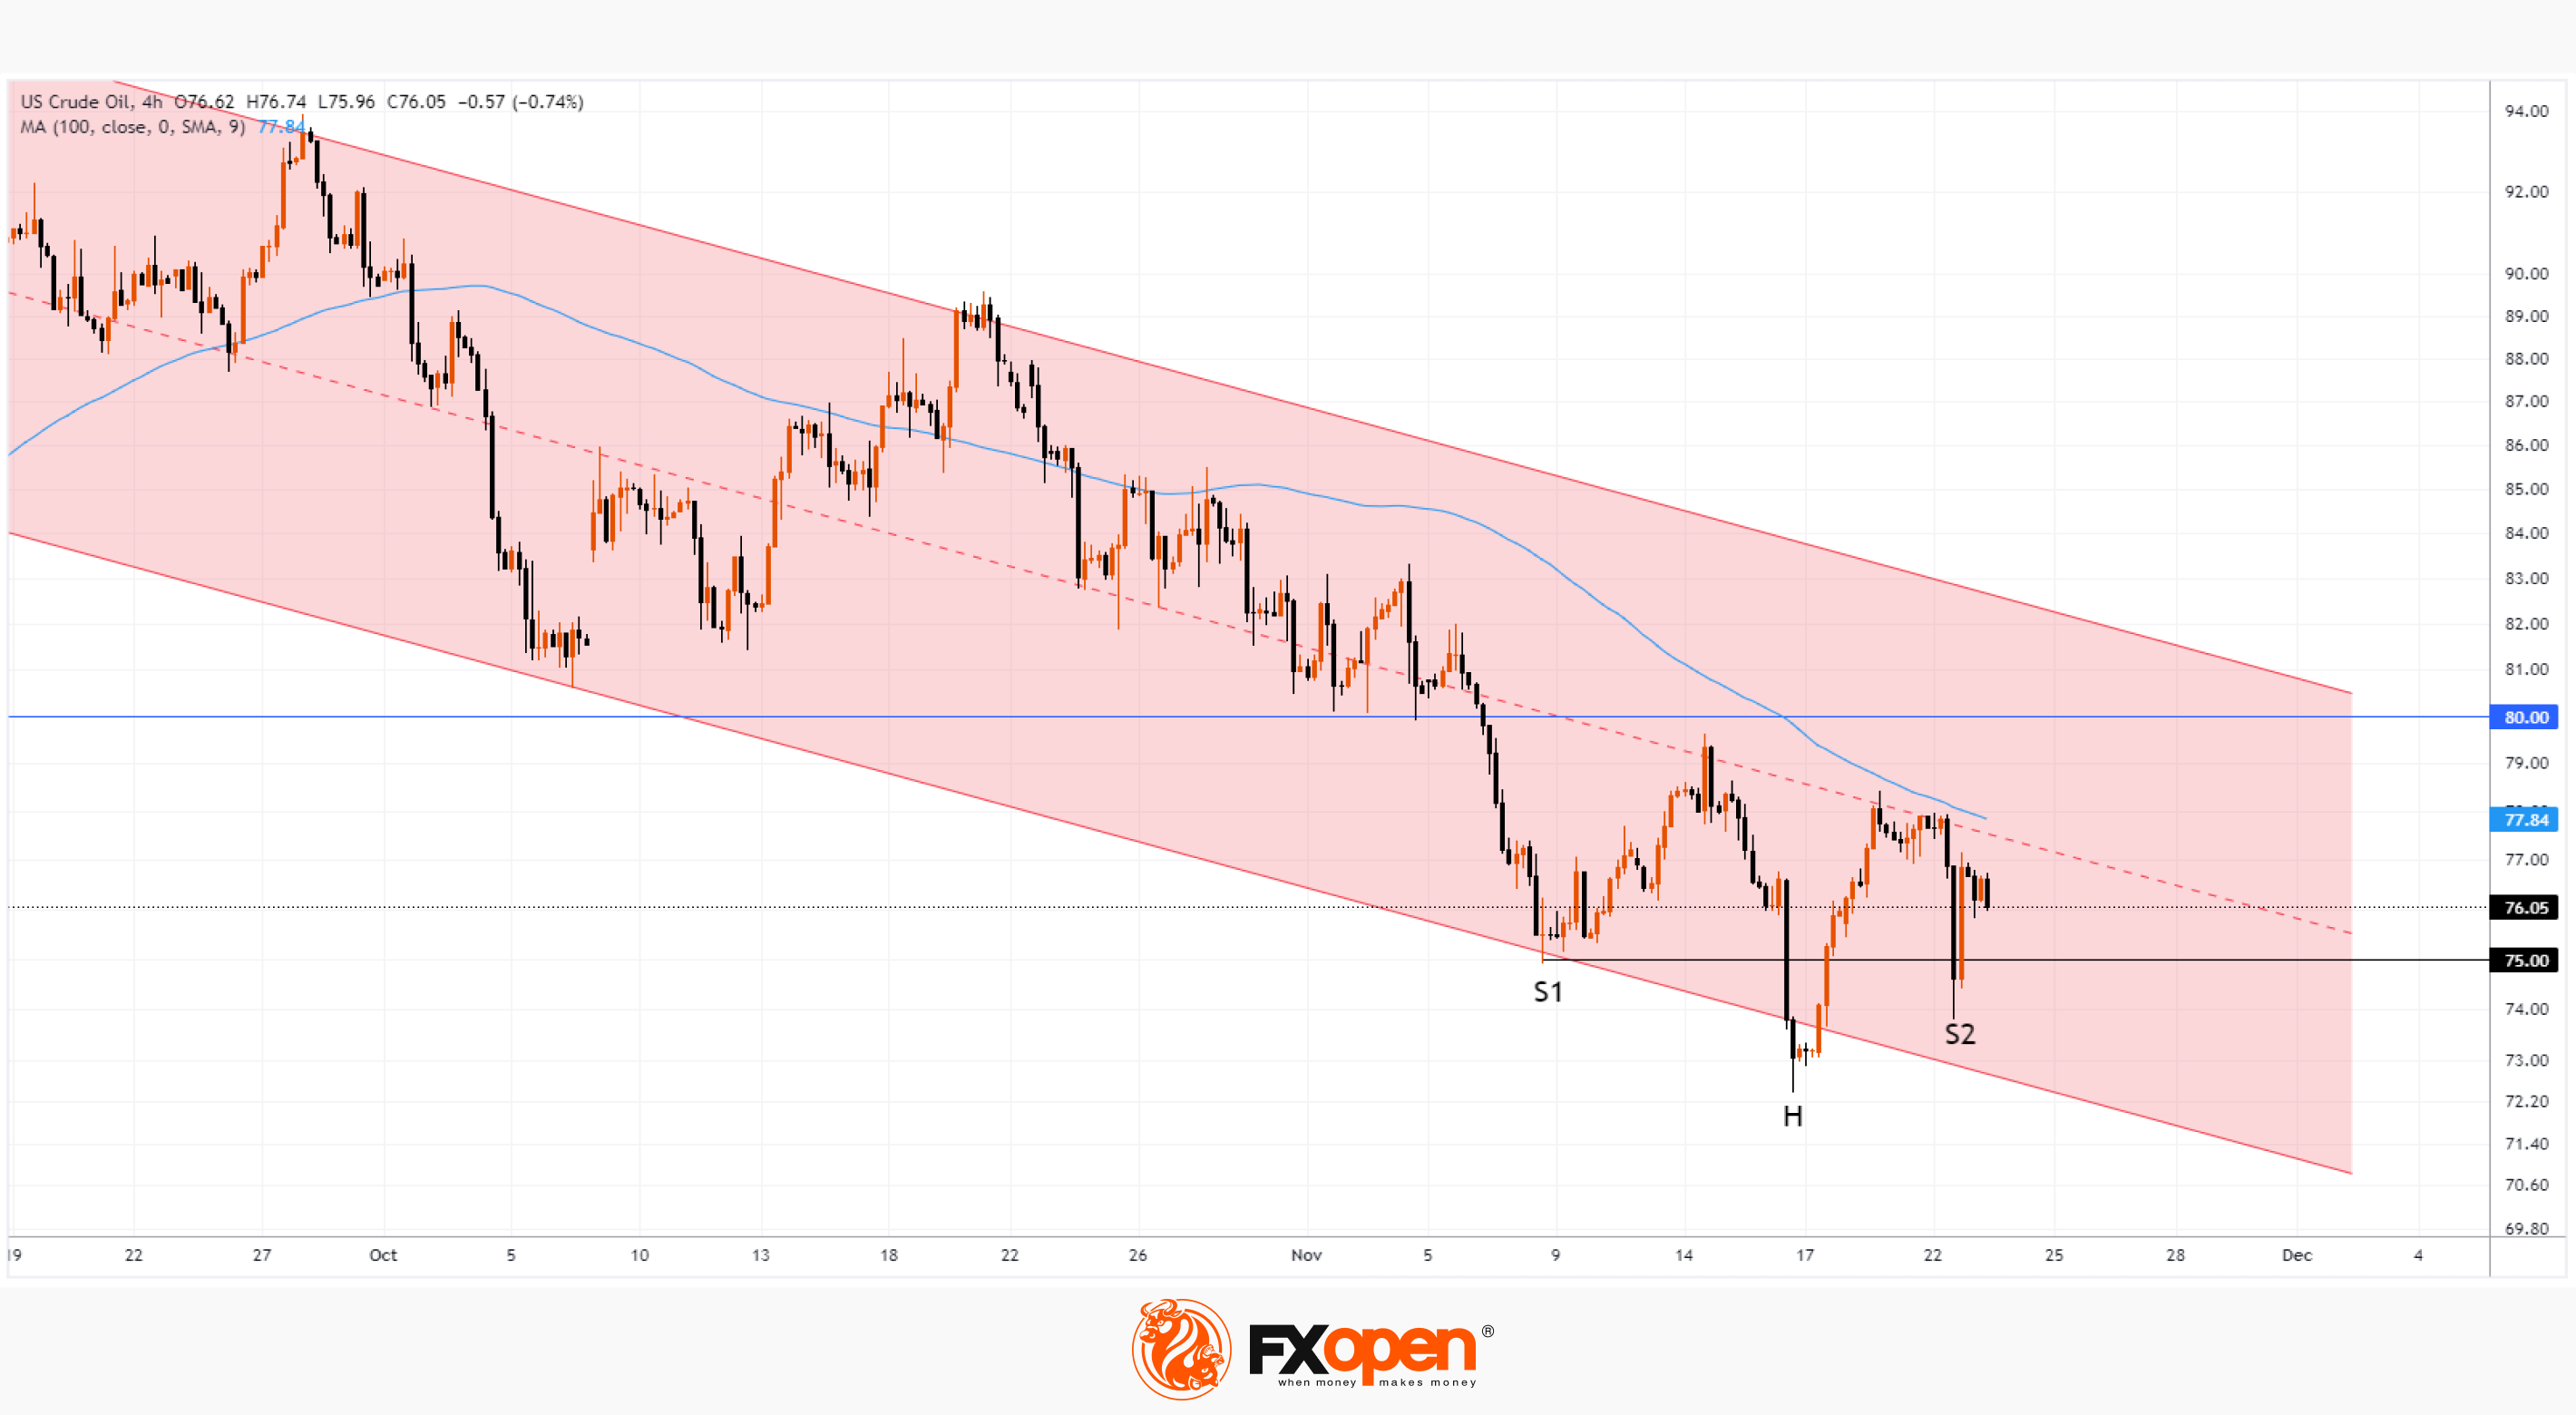
After the price failed to reach the round level of USD 80 by only 36 cents (the median line of the descending channel prevented this from happening) on November 14, the bears again seized the initiative. The result of their pressure was a reduction in the price to a new autumn low on November 14 at the level of USD 73 per barrel, after which the price recovered again to the median line.
A new attempt by the bears to push the price down from the median line occurred on November 22, but note how quickly the price of oil recovered after falling below USD 75 per barrel. This is evidence of bull aggression and the strength of demand.
At the same time, the price forms an inverted head-and-shoulders reversal pattern, as a result of which a bullish breakdown of the current descending channel may occur, although if this event occurs, it is unlikely in the near future, since first the bulls need to overcome the resistance from the median line. Also, the bulls will have psychological resistance at USD 80 and, possibly, the SMA (100), directed downwards.
Market participants are focusing on the OPEC+ meeting, which was postponed to November 30. It is reported that some members of the bloc of oil-producing countries are dissatisfied with the current policy of cutting production, as attempts to maintain world oil prices by reducing market supply do not allow them to achieve budgetary goals.
It is possible that by the end of the month we will see spikes in volatility against the backdrop of news related to OPEC+.
To benefit from fluctuations in oil prices, consider enlisting the services of a trusted broker like FXOpen.
CFDs are complex instruments and come with a high risk of losing your money.
This article represents the opinion of the Companies operating under the FXOpen brand only. It is not to be construed as an offer, solicitation, or recommendation with respect to products and services provided by the Companies operating under the FXOpen brand, nor is it to be considered financial advice.
Market Analysis: The Price of WTI Oil Forming a Reversal Pattern
In our analysis of the price of WTI oil dated November 8, we wrote that the price could recover to the level of USD 80 per barrel.
After the price failed to reach the round level of USD 80 by only 36 cents (the median line of the descending channel prevented this from happening) on November 14, the bears again seized the initiative. The result of their pressure was a reduction in the price to a new autumn low on November 14 at the level of USD 73 per barrel, after which the price recovered again to the median line.
A new attempt by the bears to push the price down from the median line occurred on November 22, but note how quickly the price of oil recovered after falling below USD 75 per barrel. This is evidence of bull aggression and the strength of demand.
At the same time, the price forms an inverted head-and-shoulders reversal pattern, as a result of which a bullish breakdown of the current descending channel may occur, although if this event occurs, it is unlikely in the near future, since first the bulls need to overcome the resistance from the median line. Also, the bulls will have psychological resistance at USD 80 and, possibly, the SMA (100), directed downwards.
Market participants are focusing on the OPEC+ meeting, which was postponed to November 30. It is reported that some members of the bloc of oil-producing countries are dissatisfied with the current policy of cutting production, as attempts to maintain world oil prices by reducing market supply do not allow them to achieve budgetary goals.
It is possible that by the end of the month we will see spikes in volatility against the backdrop of news related to OPEC+.
To benefit from fluctuations in oil prices, consider enlisting the services of a trusted broker like FXOpen.
CFDs are complex instruments and come with a high risk of losing your money.
This article represents the opinion of the Companies operating under the FXOpen brand only. It is not to be construed as an offer, solicitation, or recommendation with respect to products and services provided by the Companies operating under the FXOpen brand, nor is it to be considered financial advice.
#marketanalysis #MarketNews #stockmarket
Market Analysis: European Shares Rise on Improving PMI Readings
Yesterday, the values of the PMI index (it is characterized as a leading indicator of industrial production and services) for European countries were published:
→ in Germany: fact = 42.3; expected = 41.1; a month earlier = 40.7;
→ in France: fact = 42.6; expected = 43.2; a month earlier = 42.6;
Although the index values are below 50, indicating a contraction in the economy, the dynamics are encouraging. Thus, in France, the index stabilized after a series of declines. And in Germany, the index is consistently growing after a minimum of 38.8 in July. In this way, business is reacting to the fact that the ECB may have reached the peak of increases and monetary policy will not tighten in the future.
At the same time, the ESX50 index of 50 European shares gained bullish momentum and reached its highest levels since mid-August. Equity market participants may be feeling strongly positive about the rally of more than +9% in less than a month.
However, the daily chart of the ESX50 shows that price dynamics allow a structure of trend lines (shown in blue) to be drawn, reminiscent of a Gann fan. And what's interesting is that the current value has reached an important line (shown as thickening) in this structure, which can serve as resistance - as it did more than once during the period from April to July.
Given that the RSI indicator is forming divergence in the overbought zone, it can be assumed that the market is vulnerable to a pullback.
To benefit from fluctuations in European stock markets, consider enlisting the services of a trusted broker like FXOpen.
CFDs are complex instruments and come with a high risk of losing your money.
This article represents the opinion of the Companies operating under the FXOpen brand only. It is not to be construed as an offer, solicitation, or recommendation with respect to products and services provided by the Companies operating under the FXOpen brand, nor is it to be considered financial advice.
Market Analysis: European Shares Rise on Improving PMI Readings
Yesterday, the values of the PMI index (it is characterized as a leading indicator of industrial production and services) for European countries were published:
→ in Germany: fact = 42.3; expected = 41.1; a month earlier = 40.7;
→ in France: fact = 42.6; expected = 43.2; a month earlier = 42.6;
Although the index values are below 50, indicating a contraction in the economy, the dynamics are encouraging. Thus, in France, the index stabilized after a series of declines. And in Germany, the index is consistently growing after a minimum of 38.8 in July. In this way, business is reacting to the fact that the ECB may have reached the peak of increases and monetary policy will not tighten in the future.
At the same time, the ESX50 index of 50 European shares gained bullish momentum and reached its highest levels since mid-August. Equity market participants may be feeling strongly positive about the rally of more than +9% in less than a month.
However, the daily chart of the ESX50 shows that price dynamics allow a structure of trend lines (shown in blue) to be drawn, reminiscent of a Gann fan. And what's interesting is that the current value has reached an important line (shown as thickening) in this structure, which can serve as resistance - as it did more than once during the period from April to July.
Given that the RSI indicator is forming divergence in the overbought zone, it can be assumed that the market is vulnerable to a pullback.
To benefit from fluctuations in European stock markets, consider enlisting the services of a trusted broker like FXOpen.
CFDs are complex instruments and come with a high risk of losing your money.
This article represents the opinion of the Companies operating under the FXOpen brand only. It is not to be construed as an offer, solicitation, or recommendation with respect to products and services provided by the Companies operating under the FXOpen brand, nor is it to be considered financial advice.

👍1
#marketanalysis #MarketNews #crypto
AVAX Analysis: Market in Vulnerable Position
A chart from the FXOpen Ticktrader platform shows that the AVAX/USD cryptocurrency rate showed strong growth: in the month from October 20 to November 20, the price increased by more than 150%.
This happened against the backdrop of:
→ general positivity in the cryptocurrency market associated with the expectation of approval of Bitcoin ETFs by the SEC regulator;
→ the news about investments in the Avalance ecosystem, the native token of which is AVAX.
However, the chart also shows important signs that the market may be vulnerable to a pullback. Namely:
→ rapid growth stalled in the period from November 16 to 19. Perhaps too many investors wanted to join a pronounced trend, but did so too late: these are prerequisites typical for a correction to occur;
→ the price has exceeded the level of the previous high of the year, but there are long upper shadows on the candles, and the closes are below the high level - these are signs of a false breakout.
On November 22, the price bounced up from the broken line of the descending channel, which can be regarded as a bullish signal. But the described signs of weakness look too convincing, forcing us to consider the return of the AVAX price inside the downward channel as a realistic option.
To benefit from the rise and fall of cryptocurrency prices, consider enlisting the services of a trusted broker like FXOpen.
CFDs are complex instruments and come with a high risk of losing your money.
This article represents the opinion of the Companies operating under the FXOpen brand only. It is not to be construed as an offer, solicitation, or recommendation with respect to products and services provided by the Companies operating under the FXOpen brand, nor is it to be considered financial advice.
At FXOpen UK and FXOpen AU, Cryptocurrency CFDs are only available for trading by those clients categorised as Professional clients under FCA Rules and Professional clients under ASIC Rules, respectively. They are not available for trading by Retail clients.
AVAX Analysis: Market in Vulnerable Position
A chart from the FXOpen Ticktrader platform shows that the AVAX/USD cryptocurrency rate showed strong growth: in the month from October 20 to November 20, the price increased by more than 150%.
This happened against the backdrop of:
→ general positivity in the cryptocurrency market associated with the expectation of approval of Bitcoin ETFs by the SEC regulator;
→ the news about investments in the Avalance ecosystem, the native token of which is AVAX.
However, the chart also shows important signs that the market may be vulnerable to a pullback. Namely:
→ rapid growth stalled in the period from November 16 to 19. Perhaps too many investors wanted to join a pronounced trend, but did so too late: these are prerequisites typical for a correction to occur;
→ the price has exceeded the level of the previous high of the year, but there are long upper shadows on the candles, and the closes are below the high level - these are signs of a false breakout.
On November 22, the price bounced up from the broken line of the descending channel, which can be regarded as a bullish signal. But the described signs of weakness look too convincing, forcing us to consider the return of the AVAX price inside the downward channel as a realistic option.
To benefit from the rise and fall of cryptocurrency prices, consider enlisting the services of a trusted broker like FXOpen.
CFDs are complex instruments and come with a high risk of losing your money.
This article represents the opinion of the Companies operating under the FXOpen brand only. It is not to be construed as an offer, solicitation, or recommendation with respect to products and services provided by the Companies operating under the FXOpen brand, nor is it to be considered financial advice.
At FXOpen UK and FXOpen AU, Cryptocurrency CFDs are only available for trading by those clients categorised as Professional clients under FCA Rules and Professional clients under ASIC Rules, respectively. They are not available for trading by Retail clients.