
#stockmarket #AMZN #stocktrading #MarketNews
AMZN Shares Set a New All-Time High
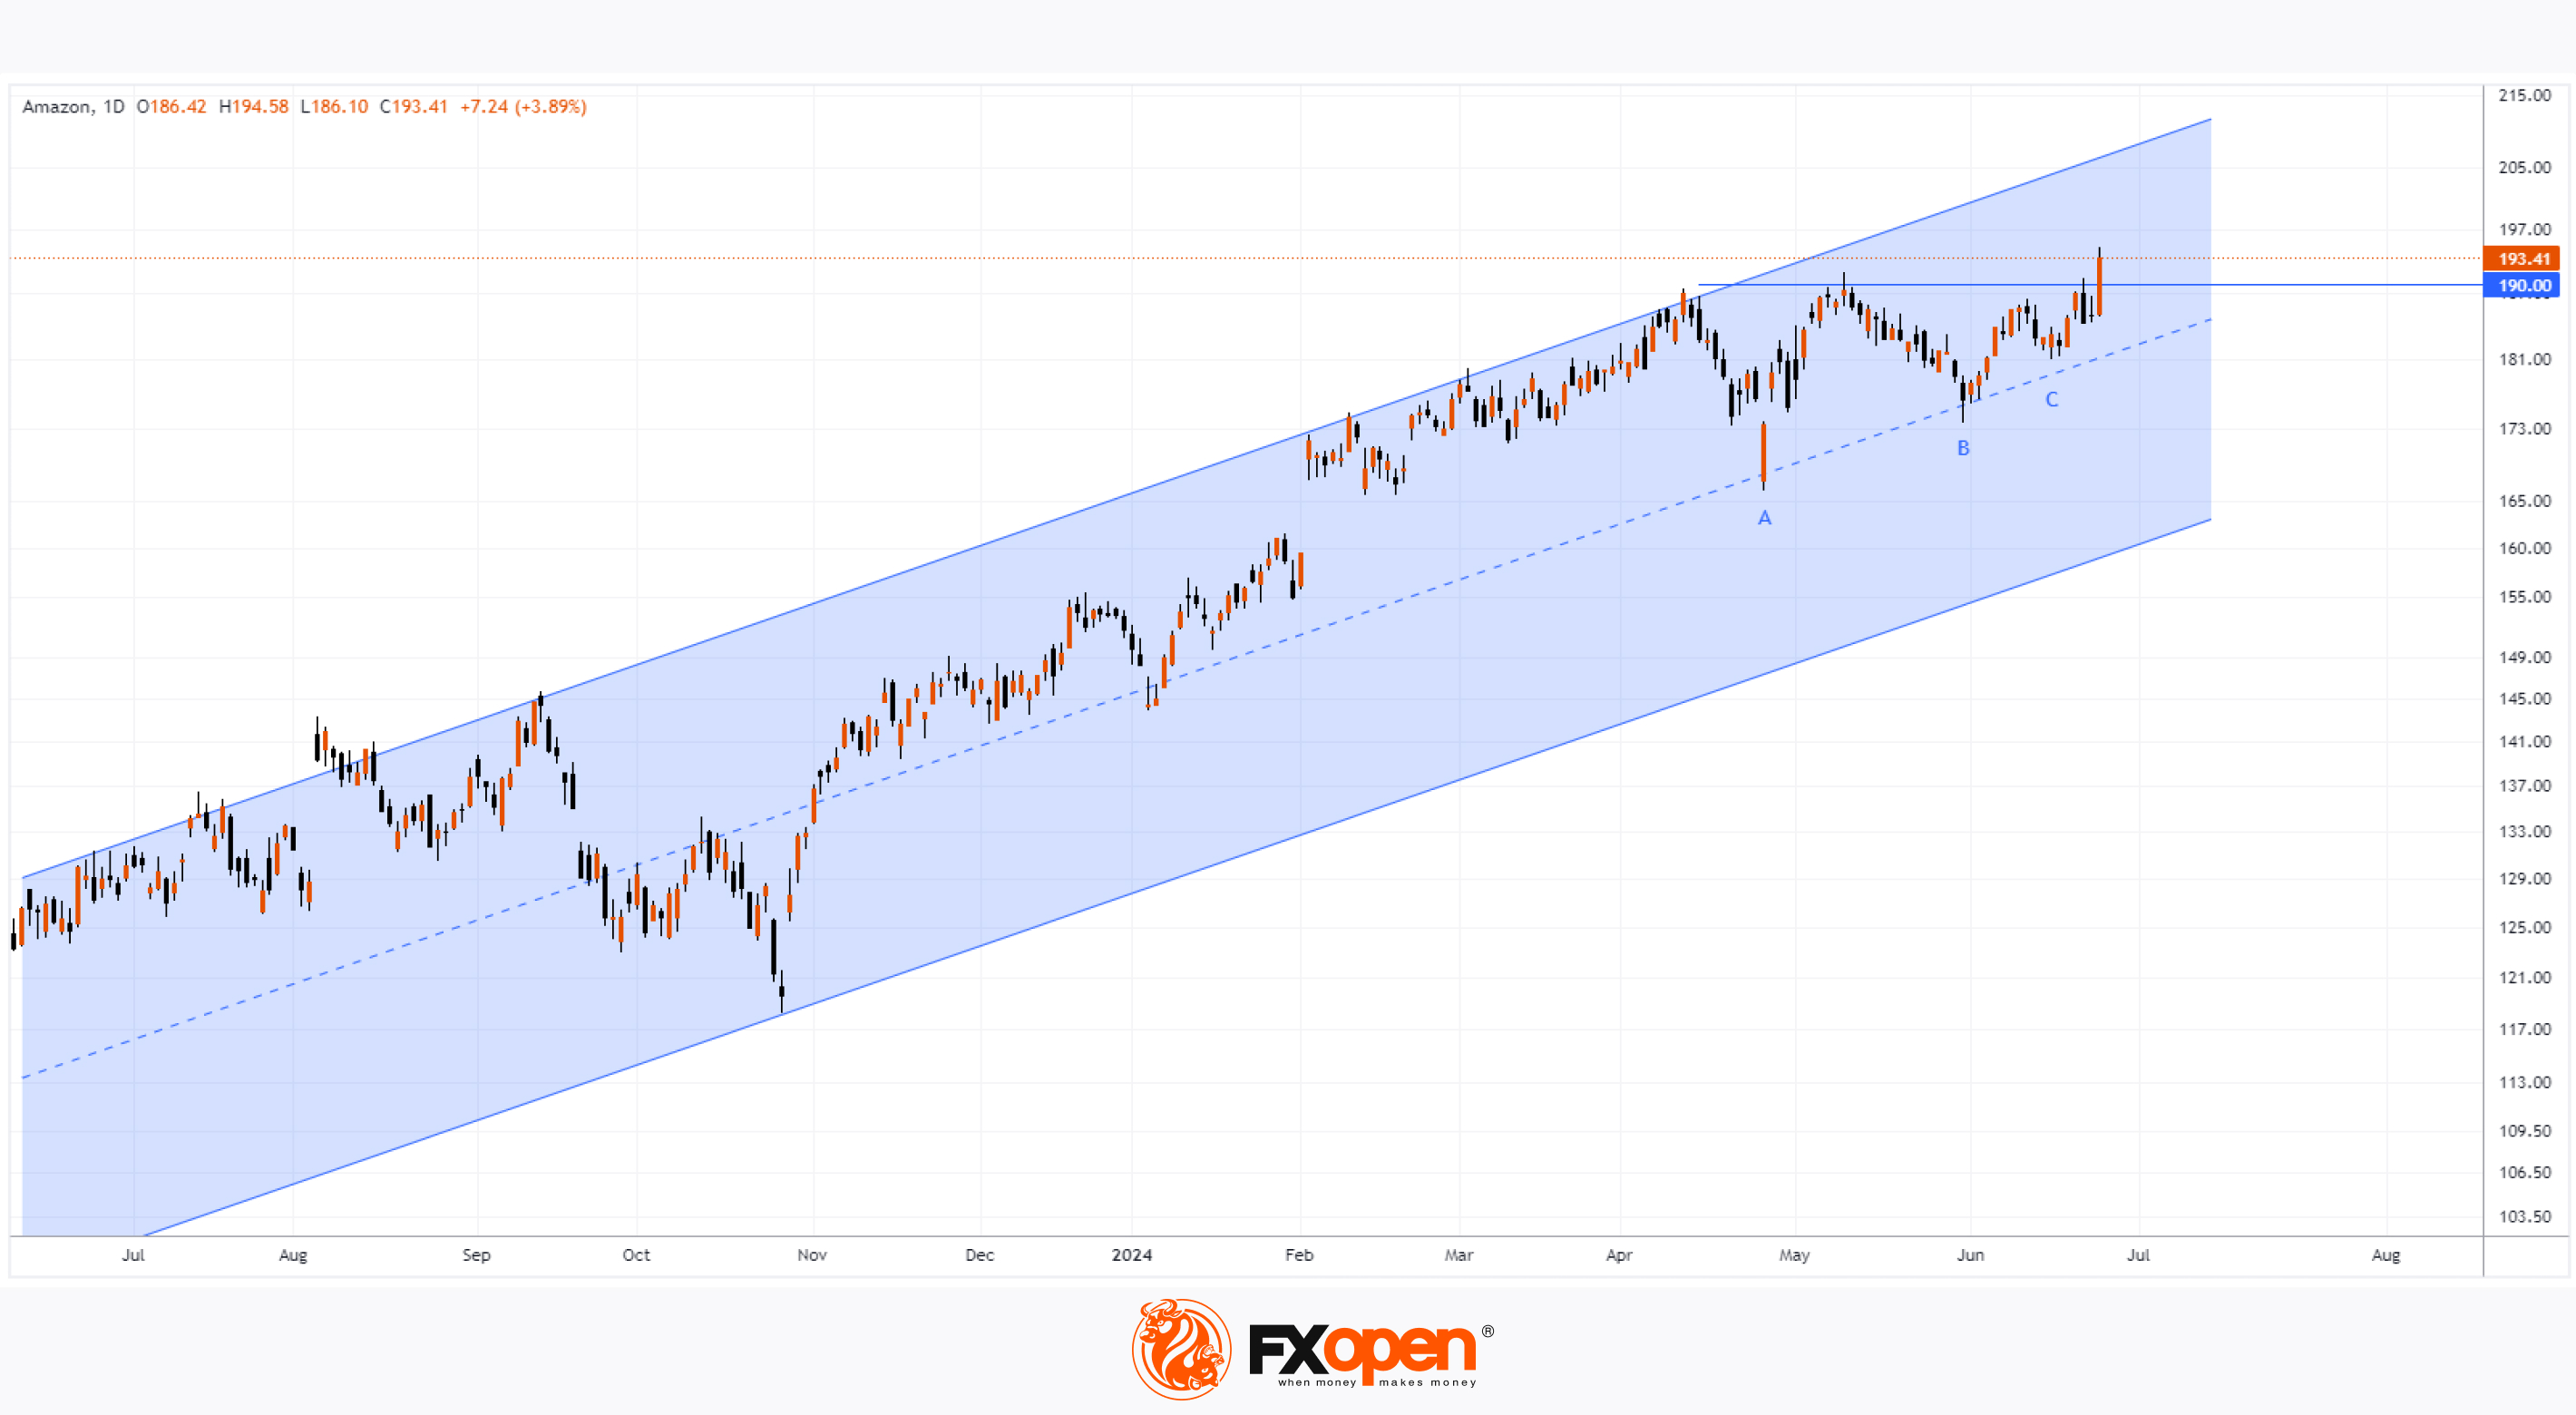
As shown in the AMZN chart, yesterday the share price confidently surpassed the psychological level of $190, closing above $193.41, which is a new all-time high.
Specifically:
→ the growth was approximately +3.9% for the day, with the closing candle at the upper part (a sign of strong demand);
→ Amazon's market capitalisation exceeded $2 trillion.
According to Benzinga, the rise in AMZN's price was driven by:
→ the news that BofA Securities analyst Justin Post maintained a "Buy" recommendation and raised the target price from $210 to $220, citing the potential for improved efficiency through better logistics.
→ the information that Amazon is preparing to launch a discount section similar to Temu, which will offer direct delivery from China.
Technical analysis of the AMZN daily chart shows that:
→ the price is moving within an upward channel (shown in blue), being in the upper half of it (evidence of strong demand);
→ rising lows A-B-C, which formed under the $190 resistance, reflect the essence of the cup-and-handle pattern;
→ bulls have the potential to rise to the upper boundary of the channel.
The bulls may be supported by:
→ the $190 level, which had acted as resistance since mid-April but was broken yesterday;
→ the median line of the blue channel.
According to TipRanks, the average target price for AMZN predicted by Wall Street analysts is $221.55 (an increase of 14.43% from current levels) within 12 months.
Trade global index CFDs with zero commission and tight spreads. Open your FXOpen account now or learn more about trading index CFDs with FXOpen.
CFDs are complex instruments and come with a high risk of losing your money.
This article represents the opinion of the Companies operating under the FXOpen brand only. It is not to be construed as an offer, solicitation, or recommendation with respect to products and services provided by the Companies operating under the FXOpen brand, nor is it to be considered financial advice.
AMZN Shares Set a New All-Time High
As shown in the AMZN chart, yesterday the share price confidently surpassed the psychological level of $190, closing above $193.41, which is a new all-time high.
Specifically:
→ the growth was approximately +3.9% for the day, with the closing candle at the upper part (a sign of strong demand);
→ Amazon's market capitalisation exceeded $2 trillion.
According to Benzinga, the rise in AMZN's price was driven by:
→ the news that BofA Securities analyst Justin Post maintained a "Buy" recommendation and raised the target price from $210 to $220, citing the potential for improved efficiency through better logistics.
→ the information that Amazon is preparing to launch a discount section similar to Temu, which will offer direct delivery from China.
Technical analysis of the AMZN daily chart shows that:
→ the price is moving within an upward channel (shown in blue), being in the upper half of it (evidence of strong demand);
→ rising lows A-B-C, which formed under the $190 resistance, reflect the essence of the cup-and-handle pattern;
→ bulls have the potential to rise to the upper boundary of the channel.
The bulls may be supported by:
→ the $190 level, which had acted as resistance since mid-April but was broken yesterday;
→ the median line of the blue channel.
According to TipRanks, the average target price for AMZN predicted by Wall Street analysts is $221.55 (an increase of 14.43% from current levels) within 12 months.
Trade global index CFDs with zero commission and tight spreads. Open your FXOpen account now or learn more about trading index CFDs with FXOpen.
CFDs are complex instruments and come with a high risk of losing your money.
This article represents the opinion of the Companies operating under the FXOpen brand only. It is not to be construed as an offer, solicitation, or recommendation with respect to products and services provided by the Companies operating under the FXOpen brand, nor is it to be considered financial advice.
👍2
#USDJPY #forextrading #forex #marketanalysis
USD/JPY Rate Hits Highest Level Since 1986
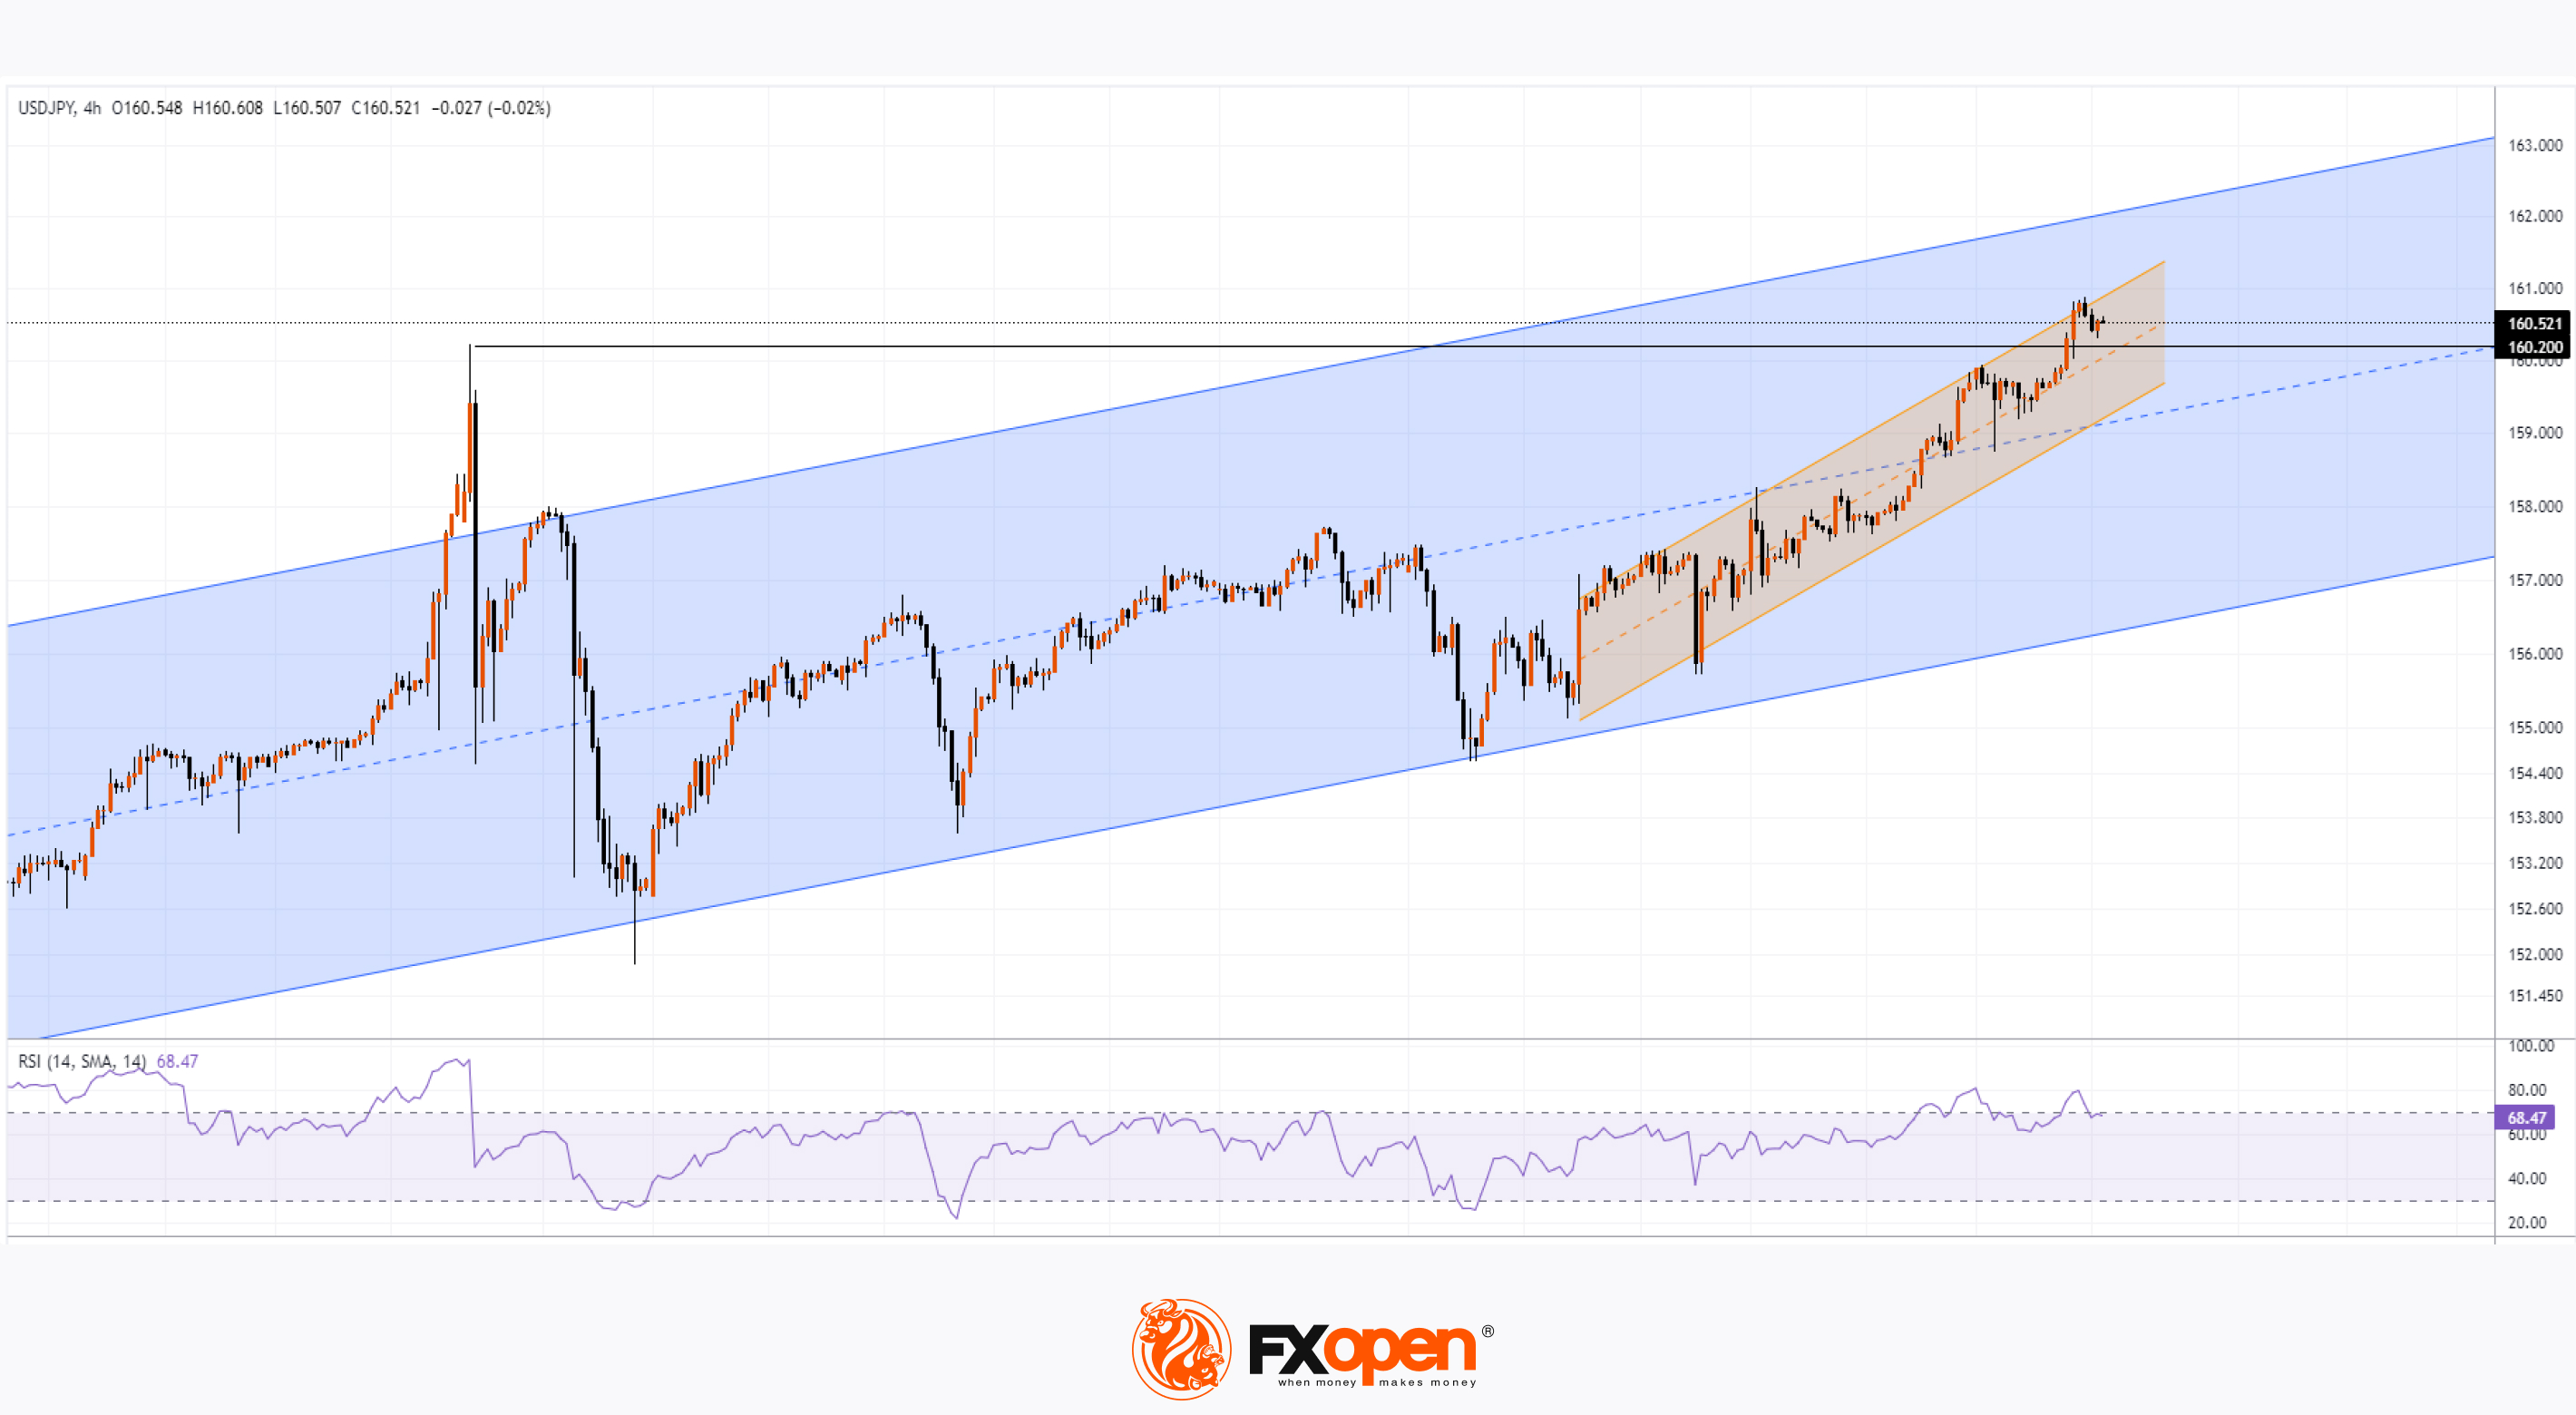
As shown in the USD/JPY chart, today the rate is around 160.58 yen per US dollar.
Bloomberg reports the words of Japan’s Finance Minister Shunichi Suzuki:
→ It is desirable for the exchange rate to move in a stable manner.
→ Sudden, one-sided moves are not desirable.
→ We will analyze the background to this move with a high sense of urgency, and take necessary action as needed.
Such rhetoric from officials seems not to have deterred the bulls, who are keeping the rate above the April high (when the Bank of Japan intervened in the market to support the weakened yen, resulting in a 4.75% decline over 5 days).
In our analysis from 24 June, we noted that:
→ the price is moving within a large upward channel (shown in blue),
→ and the local rise (framed by orange lines) could push the price to the boundaries of the blue channel.
Updated technical analysis of USD/JPY shows that:
→ the price continues to hold within the orange channel;
→ in the coming days, the April high of 160.20 yen per dollar may act as support after being broken, reinforced by the median line of the orange channel.
It seems the bulls are in control, highlighted by the RSI indicator, which has not dropped below the 50 level since mid-June.
However, everything could change suddenly with the release of US inflation data tomorrow at 15:30 GMT+3. It is possible that the data will indicate rising inflation (as it did in Australia this week), and the US dollar will strengthen further, pushing the USD/JPY rate even higher – potentially prompting another intervention by the Bank of Japan.
Be prepared for possible spikes in volatility.
Trade over 50 forex markets 24 hours a day with FXOpen. Take advantage of low commissions, deep liquidity, and spreads from 0.0 pips. Open your FXOpen account now or learn more about trading forex with FXOpen.
CFDs are complex instruments and come with a high risk of losing your money.
This article represents the opinion of the Companies operating under the FXOpen brand only. It is not to be construed as an offer, solicitation, or recommendation with respect to products and services provided by the Companies operating under the FXOpen brand, nor is it to be considered financial advice.
USD/JPY Rate Hits Highest Level Since 1986
As shown in the USD/JPY chart, today the rate is around 160.58 yen per US dollar.
Bloomberg reports the words of Japan’s Finance Minister Shunichi Suzuki:
→ It is desirable for the exchange rate to move in a stable manner.
→ Sudden, one-sided moves are not desirable.
→ We will analyze the background to this move with a high sense of urgency, and take necessary action as needed.
Such rhetoric from officials seems not to have deterred the bulls, who are keeping the rate above the April high (when the Bank of Japan intervened in the market to support the weakened yen, resulting in a 4.75% decline over 5 days).
In our analysis from 24 June, we noted that:
→ the price is moving within a large upward channel (shown in blue),
→ and the local rise (framed by orange lines) could push the price to the boundaries of the blue channel.
Updated technical analysis of USD/JPY shows that:
→ the price continues to hold within the orange channel;
→ in the coming days, the April high of 160.20 yen per dollar may act as support after being broken, reinforced by the median line of the orange channel.
It seems the bulls are in control, highlighted by the RSI indicator, which has not dropped below the 50 level since mid-June.
However, everything could change suddenly with the release of US inflation data tomorrow at 15:30 GMT+3. It is possible that the data will indicate rising inflation (as it did in Australia this week), and the US dollar will strengthen further, pushing the USD/JPY rate even higher – potentially prompting another intervention by the Bank of Japan.
Be prepared for possible spikes in volatility.
Trade over 50 forex markets 24 hours a day with FXOpen. Take advantage of low commissions, deep liquidity, and spreads from 0.0 pips. Open your FXOpen account now or learn more about trading forex with FXOpen.
CFDs are complex instruments and come with a high risk of losing your money.
This article represents the opinion of the Companies operating under the FXOpen brand only. It is not to be construed as an offer, solicitation, or recommendation with respect to products and services provided by the Companies operating under the FXOpen brand, nor is it to be considered financial advice.
👍2
#usdollar #marketanalysis #MarketNews
Strong US Dollar Dominates Forex: For How Long?
According to ICE data, the price of the US Dollar Index futures contract has reached its highest level since May 2 of this year.
This strength is reflected in the exchange rates of major currencies against the US dollar:
→ The USD/JPY rate has reached a record high since 1986, which we reported yesterday. Today, 1 USD was worth more than 161 yen.
→ The NZD/USD rate has dropped to its lowest level since May 15.
→ The USD/CHF rate has risen to its highest level since June 3.
Regarding the euro, the strength of the US dollar has pushed the EUR/USD rate down to significant support.
Technical analysis of the daily EUR/USD chart shows:
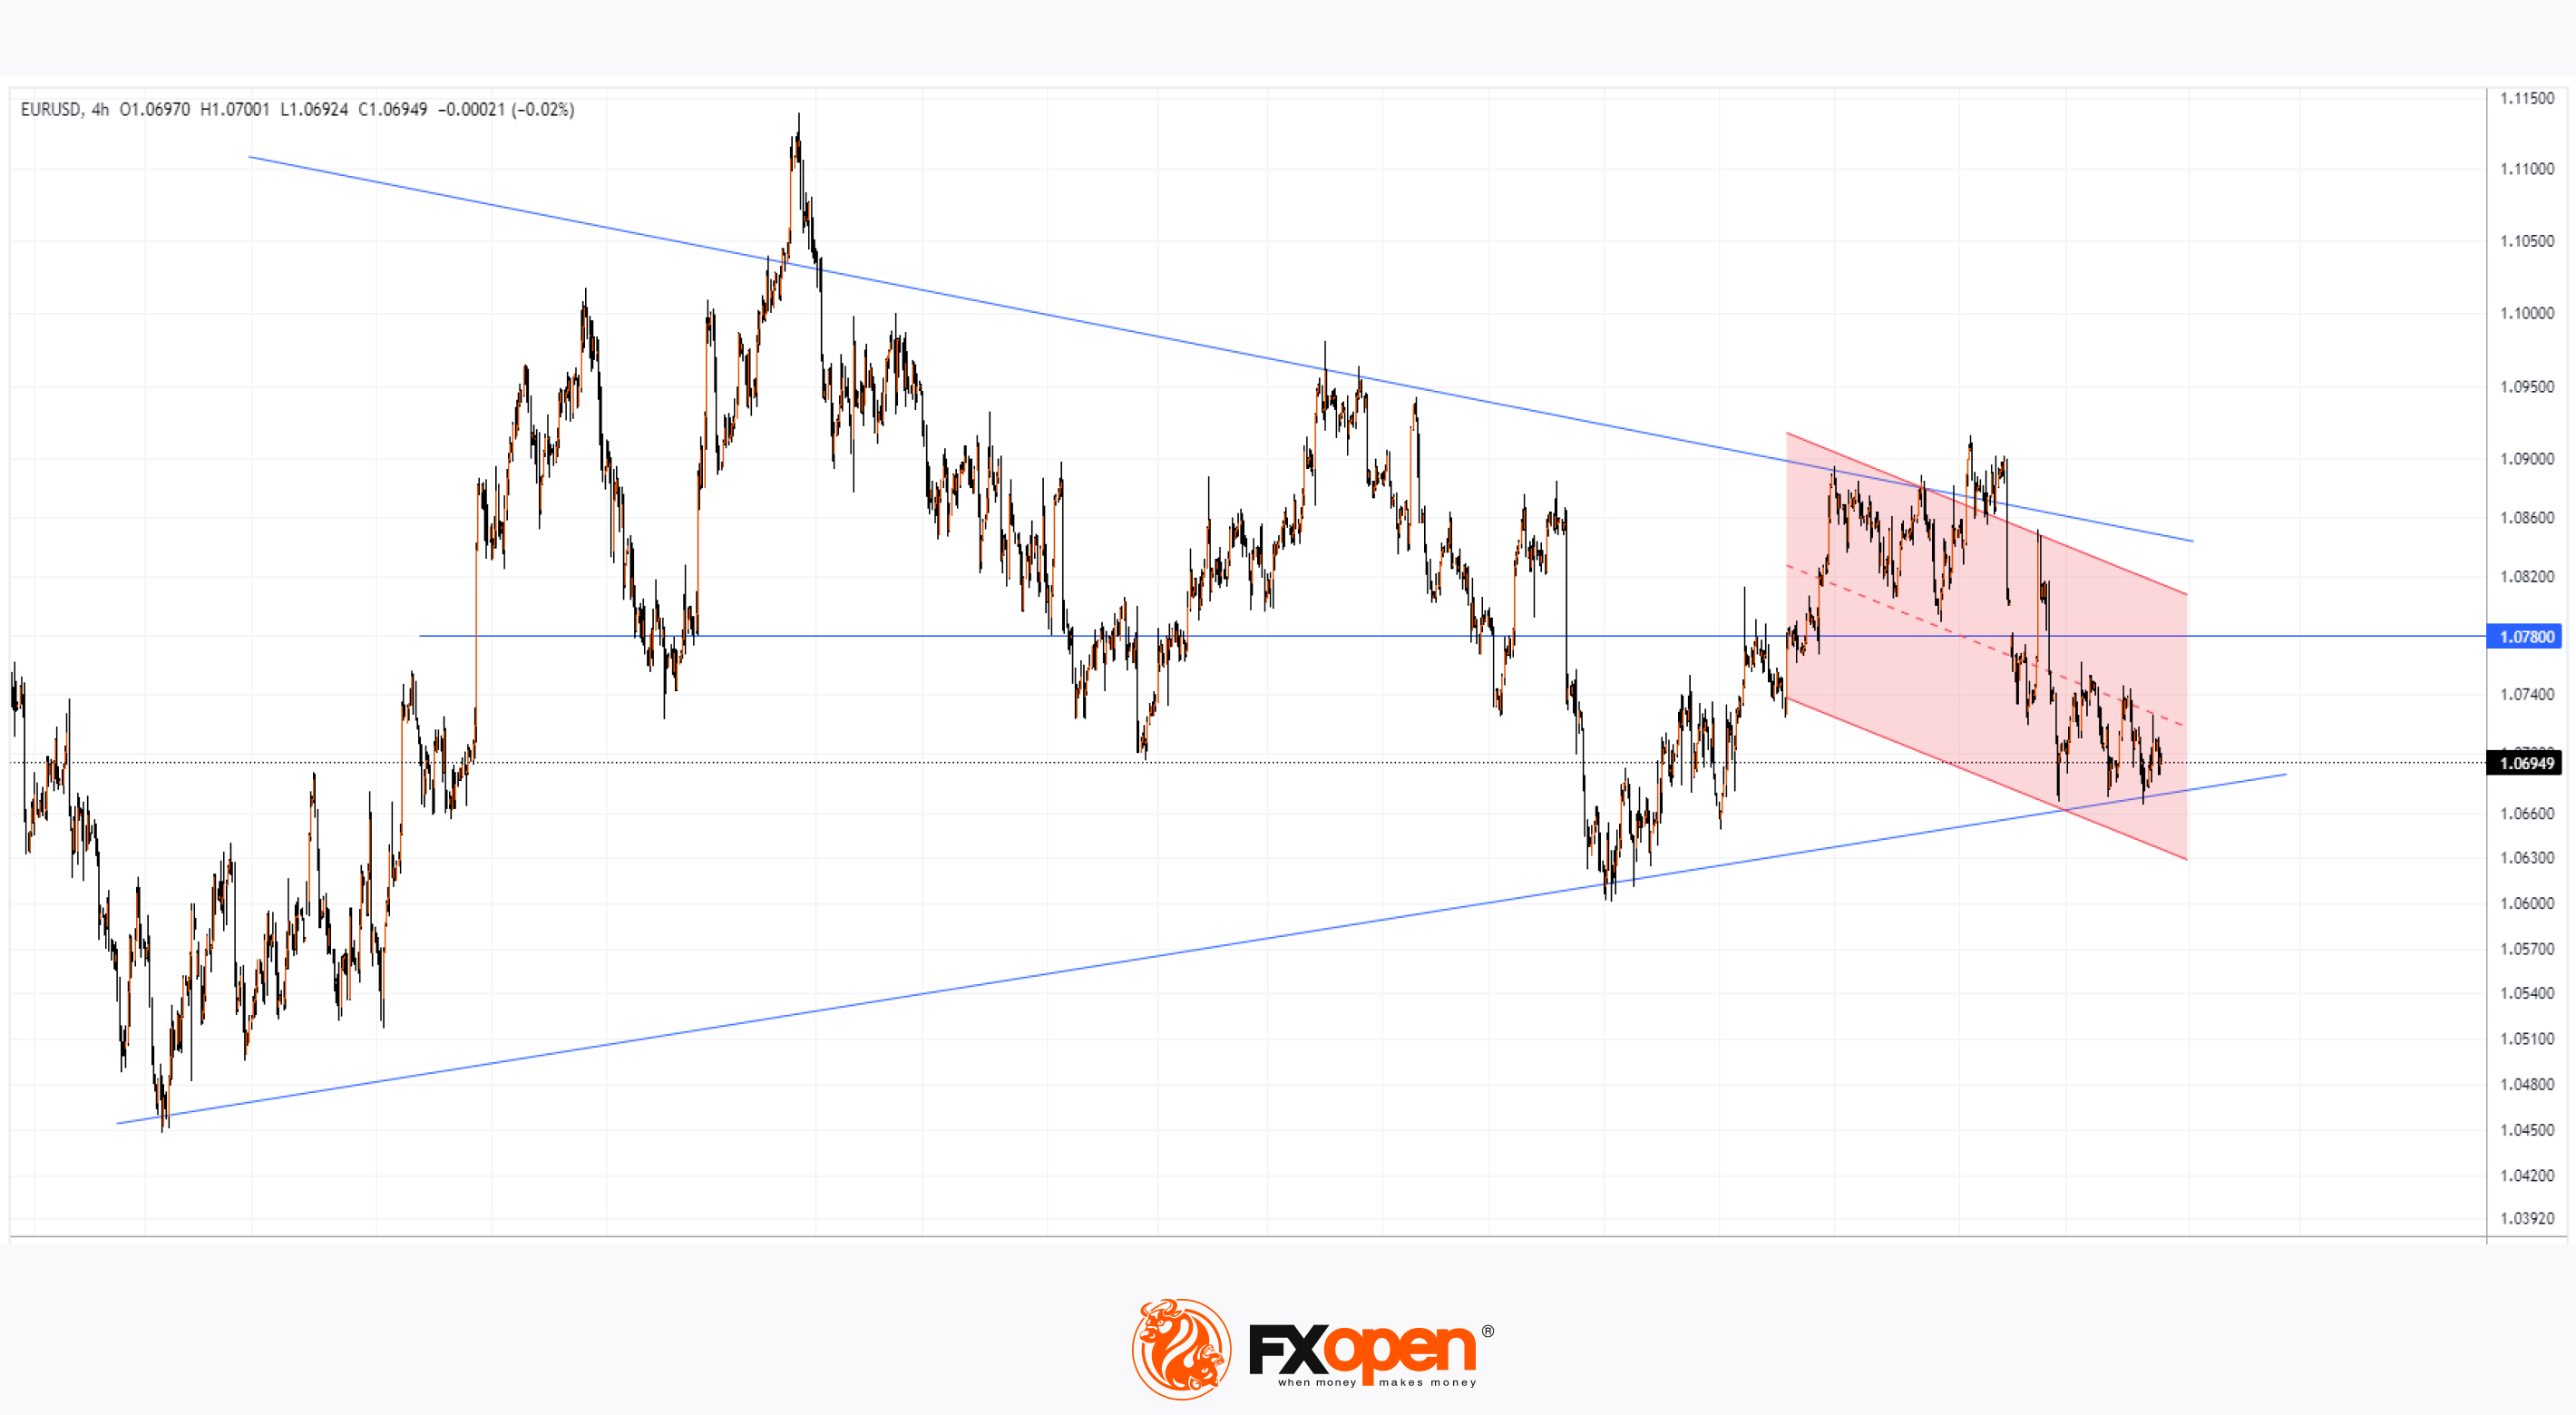
→ The price is in a large narrowing triangle (shown by blue lines) with a median around 1.07800;
→ Uncertainty related to political events in the Eurozone has also contributed to the euro's weakness, and today the EUR/USD price is at the lower boundary of the triangle. Since early June, the EUR/USD price has fallen by approximately 2%, forming a descending channel shown in red.
The proximity to the lower boundary of the triangle presents traders with two basic scenarios to consider:
→ A rebound and return to the median;
→ A bearish breakout of the triangle (e.g., with a weak intraday bullish rebound).
Trade over 50 forex markets 24 hours a day with FXOpen. Take advantage of low commissions, deep liquidity, and spreads from 0.0 pips. Open your FXOpen account now or learn more about trading forex with FXOpen.
CFDs are complex instruments and come with a high risk of losing your money.
This article represents the opinion of the Companies operating under the FXOpen brand only. It is not to be construed as an offer, solicitation, or recommendation with respect to products and services provided by the Companies operating under the FXOpen brand, nor is it to be considered financial advice.
Which scenario will be realised largely depends on today's publication (at 15:30 GMT+3) of the PCE index values. It is possible that signals of slowing inflation will be perceived as a sign of an imminent Fed rate cut. Consequently, this could weaken the strength of the USD.
Strong US Dollar Dominates Forex: For How Long?
According to ICE data, the price of the US Dollar Index futures contract has reached its highest level since May 2 of this year.
This strength is reflected in the exchange rates of major currencies against the US dollar:
→ The USD/JPY rate has reached a record high since 1986, which we reported yesterday. Today, 1 USD was worth more than 161 yen.
→ The NZD/USD rate has dropped to its lowest level since May 15.
→ The USD/CHF rate has risen to its highest level since June 3.
Regarding the euro, the strength of the US dollar has pushed the EUR/USD rate down to significant support.
Technical analysis of the daily EUR/USD chart shows:
→ The price is in a large narrowing triangle (shown by blue lines) with a median around 1.07800;
→ Uncertainty related to political events in the Eurozone has also contributed to the euro's weakness, and today the EUR/USD price is at the lower boundary of the triangle. Since early June, the EUR/USD price has fallen by approximately 2%, forming a descending channel shown in red.
The proximity to the lower boundary of the triangle presents traders with two basic scenarios to consider:
→ A rebound and return to the median;
→ A bearish breakout of the triangle (e.g., with a weak intraday bullish rebound).
Trade over 50 forex markets 24 hours a day with FXOpen. Take advantage of low commissions, deep liquidity, and spreads from 0.0 pips. Open your FXOpen account now or learn more about trading forex with FXOpen.
CFDs are complex instruments and come with a high risk of losing your money.
This article represents the opinion of the Companies operating under the FXOpen brand only. It is not to be construed as an offer, solicitation, or recommendation with respect to products and services provided by the Companies operating under the FXOpen brand, nor is it to be considered financial advice.
Which scenario will be realised largely depends on today's publication (at 15:30 GMT+3) of the PCE index values. It is possible that signals of slowing inflation will be perceived as a sign of an imminent Fed rate cut. Consequently, this could weaken the strength of the USD.
👍2
#NASDAQ #AMZN #stockmarket #USDJPY #forextrading #marketupdate #Amazon
Weekly Market Wrap With Gary Thomson: Nasdaq 100 Index, EU Currencies, USD/JPY, AMZN Shares
Get the latest scoop on the week's hottest headlines, all in one convenient video. Join Gary Thomson, the COO of FXOpen UK, as he breaks down the most significant news reports and shares his expert insights.
🔸Nasdaq 100 Index Failed to Hold above 20,000 Points
🔸 European Currencies Face a Crucial Test: What to Expect
🔸 USD/JPY Rate Hits Highest Level since 1986
🔸 AMZN Shares Set a New All-Time High
Stay in the know and empower yourself with our short, yet power-packed video. Watch it now and stay updated with FXOpen. Don't miss out on this invaluable opportunity to sharpen your trading skills and make informed decisions.
https://cutt.ly/qedq6Ltv
To take advantage of price fluctuations in the foreign exchange markets, consider enlisting the services of a reliable broker like FXOpen.
⚠️
This forecast represents FXOpen Companies opinion only, it should not be construed as an offer, invitation or recommendation in respect to FXOpen Companies products and services or as financial advice.
Weekly Market Wrap With Gary Thomson: Nasdaq 100 Index, EU Currencies, USD/JPY, AMZN Shares
Get the latest scoop on the week's hottest headlines, all in one convenient video. Join Gary Thomson, the COO of FXOpen UK, as he breaks down the most significant news reports and shares his expert insights.
🔸Nasdaq 100 Index Failed to Hold above 20,000 Points
🔸 European Currencies Face a Crucial Test: What to Expect
🔸 USD/JPY Rate Hits Highest Level since 1986
🔸 AMZN Shares Set a New All-Time High
Stay in the know and empower yourself with our short, yet power-packed video. Watch it now and stay updated with FXOpen. Don't miss out on this invaluable opportunity to sharpen your trading skills and make informed decisions.
https://cutt.ly/qedq6Ltv
To take advantage of price fluctuations in the foreign exchange markets, consider enlisting the services of a reliable broker like FXOpen.
⚠️
This forecast represents FXOpen Companies opinion only, it should not be construed as an offer, invitation or recommendation in respect to FXOpen Companies products and services or as financial advice.
YouTube
Weekly Market Wrap With Gary Thomson: Nasdaq 100 Index, EU Currencies, USD/JPY, AMZN Shares
Get the latest scoop on the week's hottest headlines, all in one convenient video. Join Gary Thomson, the COO of FXOpen UK, as he breaks down the most significant news reports and shares his expert insights.
00:28 Nasdaq 100 Index Failed to Hold above 20…
00:28 Nasdaq 100 Index Failed to Hold above 20…
👍3
#EURUSD #marketanalysis #tradingforex
EUR/USD Rate Rises After First Round of Voting in France
According to Reuters, exit polls show that Marine Le Pen's far-right party, the National Rally (RN), won the first round of parliamentary elections in France on Sunday.
The financial market reacted to this with a rise in the euro's exchange rate against other currencies.
Specifically, the EUR/USD rate jumped to its highest level since June 13.
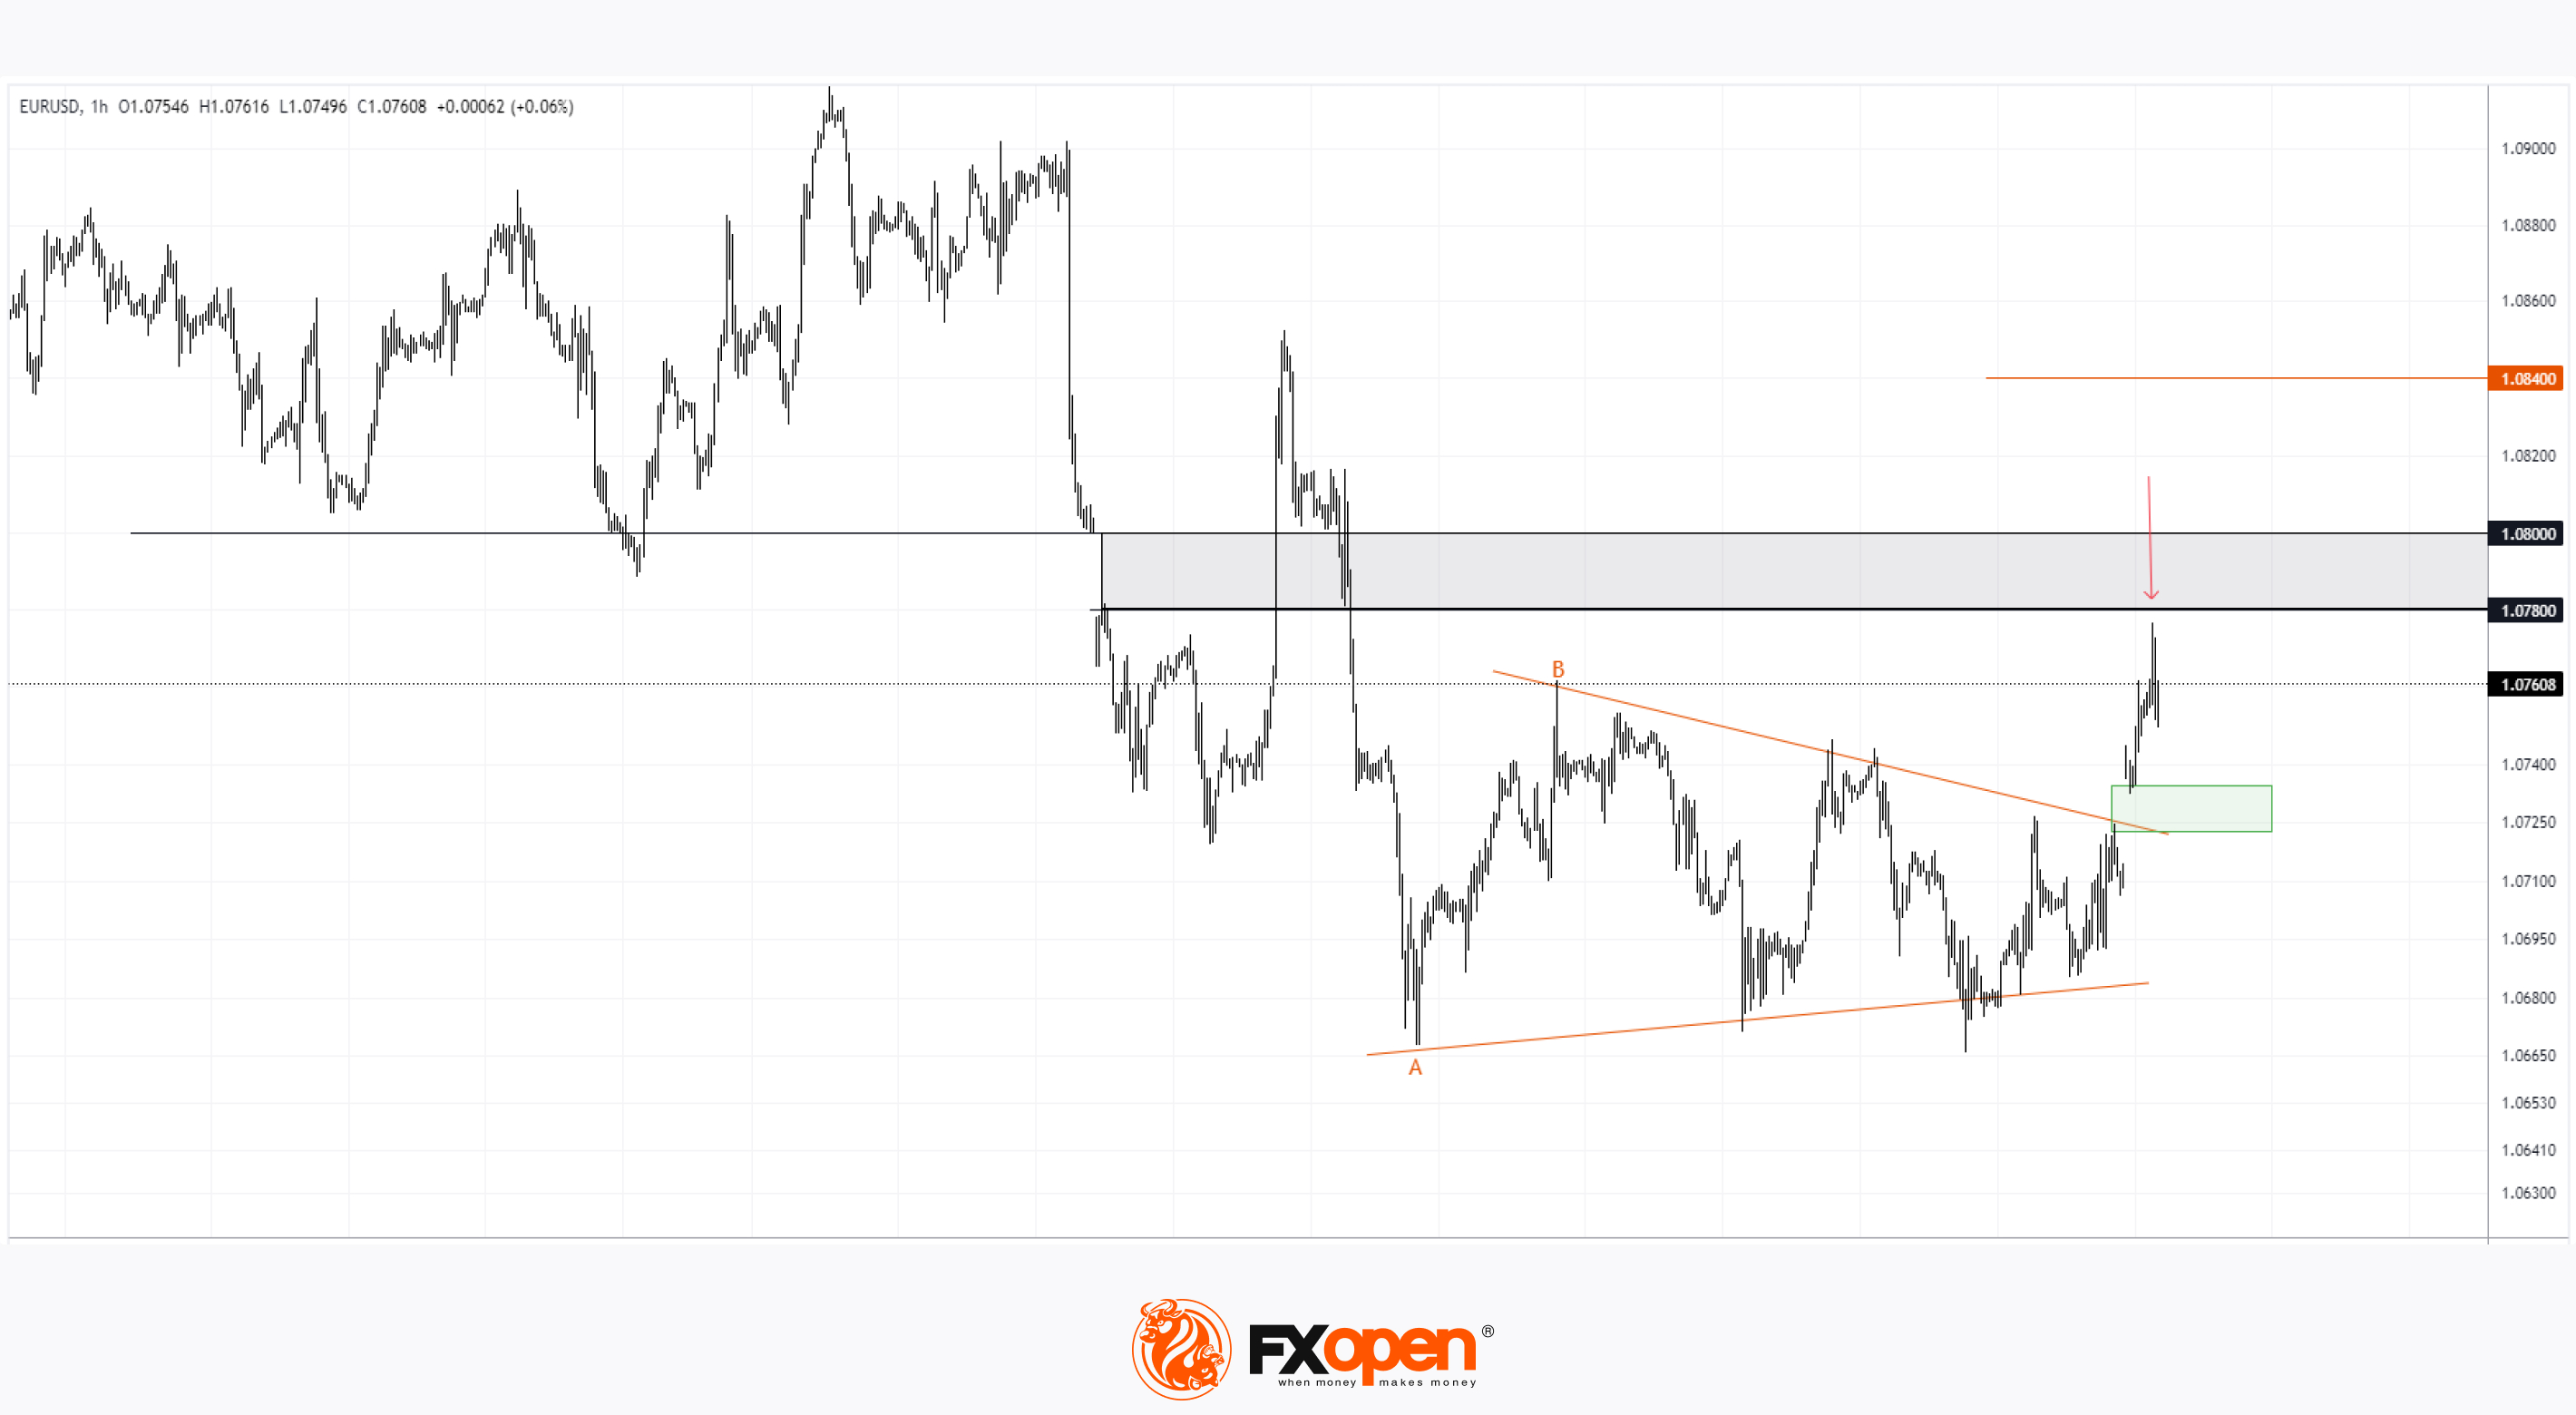
The EUR/USD chart shows that:
→ At the end of June, the price formed a consolidation pattern (shown as an orange triangle);
→ But today's bullish gap (shown in green) broke through it.
According to the principles of technical analysis, if the height of the consolidation pattern is measured through the A-B extremes, the rise could reach the level of 1.08400 (the height of the pattern, projected from the breakout level).
However, for this to happen, bulls need to overcome the resistance zone of 1.080-1.078.
Note that at the Monday morning high, the EUR/USD price sharply reversed downwards (indicated by an arrow). This indicates the activity of supply forces, so traders should not rule out a scenario where the price retraces to the breakout level, into the zone of the bullish gap.
Trade over 50 forex markets 24 hours a day with FXOpen. Take advantage of low commissions, deep liquidity, and spreads from 0.0 pips. Open your FXOpen account now or learn more about trading forex with FXOpen.
CFDs are complex instruments and come with a high risk of losing your money.
This article represents the opinion of the Companies operating under the FXOpen brand only. It is not to be construed as an offer, solicitation, or recommendation with respect to products and services provided by the Companies operating under the FXOpen brand, nor is it to be considered financial advice.
Which scenario will be realised largely depends on today's publication (at 15:30 GMT+3) of the PCE index values. It is possible that signals of slowing inflation will be perceived as a sign of an imminent Fed rate cut. Consequently, this could weaken the strength of the USD.
EUR/USD Rate Rises After First Round of Voting in France
According to Reuters, exit polls show that Marine Le Pen's far-right party, the National Rally (RN), won the first round of parliamentary elections in France on Sunday.
The financial market reacted to this with a rise in the euro's exchange rate against other currencies.
Specifically, the EUR/USD rate jumped to its highest level since June 13.
The EUR/USD chart shows that:
→ At the end of June, the price formed a consolidation pattern (shown as an orange triangle);
→ But today's bullish gap (shown in green) broke through it.
According to the principles of technical analysis, if the height of the consolidation pattern is measured through the A-B extremes, the rise could reach the level of 1.08400 (the height of the pattern, projected from the breakout level).
However, for this to happen, bulls need to overcome the resistance zone of 1.080-1.078.
Note that at the Monday morning high, the EUR/USD price sharply reversed downwards (indicated by an arrow). This indicates the activity of supply forces, so traders should not rule out a scenario where the price retraces to the breakout level, into the zone of the bullish gap.
Trade over 50 forex markets 24 hours a day with FXOpen. Take advantage of low commissions, deep liquidity, and spreads from 0.0 pips. Open your FXOpen account now or learn more about trading forex with FXOpen.
CFDs are complex instruments and come with a high risk of losing your money.
This article represents the opinion of the Companies operating under the FXOpen brand only. It is not to be construed as an offer, solicitation, or recommendation with respect to products and services provided by the Companies operating under the FXOpen brand, nor is it to be considered financial advice.
Which scenario will be realised largely depends on today's publication (at 15:30 GMT+3) of the PCE index values. It is possible that signals of slowing inflation will be perceived as a sign of an imminent Fed rate cut. Consequently, this could weaken the strength of the USD.
👍2
#sp500 #MarketNews #stockmarket #stocktrading
S&P 500 Analysis: Concerning Market Behaviour
On Friday, data was released showing that inflation in the US slowed down in May. According to ForexFactory, the actual monthly Core PCE Price Index was 0.1%, which matched the forecasts (last month’s PCE was 0.3%).
Reuters reports that:
→ Prices for recreational goods, as well as for vehicles, furniture, and durable household appliances, dropped significantly.
→ This news reinforced expectations that the Federal Reserve might begin to cut interest rates later this year. According to the CME FedWatch tool, market prices now indicate a 63% probability of a Fed rate cut in September, compared to a 55% probability a month ago.
Monetary policy easing should be perceived as bullish news for the market, however… While the S&P 500 index (US SPX 500 mini on FXOpen) initially rose in the hours following the publication, it dropped to the week's lows by the end of trading. This bearish market behaviour amidst positive news of slowing inflation is concerning.
Today, the price of the S&P 500 (US SPX 500 mini on FXOpen) shows that bulls are trying to recover from Friday's decline. They might be aiming to resume the upward trend that has been in place in 2024.
How successful could this be?
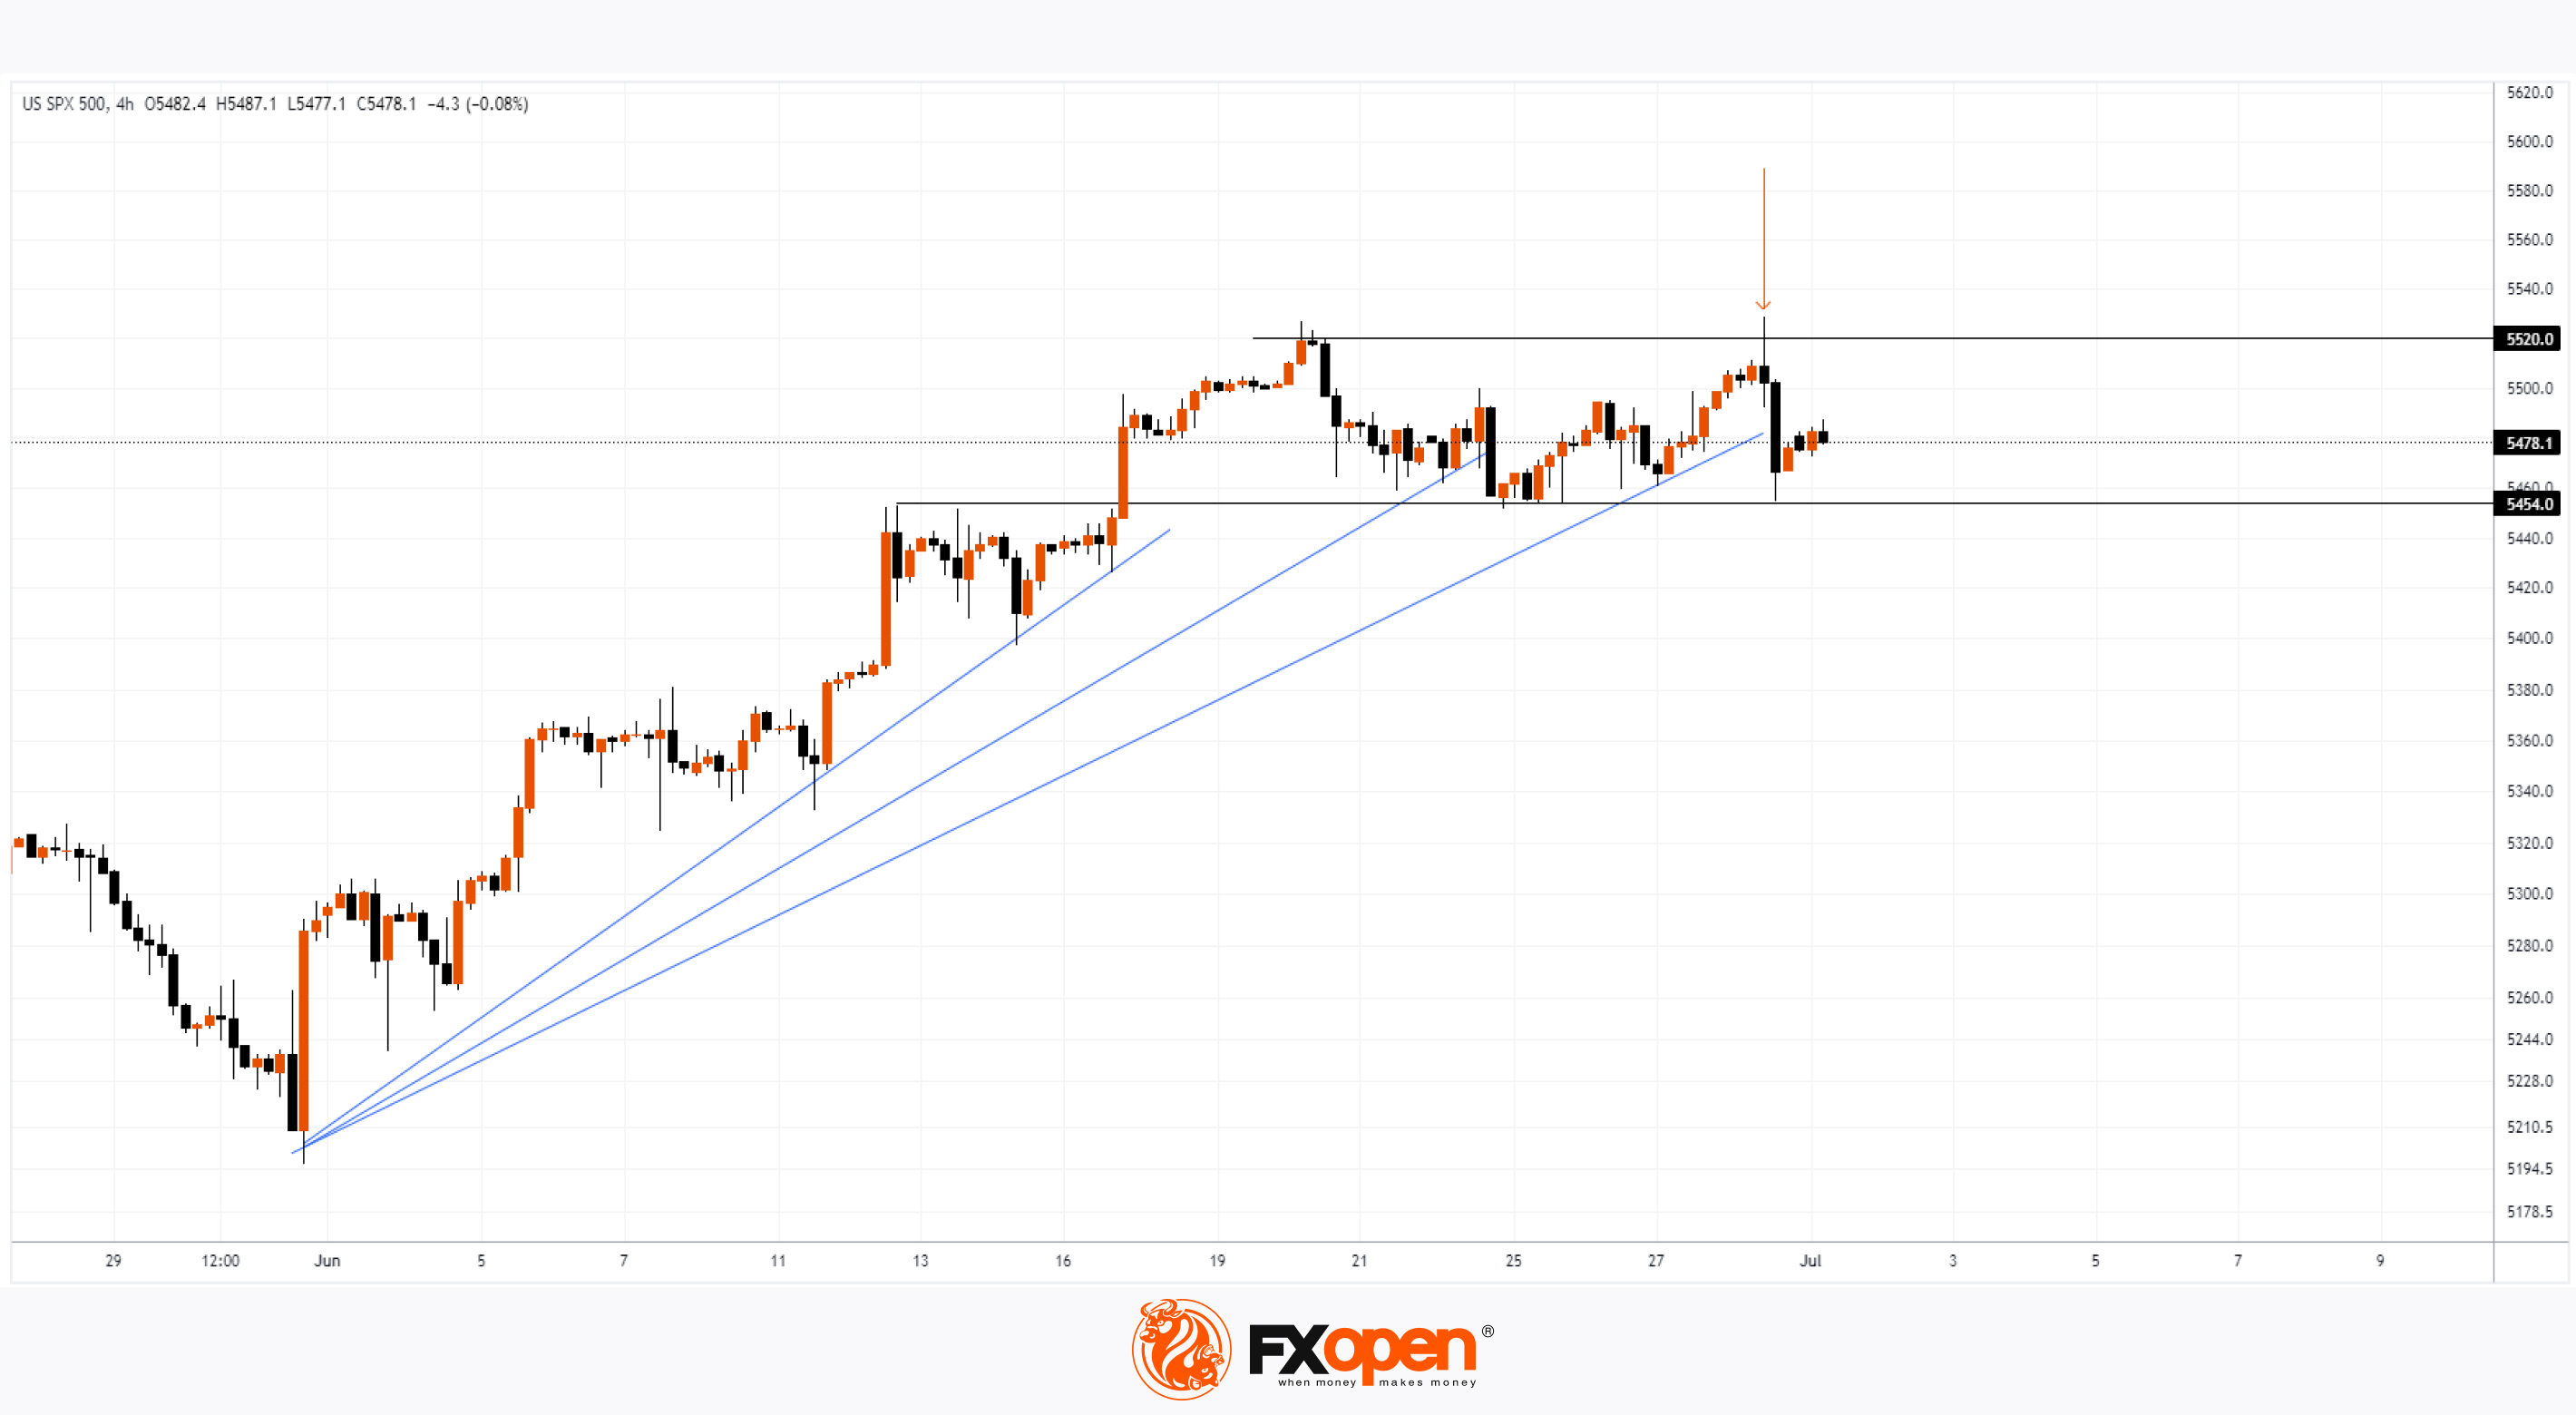
According to the technical analysis of the S&P 500 (US SPX 500 mini on FXOpen) chart:
→ The price action is forming a fan of supports (shown with blue lines) that are sequentially being broken from top to bottom. This is a sign of weakening demand.
→ On Friday, the price slightly surpassed the historical high (indicated with an arrow) but then sharply plummeted. Another bearish sign.
Currently, the price of the S&P 500 (US SPX 500 mini on FXOpen) is within the range of 5454-5520, which can be interpreted as bulls being exhausted while bears are not yet ready to push the price down. If the former do not find a fundamental incentive, it may lead to the latter taking the initiative.
Trade global index CFDs with zero commission and tight spreads. Open your FXOpen account now or learn more about trading index CFDs with FXOpen.
CFDs are complex instruments and come with a high risk of losing your money.
This article represents the opinion of the Companies operating under the FXOpen brand only. It is not to be construed as an offer, solicitation, or recommendation with respect to products and services provided by the Companies operating under the FXOpen brand, nor is it to be considered financial advice.
S&P 500 Analysis: Concerning Market Behaviour
On Friday, data was released showing that inflation in the US slowed down in May. According to ForexFactory, the actual monthly Core PCE Price Index was 0.1%, which matched the forecasts (last month’s PCE was 0.3%).
Reuters reports that:
→ Prices for recreational goods, as well as for vehicles, furniture, and durable household appliances, dropped significantly.
→ This news reinforced expectations that the Federal Reserve might begin to cut interest rates later this year. According to the CME FedWatch tool, market prices now indicate a 63% probability of a Fed rate cut in September, compared to a 55% probability a month ago.
Monetary policy easing should be perceived as bullish news for the market, however… While the S&P 500 index (US SPX 500 mini on FXOpen) initially rose in the hours following the publication, it dropped to the week's lows by the end of trading. This bearish market behaviour amidst positive news of slowing inflation is concerning.
Today, the price of the S&P 500 (US SPX 500 mini on FXOpen) shows that bulls are trying to recover from Friday's decline. They might be aiming to resume the upward trend that has been in place in 2024.
How successful could this be?
According to the technical analysis of the S&P 500 (US SPX 500 mini on FXOpen) chart:
→ The price action is forming a fan of supports (shown with blue lines) that are sequentially being broken from top to bottom. This is a sign of weakening demand.
→ On Friday, the price slightly surpassed the historical high (indicated with an arrow) but then sharply plummeted. Another bearish sign.
Currently, the price of the S&P 500 (US SPX 500 mini on FXOpen) is within the range of 5454-5520, which can be interpreted as bulls being exhausted while bears are not yet ready to push the price down. If the former do not find a fundamental incentive, it may lead to the latter taking the initiative.
Trade global index CFDs with zero commission and tight spreads. Open your FXOpen account now or learn more about trading index CFDs with FXOpen.
CFDs are complex instruments and come with a high risk of losing your money.
This article represents the opinion of the Companies operating under the FXOpen brand only. It is not to be construed as an offer, solicitation, or recommendation with respect to products and services provided by the Companies operating under the FXOpen brand, nor is it to be considered financial advice.
👍2
#XAGUSD #marketanalysis #MarketNews #silver
Silver Price Analysis: Awaiting Powell's Comments
Today, at 16:30 GMT+3, the Federal Reserve Chairman is scheduled to speak. Market participants are looking for more clarity on the Fed's plans regarding interest rate cuts following the release of inflation data last Friday.
According to Trading Economics, Fed officials have repeatedly called for caution before cutting rates, and Federal Reserve Board member Michelle Bowman stated that she is open to further rate hikes if progress in combating inflation stalls or reverses.
Powell's speech will significantly impact many financial markets, including the precious metals market, as lowering interest rates could increase the appeal of gold and silver as "safe haven" assets compared to bonds.
It is important to note that besides the Fed's monetary policy, the XAG/USD price is significantly influenced by news about the Chinese economy – the largest consumer of silver. The demand outlook remains uncertain, considering that official data for June indicated a second consecutive month of production decline.
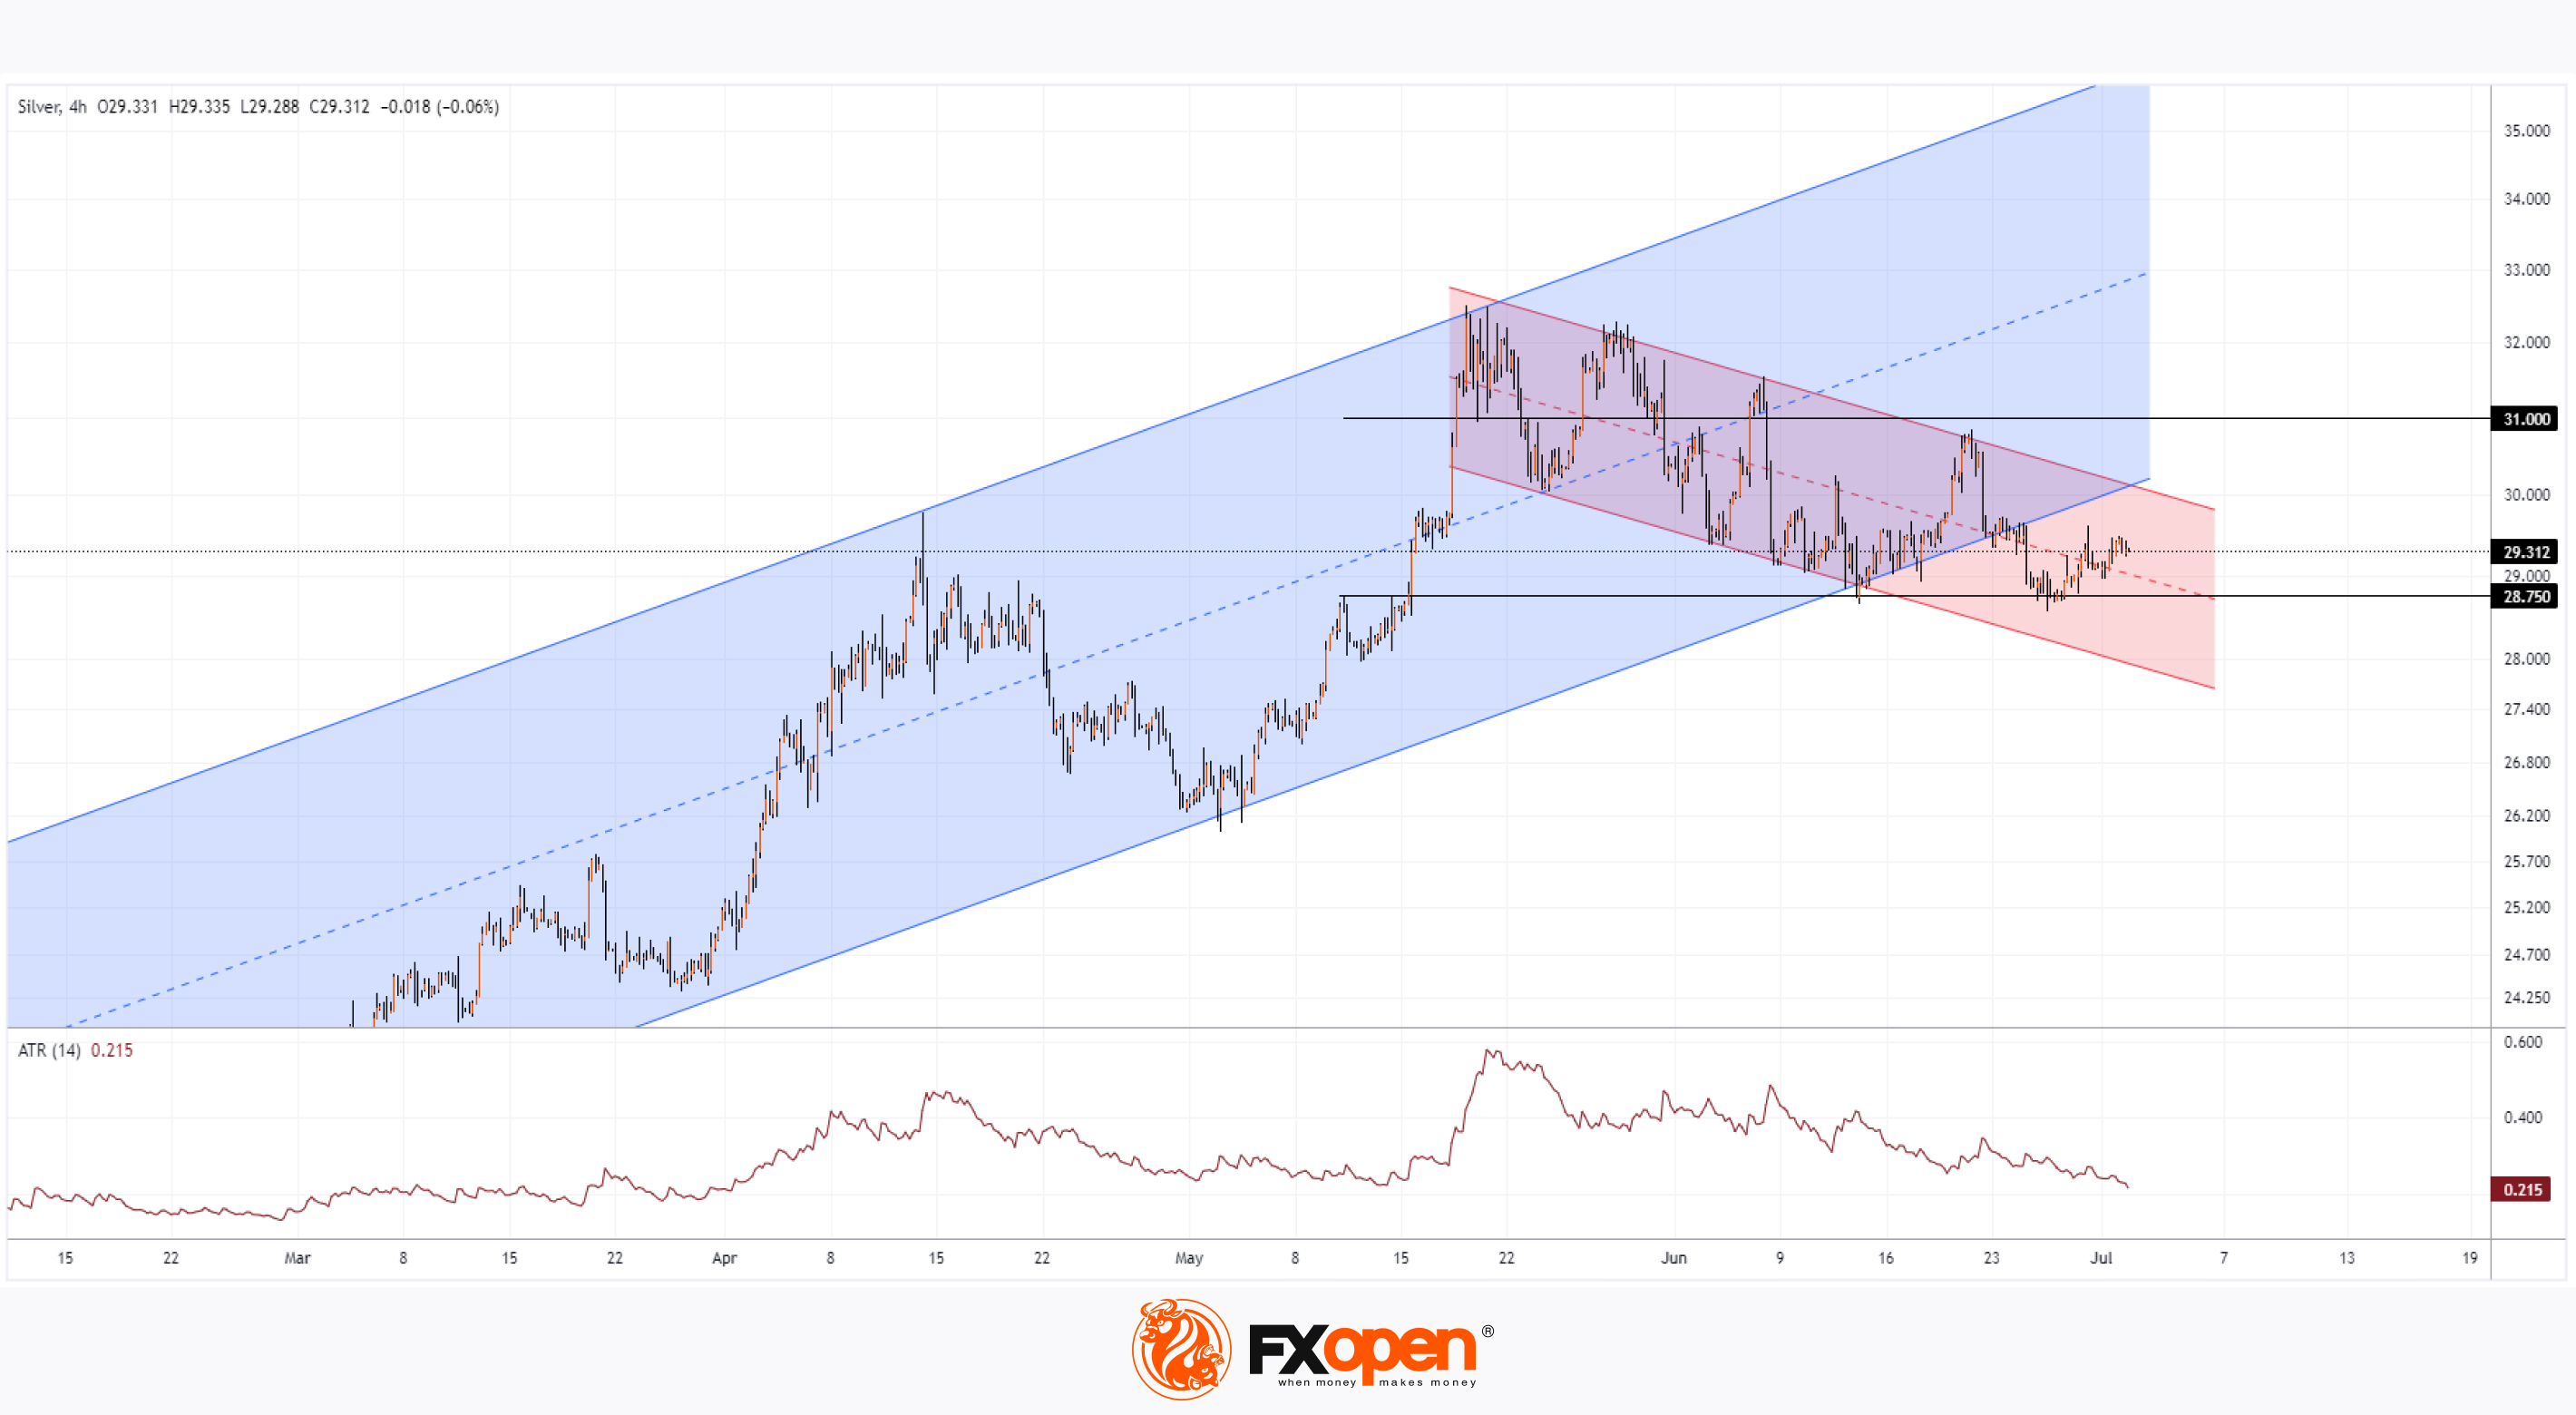
Technical analysis of the XAG/USD chart provides more useful information:
→ Silver prices were in an upward trend (indicated by a blue channel), peaking at a multi-year high reached in late May above the $31 per ounce level.
→ The ATR indicator pointed to increased activity during those days. It is likely that major players used the buoyant market, supported by optimistic news, to close long positions.
→ Regardless, silver prices have since started forming a downward trend (indicated by a red colour). The $31 level has shown signs of resistance, and the lower boundary of the blue channel has been broken.
→ The $28.75 level (former resistance) is now showing signs of support.
It is possible that the broad range of $28.75 - $31.00 will become a zone where the silver price finds equilibrium, resilient to various influencing factors, including today's speech by Powell. Be prepared for volatility spikes.
Start trading commodities with tight spreads. Open your trading account now or learn more about trading commodity CFDs with FXOpen.
CFDs are complex instruments and come with a high risk of losing your money.
This article represents the opinion of the Companies operating under the FXOpen brand only. It is not to be construed as an offer, solicitation, or recommendation with respect to products and services provided by the Companies operating under the FXOpen brand, nor is it to be considered financial advice.
Silver Price Analysis: Awaiting Powell's Comments
Today, at 16:30 GMT+3, the Federal Reserve Chairman is scheduled to speak. Market participants are looking for more clarity on the Fed's plans regarding interest rate cuts following the release of inflation data last Friday.
According to Trading Economics, Fed officials have repeatedly called for caution before cutting rates, and Federal Reserve Board member Michelle Bowman stated that she is open to further rate hikes if progress in combating inflation stalls or reverses.
Powell's speech will significantly impact many financial markets, including the precious metals market, as lowering interest rates could increase the appeal of gold and silver as "safe haven" assets compared to bonds.
It is important to note that besides the Fed's monetary policy, the XAG/USD price is significantly influenced by news about the Chinese economy – the largest consumer of silver. The demand outlook remains uncertain, considering that official data for June indicated a second consecutive month of production decline.
Technical analysis of the XAG/USD chart provides more useful information:
→ Silver prices were in an upward trend (indicated by a blue channel), peaking at a multi-year high reached in late May above the $31 per ounce level.
→ The ATR indicator pointed to increased activity during those days. It is likely that major players used the buoyant market, supported by optimistic news, to close long positions.
→ Regardless, silver prices have since started forming a downward trend (indicated by a red colour). The $31 level has shown signs of resistance, and the lower boundary of the blue channel has been broken.
→ The $28.75 level (former resistance) is now showing signs of support.
It is possible that the broad range of $28.75 - $31.00 will become a zone where the silver price finds equilibrium, resilient to various influencing factors, including today's speech by Powell. Be prepared for volatility spikes.
Start trading commodities with tight spreads. Open your trading account now or learn more about trading commodity CFDs with FXOpen.
CFDs are complex instruments and come with a high risk of losing your money.
This article represents the opinion of the Companies operating under the FXOpen brand only. It is not to be construed as an offer, solicitation, or recommendation with respect to products and services provided by the Companies operating under the FXOpen brand, nor is it to be considered financial advice.
👍2
#tsla #stockmarket #MarketNews #marketanalysis
TSLA Stock Price Hits Over 5-Month High
As today's TSLA chart shows, the stock price rose by approximately 6% during yesterday's trading, surpassing the $209 per share level. This marks the highest point since 24 January this year.
The price increase was driven by optimism related to the release of second-quarter car sales data. It is expected that Tesla might report a decline in sales, but not as significant as it could have been.
Analysts surveyed by Bloomberg estimate that the automaker will report sales of around 440,000 electric vehicles in the second quarter, which is 5.8% less than a year ago.
Factors contributing to the decline in sales include:
→ The suspected arson at the Tesla factory in Berlin;
→ Changes in the supply chain due to attacks in the Red Sea;
→ A reduction of approximately 10% in the company's workforce, announced by Musk in April.
However, the main factor could be competition and Tesla's aging model lineup. Can the TSLA price maintain its current high?
Technical analysis of today's TSLA chart shows that:
→ The price is still within the descending channel (marked in red), but has already broken upwards through its median (indicated by an arrow) – a sign of demand;
→ On 5 April, we mentioned that the TSLA price could rise to the psychological level of $150 per share. At that time, the market was oversold, with the price below the lower boundary of the descending channel. Since then, the price has formed an upward trajectory (shown in blue);
→ The price is above the psychological level of $200 per share.
Regardless of the report's outcome, for bulls, an important achievement will be the ability to stay in the upper half of the ascending channel and above the psychological level of $200 per share. This would boost their confidence ahead of Tesla's upcoming second-quarter corporate report, scheduled for 17 July.
Trade global index CFDs with zero commission and tight spreads. Open your FXOpen account now or learn more about trading index CFDs with FXOpen.
CFDs are complex instruments and come with a high risk of losing your money.
This article represents the opinion of the Companies operating under the FXOpen brand only. It is not to be construed as an offer, solicitation, or recommendation with respect to products and services provided by the Companies operating under the FXOpen brand, nor is it to be considered financial advice.
TSLA Stock Price Hits Over 5-Month High
As today's TSLA chart shows, the stock price rose by approximately 6% during yesterday's trading, surpassing the $209 per share level. This marks the highest point since 24 January this year.
The price increase was driven by optimism related to the release of second-quarter car sales data. It is expected that Tesla might report a decline in sales, but not as significant as it could have been.
Analysts surveyed by Bloomberg estimate that the automaker will report sales of around 440,000 electric vehicles in the second quarter, which is 5.8% less than a year ago.
Factors contributing to the decline in sales include:
→ The suspected arson at the Tesla factory in Berlin;
→ Changes in the supply chain due to attacks in the Red Sea;
→ A reduction of approximately 10% in the company's workforce, announced by Musk in April.
However, the main factor could be competition and Tesla's aging model lineup. Can the TSLA price maintain its current high?
Technical analysis of today's TSLA chart shows that:
→ The price is still within the descending channel (marked in red), but has already broken upwards through its median (indicated by an arrow) – a sign of demand;
→ On 5 April, we mentioned that the TSLA price could rise to the psychological level of $150 per share. At that time, the market was oversold, with the price below the lower boundary of the descending channel. Since then, the price has formed an upward trajectory (shown in blue);
→ The price is above the psychological level of $200 per share.
Regardless of the report's outcome, for bulls, an important achievement will be the ability to stay in the upper half of the ascending channel and above the psychological level of $200 per share. This would boost their confidence ahead of Tesla's upcoming second-quarter corporate report, scheduled for 17 July.
Trade global index CFDs with zero commission and tight spreads. Open your FXOpen account now or learn more about trading index CFDs with FXOpen.
CFDs are complex instruments and come with a high risk of losing your money.
This article represents the opinion of the Companies operating under the FXOpen brand only. It is not to be construed as an offer, solicitation, or recommendation with respect to products and services provided by the Companies operating under the FXOpen brand, nor is it to be considered financial advice.

👍3
#sp500 #stockmarket #stocktrading #marketanalysis
S&P 500: Mid-Year Prospects Analysis
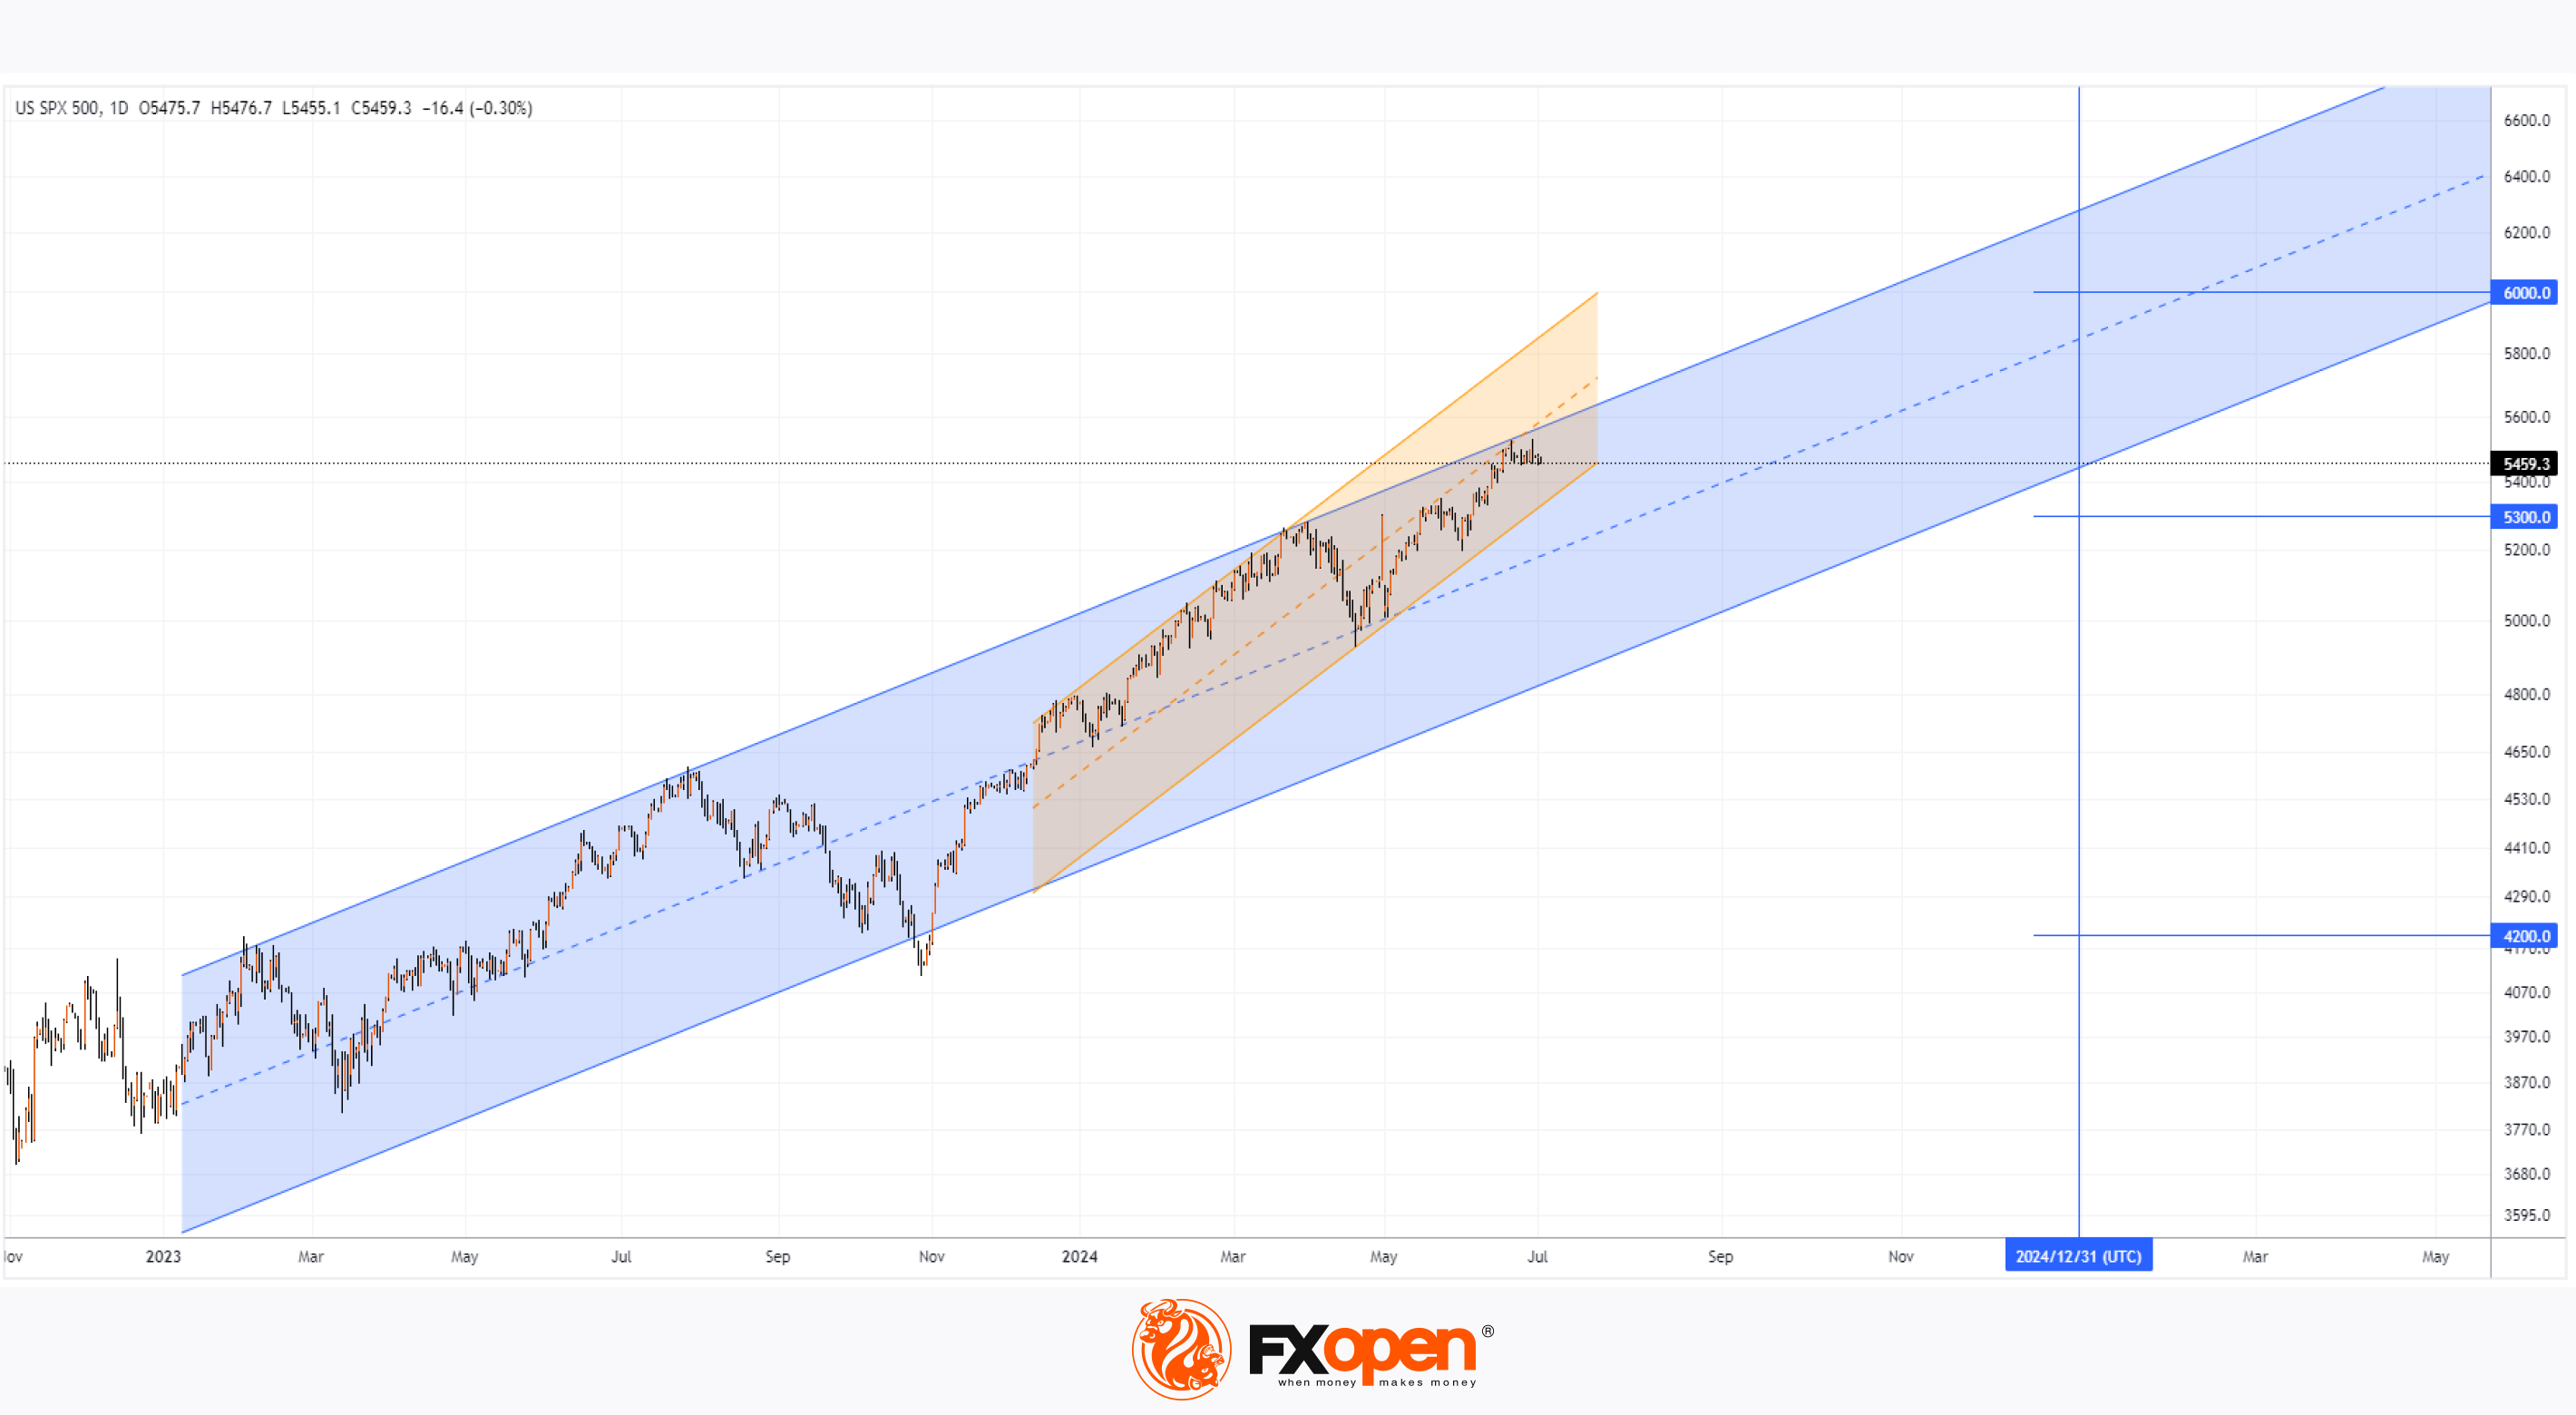
As shown by the daily chart of the S&P 500 (US SPX 500 mini on FXOpen):
→ Since the beginning of 2023, the price has been moving in an upward blue channel. To date, the increase has been over 42%;
→ Since the start of 2024, the price has formed a steeper upward channel (shown in orange). In the first half of the year, the growth has exceeded 14%.
How realistic is it for bullish sentiment to persist? And what might the index quotations be by the end of 2024?
Yahoo Finance reports a decidedly bearish outlook for the S&P 500 (US SPX 500 mini on FXOpen) at the end of 2024, held by Marko Kolanovic, the chief strategist at JPMorgan Chase & Co. He cites the following factors:
→ Economic slowdown;
→ Downward revision of company profits;
→ The Federal Reserve may cut interest rates less than the market expects, which would put additional pressure on the economy and stock prices in the second half of the year.
Kolanovic predicts the S&P 500 (US SPX 500 mini on FXOpen) will be at 4200 points by the end of 2024. In the context of the attached chart, this implies not only a bearish breakout of the lower boundary of the blue upward channel but also a decline to the year's minimum.
On the other hand, strategists and analysts from other reputable financial institutions tracked by Yahoo Finance hold a more optimistic view:
→ Evercore ISI analysts predict the S&P 500 (US SPX 500 mini on FXOpen) will reach 6000 points by the end of 2024. This means the price will remain within the blue channel.
→ The average estimate from analysts points to a target of 5300.
Based on these estimates, the lower boundary of the upward orange channel, which has been in place since the start of the year, will likely be broken, potentially leading to a significant correction.
In addition to traditional fundamental factors (such as inflation, the Federal Reserve's interest rate, the labour market, and company profits), the S&P 500 (US SPX 500 mini on FXOpen) price in the second half of the year could be influenced by:
→ The presidential election in November;
→ The unusually high weight of the top 10 leading technology companies (including Nvidia, Microsoft, and Google) in the index.
Trade global index CFDs with zero commission and tight spreads. Open your FXOpen account now or learn more about trading index CFDs with FXOpen.
CFDs are complex instruments and come with a high risk of losing your money.
This article represents the opinion of the Companies operating under the FXOpen brand only. It is not to be construed as an offer, solicitation, or recommendation with respect to products and services provided by the Companies operating under the FXOpen brand, nor is it to be considered financial advice.
S&P 500: Mid-Year Prospects Analysis
As shown by the daily chart of the S&P 500 (US SPX 500 mini on FXOpen):
→ Since the beginning of 2023, the price has been moving in an upward blue channel. To date, the increase has been over 42%;
→ Since the start of 2024, the price has formed a steeper upward channel (shown in orange). In the first half of the year, the growth has exceeded 14%.
How realistic is it for bullish sentiment to persist? And what might the index quotations be by the end of 2024?
Yahoo Finance reports a decidedly bearish outlook for the S&P 500 (US SPX 500 mini on FXOpen) at the end of 2024, held by Marko Kolanovic, the chief strategist at JPMorgan Chase & Co. He cites the following factors:
→ Economic slowdown;
→ Downward revision of company profits;
→ The Federal Reserve may cut interest rates less than the market expects, which would put additional pressure on the economy and stock prices in the second half of the year.
Kolanovic predicts the S&P 500 (US SPX 500 mini on FXOpen) will be at 4200 points by the end of 2024. In the context of the attached chart, this implies not only a bearish breakout of the lower boundary of the blue upward channel but also a decline to the year's minimum.
On the other hand, strategists and analysts from other reputable financial institutions tracked by Yahoo Finance hold a more optimistic view:
→ Evercore ISI analysts predict the S&P 500 (US SPX 500 mini on FXOpen) will reach 6000 points by the end of 2024. This means the price will remain within the blue channel.
→ The average estimate from analysts points to a target of 5300.
Based on these estimates, the lower boundary of the upward orange channel, which has been in place since the start of the year, will likely be broken, potentially leading to a significant correction.
In addition to traditional fundamental factors (such as inflation, the Federal Reserve's interest rate, the labour market, and company profits), the S&P 500 (US SPX 500 mini on FXOpen) price in the second half of the year could be influenced by:
→ The presidential election in November;
→ The unusually high weight of the top 10 leading technology companies (including Nvidia, Microsoft, and Google) in the index.
Trade global index CFDs with zero commission and tight spreads. Open your FXOpen account now or learn more about trading index CFDs with FXOpen.
CFDs are complex instruments and come with a high risk of losing your money.
This article represents the opinion of the Companies operating under the FXOpen brand only. It is not to be construed as an offer, solicitation, or recommendation with respect to products and services provided by the Companies operating under the FXOpen brand, nor is it to be considered financial advice.
👍2
#XAUUSD #xau #goldprice #marketanalysis
Gold Price Prospects for H2
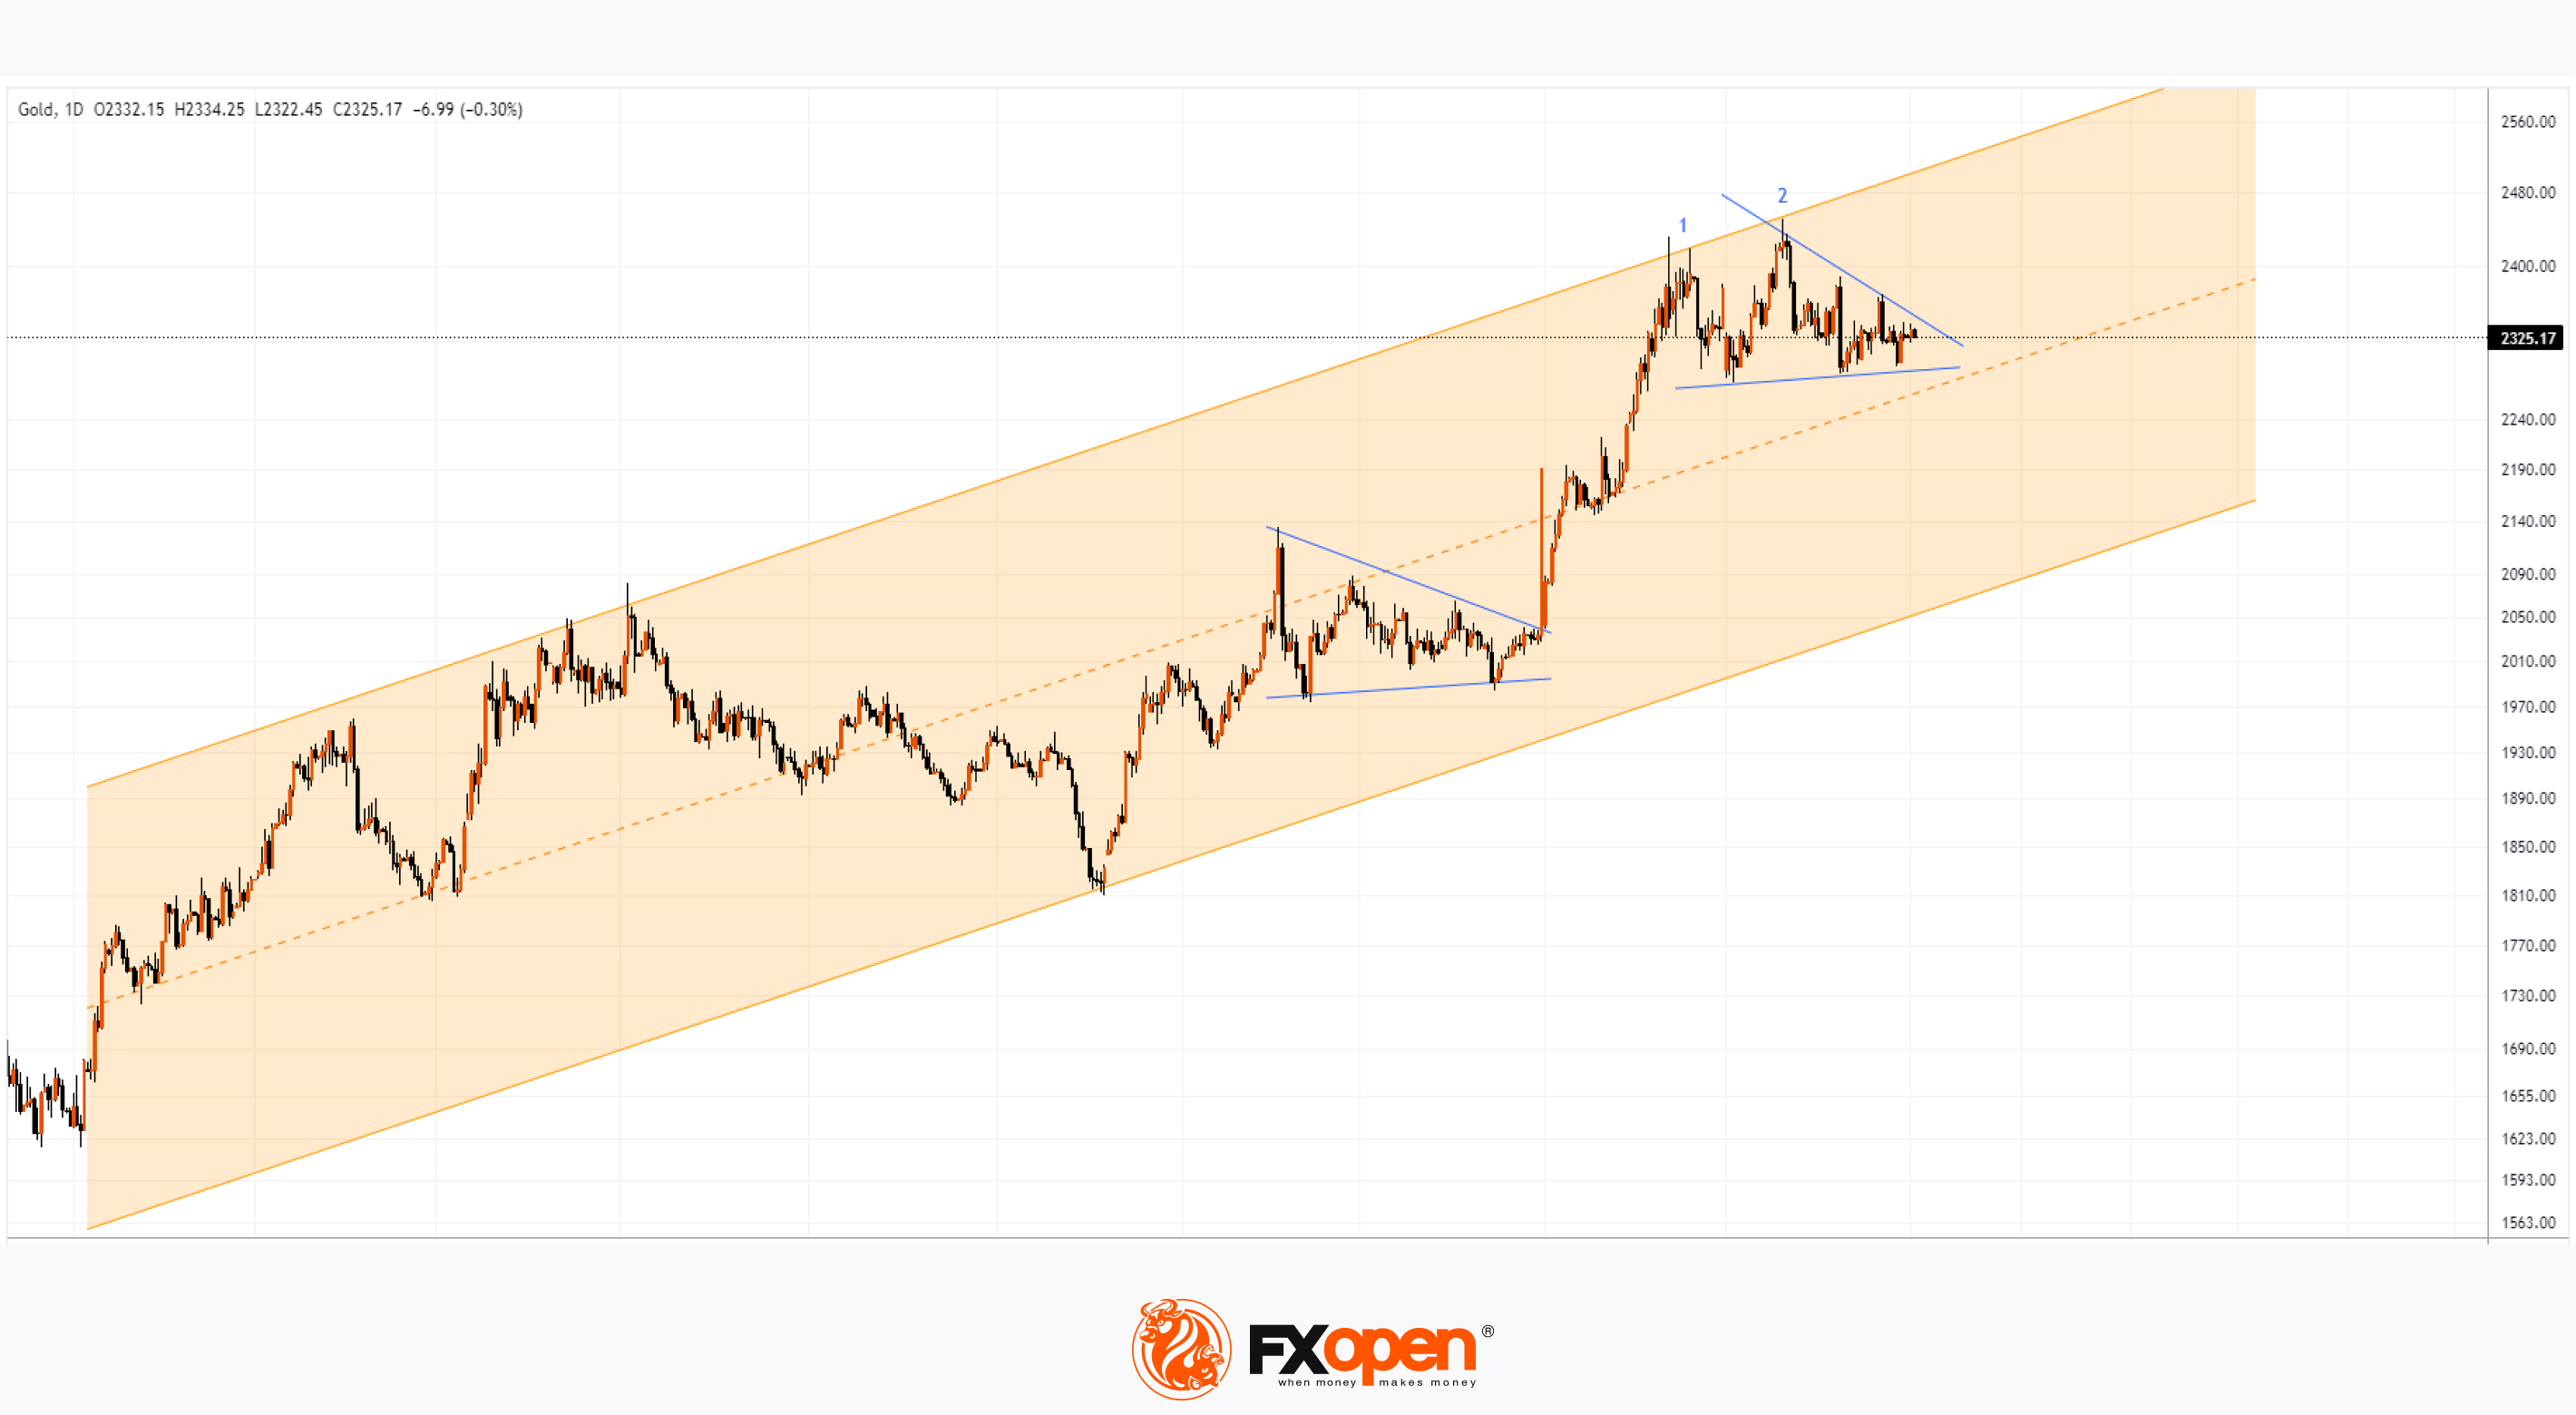
As shown by the daily XAU/USD chart:
→ Since November 2022, the price has been moving in an upward channel, marked in orange;
→ Since the start of 2024, the price has risen by approximately 12.5%.
What are the gold price forecasts for the end of 2024?
According to Investing.com, Georgette Boele, a senior sustainability economist at ABN Amro, published a cautious forecast on 27 June, predicting a gold price of $2000 per ounce by the end of the year. In her view:
→ Gold prices peaked at the beginning of the year but have since lost momentum.
→ Anticipated easing measures by central banks have not provided the expected support to gold prices.
→ Concerns about physical gold shortages, which were a factor during the COVID crisis, are unfounded in the current market.
On the other hand, longer-term forecasts are optimistic. Analysts at Bank of America believe the gold price could rise to $3000 within 12-18 months. Their arguments include:
→ Lowering Federal Reserve rates could trigger an inflow of funds into ETFs backed by physical gold;
→ The desire to reduce USD holdings in portfolios is likely to lead to increased gold purchases by central banks.
Technical analysis of the XAU/USD chart shows that:
→ After the price reached the upper boundary of the channel twice in the first half of the year (indicated by numbers), the bulls lost momentum;
→ This resulted in a consolidation pattern resembling a triangle (shown by blue lines), within which the gold price fluctuated throughout June.
Note that a similar consolidation was observed at the beginning of 2024, and a bullish breakout led to a sharp rally.
It is possible that a breakout of the current pattern could lead to a trend that significantly influences which gold price forecast—BofA’s bullish or ABN Amro’s bearish—proves more accurate.
Start trading commodities with tight spreads. Open your trading account now or learn more about trading commodity CFDs with FXOpen.
CFDs are complex instruments and come with a high risk of losing your money.
This article represents the opinion of the Companies operating under the FXOpen brand only. It is not to be construed as an offer, solicitation, or recommendation with respect to products and services provided by the Companies operating under the FXOpen brand, nor is it to be considered financial advice.
Gold Price Prospects for H2
As shown by the daily XAU/USD chart:
→ Since November 2022, the price has been moving in an upward channel, marked in orange;
→ Since the start of 2024, the price has risen by approximately 12.5%.
What are the gold price forecasts for the end of 2024?
According to Investing.com, Georgette Boele, a senior sustainability economist at ABN Amro, published a cautious forecast on 27 June, predicting a gold price of $2000 per ounce by the end of the year. In her view:
→ Gold prices peaked at the beginning of the year but have since lost momentum.
→ Anticipated easing measures by central banks have not provided the expected support to gold prices.
→ Concerns about physical gold shortages, which were a factor during the COVID crisis, are unfounded in the current market.
On the other hand, longer-term forecasts are optimistic. Analysts at Bank of America believe the gold price could rise to $3000 within 12-18 months. Their arguments include:
→ Lowering Federal Reserve rates could trigger an inflow of funds into ETFs backed by physical gold;
→ The desire to reduce USD holdings in portfolios is likely to lead to increased gold purchases by central banks.
Technical analysis of the XAU/USD chart shows that:
→ After the price reached the upper boundary of the channel twice in the first half of the year (indicated by numbers), the bulls lost momentum;
→ This resulted in a consolidation pattern resembling a triangle (shown by blue lines), within which the gold price fluctuated throughout June.
Note that a similar consolidation was observed at the beginning of 2024, and a bullish breakout led to a sharp rally.
It is possible that a breakout of the current pattern could lead to a trend that significantly influences which gold price forecast—BofA’s bullish or ABN Amro’s bearish—proves more accurate.
Start trading commodities with tight spreads. Open your trading account now or learn more about trading commodity CFDs with FXOpen.
CFDs are complex instruments and come with a high risk of losing your money.
This article represents the opinion of the Companies operating under the FXOpen brand only. It is not to be construed as an offer, solicitation, or recommendation with respect to products and services provided by the Companies operating under the FXOpen brand, nor is it to be considered financial advice.
👍2
#usdcad #marketanalysis #forextrading
USD/CAD Breaks Key Support
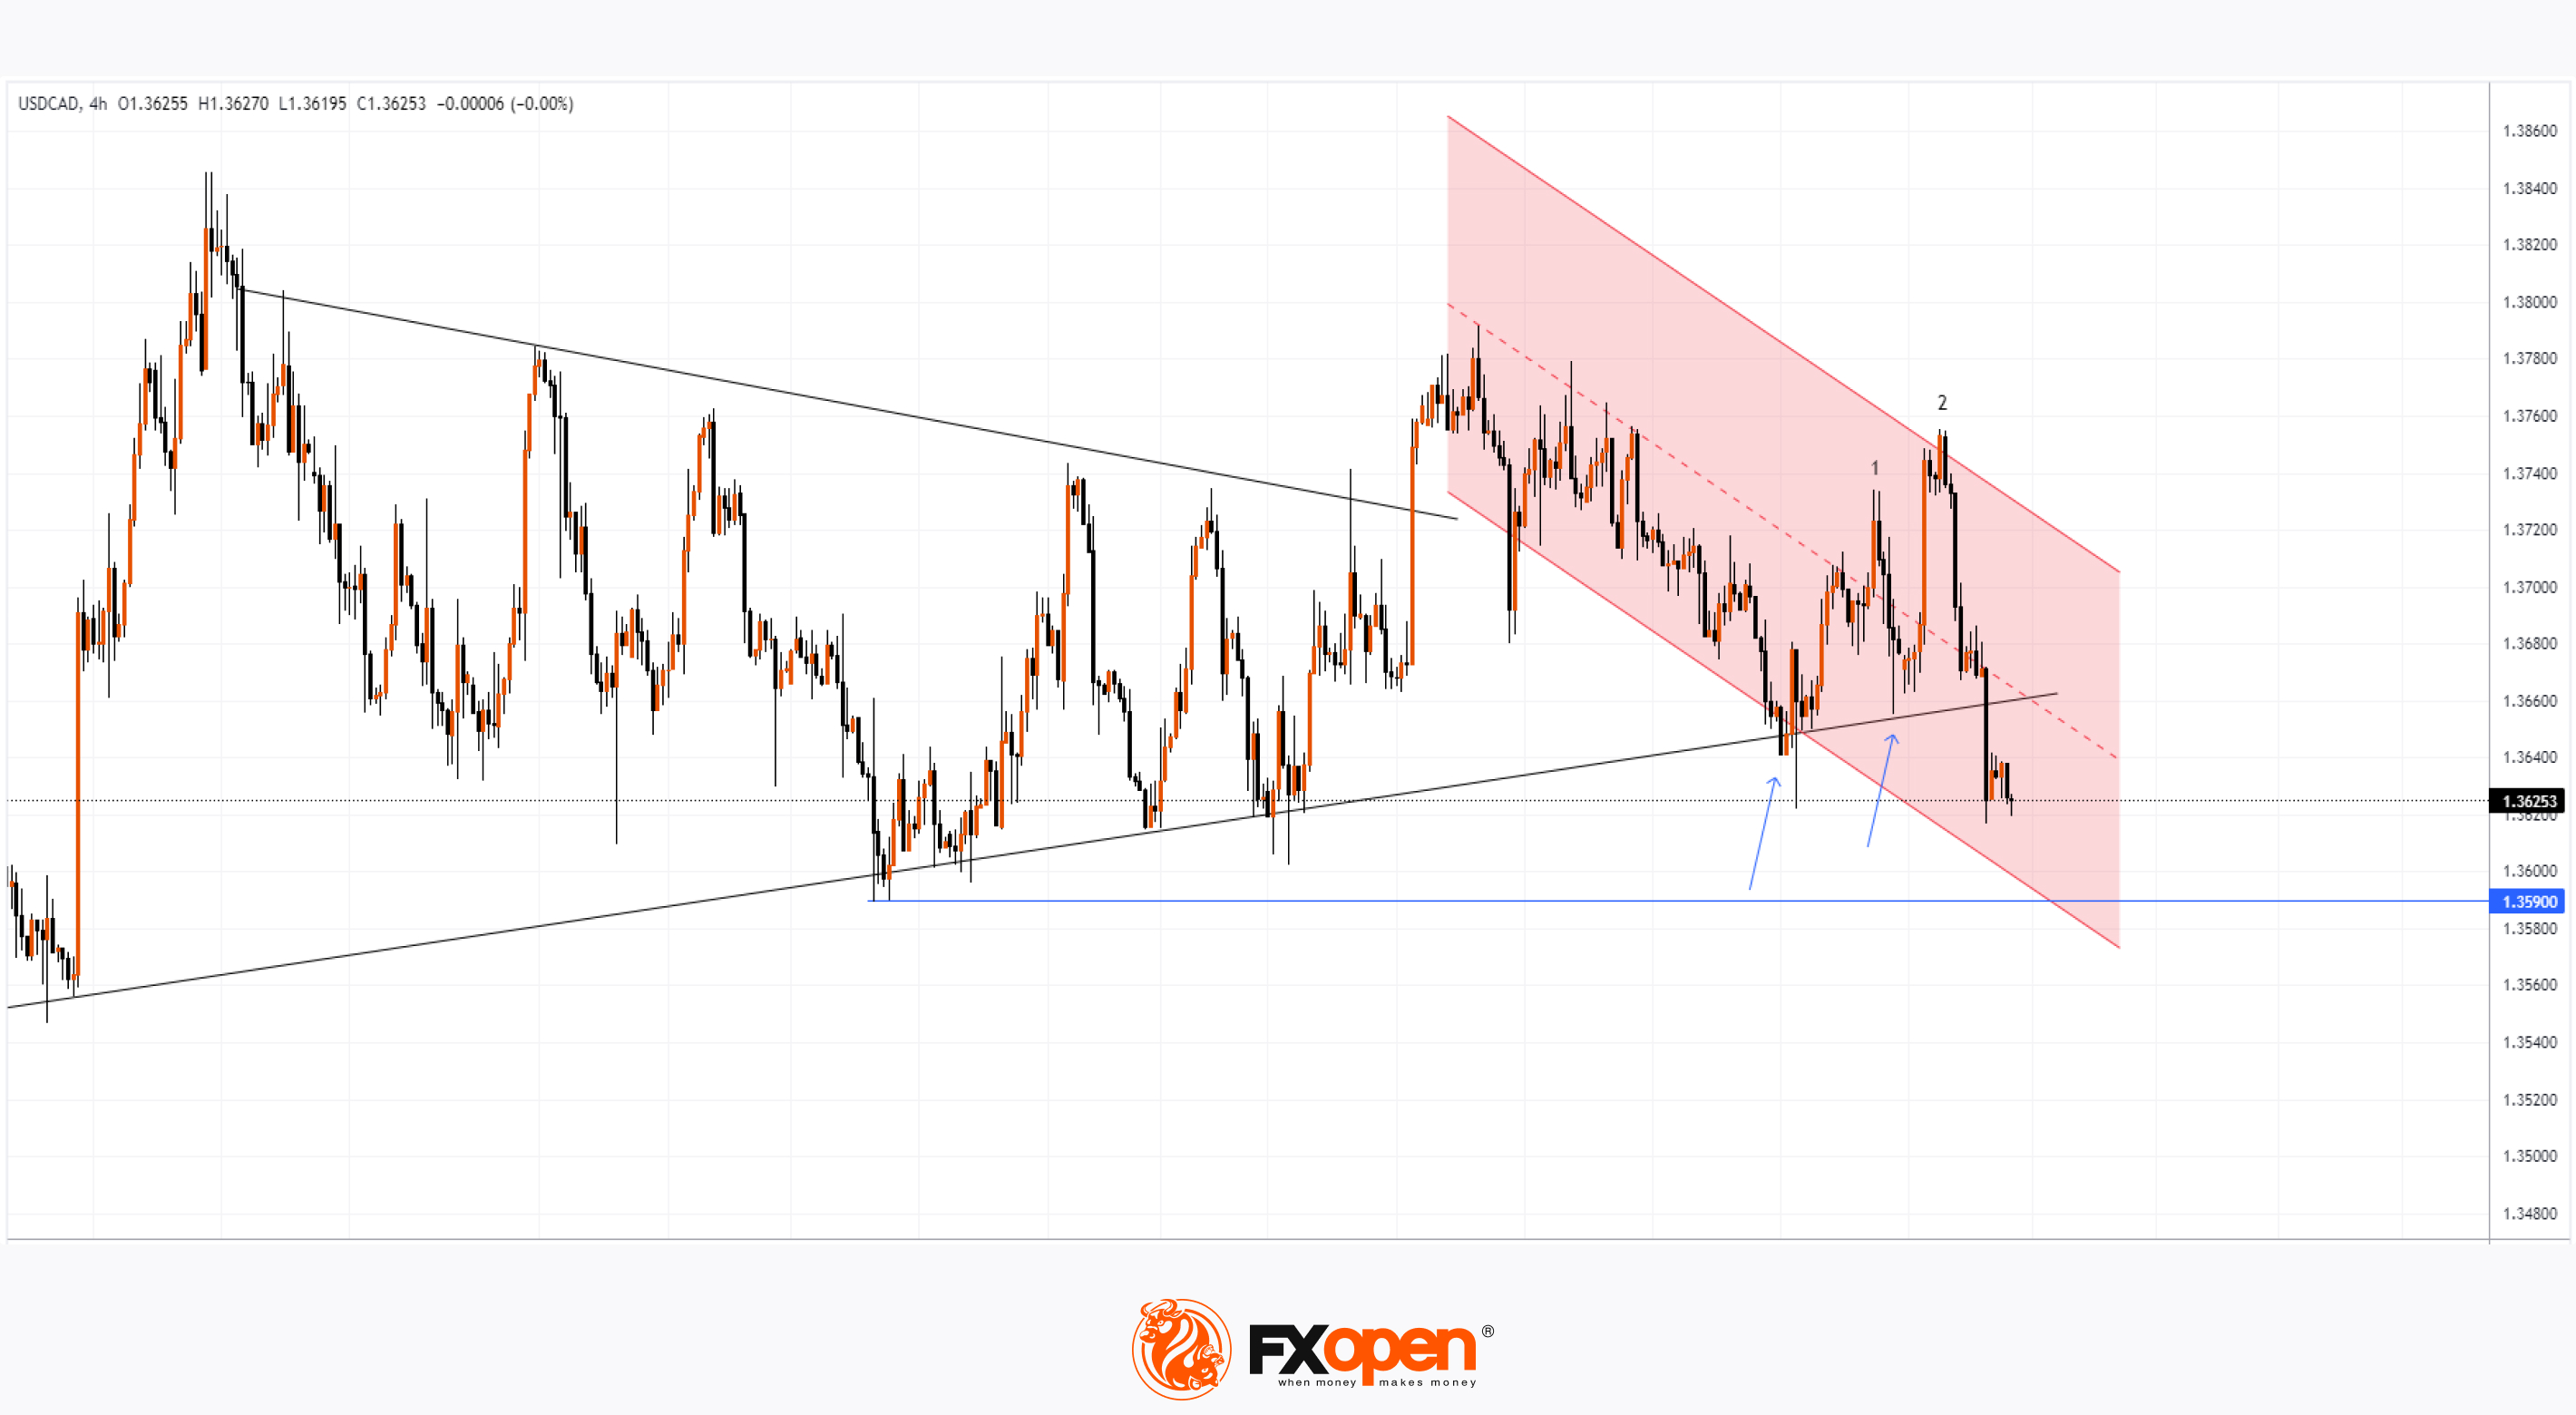
On 25 June, we noted that the USD/CAD price had approached a crucial support level—the lower boundary of a converging triangle, which indicated a relative balance of supply and demand in the market during May.
Since then, the price has bounced twice from this level (as indicated by the arrow).
Today, as the USD/CAD chart shows, the exchange rate is breaking through this key support, indicating a disruption in balance.
This has been influenced by the weakness of the USD. According to Reuters, the US dollar has declined relative to other currencies due to weaker-than-expected US economic data released on Wednesday. These included a weak ISM Services PMI report and the ADP Non-Farm Employment Change report, which might suggest an economic slowdown.
How might the Canadian dollar's exchange rate change relative to the US dollar?
According to today's technical analysis of the USD/CAD chart:
→ the price is moving within a descending trend channel (shown in red). The median line of the channel may serve as a resistance level;
→ the fact that bulls attempted to push the price upwards, breaking the peak at Point 1, but failed—a bearish signal;
→ the sharp rise to Peak 2 was followed by an even sharper fall—a sign of bearish engulfing.
Therefore, the dominance of supply forces could lead to a continuation of the downward movement. It is not out of the question for the USD/CAD exchange rate to decline to the lower boundary of the red channel, with an attempt to break the May low around 1.359.
However, sharp movements are unlikely today due to the celebration of Independence Day in the USA.
Trade over 50 forex markets 24 hours a day with FXOpen. Take advantage of low commissions, deep liquidity, and spreads from 0.0 pips. Open your FXOpen account now or learn more about trading forex with FXOpen.
CFDs are complex instruments and come with a high risk of losing your money.
This article represents the opinion of the Companies operating under the FXOpen brand only. It is not to be construed as an offer, solicitation, or recommendation with respect to products and services provided by the Companies operating under the FXOpen brand, nor is it to be considered financial advice.
USD/CAD Breaks Key Support
On 25 June, we noted that the USD/CAD price had approached a crucial support level—the lower boundary of a converging triangle, which indicated a relative balance of supply and demand in the market during May.
Since then, the price has bounced twice from this level (as indicated by the arrow).
Today, as the USD/CAD chart shows, the exchange rate is breaking through this key support, indicating a disruption in balance.
This has been influenced by the weakness of the USD. According to Reuters, the US dollar has declined relative to other currencies due to weaker-than-expected US economic data released on Wednesday. These included a weak ISM Services PMI report and the ADP Non-Farm Employment Change report, which might suggest an economic slowdown.
How might the Canadian dollar's exchange rate change relative to the US dollar?
According to today's technical analysis of the USD/CAD chart:
→ the price is moving within a descending trend channel (shown in red). The median line of the channel may serve as a resistance level;
→ the fact that bulls attempted to push the price upwards, breaking the peak at Point 1, but failed—a bearish signal;
→ the sharp rise to Peak 2 was followed by an even sharper fall—a sign of bearish engulfing.
Therefore, the dominance of supply forces could lead to a continuation of the downward movement. It is not out of the question for the USD/CAD exchange rate to decline to the lower boundary of the red channel, with an attempt to break the May low around 1.359.
However, sharp movements are unlikely today due to the celebration of Independence Day in the USA.
Trade over 50 forex markets 24 hours a day with FXOpen. Take advantage of low commissions, deep liquidity, and spreads from 0.0 pips. Open your FXOpen account now or learn more about trading forex with FXOpen.
CFDs are complex instruments and come with a high risk of losing your money.
This article represents the opinion of the Companies operating under the FXOpen brand only. It is not to be construed as an offer, solicitation, or recommendation with respect to products and services provided by the Companies operating under the FXOpen brand, nor is it to be considered financial advice.
👍2
#FTSE #stockmarket #stocktrading
FTSE 100 Index Behaves Bullishly Amid Elections
On Friday, the FTSE 100 index rose by 0.4% to 8273 points, continuing its 0.9% rise on Thursday. According to Trading Economics, the centre-left Labour Party, as expected, won the parliamentary elections and secured a majority, ousting the Conservative Party after 14 years in power.
The Labour Party emphasised the importance of economic stability in its decisions and committed to strict budgetary spending rules.
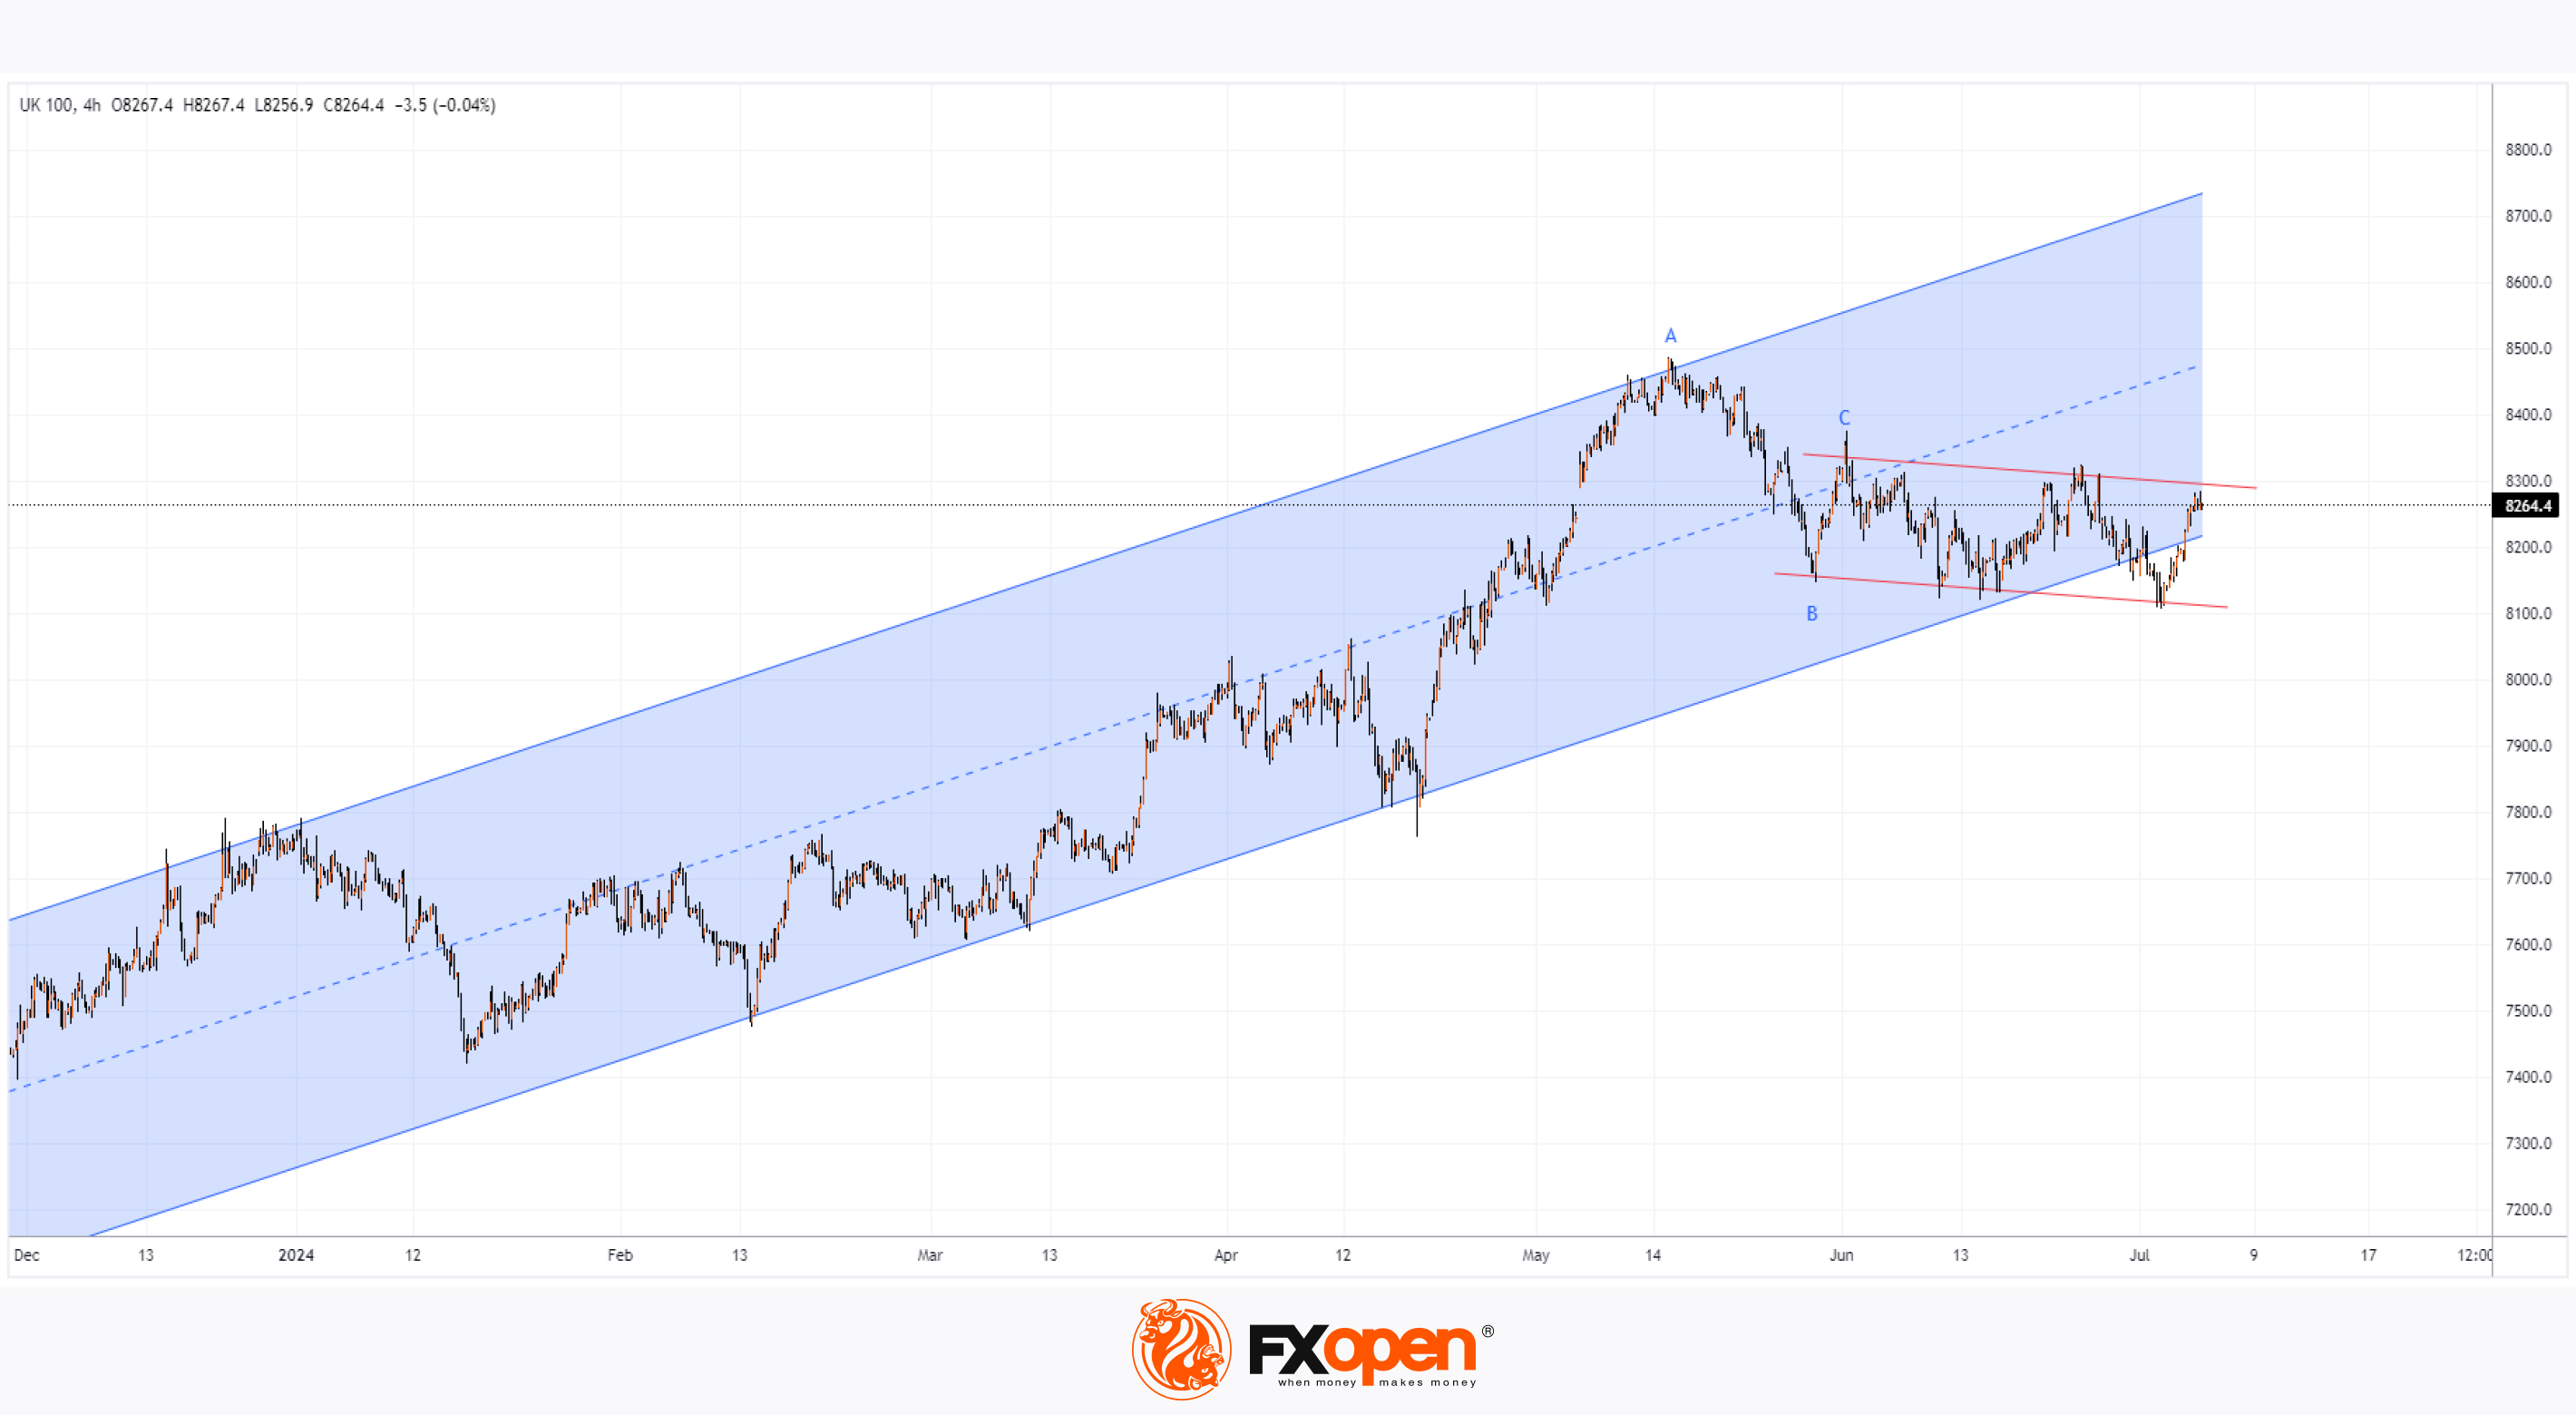
Prime Minister Sunak conceded defeat, and the UK stock market positively received the official election results. As shown by the chart, the FTSE 100 index (UK 100 on FXOpen) has risen by approximately 1.9% from the July 2nd low.
However, the situation remains unfavourable for the bulls.
According to the technical analysis of the FTSE 100 (UK 100 on FXOpen) chart:
→ the market has formed an upward trend (shown in blue), but its relevance remains in question;
→ the B→C rise constitutes 50% of the A→B downward impulse – a bearish sign;
→ in June, the price formed a range zone (shown with red lines), within which it currently resides.
In a favourable scenario, the bulls may break the upper boundary of the red range to return within the long-term channel.
Otherwise, the long-term blue channel will lose its relevance, and the Labour Party may experience a period of decline in the FTSE 100 index (UK 100 on FXOpen) early in their term.
Trade global index CFDs with zero commission and tight spreads. Open your FXOpen account now or learn more about trading index CFDs with FXOpen.
CFDs are complex instruments and come with a high risk of losing your money.
This article represents the opinion of the Companies operating under the FXOpen brand only. It is not to be construed as an offer, solicitation, or recommendation with respect to products and services provided by the Companies operating under the FXOpen brand, nor is it to be considered financial advice.
FTSE 100 Index Behaves Bullishly Amid Elections
On Friday, the FTSE 100 index rose by 0.4% to 8273 points, continuing its 0.9% rise on Thursday. According to Trading Economics, the centre-left Labour Party, as expected, won the parliamentary elections and secured a majority, ousting the Conservative Party after 14 years in power.
The Labour Party emphasised the importance of economic stability in its decisions and committed to strict budgetary spending rules.
Prime Minister Sunak conceded defeat, and the UK stock market positively received the official election results. As shown by the chart, the FTSE 100 index (UK 100 on FXOpen) has risen by approximately 1.9% from the July 2nd low.
However, the situation remains unfavourable for the bulls.
According to the technical analysis of the FTSE 100 (UK 100 on FXOpen) chart:
→ the market has formed an upward trend (shown in blue), but its relevance remains in question;
→ the B→C rise constitutes 50% of the A→B downward impulse – a bearish sign;
→ in June, the price formed a range zone (shown with red lines), within which it currently resides.
In a favourable scenario, the bulls may break the upper boundary of the red range to return within the long-term channel.
Otherwise, the long-term blue channel will lose its relevance, and the Labour Party may experience a period of decline in the FTSE 100 index (UK 100 on FXOpen) early in their term.
Trade global index CFDs with zero commission and tight spreads. Open your FXOpen account now or learn more about trading index CFDs with FXOpen.
CFDs are complex instruments and come with a high risk of losing your money.
This article represents the opinion of the Companies operating under the FXOpen brand only. It is not to be construed as an offer, solicitation, or recommendation with respect to products and services provided by the Companies operating under the FXOpen brand, nor is it to be considered financial advice.
👍2
#GOOGL #stockmarket #marketanalysis #stocktrading
GOOG Stock Sets Historic Record
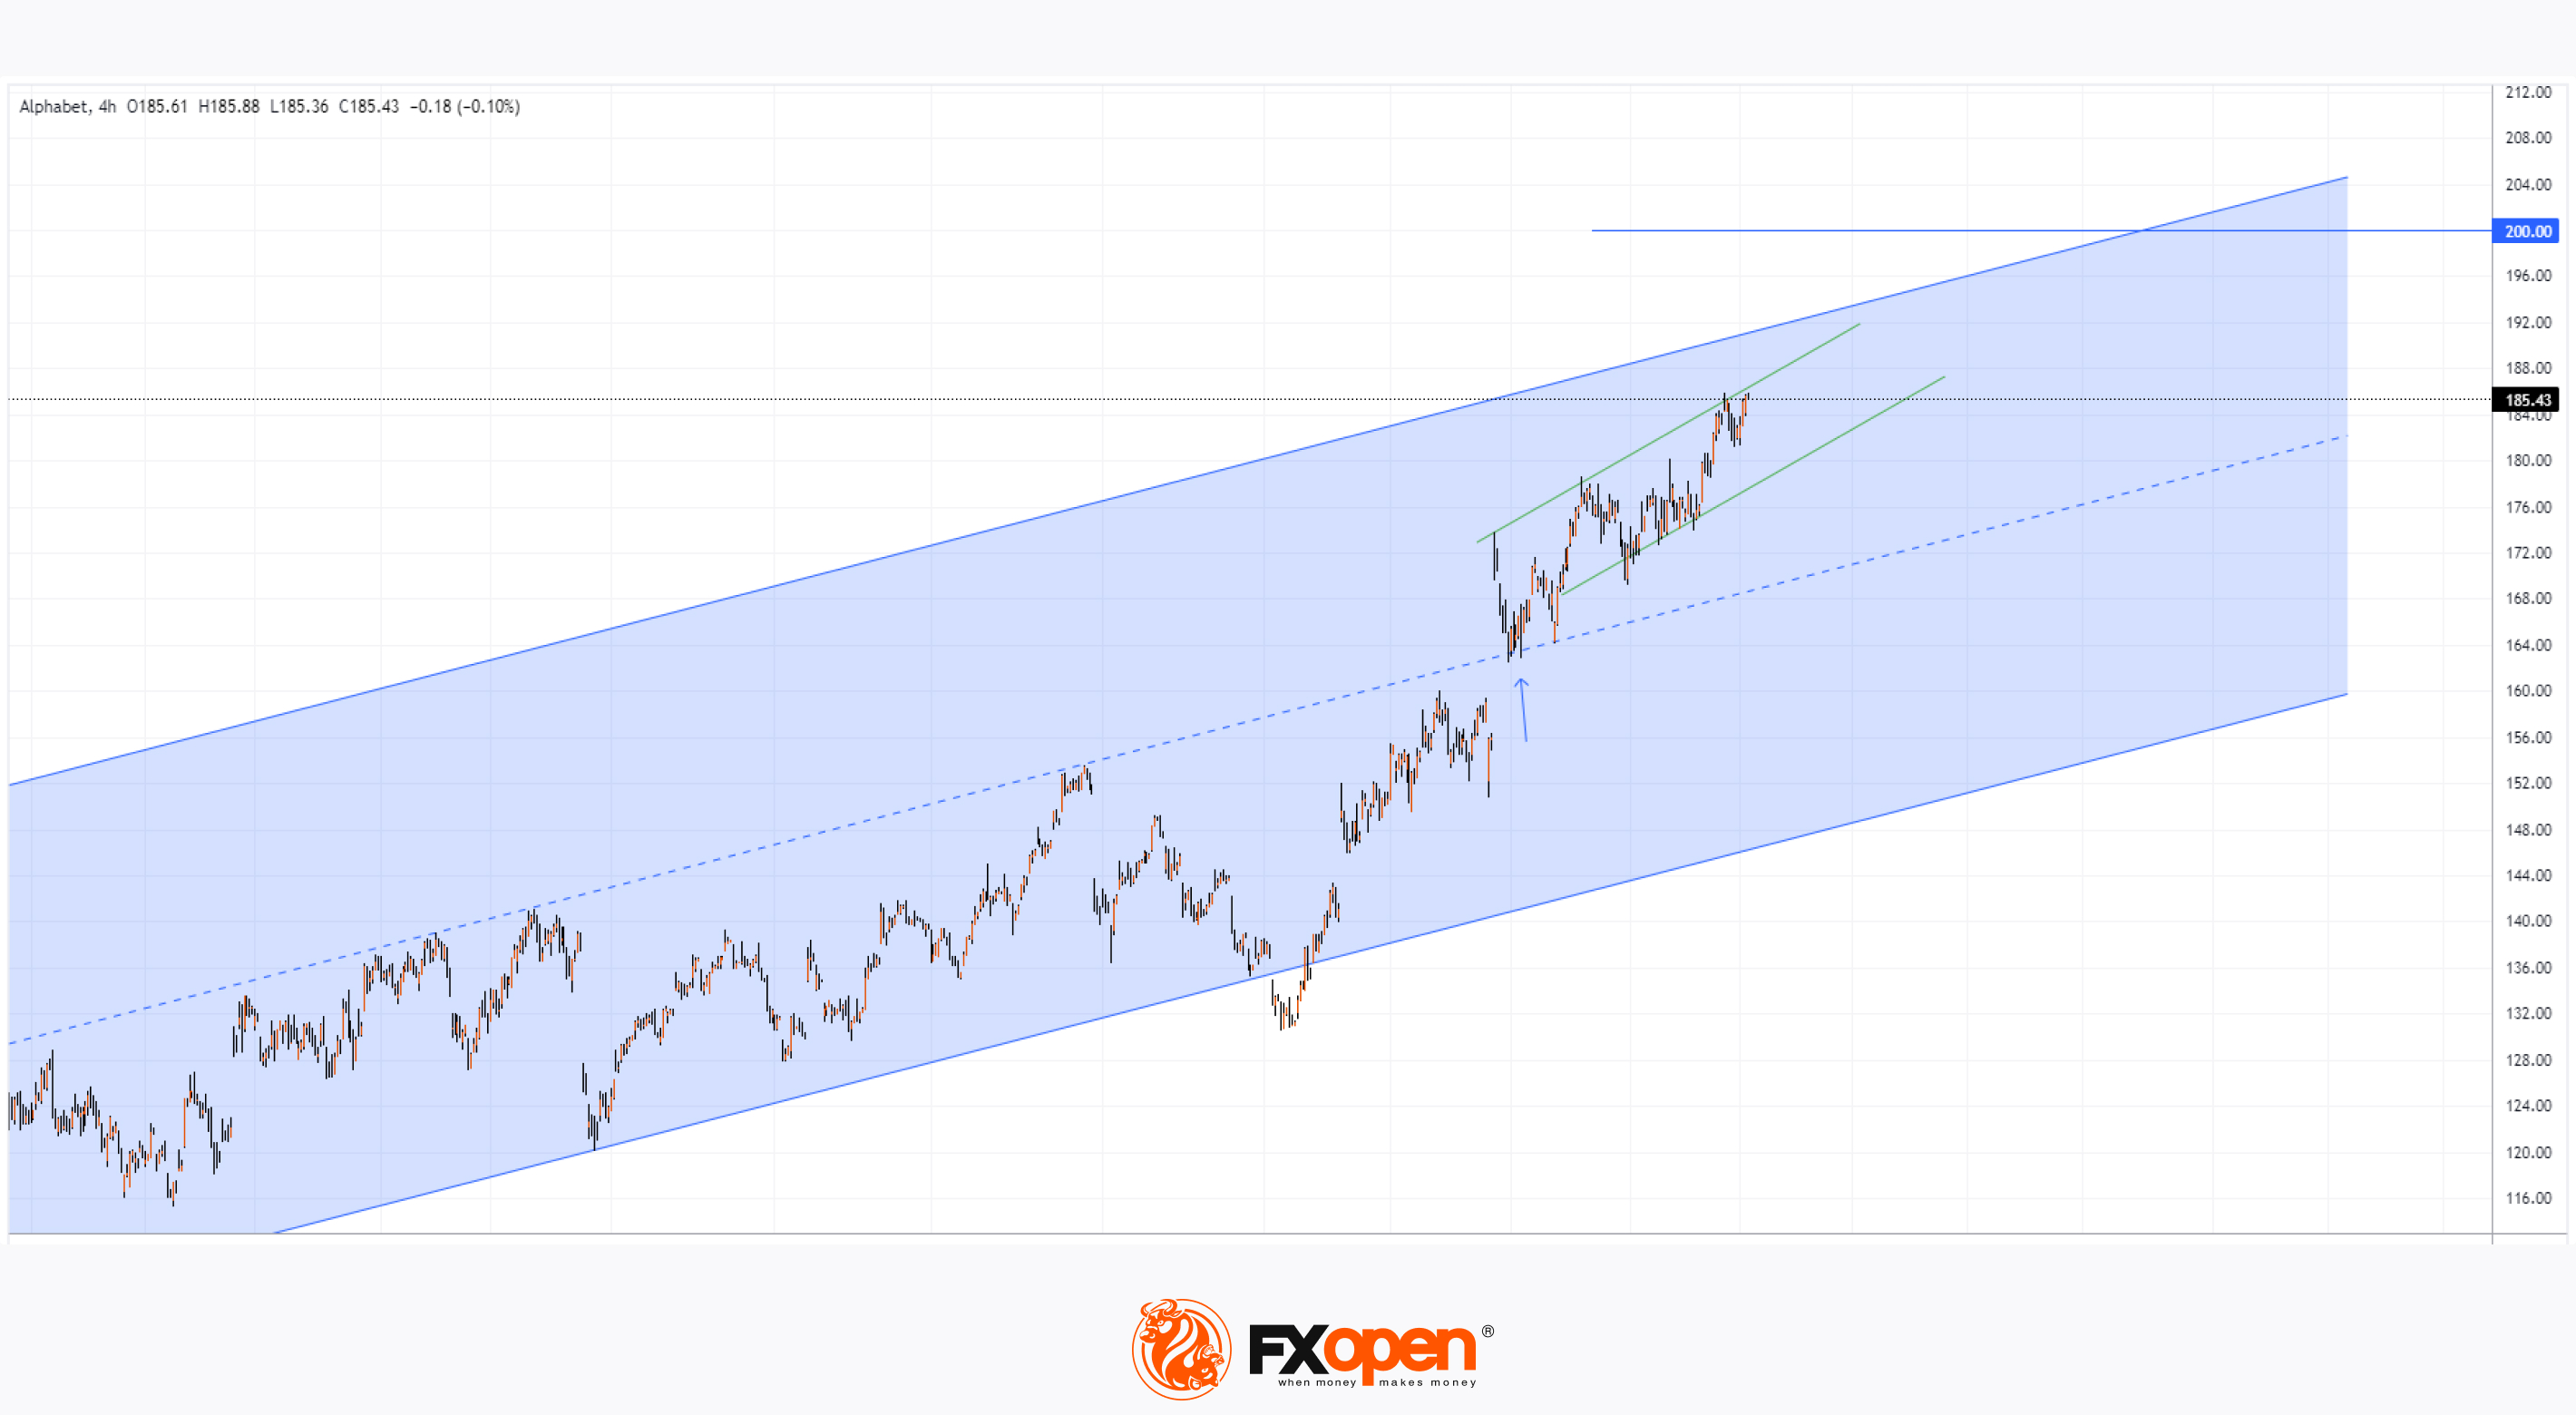
As the chart shows, the GOOG stock price yesterday surpassed the June 27th high and set a historic record at $185.88.
What contributed to this?
→ Overall bullish sentiment in the US stock market. Incidentally, the S&P 500 index (US SPX 500 mini on FXOpen) also set a historic record yesterday;
→ Positive market expectations ahead of the second-quarter earnings report from Alphabet (Google's parent company);
→ Benzinga reports positive prospects, particularly highlighting the development of YouTube and language models.
Out of 38 analysts surveyed by TipRanks, 32 recommend buying Google stock. The average price forecast is $199 in 12 months.
But why then is Alphabet CEO Sundar Pichai selling over $4 million worth of company shares? According to the Form 4 filed with the SEC, Sundar sold a total of 22,500 shares.
Today's technical analysis of the GOOG chart shows that:
→ The price is moving in an uptrend (shown in blue), which began in 2023.
→ The price, with a bullish gap, "burst" into the upper half of the channel, then tested the median (indicated by an arrow) and entered a steeper uptrend, shown by the green lines.
If the bullish trend continues, the price may find resistance at the upper boundary of the blue channel on its way to the psychological level of $200.
Current sentiments could be influenced by the second-quarter earnings report (scheduled for release on June 23rd). If the report is disappointing, the GOOG price may fall to the median – which could provide another clue as to why the company's head sold shares.
Trade global index CFDs with zero commission and tight spreads. Open your FXOpen account now or learn more about trading index CFDs with FXOpen.
CFDs are complex instruments and come with a high risk of losing your money.
This article represents the opinion of the Companies operating under the FXOpen brand only. It is not to be construed as an offer, solicitation, or recommendation with respect to products and services provided by the Companies operating under the FXOpen brand, nor is it to be considered financial advice.
GOOG Stock Sets Historic Record
As the chart shows, the GOOG stock price yesterday surpassed the June 27th high and set a historic record at $185.88.
What contributed to this?
→ Overall bullish sentiment in the US stock market. Incidentally, the S&P 500 index (US SPX 500 mini on FXOpen) also set a historic record yesterday;
→ Positive market expectations ahead of the second-quarter earnings report from Alphabet (Google's parent company);
→ Benzinga reports positive prospects, particularly highlighting the development of YouTube and language models.
Out of 38 analysts surveyed by TipRanks, 32 recommend buying Google stock. The average price forecast is $199 in 12 months.
But why then is Alphabet CEO Sundar Pichai selling over $4 million worth of company shares? According to the Form 4 filed with the SEC, Sundar sold a total of 22,500 shares.
Today's technical analysis of the GOOG chart shows that:
→ The price is moving in an uptrend (shown in blue), which began in 2023.
→ The price, with a bullish gap, "burst" into the upper half of the channel, then tested the median (indicated by an arrow) and entered a steeper uptrend, shown by the green lines.
If the bullish trend continues, the price may find resistance at the upper boundary of the blue channel on its way to the psychological level of $200.
Current sentiments could be influenced by the second-quarter earnings report (scheduled for release on June 23rd). If the report is disappointing, the GOOG price may fall to the median – which could provide another clue as to why the company's head sold shares.
Trade global index CFDs with zero commission and tight spreads. Open your FXOpen account now or learn more about trading index CFDs with FXOpen.
CFDs are complex instruments and come with a high risk of losing your money.
This article represents the opinion of the Companies operating under the FXOpen brand only. It is not to be construed as an offer, solicitation, or recommendation with respect to products and services provided by the Companies operating under the FXOpen brand, nor is it to be considered financial advice.
👍2
#SP500 #USDCAD #investment #XAUUSD #goldprices #stockmarket #TSLA
Weekly Market Wrap With Gary Thomson: S&P 500, USD/CAD, Gold Price, TSLA Stock
Get the latest scoop on the week's hottest headlines, all in one convenient video. Join Gary Thomson, the COO of FXOpen UK, as he breaks down the most significant news reports and shares his expert insights.
🔸S&P 500: Mid-Year Prospects Analysis
🔸USD/CAD Breaks Key Support
🔸Gold Price Prospects for H2
🔸TSLA Stock Price Hits over 5-Month High
Stay in the know and empower yourself with our short, yet power-packed video. Watch it now and stay updated with FXOpen. Don't miss out on this invaluable opportunity to sharpen your trading skills and make informed decisions.
https://cutt.ly/0efTYA4g
#SP500 #USDCAD #investment #XAUUSD #goldprices #stockmarket #TSLA
To take advantage of price fluctuations in the foreign exchange markets, consider enlisting the services of a reliable broker like FXOpen.
⚠️
This forecast represents FXOpen Companies opinion only, it should not be construed as an offer, invitation or recommendation in respect to FXOpen Companies products and services or as financial advice.
Weekly Market Wrap With Gary Thomson: S&P 500, USD/CAD, Gold Price, TSLA Stock
Get the latest scoop on the week's hottest headlines, all in one convenient video. Join Gary Thomson, the COO of FXOpen UK, as he breaks down the most significant news reports and shares his expert insights.
🔸S&P 500: Mid-Year Prospects Analysis
🔸USD/CAD Breaks Key Support
🔸Gold Price Prospects for H2
🔸TSLA Stock Price Hits over 5-Month High
Stay in the know and empower yourself with our short, yet power-packed video. Watch it now and stay updated with FXOpen. Don't miss out on this invaluable opportunity to sharpen your trading skills and make informed decisions.
https://cutt.ly/0efTYA4g
#SP500 #USDCAD #investment #XAUUSD #goldprices #stockmarket #TSLA
To take advantage of price fluctuations in the foreign exchange markets, consider enlisting the services of a reliable broker like FXOpen.
⚠️
This forecast represents FXOpen Companies opinion only, it should not be construed as an offer, invitation or recommendation in respect to FXOpen Companies products and services or as financial advice.
YouTube
Weekly Market Wrap With Gary Thomson: S&P 500, USD/CAD, Gold Price, TSLA Stock
Get the latest scoop on the week's hottest headlines, all in one convenient video. Join Gary Thomson, the COO of FXOpen UK, as he breaks down the most significant news reports and shares his expert insights.
00:43 S&P 500: Mid-Year Prospects Analysis
03:09…
00:43 S&P 500: Mid-Year Prospects Analysis
03:09…
👍2
#EURGBP #marketanalysis #MarketNews #forextrading
The EUR/GBP rate fluctuates under the influence of political factors
On 10th June, we wrote that the EUR/GBP rate fell to a 21-month low after the European Parliament elections. Political fundamental factors continue to influence this pair.
As Reuters reports:
→ The euro is down on Monday amid unexpectedly strong results for the left-wing forces in the French elections, which has created new uncertainty regarding the country’s financial outlook.
→ The pound sterling has risen to a 3.5-week high against the US dollar, as the British currency strengthens following the Labour Party’s decisive victory in last week’s elections, ending 14 years of Conservative rule.
Therefore, it is not surprising that a bearish gap formed on the EUR/GBP chart at the start of the week – however, bulls managed to recoup the decline during the Asian session. How will events unfold from here?
According to the technical analysis of EUR/GBP today:
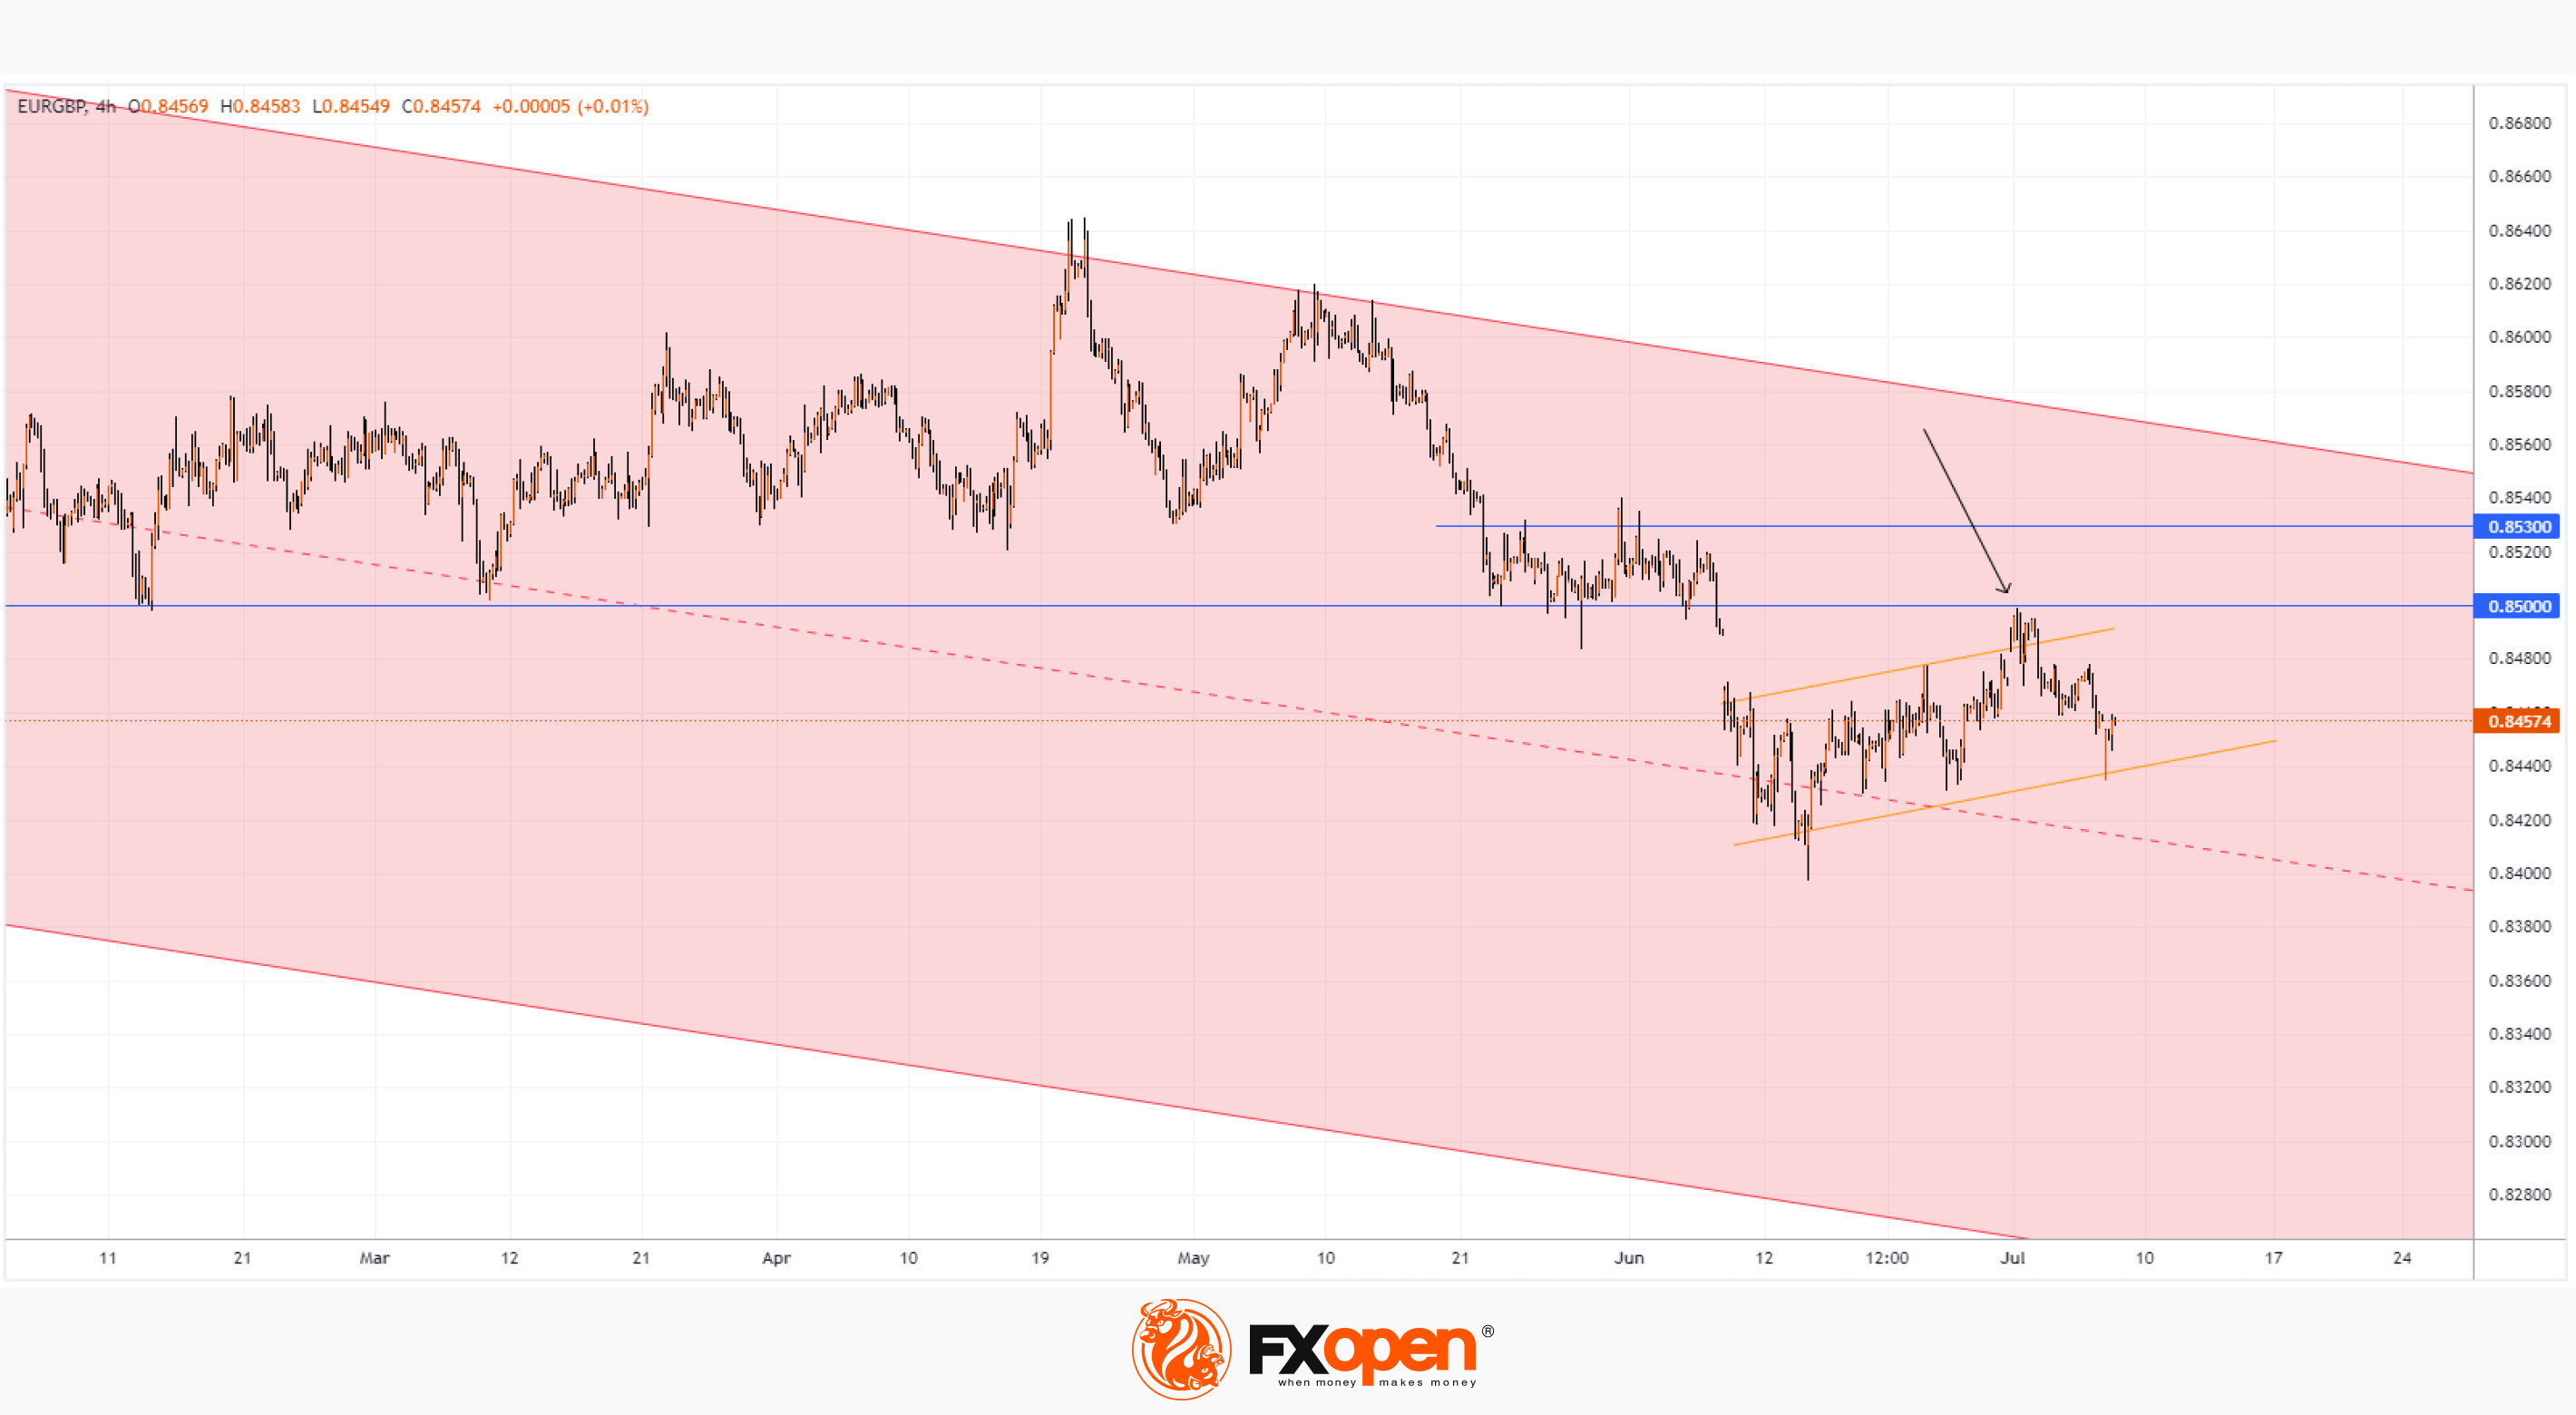
→ In terms of price dynamics since spring 2023, the market is in a downtrend (as indicated by the red channel);
→ In the aforementioned post from 10 June, we wrote that the 0.85-0.853 zone might provide significant resistance. Indeed, this was confirmed on the first day of July, when the price turned downwards from the 0.85 level (as indicated by the arrow).
If political developments do not alter the months-long dominance of the bears, the formation shown by the yellow lines could become an intermediate consolidation zone before the EUR/GBP price continues its downward trend.
Trade over 50 forex markets 24 hours a day with FXOpen. Take advantage of low commissions, deep liquidity, and spreads from 0.0 pips. Open your FXOpen account now or learn more about trading forex with FXOpen.
CFDs are complex instruments and come with a high risk of losing your money.
This article represents the opinion of the Companies operating under the FXOpen brand only. It is not to be construed as an offer, solicitation, or recommendation with respect to products and services provided by the Companies operating under the FXOpen brand, nor is it to be considered financial advice.
The EUR/GBP rate fluctuates under the influence of political factors
On 10th June, we wrote that the EUR/GBP rate fell to a 21-month low after the European Parliament elections. Political fundamental factors continue to influence this pair.
As Reuters reports:
→ The euro is down on Monday amid unexpectedly strong results for the left-wing forces in the French elections, which has created new uncertainty regarding the country’s financial outlook.
→ The pound sterling has risen to a 3.5-week high against the US dollar, as the British currency strengthens following the Labour Party’s decisive victory in last week’s elections, ending 14 years of Conservative rule.
Therefore, it is not surprising that a bearish gap formed on the EUR/GBP chart at the start of the week – however, bulls managed to recoup the decline during the Asian session. How will events unfold from here?
According to the technical analysis of EUR/GBP today:
→ In terms of price dynamics since spring 2023, the market is in a downtrend (as indicated by the red channel);
→ In the aforementioned post from 10 June, we wrote that the 0.85-0.853 zone might provide significant resistance. Indeed, this was confirmed on the first day of July, when the price turned downwards from the 0.85 level (as indicated by the arrow).
If political developments do not alter the months-long dominance of the bears, the formation shown by the yellow lines could become an intermediate consolidation zone before the EUR/GBP price continues its downward trend.
Trade over 50 forex markets 24 hours a day with FXOpen. Take advantage of low commissions, deep liquidity, and spreads from 0.0 pips. Open your FXOpen account now or learn more about trading forex with FXOpen.
CFDs are complex instruments and come with a high risk of losing your money.
This article represents the opinion of the Companies operating under the FXOpen brand only. It is not to be construed as an offer, solicitation, or recommendation with respect to products and services provided by the Companies operating under the FXOpen brand, nor is it to be considered financial advice.
👍2
#marketanalysis #oilindustry #oilprices #MarketNews
Brent crude oil price hits a high since 1 May
Analysing the oil price on 19 June, we wrote that:
→ Amidst increasing demand for oil during the holiday season, Goldman Sachs analysts suggest that by the end of summer, the Brent price could rise to $86 per barrel with an upper limit around $90.
→ The price could reach the upper boundary of a narrowing triangle that originated in 2022-2023 – technically, this is a significant resistance level.
Since then, as the Brent crude oil price chart (XBR/USD) shows, the price has reached the upper boundary of the triangle. How will events unfold from here?
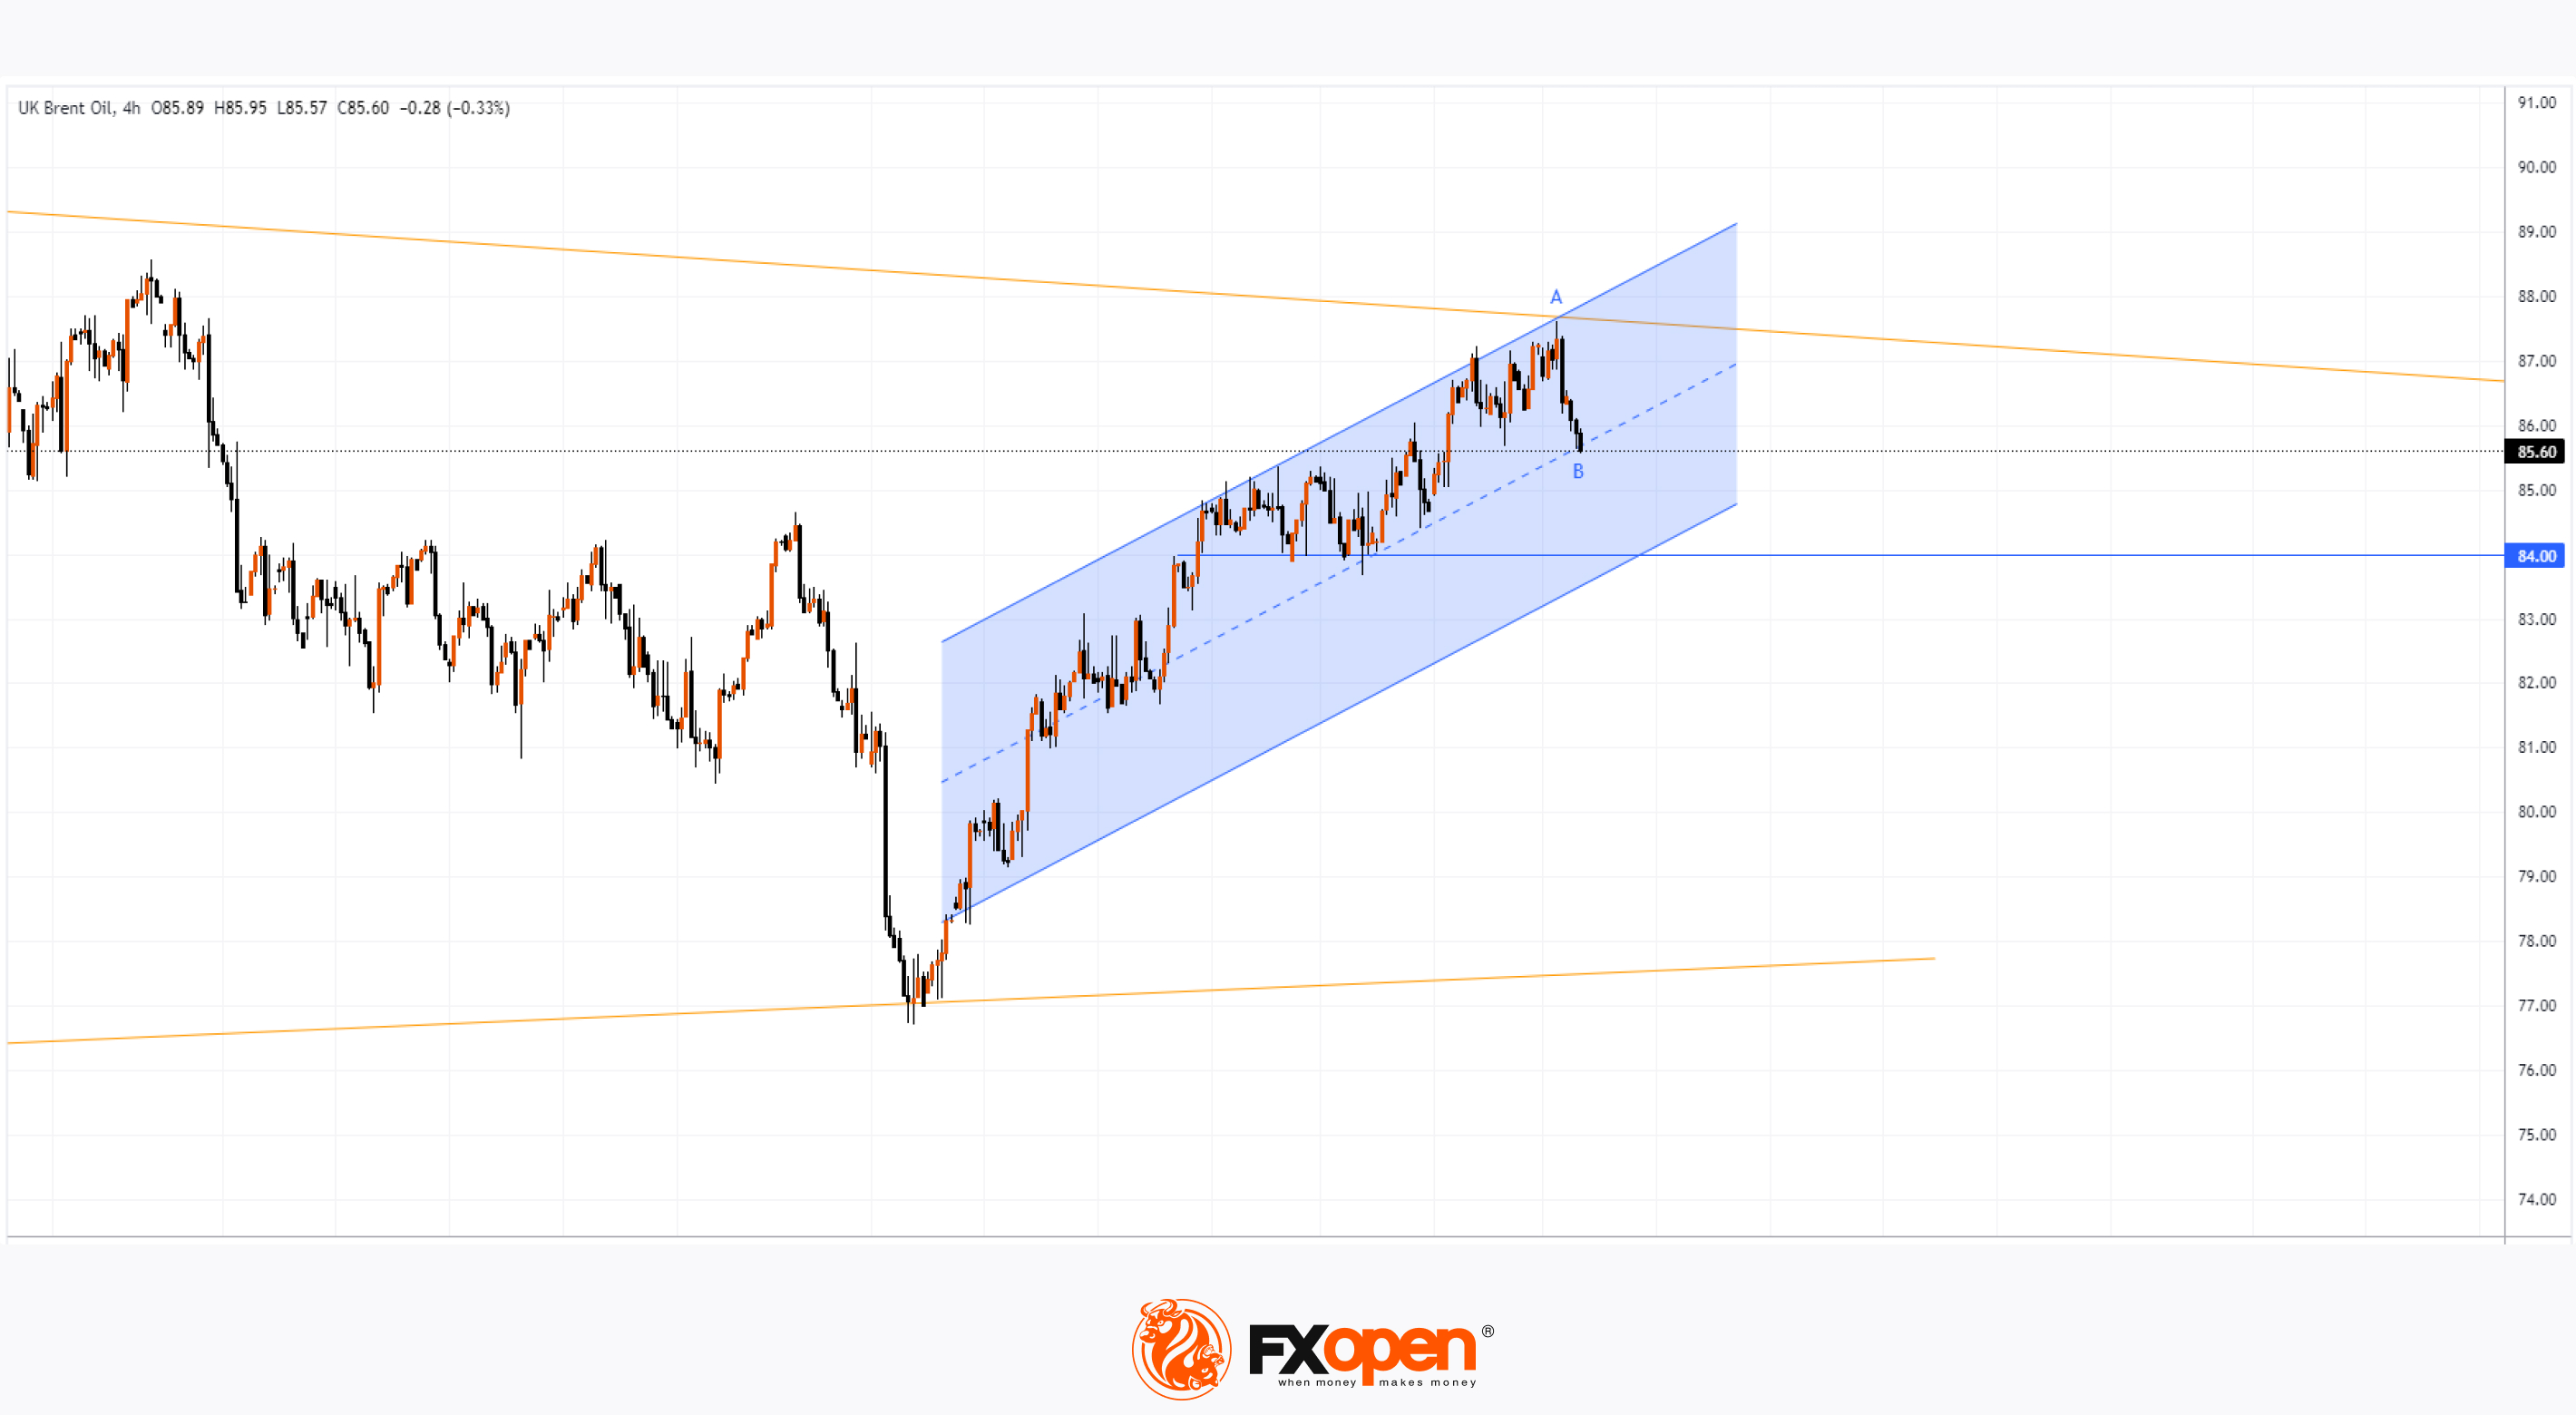
Technical analysis of the Brent crude oil price chart indicates that:
→ The price increase in June has formed an ascending channel (shown in blue);
→ The resistance effect of the upper boundary of the large triangle has led to the A
→B movement. The price quickly reached the median line of the blue channel, confirming seller activity at levels above $87 per barrel
The price decline at the end of last week was influenced not only by technical factors but also by fundamental ones – as Reuters reports, oil prices are falling amidst renewed ceasefire talks and a hostage release deal in the Gaza Strip.
It is possible that the Brent crude oil price could drop to the lower boundary of the blue channel, from where bulls may attempt to resume the upward movement. The following fundamental factors have the potential to support the bulls:
→ The impact of Hurricane Beryl on production and operations in the US. Major ports in Texas have shut down operations and vessel movements as Beryl continues to strengthen approaching the coast near Houston.
→ Breakdown of negotiations and the threat of escalation in the Middle East and other geopolitical factors.
→ Continuation of the holiday season.
Note that the lower boundary of the blue channel is reinforced by the $84 support level. Considering the upper boundary of the triangle, traders have reasons to believe that in July, a consolidation pattern could form on the XBR/USD chart between the $84-$87 levels.
Start trading commodities with tight spreads. Open your trading account now or learn more about trading commodity CFDs with FXOpen.
CFDs are complex instruments and come with a high risk of losing your money.
This article represents the opinion of the Companies operating under the FXOpen brand only. It is not to be construed as an offer, solicitation, or recommendation with respect to products and services provided by the Companies operating under the FXOpen brand, nor is it to be considered financial advice.
Brent crude oil price hits a high since 1 May
Analysing the oil price on 19 June, we wrote that:
→ Amidst increasing demand for oil during the holiday season, Goldman Sachs analysts suggest that by the end of summer, the Brent price could rise to $86 per barrel with an upper limit around $90.
→ The price could reach the upper boundary of a narrowing triangle that originated in 2022-2023 – technically, this is a significant resistance level.
Since then, as the Brent crude oil price chart (XBR/USD) shows, the price has reached the upper boundary of the triangle. How will events unfold from here?
Technical analysis of the Brent crude oil price chart indicates that:
→ The price increase in June has formed an ascending channel (shown in blue);
→ The resistance effect of the upper boundary of the large triangle has led to the A
→B movement. The price quickly reached the median line of the blue channel, confirming seller activity at levels above $87 per barrel
The price decline at the end of last week was influenced not only by technical factors but also by fundamental ones – as Reuters reports, oil prices are falling amidst renewed ceasefire talks and a hostage release deal in the Gaza Strip.
It is possible that the Brent crude oil price could drop to the lower boundary of the blue channel, from where bulls may attempt to resume the upward movement. The following fundamental factors have the potential to support the bulls:
→ The impact of Hurricane Beryl on production and operations in the US. Major ports in Texas have shut down operations and vessel movements as Beryl continues to strengthen approaching the coast near Houston.
→ Breakdown of negotiations and the threat of escalation in the Middle East and other geopolitical factors.
→ Continuation of the holiday season.
Note that the lower boundary of the blue channel is reinforced by the $84 support level. Considering the upper boundary of the triangle, traders have reasons to believe that in July, a consolidation pattern could form on the XBR/USD chart between the $84-$87 levels.
Start trading commodities with tight spreads. Open your trading account now or learn more about trading commodity CFDs with FXOpen.
CFDs are complex instruments and come with a high risk of losing your money.
This article represents the opinion of the Companies operating under the FXOpen brand only. It is not to be construed as an offer, solicitation, or recommendation with respect to products and services provided by the Companies operating under the FXOpen brand, nor is it to be considered financial advice.
👍3
#XAUUSD #goldprice #MarketNews
XAU/USD Analysis: Gold Price Falls from Six-Week High
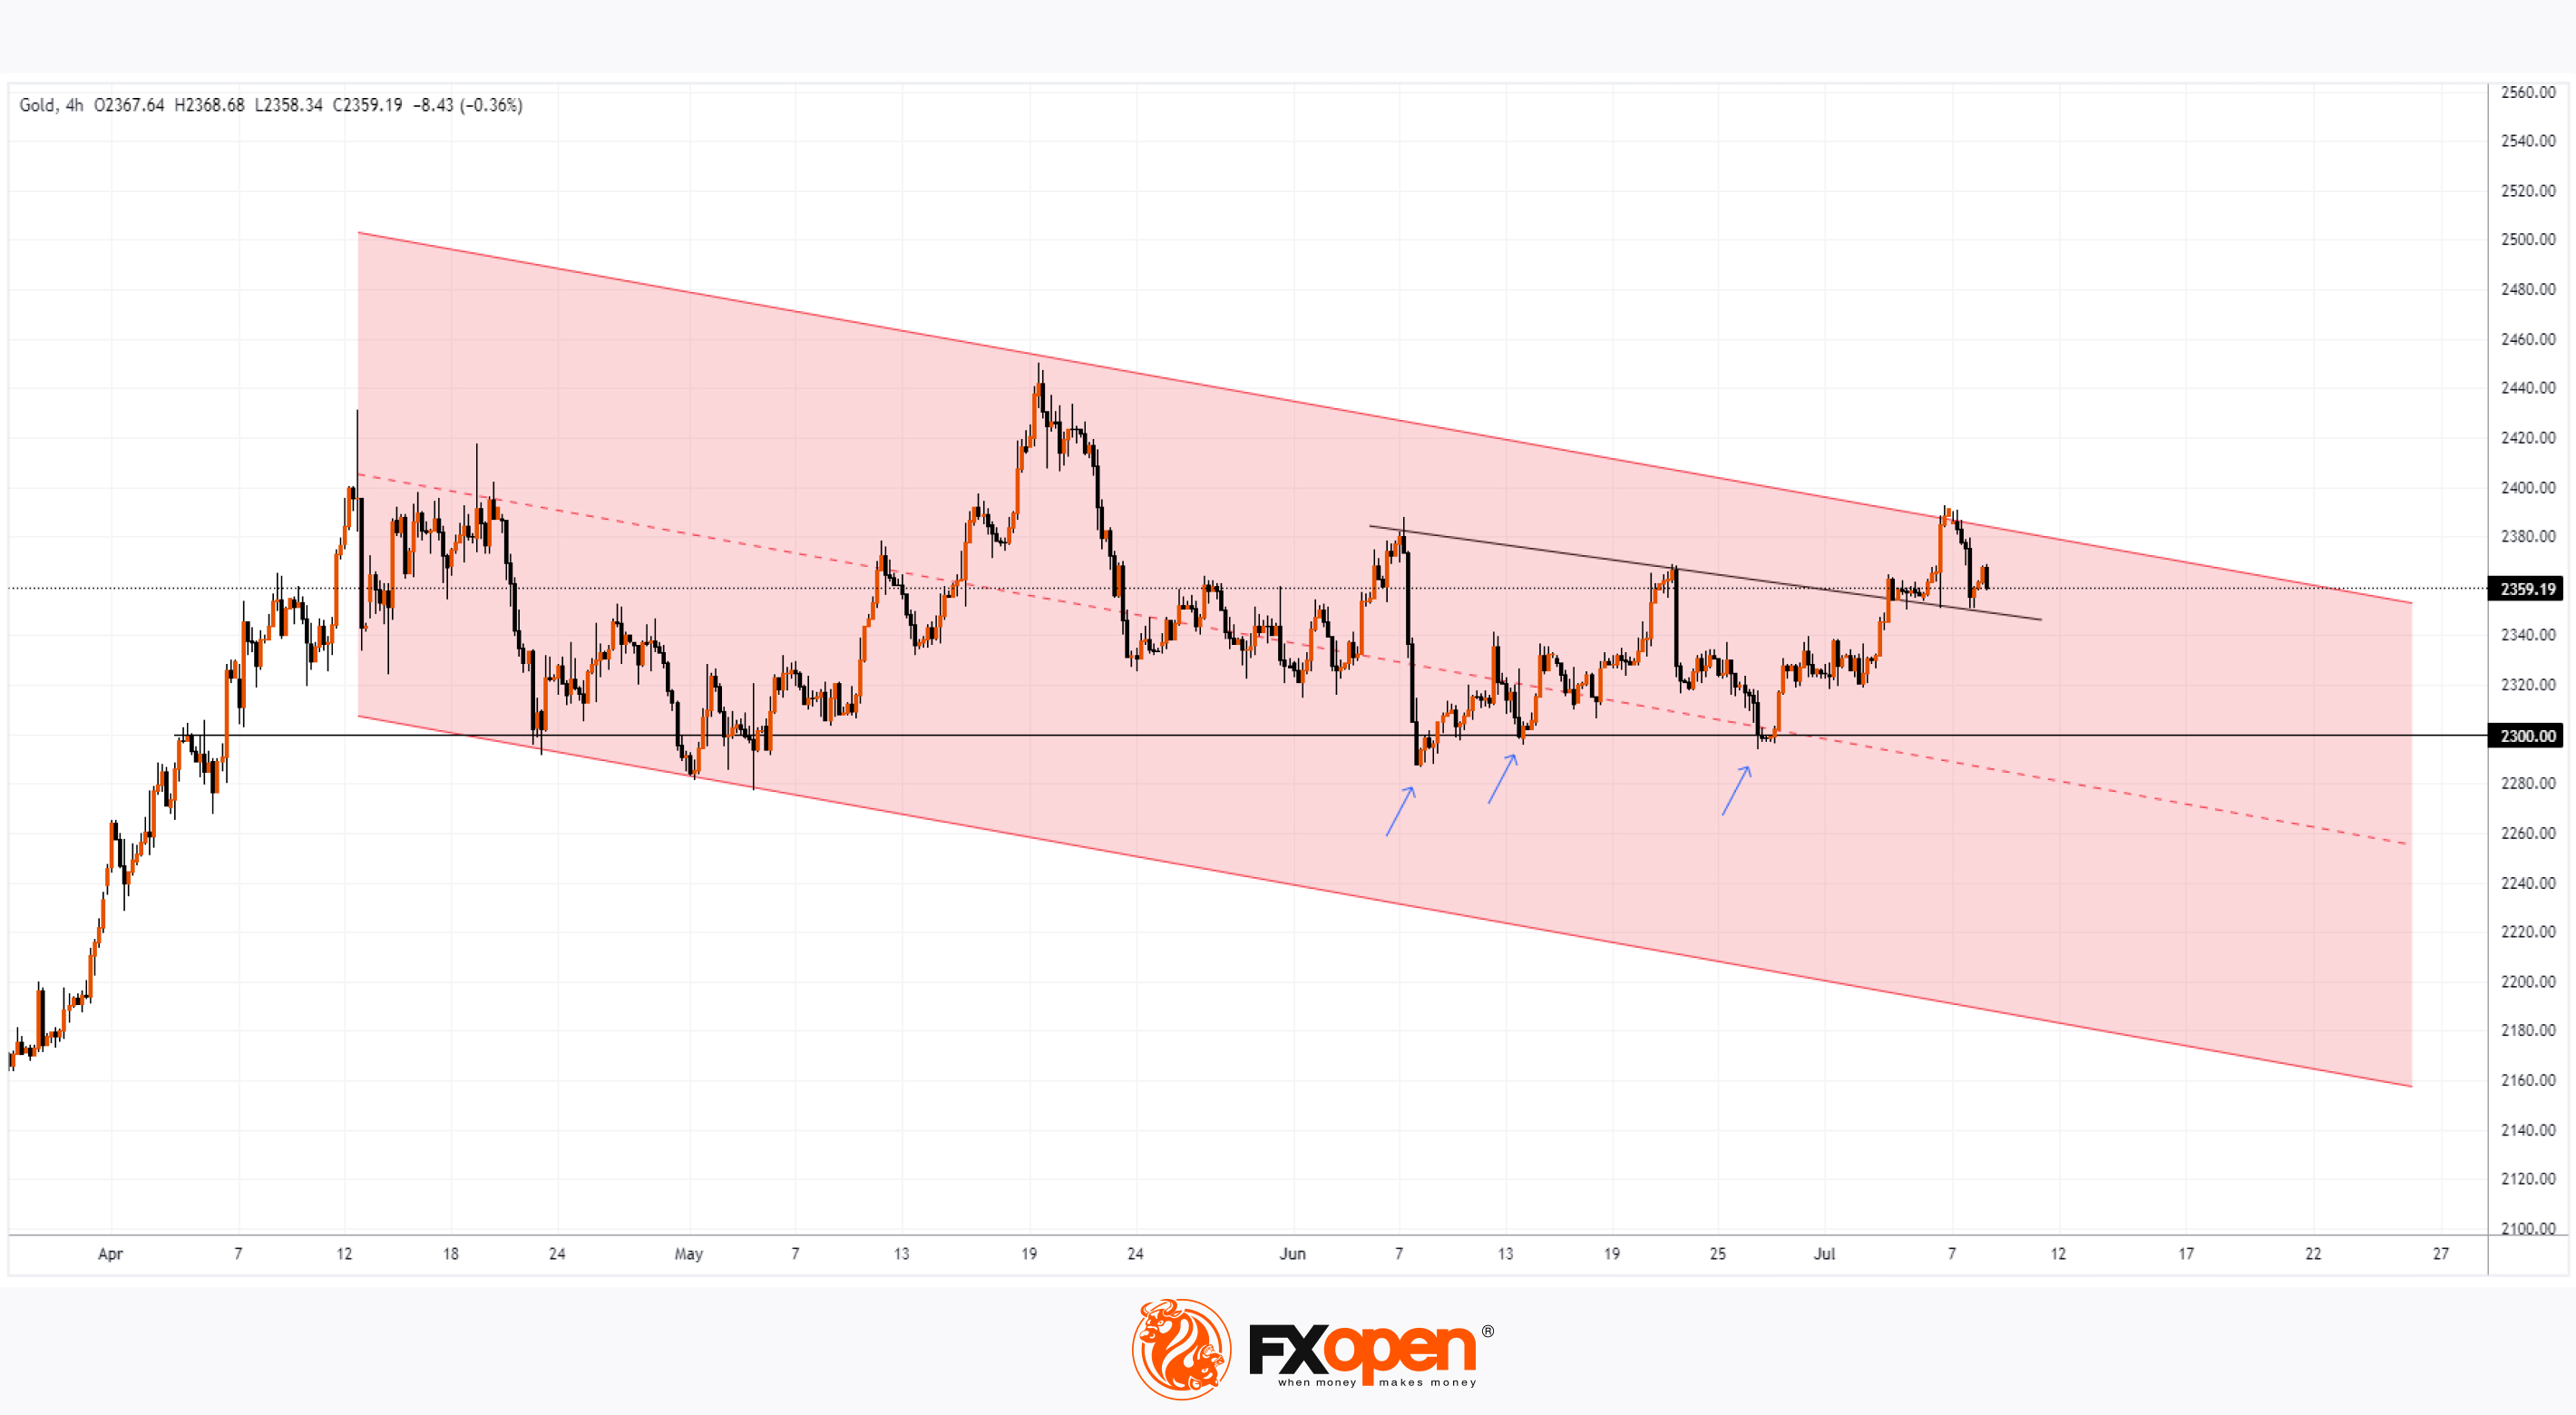
As shown by the XAU/USD chart, on Friday, 5 July, the price of gold rose above the $2390 level for the first time since 22 May. According to Reuters, this increase occurred following the release of key U.S. employment data, which indicated a softening labour market, raising expectations of a Federal Reserve interest rate cut in September.
However, yesterday, Monday, the gold price fell to $2360 per ounce – the level from which Friday's ascent began. This suggests that the bulls were unable to sustain the progress made on Friday, indicating a bearish sign.
Could the Gold Price Decline in the Coming Days?
From a technical analysis perspective of the XAU/USD chart:
-The gold market has clear support around the $2300 area. Each time the price fell below this level in June (as indicated by arrows), it quickly rebounded upwards, demonstrating sustained demand.
-Price action since April provides enough reference points to establish a descending channel (shown in red). The recent bearish reversal returned the price within this channel, reinforcing resistance from its upper boundary.
There is also reason to believe that the bullish breakout of local resistance (shown in black) might be false.
Therefore, signs of seller activity in the $2380-2400 range suggest that the gold price could continue to decline towards the important support at $2300.
External Influences on the Gold Market
The head of the Federal Reserve, Jerome Powell, is likely to have a significant impact on the gold market. Powell will testify before Congress, starting with an appearance in the Senate on Tuesday at 17:00 GMT+3, followed by the House of Representatives on Wednesday at 17:00 GMT+3.
If Powell hints directly or indirectly at signs of weakness in the U.S. economy, this could provide a positive impulse for the gold price. In such a scenario, market participants might increase their expectations of a rate cut (currently, according to CME’s FedWatch Tool, the probability of a September rate cut is estimated at 77%). The attractiveness of non-yielding gold bars typically rises in a low-interest-rate environment.
Start trading commodities with tight spreads. Open your trading account now or learn more about trading commodity CFDs with FXOpen.
CFDs are complex instruments and come with a high risk of losing your money.
This article represents the opinion of the Companies operating under the FXOpen brand only. It is not to be construed as an offer, solicitation, or recommendation with respect to products and services provided by the Companies operating under the FXOpen brand, nor is it to be considered financial advice.
XAU/USD Analysis: Gold Price Falls from Six-Week High
As shown by the XAU/USD chart, on Friday, 5 July, the price of gold rose above the $2390 level for the first time since 22 May. According to Reuters, this increase occurred following the release of key U.S. employment data, which indicated a softening labour market, raising expectations of a Federal Reserve interest rate cut in September.
However, yesterday, Monday, the gold price fell to $2360 per ounce – the level from which Friday's ascent began. This suggests that the bulls were unable to sustain the progress made on Friday, indicating a bearish sign.
Could the Gold Price Decline in the Coming Days?
From a technical analysis perspective of the XAU/USD chart:
-The gold market has clear support around the $2300 area. Each time the price fell below this level in June (as indicated by arrows), it quickly rebounded upwards, demonstrating sustained demand.
-Price action since April provides enough reference points to establish a descending channel (shown in red). The recent bearish reversal returned the price within this channel, reinforcing resistance from its upper boundary.
There is also reason to believe that the bullish breakout of local resistance (shown in black) might be false.
Therefore, signs of seller activity in the $2380-2400 range suggest that the gold price could continue to decline towards the important support at $2300.
External Influences on the Gold Market
The head of the Federal Reserve, Jerome Powell, is likely to have a significant impact on the gold market. Powell will testify before Congress, starting with an appearance in the Senate on Tuesday at 17:00 GMT+3, followed by the House of Representatives on Wednesday at 17:00 GMT+3.
If Powell hints directly or indirectly at signs of weakness in the U.S. economy, this could provide a positive impulse for the gold price. In such a scenario, market participants might increase their expectations of a rate cut (currently, according to CME’s FedWatch Tool, the probability of a September rate cut is estimated at 77%). The attractiveness of non-yielding gold bars typically rises in a low-interest-rate environment.
Start trading commodities with tight spreads. Open your trading account now or learn more about trading commodity CFDs with FXOpen.
CFDs are complex instruments and come with a high risk of losing your money.
This article represents the opinion of the Companies operating under the FXOpen brand only. It is not to be construed as an offer, solicitation, or recommendation with respect to products and services provided by the Companies operating under the FXOpen brand, nor is it to be considered financial advice.
👍2
#marketanalysis #forextrading #MarketNews
Analysis of NZD/USD: The "kiwi" sharply fell after the central bank's decision
The Reserve Bank of New Zealand (RBNZ) kept the interest rate unchanged at 5.5% on Wednesday.
The decision to maintain the interest rate was anticipated. However, market participants noted a shift in the tone of the RBNZ's official statements. In May, the bank indicated that the tight policy would continue as long as necessary, but now it is open to easing the restrictive monetary policy if inflation slows down.
As a result, market participants are now considering the possibility of a nearer-term rate cut, which led to a decline in the New Zealand dollar relative to other currencies.
Specifically, against the US dollar, the "kiwi" fell by approximately 0.75%.
Will the decline continue as the situation develops?
According to the technical analysis of the NZD/USD chart today:
→ In 2024, the exchange rate dynamics are significantly influenced by interactions with the levels: 0.62150 (resistance), 0.58850 (support), and 0.60500 (which acts as a pivot between support and resistance, as indicated by the black arrows).
→ Bullish sentiment prevailed in the market since May, resulting in the formation of an upward blue channel on the chart. However, the bulls were unable to break through the 0.62150 resistance, and now the median of the blue channel serves as resistance (indicated by the blue arrow).
Considering the prospect of further NZD/USD price decline, it is important to note obstacles in the path of the bears in the form of supports:
→ from the lower boundary of the blue channel;
→ from the 0.60500 level, around which the price has fluctuated since the beginning of the year;
→ from the psychological level of 0.6.
Therefore, technically, it is possible that the downward momentum created today due to the RBNZ decision may weaken when attempting to break through these supports.
Trade over 50 forex markets 24 hours a day with FXOpen. Take advantage of low commissions, deep liquidity, and spreads from 0.0 pips. Open your FXOpen account now or learn more about trading forex with FXOpen.
CFDs are complex instruments and come with a high risk of losing your money.
This article represents the opinion of the Companies operating under the FXOpen brand only. It is not to be construed as an offer, solicitation, or recommendation with respect to products and services provided by the Companies operating under the FXOpen brand, nor is it to be considered financial advice.
Analysis of NZD/USD: The "kiwi" sharply fell after the central bank's decision
The Reserve Bank of New Zealand (RBNZ) kept the interest rate unchanged at 5.5% on Wednesday.
The decision to maintain the interest rate was anticipated. However, market participants noted a shift in the tone of the RBNZ's official statements. In May, the bank indicated that the tight policy would continue as long as necessary, but now it is open to easing the restrictive monetary policy if inflation slows down.
As a result, market participants are now considering the possibility of a nearer-term rate cut, which led to a decline in the New Zealand dollar relative to other currencies.
Specifically, against the US dollar, the "kiwi" fell by approximately 0.75%.
Will the decline continue as the situation develops?
According to the technical analysis of the NZD/USD chart today:
→ In 2024, the exchange rate dynamics are significantly influenced by interactions with the levels: 0.62150 (resistance), 0.58850 (support), and 0.60500 (which acts as a pivot between support and resistance, as indicated by the black arrows).
→ Bullish sentiment prevailed in the market since May, resulting in the formation of an upward blue channel on the chart. However, the bulls were unable to break through the 0.62150 resistance, and now the median of the blue channel serves as resistance (indicated by the blue arrow).
Considering the prospect of further NZD/USD price decline, it is important to note obstacles in the path of the bears in the form of supports:
→ from the lower boundary of the blue channel;
→ from the 0.60500 level, around which the price has fluctuated since the beginning of the year;
→ from the psychological level of 0.6.
Therefore, technically, it is possible that the downward momentum created today due to the RBNZ decision may weaken when attempting to break through these supports.
Trade over 50 forex markets 24 hours a day with FXOpen. Take advantage of low commissions, deep liquidity, and spreads from 0.0 pips. Open your FXOpen account now or learn more about trading forex with FXOpen.
CFDs are complex instruments and come with a high risk of losing your money.
This article represents the opinion of the Companies operating under the FXOpen brand only. It is not to be construed as an offer, solicitation, or recommendation with respect to products and services provided by the Companies operating under the FXOpen brand, nor is it to be considered financial advice.
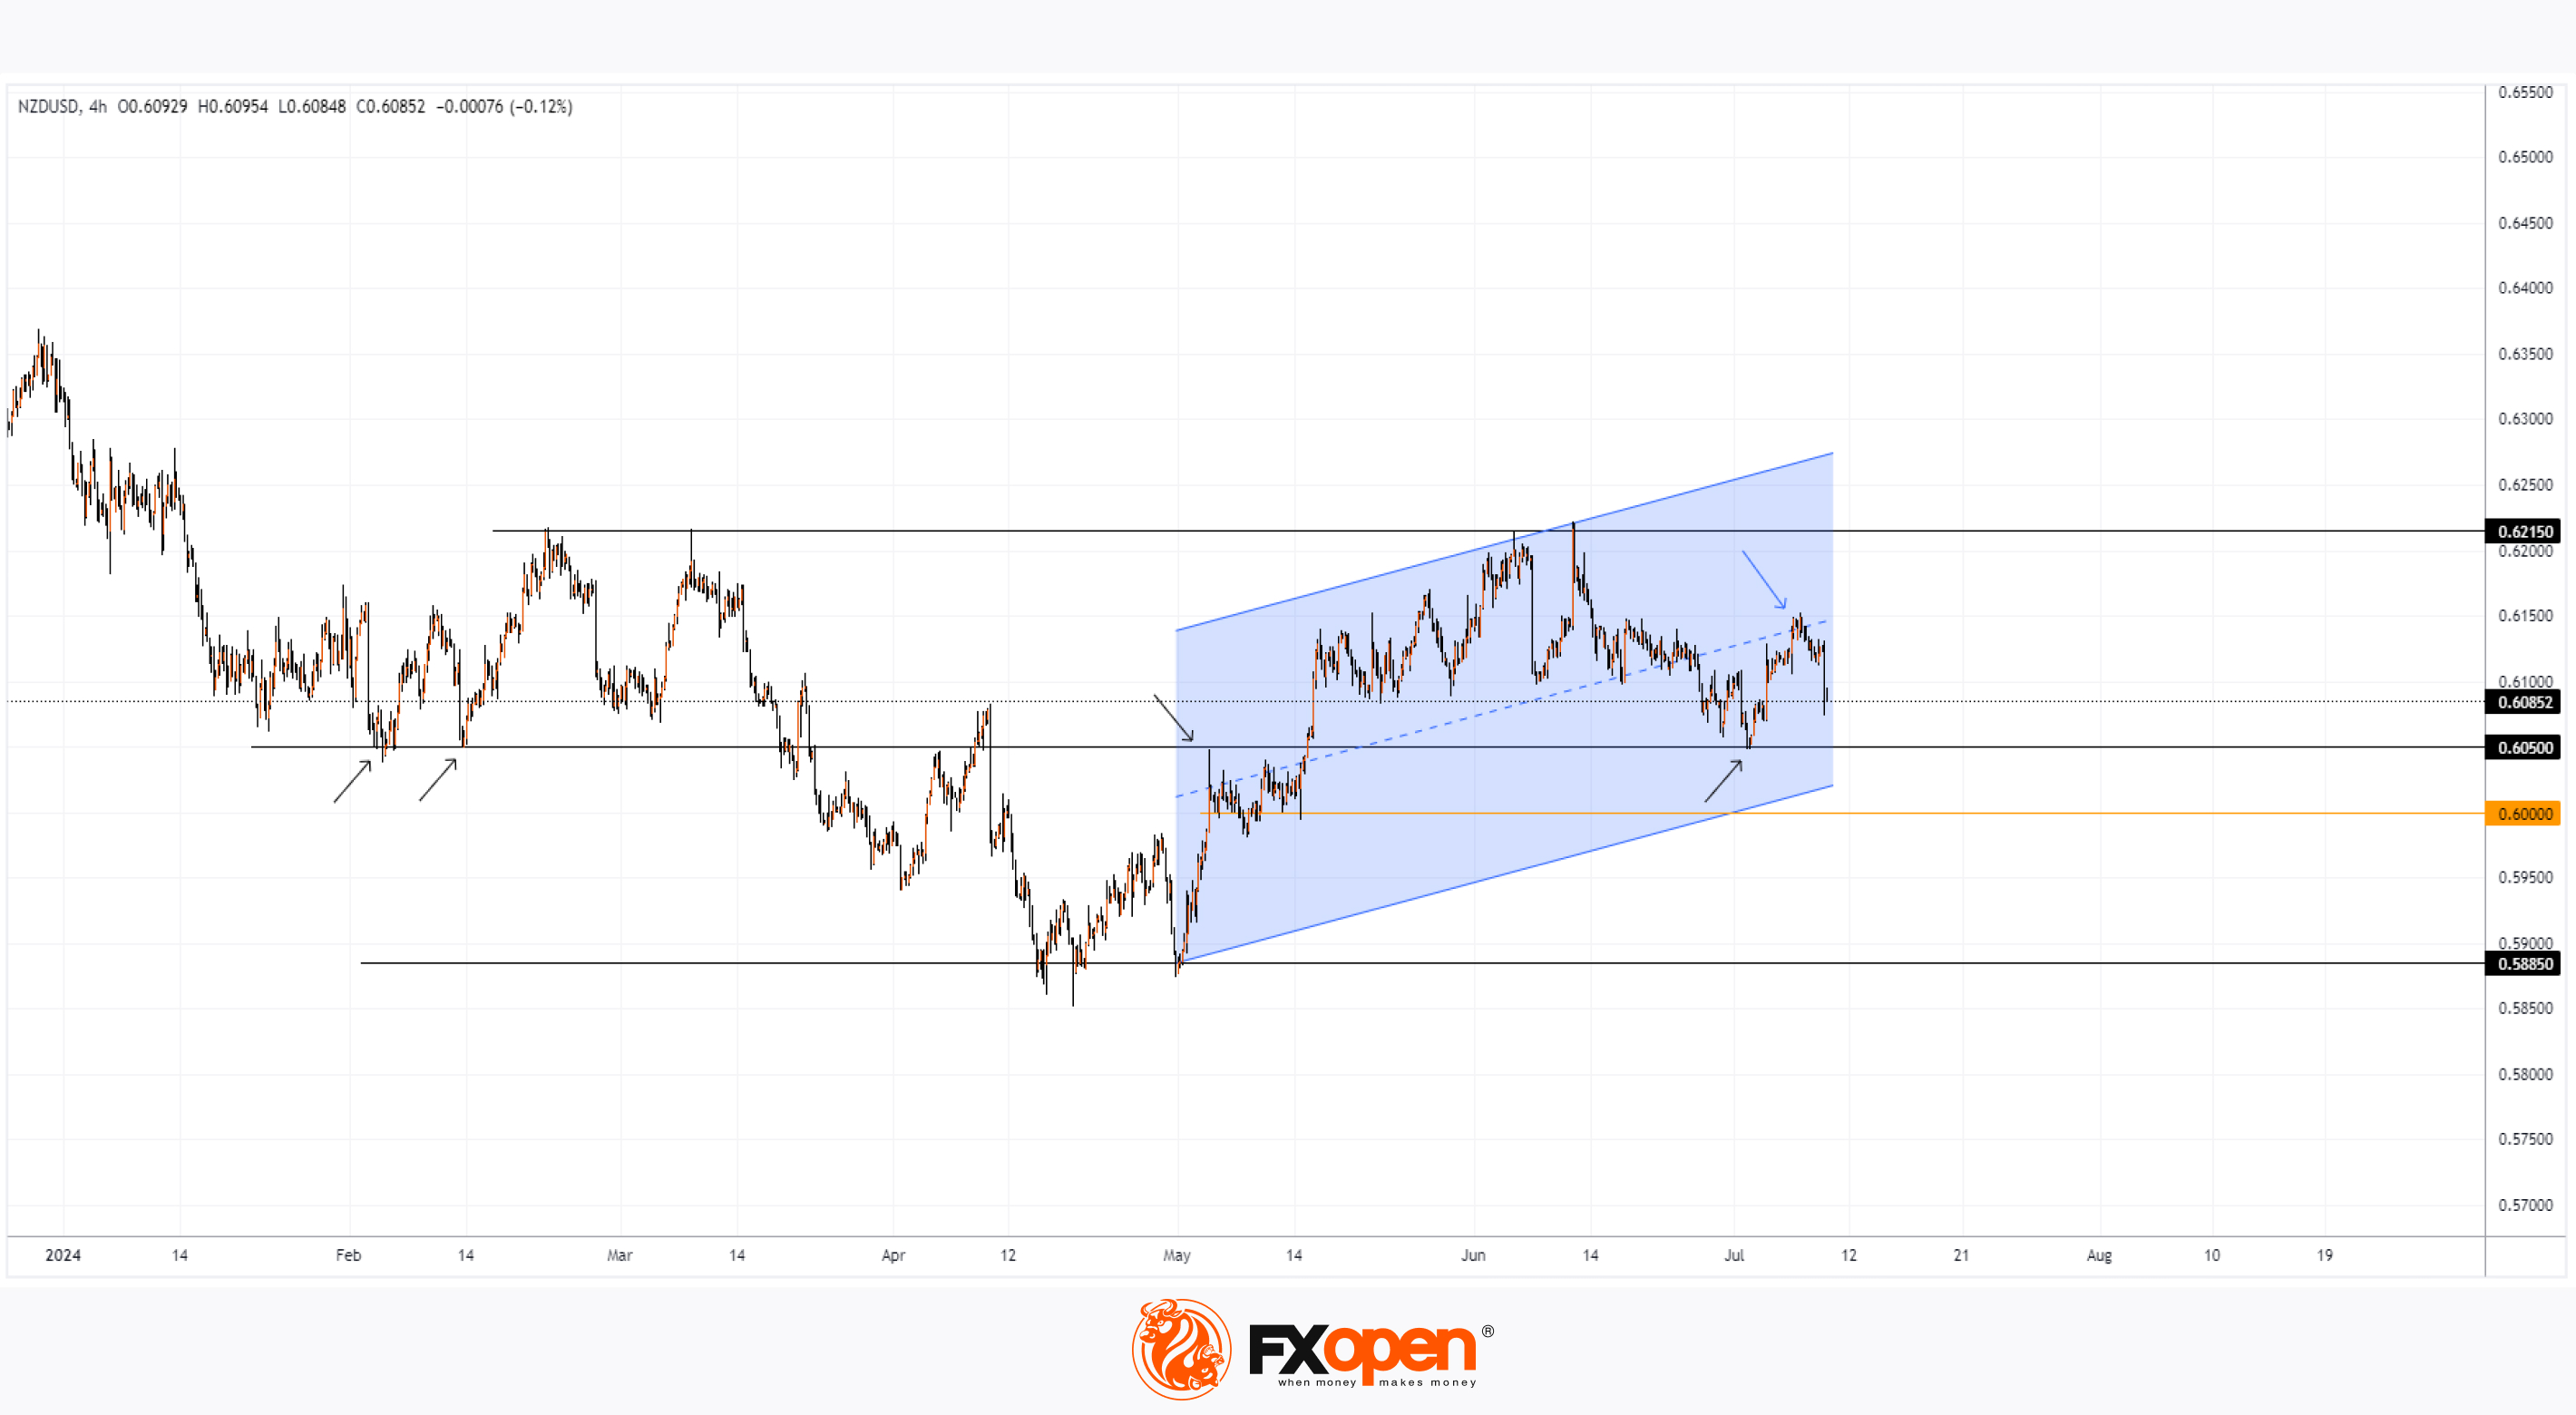
👍2
#stockmarket #NVDA #nvidia #stocktrading
Analysts Raise NVDA Forecasts, Stock Price Rises
According to FactSet, in July, seven reputable analysts have raised their target prices for NVDA stock. KeyBanc analyst John Vinh, for instance, increased his target from $130 to $180 (approximately 33% above the current price).
Following these target increases, Nvidia's stock has risen, closing above the psychological level of $130 yesterday for the first time since June 20. Consequently, NVDA's price has increased by more than 160% since the start of the year.
Will Nvidia's rally continue? The NVDA chart data raises doubts about the stock's ability to confidently set new historical highs as it did in the first half of the year.
Notice the price behaviour when crossing the psychological level of $130, considering NVDA's trading volumes on the Nasdaq:
→ The rise to peak A occurred on below-average volumes;
→ The decline to low B occurred on significantly above-average volumes;
→ The rise to C (which may be exceeded) occurred on below-average volumes.
This relationship suggests a lack of buyers above the $130 level and sufficient sellers to push the price down.
According to NVDA's technical analysis today:
→ The price is in an upward channel (shown in blue);
→ The price is in the lower part of this channel, and the July rebound from the lower boundary is not very confident;
→ Peak C is approximately at the 50% Fibonacci retracement level of the A→B downward move (a potential proportion of the upward correction within the prevailing trend).
All these factors provide enough arguments to be prepared for a scenario where NVDA's price breaks below the lower boundary of the current blue channel on increased volumes.
Trade global index CFDs with zero commission and tight spreads. Open your FXOpen account now or learn more about trading index CFDs with FXOpen.
CFDs are complex instruments and come with a high risk of losing your money.
This article represents the opinion of the Companies operating under the FXOpen brand only. It is not to be construed as an offer, solicitation, or recommendation with respect to products and services provided by the Companies operating under the FXOpen brand, nor is it to be considered financial advice.
Analysts Raise NVDA Forecasts, Stock Price Rises
According to FactSet, in July, seven reputable analysts have raised their target prices for NVDA stock. KeyBanc analyst John Vinh, for instance, increased his target from $130 to $180 (approximately 33% above the current price).
Following these target increases, Nvidia's stock has risen, closing above the psychological level of $130 yesterday for the first time since June 20. Consequently, NVDA's price has increased by more than 160% since the start of the year.
Will Nvidia's rally continue? The NVDA chart data raises doubts about the stock's ability to confidently set new historical highs as it did in the first half of the year.
Notice the price behaviour when crossing the psychological level of $130, considering NVDA's trading volumes on the Nasdaq:
→ The rise to peak A occurred on below-average volumes;
→ The decline to low B occurred on significantly above-average volumes;
→ The rise to C (which may be exceeded) occurred on below-average volumes.
This relationship suggests a lack of buyers above the $130 level and sufficient sellers to push the price down.
According to NVDA's technical analysis today:
→ The price is in an upward channel (shown in blue);
→ The price is in the lower part of this channel, and the July rebound from the lower boundary is not very confident;
→ Peak C is approximately at the 50% Fibonacci retracement level of the A→B downward move (a potential proportion of the upward correction within the prevailing trend).
All these factors provide enough arguments to be prepared for a scenario where NVDA's price breaks below the lower boundary of the current blue channel on increased volumes.
Trade global index CFDs with zero commission and tight spreads. Open your FXOpen account now or learn more about trading index CFDs with FXOpen.
CFDs are complex instruments and come with a high risk of losing your money.
This article represents the opinion of the Companies operating under the FXOpen brand only. It is not to be construed as an offer, solicitation, or recommendation with respect to products and services provided by the Companies operating under the FXOpen brand, nor is it to be considered financial advice.
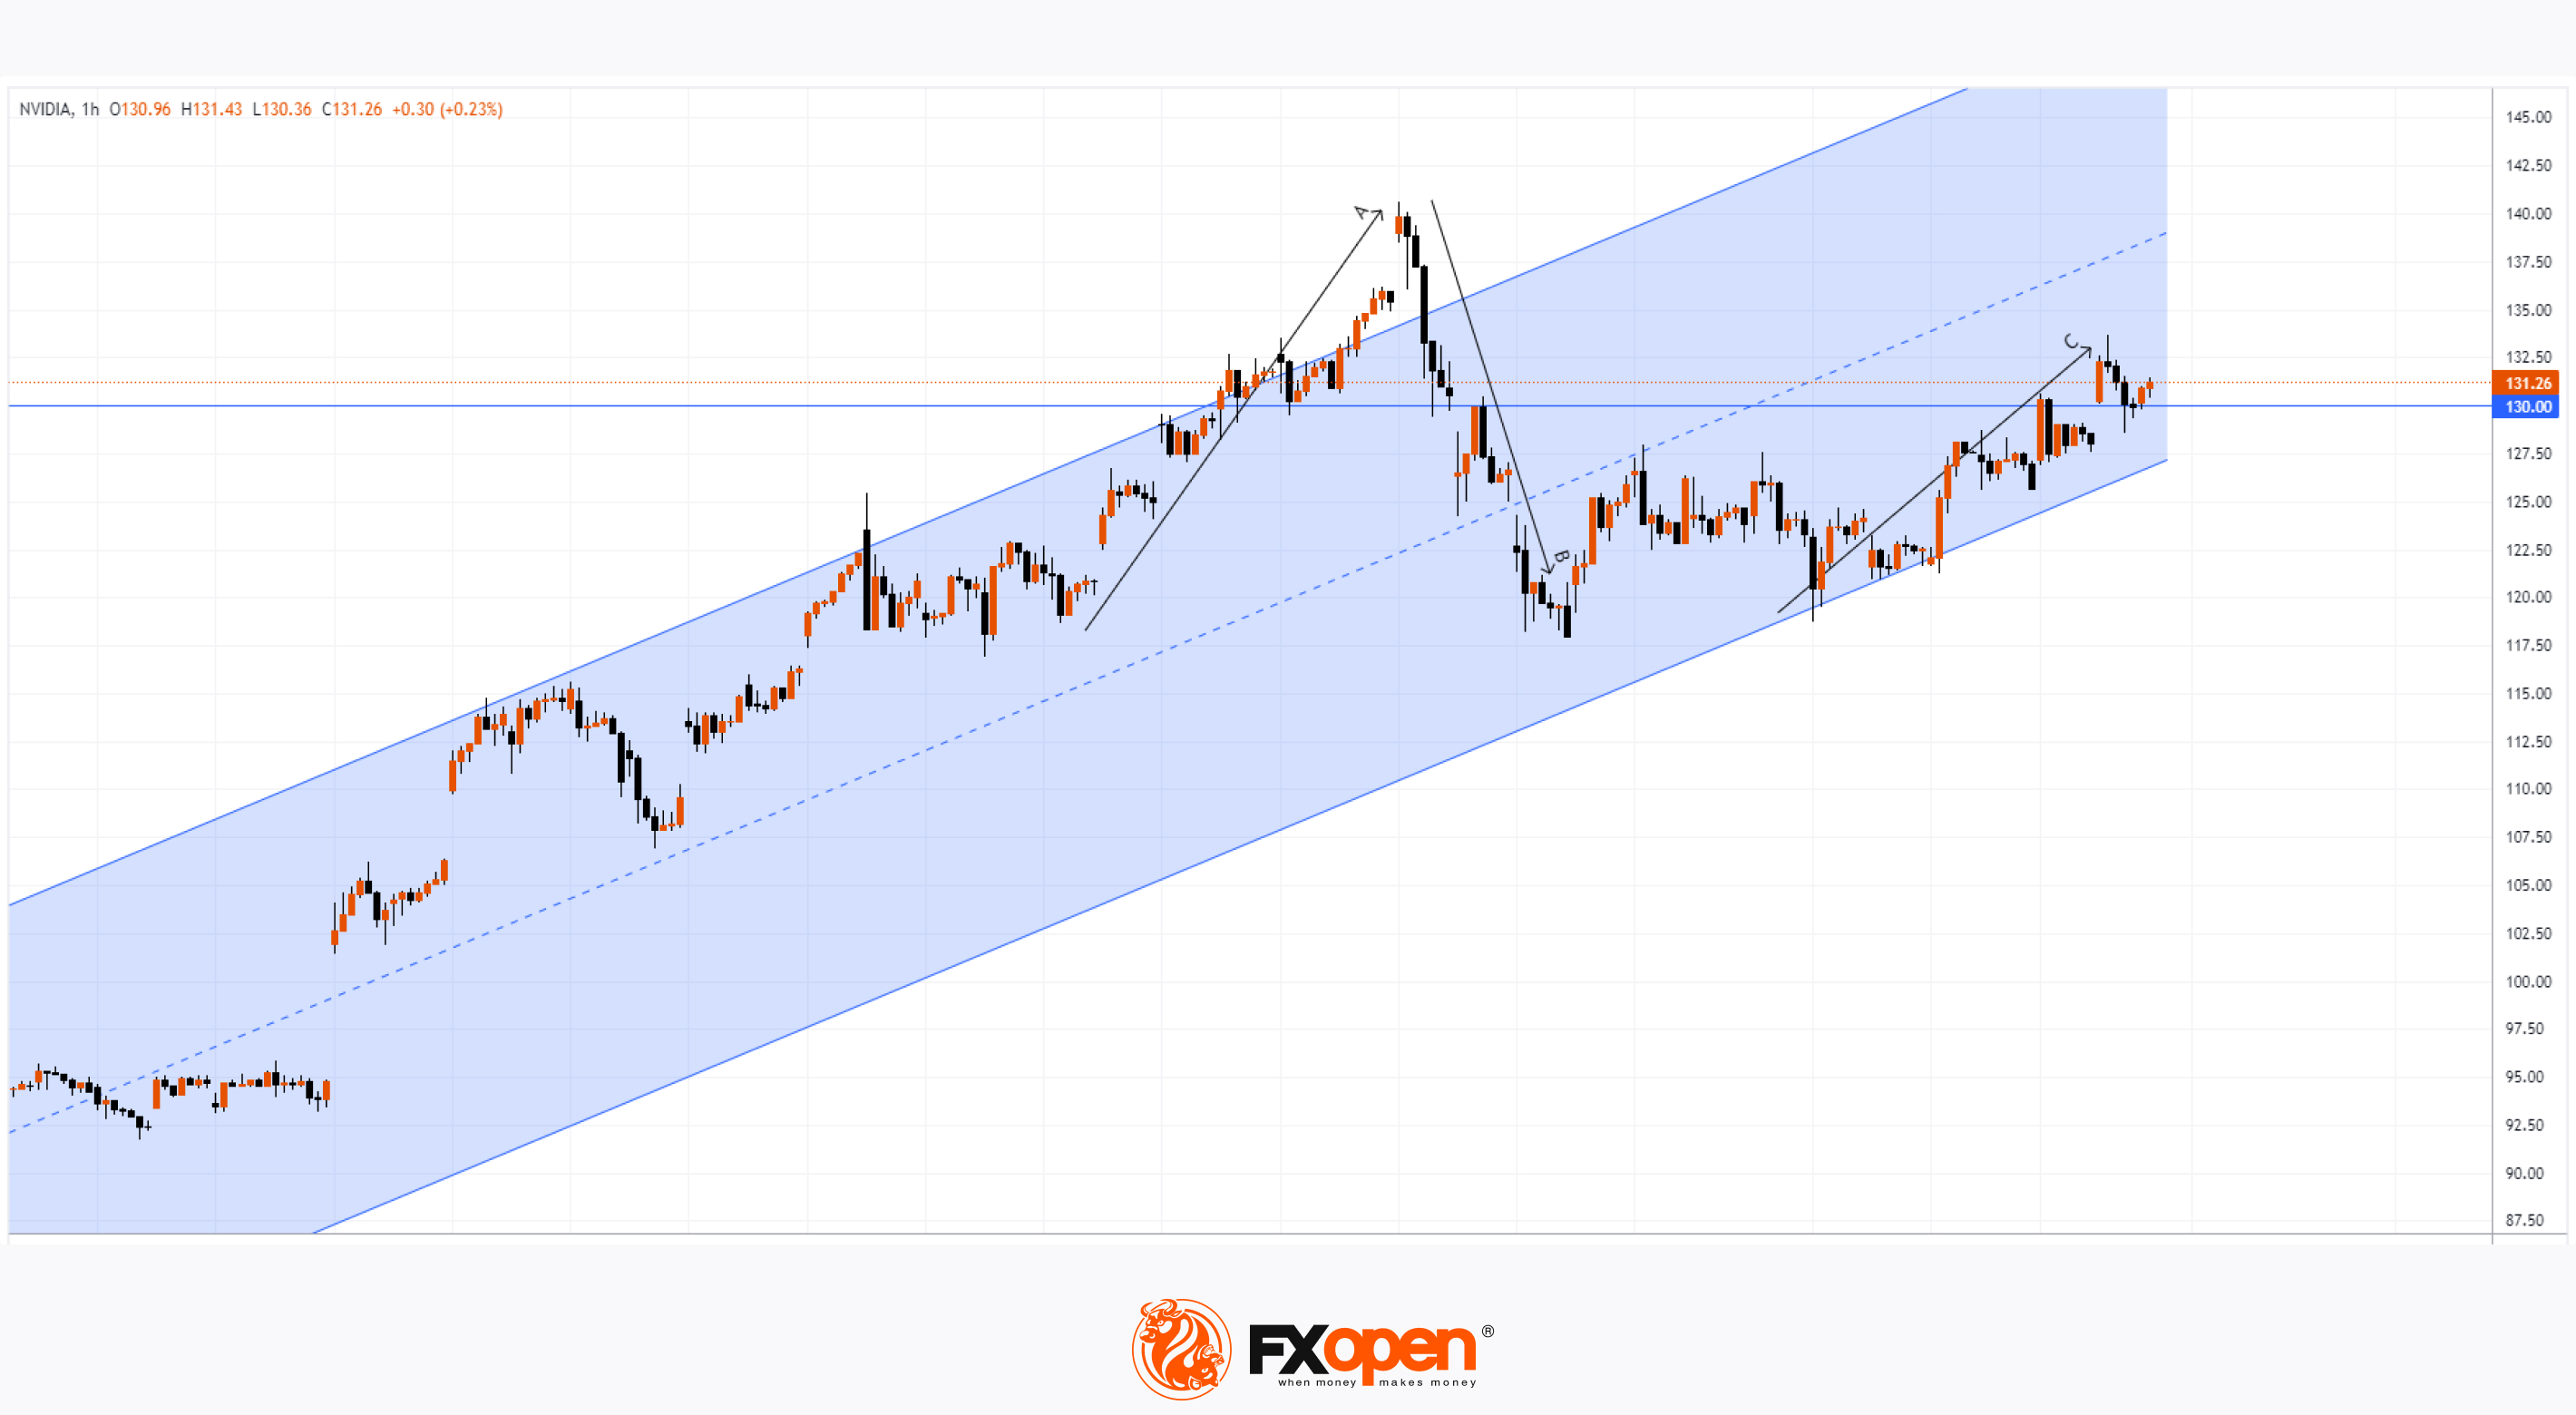
👍2
#GBPUSD #marketanalysis #forextrading #tradingtips
GBP/USD Hits Four-Month High Following GDP Growth News
Today, the UK Office for National Statistics published data showing an increase in GDP. According to Forex Factory:
→ A month ago, GDP was at 0.0% month-on-month;
→ This month, analysts had forecasted growth of 0.2%;
→ Actual growth reached 0.4%.
This news should be welcomed by the Labour Party, which has come into power with ambitious plans for economic development. On the other hand, how will the Bank of England respond? The GDP growth might provide an argument for maintaining high interest rates for a longer period to ensure that fears of a new inflationary surge do not materialise.
As Bloomberg reports, markets currently assess the likelihood of a rate cut at the next Bank of England meeting on 1 August at just under 50%. Financial markets reacted with a rise in the sterling's value against other currencies. The GBP/USD rate is at its highest level since early March.
Will the Growth Continue?
The GBP/USD chart shows that the price is in a rally, having risen by 1.7% since the beginning of July.
Technical Analysis of the GBP/USD Chart Today:
→ The price is moving within an ascending channel that started in early July, with the 1.27755 level having shifted from resistance to support.
→ The price has surpassed the June high at 1.28600 and is heading towards the year's high at 1.28930.
→ Support may come from the lower boundary of the ascending channel.
→ The strength of the bullish trend is indicated by the size of the B→C retracement. It is approximately at the 0.382 Fibonacci level of the A→B impulse, which broke the 1.27000 resistance.
If market sentiment remains unchanged, the bulls might attempt to surpass the year's high. However, one should also consider the news from the US. Today, inflation news is expected at 15:30 (GMT+3), which could significantly influence the current GBP/USD exchange rate dynamics.
Trade over 50 forex markets 24 hours a day with FXOpen. Take advantage of low commissions, deep liquidity, and spreads from 0.0 pips. Open your FXOpen account now or learn more about trading forex with FXOpen.
CFDs are complex instruments and come with a high risk of losing your money.
This article represents the opinion of the Companies operating under the FXOpen brand only. It is not to be construed as an offer, solicitation, or recommendation with respect to products and services provided by the Companies operating under the FXOpen brand, nor is it to be considered financial advice.
GBP/USD Hits Four-Month High Following GDP Growth News
Today, the UK Office for National Statistics published data showing an increase in GDP. According to Forex Factory:
→ A month ago, GDP was at 0.0% month-on-month;
→ This month, analysts had forecasted growth of 0.2%;
→ Actual growth reached 0.4%.
This news should be welcomed by the Labour Party, which has come into power with ambitious plans for economic development. On the other hand, how will the Bank of England respond? The GDP growth might provide an argument for maintaining high interest rates for a longer period to ensure that fears of a new inflationary surge do not materialise.
As Bloomberg reports, markets currently assess the likelihood of a rate cut at the next Bank of England meeting on 1 August at just under 50%. Financial markets reacted with a rise in the sterling's value against other currencies. The GBP/USD rate is at its highest level since early March.
Will the Growth Continue?
The GBP/USD chart shows that the price is in a rally, having risen by 1.7% since the beginning of July.
Technical Analysis of the GBP/USD Chart Today:
→ The price is moving within an ascending channel that started in early July, with the 1.27755 level having shifted from resistance to support.
→ The price has surpassed the June high at 1.28600 and is heading towards the year's high at 1.28930.
→ Support may come from the lower boundary of the ascending channel.
→ The strength of the bullish trend is indicated by the size of the B→C retracement. It is approximately at the 0.382 Fibonacci level of the A→B impulse, which broke the 1.27000 resistance.
If market sentiment remains unchanged, the bulls might attempt to surpass the year's high. However, one should also consider the news from the US. Today, inflation news is expected at 15:30 (GMT+3), which could significantly influence the current GBP/USD exchange rate dynamics.
Trade over 50 forex markets 24 hours a day with FXOpen. Take advantage of low commissions, deep liquidity, and spreads from 0.0 pips. Open your FXOpen account now or learn more about trading forex with FXOpen.
CFDs are complex instruments and come with a high risk of losing your money.
This article represents the opinion of the Companies operating under the FXOpen brand only. It is not to be construed as an offer, solicitation, or recommendation with respect to products and services provided by the Companies operating under the FXOpen brand, nor is it to be considered financial advice.

👍2