
#MarketNews #Сryptocurency #Intel
INTEL TO INTRODUCE CRYPTO MINING CHIP
Intel is set to unveil its Bonanza Mine processor at the International Solid-State Circuits Conference (ISSCC) that starts on February 20th.
Intel describes its "highlighted chip" as an "ultra-low-voltage energy-efficient bitcoin mining ASIC."
In an interview with Tom's Hardware, an Intel spokesperson said the tech giant has "done design work around SHA 256 optimized ASICs for several years beginning with pathfinding work done in Intel Labs."
The news suggests that Intel has long-term plans for bitcoin, which, however, is currently bearish.
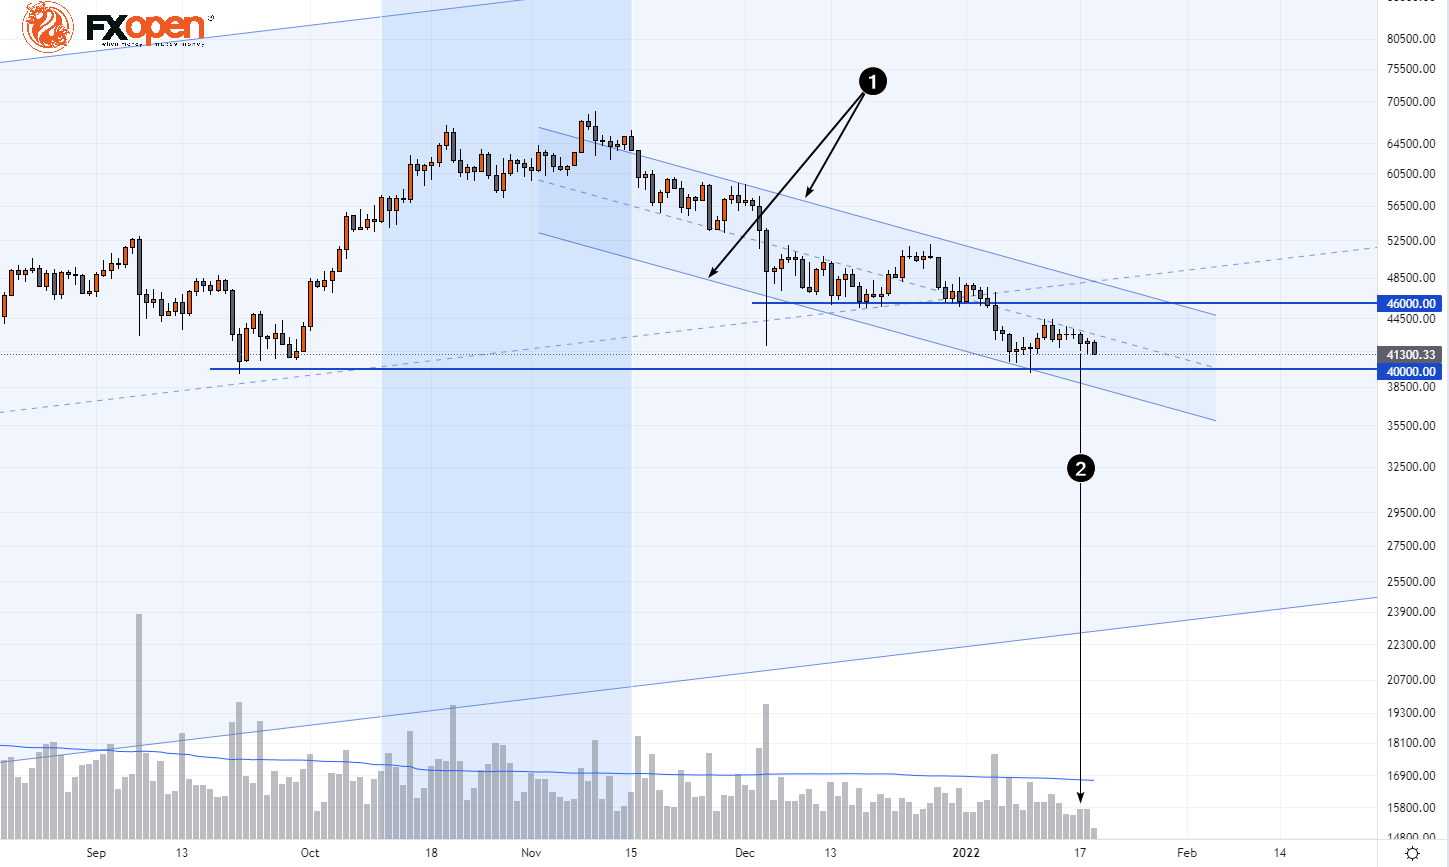
So far, BTCUSD has been developing within the descending channel (1), with the quote fluctuating within the range of 46k-40k. Doji candles formed on January 15-16, trading volumes were small. This was followed by a bearish candle on January 17 paired with growing volumes (2), which in general can be interpreted as the superiority of sellers after a period of indecision. In such conditions, the chances of a breakdown of the 40k support increase.
Are you interested in benefiting from the rise and fall of cryptocurrencies and/or Intel stocks? Consider enlisting the services of a reliable broker like FXOpen.
⚠️
This forecast represents FXOpen Markets Limited opinion only, it should not be construed as an offer, invitation or recommendation in respect to FXOpen Markets Limited products and services or as financial advice
#stocktrading #stockmarket #intel #marketanalysis #MarketNews
Intel (INTC) Stock Price Rises 7% Amid White House Rumours
Intel (INTC) stock price surged more than 7% yesterday, making it the top performer in the S&P 500 index (US SPX 500 mini on FXOpen). The rally came on the back of a report in Barron’s stating that the US government is in talks to acquire a stake in Intel:
→ Intel declined to comment on Barron's report.
→ White House spokesperson Kush Desai stated: “Discussion about hypothetical deals should be regarded as speculation unless officially announced by the Administration.”
Meanwhile, Bloomberg reported that the Trump administration is negotiating with Intel over a potential US government stake in the company – a move aimed at boosting domestic manufacturing and supporting Intel’s plans to build a new facility in Ohio.
The prospect of state backing for the American chipmaker triggered a sharp bullish impulse yesterday, which could extend into today. In pre-market trading, INTC shares are hovering around $25 – their highest level since March.
Technical Analysis of INTC Shares
Previously, when analysing the INTC chart, we highlighted the significance of the $20 level, which appeared to act as strong support from major market participants. This may have reflected expectations that the government would not abandon a strategically important US company during challenging times – particularly in the context of technological rivalry with China.
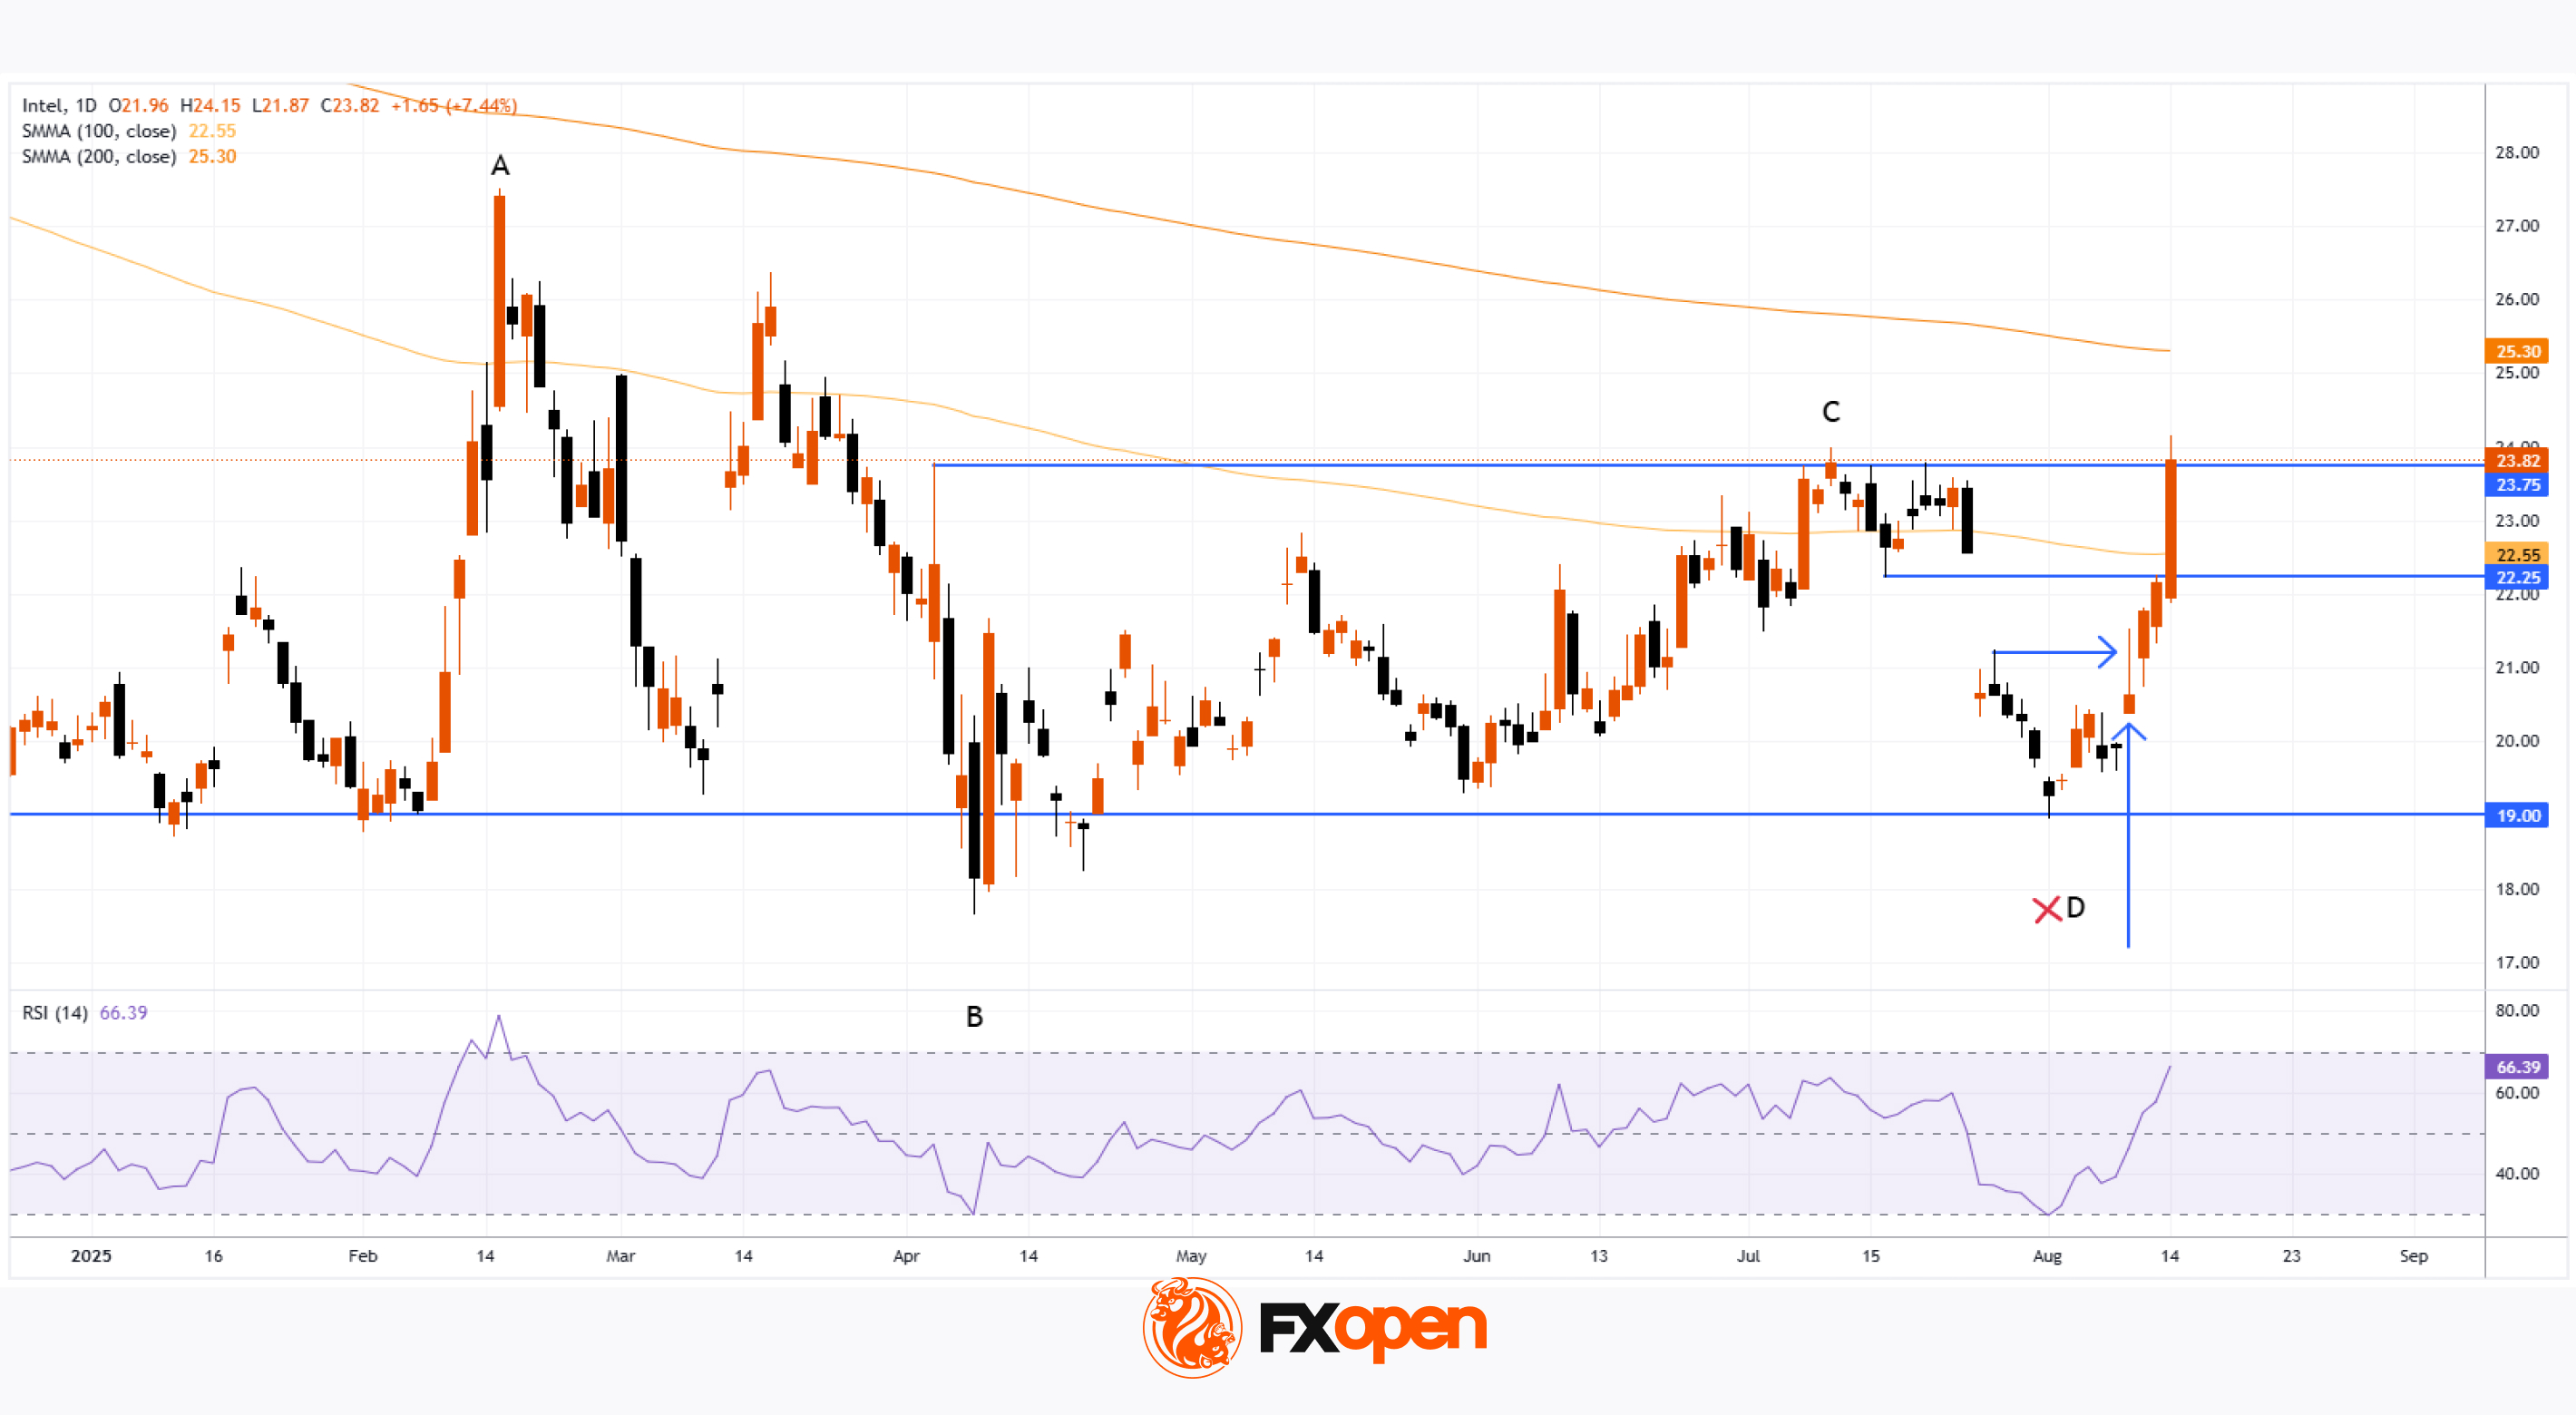
For months, INTC shares had been in a downtrend (as shown by the 100- and 200-period moving averages). However, yesterday’s sharp rally now appears capable of reversing that trend:
→ Lower highs and lows at points A, B, and C had suggested a lower low at point D. Indeed, the price came close to setting it after a disappointing quarterly earnings report on 24 July, which led to a large bearish gap at the market open on 25 July.
→ Today, we may see the price break above point C’s high, signalling a potential end to the bearish market structure.
Candlestick analysis this week highlights strong bullish momentum:
→ On Monday (indicated by an upward arrow), trading opened with a bullish gap. However, sellers became active near the upper boundary of the aforementioned bearish gap (marked with a rightward arrow), causing the candle to close with a long upper wick – a sign of weakness.
→ The next two sessions demonstrated that buying pressure persisted – on Tuesday, the stock opened with a bullish gap and rose steadily throughout the day, with Wednesday’s strong candle further confirming buyer activity.
→ Yesterday, the price confidently broke through resistance at $22.25, moving towards the $23.75 level, which could be breached today.
→ The RSI indicator is now at its highest level since February.
The INTC share chart may be signalling that the prolonged bearish market, which began in 2021, is undergoing a significant shift in sentiment. This could mark the early stages of a rally – one that would be fundamentally justified if Intel does indeed secure government backing.
Trade global index CFDs with zero commission and tight spreads. Open your FXOpen account now or learn more about trading index CFDs with FXOpen.
CFDs are complex instruments and come with a high risk of losing your money.
This article represents the opinion of the Companies operating under the FXOpen brand only. It is not to be construed as an offer, solicitation, or recommendation with respect to products and services provided by the Companies operating under the FXOpen brand, nor is it to be considered financial advice.
👍2
#intel #stockmarket #stocks #marketanalysis #MarketNews
Intel (INTC) shares surge following chip unveiling
Intel (INTC) shares jumped above $44.30 yesterday, marking a 21-month high. The rally was driven by news from CES 2026, where the company unveiled its new Core Ultra Series 3 processors (codenamed Panther Lake). These are Intel’s first consumer chips manufactured using the advanced Intel 18A process technology.
Market participants interpreted the announcement as evidence that Intel’s ambitious turnaround strategy to restore its technological leadership is gaining traction. The launch of the 18A node suggests that Intel is once again capable of competing with TSMC on the leading edge of semiconductor manufacturing.
According to media reports, several analysts have raised their price targets for INTC shares, as the new technology opens up the prospect for Intel to secure contract manufacturing orders from major players such as Nvidia and Apple.
Technical analysis of INTC shares
On 3 December, when analysing the INTC chart, we:
→ identified a broad long-term price channel;
→ highlighted the importance of the $20 level, which appeared to act as support from institutional investors;
→ noted that the line dividing the upper half of the channel into two quarters could function as resistance.
As indicated by the red arrow, this line has indeed acted as a reliable barrier to further upside. Volume analysis is particularly noteworthy: on two occasions when INTC shares rallied towards this level, we observed:
→ a surge in trading volumes;
→ followed by a subsequent pullback.
It is possible that the move above the psychological $40 level, combined with positive news flow, generated FOMO-driven demand. Institutional traders may be using this demand to lock in profits on long positions accumulated around the $20 zone.
Given the long upper wick on yesterday’s candlestick, we could assume that the identified resistance line may hold, and that a third attempt to break above it could once again result in a pullback.
Trade global index CFDs with zero commission and tight spreads*. Learn more about trading index CFDs with FXOpen. *Additional fees may apply.
CFDs are complex instruments and come with a high risk of losing money rapidly due to leverage. You should consider whether you understand how CFDs work, and whether you can afford to take the high risk of losing your money. You can find the full disclaimer here: www.fxopen.com
This article represents the opinion of the Companies operating under the FXOpen brand only. It is not to be construed as an offer, solicitation, or recommendation with respect to products and services provided by the Companies operating under the FXOpen brand, nor is it to be considered financial advice.
👍3
#intel #stockmarket #stocks #stocktrading #MarketNews #marketanalysis
Intel (INTC) Shares Surge Ahead of Earnings Release
Yesterday, Intel (INTC) shares jumped by 11% in a single session, climbing above $54.00 — a level last seen in early 2022.
The sharp rally reflects several factors:
→ the psychological impact of breaking above the $50 threshold;
→ a short squeeze effect;
→ prevailing bullish sentiment ahead of Intel’s earnings report, due to be released after the close of the main trading session today.
Optimism is being driven by:
→ Analyst commentary (notably from HSBC), suggesting that the evolution of AI from simple chatbots to autonomous agents requires massive CPU capacity, not just GPUs. This implies a potential shift in demand away from Nvidia’s products towards Intel’s server chips.
→ Successful implementation of the 18A process technology and strong prospects for Panther Lake processors. Market participants may be expecting Intel to unveil ambitious plans for 2026, signalling the company’s emergence from its recent difficulties.
Technical Analysis of INTC Shares
On the morning of 8 January, when analysing the INTC chart, we:
→ confirmed that the broad long-term channel remains valid;
→ noted that the line dividing the upper half of the channel into two quarters was showing signs of resistance, based on volume analysis;
→ considered the likelihood of a pullback.
As the chart illustrates:
→ a pullback did occur, but it was limited in scope and accompanied by below-average volumes, indicating weak selling pressure;
→ as early as 9 January, bulls viewed the stock as attractive near the trendline (shown in grey) and launched a renewed advance. This move proved successful, with the formation of a wide bullish candle closing at the highs on rising volume. Declining volume during pullbacks and increasing volume on advances is a classic hallmark of a bullish market.
As a result, INTC shares have risen by more than 130% over the past six months. However, it cannot be ruled out that the earnings release may mark a culmination of the uptrend near the upper boundary of the long-term channel.
Trade global index CFDs with zero commission and tight spreads*. Learn more about trading index CFDs with FXOpen. *Additional fees may apply.
CFDs are complex instruments and come with a high risk of losing money rapidly due to leverage. You should consider whether you understand how CFDs work, and whether you can afford to take the high risk of losing your money. You can find the full disclaimer here: www.fxopen.com
This article represents the opinion of the Companies operating under the FXOpen brand only. It is not to be construed as an offer, solicitation, or recommendation with respect to products and services provided by the Companies operating under the FXOpen brand, nor is it to be considered financial advice.
👍3
#intel #stockmarket #stocktrading #marketanalysis #MarketNews
Intel at a Crossroads: Earnings Beat Meets Technical Resistance
Intel has just delivered its strongest quarter in over fifteen years, and the market reaction says it all. Q2 2026 revenue surged 25% year-over-year to $16.1 billion, crushing the consensus estimate of $14.42 billion, while adjusted EPS of $0.42 nearly doubled the expected $0.21. The stock rallied over 12% in after-hours trading following the release.
The engine behind the beat was unmistakably AI: Intel's Data Center and AI segment jumped 59% year-over-year to $6.3 billion, with the company saying demand is now outpacing what its factories can supply. CEO Lip-Bu Tan pointed to faster production cycles and improved yields as key drivers behind the upside, while CFO Dave Zinsner said the company exceeded its guidance thanks to stronger execution.
There was a notable asterisk, however: Intel posted a GAAP net loss of $11 billion, driven by a $12.5 billion mark-to-market charge tied to its CHIPS Act agreement—a technical, non-operational hit that markets largely looked past. Looking ahead, Intel raised its Q3 guidance to a $16.3 billion midpoint, reinforcing confidence that this AI-driven turnaround has real momentum behind it.
Intel Technical Analysis
As the INTC stock chart shows, the explosive rally from March's lows near $40 to July's highs above $140 has since cooled into a broad falling wedge, with price now consolidating around the $100 level, sitting right between the 0.382 and 0.5 Fibonacci retracements of the entire move.
Bullish Scenario
Following yesterday's blowout earnings, price is testing the confluence of the descending trendline from the July highs and the 0.382 retracement near $108. A confirmed breakout above this zone would suggest buyers are back in control, opening the path toward a retest of the wedge highs near $130-$140 as fresh momentum builds following the earnings catalyst.
Bearish Scenario
Conversely, a rejection at this same trendline-Fibonacci confluence would keep the price capped within the wedge, increasing the odds of a deeper pullback toward the 0.5 retracement near $94, or even the rising trendline support closer to $85-$90 if selling pressure intensifies and the earnings pop fades.
With price wedged directly between trendline resistance and key Fibonacci support, Intel's next move looks set to be decisive. Will the earnings beat be enough to reignite the rally, or does the broader correction still have room to run?
Trade global index CFDs with zero commission and tight spreads*. Learn more about trading index CFDs with FXOpen. *Additional fees may apply.
CFDs are complex instruments and come with a high risk of losing money rapidly due to leverage. You should consider whether you understand how CFDs work, and whether you can afford to take the high risk of losing your money. You can find the full disclaimer here: www.fxopen.com
This article represents the opinion of the Companies operating under the FXOpen brand only. It is not to be construed as an offer, solicitation, or recommendation with respect to products and services provided by the Companies operating under the FXOpen brand, nor is it to be considered financial advice.
👍3
#intel #stockmarket #stocktrading #marketanalysis
Intel Analysis: Attempt to Hold Above the Profile Following a False Trend Breakout
On 8 September, Northland Securities upgraded Intel to Outperform with a price target of $120, citing a shortage of server processors, progress in the company’s business turnaround and potential benefits from its involvement in the Terafab project with Tesla and SpaceX. On the same day, reports emerged that Intel was planning to raise processor prices by around 10% from October amid rising costs and limited supply across the supply chain. The combination of higher prices and a positive rating revision is helping to sustain investor interest in Intel shares against the backdrop of strong performance across the semiconductor sector.
Intel Technical Analysis
From 30 June to 29 July, a short-term trend formed on the INTC four-hour chart. Following a decline, the market corrected higher, with the rebound forming an ascending trendline. The price subsequently broke below this trendline, but the attempted breakout was not confirmed by the RSI + MAs indicator. As a result, the price reversed direction and quickly moved through the current market profile, breaking above its upper boundary at $100.00 and is now attempting to establish itself above this level.
It is worth noting that the red resistance level at $109.00 is relatively close to the current price, while the RSI + MAs indicator currently stands at 75, 56 and 51. The RSI has already entered overbought territory, while the moving averages have yet to leave the neutral zone, making the current breakout attempt look questionable. If the market produces another false breakout, a return into the market profile could bring several important levels into play, including the Point of Control (POC) at $92.00 and the lower boundary of the profile at $86.00. Below this level, and relatively close to it, lies the green support level around $82.00.
Key Takeaways
The RSI being in overbought territory while the moving averages remain in the neutral zone casts doubt on a potential breakout of the profile. The short distance to the red resistance level could also strengthen the current resistance zone. Investor reaction to the planned price increase in October could provide an additional factor influencing the stock’s price action.
Trade global index CFDs with zero commission and tight spreads*. Learn more about trading index CFDs with FXOpen. *Additional fees may apply.
CFDs are complex instruments and come with a high risk of losing money rapidly due to leverage. You should consider whether you understand how CFDs work, and whether you can afford to take the high risk of losing your money. You can find the full disclaimer here: www.fxopen.com
This article represents the opinion of the Companies operating under the FXOpen brand only. It is not to be construed as an offer, solicitation, or recommendation with respect to products and services provided by the Companies operating under the FXOpen brand, nor is it to be considered financial advice.
👍3