
GOLD PRICE CORRECTING GAINS WHILE CRUDE OIL PRICE APPROACHING BREAKOUT
Gold price rallied recently to a new 8-year high above $1,740 and it is currently correcting lower. Conversely, crude oil price is now showing signs of a bullish breakout above $27.00.
❗️Important Takeaways for Gold and Oil❗️
📊Gold price surged towards the $1,750 level and it is currently correcting against the US Dollar.
📊There was a break below a key contracting triangle with support near $1,720 on the hourly chart of gold.
📊Crude oil price is currently showing a few recovery signs above the $25.00 support.
📊There is a major bearish trend line forming with resistance near $26.85 on the hourly chart of XTI/USD.
Read more on #FXOpen blog: https://bit.ly/2VePI2K
#XTIUSD #GLD #OIL #forex
#ForexAnalysis
GOLD PRICE AND CRUDE OIL PRICE TRADING NEAR CRUCIAL JUNCTURE
Gold price rallied to a new multi-year high above $1,775 before correcting lower. Crude oil price is currently recovering from $37.15, but it is facing many hurdles.
❗Important Takeaways for Gold and Oil❗
📊Gold price traded to a new multi-year high at $1,779 before correcting lower against the US Dollar.
📊There is a major bullish trend line forming with support near $1,758 on the hourly chart of gold.
📊Crude oil price started a fresh increase after trading as low as $37.15.
📊There was a break above a key bearish trend line with resistance near $38.50 on the hourly chart of XTI/USD.
Read more on FXOpen blog
#XTIUSD #GOLD #Stayhomeandtrade #OIL #forex
#ForexAnalysis
GOLD PRICE SETTLES ABOVE $1,800 WHILE OIL PRICE TURNS RED
Gold price rallied to a new multi-year high above $1,815 before correcting lower. Crude oil price is currently declining and trading in a bearish zone below $40.00.
❗Important Takeaways for Gold and Oil❗
📊Gold price extended its upward move and traded a new multi-year high at $1,817 against the US Dollar.
📊There is a crucial bullish trend line forming with support near $1,795 on the hourly chart of gold.
📊Crude oil price started a fresh decline after it failed to gain strength above $41.00.
📊There was a break below a major bullish trend line with support near $40.65 on the hourly chart of XTI/USD.
#XTIUSD #OIL #Stayhomeandtrade #GOLD
#ForexAnalysis
GOLD PRICE COULD DECLINE WHILE OIL PRICE AIMS MORE UPSIDES
Gold price traded to a new multi-year high towards $1,818 before correcting lower. Crude oil price is currently rising and it might continue to climb as long as it is above $40.00.
❗Important Takeaways for Gold and Oil❗
📊Gold price failed on more than two occasions to clear the $1,815 resistance against the US Dollar.
📊There was a break below a connecting bullish trend line with support near $1,800 on the hourly chart of gold.
📊Crude oil price traded to a new weekly high at $41.42 and it is currently correcting gains.
📊There is a key bullish trend line forming with support near $40.45 on the hourly chart of XTI/USD.
Read more on FXOpen blog
#GOLD #XTIUSD #Stayhomeandtrade #OIL
#ForexAnalysis
GOLD PRICE AND CRUDE OIL PRICE COULD ACCELERATE FURTHER
Gold price gained traction and surged above the $1,880 resistance. Similarly, crude oil price is showing positive signs above $40.00 and it might continue to rise.
❗️Important Takeaways for Gold and Oil❗️
📊Gold price extended its rise and traded to a new multi-year high above $1,885 against the US Dollar.
📊There is a major bullish trend line forming with support near $1,830 on the daily chart of gold.
📊Crude oil price remained in a positive zone and it surpassed the $40.00 resistance.
📊There was a break above a key bearish trend line with resistance near $33.50 on the daily chart of XTI/USD.
Read more on FXOpen Blog
#XTIUSD #GOLD #OIL
#FinancialMarketNews
GOLD BULLISH MOMENTUM POISED TO CONTINUE
Gold is on every investor’s mind these days – it closed the week above $1900, a tremendous milestone for the only form of money that survived for thousands of years. Investors owning gold as a long-term investment or only as a mean to diversify their portfolio feel vindicated.
Gold and bonds fulfilled their role in protecting investments during the Great Financial Crisis of 2008 and 2009, and also during the current COVID-19 pandemic. The rise in the price of gold reflects investors’ uncertainty about the future, with no prospects of a solution to the health crisis.
From a technical perspective, gold is poised to make a new high. After consolidating for many years around the $1000 level, it broke higher in the summer of 2019.
Will the price of gold make a new high? It really does not matter anymore, as gold proved, once again, why it is the safest investment of them all.
Read more on FXOpen blog
#gold #XTIUSD
#forexanalysis
GOLD PRICE COULD EXTEND DECLINE WHILE OIL PRICE EYES NEXT BREAK
Gold price started a strong decline after trading close to $2,075. Crude oil price is currently consolidating in a range and preparing for the next key break.
❗️Important Takeaways for Gold and Oil❗️
📊Gold price traded to a new all-time high above $2,070 before correcting lower against the US Dollar.
📊There is a key bearish trend line forming with resistance near $1,970 on the hourly chart of gold.
📊Crude oil price is currently trading nicely above the $42.00 support zone.
📊There is a major bullish trend line forming with support near $42.30 on the hourly chart of XTI/USD.
#XTIUSD #OIL #forex #traiding
#forexanalysis
GOLD PRICE AND OIL PRICE EYE NEXT KEY BULLISH BREAK
Gold price is forming a new support base above the $1,900 level. Crude oil price is currently rising and eyeing an upside break above the $43.30 resistance.
❗️Important Takeaways for Gold and Oil❗️
📊Gold price declined below the $1,950 level, but it found support above $1,900 against the US Dollar.
📊There is a key bearish trend line forming with resistance near $1,942 on the hourly chart of gold.
📊Crude oil price is currently trading in a positive zone above the $42.40 support zone.
📊There is a major declining channel forming with resistance near $43.30 on the hourly chart of XTI/USD.
#XTIUSD #gold #oil
#forexanalysis
GOLD PRICE AND OIL PRICE FACING KEY HURDLES
Gold price is facing a strong resistance near the $1,950 and $1,960 levels. Crude oil price is currently declining and it may perhaps continue lower below $37.00.
❗️Important Takeaways for Gold and Oil❗️
📊Gold price started a decent recovery from $1,910, but struggled near $1,960 against the US Dollar.
📊There is a key rising channel forming with support near $1,938 on the hourly chart of gold.
📊Crude oil price is currently sliding and it is trading below the $40.00 support zone.
📊There is a major bearish trend line forming with resistance near $37.70 on the hourly chart of XTI/USD.
#XTIUSD #gold #oil
#forexanalysis
GOLD PRICE AND OIL PRICE SIGNALING MORE UPSIDES
Gold price started a fresh increase from the $1,870 support and climbed above $1,900. Crude oil price is currently rising and trading well above the $40.00 pivot level.
❗️Important Takeaways for Gold and Oil❗️
📊Gold price started a strong upward move above the $1,880 and $1,900 levels against the US Dollar.
📊There was a break above a key rising channel with resistance near $1,902 on the hourly chart of gold.
📊Crude oil price climbed higher steadily after it broke the $38.80 and $40.00 resistance levels.
📊There is a major bullish trend line forming with support near $41.00 on the hourly chart of XTI/USD.
#XTIUSD #gold #oil
#FinancialMarketNews
OIL PRICE – CAN IT MOVE EVEN HIGHER
Oil made history in 2020. For the first time ever, it settled into negative territory as investors responded to the coronavirus demand shock.
In April, it closed around -$40, sending deflationary waves throughout the word. But what followed was equally impressive. The bounce from -$40 to +$40 is nothing short of impressive.
📊Oil and Its Share in the Energy Mix
The chart above shows the oil’s share in the energy mix and how it evolved in the last century. In green, we see the modern renewables, that include all uses with the exception of biomass. The trend is clear and reflects the direction the world is heading – a greener future with more emphasis on modern renewable technologies to satisfy the world’s energetic need
Undersupplied Oil Market
After the coronavirus pandemic reached the Western world, demand for oil simply collapsed. It caused the decline in prices described earlier.
#XTIUSD
#forexanalysis
GOLD PRICE AND OIL PRICE APPROACHING NEXT KEY BREAK
Gold price started a fresh decline after it failed to clear the $1,930 resistance. Crude oil price is currently holding the $40.50 support and eyeing the next key break.
❗️Important Takeaways for Gold and Oil❗️
📊Gold price extended its rise towards $1,930 before correcting lower against the US Dollar.
📊There is a major bullish trend line forming with support near $1,900 on the hourly chart of gold.
📊Crude oil price formed a strong support near the $39.75 level before climbing higher.
📊There is a key bearish trend line forming with resistance near $40.80 on the hourly chart of XTI/USD.
#XTIUSD #XAUUSD #gold
#Forexanalysis
GOLD PRICE AND OIL PRICE COULD CORRECT RECENT GAINS
Gold price started a fresh increase and surged towards the $1,950 resistance. Crude oil price also gained pace and it is currently correcting lower from $39.50.
❗️Important Takeaways for Gold and Oil❗️
📊Gold price rallied towards the $1,950 resistance and currently correcting gains against the US Dollar.
📊Earlier, there was a break above a major contracting triangle with resistance near $1,910 on the hourly chart of gold.
📊Crude oil price seems to be facing a strong resistance near $39.50 and $40.00.
📊There was a break below a key bullish trend line with support near $39.00 on the hourly chart of XTI/USD.
#xauusd #Xtiusd #gold #oil
#ForexAnalysis
GOLD PRICE AT RISK WHILE OIL PRICE COULD RISE FURTHER
Gold price failed to clear the $1,900 resistance and declined towards $1,855. Conversely, crude oil price is rising and it is showing positive signs above $41.50.
❗️Important Takeaways for Gold and Oil❗️
📊Gold price declined below the $1,880 and $1,865 support levels against the US Dollar.
📊There is a major bearish trend line forming with resistance near $1,878 on the hourly chart of gold.
📊Crude oil price is currently consolidating gains above the $41.00 and $41.50 support levels.
📊There is a key bullish trend line forming with support near $41.60 on the hourly chart of XTI/USD.
#XTIUSD #XAUUSD
#ForexAnalysis
GOLD PRICE CONSOLIDATES LOSSES WHILE OIL PRICE GAINS TRACTION
Gold price declined heavily below $1,850 and tested the $1,800 support zone. Conversely, crude oil price gained bullish momentum above $42.00 and it even traded to a new multi-month high.
❗️Important Takeaways for Gold and Oil❗️
📊Gold price declined below the $1,850 and $1,835 support levels against the US Dollar.
📊There is a key contracting triangle forming with resistance near $1,812 on the hourly chart of gold.
📊Crude oil price is currently correcting gains after trading close to the $46.50 level.
📊There is a major contracting triangle forming with resistance near $45.35 on the hourly chart of XTI/USD.
#XTIUSD #XAUUSD
#oilprices #oilindustry #commodities #XTIUSD #MarketNews
Oil Prices: April Could Be the Worst Month in Three and a Half Years
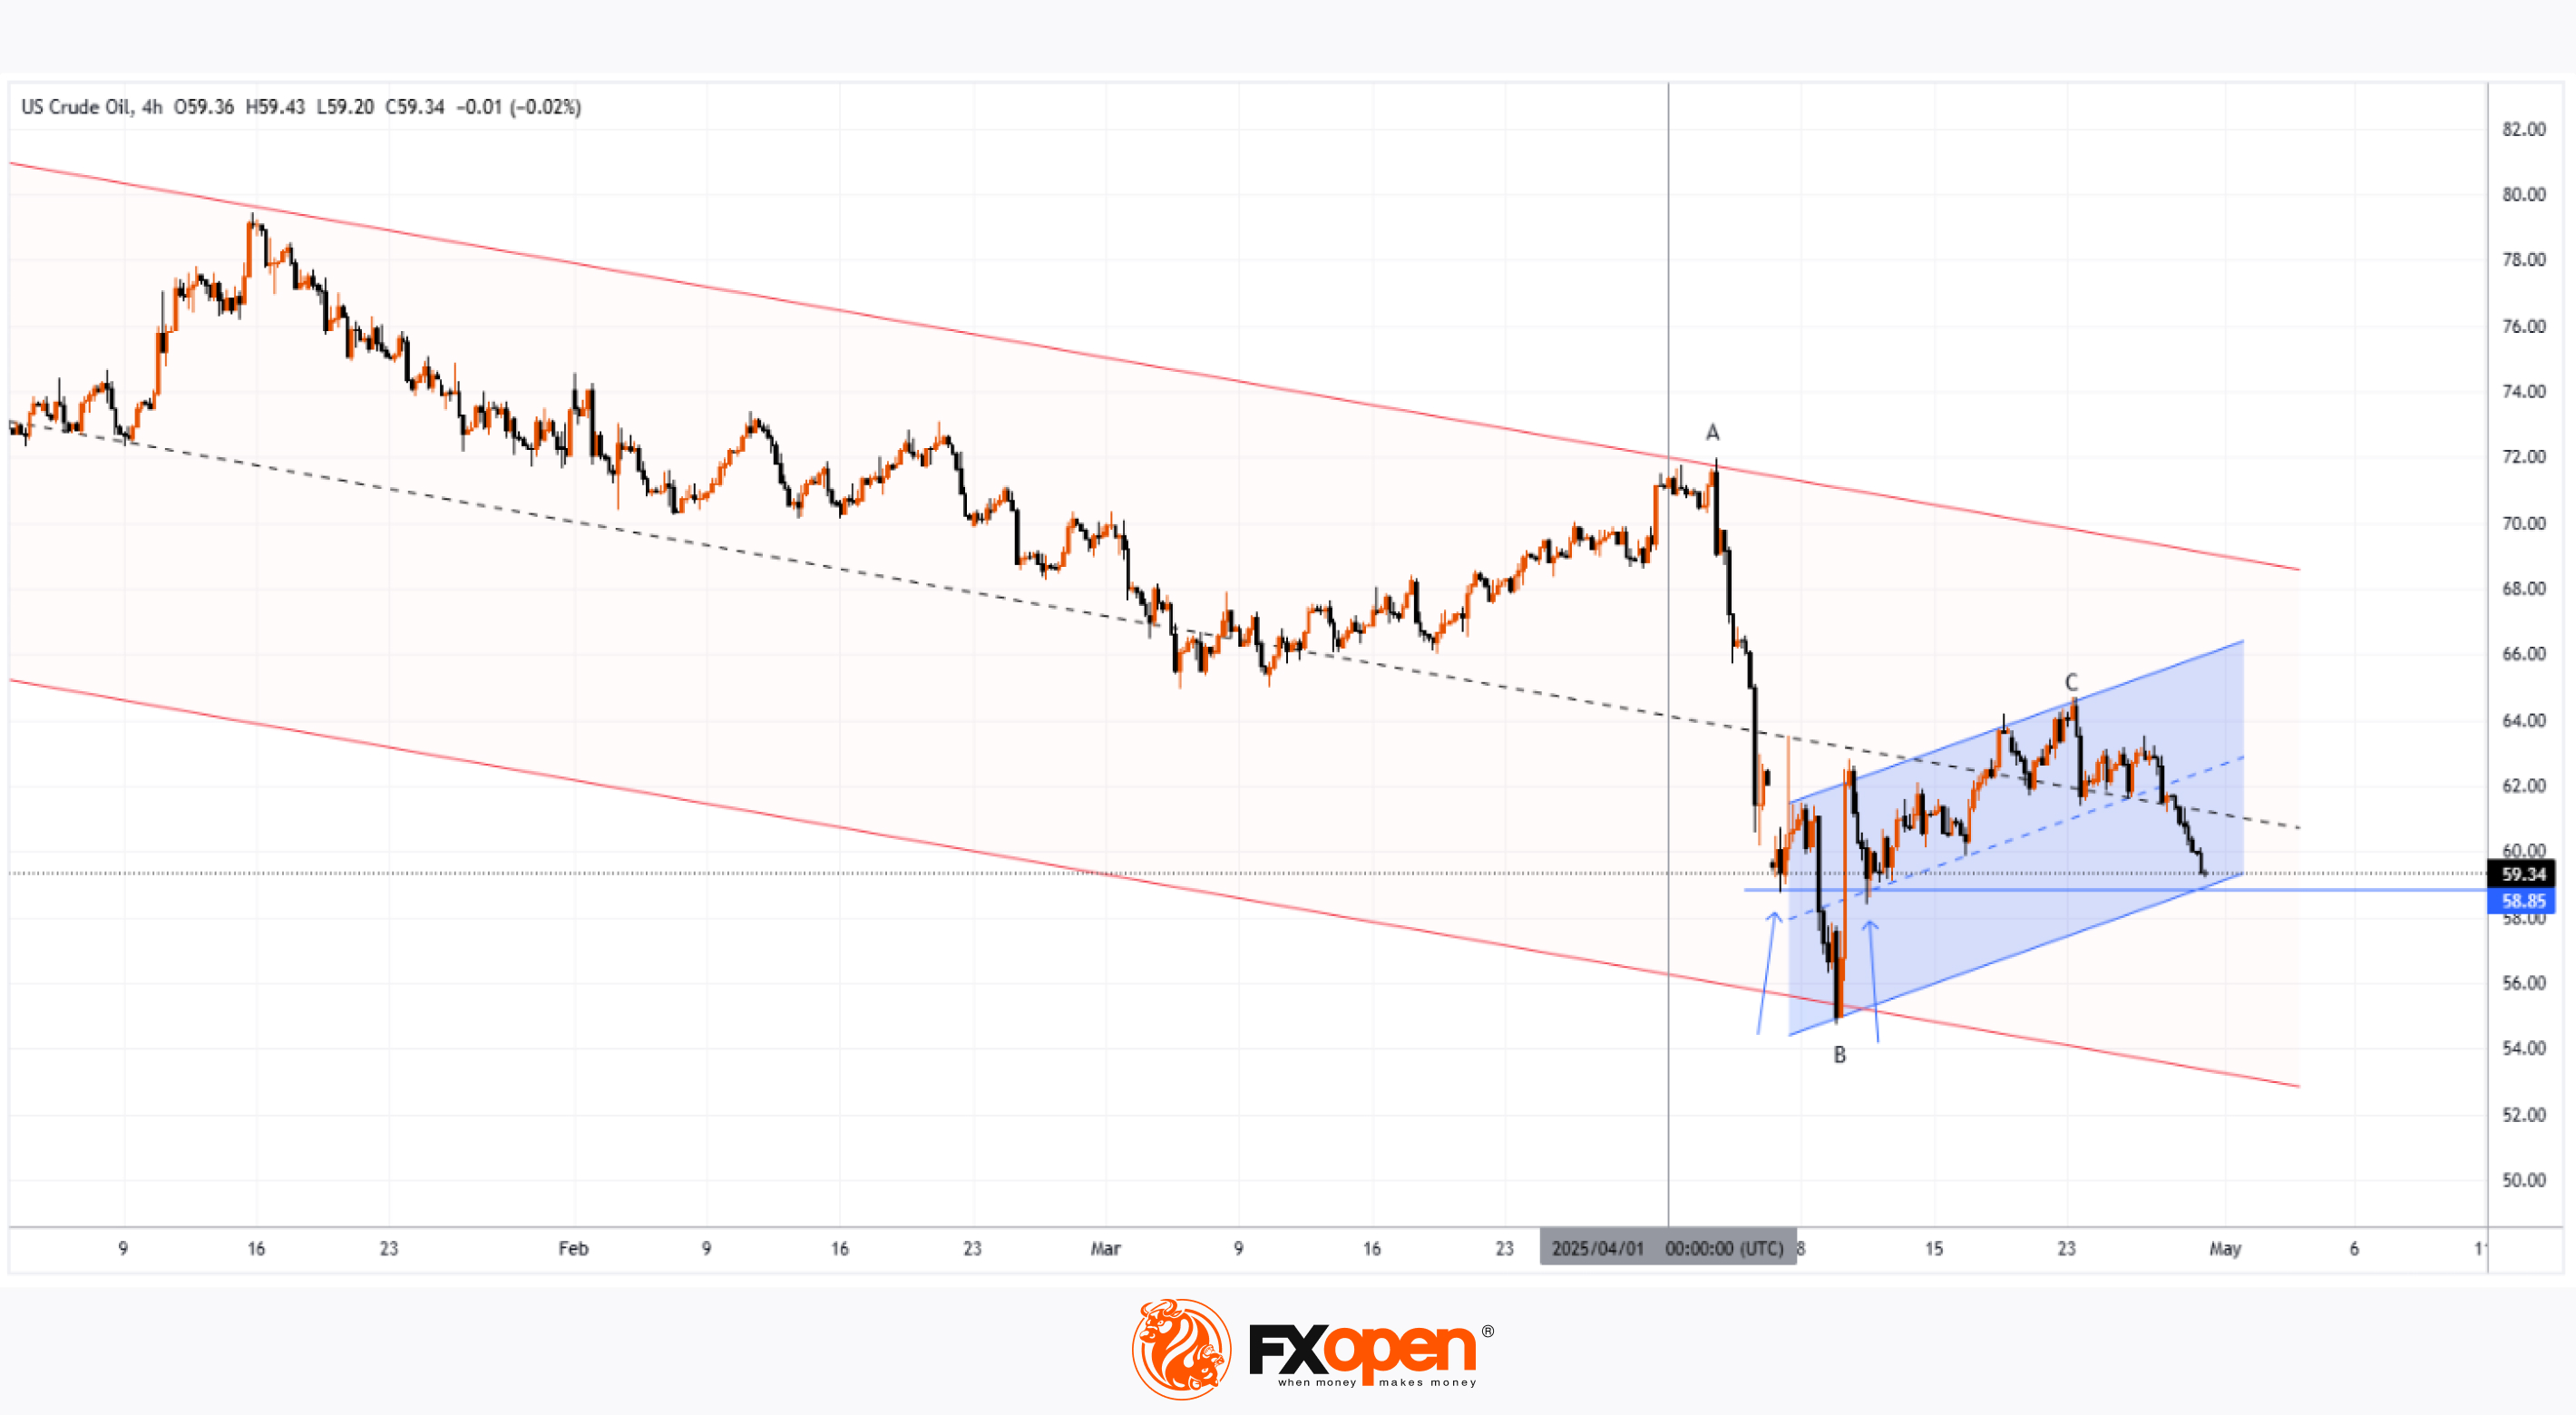
As the XTI/USD chart shows:
→ at the beginning of April, WTI crude was trading above $71 per barrel;
→ this morning, on the last day of the month, the price has fallen below $60.
The overall decline may reach 16% — the worst monthly performance since November 2021.
Why Is Oil Falling?
The primary driver behind the sharp drop in oil prices earlier this month was the introduction of new US tariffs, particularly targeting China and the EU. This raised concerns that a potential global trade war could slow economic growth and, in turn, reduce global oil demand.
According to a Reuters poll, the tariffs imposed by Trump have made a global recession in 2025 a realistic risk.
In addition, growing attention is being paid to OPEC+ and its plans to increase oil production. The next meeting is scheduled for 5 May.
Technical Analysis of the XTI/USD Chart
Oil price fluctuations in 2025 have formed a descending channel (highlighted in red), with lower highs and lower lows reflecting continued bearish sentiment.
Bulls may hope for support to emerge around the $58.85 level, as:
→ this has acted as support before (as indicated by arrows);
→ this level aligns with the lower boundary of a local upward trend (shown in blue), which formed after news broke that Trump had postponed the implementation of some tariffs — triggering a sharp rebound in oil prices from the 9 April low.
Nevertheless, the broader structure remains bearish: the rise towards point C appears to be a corrective recovery following the impulse drop from A to B. Given the potential impact of upcoming news — including statements from the White House and OPEC+ decisions — a bearish breakout below the blue channel cannot be ruled out.
Start trading commodities with tight spreads. Open your trading account now or learn more about trading commodity CFDs with FXOpen.
CFDs are complex instruments and come with a high risk of losing your money.
This article represents the opinion of the Companies operating under the FXOpen brand only. It is not to be construed as an offer, solicitation, or recommendation with respect to products and services provided by the Companies operating under the FXOpen brand, nor is it to be considered financial advice.
👍3
#xtiusd #brentoil #commodities #oilprices #marketanalysis
XTI/USD Chart Analysis: Oil Price Falls 2.8% from This Week’s High
As the XTI/USD chart shows, this morning (27 August) WTI crude oil is trading around the $63 level, although on Monday it climbed above $64.70. This means the price has retreated by approximately 2.8% from this week’s high.
The bearish momentum may be linked to the market’s reassessment of geopolitical risks. According to Reuters, US Special Representative Steve Witkoff stated that:
→ he will meet with a Ukrainian delegation in New York this week;
→ the US administration is also in talks with Russia, seeking to bring the war to an end.
He also noted that Washington is striving for de-escalation in the Middle East. We could assume that market participants are pricing in the possibility that these efforts could lead to the easing of sanctions and reduce risks and restrictions in global oil trade.
Technical Analysis of the XTI/USD Chart
On 19 August, we highlighted that:
→ the August downtrend remained intact, though it appeared to be weakening;
→ bulls might exploit this situation and attempt to launch an attack.
Indeed, since then the price rallied to a peak near $64.80, forming an upward trajectory shown by the orange lines. However, at the start of this week, momentum shifted back to the bears, as evidenced by a series of bearish signals on the chart:
→ Yesterday, bulls attempted to resume the upward trend from the lower orange boundary but failed – this was reflected in a candlestick with a long upper shadow, touching the $64 level before reversing downwards.
→ Bears then built on this success, pushing the price below $63.50 (where the lower orange line had been positioned).
→ This morning, WTI is trading close to weekly lows, highlighting the bulls’ inability to counter the pressure.
As a result, bears have driven the price back into the descending channel that has been in place since the start of the month. Given the above, we could assume that the market may continue to develop bearish dynamics within this downward channel – with WTI potentially heading towards the red median line.
The forthcoming oil inventory report (due today at 15:30 GMT+3) might have a significant influence on how the situation unfolds.
Start trading commodities with tight spreads. Open your trading account now or learn more about trading commodity CFDs with FXOpen.
CFDs are complex instruments and come with a high risk of losing your money.
This article represents the opinion of the Companies operating under the FXOpen brand only. It is not to be construed as an offer, solicitation, or recommendation with respect to products and services provided by the Companies operating under the FXOpen brand, nor is it to be considered financial advice.
👍2
#oilprices #oilindustry #XTIUSD #commodities #MarketNews
XTI/USD Chart Analysis: Oil Price Volatility on the Rise
Events in Venezuela over the weekend have led to a sharp increase in oil price volatility following the market open. As the chart shows, during the European session the ATR indicator rose to levels last seen before the start of the Christmas period.
It is possible that the opening of US trading could further increase price swings, with the trend potentially developing in either direction:
▪️Bearish scenario: if American companies gain access to Venezuela’s oil reserves (both in the ground and in storage facilities), this could lead to an increase in supply on the global market.
▪️Bullish scenario: risks include reactions from China, OPEC+, as well as the possibility of a guerrilla warfare scenario and other difficult-to-predict developments.
At present, WTI crude oil price is holding near the median of the descending channel (highlighted in red). Note the long lower wicks forming when the price touches the lower boundary of the channel, indicating a sharp activation of demand whenever the price falls below the 26 December low of around $56.60 per barrel.
This behaviour resembles a bear trap and could trigger a bullish impulse, potentially testing the upper boundary of the channel.
Start trading commodities with tight spreads*. Learn more about trading commodity CFDs with FXOpen. *Additional fees may apply.
CFDs are complex instruments and come with a high risk of losing money rapidly due to leverage. You should consider whether you understand how CFDs work, and whether you can afford to take the high risk of losing your money. You can find the full disclaimer here: www.fxopen.com
This article represents the opinion of the Companies operating under the FXOpen brand only. It is not to be construed as an offer, solicitation, or recommendation with respect to products and services provided by the Companies operating under the FXOpen brand, nor is it to be considered financial advice.
👍2