
#TradingEducation
☁️The Sky-High Profits with Ichimoku Cloud
😎Hey guys! Here's yet another indicator of the week. Let’s talk about the Ichimoku Cloud. Ichimoku Cloud (also known as Ichimoku Kinko Hyo) is a popular technical indicator developed in Japan. Translated into English, the indicator's name is "One glance equilibrium chart," as traders can derive a variety of information from it.
While this indicator may seem challenging to understand, it can tell a lot, and there is no need for additional indicators.
🤔What are the elements of the Ichimoku Cloud?
The Ichimoku Cloud consists of four elements, which you can see below. All of them have alternative Japanese names that we mentioned in brackets.
🔹Cloud (Kumo) – a space between the 2 MAs that is usually shaded on the chart;
🔹Base line (Kijun-sen) – long-term MA (usually 26 periods);
🔹Turning line (Tenkan-sen) – short-term MA (usually nine periods);
🔹Lagging line (Chinkou Span) – closing price of the current candle, which has been moved 26 periods back.
However, there is no need to learn them by heart. You can read about the details on the FBS website. A crossover of different elements can generate good trade signals.
🔈Let's look at the strategy you can use with the Ichimoku Cloud. We will consider a “Sell” scenario and a daily timeframe.
1️⃣ After the price breaks below the cloud, you can consider opening a sell order.
2️⃣ You enter the market on the next bearish candlestick.
3️⃣ You can place a Stop Loss above the recent high.
4️⃣ You can close the trade after a crossover of the Baseline and the Turning line.
💚Now you know one easy trading strategy with the Ichimoku Cloud! See, this indicator is not that complicated!
Leave a reaction if you like to use it in trading!
☁️The Sky-High Profits with Ichimoku Cloud
😎Hey guys! Here's yet another indicator of the week. Let’s talk about the Ichimoku Cloud. Ichimoku Cloud (also known as Ichimoku Kinko Hyo) is a popular technical indicator developed in Japan. Translated into English, the indicator's name is "One glance equilibrium chart," as traders can derive a variety of information from it.
While this indicator may seem challenging to understand, it can tell a lot, and there is no need for additional indicators.
🤔What are the elements of the Ichimoku Cloud?
The Ichimoku Cloud consists of four elements, which you can see below. All of them have alternative Japanese names that we mentioned in brackets.
🔹Cloud (Kumo) – a space between the 2 MAs that is usually shaded on the chart;
🔹Base line (Kijun-sen) – long-term MA (usually 26 periods);
🔹Turning line (Tenkan-sen) – short-term MA (usually nine periods);
🔹Lagging line (Chinkou Span) – closing price of the current candle, which has been moved 26 periods back.
However, there is no need to learn them by heart. You can read about the details on the FBS website. A crossover of different elements can generate good trade signals.
🔈Let's look at the strategy you can use with the Ichimoku Cloud. We will consider a “Sell” scenario and a daily timeframe.
1️⃣ After the price breaks below the cloud, you can consider opening a sell order.
2️⃣ You enter the market on the next bearish candlestick.
3️⃣ You can place a Stop Loss above the recent high.
4️⃣ You can close the trade after a crossover of the Baseline and the Turning line.
💚Now you know one easy trading strategy with the Ichimoku Cloud! See, this indicator is not that complicated!
Leave a reaction if you like to use it in trading!

👍80❤34🔥6🥰6👎3
🇺🇸#USD #Interesting
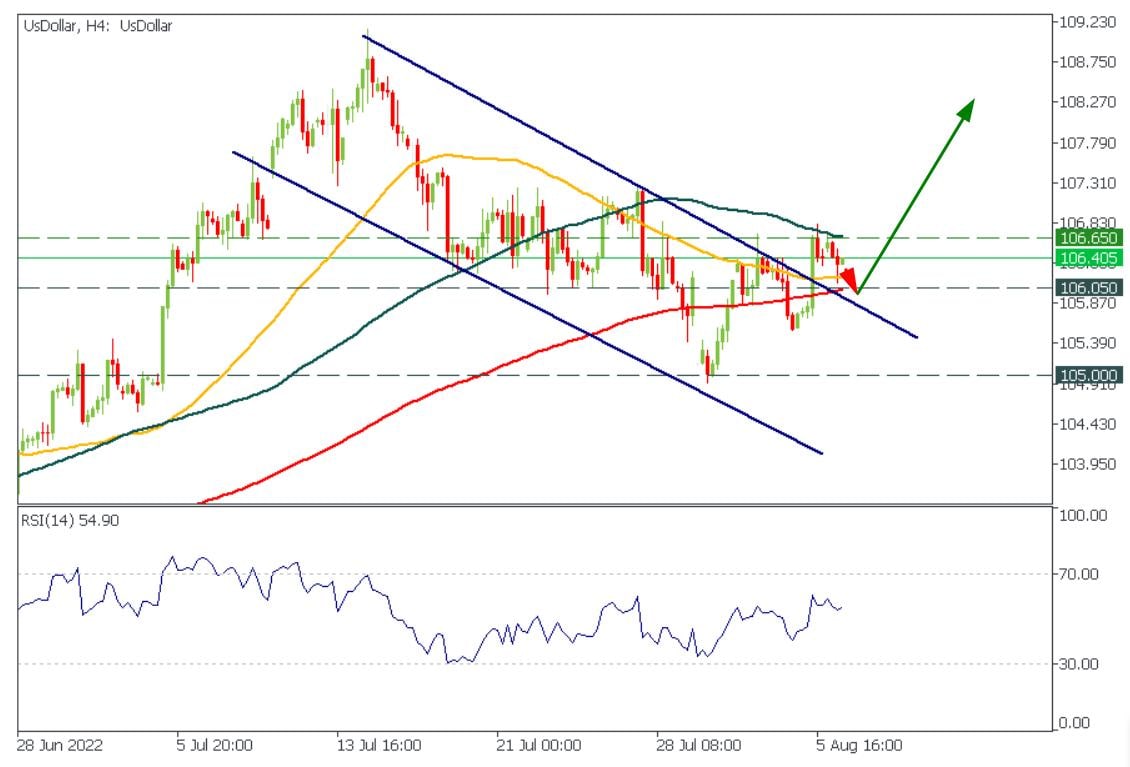
🔥The US dollar is getting ready for a pump!
On Friday, the US dollar index (DXY) broke through the upper border of the bullish flag, and today the price retested the breakout!
It means that during this week, we might see a significant plunge in EURUSD, XAUUSD, and GBPUSD.
On the other hand, USDJPY might work the best for bulls!
Key levels for the US dollar index:
Support - 106.05
Resistance - 106.65
Which pair should we look at closely? Write in the comments!
🔥The US dollar is getting ready for a pump!
On Friday, the US dollar index (DXY) broke through the upper border of the bullish flag, and today the price retested the breakout!
It means that during this week, we might see a significant plunge in EURUSD, XAUUSD, and GBPUSD.
On the other hand, USDJPY might work the best for bulls!
Key levels for the US dollar index:
Support - 106.05
Resistance - 106.65
Which pair should we look at closely? Write in the comments!
🔥20👍9👏2
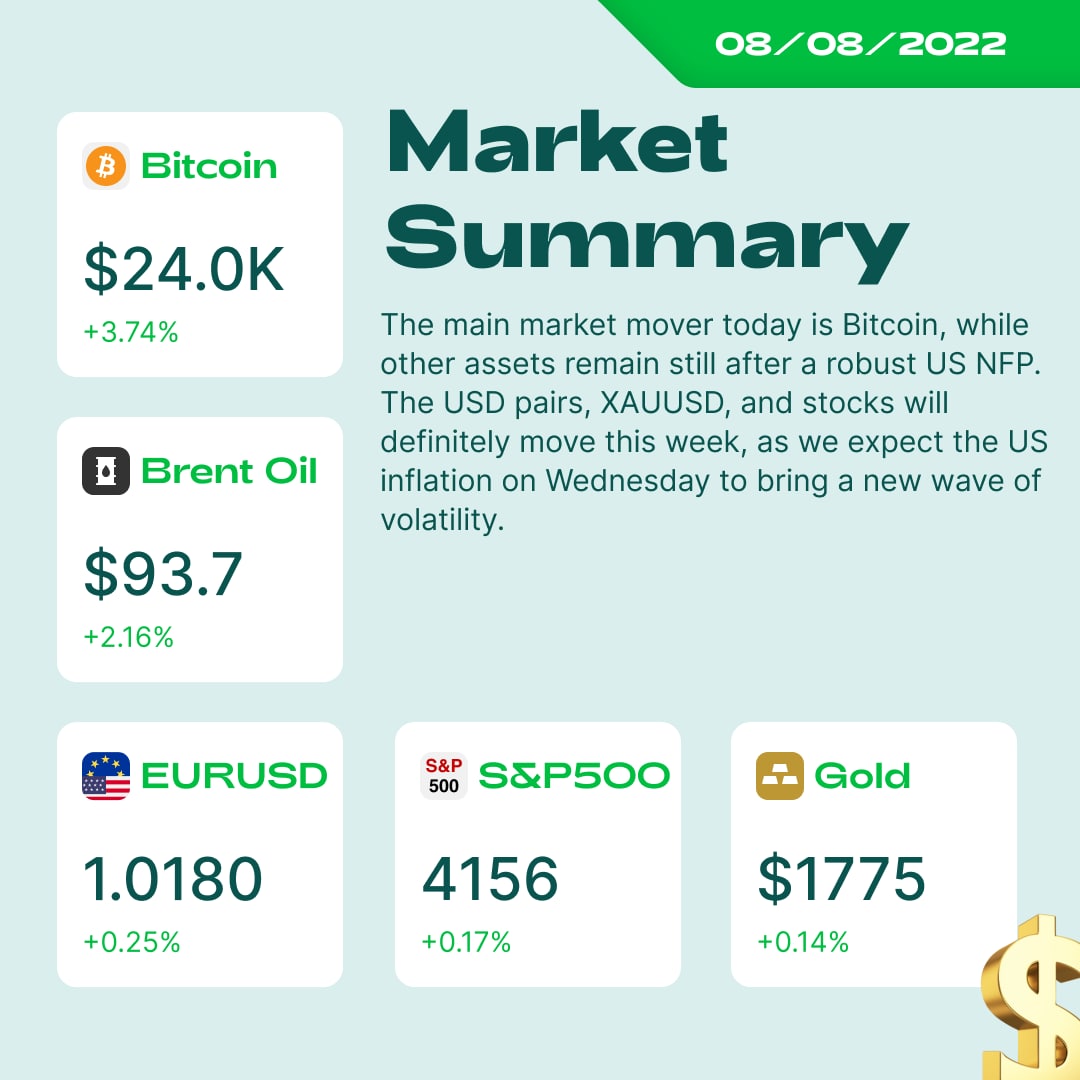
💥Good Monday, beautiful people! Let’s review the main trends in the market today!
📈On Friday, US NFP came out at 528K (vs. the forecast of 250K), the average hourly earnings increased by 0.5% (vs. 0.5% expected), and the unemployment rate reached 3.5% (vs. the consensus of 3.6%). Robust US employment data raised expectations for more aggressive Fed monetary tightening, pushing the US Dollar.
🧐The US bond curve is close to the most inverted level since 2000. Does it mean that investors will foresee a recession ahead? Let’s wait for US inflation on Wednesday for more market swings.
💪Bitcoin has started the week with gains. The famous crypto has jumped 3.66% already. Ethereum has also strengthened with a 3% rise.
🙌The price of oil erased previous losses. XTIUSD gained towards $90, and XBRUSD moved closer to $95. The supply/demand concerns are critical drivers for the commodity.
🗣According to ECB’s Kazaks, the ECB is open to discussions on more significant rate hikes, and September’s one needs to be quite substantial.
👀China continues military drills around Taiwan this week. According to China’s foreign ministry, Taiwan is part of China, and conducting regular military exercises is open and transparent in its waters.
😍Today, we will see the earnings reports by Biontech at 13:00 GMT+3 and Novavax at 23:00 GMT+3. Get ready to trade the stocks of these companies!
Are you excited for this week? Leave a reaction for more market signals! 💵
📈On Friday, US NFP came out at 528K (vs. the forecast of 250K), the average hourly earnings increased by 0.5% (vs. 0.5% expected), and the unemployment rate reached 3.5% (vs. the consensus of 3.6%). Robust US employment data raised expectations for more aggressive Fed monetary tightening, pushing the US Dollar.
🧐The US bond curve is close to the most inverted level since 2000. Does it mean that investors will foresee a recession ahead? Let’s wait for US inflation on Wednesday for more market swings.
💪Bitcoin has started the week with gains. The famous crypto has jumped 3.66% already. Ethereum has also strengthened with a 3% rise.
🙌The price of oil erased previous losses. XTIUSD gained towards $90, and XBRUSD moved closer to $95. The supply/demand concerns are critical drivers for the commodity.
🗣According to ECB’s Kazaks, the ECB is open to discussions on more significant rate hikes, and September’s one needs to be quite substantial.
👀China continues military drills around Taiwan this week. According to China’s foreign ministry, Taiwan is part of China, and conducting regular military exercises is open and transparent in its waters.
😍Today, we will see the earnings reports by Biontech at 13:00 GMT+3 and Novavax at 23:00 GMT+3. Get ready to trade the stocks of these companies!
Are you excited for this week? Leave a reaction for more market signals! 💵
👍20🔥16🥰6
🥇#gold
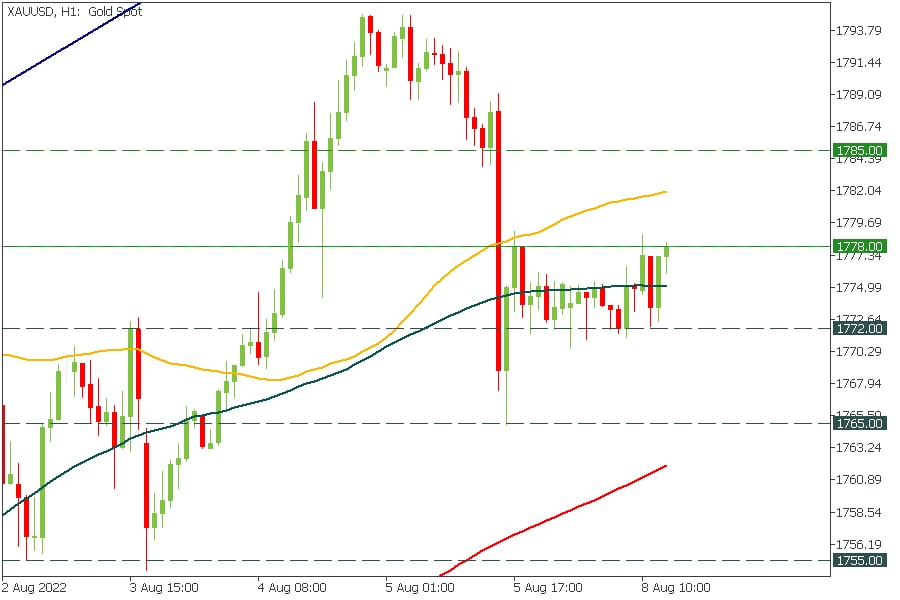
💥Patience is everything for gold traders!
The price is consolidating between 1778 and 1772!
The breakout of the upper side will send gold to 1785! While the breakout of the lower side will push the price to 1765!
Wait for the impulse and join the trend!
*Breakout is valid only after the H1 candle closes below/lower the key level.
🟩START TRADING🟩
💥Patience is everything for gold traders!
The price is consolidating between 1778 and 1772!
The breakout of the upper side will send gold to 1785! While the breakout of the lower side will push the price to 1765!
Wait for the impulse and join the trend!
*Breakout is valid only after the H1 candle closes below/lower the key level.
🟩START TRADING🟩
👍47🔥11❤7👏1
🇺🇸📈#US100 #Stocks
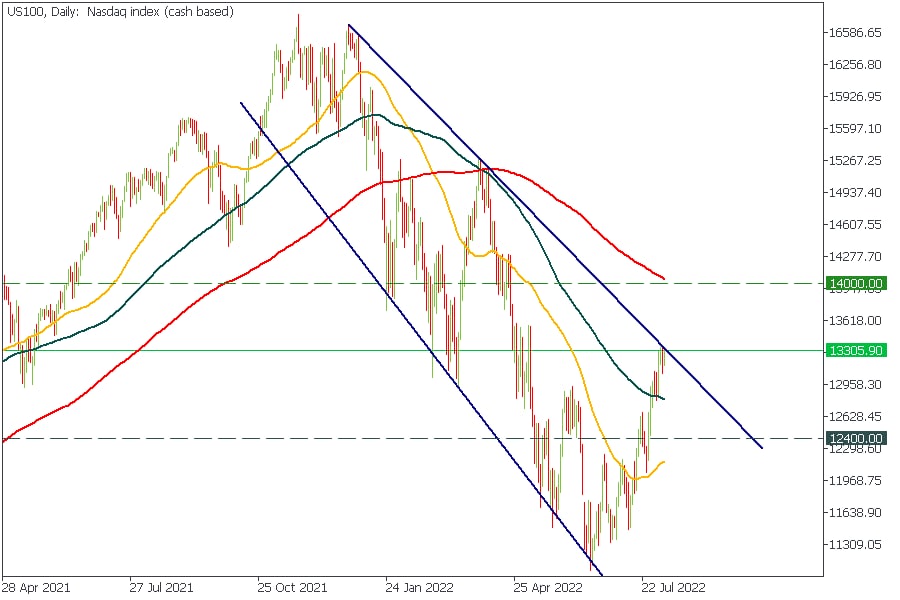
💥NASDAQ (US100) reached the resistance border of the descending channel!
If the price breaks through the line, buyers will bring the index to 14 000! Otherwise, bears might drag the price to 12 400!
🟩START TRADING🟩
💥NASDAQ (US100) reached the resistance border of the descending channel!
If the price breaks through the line, buyers will bring the index to 14 000! Otherwise, bears might drag the price to 12 400!
🟩START TRADING🟩
👍20🔥6❤2🥰2
🇪🇺🇺🇸#EURUSD
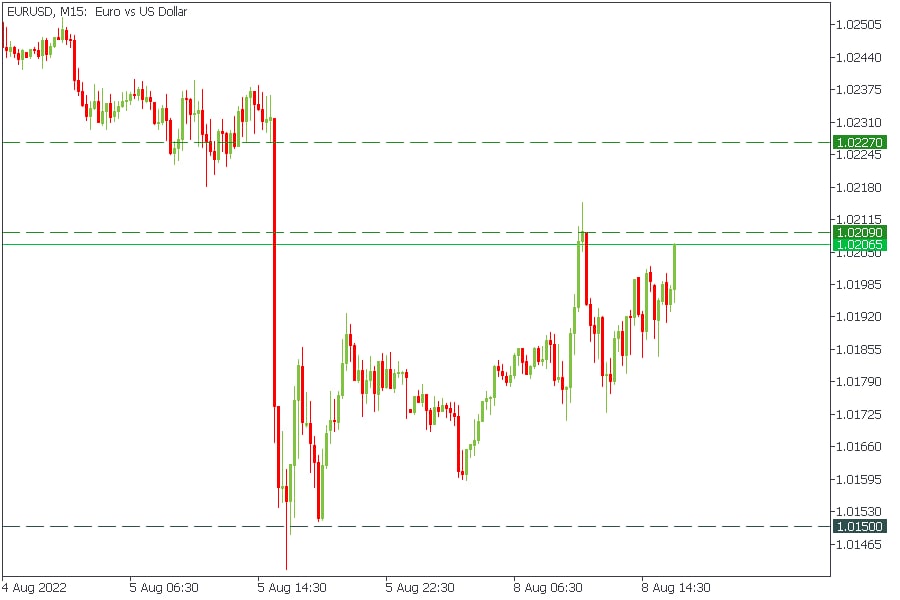
💥If the price breaks above 1.0209, consider buying with the target at 1.0270!
However, if EURUSD closes M15 candle below 1.0209, sell the pair with the target 1.0150!
🟩START TRADING🟩
💥If the price breaks above 1.0209, consider buying with the target at 1.0270!
However, if EURUSD closes M15 candle below 1.0209, sell the pair with the target 1.0150!
🟩START TRADING🟩
👍28❤5🔥3🥰2
📈Which release will shake the market the most this week?
Anonymous Poll
8%
Disney earnings
76%
US inflation
16%
British GDP
👍30🔥10❤4👏3👎2🥰1
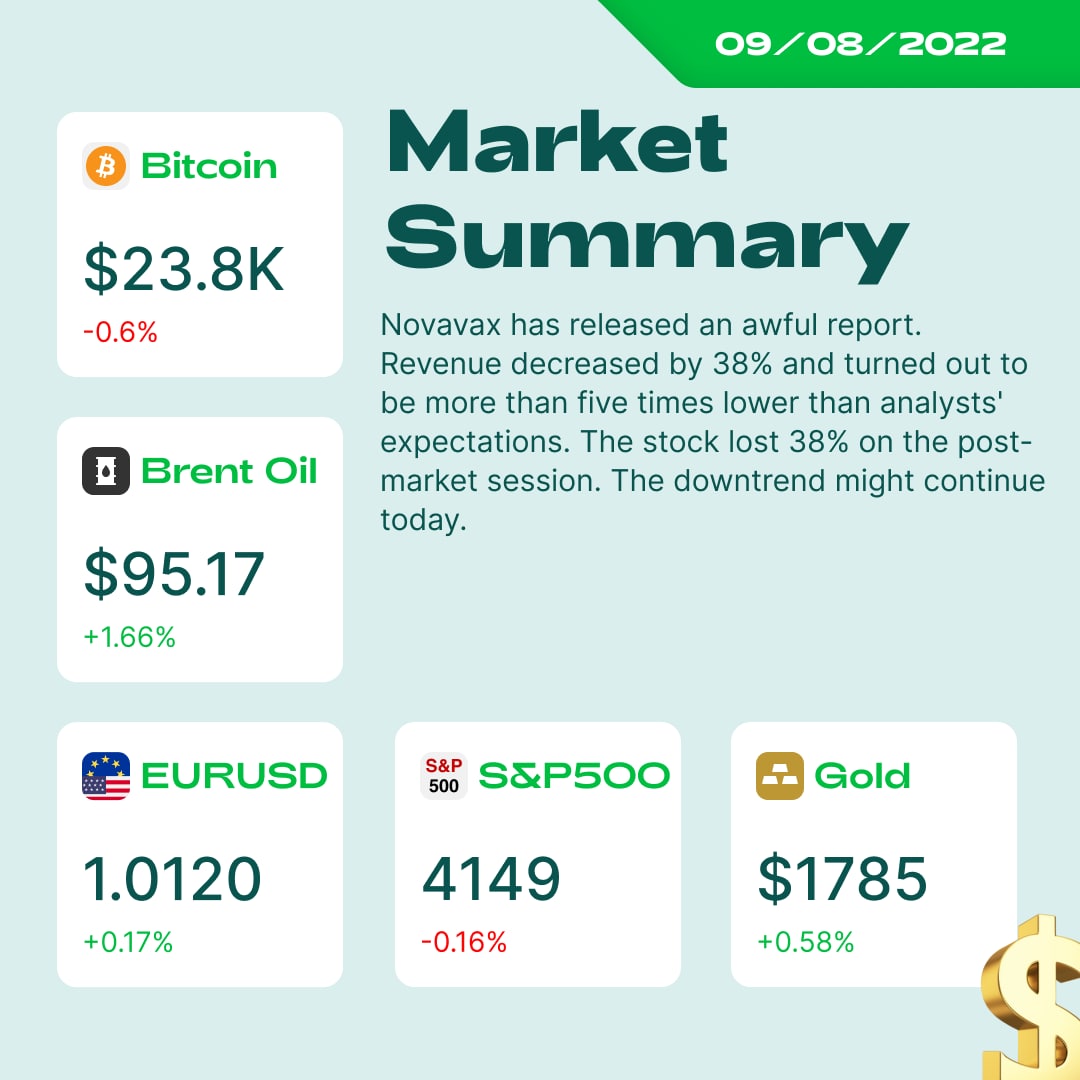
💥Good morning, traders! Let’s look at the main drivers for the markets today!
🇺🇸Joe Biden will sign the protocols on Sweden and Finland entry into NATO on August 9.
🇹🇷🇷🇺EU discusses sanctions against Turkey due to its rapprochement with Russia after Erdogan and Putin's agreements to expand cooperation in trade and energy - Financial Times.
🇺🇸US Consumer inflation expectations fell sharply in July:
- during the next year: from 6.8% to 6.2%
- over the next 3 years: from 3.6% to 3.2%
📈According to Barclays, the Fed has a chance of a soft landing, but there is also the possibility that the US stock market will fall by 5-10% from current levels even without the onset of a deep economic downturn.
🇺🇸🚨 Federal investigators raided Donald Trump's Florida residence on Monday investigating whether he took classified documents from the White House when he left office.
🧐What are you trading today?
🇺🇸Joe Biden will sign the protocols on Sweden and Finland entry into NATO on August 9.
🇹🇷🇷🇺EU discusses sanctions against Turkey due to its rapprochement with Russia after Erdogan and Putin's agreements to expand cooperation in trade and energy - Financial Times.
🇺🇸US Consumer inflation expectations fell sharply in July:
- during the next year: from 6.8% to 6.2%
- over the next 3 years: from 3.6% to 3.2%
📈According to Barclays, the Fed has a chance of a soft landing, but there is also the possibility that the US stock market will fall by 5-10% from current levels even without the onset of a deep economic downturn.
🇺🇸🚨 Federal investigators raided Donald Trump's Florida residence on Monday investigating whether he took classified documents from the White House when he left office.
🧐What are you trading today?
👍33🔥8
🇺🇸🇨🇦#USDCAD
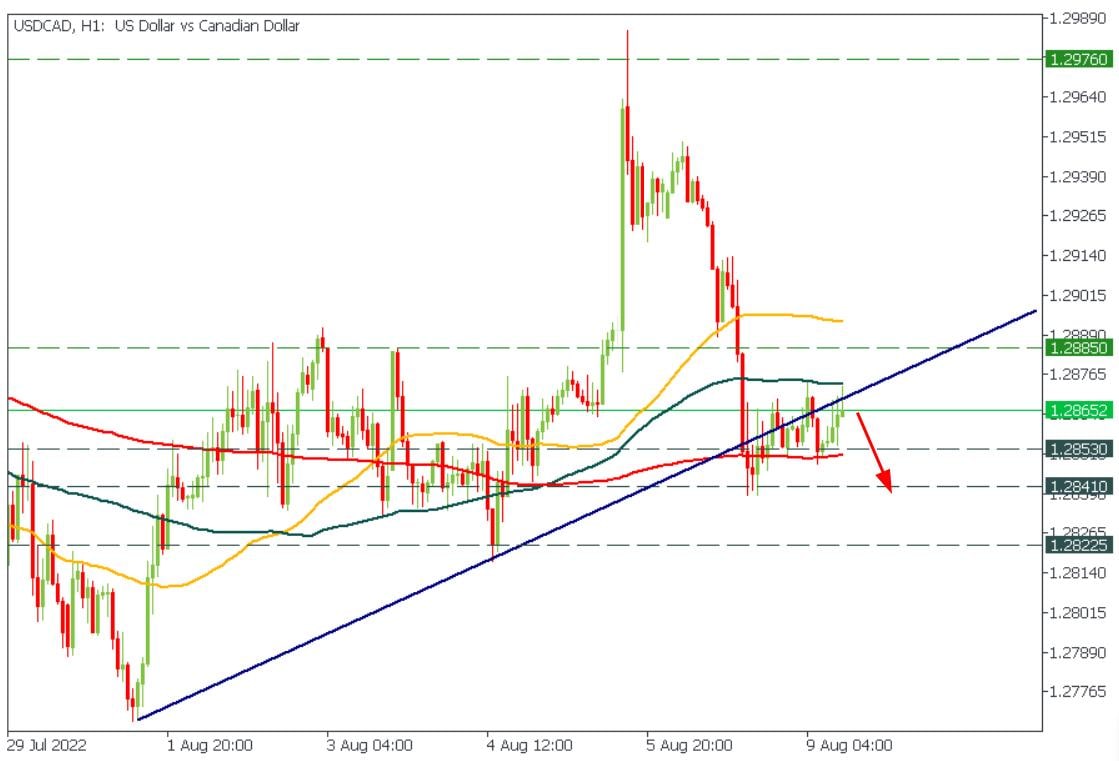
🔥USDCAD broke through the ascending trend line and retested it from below!
The price might drop towards 1.2853 and 1.2841 support levels!
🟩START TRADING🟩
🔥USDCAD broke through the ascending trend line and retested it from below!
The price might drop towards 1.2853 and 1.2841 support levels!
🟩START TRADING🟩
👍21🔥10👎2😁1
☢️#BTCUSD
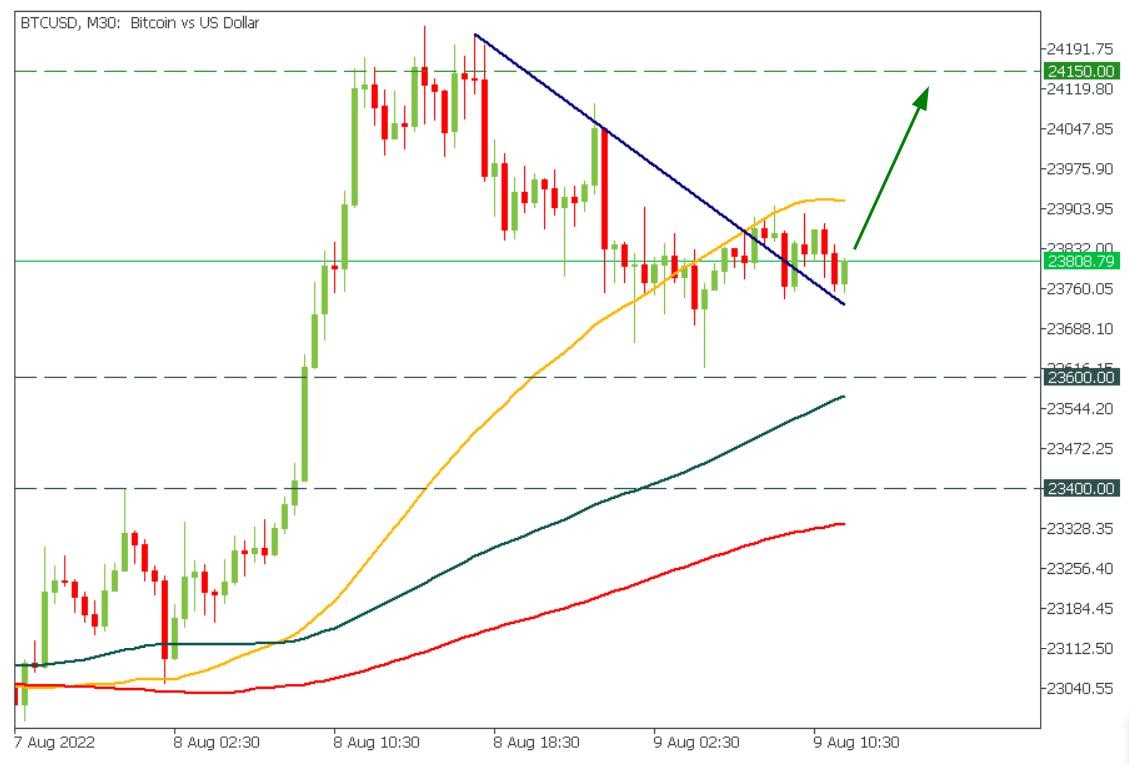
💥Bitcoin breaks through the descending trendline with the retest.
The price might reach $24 150 (1.5% potential profit).
🟩START TRADING🟩
💥Bitcoin breaks through the descending trendline with the retest.
The price might reach $24 150 (1.5% potential profit).
🟩START TRADING🟩
👍23🔥7
🇺🇸🇯🇵#USDJPY
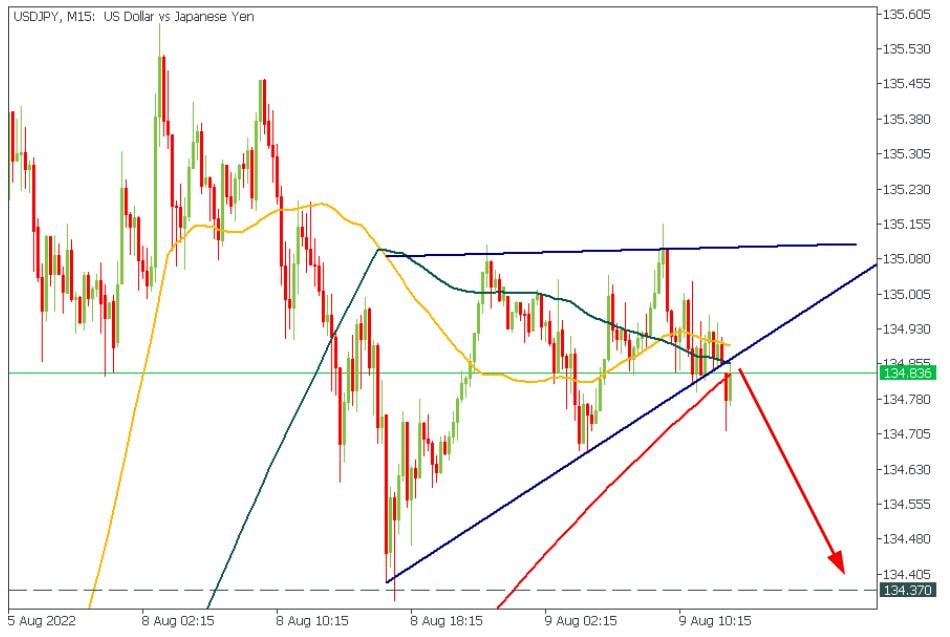
🔥USDJPY broke through the ascending trend line! Currently, the price is retesting it from the below.
If you see a downward impulse, follow the trend and sell USDJPY with the target at 134.37!
🟩START TRADING🟩
🔥USDJPY broke through the ascending trend line! Currently, the price is retesting it from the below.
If you see a downward impulse, follow the trend and sell USDJPY with the target at 134.37!
🟩START TRADING🟩
🔥15👍5👎1
What are your expectations on CPI release tomorrow? 🧐
Anonymous Poll
66%
USD up ( the actual numbers are higher-than-expected )
34%
USD down ( the actual numbers meet or lower-than-expected )
👍13🔥8🥰2
🧐What is the ideal moment for an entry?
😒Finding the best way to enter the market may be challenging for newbies. Some of them constantly look for ideal indicators and other hidden techniques. In reality, a trader can open a trade based on straightforward and understandable rules. Let's look at them!
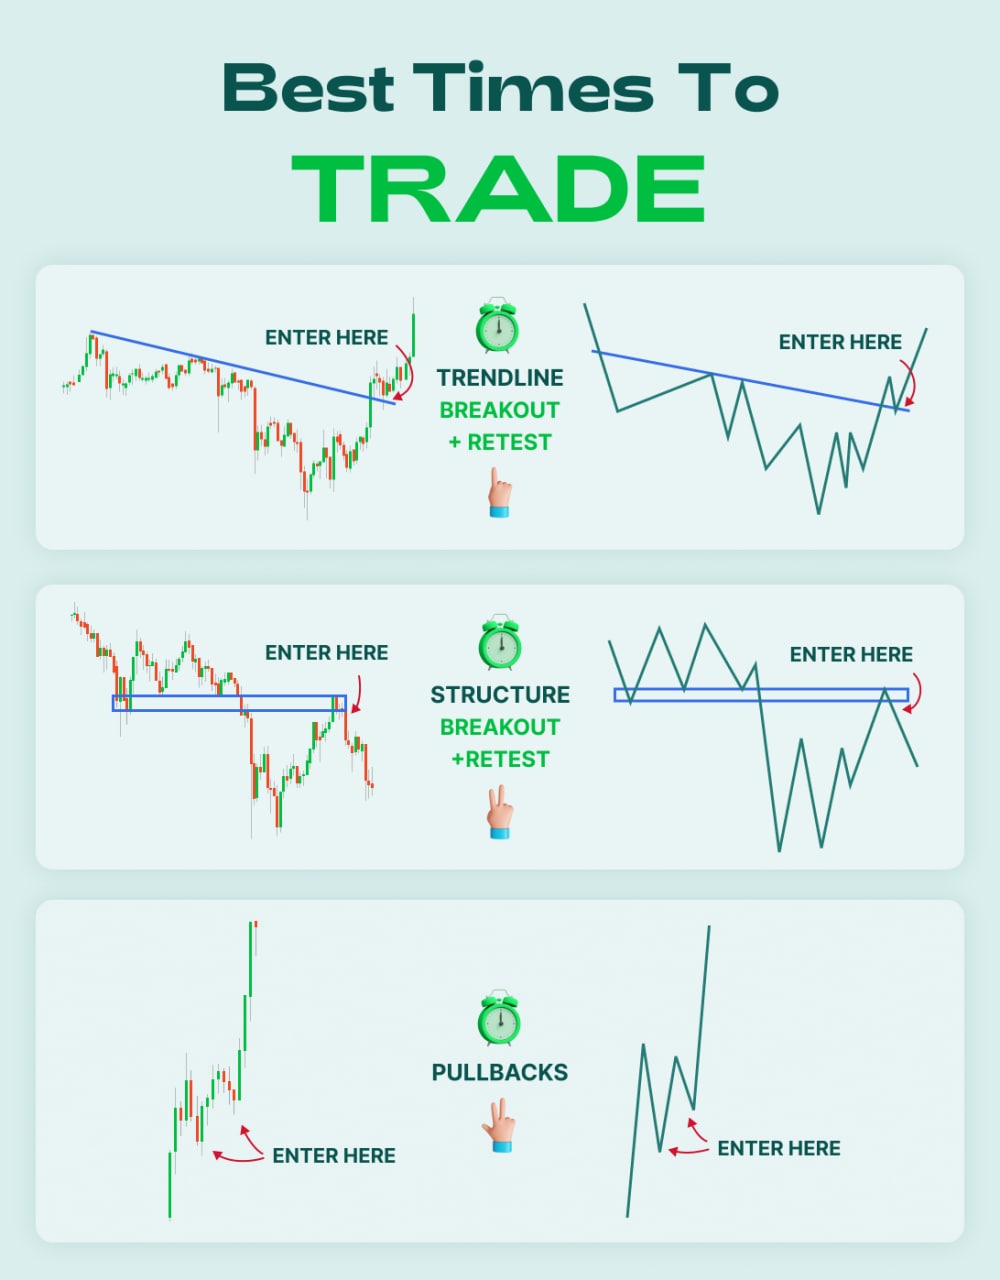
👆Every trader knows they must look at trends and levels to catch the right moment for an order. After you draw them, focus on breakouts! Below, we list three scenarios you can face on the charts.
✅Breakout of a trendline + retest. If the price crosses the trend line, it signals you to enter the market soon. Don't rush into trading after a big spike occurred! It's better to wait for a retest of the trendline, as the price tends to correct towards it after a huge momentum occurs. After a retest of a trend line happens, you are ready to place an order!
✅Breakout of the market structure + retest. If the price breaks a resistance/support zone, this is also a good sign to consider order. To confirm your signal, wait for a retest of the zone.
✅Pullbacks. If the price moves within a strong trend, you can enter on pullbacks (corrections) to the trend line.
💥That’s all! Now you know three simple ways to enter the market! To learn more about market entries, visit the FBS website: https://bit.ly/3BSURDm
😒Finding the best way to enter the market may be challenging for newbies. Some of them constantly look for ideal indicators and other hidden techniques. In reality, a trader can open a trade based on straightforward and understandable rules. Let's look at them!
👆Every trader knows they must look at trends and levels to catch the right moment for an order. After you draw them, focus on breakouts! Below, we list three scenarios you can face on the charts.
✅Breakout of a trendline + retest. If the price crosses the trend line, it signals you to enter the market soon. Don't rush into trading after a big spike occurred! It's better to wait for a retest of the trendline, as the price tends to correct towards it after a huge momentum occurs. After a retest of a trend line happens, you are ready to place an order!
✅Breakout of the market structure + retest. If the price breaks a resistance/support zone, this is also a good sign to consider order. To confirm your signal, wait for a retest of the zone.
✅Pullbacks. If the price moves within a strong trend, you can enter on pullbacks (corrections) to the trend line.
💥That’s all! Now you know three simple ways to enter the market! To learn more about market entries, visit the FBS website: https://bit.ly/3BSURDm
👍63🔥12❤11👏4🥰3
#MarketNews
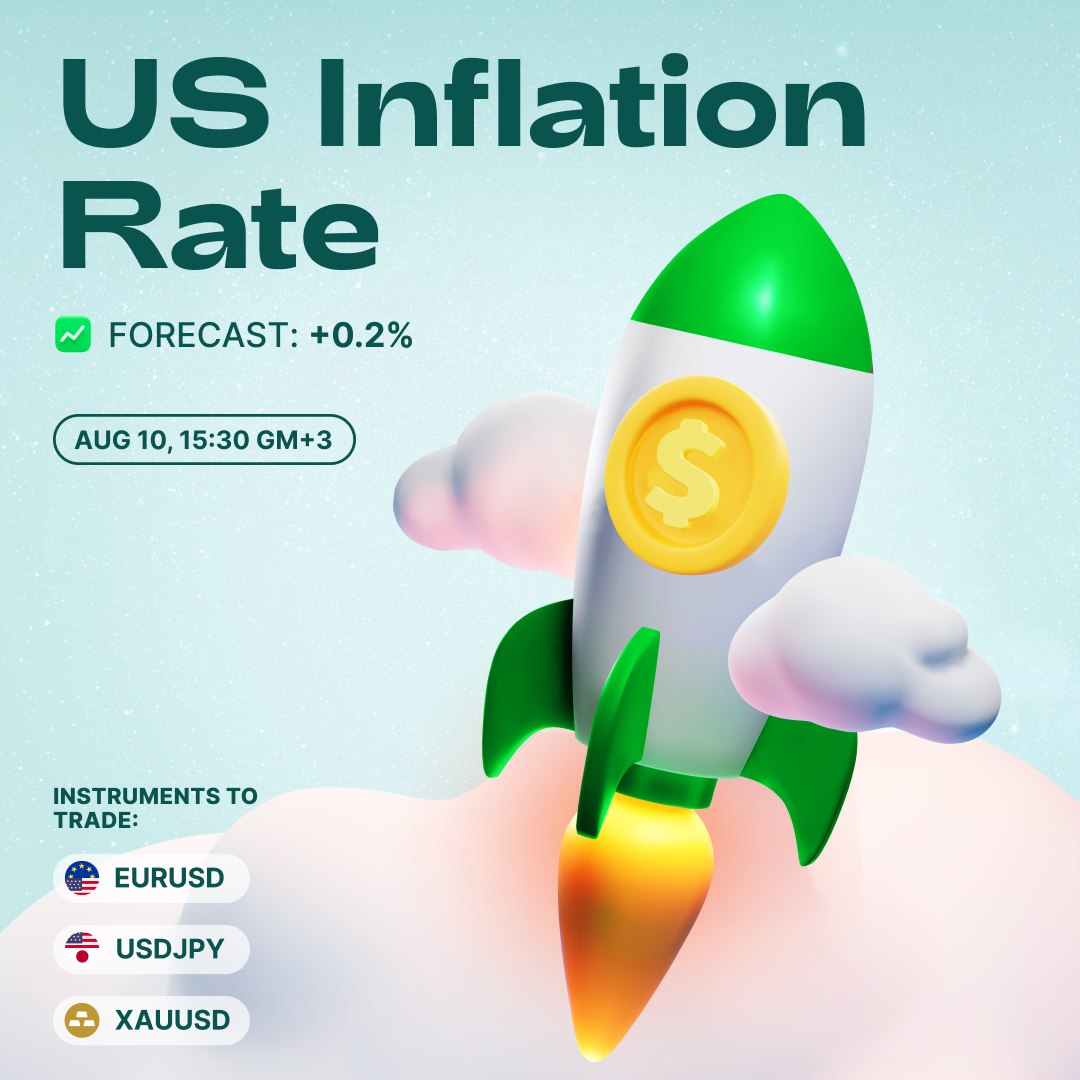
🔥Today traders await the release of the US inflation data (CPI) at 15:30 MT time. This release will shape investor expectations for further Federal Reserve interest-rate hikes. A high CPI will reinforce the need for the Fed to keep raising rates and push the USD up.
🗣Chicago Fed President Charles Evans and his Minneapolis counterpart Neel Kashkari will speak today. Their comments might add volatility to the USD pairs.
🤷♂️Elon Musk sold $6.9 billion of shares in Tesla Inc., the billionaire’s biggest sale on record, saying he needed cash in case he is forced to go ahead with his aborted deal to buy Twitter Inc. If the Twitter deal isn’t closed, Musk plans to buy Tesla back.
⬇Coinbase posted a record $1.1 billion second-quarter loss and lower-than-expected revenue as the largest US cryptocurrency exchange was battered by tumbling digital-asset prices. The stock dropped about 5% after the close of regular trading.
📉Bitcoin erased its recent rally. BTCUSD dropped from Monday's high above 24 000 to 22 650. Further moves of BTC will depend on the US CPI release as well: a high number will deepen the decline and vice versa.
Do you want some hints on how to trade CPI today? 👍 if yes!
🔥Today traders await the release of the US inflation data (CPI) at 15:30 MT time. This release will shape investor expectations for further Federal Reserve interest-rate hikes. A high CPI will reinforce the need for the Fed to keep raising rates and push the USD up.
🗣Chicago Fed President Charles Evans and his Minneapolis counterpart Neel Kashkari will speak today. Their comments might add volatility to the USD pairs.
🤷♂️Elon Musk sold $6.9 billion of shares in Tesla Inc., the billionaire’s biggest sale on record, saying he needed cash in case he is forced to go ahead with his aborted deal to buy Twitter Inc. If the Twitter deal isn’t closed, Musk plans to buy Tesla back.
⬇Coinbase posted a record $1.1 billion second-quarter loss and lower-than-expected revenue as the largest US cryptocurrency exchange was battered by tumbling digital-asset prices. The stock dropped about 5% after the close of regular trading.
📉Bitcoin erased its recent rally. BTCUSD dropped from Monday's high above 24 000 to 22 650. Further moves of BTC will depend on the US CPI release as well: a high number will deepen the decline and vice versa.
Do you want some hints on how to trade CPI today? 👍 if yes!
👍137🔥14💯3
👋Hey, FBS Traders!
We have an interesting opinion about today's CPI release and want to share with you!
It looks like the numbers might surprise today!
Let's have a deal. Put 300 🔥 reactions and we will give it to you! We think, it's a fair price 😉
We have an interesting opinion about today's CPI release and want to share with you!
It looks like the numbers might surprise today!
Let's have a deal. Put 300 🔥 reactions and we will give it to you! We think, it's a fair price 😉
🔥354👍55❤15🥰4💩3😁1
#Disney #stock
✨Do you believe in happy endings? Well, today may be the day with a great ending, as the Walt Disney company publishes its earnings report after the market close at 23:05 GMT+3!
FORECASTS:
EPS - $1
Revenue - $20.68 billion
Why are analysts and investors so confident in Disney this time? Should you buy the stock? Click the link and find out in the article below!
🟩TIME TO BUY DISNEY?🟩
✨Do you believe in happy endings? Well, today may be the day with a great ending, as the Walt Disney company publishes its earnings report after the market close at 23:05 GMT+3!
FORECASTS:
EPS - $1
Revenue - $20.68 billion
Why are analysts and investors so confident in Disney this time? Should you buy the stock? Click the link and find out in the article below!
🟩TIME TO BUY DISNEY?🟩

🔥16👍8❤4
🇺🇸🇨🇭#USDCHF
🔥USDCHF is trading right above the support trendline ahead of the CPI release!
Greater-than-expected numbers might push the pair up to 0.9540 and even 0.9642!
However, lower-than-expected CPI and the breakout of 0.9450 and the 200-day moving average will send the pair to 0.9360!
🟩START TRADING🟩
🔥USDCHF is trading right above the support trendline ahead of the CPI release!
Greater-than-expected numbers might push the pair up to 0.9540 and even 0.9642!
However, lower-than-expected CPI and the breakout of 0.9450 and the 200-day moving average will send the pair to 0.9360!
🟩START TRADING🟩

🔥14👍4❤2🤔2👏1
🇺🇸💥#Macro
🔥US CPI RELEASE!
CPI m/m:
Actual: 0.0%
Forecast: 0.2%
Previous: 1.3%
Core CPI m/m:
Actual: 0.3%
Forecast: 0.5%
Previous: 0.7%
🔥US CPI RELEASE!
CPI m/m:
Actual: 0.0%
Forecast: 0.2%
Previous: 1.3%
Core CPI m/m:
Actual: 0.3%
Forecast: 0.5%
Previous: 0.7%
👍28🔥10❤2
🇪🇺🇺🇸#EURUSD
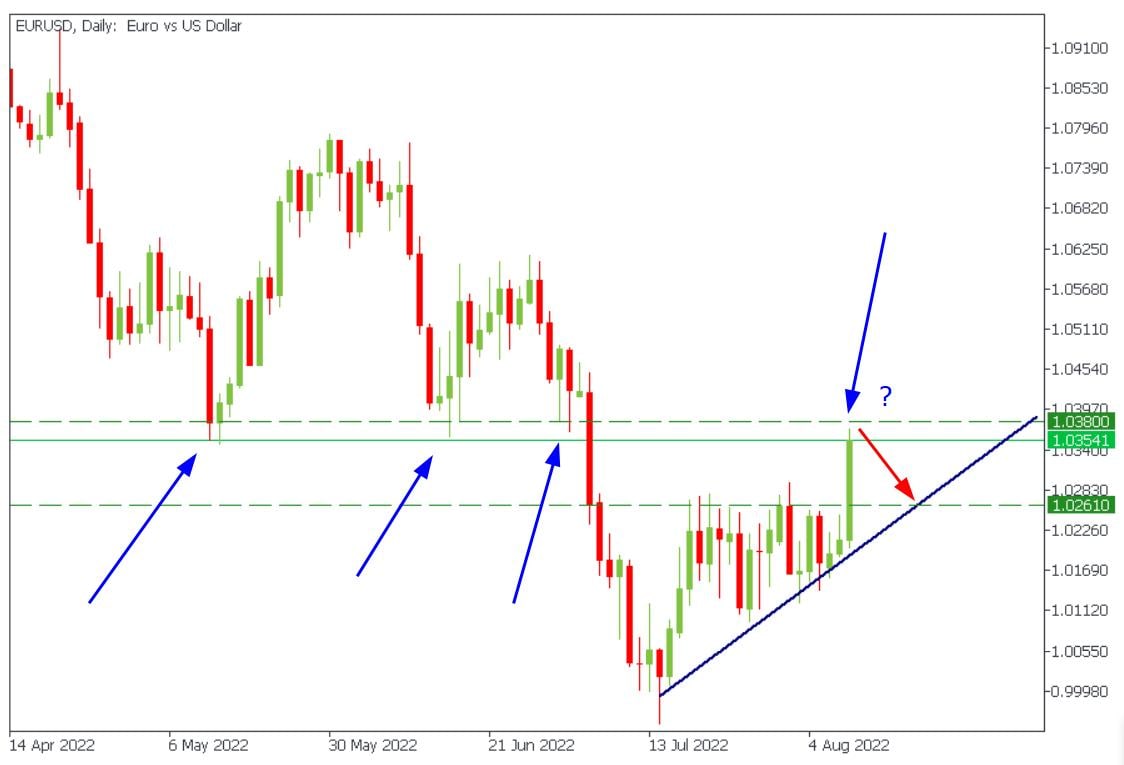
🔥EURUSD is coming close to the critical resistance level!
We highly doubt the price will break this level straight through, that's why we suggest you to be really careful buying around this level.
Vice versa, look for any reversal pattern or impulse appearance at 1.0380!
🟩START TRADING🟩
🔥EURUSD is coming close to the critical resistance level!
We highly doubt the price will break this level straight through, that's why we suggest you to be really careful buying around this level.
Vice versa, look for any reversal pattern or impulse appearance at 1.0380!
🟩START TRADING🟩
👍32🔥29❤7
🥇#XAUUSD
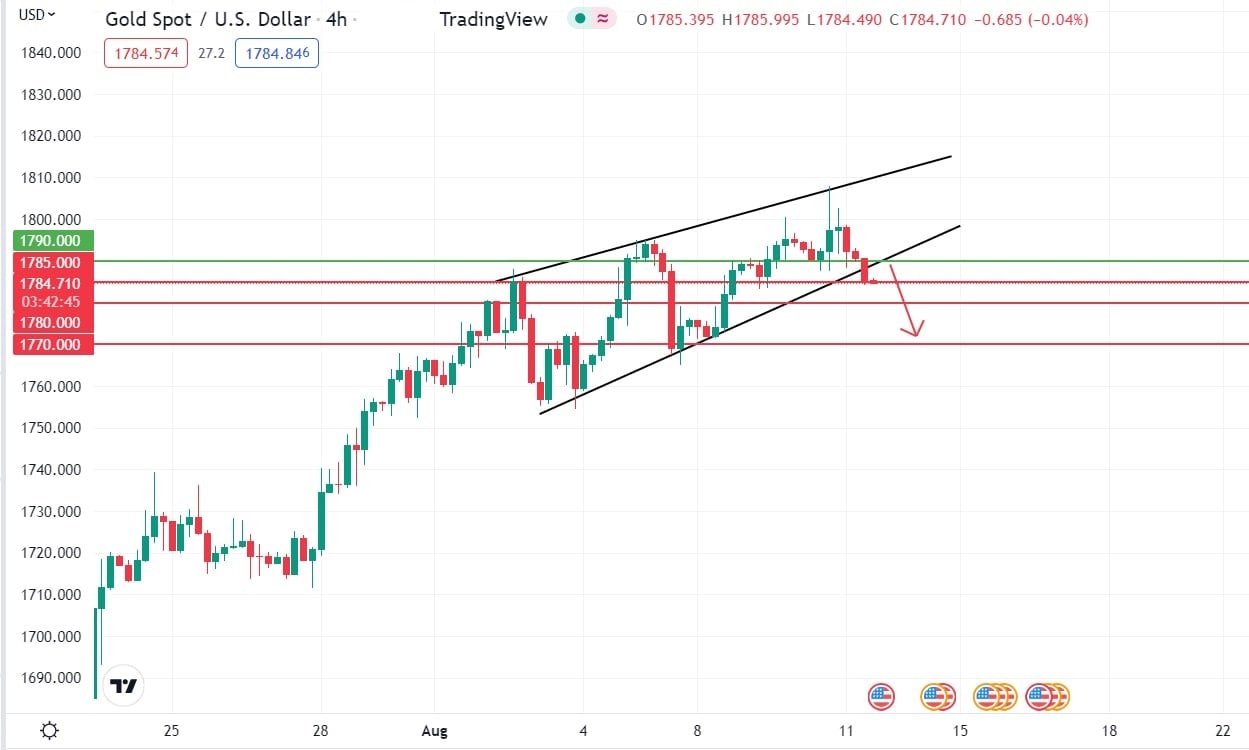
🔥The bearish signal appeared on the XAUUSD chart !
Gold closed the H4 candle below the bottom line of the bearish rising wedge. With the retest or without it the price will try to reach $1770!
Resistance: $1790
Support: $1780, $1770
🟩START TRADING🟩
🔥The bearish signal appeared on the XAUUSD chart !
Gold closed the H4 candle below the bottom line of the bearish rising wedge. With the retest or without it the price will try to reach $1770!
Resistance: $1790
Support: $1780, $1770
🟩START TRADING🟩
❤36👍24🔥12👏3