
#marketanalysis #MarketNews #tsla #stockmarket
TSLA analysis: Price Returns to Above the $170 Level, But for How Long?
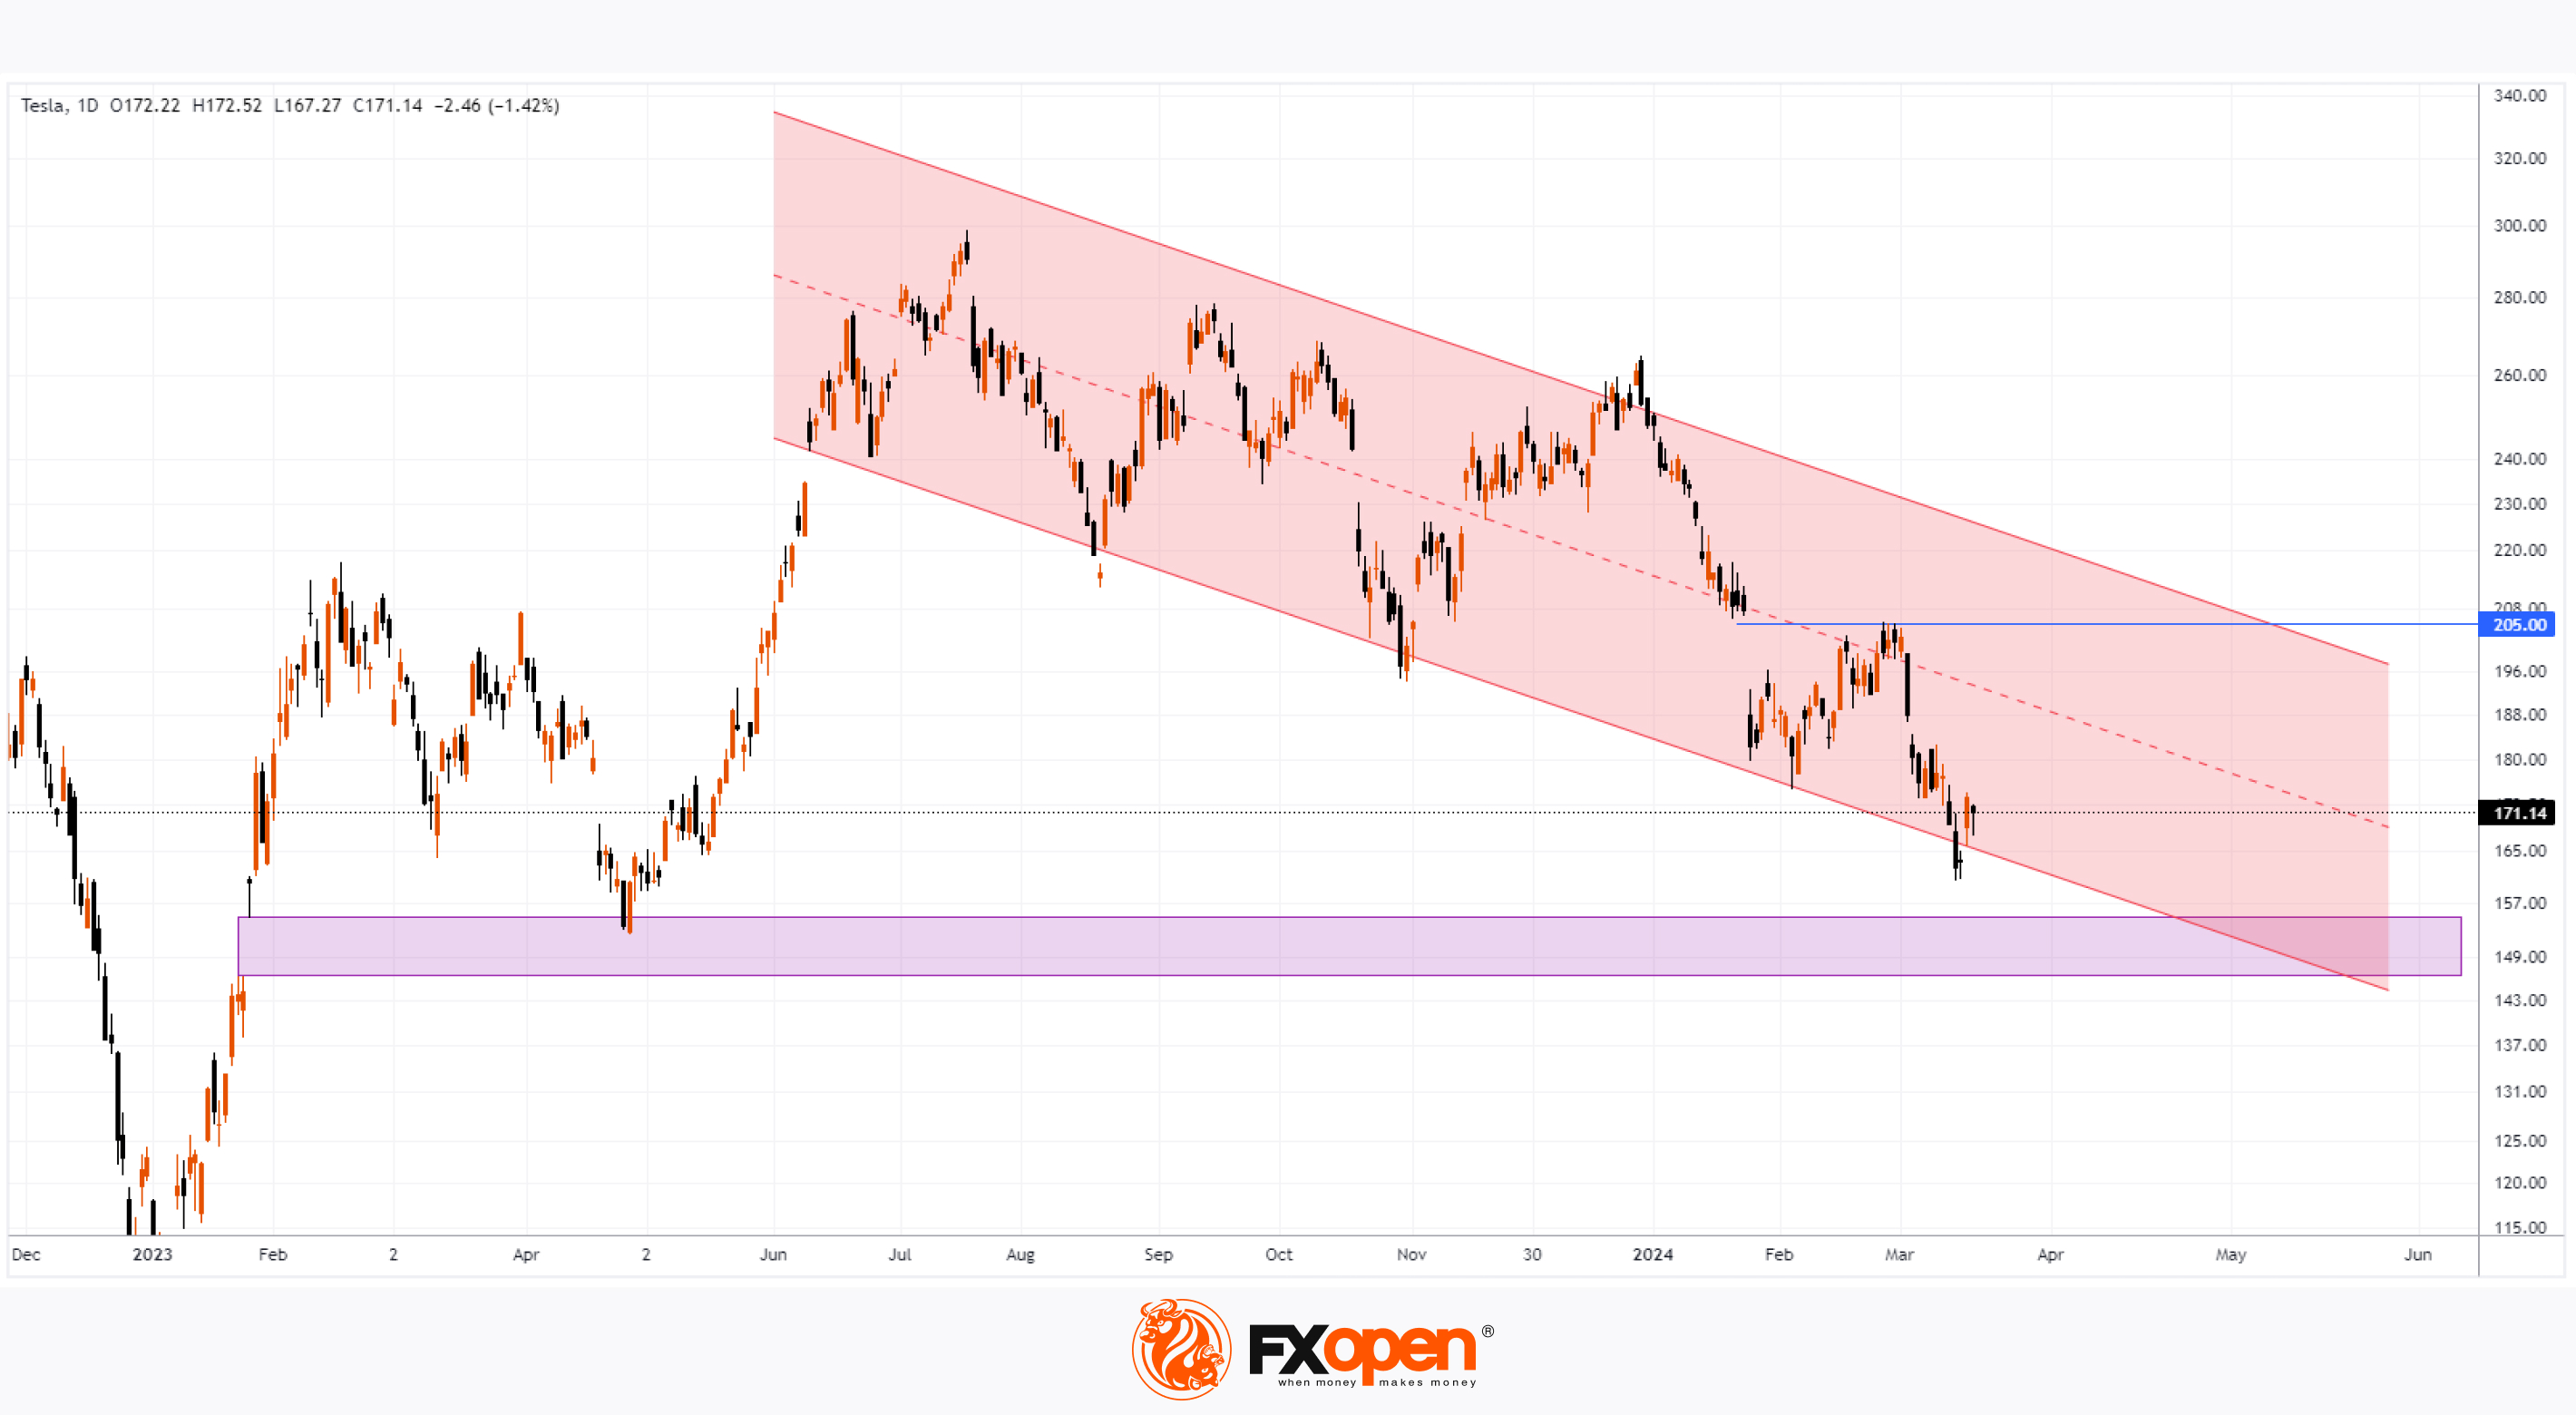
After forming a low of the year on March 14, the TSLA share price managed to rise above the USD 170 level — investors reacted positively to Tesla’s decision to increase prices for electric vehicles in the US and Europe.
However, the TSLA stock market remains under pressure:
the TSLA price performs noticeably worse than the S&P 500 index;
the price forms a downward channel (shown in red);
Goldman Sachs analysts cut their forecast for Tesla shares to USD 190 from USD 220 for the next 12 months due to problems with production and sales.
Yahoo writes that investors are not happy with Musk's attitude. The fall in Tesla shares could quickly stop if the company gets a “real CEO” or Musk changes his position and returns to work and positively promoting the brand.
What is the market outlook?
Bullish arguments:
→ the price is near an important support zone, which is formed by the 2023 pattern: a bullish gap that has been successfully tested;
→ a decrease in the TSLA price below the lower border of the downward channel creates short-term oversold conditions in the market.
→ Fortune reported on March 15 that Cathie Wood's fund bought USD 35 million of TSLA stock.
Bearish arguments:
→ the bearish gap of early January works as resistance;
→ resistance may also include the psychological level of USD 200 and the median line of the descending channel.
At the same time, Barron's writes that the approaching earnings season is the biggest risk for Tesla shares right now. Tesla is expected to report electric vehicle deliveries of about 480,000 units in the first quarter of 2024, according to estimates from Bloomberg and FactSet. However, investors should pay attention to more recent estimates that have emerged in the last couple of weeks — they point to a figure of around 430,000 units.
Actual values below expectations may significantly lower the price of TSLA shares — it is possible that the price will continue to move within the descending channel, breaking through the support area. The news release is scheduled for April 17.
Buy and sell stocks of the world's biggest publicly-listed companies with CFDs on FXOpen’s trading platform. Open your FXOpen account now or learn more about trading share CFDs with FXOpen.
CFDs are complex instruments and come with a high risk of losing your money.
This article represents the opinion of the Companies operating under the FXOpen brand only. It is not to be construed as an offer, solicitation, or recommendation with respect to products and services provided by the Companies operating under the FXOpen brand, nor is it to be considered financial advice.
TSLA analysis: Price Returns to Above the $170 Level, But for How Long?
After forming a low of the year on March 14, the TSLA share price managed to rise above the USD 170 level — investors reacted positively to Tesla’s decision to increase prices for electric vehicles in the US and Europe.
However, the TSLA stock market remains under pressure:
the TSLA price performs noticeably worse than the S&P 500 index;
the price forms a downward channel (shown in red);
Goldman Sachs analysts cut their forecast for Tesla shares to USD 190 from USD 220 for the next 12 months due to problems with production and sales.
Yahoo writes that investors are not happy with Musk's attitude. The fall in Tesla shares could quickly stop if the company gets a “real CEO” or Musk changes his position and returns to work and positively promoting the brand.
What is the market outlook?
Bullish arguments:
→ the price is near an important support zone, which is formed by the 2023 pattern: a bullish gap that has been successfully tested;
→ a decrease in the TSLA price below the lower border of the downward channel creates short-term oversold conditions in the market.
→ Fortune reported on March 15 that Cathie Wood's fund bought USD 35 million of TSLA stock.
Bearish arguments:
→ the bearish gap of early January works as resistance;
→ resistance may also include the psychological level of USD 200 and the median line of the descending channel.
At the same time, Barron's writes that the approaching earnings season is the biggest risk for Tesla shares right now. Tesla is expected to report electric vehicle deliveries of about 480,000 units in the first quarter of 2024, according to estimates from Bloomberg and FactSet. However, investors should pay attention to more recent estimates that have emerged in the last couple of weeks — they point to a figure of around 430,000 units.
Actual values below expectations may significantly lower the price of TSLA shares — it is possible that the price will continue to move within the descending channel, breaking through the support area. The news release is scheduled for April 17.
Buy and sell stocks of the world's biggest publicly-listed companies with CFDs on FXOpen’s trading platform. Open your FXOpen account now or learn more about trading share CFDs with FXOpen.
CFDs are complex instruments and come with a high risk of losing your money.
This article represents the opinion of the Companies operating under the FXOpen brand only. It is not to be construed as an offer, solicitation, or recommendation with respect to products and services provided by the Companies operating under the FXOpen brand, nor is it to be considered financial advice.
👍3
#sp500 #stockmarket #stocks #marketanalysis
The price of the S&P 500 set a historical record amid news from the Fed
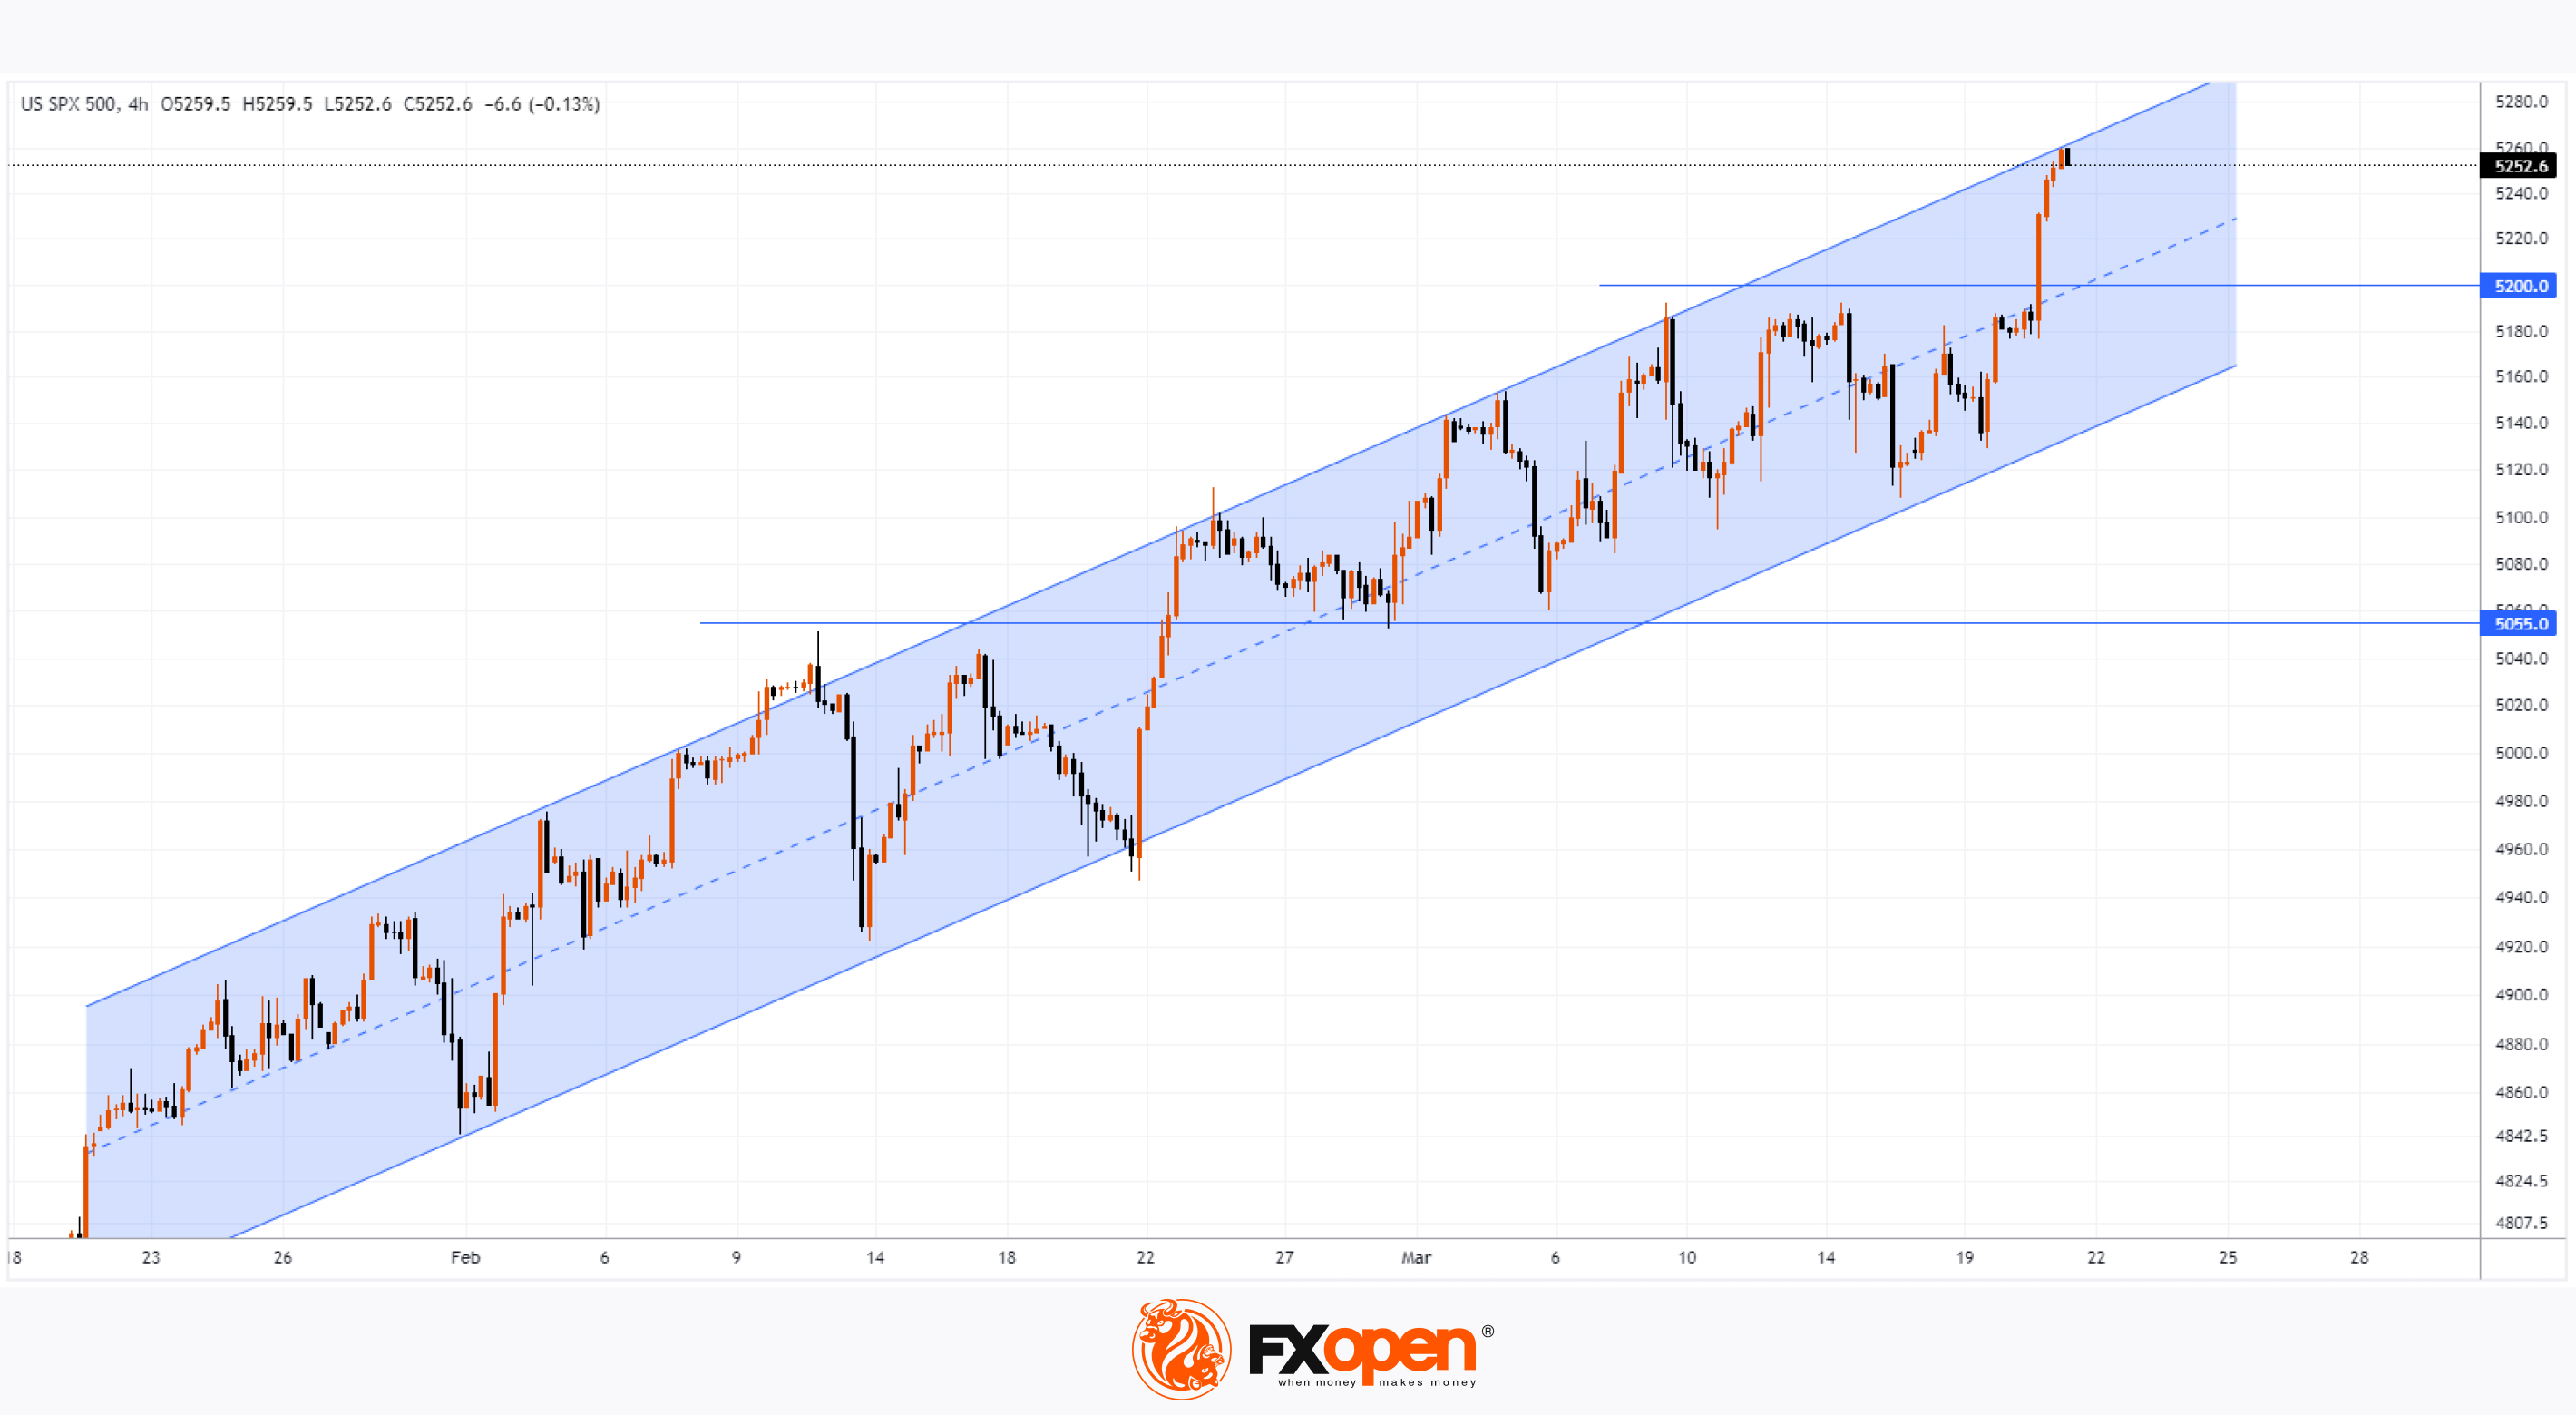
On March 14, we wrote: “The US500 stock index market is showing signs of positivity, indicating that an attempt to overcome the resistance of 5,200 points with a new record high may be made in the near future.” Yesterday's event created the momentum that allowed the bulls to do this.
On Wednesday evening it became known that it was decided to keep the interest rate at 5.5% in the US — this was expected. What market participants paid more attention to was the dovish tone of the Fed. Thus, it became known that by the end of 2024 there may be 3 consecutive rate cuts.
According to Jerome Powell:
→ recent inflation data turned out to be hotter than expected;
→ however, “in fact, the overall story has not changed, it is a gradual decline in inflation along a somewhat bumpy road.”
Thus, fears associated with a longer period of tight monetary policy have been dispelled. As a result, the US dollar fell in price against a number of currencies, and the US stock market index S&P 500 soared to a new historical high around the level of 5,250.
Technical analysis of the US500 chart today shows that:
→ the market continues its upward trend (shown by the blue channel);
→ the price is in the upper half of the channel – a sign of increased demand.
However, the price of US500 is near the upper border of the channel, which makes the market vulnerable to a correction to the support level from the historical top — a similar pattern has been formed more than once since the beginning of 2024.
Support can be provided by:
→ median line of the channel and its lower border;
→ level 5200, from which we can expect a change in role from resistance to support - as was the case with level 5055.
Trade global index CFDs with zero commission and tight spreads. Open your FXOpen account now or learn more about trading index CFDs with FXOpen.
CFDs are complex instruments and come with a high risk of losing your money.
This article represents the opinion of the Companies operating under the FXOpen brand only. It is not to be construed as an offer, solicitation, or recommendation with respect to products and services provided by the Companies operating under the FXOpen brand, nor is it to be considered financial advice.
The price of the S&P 500 set a historical record amid news from the Fed
On March 14, we wrote: “The US500 stock index market is showing signs of positivity, indicating that an attempt to overcome the resistance of 5,200 points with a new record high may be made in the near future.” Yesterday's event created the momentum that allowed the bulls to do this.
On Wednesday evening it became known that it was decided to keep the interest rate at 5.5% in the US — this was expected. What market participants paid more attention to was the dovish tone of the Fed. Thus, it became known that by the end of 2024 there may be 3 consecutive rate cuts.
According to Jerome Powell:
→ recent inflation data turned out to be hotter than expected;
→ however, “in fact, the overall story has not changed, it is a gradual decline in inflation along a somewhat bumpy road.”
Thus, fears associated with a longer period of tight monetary policy have been dispelled. As a result, the US dollar fell in price against a number of currencies, and the US stock market index S&P 500 soared to a new historical high around the level of 5,250.
Technical analysis of the US500 chart today shows that:
→ the market continues its upward trend (shown by the blue channel);
→ the price is in the upper half of the channel – a sign of increased demand.
However, the price of US500 is near the upper border of the channel, which makes the market vulnerable to a correction to the support level from the historical top — a similar pattern has been formed more than once since the beginning of 2024.
Support can be provided by:
→ median line of the channel and its lower border;
→ level 5200, from which we can expect a change in role from resistance to support - as was the case with level 5055.
Trade global index CFDs with zero commission and tight spreads. Open your FXOpen account now or learn more about trading index CFDs with FXOpen.
CFDs are complex instruments and come with a high risk of losing your money.
This article represents the opinion of the Companies operating under the FXOpen brand only. It is not to be construed as an offer, solicitation, or recommendation with respect to products and services provided by the Companies operating under the FXOpen brand, nor is it to be considered financial advice.
👍3
#marketanalysis #tradingforex #usdollar
USD/CHF Analysis: SNB Decision Breaks Multi-month Trend
According to Reuters, on the sidelines of the World Economic Forum in Davos in January, the head of the Swiss National Bank (SNB) Thomas Jordan told the Swiss press that the appreciation of the franc creates problems for exporters. Thus, indicating intentions to weaken the CHF.
His words in January seem to be in line with how events are developing — the franc has weakened against the US dollar by more than 6% since the start of the year.
Moreover, today, quite unexpectedly, the Swiss National Bank decided to lower the interest rate: actual = 1.50%, forecast = 1.75%, previous value = 1.75%.
The result of the decision today was a sharp weakening of the franc against other currencies, including the US dollar.
Technical analysis of the USD/CHF chart today shows that the bulls are breaking the downward trend (shown by the red channel), which dates back to the fall of 2022. Wherein:
→ the price of USD/CHF may continue to develop within the channel shown by the blue lines, including a rollback from the 4-month high;
→ in case of a rollback, the level of 0.8888 may constitute support (as a former resistance) - just like the lower blue line.
If the weakening of the franc, which is facilitated by the SNB, continues, the price of USD/CHF may reach the level of 0.9095 - near which the market has repeatedly formed reversals.
But most importantly, the easing of monetary policy by the SNB will likely serve as an example for the National Banks of other Western countries - which, in turn, will cause the emergence of new trends in the foreign exchange markets.
Trade over 50 forex markets 24 hours a day with FXOpen. Take advantage of low commissions, deep liquidity, and spreads from 0.0 pips. Open your FXOpen account now or learn more about trading forex with FXOpen.
CFDs are complex instruments and come with a high risk of losing your money.
This article represents the opinion of the Companies operating under the FXOpen brand only. It is not to be construed as an offer, solicitation, or recommendation with respect to products and services provided by the Companies operating under the FXOpen brand, nor is it to be considered financial advice.
USD/CHF Analysis: SNB Decision Breaks Multi-month Trend
According to Reuters, on the sidelines of the World Economic Forum in Davos in January, the head of the Swiss National Bank (SNB) Thomas Jordan told the Swiss press that the appreciation of the franc creates problems for exporters. Thus, indicating intentions to weaken the CHF.
His words in January seem to be in line with how events are developing — the franc has weakened against the US dollar by more than 6% since the start of the year.
Moreover, today, quite unexpectedly, the Swiss National Bank decided to lower the interest rate: actual = 1.50%, forecast = 1.75%, previous value = 1.75%.
The result of the decision today was a sharp weakening of the franc against other currencies, including the US dollar.
Technical analysis of the USD/CHF chart today shows that the bulls are breaking the downward trend (shown by the red channel), which dates back to the fall of 2022. Wherein:
→ the price of USD/CHF may continue to develop within the channel shown by the blue lines, including a rollback from the 4-month high;
→ in case of a rollback, the level of 0.8888 may constitute support (as a former resistance) - just like the lower blue line.
If the weakening of the franc, which is facilitated by the SNB, continues, the price of USD/CHF may reach the level of 0.9095 - near which the market has repeatedly formed reversals.
But most importantly, the easing of monetary policy by the SNB will likely serve as an example for the National Banks of other Western countries - which, in turn, will cause the emergence of new trends in the foreign exchange markets.
Trade over 50 forex markets 24 hours a day with FXOpen. Take advantage of low commissions, deep liquidity, and spreads from 0.0 pips. Open your FXOpen account now or learn more about trading forex with FXOpen.
CFDs are complex instruments and come with a high risk of losing your money.
This article represents the opinion of the Companies operating under the FXOpen brand only. It is not to be construed as an offer, solicitation, or recommendation with respect to products and services provided by the Companies operating under the FXOpen brand, nor is it to be considered financial advice.

👍3
#AAPL #stockmarket #marketanalysis
AAPL Share Price Falls More Than 4% after Antitrust Lawsuit
Yesterday, the Department of Justice filed an antitrust lawsuit against Apple, alleging that the company has established a monopoly with the iPhone, which has harmed consumers, developers and competitors.
“Each step in Apple's course of conduct built and reinforced the moat around its smartphone monopoly,” the government said in the 88-page lawsuit.
The result of news of the lawsuit was a sharp decline in Apple's share price by more than 4%. This is a serious blow to stocks that are already underperforming the broader market. As confirmation, we note that yesterday, the ratio of the S&P 500 index to the AAPL share price set a maximum since November 2021.
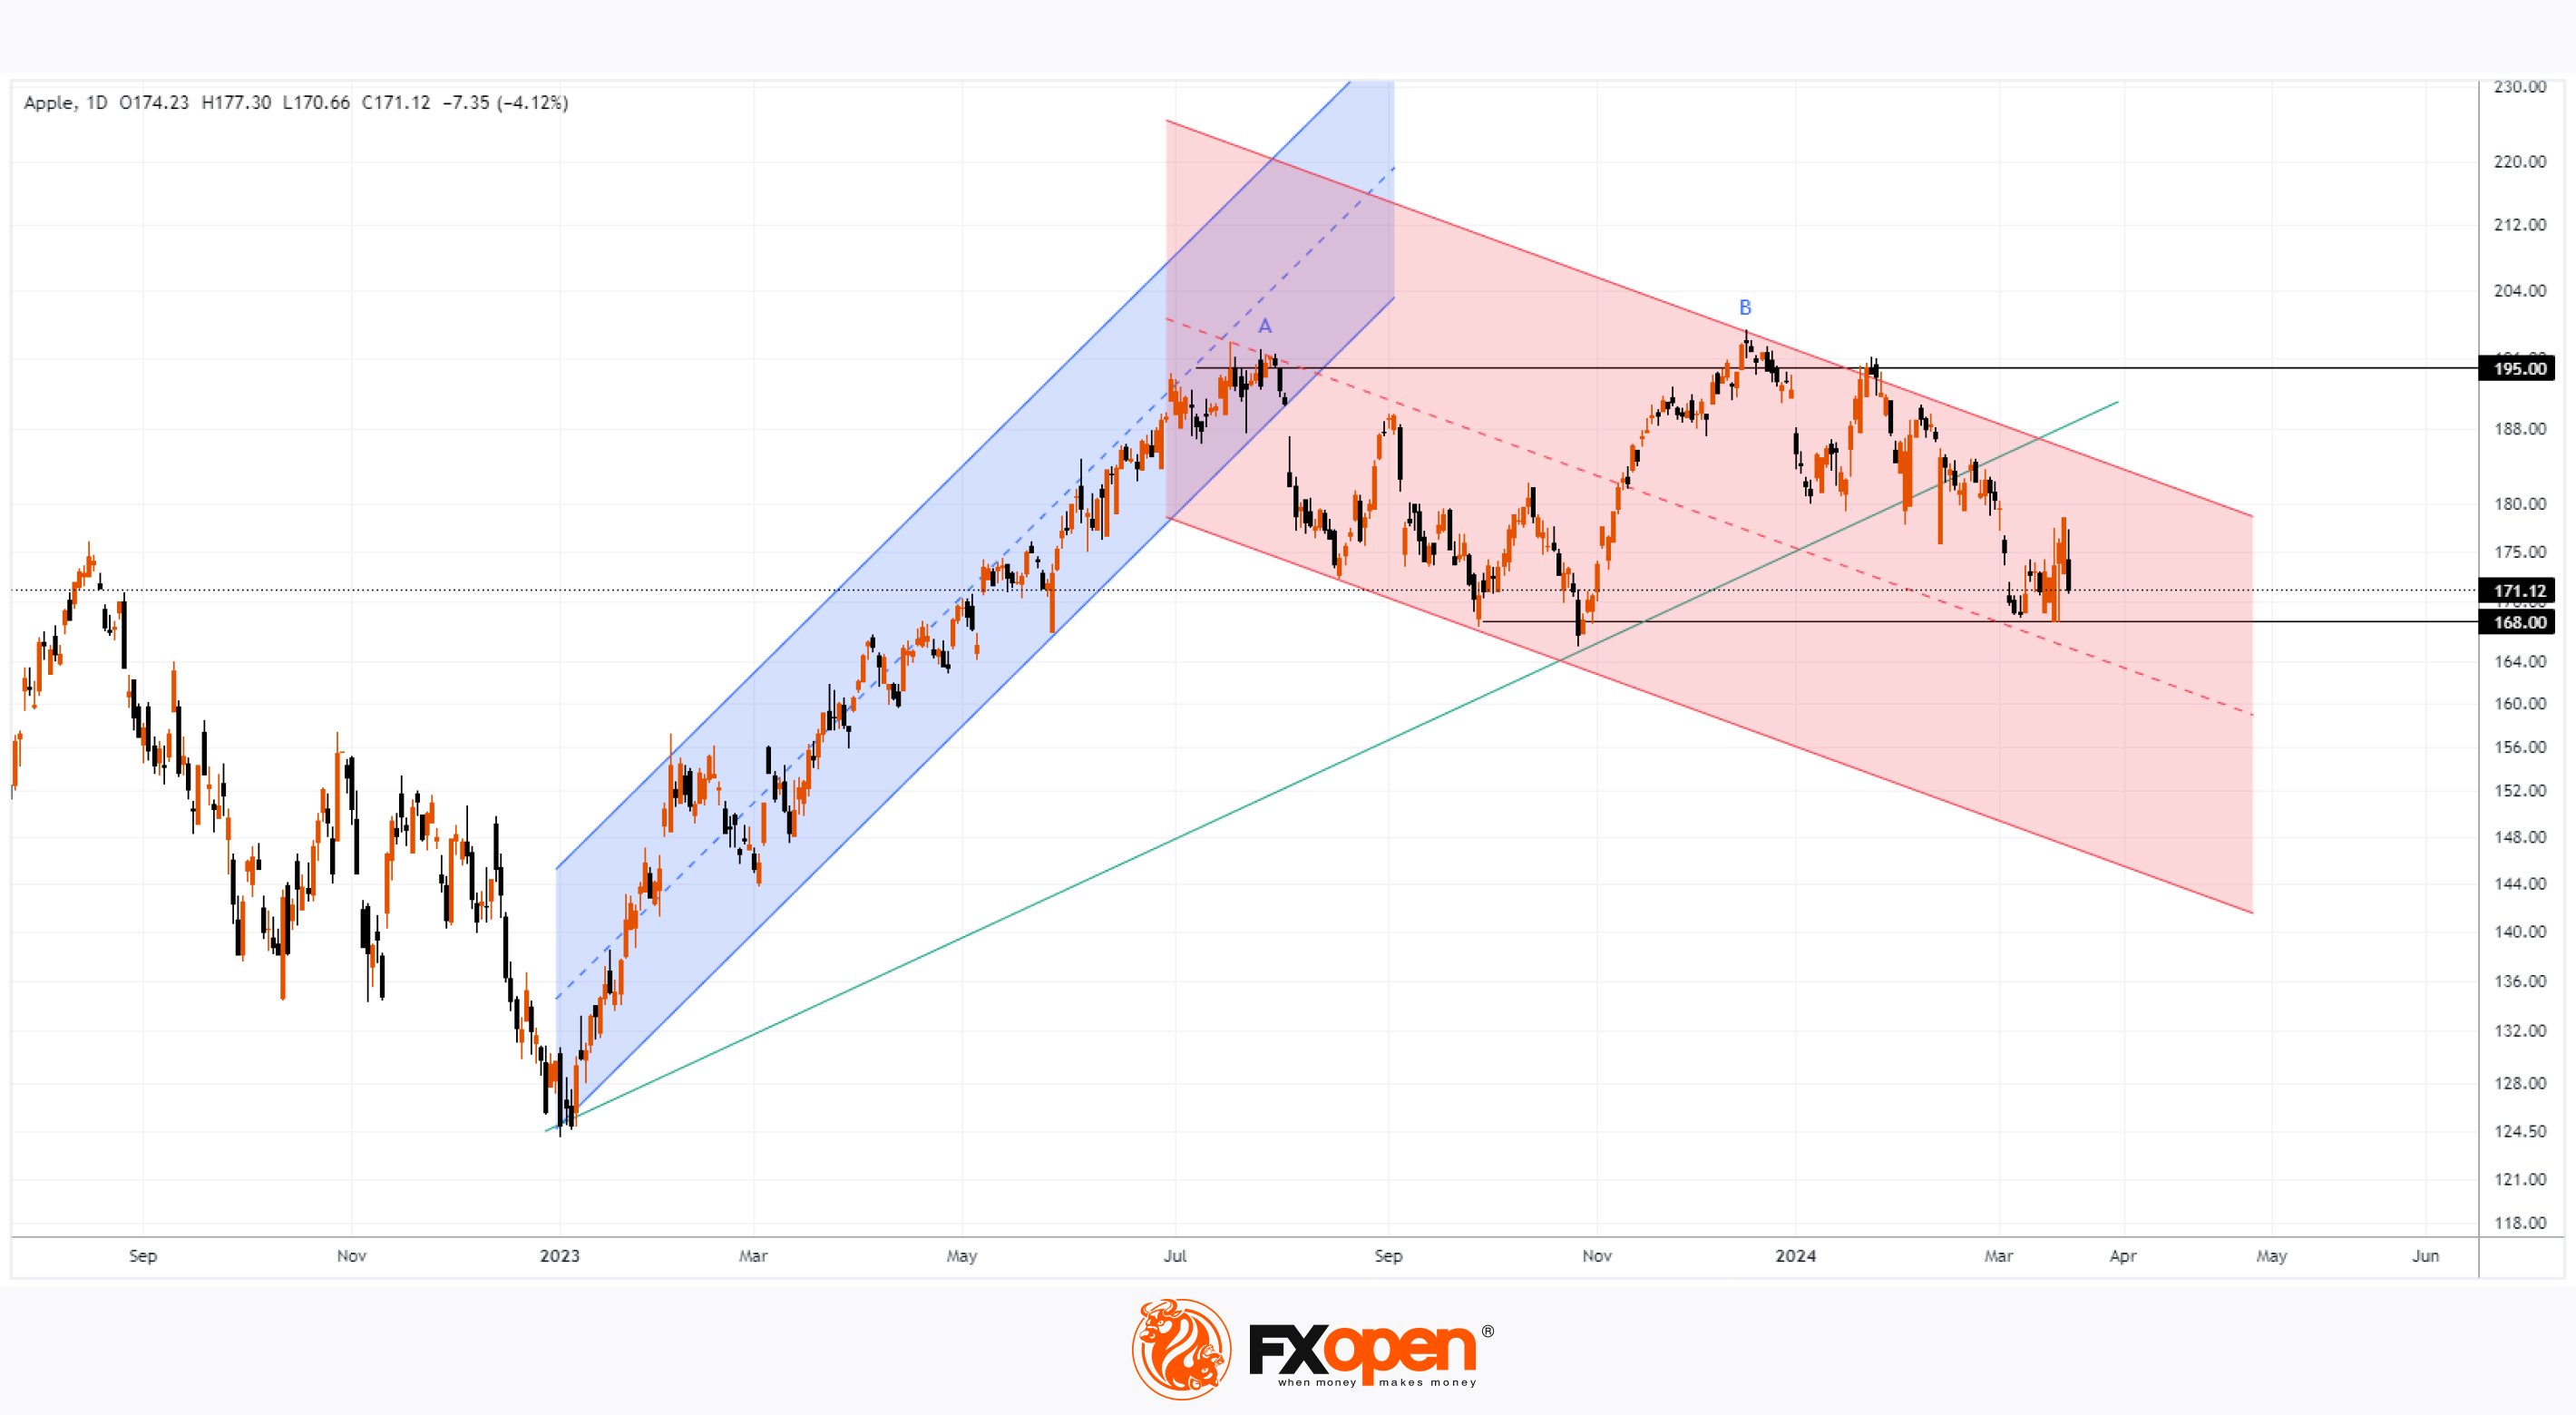
The chart for AAPL stock shows an increasingly bearish picture:
→ The pace of the strong bull run (shown in the blue channel) of 2023 remains in the past, forming an A top near the USD 195 per share level of AAPL.
→ The price tested this level, forming top B.
→ Thus, the level of USD 195 works as an important resistance, around which a double top A-B pattern has formed (subjectively, it can be regarded as a triple, taking into account the high of January 24.
→ Price action increasingly defines the contours of the downward channel (shown in red).
→ While developing within this channel, the price has already dropped below the uptrend line (shown in green).
As we wrote earlier, analysts fear a decline in sales of Apple products. If the negativity in the market increases, the bears may attempt to break through the support level of USD 168 per share.
The company's report for the 1st quarter of 2024 will have an important impact, its publication is scheduled for April 25. But for now, analysts believe more in a positive scenario - according to TipRanks, the average predicted price for AAPL shares is $204.86 in 12 months.
Buy and sell stocks of the world's biggest publicly-listed companies with CFDs on FXOpen’s trading platform. Open your FXOpen account now or learn more about trading share CFDs with FXOpen.
CFDs are complex instruments and come with a high risk of losing your money.
This article represents the opinion of the Companies operating under the FXOpen brand only. It is not to be construed as an offer, solicitation, or recommendation with respect to products and services provided by the Companies operating under the FXOpen brand, nor is it to be considered financial advice.
AAPL Share Price Falls More Than 4% after Antitrust Lawsuit
Yesterday, the Department of Justice filed an antitrust lawsuit against Apple, alleging that the company has established a monopoly with the iPhone, which has harmed consumers, developers and competitors.
“Each step in Apple's course of conduct built and reinforced the moat around its smartphone monopoly,” the government said in the 88-page lawsuit.
The result of news of the lawsuit was a sharp decline in Apple's share price by more than 4%. This is a serious blow to stocks that are already underperforming the broader market. As confirmation, we note that yesterday, the ratio of the S&P 500 index to the AAPL share price set a maximum since November 2021.
The chart for AAPL stock shows an increasingly bearish picture:
→ The pace of the strong bull run (shown in the blue channel) of 2023 remains in the past, forming an A top near the USD 195 per share level of AAPL.
→ The price tested this level, forming top B.
→ Thus, the level of USD 195 works as an important resistance, around which a double top A-B pattern has formed (subjectively, it can be regarded as a triple, taking into account the high of January 24.
→ Price action increasingly defines the contours of the downward channel (shown in red).
→ While developing within this channel, the price has already dropped below the uptrend line (shown in green).
As we wrote earlier, analysts fear a decline in sales of Apple products. If the negativity in the market increases, the bears may attempt to break through the support level of USD 168 per share.
The company's report for the 1st quarter of 2024 will have an important impact, its publication is scheduled for April 25. But for now, analysts believe more in a positive scenario - according to TipRanks, the average predicted price for AAPL shares is $204.86 in 12 months.
Buy and sell stocks of the world's biggest publicly-listed companies with CFDs on FXOpen’s trading platform. Open your FXOpen account now or learn more about trading share CFDs with FXOpen.
CFDs are complex instruments and come with a high risk of losing your money.
This article represents the opinion of the Companies operating under the FXOpen brand only. It is not to be construed as an offer, solicitation, or recommendation with respect to products and services provided by the Companies operating under the FXOpen brand, nor is it to be considered financial advice.
👍3
#GBPUSD #marketanalysis #forextrading
GBP/USD Price Falls to 1.26 after Bank of England Decision
Yesterday, the GBP/USD market experienced a day of intense volatility due to a number of news items. According to Trading Economics:
→ UK retail sales were flat last month after a strong rise of 3.6% in January, contrasting with market expectations of a 0.3% decline.
→ The Bank of England decided to leave interest rates unchanged. However, its head Andrew Bailey hinted at a potential reduction in interest rates. He noted positive indicators of lower inflation but stressed the need for greater confidence in managing price pressures.
Thus, a clearer prospect of easing monetary policy in the UK (which, however, is relevant for many countries) has become a driver for the weakening of the British pound.
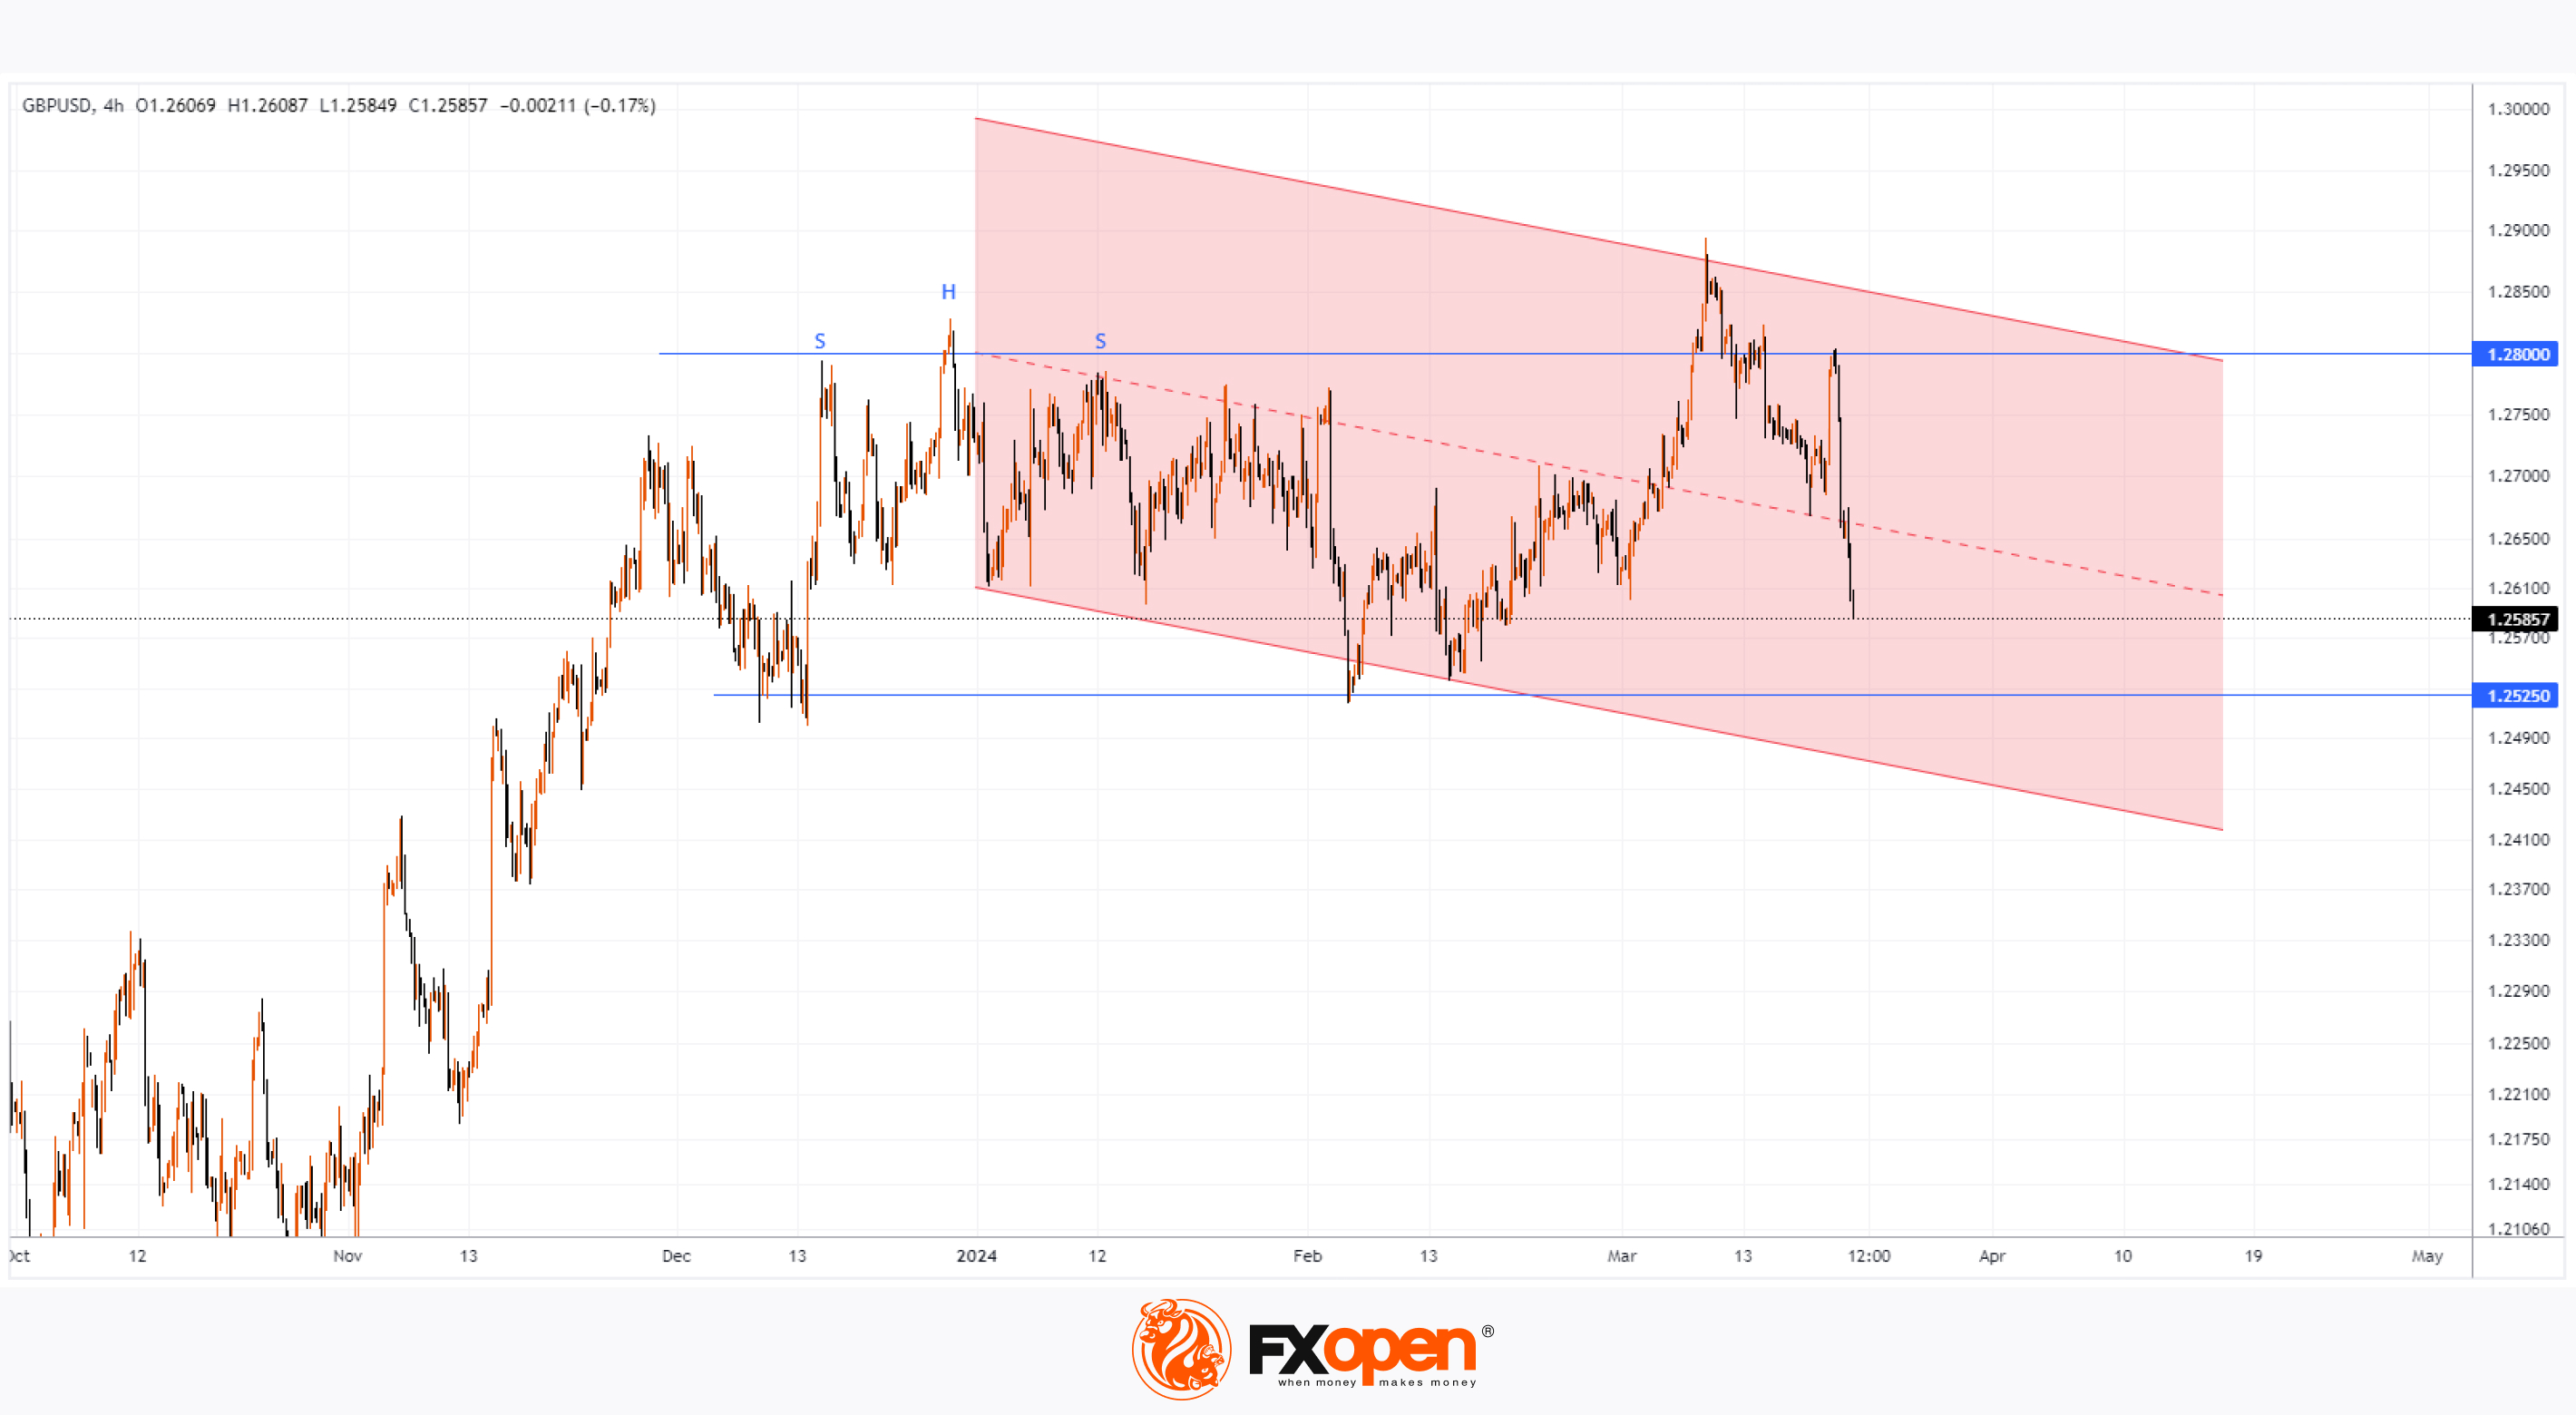
The GBP/USD chart today shows that:
→ The price fell below USD 1.26, forming a March low;
→ The USD 1.28 level looks like an important resistance — at the beginning of the year a head-and-shoulders pattern formed there, after which in March there was an unsuccessful bullish breakout of this formation and a test of the USD 1.28 level.
→ The contours of the downward channel become more obvious on the chart (shown in red).
The rate of decline from yesterday's high is very fast. If the momentum continues, it is possible that the bears will be able to lower the price of GBP/USD to the lower border of the red channel. An obstacle for them may be the support of USD 1.2525, near which the GBP/USD price has repeatedly formed bullish reversals.
Trade over 50 forex markets 24 hours a day with FXOpen. Take advantage of low commissions, deep liquidity, and spreads from 0.0 pips. Open your FXOpen account now or learn more about trading forex with FXOpen.
CFDs are complex instruments and come with a high risk of losing your money.
This article represents the opinion of the Companies operating under the FXOpen brand only. It is not to be construed as an offer, solicitation, or recommendation with respect to products and services provided by the Companies operating under the FXOpen brand, nor is it to be considered financial advice.
GBP/USD Price Falls to 1.26 after Bank of England Decision
Yesterday, the GBP/USD market experienced a day of intense volatility due to a number of news items. According to Trading Economics:
→ UK retail sales were flat last month after a strong rise of 3.6% in January, contrasting with market expectations of a 0.3% decline.
→ The Bank of England decided to leave interest rates unchanged. However, its head Andrew Bailey hinted at a potential reduction in interest rates. He noted positive indicators of lower inflation but stressed the need for greater confidence in managing price pressures.
Thus, a clearer prospect of easing monetary policy in the UK (which, however, is relevant for many countries) has become a driver for the weakening of the British pound.
The GBP/USD chart today shows that:
→ The price fell below USD 1.26, forming a March low;
→ The USD 1.28 level looks like an important resistance — at the beginning of the year a head-and-shoulders pattern formed there, after which in March there was an unsuccessful bullish breakout of this formation and a test of the USD 1.28 level.
→ The contours of the downward channel become more obvious on the chart (shown in red).
The rate of decline from yesterday's high is very fast. If the momentum continues, it is possible that the bears will be able to lower the price of GBP/USD to the lower border of the red channel. An obstacle for them may be the support of USD 1.2525, near which the GBP/USD price has repeatedly formed bullish reversals.
Trade over 50 forex markets 24 hours a day with FXOpen. Take advantage of low commissions, deep liquidity, and spreads from 0.0 pips. Open your FXOpen account now or learn more about trading forex with FXOpen.
CFDs are complex instruments and come with a high risk of losing your money.
This article represents the opinion of the Companies operating under the FXOpen brand only. It is not to be construed as an offer, solicitation, or recommendation with respect to products and services provided by the Companies operating under the FXOpen brand, nor is it to be considered financial advice.
👍4
#tsla #stockmarket #sp500 #usdollar #usdchf
Weekly Market Wrap With Gary Thomson: S&P500, USD, SNB, TSLA
Get the latest scoop on the week's hottest headlines, all in one convenient video. Join Gary Thomson, the COO of FXOpen UK, as he breaks down the most significant news reports and shares his expert insights.
🔸 The Price of the S&P 500 Set a Historical Record amid News from the Fed
🔸 US Dollar Shows Record Weekly Gain Since Mid-January
🔸 USD/CHF Analysis: SNB Decision Breaks Multi-month Trend
🔸 TSLA analysis: Price Returns to Above the $170 Level, But for How Long?
Stay in the know and empower yourself with our short, yet power-packed video. Watch it now and stay updated with FXOpen. Don't miss out on this invaluable opportunity to sharpen your trading skills and make informed decisions.
https://cutt.ly/qw9sPZmB
To take advantage of price fluctuations in the foreign exchange markets, consider enlisting the services of a reliable broker like FXOpen.
⚠️
This forecast represents FXOpen Companies opinion only, it should not be construed as an offer, invitation or recommendation in respect to FXOpen Companies products and services or as financial advice
Weekly Market Wrap With Gary Thomson: S&P500, USD, SNB, TSLA
Get the latest scoop on the week's hottest headlines, all in one convenient video. Join Gary Thomson, the COO of FXOpen UK, as he breaks down the most significant news reports and shares his expert insights.
🔸 The Price of the S&P 500 Set a Historical Record amid News from the Fed
🔸 US Dollar Shows Record Weekly Gain Since Mid-January
🔸 USD/CHF Analysis: SNB Decision Breaks Multi-month Trend
🔸 TSLA analysis: Price Returns to Above the $170 Level, But for How Long?
Stay in the know and empower yourself with our short, yet power-packed video. Watch it now and stay updated with FXOpen. Don't miss out on this invaluable opportunity to sharpen your trading skills and make informed decisions.
https://cutt.ly/qw9sPZmB
To take advantage of price fluctuations in the foreign exchange markets, consider enlisting the services of a reliable broker like FXOpen.
⚠️
This forecast represents FXOpen Companies opinion only, it should not be construed as an offer, invitation or recommendation in respect to FXOpen Companies products and services or as financial advice
YouTube
Weekly Market Wrap With Gary Thomson: S&P500, USD, SNB, TSLA
Get the latest scoop on the week's hottest headlines, all in one convenient video. Join Gary Thomson, the COO of FXOpen UK, as he breaks down the most significant news reports and shares his expert insights.
00:40 The Price of the S&P 500 Set a Historical…
00:40 The Price of the S&P 500 Set a Historical…
👍3
#bitcoin #marketanalysis #cryptonews #crypto
Bitcoin Price Recovered over the Weekend, But Market Anxiety Remains
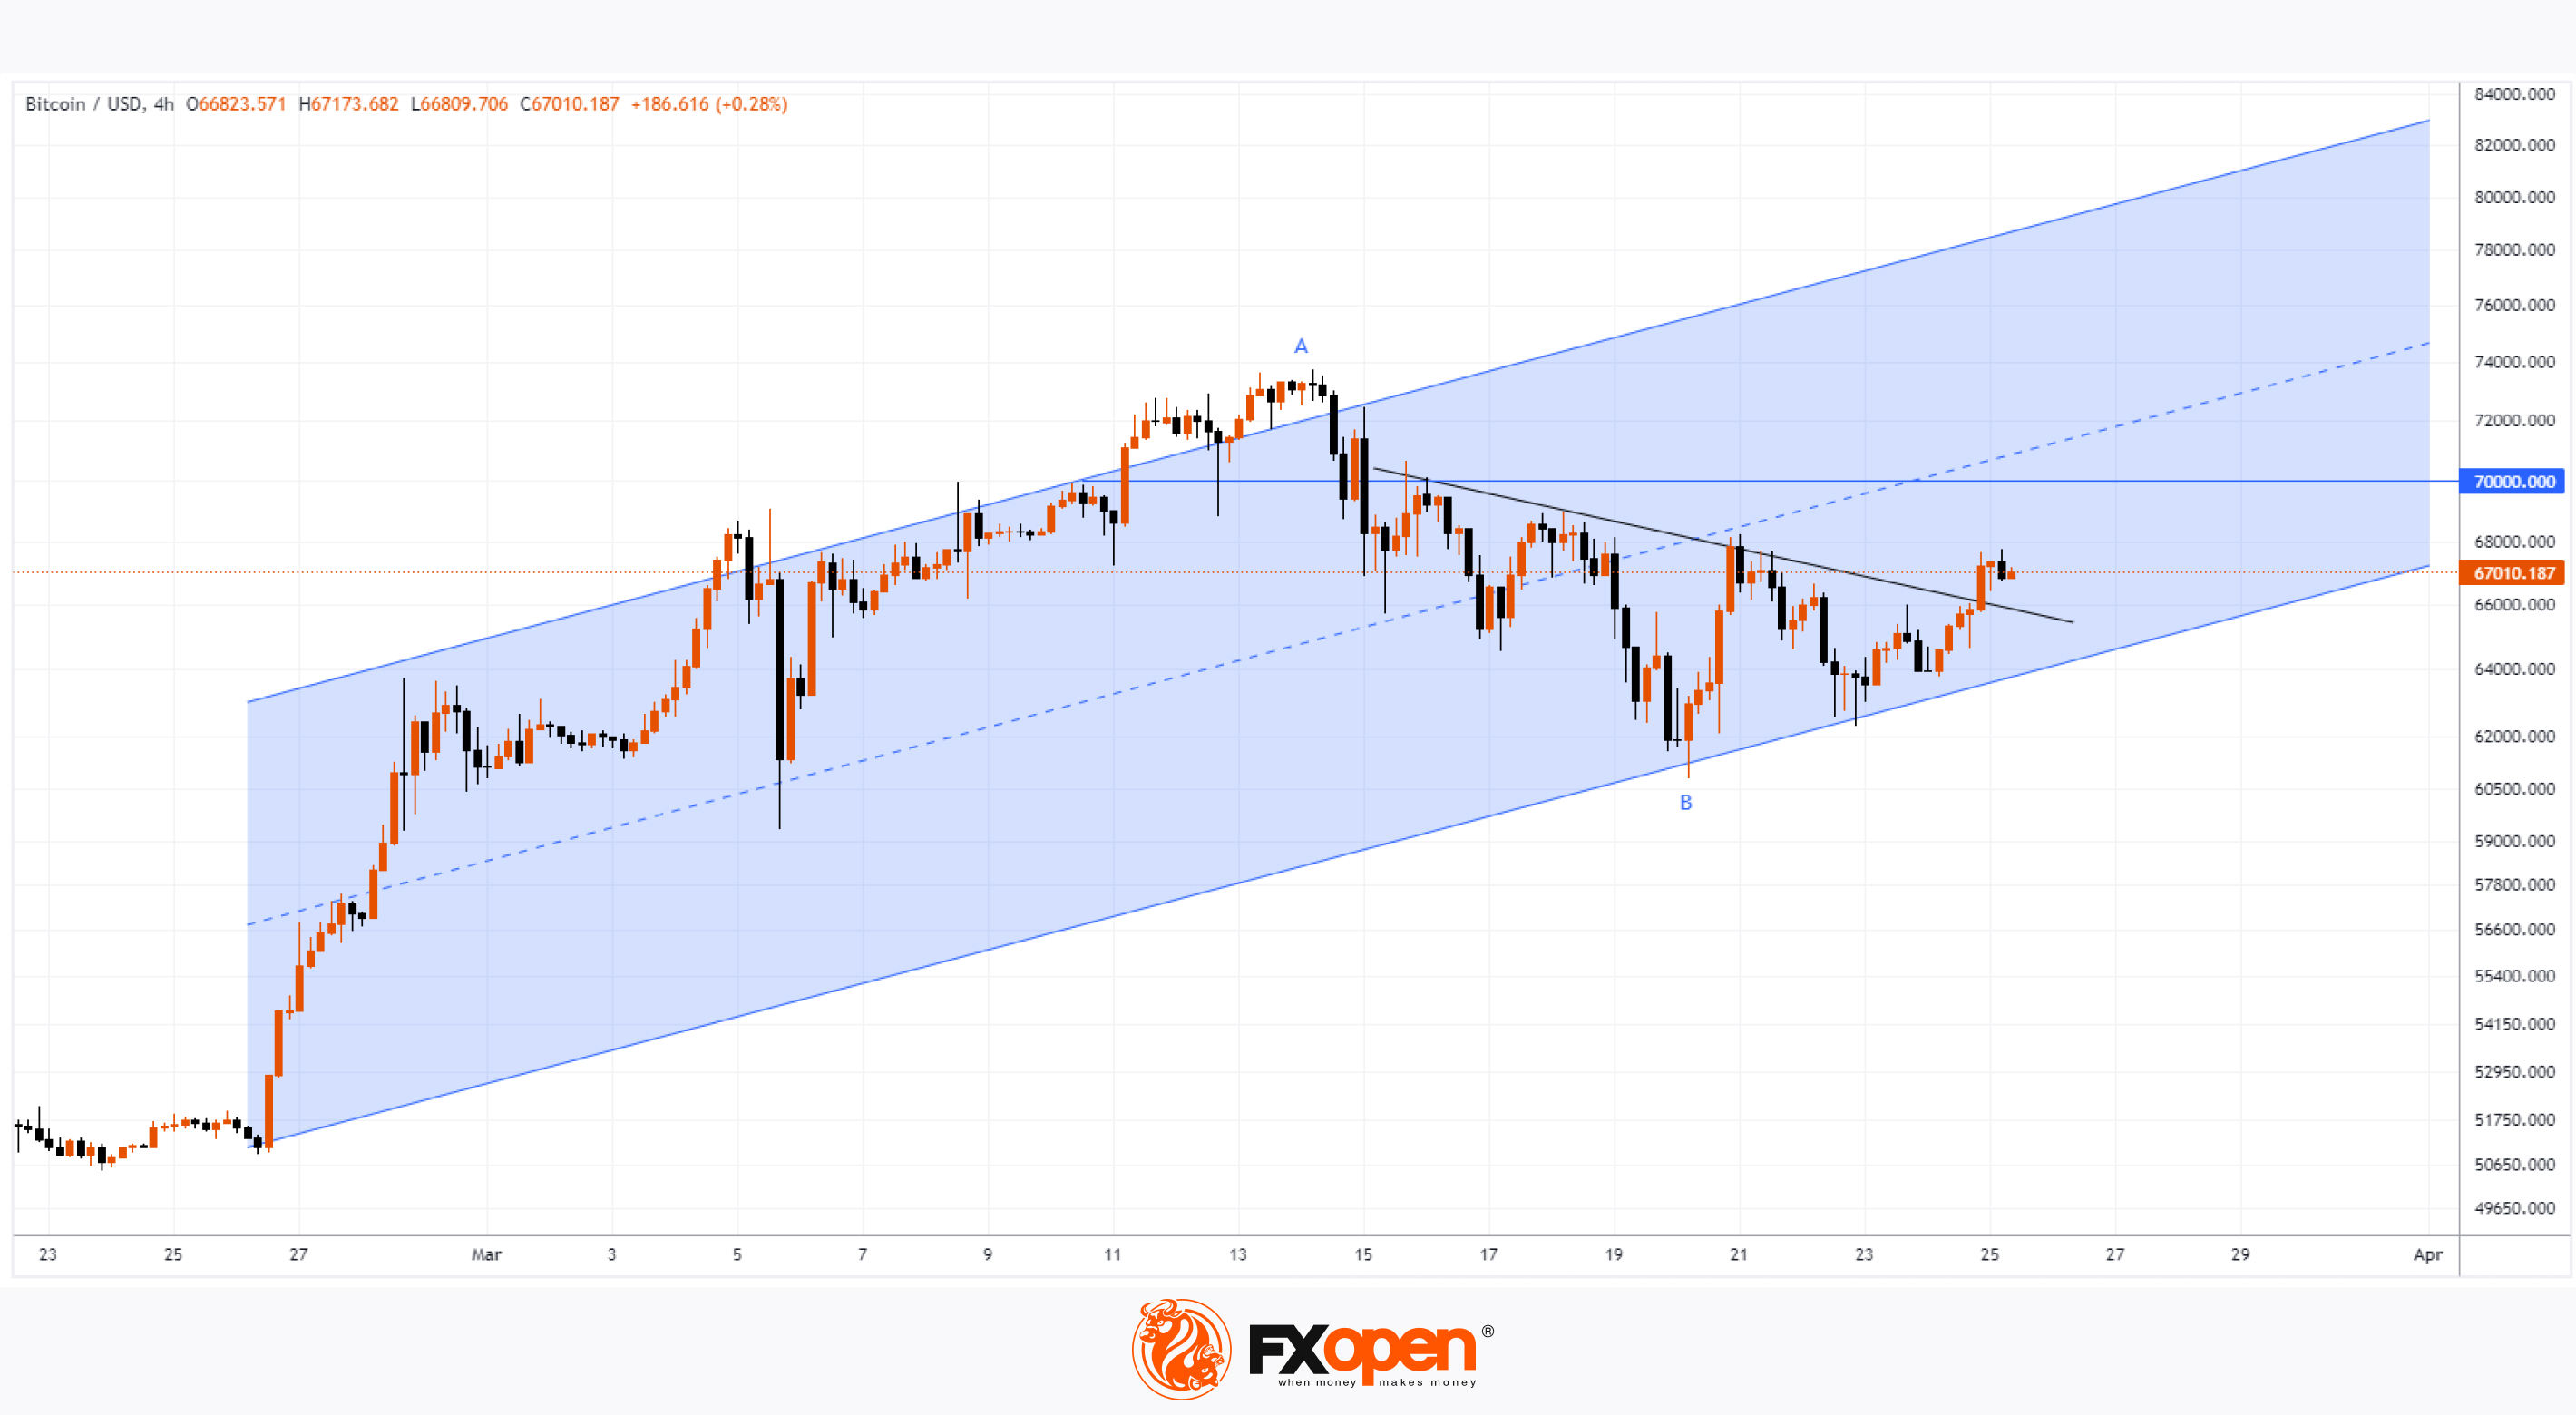
From the point of view of technical analysis of BTC/USD, on Friday evening the price of Bitcoin was near the lower boundary of the ascending channel (shown in blue). This was alarming as it indicated that the market action could result in a weekly bearish candle forming with the price of BTC down by around 5% — something that hasn't happened since August of last year.
However, this did not happen, as the price recovered over the weekend, forming rebounds from the lower border of the channel. The lower shadows of the candles are a sign of demand forces. Moreover, the bulls have broken through the downward trend line (shown in black). Will the bulls be able to return the price of Bitcoin to an upward trajectory within the specified trend?
Doubts remain.
→ Bitcoin “still looks overbought,” JPMorgan strategists warned, predicting a decline to USD 42k.
→ Bloomberg writes about record capital outflows from Bitcoin ETFs last week.
→ The level of 70k looks like an important psychological resistance. Above it, the Bitcoin price formed a double top pattern with an all-time high at point A, after which the bears clearly became more active. They successfully pushed the price to minimum B, breaking the support of the channel median line.
The price of Bitcoin starts the new week around the 50% retracement from the decline A→B (about -16%). This gives reason to assume the development of consolidation.
But if the price again falls to the lower border of the channel, then this will more clearly indicate the inability of the bulls to resume the upward trend — and therefore put the lower border of the channel at risk of a bearish breakout.
FXOpen offers the world's most popular cryptocurrency CFDs*, including Bitcoin and Ethereum. Floating spreads, 1:2 leverage — at your service. Open your trading account now or learn more about crypto CFD trading with FXOpen.
*At FXOpen UK and FXOpen AU, Cryptocurrency CFDs are only available for trading by those clients categorised as Professional clients under FCA Rules and Professional clients under AFSL 412871 – ABN 61 143 678 719 respectively. They are not available for trading by Retail clients.
CFDs are complex instruments and come with a high risk of losing your money.
This article represents the opinion of the Companies operating under the FXOpen brand only. It is not to be construed as an offer, solicitation, or recommendation with respect to products and services provided by the Companies operating under the FXOpen brand, nor is it to be considered financial advice.
Bitcoin Price Recovered over the Weekend, But Market Anxiety Remains
From the point of view of technical analysis of BTC/USD, on Friday evening the price of Bitcoin was near the lower boundary of the ascending channel (shown in blue). This was alarming as it indicated that the market action could result in a weekly bearish candle forming with the price of BTC down by around 5% — something that hasn't happened since August of last year.
However, this did not happen, as the price recovered over the weekend, forming rebounds from the lower border of the channel. The lower shadows of the candles are a sign of demand forces. Moreover, the bulls have broken through the downward trend line (shown in black). Will the bulls be able to return the price of Bitcoin to an upward trajectory within the specified trend?
Doubts remain.
→ Bitcoin “still looks overbought,” JPMorgan strategists warned, predicting a decline to USD 42k.
→ Bloomberg writes about record capital outflows from Bitcoin ETFs last week.
→ The level of 70k looks like an important psychological resistance. Above it, the Bitcoin price formed a double top pattern with an all-time high at point A, after which the bears clearly became more active. They successfully pushed the price to minimum B, breaking the support of the channel median line.
The price of Bitcoin starts the new week around the 50% retracement from the decline A→B (about -16%). This gives reason to assume the development of consolidation.
But if the price again falls to the lower border of the channel, then this will more clearly indicate the inability of the bulls to resume the upward trend — and therefore put the lower border of the channel at risk of a bearish breakout.
FXOpen offers the world's most popular cryptocurrency CFDs*, including Bitcoin and Ethereum. Floating spreads, 1:2 leverage — at your service. Open your trading account now or learn more about crypto CFD trading with FXOpen.
*At FXOpen UK and FXOpen AU, Cryptocurrency CFDs are only available for trading by those clients categorised as Professional clients under FCA Rules and Professional clients under AFSL 412871 – ABN 61 143 678 719 respectively. They are not available for trading by Retail clients.
CFDs are complex instruments and come with a high risk of losing your money.
This article represents the opinion of the Companies operating under the FXOpen brand only. It is not to be construed as an offer, solicitation, or recommendation with respect to products and services provided by the Companies operating under the FXOpen brand, nor is it to be considered financial advice.
👍3
#marketanalysis #MarketNews #tradingforex
USD/JPY Price Analysis: Consolidation ahead of US News
This morning, news about inflation in Japan was published. It did not bring any surprises — inflation in Japan is gradually weakening as expected. Core CPI in annual terms: actual = 2.3%, forecast = 2.5%, a month ago = 2.6%, a year ago = 3.0%.
We also note that the official position is aimed at preventing further weakening of the yen, as the USD/JPY price has risen more than 7% since the beginning of 2024 — very close to a 32-year high. Thus, Japanese Deputy Finance Minister for Economic Affairs Masato Kanda yesterday warned that the current weakening of the yen does not correspond to fundamental indicators and is clearly caused by speculation. He concluded that the authorities would take appropriate measures against excessive fluctuations.
However, neither verbal interventions nor the publication of Japanese Core CPI values led to strong fluctuations in the USD/JPY market. Why so?
From a fundamental analysis point of view, market participants are keeping their focus on the publication of Core PCE Price Index values in the US, as well as the Fed Chairman's speech — both events are scheduled for Friday (at 15:30 and 18:30 GMT+3, respectively).
From a technical analysis point of view, the market stabilization is quite natural, since the USD/JPY price today is near the median line of the ascending channel (shown in blue), which describes the trajectory of 2024. The market seems to be cooling down after the RSI indicated it was overbought on March 20th.
It is the events of Friday that can bring the market out of the current equilibrium state (despite the fact that Friday is a day off in many countries, volatility can be high).
In case of bearish activity, the USD/JPY price may be supported by a zone consisting of:
→ the lower line of the border of the ascending channel;
→ psychological level of 150 yen per US dollar;
→ support from a local minimum of about 150.30 yen per US dollar.
If the market goes out of balance towards the upper boundary of the channel, market sentiment will likely be influenced by expectations of the Bank of Japan's reaction to an excessively weak yen — and this may not only be verbal interventions.
Trade over 50 forex markets 24 hours a day with FXOpen. Take advantage of low commissions, deep liquidity, and spreads from 0.0 pips. Open your FXOpen account now or learn more about trading forex with FXOpen.
CFDs are complex instruments and come with a high risk of losing your money.
This article represents the opinion of the Companies operating under the FXOpen brand only. It is not to be construed as an offer, solicitation, or recommendation with respect to products and services provided by the Companies operating under the FXOpen brand, nor is it to be considered financial advice.
USD/JPY Price Analysis: Consolidation ahead of US News
This morning, news about inflation in Japan was published. It did not bring any surprises — inflation in Japan is gradually weakening as expected. Core CPI in annual terms: actual = 2.3%, forecast = 2.5%, a month ago = 2.6%, a year ago = 3.0%.
We also note that the official position is aimed at preventing further weakening of the yen, as the USD/JPY price has risen more than 7% since the beginning of 2024 — very close to a 32-year high. Thus, Japanese Deputy Finance Minister for Economic Affairs Masato Kanda yesterday warned that the current weakening of the yen does not correspond to fundamental indicators and is clearly caused by speculation. He concluded that the authorities would take appropriate measures against excessive fluctuations.
However, neither verbal interventions nor the publication of Japanese Core CPI values led to strong fluctuations in the USD/JPY market. Why so?
From a fundamental analysis point of view, market participants are keeping their focus on the publication of Core PCE Price Index values in the US, as well as the Fed Chairman's speech — both events are scheduled for Friday (at 15:30 and 18:30 GMT+3, respectively).
From a technical analysis point of view, the market stabilization is quite natural, since the USD/JPY price today is near the median line of the ascending channel (shown in blue), which describes the trajectory of 2024. The market seems to be cooling down after the RSI indicated it was overbought on March 20th.
It is the events of Friday that can bring the market out of the current equilibrium state (despite the fact that Friday is a day off in many countries, volatility can be high).
In case of bearish activity, the USD/JPY price may be supported by a zone consisting of:
→ the lower line of the border of the ascending channel;
→ psychological level of 150 yen per US dollar;
→ support from a local minimum of about 150.30 yen per US dollar.
If the market goes out of balance towards the upper boundary of the channel, market sentiment will likely be influenced by expectations of the Bank of Japan's reaction to an excessively weak yen — and this may not only be verbal interventions.
Trade over 50 forex markets 24 hours a day with FXOpen. Take advantage of low commissions, deep liquidity, and spreads from 0.0 pips. Open your FXOpen account now or learn more about trading forex with FXOpen.
CFDs are complex instruments and come with a high risk of losing your money.
This article represents the opinion of the Companies operating under the FXOpen brand only. It is not to be construed as an offer, solicitation, or recommendation with respect to products and services provided by the Companies operating under the FXOpen brand, nor is it to be considered financial advice.

👍4
#XAUUSD #goldprice #MarketNews #marketanalysis
XAU/USD Analysis: The Price is Forming an Important Bearish Pattern
On March 21, the price of gold reached a new historical maximum, exceeding the level of 2,220 per ounce on the spot market. What bullish drivers contributed to the rise in the price of XAU/USD?
→ According to analysts at Goldman Sachs, commodities could generate a return of 15% in 2024, as the expected rate cut in the US, absent a recession, leads to higher commodity prices. At the same time, the largest increase in prices occurs in metals and then in oil.
→ Also bullish drivers are the geopolitical background (threats of expansion of existing and emergence of new military conflicts) and uncertainty associated with the increasing US national debt.
Will the price of XAU/USD continue its growth rate in the future?
From the point of view of technical analysis of the price of gold, there are arguments to expect a correction in the market:
→ The price of XAU/USD today is within the uptrend (shown by the blue channel), which begins in 2023.
→ In March, the price of gold reached the upper boundary of the channel, which acts as resistance.
→ Long upper shadows on the candles, which appeared when the price rose above USd 2,180, indicate the activation of sellers (they may be motivated to take profits in the area of historical highs).
→ The RSI indicator indicates bearish divergence.
→ Formation of an important bearish head-and-shoulders pattern (SHS).
Today, the gold chart shows that the price is held by the trend line shown in orange (aka the neck line of the SHS pattern), but it is possible that the following will be formed sequentially on the chart:
→ signs of the bulls’ inability to push off the orange line;
→ bearish breakdown of the orange line;
→ successful test of the breakdown level.
In such a scenario, market sentiment could change dramatically, opening up the prospect of a correction within the large blue channel - for example, testing the psychological level of USD 2,100.
Start trading commodity CFDs with tight spreads. Open your trading account now or learn more about trading commodity CFDs with FXOpen.
CFDs are complex instruments and come with a high risk of losing your money.
This article represents the opinion of the Companies operating under the FXOpen brand only. It is not to be construed as an offer, solicitation, or recommendation with respect to products and services provided by the Companies operating under the FXOpen brand, nor is it to be considered financial advice.
XAU/USD Analysis: The Price is Forming an Important Bearish Pattern
On March 21, the price of gold reached a new historical maximum, exceeding the level of 2,220 per ounce on the spot market. What bullish drivers contributed to the rise in the price of XAU/USD?
→ According to analysts at Goldman Sachs, commodities could generate a return of 15% in 2024, as the expected rate cut in the US, absent a recession, leads to higher commodity prices. At the same time, the largest increase in prices occurs in metals and then in oil.
→ Also bullish drivers are the geopolitical background (threats of expansion of existing and emergence of new military conflicts) and uncertainty associated with the increasing US national debt.
Will the price of XAU/USD continue its growth rate in the future?
From the point of view of technical analysis of the price of gold, there are arguments to expect a correction in the market:
→ The price of XAU/USD today is within the uptrend (shown by the blue channel), which begins in 2023.
→ In March, the price of gold reached the upper boundary of the channel, which acts as resistance.
→ Long upper shadows on the candles, which appeared when the price rose above USd 2,180, indicate the activation of sellers (they may be motivated to take profits in the area of historical highs).
→ The RSI indicator indicates bearish divergence.
→ Formation of an important bearish head-and-shoulders pattern (SHS).
Today, the gold chart shows that the price is held by the trend line shown in orange (aka the neck line of the SHS pattern), but it is possible that the following will be formed sequentially on the chart:
→ signs of the bulls’ inability to push off the orange line;
→ bearish breakdown of the orange line;
→ successful test of the breakdown level.
In such a scenario, market sentiment could change dramatically, opening up the prospect of a correction within the large blue channel - for example, testing the psychological level of USD 2,100.
Start trading commodity CFDs with tight spreads. Open your trading account now or learn more about trading commodity CFDs with FXOpen.
CFDs are complex instruments and come with a high risk of losing your money.
This article represents the opinion of the Companies operating under the FXOpen brand only. It is not to be construed as an offer, solicitation, or recommendation with respect to products and services provided by the Companies operating under the FXOpen brand, nor is it to be considered financial advice.

👍3
#nikkei225 #stockmarket #stocks #marketanalysis
NIKKEI-225 Analysis Indicates Possibility of Correction from Historically High Levels
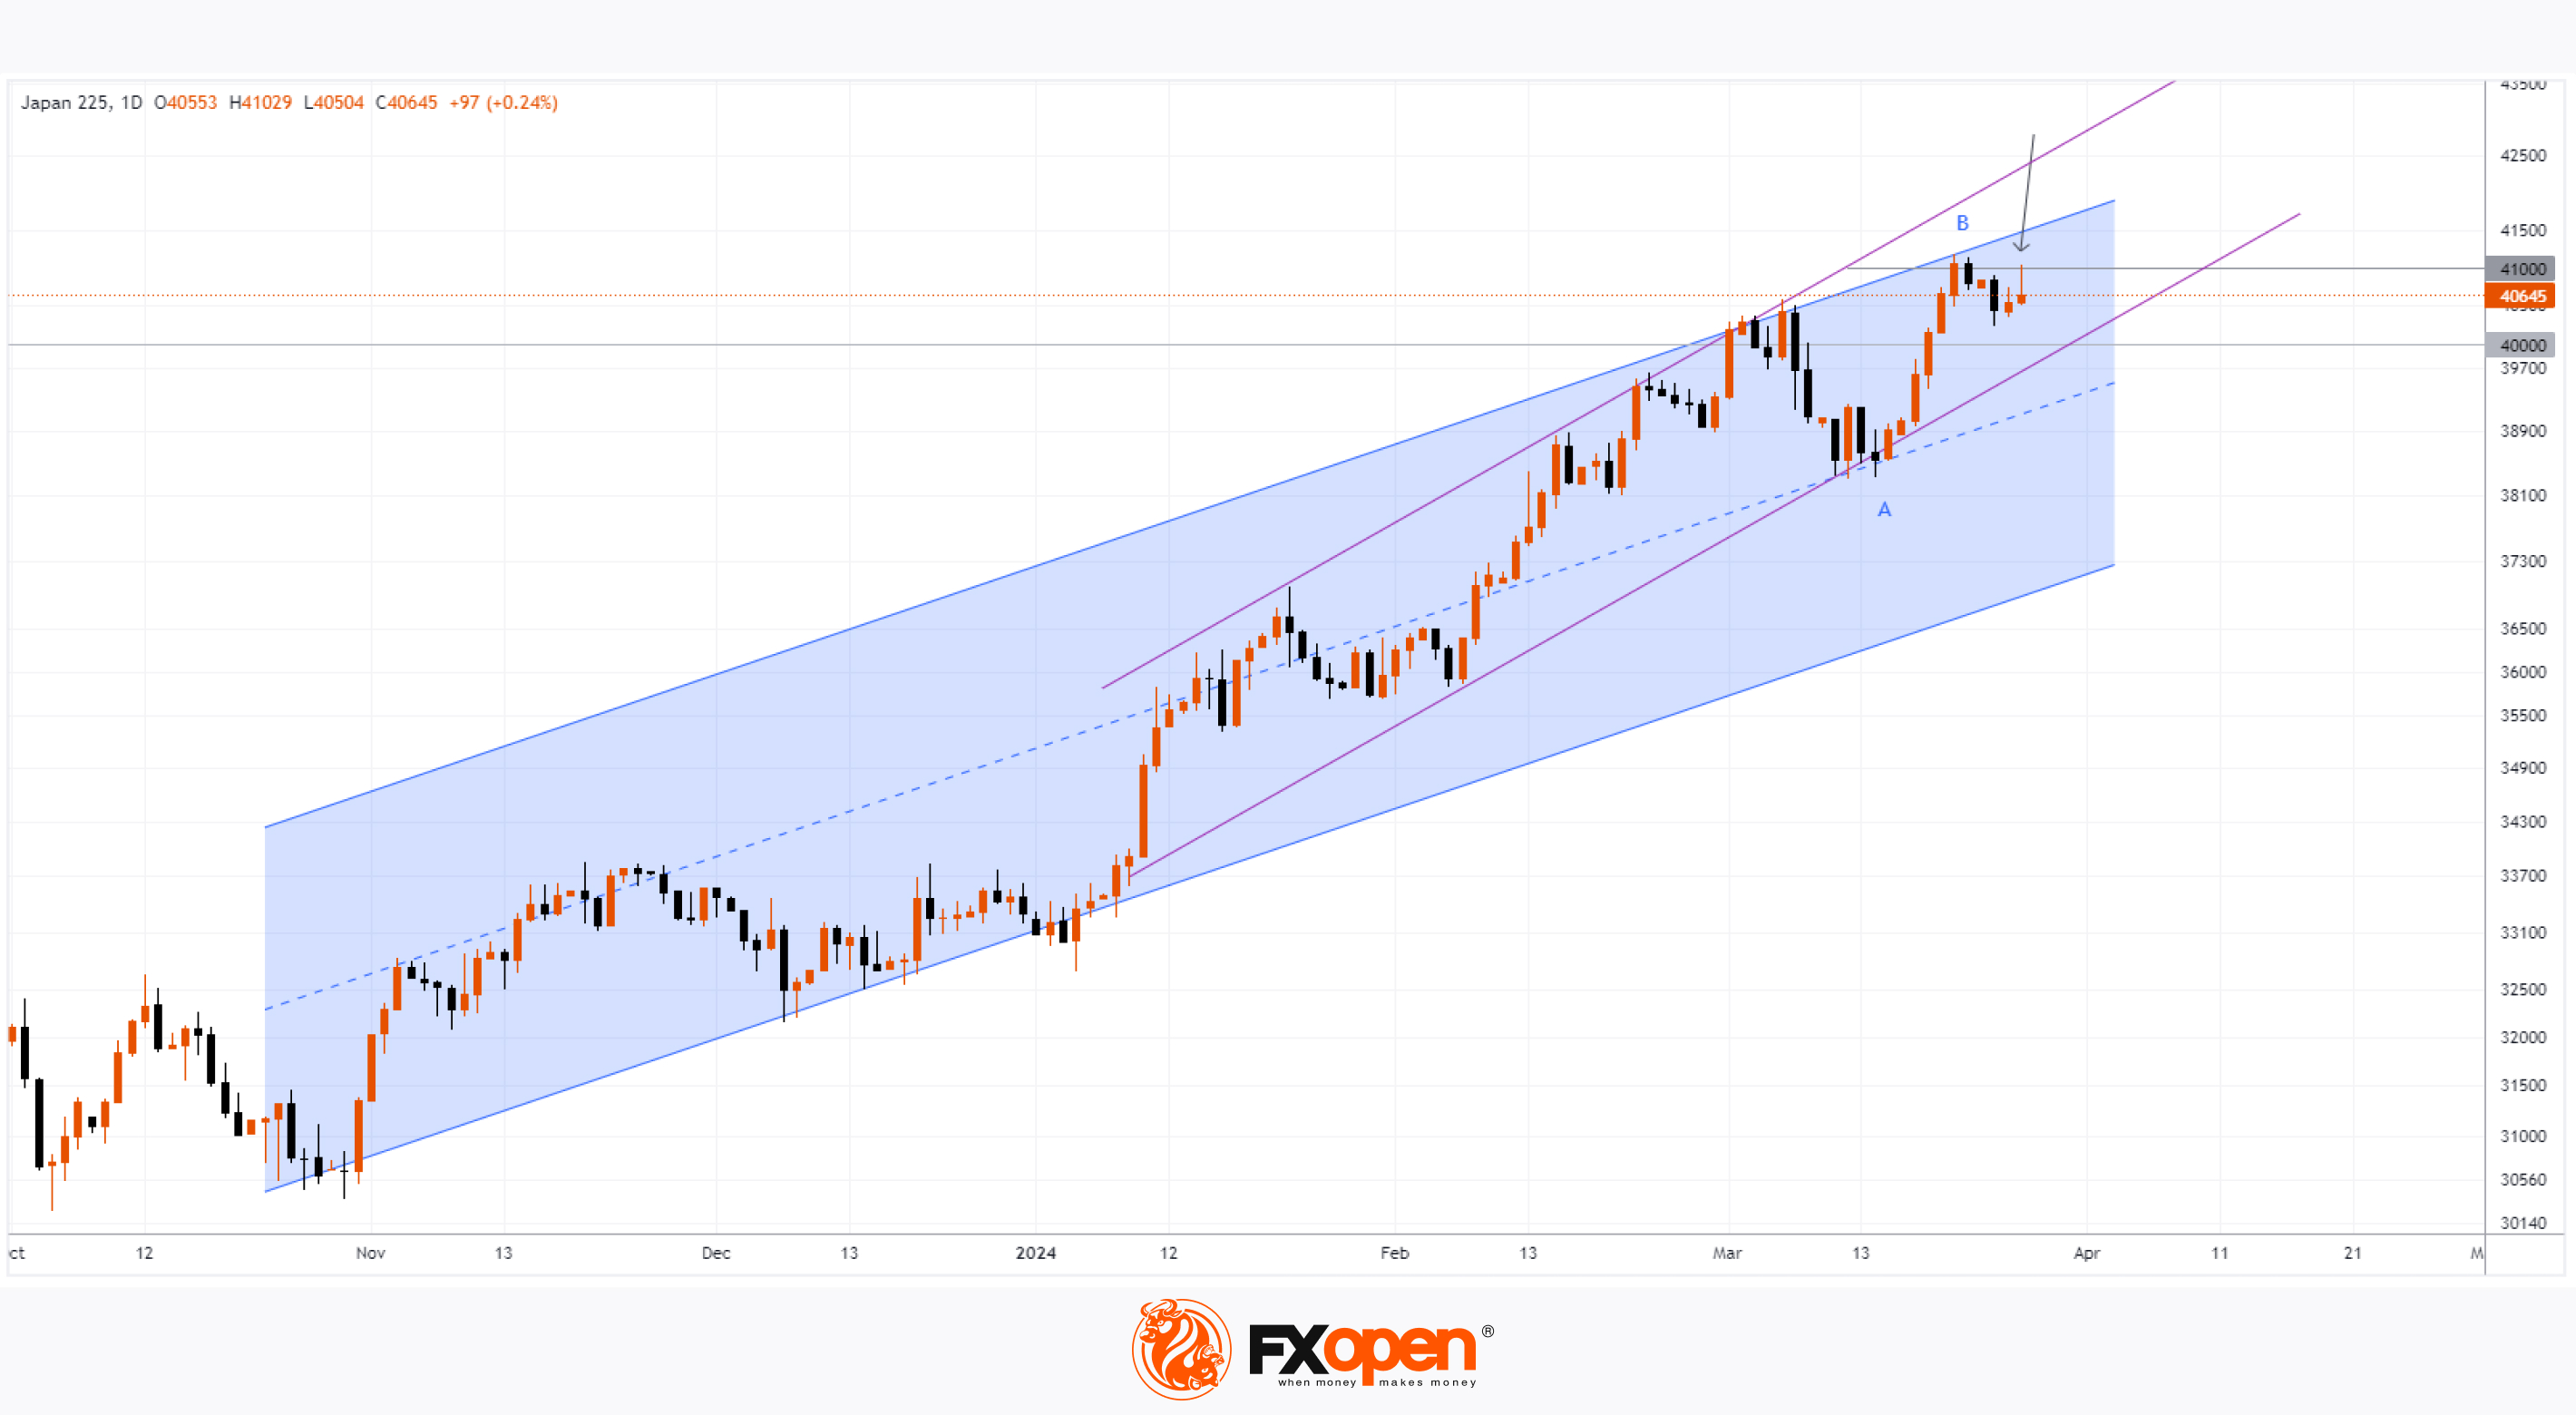
On March 21, the value of the Japanese stock index reached a historical maximum, exceeding the level of 41,100 points. This was facilitated by:
→ Weak yen supporting exporters. It increases the value of profits earned abroad for a large number of companies that sell their products abroad and then convert the profits into yen.
→ Demand for shares of Japanese companies paying dividends. For example, shares of air conditioner manufacturer Daikin Industries rose by 2.82%.
At the same time, the NIKKEI-225 chart signals indicate the likelihood of a correction, since:
→ The price is near the upper border of the ascending channel, from which resistance can be expected.
→ Based on the results of trading in the Asian session, a long upper shadow is forming on today’s candle – a sign of selling pressure (as shown by the arrow). It seems that the price of NIKKEI-225 is difficult to stay above the level of 41,000.
If the Japanese stock market follows a correction scenario, the price of NIKKEI-225 may be supported by:
→ the lower boundary of a steeper ascending channel (shown in purple), which runs in the area of the Fibonacci level = 50% of the A→B impulse;
→ psychological level of 40,000.
Bearish sentiment for NIKKEI-225 could be triggered by decisions from the Bank of Japan and the Ministry of Finance, which are concerned about the weakness of the yen — the USD/JPY rate is today near a 34-year low.
Buy and sell stocks of the world's biggest publicly-listed companies with CFDs on FXOpen’s trading platform. Open your FXOpen account now or learn more about trading share CFDs with FXOpen.
CFDs are complex instruments and come with a high risk of losing your money.
This article represents the opinion of the Companies operating under the FXOpen brand only. It is not to be construed as an offer, solicitation, or recommendation with respect to products and services provided by the Companies operating under the FXOpen brand, nor is it to be considered financial advice.
NIKKEI-225 Analysis Indicates Possibility of Correction from Historically High Levels
On March 21, the value of the Japanese stock index reached a historical maximum, exceeding the level of 41,100 points. This was facilitated by:
→ Weak yen supporting exporters. It increases the value of profits earned abroad for a large number of companies that sell their products abroad and then convert the profits into yen.
→ Demand for shares of Japanese companies paying dividends. For example, shares of air conditioner manufacturer Daikin Industries rose by 2.82%.
At the same time, the NIKKEI-225 chart signals indicate the likelihood of a correction, since:
→ The price is near the upper border of the ascending channel, from which resistance can be expected.
→ Based on the results of trading in the Asian session, a long upper shadow is forming on today’s candle – a sign of selling pressure (as shown by the arrow). It seems that the price of NIKKEI-225 is difficult to stay above the level of 41,000.
If the Japanese stock market follows a correction scenario, the price of NIKKEI-225 may be supported by:
→ the lower boundary of a steeper ascending channel (shown in purple), which runs in the area of the Fibonacci level = 50% of the A→B impulse;
→ psychological level of 40,000.
Bearish sentiment for NIKKEI-225 could be triggered by decisions from the Bank of Japan and the Ministry of Finance, which are concerned about the weakness of the yen — the USD/JPY rate is today near a 34-year low.
Buy and sell stocks of the world's biggest publicly-listed companies with CFDs on FXOpen’s trading platform. Open your FXOpen account now or learn more about trading share CFDs with FXOpen.
CFDs are complex instruments and come with a high risk of losing your money.
This article represents the opinion of the Companies operating under the FXOpen brand only. It is not to be construed as an offer, solicitation, or recommendation with respect to products and services provided by the Companies operating under the FXOpen brand, nor is it to be considered financial advice.
👍3
#marketanalysis #forextrading #MarketNews
EUR/USD Analysis: The Price Today Has Set Its Minimum Since the Beginning of March
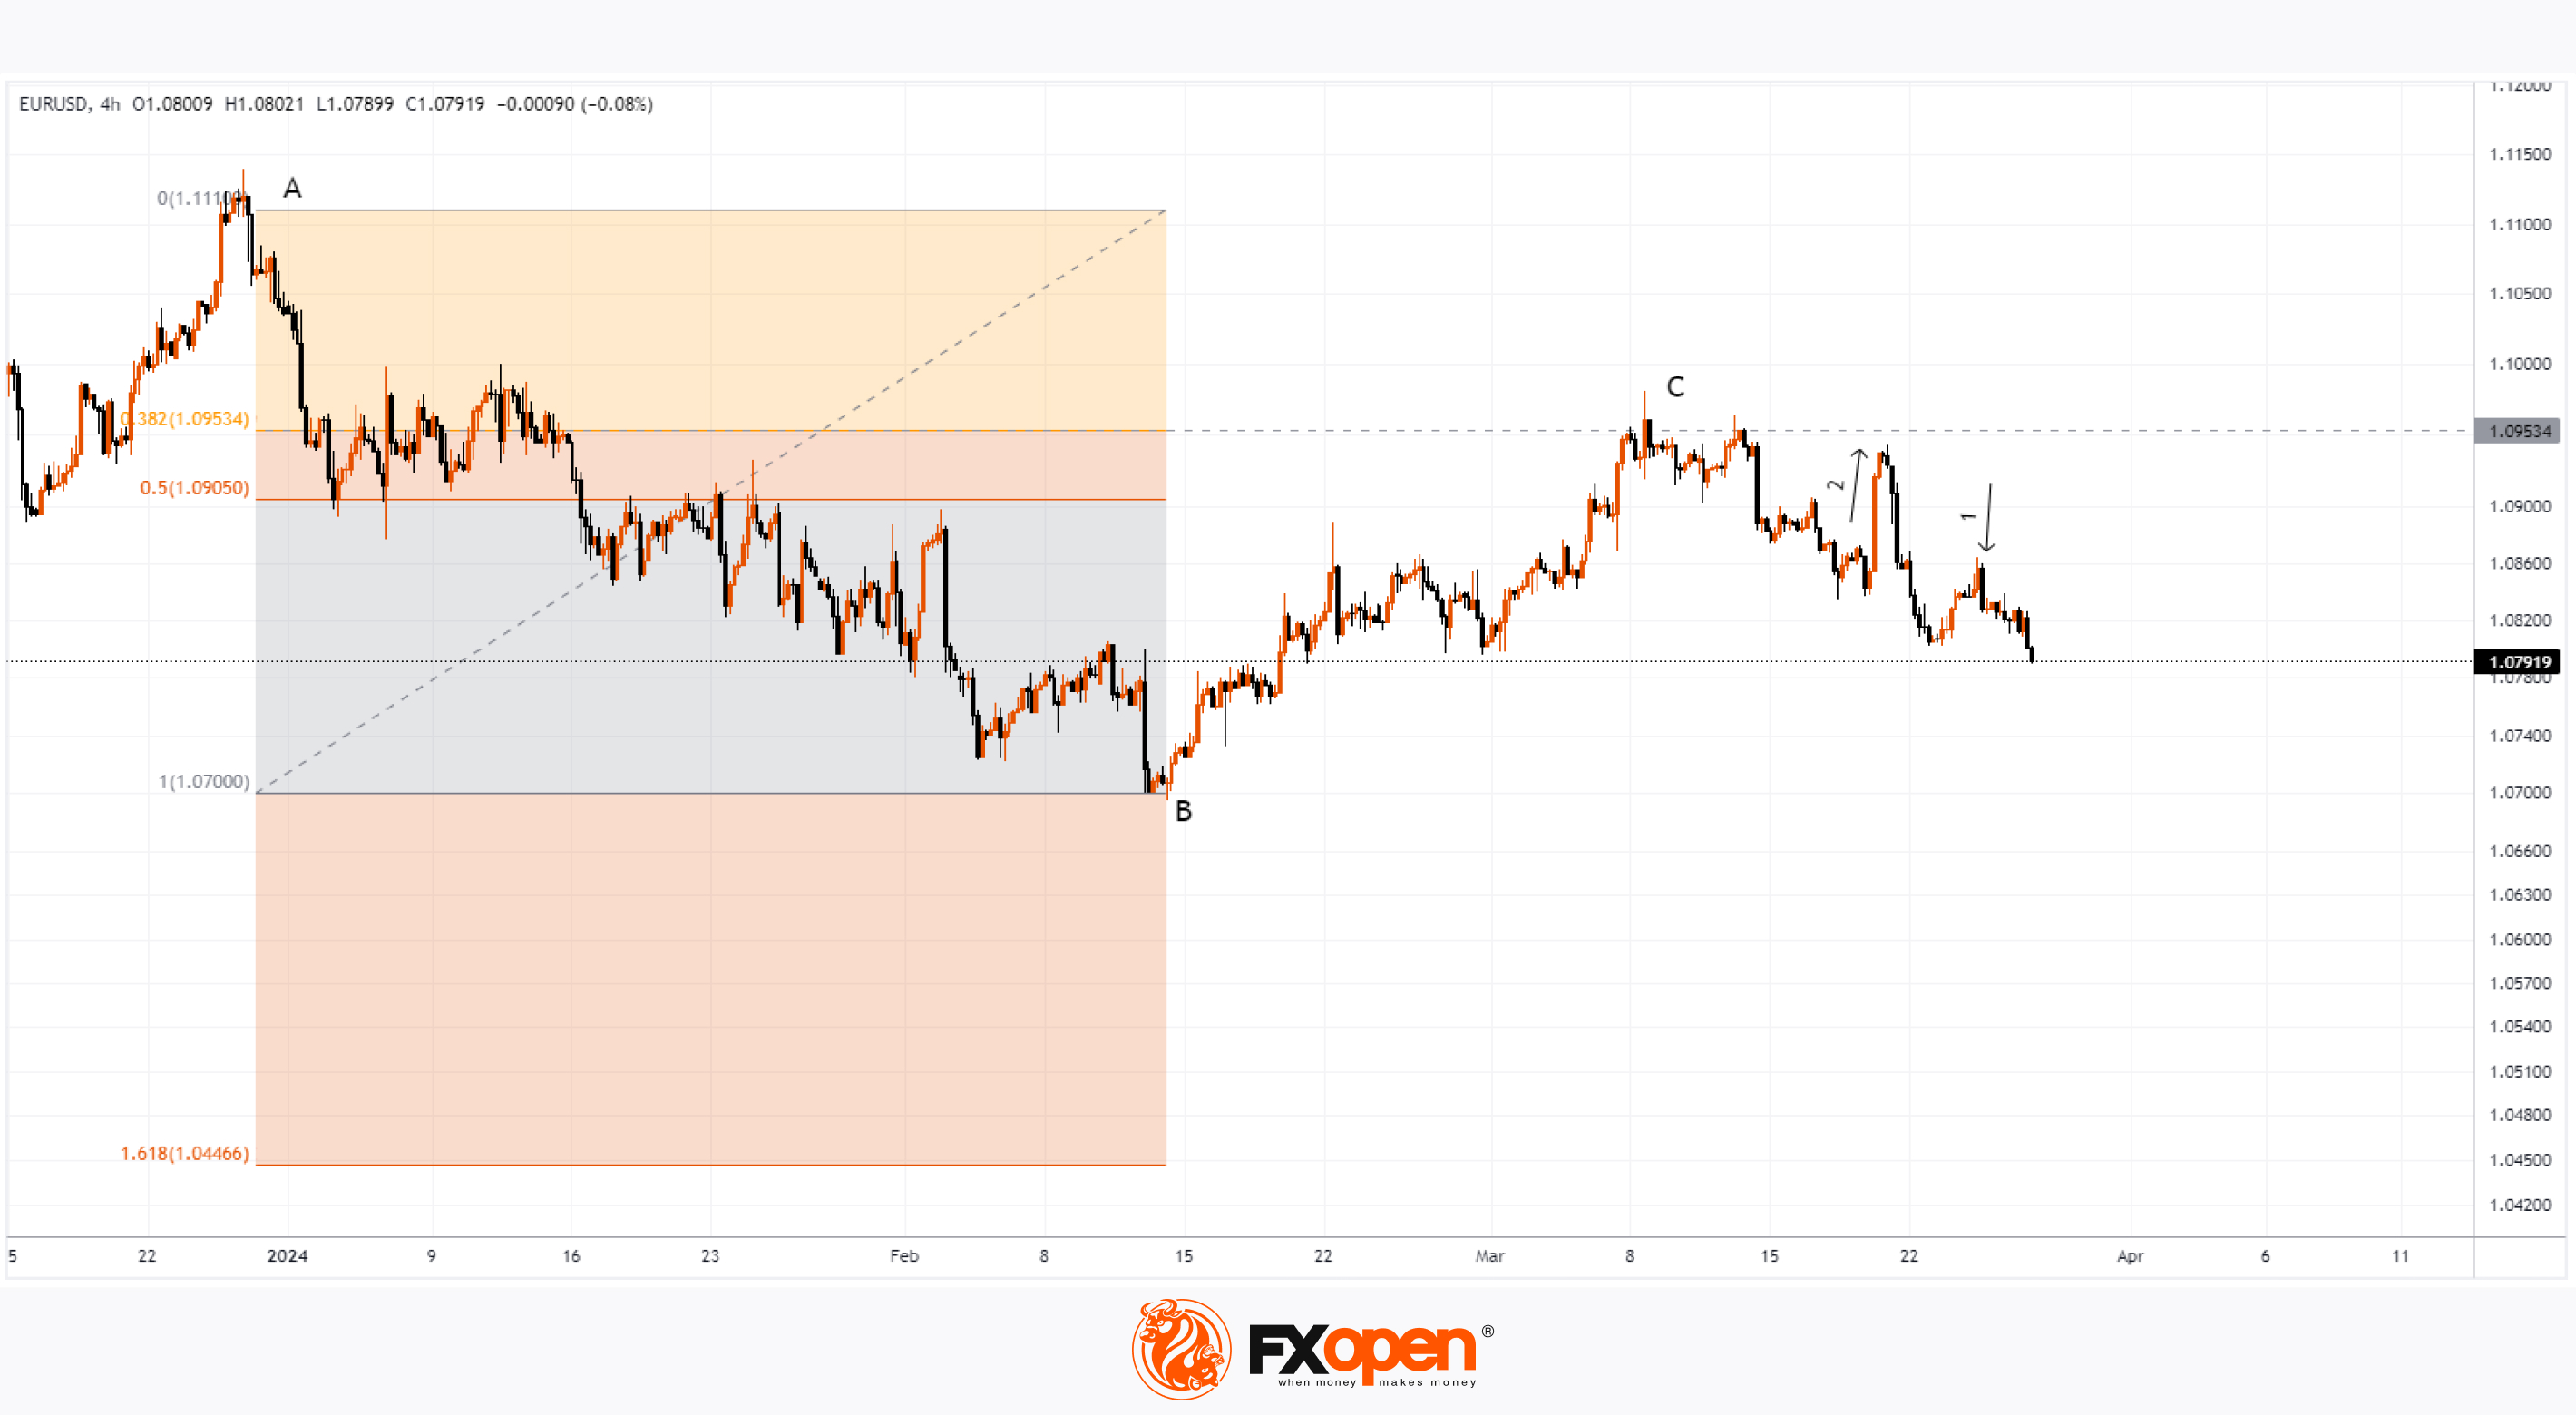
As the EUR/USD chart shows at the start of the European session today, the exchange rate has dropped below EUR 1.08 per US dollar.
Tuesday's news contributed to this. According to Nasdaq.com, on March 26, 2024, The Conference Board published a report for March, according to which the CB Consumer Confidence index of consumer confidence dropped sharply: fact = 104.7; forecast = 107.0; previous value = 106.7. Comments followed: “Consumers remain concerned about increased price levels, which dominates the responses. March written responses showed growing concerns about food and gasoline prices.”
As a result, the US dollar strengthened (as shown by arrow No. 1). After all, if the published data give grounds to assess inflation as high, then the Fed’s tough policy may last longer.
Today's decline reflects a rebalancing in market sentiment.
Fed spokesman Christopher Waller added doubts about easing monetary policy yesterday, saying that the economy does not require a dramatic reduction in rates, so the Fed is in no hurry.
Could the US dollar strengthen further against the euro?
This prospect is supported by the assumption that medium-term traders who opened long positions on March 20 in response to the growth of EUR/USD (shown by arrow No. 2) are now actively closing positions, creating additional pressure.
Technical analysis of EUR/USD provides another argument: the increase in B→C stopped at the Fibonacci level of 0.382, formed from the decline in A→B. Thus, according to wave theory and Fibonacci proportions, the current decline may reach the level of 1.618, which approximately corresponds to the 2024 low.
Euro bulls have enough reasons to be cautious.
Trade over 50 forex markets 24 hours a day with FXOpen. Take advantage of low commissions, deep liquidity, and spreads from 0.0 pips. Open your FXOpen account now or learn more about trading forex with FXOpen.
CFDs are complex instruments and come with a high risk of losing your money.
This article represents the opinion of the Companies operating under the FXOpen brand only. It is not to be construed as an offer, solicitation, or recommendation with respect to products and services provided by the Companies operating under the FXOpen brand, nor is it to be considered financial advice.
EUR/USD Analysis: The Price Today Has Set Its Minimum Since the Beginning of March
As the EUR/USD chart shows at the start of the European session today, the exchange rate has dropped below EUR 1.08 per US dollar.
Tuesday's news contributed to this. According to Nasdaq.com, on March 26, 2024, The Conference Board published a report for March, according to which the CB Consumer Confidence index of consumer confidence dropped sharply: fact = 104.7; forecast = 107.0; previous value = 106.7. Comments followed: “Consumers remain concerned about increased price levels, which dominates the responses. March written responses showed growing concerns about food and gasoline prices.”
As a result, the US dollar strengthened (as shown by arrow No. 1). After all, if the published data give grounds to assess inflation as high, then the Fed’s tough policy may last longer.
Today's decline reflects a rebalancing in market sentiment.
Fed spokesman Christopher Waller added doubts about easing monetary policy yesterday, saying that the economy does not require a dramatic reduction in rates, so the Fed is in no hurry.
Could the US dollar strengthen further against the euro?
This prospect is supported by the assumption that medium-term traders who opened long positions on March 20 in response to the growth of EUR/USD (shown by arrow No. 2) are now actively closing positions, creating additional pressure.
Technical analysis of EUR/USD provides another argument: the increase in B→C stopped at the Fibonacci level of 0.382, formed from the decline in A→B. Thus, according to wave theory and Fibonacci proportions, the current decline may reach the level of 1.618, which approximately corresponds to the 2024 low.
Euro bulls have enough reasons to be cautious.
Trade over 50 forex markets 24 hours a day with FXOpen. Take advantage of low commissions, deep liquidity, and spreads from 0.0 pips. Open your FXOpen account now or learn more about trading forex with FXOpen.
CFDs are complex instruments and come with a high risk of losing your money.
This article represents the opinion of the Companies operating under the FXOpen brand only. It is not to be construed as an offer, solicitation, or recommendation with respect to products and services provided by the Companies operating under the FXOpen brand, nor is it to be considered financial advice.
👍3
#stockmarket #nvidia #NVDA #stocktrading
Stock Market Analysis: NVDA Losing Leadership?
Since the start of the week, the S&P-500 Index (US500) is up about 0.58% while NVDA's share price is down about 3.8%. This is a worrying sign for Nvidia stock investors — could it be a sign that NVDA is no longer the market leader?
Dubravko Lakos-Bujas, JPMorgan's chief equity strategist, warned of a potential "surprise" shock to the stock market, Bloomberg reported. He's noticed a trend in recent history where gains in popular momentum stocks like NVDA are often followed by corrections. This situation has repeated itself three times since the 2008 global financial crisis.
“One day this may happen completely unexpectedly. This has happened in the past; we’ve had flash collapses,” Lakos-Bujas said in the webinar. “One large fund starts cutting some positions, a second fund hears this and tries to reposition, a third fund is basically caught off guard, and then, you know, we start to unwind more and more momentum.”
He noted the potential for innovation in artificial intelligence as a major source of surprise, emphasizing that these opportunities are dwindling and risks are growing in the background.
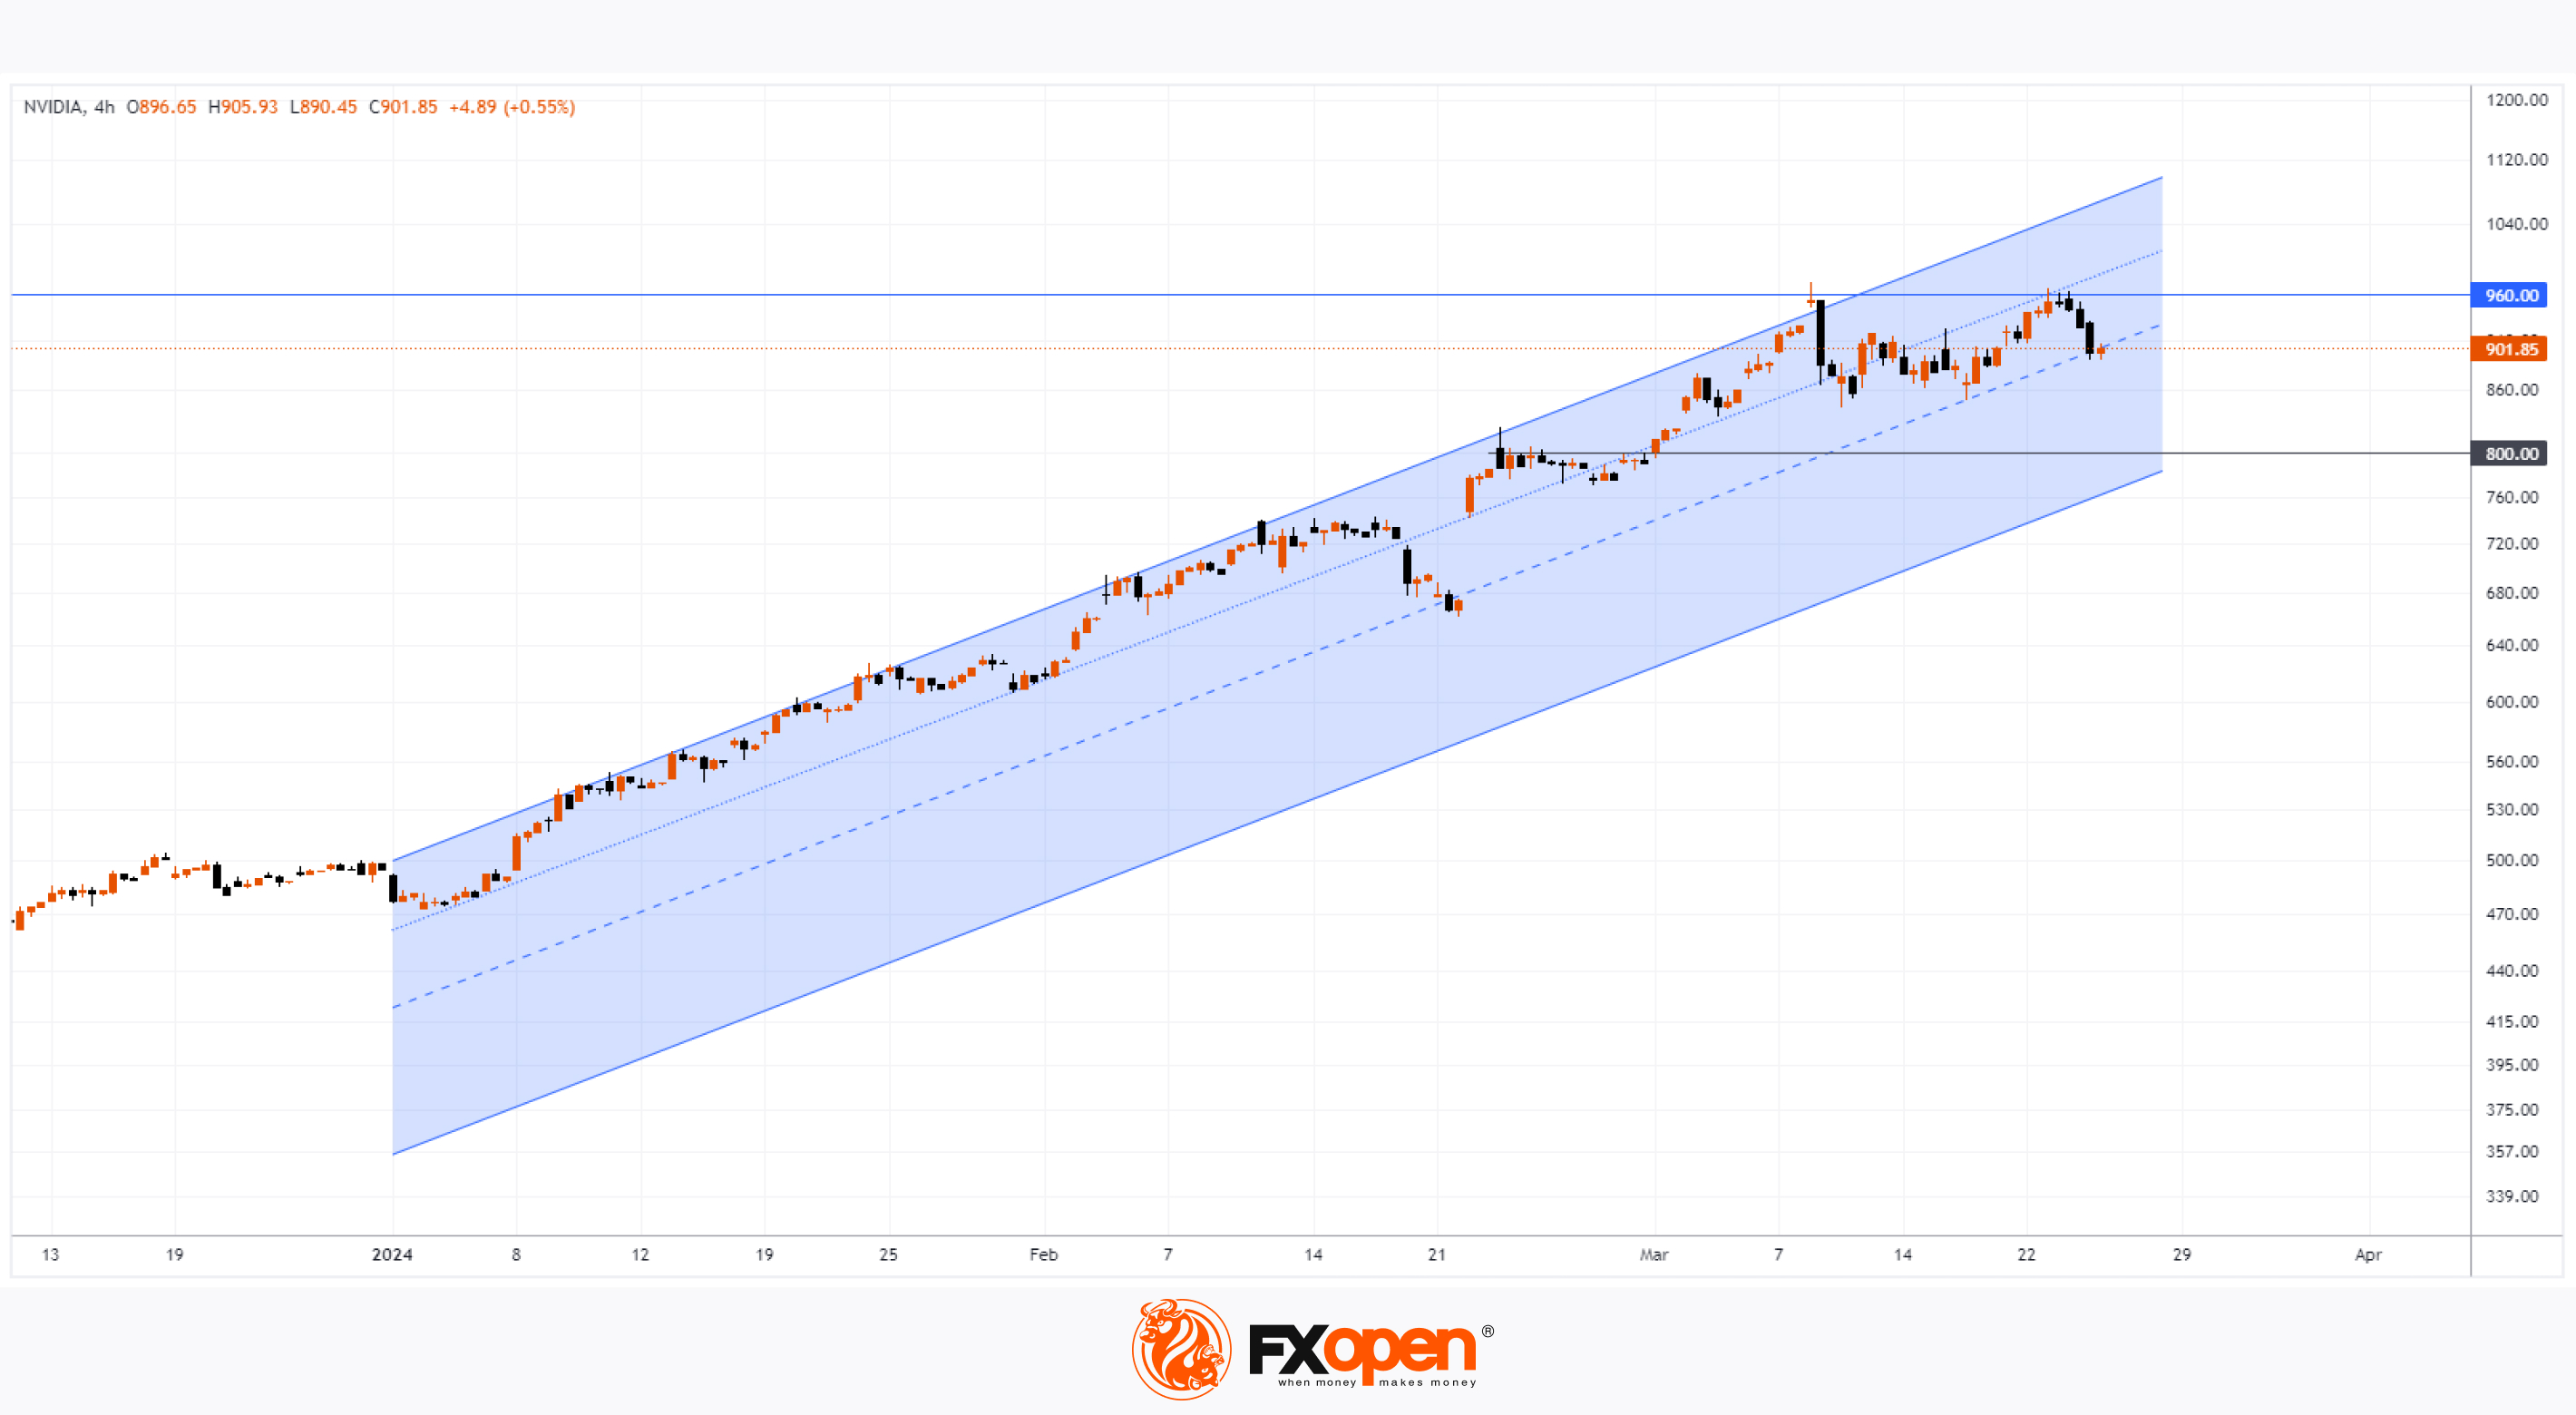
Technical analysis of NVDA shares shows that:
→ so far the price is in an upward trend - its contours are shown by the blue channel;
→ yesterday’s close lowered the price to its median line;
→ the $960 level looks like an important resistance.
The all-time high is approximately 100% of NVDA's share price at the start of the year - the price has doubled in less than 3 months, so a correction appears natural in this extremely hot market. It is possible that the price of NVDA may roll back to the lower border of the channel and test the psychological level of $800 per share.
Buy and sell stocks of the world's biggest publicly-listed companies with CFDs on FXOpen’s trading platform. Open your FXOpen account now or learn more about trading share CFDs with FXOpen.
CFDs are complex instruments and come with a high risk of losing your money.
This article represents the opinion of the Companies operating under the FXOpen brand only. It is not to be construed as an offer, solicitation, or recommendation with respect to products and services provided by the Companies operating under the FXOpen brand, nor is it to be considered financial advice.
Stock Market Analysis: NVDA Losing Leadership?
Since the start of the week, the S&P-500 Index (US500) is up about 0.58% while NVDA's share price is down about 3.8%. This is a worrying sign for Nvidia stock investors — could it be a sign that NVDA is no longer the market leader?
Dubravko Lakos-Bujas, JPMorgan's chief equity strategist, warned of a potential "surprise" shock to the stock market, Bloomberg reported. He's noticed a trend in recent history where gains in popular momentum stocks like NVDA are often followed by corrections. This situation has repeated itself three times since the 2008 global financial crisis.
“One day this may happen completely unexpectedly. This has happened in the past; we’ve had flash collapses,” Lakos-Bujas said in the webinar. “One large fund starts cutting some positions, a second fund hears this and tries to reposition, a third fund is basically caught off guard, and then, you know, we start to unwind more and more momentum.”
He noted the potential for innovation in artificial intelligence as a major source of surprise, emphasizing that these opportunities are dwindling and risks are growing in the background.
Technical analysis of NVDA shares shows that:
→ so far the price is in an upward trend - its contours are shown by the blue channel;
→ yesterday’s close lowered the price to its median line;
→ the $960 level looks like an important resistance.
The all-time high is approximately 100% of NVDA's share price at the start of the year - the price has doubled in less than 3 months, so a correction appears natural in this extremely hot market. It is possible that the price of NVDA may roll back to the lower border of the channel and test the psychological level of $800 per share.
Buy and sell stocks of the world's biggest publicly-listed companies with CFDs on FXOpen’s trading platform. Open your FXOpen account now or learn more about trading share CFDs with FXOpen.
CFDs are complex instruments and come with a high risk of losing your money.
This article represents the opinion of the Companies operating under the FXOpen brand only. It is not to be construed as an offer, solicitation, or recommendation with respect to products and services provided by the Companies operating under the FXOpen brand, nor is it to be considered financial advice.
👍2
#XAUUSD #goldprice #nikkei225 #USDJPY #GBPUSD #usdcad
Weekly Market Wrap With Gary Thomson: NIKKEI-225, USD/JPY, GBP/USD, USD/CAD, Gold
Get the latest scoop on the week's hottest headlines, all in one convenient video. Join Gary Thomson, the COO of FXOpen UK, as he breaks down the most significant news reports and shares his expert insights.
🔸 NIKKEI-225 Analysis Indicates Possibility of Correction from Historically High Levels
🔸 USD/JPY Price Analysis: Consolidation ahead of US News
🔸 Market Analysis: GBP/USD Dives While USD/CAD Gains Bullish Pace
🔸 XAU/USD Analysis: The Price is Forming an Important Bearish Pattern
Stay in the know and empower yourself with our short, yet power-packed video. Watch it now and stay updated with FXOpen. Don't miss out on this invaluable opportunity to sharpen your trading skills and make informed decisions.
https://cutt.ly/rw3g6zs3
To take advantage of price fluctuations in the foreign exchange markets, consider enlisting the services of a reliable broker like FXOpen.
⚠️
This forecast represents FXOpen Companies opinion only, it should not be construed as an offer, invitation or recommendation in respect to FXOpen Companies products and services or as financial advice
Weekly Market Wrap With Gary Thomson: NIKKEI-225, USD/JPY, GBP/USD, USD/CAD, Gold
Get the latest scoop on the week's hottest headlines, all in one convenient video. Join Gary Thomson, the COO of FXOpen UK, as he breaks down the most significant news reports and shares his expert insights.
🔸 NIKKEI-225 Analysis Indicates Possibility of Correction from Historically High Levels
🔸 USD/JPY Price Analysis: Consolidation ahead of US News
🔸 Market Analysis: GBP/USD Dives While USD/CAD Gains Bullish Pace
🔸 XAU/USD Analysis: The Price is Forming an Important Bearish Pattern
Stay in the know and empower yourself with our short, yet power-packed video. Watch it now and stay updated with FXOpen. Don't miss out on this invaluable opportunity to sharpen your trading skills and make informed decisions.
https://cutt.ly/rw3g6zs3
To take advantage of price fluctuations in the foreign exchange markets, consider enlisting the services of a reliable broker like FXOpen.
⚠️
This forecast represents FXOpen Companies opinion only, it should not be construed as an offer, invitation or recommendation in respect to FXOpen Companies products and services or as financial advice
YouTube
Weekly Market Wrap With Gary Thomson: NIKKEI-225, USD/JPY, GBP/USD, USD/CAD, Gold
Get the latest scoop on the week's hottest headlines, all in one convenient video. Join Gary Thomson, the COO of FXOpen UK, as he breaks down the most significant news reports and shares his expert insights.
00:35 NIKKEI-225 Analysis Indicates Possibility…
00:35 NIKKEI-225 Analysis Indicates Possibility…
👍3
#stockmarket #marketanalysis #MarketNews
Although UK-100 Index Is Near All-time Highs, UK Economy Slips into Recession
Technically, a national economic recession is defined as two consecutive quarters of contraction, and yesterday's Office for National Statistics data confirmed that this has happened — UK GDP fell in the third and fourth quarters of 2023 by 0.1% and 0.3% respectively.
The Guardian writes that the recession may be deeper than it seems at first glance:
→ Increased government spending (including for the military) masks a deep and persistent decline in production.
→ The economy is shrinking despite population growth;
→ In the fourth quarter of 2023, the deficit widened to £26.3 billion, or 3.9% of GDP, up £5.9 billion from the third quarter.
→ The big problem is the decline in goods exports. Soaring prices for imported raw materials and energy have played a major role in increasing the cost of producing goods in the UK and making it difficult to sell them abroad.
However, the price of the UK-100 index (or FTSE-100) is near all-time highs. This is because the Bank of England may ease monetary policy to avoid worsening the recession. And this will be a positive factor for the development of the top 100 companies whose shares are included in the index — this expectation is included in the current quote.
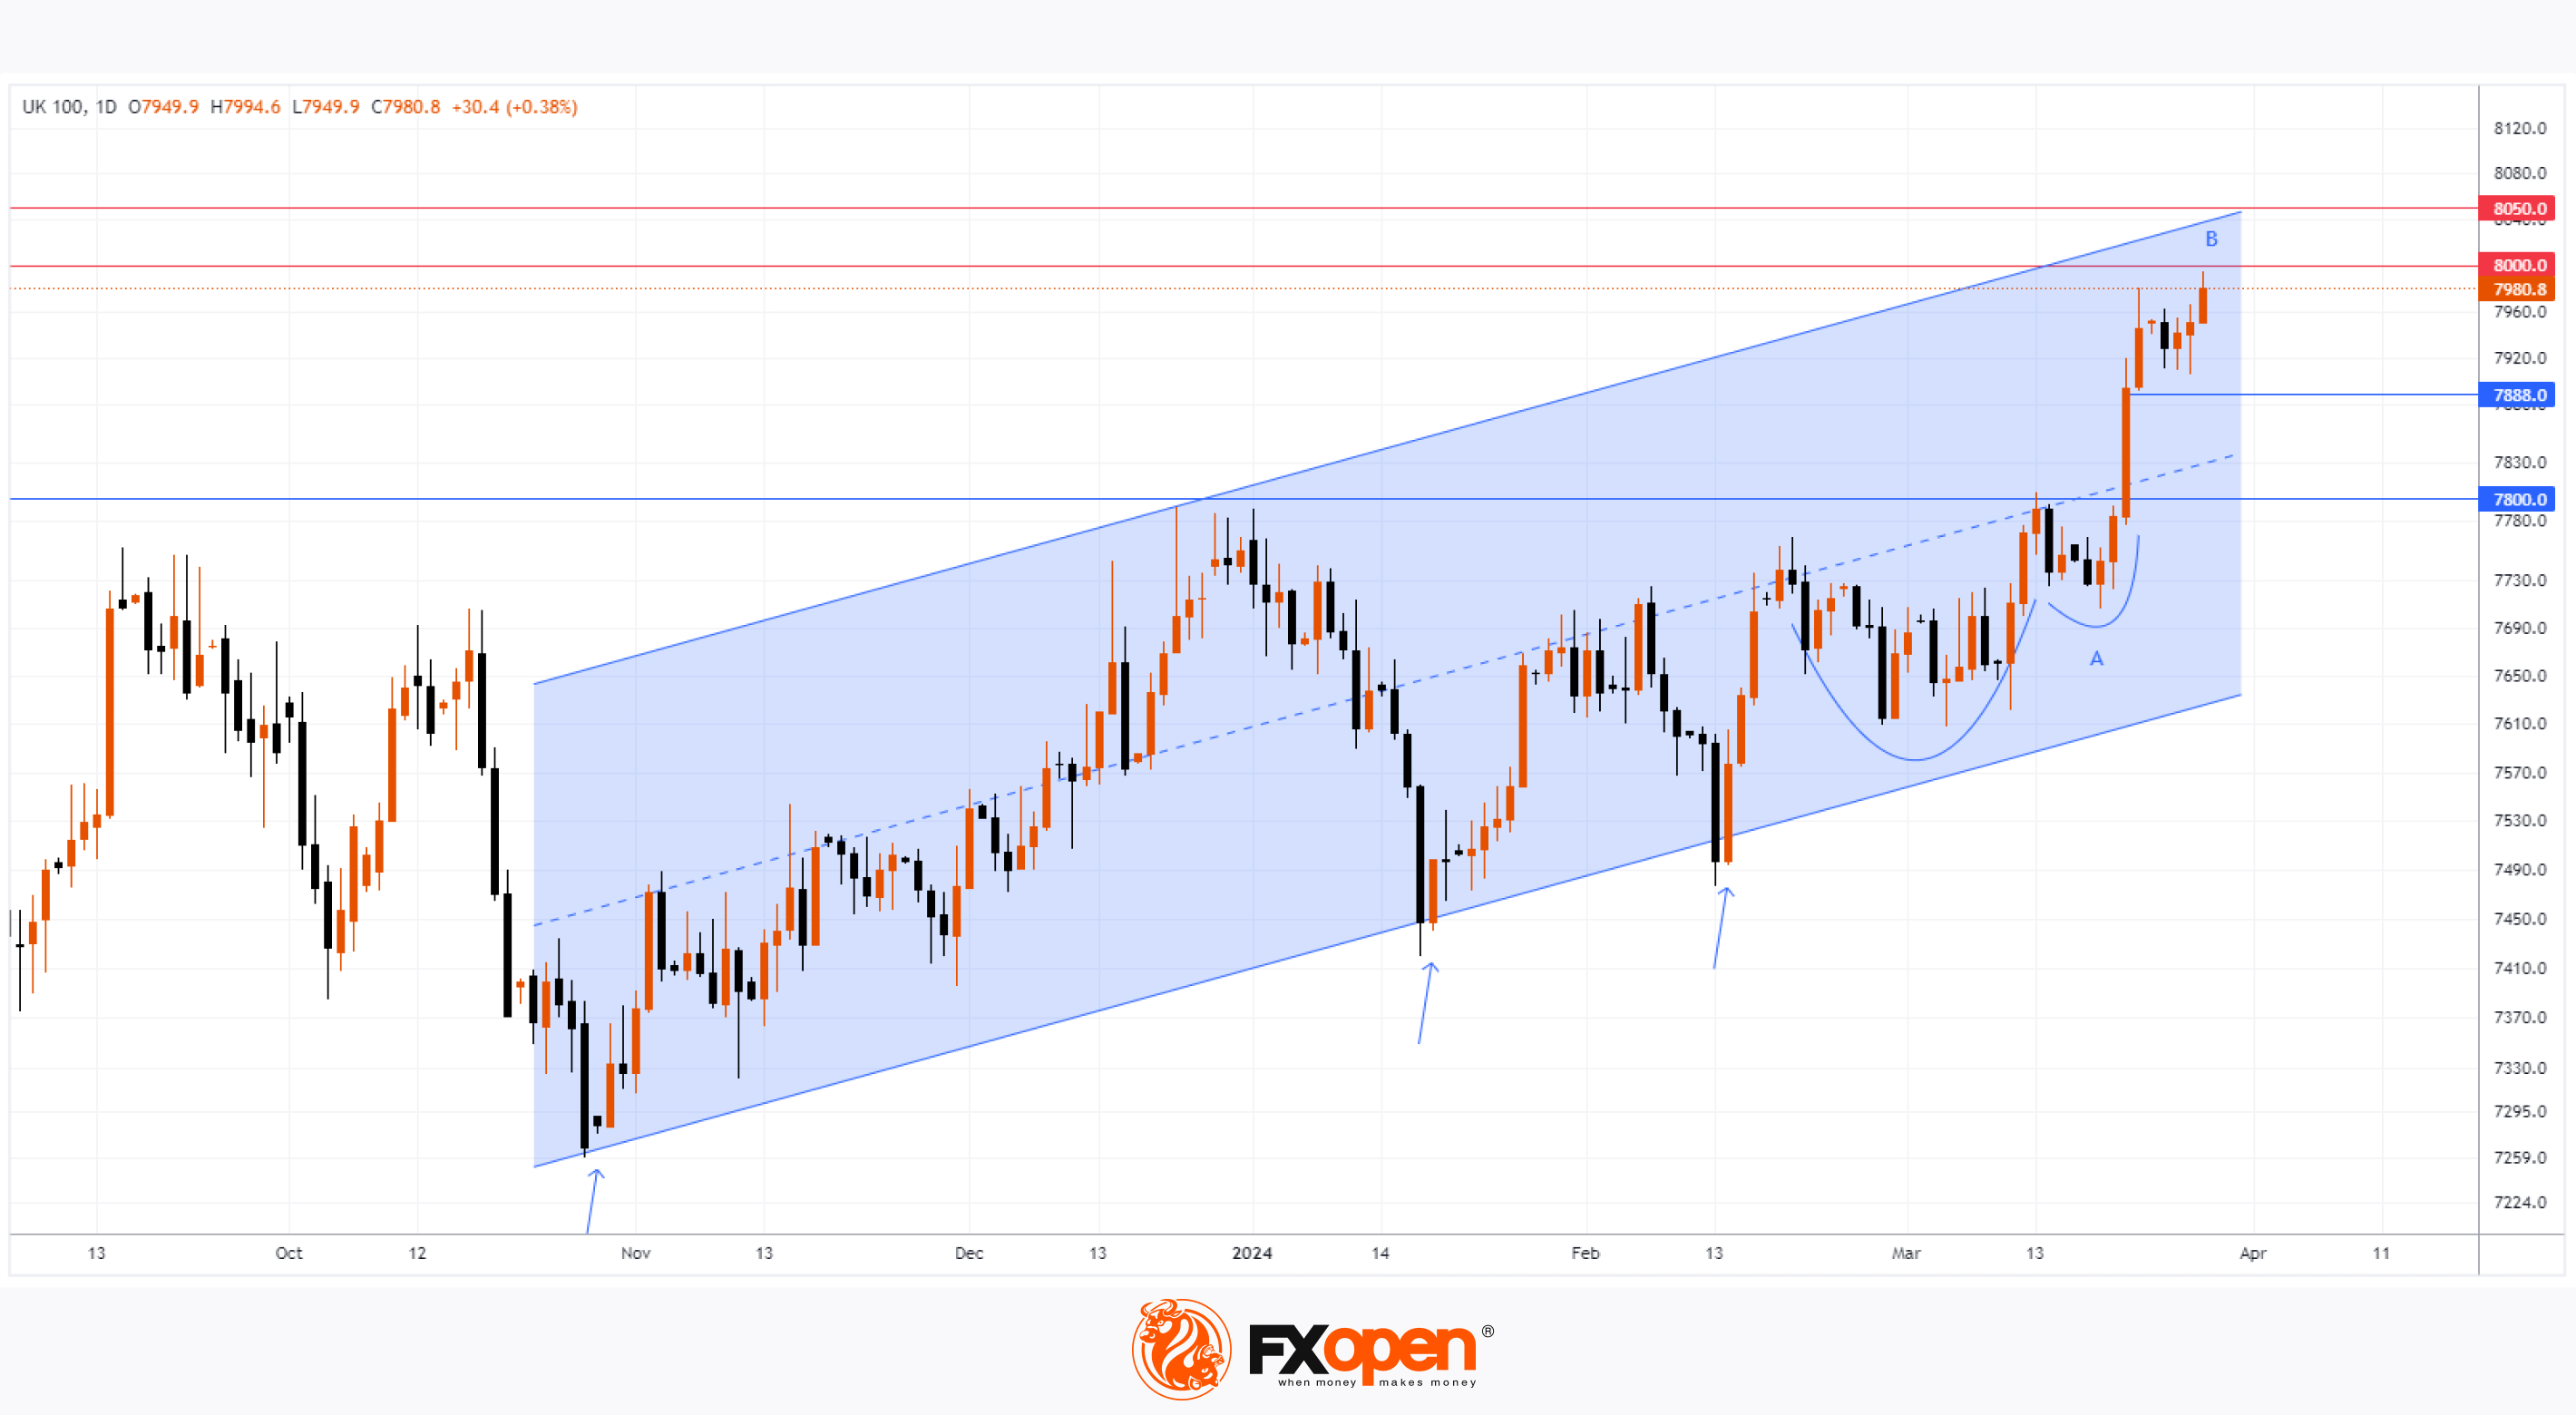
The UK-100 Index chart shows that:
→ today the price of UK-100 is moving within an upward trend (shown by the blue channel);
→ demand forces are active at the lower border of the channel, quickly absorbing all declines (shown by arrows);
→ the bulls confirmed their dominance upon breaking through the 7,800 level, forming a strong cup-and-handle pattern;
→ the psychological level of 8,000 points prevents the bulls from maintaining the growth rate - when approaching it, the bullish candles become narrower. Buyer confidence is waning. This creates difficulties for the price to realize the prospect of reaching the upper boundary of the channel.
It is possible that the upward trend, rooted in the fall of 2023, will continue with the formation of a correction before attempts to overcome the resistance block of 8,000-8,050. In this scenario, support for the UK-100 price may come from:
→ Fibo level 50% rollback from growth impulse A→B;
→ local support formed by intraday price action around the level of 7.888;
→ median line and/or lower border of the blue channel.
Trade global index CFDs with zero commission and tight spreads. Open your FXOpen account now or learn more about trading forex with FXOpen.
CFDs are complex instruments and come with a high risk of losing your money.
This article represents the opinion of the Companies operating under the FXOpen brand only. It is not to be construed as an offer, solicitation, or recommendation with respect to products and services provided by the Companies operating under the FXOpen brand, nor is it to be considered financial advice.
Although UK-100 Index Is Near All-time Highs, UK Economy Slips into Recession
Technically, a national economic recession is defined as two consecutive quarters of contraction, and yesterday's Office for National Statistics data confirmed that this has happened — UK GDP fell in the third and fourth quarters of 2023 by 0.1% and 0.3% respectively.
The Guardian writes that the recession may be deeper than it seems at first glance:
→ Increased government spending (including for the military) masks a deep and persistent decline in production.
→ The economy is shrinking despite population growth;
→ In the fourth quarter of 2023, the deficit widened to £26.3 billion, or 3.9% of GDP, up £5.9 billion from the third quarter.
→ The big problem is the decline in goods exports. Soaring prices for imported raw materials and energy have played a major role in increasing the cost of producing goods in the UK and making it difficult to sell them abroad.
However, the price of the UK-100 index (or FTSE-100) is near all-time highs. This is because the Bank of England may ease monetary policy to avoid worsening the recession. And this will be a positive factor for the development of the top 100 companies whose shares are included in the index — this expectation is included in the current quote.
The UK-100 Index chart shows that:
→ today the price of UK-100 is moving within an upward trend (shown by the blue channel);
→ demand forces are active at the lower border of the channel, quickly absorbing all declines (shown by arrows);
→ the bulls confirmed their dominance upon breaking through the 7,800 level, forming a strong cup-and-handle pattern;
→ the psychological level of 8,000 points prevents the bulls from maintaining the growth rate - when approaching it, the bullish candles become narrower. Buyer confidence is waning. This creates difficulties for the price to realize the prospect of reaching the upper boundary of the channel.
It is possible that the upward trend, rooted in the fall of 2023, will continue with the formation of a correction before attempts to overcome the resistance block of 8,000-8,050. In this scenario, support for the UK-100 price may come from:
→ Fibo level 50% rollback from growth impulse A→B;
→ local support formed by intraday price action around the level of 7.888;
→ median line and/or lower border of the blue channel.
Trade global index CFDs with zero commission and tight spreads. Open your FXOpen account now or learn more about trading forex with FXOpen.
CFDs are complex instruments and come with a high risk of losing your money.
This article represents the opinion of the Companies operating under the FXOpen brand only. It is not to be construed as an offer, solicitation, or recommendation with respect to products and services provided by the Companies operating under the FXOpen brand, nor is it to be considered financial advice.
👍4
#cryptonews #crypto #MarketNews
DOGE Price Increases by 170% in Less Than 2 Months
On February 1, 2024, the DOGE/USD rate was = 0.0783. On the last Friday of March, it rose to 0.2150. The rising price means Dogecoin is now the eighth-largest cryptocurrency in the world by market capitalization, overtaking Cardano (ADA) and Avalanche (AVAX) in recent days.
The reason for the positive sentiment is the support of the token from Elon Musk.
As the Independent writes:
→ Rumors have intensified that Elon will integrate DOGE into his social network X (Twitter), which he planned to make “an app for everything.” Musk's other companies, SpaceX and Tesla, already support payments in Dogecoin.
→ According to Elon, Dogecoin has the potential to become the main online currency due to its ease of use and efficiency.
→ The billionaire also said that DOGE could become the official currency on Mars if SpaceX can establish a permanent human colony there.
→ The price of DOGE/USD is also supported by the general bullish trend in the cryptocurrency market.
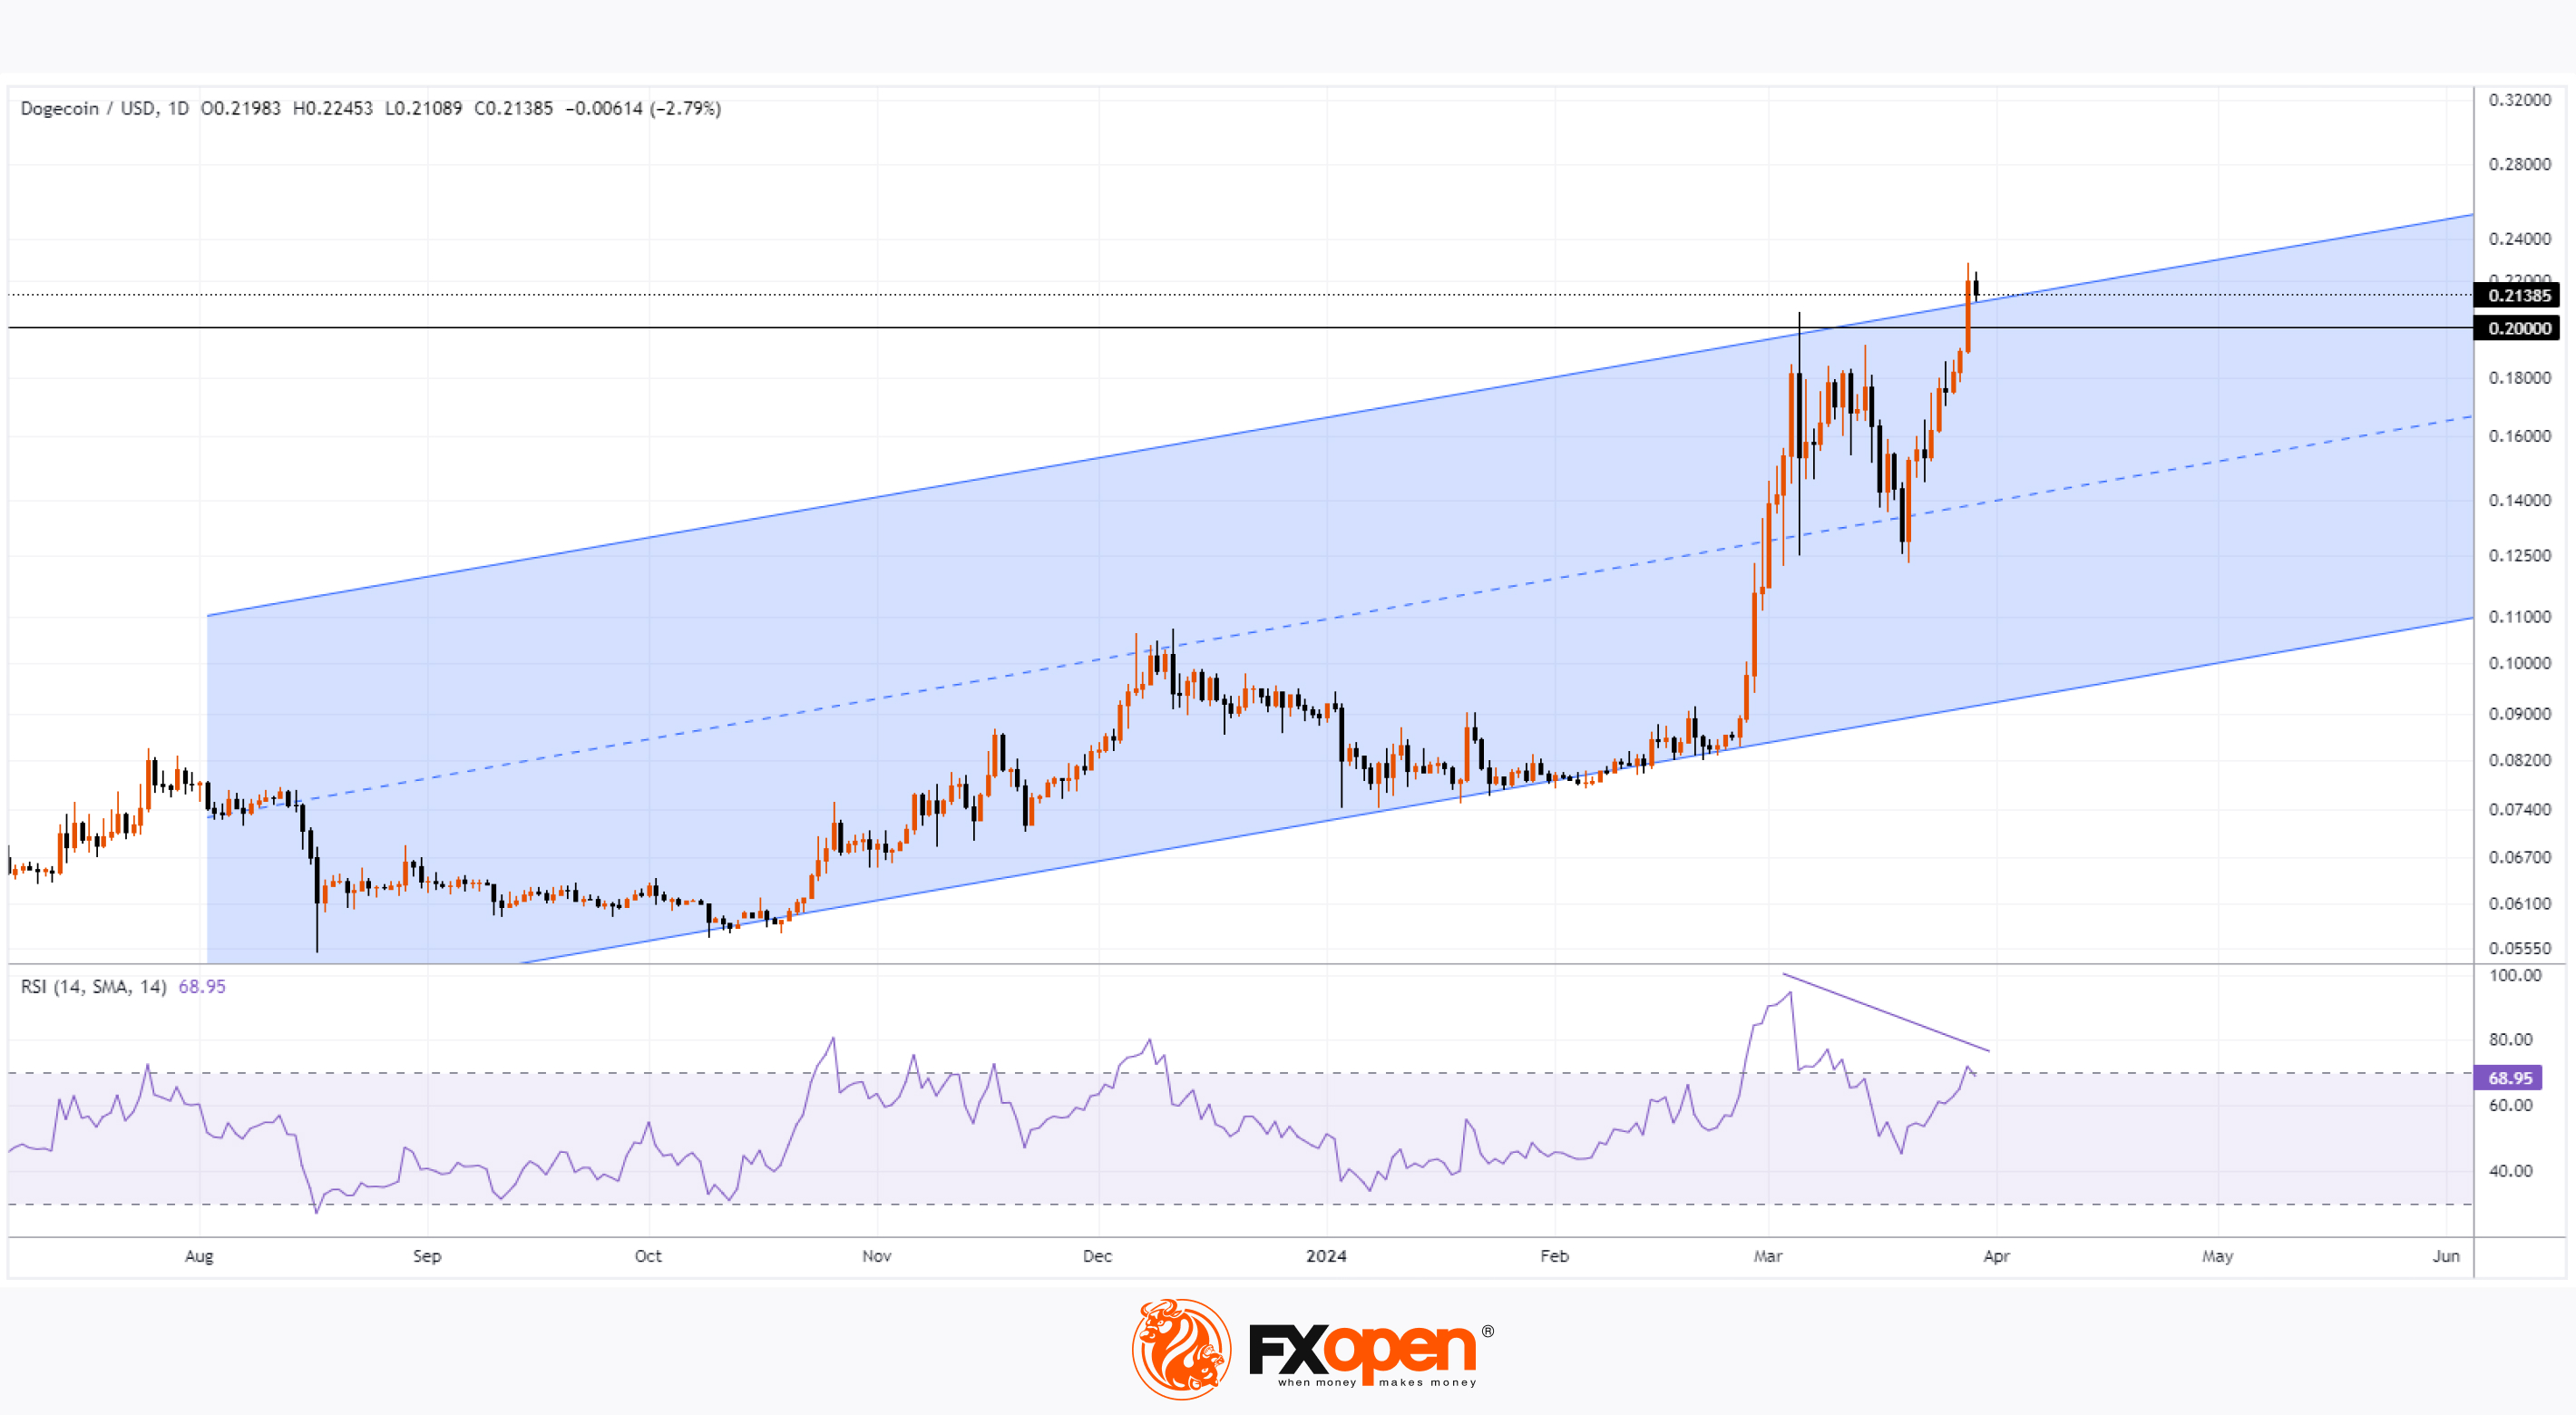
The DOGE/USD chart shows that:
→ the price moves within an uptrend (shown in blue);
→ the price of Dogecoin has overcome the psychological level of $0.2 per coin;
→ the price is near the upper border of the channel - the price action on March 28-29 can be interpreted as an attempt to break through this resistance.
But will this attempt be successful? The RSI indicator may form a bearish divergence - a warning about a possible correction. It is possible that long holders will want to take profits after the impressive growth, which will put pressure on the Dogecoin price, returning it closer to the channel median line.
FXOpen offers the world's most popular cryptocurrency CFDs*, including Bitcoin and Ethereum. Floating spreads, 1:2 leverage — at your service. Open your trading account now or learn more about crypto CFD trading with FXOpen.
*At FXOpen UK and FXOpen AU, Cryptocurrency CFDs are only available for trading by those clients categorised as Professional clients under FCA Rules and Professional clients under AFSL 412871 – ABN 61 143 678 719 respectively. They are not available for trading by Retail clients.
CFDs are complex instruments and come with a high risk of losing your money.
This article represents the opinion of the Companies operating under the FXOpen brand only. It is not to be construed as an offer, solicitation, or recommendation with respect to products and services provided by the Companies operating under the FXOpen brand, nor is it to be considered financial advice.
DOGE Price Increases by 170% in Less Than 2 Months
On February 1, 2024, the DOGE/USD rate was = 0.0783. On the last Friday of March, it rose to 0.2150. The rising price means Dogecoin is now the eighth-largest cryptocurrency in the world by market capitalization, overtaking Cardano (ADA) and Avalanche (AVAX) in recent days.
The reason for the positive sentiment is the support of the token from Elon Musk.
As the Independent writes:
→ Rumors have intensified that Elon will integrate DOGE into his social network X (Twitter), which he planned to make “an app for everything.” Musk's other companies, SpaceX and Tesla, already support payments in Dogecoin.
→ According to Elon, Dogecoin has the potential to become the main online currency due to its ease of use and efficiency.
→ The billionaire also said that DOGE could become the official currency on Mars if SpaceX can establish a permanent human colony there.
→ The price of DOGE/USD is also supported by the general bullish trend in the cryptocurrency market.
The DOGE/USD chart shows that:
→ the price moves within an uptrend (shown in blue);
→ the price of Dogecoin has overcome the psychological level of $0.2 per coin;
→ the price is near the upper border of the channel - the price action on March 28-29 can be interpreted as an attempt to break through this resistance.
But will this attempt be successful? The RSI indicator may form a bearish divergence - a warning about a possible correction. It is possible that long holders will want to take profits after the impressive growth, which will put pressure on the Dogecoin price, returning it closer to the channel median line.
FXOpen offers the world's most popular cryptocurrency CFDs*, including Bitcoin and Ethereum. Floating spreads, 1:2 leverage — at your service. Open your trading account now or learn more about crypto CFD trading with FXOpen.
*At FXOpen UK and FXOpen AU, Cryptocurrency CFDs are only available for trading by those clients categorised as Professional clients under FCA Rules and Professional clients under AFSL 412871 – ABN 61 143 678 719 respectively. They are not available for trading by Retail clients.
CFDs are complex instruments and come with a high risk of losing your money.
This article represents the opinion of the Companies operating under the FXOpen brand only. It is not to be construed as an offer, solicitation, or recommendation with respect to products and services provided by the Companies operating under the FXOpen brand, nor is it to be considered financial advice.
👍4
#marketanalysis #MarketNews #tradingforex #usdollar
US Dollar Strengthens after Strong ISM Manufacturing PMI Report
Yesterday, news was published on the state of the US manufacturing sector, namely the Purchase Manager Index (PMI), which is calculated by The Institute for Supply Management (ISM).
The data turned out to be strong: fact = 50.3, forecast = 48.5, a month earlier = 47.8.
Since readings above 50 indicate manufacturing growth, yesterday's news showed the health of this sector in the US. Consequently, it reduced the pressure on the Fed to cut interest rates.
And since the current tight monetary policy may last longer, the value of the US dollar has increased relative to other financial assets:
→ Regarding currencies. For example, the NZD/USD rate set a minimum of 2024.
→ Regarding cryptocurrencies. The decline in BTC/USD that began yesterday led to the Bitcoin rate dropping to USD 66.5k today.
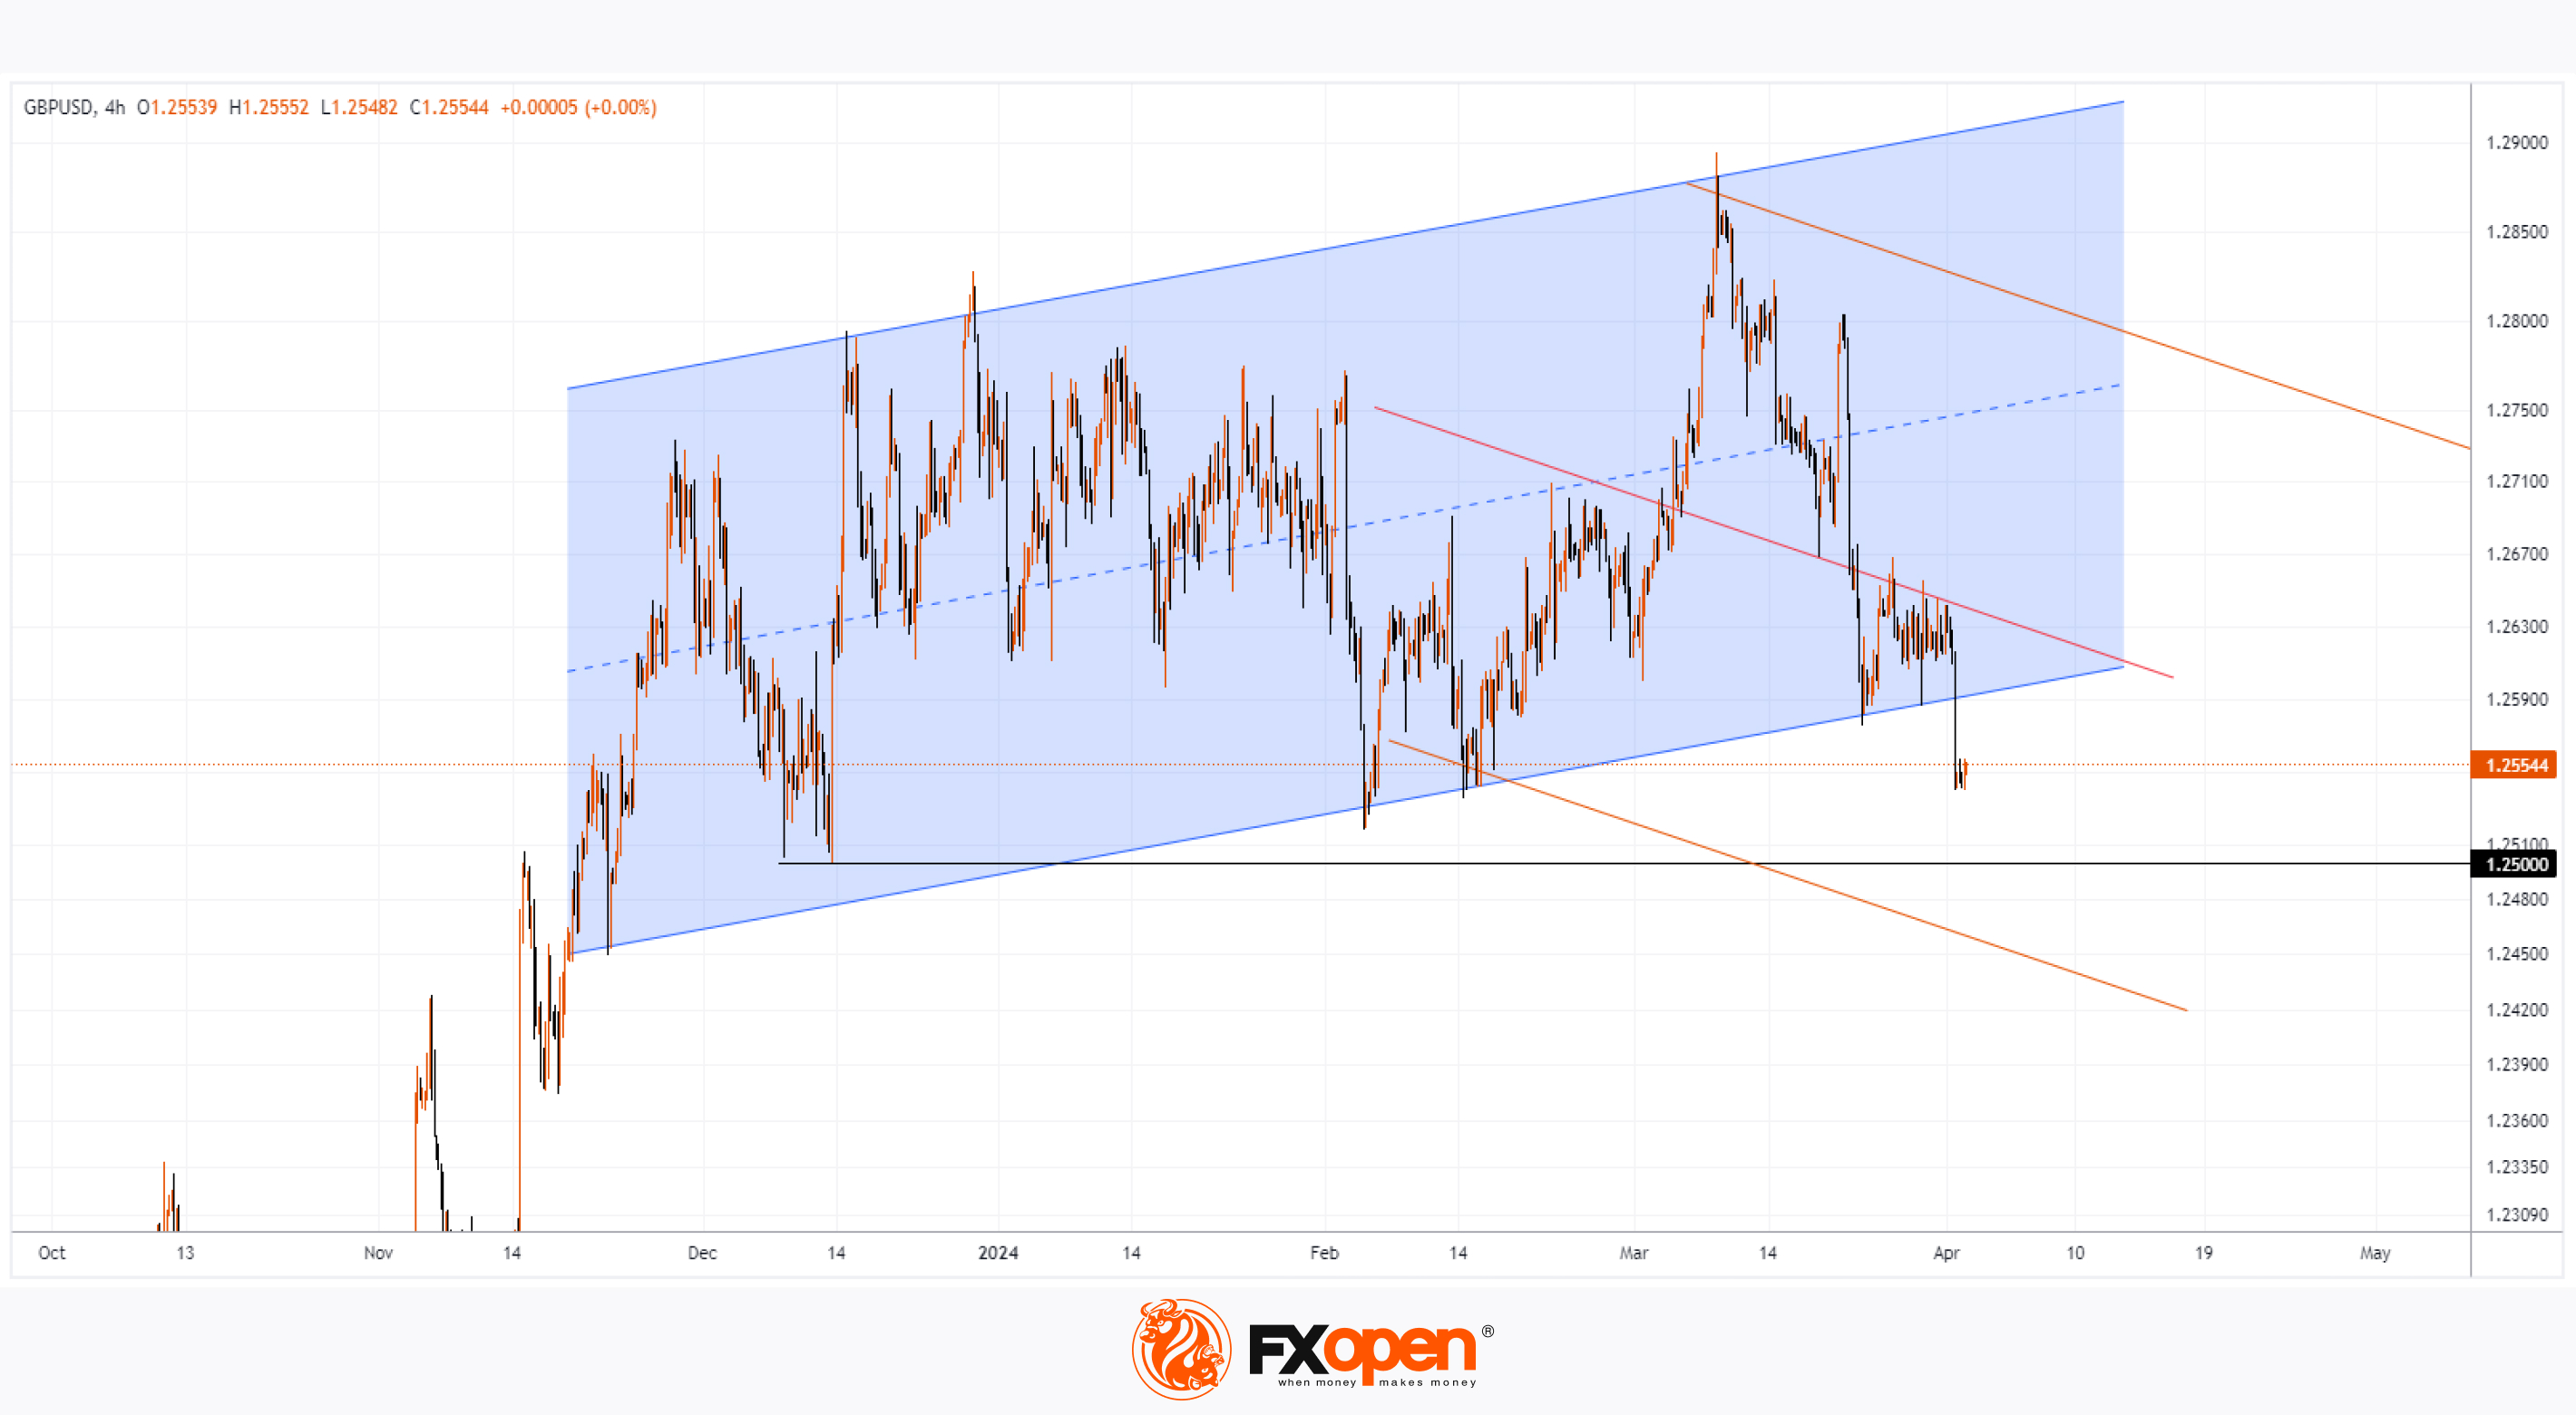
A remarkable situation is developing on the GBP/USD chart. Technical analysis shows that:
→ the pound exchange rate has been forming an ascending channel (shown in blue) since the end of last year;
→ but today GBP/USD is forming a breakdown of its lower border;
→ if bearish sentiment persists, the ascending channel will lose relevance, and the market may further develop within the descending channel, the contours of which are outlined in red lines.
It is possible that the GBP/USD price may break through the February low and form a 2024 low, falling to the psychological support of 1.25 pounds per US dollar.
Trade over 50 forex markets 24 hours a day with FXOpen. Take advantage of low commissions, deep liquidity, and spreads from 0.0 pips. Open your FXOpen account now or learn more about trading forex with FXOpen.
CFDs are complex instruments and come with a high risk of losing your money.
This article represents the opinion of the Companies operating under the FXOpen brand only. It is not to be construed as an offer, solicitation, or recommendation with respect to products and services provided by the Companies operating under the FXOpen brand, nor is it to be considered financial advice.
US Dollar Strengthens after Strong ISM Manufacturing PMI Report
Yesterday, news was published on the state of the US manufacturing sector, namely the Purchase Manager Index (PMI), which is calculated by The Institute for Supply Management (ISM).
The data turned out to be strong: fact = 50.3, forecast = 48.5, a month earlier = 47.8.
Since readings above 50 indicate manufacturing growth, yesterday's news showed the health of this sector in the US. Consequently, it reduced the pressure on the Fed to cut interest rates.
And since the current tight monetary policy may last longer, the value of the US dollar has increased relative to other financial assets:
→ Regarding currencies. For example, the NZD/USD rate set a minimum of 2024.
→ Regarding cryptocurrencies. The decline in BTC/USD that began yesterday led to the Bitcoin rate dropping to USD 66.5k today.
A remarkable situation is developing on the GBP/USD chart. Technical analysis shows that:
→ the pound exchange rate has been forming an ascending channel (shown in blue) since the end of last year;
→ but today GBP/USD is forming a breakdown of its lower border;
→ if bearish sentiment persists, the ascending channel will lose relevance, and the market may further develop within the descending channel, the contours of which are outlined in red lines.
It is possible that the GBP/USD price may break through the February low and form a 2024 low, falling to the psychological support of 1.25 pounds per US dollar.
Trade over 50 forex markets 24 hours a day with FXOpen. Take advantage of low commissions, deep liquidity, and spreads from 0.0 pips. Open your FXOpen account now or learn more about trading forex with FXOpen.
CFDs are complex instruments and come with a high risk of losing your money.
This article represents the opinion of the Companies operating under the FXOpen brand only. It is not to be construed as an offer, solicitation, or recommendation with respect to products and services provided by the Companies operating under the FXOpen brand, nor is it to be considered financial advice.
👍3
#goldprice #XAUUSD #marketanalysis #MarketNews
Gold Price XAU/USD Sets Another All-time High
The XAU/USD gold chart today indicates that the price of the metal has exceeded USD 2,250 per ounce.
Causes:
→ Geopolitical tensions. Military conflicts in Ukraine and the Middle East do not subside, the threat of terrorist attacks is growing, and new hot spots may appear on the world map.
→ Concerns about a new round of inflation due to rising commodity prices.
In both cases, gold acts as a safe-haven asset.
Since the beginning of 2024, the price of XAU/USD has risen by 12%. How much longer can the rally last?
In terms of technical analysis of the gold price, there are two tools to take into account:
→ ascending channel (shown in blue). Today XAU/USD is in its upper half, the price has tested (shown by the arrow) the support of the median line. And from the first days of April it has been demonstrating dynamics that direct it towards the upper border of the channel.
→ Fibonacci proportions. If we take the A→B impulse as 100%, then the decrease in B→C finds support in the zone of levels 0.5-0.618, which confirms the relevance of using proportions. Then the target for impulse price growth from point C may be the level of 1.618.
Thus, these technical analysis tools for the XAU/USD chart indicate that the price of gold may rise to the 2,333-2,380 zone if the current bullish sentiment continues.
Start trading commodity CFDs with tight spreads. Open your trading account now or learn more about trading commodity CFDs with FXOpen.
CFDs are complex instruments and come with a high risk of losing your money.
This article represents the opinion of the Companies operating under the FXOpen brand only. It is not to be construed as an offer, solicitation, or recommendation with respect to products and services provided by the Companies operating under the FXOpen brand, nor is it to be considered financial advice.
Gold Price XAU/USD Sets Another All-time High
The XAU/USD gold chart today indicates that the price of the metal has exceeded USD 2,250 per ounce.
Causes:
→ Geopolitical tensions. Military conflicts in Ukraine and the Middle East do not subside, the threat of terrorist attacks is growing, and new hot spots may appear on the world map.
→ Concerns about a new round of inflation due to rising commodity prices.
In both cases, gold acts as a safe-haven asset.
Since the beginning of 2024, the price of XAU/USD has risen by 12%. How much longer can the rally last?
In terms of technical analysis of the gold price, there are two tools to take into account:
→ ascending channel (shown in blue). Today XAU/USD is in its upper half, the price has tested (shown by the arrow) the support of the median line. And from the first days of April it has been demonstrating dynamics that direct it towards the upper border of the channel.
→ Fibonacci proportions. If we take the A→B impulse as 100%, then the decrease in B→C finds support in the zone of levels 0.5-0.618, which confirms the relevance of using proportions. Then the target for impulse price growth from point C may be the level of 1.618.
Thus, these technical analysis tools for the XAU/USD chart indicate that the price of gold may rise to the 2,333-2,380 zone if the current bullish sentiment continues.
Start trading commodity CFDs with tight spreads. Open your trading account now or learn more about trading commodity CFDs with FXOpen.
CFDs are complex instruments and come with a high risk of losing your money.
This article represents the opinion of the Companies operating under the FXOpen brand only. It is not to be construed as an offer, solicitation, or recommendation with respect to products and services provided by the Companies operating under the FXOpen brand, nor is it to be considered financial advice.
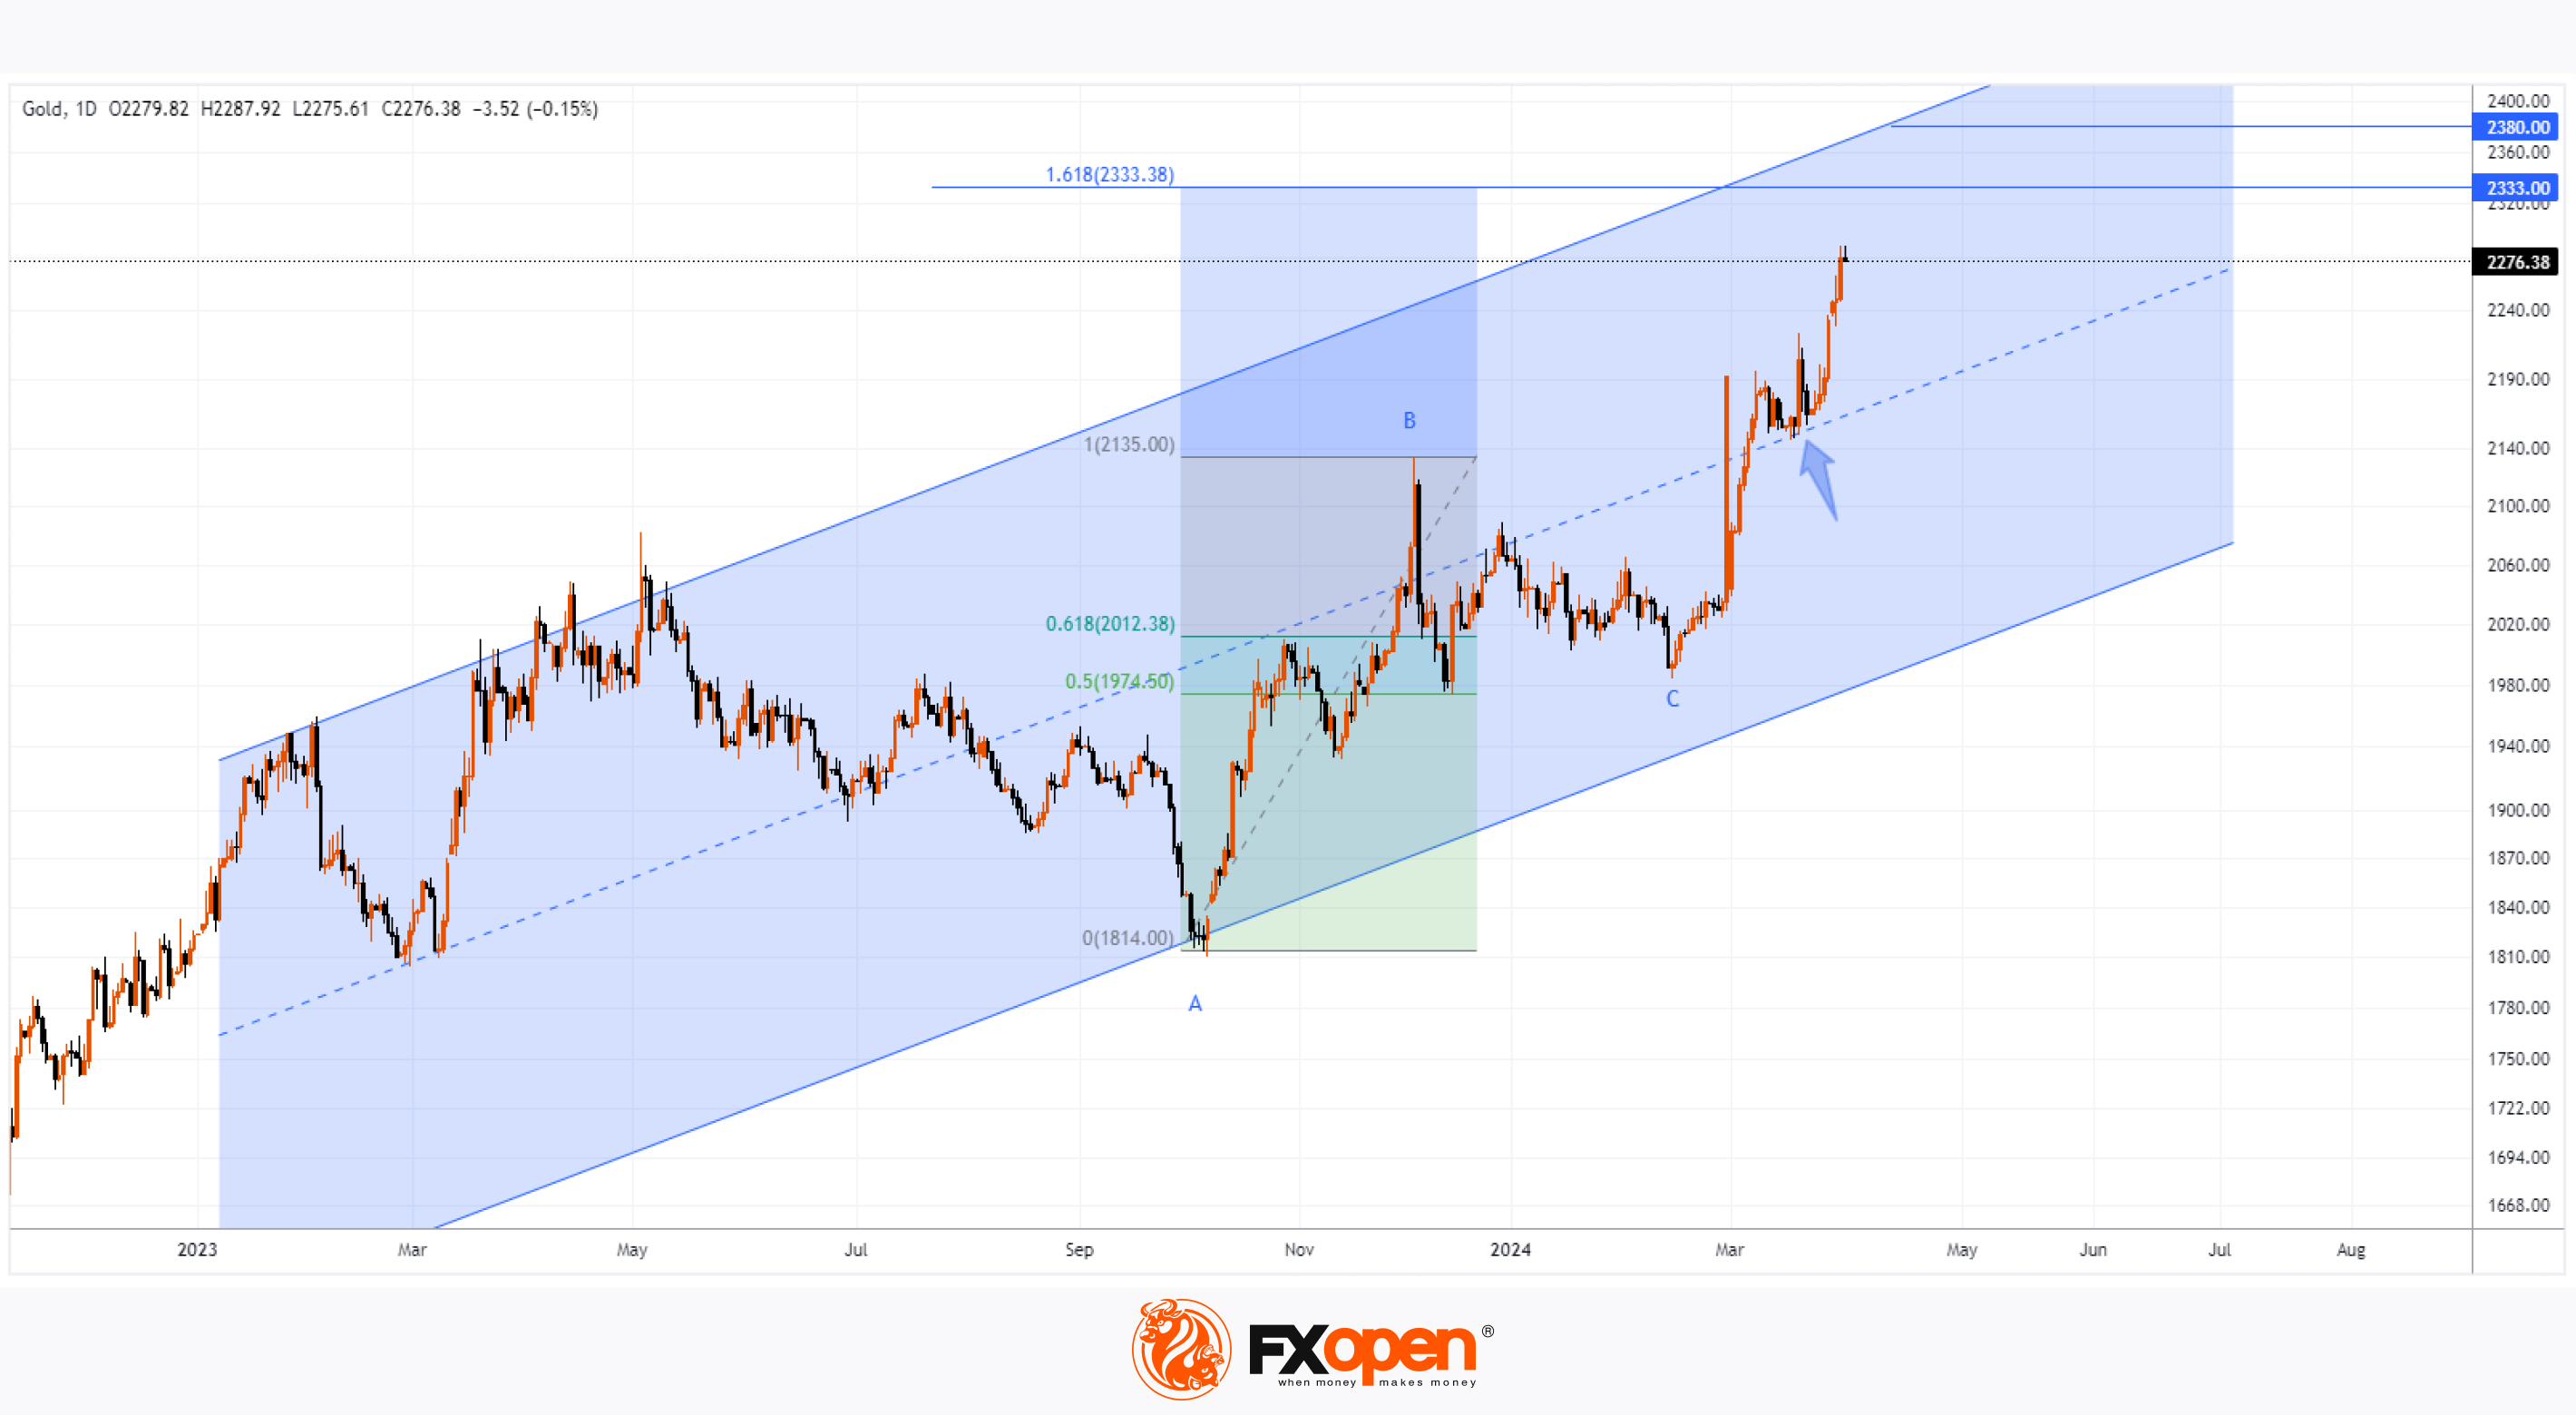
👍3
#marketanalysis #MarketNews #forextrading
USD/JPY Analysis: Calm Before the Storm?
The USD/JPY chart today shows that the rate has stabilized at 152 yen per US dollar. But can we say that there is calm in the market?
Hardly.
First, it is important to note that in 2023 there was a sharp reversal of trend around the 152.00 level due to intervention by the Japanese authorities, which supported an excessively weak yen. Therefore, crossing this psychological threshold can serve as a trigger for a new intervention.
Secondly, Reuters writes about a growing volatility premium in the options market, which confirms the growing likelihood of a strong trend in the near future.
According to USD/JPY technical analysis:
→ ADX indicator is near its lows. When this situation was observed at the end of February, 2 sharp movements followed in March: a decline in USD/JPY to 146.6 and a subsequent recovery to 151.6.
→ the price of USD/JPY today is squeezed into a narrowing triangle between the level of 152.0 and the median line of the ascending channel. The price exiting the technical triangle may mean the beginning of a new trend.
Today, 2 important news are expected: after the publication of the ISM Services PMI index (at 17:00 GMT+3), a speech by the head of the Federal Reserve is expected (19:10 GMT+3). A piece of fundamental news could change the valuation of the US dollar and lead to a surge in volatility in the USD/JPY market - this should be given special attention, given the arguments presented.
Trade over 50 forex markets 24 hours a day with FXOpen. Take advantage of low commissions, deep liquidity, and spreads from 0.0 pips. Open your FXOpen account now or learn more about trading forex with FXOpen.
CFDs are complex instruments and come with a high risk of losing your money.
This article represents the opinion of the Companies operating under the FXOpen brand only. It is not to be construed as an offer, solicitation, or recommendation with respect to products and services provided by the Companies operating under the FXOpen brand, nor is it to be considered financial advice.
USD/JPY Analysis: Calm Before the Storm?
The USD/JPY chart today shows that the rate has stabilized at 152 yen per US dollar. But can we say that there is calm in the market?
Hardly.
First, it is important to note that in 2023 there was a sharp reversal of trend around the 152.00 level due to intervention by the Japanese authorities, which supported an excessively weak yen. Therefore, crossing this psychological threshold can serve as a trigger for a new intervention.
Secondly, Reuters writes about a growing volatility premium in the options market, which confirms the growing likelihood of a strong trend in the near future.
According to USD/JPY technical analysis:
→ ADX indicator is near its lows. When this situation was observed at the end of February, 2 sharp movements followed in March: a decline in USD/JPY to 146.6 and a subsequent recovery to 151.6.
→ the price of USD/JPY today is squeezed into a narrowing triangle between the level of 152.0 and the median line of the ascending channel. The price exiting the technical triangle may mean the beginning of a new trend.
Today, 2 important news are expected: after the publication of the ISM Services PMI index (at 17:00 GMT+3), a speech by the head of the Federal Reserve is expected (19:10 GMT+3). A piece of fundamental news could change the valuation of the US dollar and lead to a surge in volatility in the USD/JPY market - this should be given special attention, given the arguments presented.
Trade over 50 forex markets 24 hours a day with FXOpen. Take advantage of low commissions, deep liquidity, and spreads from 0.0 pips. Open your FXOpen account now or learn more about trading forex with FXOpen.
CFDs are complex instruments and come with a high risk of losing your money.
This article represents the opinion of the Companies operating under the FXOpen brand only. It is not to be construed as an offer, solicitation, or recommendation with respect to products and services provided by the Companies operating under the FXOpen brand, nor is it to be considered financial advice.
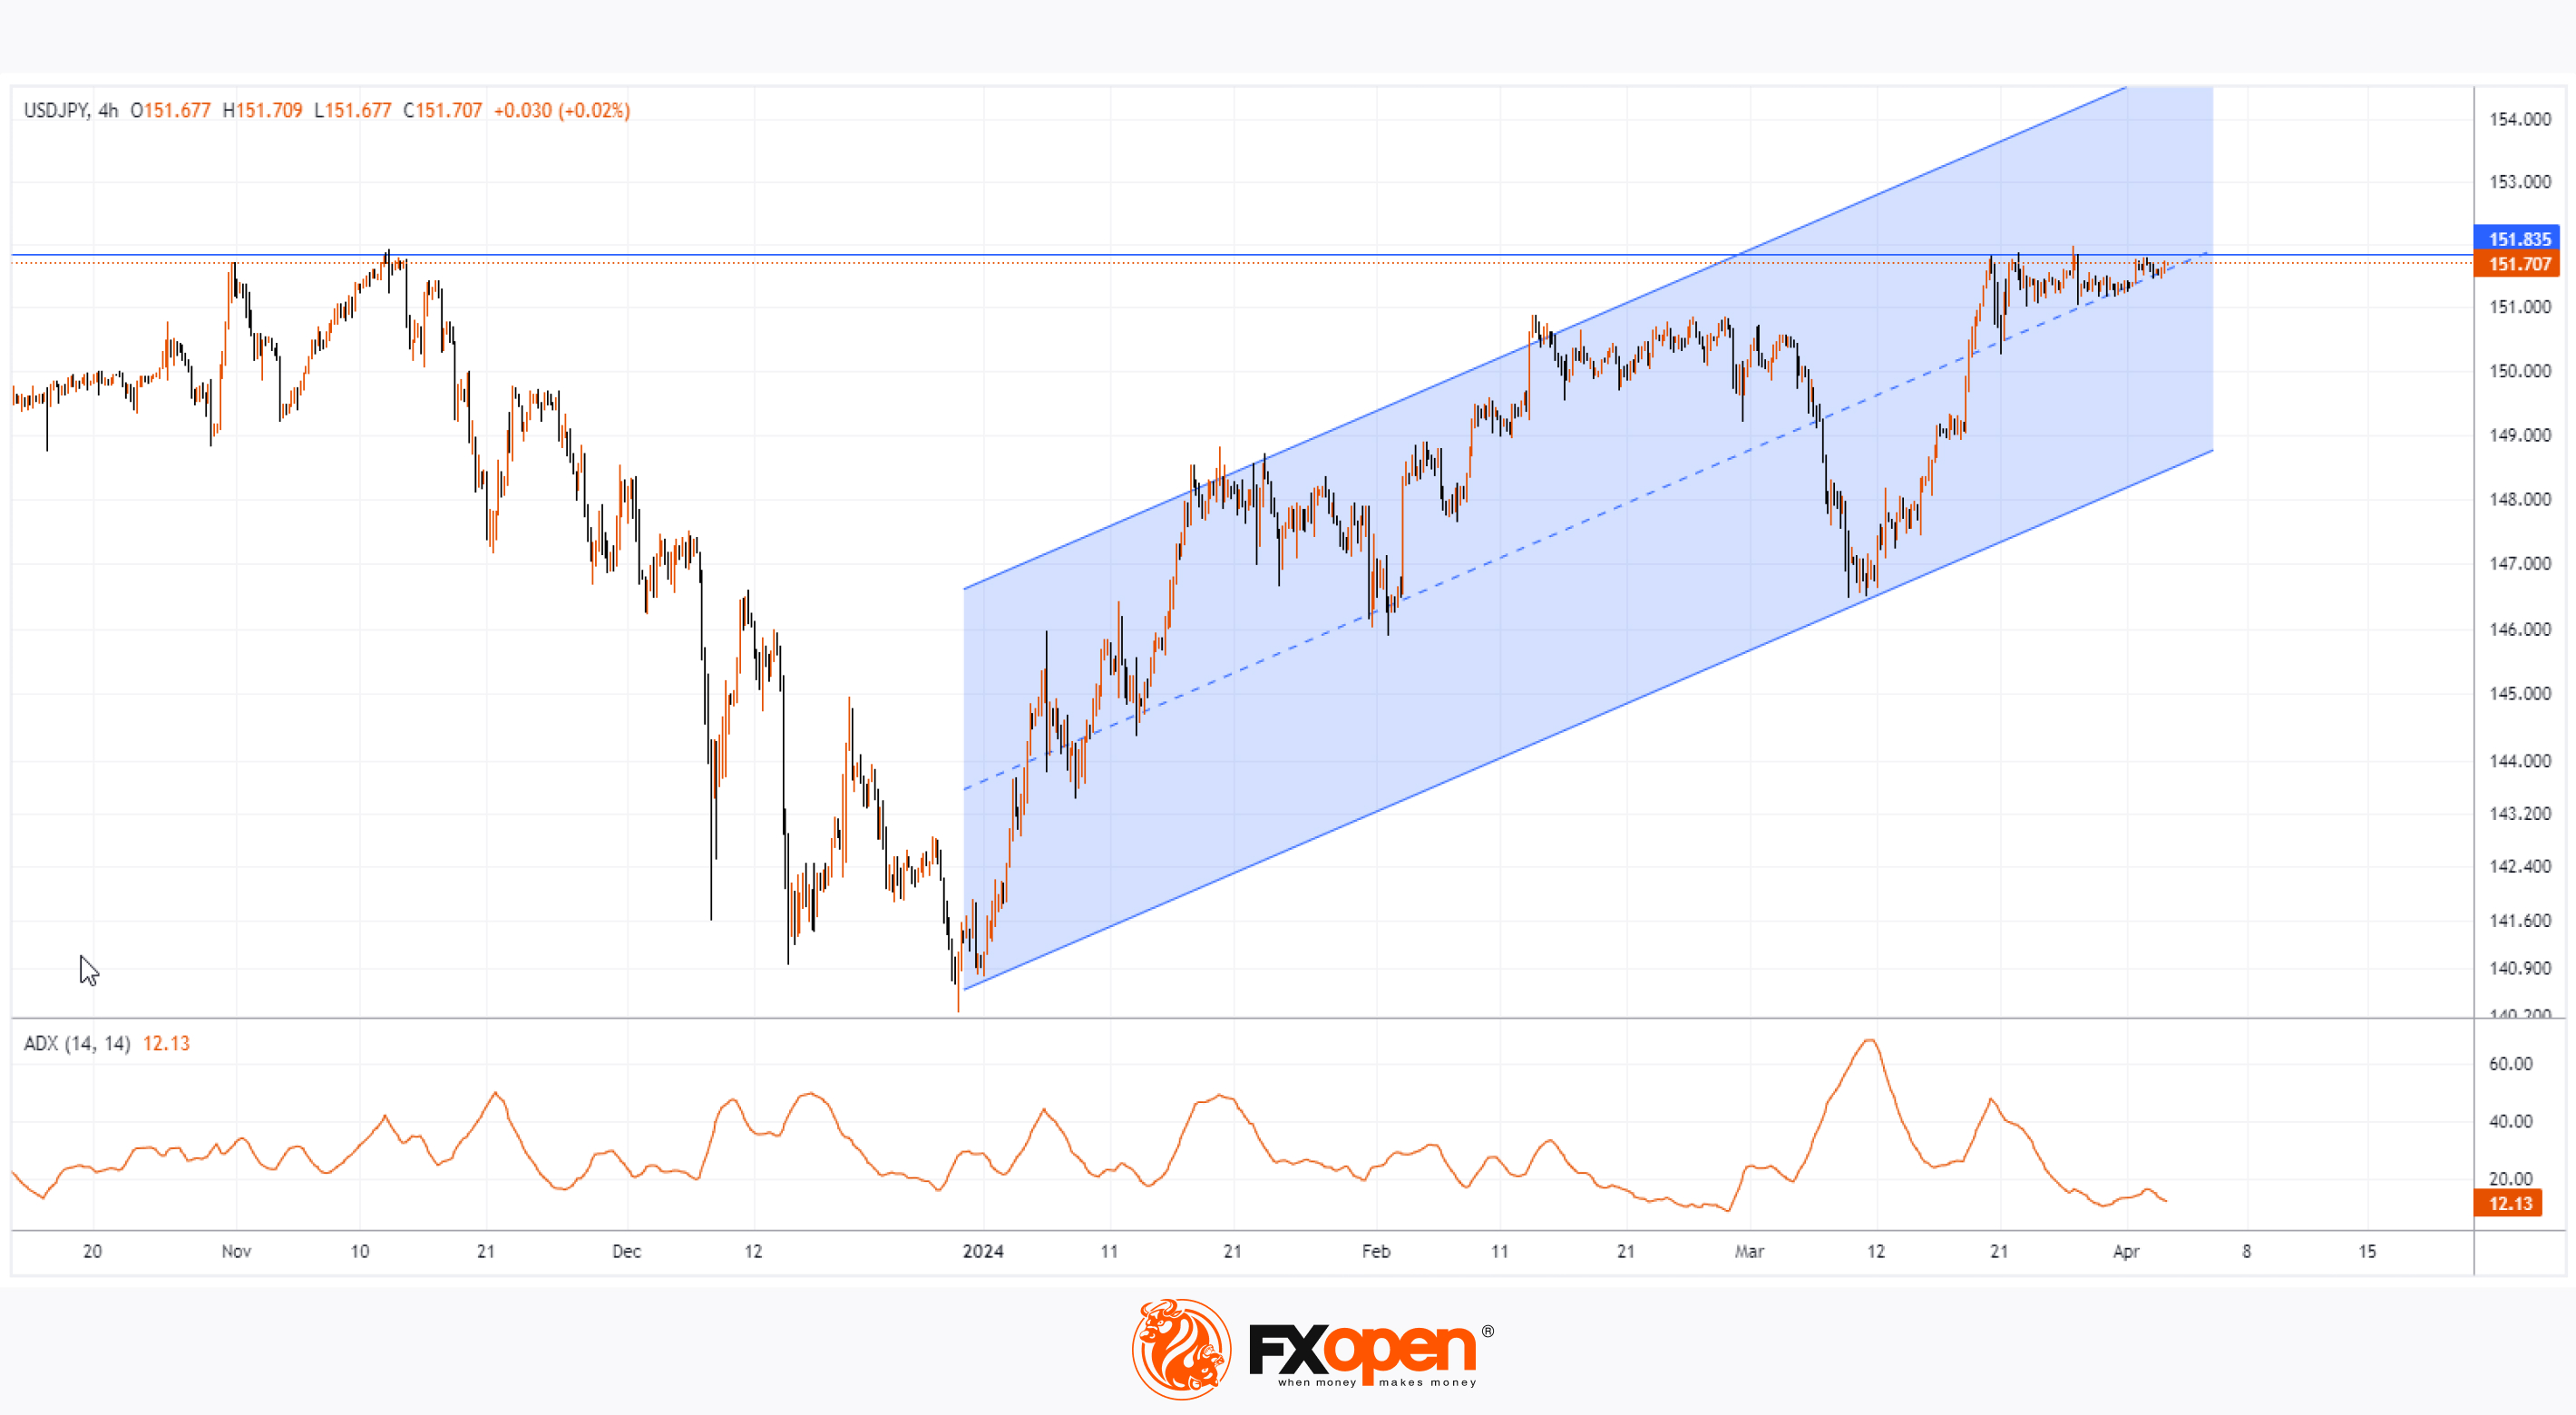
👍4
#oilprices #brentoil #marketanalysis #MarketNews
Brent Oil Price Reaches Its Highest Since October 2023
The Brent oil chart today shows that the price has exceeded USD 89 per barrel — this is the highest level since the end of October 2023.
Reasons for strong demand for oil:
→ The OPEC+ meeting ended this week. Exporting countries maintained their policy of limiting oil production unchanged.
→ Ukrainian drone attacks on oil refineries in Russia.
→ Latest data on the strength of the US economy.
Technical analysis of the Brent market shows that:
→ The price moves within the ascending channel (shown in blue), which originates back in 2023.
→ Increased demand in the spring of 2024 led to the fact that the Brent price rose into the upper half of the blue channel and formed a steeper growth trajectory (shown by black lines).
→ The median line of the blue channel acted as support (shown by arrows).
The upper limit of the blue channel is around USD 92 per barrel of Brent and it is possible that the price may reach these values in the next 1-2 months.
However, the prerequisites for a correction are not currently in place after an increase of more than 5% over the last 5 trading sessions:
→ the RSI indicator indicates overbought;
→ the price is at the upper black line.
If a correction scenario is realized in the market, the Brent price may drop to the $87 level, which previously acted as resistance.
Start trading commodity CFDs with tight spreads. Open your trading account now or learn more about trading commodity CFDs with FXOpen.
CFDs are complex instruments and come with a high risk of losing your money.
This article represents the opinion of the Companies operating under the FXOpen brand only. It is not to be construed as an offer, solicitation, or recommendation with respect to products and services provided by the Companies operating under the FXOpen brand, nor is it to be considered financial advice.
Brent Oil Price Reaches Its Highest Since October 2023
The Brent oil chart today shows that the price has exceeded USD 89 per barrel — this is the highest level since the end of October 2023.
Reasons for strong demand for oil:
→ The OPEC+ meeting ended this week. Exporting countries maintained their policy of limiting oil production unchanged.
→ Ukrainian drone attacks on oil refineries in Russia.
→ Latest data on the strength of the US economy.
Technical analysis of the Brent market shows that:
→ The price moves within the ascending channel (shown in blue), which originates back in 2023.
→ Increased demand in the spring of 2024 led to the fact that the Brent price rose into the upper half of the blue channel and formed a steeper growth trajectory (shown by black lines).
→ The median line of the blue channel acted as support (shown by arrows).
The upper limit of the blue channel is around USD 92 per barrel of Brent and it is possible that the price may reach these values in the next 1-2 months.
However, the prerequisites for a correction are not currently in place after an increase of more than 5% over the last 5 trading sessions:
→ the RSI indicator indicates overbought;
→ the price is at the upper black line.
If a correction scenario is realized in the market, the Brent price may drop to the $87 level, which previously acted as resistance.
Start trading commodity CFDs with tight spreads. Open your trading account now or learn more about trading commodity CFDs with FXOpen.
CFDs are complex instruments and come with a high risk of losing your money.
This article represents the opinion of the Companies operating under the FXOpen brand only. It is not to be construed as an offer, solicitation, or recommendation with respect to products and services provided by the Companies operating under the FXOpen brand, nor is it to be considered financial advice.
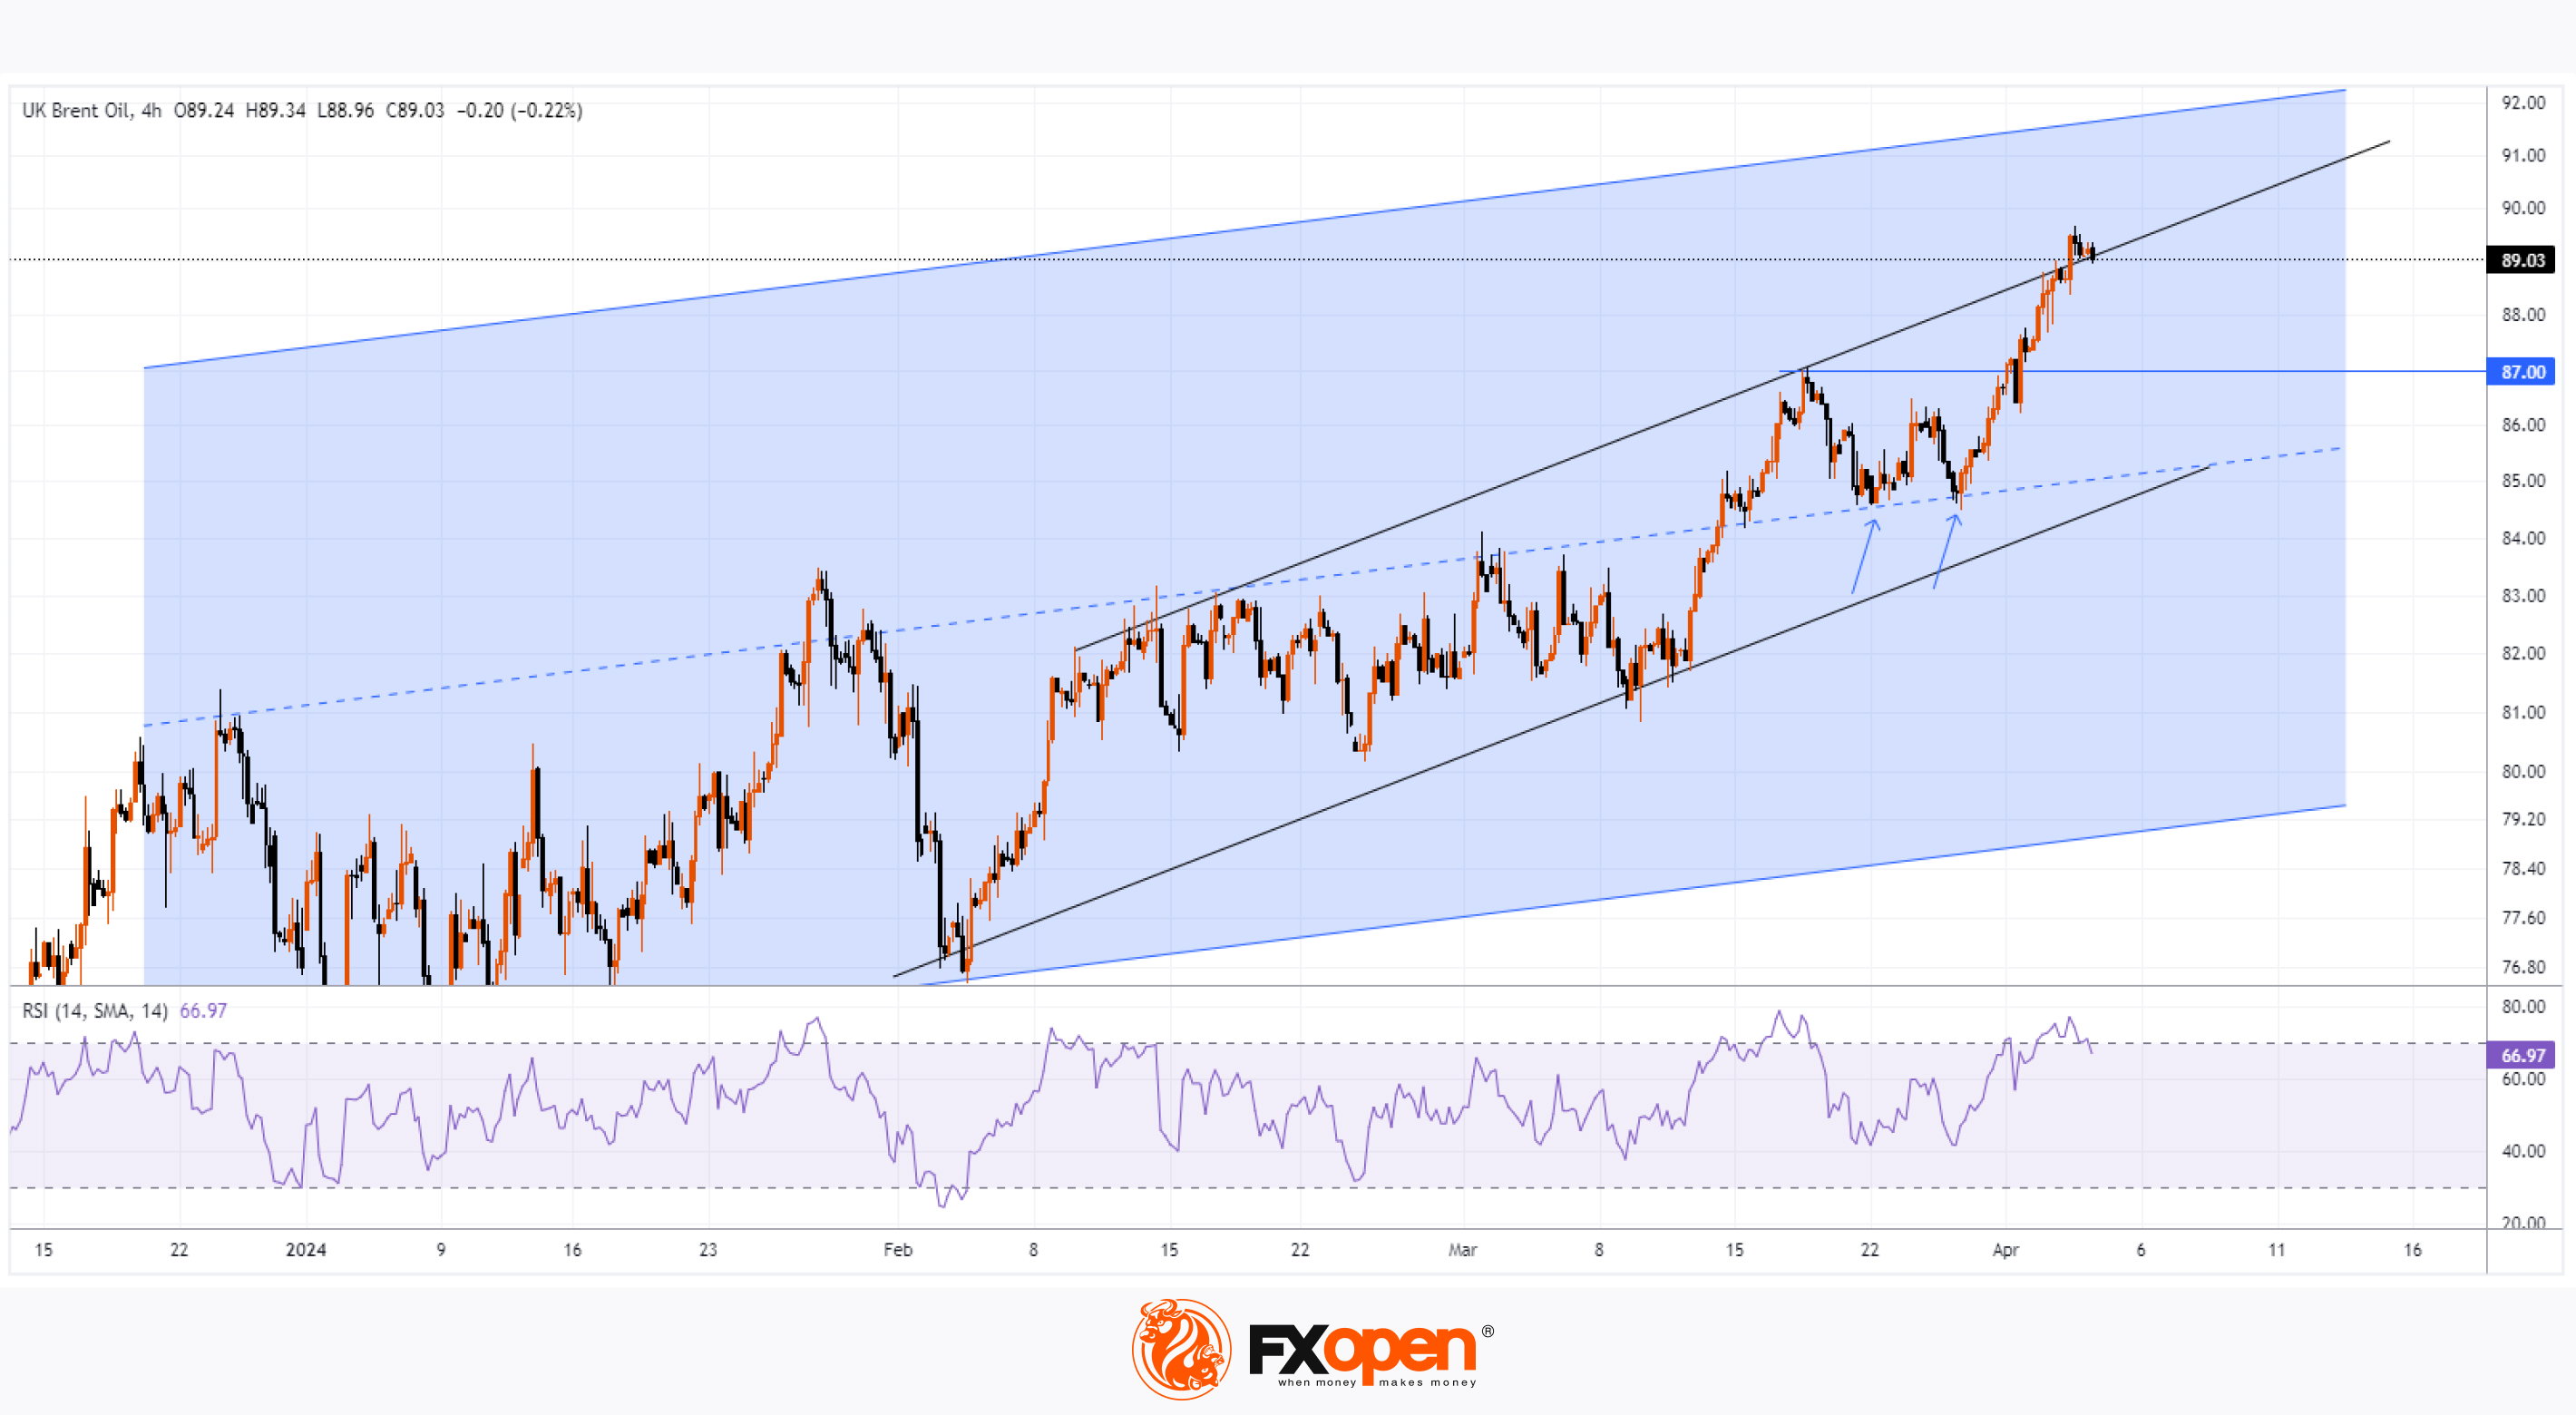
👍3
#marketanalysis #stockmarket #stocktrading
The US Stock Market Awaits the Publication of NFP and Unemployment Data
Important events of this week for investors and traders in the US stock market could be the employment news, which will be published tomorrow at 15:30 GMT+3:
→ non-Farm Payrolls (NFP) report for March. According to CNN, analysts expect nonfarm payrolls to rise by 192,500 in March. NFP for February was 275,000, according to FactSet.
→ data on the unemployment rate (Unemployment Rate). According to ForexFactory, the unemployment rate is expected to remain unchanged at 3.9%.
The state of the labour market is under close scrutiny by the Fed and could provide valuable insight into the prospects for interest rate cuts. The release of the unemployment rate and NFP numbers for March could be an example of what is called "bad news is good news" on Wall Street. After all, if the data shows a deterioration in the labor market, then this will be an argument for the Fed to lower interest rates, which in turn could lead to an increase in the stock market.
Indeed, according to CNN, Fed Chairman Jerome Powell said last week that a weakening labor market would be a reason to cut interest rates.
However, the S&P 500 chart shows the price moving within an ascending channel, but showing signs of weakness around the 5,250 level on the 4-hour period:
- After a sharp increase in A→B, the price entered a prolonged correction B→C - this may be a sign of a large volume of sell orders near the level of 5,250, which absorbed the bullish impulse A→B.
- An attempt to break through the level of 5,250 (price growth to top D) turned out to be a failure, as the price sharply dropped from the upper border of the channel to the lower one. Such progress should be alarming for the bears.
From the point of view of technical analysis of the S&P 500, on the eve of the publication of the NFP report, the price forms a rebound from the lower border of the channel. But by its nature, the rebound does not look dynamic compared to the previous ones (shown by arrows) — the price’s action shows that this time it needs time to approach the median line.
The above arguments provide the basis for the assumption that the publication of the unemployment rate and the NFP report for March can become drivers of price movement, at which it will form an F top.
Wherein:
→ the tops of B-D-F can form a bearish head and shoulders pattern;
→ the median line of the ascending channel and the level of 5,250 will act as resistance for the bulls.
Trade global index CFDs with zero commission and tight spreads. Open your FXOpen account now or learn more about trading index CFDs with FXOpen.
CFDs are complex instruments and come with a high risk of losing your money.
This article represents the opinion of the Companies operating under the FXOpen brand only. It is not to be construed as an offer, solicitation, or recommendation with respect to products and services provided by the Companies operating under the FXOpen brand, nor is it to be considered financial advice.
The US Stock Market Awaits the Publication of NFP and Unemployment Data
Important events of this week for investors and traders in the US stock market could be the employment news, which will be published tomorrow at 15:30 GMT+3:
→ non-Farm Payrolls (NFP) report for March. According to CNN, analysts expect nonfarm payrolls to rise by 192,500 in March. NFP for February was 275,000, according to FactSet.
→ data on the unemployment rate (Unemployment Rate). According to ForexFactory, the unemployment rate is expected to remain unchanged at 3.9%.
The state of the labour market is under close scrutiny by the Fed and could provide valuable insight into the prospects for interest rate cuts. The release of the unemployment rate and NFP numbers for March could be an example of what is called "bad news is good news" on Wall Street. After all, if the data shows a deterioration in the labor market, then this will be an argument for the Fed to lower interest rates, which in turn could lead to an increase in the stock market.
Indeed, according to CNN, Fed Chairman Jerome Powell said last week that a weakening labor market would be a reason to cut interest rates.
However, the S&P 500 chart shows the price moving within an ascending channel, but showing signs of weakness around the 5,250 level on the 4-hour period:
- After a sharp increase in A→B, the price entered a prolonged correction B→C - this may be a sign of a large volume of sell orders near the level of 5,250, which absorbed the bullish impulse A→B.
- An attempt to break through the level of 5,250 (price growth to top D) turned out to be a failure, as the price sharply dropped from the upper border of the channel to the lower one. Such progress should be alarming for the bears.
From the point of view of technical analysis of the S&P 500, on the eve of the publication of the NFP report, the price forms a rebound from the lower border of the channel. But by its nature, the rebound does not look dynamic compared to the previous ones (shown by arrows) — the price’s action shows that this time it needs time to approach the median line.
The above arguments provide the basis for the assumption that the publication of the unemployment rate and the NFP report for March can become drivers of price movement, at which it will form an F top.
Wherein:
→ the tops of B-D-F can form a bearish head and shoulders pattern;
→ the median line of the ascending channel and the level of 5,250 will act as resistance for the bulls.
Trade global index CFDs with zero commission and tight spreads. Open your FXOpen account now or learn more about trading index CFDs with FXOpen.
CFDs are complex instruments and come with a high risk of losing your money.
This article represents the opinion of the Companies operating under the FXOpen brand only. It is not to be construed as an offer, solicitation, or recommendation with respect to products and services provided by the Companies operating under the FXOpen brand, nor is it to be considered financial advice.
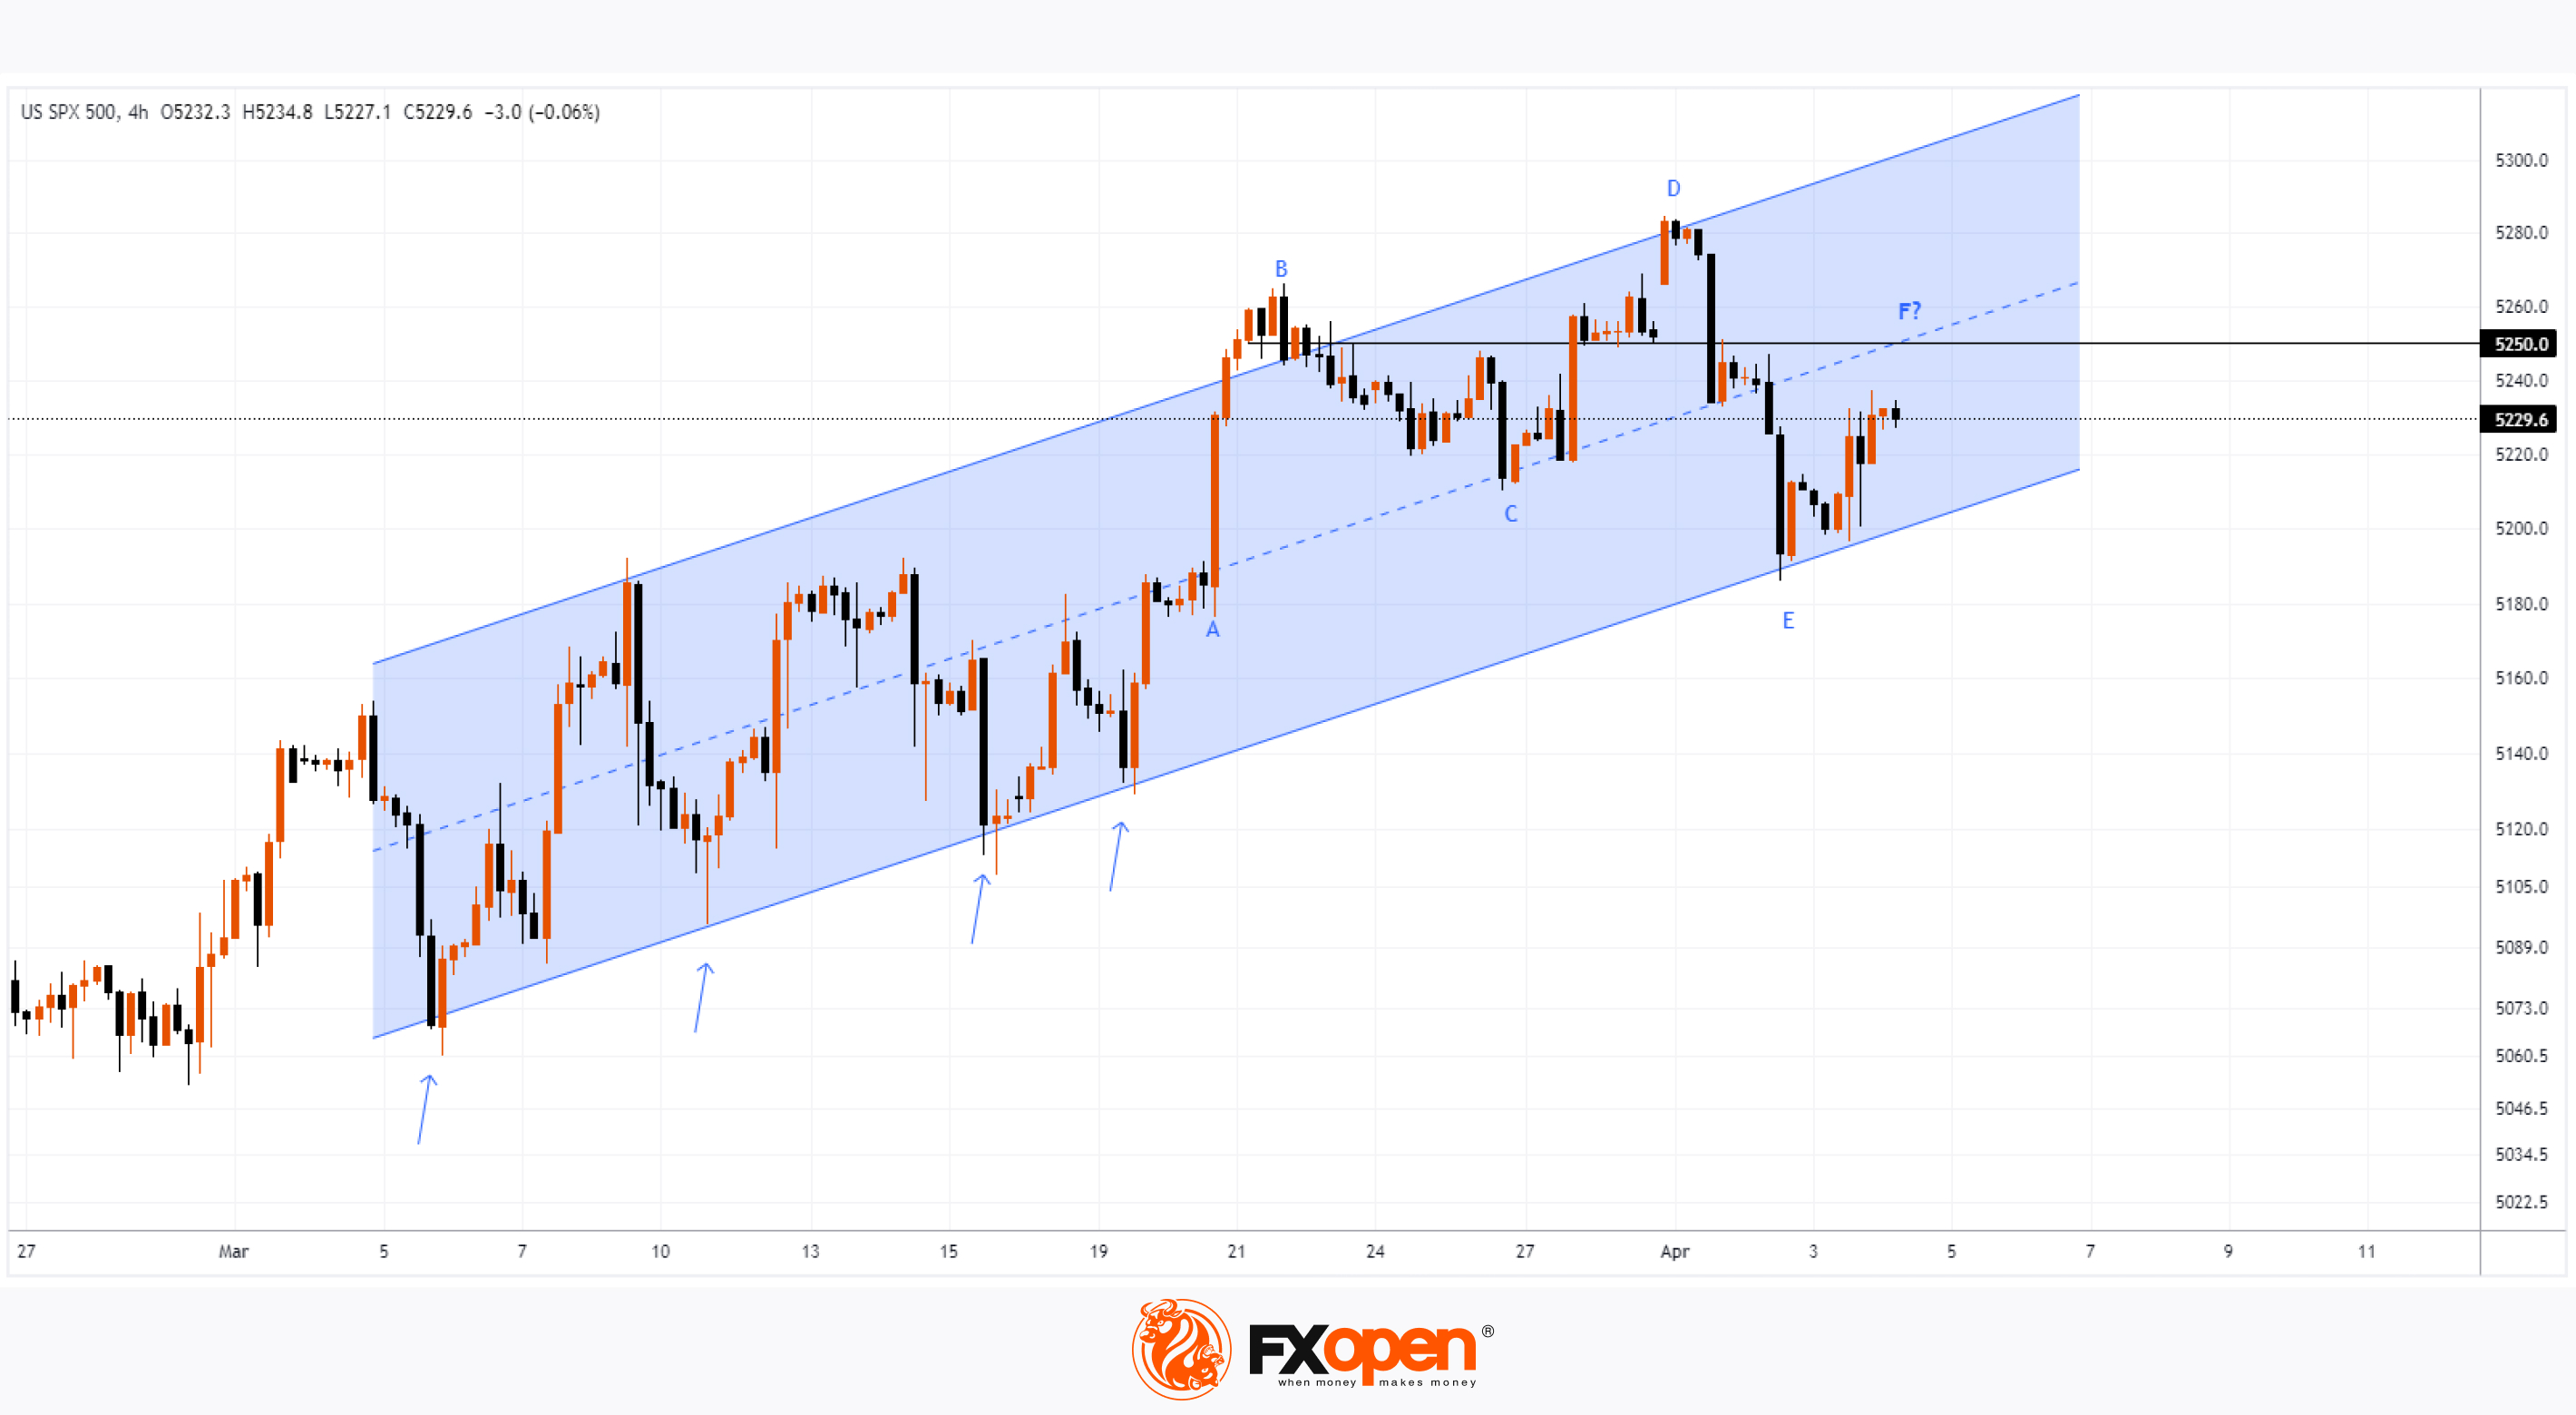
👍3