
#goldprice #MarketNews #marketanalysis #XAUUSD
Price of Gold Briefly Exceeded $2,050 per Ounce
In addition to new records in the stock markets, the reaction to yesterday's news about inflation in the US was also a decrease in government bond yields and a rapid rise in the price of gold — the cost of XAU/USD jumped by 0.9% in just one hour, while the day's high exceeded USD 2,050 per ounce .
However, on Friday morning the price of XAU/USD dropped below USD 2,040 – did market participants misjudge the impact of US inflation on the price of gold?
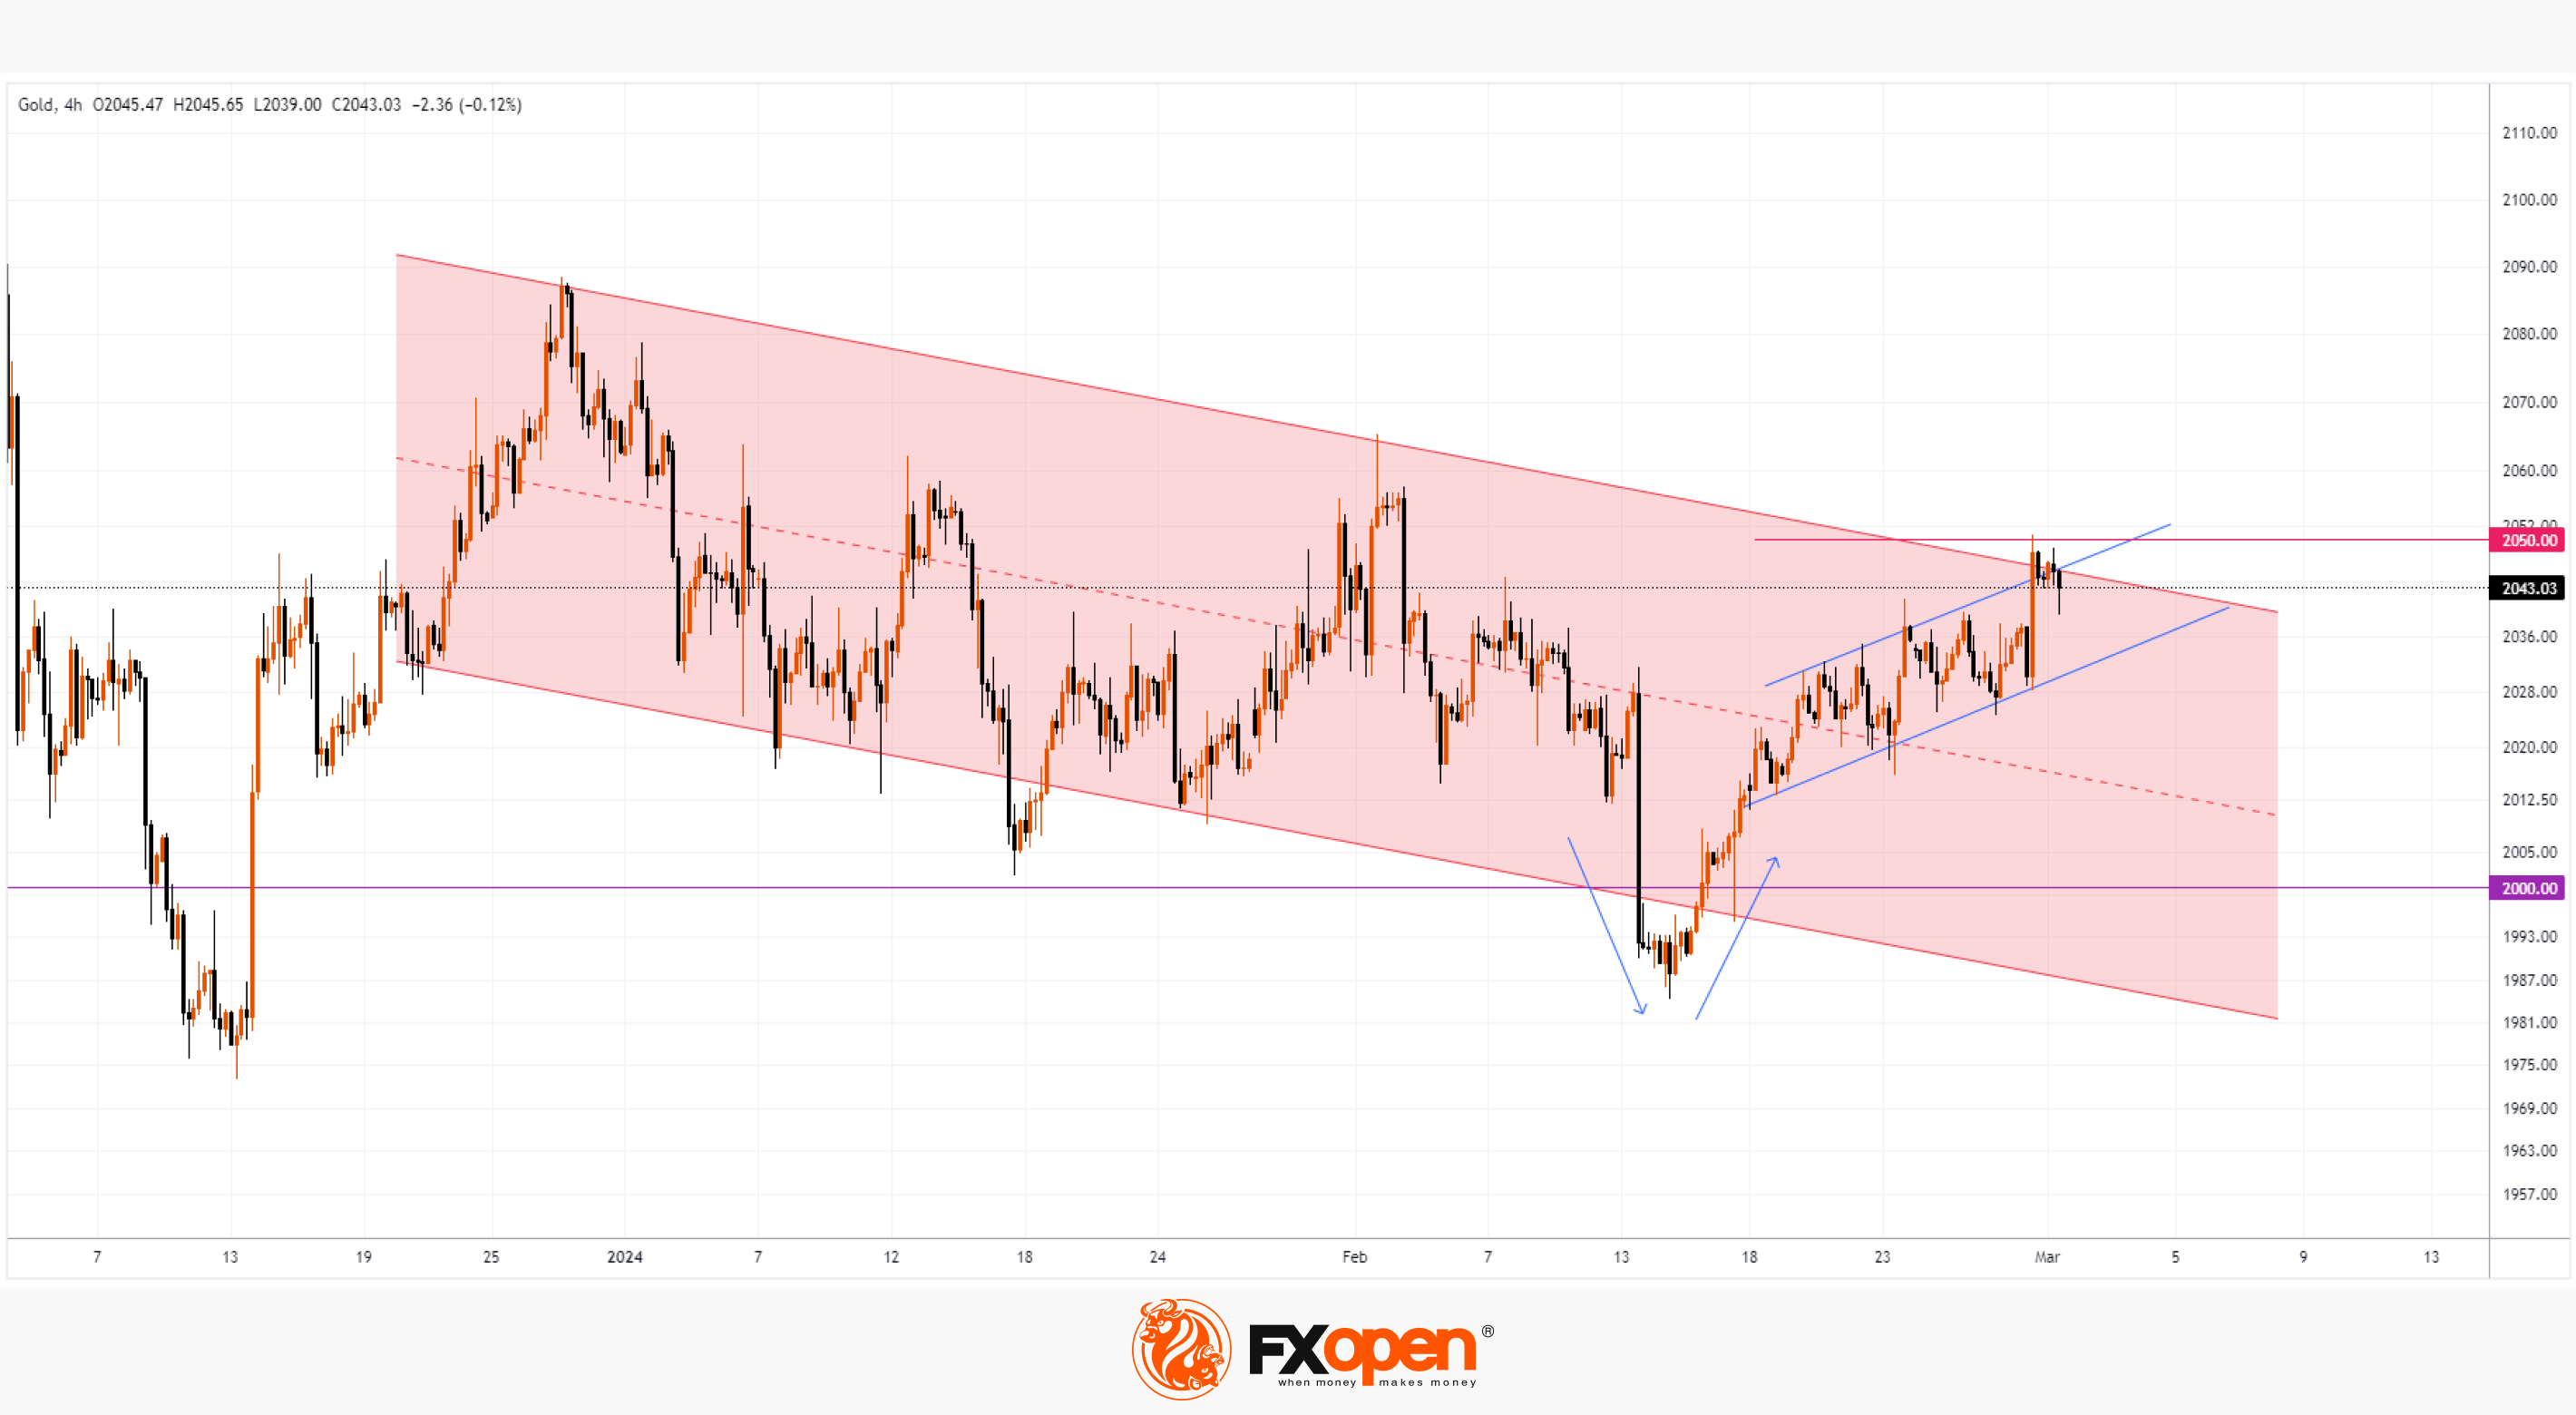
XAU/USD chart shows that:
→ the price of gold is in a downward trend (shown in red);
→ yesterday, the price not only touched the psychological level of USD 2,050, but also reached the upper limit of the downward red channel. That is, both lines acted as a block of resistance, which appears to be a serious obstacle to the upward impulse (shown by blue lines).
A sharp change in sentiment (yesterday, positive, today, negative) may be similar to a sharp change in mood (in a mirror image) that happened in mid-February. As the blue arrows show, the negativity caused by the price falling below the psychological level of USD 2,000 within a few days was replaced by positive sentiment.
Therefore, it is possible that the activation of the bears, noticeable in the action of the price of gold this morning, may result in an attempt to resume the development of the market trend within the red channel. The nearest serious test of the seriousness of the bears' intentions may be the lower blue line, which worked as support in the second half of February.
Start trading commodity CFDs with tight spreads. Open your FXOpen account now or learn more about trading forex with FXOpen.
CFDs are complex instruments and come with a high risk of losing your money.
This article represents the opinion of the Companies operating under the FXOpen brand only. It is not to be construed as an offer, solicitation, or recommendation with respect to products and services provided by the Companies operating under the FXOpen brand, nor is it to be considered financial advice.
Price of Gold Briefly Exceeded $2,050 per Ounce
In addition to new records in the stock markets, the reaction to yesterday's news about inflation in the US was also a decrease in government bond yields and a rapid rise in the price of gold — the cost of XAU/USD jumped by 0.9% in just one hour, while the day's high exceeded USD 2,050 per ounce .
However, on Friday morning the price of XAU/USD dropped below USD 2,040 – did market participants misjudge the impact of US inflation on the price of gold?
XAU/USD chart shows that:
→ the price of gold is in a downward trend (shown in red);
→ yesterday, the price not only touched the psychological level of USD 2,050, but also reached the upper limit of the downward red channel. That is, both lines acted as a block of resistance, which appears to be a serious obstacle to the upward impulse (shown by blue lines).
A sharp change in sentiment (yesterday, positive, today, negative) may be similar to a sharp change in mood (in a mirror image) that happened in mid-February. As the blue arrows show, the negativity caused by the price falling below the psychological level of USD 2,000 within a few days was replaced by positive sentiment.
Therefore, it is possible that the activation of the bears, noticeable in the action of the price of gold this morning, may result in an attempt to resume the development of the market trend within the red channel. The nearest serious test of the seriousness of the bears' intentions may be the lower blue line, which worked as support in the second half of February.
Start trading commodity CFDs with tight spreads. Open your FXOpen account now or learn more about trading forex with FXOpen.
CFDs are complex instruments and come with a high risk of losing your money.
This article represents the opinion of the Companies operating under the FXOpen brand only. It is not to be construed as an offer, solicitation, or recommendation with respect to products and services provided by the Companies operating under the FXOpen brand, nor is it to be considered financial advice.
👍3
#cac40 #stockmarket #AMZN #oilprices
Weekly Market Wrap With Gary Thomson: CAC 40, AUD, OIL, AMAZON
Get the latest scoop on the week's hottest headlines, all in one convenient video. Join Gary Thomson, the COO of FXOpen UK, as he breaks down the most significant news reports and shares his expert insights.
🔸 European Stock Markets on All-Time Roll Despite Economic Bleakness
🔸 Australian Dollar Weakens amid Inflation News
🔸 Brent Crude Oil Makes Sudden Rally As OPEC Countries Mull Low Output
🔸 AMZN Share Price Hits 25-Month High After Inclusion in DJIA Index
Stay in the know and empower yourself with our short, yet power-packed video. Watch it now and stay updated with FXOpen. Don't miss out on this invaluable opportunity to sharpen your trading skills and make informed decisions.
https://cutt.ly/WwMldrex
To take advantage of price fluctuations in the foreign exchange markets, consider enlisting the services of a reliable broker like FXOpen.
⚠️
This forecast represents FXOpen Companies opinion only, it should not be construed as an offer, invitation or recommendation in respect to FXOpen Companies products and services or as financial advice
Weekly Market Wrap With Gary Thomson: CAC 40, AUD, OIL, AMAZON
Get the latest scoop on the week's hottest headlines, all in one convenient video. Join Gary Thomson, the COO of FXOpen UK, as he breaks down the most significant news reports and shares his expert insights.
🔸 European Stock Markets on All-Time Roll Despite Economic Bleakness
🔸 Australian Dollar Weakens amid Inflation News
🔸 Brent Crude Oil Makes Sudden Rally As OPEC Countries Mull Low Output
🔸 AMZN Share Price Hits 25-Month High After Inclusion in DJIA Index
Stay in the know and empower yourself with our short, yet power-packed video. Watch it now and stay updated with FXOpen. Don't miss out on this invaluable opportunity to sharpen your trading skills and make informed decisions.
https://cutt.ly/WwMldrex
To take advantage of price fluctuations in the foreign exchange markets, consider enlisting the services of a reliable broker like FXOpen.
⚠️
This forecast represents FXOpen Companies opinion only, it should not be construed as an offer, invitation or recommendation in respect to FXOpen Companies products and services or as financial advice
YouTube
Weekly Market Wrap With Gary Thomson: CAC 40, AUD, OIL, AMAZON
Get the latest scoop on the week's hottest headlines, all in one convenient video. Join Gary Thomson, the COO of FXOpen UK, as he breaks down the most significant news reports and shares his expert insights.
00:41 - European Stock Markets on All-Time Roll…
00:41 - European Stock Markets on All-Time Roll…
👍4
#marketanalysis #oilprices #opec #MarketNews
WTI Oil Price Reaches 4-month High against the Backdrop of OPEC+ Decision
On Friday, the price of a barrel of WTI crude oil exceeded USD 80 per barrel due to the decision to continue the policy of reducing oil production by OPEC+ countries.
Saudi Arabia said on Sunday it would extend oil production cuts until June to “maintain stability and balance in oil markets,” an official statement said. Kuwait and the United Arab Emirates also said they would also continue cuts.
NYT writes that the decision was expected. At the same time, the price of WTI oil exceeded USD 80 per barrel on Friday for the first time since the beginning of November 2023.
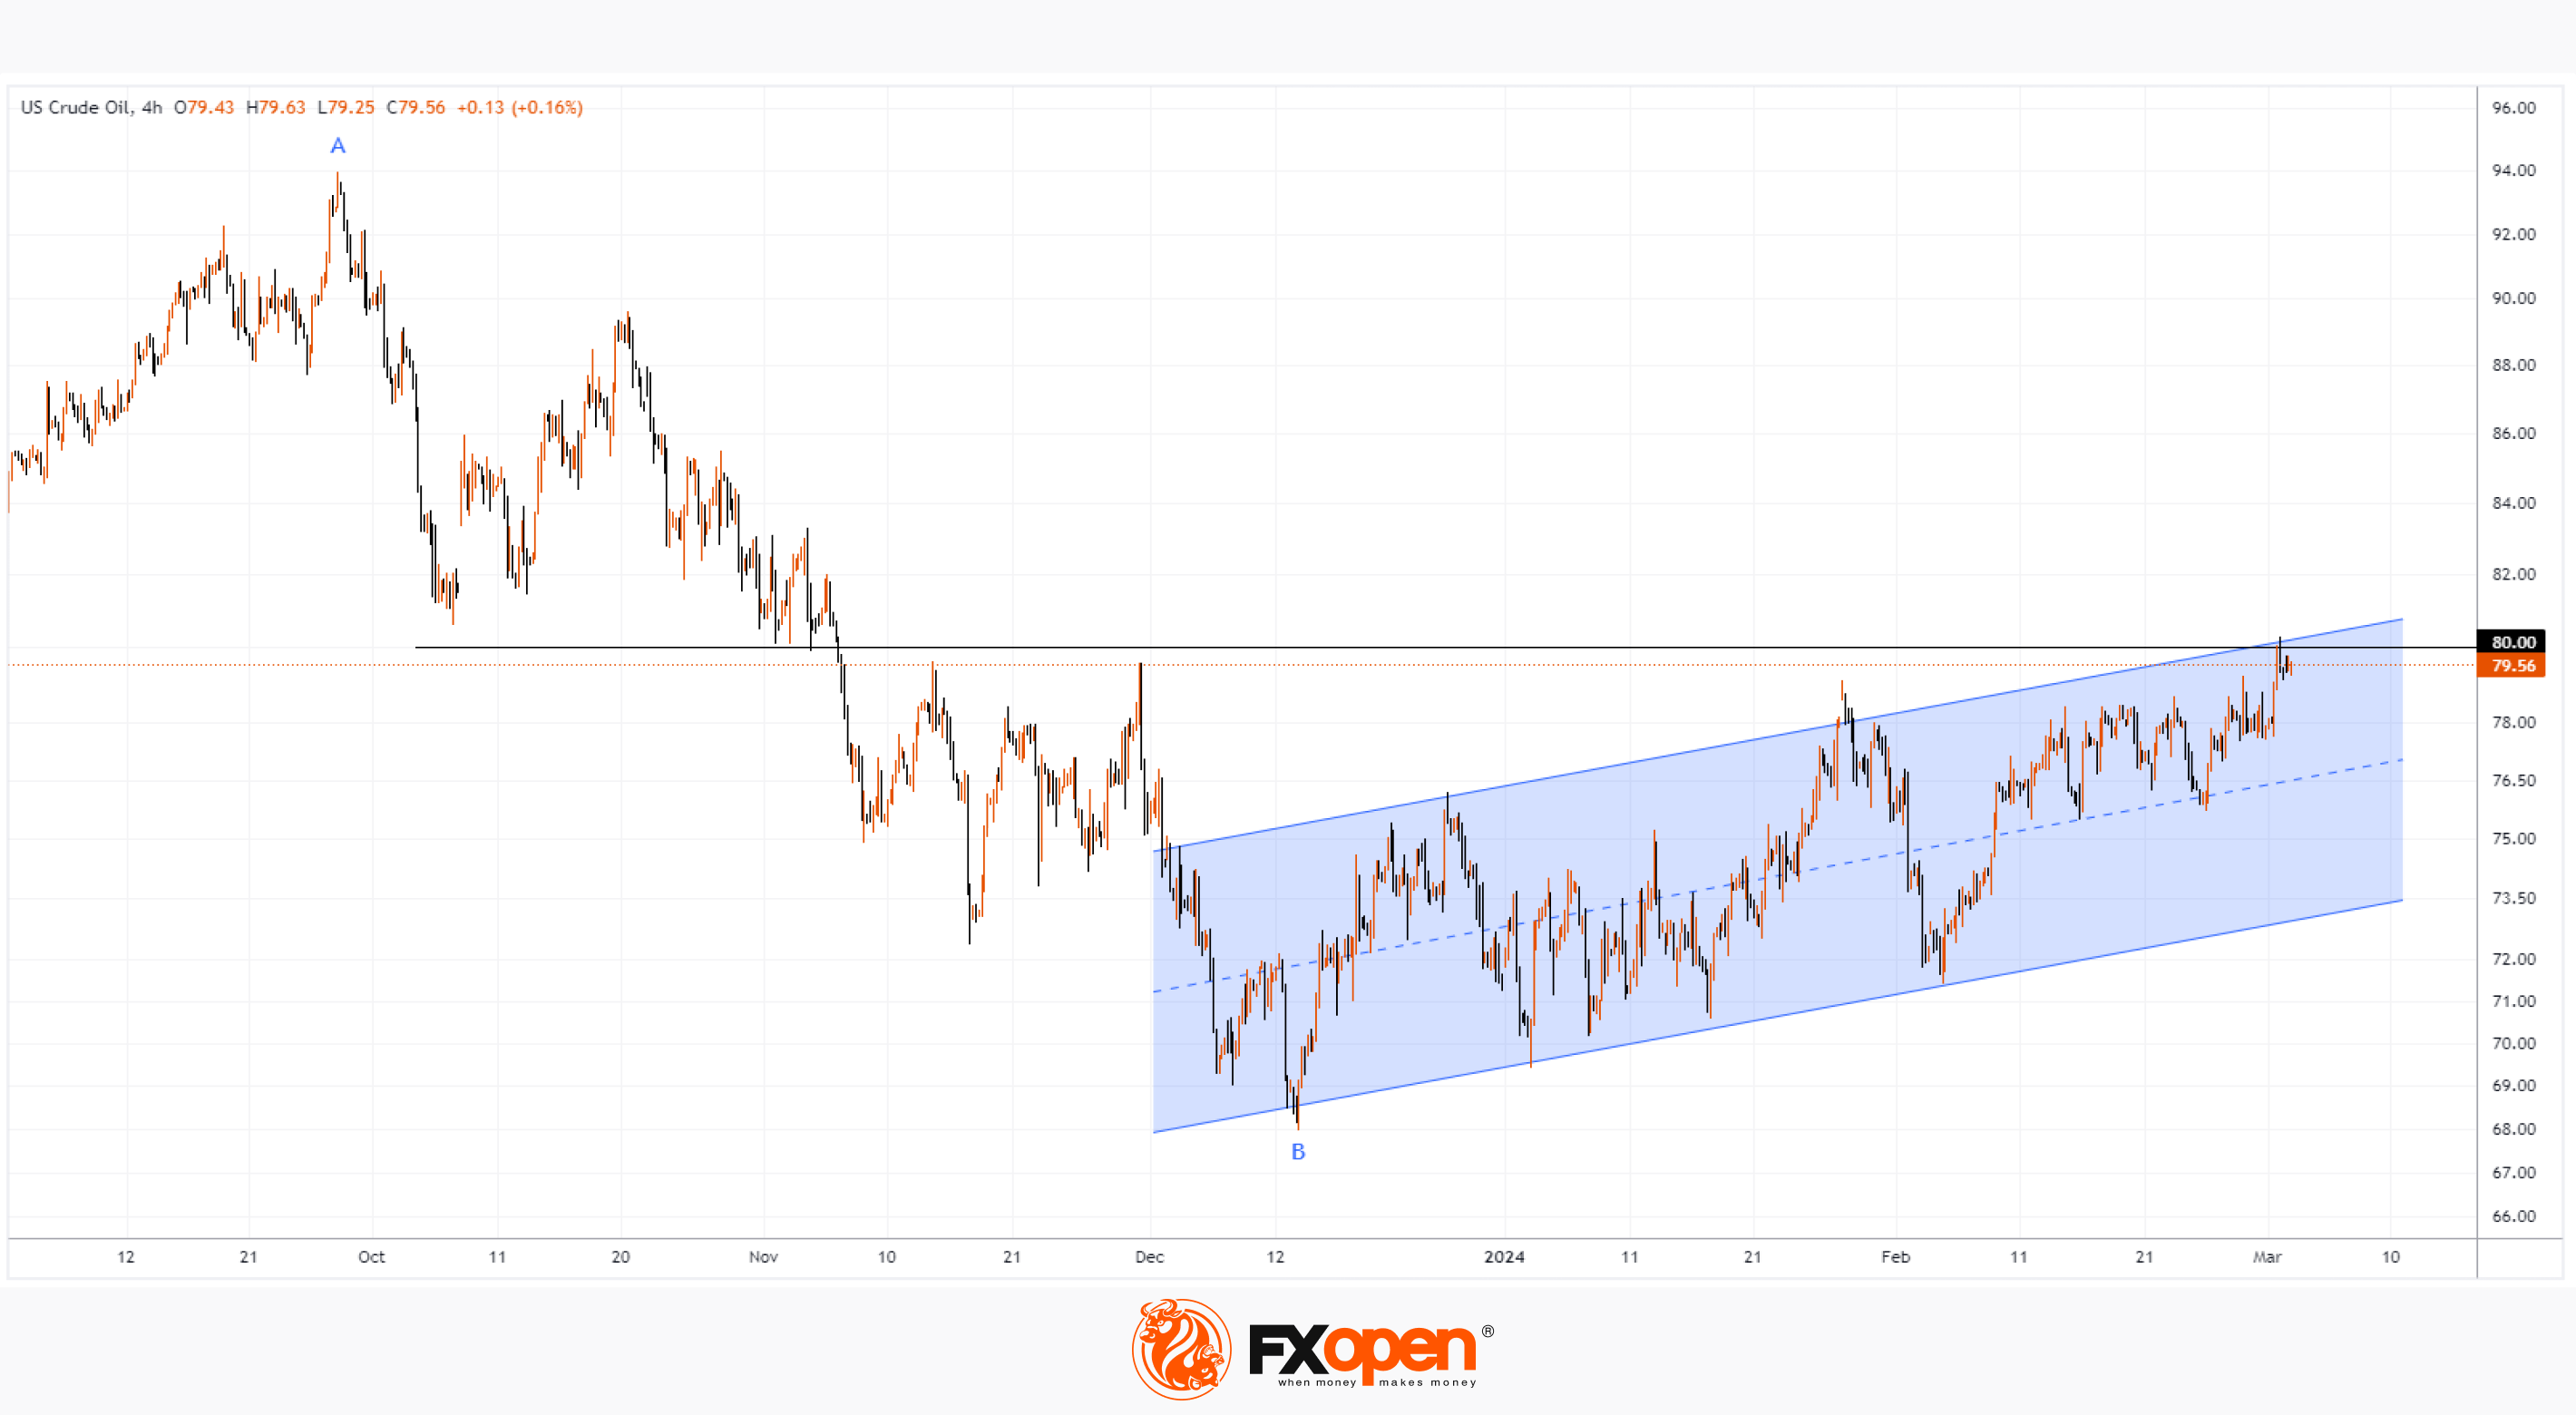
The price chart for WTI oil shows that the market has been in an upward trend since mid-December - the price has formed an upward channel (shown in blue). In addition to the OPEC+ policy, the strength of demand is also supported by:
→ uncertainty in the military conflict between Hamas and Israel;
→ facts of attacks on oil tankers in the Red Sea.
Will the price be able to consolidate at the peak reached? Arguments against the development of such a scenario are provided by a technical analysis of the WTI oil price chart:
→ the price is at the upper border of the ascending blue channel (that is, near the resistance line);
→ the USD 80 level can act as psychological resistance with the formation of a false breakout pattern;
→ the top formed on Friday is in the resistance area of the Fibonacci level of 50% of the decline A→B.
Thus, there are prerequisites to assume that the market is in a vulnerable position for a pullback after the effect of the news about the OPEC+ decision is fully taken into account. It is possible that the price of WTI oil may roll back to the support of the median line of the ascending blue channel.
Start trading commodity CFDs with tight spreads. Open your trading account now or learn more about trading commodity CFDs with FXOpen.
CFDs are complex instruments and come with a high risk of losing your money.
This article represents the opinion of the Companies operating under the FXOpen brand only. It is not to be construed as an offer, solicitation, or recommendation with respect to products and services provided by the Companies operating under the FXOpen brand, nor is it to be considered financial advice.
WTI Oil Price Reaches 4-month High against the Backdrop of OPEC+ Decision
On Friday, the price of a barrel of WTI crude oil exceeded USD 80 per barrel due to the decision to continue the policy of reducing oil production by OPEC+ countries.
Saudi Arabia said on Sunday it would extend oil production cuts until June to “maintain stability and balance in oil markets,” an official statement said. Kuwait and the United Arab Emirates also said they would also continue cuts.
NYT writes that the decision was expected. At the same time, the price of WTI oil exceeded USD 80 per barrel on Friday for the first time since the beginning of November 2023.
The price chart for WTI oil shows that the market has been in an upward trend since mid-December - the price has formed an upward channel (shown in blue). In addition to the OPEC+ policy, the strength of demand is also supported by:
→ uncertainty in the military conflict between Hamas and Israel;
→ facts of attacks on oil tankers in the Red Sea.
Will the price be able to consolidate at the peak reached? Arguments against the development of such a scenario are provided by a technical analysis of the WTI oil price chart:
→ the price is at the upper border of the ascending blue channel (that is, near the resistance line);
→ the USD 80 level can act as psychological resistance with the formation of a false breakout pattern;
→ the top formed on Friday is in the resistance area of the Fibonacci level of 50% of the decline A→B.
Thus, there are prerequisites to assume that the market is in a vulnerable position for a pullback after the effect of the news about the OPEC+ decision is fully taken into account. It is possible that the price of WTI oil may roll back to the support of the median line of the ascending blue channel.
Start trading commodity CFDs with tight spreads. Open your trading account now or learn more about trading commodity CFDs with FXOpen.
CFDs are complex instruments and come with a high risk of losing your money.
This article represents the opinion of the Companies operating under the FXOpen brand only. It is not to be construed as an offer, solicitation, or recommendation with respect to products and services provided by the Companies operating under the FXOpen brand, nor is it to be considered financial advice.
👍3
#marketanalysis #MarketNews #tradingforex
Swiss Franc Weakens after Inflation News
Inflation in the country fell in February to its lowest level in nearly two-and-a-half years, data from Switzerland's Federal Statistical Office showed on Monday. Although consumer prices rose 1.2% compared to a year earlier, there is reason to believe that inflation is slowing down compared to the 1.3% recorded a month earlier.
Reuters writes that the Swiss National Bank has kept inflation rates within the target range since May 2023, despite rising rents, sales taxes and energy prices. And the latest news makes it more likely that the SNB will cut rates at its next meeting, scheduled for March 21.
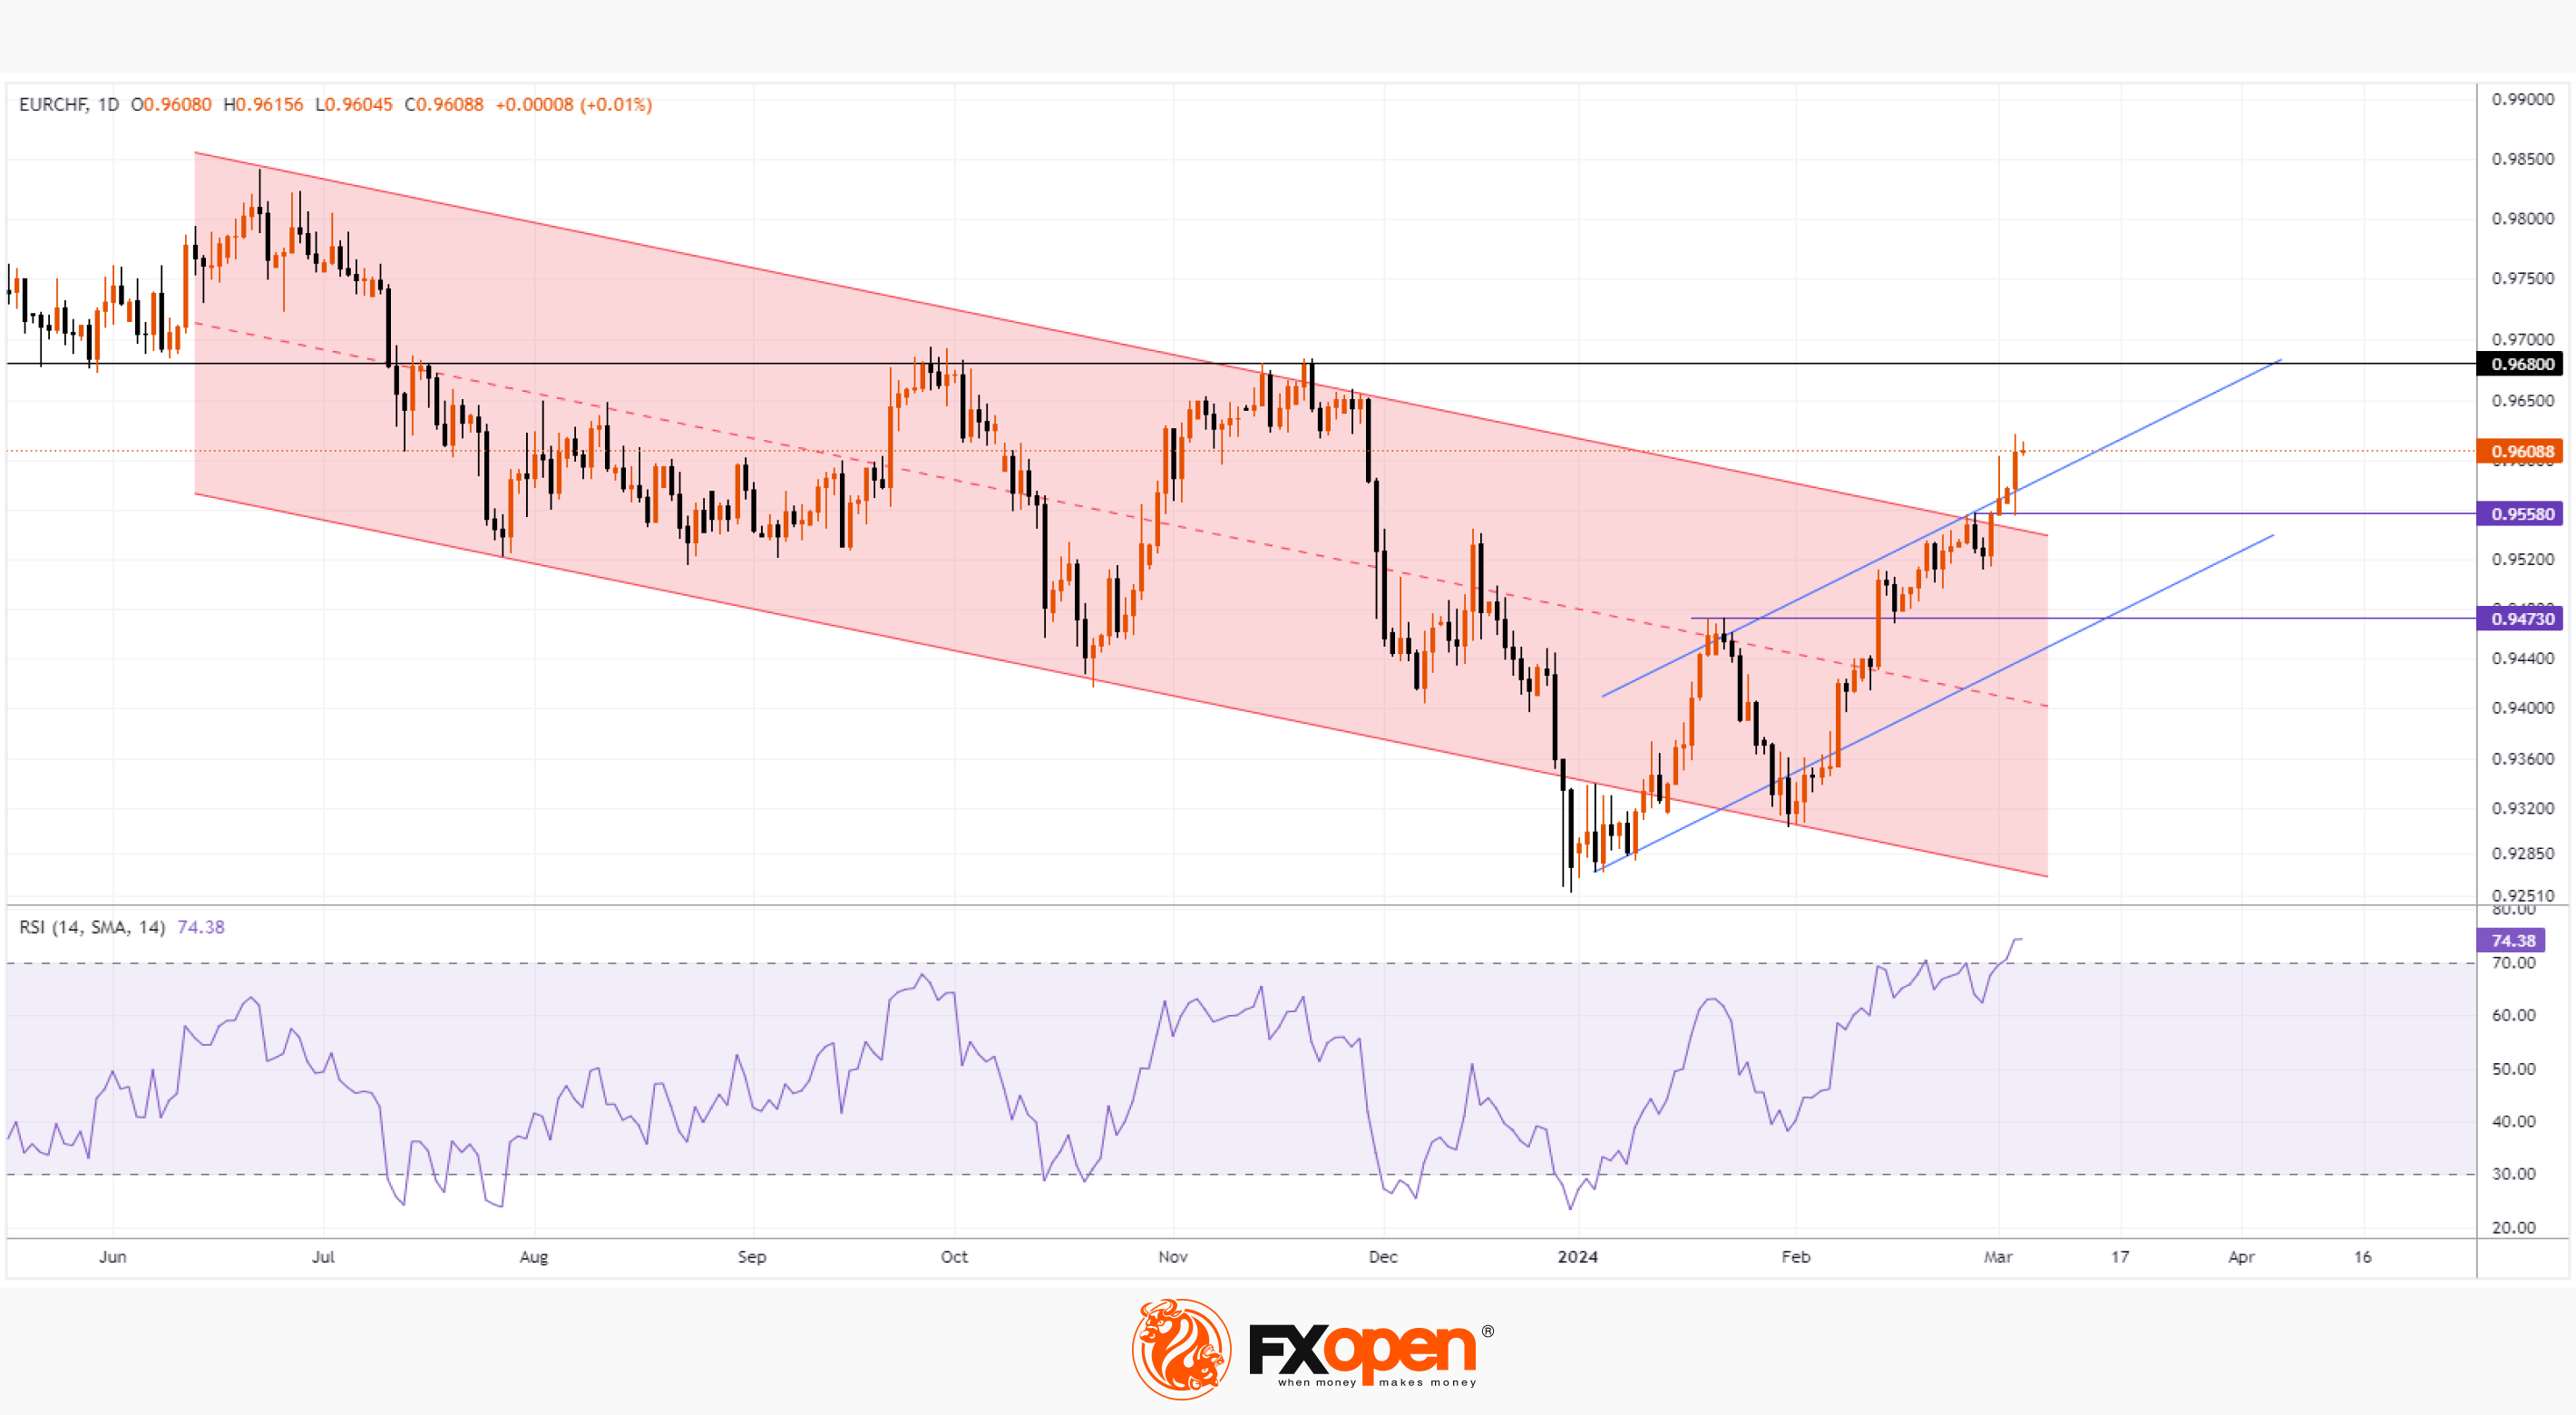
Thus, market participants can expect a looser policy and an affordable franc — which is why the CHF has weakened against a number of currencies. For example, the EUR/CHF rate has reached its highest level since November 2023.
Wherein:
→ the price has broken through the downward channel (shown in red), which has been in effect since last summer — it seems that it is already losing relevance;
→ since the beginning of the year, the rate has already increased by more than 3.5%, which allows us to outline trend lines (shown in blue);
→ levels 0.94730 and 0.95580 changed their behaviour from resistance to support;
→ daily RSI indicates that after strong growth, the market is in the overbought zone, which creates the preconditions for the formation of a correction.
If the growth continues, an important test of the seriousness of the bulls’ intentions may be the level of 0.96800 – near which important reversals in the EUR/CHF price were previously formed.
Trade over 50 forex markets 24 hours a day with FXOpen. Take advantage of low commissions, deep liquidity, and spreads from 0.0 pips. Open your FXOpen account now or learn more about trading forex with FXOpen.
CFDs are complex instruments and come with a high risk of losing your money.
This article represents the opinion of the Companies operating under the FXOpen brand only. It is not to be construed as an offer, solicitation, or recommendation with respect to products and services provided by the Companies operating under the FXOpen brand, nor is it to be considered financial advice.
Swiss Franc Weakens after Inflation News
Inflation in the country fell in February to its lowest level in nearly two-and-a-half years, data from Switzerland's Federal Statistical Office showed on Monday. Although consumer prices rose 1.2% compared to a year earlier, there is reason to believe that inflation is slowing down compared to the 1.3% recorded a month earlier.
Reuters writes that the Swiss National Bank has kept inflation rates within the target range since May 2023, despite rising rents, sales taxes and energy prices. And the latest news makes it more likely that the SNB will cut rates at its next meeting, scheduled for March 21.
Thus, market participants can expect a looser policy and an affordable franc — which is why the CHF has weakened against a number of currencies. For example, the EUR/CHF rate has reached its highest level since November 2023.
Wherein:
→ the price has broken through the downward channel (shown in red), which has been in effect since last summer — it seems that it is already losing relevance;
→ since the beginning of the year, the rate has already increased by more than 3.5%, which allows us to outline trend lines (shown in blue);
→ levels 0.94730 and 0.95580 changed their behaviour from resistance to support;
→ daily RSI indicates that after strong growth, the market is in the overbought zone, which creates the preconditions for the formation of a correction.
If the growth continues, an important test of the seriousness of the bulls’ intentions may be the level of 0.96800 – near which important reversals in the EUR/CHF price were previously formed.
Trade over 50 forex markets 24 hours a day with FXOpen. Take advantage of low commissions, deep liquidity, and spreads from 0.0 pips. Open your FXOpen account now or learn more about trading forex with FXOpen.
CFDs are complex instruments and come with a high risk of losing your money.
This article represents the opinion of the Companies operating under the FXOpen brand only. It is not to be construed as an offer, solicitation, or recommendation with respect to products and services provided by the Companies operating under the FXOpen brand, nor is it to be considered financial advice.
👍3
#bitcoin #BTCUSD #crypto #cryptonews
After Updating the Historical High, the Price of Bitcoin Collapsed by 14%
Bitcoin's previous all-time high price, recorded on November 10, 2021, was around USD 68,900 per coin (depending on exchanges).
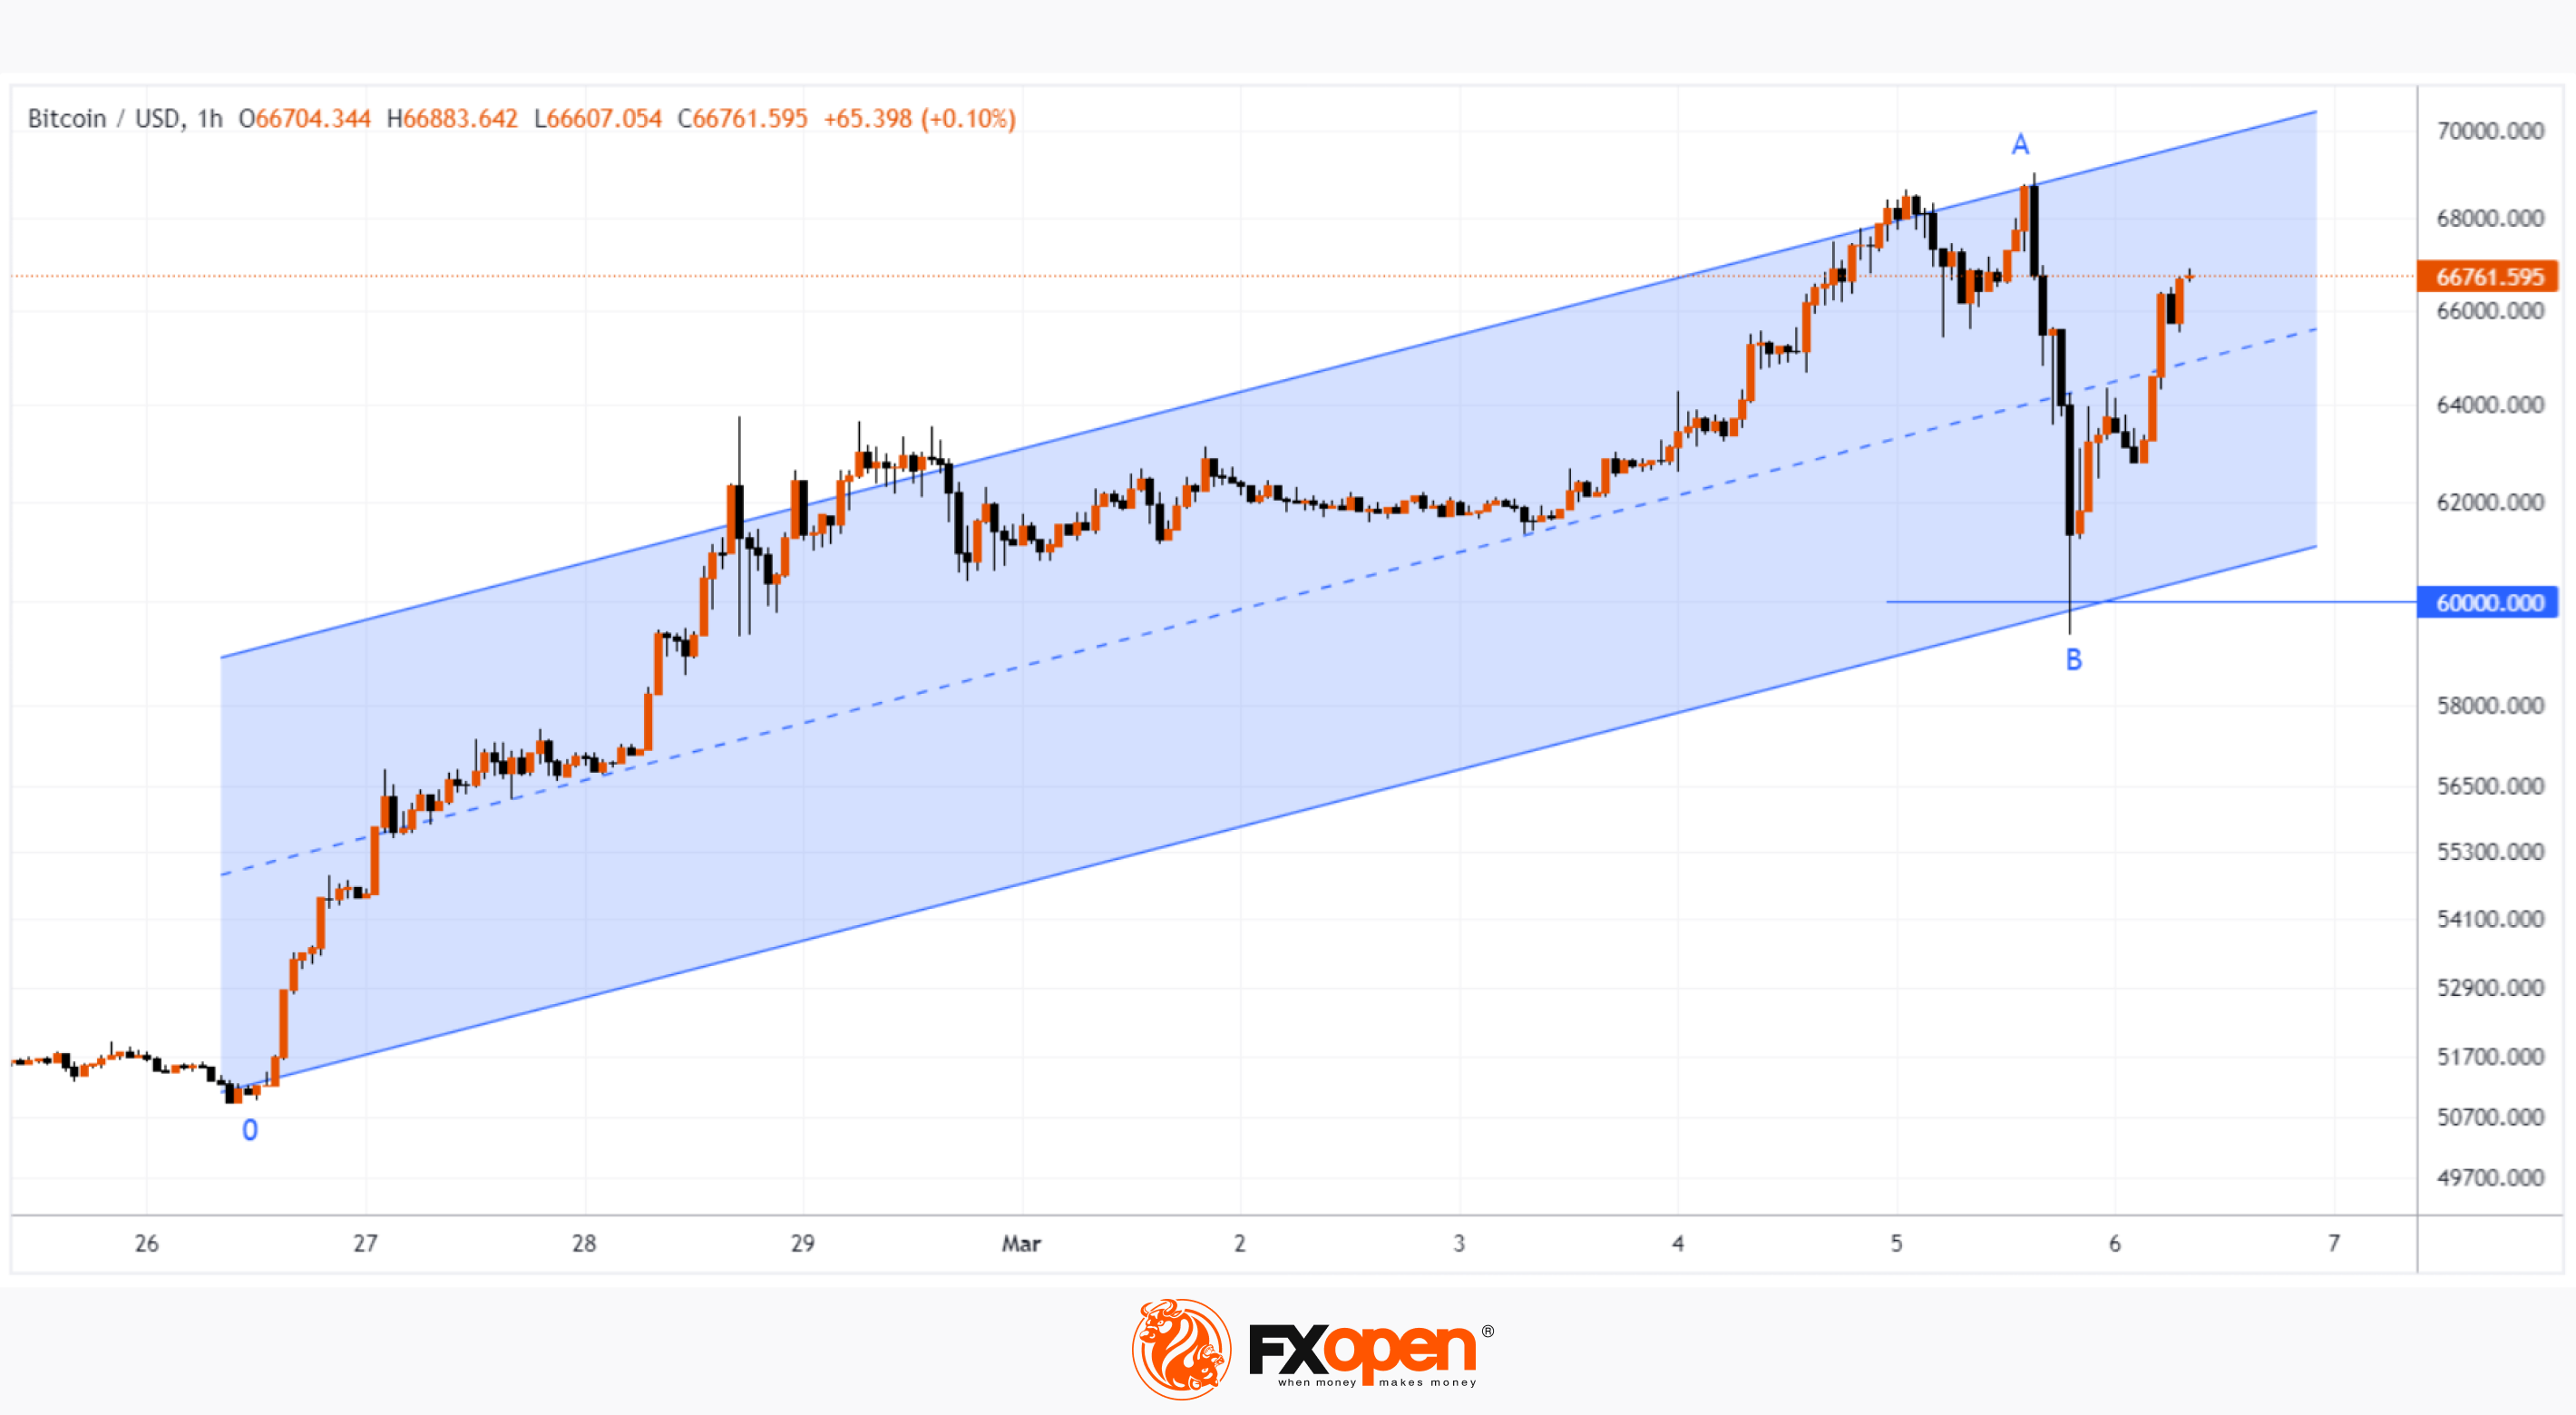
But yesterday, the price of Bitcoin exceeded 69k! However, the jubilation from the new historical peak quickly gave way to fear — as the BTC/USD rate began to fall rapidly. From peak A to low B – the price traveled a path of more than -14% in just 5 hours.
These events highlight 2 characteristic features of the cryptocurrency market:
→ Excessive volatility, which is not typical for the stock and foreign exchange markets. For comparison: on October 19, 1987 — Black Monday — the S&P 500 index fell by about 20.5%. After this incident, there were no days when the drop exceeded 14%.
→ Emotionality of the market and the importance of psychological levels. At these levels, the price of Bitcoin often makes false punctures. Yesterday, there were 2 such punctures: a false bullish puncture of the 2021 top, and a false bearish puncture of the round level of 60k dollars for Bitcoin.
It is also worth noting that yesterday’s low was strengthened by support lines:
→ Fibo level 50% of the rally 0→A.
→ The lower border of the ascending channel (shown in blue).
Technical analysis of the Bitcoin chart shows that the price continues to move in an ascending channel, moreover, the price has returned to its upper half. It is possible that yesterday's sharp decline, which saw over USD 400 million in long positions liquidated across 8 major crypto exchanges, is an extremely aggressive form of correction that occurred as part of the current uptrend. If so, then in March we may witness new hikes in the price of Bitcoin to historical peaks.
FXOpen offers the world's most popular cryptocurrency CFDs*, including Bitcoin and Ethereum. Floating spreads, 1:2 leverage — at your service. Open your trading account now or learn more about crypto CFD trading with FXOpen.
*At FXOpen UK and FXOpen AU, Cryptocurrency CFDs are only available for trading by those clients categorised as Professional clients under FCA Rules and Professional clients under ASIC Rules respectively. They are not available for trading by Retail clients.
CFDs are complex instruments and come with a high risk of losing your money.
This article represents the opinion of the Companies operating under the FXOpen brand only. It is not to be construed as an offer, solicitation, or recommendation with respect to products and services provided by the Companies operating under the FXOpen brand, nor is it to be considered financial advice.
After Updating the Historical High, the Price of Bitcoin Collapsed by 14%
Bitcoin's previous all-time high price, recorded on November 10, 2021, was around USD 68,900 per coin (depending on exchanges).
But yesterday, the price of Bitcoin exceeded 69k! However, the jubilation from the new historical peak quickly gave way to fear — as the BTC/USD rate began to fall rapidly. From peak A to low B – the price traveled a path of more than -14% in just 5 hours.
These events highlight 2 characteristic features of the cryptocurrency market:
→ Excessive volatility, which is not typical for the stock and foreign exchange markets. For comparison: on October 19, 1987 — Black Monday — the S&P 500 index fell by about 20.5%. After this incident, there were no days when the drop exceeded 14%.
→ Emotionality of the market and the importance of psychological levels. At these levels, the price of Bitcoin often makes false punctures. Yesterday, there were 2 such punctures: a false bullish puncture of the 2021 top, and a false bearish puncture of the round level of 60k dollars for Bitcoin.
It is also worth noting that yesterday’s low was strengthened by support lines:
→ Fibo level 50% of the rally 0→A.
→ The lower border of the ascending channel (shown in blue).
Technical analysis of the Bitcoin chart shows that the price continues to move in an ascending channel, moreover, the price has returned to its upper half. It is possible that yesterday's sharp decline, which saw over USD 400 million in long positions liquidated across 8 major crypto exchanges, is an extremely aggressive form of correction that occurred as part of the current uptrend. If so, then in March we may witness new hikes in the price of Bitcoin to historical peaks.
FXOpen offers the world's most popular cryptocurrency CFDs*, including Bitcoin and Ethereum. Floating spreads, 1:2 leverage — at your service. Open your trading account now or learn more about crypto CFD trading with FXOpen.
*At FXOpen UK and FXOpen AU, Cryptocurrency CFDs are only available for trading by those clients categorised as Professional clients under FCA Rules and Professional clients under ASIC Rules respectively. They are not available for trading by Retail clients.
CFDs are complex instruments and come with a high risk of losing your money.
This article represents the opinion of the Companies operating under the FXOpen brand only. It is not to be construed as an offer, solicitation, or recommendation with respect to products and services provided by the Companies operating under the FXOpen brand, nor is it to be considered financial advice.
👍3
#tsla #stockmarket #stocktrading #MarketNews
TSLA Stock Price Falls Over 9% in Just 2 Days
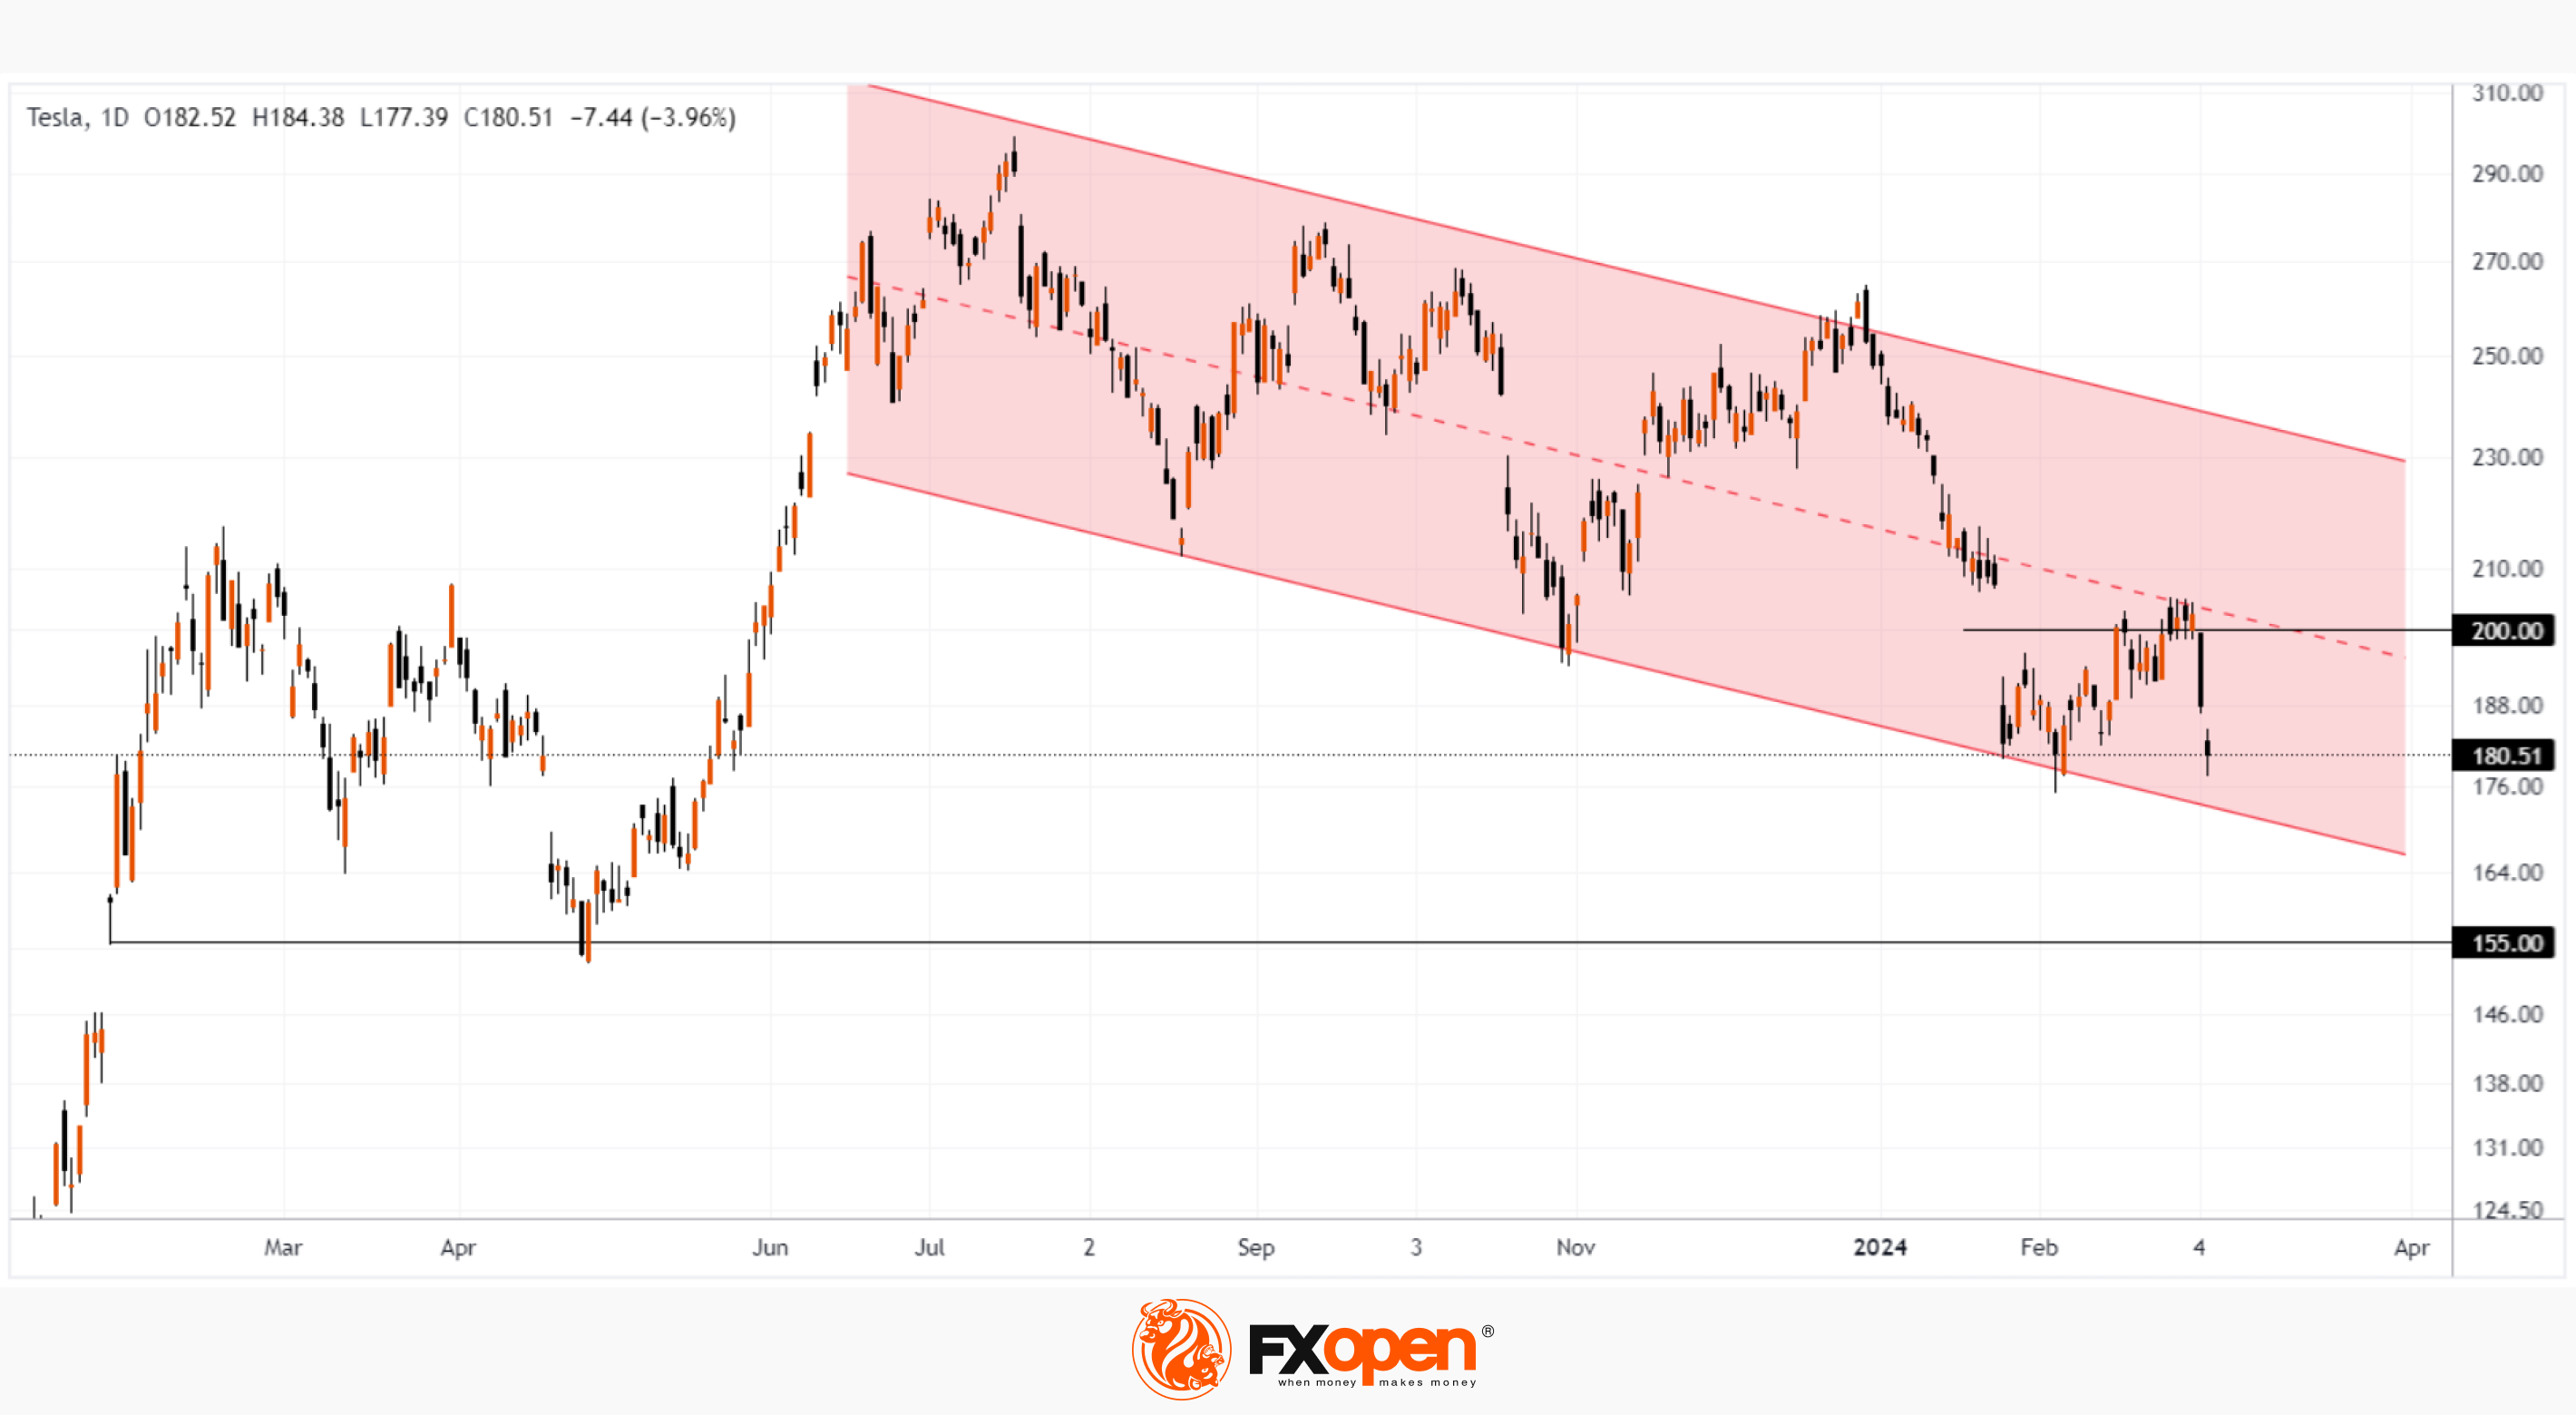
The day before yesterday, trading in TSLA shares began at an opening price of USD 199.34; trading yesterday closed at a price of USD 180.51. The fall in TSLA shares led Musk to lose the title of the world's richest man to Jeff Bezos.
The main driver of the decline in the price of TSLA shares was news:
→ about the temporary shutdown of the Giga Berlin plant in Germany after an arson set by a group claiming that the company led by Elon Musk is devouring “land, resources, people”;
→ that deliveries of electric cars from the Shanghai plant have dropped to their lowest level in more than a year — which may indicate fierce competition with Chinese manufacturers.
It also became known that Morgan Stanley analyst Adam Jonas is lowering his target price from USD 345 to USD 320 and predicting a decline in sales for FY24.
Technical analysis of the TSLA stock chart shows that:
→ The TSLA stock price is moving in a downward channel (shown in red), acting noticeably weaker than the broader market.
→ In March, the median line acted as resistance.
→ The price was unable to consolidate above the round level of USD 200 (in November last year it worked as support).
If the bearish momentum continues, TSLA price could reach the channel's lower boundary around USD 170, renewing its 2024 low. Even lower is important support at USD 155, formed from a gap last January and tested in April.
On the other hand, the current decline may turn into a profitable opportunity in the long term.
As it became known this week, Cathie Wood's ARK funds are increasing their long positions in TSLA shares. And respected analyst Daniel Ives said on CNBC that Tesla's growth story isn't dead and it's just going through a "brutal transition" that could be linked to deteriorating communication due to the company replacing its chief financial officer last year.
Buy and sell stocks of the world's biggest publicly-listed companies with CFDs on FXOpen’s trading platform. Open your FXOpen account now or learn more about trading share CFDs with FXOpen.
CFDs are complex instruments and come with a high risk of losing your money.
This article represents the opinion of the Companies operating under the FXOpen brand only. It is not to be construed as an offer, solicitation, or recommendation with respect to products and services provided by the Companies operating under the FXOpen brand, nor is it to be considered financial advice.
TSLA Stock Price Falls Over 9% in Just 2 Days
The day before yesterday, trading in TSLA shares began at an opening price of USD 199.34; trading yesterday closed at a price of USD 180.51. The fall in TSLA shares led Musk to lose the title of the world's richest man to Jeff Bezos.
The main driver of the decline in the price of TSLA shares was news:
→ about the temporary shutdown of the Giga Berlin plant in Germany after an arson set by a group claiming that the company led by Elon Musk is devouring “land, resources, people”;
→ that deliveries of electric cars from the Shanghai plant have dropped to their lowest level in more than a year — which may indicate fierce competition with Chinese manufacturers.
It also became known that Morgan Stanley analyst Adam Jonas is lowering his target price from USD 345 to USD 320 and predicting a decline in sales for FY24.
Technical analysis of the TSLA stock chart shows that:
→ The TSLA stock price is moving in a downward channel (shown in red), acting noticeably weaker than the broader market.
→ In March, the median line acted as resistance.
→ The price was unable to consolidate above the round level of USD 200 (in November last year it worked as support).
If the bearish momentum continues, TSLA price could reach the channel's lower boundary around USD 170, renewing its 2024 low. Even lower is important support at USD 155, formed from a gap last January and tested in April.
On the other hand, the current decline may turn into a profitable opportunity in the long term.
As it became known this week, Cathie Wood's ARK funds are increasing their long positions in TSLA shares. And respected analyst Daniel Ives said on CNBC that Tesla's growth story isn't dead and it's just going through a "brutal transition" that could be linked to deteriorating communication due to the company replacing its chief financial officer last year.
Buy and sell stocks of the world's biggest publicly-listed companies with CFDs on FXOpen’s trading platform. Open your FXOpen account now or learn more about trading share CFDs with FXOpen.
CFDs are complex instruments and come with a high risk of losing your money.
This article represents the opinion of the Companies operating under the FXOpen brand only. It is not to be construed as an offer, solicitation, or recommendation with respect to products and services provided by the Companies operating under the FXOpen brand, nor is it to be considered financial advice.
👍3
#marketanalysis #goldprice #XAUUSD
The Price of Gold XAU/USD Sets a Historical Record Exceeding $2160 per Ounce
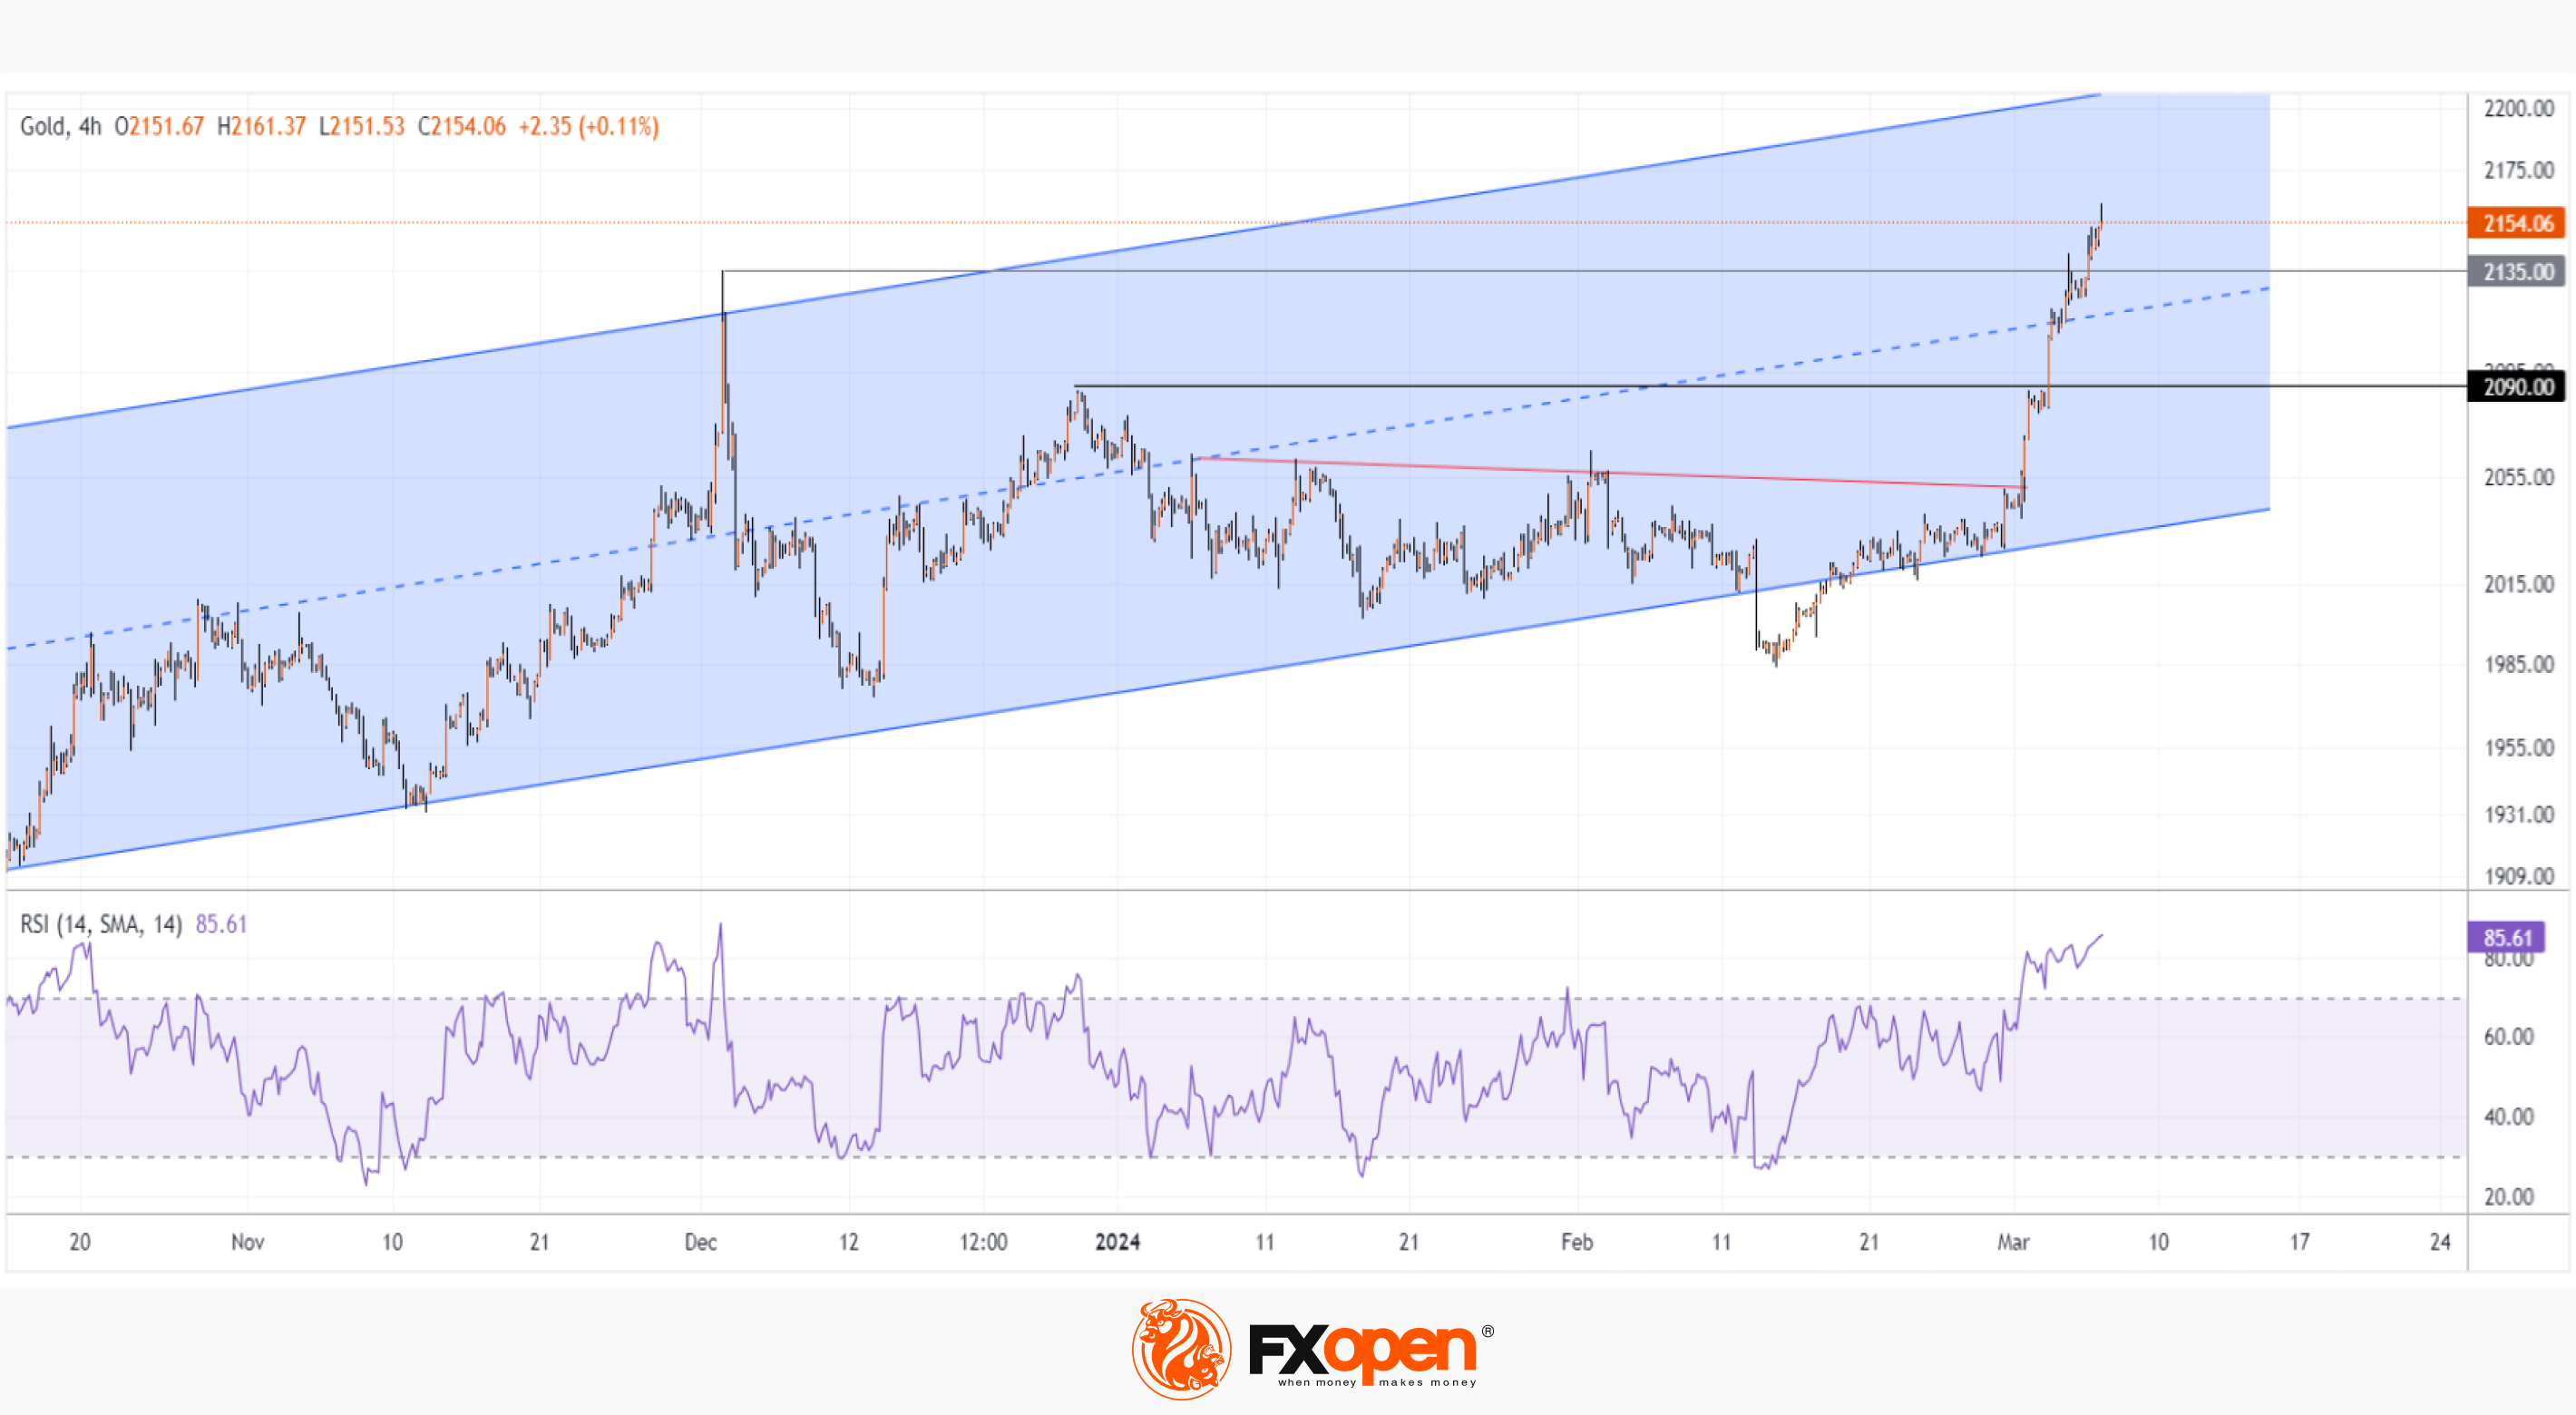
The previous high was around USD 2,135, but gold rose above USD 2,160 an ounce this morning, reaching its highest level ever, as Treasury yields weakened on hopes that the US Federal Reserve will soon begin cutting interest rates.
In a speech yesterday, the Fed chief offered no clarity, saying it would likely be appropriate to ease policy restrictions "at some point this year."
Traders now see a 70% chance of a Fed rate cut in June.
Technical analysis of the XAU/USD chart shows that:
→ the price of gold is in an ascending channel (shown in blue);
→ after a false breakout of its lower border, the price confidently overcame the downward trend line (shown in red) and resistance 2,090;
→ a strong upward impulse led to the RSI indicator entering the extreme overbought zone.
Although the blue ascending channel leaves room for growth to its upper limit, the rise in the price of gold by more than 5% since the first days of March leaves the market vulnerable to a correction — for instance, to the median line of the ascending channel.
James Steel, chief precious metals analyst at HSBC, also says that gold's upward trajectory may slow down. He believes record high prices could cool physical demand for the metal, especially from central banks.
Start trading commodity CFDs with tight spreads. Open your trading account now or learn more about trading commodity CFDs with FXOpen.
CFDs are complex instruments and come with a high risk of losing your money.
This article represents the opinion of the Companies operating under the FXOpen brand only. It is not to be construed as an offer, solicitation, or recommendation with respect to products and services provided by the Companies operating under the FXOpen brand, nor is it to be considered financial advice.
The Price of Gold XAU/USD Sets a Historical Record Exceeding $2160 per Ounce
The previous high was around USD 2,135, but gold rose above USD 2,160 an ounce this morning, reaching its highest level ever, as Treasury yields weakened on hopes that the US Federal Reserve will soon begin cutting interest rates.
In a speech yesterday, the Fed chief offered no clarity, saying it would likely be appropriate to ease policy restrictions "at some point this year."
Traders now see a 70% chance of a Fed rate cut in June.
Technical analysis of the XAU/USD chart shows that:
→ the price of gold is in an ascending channel (shown in blue);
→ after a false breakout of its lower border, the price confidently overcame the downward trend line (shown in red) and resistance 2,090;
→ a strong upward impulse led to the RSI indicator entering the extreme overbought zone.
Although the blue ascending channel leaves room for growth to its upper limit, the rise in the price of gold by more than 5% since the first days of March leaves the market vulnerable to a correction — for instance, to the median line of the ascending channel.
James Steel, chief precious metals analyst at HSBC, also says that gold's upward trajectory may slow down. He believes record high prices could cool physical demand for the metal, especially from central banks.
Start trading commodity CFDs with tight spreads. Open your trading account now or learn more about trading commodity CFDs with FXOpen.
CFDs are complex instruments and come with a high risk of losing your money.
This article represents the opinion of the Companies operating under the FXOpen brand only. It is not to be construed as an offer, solicitation, or recommendation with respect to products and services provided by the Companies operating under the FXOpen brand, nor is it to be considered financial advice.
👍3
#usdcad #marketanalysis #tradingforex
USD/CAD Analysis: Canadian Dollar Strengthens after Bank of Canada Decision
The Bank of Canada has decided to keep interest rates at 5.0% for the fifth time in a row, it announced yesterday, as it continues to look for clearer signs that inflation is moving closer to the bank's 2% target before considering rate cuts.
According to Bank of Canada Governor Tiff Macklem:
→ the Bank is concerned that underlying inflationary pressures remain.
→ It is too early to ease restrictive policies. There is a clear consensus within the Board of Governors that the time has not come (for rate cuts).
→ We are now in a difficult phase of the monetary cycle.
These hawkish statements contributed to the Canadian dollar strengthening against other currencies, in particular against the US dollar.
Technical analysis of the USD/CAD chart today shows that:
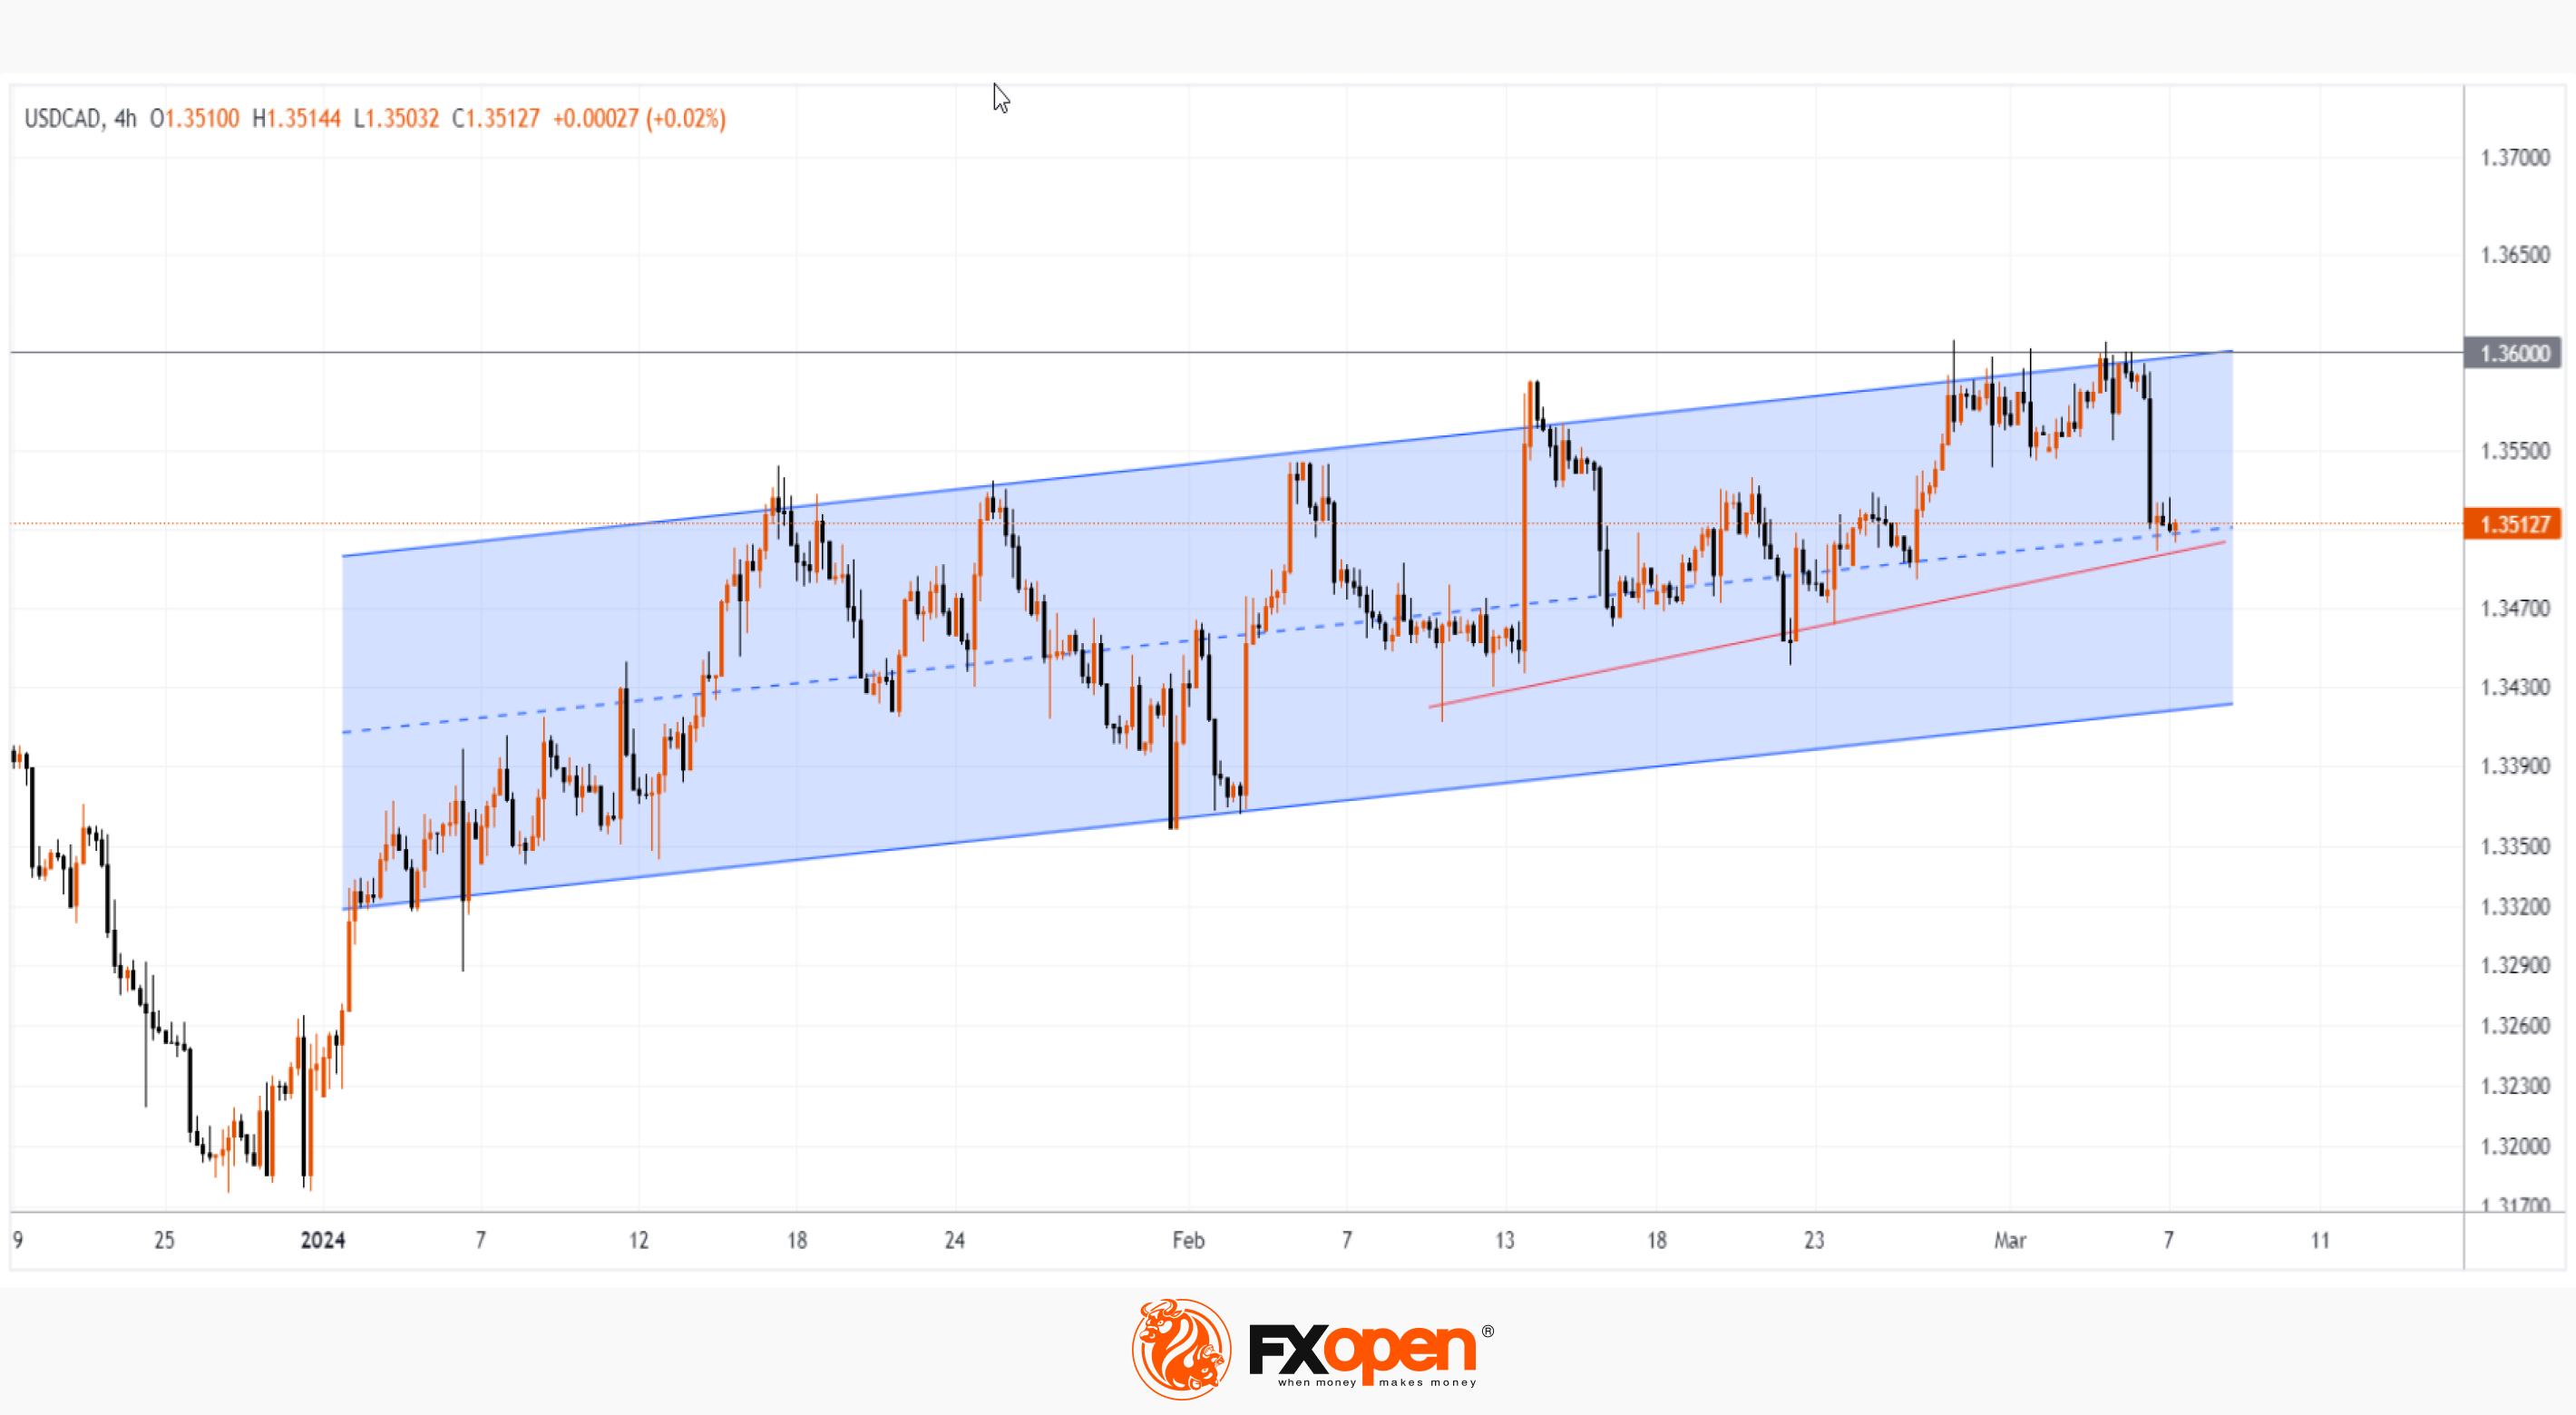
→ for most of 2024, the price moves within the channel shown in blue;
→ yesterday’s news lowered the price from its upper limit to the median;
→ the psychological level of 1.36 retained its role as resistance, although the bulls repeatedly tried to overcome it.
If the bears maintain the initiative, the price of USD/CAD may fall below:
→ breaking through the median line of the channel;
→ breaking through the local trend line (shown by the orange line);
→ attempting to break through the psychological level of 1.35.
In this scenario, the most obvious target for bears may be the lower boundary of the channel, with news about inflation and interest rates remaining the main drivers in the USD/CAD market. Today, by the way, at 16:15 GMT+3, the decision on interest rates from the ECB will become known — be prepared for surges in volatility.
Trade over 50 forex markets 24 hours a day with FXOpen. Take advantage of low commissions, deep liquidity, and spreads from 0.0 pips. Open your FXOpen account now or learn more about trading forex with FXOpen.
CFDs are complex instruments and come with a high risk of losing your money.
This article represents the opinion of the Companies operating under the FXOpen brand only. It is not to be construed as an offer, solicitation, or recommendation with respect to products and services provided by the Companies operating under the FXOpen brand, nor is it to be considered financial advice.
USD/CAD Analysis: Canadian Dollar Strengthens after Bank of Canada Decision
The Bank of Canada has decided to keep interest rates at 5.0% for the fifth time in a row, it announced yesterday, as it continues to look for clearer signs that inflation is moving closer to the bank's 2% target before considering rate cuts.
According to Bank of Canada Governor Tiff Macklem:
→ the Bank is concerned that underlying inflationary pressures remain.
→ It is too early to ease restrictive policies. There is a clear consensus within the Board of Governors that the time has not come (for rate cuts).
→ We are now in a difficult phase of the monetary cycle.
These hawkish statements contributed to the Canadian dollar strengthening against other currencies, in particular against the US dollar.
Technical analysis of the USD/CAD chart today shows that:
→ for most of 2024, the price moves within the channel shown in blue;
→ yesterday’s news lowered the price from its upper limit to the median;
→ the psychological level of 1.36 retained its role as resistance, although the bulls repeatedly tried to overcome it.
If the bears maintain the initiative, the price of USD/CAD may fall below:
→ breaking through the median line of the channel;
→ breaking through the local trend line (shown by the orange line);
→ attempting to break through the psychological level of 1.35.
In this scenario, the most obvious target for bears may be the lower boundary of the channel, with news about inflation and interest rates remaining the main drivers in the USD/CAD market. Today, by the way, at 16:15 GMT+3, the decision on interest rates from the ECB will become known — be prepared for surges in volatility.
Trade over 50 forex markets 24 hours a day with FXOpen. Take advantage of low commissions, deep liquidity, and spreads from 0.0 pips. Open your FXOpen account now or learn more about trading forex with FXOpen.
CFDs are complex instruments and come with a high risk of losing your money.
This article represents the opinion of the Companies operating under the FXOpen brand only. It is not to be construed as an offer, solicitation, or recommendation with respect to products and services provided by the Companies operating under the FXOpen brand, nor is it to be considered financial advice.
👍3
#tsla #stockmarket #usdcad #goldprice #XAUUSD #teslastock
Weekly Market Wrap With Gary Thomson: CHF, CAD, GOLD, TSLA
Get the latest scoop on the week's hottest headlines, all in one convenient video. Join Gary Thomson, the COO of FXOpen UK, as he breaks down the most significant news reports and shares his expert insights.
🔸Swiss Franc Weakens after Inflation News
🔸 USD/CAD Analysis: Canadian Dollar Strengthens after Bank of Canada Decision
🔸 The Price of Gold XAU/USD Sets a Historical Record Exceeding $2160 per Ounce
🔸 TSLA Stock Price Falls Over 9% in Just 2 Days
Stay in the know and empower yourself with our short, yet power-packed video. Watch it now and stay updated with FXOpen. Don't miss out on this invaluable opportunity to sharpen your trading skills and make informed decisions.
https://cutt.ly/9w1OwtxG
To take advantage of price fluctuations in the foreign exchange markets, consider enlisting the services of a reliable broker like FXOpen.
⚠️
This forecast represents FXOpen Companies opinion only, it should not be construed as an offer, invitation or recommendation in respect to FXOpen Companies products and services or as financial advice
Weekly Market Wrap With Gary Thomson: CHF, CAD, GOLD, TSLA
Get the latest scoop on the week's hottest headlines, all in one convenient video. Join Gary Thomson, the COO of FXOpen UK, as he breaks down the most significant news reports and shares his expert insights.
🔸Swiss Franc Weakens after Inflation News
🔸 USD/CAD Analysis: Canadian Dollar Strengthens after Bank of Canada Decision
🔸 The Price of Gold XAU/USD Sets a Historical Record Exceeding $2160 per Ounce
🔸 TSLA Stock Price Falls Over 9% in Just 2 Days
Stay in the know and empower yourself with our short, yet power-packed video. Watch it now and stay updated with FXOpen. Don't miss out on this invaluable opportunity to sharpen your trading skills and make informed decisions.
https://cutt.ly/9w1OwtxG
To take advantage of price fluctuations in the foreign exchange markets, consider enlisting the services of a reliable broker like FXOpen.
⚠️
This forecast represents FXOpen Companies opinion only, it should not be construed as an offer, invitation or recommendation in respect to FXOpen Companies products and services or as financial advice
YouTube
Weekly Market Wrap With Gary Thomson: CHF, CAD, GOLD, TSLA
Get the latest scoop on the week's hottest headlines, all in one convenient video. Join Gary Thomson, the COO of FXOpen UK, as he breaks down the most significant news reports and shares his expert insights.
00:32 - Swiss Franc Weakens after Inflation News…
00:32 - Swiss Franc Weakens after Inflation News…
👍4
#EURUSD #marketanalysis #MarketNews
EUR/USD Hits 8-week High
The euro is trading above USD 1.09, hitting its strongest point since mid-January on Friday, helped by news from both the US and Europe.
Friday's news showed that the US labor market is weakening:
→ The change in employment in the non-farm sector showed an increase in jobs = 275k for the month, although last month it was = +353k.
→ The unemployment rate rose to 3.9%, although it was 3.7% for 3 months.
News of a weakening labour market could put pressure on the Fed to ease monetary policy.
Meanwhile in Europe, the ECB kept borrowing costs at a record high, citing significant progress in containing inflation, and revised its inflation expectations downward, forecasting price growth of 2.3% in 2024, and 1.9% in 2025. And during a press conference last Thursday, ECB President Lagarde told reporters that policymakers had not discussed rate cuts at that meeting.
Thus, there is reason to believe that the Fed will start lowering rates earlier (it started raising them earlier than the ECB). And this assumption is shared by many market participants, judging by the bullish dynamics in the EUR/USD market.
Today's chart shows:
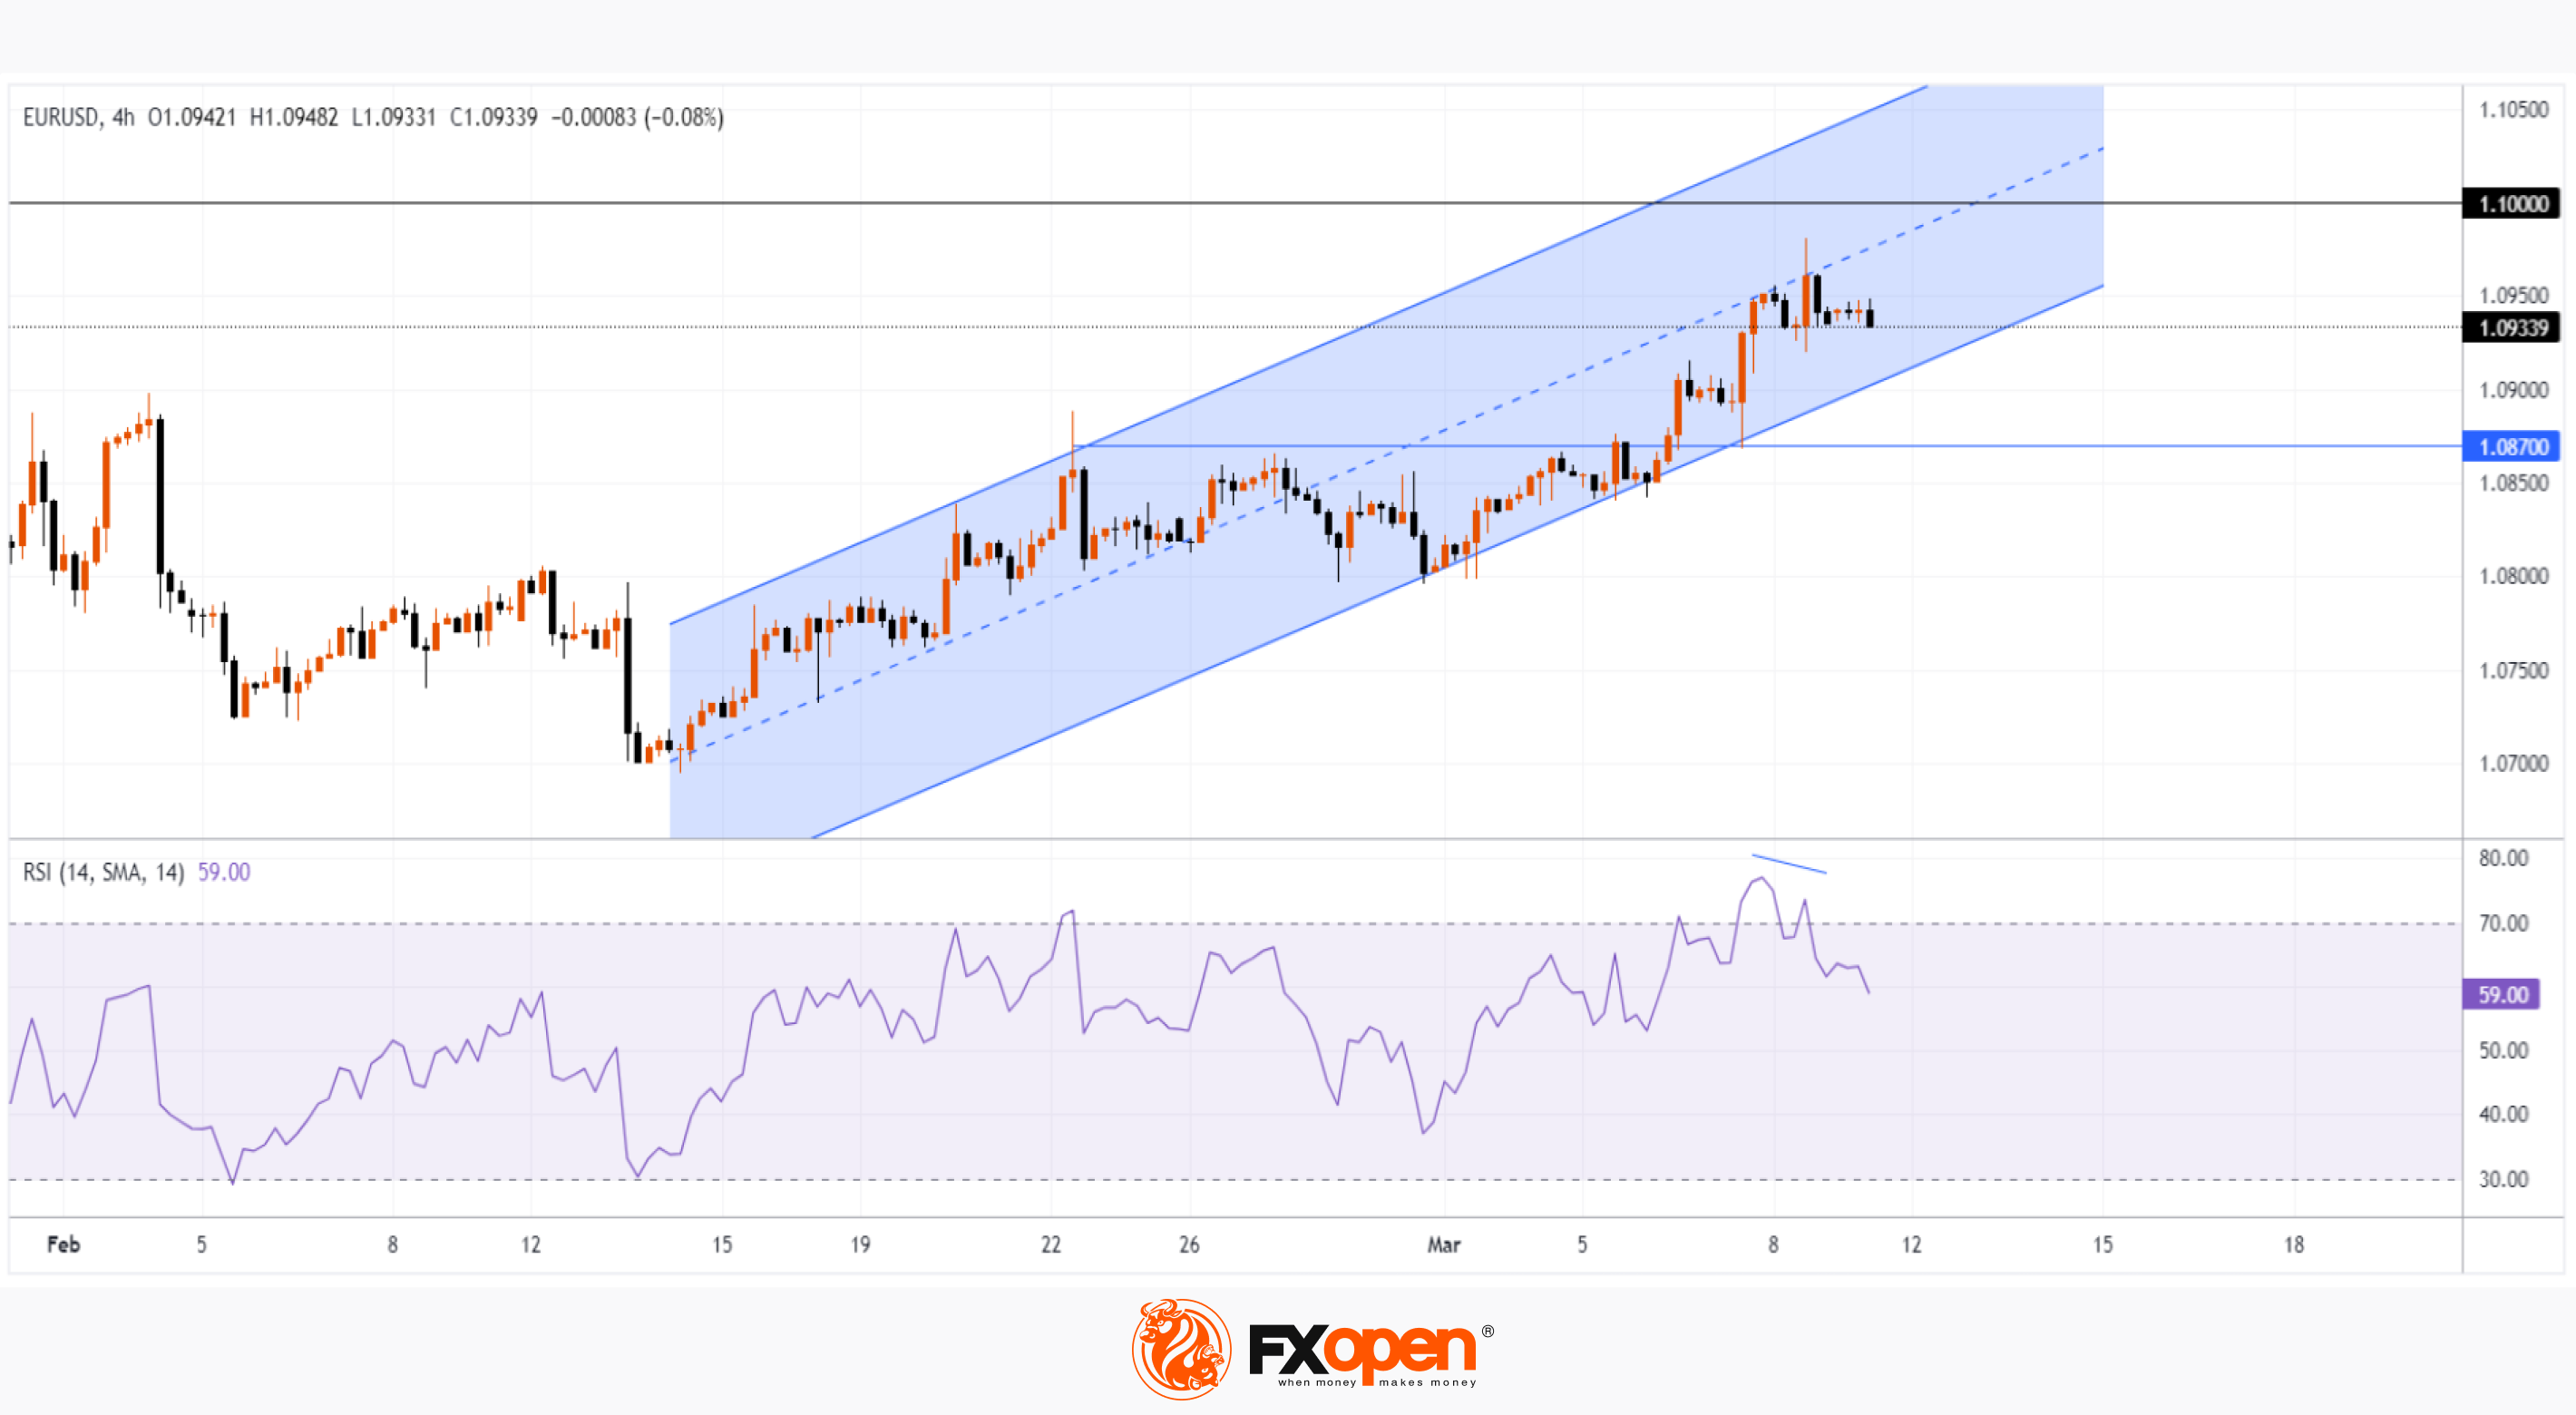
→ the price of EUR/USD has been moving within an ascending channel (shown in blue) since mid-February. Moreover, it seems that the median line acts as resistance — Friday’s peak indicates this;
→ the price rose to the important psychological level of 1.1000 – it served as resistance in January;
→ the RSI indicator is in the overbought zone, forming a bearish divergence.
If there is some correction this week after an increase of more than 0.9% last week, then the price of EUR/USD may fall to its lower limit. Failure of the bulls to resume the uptrend from this line could mark the prospect of a decline in price towards the important support of 1.0870.
Trade over 50 forex markets 24 hours a day with FXOpen. Take advantage of low commissions, deep liquidity, and spreads from 0.0 pips. Open your FXOpen account now or learn more about trading forex with FXOpen.
CFDs are complex instruments and come with a high risk of losing your money.
This article represents the opinion of the Companies operating under the FXOpen brand only. It is not to be construed as an offer, solicitation, or recommendation with respect to products and services provided by the Companies operating under the FXOpen brand, nor is it to be considered financial advice.
EUR/USD Hits 8-week High
The euro is trading above USD 1.09, hitting its strongest point since mid-January on Friday, helped by news from both the US and Europe.
Friday's news showed that the US labor market is weakening:
→ The change in employment in the non-farm sector showed an increase in jobs = 275k for the month, although last month it was = +353k.
→ The unemployment rate rose to 3.9%, although it was 3.7% for 3 months.
News of a weakening labour market could put pressure on the Fed to ease monetary policy.
Meanwhile in Europe, the ECB kept borrowing costs at a record high, citing significant progress in containing inflation, and revised its inflation expectations downward, forecasting price growth of 2.3% in 2024, and 1.9% in 2025. And during a press conference last Thursday, ECB President Lagarde told reporters that policymakers had not discussed rate cuts at that meeting.
Thus, there is reason to believe that the Fed will start lowering rates earlier (it started raising them earlier than the ECB). And this assumption is shared by many market participants, judging by the bullish dynamics in the EUR/USD market.
Today's chart shows:
→ the price of EUR/USD has been moving within an ascending channel (shown in blue) since mid-February. Moreover, it seems that the median line acts as resistance — Friday’s peak indicates this;
→ the price rose to the important psychological level of 1.1000 – it served as resistance in January;
→ the RSI indicator is in the overbought zone, forming a bearish divergence.
If there is some correction this week after an increase of more than 0.9% last week, then the price of EUR/USD may fall to its lower limit. Failure of the bulls to resume the uptrend from this line could mark the prospect of a decline in price towards the important support of 1.0870.
Trade over 50 forex markets 24 hours a day with FXOpen. Take advantage of low commissions, deep liquidity, and spreads from 0.0 pips. Open your FXOpen account now or learn more about trading forex with FXOpen.
CFDs are complex instruments and come with a high risk of losing your money.
This article represents the opinion of the Companies operating under the FXOpen brand only. It is not to be construed as an offer, solicitation, or recommendation with respect to products and services provided by the Companies operating under the FXOpen brand, nor is it to be considered financial advice.
👍3
#marketanalysis #tradingforex #stockmarket
A Weak Dollar Is the Driver of Price Records for NASDAQ-100, BTC/USD, XAU/USD
Financial market participants expect an easing of the Fed's monetary policy. The prospect of lower rates puts pressure on the value of the dollar, which in turn pushes up dollar-denominated assets. This contributed to the setting of record highs:
→ The price of BTC/USD exceeded 70k dollars per bitcoin
→ The price of XAU/USD exceeded USD 2,200 per ounce of gold
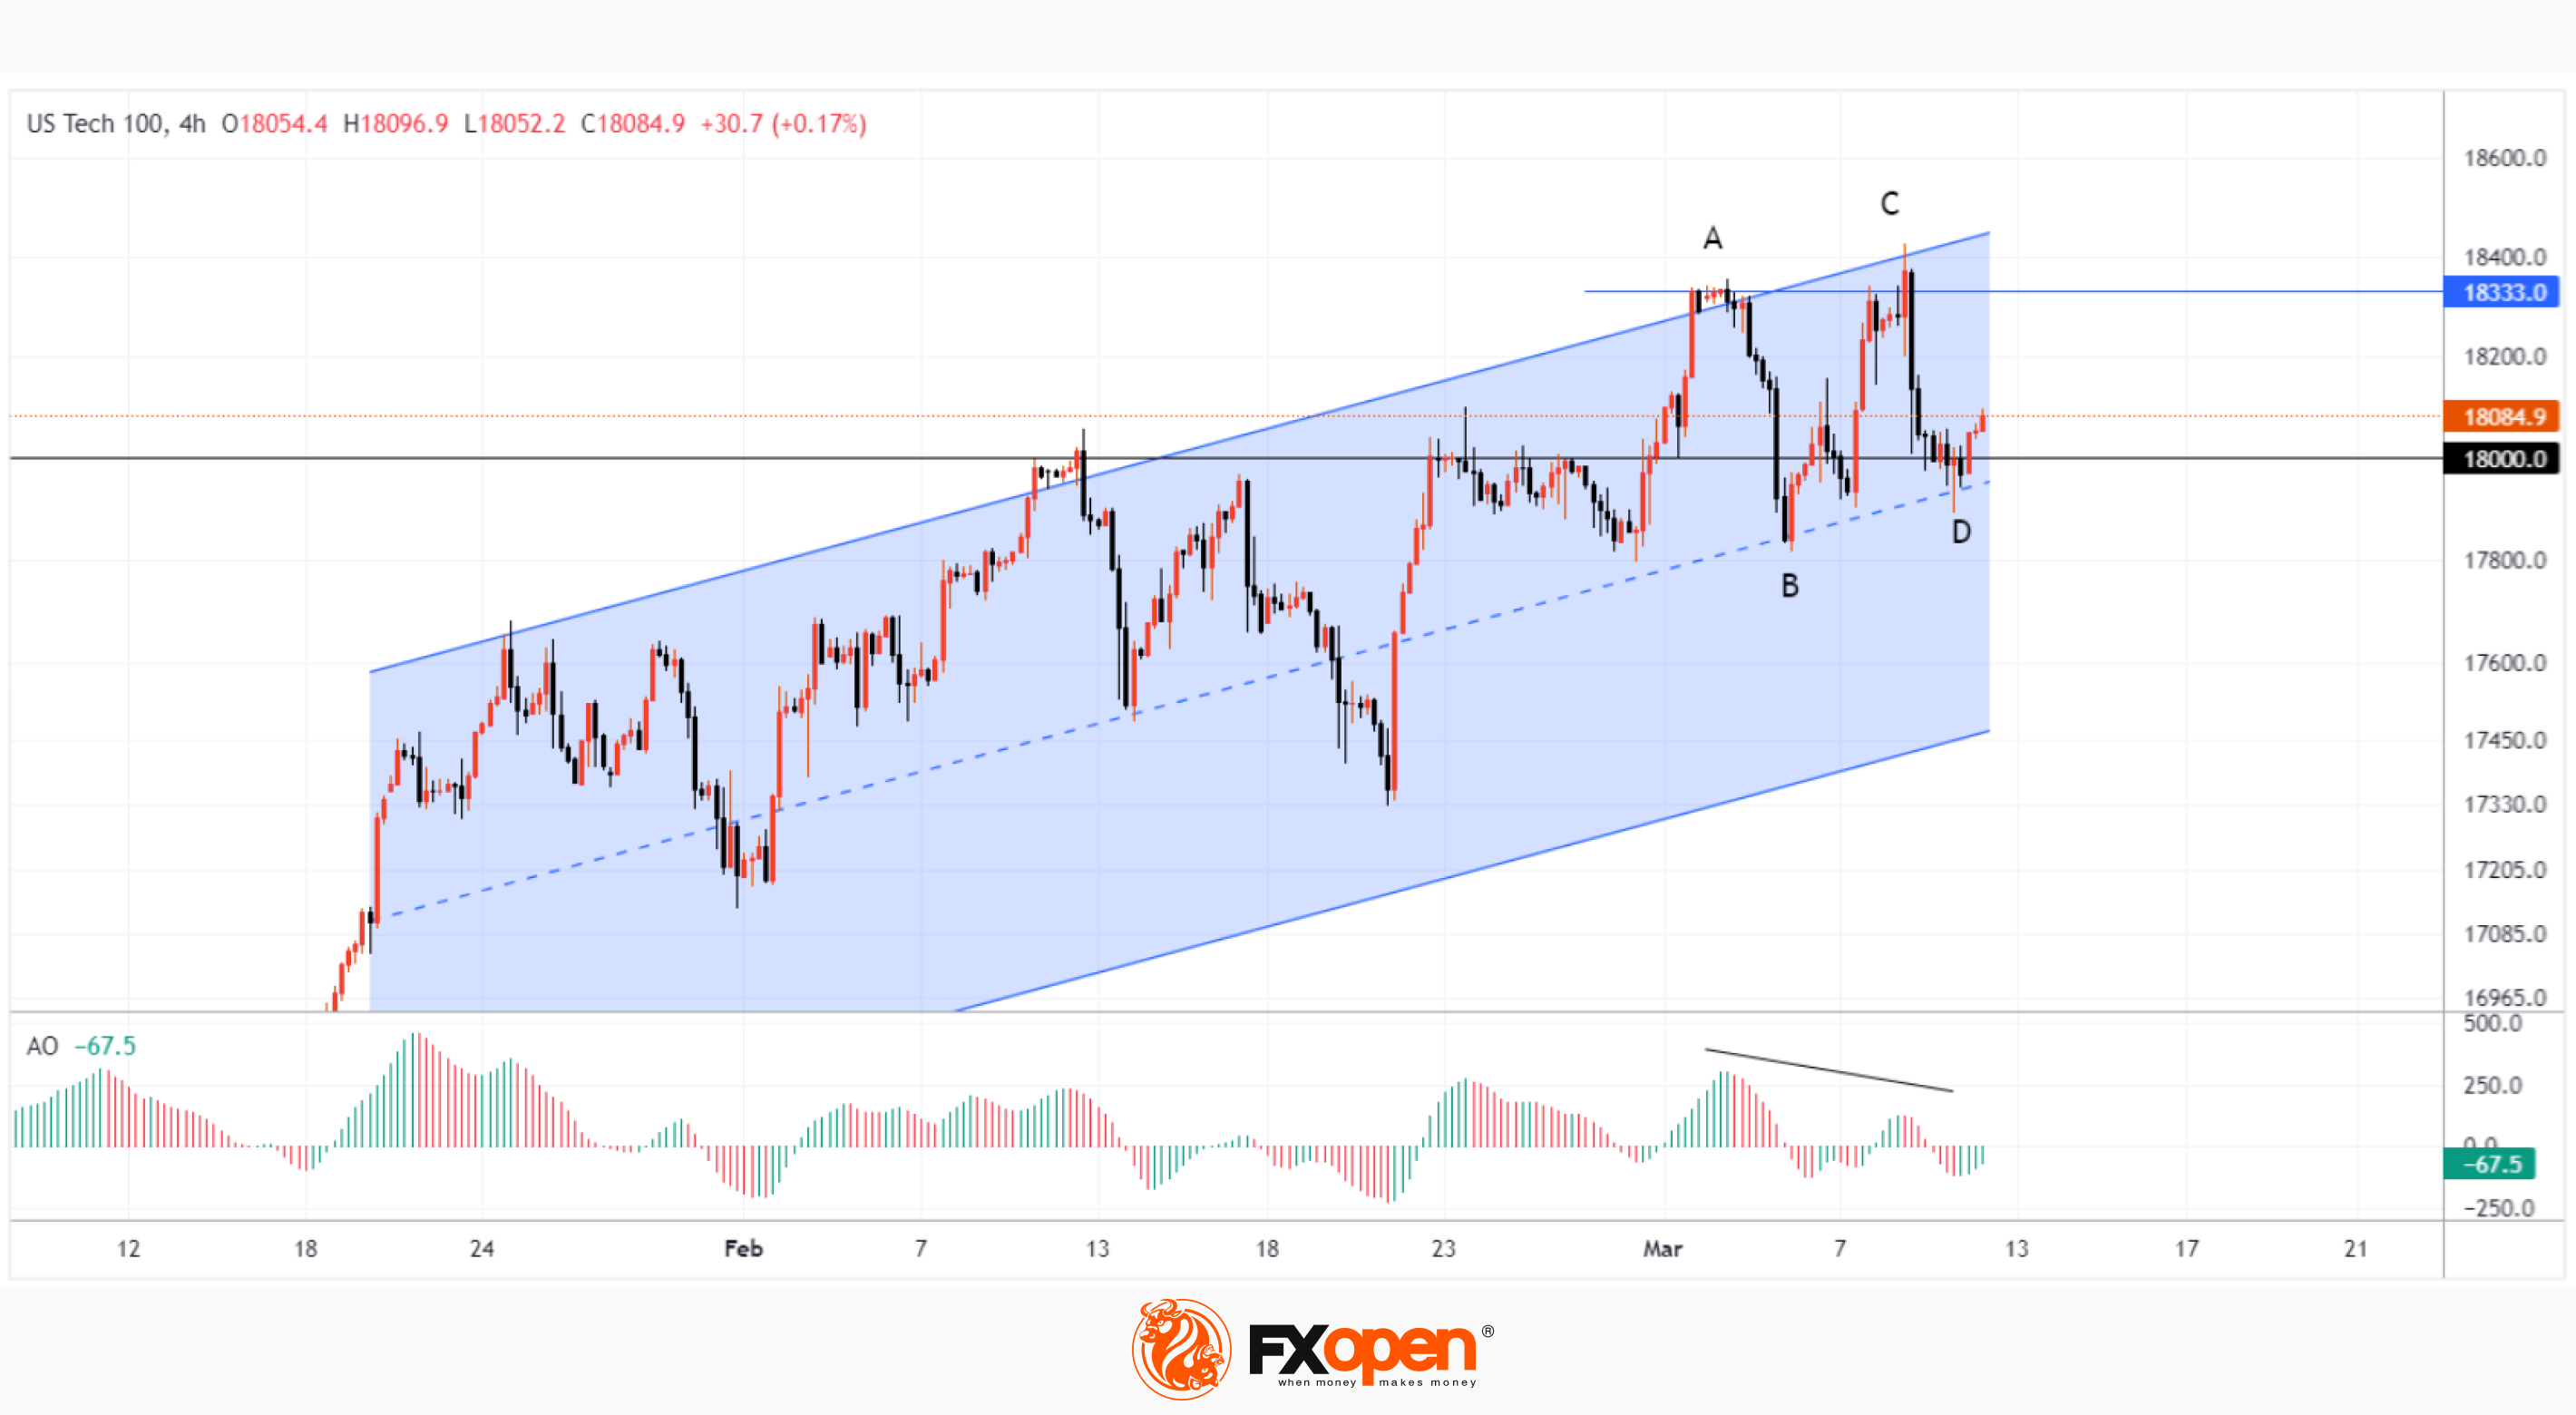
→ The NASDAQ-100 index reached 18,400 points.
But are markets too optimistic? Let's see what the technical analysis of the NASDAQ-100 chart shows today:
→ The price is in an uptrend (shown in blue), which has been in effect since the beginning of the year. The price is in the upper half, which may indicate the strength of demand.
→ Top C only slightly exceeded the level of the previous top A. It is not surprising that a bearish divergence has formed on the oscillators — Awesome Osc among them. Buyers who entered long positions at the breakout of top A found themselves in a trap. Sellers who held stops above A lost their positions.
Pay attention to the nature of the NASDAQ-100 price movement from tops to local lows A→B and C→D. Each time, the bears were able to quickly lower the price as soon as it exceeded the 18.333 level. This indicates that sellers are active — perhaps they are taking profits after the rally since the beginning of the year.
One way or another, the level of 18.333 looks like an important resistance. So far, the price of NASDAQ-100 is at support from the median line of the channel, but it is possible, given the signs of exhaustion of demand and the activity of sellers, that the price may fall to its lower border, forming a correction. This may happen under the influence of news — today, be prepared, at 15:30 GMT+3 data on inflation in the United States will be published.
Trade global index CFDs with zero commission and tight spreads. Open your FXOpen account now or learn more about trading index CFDs with FXOpen.
CFDs are complex instruments and come with a high risk of losing your money.
This article represents the opinion of the Companies operating under the FXOpen brand only. It is not to be construed as an offer, solicitation, or recommendation with respect to products and services provided by the Companies operating under the FXOpen brand, nor is it to be considered financial advice.
A Weak Dollar Is the Driver of Price Records for NASDAQ-100, BTC/USD, XAU/USD
Financial market participants expect an easing of the Fed's monetary policy. The prospect of lower rates puts pressure on the value of the dollar, which in turn pushes up dollar-denominated assets. This contributed to the setting of record highs:
→ The price of BTC/USD exceeded 70k dollars per bitcoin
→ The price of XAU/USD exceeded USD 2,200 per ounce of gold
→ The NASDAQ-100 index reached 18,400 points.
But are markets too optimistic? Let's see what the technical analysis of the NASDAQ-100 chart shows today:
→ The price is in an uptrend (shown in blue), which has been in effect since the beginning of the year. The price is in the upper half, which may indicate the strength of demand.
→ Top C only slightly exceeded the level of the previous top A. It is not surprising that a bearish divergence has formed on the oscillators — Awesome Osc among them. Buyers who entered long positions at the breakout of top A found themselves in a trap. Sellers who held stops above A lost their positions.
Pay attention to the nature of the NASDAQ-100 price movement from tops to local lows A→B and C→D. Each time, the bears were able to quickly lower the price as soon as it exceeded the 18.333 level. This indicates that sellers are active — perhaps they are taking profits after the rally since the beginning of the year.
One way or another, the level of 18.333 looks like an important resistance. So far, the price of NASDAQ-100 is at support from the median line of the channel, but it is possible, given the signs of exhaustion of demand and the activity of sellers, that the price may fall to its lower border, forming a correction. This may happen under the influence of news — today, be prepared, at 15:30 GMT+3 data on inflation in the United States will be published.
Trade global index CFDs with zero commission and tight spreads. Open your FXOpen account now or learn more about trading index CFDs with FXOpen.
CFDs are complex instruments and come with a high risk of losing your money.
This article represents the opinion of the Companies operating under the FXOpen brand only. It is not to be construed as an offer, solicitation, or recommendation with respect to products and services provided by the Companies operating under the FXOpen brand, nor is it to be considered financial advice.
👍3
#ETH #crypto #cryptonews #marketanalysis
Today Is an Ethereum Update. ETH/USD > $4,000
An update is scheduled for the Ethereum network today, approximately at 16:55 GMT+3.
The update is called Dencun and is the biggest code change since April 2023, when the Shapella update was implemented.
Dencun aims to reduce fees on the growing array of ancillary networks running on top of Ethereum, called layer 2 (L2) “aggregates.” The changes involve “proto-dunksharding” technology, which is intended to improve the blockchain’s ability to process data from L2 networks.
It is believed that the implementation of the update will give impetus to the development of projects built on auxiliary networks. On the other hand, there is a risk of failures. Although it is worth noting that Dencun was deployed three times on test networks, and each time there were no problems.
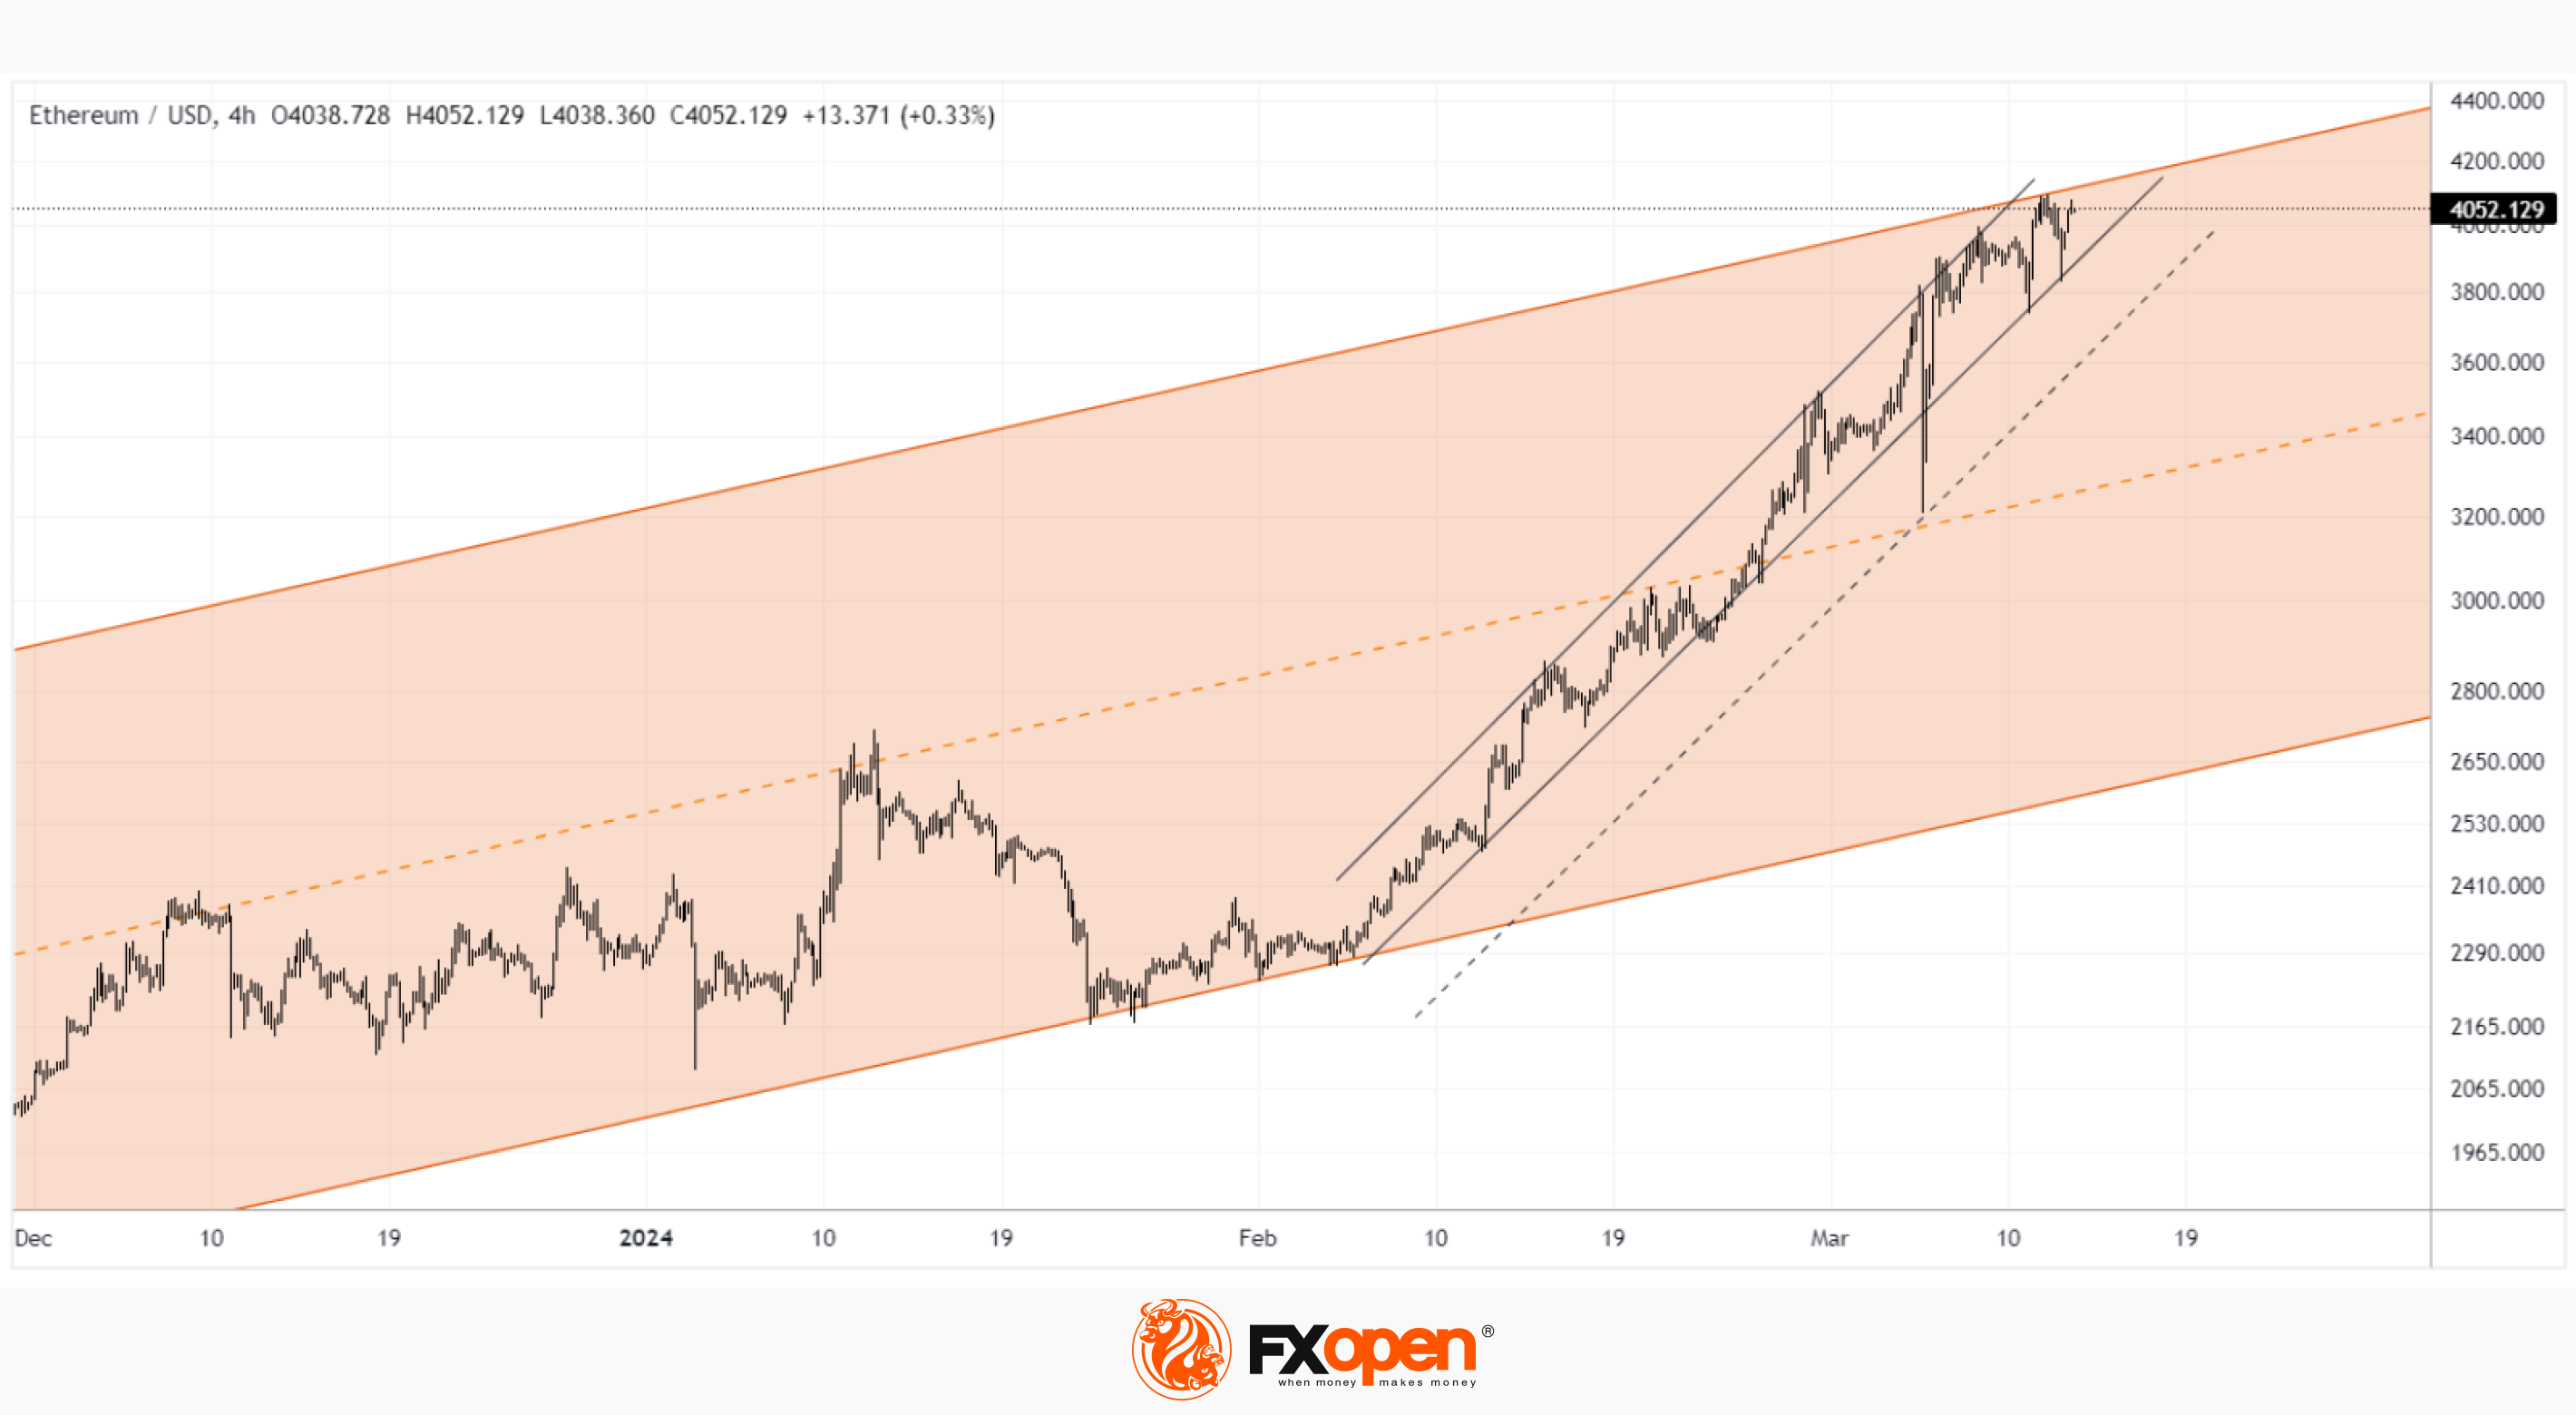
The ETH/USD chart shows that the price of Ethereum today, on the day of the update, is showing bullish behavior:
→ the price moves within the long-term ascending channel (shown in orange). Having pushed off from its lower limit in early February, the price of ETH has already reached its upper limit, which is +76% in about a month!
→ during the growth, the price formed an ascending channel (shown by black lines);
→ the price is trying to consolidate above the psychological level of USD 4,000 for Ethereum.
→ long lower shadows on the candles on March 11-12 give reason to believe that there is strong demand in the market amid news related to an important update for the development of Ethereum.
Reaching the upper boundary of the channel is an argument in favor of a consolidation scenario after a significant rally. But it is possible that using the hype, the bulls will try to storm the upper border of the channel. If successful, the area around USD 4,000 could act as an important support for ETH/USD in the future.
FXOpen offers the world's most popular cryptocurrency CFDs*, including Bitcoin and Ethereum. Floating spreads, 1:2 leverage — at your service. Open your trading account now or learn more about crypto CFD trading with FXOpen.
*At FXOpen UK and FXOpen AU, Cryptocurrency CFDs are only available for trading by those clients categorised as Professional clients under FCA Rules and Professional clients under ASIC Rules respectively. They are not available for trading by Retail clients.
CFDs are complex instruments and come with a high risk of losing your money.
This article represents the opinion of the Companies operating under the FXOpen brand only. It is not to be construed as an offer, solicitation, or recommendation with respect to products and services provided by the Companies operating under the FXOpen brand, nor is it to be considered financial advice.
Today Is an Ethereum Update. ETH/USD > $4,000
An update is scheduled for the Ethereum network today, approximately at 16:55 GMT+3.
The update is called Dencun and is the biggest code change since April 2023, when the Shapella update was implemented.
Dencun aims to reduce fees on the growing array of ancillary networks running on top of Ethereum, called layer 2 (L2) “aggregates.” The changes involve “proto-dunksharding” technology, which is intended to improve the blockchain’s ability to process data from L2 networks.
It is believed that the implementation of the update will give impetus to the development of projects built on auxiliary networks. On the other hand, there is a risk of failures. Although it is worth noting that Dencun was deployed three times on test networks, and each time there were no problems.
The ETH/USD chart shows that the price of Ethereum today, on the day of the update, is showing bullish behavior:
→ the price moves within the long-term ascending channel (shown in orange). Having pushed off from its lower limit in early February, the price of ETH has already reached its upper limit, which is +76% in about a month!
→ during the growth, the price formed an ascending channel (shown by black lines);
→ the price is trying to consolidate above the psychological level of USD 4,000 for Ethereum.
→ long lower shadows on the candles on March 11-12 give reason to believe that there is strong demand in the market amid news related to an important update for the development of Ethereum.
Reaching the upper boundary of the channel is an argument in favor of a consolidation scenario after a significant rally. But it is possible that using the hype, the bulls will try to storm the upper border of the channel. If successful, the area around USD 4,000 could act as an important support for ETH/USD in the future.
FXOpen offers the world's most popular cryptocurrency CFDs*, including Bitcoin and Ethereum. Floating spreads, 1:2 leverage — at your service. Open your trading account now or learn more about crypto CFD trading with FXOpen.
*At FXOpen UK and FXOpen AU, Cryptocurrency CFDs are only available for trading by those clients categorised as Professional clients under FCA Rules and Professional clients under ASIC Rules respectively. They are not available for trading by Retail clients.
CFDs are complex instruments and come with a high risk of losing your money.
This article represents the opinion of the Companies operating under the FXOpen brand only. It is not to be construed as an offer, solicitation, or recommendation with respect to products and services provided by the Companies operating under the FXOpen brand, nor is it to be considered financial advice.
👍5
#GBPUSD #marketanalysis #MarketNews
GBP/USD: Bulls Show Resilience amid Inflation and GDP News
Yesterday important data on inflation in the United States was published. It caused a significant spike in volatility in financial markets, even though the values were in line with expectations. CPI in monthly terms: actual = 0.4%, forecast = 0.4%, a month ago = 0.3%, a year ago = 0.4%.
And today news came out about UK GDP in monthly terms, which also corresponded to expectations: fact = +0.2%, forecast = +0.2%, a month ago = -0.1%.
It is noteworthy that in both cases the first reaction was a fall in the price of GBP/USD, but then a recovery followed — this is a manifestation of the stability of demand.
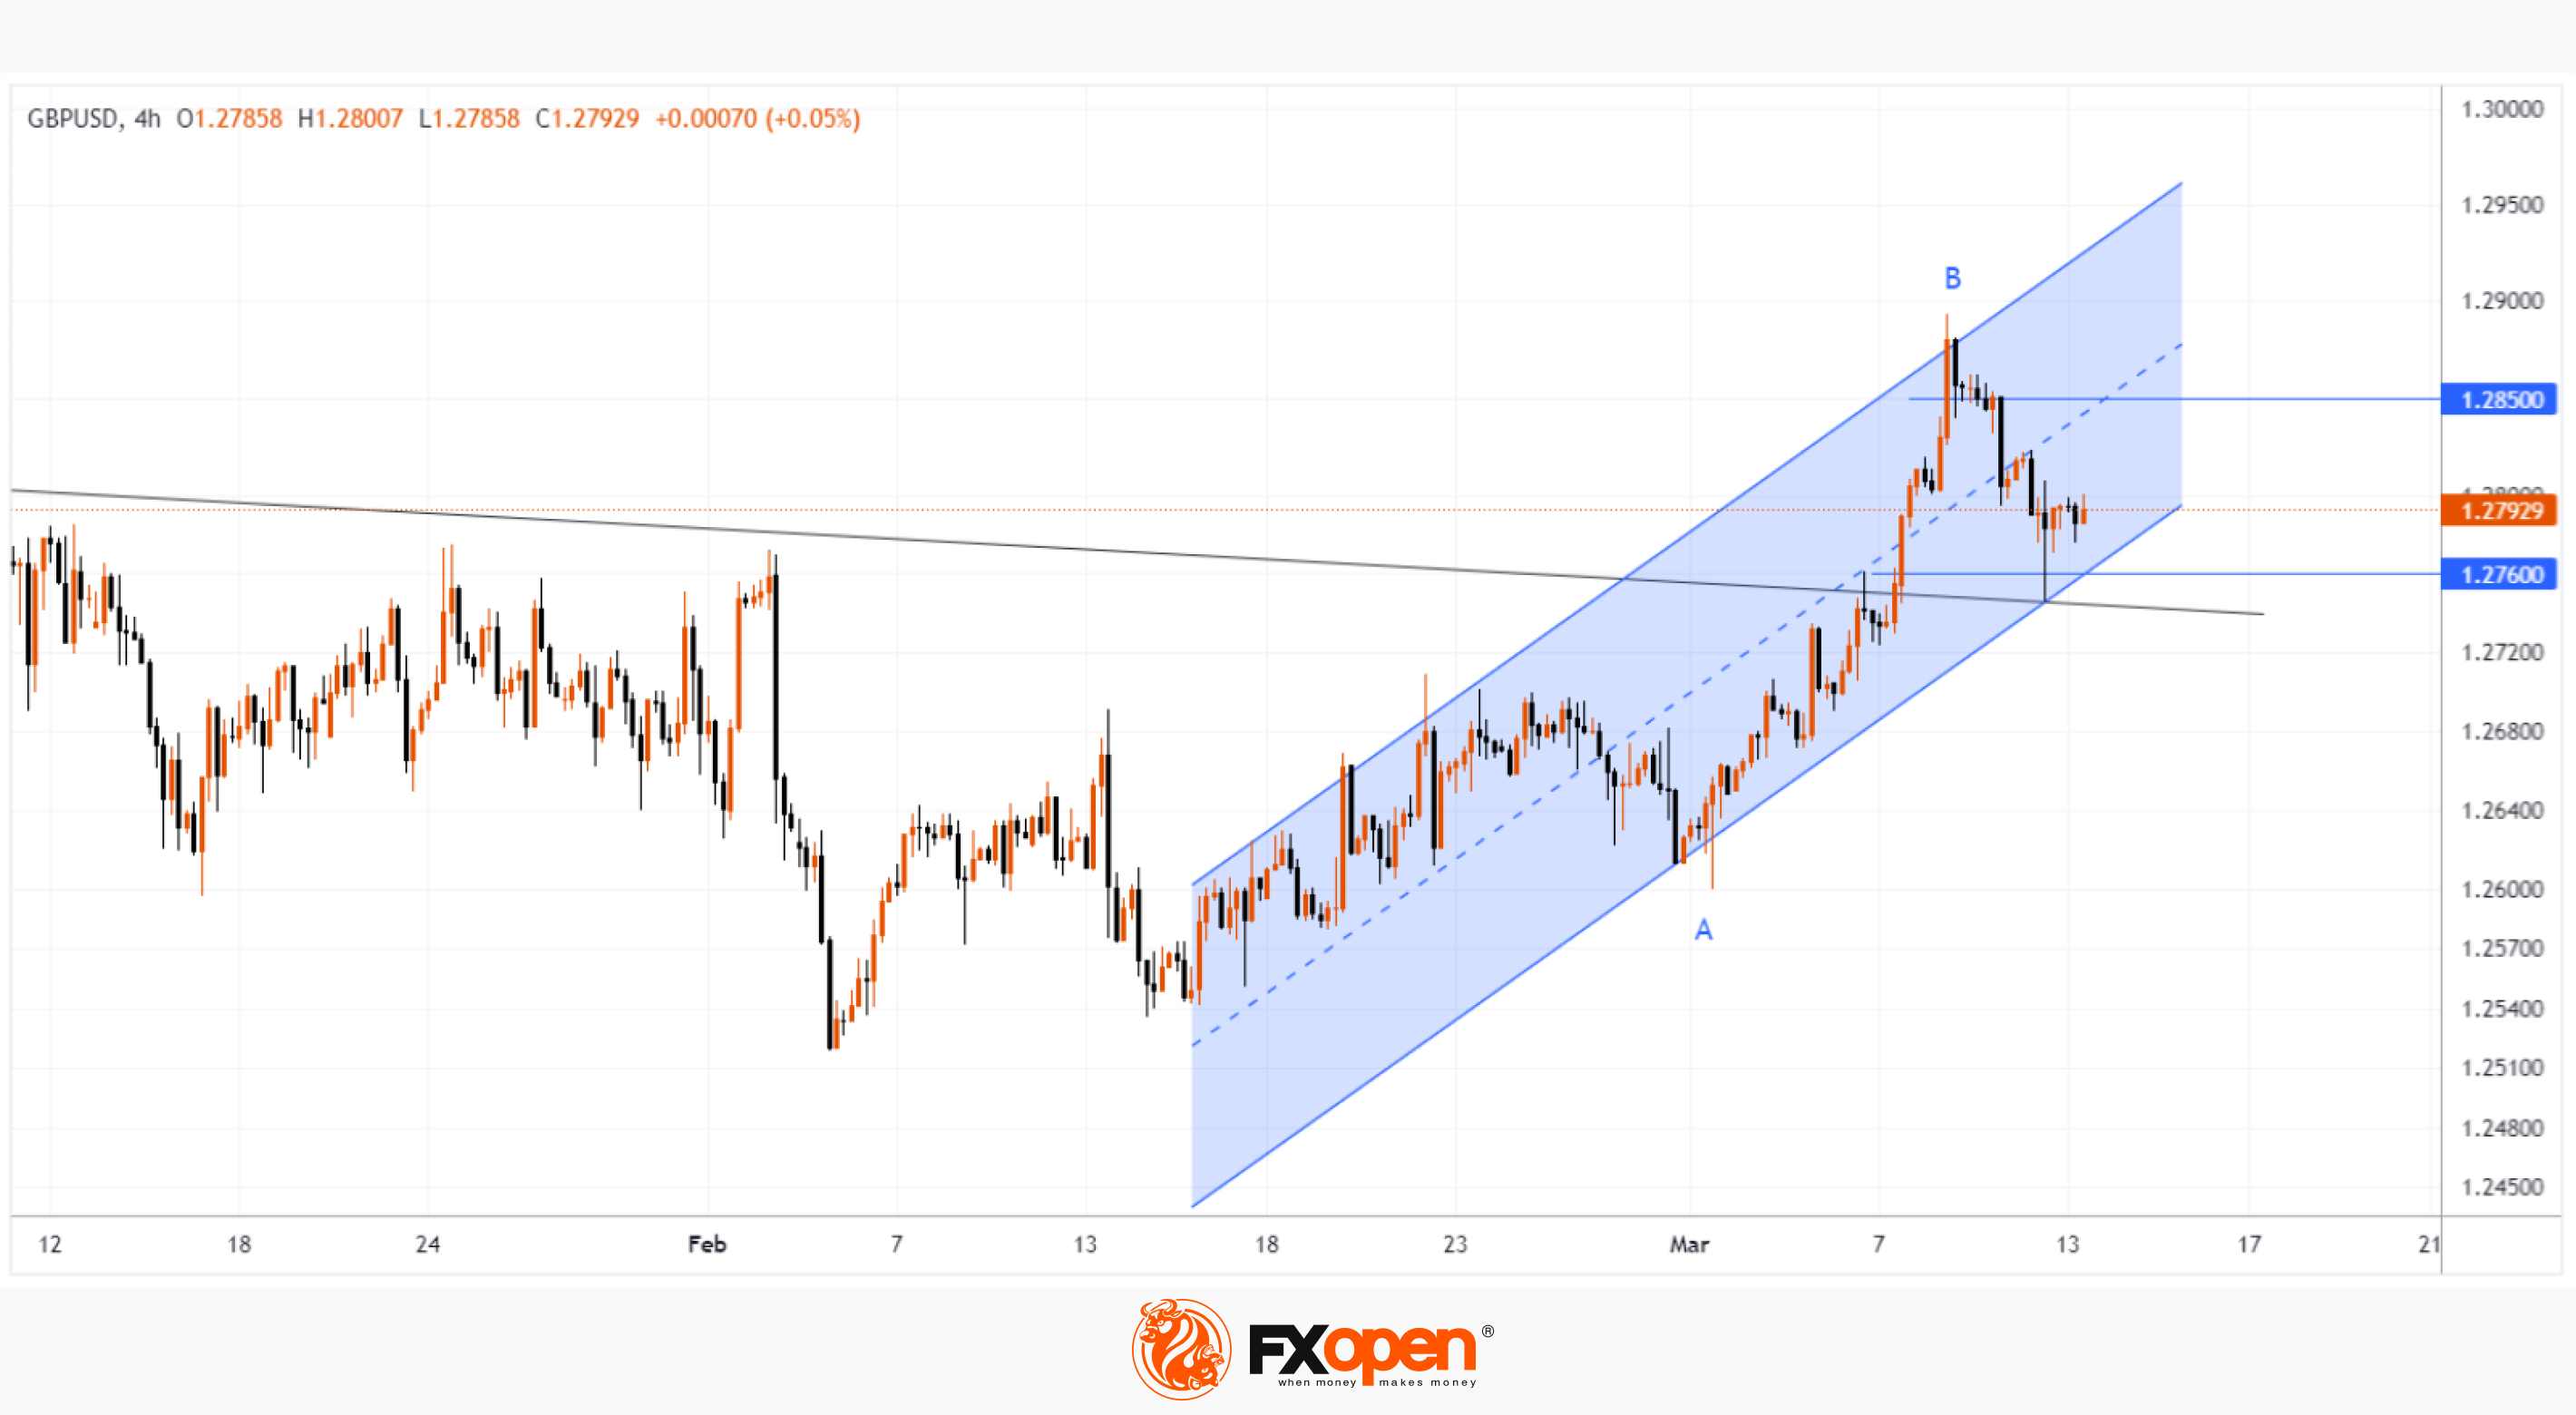
From the point of view of technical analysis of the GBP/USD chart, the market has support in the area of 1.276 from:
→ the bottom line of the ascending channel (shown in blue);
→ Fibo level 50% rollback from impulse A→B;
→ the black long-term trend line originating at the end of 2023, which previously served as resistance, but changed its role after the breakdown on March 7.
Will the bulls be able to resume the upward trend within the blue channel?
Even if attempts to implement this scenario occur, the GBP/USD chart shows that:
→ In this case, they may encounter bearish aggression, visible in sharp price declines from top B.
→ It is possible that resistance will be the level of 1.285, which served as local support on March 10-11, and in the area of which (for now) the median line of the blue ascending channel passes.
Trade over 50 forex markets 24 hours a day with FXOpen. Take advantage of low commissions, deep liquidity, and spreads from 0.0 pips. Open your FXOpen account now or learn more about trading forex with FXOpen.
CFDs are complex instruments and come with a high risk of losing your money.
This article represents the opinion of the Companies operating under the FXOpen brand only. It is not to be construed as an offer, solicitation, or recommendation with respect to products and services provided by the Companies operating under the FXOpen brand, nor is it to be considered financial advice.
GBP/USD: Bulls Show Resilience amid Inflation and GDP News
Yesterday important data on inflation in the United States was published. It caused a significant spike in volatility in financial markets, even though the values were in line with expectations. CPI in monthly terms: actual = 0.4%, forecast = 0.4%, a month ago = 0.3%, a year ago = 0.4%.
And today news came out about UK GDP in monthly terms, which also corresponded to expectations: fact = +0.2%, forecast = +0.2%, a month ago = -0.1%.
It is noteworthy that in both cases the first reaction was a fall in the price of GBP/USD, but then a recovery followed — this is a manifestation of the stability of demand.
From the point of view of technical analysis of the GBP/USD chart, the market has support in the area of 1.276 from:
→ the bottom line of the ascending channel (shown in blue);
→ Fibo level 50% rollback from impulse A→B;
→ the black long-term trend line originating at the end of 2023, which previously served as resistance, but changed its role after the breakdown on March 7.
Will the bulls be able to resume the upward trend within the blue channel?
Even if attempts to implement this scenario occur, the GBP/USD chart shows that:
→ In this case, they may encounter bearish aggression, visible in sharp price declines from top B.
→ It is possible that resistance will be the level of 1.285, which served as local support on March 10-11, and in the area of which (for now) the median line of the blue ascending channel passes.
Trade over 50 forex markets 24 hours a day with FXOpen. Take advantage of low commissions, deep liquidity, and spreads from 0.0 pips. Open your FXOpen account now or learn more about trading forex with FXOpen.
CFDs are complex instruments and come with a high risk of losing your money.
This article represents the opinion of the Companies operating under the FXOpen brand only. It is not to be construed as an offer, solicitation, or recommendation with respect to products and services provided by the Companies operating under the FXOpen brand, nor is it to be considered financial advice.
👍3
#marketanalysis #MarketNews #USDJPY
USD/JPY: Analysts Adjust Forecasts for the Strengthening of the Yen
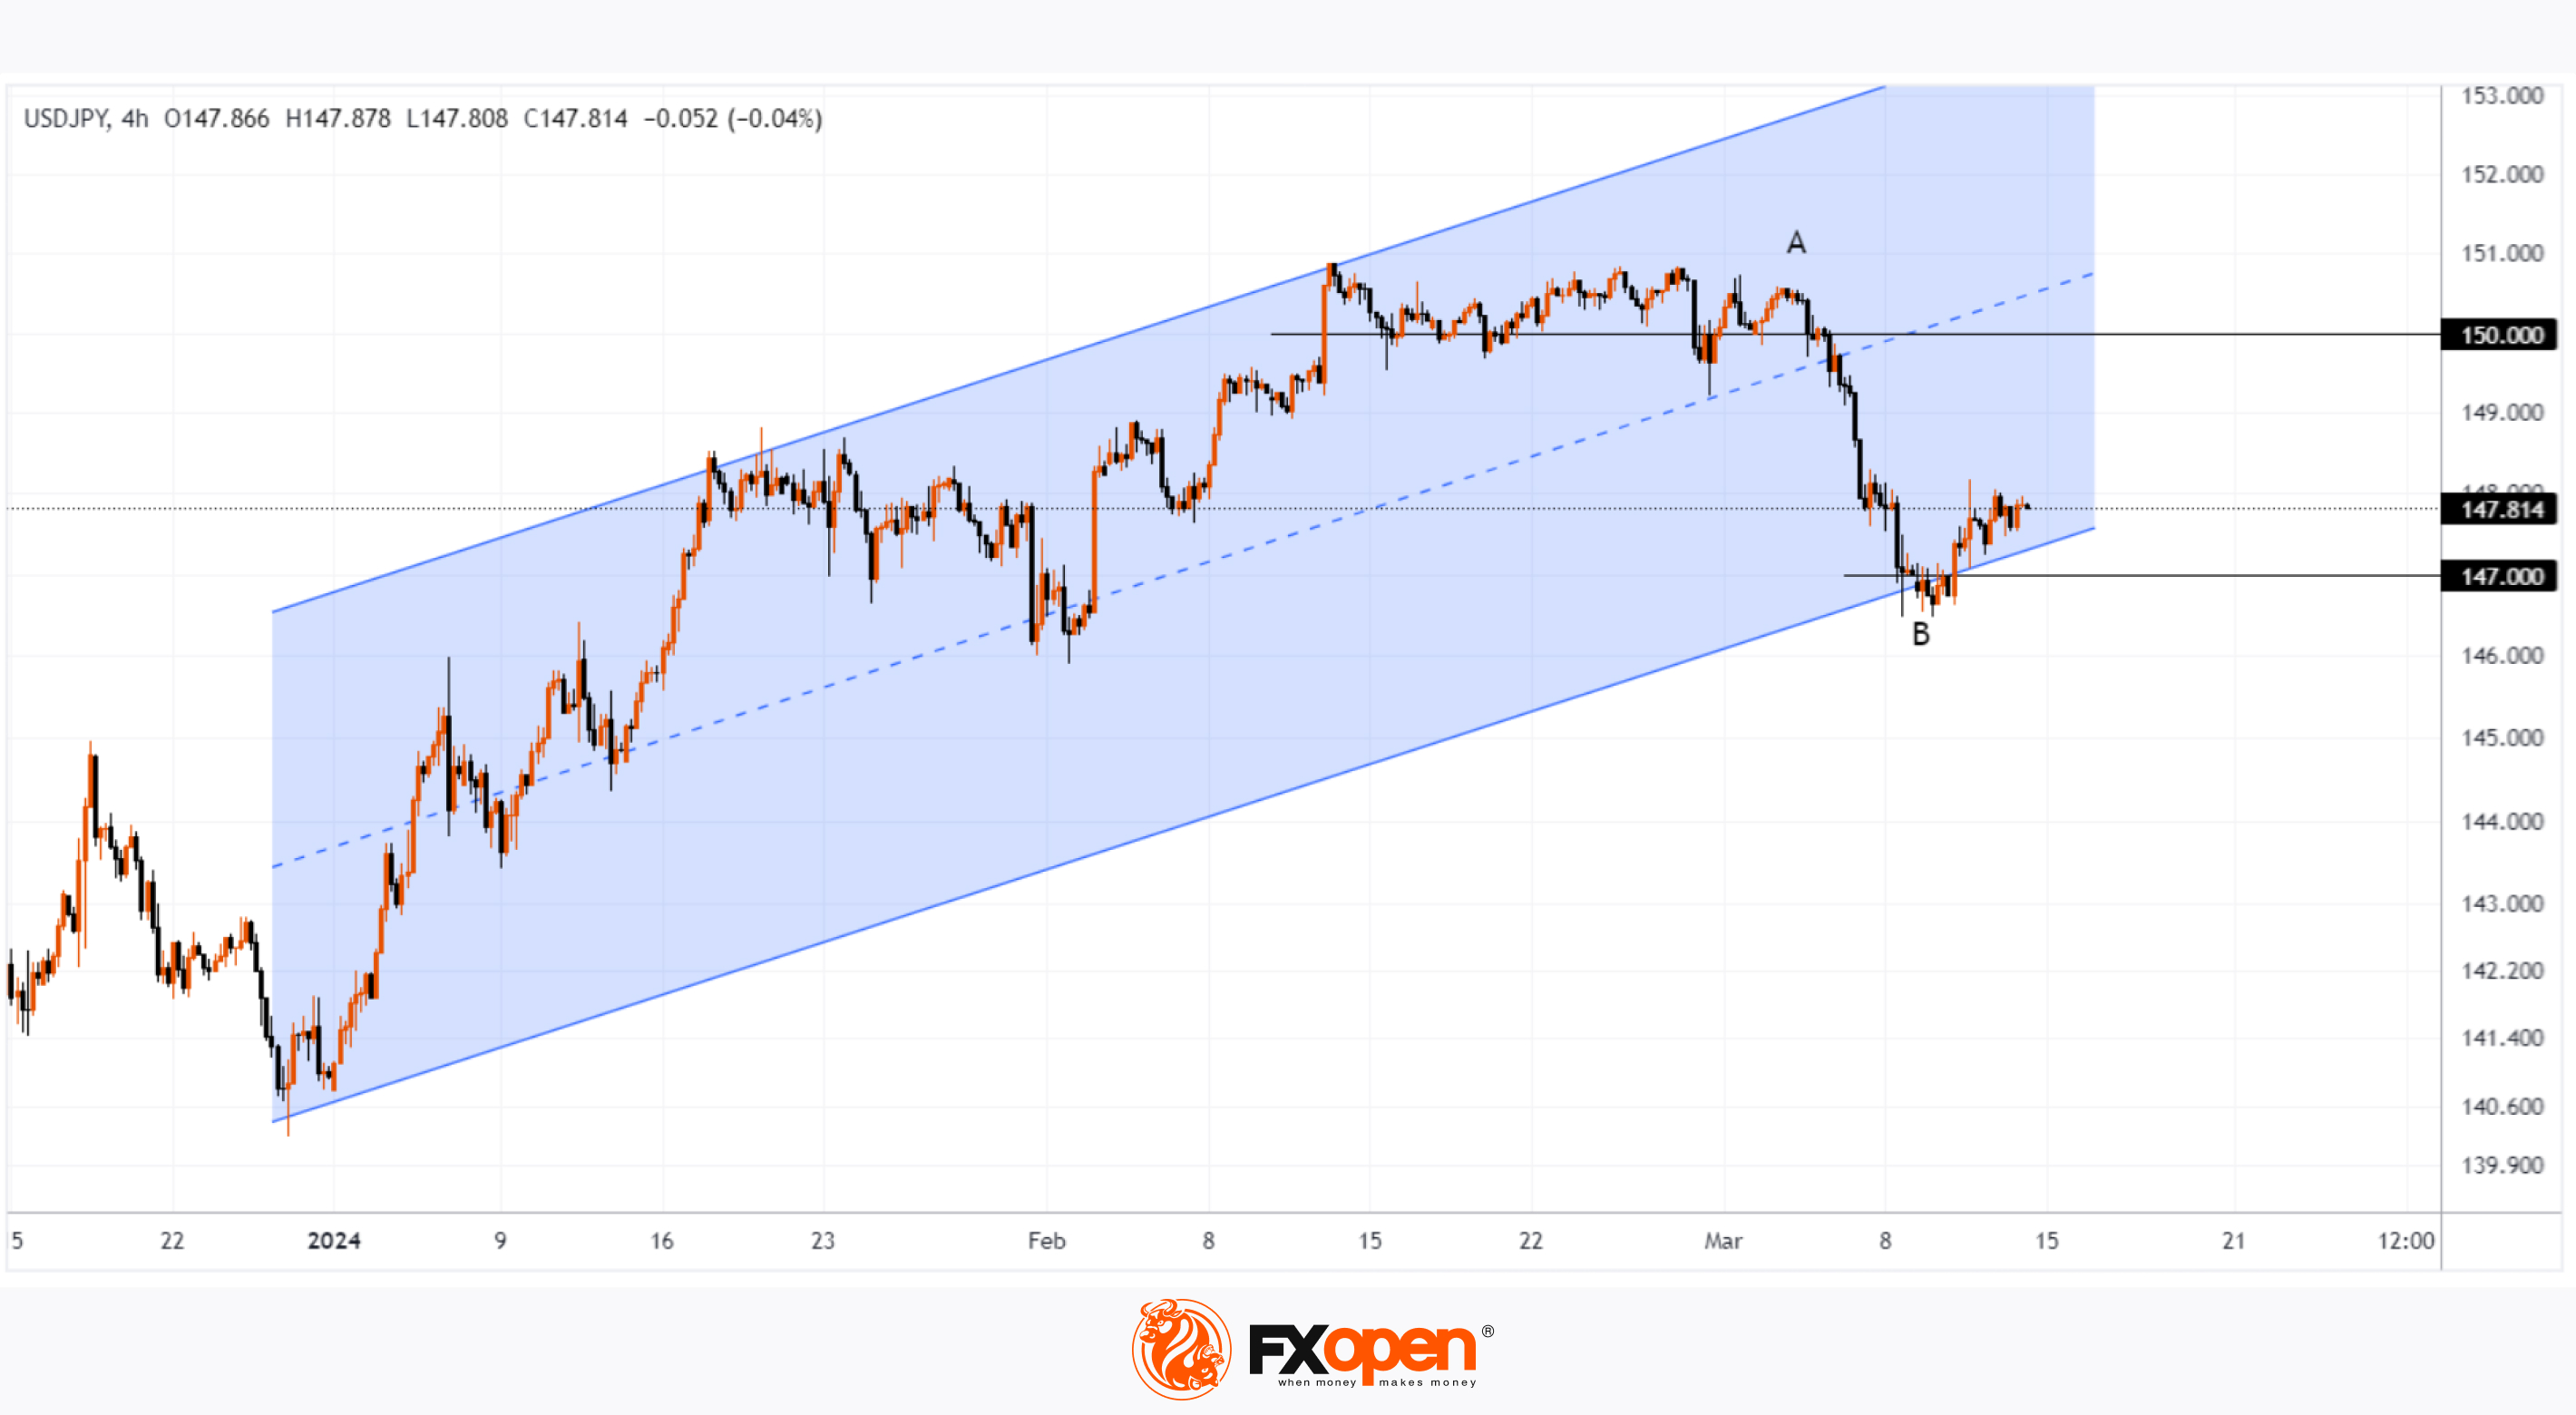
Since the beginning of 2024, the USD/JPY price has been in an uptrend (as shown by the blue channel), but when the rate exceeded the psychological level of 150 yen per US dollar, market sentiment changed. This was due to expectations that the Bank of Japan would take interest rates out of negative territory — and statements from officials gave clear indications of this possibility.
Expecting a tightening of monetary policy, the yen sharply strengthened against the dollar, and a bearish A→B impulse formed on the USD/JPY chart. However, having reached the level of 147 yen per US dollar (and dropped slightly below it), the market has stabilized. Moreover, we see some recovery: today, the USD/JPY price is trading around 147.8.
From a fundamental analysis point of view, analysts believe that the strength of the US economy should not be underestimated. And if the Bank of Japan raises rates, it will not be in an aggressive manner. Bloomberg writes that Nomura Securities Co., Mizuho Bank Ltd. and Citigroup Global Markets Japan Inc. have adjusted their forecasts for the yen in recent weeks. On average, they forecast the rate to be around 140 yen per US dollar at the end of this year. HSBC Holdings Plc, in turn, expects the yen to end the year at 136 against the US dollar.
From the point of view of technical analysis of USD/JPY, the current recovery may be due to the influence of support from the lower border of the ascending channel.
Thus, traders can assume that the recovery will end (for example, rising to approximately 148.6 — 50% of the A→B momentum), with the bears attempting to resume the downward trend with a new assault on the lower channel boundary. If it turns out to be successful, this will open the way for the price to reach the levels indicated in analysts' forecasts.
Information from the Bank of Japan will be key. Its interest rate decision is scheduled for Tuesday, March 19.
Trade over 50 forex markets 24 hours a day with FXOpen. Take advantage of low commissions, deep liquidity, and spreads from 0.0 pips. Open your FXOpen account now or learn more about trading forex with FXOpen.
CFDs are complex instruments and come with a high risk of losing your money.
This article represents the opinion of the Companies operating under the FXOpen brand only. It is not to be construed as an offer, solicitation, or recommendation with respect to products and services provided by the Companies operating under the FXOpen brand, nor is it to be considered financial advice.
USD/JPY: Analysts Adjust Forecasts for the Strengthening of the Yen
Since the beginning of 2024, the USD/JPY price has been in an uptrend (as shown by the blue channel), but when the rate exceeded the psychological level of 150 yen per US dollar, market sentiment changed. This was due to expectations that the Bank of Japan would take interest rates out of negative territory — and statements from officials gave clear indications of this possibility.
Expecting a tightening of monetary policy, the yen sharply strengthened against the dollar, and a bearish A→B impulse formed on the USD/JPY chart. However, having reached the level of 147 yen per US dollar (and dropped slightly below it), the market has stabilized. Moreover, we see some recovery: today, the USD/JPY price is trading around 147.8.
From a fundamental analysis point of view, analysts believe that the strength of the US economy should not be underestimated. And if the Bank of Japan raises rates, it will not be in an aggressive manner. Bloomberg writes that Nomura Securities Co., Mizuho Bank Ltd. and Citigroup Global Markets Japan Inc. have adjusted their forecasts for the yen in recent weeks. On average, they forecast the rate to be around 140 yen per US dollar at the end of this year. HSBC Holdings Plc, in turn, expects the yen to end the year at 136 against the US dollar.
From the point of view of technical analysis of USD/JPY, the current recovery may be due to the influence of support from the lower border of the ascending channel.
Thus, traders can assume that the recovery will end (for example, rising to approximately 148.6 — 50% of the A→B momentum), with the bears attempting to resume the downward trend with a new assault on the lower channel boundary. If it turns out to be successful, this will open the way for the price to reach the levels indicated in analysts' forecasts.
Information from the Bank of Japan will be key. Its interest rate decision is scheduled for Tuesday, March 19.
Trade over 50 forex markets 24 hours a day with FXOpen. Take advantage of low commissions, deep liquidity, and spreads from 0.0 pips. Open your FXOpen account now or learn more about trading forex with FXOpen.
CFDs are complex instruments and come with a high risk of losing your money.
This article represents the opinion of the Companies operating under the FXOpen brand only. It is not to be construed as an offer, solicitation, or recommendation with respect to products and services provided by the Companies operating under the FXOpen brand, nor is it to be considered financial advice.
👍3
#sp500 #stockmarket #stocks #MarketNews
US500: The Market Has Been Growing without Corrections by 2% for 266 Consecutive Trading Sessions
The S&P 500 remains in its longest rally since 2018 without a decline of at least 2%, according to data compiled by Bloomberg; analysts note that there hasn't been a correction of this size in 266 trading sessions.
The positive sentiment of market participants is due to:
→ the prospect of lowering interest rates by the Federal Reserve;
→ enthusiasm for AI and its positive impact on economic development.
However, although the fundamental background is strong, current estimates of the US500 index may be overestimated — in fact, this is the essence of the correction.
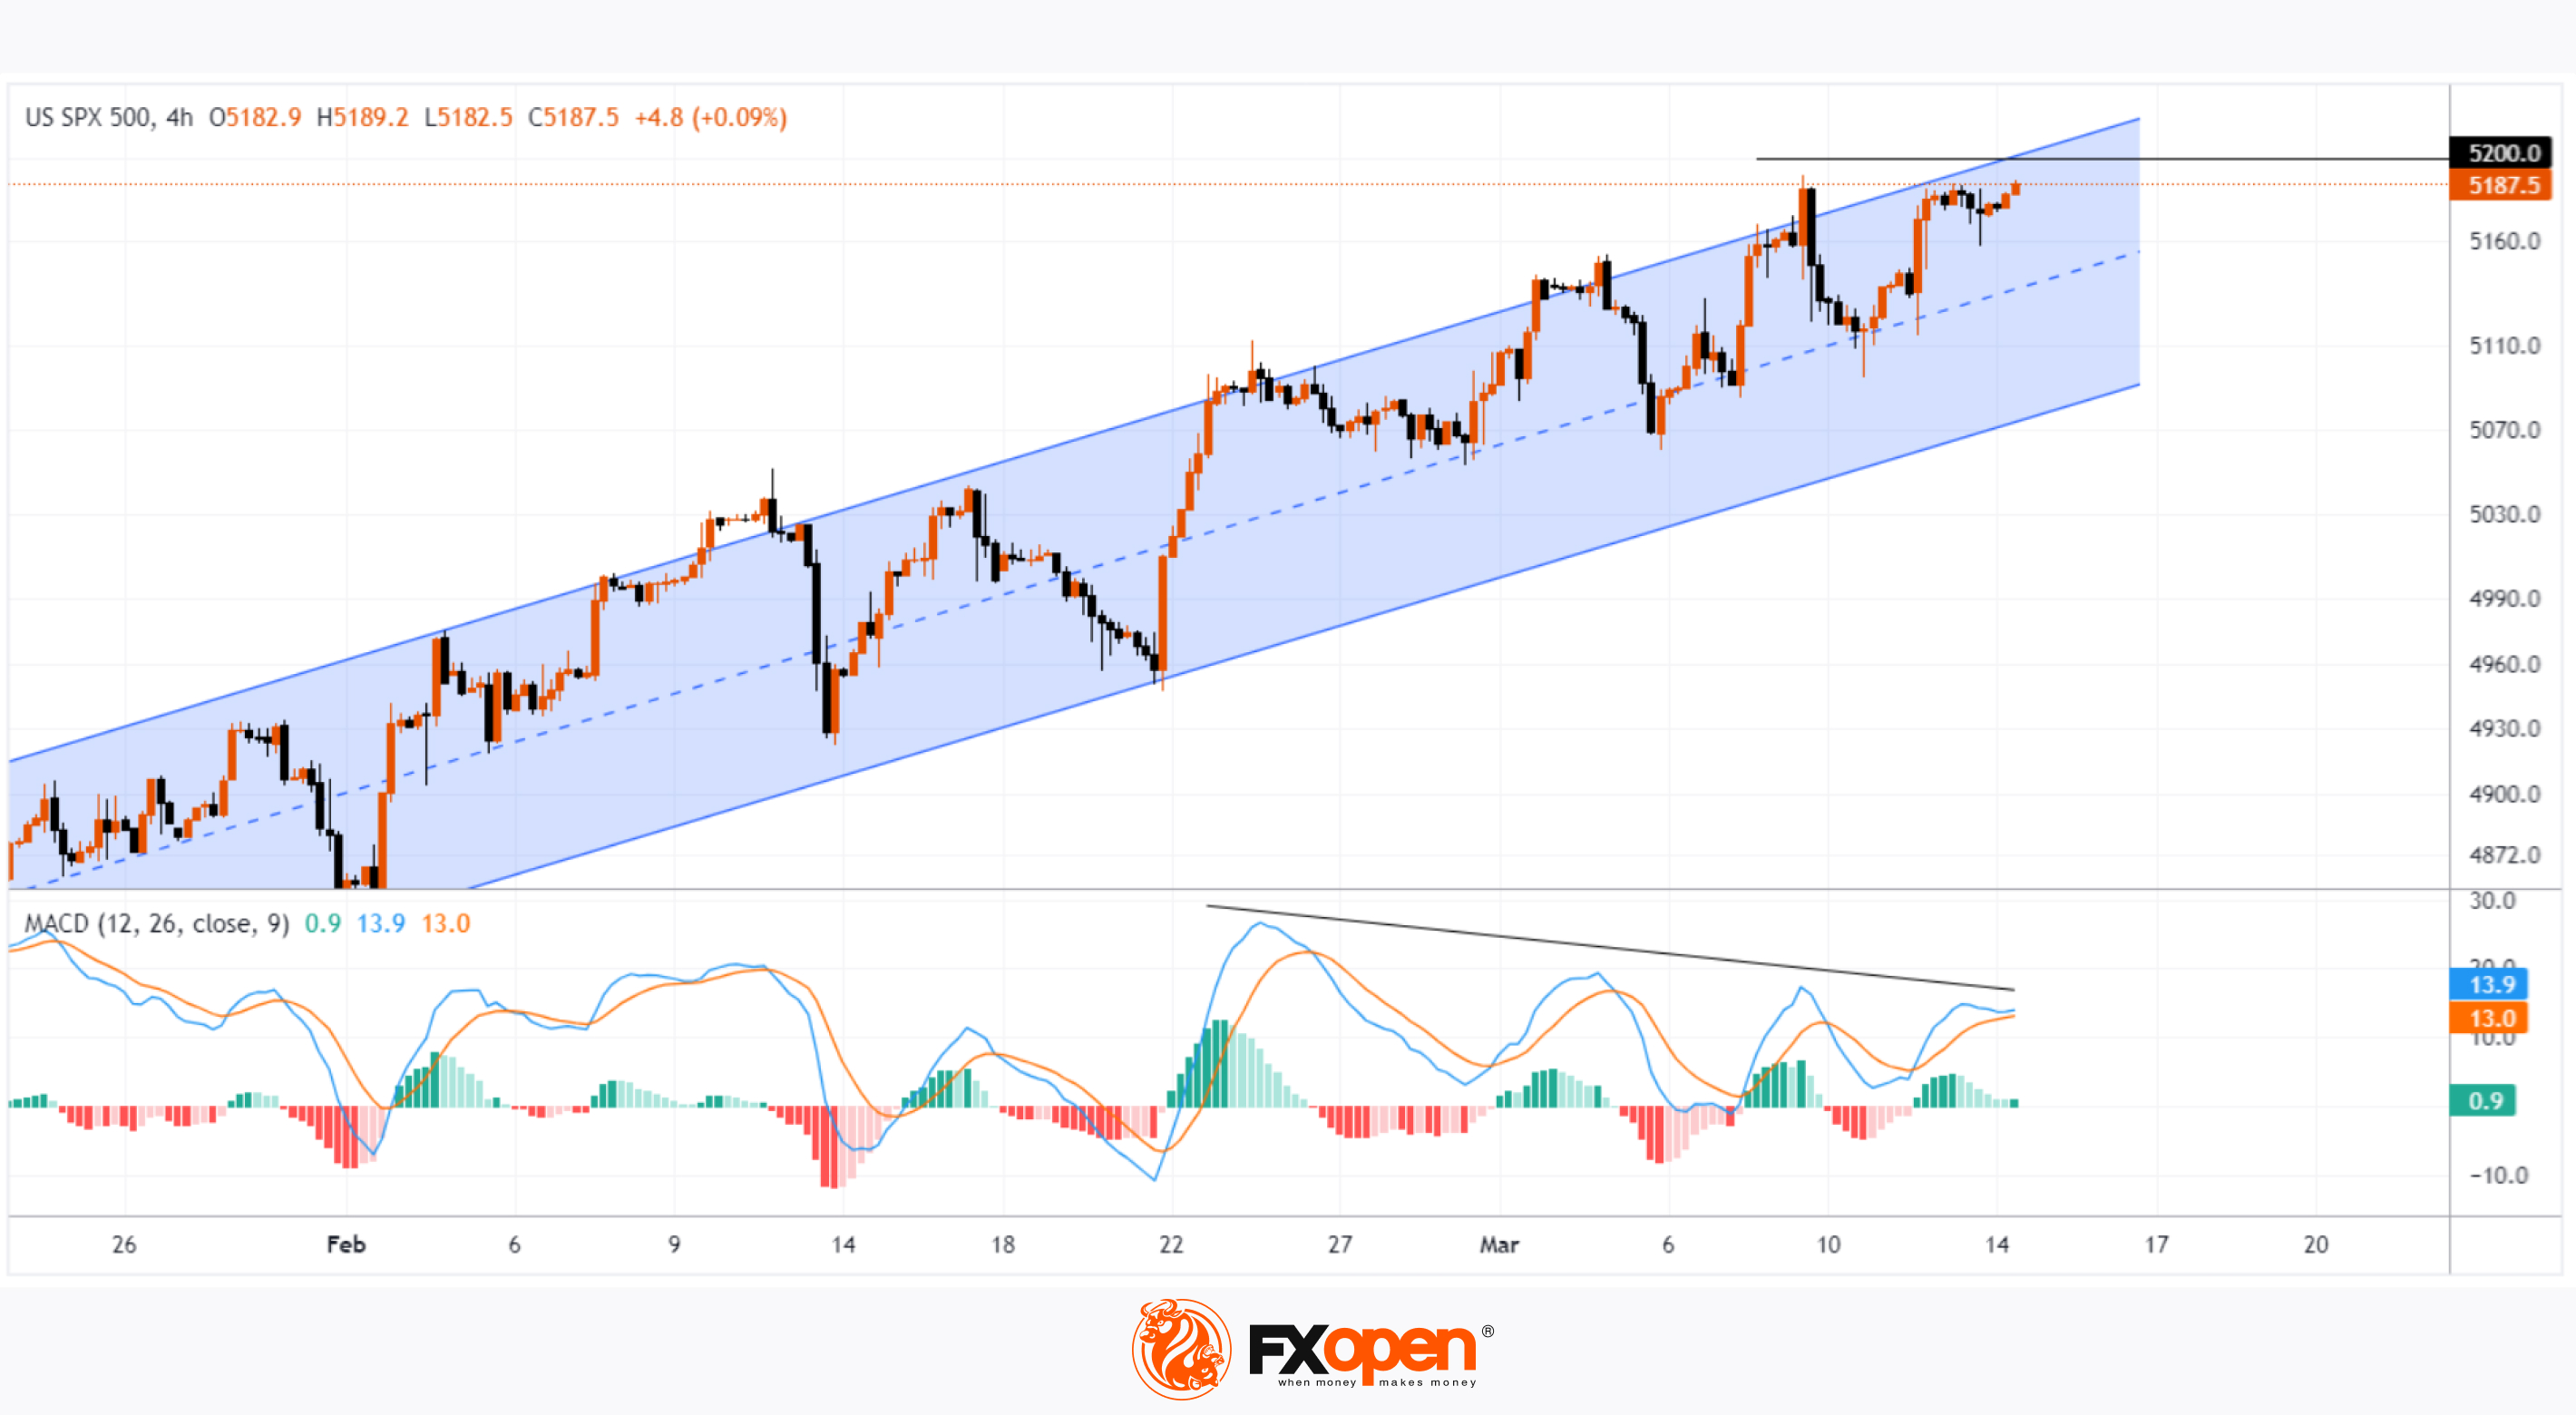
The US500 chart shows that:
→ the price is in an upward trend (shown by the blue channel);
→ the price moves in the upper half of the channel, and the median line acts as support — a sign of strong demand;
→ on the morning of March 14, the market is showing signs of positivity, indicating that an attempt to overcome the resistance of 5,200 points and take a new record high may be made in the near future.
However, the MACD is holding back optimism — the popular oscillator is forming a bearish divergence pattern, which hints at the gradual fading of bullish impulses.
Given the above, bulls should be cautious as the market looks vulnerable to a correction, such as to the lower border of the channel. But this requires a trigger. One of these could be news about inflation in the US; the values of the Producer Price Index (as well as data on retail sales in the US) will be published today at 15:30 GMT+3. Be prepared for spikes in volatility.
Trade global index CFDs with zero commission and tight spreads. Open your FXOpen account now or learn more about trading index CFDs with FXOpen.
CFDs are complex instruments and come with a high risk of losing your money.
This article represents the opinion of the Companies operating under the FXOpen brand only. It is not to be construed as an offer, solicitation, or recommendation with respect to products and services provided by the Companies operating under the FXOpen brand, nor is it to be considered financial advice.
US500: The Market Has Been Growing without Corrections by 2% for 266 Consecutive Trading Sessions
The S&P 500 remains in its longest rally since 2018 without a decline of at least 2%, according to data compiled by Bloomberg; analysts note that there hasn't been a correction of this size in 266 trading sessions.
The positive sentiment of market participants is due to:
→ the prospect of lowering interest rates by the Federal Reserve;
→ enthusiasm for AI and its positive impact on economic development.
However, although the fundamental background is strong, current estimates of the US500 index may be overestimated — in fact, this is the essence of the correction.
The US500 chart shows that:
→ the price is in an upward trend (shown by the blue channel);
→ the price moves in the upper half of the channel, and the median line acts as support — a sign of strong demand;
→ on the morning of March 14, the market is showing signs of positivity, indicating that an attempt to overcome the resistance of 5,200 points and take a new record high may be made in the near future.
However, the MACD is holding back optimism — the popular oscillator is forming a bearish divergence pattern, which hints at the gradual fading of bullish impulses.
Given the above, bulls should be cautious as the market looks vulnerable to a correction, such as to the lower border of the channel. But this requires a trigger. One of these could be news about inflation in the US; the values of the Producer Price Index (as well as data on retail sales in the US) will be published today at 15:30 GMT+3. Be prepared for spikes in volatility.
Trade global index CFDs with zero commission and tight spreads. Open your FXOpen account now or learn more about trading index CFDs with FXOpen.
CFDs are complex instruments and come with a high risk of losing your money.
This article represents the opinion of the Companies operating under the FXOpen brand only. It is not to be construed as an offer, solicitation, or recommendation with respect to products and services provided by the Companies operating under the FXOpen brand, nor is it to be considered financial advice.
👍2
#marketanalysis #usdollar #MarketNews #inflation
USD Strengthens Sharply after Inflation News
Yesterday's publication of producer price indices in the US was a surprise:
→ Core PPI: actual = 0.3%, expected = 0.2%.
→ PPI: actual = 0.6%, expected = 0.3%.
Higher producer prices indicate that high inflation may remain longer than expected. And this reduces the likelihood of the Fed easing monetary policy. Markets now price the likelihood of a Fed rate cut in June at 60%, up from 74% a week earlier, according to CME's FedWatch tool.
The reaction to the news was that the dollar strengthened — there was a bearish day on the stock market, and currencies paired with the USD also fell in price.
Thus, the EUR/USD price decrease yesterday was about 0.55% per day.
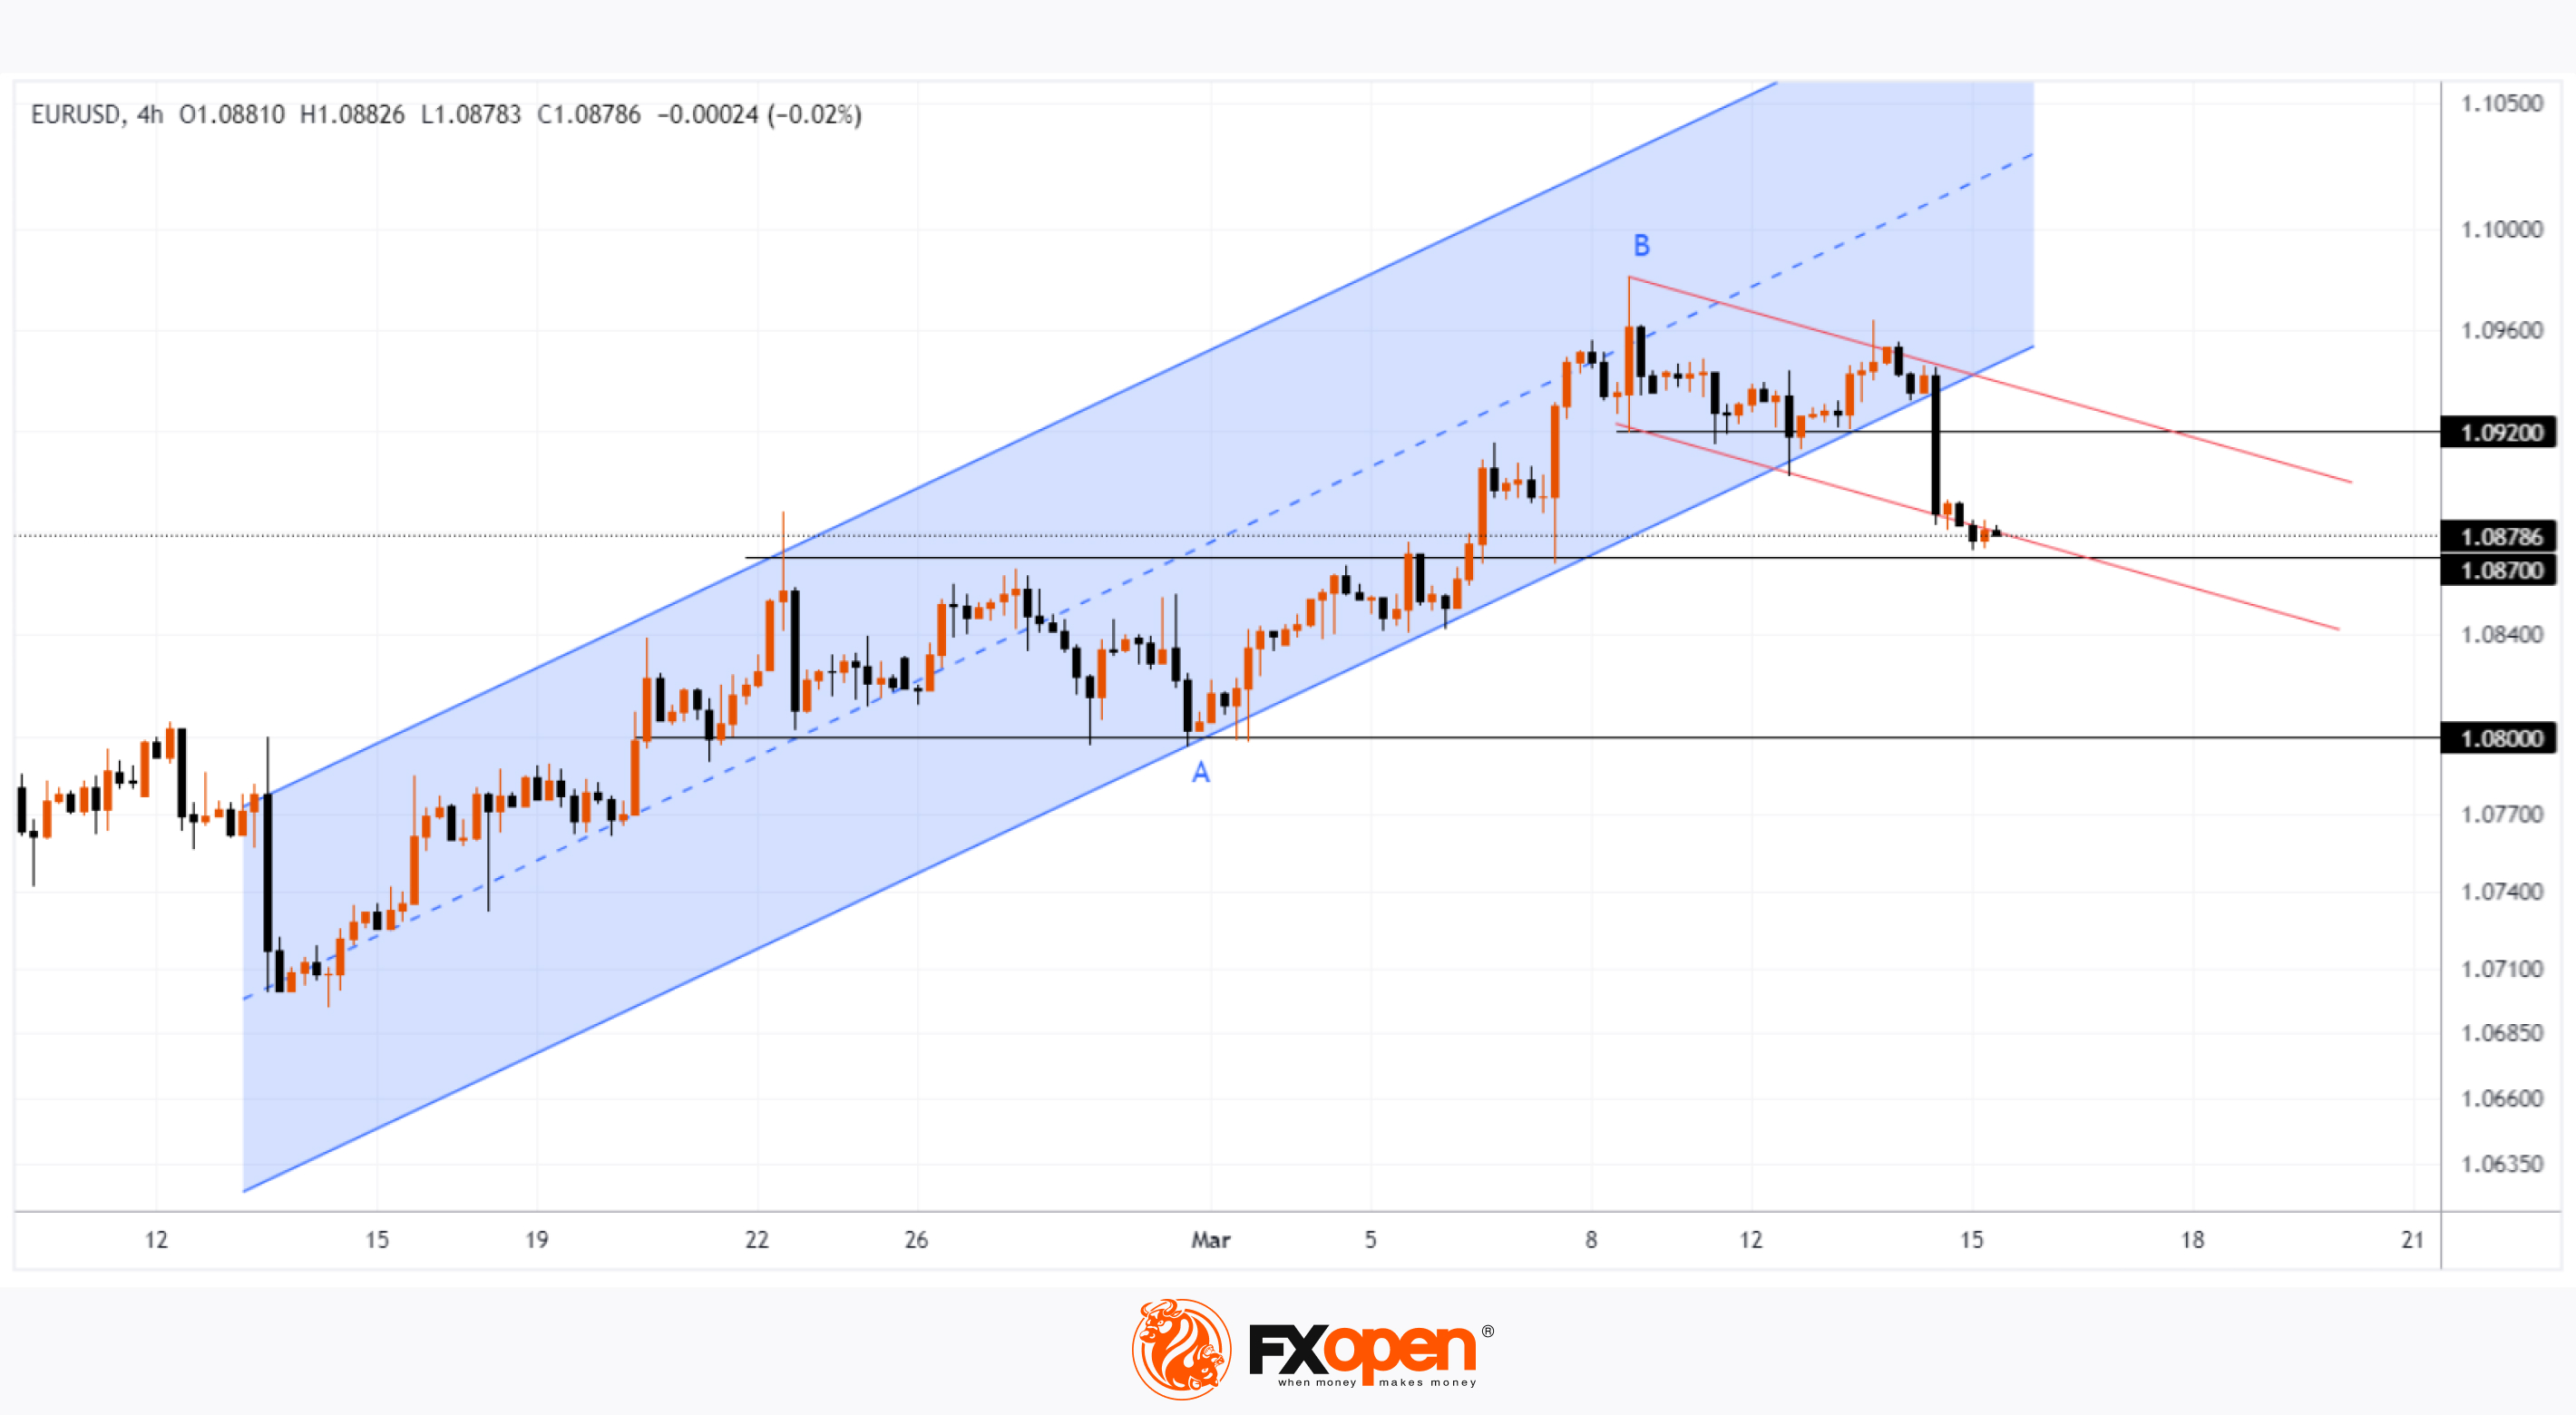
On March 11, we wrote that the price of EUR/USD may fall to the lower border of the channel (shown in blue) from the 8-week peak (B). In fact, the price made a bearish breakout of this channel.
The EUR/USD chart today shows:
→ the ascending channel loses its relevance. Bears can form a downward channel in turn — the red lines on the chart indicate its approximate contours;
→ the price of EUR/USD dropped to support 1.087 (we wrote about it on March 11). Also in this area there is support from the Fibonacci level of 50% of the growth A→B.
→ level 1.092 may resist the bulls’ attempts to restore the EUR/USD price.
The FOMC meeting will take place next week (Wednesday). It will provide information on how the Fed perceives the latest inflation news and will adjust market sentiment regarding rate cuts. It is possible that hawkish statements will be made, and the US dollar will strengthen even more — while the price of EUR/USD may fall closer to the important support of 1.08.
Trade over 50 forex markets 24 hours a day with FXOpen. Take advantage of low commissions, deep liquidity, and spreads from 0.0 pips. Open your FXOpen account now or learn more about trading forex with FXOpen.
CFDs are complex instruments and come with a high risk of losing your money.
This article represents the opinion of the Companies operating under the FXOpen brand only. It is not to be construed as an offer, solicitation, or recommendation with respect to products and services provided by the Companies operating under the FXOpen brand, nor is it to be considered financial advice.
USD Strengthens Sharply after Inflation News
Yesterday's publication of producer price indices in the US was a surprise:
→ Core PPI: actual = 0.3%, expected = 0.2%.
→ PPI: actual = 0.6%, expected = 0.3%.
Higher producer prices indicate that high inflation may remain longer than expected. And this reduces the likelihood of the Fed easing monetary policy. Markets now price the likelihood of a Fed rate cut in June at 60%, up from 74% a week earlier, according to CME's FedWatch tool.
The reaction to the news was that the dollar strengthened — there was a bearish day on the stock market, and currencies paired with the USD also fell in price.
Thus, the EUR/USD price decrease yesterday was about 0.55% per day.
On March 11, we wrote that the price of EUR/USD may fall to the lower border of the channel (shown in blue) from the 8-week peak (B). In fact, the price made a bearish breakout of this channel.
The EUR/USD chart today shows:
→ the ascending channel loses its relevance. Bears can form a downward channel in turn — the red lines on the chart indicate its approximate contours;
→ the price of EUR/USD dropped to support 1.087 (we wrote about it on March 11). Also in this area there is support from the Fibonacci level of 50% of the growth A→B.
→ level 1.092 may resist the bulls’ attempts to restore the EUR/USD price.
The FOMC meeting will take place next week (Wednesday). It will provide information on how the Fed perceives the latest inflation news and will adjust market sentiment regarding rate cuts. It is possible that hawkish statements will be made, and the US dollar will strengthen even more — while the price of EUR/USD may fall closer to the important support of 1.08.
Trade over 50 forex markets 24 hours a day with FXOpen. Take advantage of low commissions, deep liquidity, and spreads from 0.0 pips. Open your FXOpen account now or learn more about trading forex with FXOpen.
CFDs are complex instruments and come with a high risk of losing your money.
This article represents the opinion of the Companies operating under the FXOpen brand only. It is not to be construed as an offer, solicitation, or recommendation with respect to products and services provided by the Companies operating under the FXOpen brand, nor is it to be considered financial advice.
👍2
#oilprices #MarketNews #marketanalysis
WTI Oil Price Reaches 4-month High
The International Energy Agency (IEA) has once again raised its forecasts for global oil demand in 2024. While the agency's forecast pointed to the prospect of an oil surplus in 2023, its analysts now believe that the world will experience a shortage of oil in the second half of 2024.
Among the reasons for the shortage:
→ limitation of oil production by OPEC+ countries, it is 2 million barrels per day until the middle of the year. And it may be extended, as Bloomberg writes — the decision is scheduled for June 1;
→ changes in logistics routes due to Houthi attacks on tankers in the Red Sea.
Also, a bullish impulse for the price of WTI oil can be provided by the geopolitical situation, which remains tense.
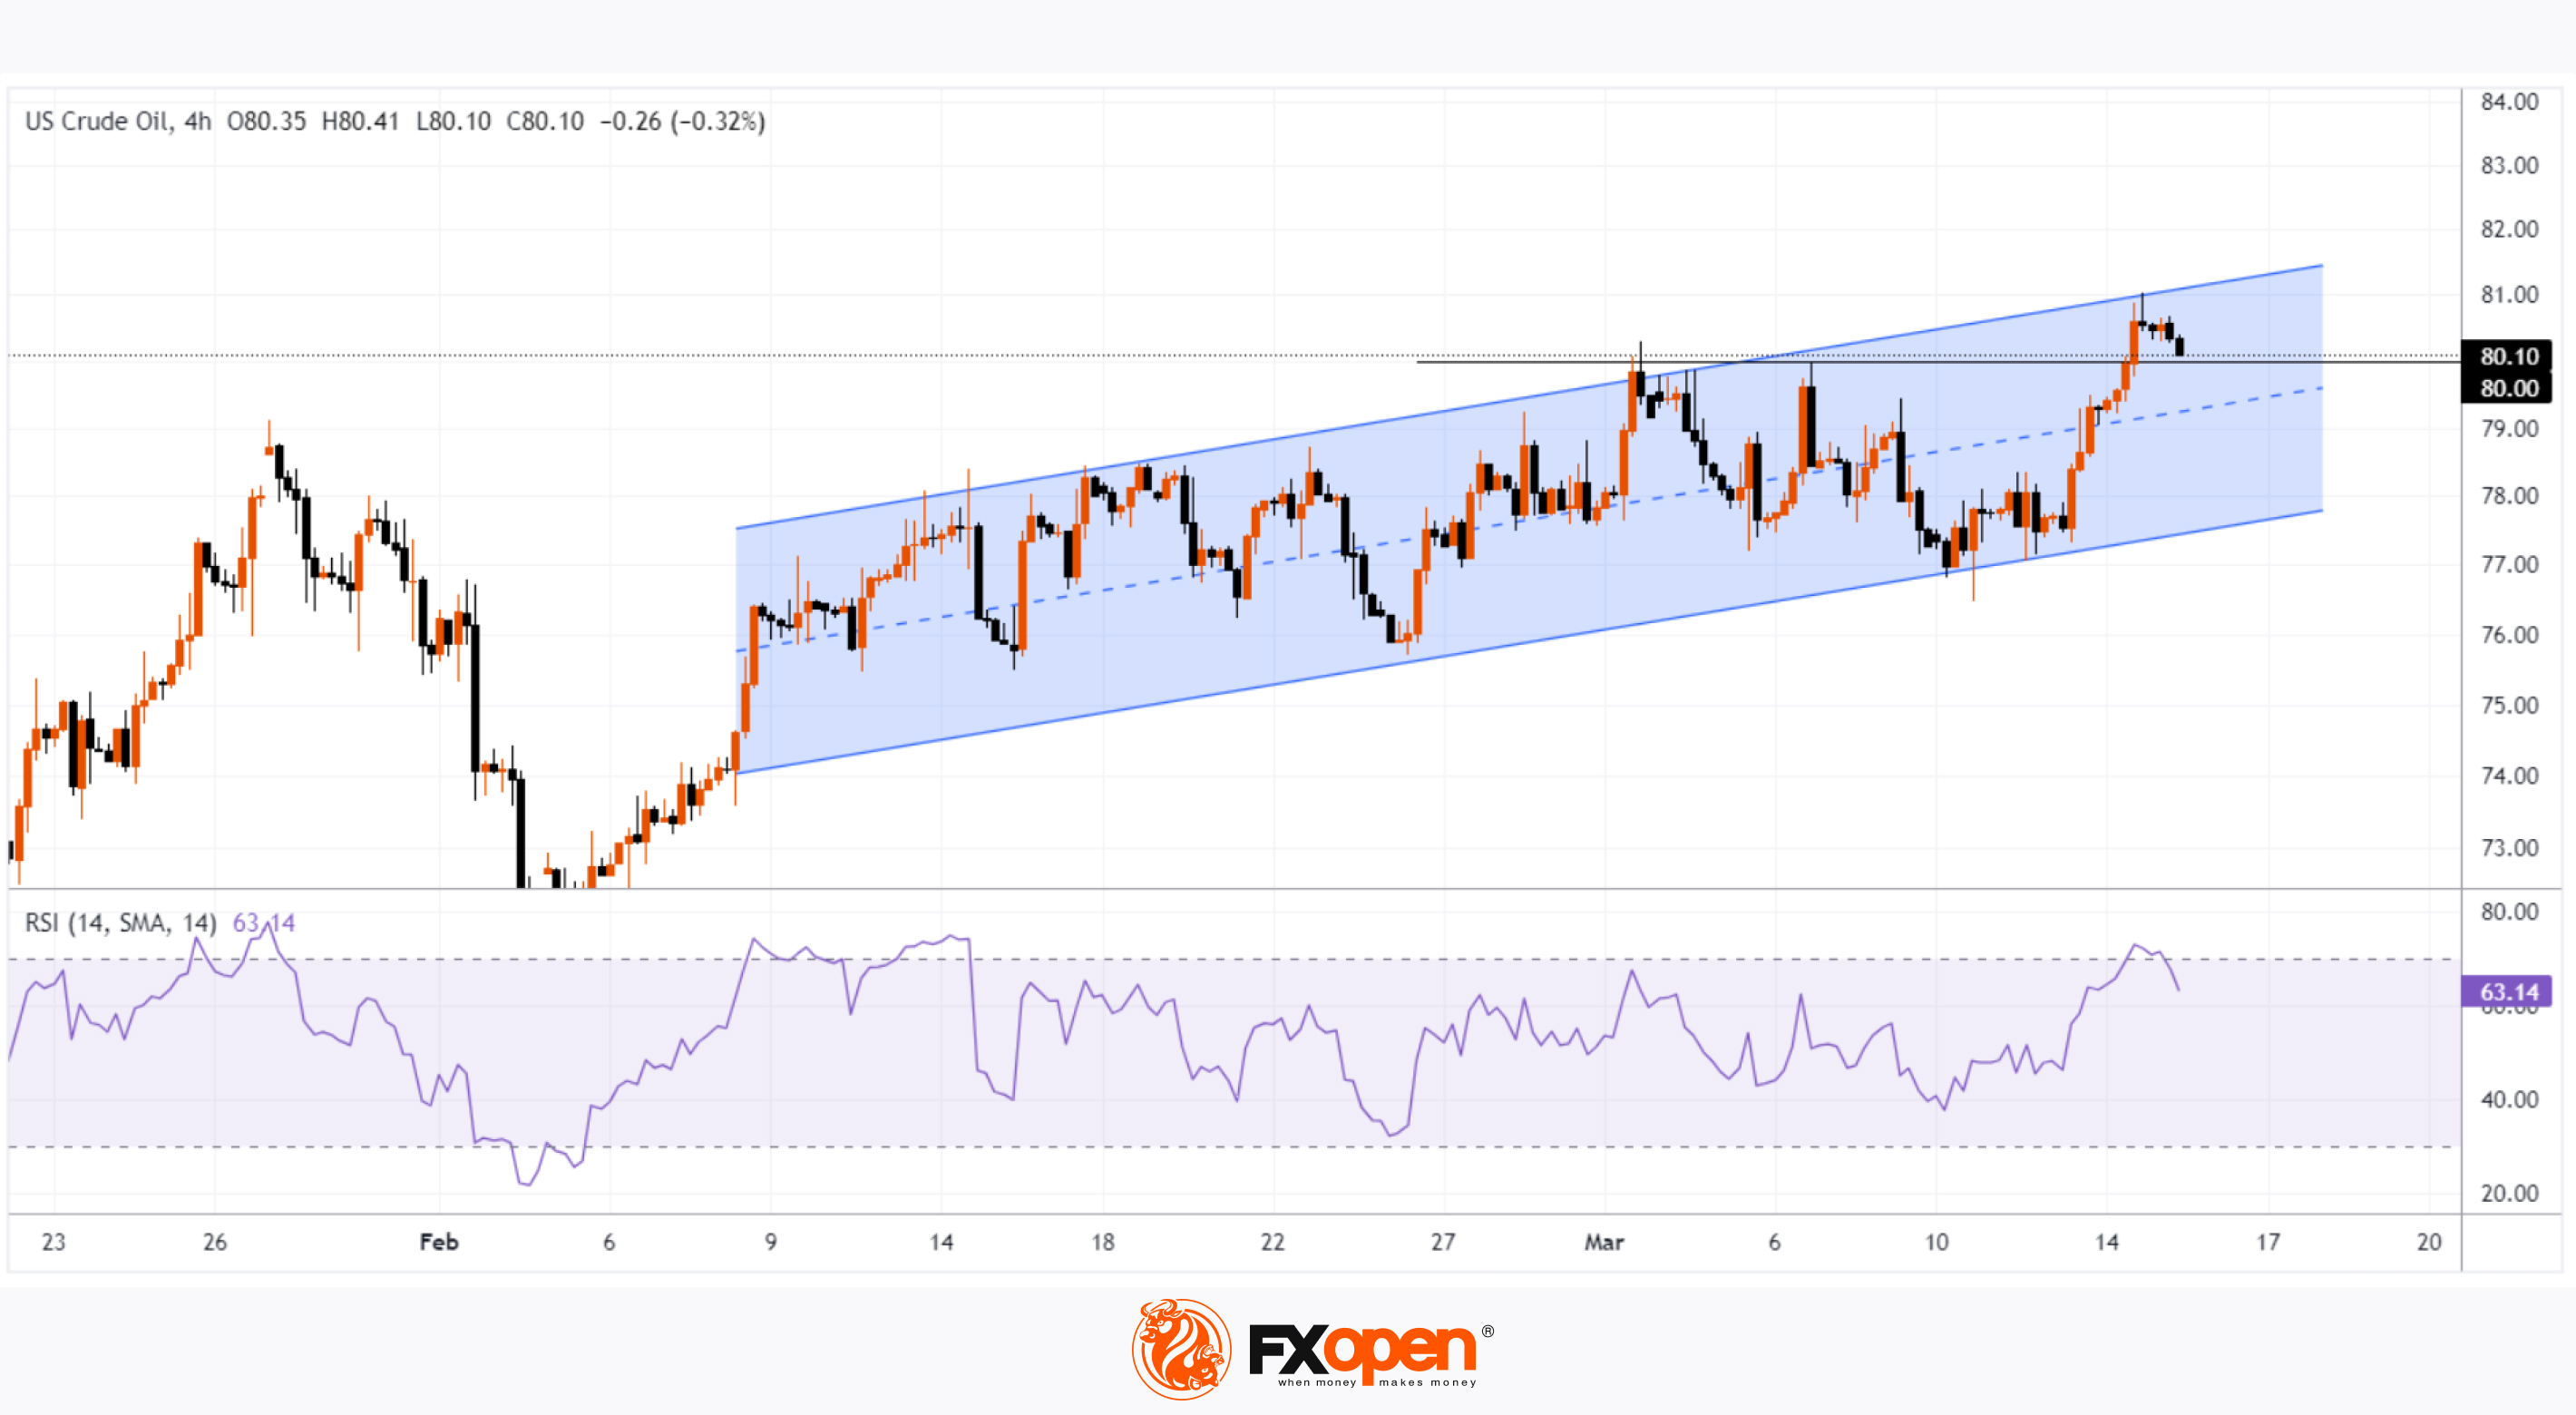
The WTI oil chart shows that:
→ the price has exceeded the psychological level of USD 80 per barrel and is trying to gain a foothold there;
→ the price moves within the ascending channel (shown in blue);
→ long upper shadows on the candles around USD 81 indicate seller activity. This is where the upper boundary of the channel lies, so there is reason to consider the level of USD 81 as current resistance.
Perhaps long position holders decided to take profits at the 4-month high in WTI oil prices. One way or another, given the activity of sellers and the presence of RSI indicator values in the overbought zone, this market is vulnerable to a pullback after growing by more than 4% this week. It is possible that the price will adjust to the median line of the channel.
Start trading commodity CFDs with tight spreads. Open your trading account now or learn more about trading commodity CFDs with FXOpen.
CFDs are complex instruments and come with a high risk of losing your money.
This article represents the opinion of the Companies operating under the FXOpen brand only. It is not to be construed as an offer, solicitation, or recommendation with respect to products and services provided by the Companies operating under the FXOpen brand, nor is it to be considered financial advice.
WTI Oil Price Reaches 4-month High
The International Energy Agency (IEA) has once again raised its forecasts for global oil demand in 2024. While the agency's forecast pointed to the prospect of an oil surplus in 2023, its analysts now believe that the world will experience a shortage of oil in the second half of 2024.
Among the reasons for the shortage:
→ limitation of oil production by OPEC+ countries, it is 2 million barrels per day until the middle of the year. And it may be extended, as Bloomberg writes — the decision is scheduled for June 1;
→ changes in logistics routes due to Houthi attacks on tankers in the Red Sea.
Also, a bullish impulse for the price of WTI oil can be provided by the geopolitical situation, which remains tense.
The WTI oil chart shows that:
→ the price has exceeded the psychological level of USD 80 per barrel and is trying to gain a foothold there;
→ the price moves within the ascending channel (shown in blue);
→ long upper shadows on the candles around USD 81 indicate seller activity. This is where the upper boundary of the channel lies, so there is reason to consider the level of USD 81 as current resistance.
Perhaps long position holders decided to take profits at the 4-month high in WTI oil prices. One way or another, given the activity of sellers and the presence of RSI indicator values in the overbought zone, this market is vulnerable to a pullback after growing by more than 4% this week. It is possible that the price will adjust to the median line of the channel.
Start trading commodity CFDs with tight spreads. Open your trading account now or learn more about trading commodity CFDs with FXOpen.
CFDs are complex instruments and come with a high risk of losing your money.
This article represents the opinion of the Companies operating under the FXOpen brand only. It is not to be construed as an offer, solicitation, or recommendation with respect to products and services provided by the Companies operating under the FXOpen brand, nor is it to be considered financial advice.
👍2
#BTCUSD #cryptonews #marketanalysis
BTC/USD Analysis: Bears Have Become More Active Near the $70,000 Level
On February 26 (A), a strong bullish impulse started in the Bitcoin market. Its trajectory is visually described by a blue line. The price of bitcoins developed along it — this can be interpreted in such a way that market participants agreed that the value of the cryptocurrency was increasing.
If the price of Bitcoin deviated from the blue line, it was only for a short period of time. For example, to pierce the psychological level of USD 60,000 on March 5th.
However, the bullish momentum changed on March 15th, and this can be seen on the BTC/USD chart today:
→ the blue line began to work as resistance (shown by the first arrow);
→ the level of USD 70,000 also began to act as resistance (shown by the second arrow).
BTC price briefly deviated from breaking through the psychological USD 65,000 level - but it appears that due to said resistances, bulls may now have trouble getting Bitcoin price back onto the upward trajectory shown by the blue line.
This could mean that the market's consensus on the value of BTC has changed - the chart suggests that a price of over USD 70k per Bitcoin may be considered overpriced (not surprising after A→B's rise of over 40% in 14 days).
On the other hand, demand remains high ahead of the halving (scheduled for April 19).
According to Matt Hougan (a top executive at Bitwise, one of the BTC ETF providers), about 40% of independent registered financial advisors at Barron's Summit owned Bitcoin. And this number among their clients is about 5-10%, which leaves potential for further growth.
Matt Hougan also noted the growing concern about the huge US government debt, and Bitcoin in this case acts as an insurance asset.
Given the strong fundamentals and signs of technical weakness near the last historical high, it is reasonable to assume that the price of Bitcoin may form some kind of consolidation zone around USD 70,000, thereby suggesting the levels that most market participants consider a fair price for Bitcoin at the moment.
FXOpen offers the world's most popular cryptocurrency CFDs*, including Bitcoin and Ethereum. Floating spreads, 1:2 leverage — at your service. Open your trading account now or learn more about crypto CFD trading with FXOpen.
*At FXOpen UK and FXOpen AU, Cryptocurrency CFDs are only available for trading by those clients categorised as Professional clients under FCA Rules and Professional clients under ASIC Rules respectively. They are not available for trading by Retail clients.
CFDs are complex instruments and come with a high risk of losing your money.
BTC/USD Analysis: Bears Have Become More Active Near the $70,000 Level
On February 26 (A), a strong bullish impulse started in the Bitcoin market. Its trajectory is visually described by a blue line. The price of bitcoins developed along it — this can be interpreted in such a way that market participants agreed that the value of the cryptocurrency was increasing.
If the price of Bitcoin deviated from the blue line, it was only for a short period of time. For example, to pierce the psychological level of USD 60,000 on March 5th.
However, the bullish momentum changed on March 15th, and this can be seen on the BTC/USD chart today:
→ the blue line began to work as resistance (shown by the first arrow);
→ the level of USD 70,000 also began to act as resistance (shown by the second arrow).
BTC price briefly deviated from breaking through the psychological USD 65,000 level - but it appears that due to said resistances, bulls may now have trouble getting Bitcoin price back onto the upward trajectory shown by the blue line.
This could mean that the market's consensus on the value of BTC has changed - the chart suggests that a price of over USD 70k per Bitcoin may be considered overpriced (not surprising after A→B's rise of over 40% in 14 days).
On the other hand, demand remains high ahead of the halving (scheduled for April 19).
According to Matt Hougan (a top executive at Bitwise, one of the BTC ETF providers), about 40% of independent registered financial advisors at Barron's Summit owned Bitcoin. And this number among their clients is about 5-10%, which leaves potential for further growth.
Matt Hougan also noted the growing concern about the huge US government debt, and Bitcoin in this case acts as an insurance asset.
Given the strong fundamentals and signs of technical weakness near the last historical high, it is reasonable to assume that the price of Bitcoin may form some kind of consolidation zone around USD 70,000, thereby suggesting the levels that most market participants consider a fair price for Bitcoin at the moment.
FXOpen offers the world's most popular cryptocurrency CFDs*, including Bitcoin and Ethereum. Floating spreads, 1:2 leverage — at your service. Open your trading account now or learn more about crypto CFD trading with FXOpen.
*At FXOpen UK and FXOpen AU, Cryptocurrency CFDs are only available for trading by those clients categorised as Professional clients under FCA Rules and Professional clients under ASIC Rules respectively. They are not available for trading by Retail clients.
CFDs are complex instruments and come with a high risk of losing your money.
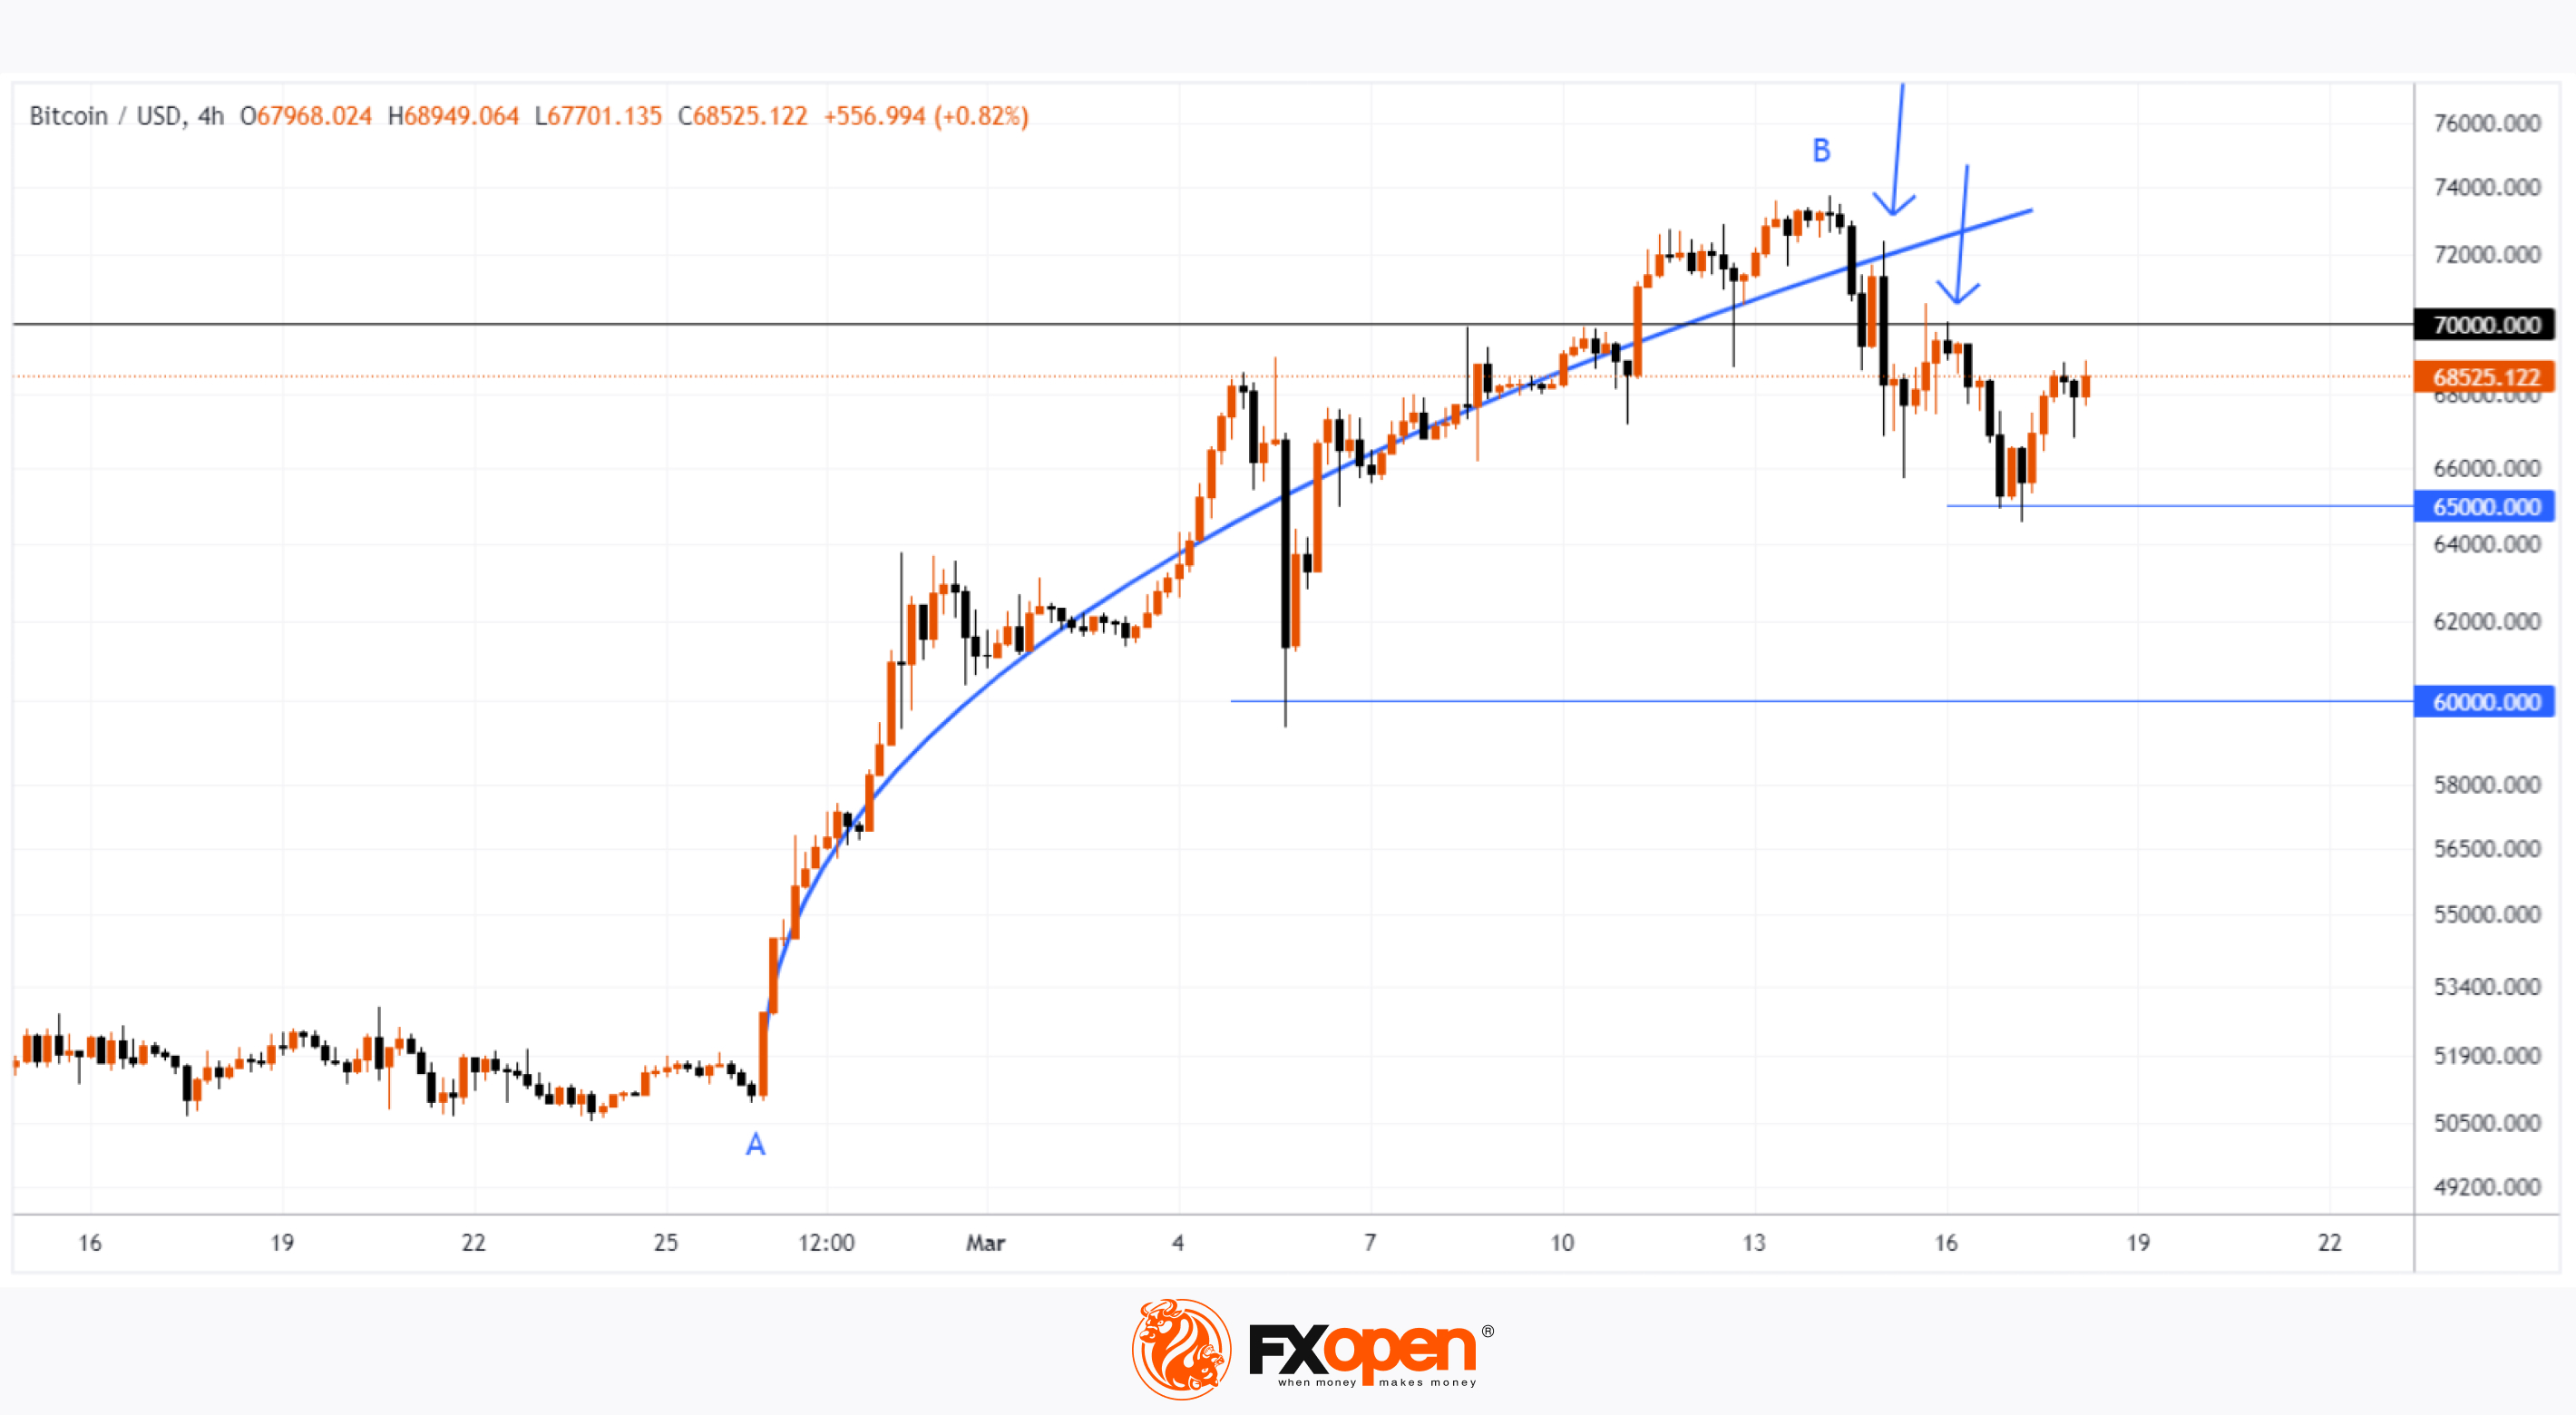
👍3
#marketanalysis #forextrading #MarketNews
Bank of Japan Ends the Era of Negative Interest Rates
The Bank of Japan has not raised interest rates for 17 years. For 8 years, it was in the negative zone.
But today there was a dramatic shift in monetary policy — the Bank of Japan announced a decision to increase the interest rate from -0.1% to 0.1%.
The central bank also abandoned yield curve control (YCC), a policy that had been in place since 2016 and capped long-term interest rates near zero.
Considering the scale of the decisions taken, the reaction of the yen exchange rate relative to other currencies turned out to be moderate. This is because the plans of the Bank of Japan have been discussed for a long time, including in official sources of information. Therefore, it is acceptable to assume that participants in the currency markets have already laid down the probability of today's event.
In fact, the yen has weakened as a result, but this may only be an initial reaction in which markets are reassessing the impact of the Bank of Japan's decision over a range of short-term to long-term horizons.
The USD/JPY chart today shows that:
→ the yen exceeded the psychological level of 150 yen per US dollar;
→ the rate continues to develop in an ascending channel (marked in blue). At the same time, its median line was tested, which can serve as resistance from the point of view of technical analysis of USD/JPY.
Let us mark on the chart the top of the year around the level of 150.888.
It is possible that the emerging prospect of a tighter monetary policy, as well as the indicated resistance lines, will lead to the bears becoming more active and trying to lower the USD/JPY price to the lower border of the indicated channel. An important driver will also be news from the FOMC (scheduled for tomorrow, 21:00-21:30, GMT+3).
Trade over 50 forex markets 24 hours a day with FXOpen. Take advantage of low commissions, deep liquidity, and spreads from 0.0 pips. Open your FXOpen account now or learn more about trading forex with FXOpen.
CFDs are complex instruments and come with a high risk of losing your money.
This article represents the opinion of the Companies operating under the FXOpen brand only. It is not to be construed as an offer, solicitation, or recommendation with respect to products and services provided by the Companies operating under the FXOpen brand, nor is it to be considered financial advice.
Bank of Japan Ends the Era of Negative Interest Rates
The Bank of Japan has not raised interest rates for 17 years. For 8 years, it was in the negative zone.
But today there was a dramatic shift in monetary policy — the Bank of Japan announced a decision to increase the interest rate from -0.1% to 0.1%.
The central bank also abandoned yield curve control (YCC), a policy that had been in place since 2016 and capped long-term interest rates near zero.
Considering the scale of the decisions taken, the reaction of the yen exchange rate relative to other currencies turned out to be moderate. This is because the plans of the Bank of Japan have been discussed for a long time, including in official sources of information. Therefore, it is acceptable to assume that participants in the currency markets have already laid down the probability of today's event.
In fact, the yen has weakened as a result, but this may only be an initial reaction in which markets are reassessing the impact of the Bank of Japan's decision over a range of short-term to long-term horizons.
The USD/JPY chart today shows that:
→ the yen exceeded the psychological level of 150 yen per US dollar;
→ the rate continues to develop in an ascending channel (marked in blue). At the same time, its median line was tested, which can serve as resistance from the point of view of technical analysis of USD/JPY.
Let us mark on the chart the top of the year around the level of 150.888.
It is possible that the emerging prospect of a tighter monetary policy, as well as the indicated resistance lines, will lead to the bears becoming more active and trying to lower the USD/JPY price to the lower border of the indicated channel. An important driver will also be news from the FOMC (scheduled for tomorrow, 21:00-21:30, GMT+3).
Trade over 50 forex markets 24 hours a day with FXOpen. Take advantage of low commissions, deep liquidity, and spreads from 0.0 pips. Open your FXOpen account now or learn more about trading forex with FXOpen.
CFDs are complex instruments and come with a high risk of losing your money.
This article represents the opinion of the Companies operating under the FXOpen brand only. It is not to be construed as an offer, solicitation, or recommendation with respect to products and services provided by the Companies operating under the FXOpen brand, nor is it to be considered financial advice.
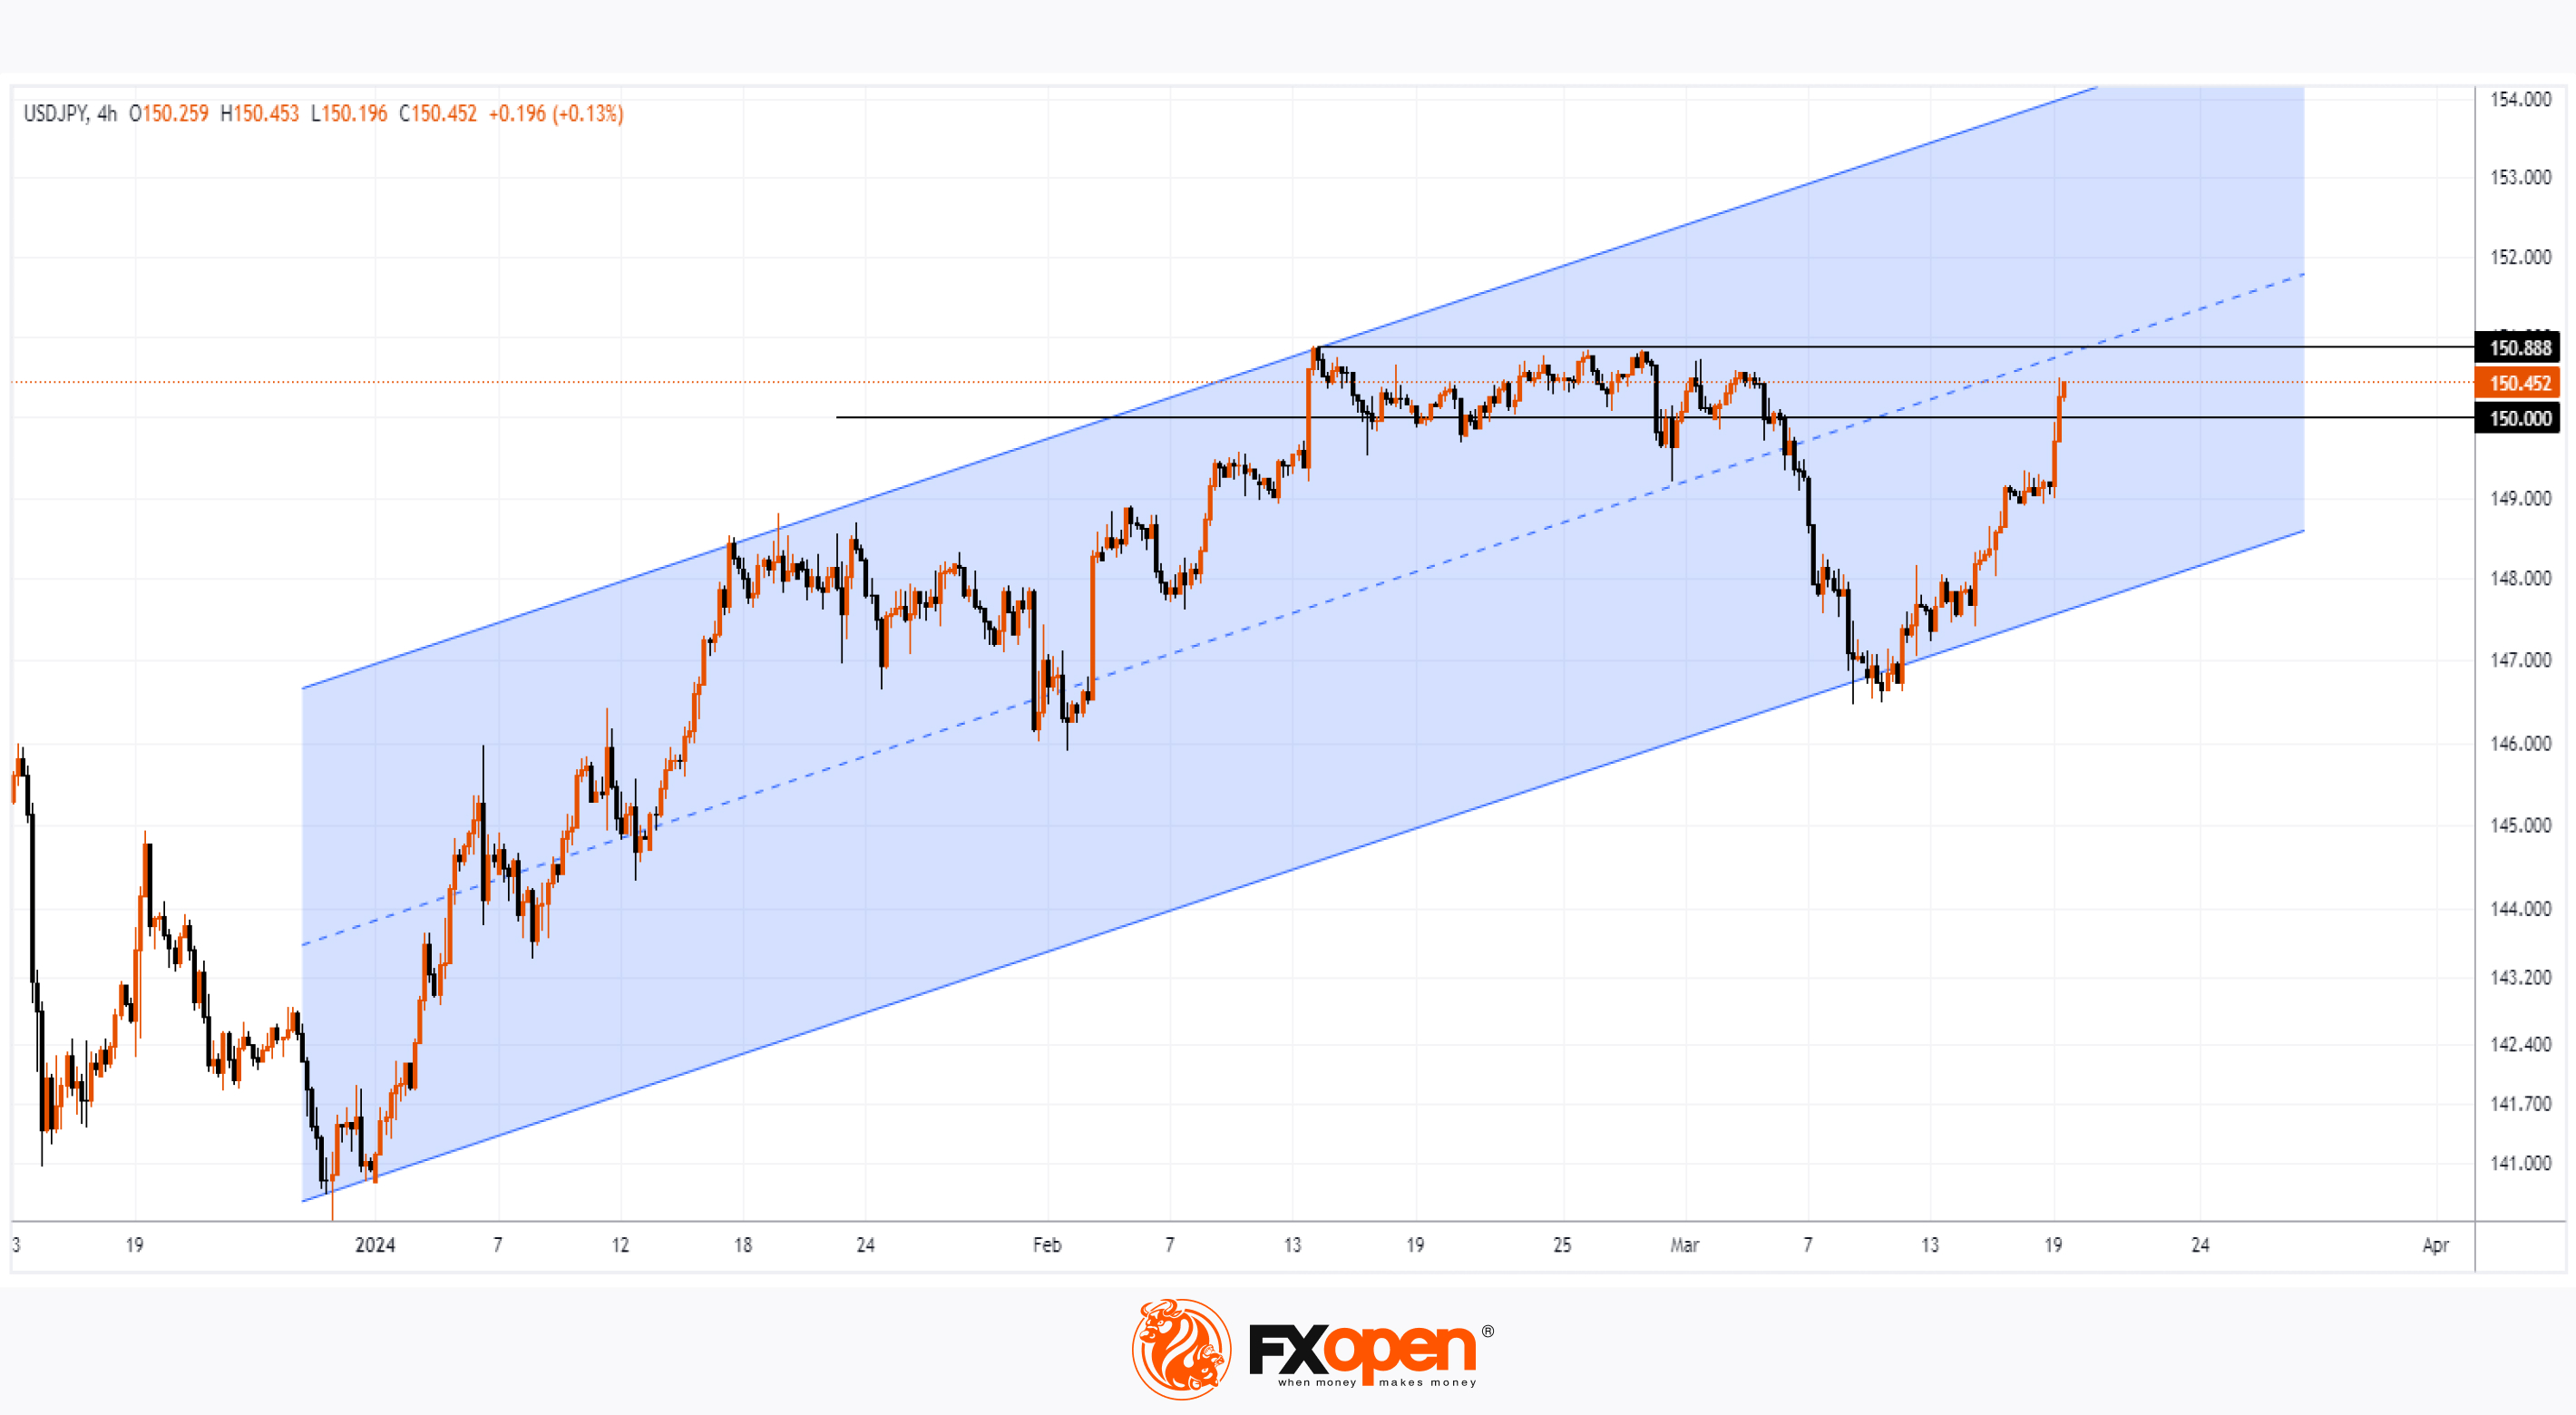
👍4
#bitcoin #BTCUSD #cryptonews #marketanalysis
Correction in Crypto Markets: BTC/USD Rate Drops to $60,000
On March 18, we wrote that bears became more active near the $70,000 level.
As the BTC/USD chart shows, today the price of Bitcoin is already close to the psychological level of USD 60k, while the price of Ethereum is close to USD 3,000.
According to MarketWatch, experts consider the decline to be a correction that is “long overdue” as part of an upward trend. According to Fundstrat, Monday saw net outflows from BTC ETFs for the first time since March 1, amounting to about $154.3 million.
What's next?
From a technical analysis point of view, the price of Bitcoin, given an increase of approximately 90% from point A (around USD 38.8k) to point B (around USD 73.4k), a normal correction of 50% indicates the prospect of a decline to the area of USD 56.1k .
Having constructed a channel (shown in blue), taking into account extrema A and B, as well as turning points (indicated by arrows), it is permissible to assume that the price of Bitcoin will drop to the lower boundary of the channel in the area of $57k, where it currently lies.
Thus, the USD 56-57k area can be seen as a target for the bears, who have seized the initiative after the upward momentum has exhausted itself (judging by the divergence on the RSI indicator).
In the event of a deeper correction, a test of the psychological mark of USD 50k per Bitcoin cannot be ruled out.
However, despite the significant decline (about 15% over the last 6 days), the Bitcoin market can be considered bullish:
→ the blue ascending channel has not yet been broken;
→ the approaching halving is seen as a growth driver;
→ according to the new Bitcoin price forecast from Standard Chartered, the target has been increased to USD 150k by the end of 2024 and USD 250k by the end of 2025.
FXOpen offers the world's most popular cryptocurrency CFDs*, including Bitcoin and Ethereum. Floating spreads, 1:2 leverage — at your service. Open your trading account now or learn more about crypto CFD trading with FXOpen.
*At FXOpen UK and FXOpen AU, Cryptocurrency CFDs are only available for trading by those clients categorised as Professional clients under FCA Rules and Professional clients under AFSL 412871 – ABN 61 143 678 719 respectively. They are not available for trading by Retail clients.
CFDs are complex instruments and come with a high risk of losing your money.
This article represents the opinion of the Companies operating under the FXOpen brand only. It is not to be construed as an offer, solicitation, or recommendation with respect to products and services provided by the Companies operating under the FXOpen brand, nor is it to be considered financial advice.
Correction in Crypto Markets: BTC/USD Rate Drops to $60,000
On March 18, we wrote that bears became more active near the $70,000 level.
As the BTC/USD chart shows, today the price of Bitcoin is already close to the psychological level of USD 60k, while the price of Ethereum is close to USD 3,000.
According to MarketWatch, experts consider the decline to be a correction that is “long overdue” as part of an upward trend. According to Fundstrat, Monday saw net outflows from BTC ETFs for the first time since March 1, amounting to about $154.3 million.
What's next?
From a technical analysis point of view, the price of Bitcoin, given an increase of approximately 90% from point A (around USD 38.8k) to point B (around USD 73.4k), a normal correction of 50% indicates the prospect of a decline to the area of USD 56.1k .
Having constructed a channel (shown in blue), taking into account extrema A and B, as well as turning points (indicated by arrows), it is permissible to assume that the price of Bitcoin will drop to the lower boundary of the channel in the area of $57k, where it currently lies.
Thus, the USD 56-57k area can be seen as a target for the bears, who have seized the initiative after the upward momentum has exhausted itself (judging by the divergence on the RSI indicator).
In the event of a deeper correction, a test of the psychological mark of USD 50k per Bitcoin cannot be ruled out.
However, despite the significant decline (about 15% over the last 6 days), the Bitcoin market can be considered bullish:
→ the blue ascending channel has not yet been broken;
→ the approaching halving is seen as a growth driver;
→ according to the new Bitcoin price forecast from Standard Chartered, the target has been increased to USD 150k by the end of 2024 and USD 250k by the end of 2025.
FXOpen offers the world's most popular cryptocurrency CFDs*, including Bitcoin and Ethereum. Floating spreads, 1:2 leverage — at your service. Open your trading account now or learn more about crypto CFD trading with FXOpen.
*At FXOpen UK and FXOpen AU, Cryptocurrency CFDs are only available for trading by those clients categorised as Professional clients under FCA Rules and Professional clients under AFSL 412871 – ABN 61 143 678 719 respectively. They are not available for trading by Retail clients.
CFDs are complex instruments and come with a high risk of losing your money.
This article represents the opinion of the Companies operating under the FXOpen brand only. It is not to be construed as an offer, solicitation, or recommendation with respect to products and services provided by the Companies operating under the FXOpen brand, nor is it to be considered financial advice.
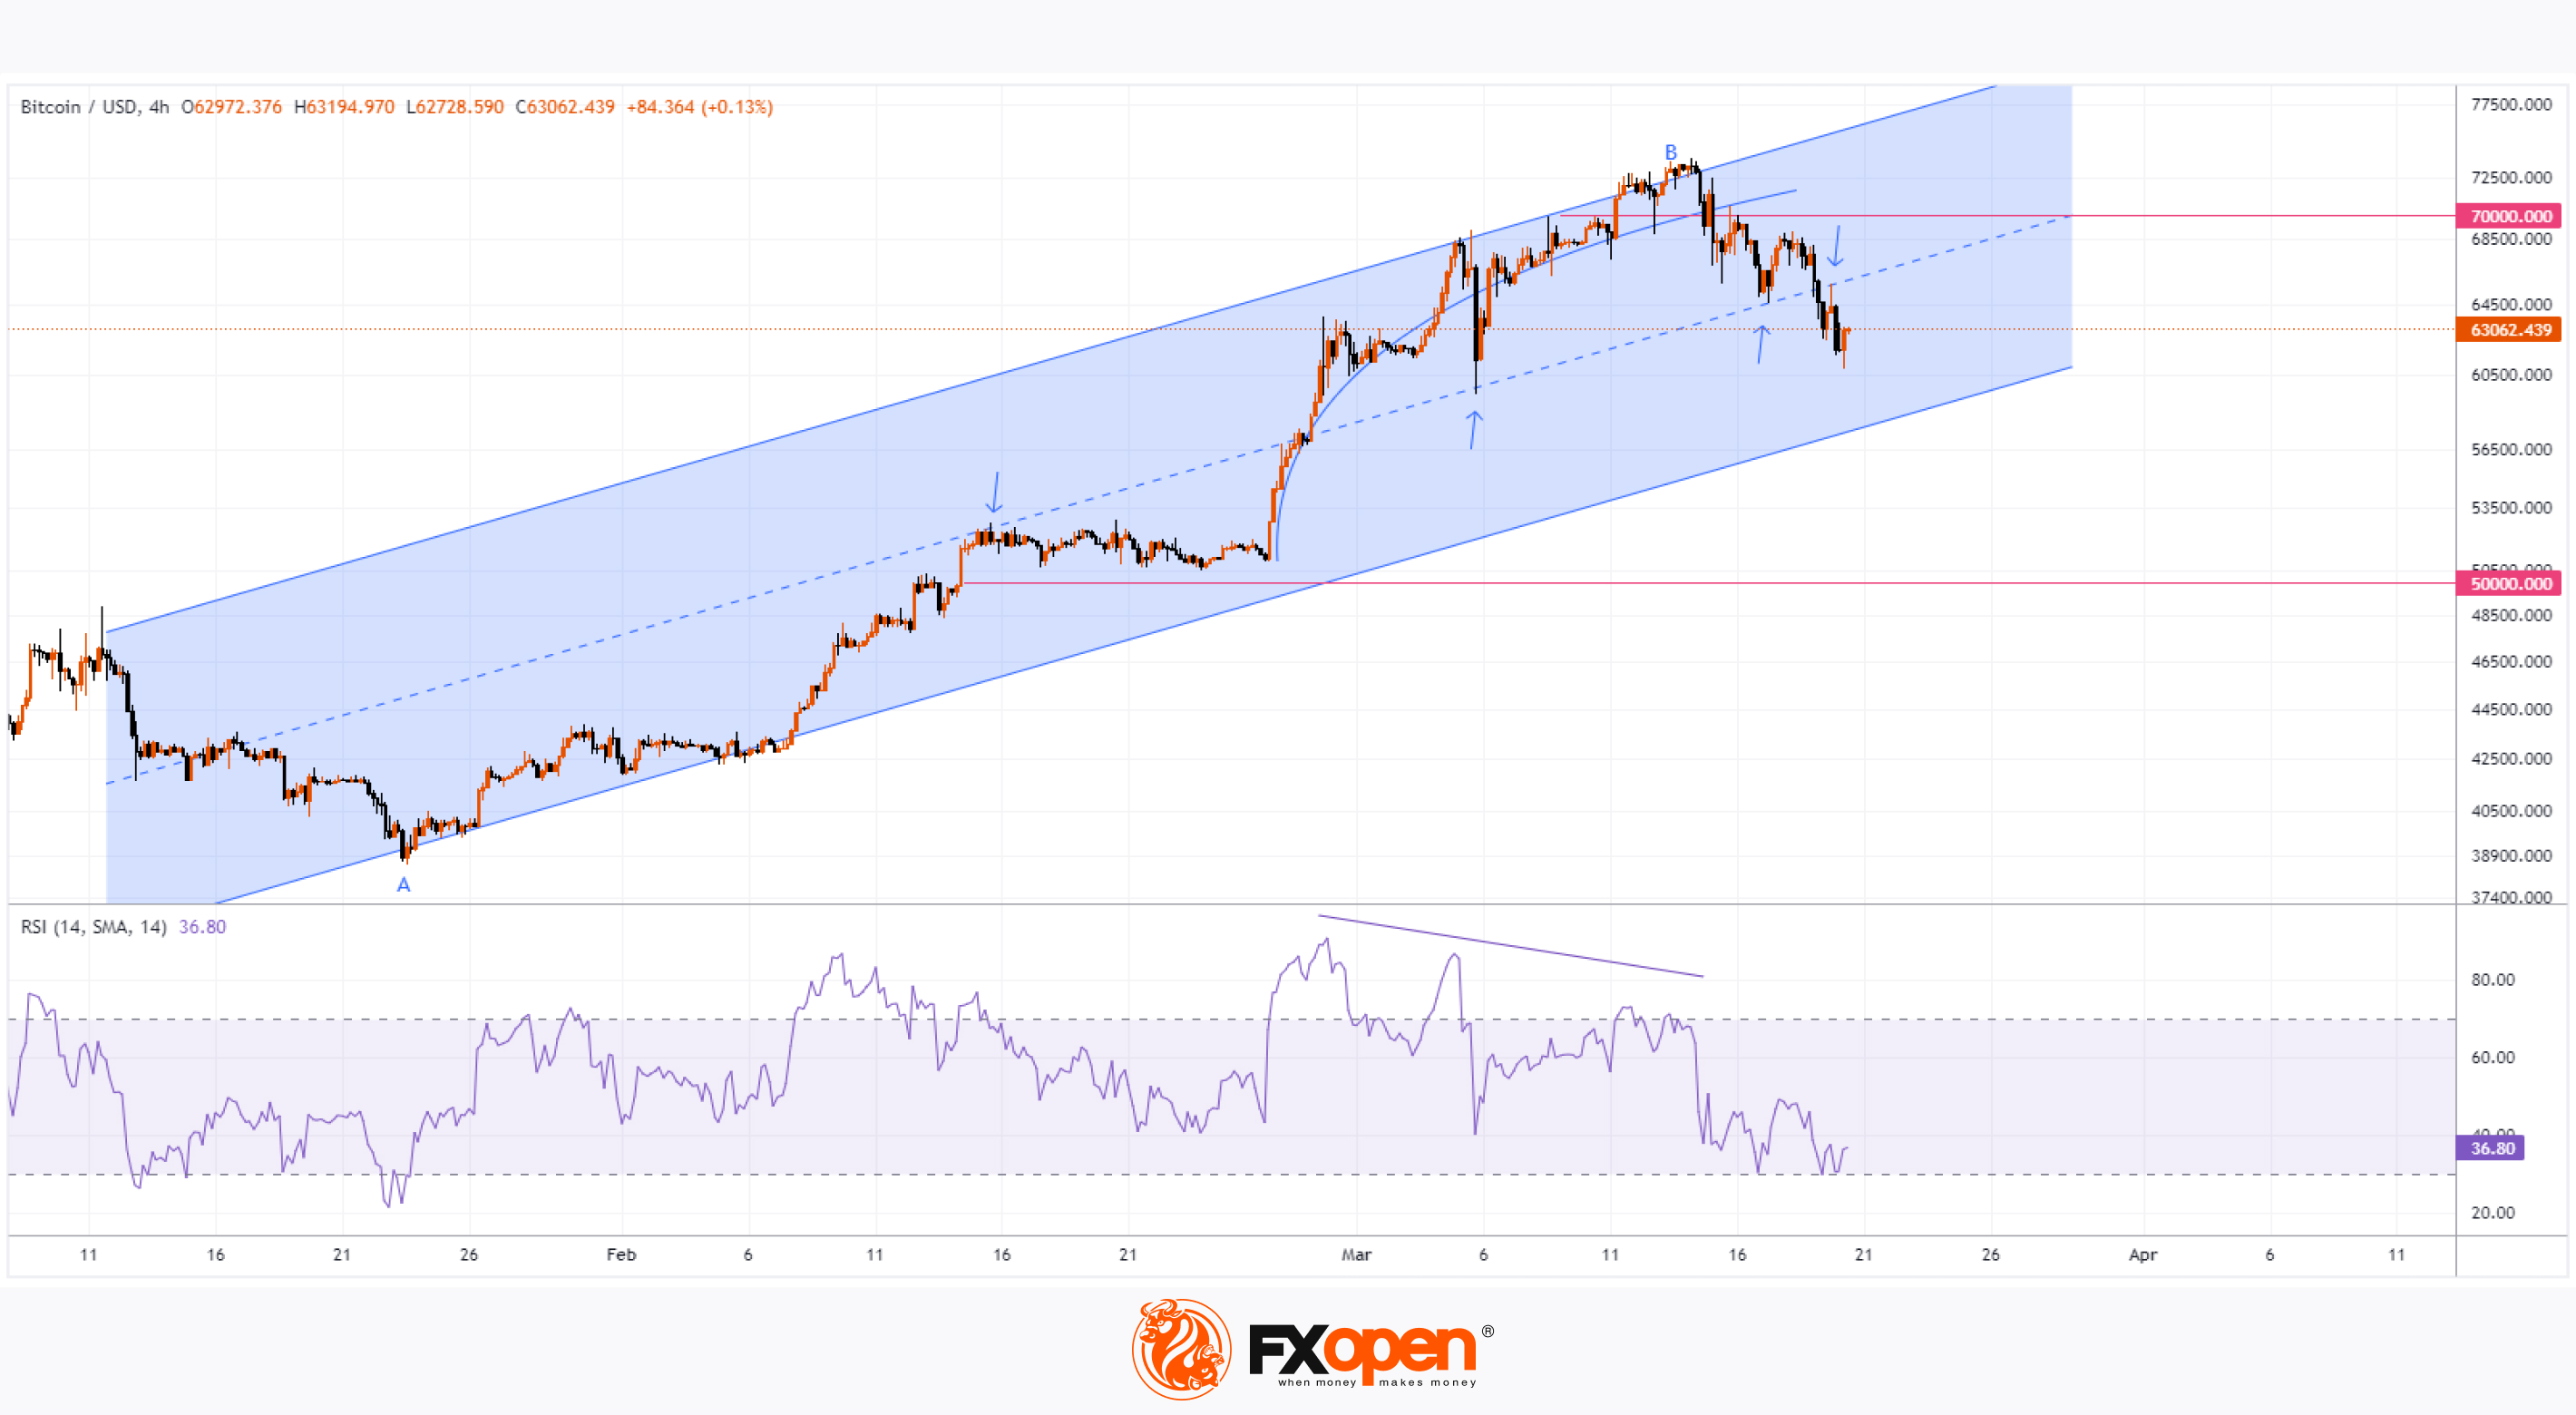
👍3