
#marketanalysis #MarketNews #inflation
News about US Inflation Shake Markets
According to data published yesterday:
→ Core CPI: actual = 0.4%, expected = 0.3%, past values = 0.3%
→ CPI: actual = 0.3%, expected = 0.2%, past values = 0.3%
Thus, the statistics dealt a blow to the hopes of market participants that inflation in the United States is fading and the Fed will lower interest rates. The figures suggest that tight monetary policy will remain tight for longer.
The market reaction was a sharp rise in the price of the US dollar - accordingly, many exchange assets denominated in USD fell in price:
→ the EUR/USD rate fell by approximately 0.5%, setting a minimum for the year;
→ the price of E-mini futures for the S&P-500 index decreased by approximately 1.5%;
→ the price of E-mini futures for the Nasdaq-100 index decreased by approximately 2.0%;
→ the price of gold XAU/USD decreased by approximately 1.8%;
→ the price of bitcoins BTC/USD decreased by more than 3%, but this morning the cryptocurrencies have already managed to recover, thus winning back yesterday’s dump.
Also resistant to news about inflation in the United States was the price of oil XBR/USD, which is rising against the backdrop of a tense geopolitical situation.
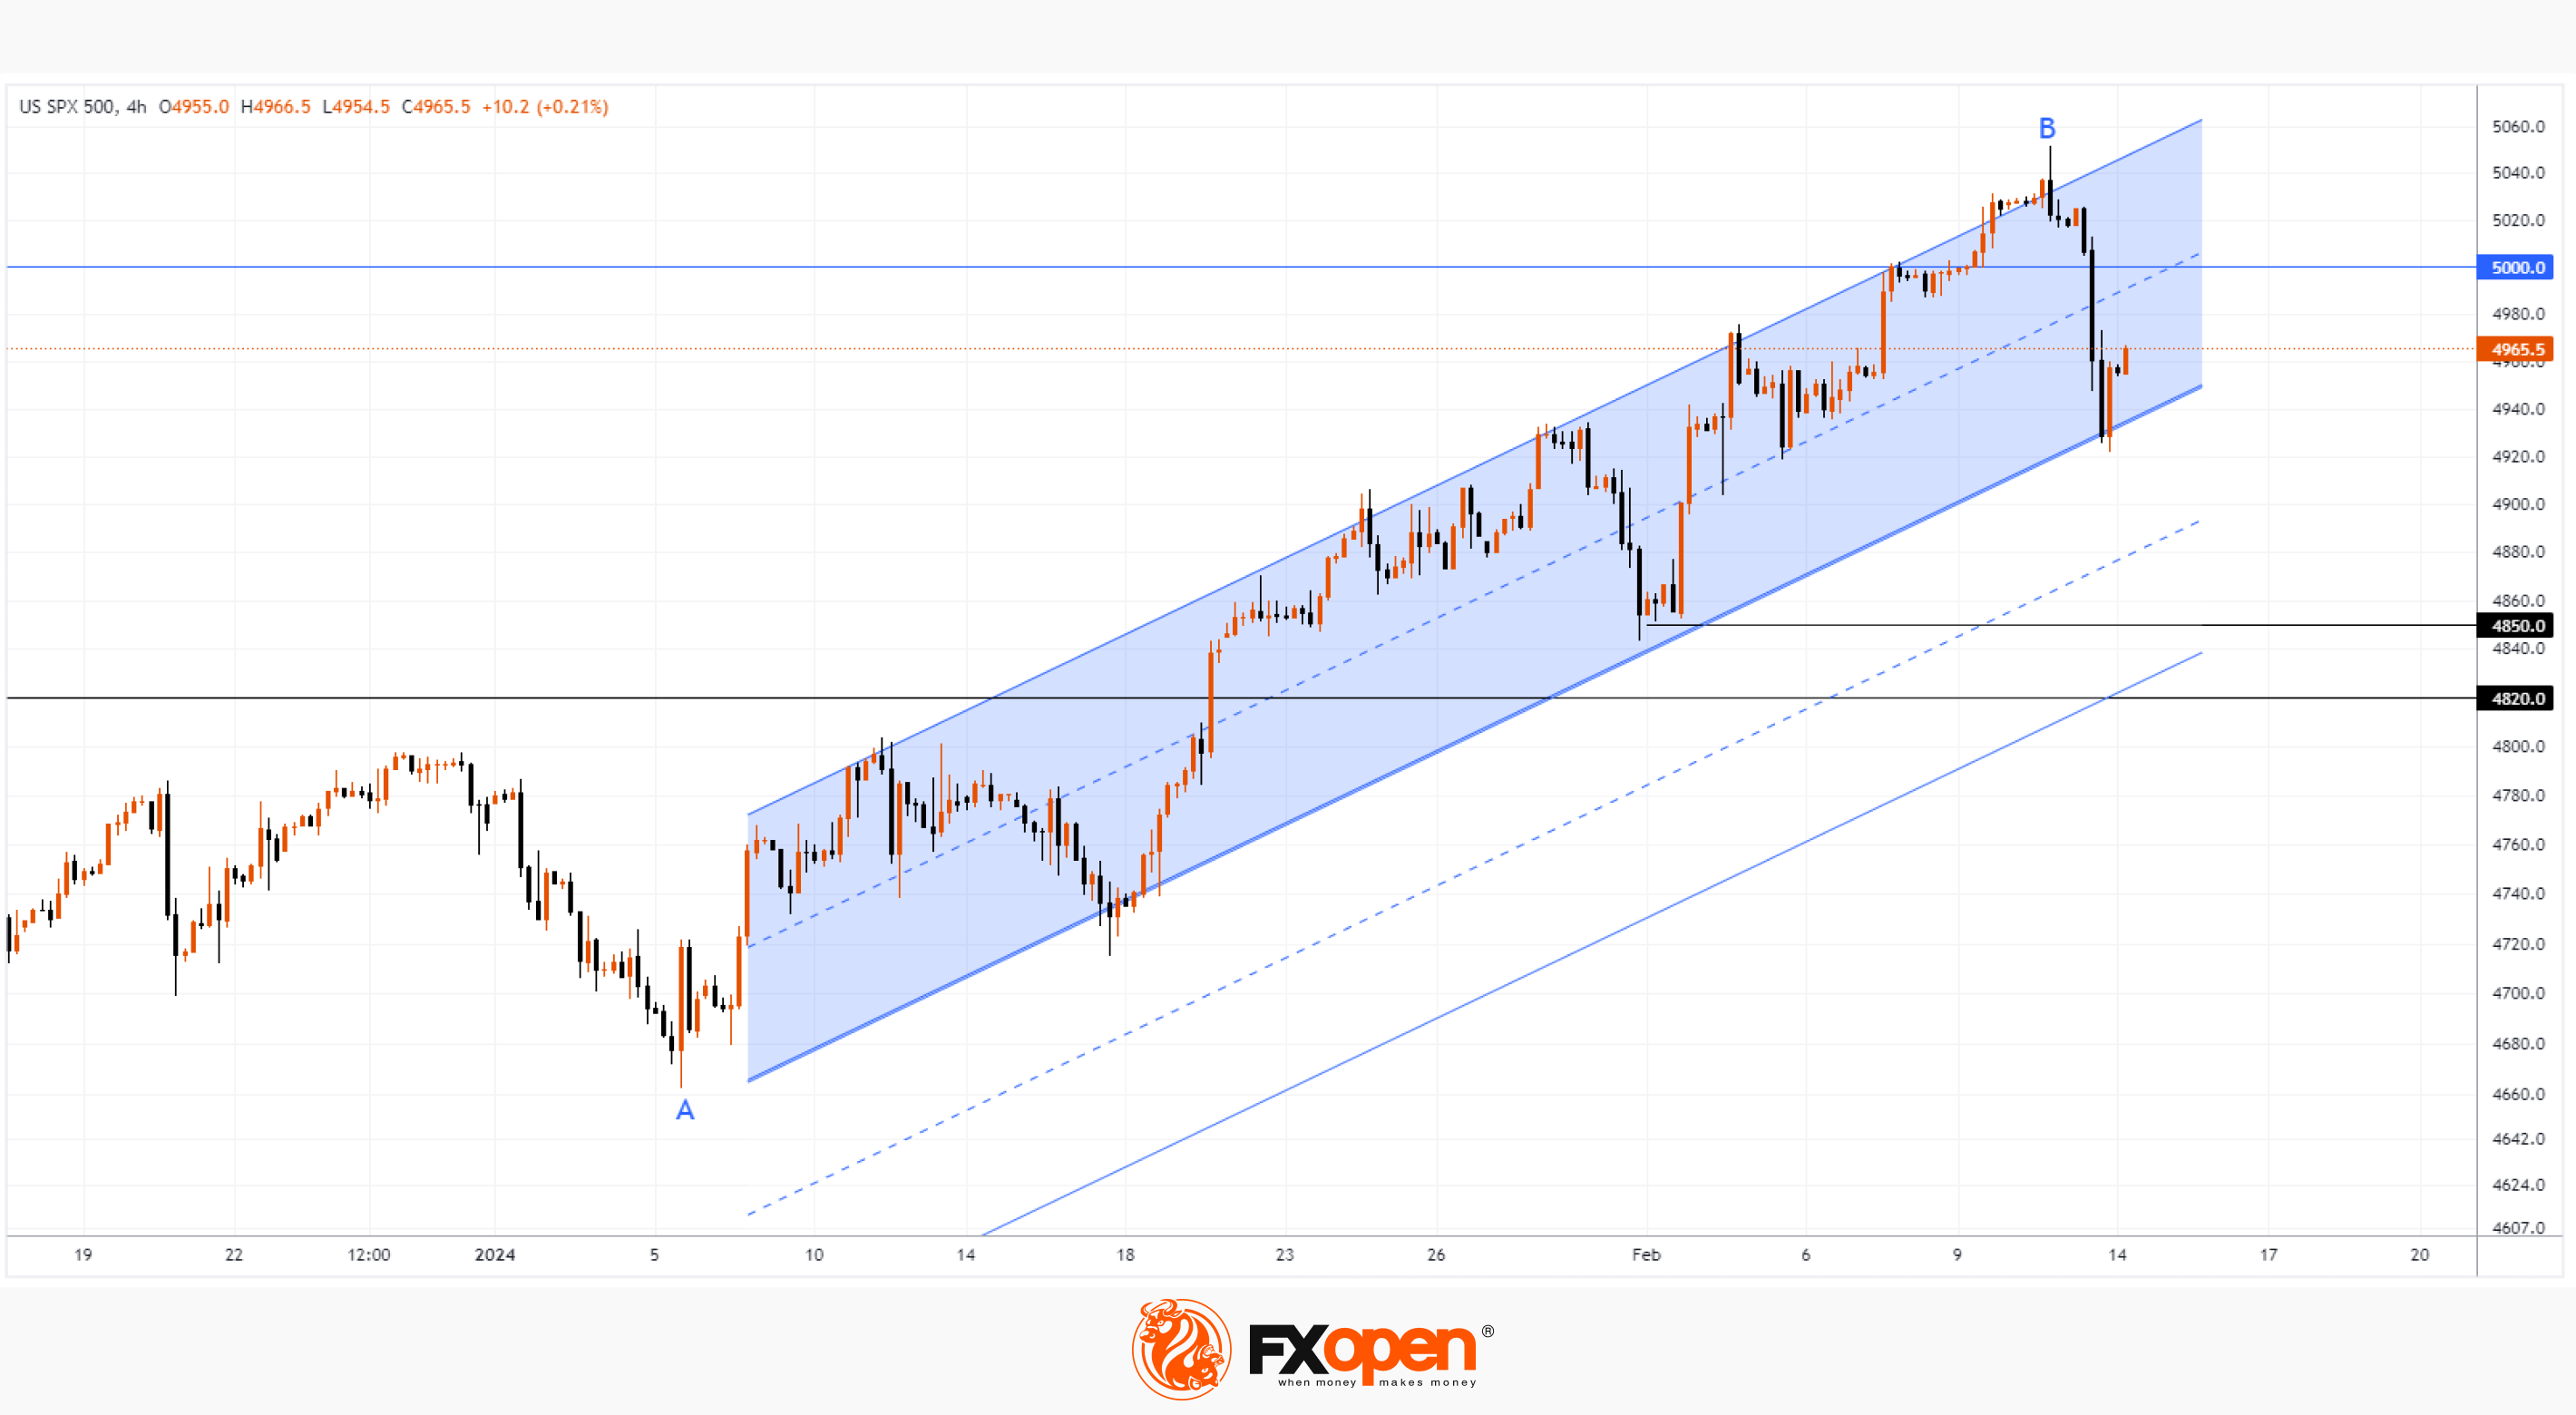
Although stock index charts show that the bullish trend remains in force. But for how long? According to technical analysis of the S&P-500 index chart:
→ the price is within the ascending channel (shown in blue);
→ the price found support near its lower border;
→ the psychological level of 5000 points may turn out to be resistance if the price tries to recover from the lower border of the channel. Note that around the 5000 mark there is a level of 50% of the decrease in B→C.
The S&P-500 index can be supported by:
→ lower boundary of the parallel channel;
→ level 4820, which previously served as resistance, but was powerfully broken by the bulls on January 19;
→ level 4850, which approximately coincides with the level of the 50% retracement of the A→B impulse.
Trade global index CFDs with zero commission and tight spreads. Open your FXOpen account now or learn more about trading index CFDs with FXOpen.
CFDs are complex instruments and come with a high risk of losing your money.
This article represents the opinion of the Companies operating under the FXOpen brand only. It is not to be construed as an offer, solicitation, or recommendation with respect to products and services provided by the Companies operating under the FXOpen brand, nor is it to be considered financial advice.
News about US Inflation Shake Markets
According to data published yesterday:
→ Core CPI: actual = 0.4%, expected = 0.3%, past values = 0.3%
→ CPI: actual = 0.3%, expected = 0.2%, past values = 0.3%
Thus, the statistics dealt a blow to the hopes of market participants that inflation in the United States is fading and the Fed will lower interest rates. The figures suggest that tight monetary policy will remain tight for longer.
The market reaction was a sharp rise in the price of the US dollar - accordingly, many exchange assets denominated in USD fell in price:
→ the EUR/USD rate fell by approximately 0.5%, setting a minimum for the year;
→ the price of E-mini futures for the S&P-500 index decreased by approximately 1.5%;
→ the price of E-mini futures for the Nasdaq-100 index decreased by approximately 2.0%;
→ the price of gold XAU/USD decreased by approximately 1.8%;
→ the price of bitcoins BTC/USD decreased by more than 3%, but this morning the cryptocurrencies have already managed to recover, thus winning back yesterday’s dump.
Also resistant to news about inflation in the United States was the price of oil XBR/USD, which is rising against the backdrop of a tense geopolitical situation.
Although stock index charts show that the bullish trend remains in force. But for how long? According to technical analysis of the S&P-500 index chart:
→ the price is within the ascending channel (shown in blue);
→ the price found support near its lower border;
→ the psychological level of 5000 points may turn out to be resistance if the price tries to recover from the lower border of the channel. Note that around the 5000 mark there is a level of 50% of the decrease in B→C.
The S&P-500 index can be supported by:
→ lower boundary of the parallel channel;
→ level 4820, which previously served as resistance, but was powerfully broken by the bulls on January 19;
→ level 4850, which approximately coincides with the level of the 50% retracement of the A→B impulse.
Trade global index CFDs with zero commission and tight spreads. Open your FXOpen account now or learn more about trading index CFDs with FXOpen.
CFDs are complex instruments and come with a high risk of losing your money.
This article represents the opinion of the Companies operating under the FXOpen brand only. It is not to be construed as an offer, solicitation, or recommendation with respect to products and services provided by the Companies operating under the FXOpen brand, nor is it to be considered financial advice.
👍2
#marketanalysis #MarketNews #tradingforex #GBPUSD
GBP/USD Price Declining after Encouraging UK Inflation Data Release
After yesterday's disappointing US inflation data, market participants were wary of UK inflation data. But they turned out to be more favorable.
→ Core CPI: actual = 5.1%, expected = 5.2%, past values = 5.1%
→ CPI: actual = 4.0%, expected = 4.1%, past values = 4.0%
Although in absolute comparison the inflation rate in the UK is significantly higher than in the USA, it is encouraging that over the month it shows a downward trend.
This eases pressure on the Bank of England in its tight monetary policy, and therefore the British pound fell in value against other currencies. In particular, the decline against the USD that began yesterday continued. Since yesterday's high, the price of GBP/USD has already decreased by approximately 1%.
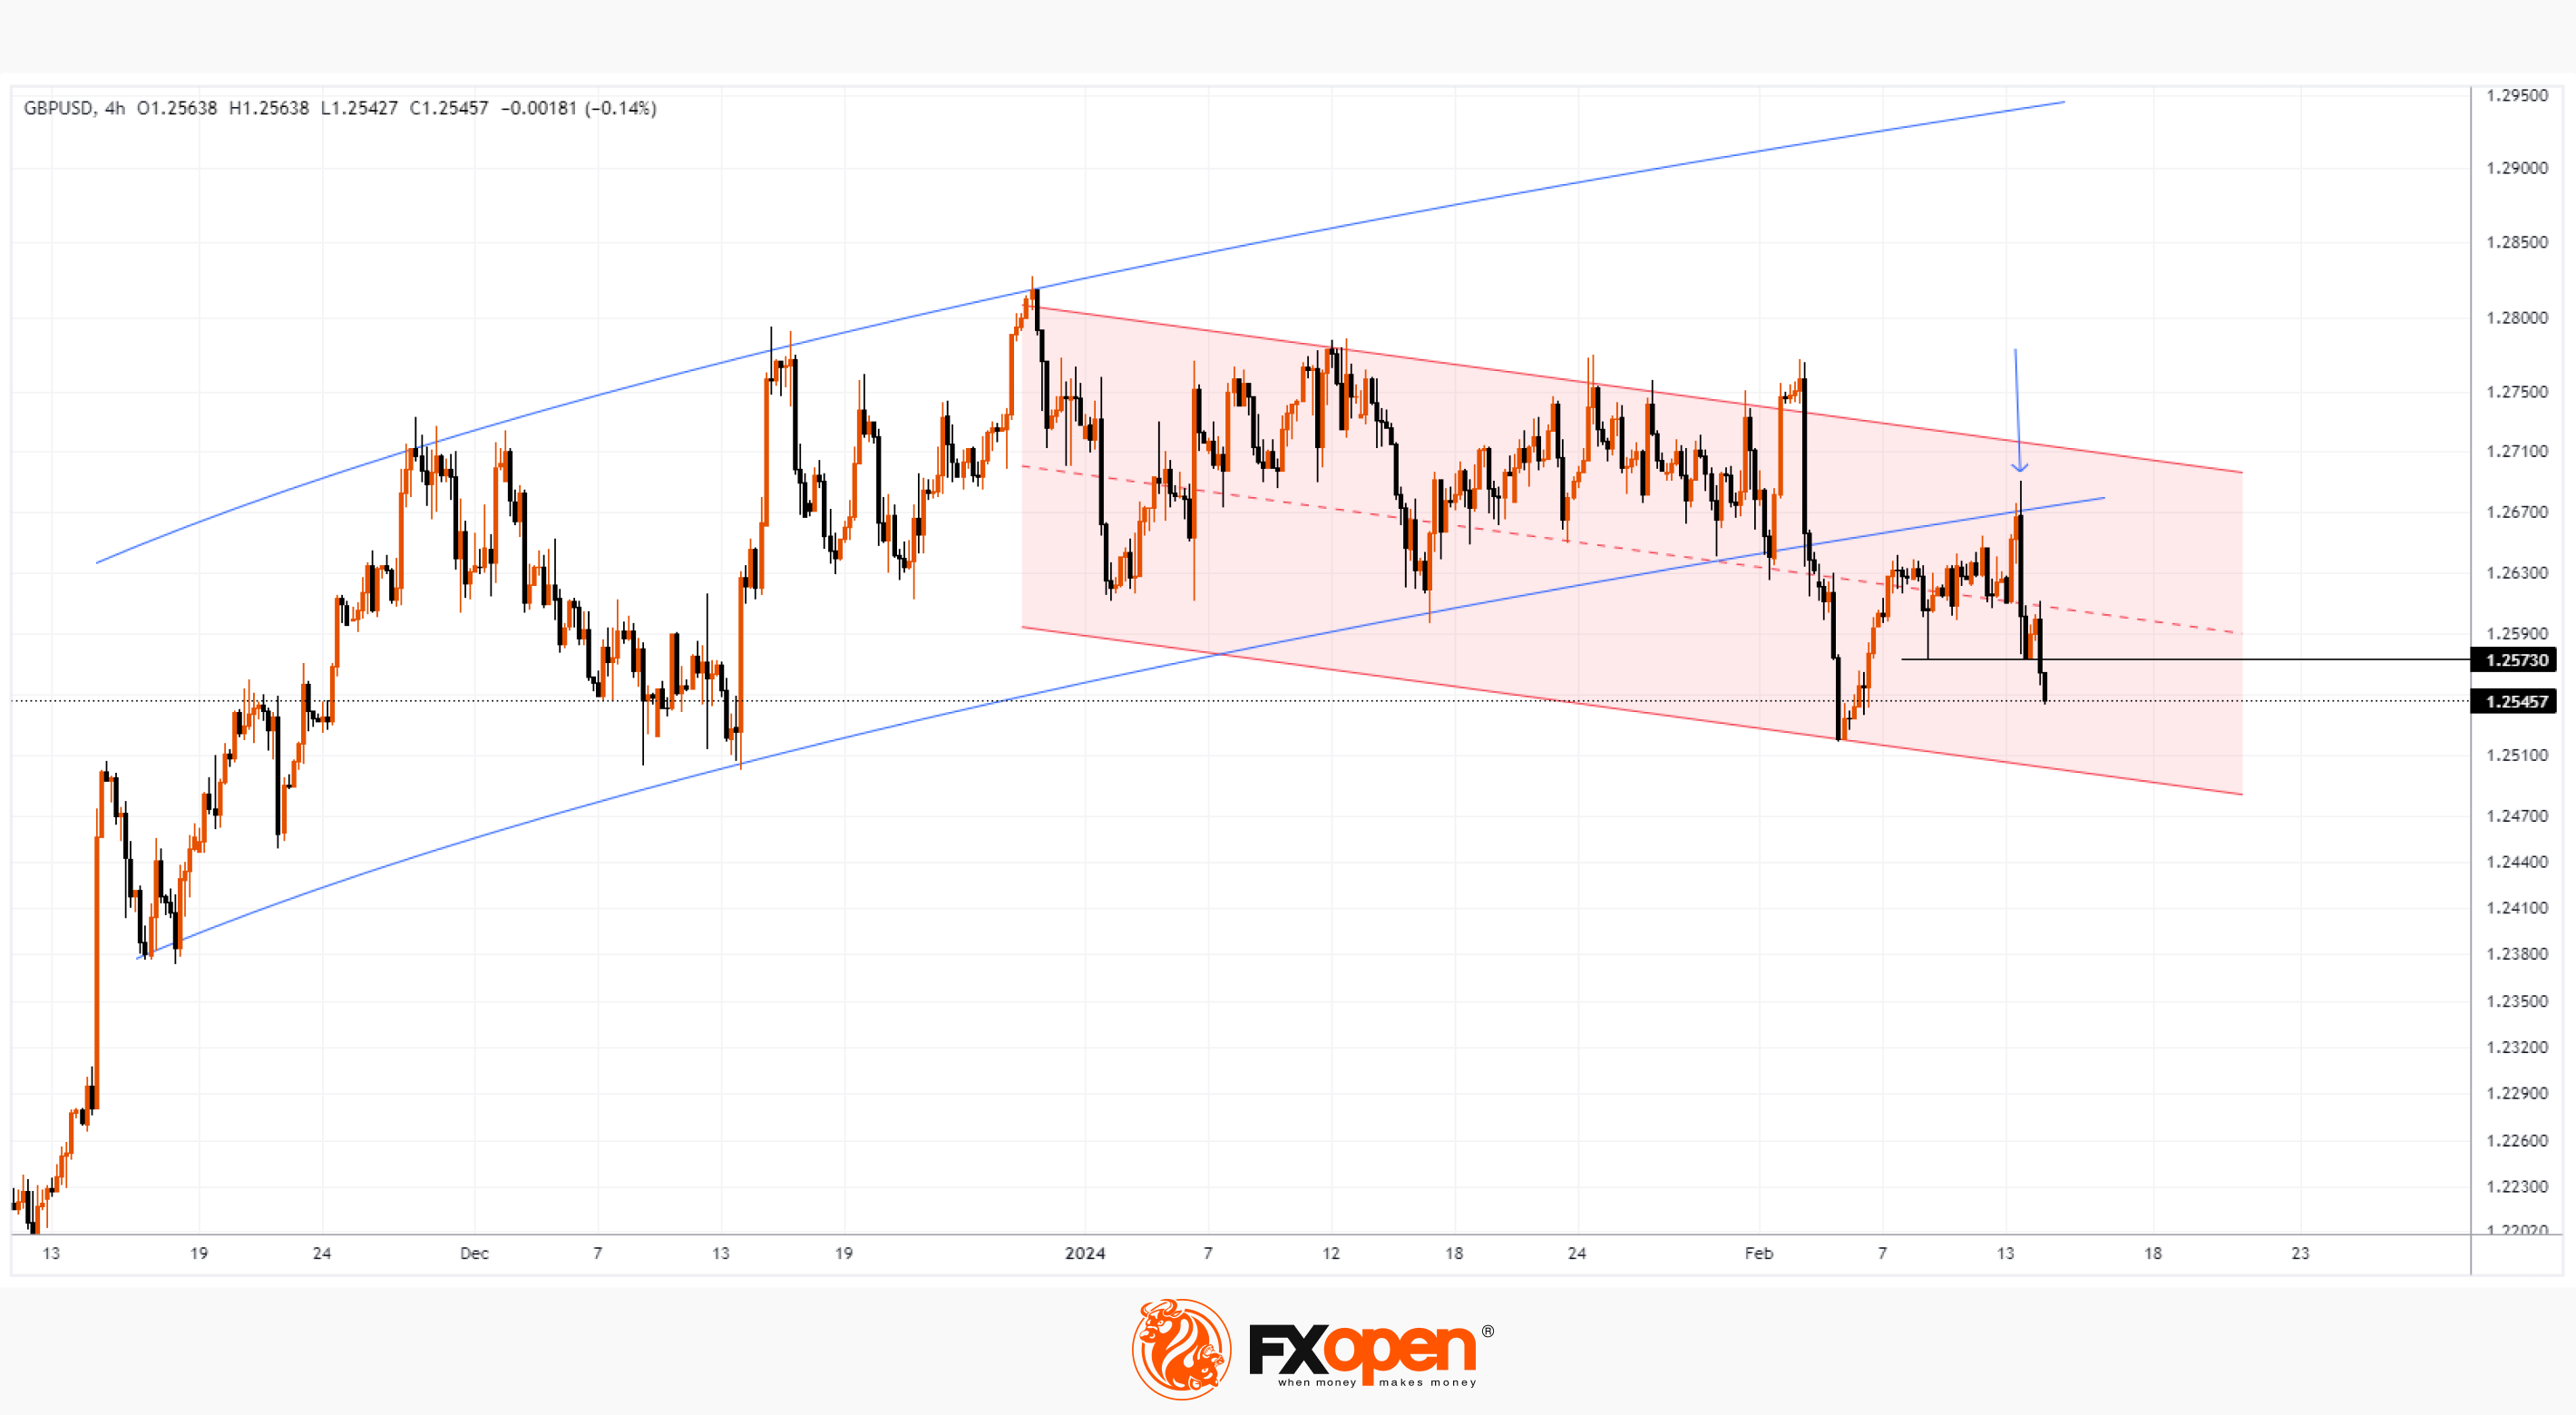
The GBP/USD chart shows that:
→ the bears have broken the upward trajectory indicated by the blue lines;
→ the price develops within the descending channel (shown in red);
→ the price dropped below the level of 1.25730, which served as support since February 8.
If the trend continues, the GBP/USD price could drop to the lower boundary of the red channel, thereby setting the 2024 low.
The following can add confidence to bears:
→ a long upper shadow was formed on yesterday’s candle (at the same time a test of the blue line occurred, as shown by the arrow);
→ based on the technical analysis of GBP/USD, it is acceptable to assume that the median line of the red channel will act as resistance.
Trade over 50 forex markets 24 hours a day with FXOpen. Take advantage of low commissions, deep liquidity, and spreads from 0.0 pips. Open your FXOpen account now or learn more about trading forex with FXOpen.
CFDs are complex instruments and come with a high risk of losing your money.
This article represents the opinion of the Companies operating under the FXOpen brand only. It is not to be construed as an offer, solicitation, or recommendation with respect to products and services provided by the Companies operating under the FXOpen brand, nor is it to be considered financial advice.
GBP/USD Price Declining after Encouraging UK Inflation Data Release
After yesterday's disappointing US inflation data, market participants were wary of UK inflation data. But they turned out to be more favorable.
→ Core CPI: actual = 5.1%, expected = 5.2%, past values = 5.1%
→ CPI: actual = 4.0%, expected = 4.1%, past values = 4.0%
Although in absolute comparison the inflation rate in the UK is significantly higher than in the USA, it is encouraging that over the month it shows a downward trend.
This eases pressure on the Bank of England in its tight monetary policy, and therefore the British pound fell in value against other currencies. In particular, the decline against the USD that began yesterday continued. Since yesterday's high, the price of GBP/USD has already decreased by approximately 1%.
The GBP/USD chart shows that:
→ the bears have broken the upward trajectory indicated by the blue lines;
→ the price develops within the descending channel (shown in red);
→ the price dropped below the level of 1.25730, which served as support since February 8.
If the trend continues, the GBP/USD price could drop to the lower boundary of the red channel, thereby setting the 2024 low.
The following can add confidence to bears:
→ a long upper shadow was formed on yesterday’s candle (at the same time a test of the blue line occurred, as shown by the arrow);
→ based on the technical analysis of GBP/USD, it is acceptable to assume that the median line of the red channel will act as resistance.
Trade over 50 forex markets 24 hours a day with FXOpen. Take advantage of low commissions, deep liquidity, and spreads from 0.0 pips. Open your FXOpen account now or learn more about trading forex with FXOpen.
CFDs are complex instruments and come with a high risk of losing your money.
This article represents the opinion of the Companies operating under the FXOpen brand only. It is not to be construed as an offer, solicitation, or recommendation with respect to products and services provided by the Companies operating under the FXOpen brand, nor is it to be considered financial advice.
👍3
#marketanalysis #MarketNews #tradingforex
AUD/USD Price Reaction to Labour Market News Provides Important Information for Analysis
Australia's unemployment rate rose to a two-year high of 4.1% in January, while employment was little changed although analysts had expected around 25,000 new jobs, data released this morning showed.
It is believed that weak labour market data should prompt central bank officials to ease monetary policy, which is currently aimed at fighting inflation. According to Trading Economics, the Reserve Bank of Australia is expected to cut interest rates by about 40 basis points this year.
The first reaction to the news was the weakening of the Australian dollar (counting on the easing of the Central Bank's policy), but by the opening of the European session, the price of AUD/USD had recovered a significant part of the decline, which provides important food for thought.
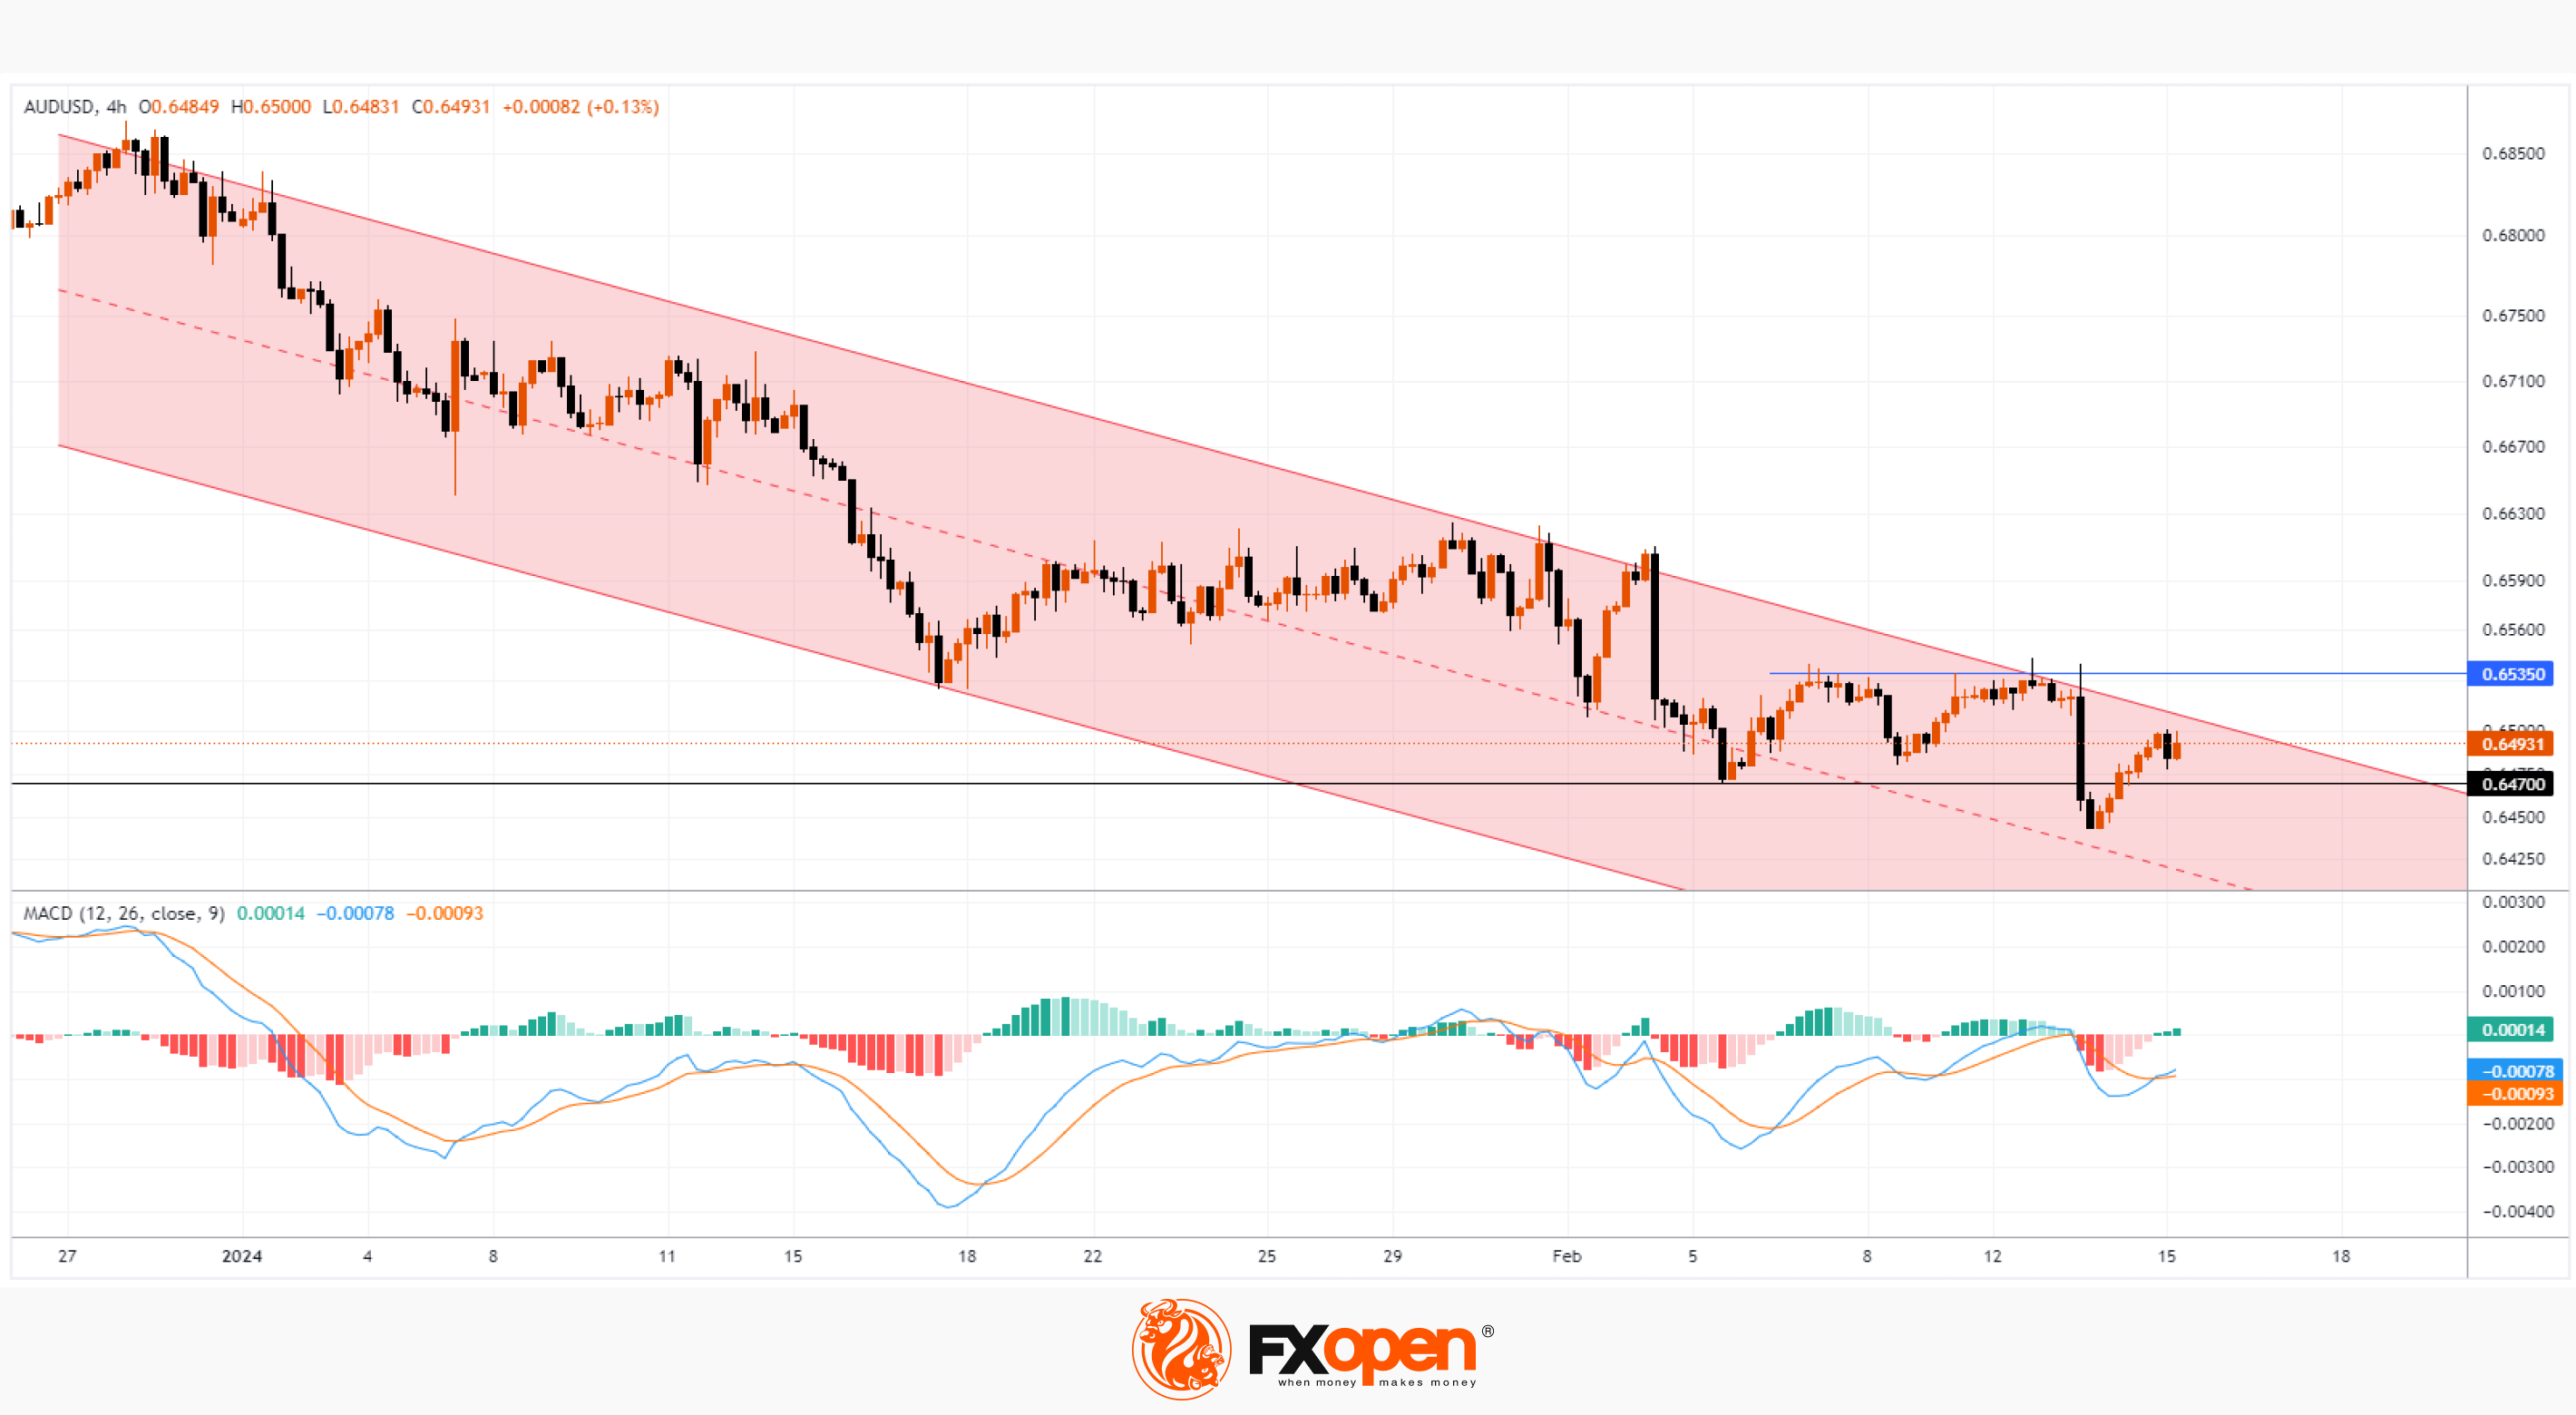
The AUD/USD chart shows that the price is within a downward trend (shown by the red channel), however, there are a number of signs that the bearish pressure has exhausted. The fact that the AUD/USD price is showing some recovery after the initial negative reaction to the unemployment news is one such sign.
It should also be noted that:
→ the median line of the descending channel now acts as support;
→ MACD moved into the green zone;
→ the price was unable to consolidate below the level of 0.647.
This means that if we regard the fundamental background as bearish, then the price shows stability through its action, which can be regarded as a manifestation of the forces of demand. Therefore, it is possible that the bulls will try to break through the upper limit of the current downward channel. If this happens, the price may face resistance at 0.65350.
Trade over 50 forex markets 24 hours a day with FXOpen. Take advantage of low commissions, deep liquidity, and spreads from 0.0 pips. Open your FXOpen account now or learn more about trading forex with FXOpen.
CFDs are complex instruments and come with a high risk of losing your money.
This article represents the opinion of the Companies operating under the FXOpen brand only. It is not to be construed as an offer, solicitation, or recommendation with respect to products and services provided by the Companies operating under the FXOpen brand, nor is it to be considered financial advice.
AUD/USD Price Reaction to Labour Market News Provides Important Information for Analysis
Australia's unemployment rate rose to a two-year high of 4.1% in January, while employment was little changed although analysts had expected around 25,000 new jobs, data released this morning showed.
It is believed that weak labour market data should prompt central bank officials to ease monetary policy, which is currently aimed at fighting inflation. According to Trading Economics, the Reserve Bank of Australia is expected to cut interest rates by about 40 basis points this year.
The first reaction to the news was the weakening of the Australian dollar (counting on the easing of the Central Bank's policy), but by the opening of the European session, the price of AUD/USD had recovered a significant part of the decline, which provides important food for thought.
The AUD/USD chart shows that the price is within a downward trend (shown by the red channel), however, there are a number of signs that the bearish pressure has exhausted. The fact that the AUD/USD price is showing some recovery after the initial negative reaction to the unemployment news is one such sign.
It should also be noted that:
→ the median line of the descending channel now acts as support;
→ MACD moved into the green zone;
→ the price was unable to consolidate below the level of 0.647.
This means that if we regard the fundamental background as bearish, then the price shows stability through its action, which can be regarded as a manifestation of the forces of demand. Therefore, it is possible that the bulls will try to break through the upper limit of the current downward channel. If this happens, the price may face resistance at 0.65350.
Trade over 50 forex markets 24 hours a day with FXOpen. Take advantage of low commissions, deep liquidity, and spreads from 0.0 pips. Open your FXOpen account now or learn more about trading forex with FXOpen.
CFDs are complex instruments and come with a high risk of losing your money.
This article represents the opinion of the Companies operating under the FXOpen brand only. It is not to be construed as an offer, solicitation, or recommendation with respect to products and services provided by the Companies operating under the FXOpen brand, nor is it to be considered financial advice.
👍2
#marketanalysis #MarketNews #crypto
Ethereum Price Exceeds $2,800
The last time the ETH/USD price was at this level was in May 2022, which was the start of a massive drop of more than 65% in 1.5 months.
However, now the ETH/USD market is dominated by bullish sentiment, for the following reasons:
→ deployment of the Dencun update on the Ethereum network this month, which will open up new opportunities for users and developers;
→ expectations that this year, following the approval of Bitcoin ETFs, applications for the launch of ETFs on Ethereum will be approved;
→ waiting for a traditional bull market after halving in the Bitcoin network.
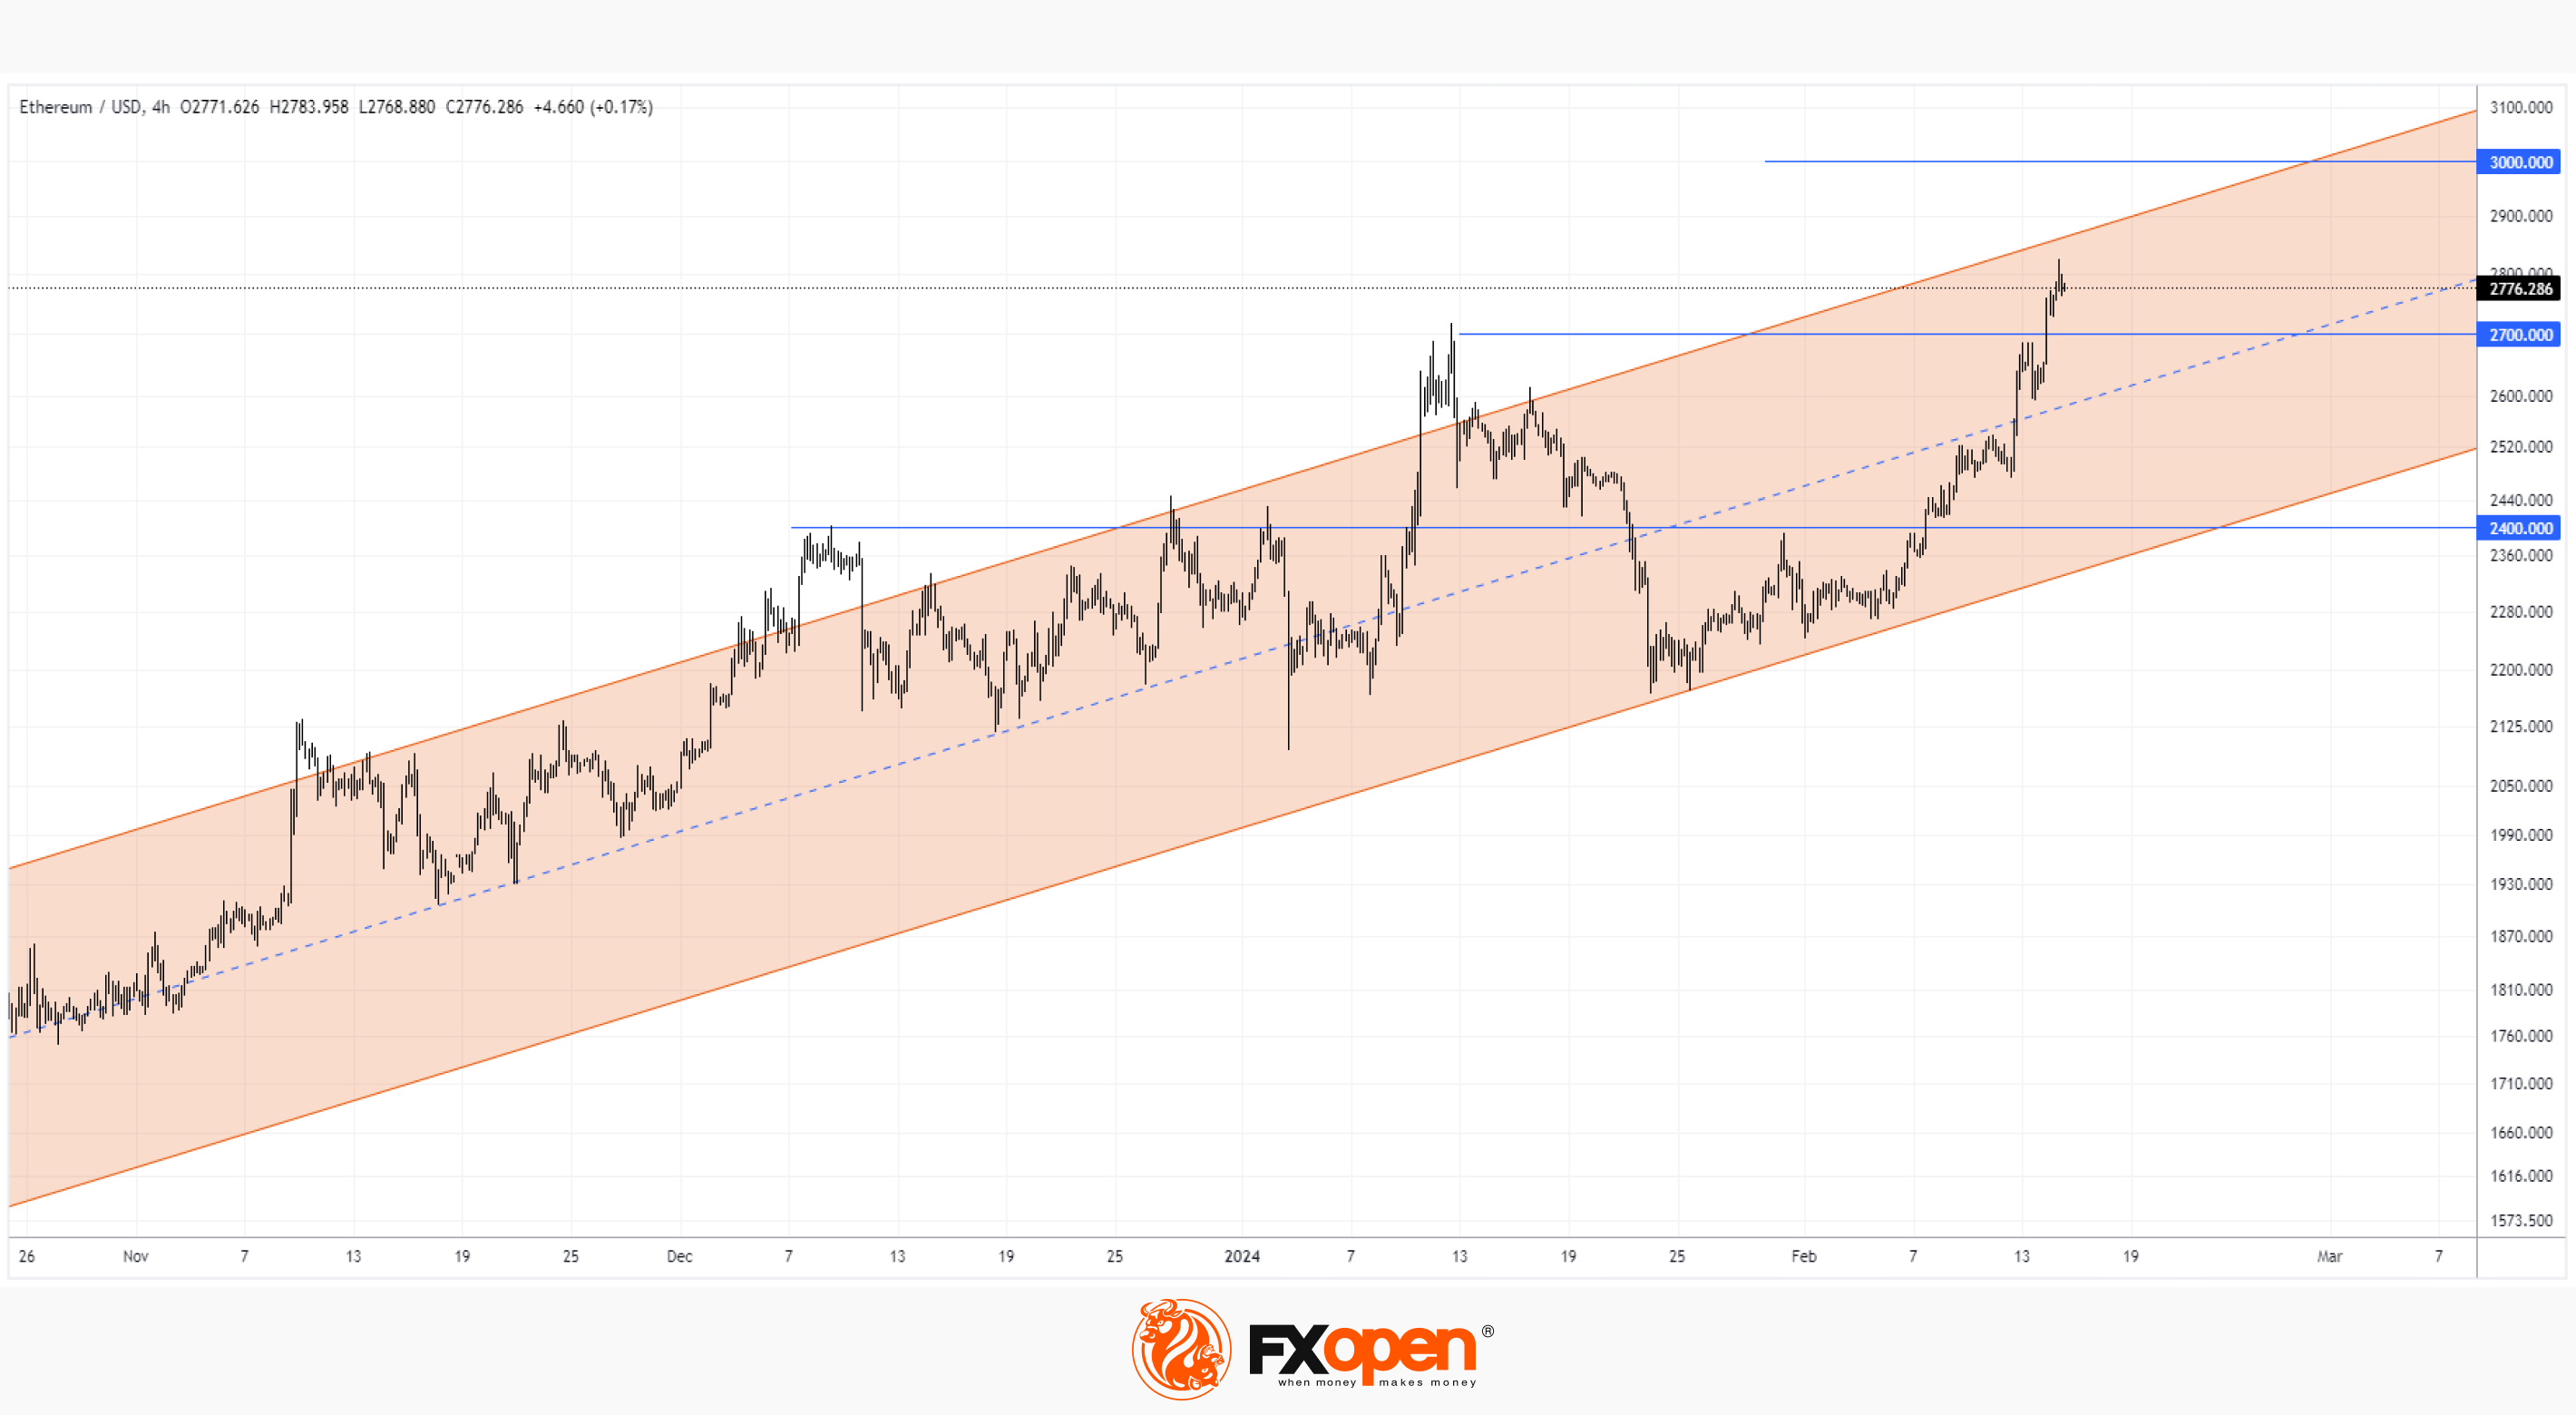
So far, the ETH/USD chart shows that the price of Ethereum is moving within an ascending channel that begins in 2023. Moreover, the price is in its upper half — an indication of the strength of demand. If the trend continues, the price of Ethereum could reach $3,000 within a month.
At the same time, the price of Ethereum is approaching the upper border of the channel, which may provide resistance. It is possible that the indicators will indicate that the market is overbought, creating the preconditions for the formation of a correction.
Probable support levels can help the bulls in a scenario where a correction develops:
→ 2,400: this level influenced the price of ETH starting in December 2023;
→ 2,700: former 2024 high, which was broken on a wide bullish candle (a sign of strong demand);
→ median line and lower boundary of the current channel.
FXOpen offers the world's most popular cryptocurrency CFDs*, including Bitcoin and Ethereum. Floating spreads, 1:2 leverage — at your service. Open your trading account now or learn more about crypto CFD trading with FXOpen.
*At FXOpen UK and FXOpen AU, Cryptocurrency CFDs are only available for trading by those clients categorised as Professional clients under FCA Rules and Professional clients under ASIC Rules respectively. They are not available for trading by Retail clients.
CFDs are complex instruments and come with a high risk of losing your money.
This article represents the opinion of the Companies operating under the FXOpen brand only. It is not to be construed as an offer, solicitation, or recommendation with respect to products and services provided by the Companies operating under the FXOpen brand, nor is it to be considered financial advice.
Ethereum Price Exceeds $2,800
The last time the ETH/USD price was at this level was in May 2022, which was the start of a massive drop of more than 65% in 1.5 months.
However, now the ETH/USD market is dominated by bullish sentiment, for the following reasons:
→ deployment of the Dencun update on the Ethereum network this month, which will open up new opportunities for users and developers;
→ expectations that this year, following the approval of Bitcoin ETFs, applications for the launch of ETFs on Ethereum will be approved;
→ waiting for a traditional bull market after halving in the Bitcoin network.
So far, the ETH/USD chart shows that the price of Ethereum is moving within an ascending channel that begins in 2023. Moreover, the price is in its upper half — an indication of the strength of demand. If the trend continues, the price of Ethereum could reach $3,000 within a month.
At the same time, the price of Ethereum is approaching the upper border of the channel, which may provide resistance. It is possible that the indicators will indicate that the market is overbought, creating the preconditions for the formation of a correction.
Probable support levels can help the bulls in a scenario where a correction develops:
→ 2,400: this level influenced the price of ETH starting in December 2023;
→ 2,700: former 2024 high, which was broken on a wide bullish candle (a sign of strong demand);
→ median line and lower boundary of the current channel.
FXOpen offers the world's most popular cryptocurrency CFDs*, including Bitcoin and Ethereum. Floating spreads, 1:2 leverage — at your service. Open your trading account now or learn more about crypto CFD trading with FXOpen.
*At FXOpen UK and FXOpen AU, Cryptocurrency CFDs are only available for trading by those clients categorised as Professional clients under FCA Rules and Professional clients under ASIC Rules respectively. They are not available for trading by Retail clients.
CFDs are complex instruments and come with a high risk of losing your money.
This article represents the opinion of the Companies operating under the FXOpen brand only. It is not to be construed as an offer, solicitation, or recommendation with respect to products and services provided by the Companies operating under the FXOpen brand, nor is it to be considered financial advice.
👍2
#marketanalysis #MarketNews #goldprice #XAUUSD
Gold Price Recovers from Year Lows
On Wednesday, the gold price XAU/USD set a year low due to news about inflation in the US, which “does not want” to decline to target levels.
As a result, market participants are revising their estimates regarding the price of gold with the prospect that the Fed's tight policy may last for a longer time, as well as taking into account yesterday's news:
→ Retail Core Sales in the US fell by 0.6%, although an increase of +0.2% was expected, a month ago = +0.4%.
→ the number of unemployment applications for the week remains relatively stable: actual = 212k, a week ago = 218k, a month ago = 202k.
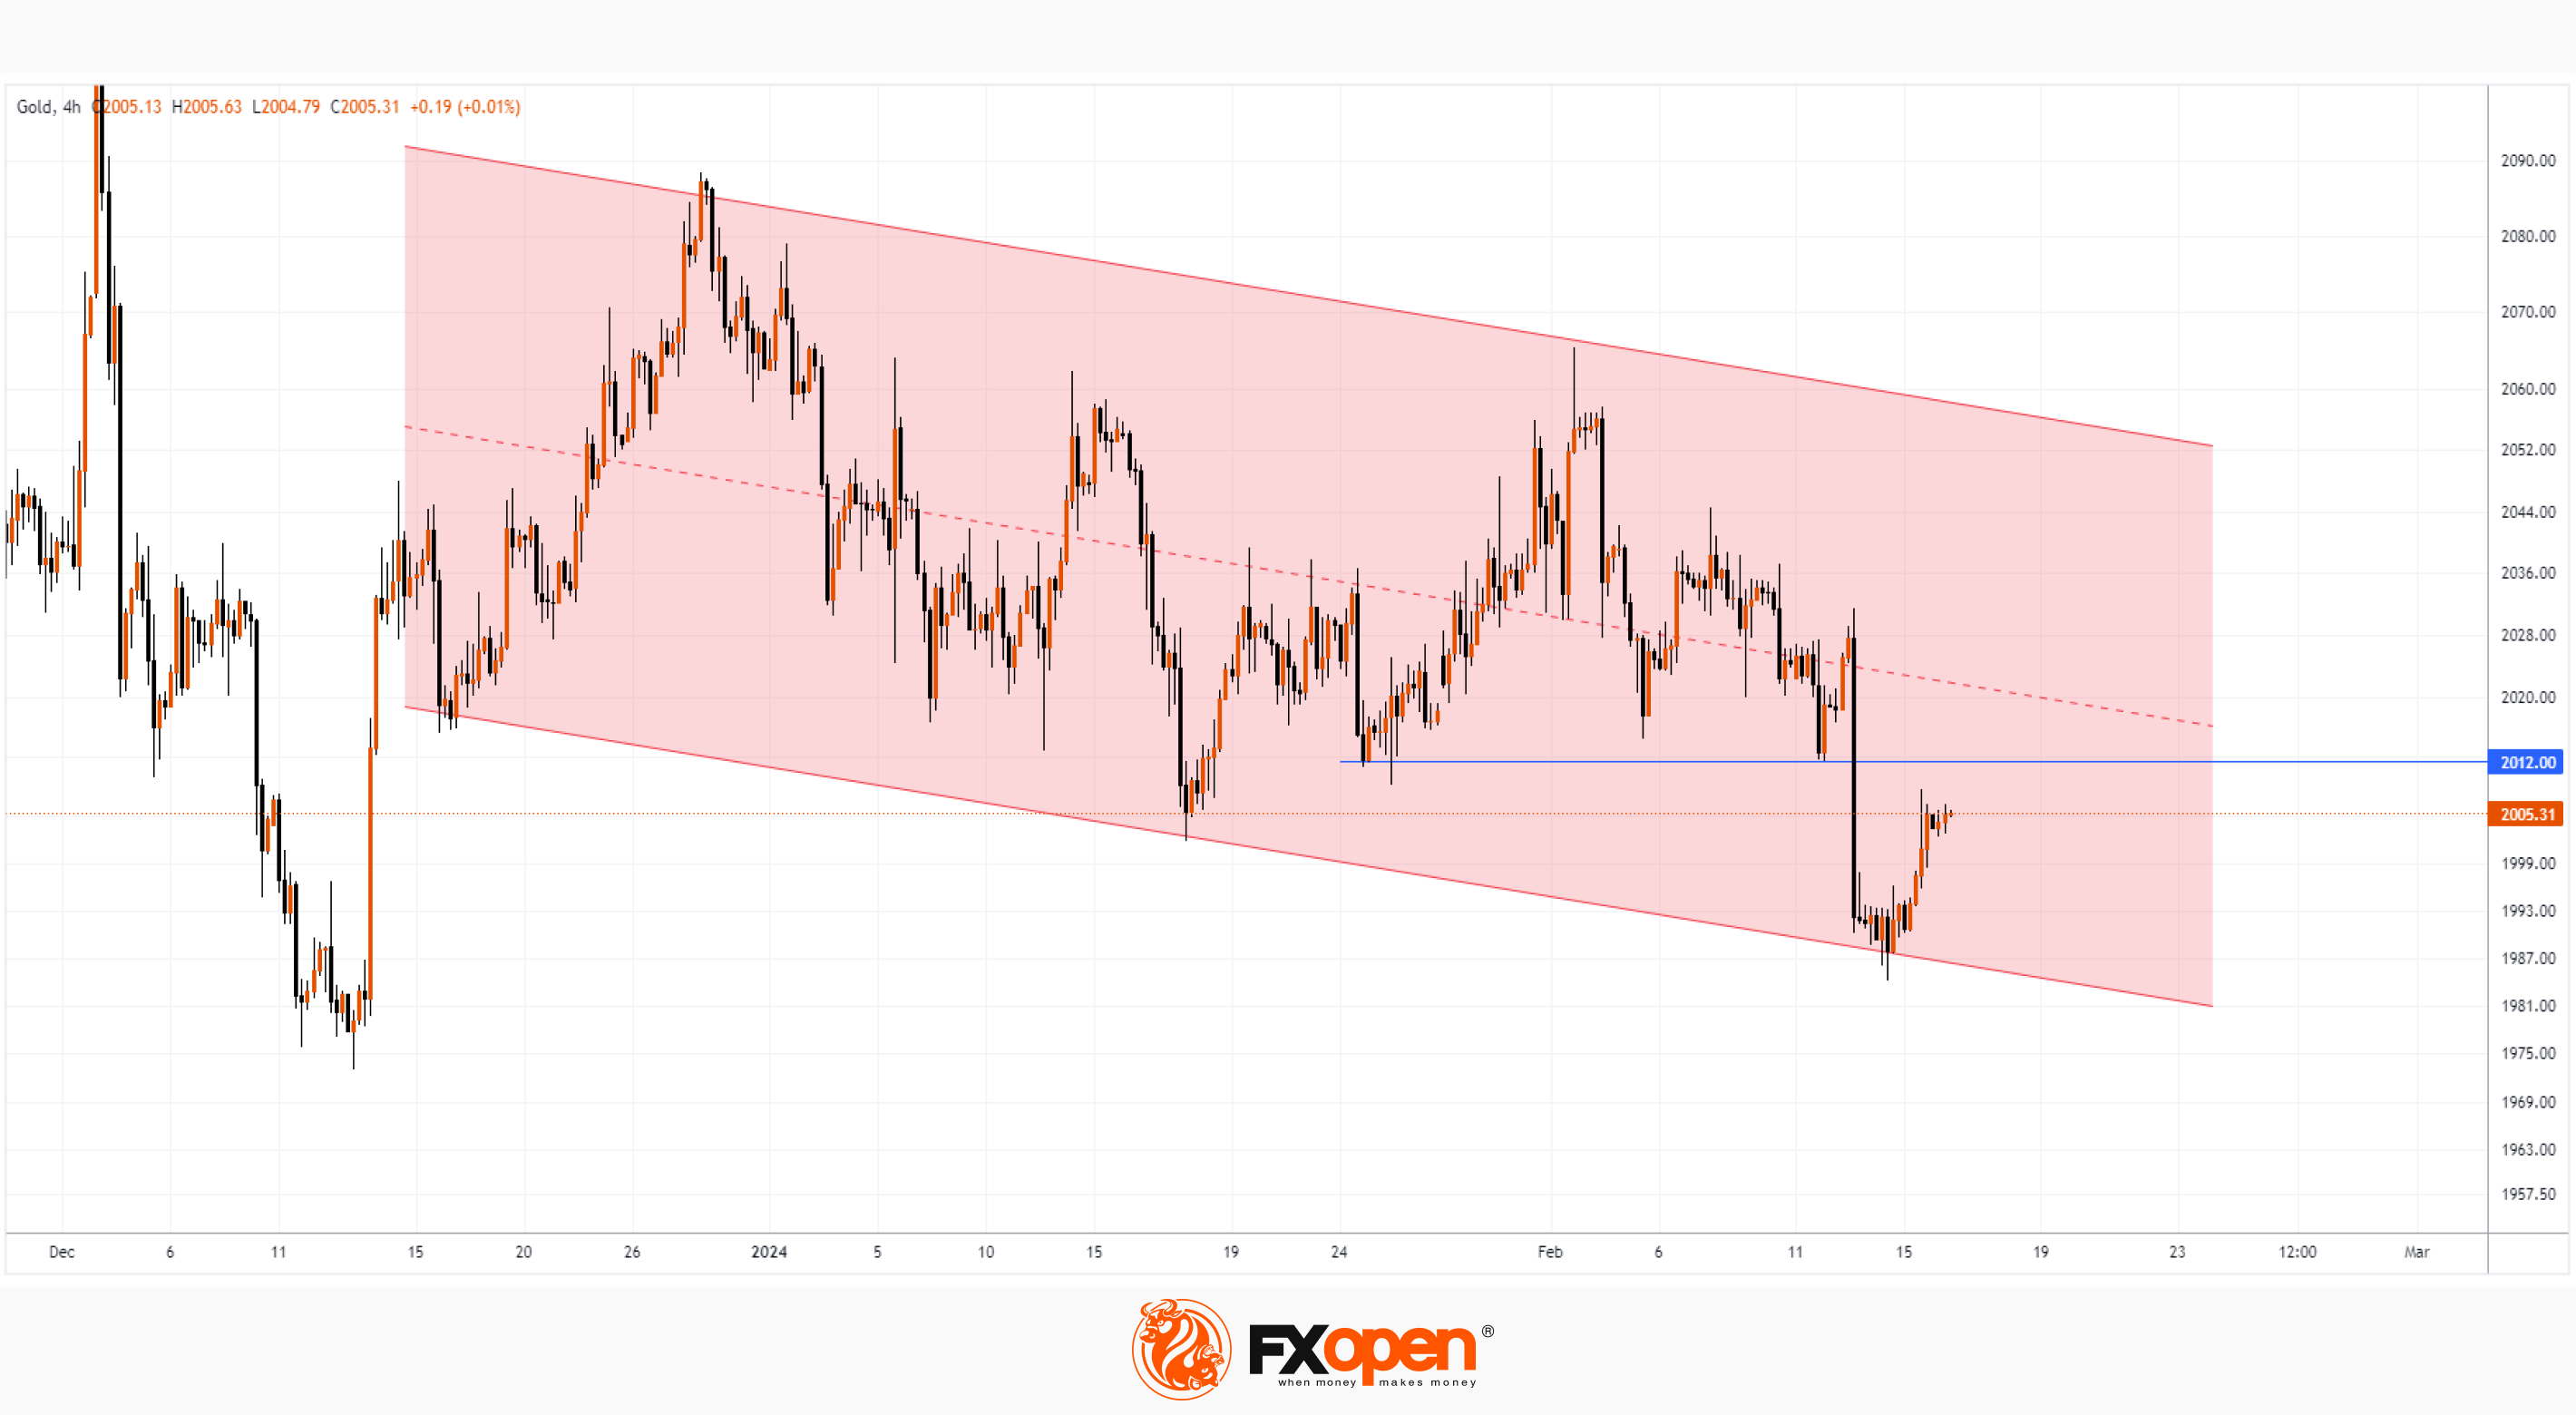
The XAU/USD chart shows that the price of gold is moving within a downward channel (shown in red). During the first half of February, the price managed to decline from its upper limit to its lower limit, which can be considered as evidence of the bears’ initiative. Then the current price recovery from the lower boundary may only be a correction from the oversold zone within the broader bear market.
Obstacles to the recovery of the XAU/USD price may include the following resistance levels:
→ median line of the descending channel;
→ the level of 2012 dollars per ounce, which worked as support, but was broken on Wednesday.
Reuters writes that the price of gold XAU/USD may reach the levels of 1960-1970 to intensify interest from buyers. This is a valid scenario that may well come true if the current trend in the form of a downward channel is not broken.
Start trading commodity CFDs with tight spreads. Open your trading account now or learn more about trading commodity CFDs with FXOpen.
CFDs are complex instruments and come with a high risk of losing your money.
This article represents the opinion of the Companies operating under the FXOpen brand only. It is not to be construed as an offer, solicitation, or recommendation with respect to products and services provided by the Companies operating under the FXOpen brand, nor is it to be considered financial advice.
Gold Price Recovers from Year Lows
On Wednesday, the gold price XAU/USD set a year low due to news about inflation in the US, which “does not want” to decline to target levels.
As a result, market participants are revising their estimates regarding the price of gold with the prospect that the Fed's tight policy may last for a longer time, as well as taking into account yesterday's news:
→ Retail Core Sales in the US fell by 0.6%, although an increase of +0.2% was expected, a month ago = +0.4%.
→ the number of unemployment applications for the week remains relatively stable: actual = 212k, a week ago = 218k, a month ago = 202k.
The XAU/USD chart shows that the price of gold is moving within a downward channel (shown in red). During the first half of February, the price managed to decline from its upper limit to its lower limit, which can be considered as evidence of the bears’ initiative. Then the current price recovery from the lower boundary may only be a correction from the oversold zone within the broader bear market.
Obstacles to the recovery of the XAU/USD price may include the following resistance levels:
→ median line of the descending channel;
→ the level of 2012 dollars per ounce, which worked as support, but was broken on Wednesday.
Reuters writes that the price of gold XAU/USD may reach the levels of 1960-1970 to intensify interest from buyers. This is a valid scenario that may well come true if the current trend in the form of a downward channel is not broken.
Start trading commodity CFDs with tight spreads. Open your trading account now or learn more about trading commodity CFDs with FXOpen.
CFDs are complex instruments and come with a high risk of losing your money.
This article represents the opinion of the Companies operating under the FXOpen brand only. It is not to be construed as an offer, solicitation, or recommendation with respect to products and services provided by the Companies operating under the FXOpen brand, nor is it to be considered financial advice.
👍2
#marketanalysis #stockmarket #tsla #tesla
TSLA Share Price Rises Sharply amid News of Musk's Increased Stake in the Company
According to media reports, Elon Musk has increased his stake in Tesla by more than one and a half times — previously, the billionaire owned approximately 13% of the shares, now he owns 20.5% of Tesla. And earlier it was reported that Musk wants to increase his stake in Tesla to at least 25%.
At the same time, the TSLA share price rose sharply in yesterday's trading by more than 6%, while the S&P 500 stock market index increased by “only” +0.6%.
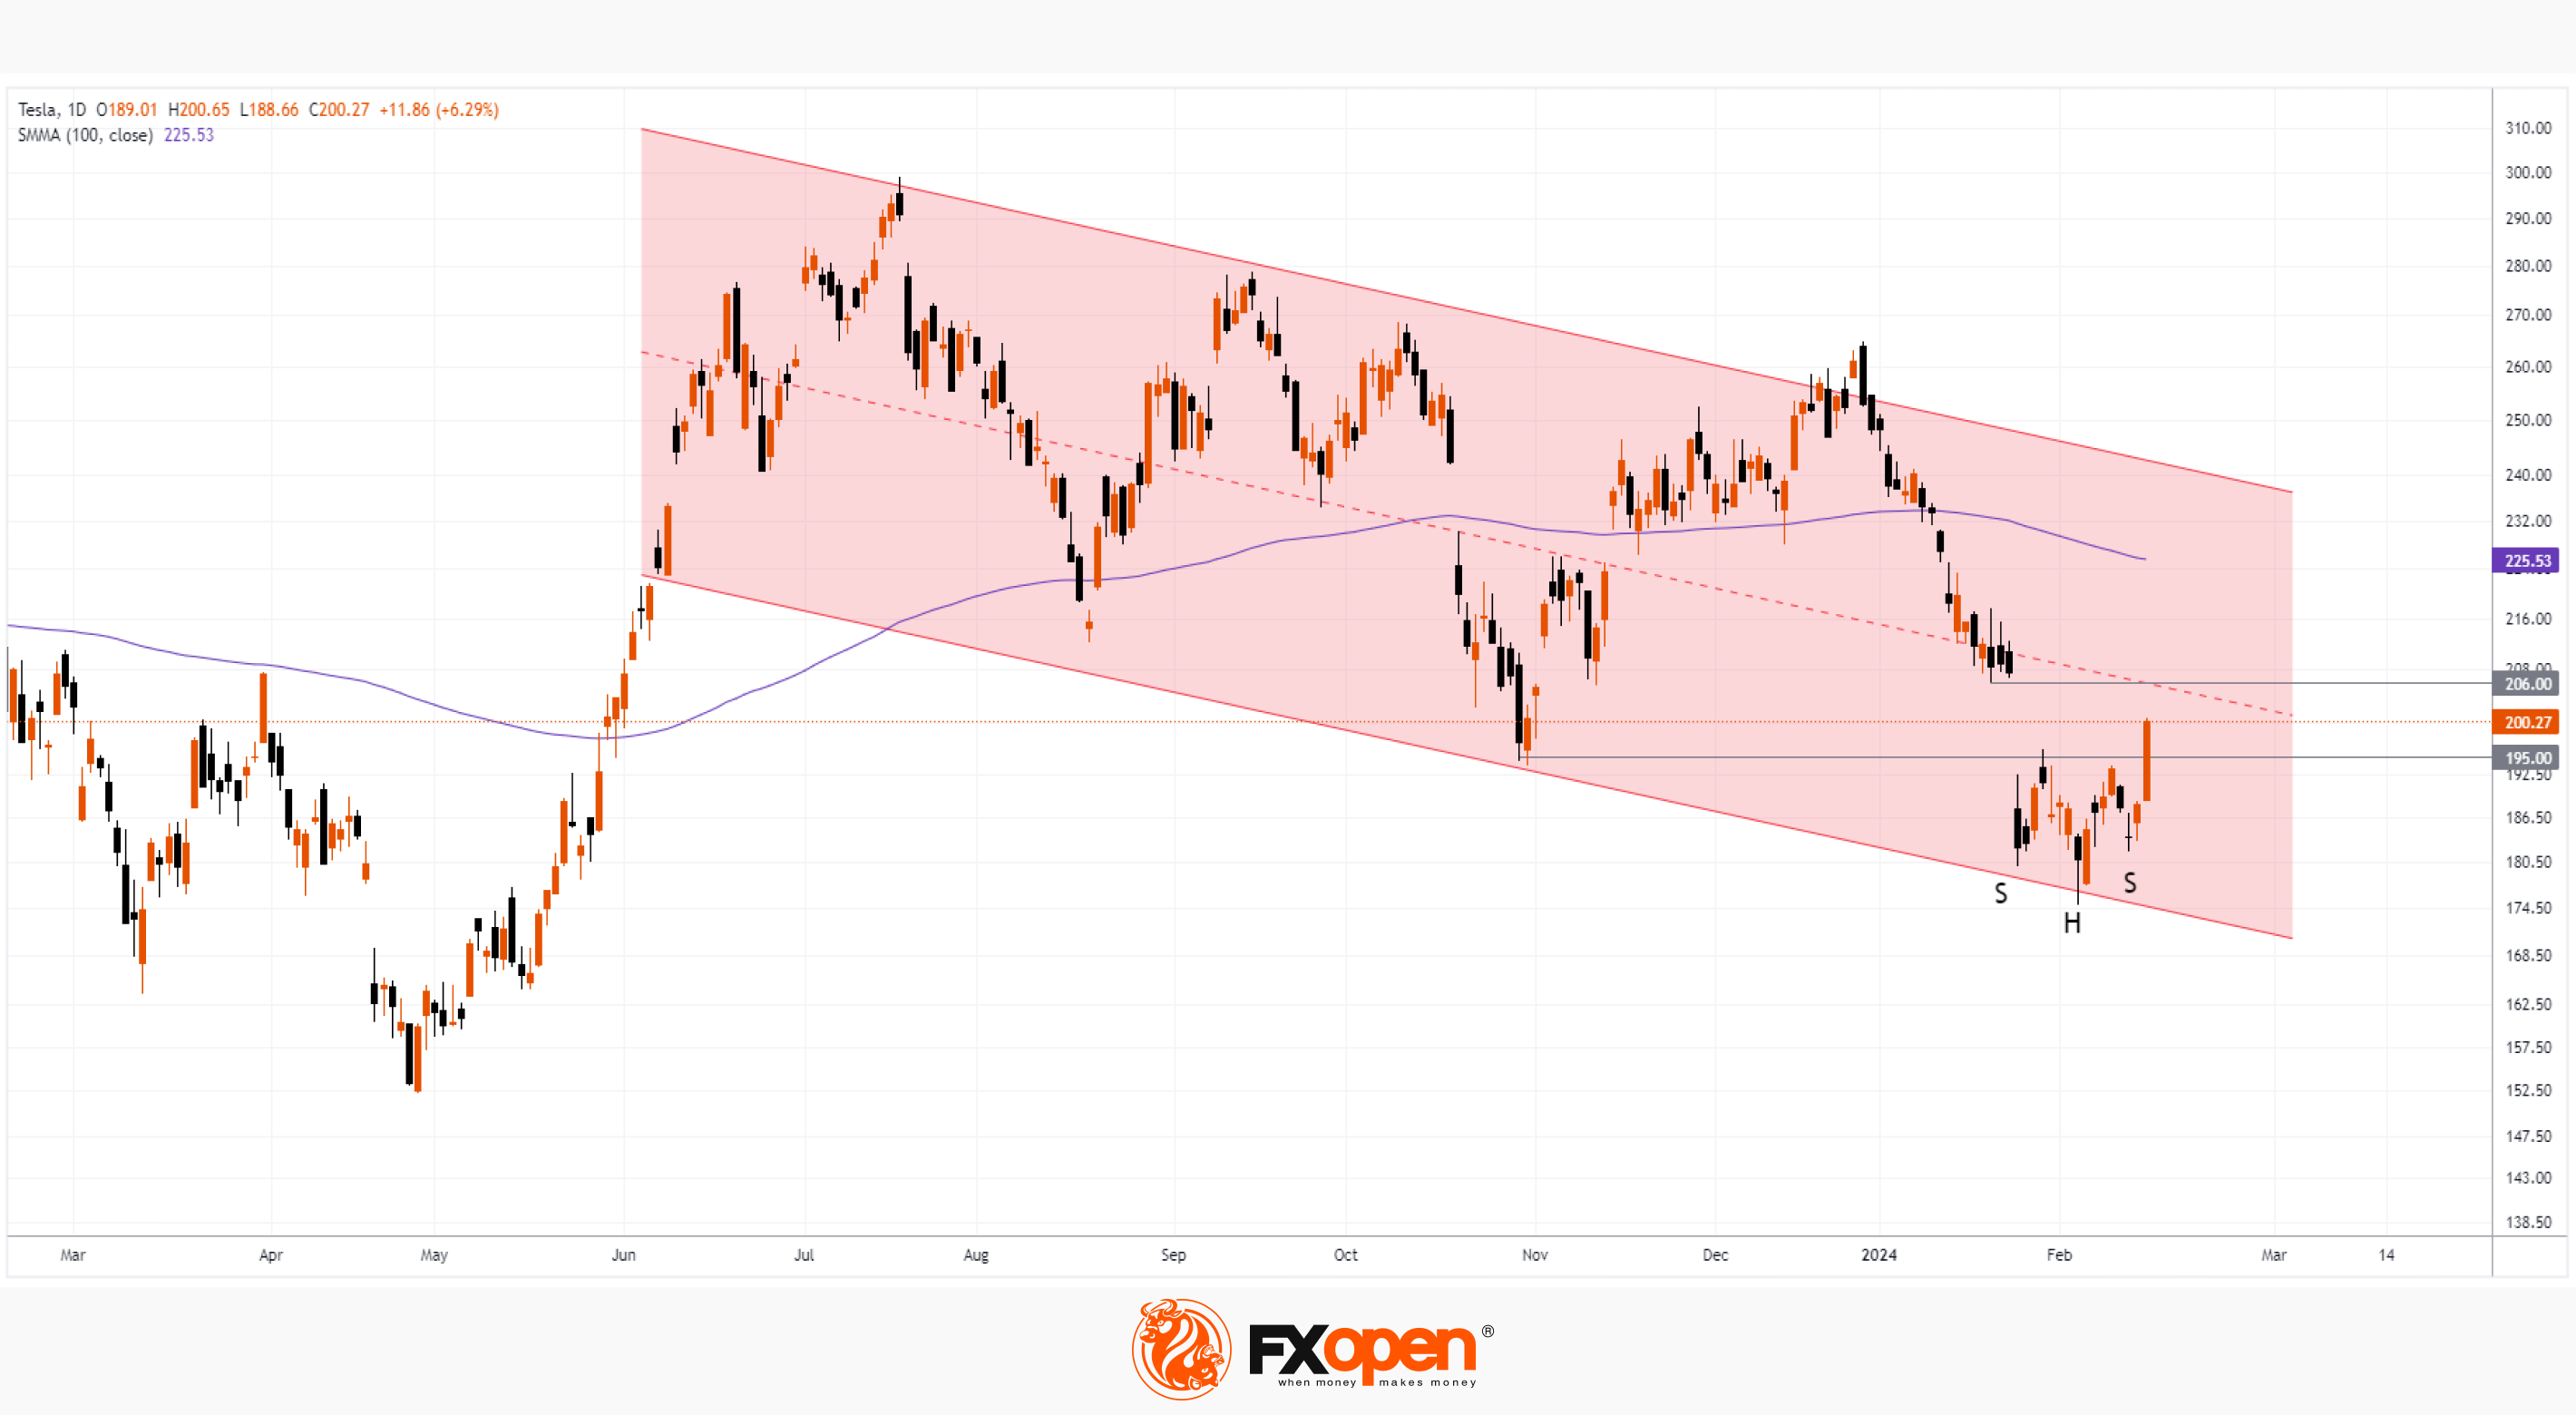
The TSLA stock chart today shows that:
→ the price has overcome the psychological mark of USD 200 per share;
→ the price has overcome the resistance level of USD 195 per share;
→ a bullish reversal pattern inverted head-and-shoulders has formed on the chart.
The situation gives hope to the bulls in a disadvantageous situation, because:
→ TSLA stock price is in a bearish trend (as shown by the red channel);
→ the last quarter report disappointed investors — and the price formed a wide bearish gap at the end of January.
How determined are the bulls, will they be able to break the trend? This will show their ability to overcome resistance levels:
→ 206.0 – in the area of the upper border of the gap;
→ median line of the descending channel;
→ SMA line (100) pointing down.
Buy and sell stocks of the world's biggest publicly-listed companies with CFDs on FXOpen’s trading platform. Open your FXOpen account now or learn more about trading share CFDs with FXOpen.
CFDs are complex instruments and come with a high risk of losing your money.
This article represents the opinion of the Companies operating under the FXOpen brand only. It is not to be construed as an offer, solicitation, or recommendation with respect to products and services provided by the Companies operating under the FXOpen brand, nor is it to be considered financial advice.
TSLA Share Price Rises Sharply amid News of Musk's Increased Stake in the Company
According to media reports, Elon Musk has increased his stake in Tesla by more than one and a half times — previously, the billionaire owned approximately 13% of the shares, now he owns 20.5% of Tesla. And earlier it was reported that Musk wants to increase his stake in Tesla to at least 25%.
At the same time, the TSLA share price rose sharply in yesterday's trading by more than 6%, while the S&P 500 stock market index increased by “only” +0.6%.
The TSLA stock chart today shows that:
→ the price has overcome the psychological mark of USD 200 per share;
→ the price has overcome the resistance level of USD 195 per share;
→ a bullish reversal pattern inverted head-and-shoulders has formed on the chart.
The situation gives hope to the bulls in a disadvantageous situation, because:
→ TSLA stock price is in a bearish trend (as shown by the red channel);
→ the last quarter report disappointed investors — and the price formed a wide bearish gap at the end of January.
How determined are the bulls, will they be able to break the trend? This will show their ability to overcome resistance levels:
→ 206.0 – in the area of the upper border of the gap;
→ median line of the descending channel;
→ SMA line (100) pointing down.
Buy and sell stocks of the world's biggest publicly-listed companies with CFDs on FXOpen’s trading platform. Open your FXOpen account now or learn more about trading share CFDs with FXOpen.
CFDs are complex instruments and come with a high risk of losing your money.
This article represents the opinion of the Companies operating under the FXOpen brand only. It is not to be construed as an offer, solicitation, or recommendation with respect to products and services provided by the Companies operating under the FXOpen brand, nor is it to be considered financial advice.
👍2
Weekly Market Wrap With Gary Thomson: US INFLATION, GBP/USD, GOLD, BITCOIN
Get the latest scoop on the week's hottest headlines, all in one convenient video. Join Gary Thomson, the COO of FXOpen UK, as he breaks down the most significant news reports and shares his expert insights.
🔸 News about US Inflation Shake Markets
🔸 GBP/USD Price Declining after Encouraging UK Inflation Data Release
🔸 Gold Price Takes Hit While Crude Oil Price Extends Rally
🔸 Bitcoin Price Exceeds Psychological Level of $50k
Stay in the know and empower yourself with our short, yet power-packed video. Watch it now and stay updated with FXOpen. Don't miss out on this invaluable opportunity to sharpen your trading skills and make informed decisions.
https://cutt.ly/SwV1NKyu
To take advantage of price fluctuations in the foreign exchange markets, consider enlisting the services of a reliable broker like FXOpen.
⚠️
This forecast represents FXOpen Companies opinion only, it should not be construed as an offer, invitation or recommendation in respect to FXOpen Companies products and services or as financial advice
Get the latest scoop on the week's hottest headlines, all in one convenient video. Join Gary Thomson, the COO of FXOpen UK, as he breaks down the most significant news reports and shares his expert insights.
🔸 News about US Inflation Shake Markets
🔸 GBP/USD Price Declining after Encouraging UK Inflation Data Release
🔸 Gold Price Takes Hit While Crude Oil Price Extends Rally
🔸 Bitcoin Price Exceeds Psychological Level of $50k
Stay in the know and empower yourself with our short, yet power-packed video. Watch it now and stay updated with FXOpen. Don't miss out on this invaluable opportunity to sharpen your trading skills and make informed decisions.
https://cutt.ly/SwV1NKyu
To take advantage of price fluctuations in the foreign exchange markets, consider enlisting the services of a reliable broker like FXOpen.
⚠️
This forecast represents FXOpen Companies opinion only, it should not be construed as an offer, invitation or recommendation in respect to FXOpen Companies products and services or as financial advice
YouTube
Weekly Market Wrap With Gary Thomson: US INFLATION, GBP/USD, GOLD, BITCOIN
Get the latest scoop on the week's hottest headlines, all in one convenient video. Join Gary Thomson, the COO of FXOpen UK, as he breaks down the most significant news reports and shares his expert insights.
00:33 - News about US Inflation Shake Markets…
00:33 - News about US Inflation Shake Markets…
👍2
#marketanalysis #MarketNews #tradingforex
GBP/JPY: Price Corrects from 8.5 Year High
According to CNN, the economies of the UK and Japan entered a technical recession last week as data showed a second consecutive quarterly decline in gross domestic product. And if in the UK the economic downturn can be associated with high inflation and the strict policies of the Bank of England, then in Japan the reason may be the population decline (which has been going on for 14 years in a row).
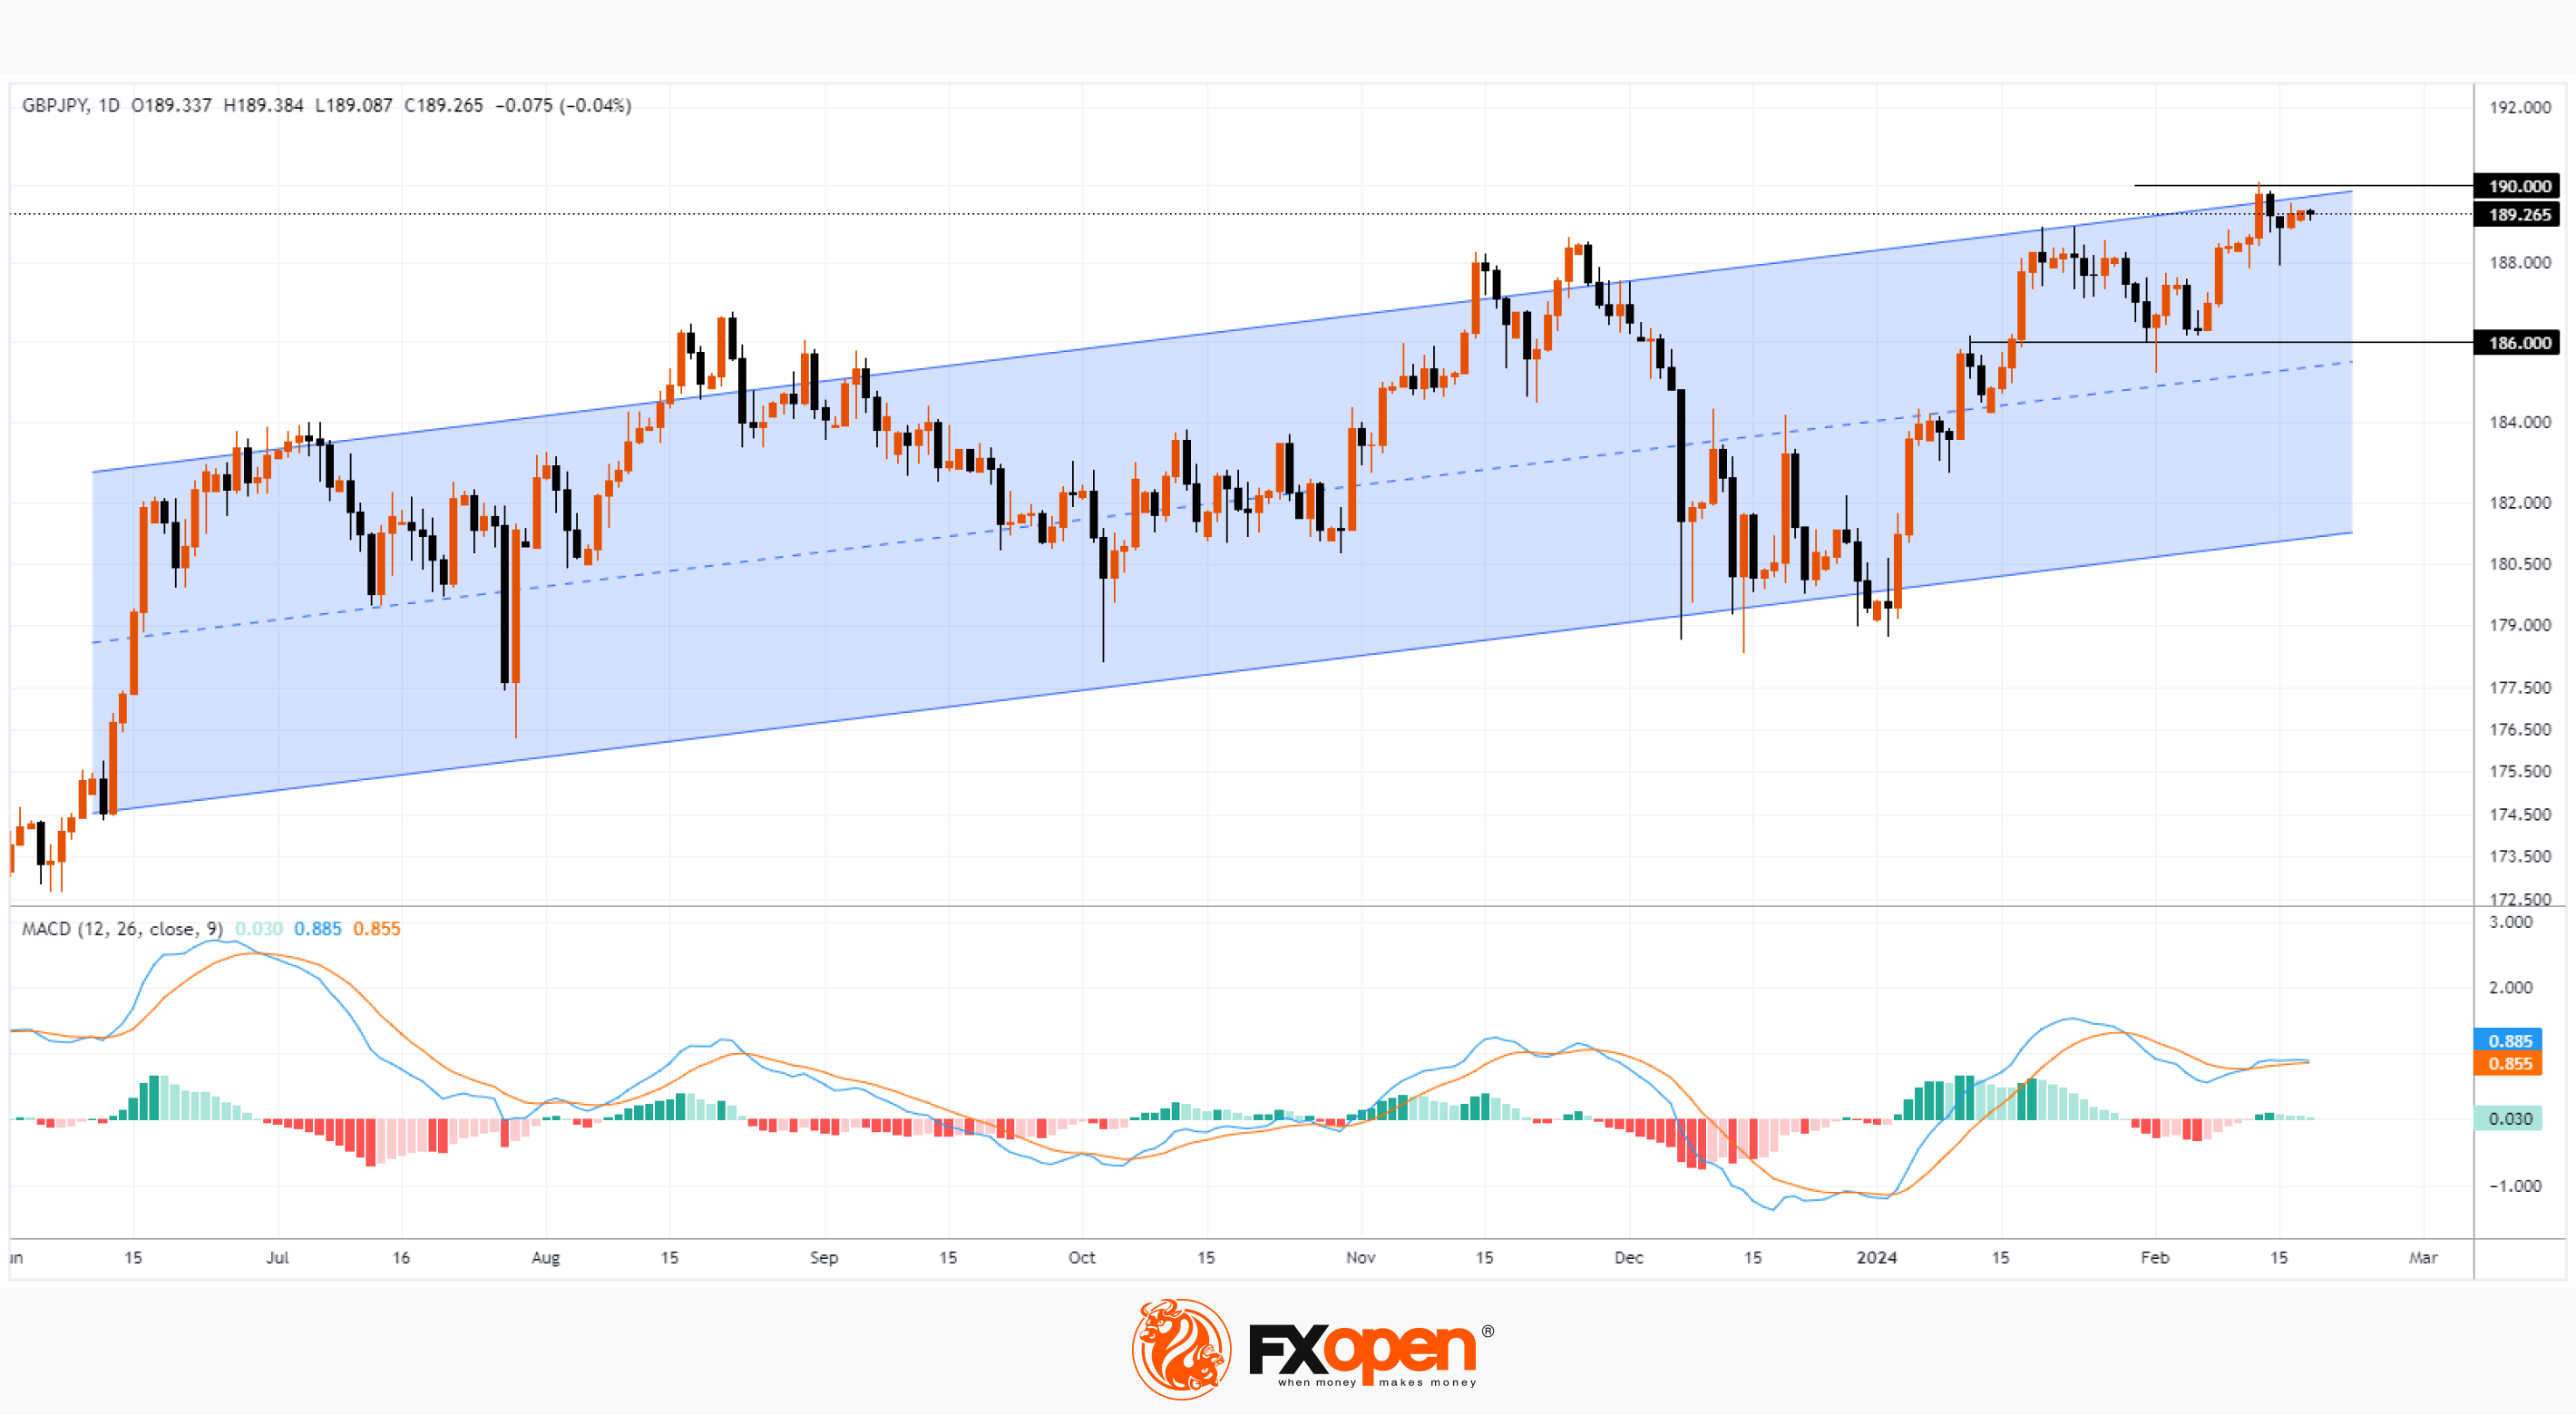
At the same time, the GBP/JPY chart shows that last week the rate exceeded 190 yen per pound for the first time since August 2015.
However:
→ the price is at the upper border of the ascending channel (shown in blue);
→ at the beginning of this week, the price of GBP/JPY is below the 190 yen level – and a false bullish breakout of the psychological level should be regarded as a bearish sign;
→ the MACD indicator indicates that demand forces are fading.
Perhaps market participants are inclined to take profits from longs. Since it is possible that the Japanese authorities are able to announce some decisions aimed at supporting the yen. In this case, one of the immediate targets for the bears may be the level of 186 yen per pound – where the support level (formerly the resistance level) is located, reinforced by the median line of the long-term channel.
Trade over 50 forex markets 24 hours a day with FXOpen. Take advantage of low commissions, deep liquidity, and spreads from 0.0 pips. Open your FXOpen account now or learn more about trading forex with FXOpen.
CFDs are complex instruments and come with a high risk of losing your money.
This article represents the opinion of the Companies operating under the FXOpen brand only. It is not to be construed as an offer, solicitation, or recommendation with respect to products and services provided by the Companies operating under the FXOpen brand, nor is it to be considered financial advice.
GBP/JPY: Price Corrects from 8.5 Year High
According to CNN, the economies of the UK and Japan entered a technical recession last week as data showed a second consecutive quarterly decline in gross domestic product. And if in the UK the economic downturn can be associated with high inflation and the strict policies of the Bank of England, then in Japan the reason may be the population decline (which has been going on for 14 years in a row).
At the same time, the GBP/JPY chart shows that last week the rate exceeded 190 yen per pound for the first time since August 2015.
However:
→ the price is at the upper border of the ascending channel (shown in blue);
→ at the beginning of this week, the price of GBP/JPY is below the 190 yen level – and a false bullish breakout of the psychological level should be regarded as a bearish sign;
→ the MACD indicator indicates that demand forces are fading.
Perhaps market participants are inclined to take profits from longs. Since it is possible that the Japanese authorities are able to announce some decisions aimed at supporting the yen. In this case, one of the immediate targets for the bears may be the level of 186 yen per pound – where the support level (formerly the resistance level) is located, reinforced by the median line of the long-term channel.
Trade over 50 forex markets 24 hours a day with FXOpen. Take advantage of low commissions, deep liquidity, and spreads from 0.0 pips. Open your FXOpen account now or learn more about trading forex with FXOpen.
CFDs are complex instruments and come with a high risk of losing your money.
This article represents the opinion of the Companies operating under the FXOpen brand only. It is not to be construed as an offer, solicitation, or recommendation with respect to products and services provided by the Companies operating under the FXOpen brand, nor is it to be considered financial advice.
👍5
#stockmarket #NASDAQ #MarketNews
NASDAQ Price Declining Ahead of NVDA Report
E-mini NASDAQ 100 futures fell below the psychological 17,500 level yesterday after trading above 18,000 on Friday.
The reason for the decline may be the fears of market participants ahead of the news release:
→ today after the close of the main trading session, Nvidia, the 5th largest company by capitalization, will publish its report;
→ today at 22:00 GMT+3, data from the Federal Reserve will be published, which will provide important information about the prospects for lowering the interest rate.
However, for now the decline looks like a correction.
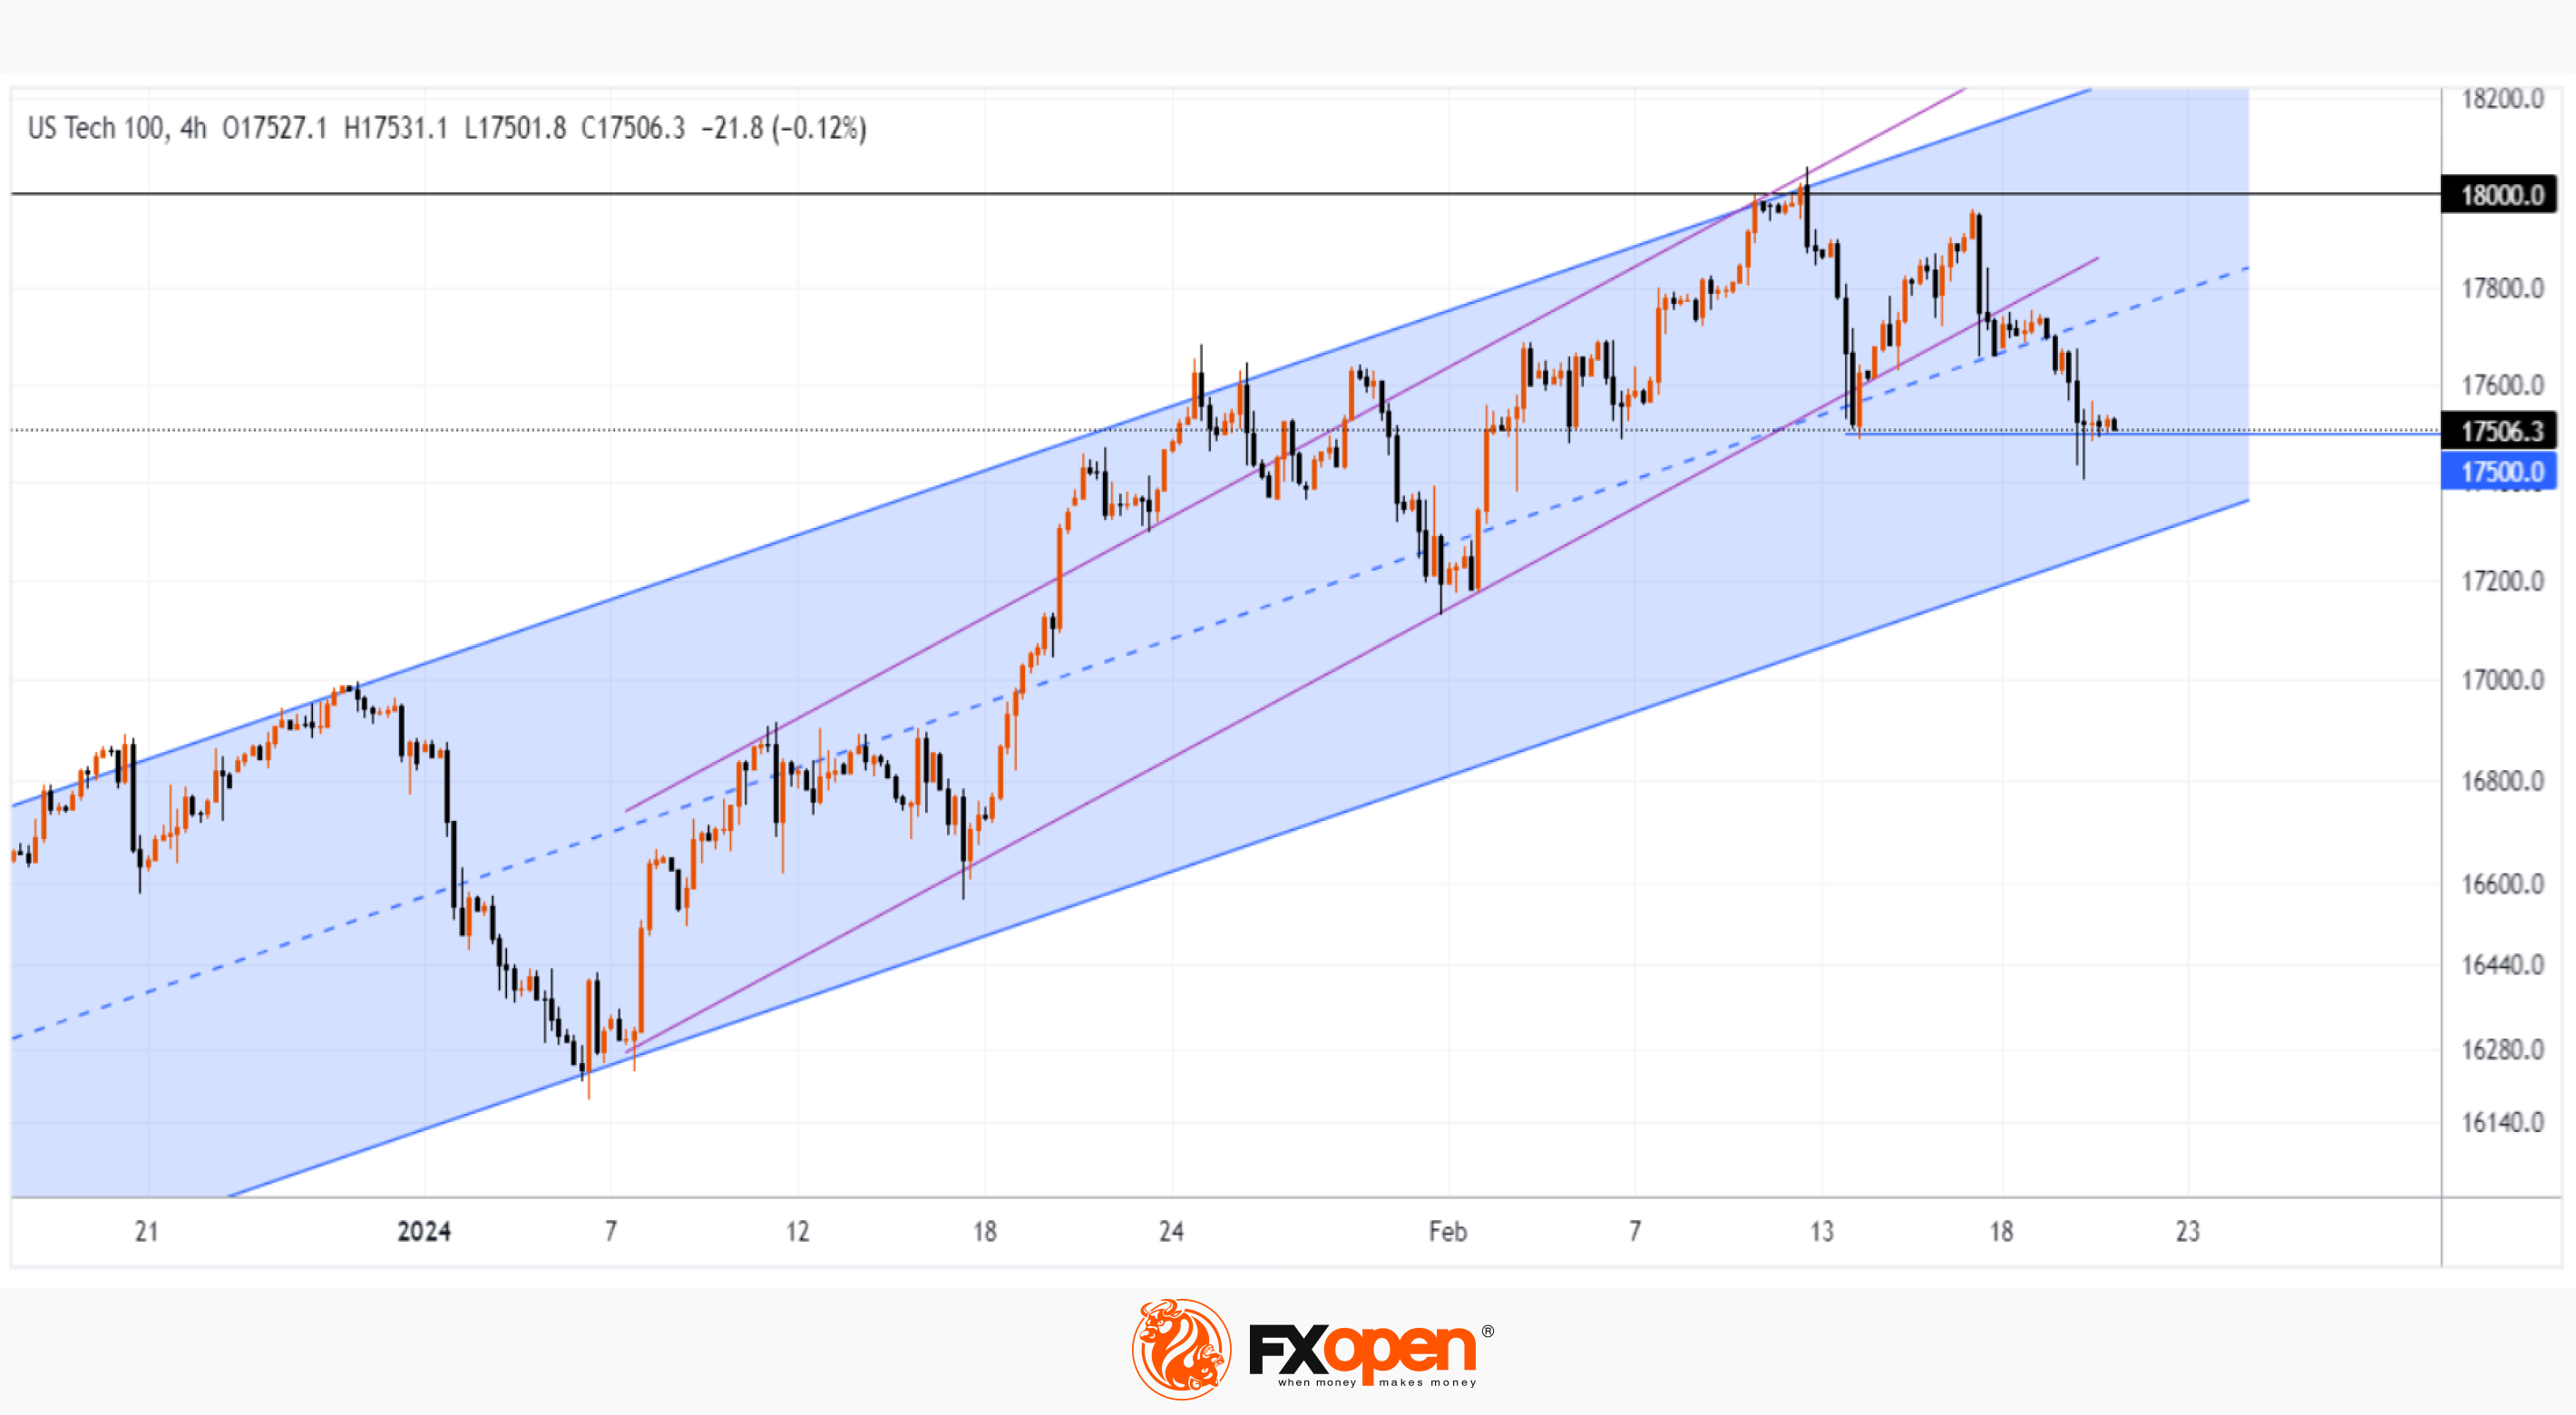
The NASDAQ 100 chart shows that:
→ the price is within an uptrend (shown by a blue channel);
→ the level of 18000 acted as psychological resistance, as the price turned down after a small puncture;
→ the price fixes below the local ascending channel (shown by purple lines).
For now, the support level at 17,500 is keeping the price from falling further, but if the news is disappointing, the price may drop to the lower border of the channel — it is even possible that the bears will attempt a breakout.
Trade global index CFDs with zero commission and tight spreads. Open your FXOpen account now or learn more about trading index CFDs with FXOpen.
CFDs are complex instruments and come with a high risk of losing your money.
This article represents the opinion of the Companies operating under the FXOpen brand only. It is not to be construed as an offer, solicitation, or recommendation with respect to products and services provided by the Companies operating under the FXOpen brand, nor is it to be considered financial advice.
NASDAQ Price Declining Ahead of NVDA Report
E-mini NASDAQ 100 futures fell below the psychological 17,500 level yesterday after trading above 18,000 on Friday.
The reason for the decline may be the fears of market participants ahead of the news release:
→ today after the close of the main trading session, Nvidia, the 5th largest company by capitalization, will publish its report;
→ today at 22:00 GMT+3, data from the Federal Reserve will be published, which will provide important information about the prospects for lowering the interest rate.
However, for now the decline looks like a correction.
The NASDAQ 100 chart shows that:
→ the price is within an uptrend (shown by a blue channel);
→ the level of 18000 acted as psychological resistance, as the price turned down after a small puncture;
→ the price fixes below the local ascending channel (shown by purple lines).
For now, the support level at 17,500 is keeping the price from falling further, but if the news is disappointing, the price may drop to the lower border of the channel — it is even possible that the bears will attempt a breakout.
Trade global index CFDs with zero commission and tight spreads. Open your FXOpen account now or learn more about trading index CFDs with FXOpen.
CFDs are complex instruments and come with a high risk of losing your money.
This article represents the opinion of the Companies operating under the FXOpen brand only. It is not to be construed as an offer, solicitation, or recommendation with respect to products and services provided by the Companies operating under the FXOpen brand, nor is it to be considered financial advice.
👍3
#crypto #ETH #MarketNews
Ethereum Price Falls after Exceeding $3,000
We previously wrote about the reasons for the positive sentiment in the ETH/USD market.
Optimism was added by a post on X (Twitter) by Vitalik Buterin about the so-called Werkle trees. This technology, which should (according to the information in the roadmap) be introduced in the future, it includes the advantages of:
→ reduced requirements for validators;
→ faster network synchronization, and others.
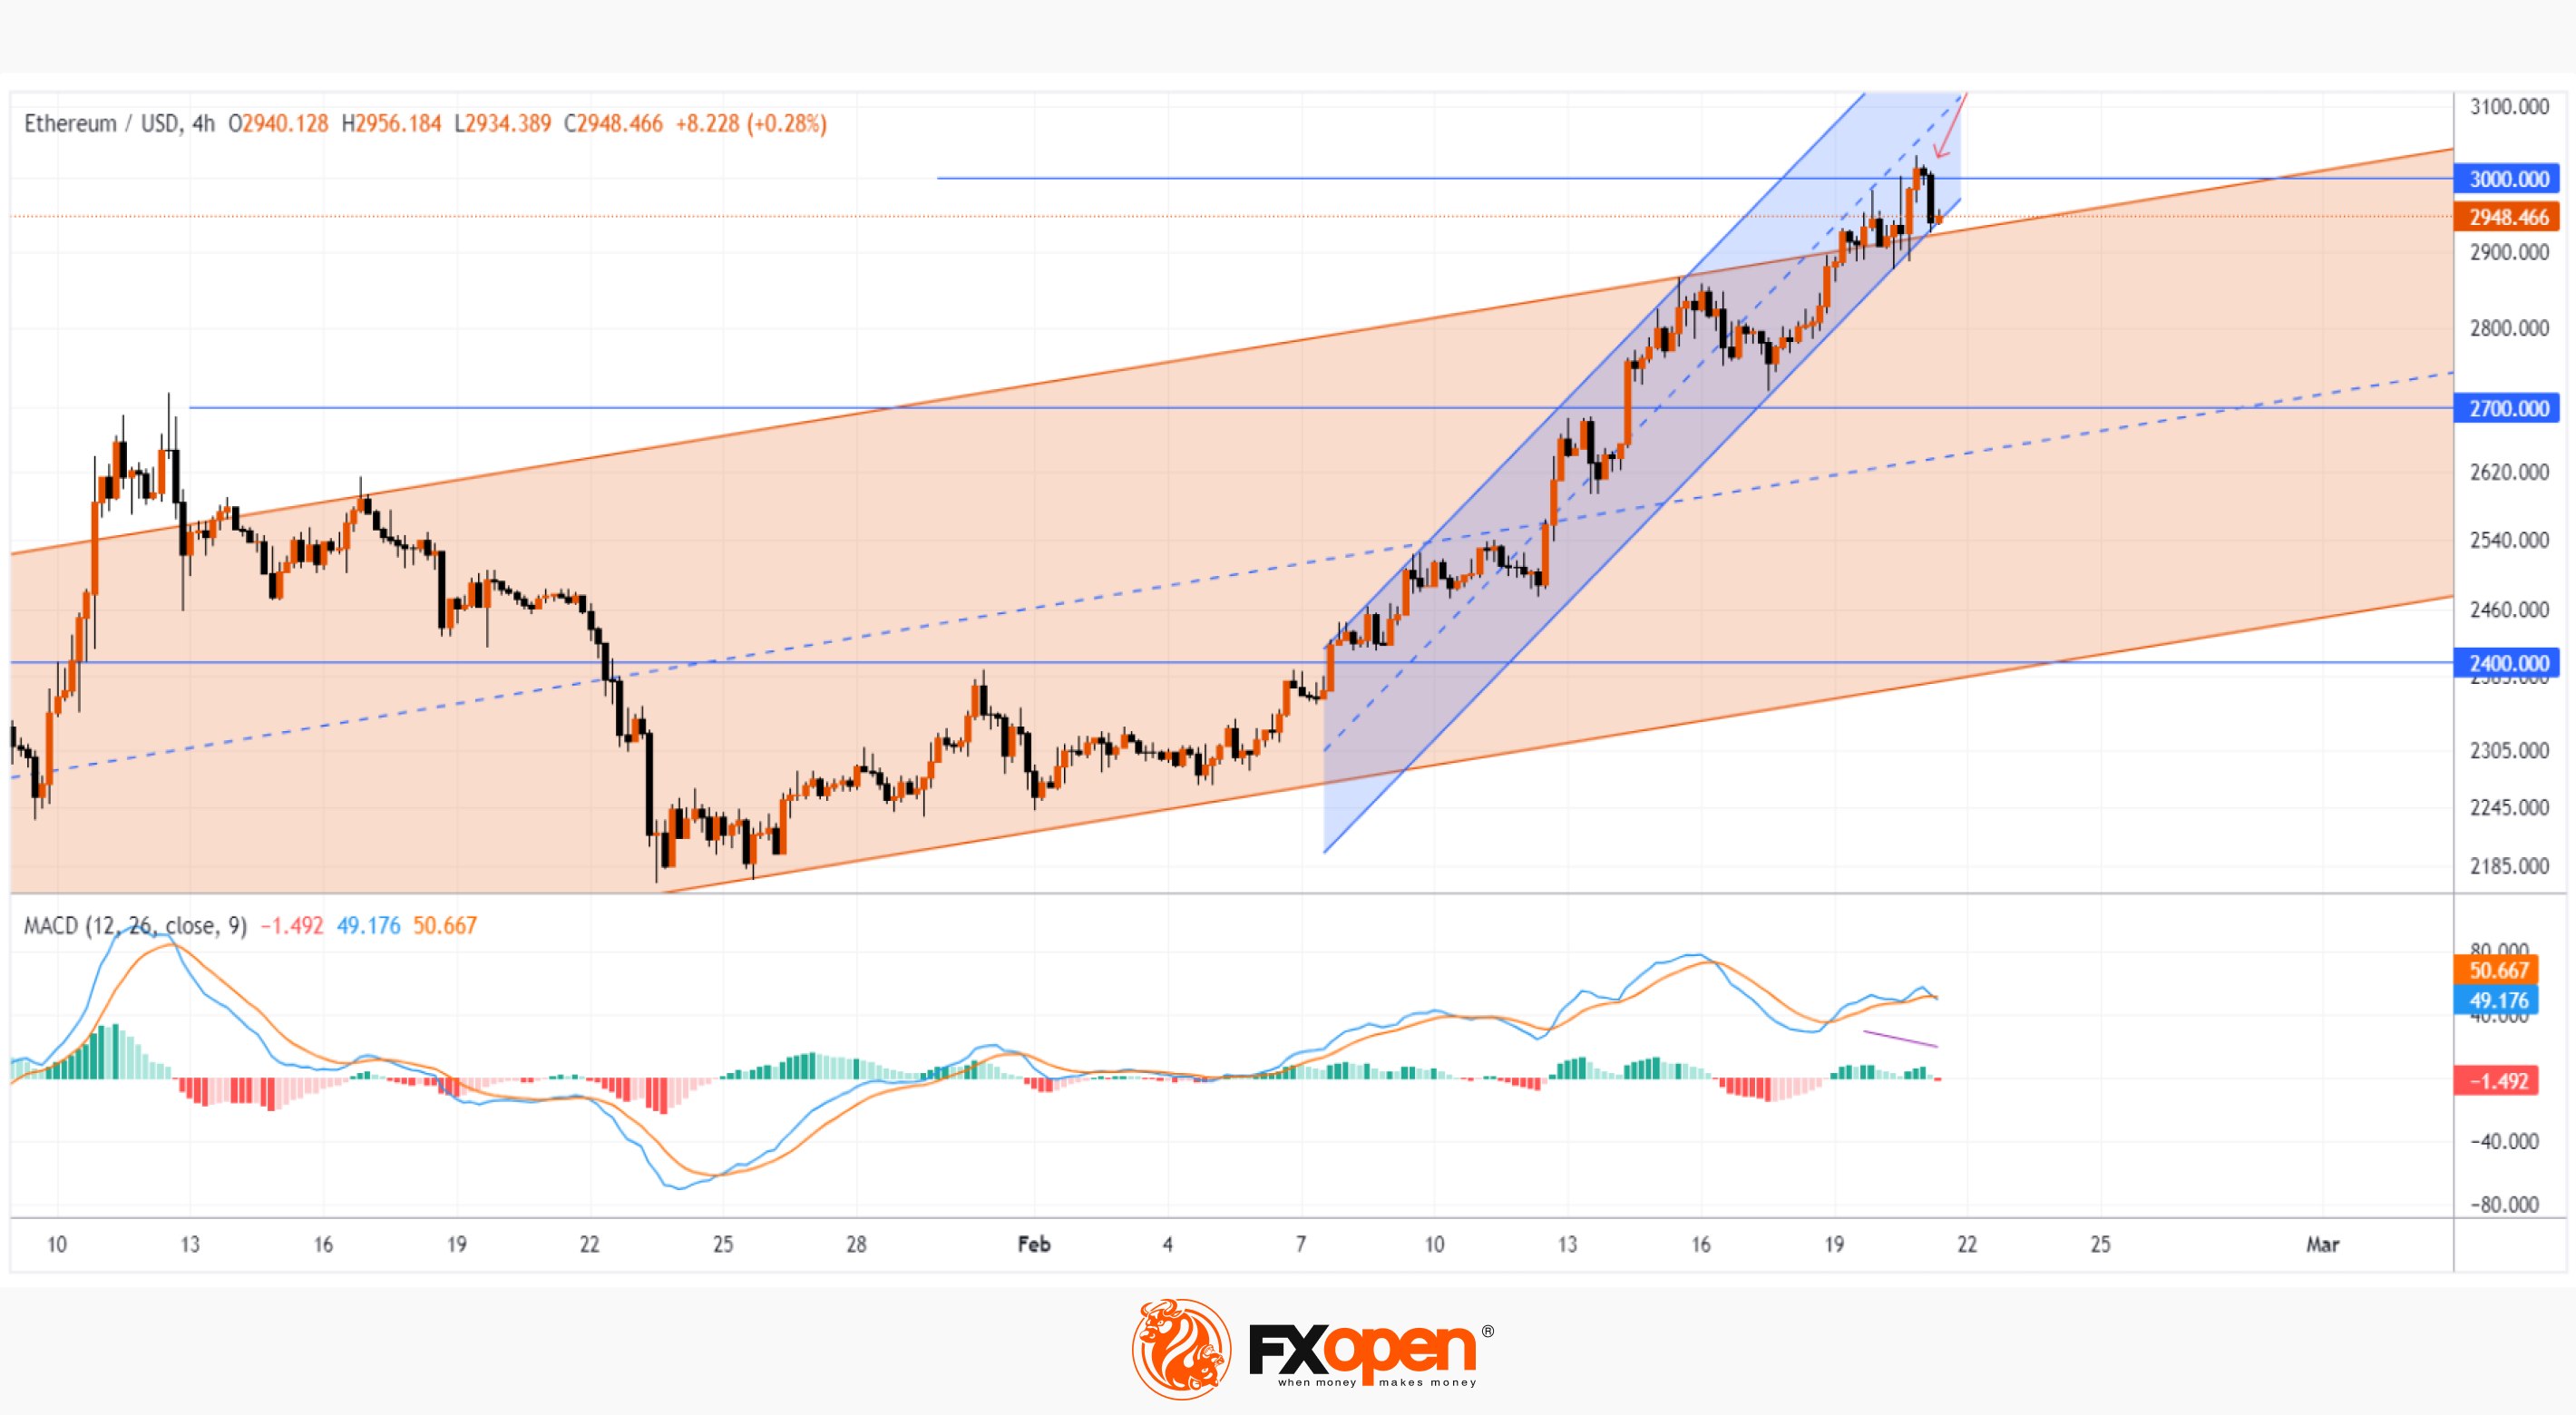
The ETH/USD chart shows that:
→ ETH price is within a larger uptrend (shown in orange);
→ the price is within the February bullish trend (shown by blue lines);
→ the market is in an overbought state, judging by the bearish divergence on the MACD indicator.
These arguments suggest that the market is vulnerable to a pullback.
Notice the wide bearish candle (shown by the red arrow) that is pushing the ETH price down from above the psychological USD 3,000 level. It may indicate a change in mood.
Since the beginning of February, the price of ETH has increased by approximately 30%. Therefore, some market participants could take profits from long positions at the psychological level. If a pullback occurs and is about 50% of the February rise, the price of Ethereum may fall to the median line of the orange channel to the support area of 2,700.
FXOpen offers the world's most popular cryptocurrency CFDs*, including Bitcoin and Ethereum. Floating spreads, 1:2 leverage — at your service. Open your trading account now or learn more about crypto CFD trading with FXOpen.
*At FXOpen UK and FXOpen AU, Cryptocurrency CFDs are only available for trading by those clients categorised as Professional clients under FCA Rules and Professional clients under ASIC Rules respectively. They are not available for trading by Retail clients.
CFDs are complex instruments and come with a high risk of losing your money.
This article represents the opinion of the Companies operating under the FXOpen brand only. It is not to be construed as an offer, solicitation, or recommendation with respect to products and services provided by the Companies operating under the FXOpen brand, nor is it to be considered financial advice.
Ethereum Price Falls after Exceeding $3,000
We previously wrote about the reasons for the positive sentiment in the ETH/USD market.
Optimism was added by a post on X (Twitter) by Vitalik Buterin about the so-called Werkle trees. This technology, which should (according to the information in the roadmap) be introduced in the future, it includes the advantages of:
→ reduced requirements for validators;
→ faster network synchronization, and others.
The ETH/USD chart shows that:
→ ETH price is within a larger uptrend (shown in orange);
→ the price is within the February bullish trend (shown by blue lines);
→ the market is in an overbought state, judging by the bearish divergence on the MACD indicator.
These arguments suggest that the market is vulnerable to a pullback.
Notice the wide bearish candle (shown by the red arrow) that is pushing the ETH price down from above the psychological USD 3,000 level. It may indicate a change in mood.
Since the beginning of February, the price of ETH has increased by approximately 30%. Therefore, some market participants could take profits from long positions at the psychological level. If a pullback occurs and is about 50% of the February rise, the price of Ethereum may fall to the median line of the orange channel to the support area of 2,700.
FXOpen offers the world's most popular cryptocurrency CFDs*, including Bitcoin and Ethereum. Floating spreads, 1:2 leverage — at your service. Open your trading account now or learn more about crypto CFD trading with FXOpen.
*At FXOpen UK and FXOpen AU, Cryptocurrency CFDs are only available for trading by those clients categorised as Professional clients under FCA Rules and Professional clients under ASIC Rules respectively. They are not available for trading by Retail clients.
CFDs are complex instruments and come with a high risk of losing your money.
This article represents the opinion of the Companies operating under the FXOpen brand only. It is not to be construed as an offer, solicitation, or recommendation with respect to products and services provided by the Companies operating under the FXOpen brand, nor is it to be considered financial advice.
👍3
#nvidia #stockmarket #stocktrading #marketanalysis
NVDA Share Price Soars 11% after Report
The signs of concern we wrote about yesterday have largely subsided. After three days of declines, the price of E-mini Nasdaq 100 futures bounced off the lower boundary of the channel (see yesterday's chart) and rose, led by NVDA stock.
Nvidia's quarterly report exceeded expectations:
→ earnings per share: actual = USD 5.16, expected = USD 4.59;
→ gross revenue: actual = USD 22.10 billion, expected = USD 20.39 billion.
According to the head of the company:
→ Accelerated computing and generative AI have reached a tipping point.
→ Demand for computing is growing worldwide among companies, industries and governments.
→ The coming year will bring major new product cycles with exceptional innovations that will help propel the industry forward.
In post-market trading, NVDA's price rose 11% to over USD 740 per share. Thus, the price increase for NVDA since the beginning of 2024 is about 50%.
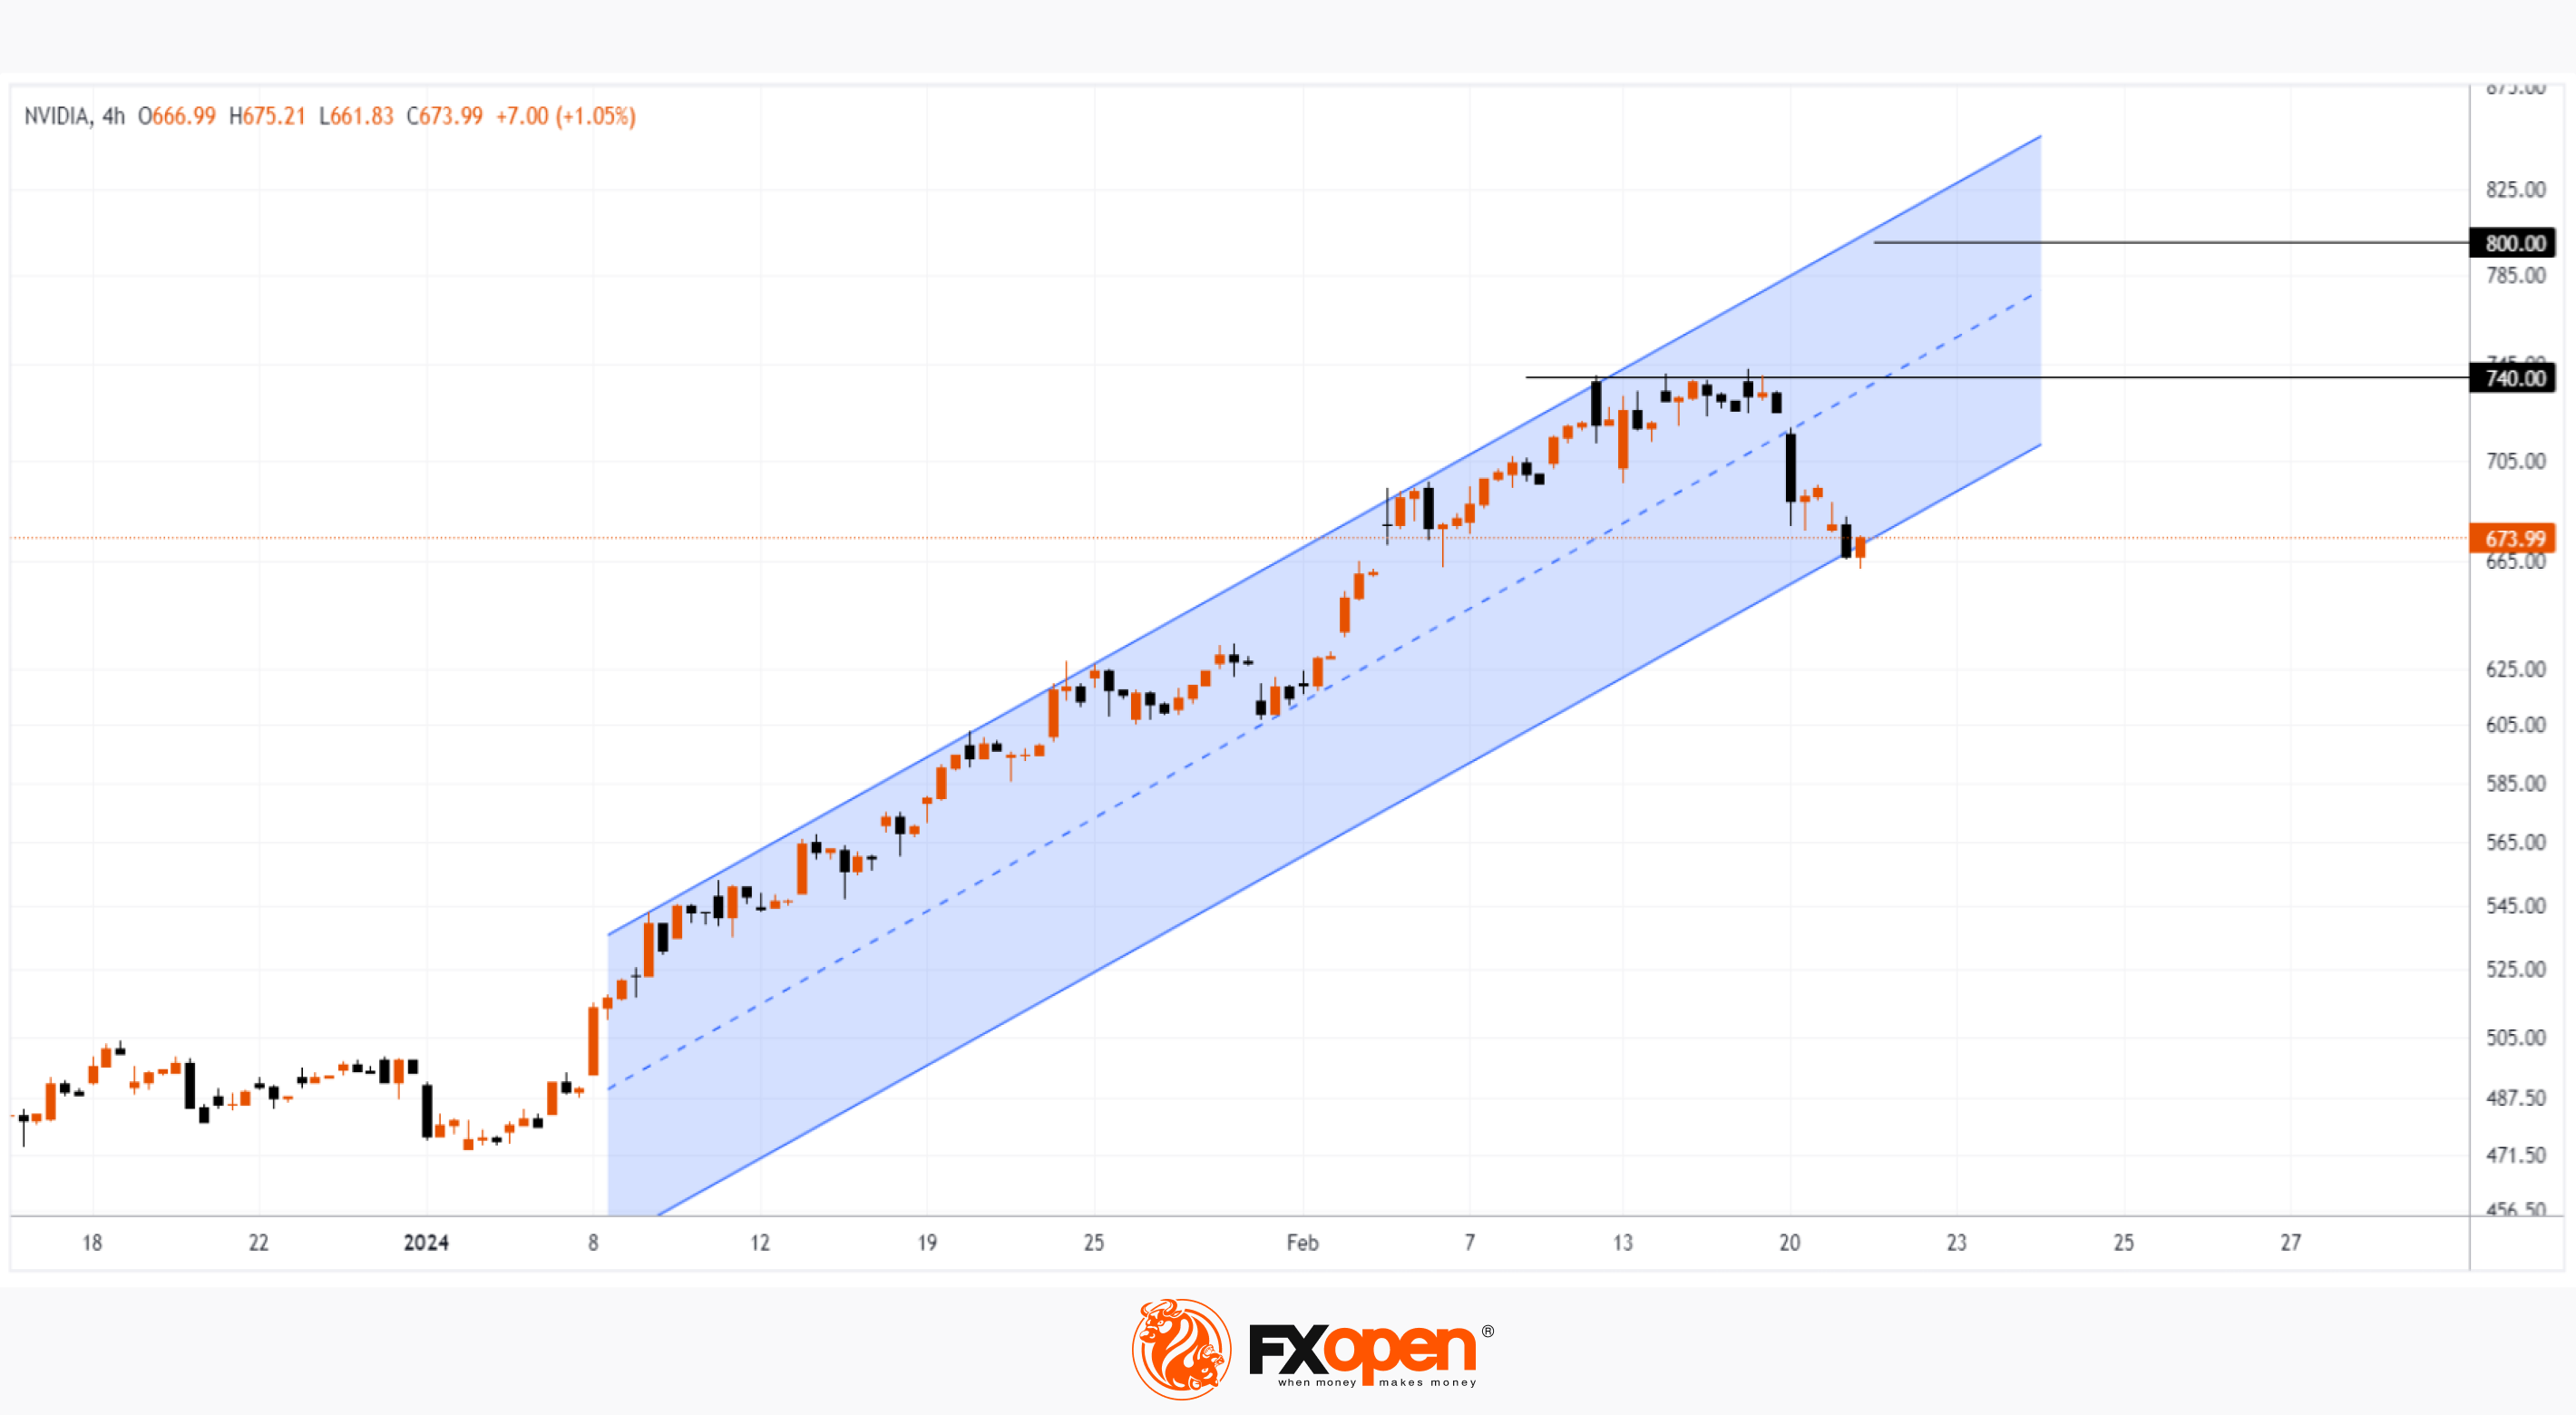
The NVDA stock chart shows that:
→ the USD 740 level acted as resistance in February;
→ however, taking into account the post-market price, we can assume that today at the opening of trading this resistance level will be broken and in the future, according to the logic of technical analysis, will begin to provide support;
→ in this case, a rebound will be formed from the lower line of the channel (shown in blue) and a wide bullish gap.
It's likely that the excitement surrounding Nvidia's strong report will continue. But the closer the price of NVDA rises to the upper border of the channel (which is located around the psychological level of USD 800), the more signs of overbought there will be on the indicators — therefore, the preconditions will be created for a correction after the extraordinary growth.
Buy and sell stocks of the world's biggest publicly-listed companies with CFDs on FXOpen’s trading platform. Open your FXOpen account now or learn more about trading share CFDs with FXOpen.
CFDs are complex instruments and come with a high risk of losing your money.
This article represents the opinion of the Companies operating under the FXOpen brand only. It is not to be construed as an offer, solicitation, or recommendation with respect to products and services provided by the Companies operating under the FXOpen brand, nor is it to be considered financial advice.
NVDA Share Price Soars 11% after Report
The signs of concern we wrote about yesterday have largely subsided. After three days of declines, the price of E-mini Nasdaq 100 futures bounced off the lower boundary of the channel (see yesterday's chart) and rose, led by NVDA stock.
Nvidia's quarterly report exceeded expectations:
→ earnings per share: actual = USD 5.16, expected = USD 4.59;
→ gross revenue: actual = USD 22.10 billion, expected = USD 20.39 billion.
According to the head of the company:
→ Accelerated computing and generative AI have reached a tipping point.
→ Demand for computing is growing worldwide among companies, industries and governments.
→ The coming year will bring major new product cycles with exceptional innovations that will help propel the industry forward.
In post-market trading, NVDA's price rose 11% to over USD 740 per share. Thus, the price increase for NVDA since the beginning of 2024 is about 50%.
The NVDA stock chart shows that:
→ the USD 740 level acted as resistance in February;
→ however, taking into account the post-market price, we can assume that today at the opening of trading this resistance level will be broken and in the future, according to the logic of technical analysis, will begin to provide support;
→ in this case, a rebound will be formed from the lower line of the channel (shown in blue) and a wide bullish gap.
It's likely that the excitement surrounding Nvidia's strong report will continue. But the closer the price of NVDA rises to the upper border of the channel (which is located around the psychological level of USD 800), the more signs of overbought there will be on the indicators — therefore, the preconditions will be created for a correction after the extraordinary growth.
Buy and sell stocks of the world's biggest publicly-listed companies with CFDs on FXOpen’s trading platform. Open your FXOpen account now or learn more about trading share CFDs with FXOpen.
CFDs are complex instruments and come with a high risk of losing your money.
This article represents the opinion of the Companies operating under the FXOpen brand only. It is not to be construed as an offer, solicitation, or recommendation with respect to products and services provided by the Companies operating under the FXOpen brand, nor is it to be considered financial advice.
👍2
#marketanalysis #MarketNews #tradingforex
EUR/USD Analysis: Euro Showing Signs of Strength
Today news was published about the values of PMI indices for European economies. Data from France was encouraging:
→ French Flash Manufacturing PMI: actual = 46.8, expected = 43.5, a month ago = 43.1;
→ French Flash Services PMI: actual = 48.0, expected = 45.7, a month ago = 45.4.
Data from Germany were less optimistic, so the euro's rise was interrupted, but in the end the euro still rose in price on this news relative to other currencies.
For example, the price of EUR/JPY broke through the resistance level of 163 yen per euro — the euro rose to this level for the first time since November last year.
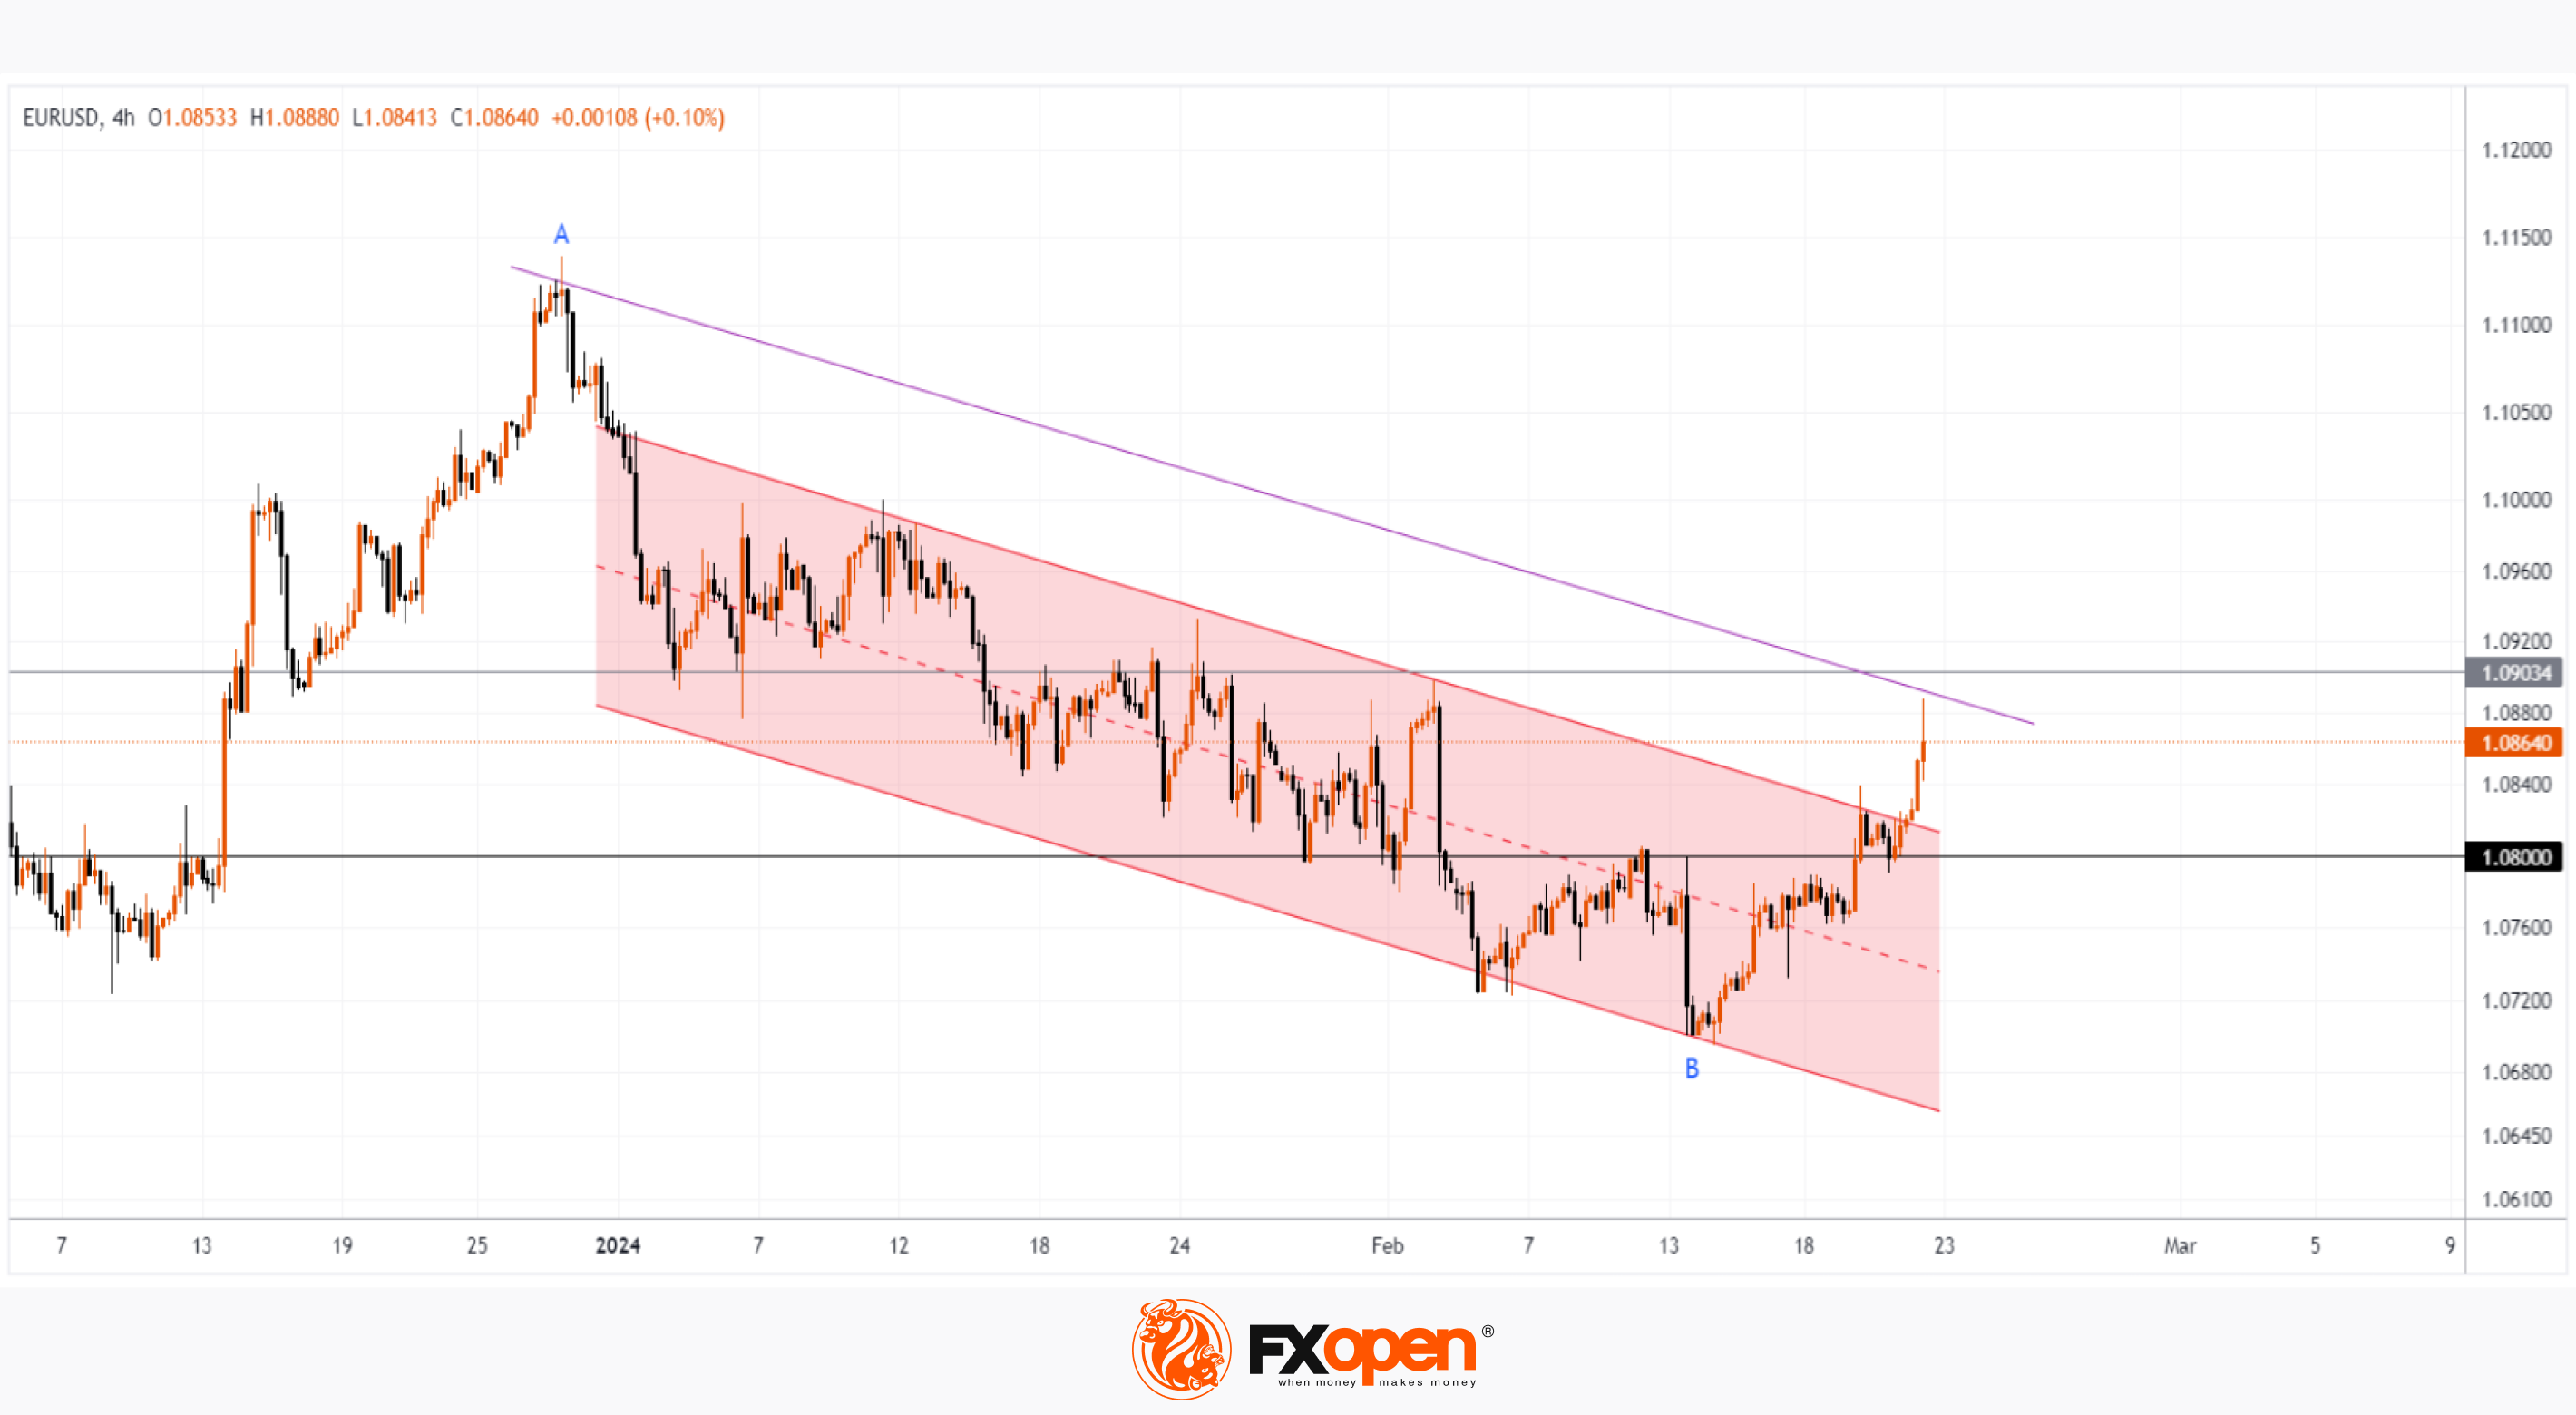
The EUR/USD chart shows an attempt to break out of the bearish channel (shown in red). Of interest are:
→ level 1.08 – it acted as resistance in mid-February, but is already showing signs of support;
→ level 1.09 – the price of EUR/USD also reacted to it in the past, and in addition – in this area there is a 50% Fibo level from the decline in A→B;
→ the resistance line (drawn from point A in purple) can also affect the price.
How strong the bulls really are will be determined by the price action near the block of the listed resistances, as well as by the reaction to news about the US PMI; data will be published today, at 17:45 GMT+3.
Trade over 50 forex markets 24 hours a day with FXOpen. Take advantage of low commissions, deep liquidity, and spreads from 0.0 pips. Open your FXOpen account now or learn more about trading forex with FXOpen.
CFDs are complex instruments and come with a high risk of losing your money.
This article represents the opinion of the Companies operating under the FXOpen brand only. It is not to be construed as an offer, solicitation, or recommendation with respect to products and services provided by the Companies operating under the FXOpen brand, nor is it to be considered financial advice.
EUR/USD Analysis: Euro Showing Signs of Strength
Today news was published about the values of PMI indices for European economies. Data from France was encouraging:
→ French Flash Manufacturing PMI: actual = 46.8, expected = 43.5, a month ago = 43.1;
→ French Flash Services PMI: actual = 48.0, expected = 45.7, a month ago = 45.4.
Data from Germany were less optimistic, so the euro's rise was interrupted, but in the end the euro still rose in price on this news relative to other currencies.
For example, the price of EUR/JPY broke through the resistance level of 163 yen per euro — the euro rose to this level for the first time since November last year.
The EUR/USD chart shows an attempt to break out of the bearish channel (shown in red). Of interest are:
→ level 1.08 – it acted as resistance in mid-February, but is already showing signs of support;
→ level 1.09 – the price of EUR/USD also reacted to it in the past, and in addition – in this area there is a 50% Fibo level from the decline in A→B;
→ the resistance line (drawn from point A in purple) can also affect the price.
How strong the bulls really are will be determined by the price action near the block of the listed resistances, as well as by the reaction to news about the US PMI; data will be published today, at 17:45 GMT+3.
Trade over 50 forex markets 24 hours a day with FXOpen. Take advantage of low commissions, deep liquidity, and spreads from 0.0 pips. Open your FXOpen account now or learn more about trading forex with FXOpen.
CFDs are complex instruments and come with a high risk of losing your money.
This article represents the opinion of the Companies operating under the FXOpen brand only. It is not to be construed as an offer, solicitation, or recommendation with respect to products and services provided by the Companies operating under the FXOpen brand, nor is it to be considered financial advice.
👍3
#marketanalysis #stockmarket #sp500
Nvidia's Successes Helps S&P 500 Price Reach Its All-time High
Yesterday, the price of the S&P 500 stock index rose to record closing highs on Thursday. Moreover, such a growth rate (+2.11% per day) has not been observed for 13 months.
Reasons for Extremely Bullish Sentiment:
→ Nvidia's report, which showed impressive earnings and prospects (the company forecasts roughly threefold revenue growth in the first quarter of 2024 amid strong demand for its AI chips). Nvidia's capitalization grew by USD 277 billion in one day — a historical record for the US stock market.
→ Positive news background for yesterday: the US Flash Manufacturing PMI index was actually = 51.5, expected = 50.5, a month ago = 50.7. Signals from the labor market were also positive - the weekly number of applications for unemployment benefits turned out to be = 201k (expected = 217k).
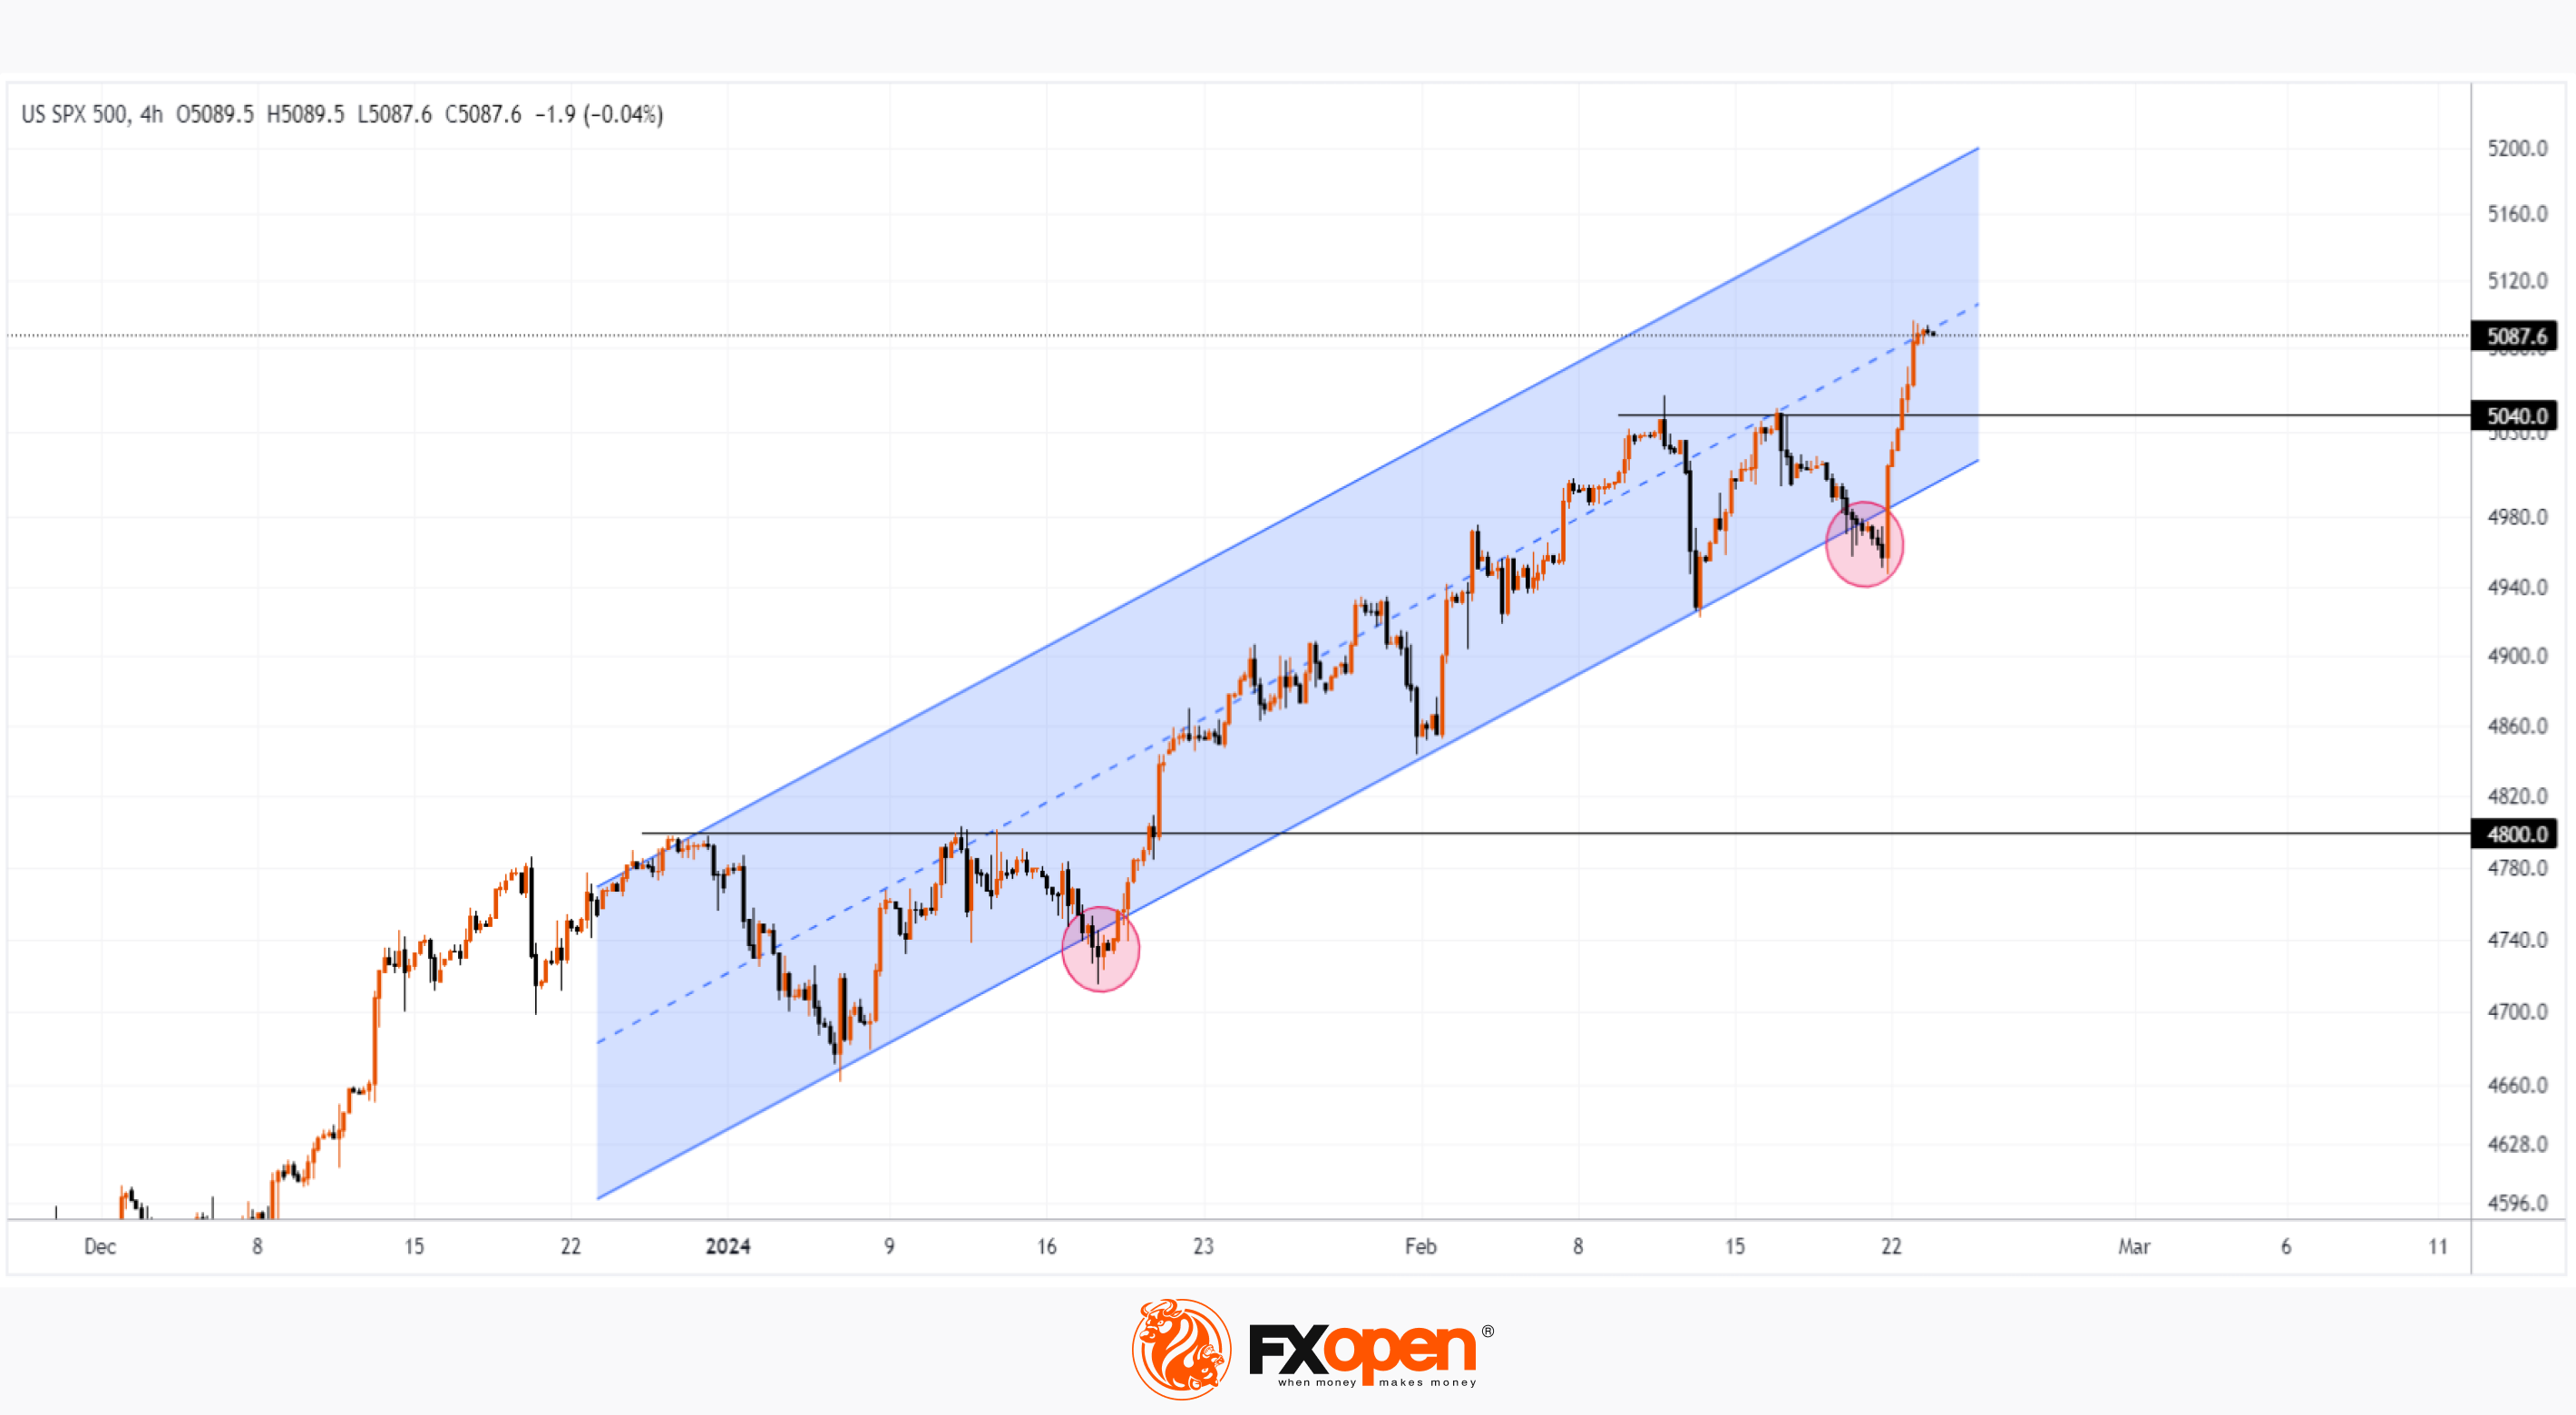
Technical analysis of the S&P 500 chart shows that the price continues to move within the ascending channel, which has been in effect since the beginning of 2024 (shown in blue).
Interestingly, the price of the S&P 500 made a small breakdown of the lower boundary on February 21; a similar pattern was observed on January 17 (both patterns are circled in red). In both cases:
→ after a false breakout of the lower border, a decisive breakout of the resistance level followed: in January this was the level of 4,800, yesterday, the level of 5,040 was broken.
→ The price showed signs of consolidation having reached the median line of the channel.
If the price of the S&P 500 continues to act according to the same scenario, we may see the formation of price consolidation above the broken level of 5,040 and its gradual increase along the median.
Trade global index CFDs with zero commission and tight spreads. Open your FXOpen account now or learn more about trading index CFDs with FXOpen.
CFDs are complex instruments and come with a high risk of losing your money.
This article represents the opinion of the Companies operating under the FXOpen brand only. It is not to be construed as an offer, solicitation, or recommendation with respect to products and services provided by the Companies operating under the FXOpen brand, nor is it to be considered financial advice.
Nvidia's Successes Helps S&P 500 Price Reach Its All-time High
Yesterday, the price of the S&P 500 stock index rose to record closing highs on Thursday. Moreover, such a growth rate (+2.11% per day) has not been observed for 13 months.
Reasons for Extremely Bullish Sentiment:
→ Nvidia's report, which showed impressive earnings and prospects (the company forecasts roughly threefold revenue growth in the first quarter of 2024 amid strong demand for its AI chips). Nvidia's capitalization grew by USD 277 billion in one day — a historical record for the US stock market.
→ Positive news background for yesterday: the US Flash Manufacturing PMI index was actually = 51.5, expected = 50.5, a month ago = 50.7. Signals from the labor market were also positive - the weekly number of applications for unemployment benefits turned out to be = 201k (expected = 217k).
Technical analysis of the S&P 500 chart shows that the price continues to move within the ascending channel, which has been in effect since the beginning of 2024 (shown in blue).
Interestingly, the price of the S&P 500 made a small breakdown of the lower boundary on February 21; a similar pattern was observed on January 17 (both patterns are circled in red). In both cases:
→ after a false breakout of the lower border, a decisive breakout of the resistance level followed: in January this was the level of 4,800, yesterday, the level of 5,040 was broken.
→ The price showed signs of consolidation having reached the median line of the channel.
If the price of the S&P 500 continues to act according to the same scenario, we may see the formation of price consolidation above the broken level of 5,040 and its gradual increase along the median.
Trade global index CFDs with zero commission and tight spreads. Open your FXOpen account now or learn more about trading index CFDs with FXOpen.
CFDs are complex instruments and come with a high risk of losing your money.
This article represents the opinion of the Companies operating under the FXOpen brand only. It is not to be construed as an offer, solicitation, or recommendation with respect to products and services provided by the Companies operating under the FXOpen brand, nor is it to be considered financial advice.
👍3
#bitcoin #crypto #cryptonews #marketanalysis
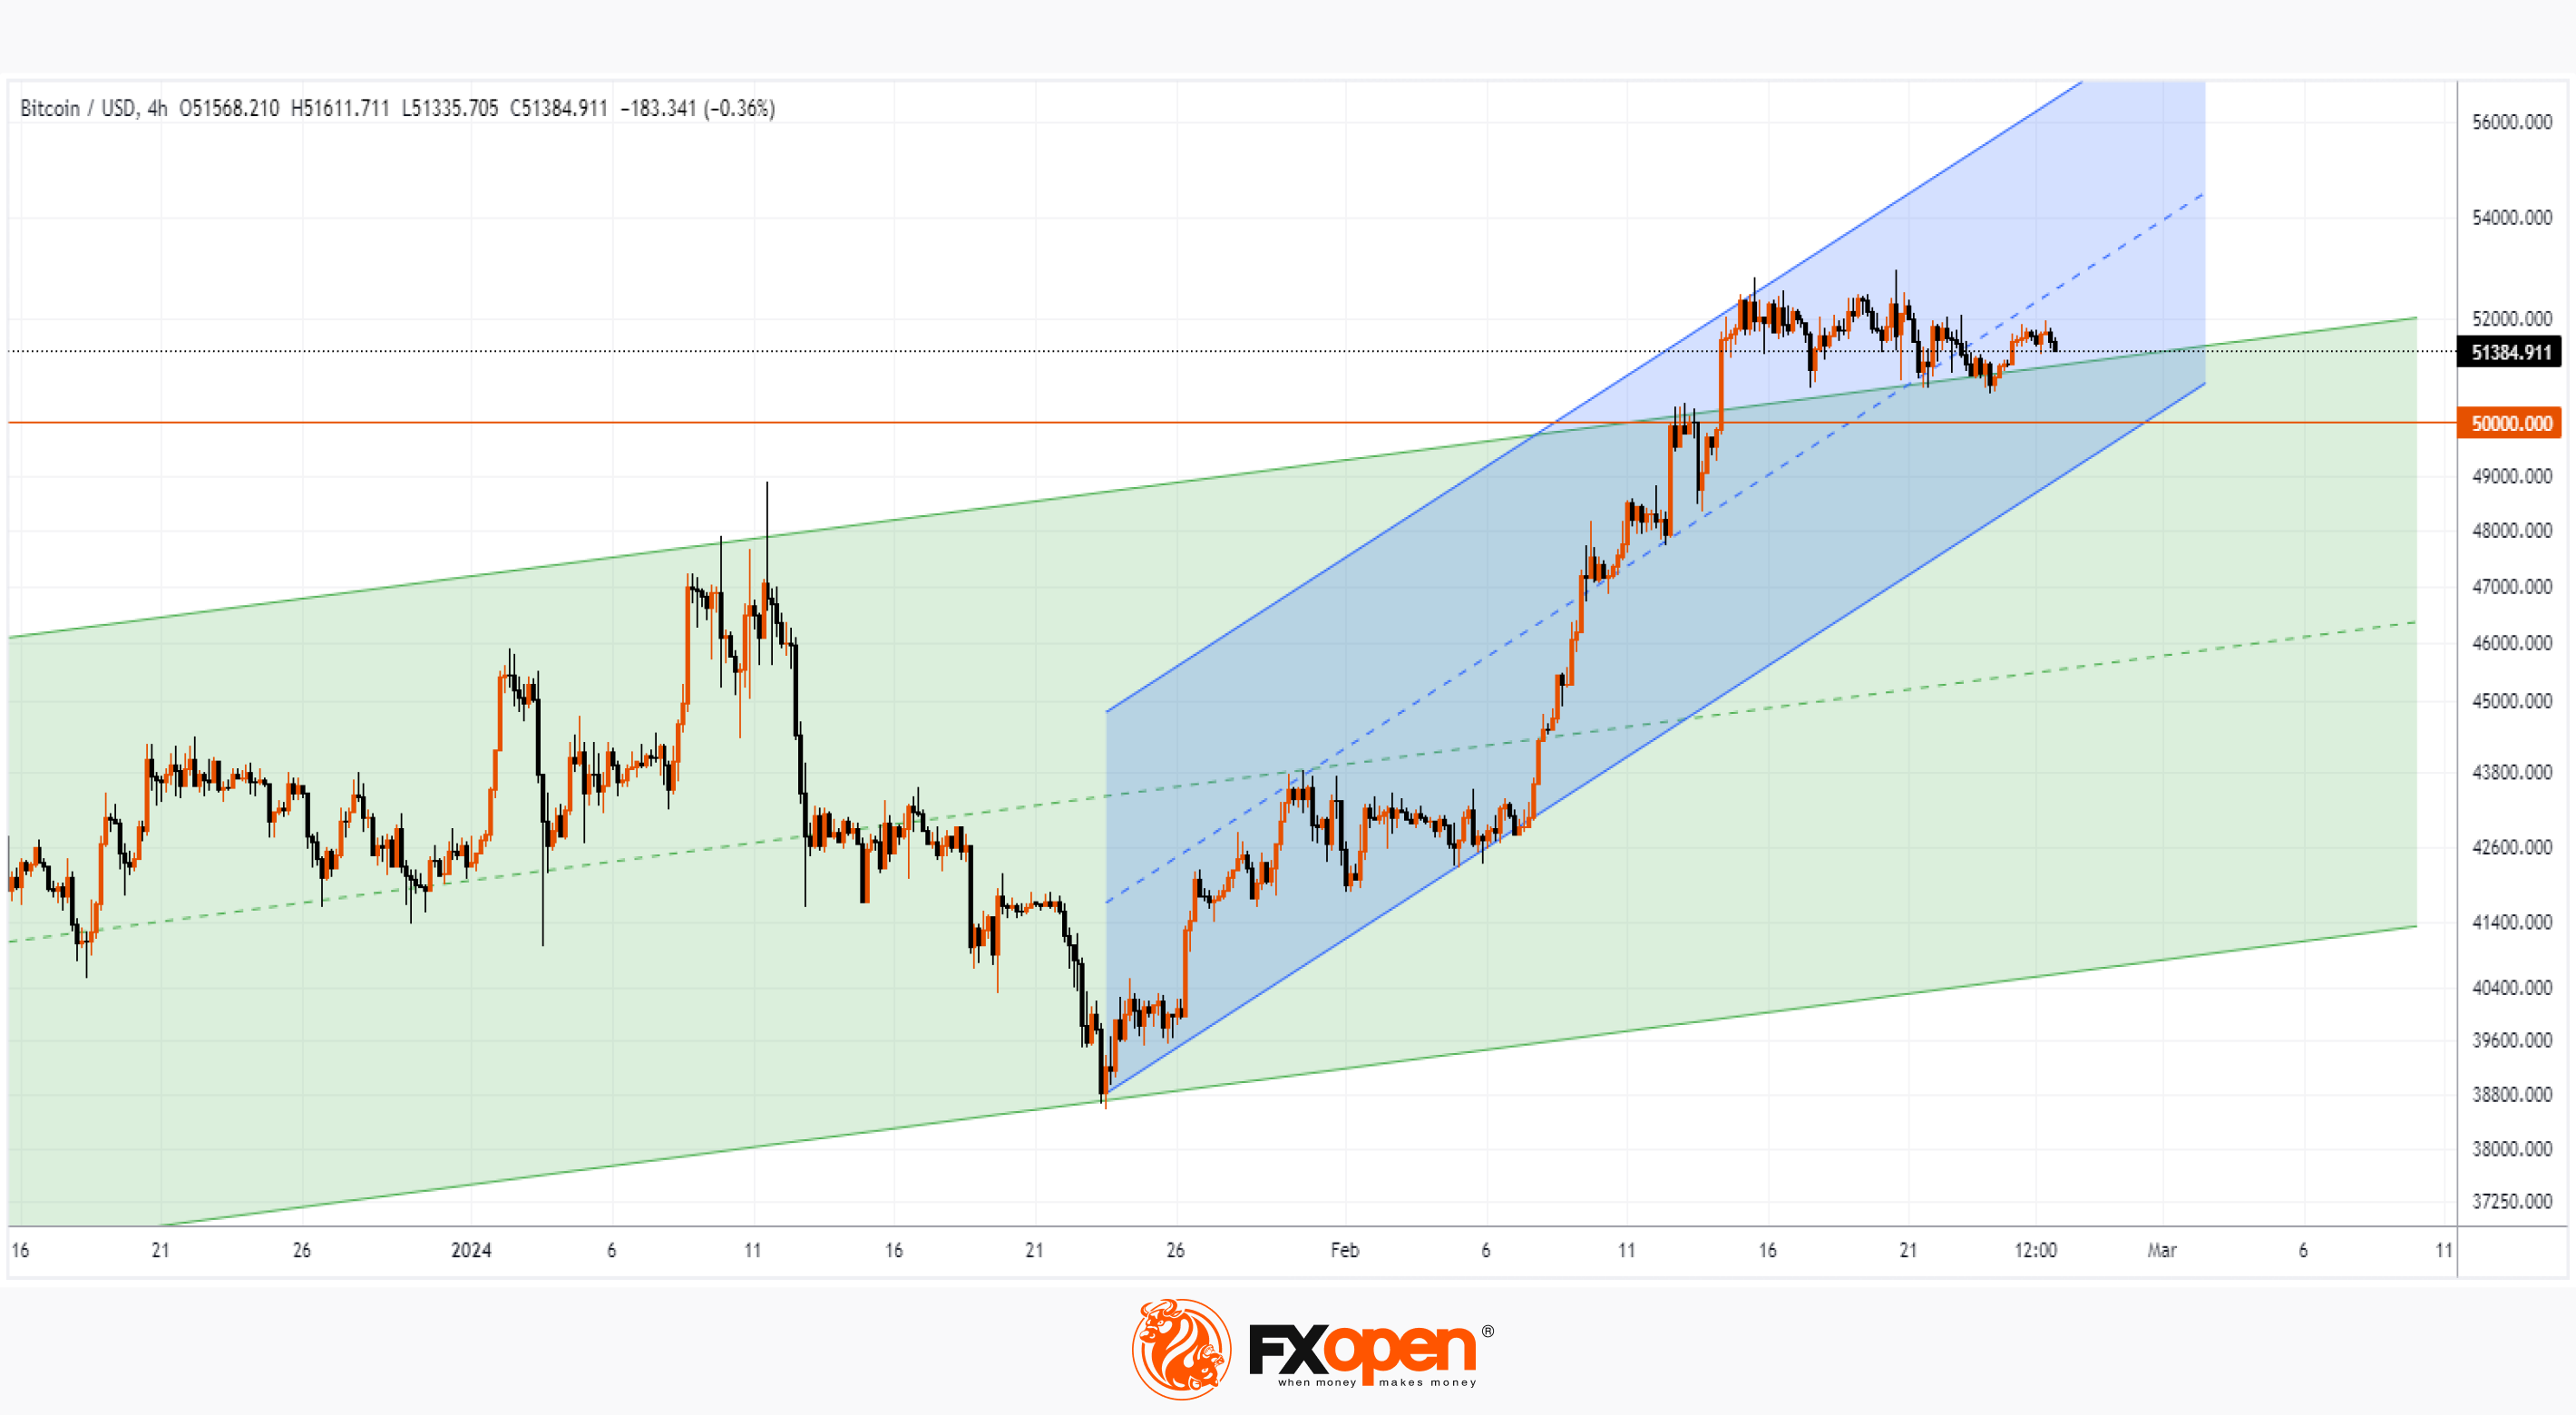
Bitcoin Price Risks Not Staying above $50k
On February 14, a strong bullish impulse was recorded in the BTC/USD market, which pushed the price of bitcoin to the area above USD 50k.
The main driver of growth was the effect of the launch of a bitcoin ETF. More than a month has passed since this event, and according to media reports, the ETF has seen an influx of more than USD 7 billion. For example, BlackRock has about 125k bitcoins on its balance sheet to support its ETF fund.
Also adding to the positive mood among market participants is news about the benefits received by companies that invested in bitcoin: MicroStrategy, Block and others. Among the latest news is Reddit's decision to invest in bitcoin.
However, technical analysis of the BTC/USD chart shows alarming signs:
→ bitcoin price has slightly exceeded the upper limit of the larger ascending channel (shown in green), but how does it behave in tests? The upper border has changed its role from resistance to support (according to the classic technical analysis pattern), but rebounds from this support line quickly lose momentum. The price does not seem to have the energy (force of demand) to rise from the existing support level.
→ Bitcoin price dropped to the lower border of a smaller ascending channel (shown in blue) - a sign that the February positive is running out.
Given the signs of weakening demand, it is possible that we will see an attempt by the bears to take the initiative and return the price of bitcoin below the psychological level of 50k per coin.
FXOpen offers the world's most popular cryptocurrency CFDs*, including Bitcoin and Ethereum. Floating spreads, 1:2 leverage — at your service. Open your trading account now or learn more about crypto CFD trading with FXOpen.
*At FXOpen UK and FXOpen AU, Cryptocurrency CFDs are only available for trading by those clients categorised as Professional clients under FCA Rules and Professional clients under ASIC Rules respectively. They are not available for trading by Retail clients.
CFDs are complex instruments and come with a high risk of losing your money.
This article represents the opinion of the Companies operating under the FXOpen brand only. It is not to be construed as an offer, solicitation, or recommendation with respect to products and services provided by the Companies operating under the FXOpen brand, nor is it to be considered financial advice.
Bitcoin Price Risks Not Staying above $50k
On February 14, a strong bullish impulse was recorded in the BTC/USD market, which pushed the price of bitcoin to the area above USD 50k.
The main driver of growth was the effect of the launch of a bitcoin ETF. More than a month has passed since this event, and according to media reports, the ETF has seen an influx of more than USD 7 billion. For example, BlackRock has about 125k bitcoins on its balance sheet to support its ETF fund.
Also adding to the positive mood among market participants is news about the benefits received by companies that invested in bitcoin: MicroStrategy, Block and others. Among the latest news is Reddit's decision to invest in bitcoin.
However, technical analysis of the BTC/USD chart shows alarming signs:
→ bitcoin price has slightly exceeded the upper limit of the larger ascending channel (shown in green), but how does it behave in tests? The upper border has changed its role from resistance to support (according to the classic technical analysis pattern), but rebounds from this support line quickly lose momentum. The price does not seem to have the energy (force of demand) to rise from the existing support level.
→ Bitcoin price dropped to the lower border of a smaller ascending channel (shown in blue) - a sign that the February positive is running out.
Given the signs of weakening demand, it is possible that we will see an attempt by the bears to take the initiative and return the price of bitcoin below the psychological level of 50k per coin.
FXOpen offers the world's most popular cryptocurrency CFDs*, including Bitcoin and Ethereum. Floating spreads, 1:2 leverage — at your service. Open your trading account now or learn more about crypto CFD trading with FXOpen.
*At FXOpen UK and FXOpen AU, Cryptocurrency CFDs are only available for trading by those clients categorised as Professional clients under FCA Rules and Professional clients under ASIC Rules respectively. They are not available for trading by Retail clients.
CFDs are complex instruments and come with a high risk of losing your money.
This article represents the opinion of the Companies operating under the FXOpen brand only. It is not to be construed as an offer, solicitation, or recommendation with respect to products and services provided by the Companies operating under the FXOpen brand, nor is it to be considered financial advice.
👍2
#stockmarket #AMZN #MarketNews
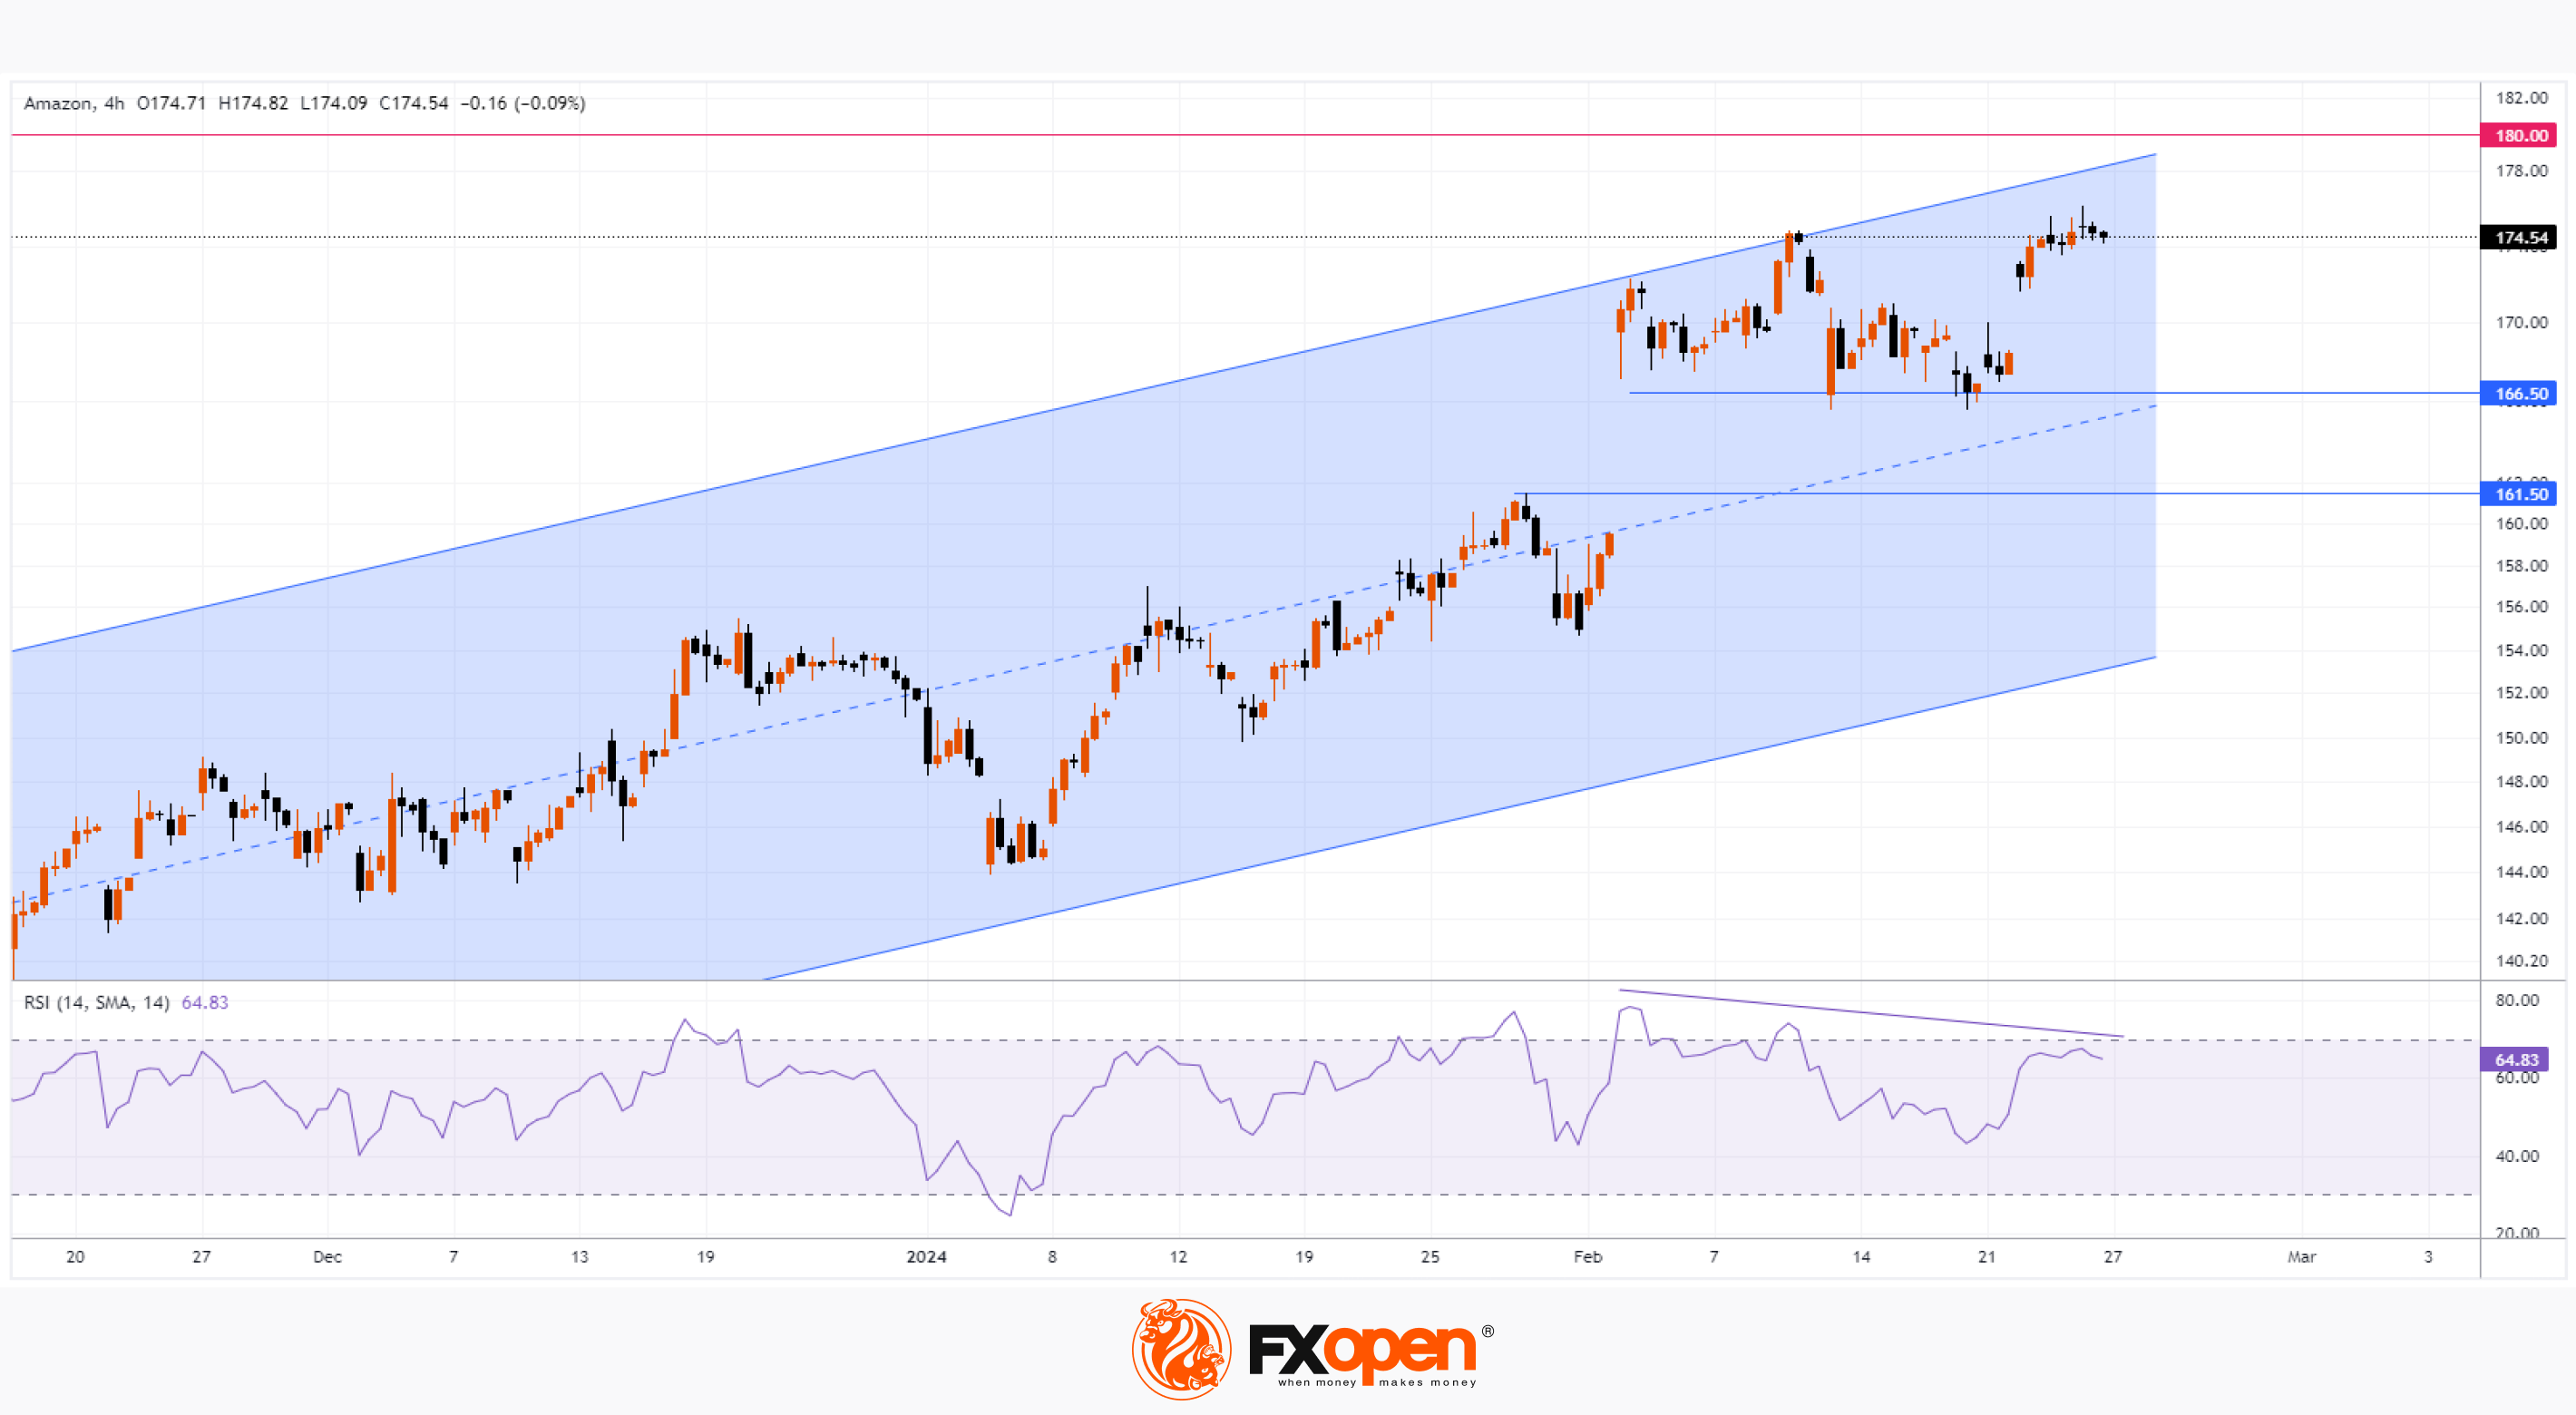
AMZN Share Price Hits 25-Month High After Inclusion in DJIA Index
As of February 26, Walgreens Boots Alliance (WBA) is no longer used in the calculation of the Dow Jones Industrial Average, replaced by Amazon (AMZN).
The planned index rebalancing was carried out because:
→ Walgreens shares currently have the lowest price among all companies included in the Dow index;
→ S&P Dow Jones Indices adds Amazon as it seeks to increase the Dow's retail exposure to reflect the emerging nature of the US economy. This was also influenced by the fact that shares of the retail chain Walmart (WMT) underwent a 3:1 split.
The AMZN stock chart today shows that:
→ the AMZN stock price is moving in an upward trend, its contours are indicated by a blue channel;
→ after a strong report (we wrote about this on February 5), a bullish gap formed on the chart — it is now more clearly visible between the levels of 161.5 and 166.5;
→ in the last days of winter, the price approached the upper border of the channel;
→ the price is in the upper half of the channel, and the median line (reinforced by the gap area), according to technical analysis, has the potential to provide support to it;
The inclusion of AMZN stock in the WMT Index means that the AMZN stock market may experience a short-term surge in demand (as it often does in similar cases) as various index funds will be forced to buy AMZN stock (and sell WBA) to make their portfolios match the Dow Jones Industrial Average.
However:
→ the price of AMZN today may already take into account the rebalancing that was announced earlier;
→ as you know, in 2021, Jeff Bezos actively sold his AMZN shares at a price of $180 per share. At the same time, according to annual corporate reporting, Bezos intends to sell about 50 million shares this year. This is seen as an argument holding back demand. And the bearish divergence on the RSI indicator hints at the depletion of buying pressure in the short term.
Although in the long term, taking into account the fundamentals, the market remains strong. According to the average opinion of TipRanks, analysts forecast shares AMZN = $208.23 in 12 months.
Buy and sell stocks of the world's biggest publicly-listed companies with CFDs on FXOpen’s trading platform. Open your FXOpen account now or learn more about trading share CFDs with FXOpen.
CFDs are complex instruments and come with a high risk of losing your money.
This article represents the opinion of the Companies operating under the FXOpen brand only. It is not to be construed as an offer, solicitation, or recommendation with respect to products and services provided by the Companies operating under the FXOpen brand, nor is it to be considered financial advice.
AMZN Share Price Hits 25-Month High After Inclusion in DJIA Index
As of February 26, Walgreens Boots Alliance (WBA) is no longer used in the calculation of the Dow Jones Industrial Average, replaced by Amazon (AMZN).
The planned index rebalancing was carried out because:
→ Walgreens shares currently have the lowest price among all companies included in the Dow index;
→ S&P Dow Jones Indices adds Amazon as it seeks to increase the Dow's retail exposure to reflect the emerging nature of the US economy. This was also influenced by the fact that shares of the retail chain Walmart (WMT) underwent a 3:1 split.
The AMZN stock chart today shows that:
→ the AMZN stock price is moving in an upward trend, its contours are indicated by a blue channel;
→ after a strong report (we wrote about this on February 5), a bullish gap formed on the chart — it is now more clearly visible between the levels of 161.5 and 166.5;
→ in the last days of winter, the price approached the upper border of the channel;
→ the price is in the upper half of the channel, and the median line (reinforced by the gap area), according to technical analysis, has the potential to provide support to it;
The inclusion of AMZN stock in the WMT Index means that the AMZN stock market may experience a short-term surge in demand (as it often does in similar cases) as various index funds will be forced to buy AMZN stock (and sell WBA) to make their portfolios match the Dow Jones Industrial Average.
However:
→ the price of AMZN today may already take into account the rebalancing that was announced earlier;
→ as you know, in 2021, Jeff Bezos actively sold his AMZN shares at a price of $180 per share. At the same time, according to annual corporate reporting, Bezos intends to sell about 50 million shares this year. This is seen as an argument holding back demand. And the bearish divergence on the RSI indicator hints at the depletion of buying pressure in the short term.
Although in the long term, taking into account the fundamentals, the market remains strong. According to the average opinion of TipRanks, analysts forecast shares AMZN = $208.23 in 12 months.
Buy and sell stocks of the world's biggest publicly-listed companies with CFDs on FXOpen’s trading platform. Open your FXOpen account now or learn more about trading share CFDs with FXOpen.
CFDs are complex instruments and come with a high risk of losing your money.
This article represents the opinion of the Companies operating under the FXOpen brand only. It is not to be construed as an offer, solicitation, or recommendation with respect to products and services provided by the Companies operating under the FXOpen brand, nor is it to be considered financial advice.
👍3
#AAPL #stockmarket #MarketNews
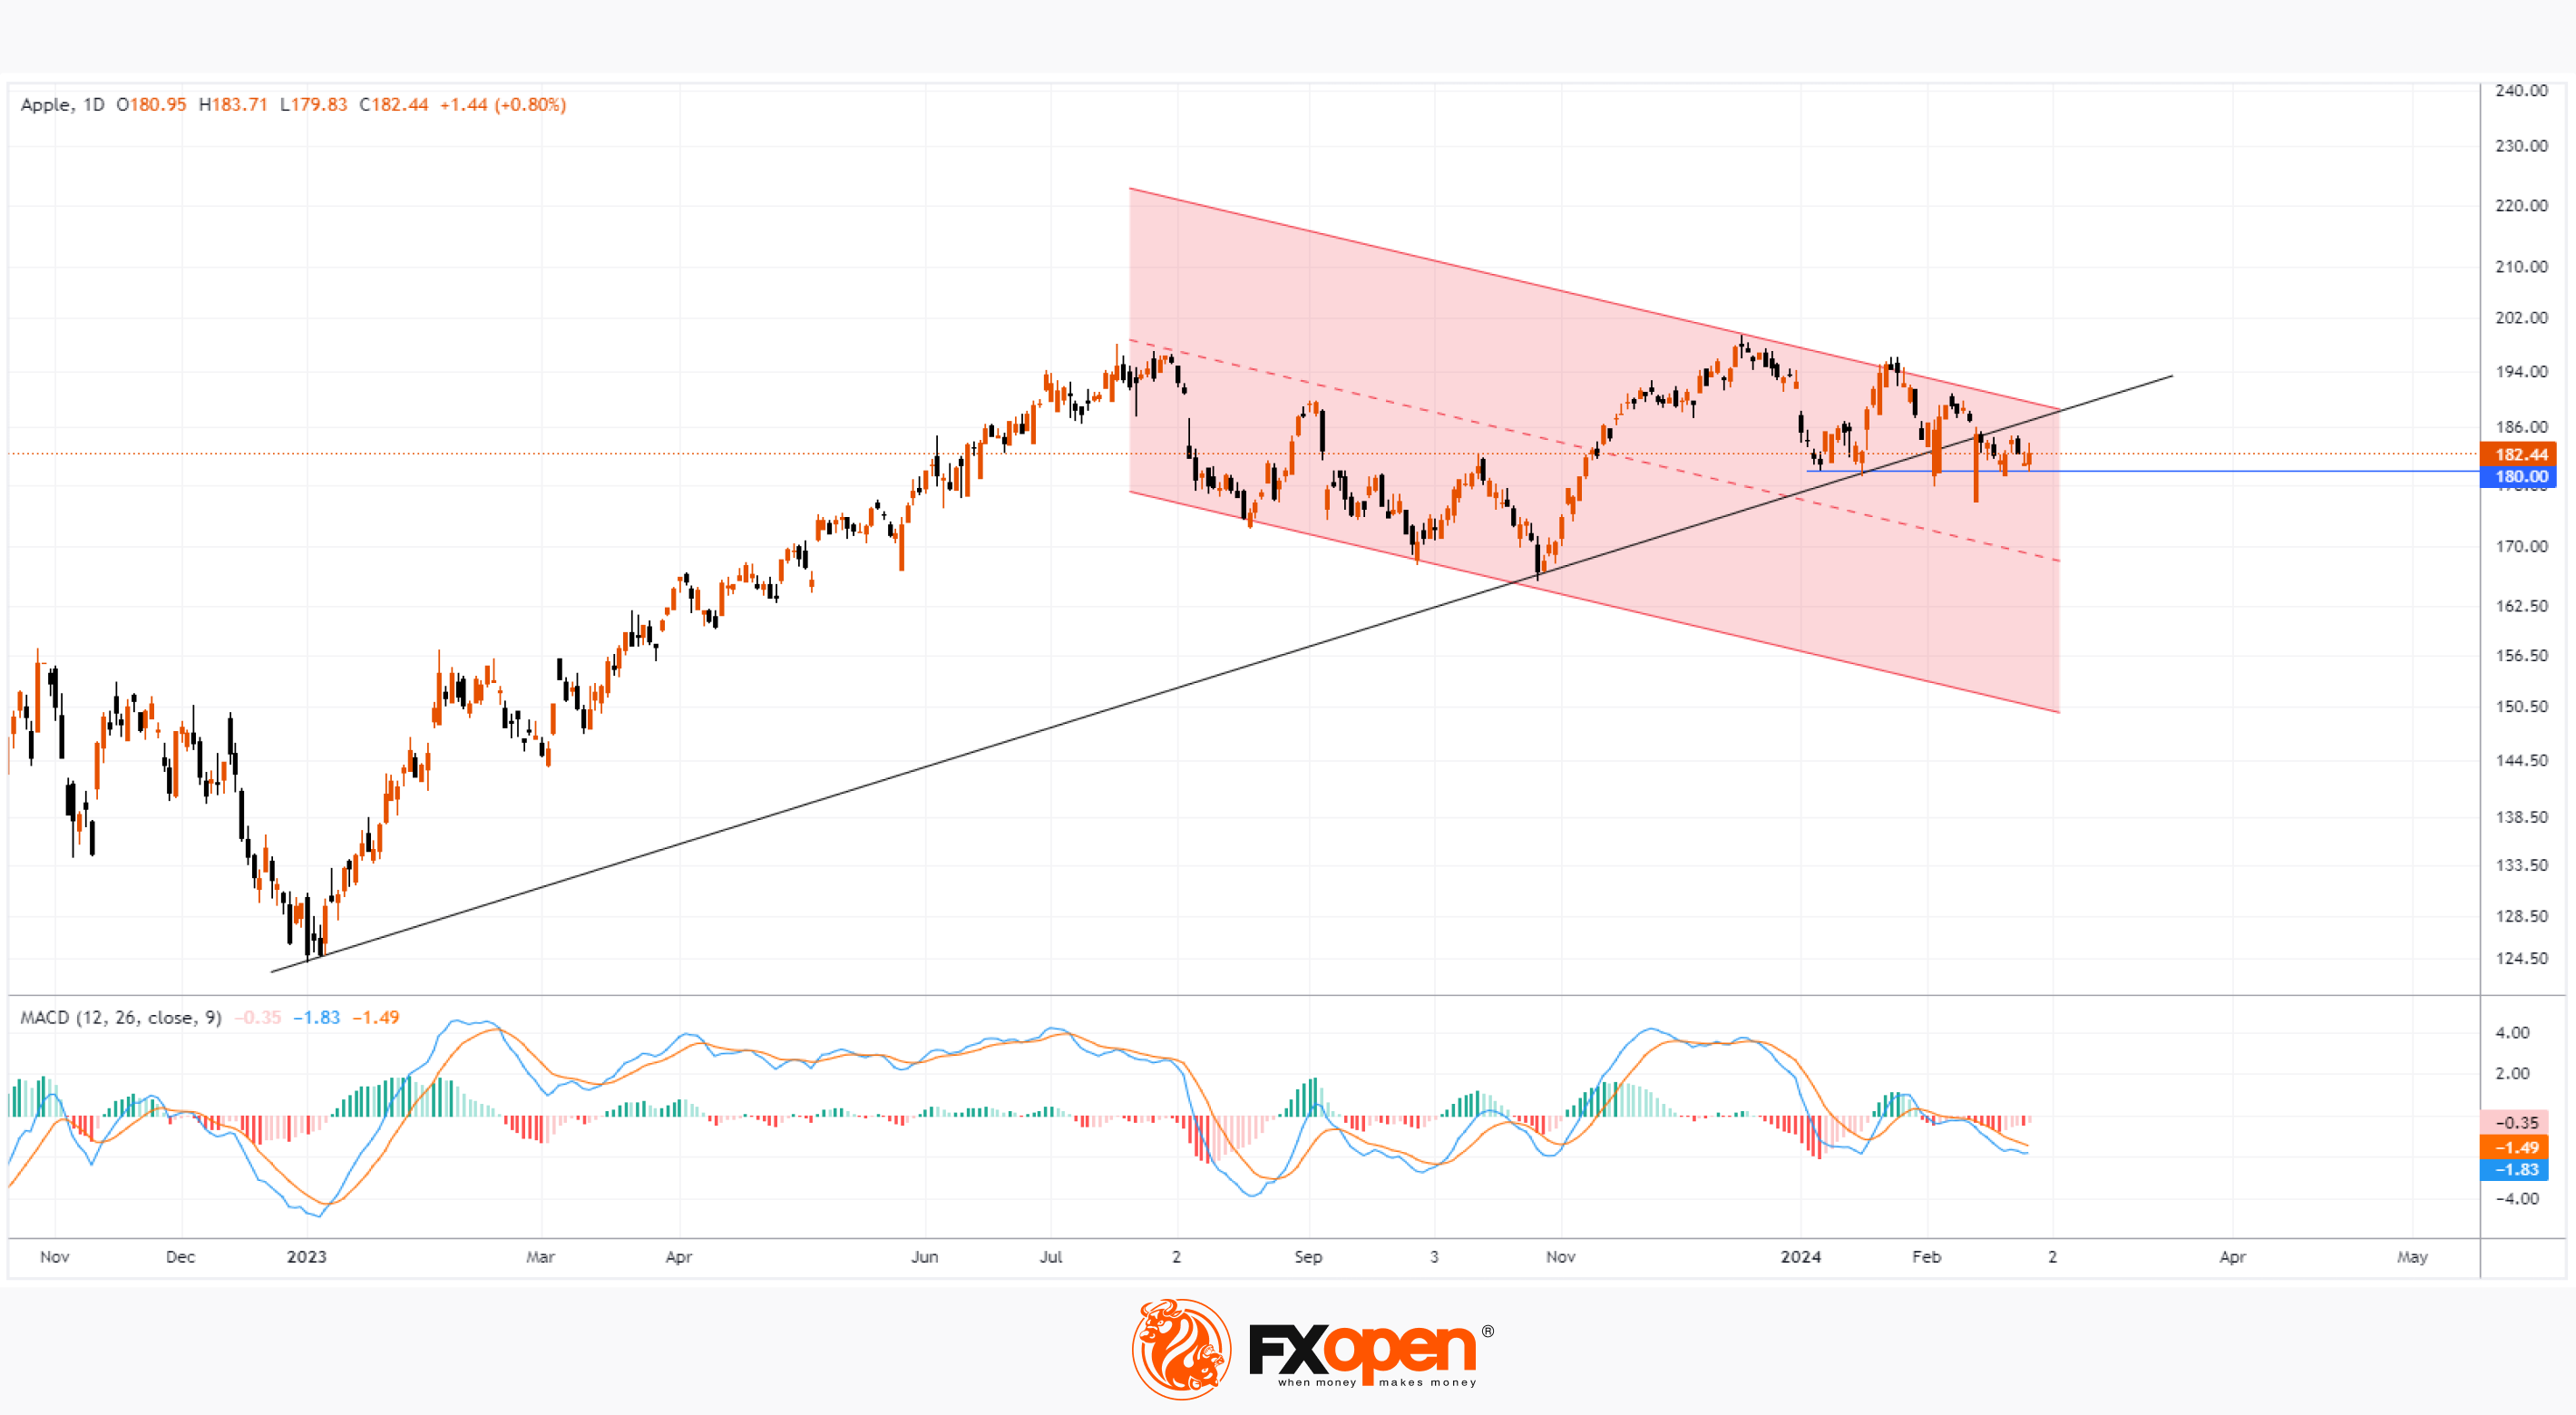
AAPL Share Price Rises Nearly 1% after Scrapping Electric Vehicle Plans
In 2021, the release of an electric car from Apple was expected in 2025, in 2022, the deadline was shifted to 2026. As it became known yesterday from Bloomberg and WSJ, Apple decided to completely abandon the project.
Causes for this decision:
→ the electric vehicle market turned out to be not so turbulent;
→ production and technological difficulties;
→ the strong development of electric vehicle construction in China may also have played a role.
Some employees will be fired, others will be transferred to a more promising department related to developments in the field of AI. Despite the fact that the ambitious project, which lasted about 10 years, failed, the price of AAPL shares rose by almost 1% yesterday as a result of trading — perhaps investors positively assessed the reorientation from electric vehicles to a more promising direction related to AI.
The AAPL stock chart shows that the level of USD 180 per share acts as support; several rebounds from it have already been formed in 2024. And the news about the abandonment of plans to produce electric vehicles caused the last of them. However, how reasonable is it to buy AAPL shares in such a situation?
Issues for bulls may include:
→ the fact that the price of AAPL is significantly weaker than stock indices, which are rewriting historical peaks thanks to NVDA, MSFT and other leaders;
→ the results of reorientation from electric vehicles to AI are a long-term and uncertain prospect;
→ from the point of view of technical analysis of AAPL stock, a downward trend appears on the chart (shown in red). Its upper border is a potential resistance line. And if there is a bearish breakout of the important USD 180 support, it could further resist the bulls' attempts to restore the AAPL share price.
Also causing negativity is that:
→ the price is fixed below the black trend line;
→ MACD is in bearish territory.
However, looking ahead to the next 12 months, analysts surveyed by TipRanks believe Apple shares will avoid a decline and benefit from the current bull market; their average price forecast for AAPL stock is USD 206.15.
Buy and sell stocks of the world's biggest publicly-listed companies with CFDs on FXOpen’s trading platform. Open your FXOpen account now or learn more about trading share CFDs with FXOpen.
CFDs are complex instruments and come with a high risk of losing your money.
This article represents the opinion of the Companies operating under the FXOpen brand only. It is not to be construed as an offer, solicitation, or recommendation with respect to products and services provided by the Companies operating under the FXOpen brand, nor is it to be considered financial advice.
AAPL Share Price Rises Nearly 1% after Scrapping Electric Vehicle Plans
In 2021, the release of an electric car from Apple was expected in 2025, in 2022, the deadline was shifted to 2026. As it became known yesterday from Bloomberg and WSJ, Apple decided to completely abandon the project.
Causes for this decision:
→ the electric vehicle market turned out to be not so turbulent;
→ production and technological difficulties;
→ the strong development of electric vehicle construction in China may also have played a role.
Some employees will be fired, others will be transferred to a more promising department related to developments in the field of AI. Despite the fact that the ambitious project, which lasted about 10 years, failed, the price of AAPL shares rose by almost 1% yesterday as a result of trading — perhaps investors positively assessed the reorientation from electric vehicles to a more promising direction related to AI.
The AAPL stock chart shows that the level of USD 180 per share acts as support; several rebounds from it have already been formed in 2024. And the news about the abandonment of plans to produce electric vehicles caused the last of them. However, how reasonable is it to buy AAPL shares in such a situation?
Issues for bulls may include:
→ the fact that the price of AAPL is significantly weaker than stock indices, which are rewriting historical peaks thanks to NVDA, MSFT and other leaders;
→ the results of reorientation from electric vehicles to AI are a long-term and uncertain prospect;
→ from the point of view of technical analysis of AAPL stock, a downward trend appears on the chart (shown in red). Its upper border is a potential resistance line. And if there is a bearish breakout of the important USD 180 support, it could further resist the bulls' attempts to restore the AAPL share price.
Also causing negativity is that:
→ the price is fixed below the black trend line;
→ MACD is in bearish territory.
However, looking ahead to the next 12 months, analysts surveyed by TipRanks believe Apple shares will avoid a decline and benefit from the current bull market; their average price forecast for AAPL stock is USD 206.15.
Buy and sell stocks of the world's biggest publicly-listed companies with CFDs on FXOpen’s trading platform. Open your FXOpen account now or learn more about trading share CFDs with FXOpen.
CFDs are complex instruments and come with a high risk of losing your money.
This article represents the opinion of the Companies operating under the FXOpen brand only. It is not to be construed as an offer, solicitation, or recommendation with respect to products and services provided by the Companies operating under the FXOpen brand, nor is it to be considered financial advice.
👍3
#marketanalysis #MarketNews #tradingtips
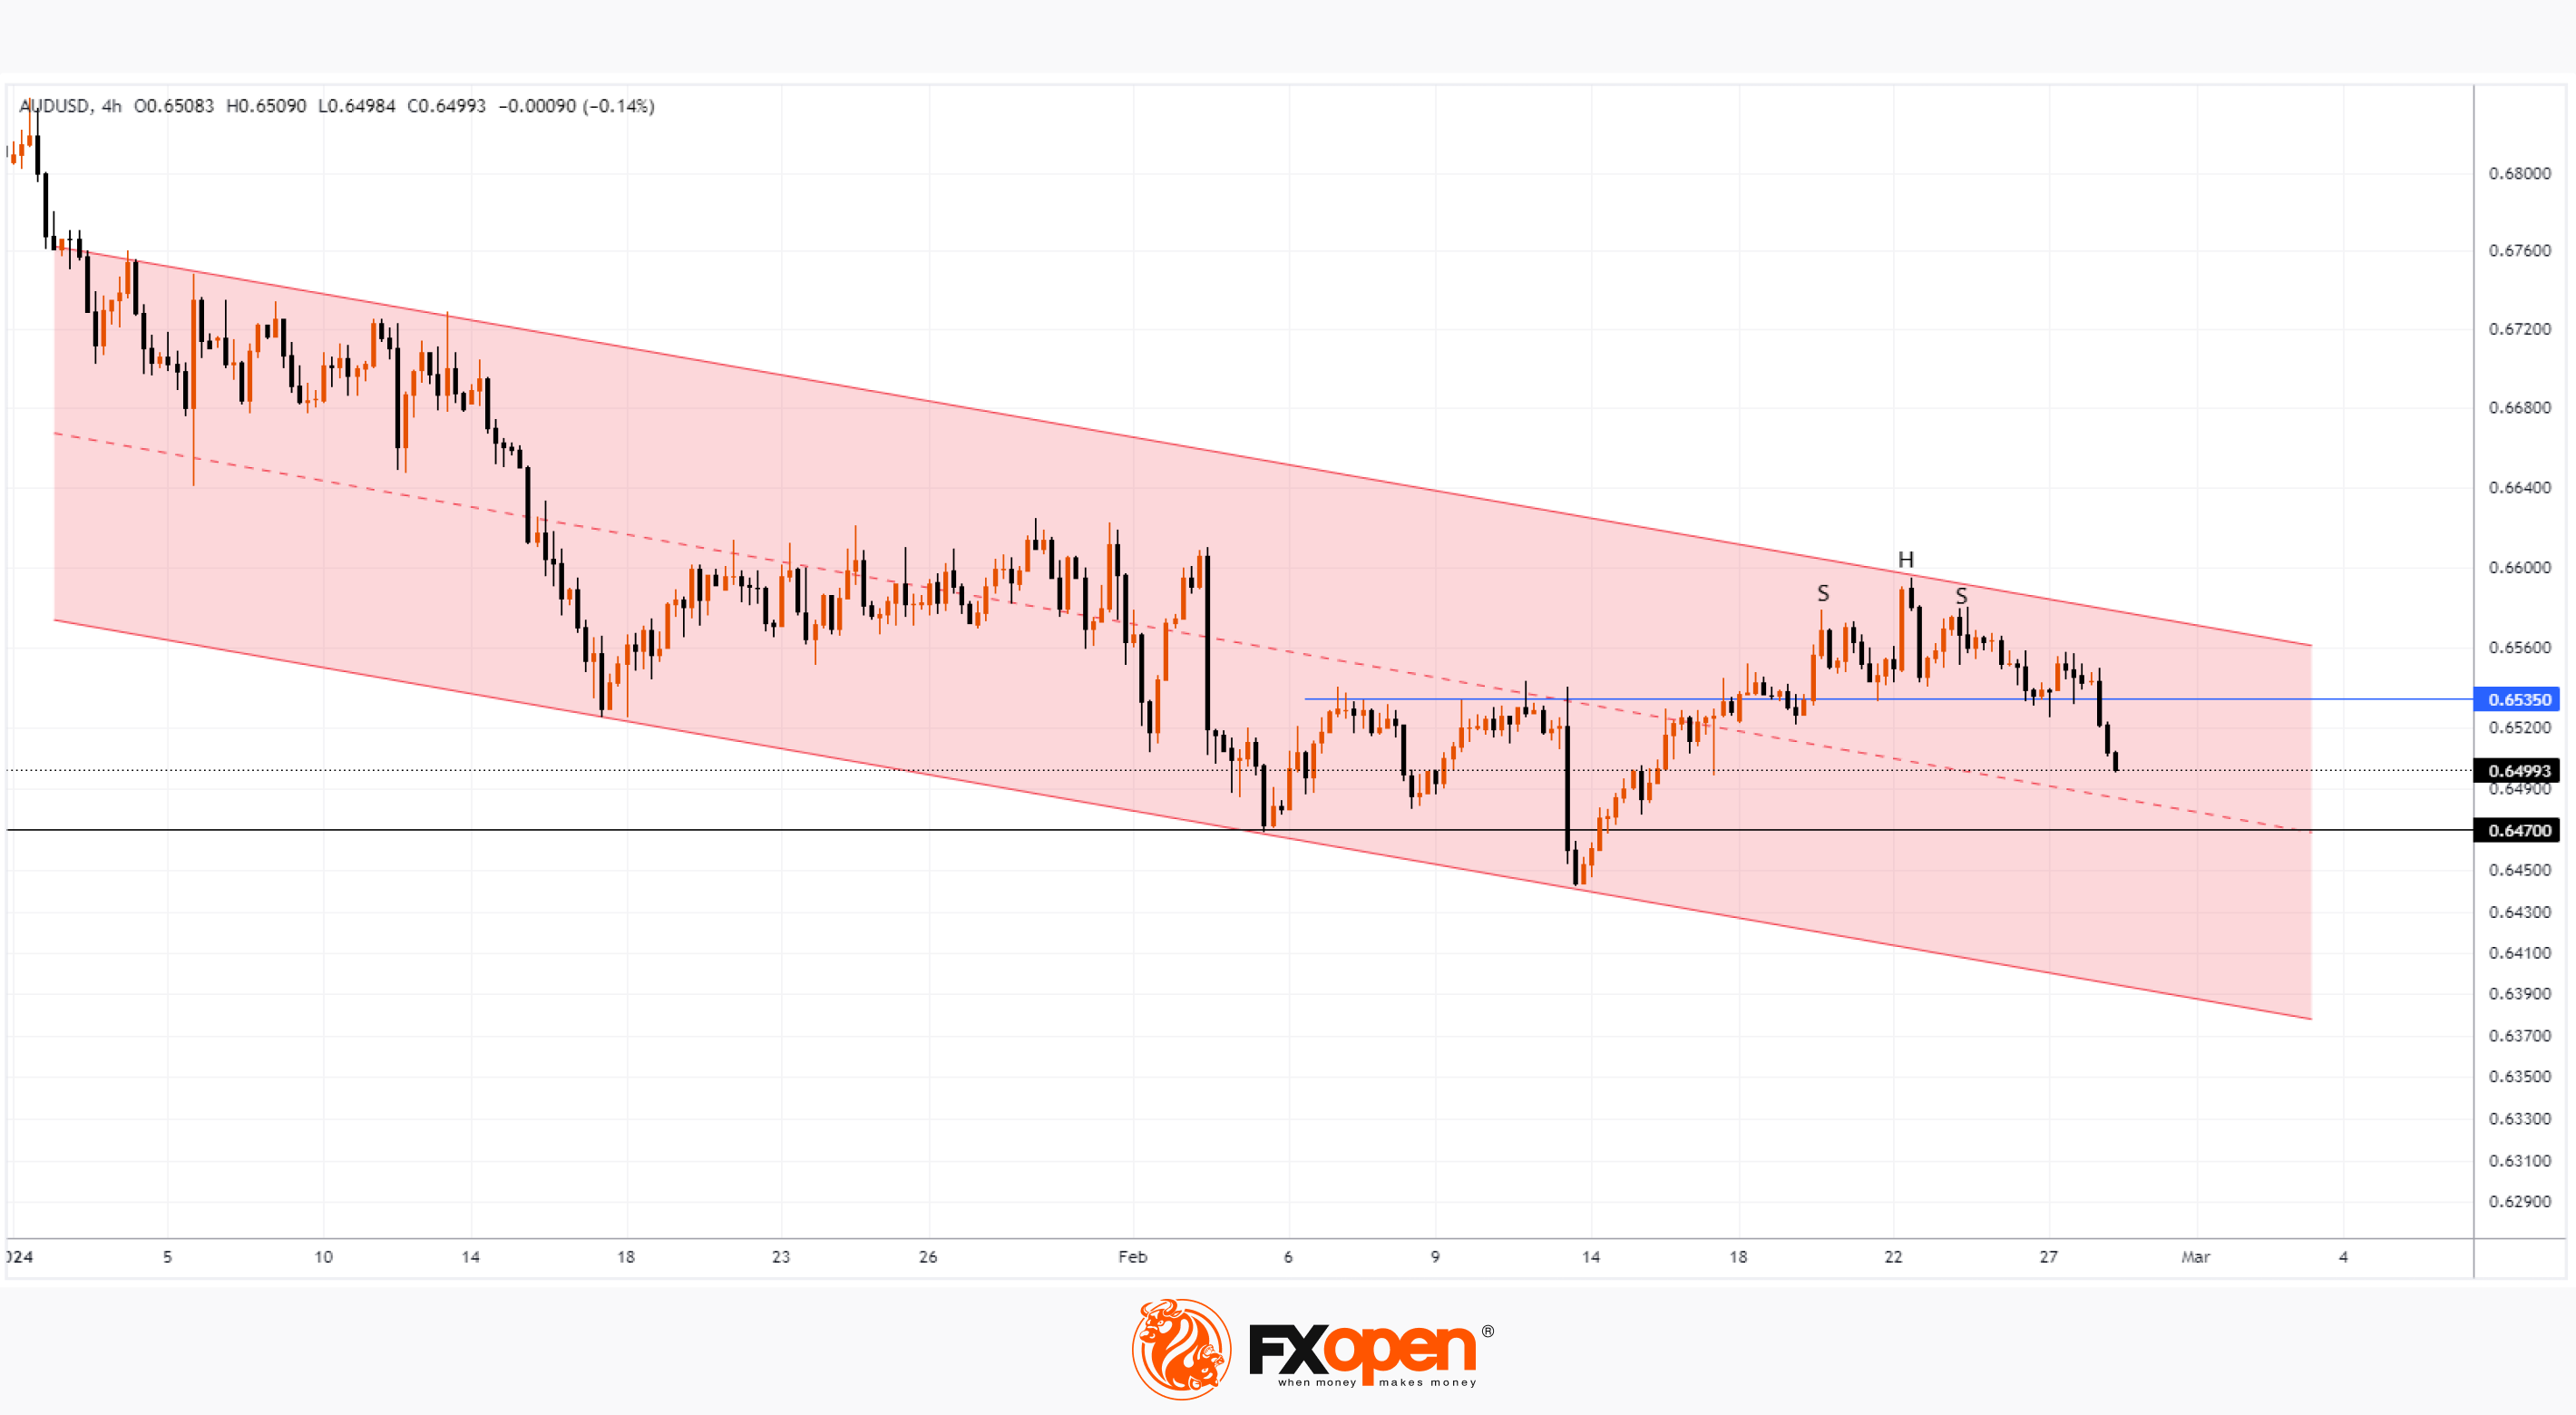
Australian Dollar Weakens amid Inflation News
According to data published today by the Australian Bureau of Statistics, the Consumer Price Index (CPI) value was: actual 3.4%, expected = 3.6%, a month ago = 3.4%, 2 months ago = 4.3%.
Data shows Australia's consumer price growth rate is slowing, approaching targets of around 2%. This means less pressure on the Reserve Bank of Australia, which is pursuing tight monetary policy to combat inflation. Thus, the prospect of lower interest rates makes the Australian dollar weaker relative to other currencies.
For example, the reaction to news about inflation in Australia, which was below expectations, was the fall in the price of AUD/USD.
Technical analysis of the AUD/USD chart shows that:
→ the price of AUD/USD continues to develop in a downward channel (shown in red);
→ the price has broken through the important level 0.6535, which served as support since last week, but now, perhaps, will again begin to provide resistance, as it did in the first half of February;
→ in February, a bearish SHS pattern formed.
Bulls can be given hope by:
→ psychological level 0.6500;
→ median line of the red channel;
→ important support 0.647.
Please also note:
→ today at 16:30 GMT+3, US GDP data will be published;
→ tomorrow at 16:30 GMT+3, data on the US PCE inflation index will be published.
Both news have the potential to have a strong impact on the US dollar exchange rate and related markets. Be prepared for spikes in volatility.
Trade over 50 forex markets 24 hours a day with FXOpen. Take advantage of low commissions, deep liquidity, and spreads from 0.0 pips. Open your FXOpen account now or learn more about trading forex with FXOpen.
CFDs are complex instruments and come with a high risk of losing your money.
This article represents the opinion of the Companies operating under the FXOpen brand only. It is not to be construed as an offer, solicitation, or recommendation with respect to products and services provided by the Companies operating under the FXOpen brand, nor is it to be considered financial advice.
Australian Dollar Weakens amid Inflation News
According to data published today by the Australian Bureau of Statistics, the Consumer Price Index (CPI) value was: actual 3.4%, expected = 3.6%, a month ago = 3.4%, 2 months ago = 4.3%.
Data shows Australia's consumer price growth rate is slowing, approaching targets of around 2%. This means less pressure on the Reserve Bank of Australia, which is pursuing tight monetary policy to combat inflation. Thus, the prospect of lower interest rates makes the Australian dollar weaker relative to other currencies.
For example, the reaction to news about inflation in Australia, which was below expectations, was the fall in the price of AUD/USD.
Technical analysis of the AUD/USD chart shows that:
→ the price of AUD/USD continues to develop in a downward channel (shown in red);
→ the price has broken through the important level 0.6535, which served as support since last week, but now, perhaps, will again begin to provide resistance, as it did in the first half of February;
→ in February, a bearish SHS pattern formed.
Bulls can be given hope by:
→ psychological level 0.6500;
→ median line of the red channel;
→ important support 0.647.
Please also note:
→ today at 16:30 GMT+3, US GDP data will be published;
→ tomorrow at 16:30 GMT+3, data on the US PCE inflation index will be published.
Both news have the potential to have a strong impact on the US dollar exchange rate and related markets. Be prepared for spikes in volatility.
Trade over 50 forex markets 24 hours a day with FXOpen. Take advantage of low commissions, deep liquidity, and spreads from 0.0 pips. Open your FXOpen account now or learn more about trading forex with FXOpen.
CFDs are complex instruments and come with a high risk of losing your money.
This article represents the opinion of the Companies operating under the FXOpen brand only. It is not to be construed as an offer, solicitation, or recommendation with respect to products and services provided by the Companies operating under the FXOpen brand, nor is it to be considered financial advice.
👍3
#marketanalysis #bitcoin #BTCUSD #cryptonews
BTC/USD Price Exceeds $60,000 Per Coin
Several factors contributed to this:
→ Effect associated with the approval of Bitcoin ETF. The media writes that investments in these financial instruments amount to about 9k bitcoins per day, and miners produce only 900 bitcoins per day. The total investment in the Bitcoin ETF after approval on January 11 is approaching USD 50 billion. By comparison, just over USD 90 billion is invested in the 19 largest gold ETFs.
→ Expectations that Ethereum ETFs will be approved in the future, simplifying access to investments in the second largest cryptocurrency by capitalization.
→ Expectations for the Fed to cut interest rates. Cheaper credit means greater appetite for investment in higher-risk assets.
→ Expectations for the halving (scheduled for April), after which a bull market usually begins.
In mid-February, we wrote that the price of Bitcoin did not show bullish progress after exceeding the psychological level of USD 50k per Bitcoin. Technical analysis of the Bitcoin chart shows that this was due to resistance (shown by the arrow) from the median line of the green ascending channel, within which the market has been developing since the fall of 2023. Yesterday's rise, which followed the breakdown of the psychological level of 60k US dollars per bitcoin, marked the upper limit of this channel just above 64k US dollars per bitcoin and made it possible to update its contours.
Now the upper limit of the green channel acts as resistance, it is possible that after an increase of +25% in 2.5 days from point A to point B, buyers will want to take profits — this confirms the fact of yesterday's bearish impulse, in which the price of Bitcoin dropped from USD 64k to USD 59k.
So it is safe to assume that the market is ready for consolidation. But if the extremely optimistic growth rate shown by the blue lines continues, the price of Bitcoin could reach an all-time high of USD 67.7k as soon as spring arrives.
FXOpen offers the world's most popular cryptocurrency CFDs*, including Bitcoin and Ethereum. Floating spreads, 1:2 leverage — at your service. Open your trading account now or learn more about crypto CFD trading with FXOpen.
*At FXOpen UK and FXOpen AU, Cryptocurrency CFDs are only available for trading by those clients categorised as Professional clients under FCA Rules and Professional clients under ASIC Rules respectively. They are not available for trading by Retail clients.
CFDs are complex instruments and come with a high risk of losing your money.
This article represents the opinion of the Companies operating under the FXOpen brand only. It is not to be construed as an offer, solicitation, or recommendation with respect to products and services provided by the Companies operating under the FXOpen brand, nor is it to be considered financial advice.
BTC/USD Price Exceeds $60,000 Per Coin
Several factors contributed to this:
→ Effect associated with the approval of Bitcoin ETF. The media writes that investments in these financial instruments amount to about 9k bitcoins per day, and miners produce only 900 bitcoins per day. The total investment in the Bitcoin ETF after approval on January 11 is approaching USD 50 billion. By comparison, just over USD 90 billion is invested in the 19 largest gold ETFs.
→ Expectations that Ethereum ETFs will be approved in the future, simplifying access to investments in the second largest cryptocurrency by capitalization.
→ Expectations for the Fed to cut interest rates. Cheaper credit means greater appetite for investment in higher-risk assets.
→ Expectations for the halving (scheduled for April), after which a bull market usually begins.
In mid-February, we wrote that the price of Bitcoin did not show bullish progress after exceeding the psychological level of USD 50k per Bitcoin. Technical analysis of the Bitcoin chart shows that this was due to resistance (shown by the arrow) from the median line of the green ascending channel, within which the market has been developing since the fall of 2023. Yesterday's rise, which followed the breakdown of the psychological level of 60k US dollars per bitcoin, marked the upper limit of this channel just above 64k US dollars per bitcoin and made it possible to update its contours.
Now the upper limit of the green channel acts as resistance, it is possible that after an increase of +25% in 2.5 days from point A to point B, buyers will want to take profits — this confirms the fact of yesterday's bearish impulse, in which the price of Bitcoin dropped from USD 64k to USD 59k.
So it is safe to assume that the market is ready for consolidation. But if the extremely optimistic growth rate shown by the blue lines continues, the price of Bitcoin could reach an all-time high of USD 67.7k as soon as spring arrives.
FXOpen offers the world's most popular cryptocurrency CFDs*, including Bitcoin and Ethereum. Floating spreads, 1:2 leverage — at your service. Open your trading account now or learn more about crypto CFD trading with FXOpen.
*At FXOpen UK and FXOpen AU, Cryptocurrency CFDs are only available for trading by those clients categorised as Professional clients under FCA Rules and Professional clients under ASIC Rules respectively. They are not available for trading by Retail clients.
CFDs are complex instruments and come with a high risk of losing your money.
This article represents the opinion of the Companies operating under the FXOpen brand only. It is not to be construed as an offer, solicitation, or recommendation with respect to products and services provided by the Companies operating under the FXOpen brand, nor is it to be considered financial advice.
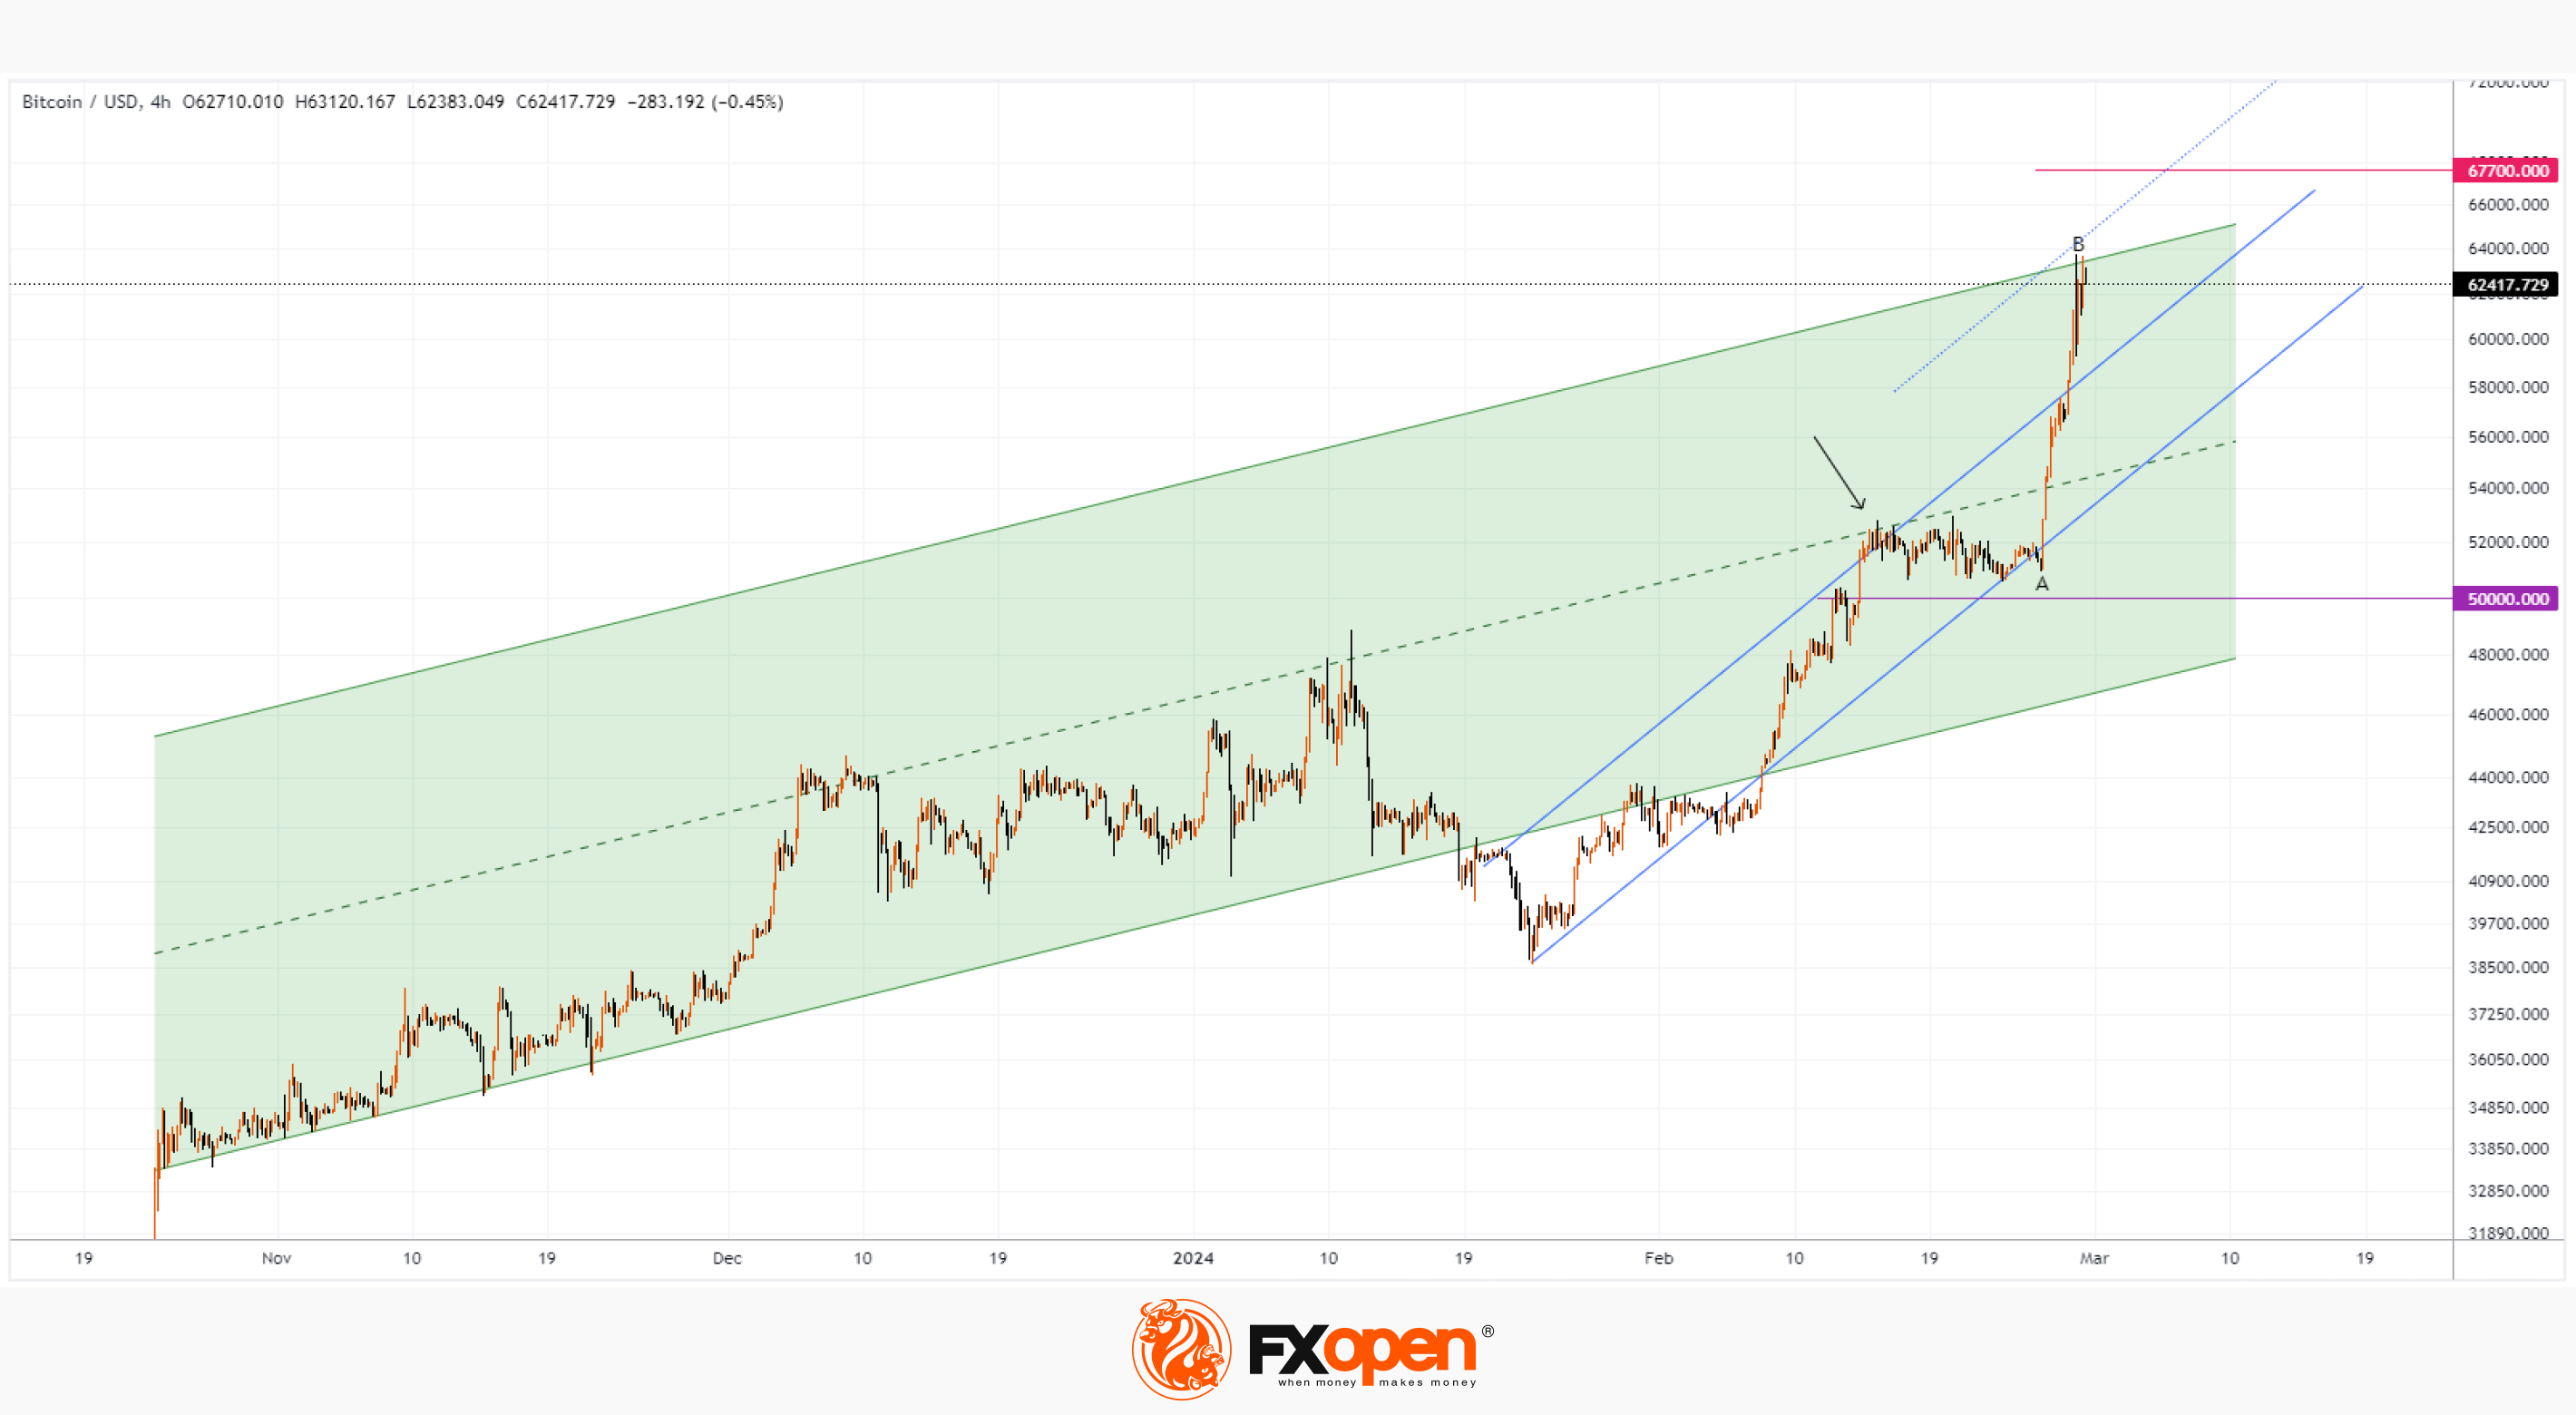
👍4
#forextrading #marketanalysis #tradingtips
USD/JPY Technical Analysis: Yen Strengthens after Comments from Japanese Officials
This week has raised alarm bells for USD/JPY market participants who are trading the bullish momentum that has been going on since early 2024 (shown in the blue curved lines on the USD/JPY chart):
→ Vice Finance Minister Masato Kanda warned against “excessive volatility” in currency markets, hinting that the yen had weakened too much.
→ Bank of Japan board member Hajime Takata said that, in his opinion, there are prospects for achieving the inflation target of 2%, which opens the way to abandoning negative rates. Note that today there was news on inflation in Japan, which showed that it is slowing down. Thus, BOJ Core CPI in annual terms was 2.6%, a month ago = 2.6%, 2 months ago = 2.7%, 3 months ago = 3.0%.
Statements from officials should increase the likelihood of a rate hike at the Bank of Japan's March meeting, thereby changing the prevailing sentiment.
Reuters writes that positions against the yen are at a record high, and their collapse could lead to the fact that the 2-month bullish trajectory of the USD/JPY price will be broken.
Wherein:
→ the psychological level factor of 150 yen per US dollar operates in the market — history shows that the fall of the yen below this level leads to a reaction from the Japanese financial authorities.
→ The USD/JPY price may fall to the support zone, which is formed by the level 148.50 (50% of the A→B impulse) and the level 148.8 (former resistance).
Trade over 50 forex markets 24 hours a day with FXOpen. Take advantage of low commissions, deep liquidity, and spreads from 0.0 pips. Open your FXOpen account now or learn more about trading forex with FXOpen.
CFDs are complex instruments and come with a high risk of losing your money.
This article represents the opinion of the Companies operating under the FXOpen brand only. It is not to be construed as an offer, solicitation, or recommendation with respect to products and services provided by the Companies operating under the FXOpen brand, nor is it to be considered financial advice.
USD/JPY Technical Analysis: Yen Strengthens after Comments from Japanese Officials
This week has raised alarm bells for USD/JPY market participants who are trading the bullish momentum that has been going on since early 2024 (shown in the blue curved lines on the USD/JPY chart):
→ Vice Finance Minister Masato Kanda warned against “excessive volatility” in currency markets, hinting that the yen had weakened too much.
→ Bank of Japan board member Hajime Takata said that, in his opinion, there are prospects for achieving the inflation target of 2%, which opens the way to abandoning negative rates. Note that today there was news on inflation in Japan, which showed that it is slowing down. Thus, BOJ Core CPI in annual terms was 2.6%, a month ago = 2.6%, 2 months ago = 2.7%, 3 months ago = 3.0%.
Statements from officials should increase the likelihood of a rate hike at the Bank of Japan's March meeting, thereby changing the prevailing sentiment.
Reuters writes that positions against the yen are at a record high, and their collapse could lead to the fact that the 2-month bullish trajectory of the USD/JPY price will be broken.
Wherein:
→ the psychological level factor of 150 yen per US dollar operates in the market — history shows that the fall of the yen below this level leads to a reaction from the Japanese financial authorities.
→ The USD/JPY price may fall to the support zone, which is formed by the level 148.50 (50% of the A→B impulse) and the level 148.8 (former resistance).
Trade over 50 forex markets 24 hours a day with FXOpen. Take advantage of low commissions, deep liquidity, and spreads from 0.0 pips. Open your FXOpen account now or learn more about trading forex with FXOpen.
CFDs are complex instruments and come with a high risk of losing your money.
This article represents the opinion of the Companies operating under the FXOpen brand only. It is not to be construed as an offer, solicitation, or recommendation with respect to products and services provided by the Companies operating under the FXOpen brand, nor is it to be considered financial advice.
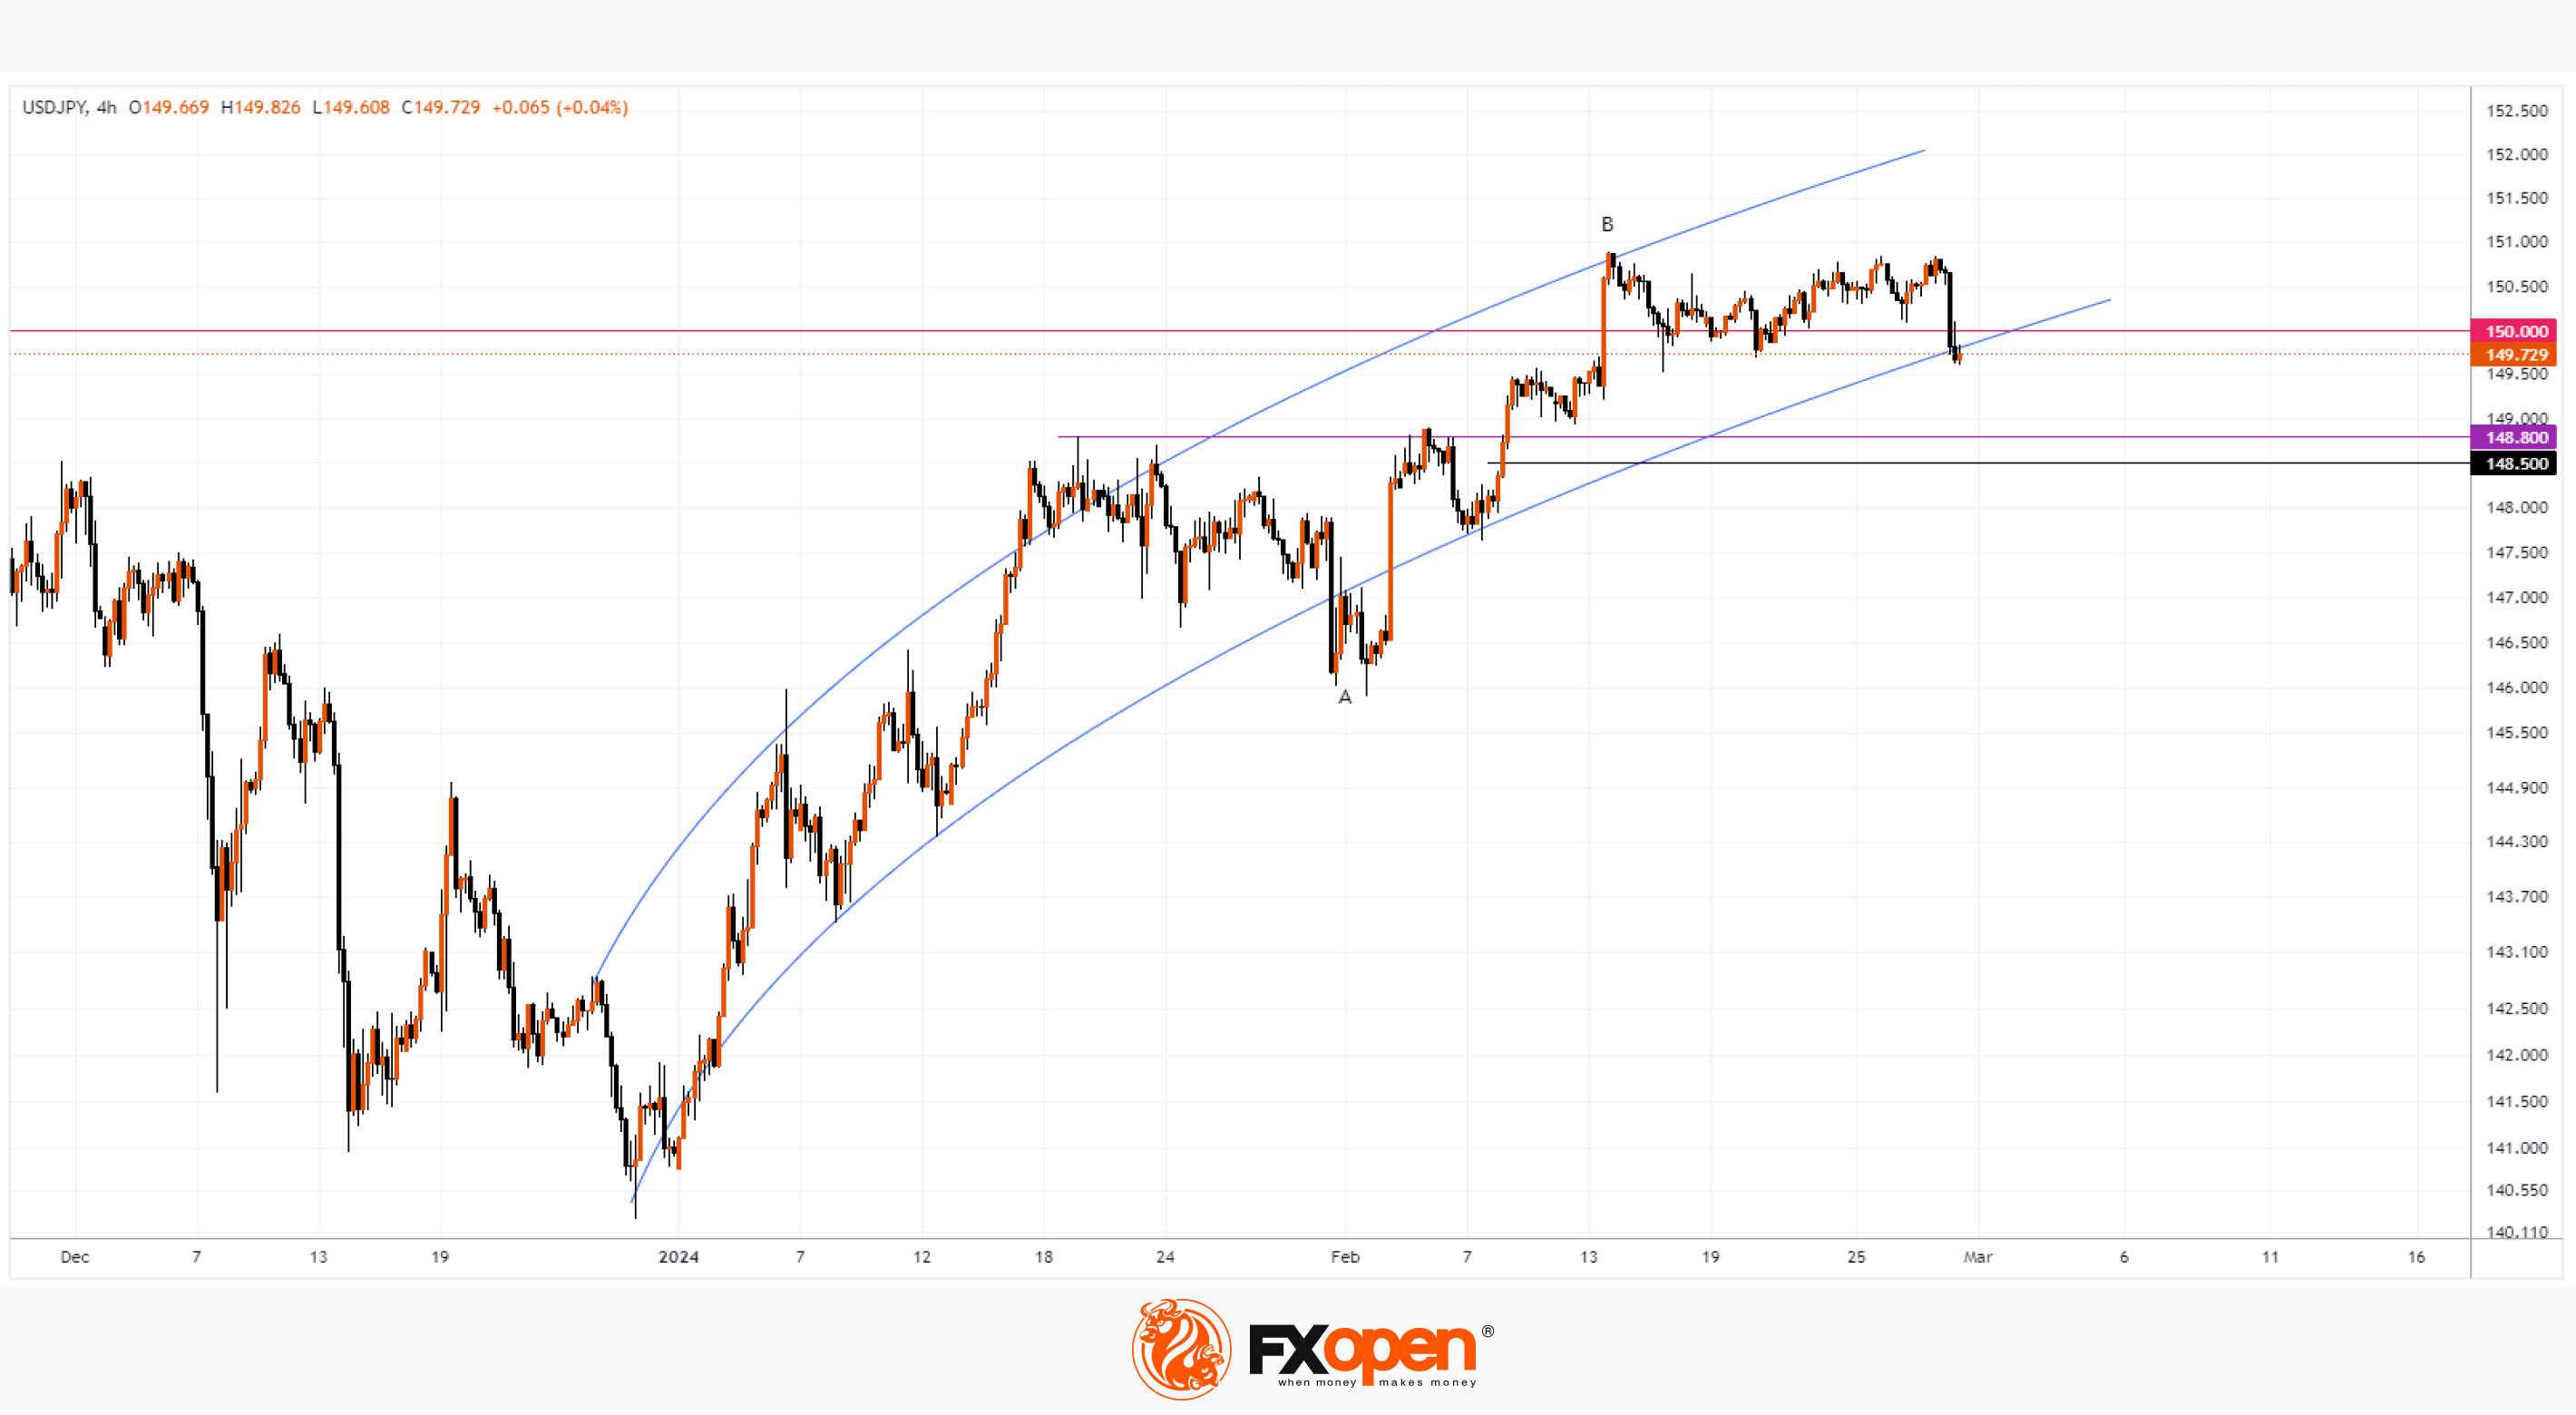
👍4
#stockmarket #NASDAQ #stocktrading #MarketNews
Nasdaq-100 Price Hits All-time High after 4 Straight Months of Gains
The Nasdaq-100 index is holding above 18,000 today following yesterday's bullish momentum, fueled by inflation news.
The PCE consumer spending index amounted to 0.4% on a monthly basis, which was in line with analysts' expectations. A year ago, we recall, it was 0.6%. Thus, statistics indicate a weakening of inflation which means that the likelihood of the Fed cutting interest rates increases — the anticipation of this event increases optimism in the stock market.
Another driver is the strong price action of NVDA stock. The company's capitalization is close to USD 2 trillion, as Nvidia is perhaps the main beneficiary of the AI boom — NVDA's price rose approximately 28% in February.
The Nasdaq-100 chart shows that the index price has been in an upward trend since the beginning of 2024 (shown by the blue channel):
→ with the price is in its upper half;
→ from the point of view of technical analysis of the Nasdsaq-100, the level of 18k points, which acted as resistance in February, may support the market in March — however, this is if the bulls manage to gain a foothold above 18,000.
In the meantime, the current exceeding of maximum 2 looks insignificant. And this creates the threat of a false bullish breakout — as an example, this turned out to be the maximum 2, when the price exceeded the maximum 1. Let's note another bearish factor, the overbought state on the RSI indicator.
Comments from FOMC committee members are expected this evening, which could impact current sentiment.
Trade global index CFDs with zero commission and tight spreads. Open your FXOpen account now or learn more about trading index CFDs with FXOpen.
CFDs are complex instruments and come with a high risk of losing your money.
This article represents the opinion of the Companies operating under the FXOpen brand only. It is not to be construed as an offer, solicitation, or recommendation with respect to products and services provided by the Companies operating under the FXOpen brand, nor is it to be considered financial advice.
Nasdaq-100 Price Hits All-time High after 4 Straight Months of Gains
The Nasdaq-100 index is holding above 18,000 today following yesterday's bullish momentum, fueled by inflation news.
The PCE consumer spending index amounted to 0.4% on a monthly basis, which was in line with analysts' expectations. A year ago, we recall, it was 0.6%. Thus, statistics indicate a weakening of inflation which means that the likelihood of the Fed cutting interest rates increases — the anticipation of this event increases optimism in the stock market.
Another driver is the strong price action of NVDA stock. The company's capitalization is close to USD 2 trillion, as Nvidia is perhaps the main beneficiary of the AI boom — NVDA's price rose approximately 28% in February.
The Nasdaq-100 chart shows that the index price has been in an upward trend since the beginning of 2024 (shown by the blue channel):
→ with the price is in its upper half;
→ from the point of view of technical analysis of the Nasdsaq-100, the level of 18k points, which acted as resistance in February, may support the market in March — however, this is if the bulls manage to gain a foothold above 18,000.
In the meantime, the current exceeding of maximum 2 looks insignificant. And this creates the threat of a false bullish breakout — as an example, this turned out to be the maximum 2, when the price exceeded the maximum 1. Let's note another bearish factor, the overbought state on the RSI indicator.
Comments from FOMC committee members are expected this evening, which could impact current sentiment.
Trade global index CFDs with zero commission and tight spreads. Open your FXOpen account now or learn more about trading index CFDs with FXOpen.
CFDs are complex instruments and come with a high risk of losing your money.
This article represents the opinion of the Companies operating under the FXOpen brand only. It is not to be construed as an offer, solicitation, or recommendation with respect to products and services provided by the Companies operating under the FXOpen brand, nor is it to be considered financial advice.
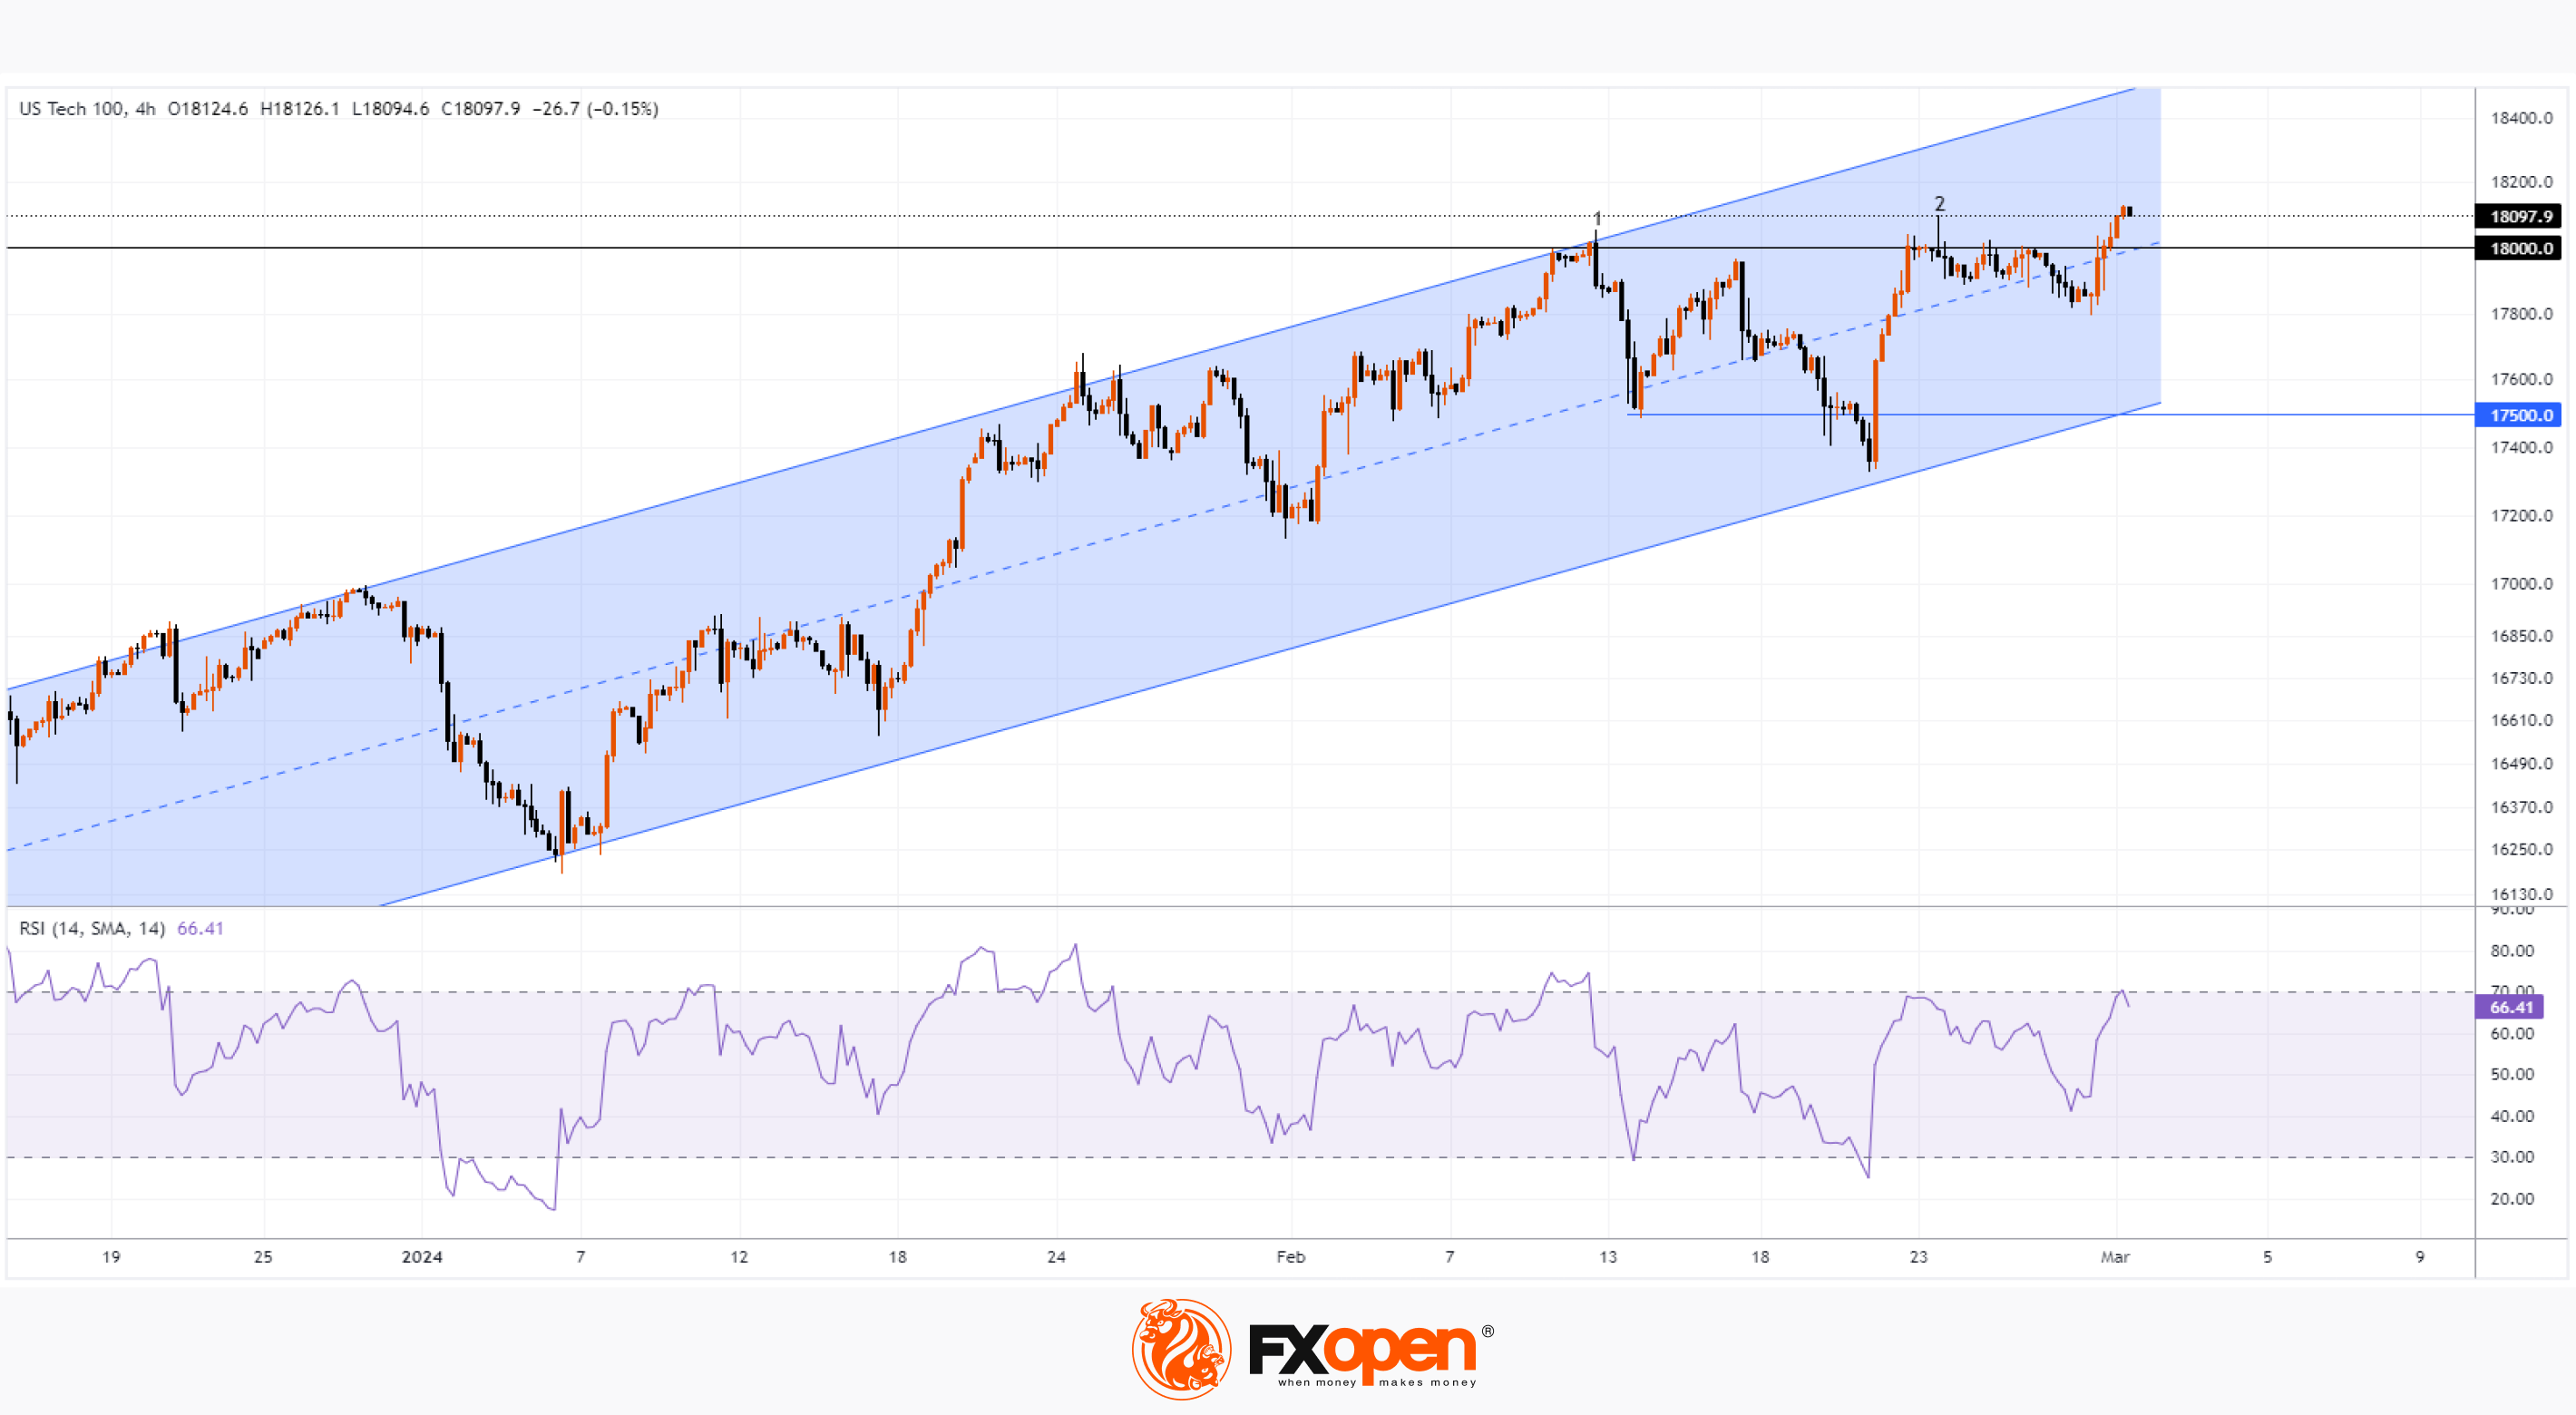
👍2