
#MarketNews #oilprices #oilindustry #crudeoil
WTI Oil Price Recovers Quickly From March Lows
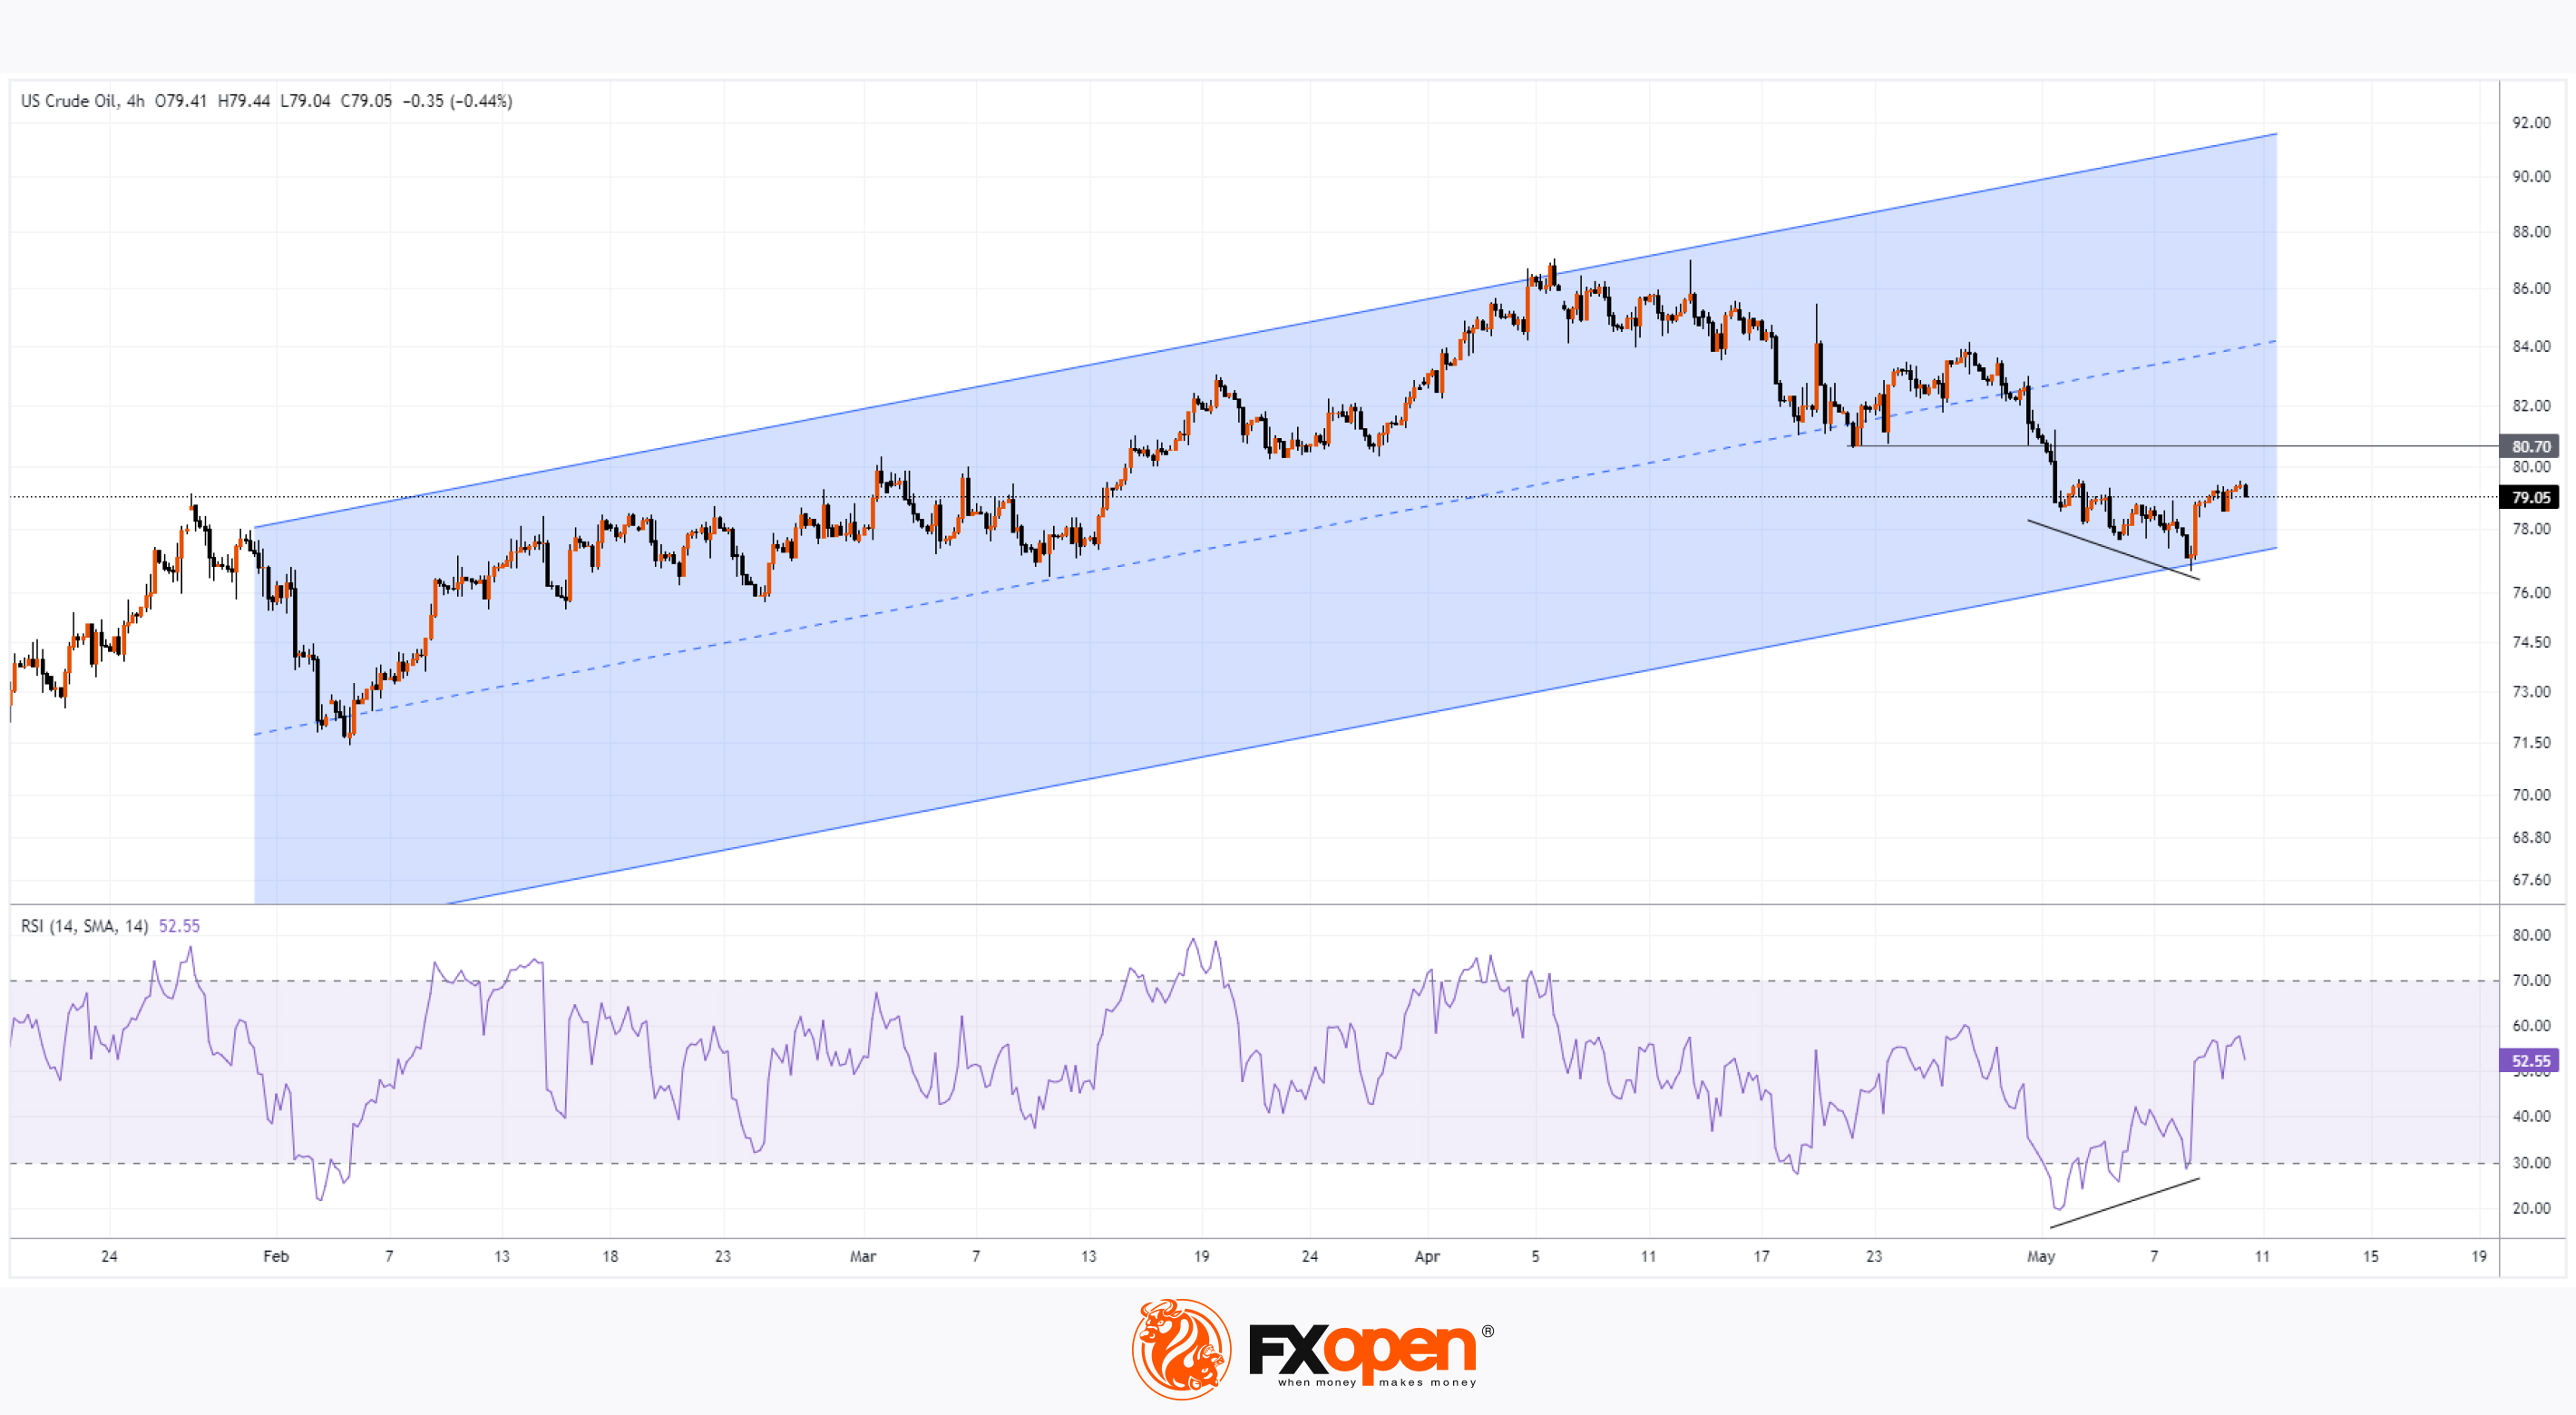
On May 8, the price of WTI crude oil fell below $77 per barrel for the first time since March 11. But on the morning of May 10, it was above $79 – an increase of almost 3% in less than two days.
Several factors contributed to the significant rise in the price of WTI crude oil. According to Reuters, among them:
→ Increased oil demand from the United States. Data released on Wednesday showed a drop in US crude oil inventories, driven by increased refinery utilisation.
→ Growing demand from China. Data published on Thursday showed an increase in oil imports.
→ Ongoing concerns about possible supply disruptions due to escalating conflict in the Middle East. Negotiations to end hostilities between Israel and Hamas failed, and Israel attacked the Palestinian city of Rafah.
On April 19, we wrote about the possibility of a bearish breakdown of the ascending channel line, which would be welcomed by the US administration, where the presidential elections are getting closer and closer.
Since then, the price of oil has broken down the median line and the support line at $80.70, which may act as resistance in the future.
The WTI crude oil chart shows that:
→ the price is within the ascending channel, which has expanded two times since the last post according to the principle of parallel channels;
→ the bullish reversal on May 8-9 formed a test of its lower boundary;
→ the exhaustion of selling pressure was indicated by a bullish divergence on the RSI indicator.
If demand from major economies strengthens and the geopolitical environment continues to deteriorate, this could create the conditions for the WTI crude oil price movement within a sustained upward channel.
Start trading commodity CFDs with tight spreads. Open your trading account now or learn more about trading commodity CFDs with FXOpen.
CFDs are complex instruments and come with a high risk of losing your money.
This article represents the opinion of the Companies operating under the FXOpen brand only. It is not to be construed as an offer, solicitation, or recommendation with respect to products and services provided by the Companies operating under the FXOpen brand, nor is it to be considered financial advice.
WTI Oil Price Recovers Quickly From March Lows
On May 8, the price of WTI crude oil fell below $77 per barrel for the first time since March 11. But on the morning of May 10, it was above $79 – an increase of almost 3% in less than two days.
Several factors contributed to the significant rise in the price of WTI crude oil. According to Reuters, among them:
→ Increased oil demand from the United States. Data released on Wednesday showed a drop in US crude oil inventories, driven by increased refinery utilisation.
→ Growing demand from China. Data published on Thursday showed an increase in oil imports.
→ Ongoing concerns about possible supply disruptions due to escalating conflict in the Middle East. Negotiations to end hostilities between Israel and Hamas failed, and Israel attacked the Palestinian city of Rafah.
On April 19, we wrote about the possibility of a bearish breakdown of the ascending channel line, which would be welcomed by the US administration, where the presidential elections are getting closer and closer.
Since then, the price of oil has broken down the median line and the support line at $80.70, which may act as resistance in the future.
The WTI crude oil chart shows that:
→ the price is within the ascending channel, which has expanded two times since the last post according to the principle of parallel channels;
→ the bullish reversal on May 8-9 formed a test of its lower boundary;
→ the exhaustion of selling pressure was indicated by a bullish divergence on the RSI indicator.
If demand from major economies strengthens and the geopolitical environment continues to deteriorate, this could create the conditions for the WTI crude oil price movement within a sustained upward channel.
Start trading commodity CFDs with tight spreads. Open your trading account now or learn more about trading commodity CFDs with FXOpen.
CFDs are complex instruments and come with a high risk of losing your money.
This article represents the opinion of the Companies operating under the FXOpen brand only. It is not to be construed as an offer, solicitation, or recommendation with respect to products and services provided by the Companies operating under the FXOpen brand, nor is it to be considered financial advice.
👍3
#stockmarket #GBPUSD #usdcad #marketanalysis #MarketNews
Weekly Market Wrap With Gary Thomson: UK100, Hang Seng Index, AUD/JPY, GBP/USD, USD/CAD
Get the latest scoop on the week's hottest headlines, all in one convenient video. Join Gary Thomson, the COO of FXOpen UK, as he breaks down the most significant news reports and shares his expert insights.
🔸UK100 Analysis: Stock Market Optimistic Ahead Of Bank Of England News
🔸The Hang Seng Index Has Risen By Over 13% In 2 Weeks
🔸AUD/JPY Analysis: Aussie Weakens After RBA Decision
🔸GBP/USD Bulls Struggle While USD/CAD Regains Strength
Stay in the know and empower yourself with our short, yet power-packed video. Watch it now and stay updated with FXOpen. Don't miss out on this invaluable opportunity to sharpen your trading skills and make informed decisions.
https://cutt.ly/meekHLlP
To take advantage of price fluctuations in the foreign exchange markets, consider enlisting the services of a reliable broker like FXOpen.
⚠️
This forecast represents FXOpen Companies opinion only, it should not be construed as an offer, invitation or recommendation in respect to FXOpen Companies products and services or as financial advice
Weekly Market Wrap With Gary Thomson: UK100, Hang Seng Index, AUD/JPY, GBP/USD, USD/CAD
Get the latest scoop on the week's hottest headlines, all in one convenient video. Join Gary Thomson, the COO of FXOpen UK, as he breaks down the most significant news reports and shares his expert insights.
🔸UK100 Analysis: Stock Market Optimistic Ahead Of Bank Of England News
🔸The Hang Seng Index Has Risen By Over 13% In 2 Weeks
🔸AUD/JPY Analysis: Aussie Weakens After RBA Decision
🔸GBP/USD Bulls Struggle While USD/CAD Regains Strength
Stay in the know and empower yourself with our short, yet power-packed video. Watch it now and stay updated with FXOpen. Don't miss out on this invaluable opportunity to sharpen your trading skills and make informed decisions.
https://cutt.ly/meekHLlP
To take advantage of price fluctuations in the foreign exchange markets, consider enlisting the services of a reliable broker like FXOpen.
⚠️
This forecast represents FXOpen Companies opinion only, it should not be construed as an offer, invitation or recommendation in respect to FXOpen Companies products and services or as financial advice
YouTube
Weekly Market Wrap With Gary Thomson: UK100, Hang Seng Index, AUD/JPY, GBP/USD, USD/CAD
Get the latest scoop on the week's hottest headlines, all in one convenient video. Join Gary Thomson, the COO of FXOpen UK, as he breaks down the most signif...
👍4
#XAUUSD #goldprice #MarketNews
Gold Price (XAU/USD) Is Testing an Important Resistance Zone
On April 16, we wrote why the $2,380 zone is an important resistance area.
The XAU/USD chart shows that:
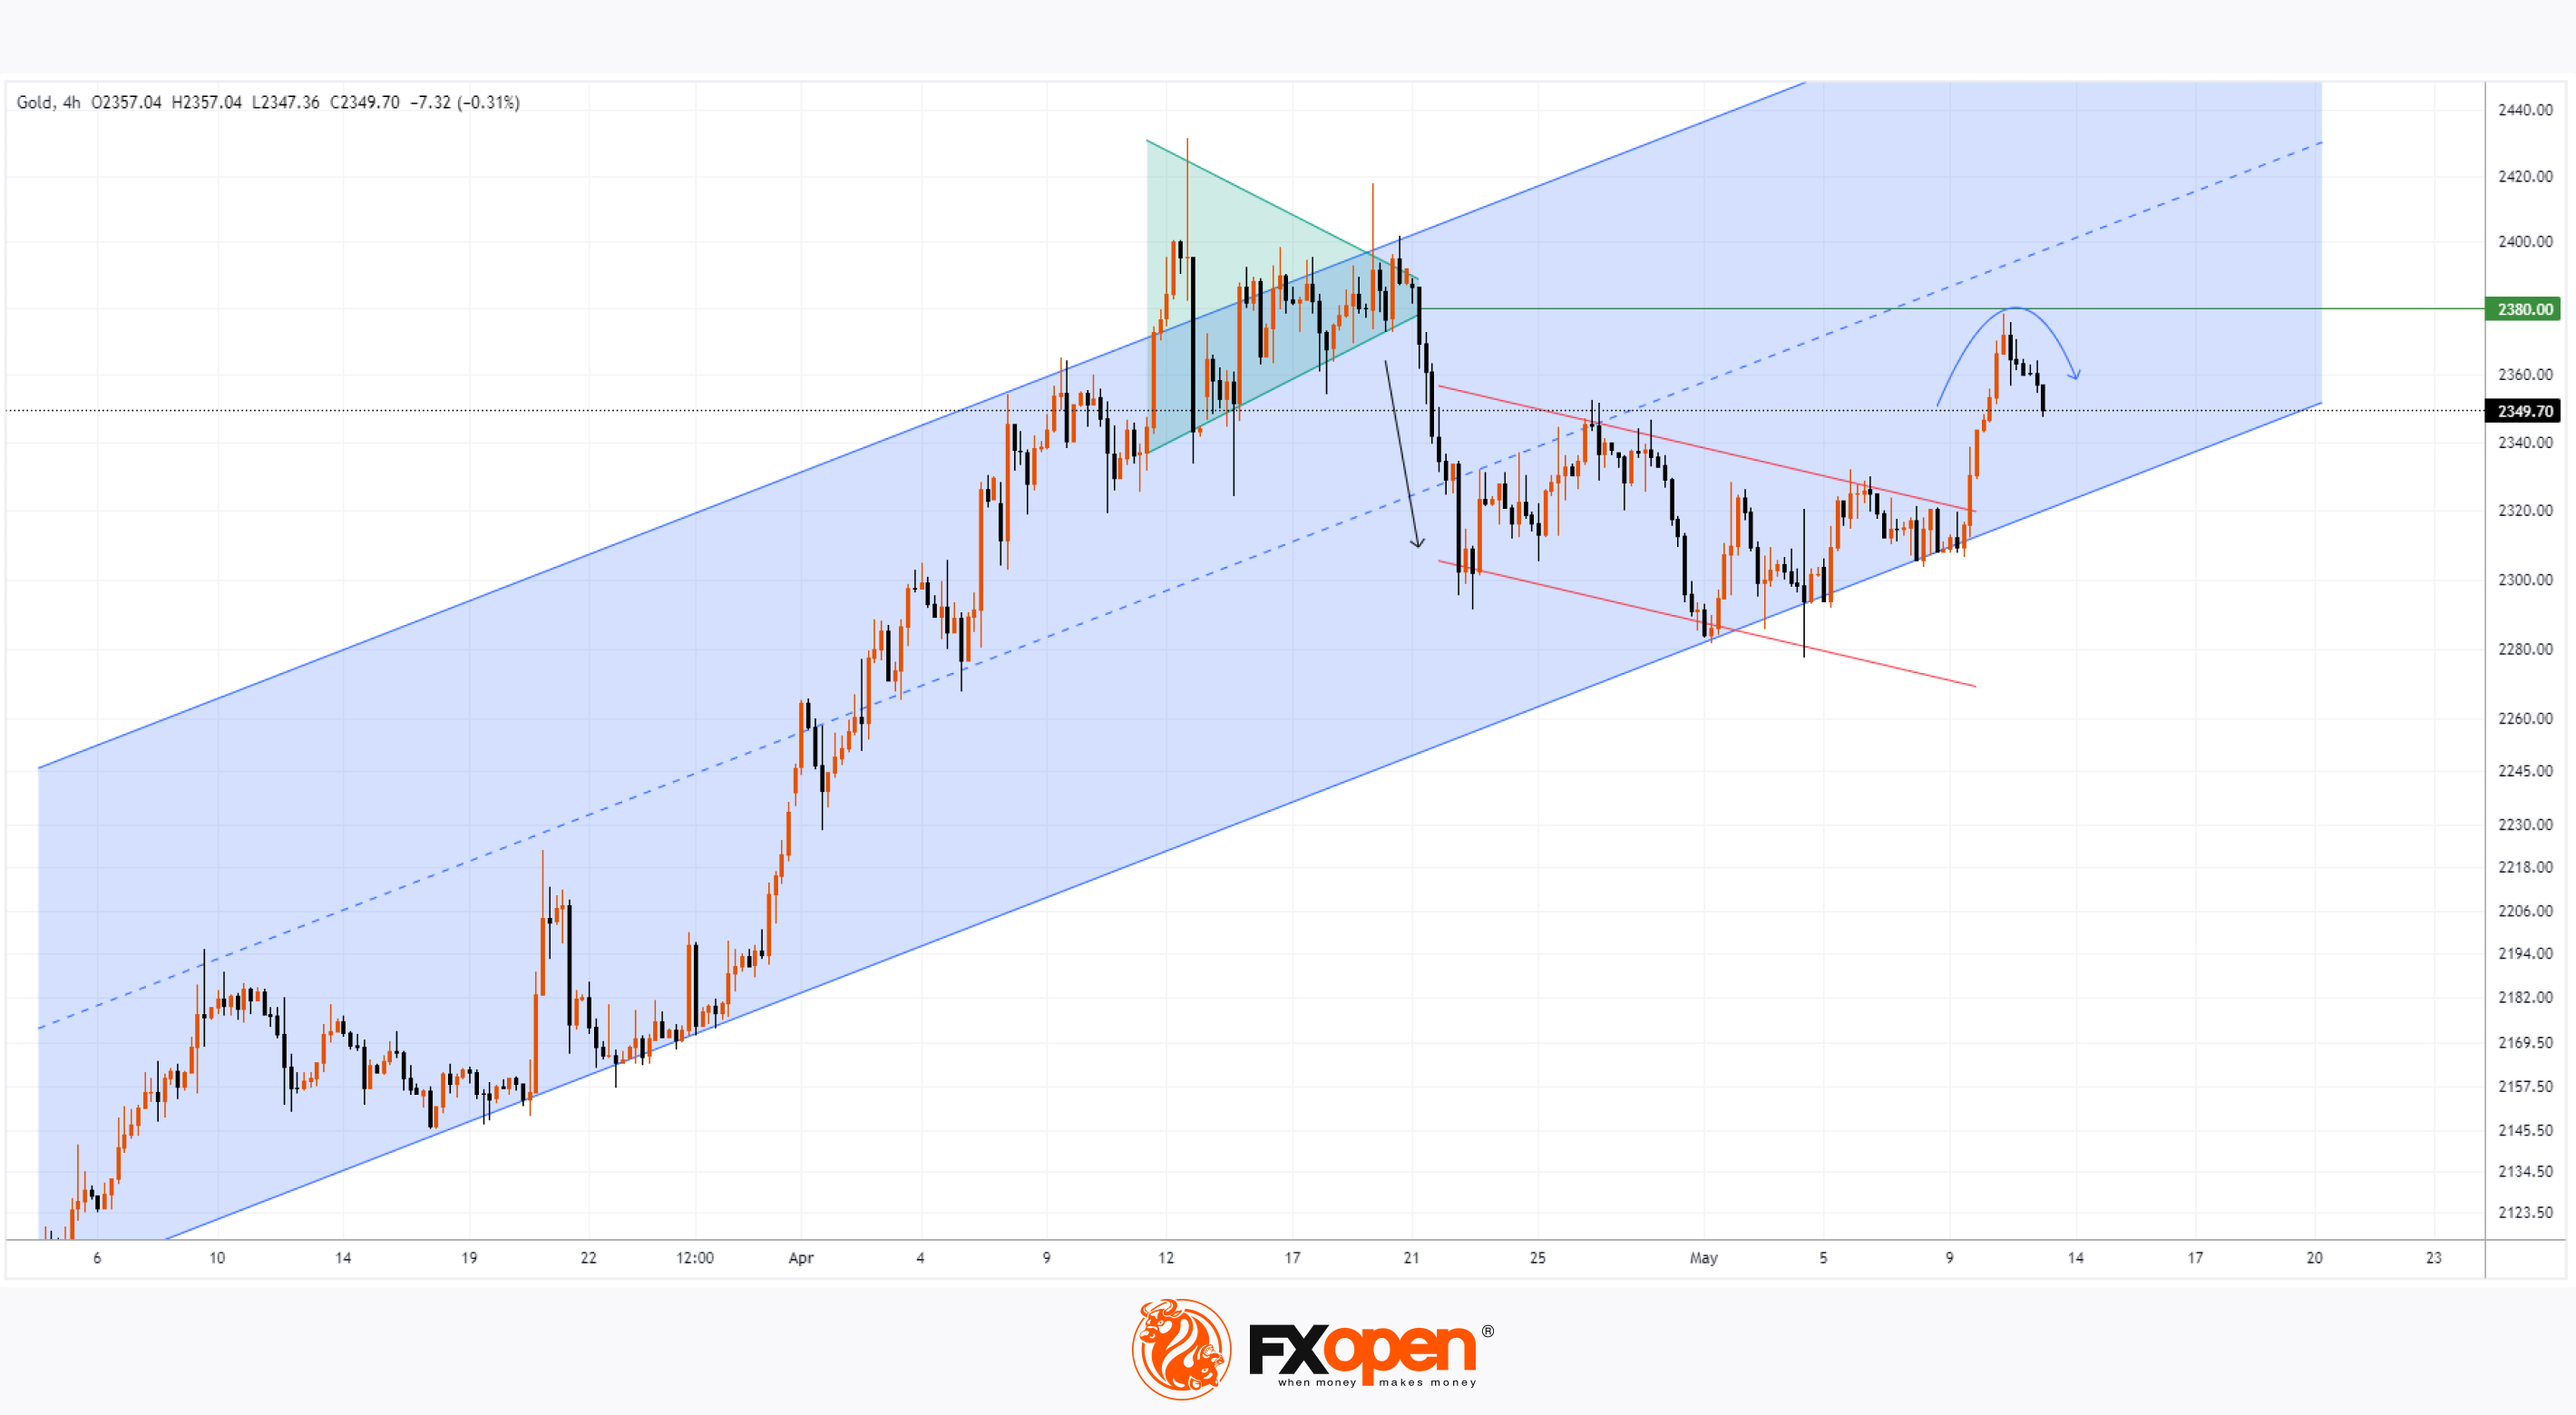
1) After fading fluctuations (they formed a narrowing consolidation triangle - shown in green), the price of gold dropped sharply (shown by a black arrow) on April 22-23.
2) Then, the price found support in the form of the lower border of the ascending channel (shown in blue), which has been in effect since the beginning of March. This led to the formation of another consolidation pattern between the blue lines.
3) An upward breakdown of the red lines on May 9 could be interpreted as an attempt by the bulls to resume the upward trend within the blue channel, but we could expect that the green triangle with its axis around 2380 would provide resistance.
However, it is important to pay attention to the nature of buyers’ behaviour when the price approaches an important resistance - the XAU/USD chart shows that the bulls’ persistence has quickly depleted. From the point of view of technical analysis of the gold price, a bearish engulfing has formed on the chart (shown by a blue arrow) in the area of 2380. In other words, the price of gold tested the resistance level, revealing the activity of bears defending their territory.
From the point of view of fundamental analysis, market participants can position themselves ahead of the key news for the beginning of the week: the CPI index will be published on Wednesday at 15:30 GMT+3.
But if economic or geopolitical news does not change the balance, in which, as we observe, the initiative is on the side of the bears, then this may create a threat of a breakdown of the blue channel’s lower border.
Start trading commodity CFDs with tight spreads. Open your trading account now or learn more about trading commodity CFDs with FXOpen.
CFDs are complex instruments and come with a high risk of losing your money.
This article represents the opinion of the Companies operating under the FXOpen brand only. It is not to be construed as an offer, solicitation, or recommendation with respect to products and services provided by the Companies operating under the FXOpen brand, nor is it to be considered financial advice.
Gold Price (XAU/USD) Is Testing an Important Resistance Zone
On April 16, we wrote why the $2,380 zone is an important resistance area.
The XAU/USD chart shows that:
1) After fading fluctuations (they formed a narrowing consolidation triangle - shown in green), the price of gold dropped sharply (shown by a black arrow) on April 22-23.
2) Then, the price found support in the form of the lower border of the ascending channel (shown in blue), which has been in effect since the beginning of March. This led to the formation of another consolidation pattern between the blue lines.
3) An upward breakdown of the red lines on May 9 could be interpreted as an attempt by the bulls to resume the upward trend within the blue channel, but we could expect that the green triangle with its axis around 2380 would provide resistance.
However, it is important to pay attention to the nature of buyers’ behaviour when the price approaches an important resistance - the XAU/USD chart shows that the bulls’ persistence has quickly depleted. From the point of view of technical analysis of the gold price, a bearish engulfing has formed on the chart (shown by a blue arrow) in the area of 2380. In other words, the price of gold tested the resistance level, revealing the activity of bears defending their territory.
From the point of view of fundamental analysis, market participants can position themselves ahead of the key news for the beginning of the week: the CPI index will be published on Wednesday at 15:30 GMT+3.
But if economic or geopolitical news does not change the balance, in which, as we observe, the initiative is on the side of the bears, then this may create a threat of a breakdown of the blue channel’s lower border.
Start trading commodity CFDs with tight spreads. Open your trading account now or learn more about trading commodity CFDs with FXOpen.
CFDs are complex instruments and come with a high risk of losing your money.
This article represents the opinion of the Companies operating under the FXOpen brand only. It is not to be construed as an offer, solicitation, or recommendation with respect to products and services provided by the Companies operating under the FXOpen brand, nor is it to be considered financial advice.
👍2
#sp500 #stockmarket #MarketNews
The S&P 500 Index Has Reached a Significant Resistance Level
Analyzing the S&P 500 chart (US SPX 500 mini on FXOpen) on April 26, we wrote about how the April decline could be a correction to the lower boundary of the channel within the 2024 rally. Following this, a logical development would be for the bulls to attempt to resume the upward trend and make another attempt to breach the 5250 level.
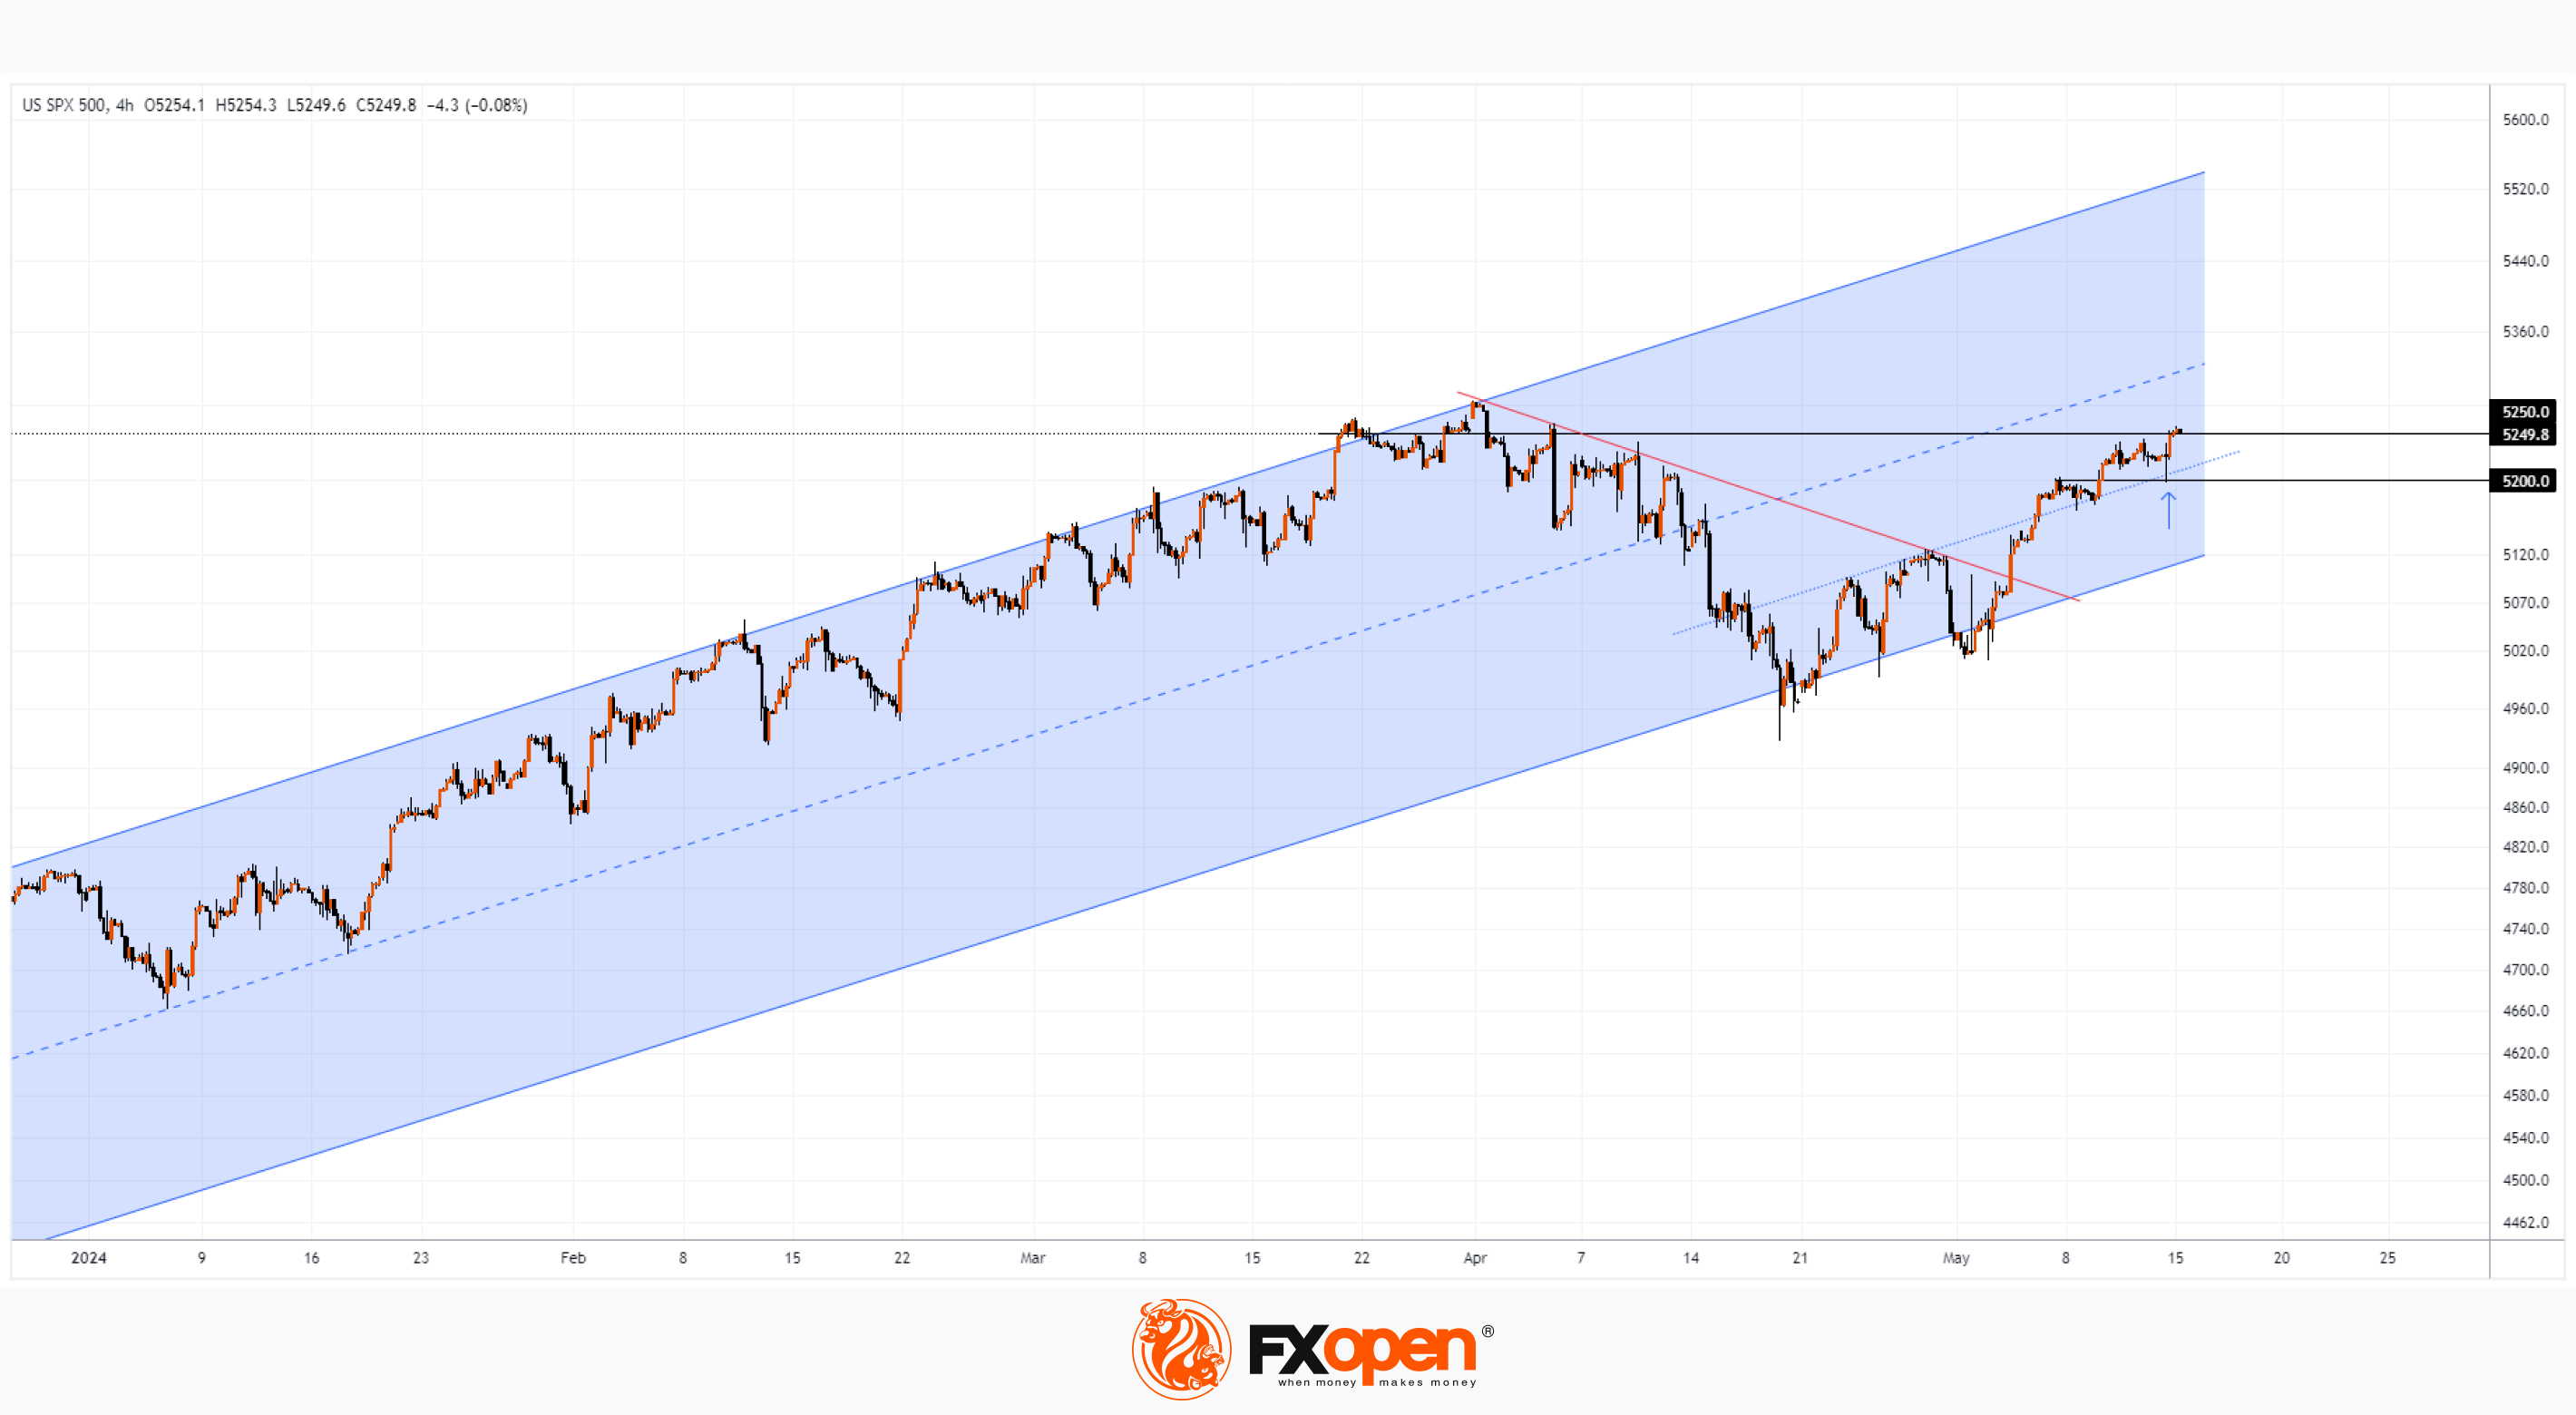
Today, May 15, the price of the S&P 500 index (US SPX 500 mini on FXOpen) is at the 5250 level after a bullish breakout of the trendline (shown in red) that delineated the correction.
The price has risen by approximately 4.5% since the beginning of May as earnings season has not been disappointing, and traders anticipate the Federal Reserve will ease monetary policy.
Is further index growth possible?
Ben Snyder, Senior US Equity Market Strategist at Goldman Sachs, is positive in the long term but notes that:
→ the S&P 500 index has already surpassed the 5200 target level indicated by the bank's analysts;
→ an obvious risk of growth lies in the fact that companies may need to significantly raise profit forecasts.
Fundamental background has a significant influence on the dynamics of the S&P 500 index (US SPX 500 mini on FXOpen). For example, yesterday Producer Price Index (PPI) data was released. According to ForexFactory: PPI m/m actual = 0.5%, expected = 0.3%, a month ago = -0.1%.
The initial market reaction was a decline in the price of the S&P 500 index (US SPX 500 mini on FXOpen) – perhaps market participants were spooked by rising producer prices and the prospect of higher Fed rates. However, this was followed by a statement from Fed Chair Powell, who reassured the markets. According to him:
→ the next Fed move is unlikely to be a rate hike;
→ the PPI data is more "mixed than hot", considering that the previous period's data was revised downwards.
The chart of US SPX 500 mini on FXOpen shows that:
→ the price is moving within an upward channel;
→ an intermediate trendline (shown with blue dots) within the upward channel is providing support;
→ after the PPI news, the price tested (as indicated by the arrow) this intermediate trendline;
→ at the same time, the price also tested the 5200 support level;
→ Powell's subsequent comments added positivity to the market, and the price rose towards the important 5250 level we mentioned earlier.
Market participants are now focused on the next set of important news: Consumer Price Index (CPI) data and Core Retail Sales will be released today at 15:30 GMT+3.
It is possible that evidence of inflation slowing down will lead to an increase in the S&P 500 index (US SPX 500 mini on FXOpen), as this will strengthen market participants' belief in an imminent rate cut. In such a scenario, the index price could reach a historical record.
Trade global index CFDs with zero commission and tight spreads. Open your FXOpen account now or learn more about trading index CFDs with FXOpen.
CFDs are complex instruments and come with a high risk of losing your money.
This article represents the opinion of the Companies operating under the FXOpen brand only. It is not to be construed as an offer, solicitation, or recommendation with respect to products and services provided by the Companies operating under the FXOpen brand, nor is it to be considered financial advice.
The S&P 500 Index Has Reached a Significant Resistance Level
Analyzing the S&P 500 chart (US SPX 500 mini on FXOpen) on April 26, we wrote about how the April decline could be a correction to the lower boundary of the channel within the 2024 rally. Following this, a logical development would be for the bulls to attempt to resume the upward trend and make another attempt to breach the 5250 level.
Today, May 15, the price of the S&P 500 index (US SPX 500 mini on FXOpen) is at the 5250 level after a bullish breakout of the trendline (shown in red) that delineated the correction.
The price has risen by approximately 4.5% since the beginning of May as earnings season has not been disappointing, and traders anticipate the Federal Reserve will ease monetary policy.
Is further index growth possible?
Ben Snyder, Senior US Equity Market Strategist at Goldman Sachs, is positive in the long term but notes that:
→ the S&P 500 index has already surpassed the 5200 target level indicated by the bank's analysts;
→ an obvious risk of growth lies in the fact that companies may need to significantly raise profit forecasts.
Fundamental background has a significant influence on the dynamics of the S&P 500 index (US SPX 500 mini on FXOpen). For example, yesterday Producer Price Index (PPI) data was released. According to ForexFactory: PPI m/m actual = 0.5%, expected = 0.3%, a month ago = -0.1%.
The initial market reaction was a decline in the price of the S&P 500 index (US SPX 500 mini on FXOpen) – perhaps market participants were spooked by rising producer prices and the prospect of higher Fed rates. However, this was followed by a statement from Fed Chair Powell, who reassured the markets. According to him:
→ the next Fed move is unlikely to be a rate hike;
→ the PPI data is more "mixed than hot", considering that the previous period's data was revised downwards.
The chart of US SPX 500 mini on FXOpen shows that:
→ the price is moving within an upward channel;
→ an intermediate trendline (shown with blue dots) within the upward channel is providing support;
→ after the PPI news, the price tested (as indicated by the arrow) this intermediate trendline;
→ at the same time, the price also tested the 5200 support level;
→ Powell's subsequent comments added positivity to the market, and the price rose towards the important 5250 level we mentioned earlier.
Market participants are now focused on the next set of important news: Consumer Price Index (CPI) data and Core Retail Sales will be released today at 15:30 GMT+3.
It is possible that evidence of inflation slowing down will lead to an increase in the S&P 500 index (US SPX 500 mini on FXOpen), as this will strengthen market participants' belief in an imminent rate cut. In such a scenario, the index price could reach a historical record.
Trade global index CFDs with zero commission and tight spreads. Open your FXOpen account now or learn more about trading index CFDs with FXOpen.
CFDs are complex instruments and come with a high risk of losing your money.
This article represents the opinion of the Companies operating under the FXOpen brand only. It is not to be construed as an offer, solicitation, or recommendation with respect to products and services provided by the Companies operating under the FXOpen brand, nor is it to be considered financial advice.
👍2
#stockmarket #stocks #MarketNews
The Stock Price of PepsiСo (PEP) Is Retracting from Its Yearly High
On April 23, the quarterly report of PepsiCo's performance for the first quarter was published, which was awaited anxiously.
The issue stemmed from the fact that in December 2023, the U.S. Food and Drug Administration (FDA) announced the recall of over 40 Quaker Oats products – a company owned by PepsiCo – due to potential salmonella contamination. This led to a 22% decline in sales volume of Quaker Food products in the first quarter.
However, the report exceeded expectations:
→ Earnings per share: Actual = $1.61, Expected = $1.518;
→ Gross revenue: Actual = $18.25 billion, Expected = $18.08 billion.
By April 25, the stock price of PepsiCo (PEP) reached its yearly high, surpassing the $180 mark.
Then, this week, specifically May 13, the stock price of PepsiCo (PEP) hit a new yearly high, exceeding $181.
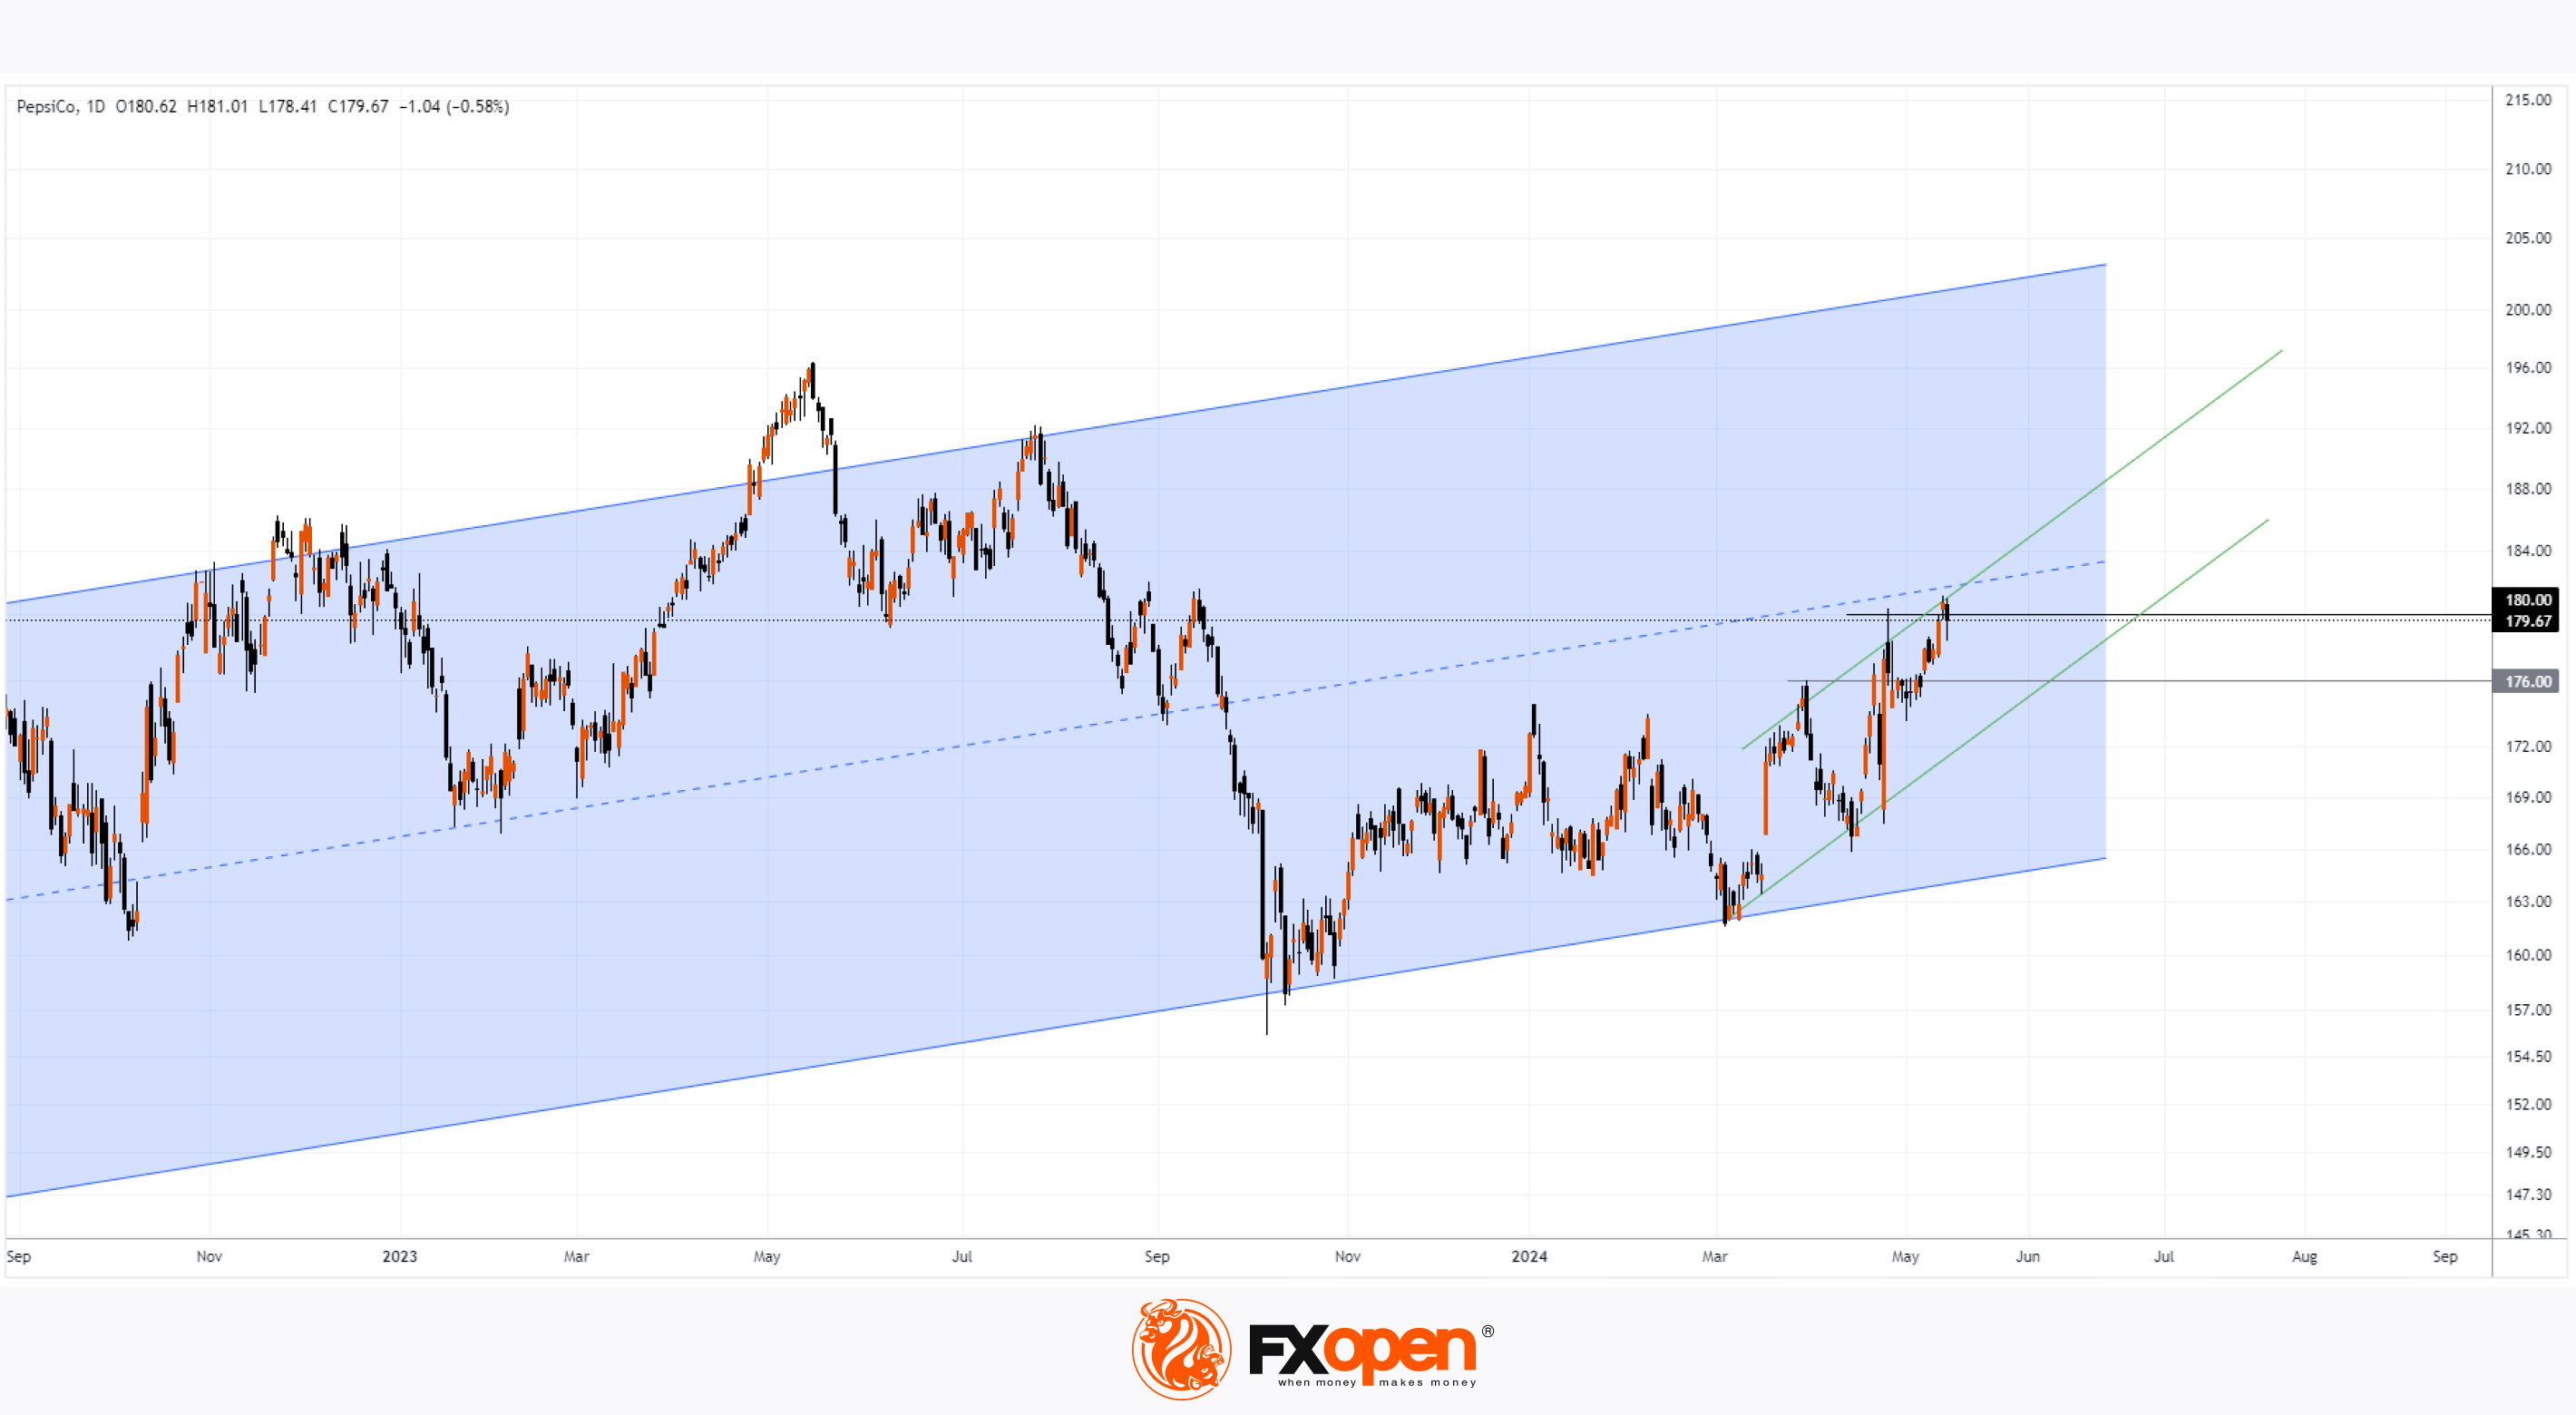
Technical analysis of the PEP stock chart shows that:
→ The price is moving within a long-term ascending channel (shown in blue);
→ Starting from March, the price is forming a short-term, steeper ascending channel (shown in green).
Thus, the price of PEP stock has risen by approximately 10% since the beginning of March. This may motivate shareholders to take profits. By the way, according to SEC Form 4 information, David Flavell, Vice President, General Counsel, and Secretary of PepsiCo, sold over 6,000 shares on May 10.
Therefore, it is plausible to assume that the PEP stock market is in a vulnerable position for a retracement, considering that resistance to further price growth in the short term could be:
→ The psychological level at $180;
→ The median line of the blue channel.
If a correction scenario unfolds, a decline to the lower boundary of the green channel cannot be ruled out.
According to TipRanks, analysts' average forecasted price for PEP stock is $190 within 12 months.
Buy and sell stocks of the world's biggest publicly-listed companies with CFDs on FXOpen’s trading platform. Open your FXOpen account now or learn more about trading share CFDs with FXOpen.
CFDs are complex instruments and come with a high risk of losing your money.
This article represents the opinion of the Companies operating under the FXOpen brand only. It is not to be construed as an offer, solicitation, or recommendation with respect to products and services provided by the Companies operating under the FXOpen brand, nor is it to be considered financial advice.
The Stock Price of PepsiСo (PEP) Is Retracting from Its Yearly High
On April 23, the quarterly report of PepsiCo's performance for the first quarter was published, which was awaited anxiously.
The issue stemmed from the fact that in December 2023, the U.S. Food and Drug Administration (FDA) announced the recall of over 40 Quaker Oats products – a company owned by PepsiCo – due to potential salmonella contamination. This led to a 22% decline in sales volume of Quaker Food products in the first quarter.
However, the report exceeded expectations:
→ Earnings per share: Actual = $1.61, Expected = $1.518;
→ Gross revenue: Actual = $18.25 billion, Expected = $18.08 billion.
By April 25, the stock price of PepsiCo (PEP) reached its yearly high, surpassing the $180 mark.
Then, this week, specifically May 13, the stock price of PepsiCo (PEP) hit a new yearly high, exceeding $181.
Technical analysis of the PEP stock chart shows that:
→ The price is moving within a long-term ascending channel (shown in blue);
→ Starting from March, the price is forming a short-term, steeper ascending channel (shown in green).
Thus, the price of PEP stock has risen by approximately 10% since the beginning of March. This may motivate shareholders to take profits. By the way, according to SEC Form 4 information, David Flavell, Vice President, General Counsel, and Secretary of PepsiCo, sold over 6,000 shares on May 10.
Therefore, it is plausible to assume that the PEP stock market is in a vulnerable position for a retracement, considering that resistance to further price growth in the short term could be:
→ The psychological level at $180;
→ The median line of the blue channel.
If a correction scenario unfolds, a decline to the lower boundary of the green channel cannot be ruled out.
According to TipRanks, analysts' average forecasted price for PEP stock is $190 within 12 months.
Buy and sell stocks of the world's biggest publicly-listed companies with CFDs on FXOpen’s trading platform. Open your FXOpen account now or learn more about trading share CFDs with FXOpen.
CFDs are complex instruments and come with a high risk of losing your money.
This article represents the opinion of the Companies operating under the FXOpen brand only. It is not to be construed as an offer, solicitation, or recommendation with respect to products and services provided by the Companies operating under the FXOpen brand, nor is it to be considered financial advice.
👍2
#marketanalysis #usdollar #forextrading #tradingtips
The US Dollar Is Weakening Following Inflation Data
Yesterday saw the release of key economic indicators for the US. According to ForexFactory:
→ Core Price Index (CPI) monthly: actual = 0.3%, expected = 0.4%, previous = 0.4%;
→ Core Price Index (CPI) annual: actual = 3.4%, expected = 3.4%, previous = 3.5%;
→ Retail Sales monthly: actual = 0.0%, expected = 0.4%, previous = 0.6%.
Concerns about rising inflation did not materialise. Reuters reports that unchanged retail sales suggest conditions are forming for interest rate cuts.
Financial markets reacted significantly, with the US dollar weakening:
→ As we reported yesterday, signs of slowing inflation increased market participants' belief in imminent rate cuts, leading to the S&P 500 stock index (US SPX 500 mini on FXOpen) reaching an all-time high;
→ Gold prices reached a high not seen since April 21;
→ Other currencies strengthened against the US dollar.
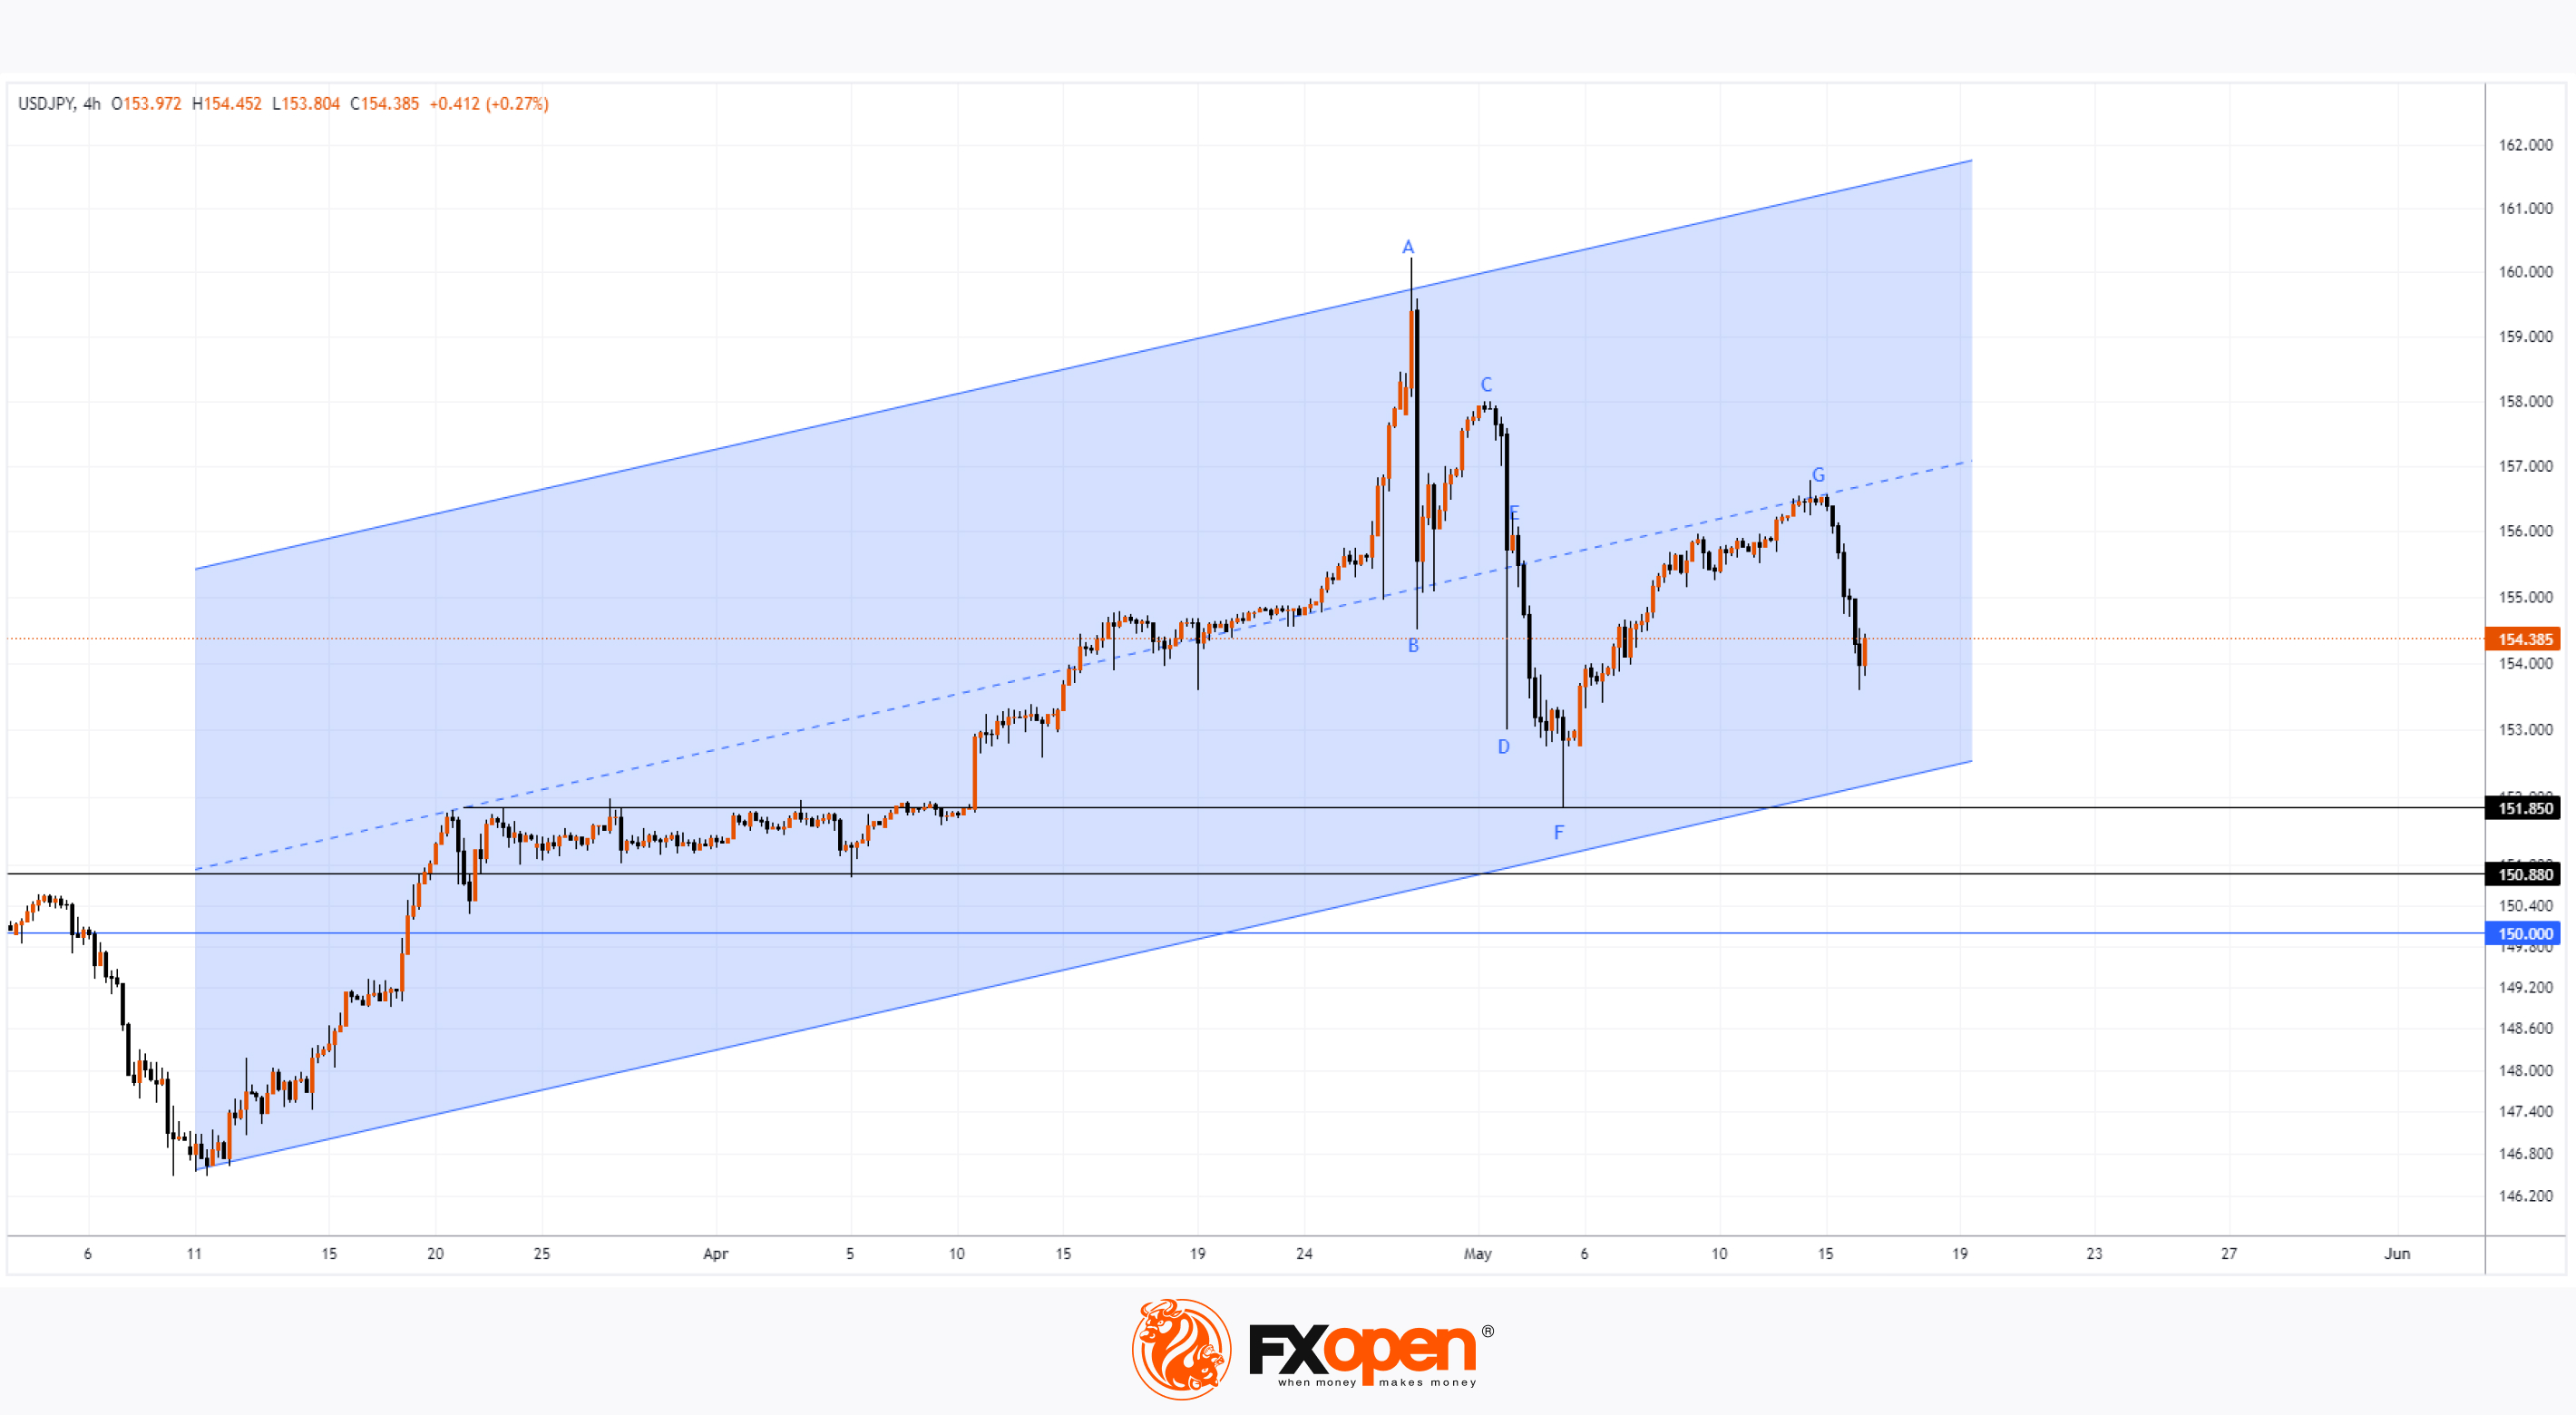
An interesting situation is developing on the USD/JPY chart. Applying Fibonacci ratios, we note three instances where price recovery halted around the 0.382 level:
→ Recovery from B to C following the impulsive decline from A to B;
→ Recovery from D to E after the impulsive decline from C to D;
→ Recovery from F to G after the 3-wave decline from A to F.
According to technical analysis of USD/JPY, these proportions indicate that demand is consistently fading with each attempt to restore the upward trend described by the blue channel.
Moreover, the local peak at G provides information about the median line, acting as resistance. Therefore, there are grounds to assume that bears will continue to dominate, pushing prices downward. If this scenario unfolds, lower support levels (151.85, 150.88, psychological level 150.00), as well as the lower boundary of the channel, will test the seriousness of the bears' intentions.
Trade over 50 forex markets 24 hours a day with FXOpen. Take advantage of low commissions, deep liquidity, and spreads from 0.0 pips. Open your FXOpen account now or learn more about trading forex with FXOpen.
CFDs are complex instruments and come with a high risk of losing your money.
This article represents the opinion of the Companies operating under the FXOpen brand only. It is not to be construed as an offer, solicitation, or recommendation with respect to products and services provided by the Companies operating under the FXOpen brand, nor is it to be considered financial advice.
The US Dollar Is Weakening Following Inflation Data
Yesterday saw the release of key economic indicators for the US. According to ForexFactory:
→ Core Price Index (CPI) monthly: actual = 0.3%, expected = 0.4%, previous = 0.4%;
→ Core Price Index (CPI) annual: actual = 3.4%, expected = 3.4%, previous = 3.5%;
→ Retail Sales monthly: actual = 0.0%, expected = 0.4%, previous = 0.6%.
Concerns about rising inflation did not materialise. Reuters reports that unchanged retail sales suggest conditions are forming for interest rate cuts.
Financial markets reacted significantly, with the US dollar weakening:
→ As we reported yesterday, signs of slowing inflation increased market participants' belief in imminent rate cuts, leading to the S&P 500 stock index (US SPX 500 mini on FXOpen) reaching an all-time high;
→ Gold prices reached a high not seen since April 21;
→ Other currencies strengthened against the US dollar.
An interesting situation is developing on the USD/JPY chart. Applying Fibonacci ratios, we note three instances where price recovery halted around the 0.382 level:
→ Recovery from B to C following the impulsive decline from A to B;
→ Recovery from D to E after the impulsive decline from C to D;
→ Recovery from F to G after the 3-wave decline from A to F.
According to technical analysis of USD/JPY, these proportions indicate that demand is consistently fading with each attempt to restore the upward trend described by the blue channel.
Moreover, the local peak at G provides information about the median line, acting as resistance. Therefore, there are grounds to assume that bears will continue to dominate, pushing prices downward. If this scenario unfolds, lower support levels (151.85, 150.88, psychological level 150.00), as well as the lower boundary of the channel, will test the seriousness of the bears' intentions.
Trade over 50 forex markets 24 hours a day with FXOpen. Take advantage of low commissions, deep liquidity, and spreads from 0.0 pips. Open your FXOpen account now or learn more about trading forex with FXOpen.
CFDs are complex instruments and come with a high risk of losing your money.
This article represents the opinion of the Companies operating under the FXOpen brand only. It is not to be construed as an offer, solicitation, or recommendation with respect to products and services provided by the Companies operating under the FXOpen brand, nor is it to be considered financial advice.
👍2
#stockmarket #stocktrading #MarketNews
The Share Price of Alibaba (BABA) Has Reached Its Yearly High
On 14 May, Alibaba released its first-quarter performance report:
→ Earnings per share: actual = $1.404, expected = $1.421;
→ Gross income: actual = $30.716 billion, expected = $30.502 billion.
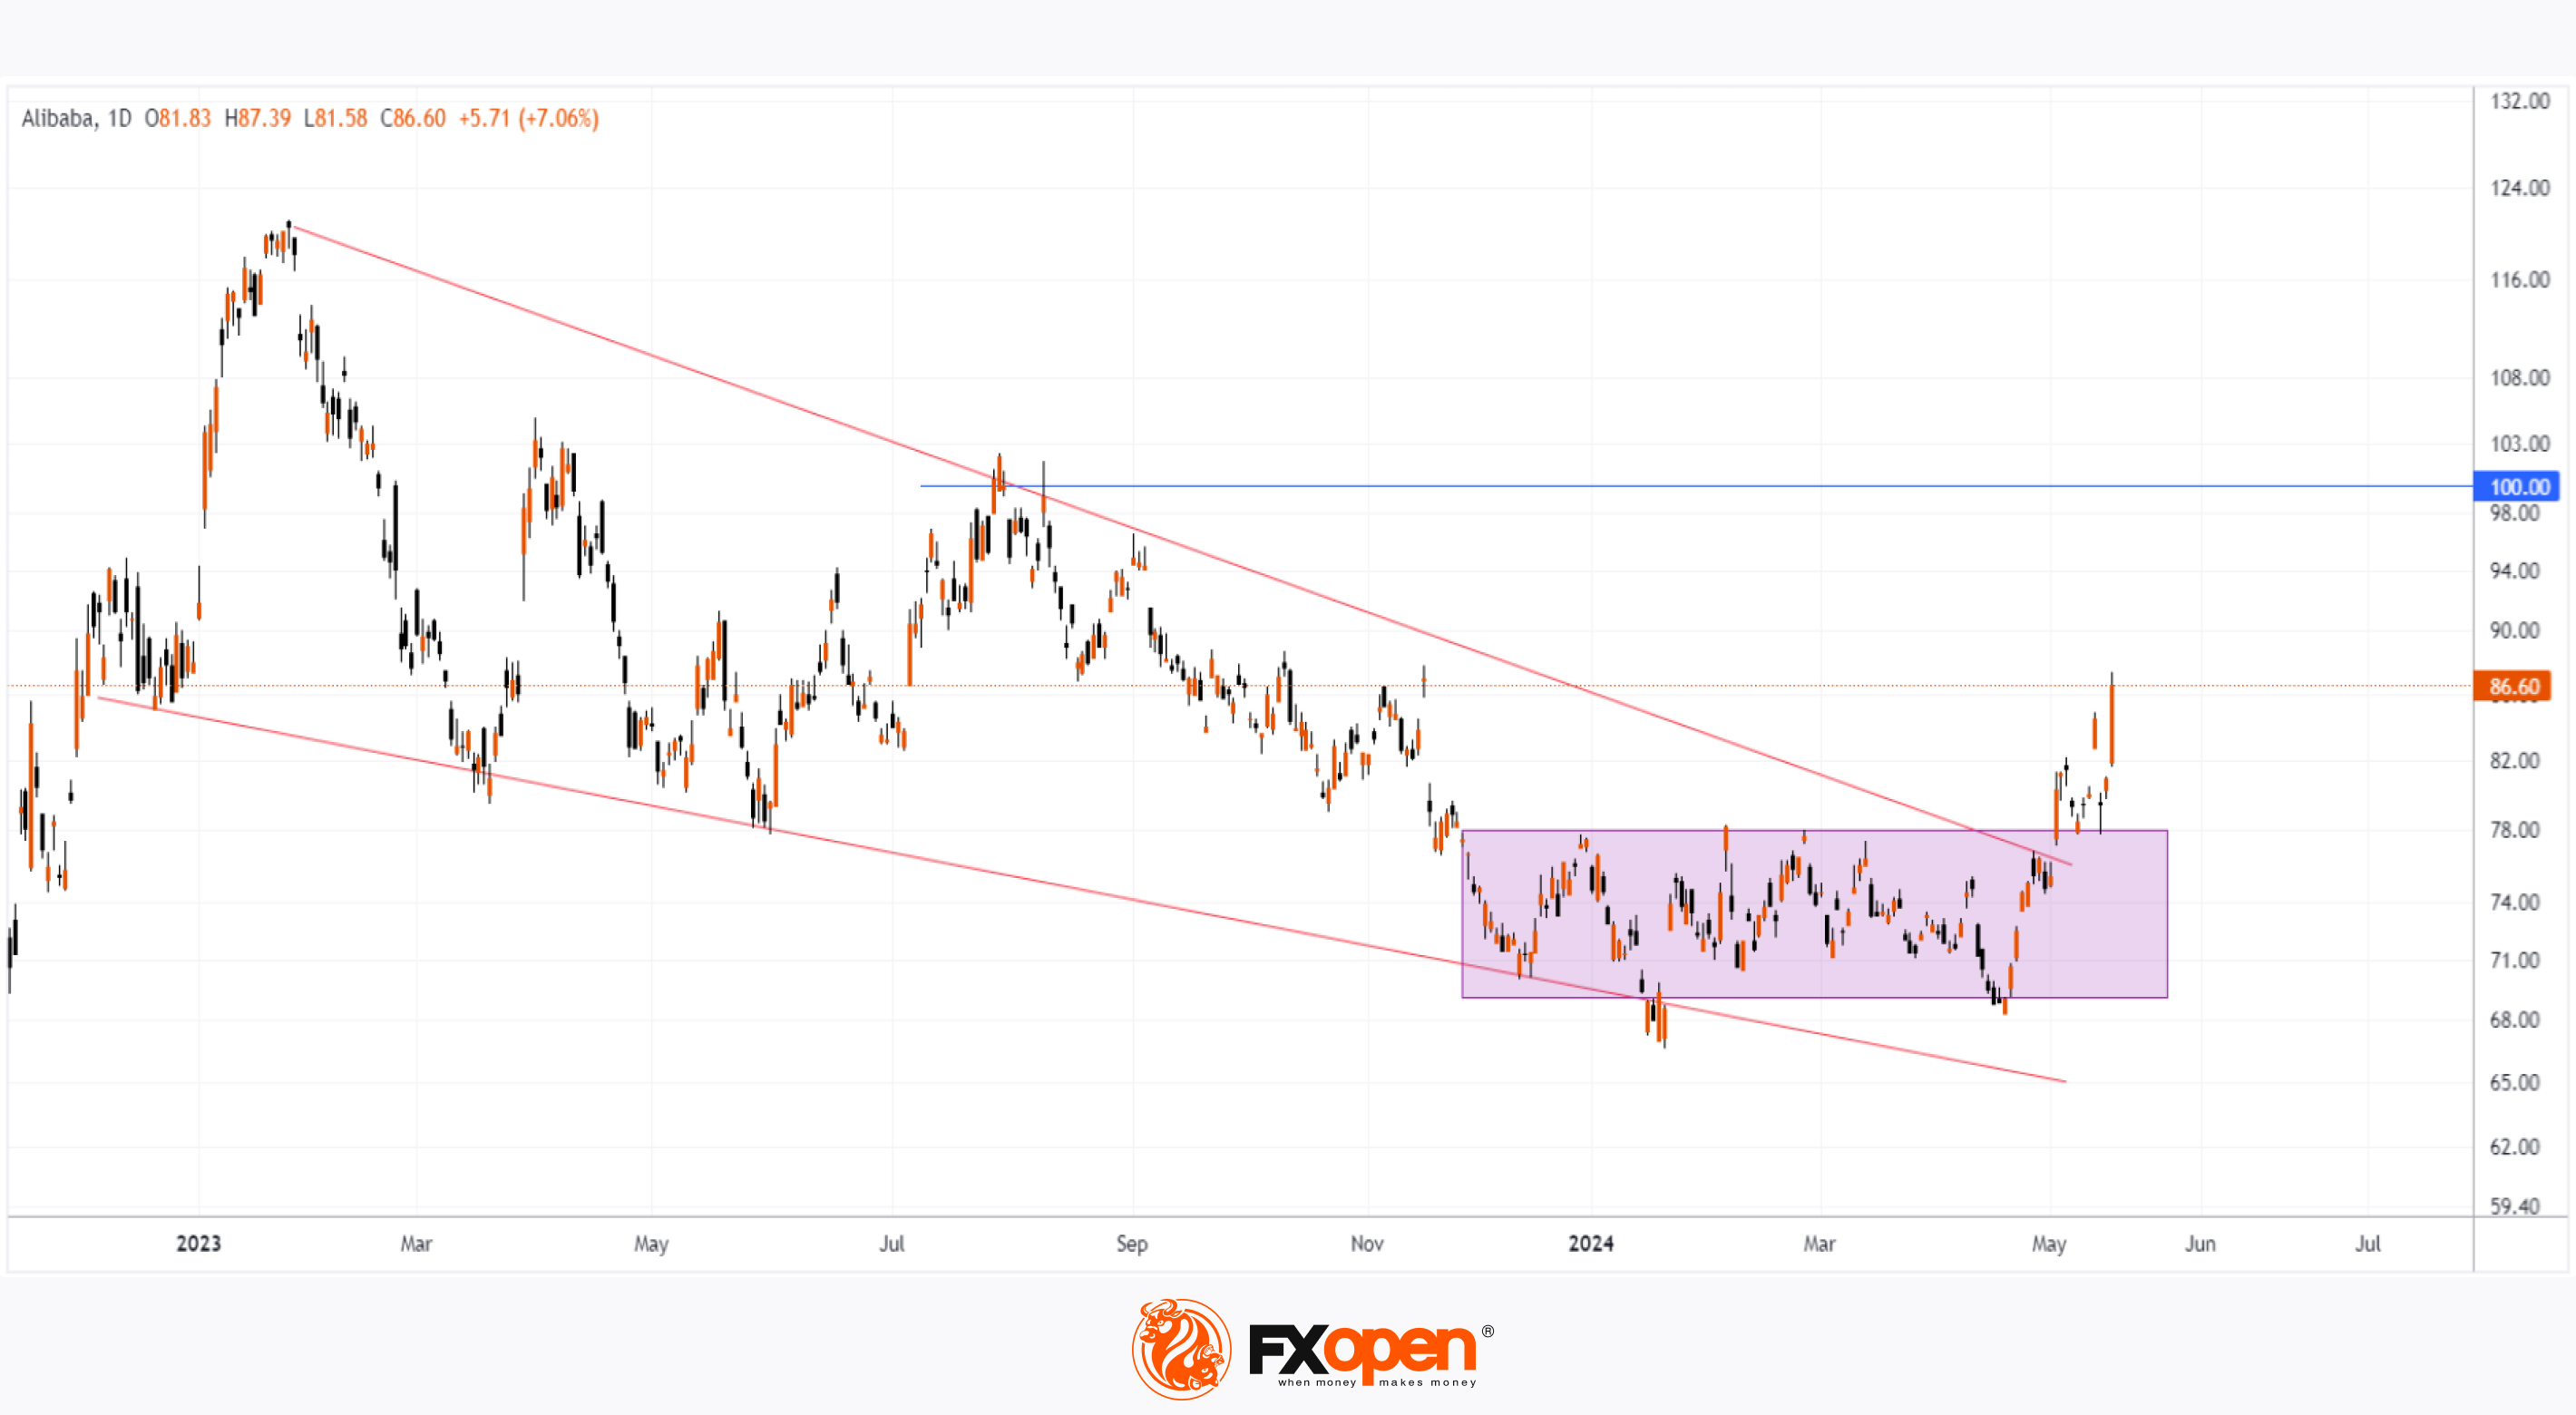
The fact that earnings per share were slightly below expectations did not disappoint investors much, as on 16 May, Alibaba's share price (BABA) reached a yearly high, exceeding $86, forming a wide bullish candlestick with a close near the top (a sign of strong demand).
Positive sentiments were also driven by:
→ Another Chinese company, JD.com, released a report that exceeded expectations;
→ US regulators published information that well-known investor Michael Burry invested in Alibaba shares. David Tepper, head of the hedge fund Appaloosa Management, also holds a bullish outlook;
→ According to a note published on X (Twitter) by Citron Research analysts, Alibaba's share price could rise to $100.
According to the technical analysis of the BABA share chart:
→ The price broke upwards from a narrowing triangle (shown in red lines) – this is a bullish sign;
→ In April, the price did not reach the lower boundary of the triangle at its lowest point – this confirms strong demand;
→ The purple rectangle can be seen as the range in which large hedge funds accumulated BABA shares;
→ Extending the height of the rectangle upwards from its upper boundary, we get a resistance level of $87, which is where the current quotation is located.
It is also worth noting that the psychological level of $100 per BABA share acted as resistance last summer.
Given the above, it is reasonable to assume that BABA's share price could form a significant rally in the long-term with short-term corrections.
According to TipRanks, the average forecasted price for BABA shares in 12 months is $105.13.
Buy and sell stocks of the world's biggest publicly-listed companies with CFDs on FXOpen’s trading platform. Open your FXOpen account now or learn more about trading share CFDs with FXOpen.
CFDs are complex instruments and come with a high risk of losing your money.
This article represents the opinion of the Companies operating under the FXOpen brand only. It is not to be construed as an offer, solicitation, or recommendation with respect to products and services provided by the Companies operating under the FXOpen brand, nor is it to be considered financial advice.
The Share Price of Alibaba (BABA) Has Reached Its Yearly High
On 14 May, Alibaba released its first-quarter performance report:
→ Earnings per share: actual = $1.404, expected = $1.421;
→ Gross income: actual = $30.716 billion, expected = $30.502 billion.
The fact that earnings per share were slightly below expectations did not disappoint investors much, as on 16 May, Alibaba's share price (BABA) reached a yearly high, exceeding $86, forming a wide bullish candlestick with a close near the top (a sign of strong demand).
Positive sentiments were also driven by:
→ Another Chinese company, JD.com, released a report that exceeded expectations;
→ US regulators published information that well-known investor Michael Burry invested in Alibaba shares. David Tepper, head of the hedge fund Appaloosa Management, also holds a bullish outlook;
→ According to a note published on X (Twitter) by Citron Research analysts, Alibaba's share price could rise to $100.
According to the technical analysis of the BABA share chart:
→ The price broke upwards from a narrowing triangle (shown in red lines) – this is a bullish sign;
→ In April, the price did not reach the lower boundary of the triangle at its lowest point – this confirms strong demand;
→ The purple rectangle can be seen as the range in which large hedge funds accumulated BABA shares;
→ Extending the height of the rectangle upwards from its upper boundary, we get a resistance level of $87, which is where the current quotation is located.
It is also worth noting that the psychological level of $100 per BABA share acted as resistance last summer.
Given the above, it is reasonable to assume that BABA's share price could form a significant rally in the long-term with short-term corrections.
According to TipRanks, the average forecasted price for BABA shares in 12 months is $105.13.
Buy and sell stocks of the world's biggest publicly-listed companies with CFDs on FXOpen’s trading platform. Open your FXOpen account now or learn more about trading share CFDs with FXOpen.
CFDs are complex instruments and come with a high risk of losing your money.
This article represents the opinion of the Companies operating under the FXOpen brand only. It is not to be construed as an offer, solicitation, or recommendation with respect to products and services provided by the Companies operating under the FXOpen brand, nor is it to be considered financial advice.
👍2
#sp500 #XAUUSD #goldprice #pepsico #stockmarket #stocktrading
Weekly Market Wrap With Gary Thomson: S&P500, US Dollar, Gold Price, PEP Stocks
Get the latest scoop on the week's hottest headlines, all in one convenient video. Join Gary Thomson, the COO of FXOpen UK, as he breaks down the most significant news reports and shares his expert insights. Read the latest news on Market Pulse.
🔸The S&P500 Has Reached a Significant Resistance Level
🔸US Dollar Adjusts after the Publication of Inflation Data in the US
🔸Gold Price (XAU/USD) Is Testing an Important Resistance Zone
🔸The Stock Price of PepsiCo (PEP) Is Retracting from its Yearly High
Stay in the know and empower yourself with our short, yet power-packed video. Watch it now and stay updated with FXOpen. Don't miss out on this invaluable opportunity to sharpen your trading skills and make informed decisions.
https://cutt.ly/EerDQqMm
CFDs are complex instruments and come with a high risk of losing your money.
Weekly Market Wrap With Gary Thomson: S&P500, US Dollar, Gold Price, PEP Stocks
Get the latest scoop on the week's hottest headlines, all in one convenient video. Join Gary Thomson, the COO of FXOpen UK, as he breaks down the most significant news reports and shares his expert insights. Read the latest news on Market Pulse.
🔸The S&P500 Has Reached a Significant Resistance Level
🔸US Dollar Adjusts after the Publication of Inflation Data in the US
🔸Gold Price (XAU/USD) Is Testing an Important Resistance Zone
🔸The Stock Price of PepsiCo (PEP) Is Retracting from its Yearly High
Stay in the know and empower yourself with our short, yet power-packed video. Watch it now and stay updated with FXOpen. Don't miss out on this invaluable opportunity to sharpen your trading skills and make informed decisions.
https://cutt.ly/EerDQqMm
CFDs are complex instruments and come with a high risk of losing your money.
YouTube
Weekly Market Wrap With Gary Thomson: S&P500, US Dollar, Gold Price, PEP Stocks
Get the latest scoop on the week's hottest headlines, all in one convenient video. Join Gary Thomson, the COO of FXOpen UK, as he breaks down the most signif...
👍2
#marketanalysis #MarketNews #stockmarket #stocktrading
Coinbase (COIN) Stock Price Holds at Key Support Level
On Thursday, stock market traders were concerned about the sharp drop in Coinbase shares, listed on the Nasdaq, which fell by 9%. This was triggered by rumours that the Chicago-based CME Group is planning to launch cryptocurrency trading, posing a challenge to Coinbase, currently the leading cryptocurrency exchange in the US.
It is worth noting that CME already trades Bitcoin futures (since December 2017) and Ethereum futures (since February 2021). Is it possible for CME to launch spot cryptocurrency trading?
On one hand, interest in the cryptocurrency market has surged in 2024, with Bitcoin’s price up approximately 58% year-to-date, and around 146% over the past 12 months.
On the other hand, CME Group, as the world’s largest operator of exchange-traded derivatives, is considered a fundamental part of the US financial system. The SEC is unlikely to be favourable towards initiating cryptocurrency trading there, given their reputation for high risk.
Nevertheless, the sharp decline in Coinbase shares on Thursday did not continue into Friday.
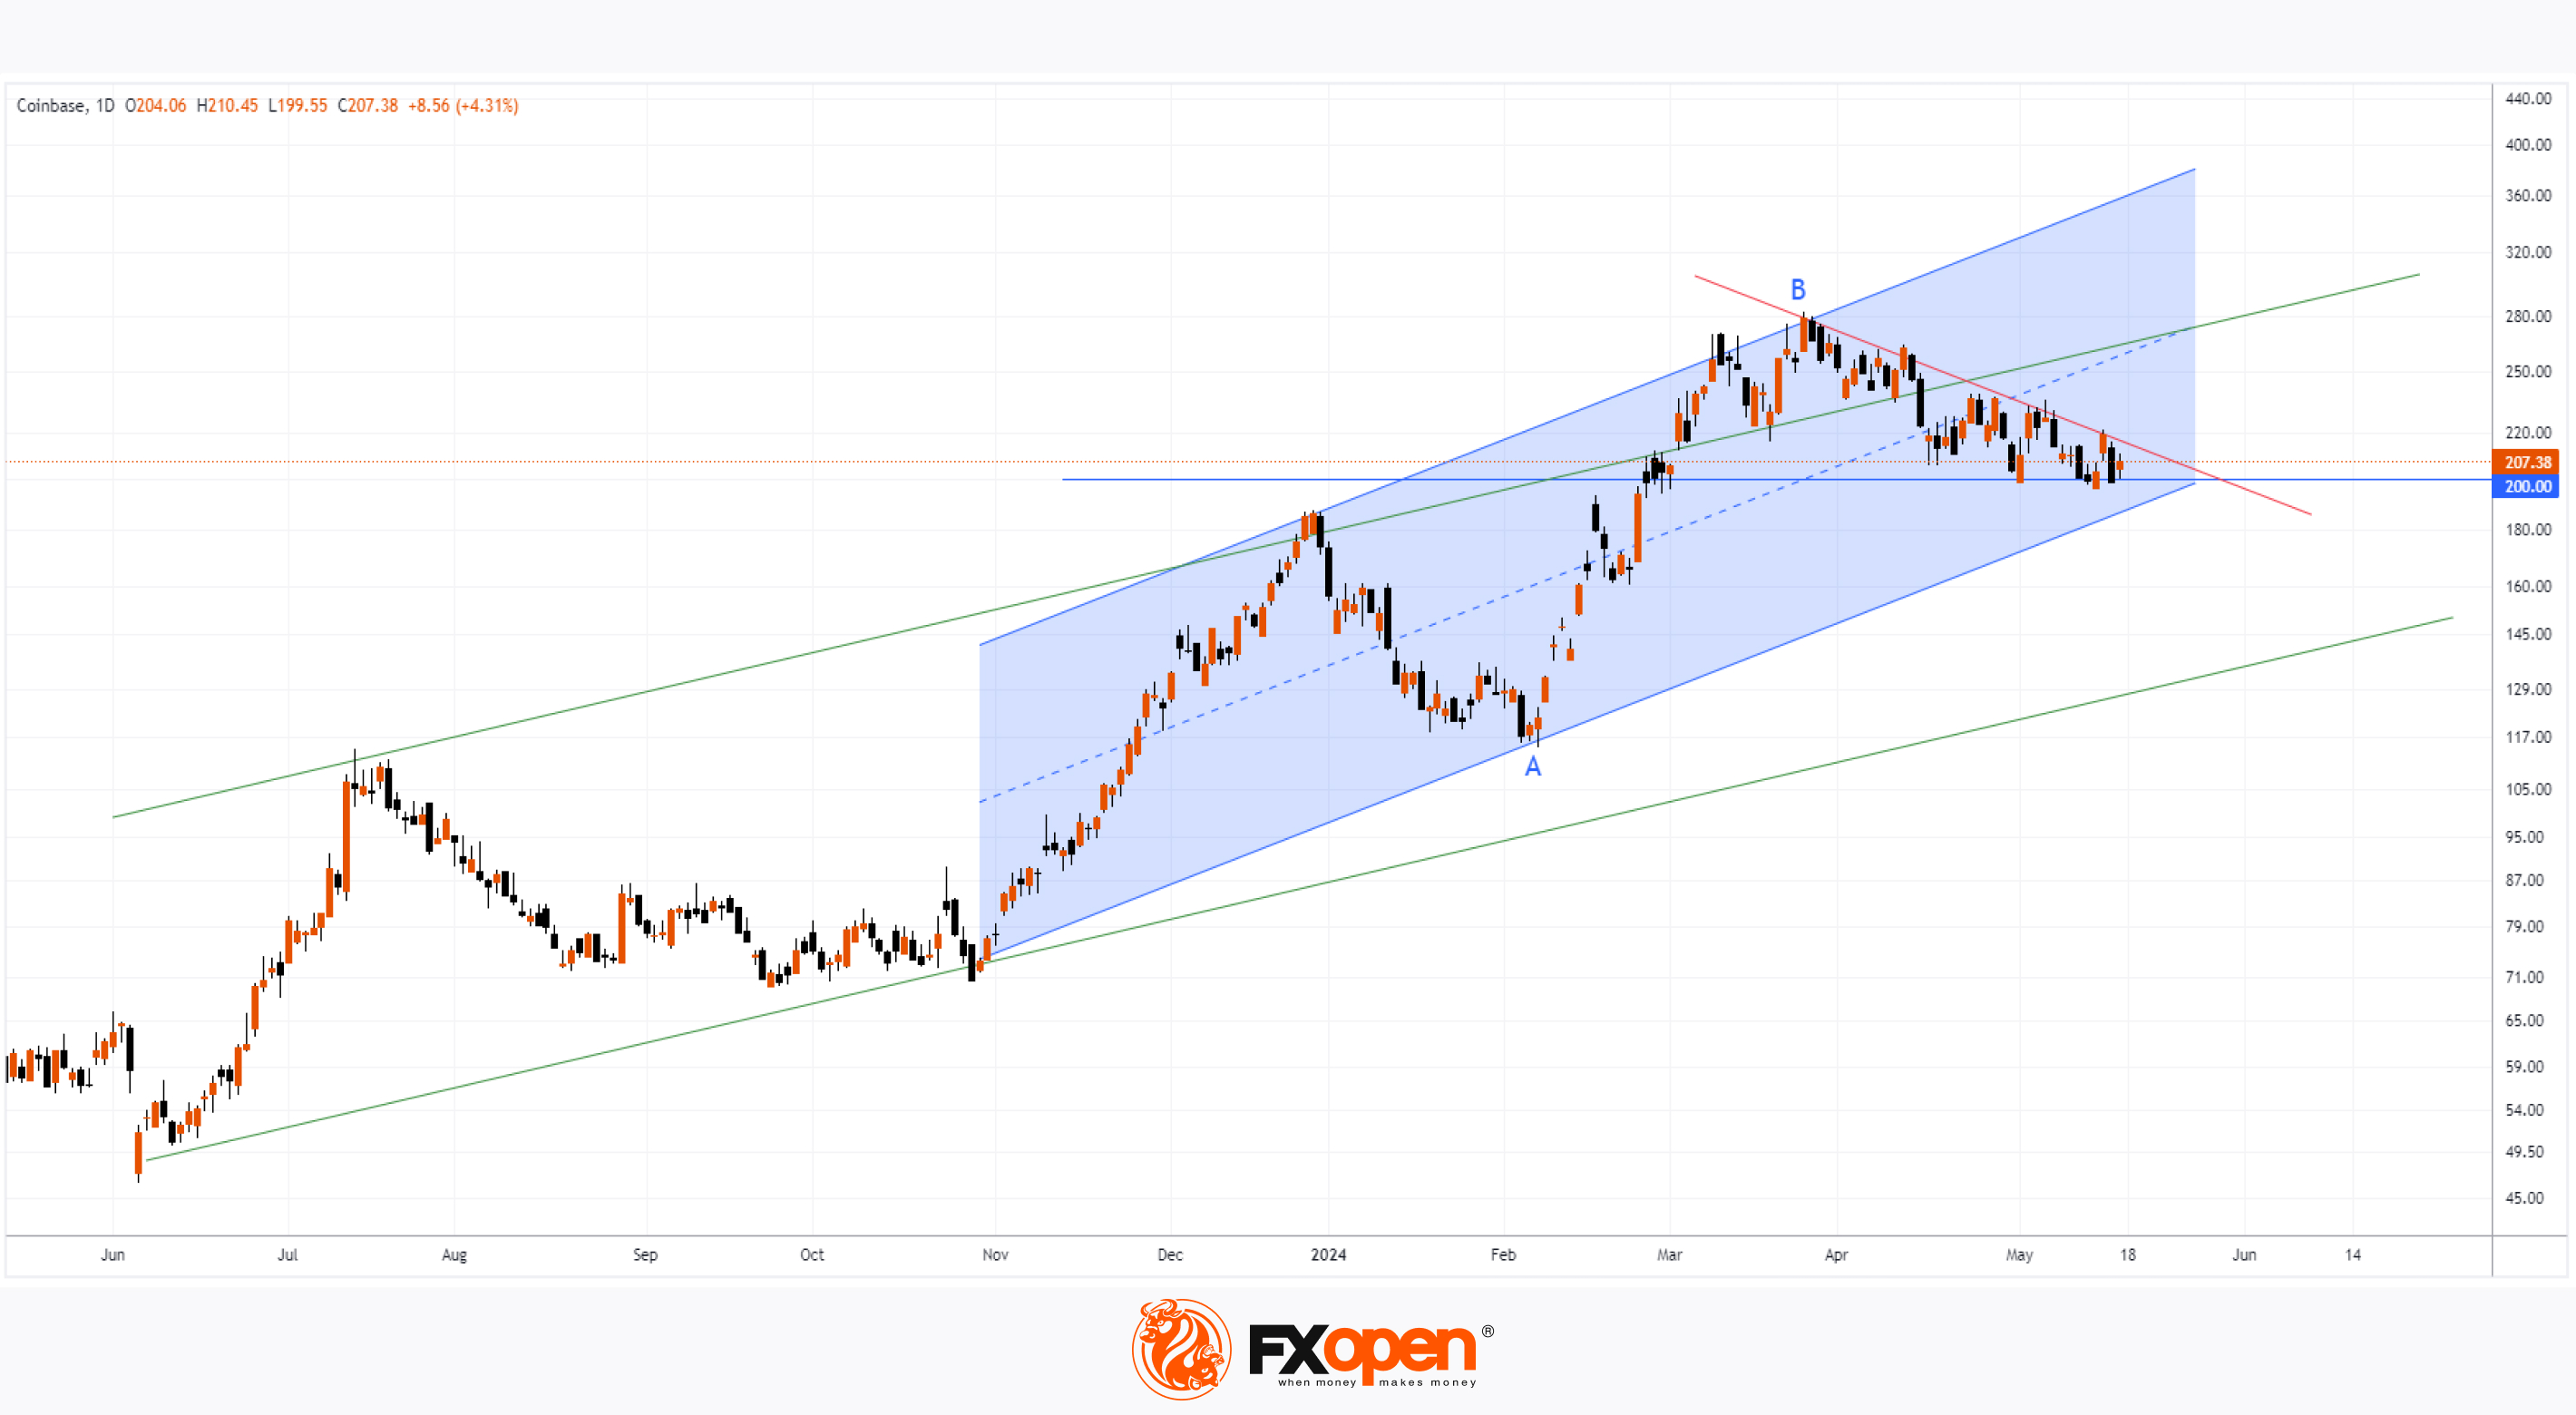
Technical analysis of COIN shares shows that:
→ Friday's closing price is higher than Thursday's, and Friday's low is above Thursday's low, indicating that the bearish momentum has eased;
→ The price is at a crucial support level of $200 per COIN share. This is not only a round psychological mark but also near the 50% retracement level after the A→B impulse rally. Additionally, the price is near the lower boundary of the upward channel shown in blue.
Given the above, it is reasonable to assume that bulls may attempt to resume the upward trend by breaking the red resistance line, marking a pullback within the multi-month rally.
However, the inability of bulls to "bounce" from the $200 level per COIN share could indicate a potential decline to the lower boundary of a less steep upward channel (shown in green) around $150 per share.
According to TipRanks, the average target price for COIN shares is $250 over the next 12 months.
Buy and sell stocks of the world's biggest publicly-listed companies with CFDs on FXOpen’s trading platform. Open your FXOpen account now or learn more about trading share CFDs with FXOpen.
CFDs are complex instruments and come with a high risk of losing your money.
This article represents the opinion of the Companies operating under the FXOpen brand only. It is not to be construed as an offer, solicitation, or recommendation with respect to products and services provided by the Companies operating under the FXOpen brand, nor is it to be considered financial advice.
Coinbase (COIN) Stock Price Holds at Key Support Level
On Thursday, stock market traders were concerned about the sharp drop in Coinbase shares, listed on the Nasdaq, which fell by 9%. This was triggered by rumours that the Chicago-based CME Group is planning to launch cryptocurrency trading, posing a challenge to Coinbase, currently the leading cryptocurrency exchange in the US.
It is worth noting that CME already trades Bitcoin futures (since December 2017) and Ethereum futures (since February 2021). Is it possible for CME to launch spot cryptocurrency trading?
On one hand, interest in the cryptocurrency market has surged in 2024, with Bitcoin’s price up approximately 58% year-to-date, and around 146% over the past 12 months.
On the other hand, CME Group, as the world’s largest operator of exchange-traded derivatives, is considered a fundamental part of the US financial system. The SEC is unlikely to be favourable towards initiating cryptocurrency trading there, given their reputation for high risk.
Nevertheless, the sharp decline in Coinbase shares on Thursday did not continue into Friday.
Technical analysis of COIN shares shows that:
→ Friday's closing price is higher than Thursday's, and Friday's low is above Thursday's low, indicating that the bearish momentum has eased;
→ The price is at a crucial support level of $200 per COIN share. This is not only a round psychological mark but also near the 50% retracement level after the A→B impulse rally. Additionally, the price is near the lower boundary of the upward channel shown in blue.
Given the above, it is reasonable to assume that bulls may attempt to resume the upward trend by breaking the red resistance line, marking a pullback within the multi-month rally.
However, the inability of bulls to "bounce" from the $200 level per COIN share could indicate a potential decline to the lower boundary of a less steep upward channel (shown in green) around $150 per share.
According to TipRanks, the average target price for COIN shares is $250 over the next 12 months.
Buy and sell stocks of the world's biggest publicly-listed companies with CFDs on FXOpen’s trading platform. Open your FXOpen account now or learn more about trading share CFDs with FXOpen.
CFDs are complex instruments and come with a high risk of losing your money.
This article represents the opinion of the Companies operating under the FXOpen brand only. It is not to be construed as an offer, solicitation, or recommendation with respect to products and services provided by the Companies operating under the FXOpen brand, nor is it to be considered financial advice.
👍2
#goldprice #XAUUSD #xau #MarketNews #marketanalysis
Gold Price Reaches Historic High
According to confirmed information, Iranian President Ebrahim Raisi, considered a potential successor to the country's supreme leader, Ayatollah Ali Khamenei, died in a helicopter crash in a mountainous area near the border with Azerbaijan. The helicopter also carried Foreign Minister Hossein Amir-Abdollahian and other officials, all of whom perished.
As news of the helicopter search in the inaccessible mountainous region spread, the price of gold rose significantly. Yahoo Finance reports that the gold rally was driven by uncertainty about the situation in Iran.
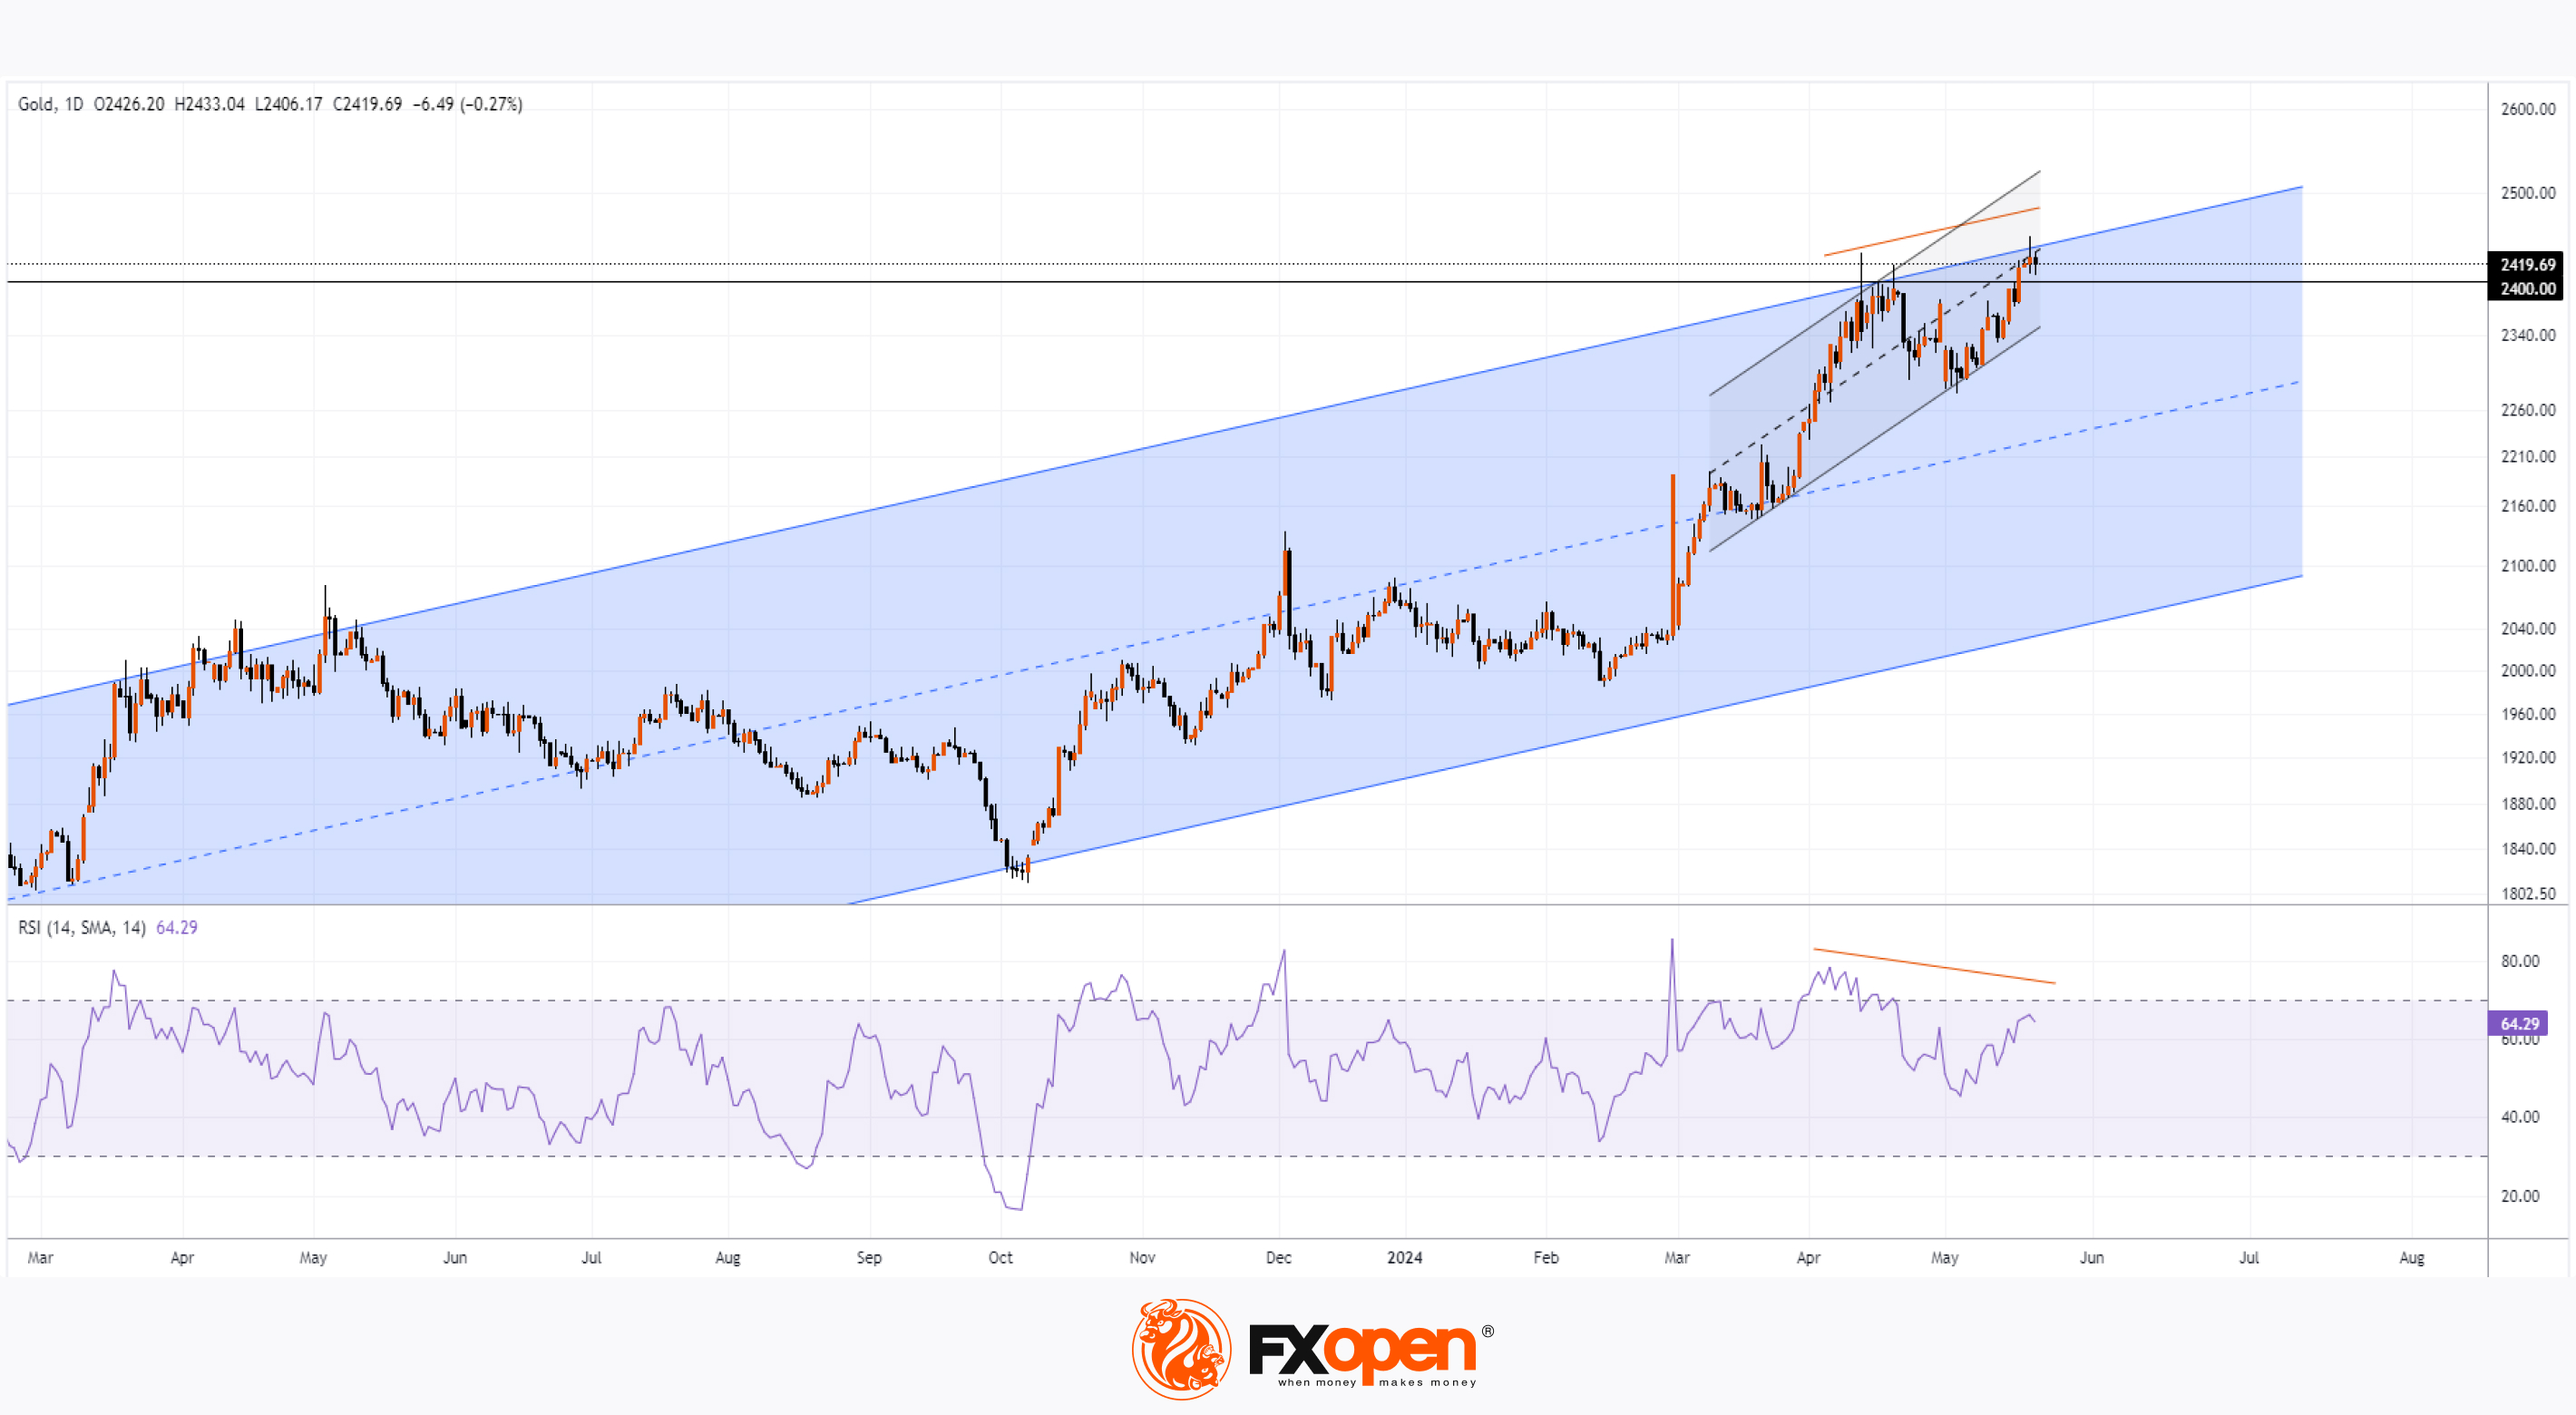
The XAU/USD chart indicates that yesterday, at the peak of the day, the price of gold reached $2450, an all-time high. Can the rally continue?
On 16 April, we wrote that the $2400 level could be a significant resistance – after which the price corrected to the $2380 level. In this context, today's gold price can be seen as a second attempt to break through the $2400 level.
Let's conduct a technical analysis of the gold price considering the new data:
→ The long-term ascending blue channel remains relevant. The price is near its upper boundary.
→ The price is near the median of the ascending black channel, which shows signs of resistance.
→ A bearish divergence is forming on the RSI indicator.
→ Having set a historical peak, the gold price started to decline. This was influenced by an official statement from Israel denying involvement in the crash.
It is possible that a reduction in geopolitical tension will deter bulls from pushing for new historical highs. Notably, the XBR/USD oil price did not show a similarly sharp rise, which would be expected if fears of Middle East escalation were truly strong.
Given the above, a new correction on the XAU/USD chart can be expected – possibly to the lower boundary of the short-term channel (shown in black). If this scenario unfolds, bears might find that the $2400 level now acts as significant support.
Start trading commodities with tight spreads. Open your trading account now or learn more about trading commodity CFDs with FXOpen.
CFDs are complex instruments and come with a high risk of losing your money.
This article represents the opinion of the Companies operating under the FXOpen brand only. It is not to be construed as an offer, solicitation, or recommendation with respect to products and services provided by the Companies operating under the FXOpen brand, nor is it to be considered financial advice.
Gold Price Reaches Historic High
According to confirmed information, Iranian President Ebrahim Raisi, considered a potential successor to the country's supreme leader, Ayatollah Ali Khamenei, died in a helicopter crash in a mountainous area near the border with Azerbaijan. The helicopter also carried Foreign Minister Hossein Amir-Abdollahian and other officials, all of whom perished.
As news of the helicopter search in the inaccessible mountainous region spread, the price of gold rose significantly. Yahoo Finance reports that the gold rally was driven by uncertainty about the situation in Iran.
The XAU/USD chart indicates that yesterday, at the peak of the day, the price of gold reached $2450, an all-time high. Can the rally continue?
On 16 April, we wrote that the $2400 level could be a significant resistance – after which the price corrected to the $2380 level. In this context, today's gold price can be seen as a second attempt to break through the $2400 level.
Let's conduct a technical analysis of the gold price considering the new data:
→ The long-term ascending blue channel remains relevant. The price is near its upper boundary.
→ The price is near the median of the ascending black channel, which shows signs of resistance.
→ A bearish divergence is forming on the RSI indicator.
→ Having set a historical peak, the gold price started to decline. This was influenced by an official statement from Israel denying involvement in the crash.
It is possible that a reduction in geopolitical tension will deter bulls from pushing for new historical highs. Notably, the XBR/USD oil price did not show a similarly sharp rise, which would be expected if fears of Middle East escalation were truly strong.
Given the above, a new correction on the XAU/USD chart can be expected – possibly to the lower boundary of the short-term channel (shown in black). If this scenario unfolds, bears might find that the $2400 level now acts as significant support.
Start trading commodities with tight spreads. Open your trading account now or learn more about trading commodity CFDs with FXOpen.
CFDs are complex instruments and come with a high risk of losing your money.
This article represents the opinion of the Companies operating under the FXOpen brand only. It is not to be construed as an offer, solicitation, or recommendation with respect to products and services provided by the Companies operating under the FXOpen brand, nor is it to be considered financial advice.
👍3
#GBPUSD #forextrading #marketanalysis
GBP/USD Rate Surges to Two-Month High After Inflation News
Today, the Consumer Price Index (CPI) figures for the UK were published. According to ForexFactory:
→ Annual CPI: actual = 2.3%; expected = 2.1%; previous = 3.2%.
→ Annual Core CPI: actual = 3.9%; expected = 3.6%; previous = 4.2%.
Thus, it can be asserted that:
→ The current inflation level is at its lowest since 2021.
→ It is close to the target levels of 2%.
However, economists polled by Reuters had expected a sharper drop to 2.1%, based on falling energy prices.
Additionally, inflation in the services sector (a key indicator monitored by the Bank of England due to the dominance of this sector in the UK economy) only slightly decreased to 5.9% from 6%.
As a result, CNBC reports that market participants have reduced the likelihood of the Bank of England easing monetary policy:
→ The probability of a rate cut in June has decreased to 15% compared to 50% before the inflation news was published.
→ The probability of a rate cut in August was estimated at 40% compared to 70% before the publication.
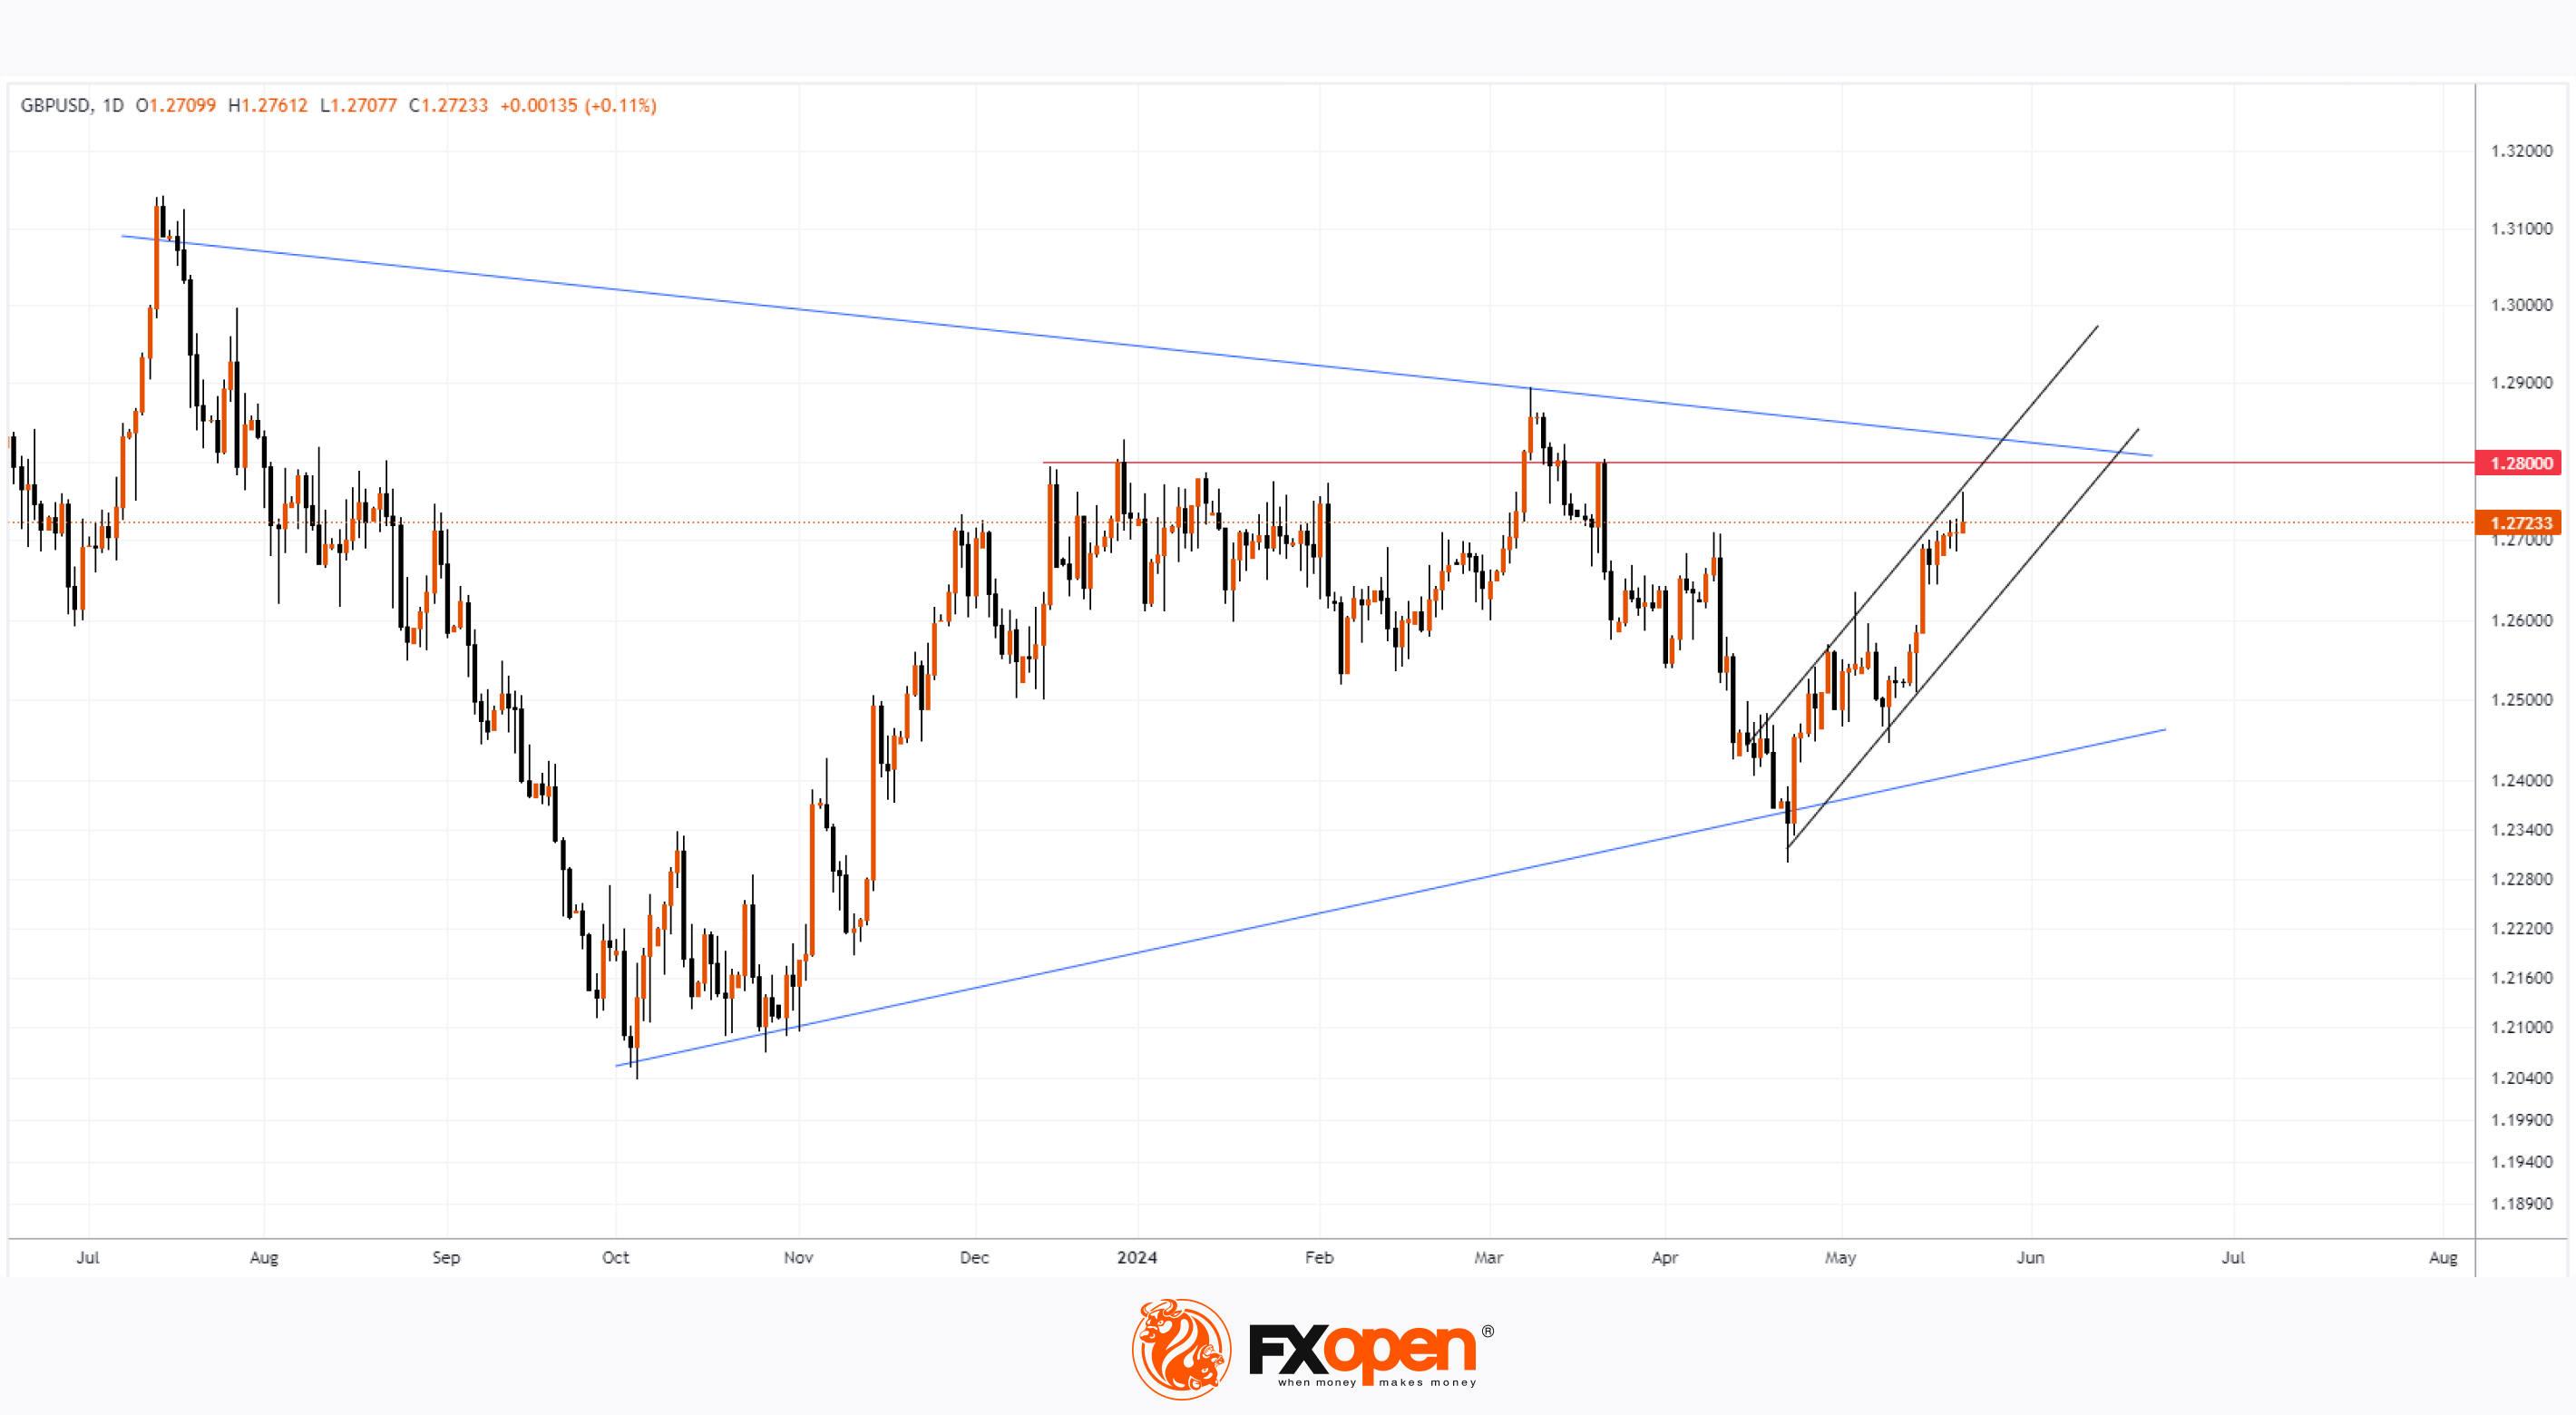
The currency market reacted with a surge in volatility – the GBP/USD rate jumped to a two-month high, reaching the 1.27555 level. However, as the market absorbed the data, the price began to gradually decline.
Technical analysis of the daily GBP/USD chart shows that:
→ The price is within a large narrowing triangle consolidation that started in 2023.
→ Within this triangle, the 1.2800 level plays a significant role – it provided resistance both last year and in 2024.
→ Today’s candlestick may form a long upper shadow, indicating continued bearish activity around the 1.2800 level.
→ This bearish activity could drive the price down to the lower boundary of the ascending channel (shown in black), which describes the trajectory of the GBP/USD price movement from the lower to the upper boundary of the triangle since mid-April.
At 21:00 GMT+3 today, the FOMC Meeting Minutes will be published – they are likely to have a strong impact on the dollar's exchange rate against other currencies. Be prepared for spikes in volatility.
Trade over 50 forex markets 24 hours a day with FXOpen. Take advantage of low commissions, deep liquidity, and spreads from 0.0 pips. Open your FXOpen account now or learn more about trading forex with FXOpen.
CFDs are complex instruments and come with a high risk of losing your money.
This article represents the opinion of the Companies operating under the FXOpen brand only. It is not to be construed as an offer, solicitation, or recommendation with respect to products and services provided by the Companies operating under the FXOpen brand, nor is it to be considered financial advice.
GBP/USD Rate Surges to Two-Month High After Inflation News
Today, the Consumer Price Index (CPI) figures for the UK were published. According to ForexFactory:
→ Annual CPI: actual = 2.3%; expected = 2.1%; previous = 3.2%.
→ Annual Core CPI: actual = 3.9%; expected = 3.6%; previous = 4.2%.
Thus, it can be asserted that:
→ The current inflation level is at its lowest since 2021.
→ It is close to the target levels of 2%.
However, economists polled by Reuters had expected a sharper drop to 2.1%, based on falling energy prices.
Additionally, inflation in the services sector (a key indicator monitored by the Bank of England due to the dominance of this sector in the UK economy) only slightly decreased to 5.9% from 6%.
As a result, CNBC reports that market participants have reduced the likelihood of the Bank of England easing monetary policy:
→ The probability of a rate cut in June has decreased to 15% compared to 50% before the inflation news was published.
→ The probability of a rate cut in August was estimated at 40% compared to 70% before the publication.
The currency market reacted with a surge in volatility – the GBP/USD rate jumped to a two-month high, reaching the 1.27555 level. However, as the market absorbed the data, the price began to gradually decline.
Technical analysis of the daily GBP/USD chart shows that:
→ The price is within a large narrowing triangle consolidation that started in 2023.
→ Within this triangle, the 1.2800 level plays a significant role – it provided resistance both last year and in 2024.
→ Today’s candlestick may form a long upper shadow, indicating continued bearish activity around the 1.2800 level.
→ This bearish activity could drive the price down to the lower boundary of the ascending channel (shown in black), which describes the trajectory of the GBP/USD price movement from the lower to the upper boundary of the triangle since mid-April.
At 21:00 GMT+3 today, the FOMC Meeting Minutes will be published – they are likely to have a strong impact on the dollar's exchange rate against other currencies. Be prepared for spikes in volatility.
Trade over 50 forex markets 24 hours a day with FXOpen. Take advantage of low commissions, deep liquidity, and spreads from 0.0 pips. Open your FXOpen account now or learn more about trading forex with FXOpen.
CFDs are complex instruments and come with a high risk of losing your money.
This article represents the opinion of the Companies operating under the FXOpen brand only. It is not to be construed as an offer, solicitation, or recommendation with respect to products and services provided by the Companies operating under the FXOpen brand, nor is it to be considered financial advice.
👍3
#stockmarket #nvidia #MarketNews
After Earnings Report, NVDA Stock Price Exceeds $1,000
For the first time in history, Nvidia's stock price has reached a four-digit number, and its market capitalisation has surpassed $2.5 trillion, ranking third globally after Microsoft and Apple. This surge is due to a strong earnings report, driven by high demand for AI chips:
→ Earnings per share: actual = $6.12, expected = $5.60;
→ Gross revenue: actual = $26.04 billion, expected = $24.59 billion.
Additionally, Nvidia announced a 10-for-1 stock split to make shares more accessible and attract new investors, which should support NVDA stock in the future.
While yesterday's main trading session closed around $950 per share, the price rose by approximately 6% in after-hours trading. Thus, NVDA's stock price has increased by over 100% since the beginning of the year. Can the rally continue?
On March 28, in the article "Stock Market Analysis: NVDA Losing Leadership?", we:
→ Noted signs of weakness relative to the S&P 500 index;
→ Constructed an ascending blue channel;
→ Suggested a potential pullback to the $800 level.
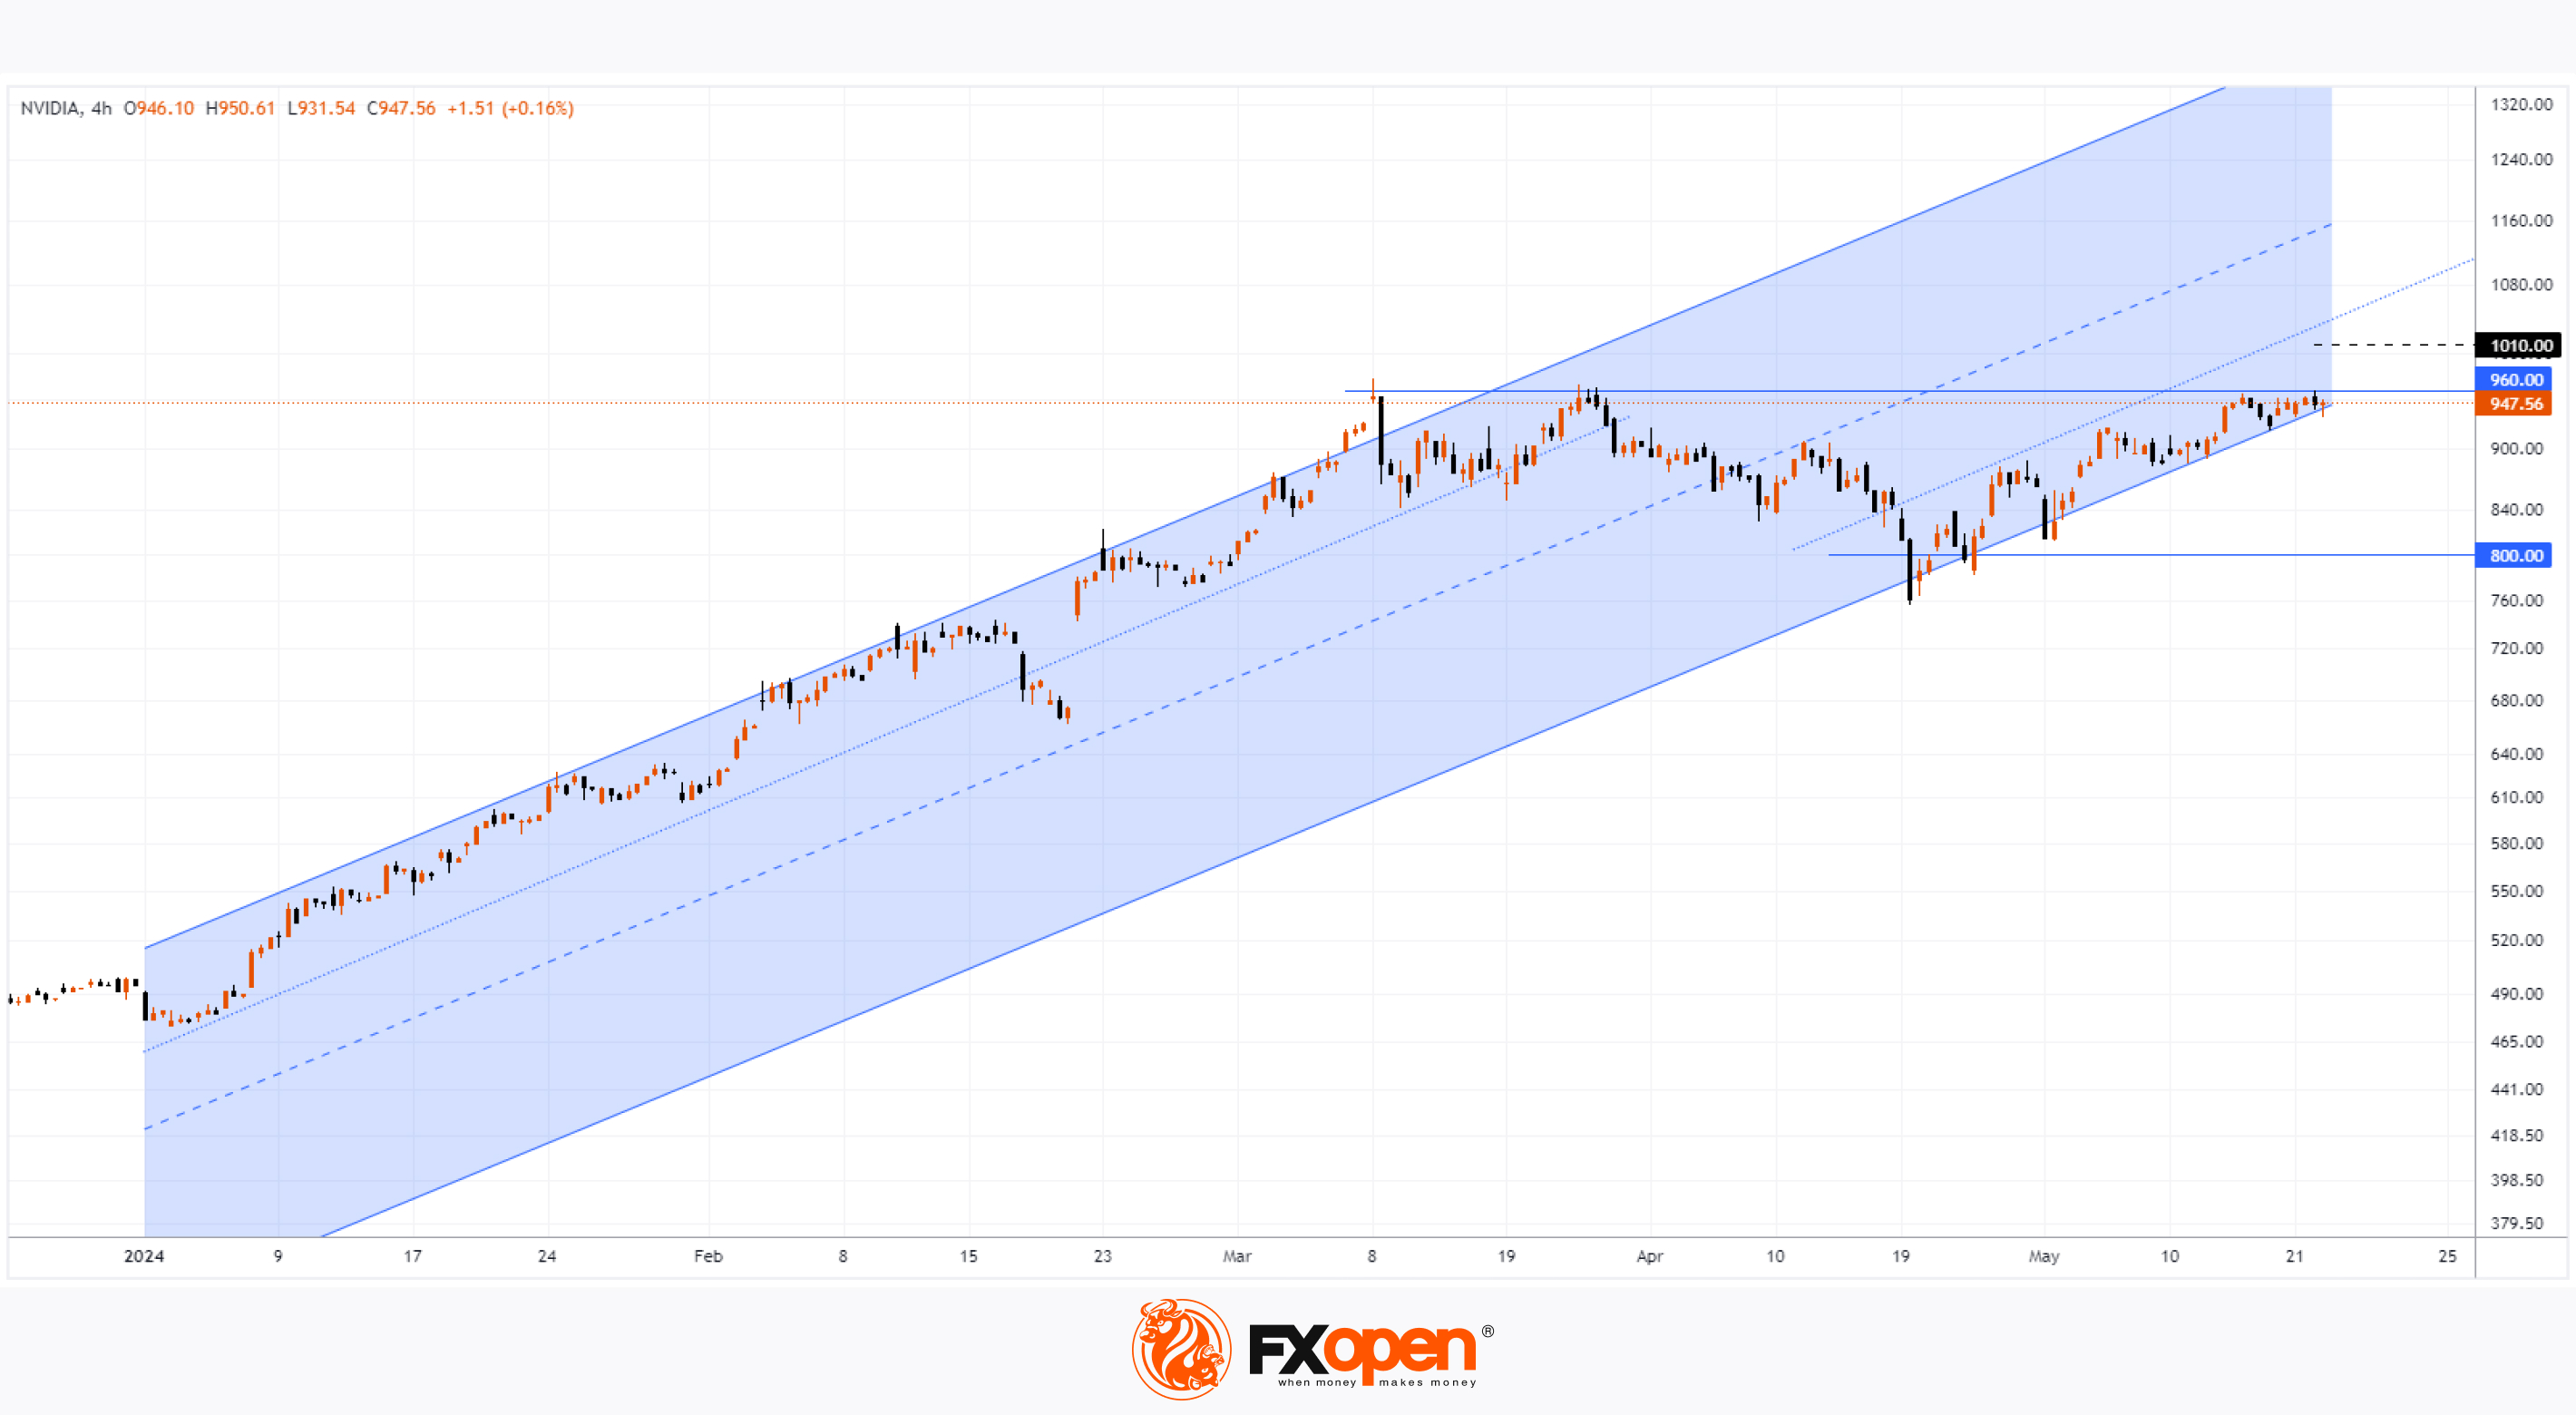
The NVDA chart shows that after these signs of weakness, the price dropped to the lower boundary of the channel on April 19, briefly falling below $800. However, the bulls then attempted to resume the upward trend, and it paid off.
Given NVDA's pre-market price, it is reasonable to assume today's main session will open around $1,010. Therefore, technical analysis of the NVDA daily chart today shows:
→ The price remains within the ascending channel;
→ The price is breaking through the $960 level with a bullish gap, which can now be expected to act as support;
→ If the bullish momentum from the earnings report continues (as it did on February 22), NVDA's price could approach the median line of the ascending channel.
According to TipRanks, the average analyst target price for NVDA is $1,104.62, but this target may be raised considering Nvidia's strong forecasts for the next quarter.
Buy and sell stocks of the world's biggest publicly-listed companies with CFDs on FXOpen’s trading platform. Open your FXOpen account now or learn more about trading share CFDs with FXOpen.
CFDs are complex instruments and come with a high risk of losing your money.
This article represents the opinion of the Companies operating under the FXOpen brand only. It is not to be construed as an offer, solicitation, or recommendation with respect to products and services provided by the Companies operating under the FXOpen brand, nor is it to be considered financial advice.
After Earnings Report, NVDA Stock Price Exceeds $1,000
For the first time in history, Nvidia's stock price has reached a four-digit number, and its market capitalisation has surpassed $2.5 trillion, ranking third globally after Microsoft and Apple. This surge is due to a strong earnings report, driven by high demand for AI chips:
→ Earnings per share: actual = $6.12, expected = $5.60;
→ Gross revenue: actual = $26.04 billion, expected = $24.59 billion.
Additionally, Nvidia announced a 10-for-1 stock split to make shares more accessible and attract new investors, which should support NVDA stock in the future.
While yesterday's main trading session closed around $950 per share, the price rose by approximately 6% in after-hours trading. Thus, NVDA's stock price has increased by over 100% since the beginning of the year. Can the rally continue?
On March 28, in the article "Stock Market Analysis: NVDA Losing Leadership?", we:
→ Noted signs of weakness relative to the S&P 500 index;
→ Constructed an ascending blue channel;
→ Suggested a potential pullback to the $800 level.
The NVDA chart shows that after these signs of weakness, the price dropped to the lower boundary of the channel on April 19, briefly falling below $800. However, the bulls then attempted to resume the upward trend, and it paid off.
Given NVDA's pre-market price, it is reasonable to assume today's main session will open around $1,010. Therefore, technical analysis of the NVDA daily chart today shows:
→ The price remains within the ascending channel;
→ The price is breaking through the $960 level with a bullish gap, which can now be expected to act as support;
→ If the bullish momentum from the earnings report continues (as it did on February 22), NVDA's price could approach the median line of the ascending channel.
According to TipRanks, the average analyst target price for NVDA is $1,104.62, but this target may be raised considering Nvidia's strong forecasts for the next quarter.
Buy and sell stocks of the world's biggest publicly-listed companies with CFDs on FXOpen’s trading platform. Open your FXOpen account now or learn more about trading share CFDs with FXOpen.
CFDs are complex instruments and come with a high risk of losing your money.
This article represents the opinion of the Companies operating under the FXOpen brand only. It is not to be construed as an offer, solicitation, or recommendation with respect to products and services provided by the Companies operating under the FXOpen brand, nor is it to be considered financial advice.
👍3
#EURUSD #forextrading #marketanalysis #MarketNews
EUR/USD Price Forms Bullish Reversal Amid Key News
Last night, the FOMC meeting minutes were released. According to USNews, there were no major surprises. However, the confirmation of persistent inflation – along with hints that some officials discussed potential future rate hikes – displayed a "hawkish" stance. The dollar index initially rose following the minutes' release but returned to pre-release levels this morning, suggesting the initial reaction might have been incorrect.
Subsequently, the Purchasing Managers' Index (PMI) data for key European economies was published. According to ForexFactory:
→ Flash Manufacturing PMI (France): actual = 46.7; expected = 45.8; previous = 45.3;
→ Flash Services PMI (France): actual = 49.4; expected = 51.8; previous = 51.3;
→ Flash Manufacturing PMI (Germany): actual = 45.4; expected = 43.4; previous = 42.5;
→ Flash Services PMI (Germany): actual = 53.9; expected = 53.5; previous = 53.2.
Overall, the actual PMI figures, considered a leading indicator of economic health, exceeded expectations and gave the euro a bullish push.
The combined effect of the euro's rise and the dollar's decline since midnight resulted in a four-hour EUR/USD chart candle with a long lower tail (indicated by an arrow), suggesting demand outweighs supply. A subsequent bullish candle could confirm this.
Technical analysis of the EUR/USD chart shows:
→ The price is within an ascending channel;
→ The 1.081 level served as resistance from 1-13 May but, following a bullish breakout on 14 May, now shows signs of support. This level is reinforced by the lower boundary of the ascending channel and the fundamental news mentioned above.
Thus, euro bulls might attempt to resume the trend and lift the EUR/USD rate to the significant resistance at 1.08750, established in April. The first test of their resolve could be the former support at 1.08466.
Trade over 50 forex markets 24 hours a day with FXOpen. Take advantage of low commissions, deep liquidity, and spreads from 0.0 pips. Open your FXOpen account now or learn more about trading forex with FXOpen.
CFDs are complex instruments and come with a high risk of losing your money.
This article represents the opinion of the Companies operating under the FXOpen brand only. It is not to be construed as an offer, solicitation, or recommendation with respect to products and services provided by the Companies operating under the FXOpen brand, nor is it to be considered financial advice.
EUR/USD Price Forms Bullish Reversal Amid Key News
Last night, the FOMC meeting minutes were released. According to USNews, there were no major surprises. However, the confirmation of persistent inflation – along with hints that some officials discussed potential future rate hikes – displayed a "hawkish" stance. The dollar index initially rose following the minutes' release but returned to pre-release levels this morning, suggesting the initial reaction might have been incorrect.
Subsequently, the Purchasing Managers' Index (PMI) data for key European economies was published. According to ForexFactory:
→ Flash Manufacturing PMI (France): actual = 46.7; expected = 45.8; previous = 45.3;
→ Flash Services PMI (France): actual = 49.4; expected = 51.8; previous = 51.3;
→ Flash Manufacturing PMI (Germany): actual = 45.4; expected = 43.4; previous = 42.5;
→ Flash Services PMI (Germany): actual = 53.9; expected = 53.5; previous = 53.2.
Overall, the actual PMI figures, considered a leading indicator of economic health, exceeded expectations and gave the euro a bullish push.
The combined effect of the euro's rise and the dollar's decline since midnight resulted in a four-hour EUR/USD chart candle with a long lower tail (indicated by an arrow), suggesting demand outweighs supply. A subsequent bullish candle could confirm this.
Technical analysis of the EUR/USD chart shows:
→ The price is within an ascending channel;
→ The 1.081 level served as resistance from 1-13 May but, following a bullish breakout on 14 May, now shows signs of support. This level is reinforced by the lower boundary of the ascending channel and the fundamental news mentioned above.
Thus, euro bulls might attempt to resume the trend and lift the EUR/USD rate to the significant resistance at 1.08750, established in April. The first test of their resolve could be the former support at 1.08466.
Trade over 50 forex markets 24 hours a day with FXOpen. Take advantage of low commissions, deep liquidity, and spreads from 0.0 pips. Open your FXOpen account now or learn more about trading forex with FXOpen.
CFDs are complex instruments and come with a high risk of losing your money.
This article represents the opinion of the Companies operating under the FXOpen brand only. It is not to be construed as an offer, solicitation, or recommendation with respect to products and services provided by the Companies operating under the FXOpen brand, nor is it to be considered financial advice.
Forex Trading Broker in Europe | FXOpen EU
Open Account to trade Forex, Stocks CFD in European Union
Open an Account
Start Trading Forex, Indices, Commodities and Crypto
*
Step 1
Select your country of residence to get started.
*
Step 2
You will then be directed to our secure server to complete the online application.…
Start Trading Forex, Indices, Commodities and Crypto
*
Step 1
Select your country of residence to get started.
*
Step 2
You will then be directed to our secure server to complete the online application.…
👍3
#sp500 #stockmarket #stocktrading
S&P 500 Analysis: Good News is Bad News
Yesterday, S&P Global reported its Purchasing Managers' Index (PMI) values for the US, which exceeded expectations. According to ForexFactory:
→ Manufacturing PMI: actual = 50.9; expected = 50.0; previous = 50.0.
→ Services PMI: actual = 54.8 (the highest value since May 2023); expected = 51.2; previous = 51.3.
However, the high PMI values, indicating a healthy economy, led to a drop in the stock index. The S&P 500 index (US SPX 500 mini on FXOpen) fell by more than 1.5% following the publication.
What explains this case of "good news is bad news"?
The point is, amid high business activity, manufacturers reported rising prices for a range of resources, suggesting that goods inflation might strengthen in the coming months. Stock market participants might have interpreted this as a reason for the Federal Reserve to maintain high rates for a longer period – hence the sharp decline in the index.
"Companies remain cautious with respect to the economic outlook amid uncertainty over the future path of inflation and interest rates, and continue to cite worries over geopolitical instabilities and the presidential election," said Chris Williamson, Chief Business Economist at S&P Global Market Intelligence, in an interview with Reuters.
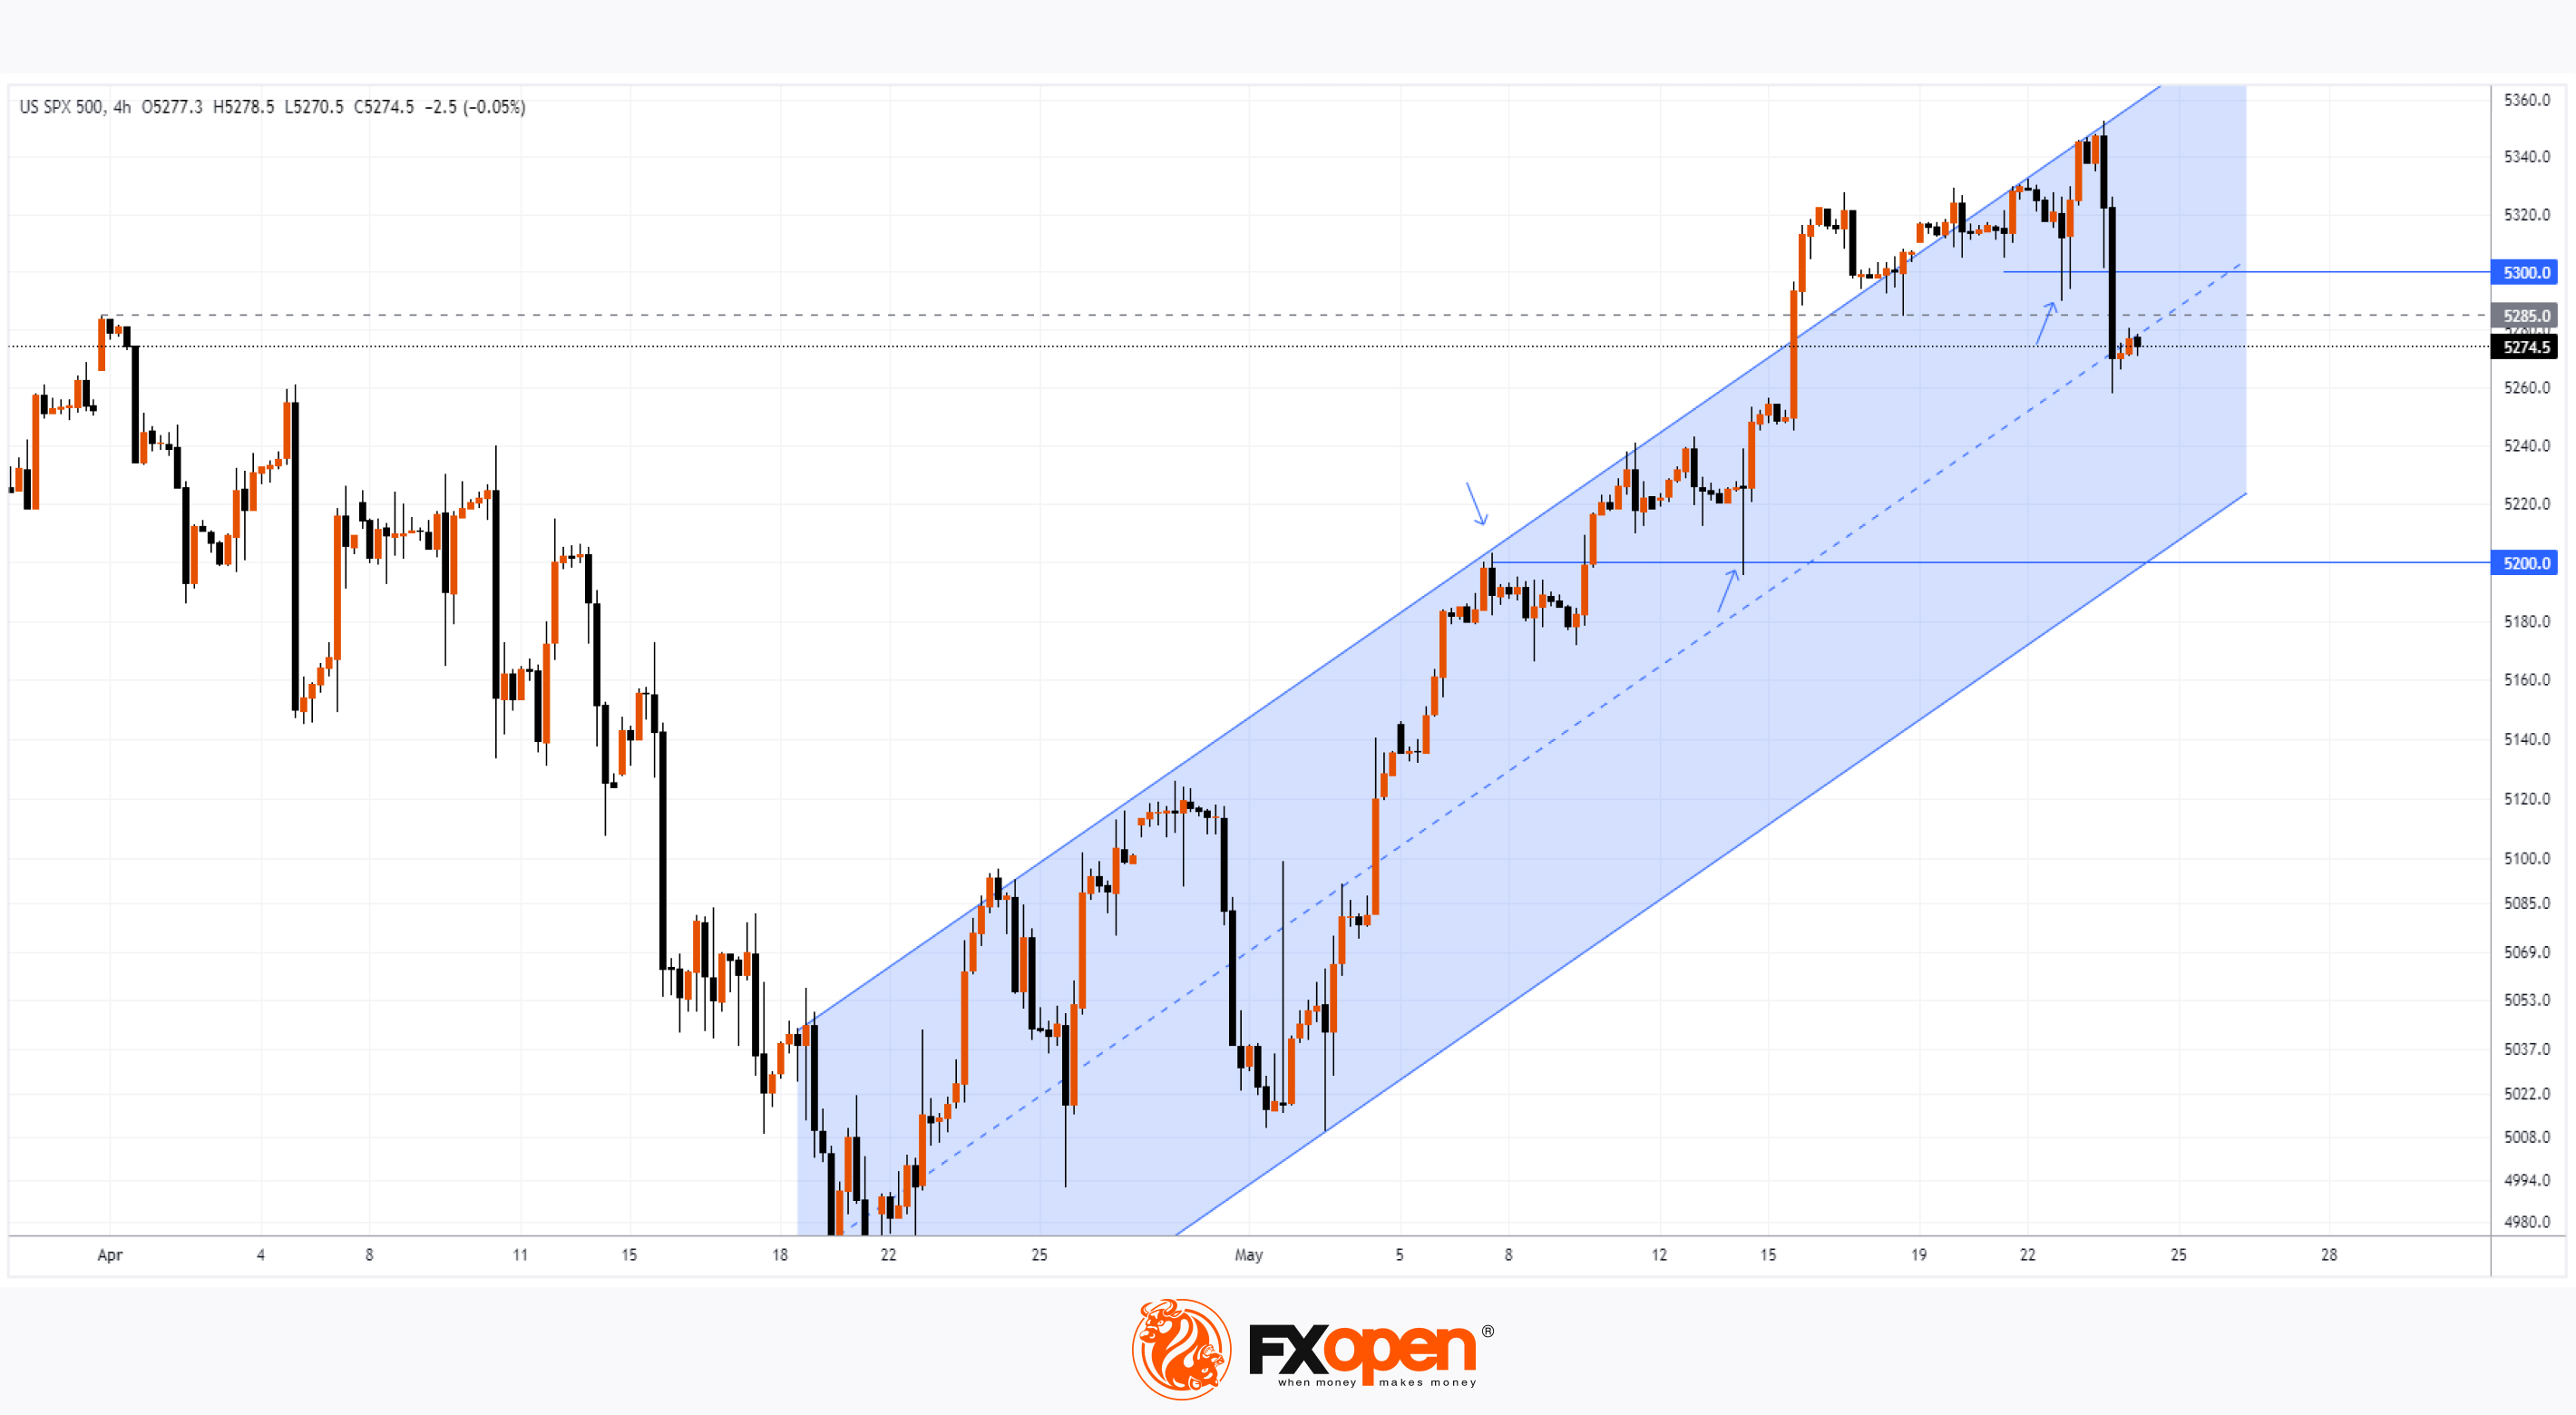
Technical analysis of the S&P-500 chart today (US SPX 500 mini on FXOpen) shows that:
→ the price has been forming an ascending channel since 19 April (shown in blue);
→ bulls failed to hold above the March high around the 5285 level (a bearish sign);
→ the psychological level of 5300, which showed signs of support this week, has now been breached and may act as resistance. Conversely, the 5200 level, after being breached, has shifted its role from resistance to support (as indicated by arrows).
So far, the bearish momentum that emerged yesterday following the PMI news release is being contained at the median line of the blue channel. But if sentiment does not change today, the median might be breached, and then the path to the lower boundary of the channel will open for the S&P-500 price (US SPX 500 mini on FXOpen).
Trade global index CFDs with zero commission and tight spreads. Open your FXOpen account now or learn more about trading index CFDs with FXOpen.
CFDs are complex instruments and come with a high risk of losing your money.
This article represents the opinion of the Companies operating under the FXOpen brand only. It is not to be construed as an offer, solicitation, or recommendation with respect to products and services provided by the Companies operating under the FXOpen brand, nor is it to be considered financial advice.
S&P 500 Analysis: Good News is Bad News
Yesterday, S&P Global reported its Purchasing Managers' Index (PMI) values for the US, which exceeded expectations. According to ForexFactory:
→ Manufacturing PMI: actual = 50.9; expected = 50.0; previous = 50.0.
→ Services PMI: actual = 54.8 (the highest value since May 2023); expected = 51.2; previous = 51.3.
However, the high PMI values, indicating a healthy economy, led to a drop in the stock index. The S&P 500 index (US SPX 500 mini on FXOpen) fell by more than 1.5% following the publication.
What explains this case of "good news is bad news"?
The point is, amid high business activity, manufacturers reported rising prices for a range of resources, suggesting that goods inflation might strengthen in the coming months. Stock market participants might have interpreted this as a reason for the Federal Reserve to maintain high rates for a longer period – hence the sharp decline in the index.
"Companies remain cautious with respect to the economic outlook amid uncertainty over the future path of inflation and interest rates, and continue to cite worries over geopolitical instabilities and the presidential election," said Chris Williamson, Chief Business Economist at S&P Global Market Intelligence, in an interview with Reuters.
Technical analysis of the S&P-500 chart today (US SPX 500 mini on FXOpen) shows that:
→ the price has been forming an ascending channel since 19 April (shown in blue);
→ bulls failed to hold above the March high around the 5285 level (a bearish sign);
→ the psychological level of 5300, which showed signs of support this week, has now been breached and may act as resistance. Conversely, the 5200 level, after being breached, has shifted its role from resistance to support (as indicated by arrows).
So far, the bearish momentum that emerged yesterday following the PMI news release is being contained at the median line of the blue channel. But if sentiment does not change today, the median might be breached, and then the path to the lower boundary of the channel will open for the S&P-500 price (US SPX 500 mini on FXOpen).
Trade global index CFDs with zero commission and tight spreads. Open your FXOpen account now or learn more about trading index CFDs with FXOpen.
CFDs are complex instruments and come with a high risk of losing your money.
This article represents the opinion of the Companies operating under the FXOpen brand only. It is not to be construed as an offer, solicitation, or recommendation with respect to products and services provided by the Companies operating under the FXOpen brand, nor is it to be considered financial advice.
👍3
#XAUUSD #goldprice #MarketNews #marketanalysis
Gold Price Drops Over 3.6% in 2 Days
The price of gold has fallen by more than 3.6% over 2 days, as indicated by today's XAU/USD chart. The day before yesterday, at the opening of the daily candle, the price of gold was $2421 per ounce, and yesterday at the close it was $2331.
This can be explained by market participants expecting higher Federal Reserve interest rates for a longer period. However, although gold is a hedge against inflation, it has two drawbacks:
→ It does not inherently generate income;
→ The gold market may be overvalued – after all, a historical peak was reached on May 20th.
Therefore, investors are increasingly paying attention to bonds – they also allow hedging against inflation, while their yields are rising.
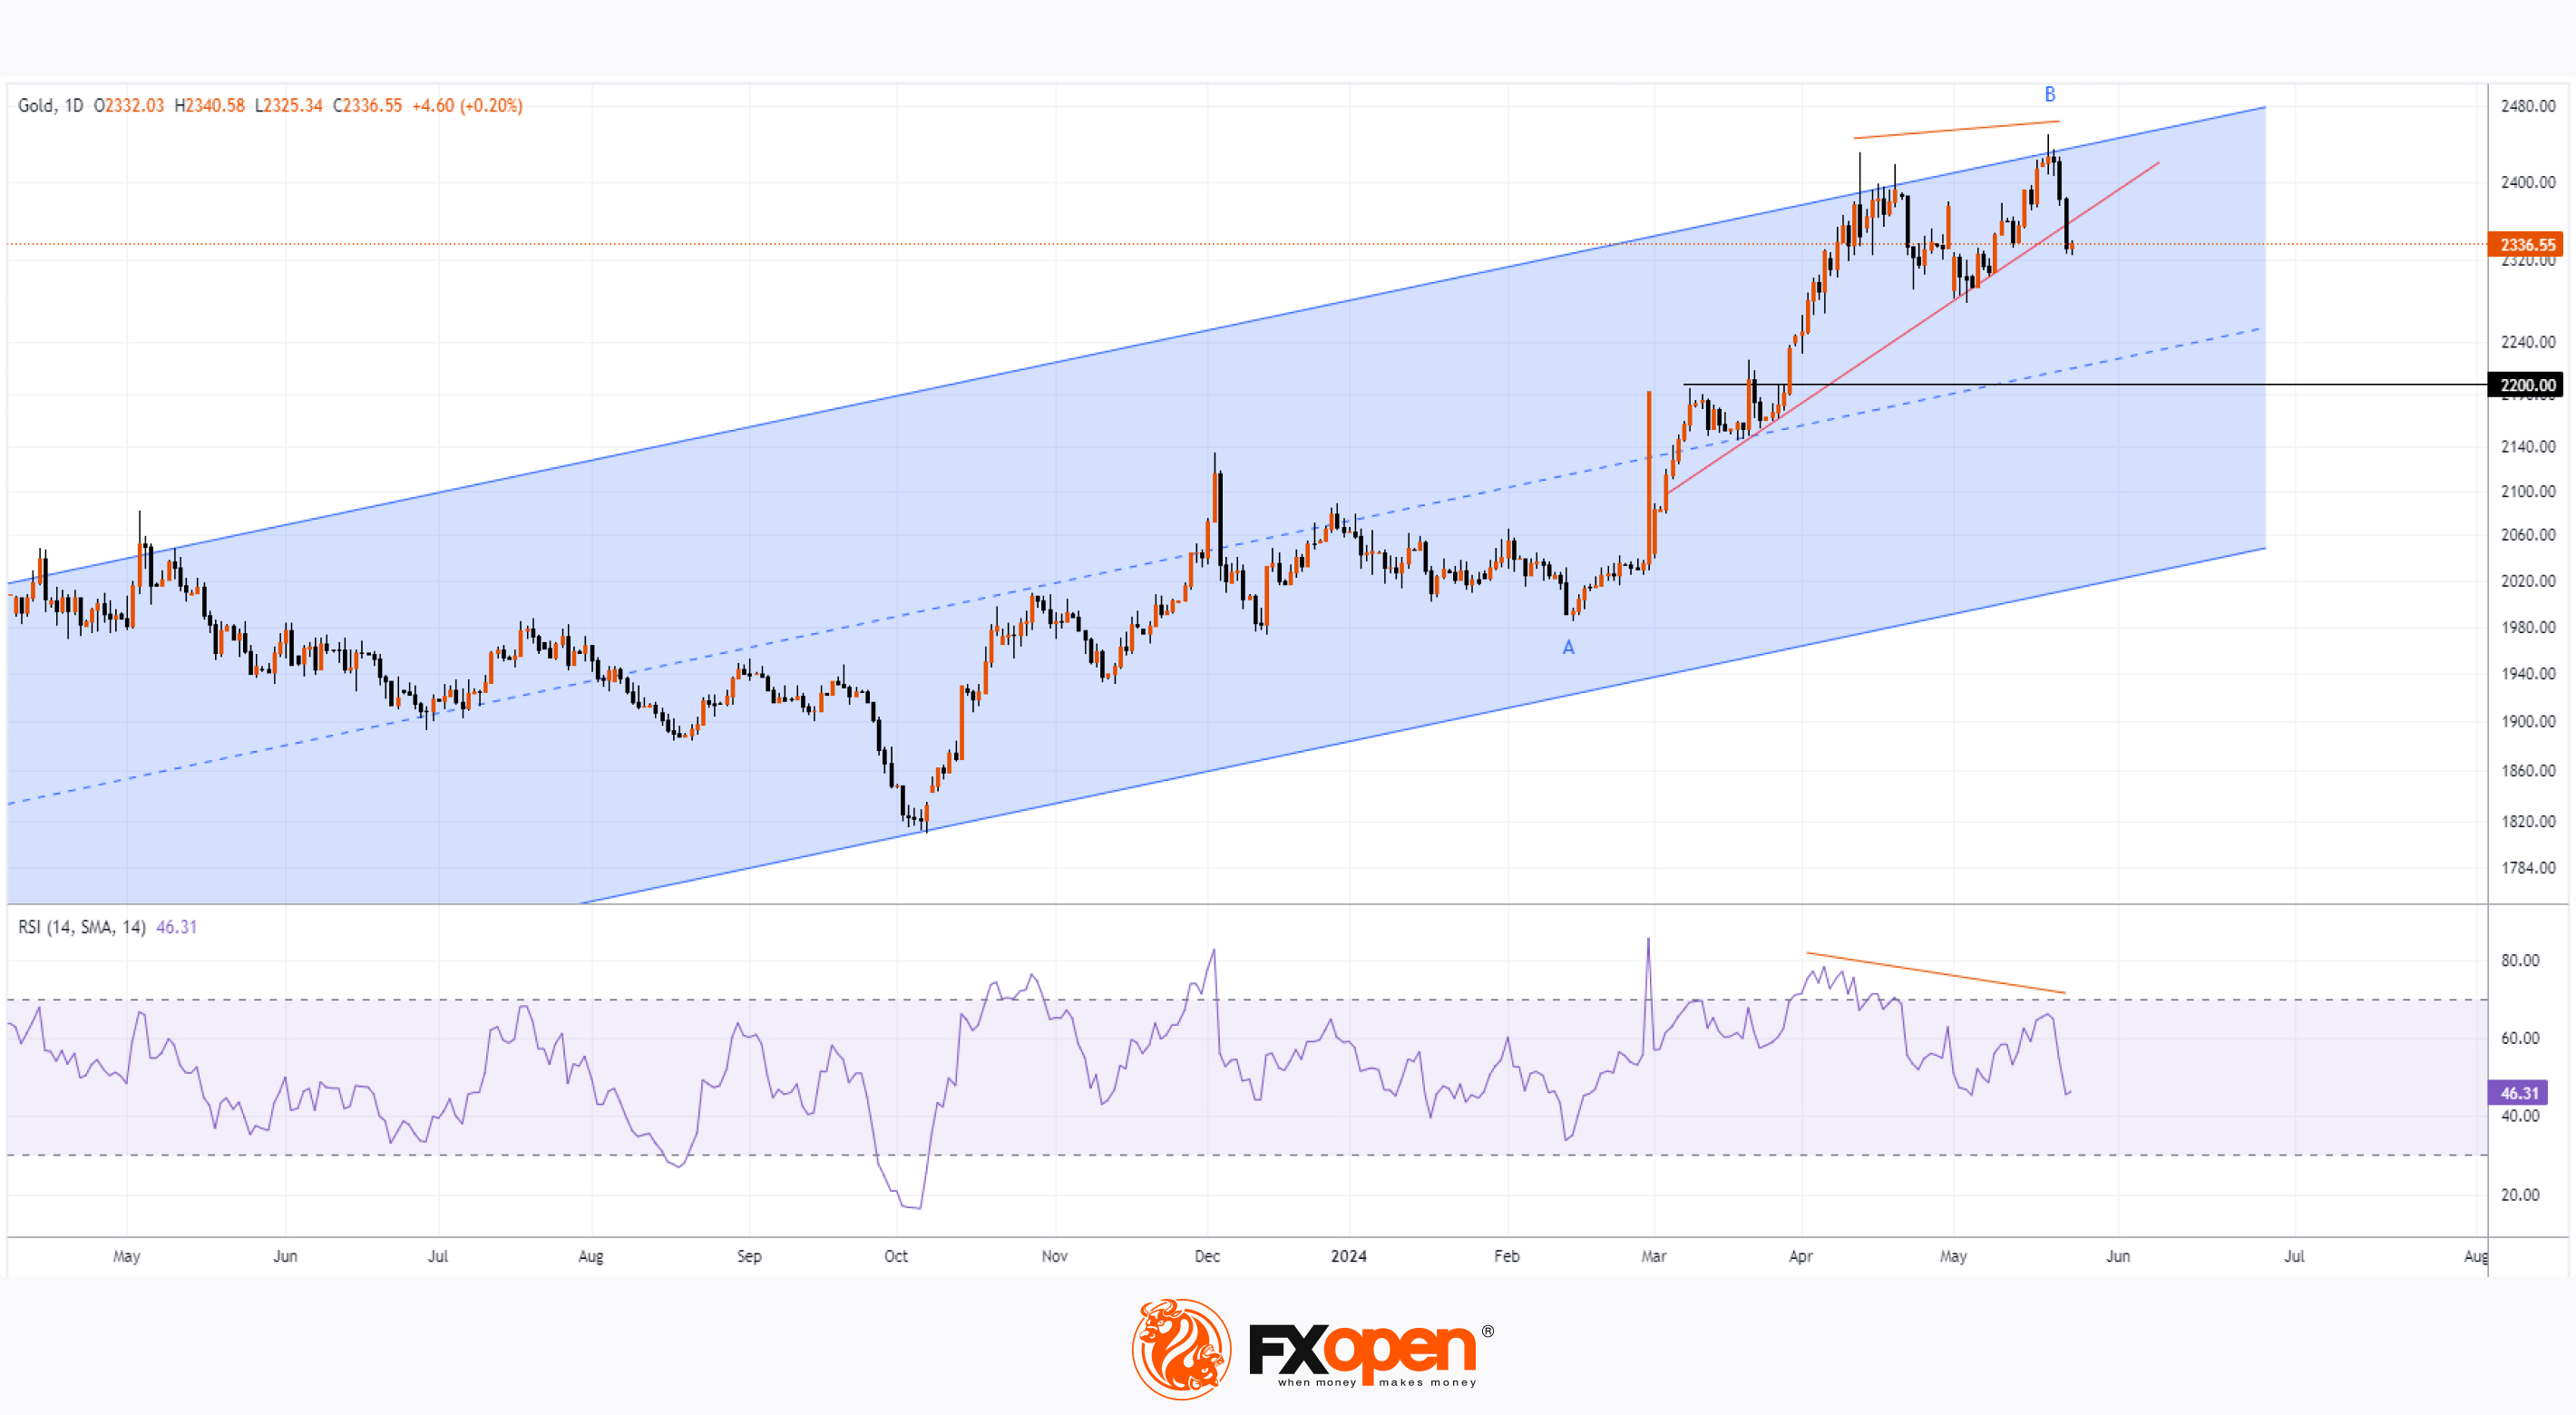
Technical analysis of the XAU/USD daily chart shows that:
→ The price of gold is in a long-term uptrend (shown in blue);
→ After reaching the upper boundary in mid-April, there was a pullback to around 2300 in early May.
Setting the historical record on May 20th also marked another achievement of the upper boundary of the channel. However:
→ Bulls failed to sustain the price above the mid-April peak;
→ There was a reversal from the upper boundary of the channel with the formation of bearish divergence on the RSI between the two peaks, which can be considered as a significant double top pattern, where the second top is slightly higher than the first.
Considering the speed of the gold price decline from the May 20th peak and the confidence of bears in breaking the trend line (shown in red), it is reasonable to assume that the market is vulnerable to forming a deeper correction within the ascending blue channel – it is possible that the correction will develop towards the median line of the blue channel.
It is worth noting the important support level at $2200:
→ This is a psychological level;
→ Previously, it served as resistance;
→ It is approximately at the 50% level of impulse A→B.
Start trading commodities with tight spreads. Open your trading account now or learn more about trading commodity CFDs with FXOpen.
CFDs are complex instruments and come with a high risk of losing your money.
This article represents the opinion of the Companies operating under the FXOpen brand only. It is not to be construed as an offer, solicitation, or recommendation with respect to products and services provided by the Companies operating under the FXOpen brand, nor is it to be considered financial advice.
Gold Price Drops Over 3.6% in 2 Days
The price of gold has fallen by more than 3.6% over 2 days, as indicated by today's XAU/USD chart. The day before yesterday, at the opening of the daily candle, the price of gold was $2421 per ounce, and yesterday at the close it was $2331.
This can be explained by market participants expecting higher Federal Reserve interest rates for a longer period. However, although gold is a hedge against inflation, it has two drawbacks:
→ It does not inherently generate income;
→ The gold market may be overvalued – after all, a historical peak was reached on May 20th.
Therefore, investors are increasingly paying attention to bonds – they also allow hedging against inflation, while their yields are rising.
Technical analysis of the XAU/USD daily chart shows that:
→ The price of gold is in a long-term uptrend (shown in blue);
→ After reaching the upper boundary in mid-April, there was a pullback to around 2300 in early May.
Setting the historical record on May 20th also marked another achievement of the upper boundary of the channel. However:
→ Bulls failed to sustain the price above the mid-April peak;
→ There was a reversal from the upper boundary of the channel with the formation of bearish divergence on the RSI between the two peaks, which can be considered as a significant double top pattern, where the second top is slightly higher than the first.
Considering the speed of the gold price decline from the May 20th peak and the confidence of bears in breaking the trend line (shown in red), it is reasonable to assume that the market is vulnerable to forming a deeper correction within the ascending blue channel – it is possible that the correction will develop towards the median line of the blue channel.
It is worth noting the important support level at $2200:
→ This is a psychological level;
→ Previously, it served as resistance;
→ It is approximately at the 50% level of impulse A→B.
Start trading commodities with tight spreads. Open your trading account now or learn more about trading commodity CFDs with FXOpen.
CFDs are complex instruments and come with a high risk of losing your money.
This article represents the opinion of the Companies operating under the FXOpen brand only. It is not to be construed as an offer, solicitation, or recommendation with respect to products and services provided by the Companies operating under the FXOpen brand, nor is it to be considered financial advice.
👍3
#StockMarket #techstocks #nvidia #goldprice #EURUSD #stockmarketnews
Weekly Market Wrap With Gary Thomson: Nasdaq 100, NVIDIA, EUR/USD, Gold price
Get the latest scoop on the week's hottest headlines, all in one convenient video. Join Gary Thomson, the COO of FXOpen UK, as he breaks down the most significant news reports and shares his expert insights. Read the latest news on Market Pulse
🔸Tech Stocks Back in Vogue as Nasdaq 100 Rallies to Record High
🔸After Earnings Report, NVDA Stock Price Exceeds $1,000
🔸EUR/USD Price Forms Bullish Reversal Amid Key News
🔸Gold Price Reaches Historic High
Stay in the know and empower yourself with our short, yet power-packed video. Watch it now and stay updated with FXOpen. Don't miss out on this invaluable opportunity to sharpen your trading skills and make informed decisions.
https://cutt.ly/3eywc6JV
To take advantage of price fluctuations in the foreign exchange markets, consider enlisting the services of a reliable broker like FXOpen.
⚠️
This forecast represents FXOpen Companies opinion only, it should not be construed as an offer, invitation or recommendation in respect to FXOpen Companies products and services or as financial advice.
Weekly Market Wrap With Gary Thomson: Nasdaq 100, NVIDIA, EUR/USD, Gold price
Get the latest scoop on the week's hottest headlines, all in one convenient video. Join Gary Thomson, the COO of FXOpen UK, as he breaks down the most significant news reports and shares his expert insights. Read the latest news on Market Pulse
🔸Tech Stocks Back in Vogue as Nasdaq 100 Rallies to Record High
🔸After Earnings Report, NVDA Stock Price Exceeds $1,000
🔸EUR/USD Price Forms Bullish Reversal Amid Key News
🔸Gold Price Reaches Historic High
Stay in the know and empower yourself with our short, yet power-packed video. Watch it now and stay updated with FXOpen. Don't miss out on this invaluable opportunity to sharpen your trading skills and make informed decisions.
https://cutt.ly/3eywc6JV
To take advantage of price fluctuations in the foreign exchange markets, consider enlisting the services of a reliable broker like FXOpen.
⚠️
This forecast represents FXOpen Companies opinion only, it should not be construed as an offer, invitation or recommendation in respect to FXOpen Companies products and services or as financial advice.
YouTube
Weekly Market Wrap With Gary Thomson: Nasdaq 100, NVIDIA, EUR/USD, Gold price
Get the latest scoop on the week's hottest headlines, all in one convenient video. Join Gary Thomson, the COO of FXOpen UK, as he breaks down the most significant news reports and shares his expert insights. Read the latest news on Market Pulse https://f…
👍3
#USDJPY #marketanalysis #MarketNews
USD/JPY Analysis: the Market is Indecisive Near Its Peak Since May 1
As the USD/JPY chart shows today:
→ The price is in an upward trend (indicated by the blue channel) that has been relevant since the beginning of 2024.
→ On Thursday, May 23, the exchange rate nearly reached 157.2 yen per US dollar, surpassing the peak of May 14.
→ Following this, the market began to stabilise – indicated by the Bollinger Bands' width showing low volatility, which can be interpreted as a sign of market equilibrium or indecision among participants.
What balances the market? The equilibrium of supply and demand forces and the anticipation of important news in the week ahead.
Bullish arguments:
→ The price has twice (shown by arrows) rebounded sharply from the median line of the upward channel. On both occasions, bulls managed to reverse aggressive declines in the USD/JPY price and return to the upper line.
→ The Bank of Japan's interest rates are much lower than those in the US. Judging by the latest US economic data, the Federal Reserve may maintain high rates for a longer period.
Bearish arguments:
→ We do not see continued upward momentum in the price after surpassing the May 14 peak. Moreover, the USD/JPY price cannot sustain above the "round" level of 157.00.
→ The price is near the upper boundary of the channel, which could act as resistance.
→ It is important to note the levels of 160 and 157.9 in the background, from which the price fell sharply, indicating possible intervention by the Bank of Japan to support the excessively weak yen.
Given that today is a holiday for financial institutions in the US and the UK, indecision may continue until tomorrow when Japan's inflation data is released at 8:00 GMT+3. Also noteworthy:
→ US GDP news will be published on Thursday at 15:30 GMT+3.
→ The US Personal Consumption Expenditures (PCE) index will be released on Friday at 15:30 GMT+3.
These and other fundamental drivers may disrupt the current balance of the USD/JPY price, which still appears stable for now.
Trade over 50 forex markets 24 hours a day with FXOpen. Take advantage of low commissions, deep liquidity, and spreads from 0.0 pips. Open your FXOpen account now or learn more about trading forex with FXOpen.
CFDs are complex instruments and come with a high risk of losing your money.
This article represents the opinion of the Companies operating under the FXOpen brand only. It is not to be construed as an offer, solicitation, or recommendation with respect to products and services provided by the Companies operating under the FXOpen brand, nor is it to be considered financial advice.
USD/JPY Analysis: the Market is Indecisive Near Its Peak Since May 1
As the USD/JPY chart shows today:
→ The price is in an upward trend (indicated by the blue channel) that has been relevant since the beginning of 2024.
→ On Thursday, May 23, the exchange rate nearly reached 157.2 yen per US dollar, surpassing the peak of May 14.
→ Following this, the market began to stabilise – indicated by the Bollinger Bands' width showing low volatility, which can be interpreted as a sign of market equilibrium or indecision among participants.
What balances the market? The equilibrium of supply and demand forces and the anticipation of important news in the week ahead.
Bullish arguments:
→ The price has twice (shown by arrows) rebounded sharply from the median line of the upward channel. On both occasions, bulls managed to reverse aggressive declines in the USD/JPY price and return to the upper line.
→ The Bank of Japan's interest rates are much lower than those in the US. Judging by the latest US economic data, the Federal Reserve may maintain high rates for a longer period.
Bearish arguments:
→ We do not see continued upward momentum in the price after surpassing the May 14 peak. Moreover, the USD/JPY price cannot sustain above the "round" level of 157.00.
→ The price is near the upper boundary of the channel, which could act as resistance.
→ It is important to note the levels of 160 and 157.9 in the background, from which the price fell sharply, indicating possible intervention by the Bank of Japan to support the excessively weak yen.
Given that today is a holiday for financial institutions in the US and the UK, indecision may continue until tomorrow when Japan's inflation data is released at 8:00 GMT+3. Also noteworthy:
→ US GDP news will be published on Thursday at 15:30 GMT+3.
→ The US Personal Consumption Expenditures (PCE) index will be released on Friday at 15:30 GMT+3.
These and other fundamental drivers may disrupt the current balance of the USD/JPY price, which still appears stable for now.
Trade over 50 forex markets 24 hours a day with FXOpen. Take advantage of low commissions, deep liquidity, and spreads from 0.0 pips. Open your FXOpen account now or learn more about trading forex with FXOpen.
CFDs are complex instruments and come with a high risk of losing your money.
This article represents the opinion of the Companies operating under the FXOpen brand only. It is not to be construed as an offer, solicitation, or recommendation with respect to products and services provided by the Companies operating under the FXOpen brand, nor is it to be considered financial advice.
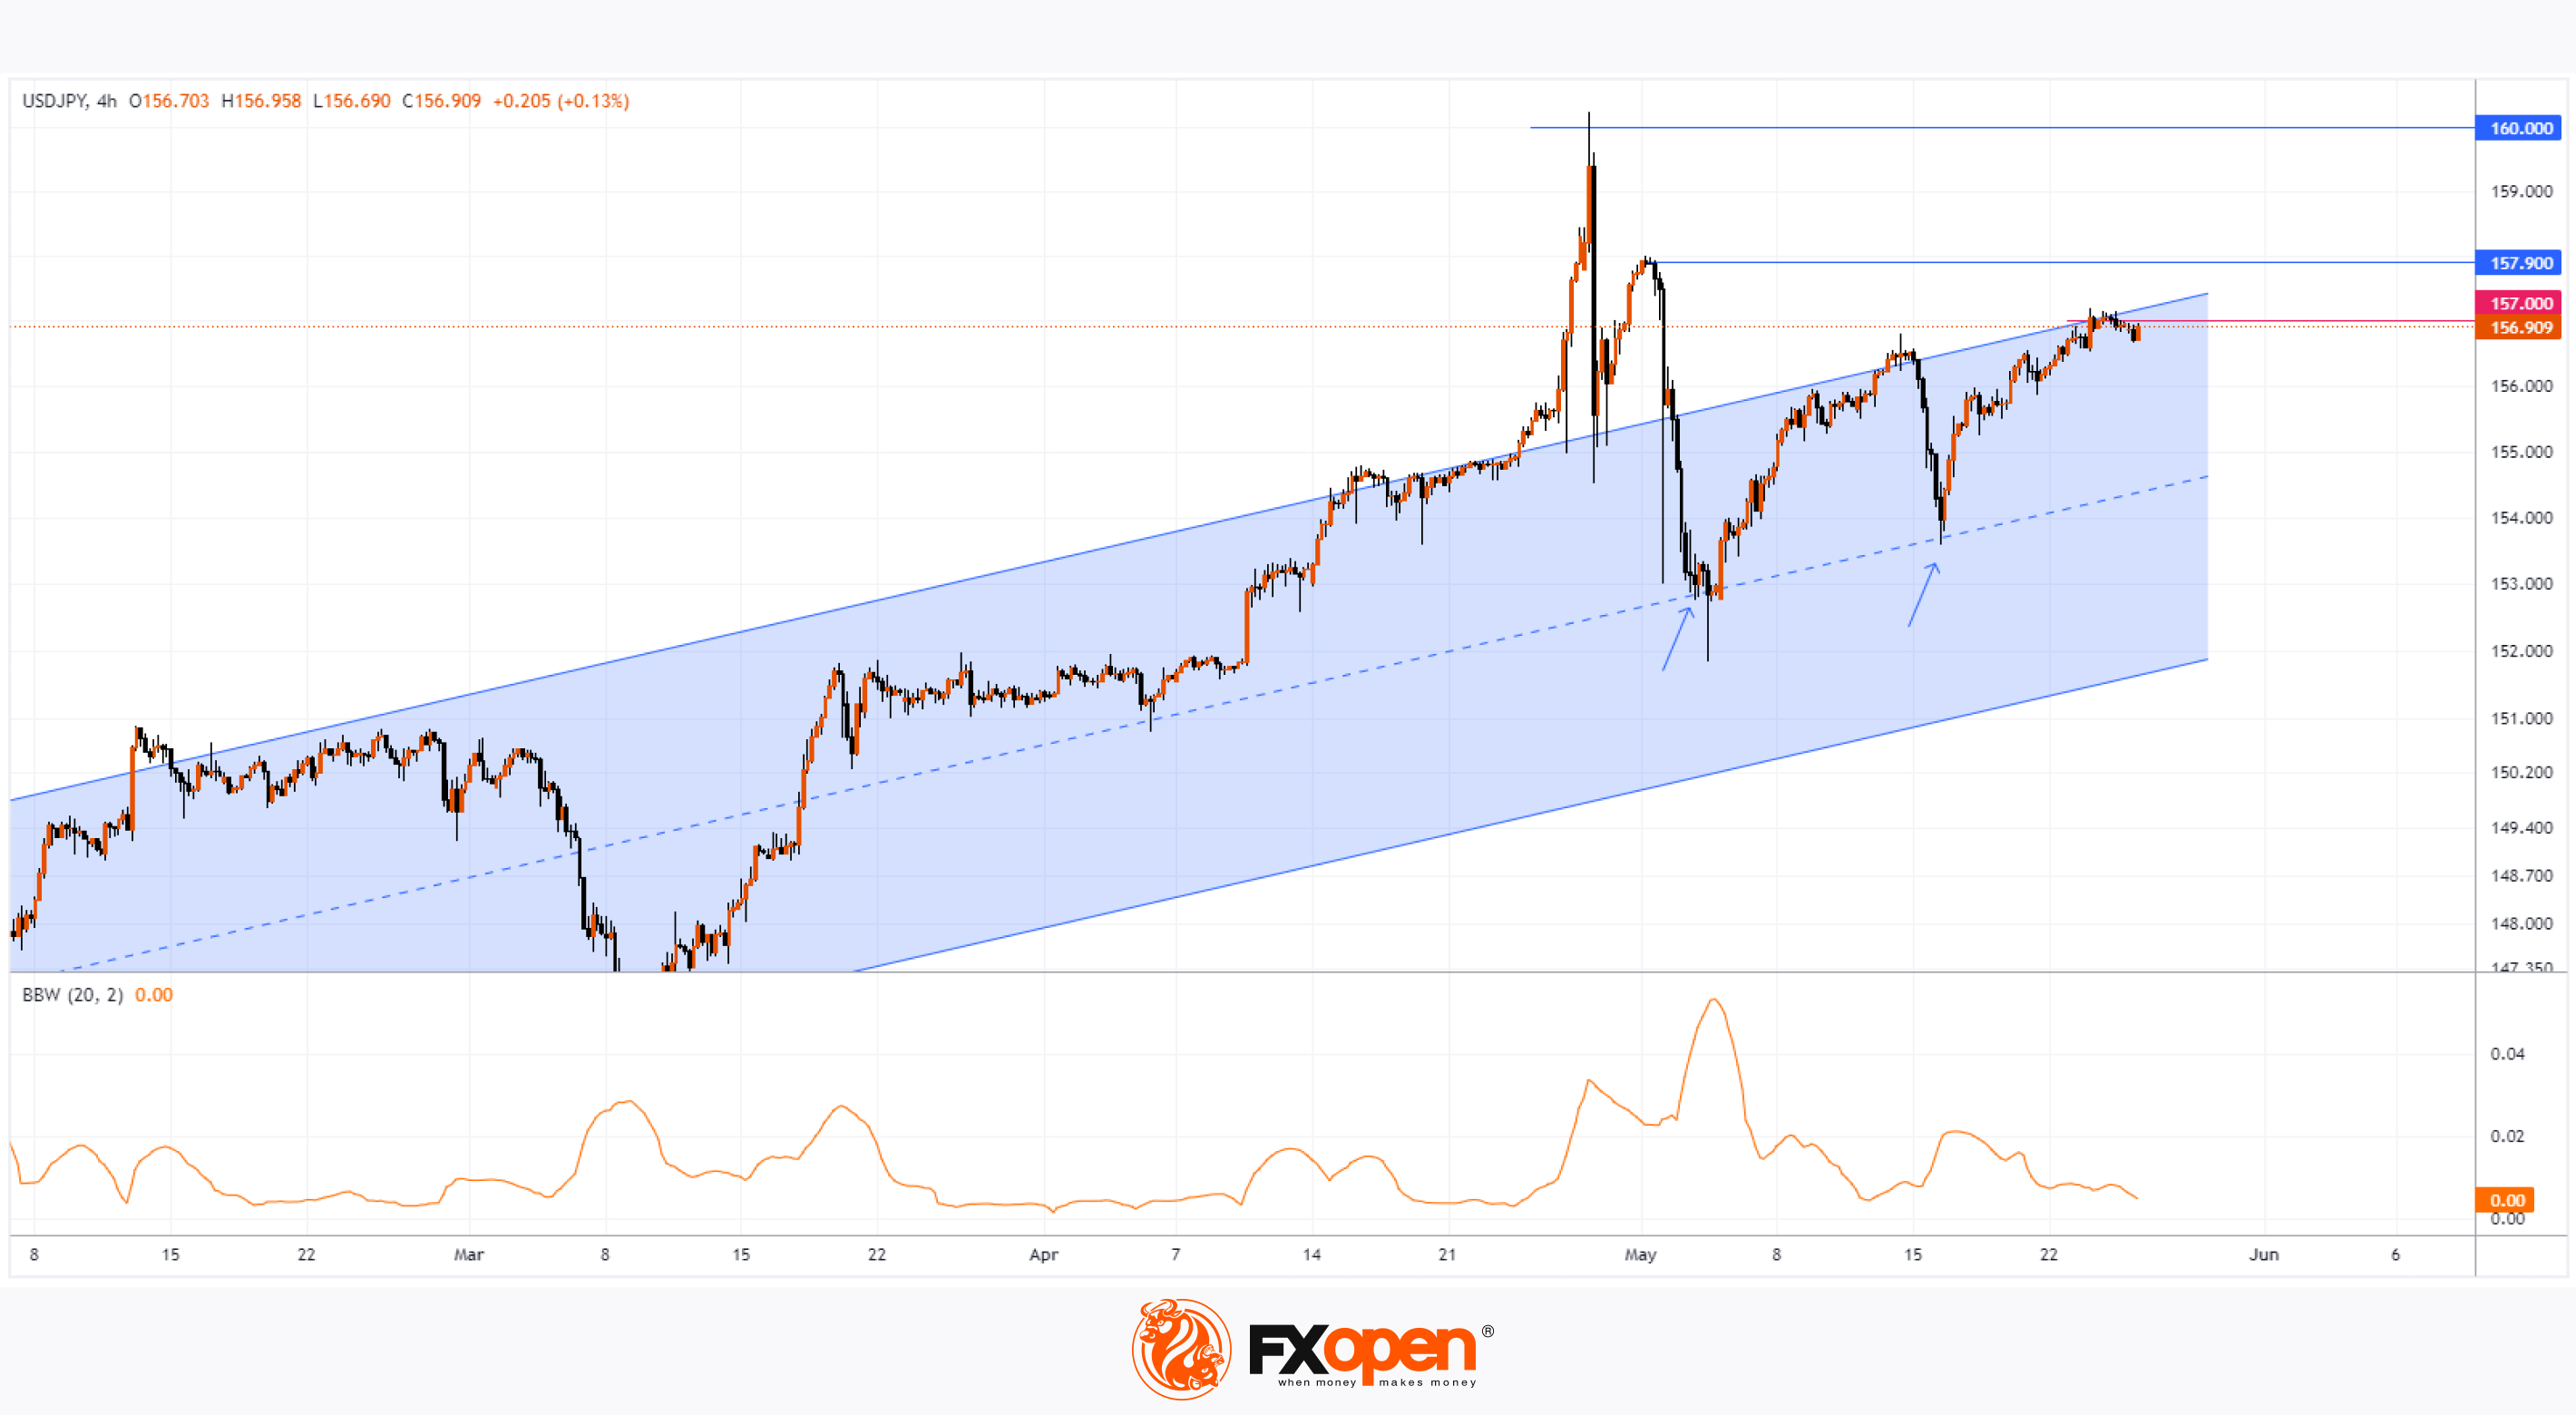
👍2
#marketanalysis #oilprices #oilindustry
WTI Crude Oil Price Shows Bullish Trend Ahead of OPEC Meeting
As the chart indicates, on Monday, the price of WTI crude oil rose by approximately 1%.
Reuters reports that the bullish sentiment is driven by:
→ the upcoming OPEC+ meeting scheduled for 2 June;
→ expectations of high fuel demand with the start of the summer driving season and holiday season in the US.
Conducting a technical analysis of WTI crude oil on 10 May, we drew an ascending channel in blue and suggested a scenario of continued price growth within this channel.
Since then:
→ the price formed a low on 15 May at the level of 76.35, but quickly recovered from it. Thus, the bears' attempt to break the low of 8 May at the level of 76.68 quickly failed. In other words, there was a false breakout of the 8 May low.
→ A similar pattern occurred on 24 May – the price dropped below the 15 May low of 76.35, but quickly recovered.
Two false bearish breakouts are a bullish sign. And the strong behaviour of WTI crude oil prices on Monday confirms this.
Analysing the XTI/USD chart today, it is important to note that:
→ the price movement in April-May forms a descending channel (shown in red);
→ this decline since 5 April may be a correction within the larger ascending blue channel;
→ the price quickly returned to the blue channel, briefly dipping below its lower boundary;
→ the price is near the upper boundary of the descending channel.
Thus, conditions are being created for the end of the corrective movement. The bears' inability to hold the WTI oil price at new lows may be used by the bulls to resume the upward trend. It is also possible that news related to the OPEC+ meeting will contribute to this development.
Start trading commodities with tight spreads. Open your trading account now or learn more about trading commodity CFDs with FXOpen.
CFDs are complex instruments and come with a high risk of losing your money.
This article represents the opinion of the Companies operating under the FXOpen brand only. It is not to be construed as an offer, solicitation, or recommendation with respect to products and services provided by the Companies operating under the FXOpen brand, nor is it to be considered financial advice.
WTI Crude Oil Price Shows Bullish Trend Ahead of OPEC Meeting
As the chart indicates, on Monday, the price of WTI crude oil rose by approximately 1%.
Reuters reports that the bullish sentiment is driven by:
→ the upcoming OPEC+ meeting scheduled for 2 June;
→ expectations of high fuel demand with the start of the summer driving season and holiday season in the US.
Conducting a technical analysis of WTI crude oil on 10 May, we drew an ascending channel in blue and suggested a scenario of continued price growth within this channel.
Since then:
→ the price formed a low on 15 May at the level of 76.35, but quickly recovered from it. Thus, the bears' attempt to break the low of 8 May at the level of 76.68 quickly failed. In other words, there was a false breakout of the 8 May low.
→ A similar pattern occurred on 24 May – the price dropped below the 15 May low of 76.35, but quickly recovered.
Two false bearish breakouts are a bullish sign. And the strong behaviour of WTI crude oil prices on Monday confirms this.
Analysing the XTI/USD chart today, it is important to note that:
→ the price movement in April-May forms a descending channel (shown in red);
→ this decline since 5 April may be a correction within the larger ascending blue channel;
→ the price quickly returned to the blue channel, briefly dipping below its lower boundary;
→ the price is near the upper boundary of the descending channel.
Thus, conditions are being created for the end of the corrective movement. The bears' inability to hold the WTI oil price at new lows may be used by the bulls to resume the upward trend. It is also possible that news related to the OPEC+ meeting will contribute to this development.
Start trading commodities with tight spreads. Open your trading account now or learn more about trading commodity CFDs with FXOpen.
CFDs are complex instruments and come with a high risk of losing your money.
This article represents the opinion of the Companies operating under the FXOpen brand only. It is not to be construed as an offer, solicitation, or recommendation with respect to products and services provided by the Companies operating under the FXOpen brand, nor is it to be considered financial advice.

👍1🤔1
#marketanalysis #NVDA #nvidia #stockmarket #elonmusk
Elon Musk Contributes to NVDA Price Surge to a New Record
Yesterday, on Tuesday, Nvidia's stock price reached a historic high, surpassing the $1,130 mark, increasing by almost 7% relative to Monday's closing price. This happened after a turbulent past week, during which Nvidia published a very strong report that led to an over 8% rise in its stock price in one day.
Thus, since the beginning of May, NVDA's price has increased by approximately 34%. The latest surge in bullish sentiment was driven by the news that Elon Musk's company xAI is purchasing Nvidia AI chips for a new powerful supercomputer.
Investor’s Business Daily reports that in a presentation for investors, Musk stated that:
→ xAI will require up to 100,000 specialised semiconductors for training and launching the next version of its AI chatbot, Grok.
→ The supercomputer will use Nvidia H100 graphics processors.
→ Musk hopes to bring the supercomputer, which he referred to as a “gigafactory of computation,” online by autumn 2025.
Analysing NVDA's stock price last week, we:
→ Updated the upward channel;
→ Suggested that on a bullish impulse, NVDA’s price could approach the median line of the upward channel.
Technical analysis of the 4-hour NVDA stock chart today shows that:
→ The price is in the median line zone (which may act as resistance);
→ RSI is at its highest in a year.
Considering these factors, it is reasonable to assume that the market is excessively overbought and vulnerable to a pullback. A 1:10 stock split scheduled for 10 June could play a role. While Nvidia shares will become more accessible to a broader range of investors (a bullish sign), it is possible that the "buy the rumour, sell the news" principle may apply, and after a series of positive events for NVDA stock, its price may correct towards the lower boundary of the 2024 upward channel and possibly test the gap area (shown in purple).
Trade global index CFDs with zero commission and tight spreads. Open your FXOpen account now or learn more about trading index CFDs with FXOpen.
CFDs are complex instruments and come with a high risk of losing your money.
This article represents the opinion of the Companies operating under the FXOpen brand only. It is not to be construed as an offer, solicitation, or recommendation with respect to products and services provided by the Companies operating under the FXOpen brand, nor is it to be considered financial advice.
Elon Musk Contributes to NVDA Price Surge to a New Record
Yesterday, on Tuesday, Nvidia's stock price reached a historic high, surpassing the $1,130 mark, increasing by almost 7% relative to Monday's closing price. This happened after a turbulent past week, during which Nvidia published a very strong report that led to an over 8% rise in its stock price in one day.
Thus, since the beginning of May, NVDA's price has increased by approximately 34%. The latest surge in bullish sentiment was driven by the news that Elon Musk's company xAI is purchasing Nvidia AI chips for a new powerful supercomputer.
Investor’s Business Daily reports that in a presentation for investors, Musk stated that:
→ xAI will require up to 100,000 specialised semiconductors for training and launching the next version of its AI chatbot, Grok.
→ The supercomputer will use Nvidia H100 graphics processors.
→ Musk hopes to bring the supercomputer, which he referred to as a “gigafactory of computation,” online by autumn 2025.
Analysing NVDA's stock price last week, we:
→ Updated the upward channel;
→ Suggested that on a bullish impulse, NVDA’s price could approach the median line of the upward channel.
Technical analysis of the 4-hour NVDA stock chart today shows that:
→ The price is in the median line zone (which may act as resistance);
→ RSI is at its highest in a year.
Considering these factors, it is reasonable to assume that the market is excessively overbought and vulnerable to a pullback. A 1:10 stock split scheduled for 10 June could play a role. While Nvidia shares will become more accessible to a broader range of investors (a bullish sign), it is possible that the "buy the rumour, sell the news" principle may apply, and after a series of positive events for NVDA stock, its price may correct towards the lower boundary of the 2024 upward channel and possibly test the gap area (shown in purple).
Trade global index CFDs with zero commission and tight spreads. Open your FXOpen account now or learn more about trading index CFDs with FXOpen.
CFDs are complex instruments and come with a high risk of losing your money.
This article represents the opinion of the Companies operating under the FXOpen brand only. It is not to be construed as an offer, solicitation, or recommendation with respect to products and services provided by the Companies operating under the FXOpen brand, nor is it to be considered financial advice.
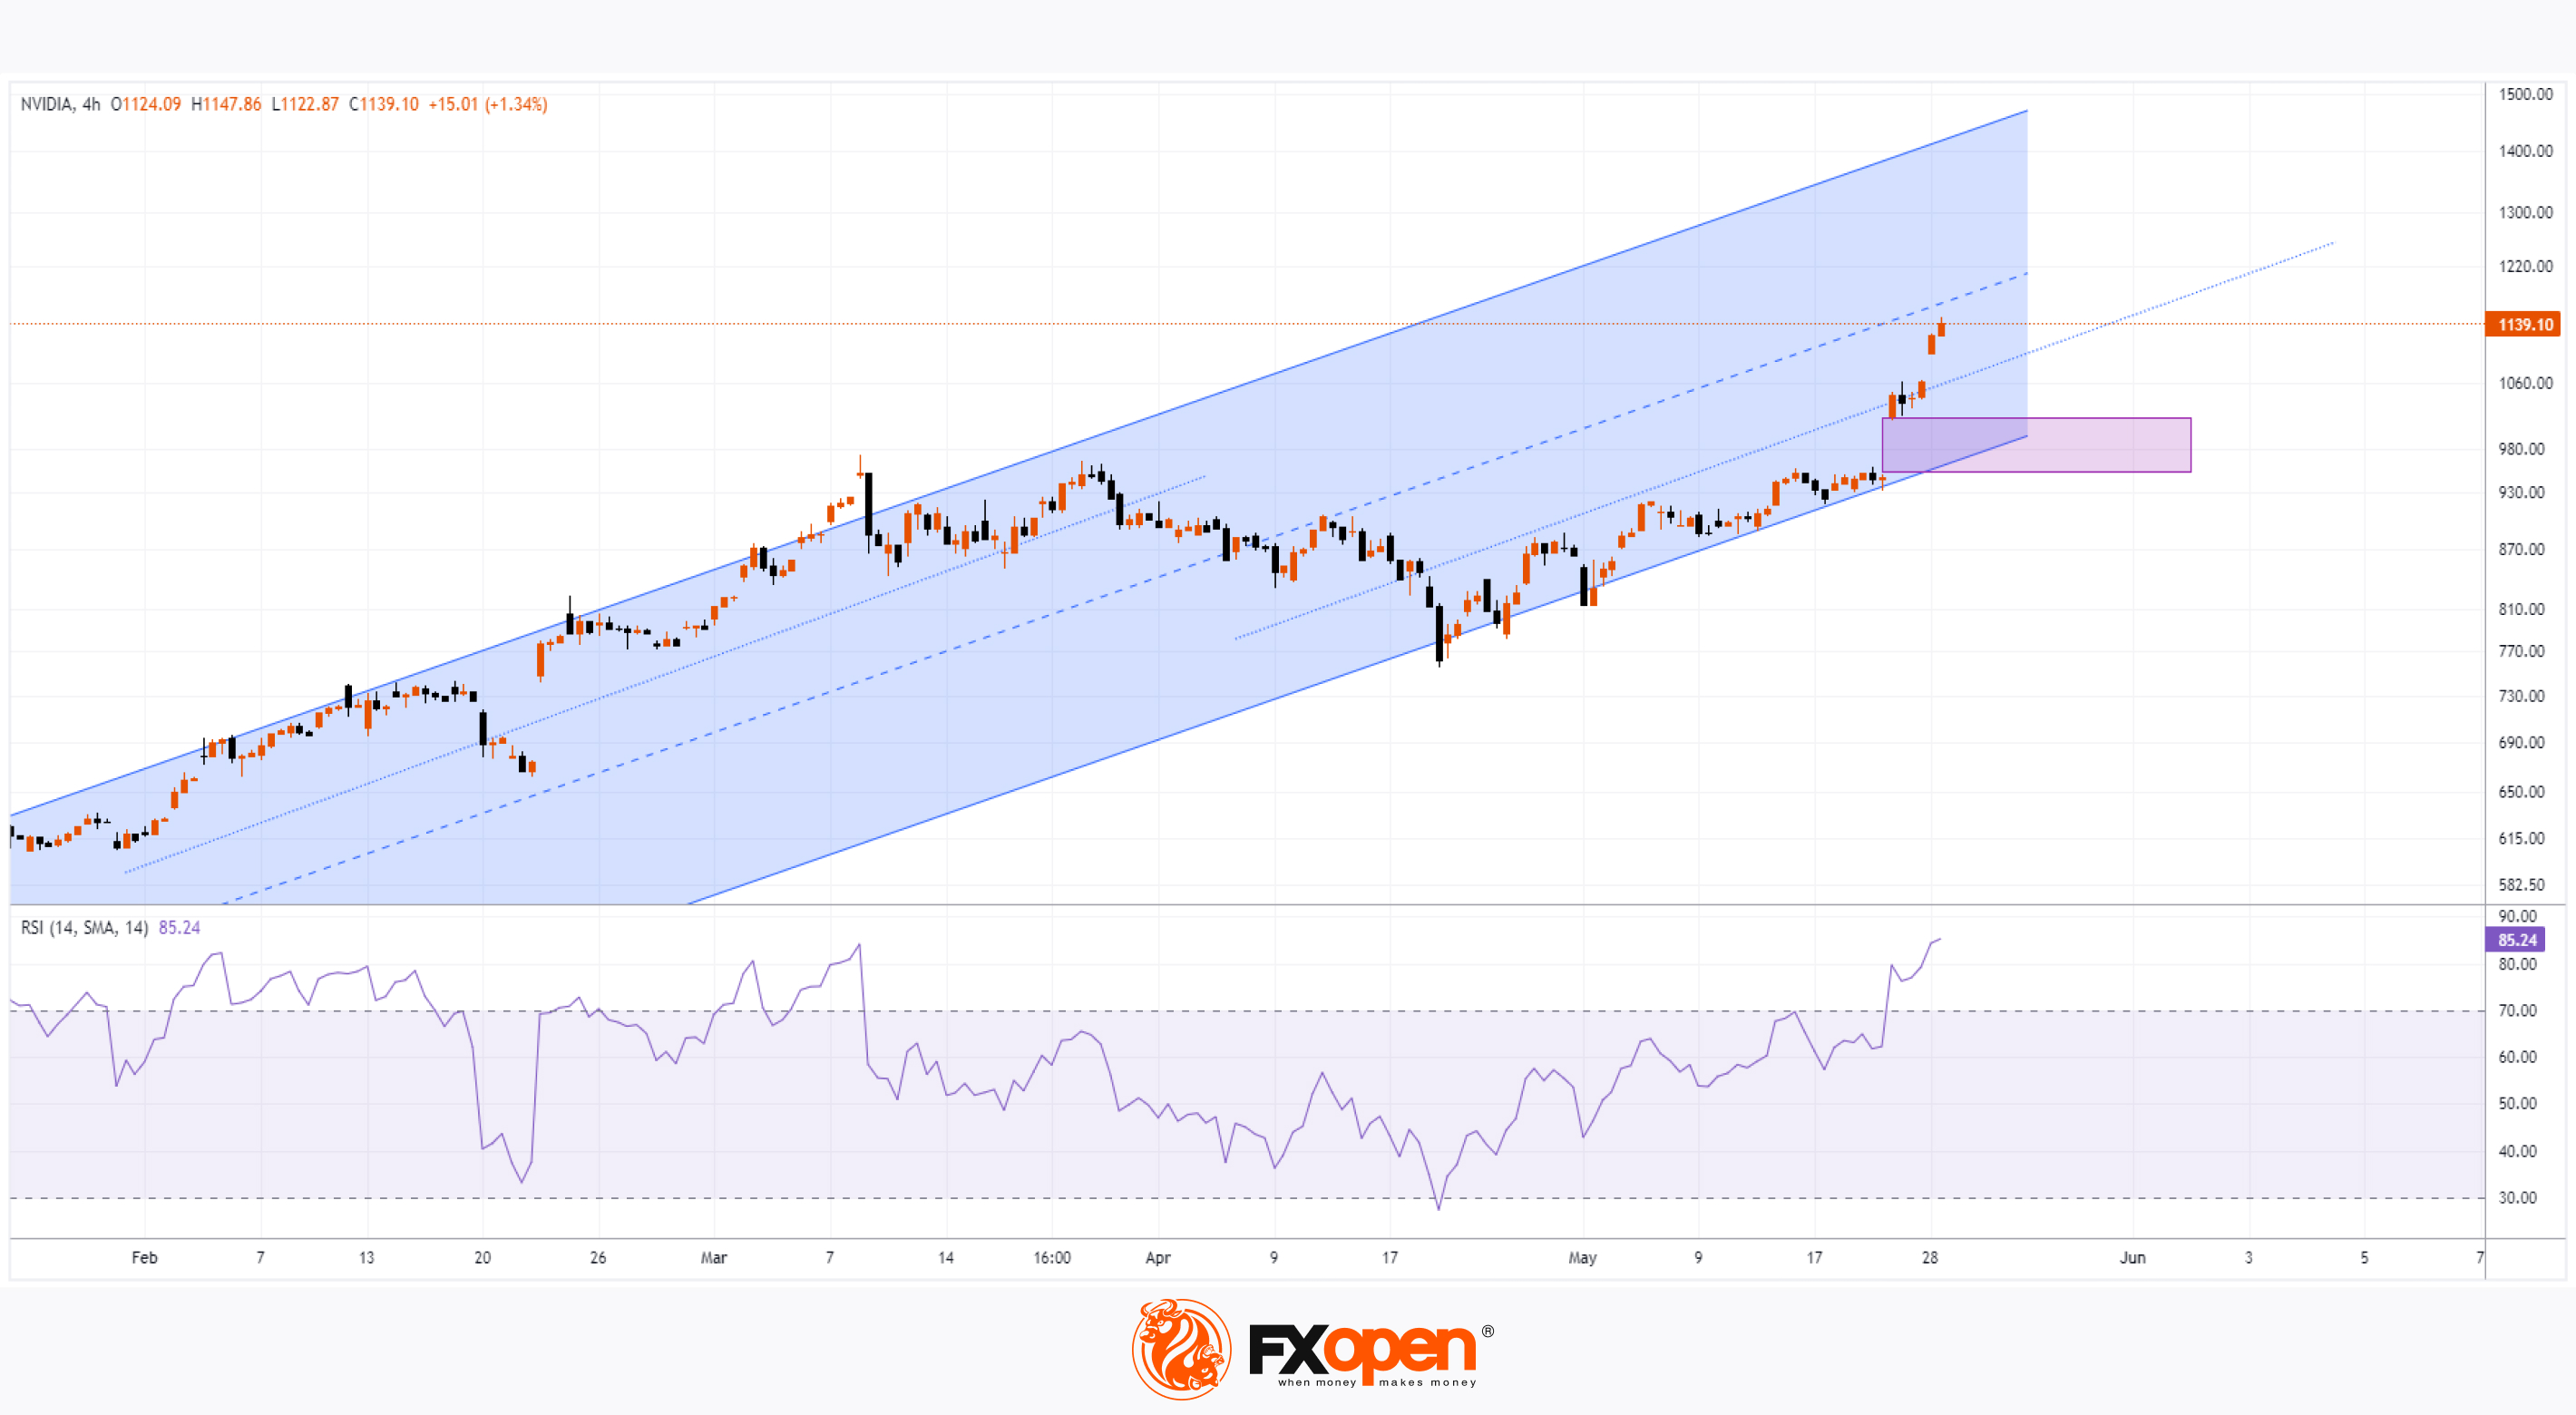
👍2
#gbpjpy #tradingtips #forextrading #marketanalysis
GBP/JPY at Highest Level in Over 15 Years
As shown by today's GBP/JPY chart, the exchange rate has not only surpassed the psychological level of 200 yen per pound but has also exceeded the peak of 29 April 2024. The market is now experiencing prices last seen in 2008.
The main driver of the pound’s strength against the yen is the difference in monetary policies enacted by the central banks. While the Bank of England maintains a rate of 5.5%, in Japan it is 0.10% (having been kept unchanged at -0.10% from January 2016 until March 2024 – over 8 years).
Can the GBP/JPY rate go even higher? Fundamentally, if the imbalance in interest rates persists, it creates conditions for a continued rally.
According to Business Recorder, the Bank of Japan (BOJ) will act cautiously within its inflation targeting framework. BOJ Governor Kazuo Ueda noted that some issues are "exceptionally challenging" for Japan after many years of ultra-loose monetary policy.
“The absence of significant interest rate movements poses a considerable obstacle in assessing the economy’s response to changes in interest rates,” he said.
Technical analysis of the GBP/JPY pair on the 4-hour chart today indicates that the price is in an uptrend (shown by the blue channel). However, the 200 yen per pound level is showing signs of resistance:
→ It is a psychological “round” number.
→ In April, the Bank of Japan intervened at this level to support the excessively weak yen, which might make buyers act more cautiously.
→ An analysis of the chart shows that the bulls have been unable to push the price to the upper boundary of the ascending channel (shown by the red circle). This is a bearish sign, which can be interpreted as a weakening bullish impulse after surpassing the psychological level.
If the GBP/JPY price can hold above the 200 yen per pound level, it will increase the likelihood that the May uptrend channel will remain valid.
Trade over 50 forex markets 24 hours a day with FXOpen. Take advantage of low commissions, deep liquidity, and spreads from 0.0 pips. Open your FXOpen account now or learn more about trading forex with FXOpen.
CFDs are complex instruments and come with a high risk of losing your money.
This article represents the opinion of the Companies operating under the FXOpen brand only. It is not to be construed as an offer, solicitation, or recommendation with respect to products and services provided by the Companies operating under the FXOpen brand, nor is it to be considered financial advice.
GBP/JPY at Highest Level in Over 15 Years
As shown by today's GBP/JPY chart, the exchange rate has not only surpassed the psychological level of 200 yen per pound but has also exceeded the peak of 29 April 2024. The market is now experiencing prices last seen in 2008.
The main driver of the pound’s strength against the yen is the difference in monetary policies enacted by the central banks. While the Bank of England maintains a rate of 5.5%, in Japan it is 0.10% (having been kept unchanged at -0.10% from January 2016 until March 2024 – over 8 years).
Can the GBP/JPY rate go even higher? Fundamentally, if the imbalance in interest rates persists, it creates conditions for a continued rally.
According to Business Recorder, the Bank of Japan (BOJ) will act cautiously within its inflation targeting framework. BOJ Governor Kazuo Ueda noted that some issues are "exceptionally challenging" for Japan after many years of ultra-loose monetary policy.
“The absence of significant interest rate movements poses a considerable obstacle in assessing the economy’s response to changes in interest rates,” he said.
Technical analysis of the GBP/JPY pair on the 4-hour chart today indicates that the price is in an uptrend (shown by the blue channel). However, the 200 yen per pound level is showing signs of resistance:
→ It is a psychological “round” number.
→ In April, the Bank of Japan intervened at this level to support the excessively weak yen, which might make buyers act more cautiously.
→ An analysis of the chart shows that the bulls have been unable to push the price to the upper boundary of the ascending channel (shown by the red circle). This is a bearish sign, which can be interpreted as a weakening bullish impulse after surpassing the psychological level.
If the GBP/JPY price can hold above the 200 yen per pound level, it will increase the likelihood that the May uptrend channel will remain valid.
Trade over 50 forex markets 24 hours a day with FXOpen. Take advantage of low commissions, deep liquidity, and spreads from 0.0 pips. Open your FXOpen account now or learn more about trading forex with FXOpen.
CFDs are complex instruments and come with a high risk of losing your money.
This article represents the opinion of the Companies operating under the FXOpen brand only. It is not to be construed as an offer, solicitation, or recommendation with respect to products and services provided by the Companies operating under the FXOpen brand, nor is it to be considered financial advice.
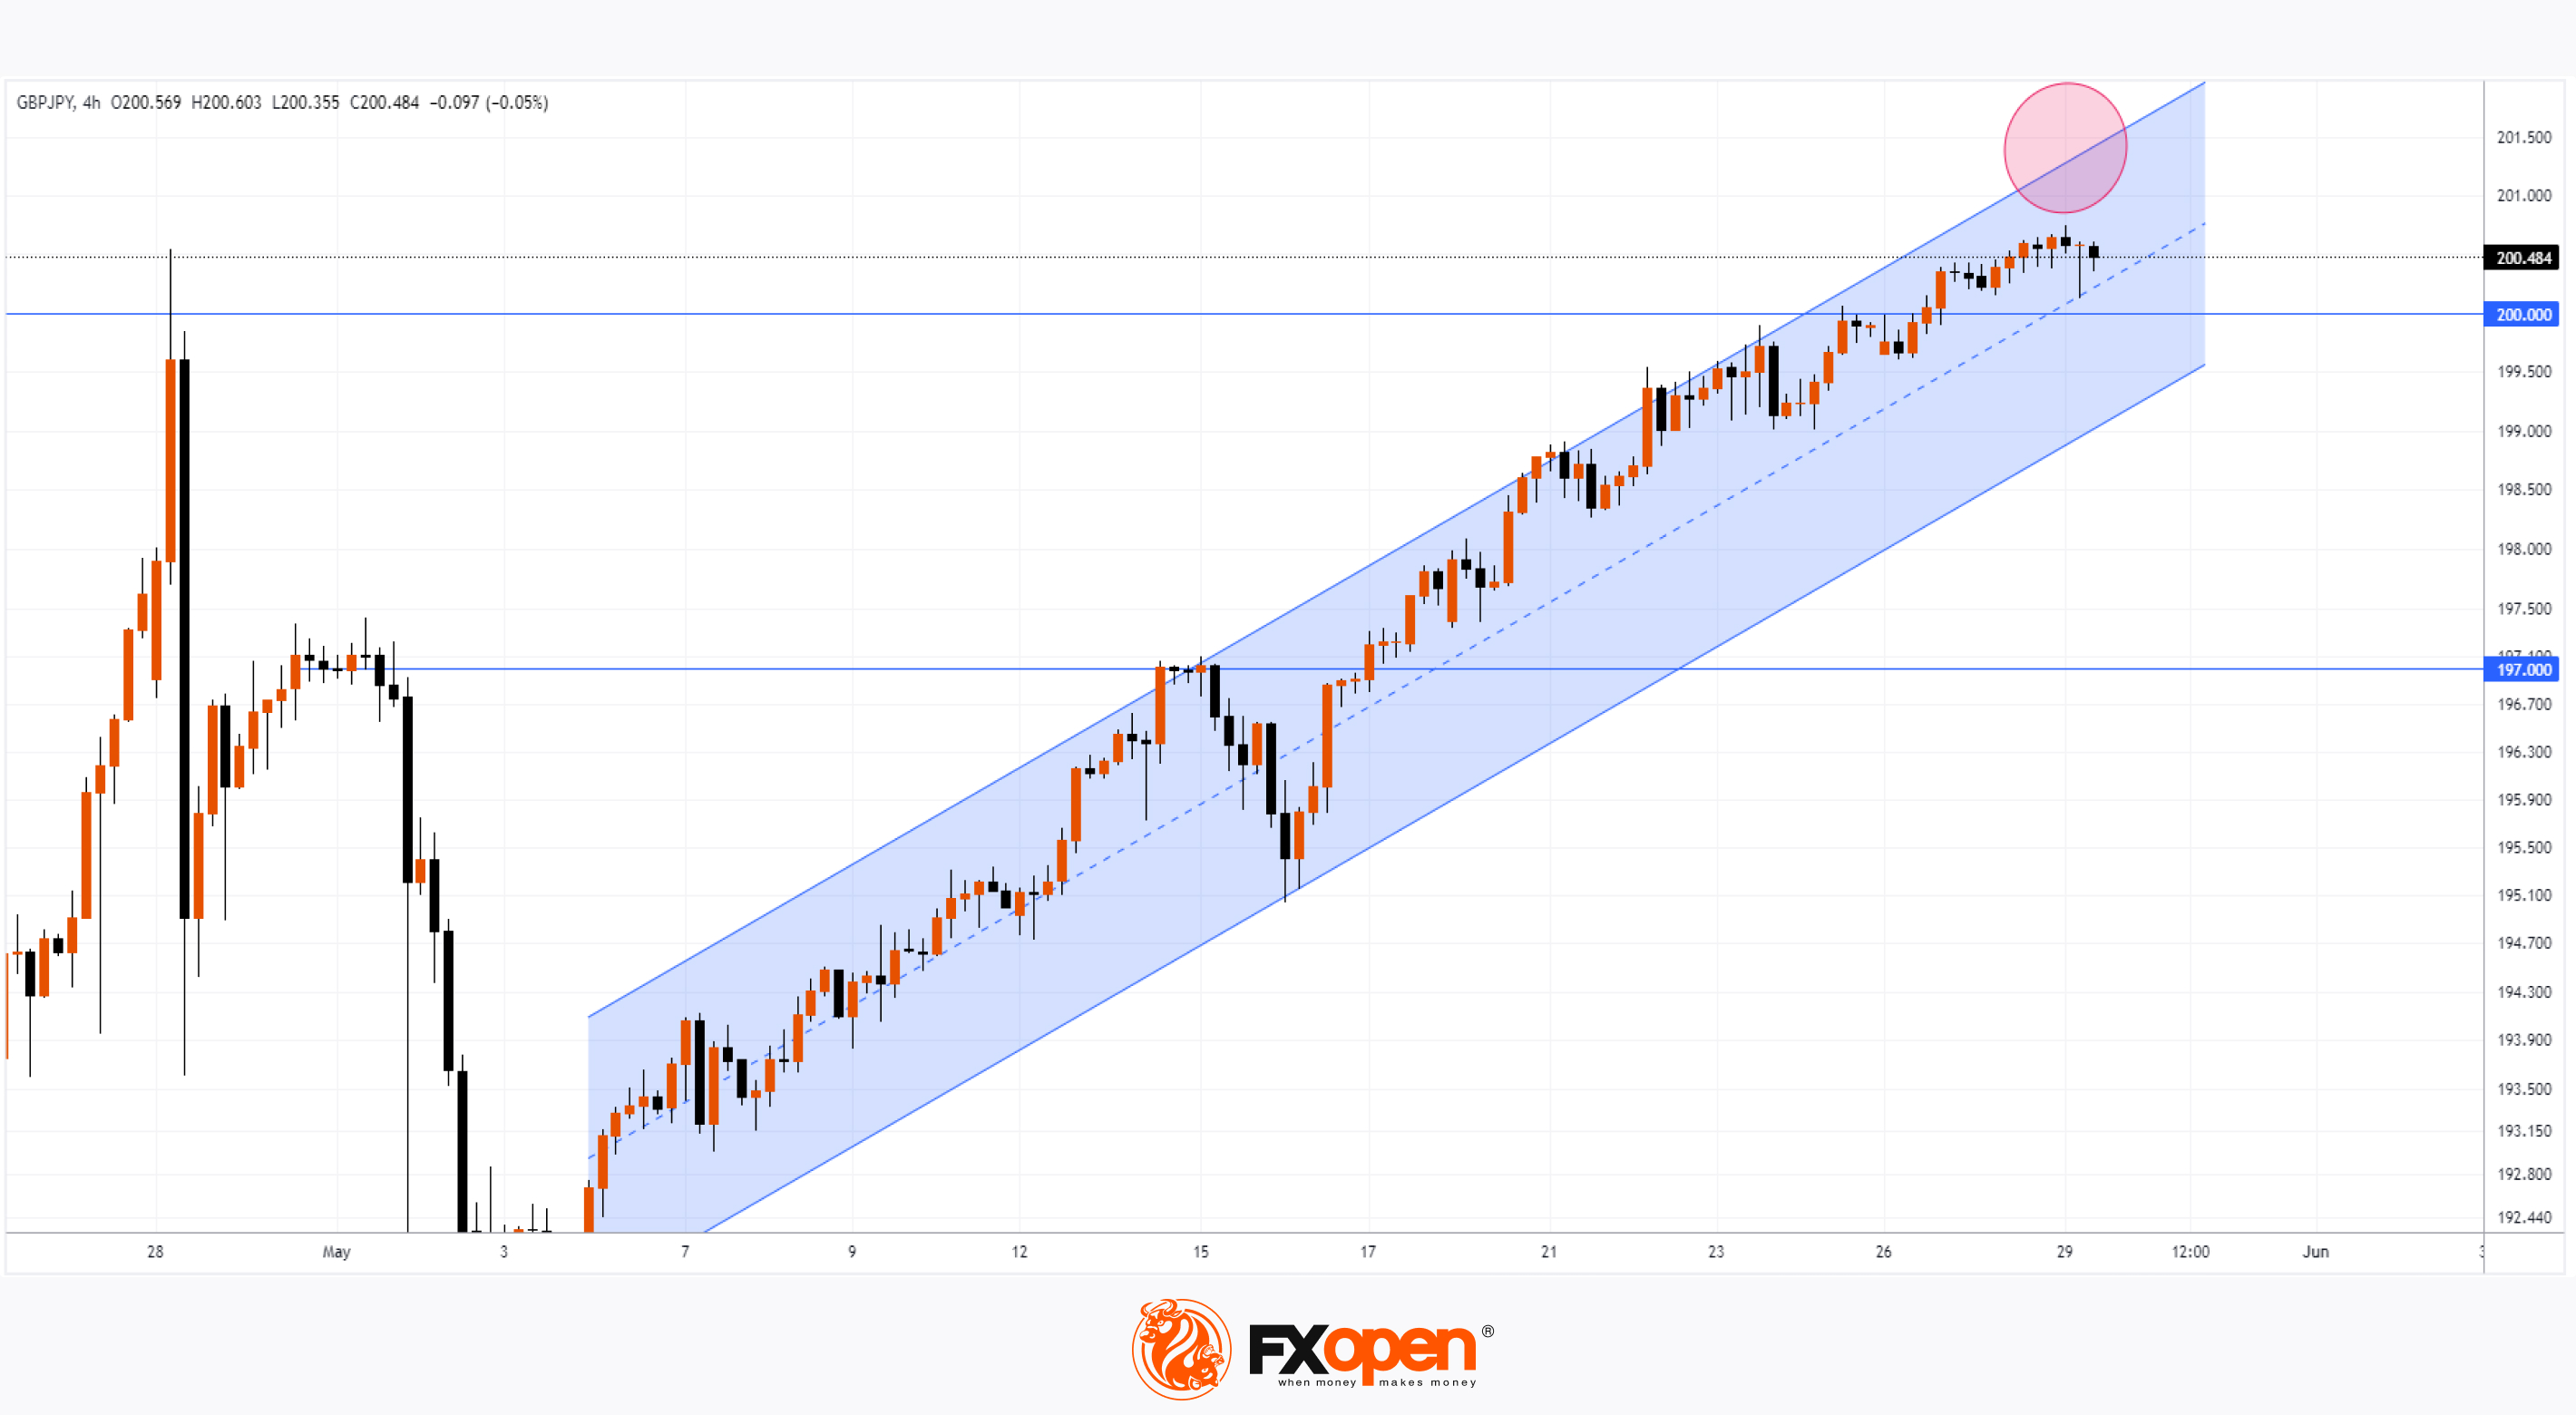
👍2