
#stockmarket #UK100 #oilprices #XAUUSD #goldprice
Weekly Market Wrap With Gary Thomson: UK100, USD, GOLD, OIL
Get the latest scoop on the week's hottest headlines, all in one convenient video. Join Gary Thomson, the COO of FXOpen UK, as he breaks down the most significant news reports and shares his expert insights.
🔸UK100 Share Index Rises as UK Inflation Slows
🔸 The Dollar is Corrected after the Comments of the Head of the Federal Reserve
🔸 XAU/USD Gold Price Reaches an Important Resistance Zone
🔸 Since the Beginning of the Week, the Price of Brent Oil Has Fallen by More than 4%
Stay in the know and empower yourself with our short, yet power-packed video. Watch it now and stay updated with FXOpen. Don't miss out on this invaluable opportunity to sharpen your trading skills and make informed decisions.
https://cutt.ly/uw5E2Cxc
To take advantage of price fluctuations in the foreign exchange markets, consider enlisting the services of a reliable broker like FXOpen.
⚠️
This forecast represents FXOpen Companies opinion only, it should not be construed as an offer, invitation or recommendation in respect to FXOpen Companies products and services or as financial advice.
Weekly Market Wrap With Gary Thomson: UK100, USD, GOLD, OIL
Get the latest scoop on the week's hottest headlines, all in one convenient video. Join Gary Thomson, the COO of FXOpen UK, as he breaks down the most significant news reports and shares his expert insights.
🔸UK100 Share Index Rises as UK Inflation Slows
🔸 The Dollar is Corrected after the Comments of the Head of the Federal Reserve
🔸 XAU/USD Gold Price Reaches an Important Resistance Zone
🔸 Since the Beginning of the Week, the Price of Brent Oil Has Fallen by More than 4%
Stay in the know and empower yourself with our short, yet power-packed video. Watch it now and stay updated with FXOpen. Don't miss out on this invaluable opportunity to sharpen your trading skills and make informed decisions.
https://cutt.ly/uw5E2Cxc
To take advantage of price fluctuations in the foreign exchange markets, consider enlisting the services of a reliable broker like FXOpen.
⚠️
This forecast represents FXOpen Companies opinion only, it should not be construed as an offer, invitation or recommendation in respect to FXOpen Companies products and services or as financial advice.
YouTube
Weekly Market Wrap With Gary Thomson: UK100, USD, GOLD, OIL
Get the latest scoop on the week's hottest headlines, all in one convenient video. Join Gary Thomson, the COO of FXOpen UK, as he breaks down the most significant news reports and shares his expert insights. Read the latest news on Market Pulse https://…
👍3
#bitcoin #BTCUSD #cryptonews #MarketNews
Bitcoin Price Bullish after Halving-2024
On April 19, 2024, a halving occurred in the Bitcoin network, resulting in the reward for the mined block amounting to 3.125 BTC.
Historically, after the halving (which is associated with a reduction in supply), the price of Bitcoin heads to all-time highs. But, as Forbes reports, Goldman Sachs analysts warn against extrapolating the results of Bitcoin price movements after past halvings to the current moment. After all, back then, the halvings occurred during a period of loose monetary policy by the Federal Reserve, while this time the Fed is struggling with harsher-than-expected inflation.
JPMorgan analysts led by Nikolaos Panigirtzoglou are also cautious. “We do not expect Bitcoin price increases post halving as it has been already priced in,” they wrote.
However, this morning Bitcoin is trading above USD 66,000, the highest price in a week. Adding to the market's positivity are rumors that the Securities and Futures Commission (SFC) in Hong Kong is going to approve spot applications for Bitcoin ETFs.
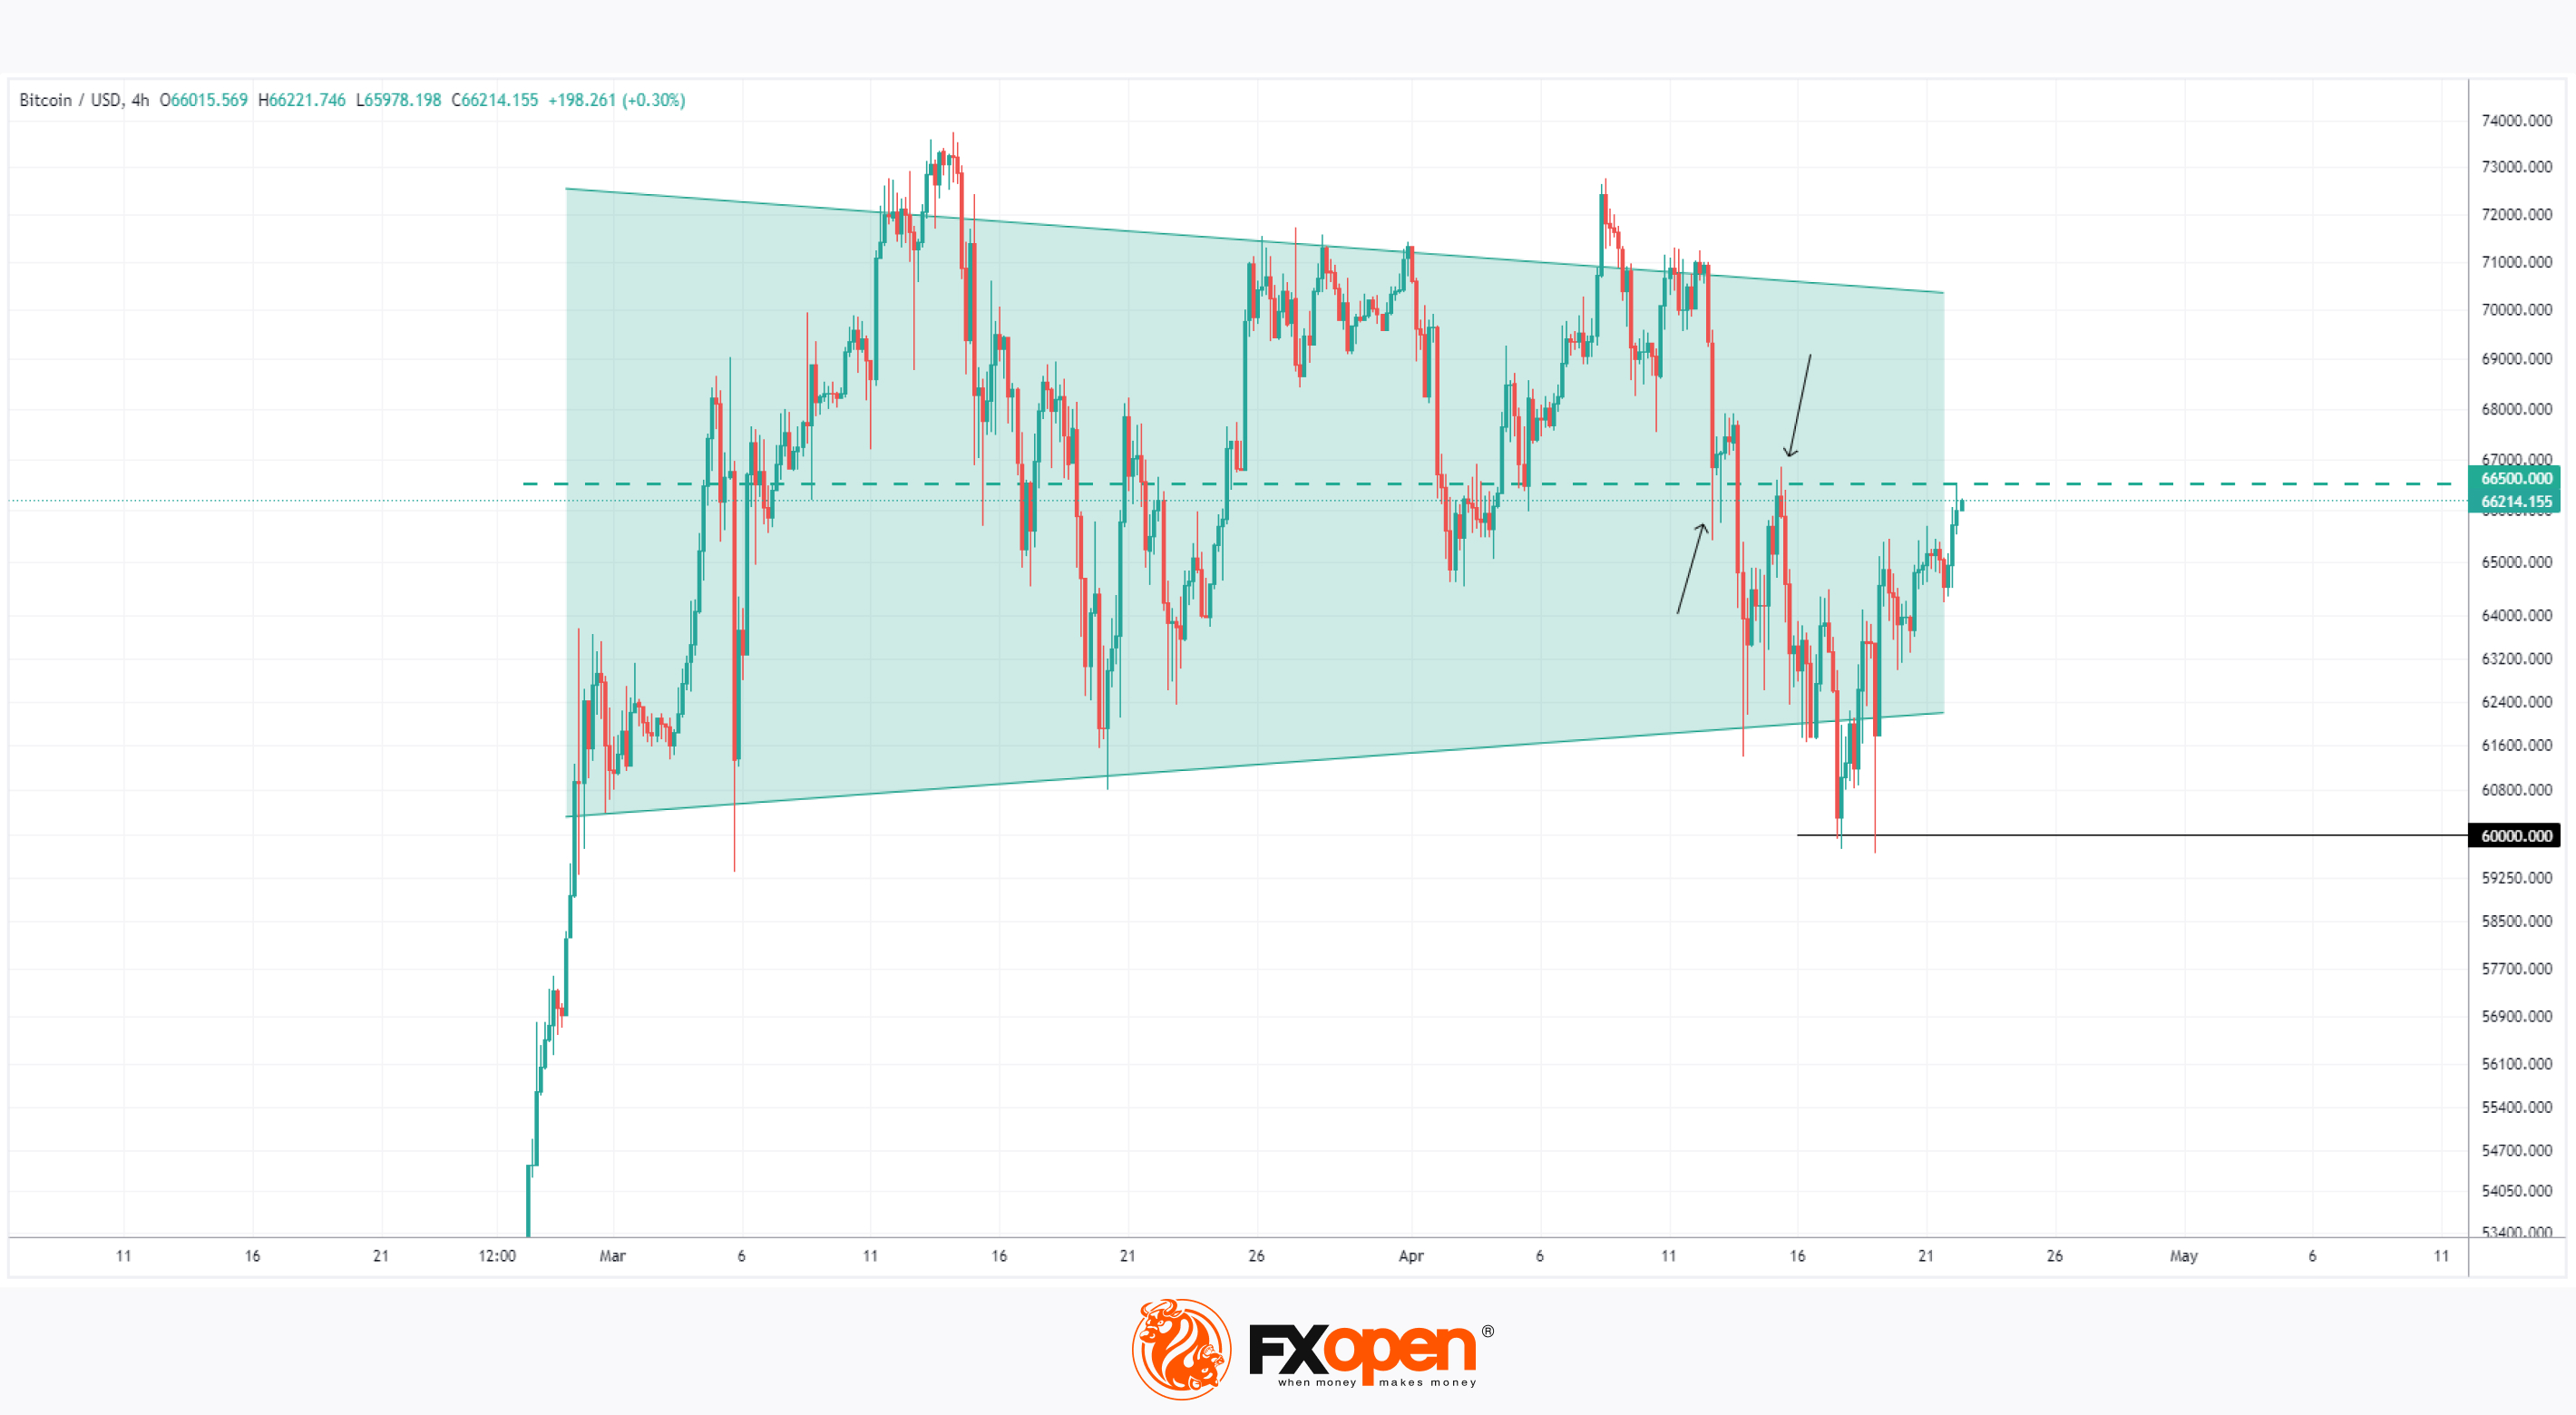
Technical analysis of the BTC/USD chart shows that:
→ Bitcoin price made a double false breakout of the psychological level of USD 60,000 last week – April 17 and 18;
→ after this maneuver, the Bitcoin price confidently recovered into the consolidation zone, shown by a narrowing green triangle;
→ Bitcoin price today may be affected by the USD 66,500 level, which is the central axis of the consolidation zone, as well as the former support level (as shown by the arrows);
What about the longer term? The demand activity seen around the USD 60,000 level can be interpreted as a stable interest in the main cryptocurrency on the part of investors, which may ultimately lead to an attempt by the Bitcoin price to attack the USD 70,000 level near the upper border of the consolidation zone.
FXOpen offers the world's most popular cryptocurrency CFDs*, including Bitcoin and Ethereum. Floating spreads, 1:2 leverage — at your service. Open your trading account now or learn more about crypto CFD trading with FXOpen.
*At FXOpen UK and FXOpen AU, Cryptocurrency CFDs are only available for trading by those clients categorised as Professional clients under FCA Rules and Professional clients under AFSL 412871 – ABN 61 143 678 719 respectively. They are not available for trading by Retail clients.
CFDs are complex instruments and come with a high risk of losing your money.
This article represents the opinion of the Companies operating under the FXOpen brand only. It is not to be construed as an offer, solicitation, or recommendation with respect to products and services provided by the Companies operating under the FXOpen brand, nor is it to be considered financial advice.
Bitcoin Price Bullish after Halving-2024
On April 19, 2024, a halving occurred in the Bitcoin network, resulting in the reward for the mined block amounting to 3.125 BTC.
Historically, after the halving (which is associated with a reduction in supply), the price of Bitcoin heads to all-time highs. But, as Forbes reports, Goldman Sachs analysts warn against extrapolating the results of Bitcoin price movements after past halvings to the current moment. After all, back then, the halvings occurred during a period of loose monetary policy by the Federal Reserve, while this time the Fed is struggling with harsher-than-expected inflation.
JPMorgan analysts led by Nikolaos Panigirtzoglou are also cautious. “We do not expect Bitcoin price increases post halving as it has been already priced in,” they wrote.
However, this morning Bitcoin is trading above USD 66,000, the highest price in a week. Adding to the market's positivity are rumors that the Securities and Futures Commission (SFC) in Hong Kong is going to approve spot applications for Bitcoin ETFs.
Technical analysis of the BTC/USD chart shows that:
→ Bitcoin price made a double false breakout of the psychological level of USD 60,000 last week – April 17 and 18;
→ after this maneuver, the Bitcoin price confidently recovered into the consolidation zone, shown by a narrowing green triangle;
→ Bitcoin price today may be affected by the USD 66,500 level, which is the central axis of the consolidation zone, as well as the former support level (as shown by the arrows);
What about the longer term? The demand activity seen around the USD 60,000 level can be interpreted as a stable interest in the main cryptocurrency on the part of investors, which may ultimately lead to an attempt by the Bitcoin price to attack the USD 70,000 level near the upper border of the consolidation zone.
FXOpen offers the world's most popular cryptocurrency CFDs*, including Bitcoin and Ethereum. Floating spreads, 1:2 leverage — at your service. Open your trading account now or learn more about crypto CFD trading with FXOpen.
*At FXOpen UK and FXOpen AU, Cryptocurrency CFDs are only available for trading by those clients categorised as Professional clients under FCA Rules and Professional clients under AFSL 412871 – ABN 61 143 678 719 respectively. They are not available for trading by Retail clients.
CFDs are complex instruments and come with a high risk of losing your money.
This article represents the opinion of the Companies operating under the FXOpen brand only. It is not to be construed as an offer, solicitation, or recommendation with respect to products and services provided by the Companies operating under the FXOpen brand, nor is it to be considered financial advice.
👍2
#marketanalysis #goldprice #XAUUSD
The Price of Gold XAU/USD Shows Strongest Fall in Almost 2 Years
On Monday, the price of gold fell from USD 2,386 to USD 2,333 per ounce — this is the strongest drop in one day in almost 2 years, according to Bloomberg. On Tuesday morning in the Asian session, the price continued to decline, reaching USD 2,300 per ounce.
This happened against the backdrop of:
→ easing tensions in the Middle East. According to Tehran's official statement, Israel received "the necessary response at this stage."
→ signs that the Federal Reserve will keep rates high for longer.
One of the reasons for the intensification of sales can also be considered the desire to take profits by those who held long positions — we wrote about this in the post “The price of gold XAU/USD has reached an important resistance zone” on April 16.
Nevertheless, the gold market continues to remain in an upward trend — since the beginning of the year, its price has increased by 11.5%.
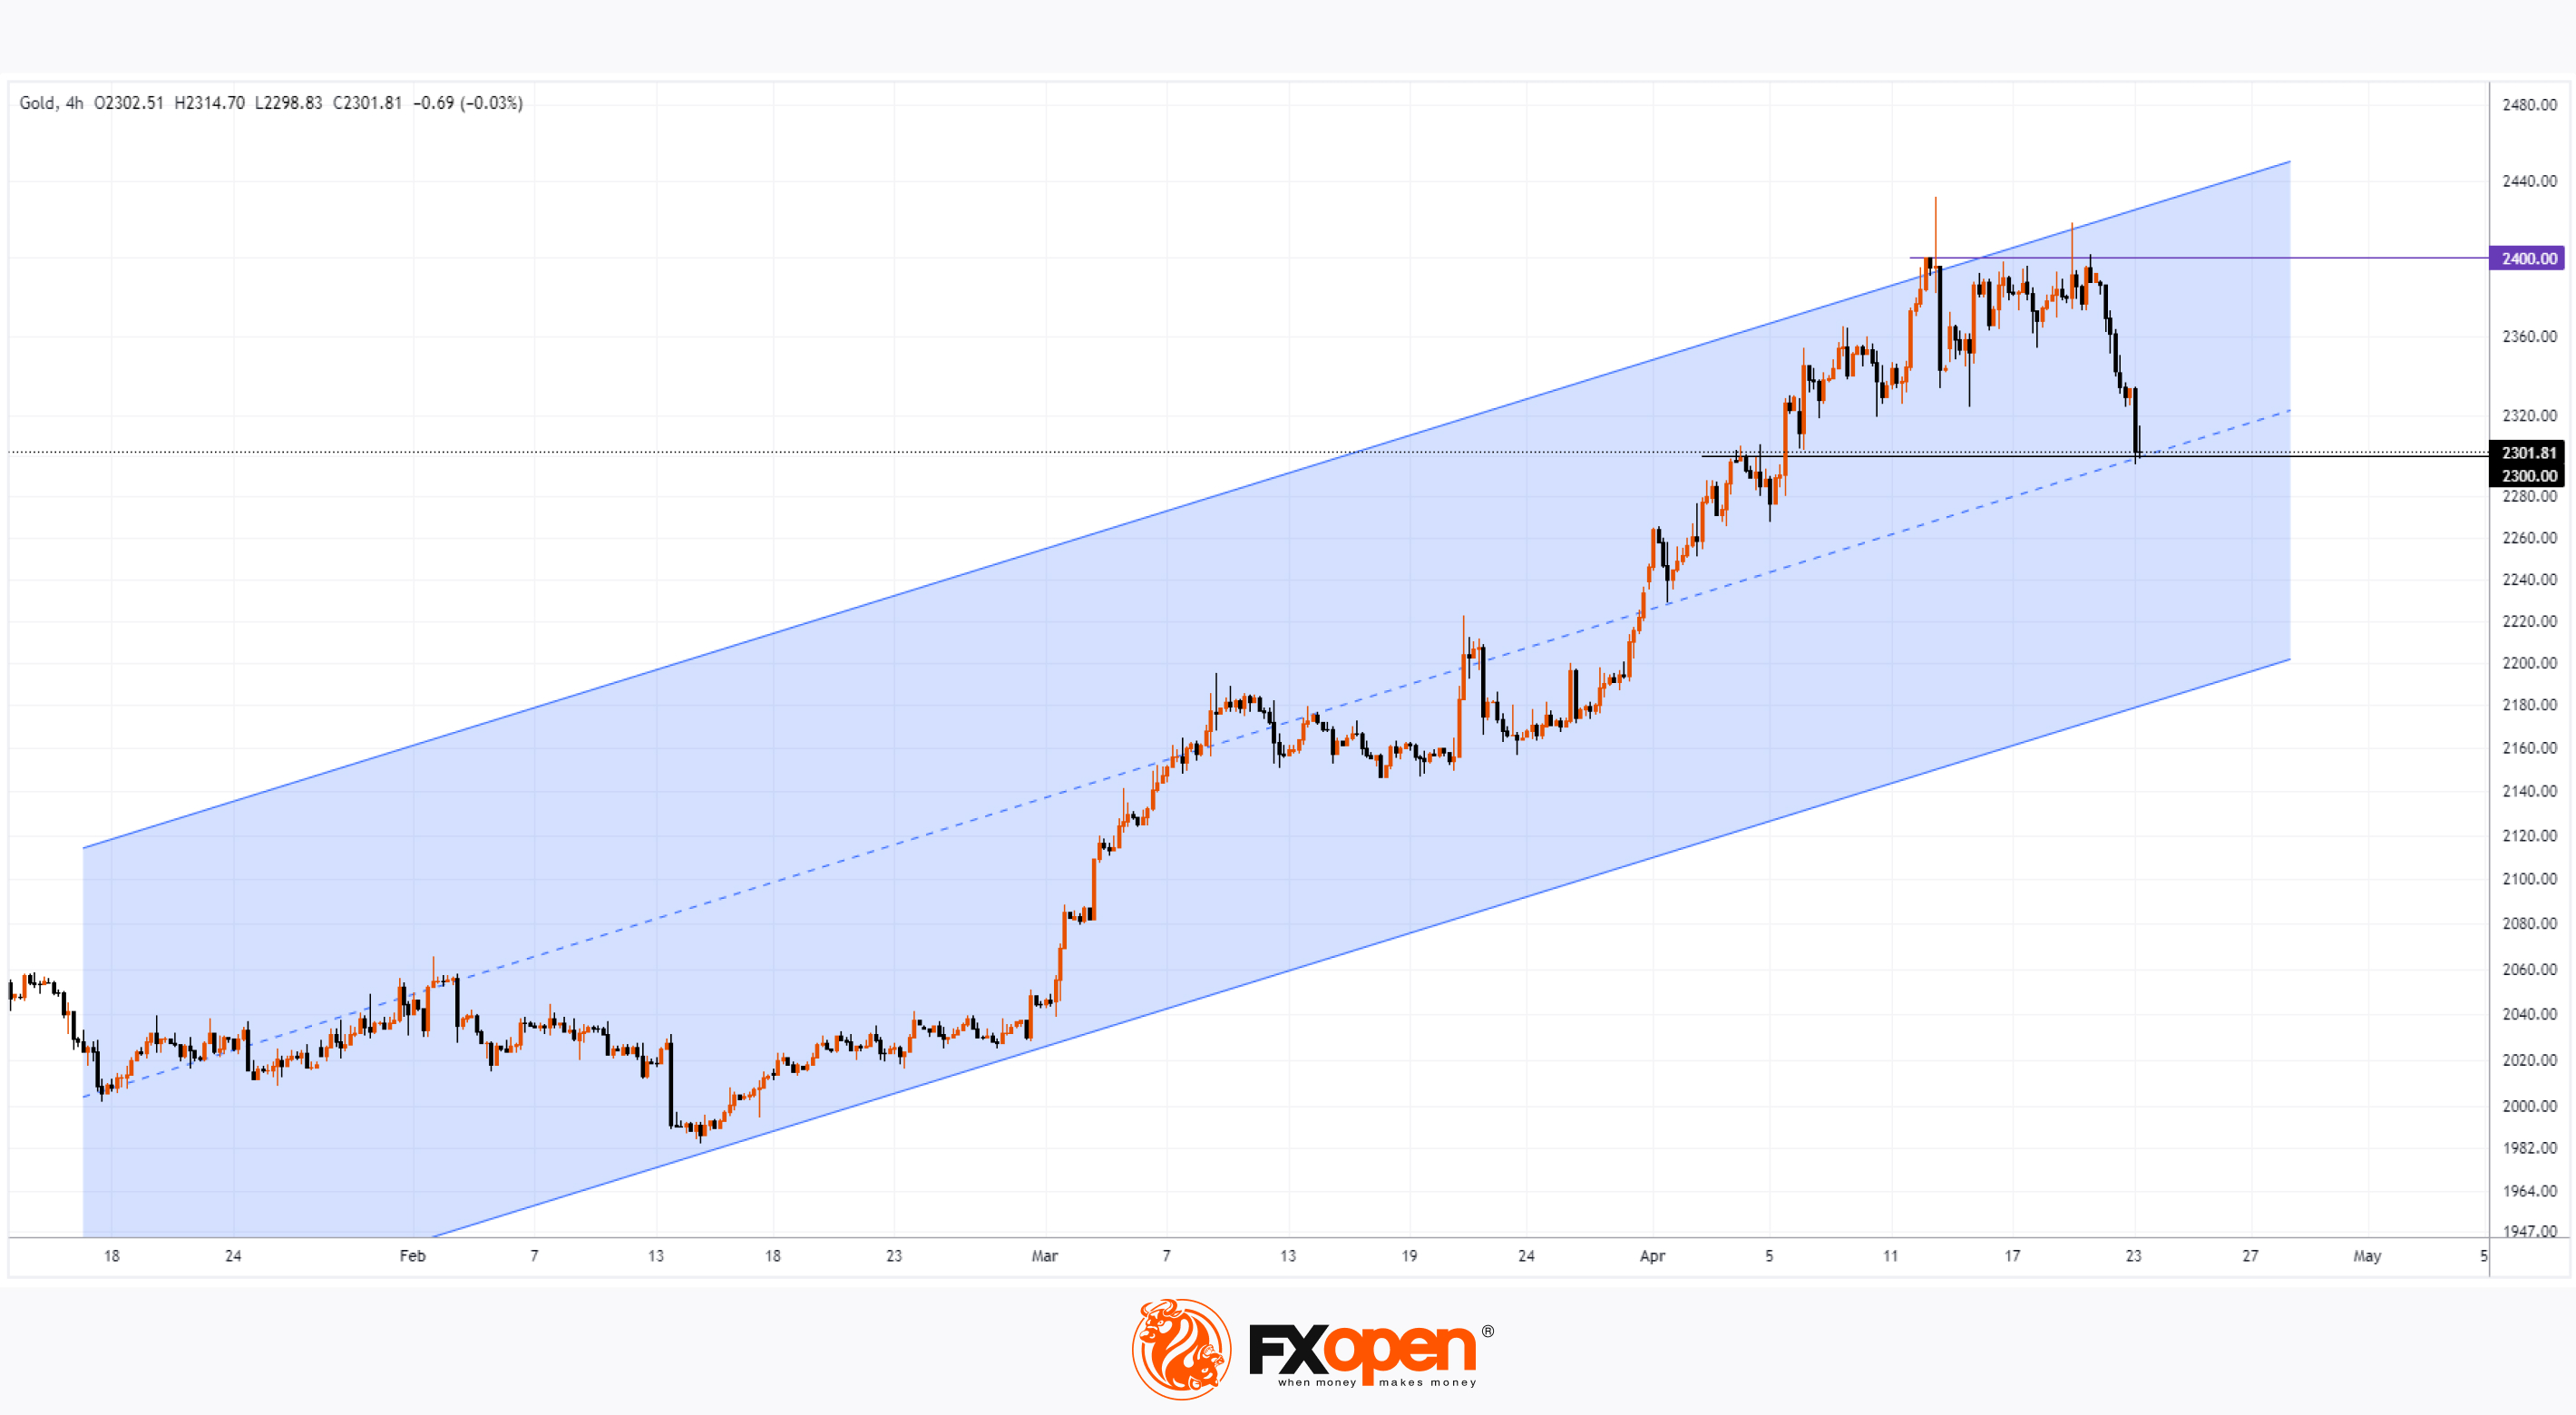
Technical analysis of the XAU/USD chart shows that:
→ the price of gold has reached the median line of the ascending channel (shown in blue), which has been in effect since the beginning of the year;
→ the indicated median line is located in the area of the psychological mark of USD 2300 per ounce — so this area can support the price of gold today.
It is possible that the bulls will try to win back at least 50% of the fall, raising the price to USD 2,350. How successful they will be will depend, among other things, on the fundamental data background. On Friday at 15:30 GMT+3 the values of the Core PCE Price Index will be published — an indicator that the Federal Reserve pays special attention to when analyzing current inflation in the United States.
Start trading commodity CFDs with tight spreads. Open your trading account now or learn more about trading commodity CFDs with FXOpen.
CFDs are complex instruments and come with a high risk of losing your money.
This article represents the opinion of the Companies operating under the FXOpen brand only. It is not to be construed as an offer, solicitation, or recommendation with respect to products and services provided by the Companies operating under the FXOpen brand, nor is it to be considered financial advice.
The Price of Gold XAU/USD Shows Strongest Fall in Almost 2 Years
On Monday, the price of gold fell from USD 2,386 to USD 2,333 per ounce — this is the strongest drop in one day in almost 2 years, according to Bloomberg. On Tuesday morning in the Asian session, the price continued to decline, reaching USD 2,300 per ounce.
This happened against the backdrop of:
→ easing tensions in the Middle East. According to Tehran's official statement, Israel received "the necessary response at this stage."
→ signs that the Federal Reserve will keep rates high for longer.
One of the reasons for the intensification of sales can also be considered the desire to take profits by those who held long positions — we wrote about this in the post “The price of gold XAU/USD has reached an important resistance zone” on April 16.
Nevertheless, the gold market continues to remain in an upward trend — since the beginning of the year, its price has increased by 11.5%.
Technical analysis of the XAU/USD chart shows that:
→ the price of gold has reached the median line of the ascending channel (shown in blue), which has been in effect since the beginning of the year;
→ the indicated median line is located in the area of the psychological mark of USD 2300 per ounce — so this area can support the price of gold today.
It is possible that the bulls will try to win back at least 50% of the fall, raising the price to USD 2,350. How successful they will be will depend, among other things, on the fundamental data background. On Friday at 15:30 GMT+3 the values of the Core PCE Price Index will be published — an indicator that the Federal Reserve pays special attention to when analyzing current inflation in the United States.
Start trading commodity CFDs with tight spreads. Open your trading account now or learn more about trading commodity CFDs with FXOpen.
CFDs are complex instruments and come with a high risk of losing your money.
This article represents the opinion of the Companies operating under the FXOpen brand only. It is not to be construed as an offer, solicitation, or recommendation with respect to products and services provided by the Companies operating under the FXOpen brand, nor is it to be considered financial advice.
👍2
#marketanalysis #MarketNews #tsla #tesla #stockmarket
TSLA Share Price Up About 13% Despite Disappointing Report
Yesterday, TSLA trading closed at USD 144.68 per share, after which Tesla reported its results for the 1st quarter:
→ earnings per share: actual = USD 0.45, forecast = USD 0.49;
→ gross income: actual = USD 21.45 billion, forecast = USD 22.2 billion.
However, in the post-market, TSLA's share price rose approximately 13% thanks to Elon Musk's plans and statements:
→ We faced numerous challenges in Q1, including the conflict in the Red Sea and the arson attack at the Gigafactory in Berlin. We think the second quarter will be much better.
→ EV adoption rates around the world are under pressure, but electric vehicles will dominate the auto industry in the long term. We continue to invest in AI infrastructure, manufacturing facilities, Supercharger networks, and new products.
→ Production of new models will start at the end of 2024 — beginning of 2025 on existing production lines.
The stock's rise after the report shows that optimism about the start of production of a new model that could be the most affordable in Tesla's lineup outweighed concerns about the poor report and increased competition.
On April 5, we wrote that the price of TSLA could reach the psychological level of USD 150 per share.
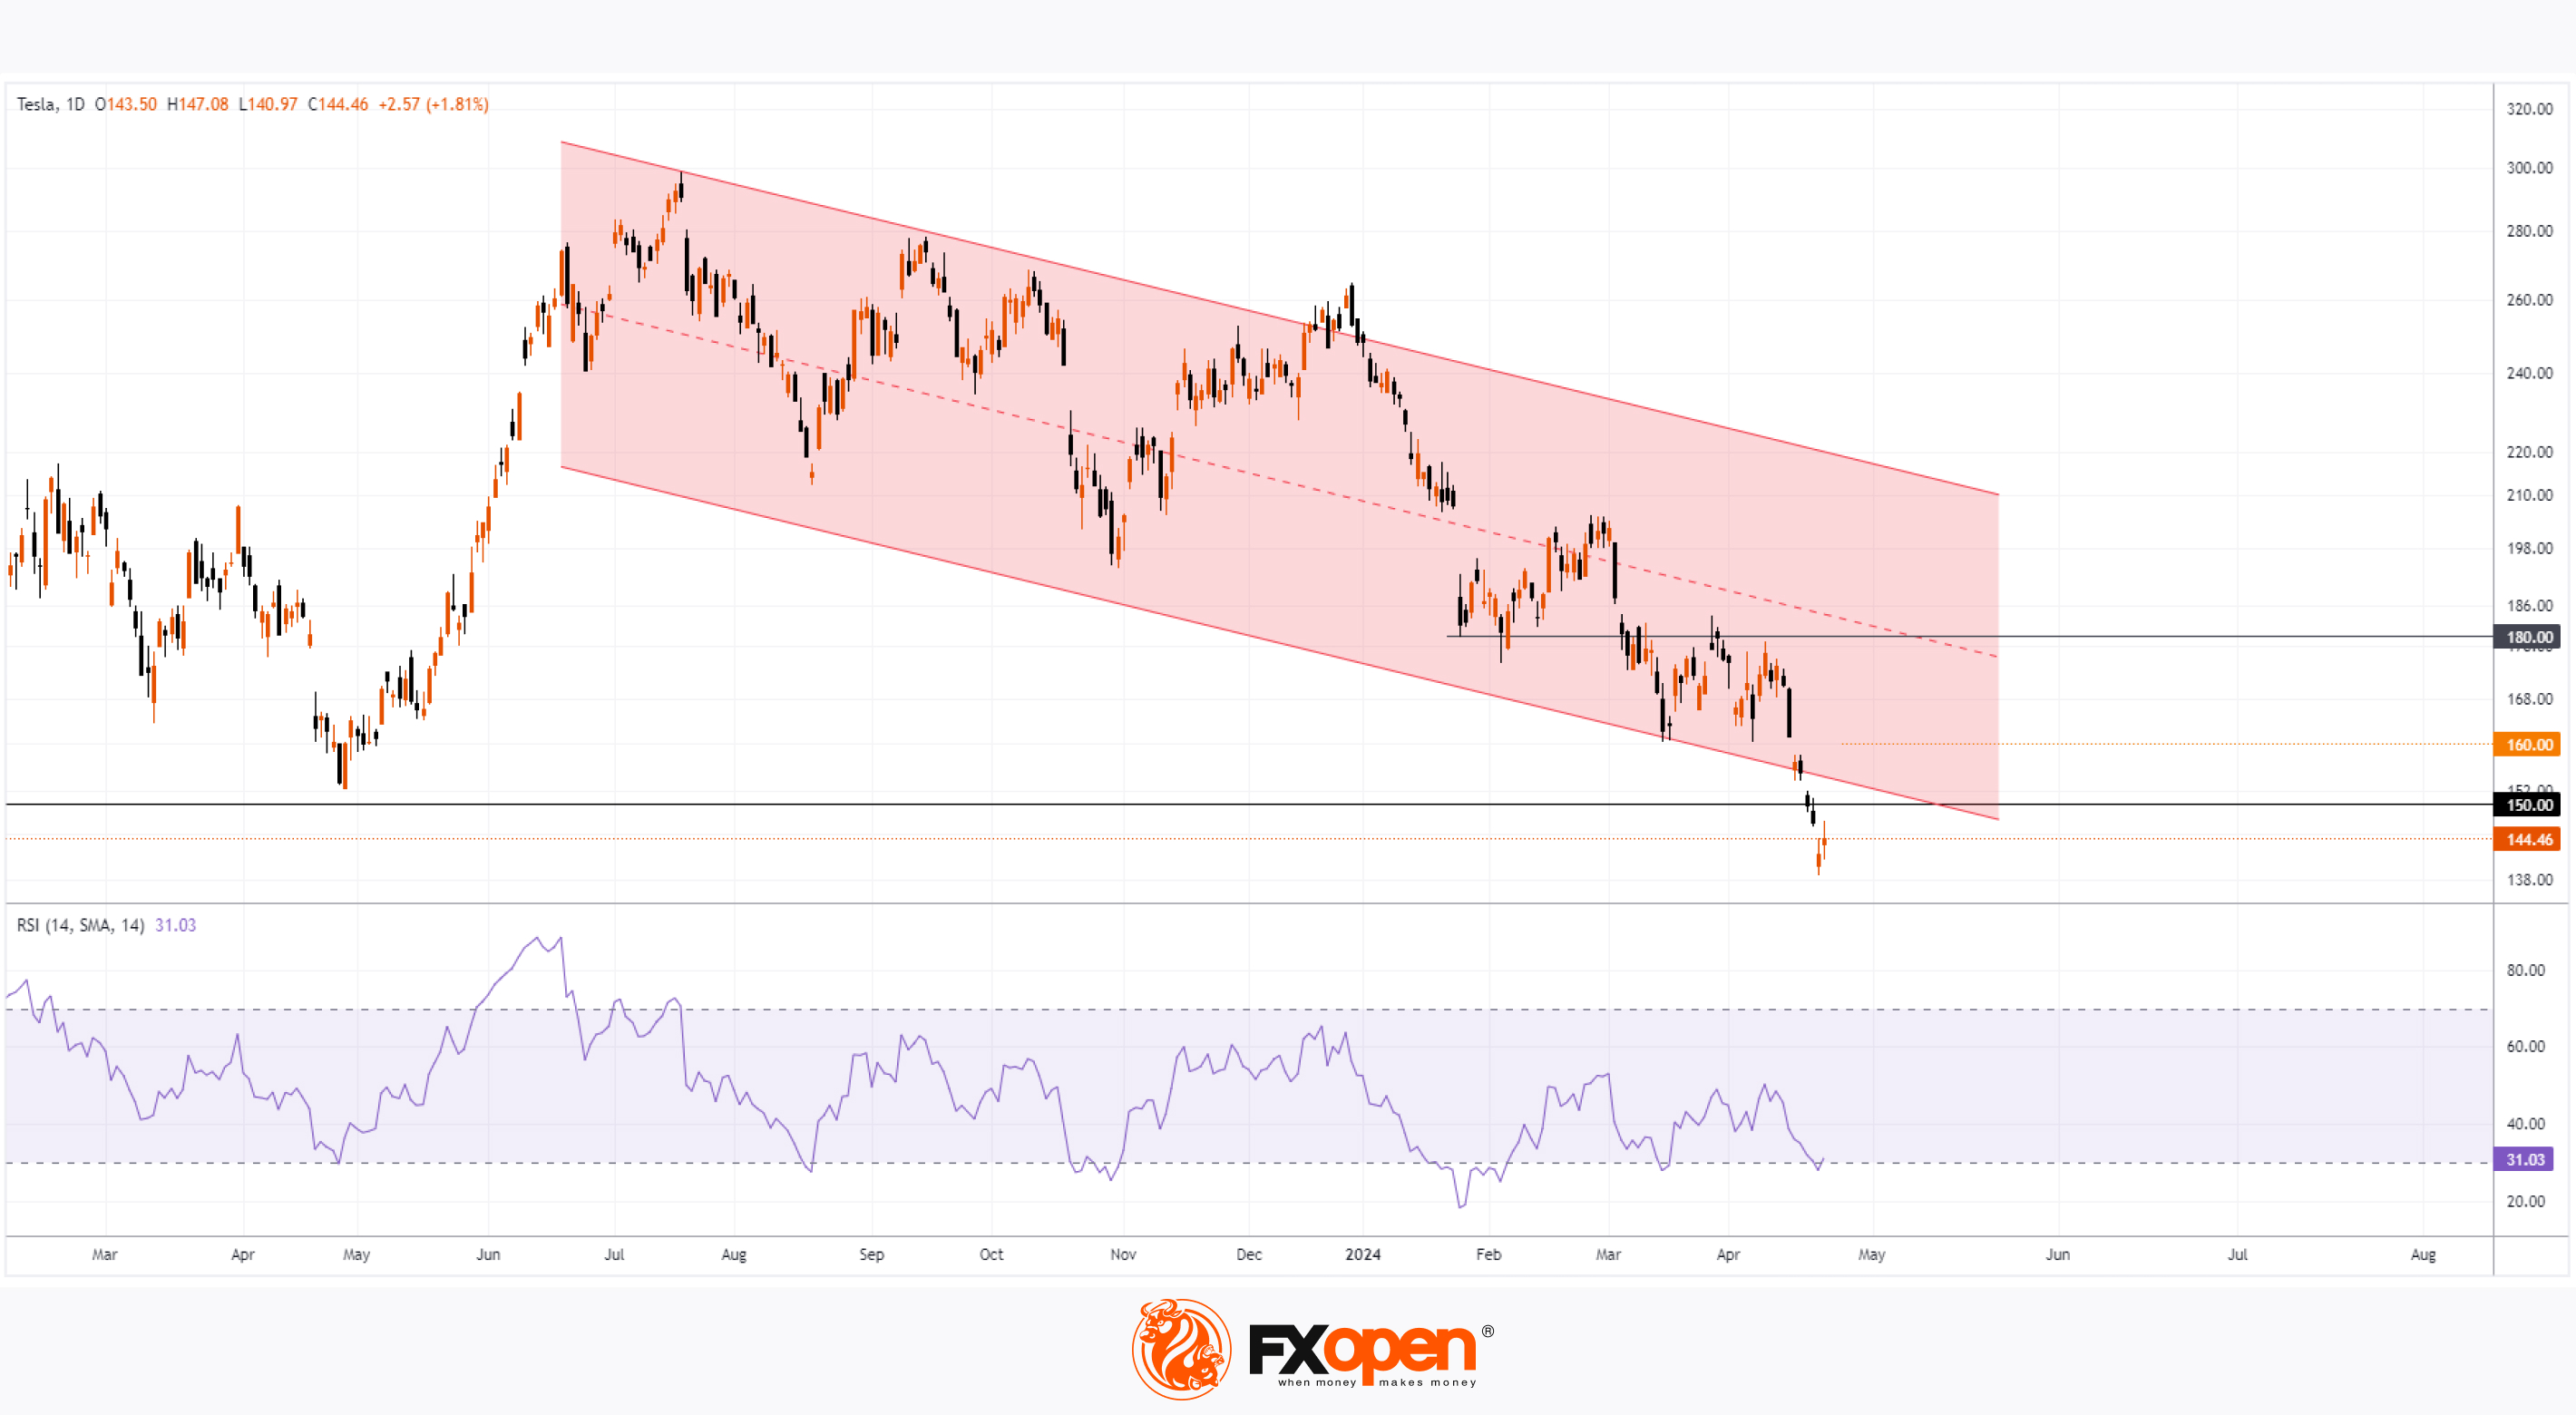
New data on the chart provides valuable information for the technical analysis of TSLA stock:
→ the price dropped below the psychological level, but was unable to gain a foothold there, since in the premarket today the TSLA share is trading above USD 160;
→ opening the main trading session today above USD 160 will mean that the market is returning to the downward channel (shown in red), and the RSI indicator is rising from the oversold zone.
Will TSLA's stock price be able to continue rising after the sharp reversal? A test for the seriousness of the bulls’ intentions can be the resistance block, which is formed by the median line of the descending channel and the resistance level of USD 180 per TSLA share.
Buy and sell stocks of the world's biggest publicly-listed companies with CFDs on FXOpen’s trading platform. Open your FXOpen account now or learn more about trading share CFDs with FXOpen.
CFDs are complex instruments and come with a high risk of losing your money.
This article represents the opinion of the Companies operating under the FXOpen brand only. It is not to be construed as an offer, solicitation, or recommendation with respect to products and services provided by the Companies operating under the FXOpen brand, nor is it to be considered financial advice.
TSLA Share Price Up About 13% Despite Disappointing Report
Yesterday, TSLA trading closed at USD 144.68 per share, after which Tesla reported its results for the 1st quarter:
→ earnings per share: actual = USD 0.45, forecast = USD 0.49;
→ gross income: actual = USD 21.45 billion, forecast = USD 22.2 billion.
However, in the post-market, TSLA's share price rose approximately 13% thanks to Elon Musk's plans and statements:
→ We faced numerous challenges in Q1, including the conflict in the Red Sea and the arson attack at the Gigafactory in Berlin. We think the second quarter will be much better.
→ EV adoption rates around the world are under pressure, but electric vehicles will dominate the auto industry in the long term. We continue to invest in AI infrastructure, manufacturing facilities, Supercharger networks, and new products.
→ Production of new models will start at the end of 2024 — beginning of 2025 on existing production lines.
The stock's rise after the report shows that optimism about the start of production of a new model that could be the most affordable in Tesla's lineup outweighed concerns about the poor report and increased competition.
On April 5, we wrote that the price of TSLA could reach the psychological level of USD 150 per share.
New data on the chart provides valuable information for the technical analysis of TSLA stock:
→ the price dropped below the psychological level, but was unable to gain a foothold there, since in the premarket today the TSLA share is trading above USD 160;
→ opening the main trading session today above USD 160 will mean that the market is returning to the downward channel (shown in red), and the RSI indicator is rising from the oversold zone.
Will TSLA's stock price be able to continue rising after the sharp reversal? A test for the seriousness of the bulls’ intentions can be the resistance block, which is formed by the median line of the descending channel and the resistance level of USD 180 per TSLA share.
Buy and sell stocks of the world's biggest publicly-listed companies with CFDs on FXOpen’s trading platform. Open your FXOpen account now or learn more about trading share CFDs with FXOpen.
CFDs are complex instruments and come with a high risk of losing your money.
This article represents the opinion of the Companies operating under the FXOpen brand only. It is not to be construed as an offer, solicitation, or recommendation with respect to products and services provided by the Companies operating under the FXOpen brand, nor is it to be considered financial advice.
👍2
#marketanalysis #MarketNews #tradingforex
AUD/USD Rises Sharply on Inflation News
The Consumer Price Index for Australia was released this morning. According to ForexFactory:
→ CPI in quarterly terms: actual = 1.0%, expected = 0.8%, previous value = 0.6%;
→ CPI in annual terms: actual = 3.5%, expected = 3.4%, previous value = 3.4%.
Rising inflation figures suggest that the Reserve Bank of Australia's tight monetary policy may continue beyond expectations - which is why the Australian dollar has jumped higher relative to other currencies.
Thus, from the minimum of the year against the US dollar, recorded on April 19, the Ausssie rose in price by more than 2%.
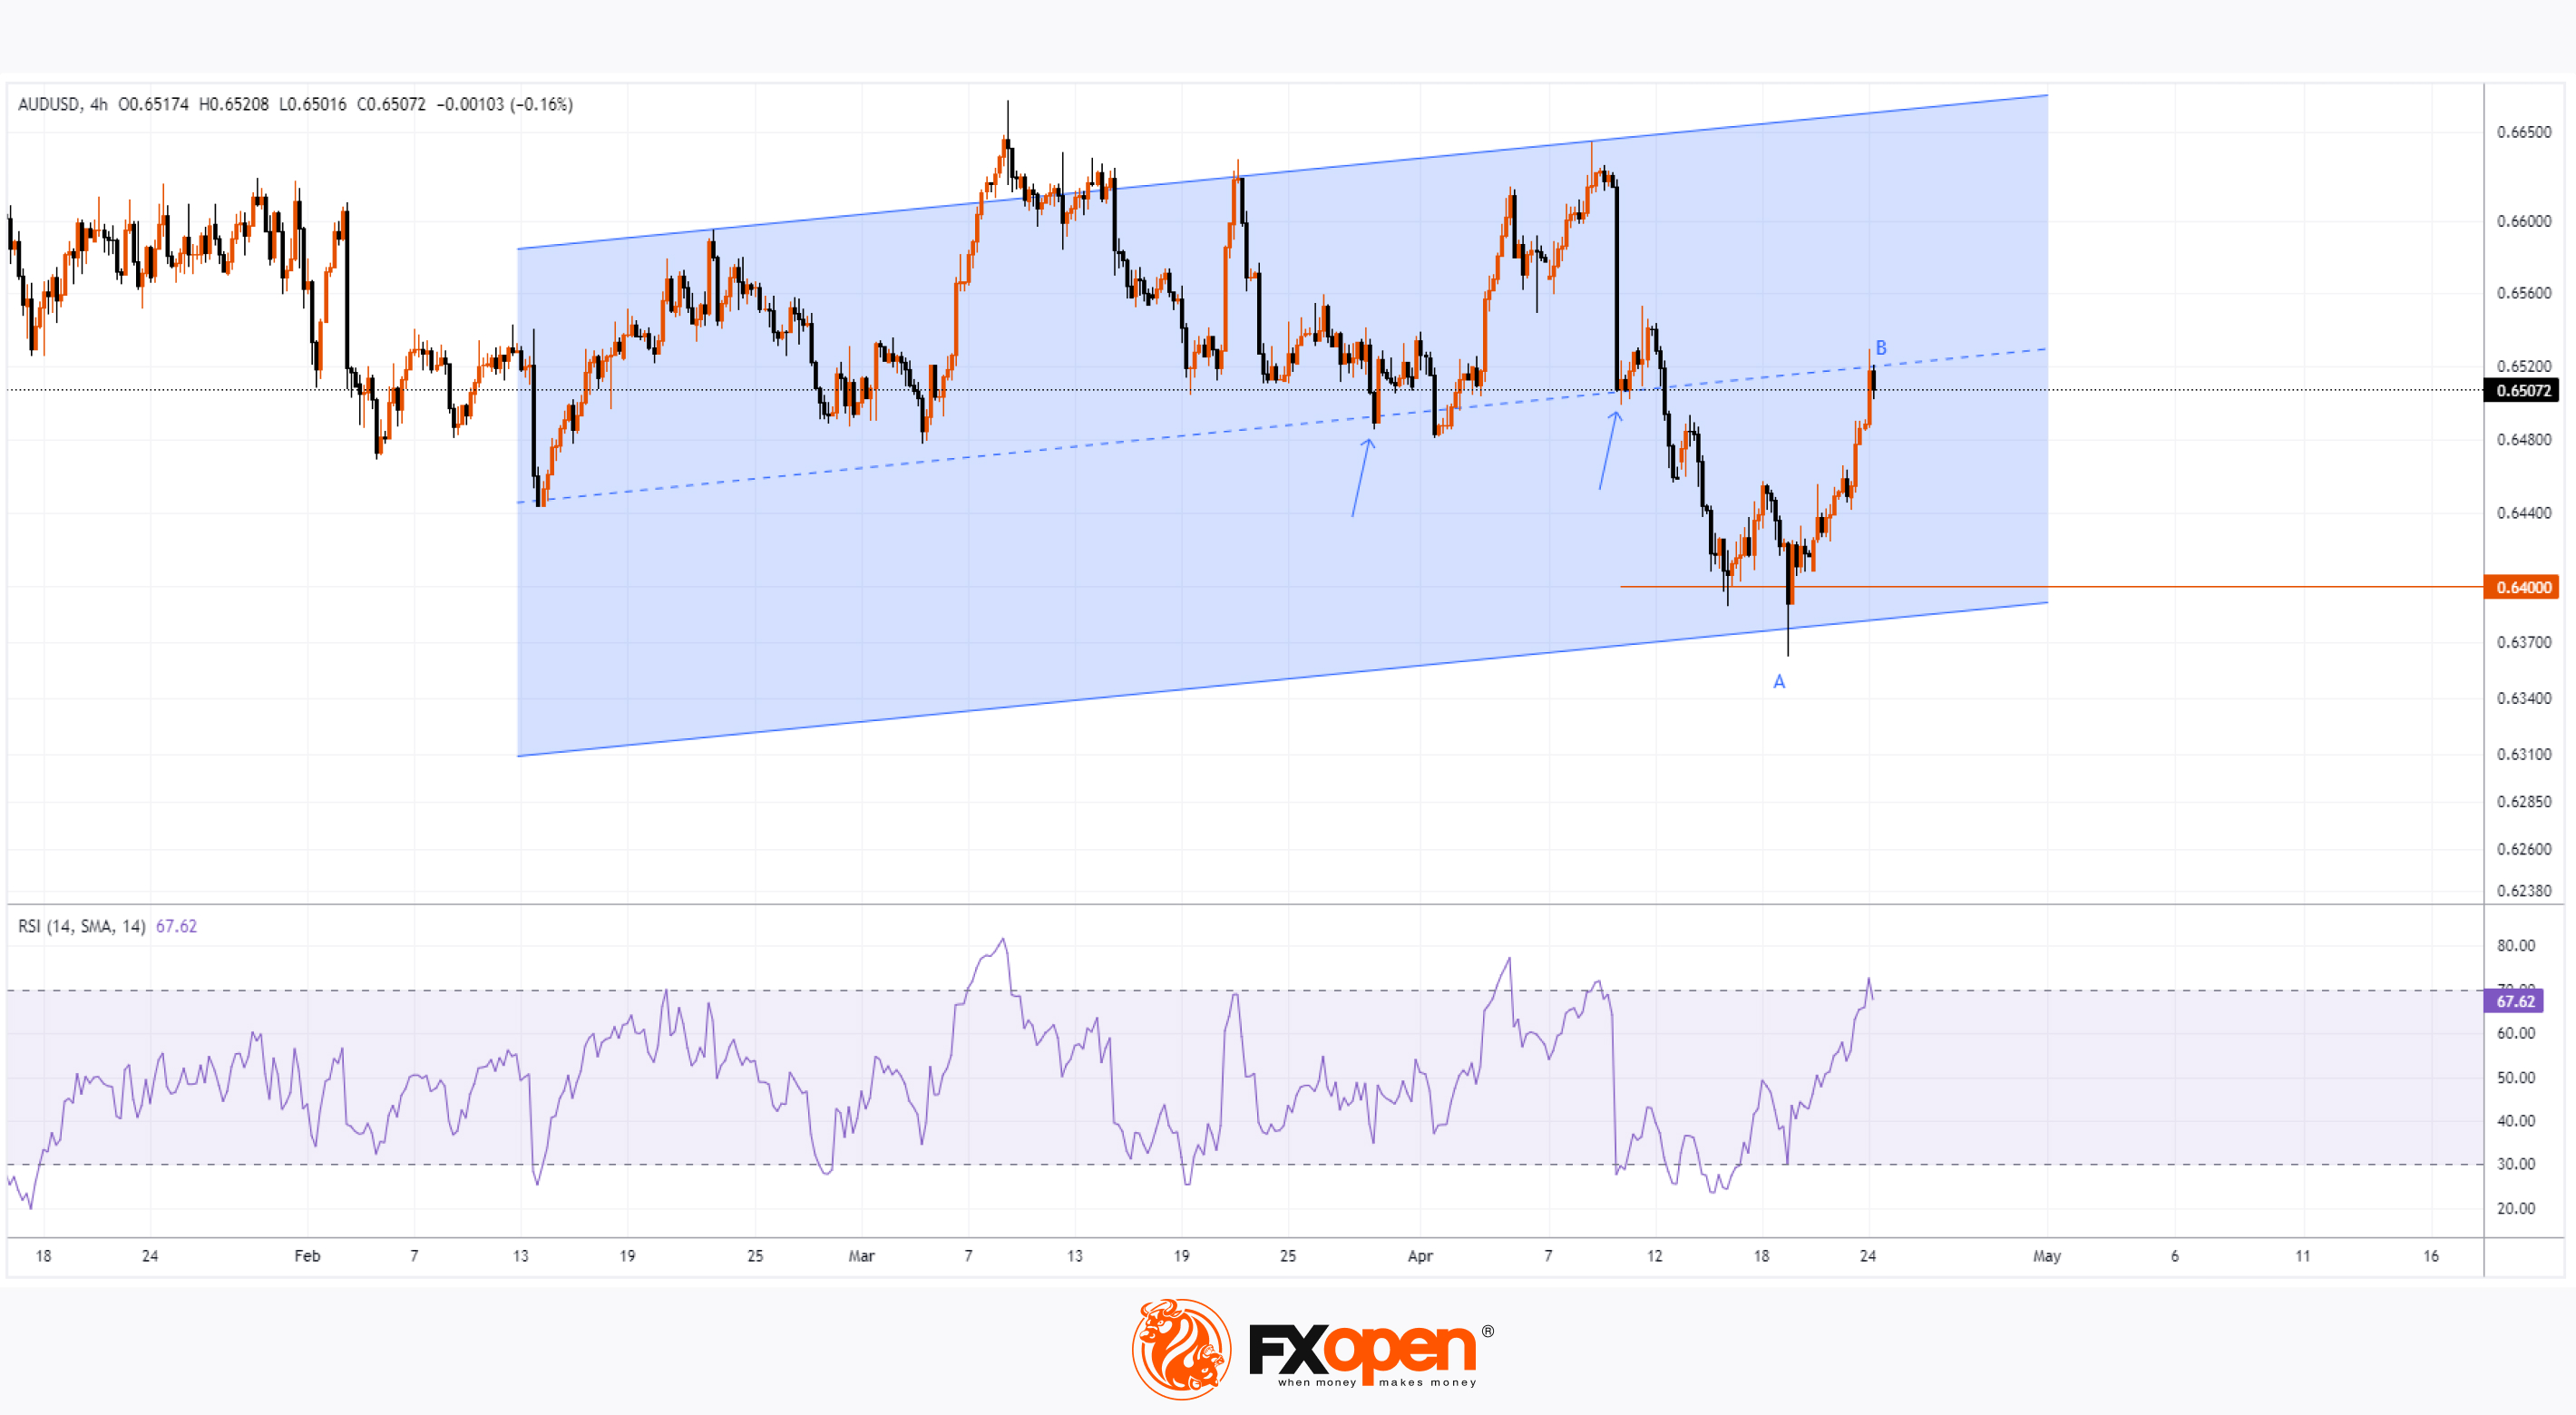
Technical analysis of the AUD/USD chart today shows that:
→ the price has reached the median of the ascending channel. Previously, this line served as support (as shown by the arrows), so there is reason to believe that it will provide resistance after rapid growth;
→ at the same time, the key support appears to be the level of 0.64, where the lower border of the channel lies;
→ the RSI indicator is in the overbought zone.
It is possible that in the short term there will be a correction after a sharp increase in the price of AUD/USD — for example, by 50% of the A→B impulse.
And to assess the long-term outlook, the upcoming release of important data for the United States will provide valuable information:
→ US GDP, tomorrow at 15:30 GMT+3
→ Personal Consumption Expenditures (PCE) USA, on Friday at 15:30 GMT+3.
Trade over 50 forex markets 24 hours a day with FXOpen. Take advantage of low commissions, deep liquidity, and spreads from 0.0 pips. Open your FXOpen account now or learn more about trading forex with FXOpen.
CFDs are complex instruments and come with a high risk of losing your money.
This article represents the opinion of the Companies operating under the FXOpen brand only. It is not to be construed as an offer, solicitation, or recommendation with respect to products and services provided by the Companies operating under the FXOpen brand, nor is it to be considered financial advice.
AUD/USD Rises Sharply on Inflation News
The Consumer Price Index for Australia was released this morning. According to ForexFactory:
→ CPI in quarterly terms: actual = 1.0%, expected = 0.8%, previous value = 0.6%;
→ CPI in annual terms: actual = 3.5%, expected = 3.4%, previous value = 3.4%.
Rising inflation figures suggest that the Reserve Bank of Australia's tight monetary policy may continue beyond expectations - which is why the Australian dollar has jumped higher relative to other currencies.
Thus, from the minimum of the year against the US dollar, recorded on April 19, the Ausssie rose in price by more than 2%.
Technical analysis of the AUD/USD chart today shows that:
→ the price has reached the median of the ascending channel. Previously, this line served as support (as shown by the arrows), so there is reason to believe that it will provide resistance after rapid growth;
→ at the same time, the key support appears to be the level of 0.64, where the lower border of the channel lies;
→ the RSI indicator is in the overbought zone.
It is possible that in the short term there will be a correction after a sharp increase in the price of AUD/USD — for example, by 50% of the A→B impulse.
And to assess the long-term outlook, the upcoming release of important data for the United States will provide valuable information:
→ US GDP, tomorrow at 15:30 GMT+3
→ Personal Consumption Expenditures (PCE) USA, on Friday at 15:30 GMT+3.
Trade over 50 forex markets 24 hours a day with FXOpen. Take advantage of low commissions, deep liquidity, and spreads from 0.0 pips. Open your FXOpen account now or learn more about trading forex with FXOpen.
CFDs are complex instruments and come with a high risk of losing your money.
This article represents the opinion of the Companies operating under the FXOpen brand only. It is not to be construed as an offer, solicitation, or recommendation with respect to products and services provided by the Companies operating under the FXOpen brand, nor is it to be considered financial advice.
👍2
#marketanalysis #MarketNews #USDJPY
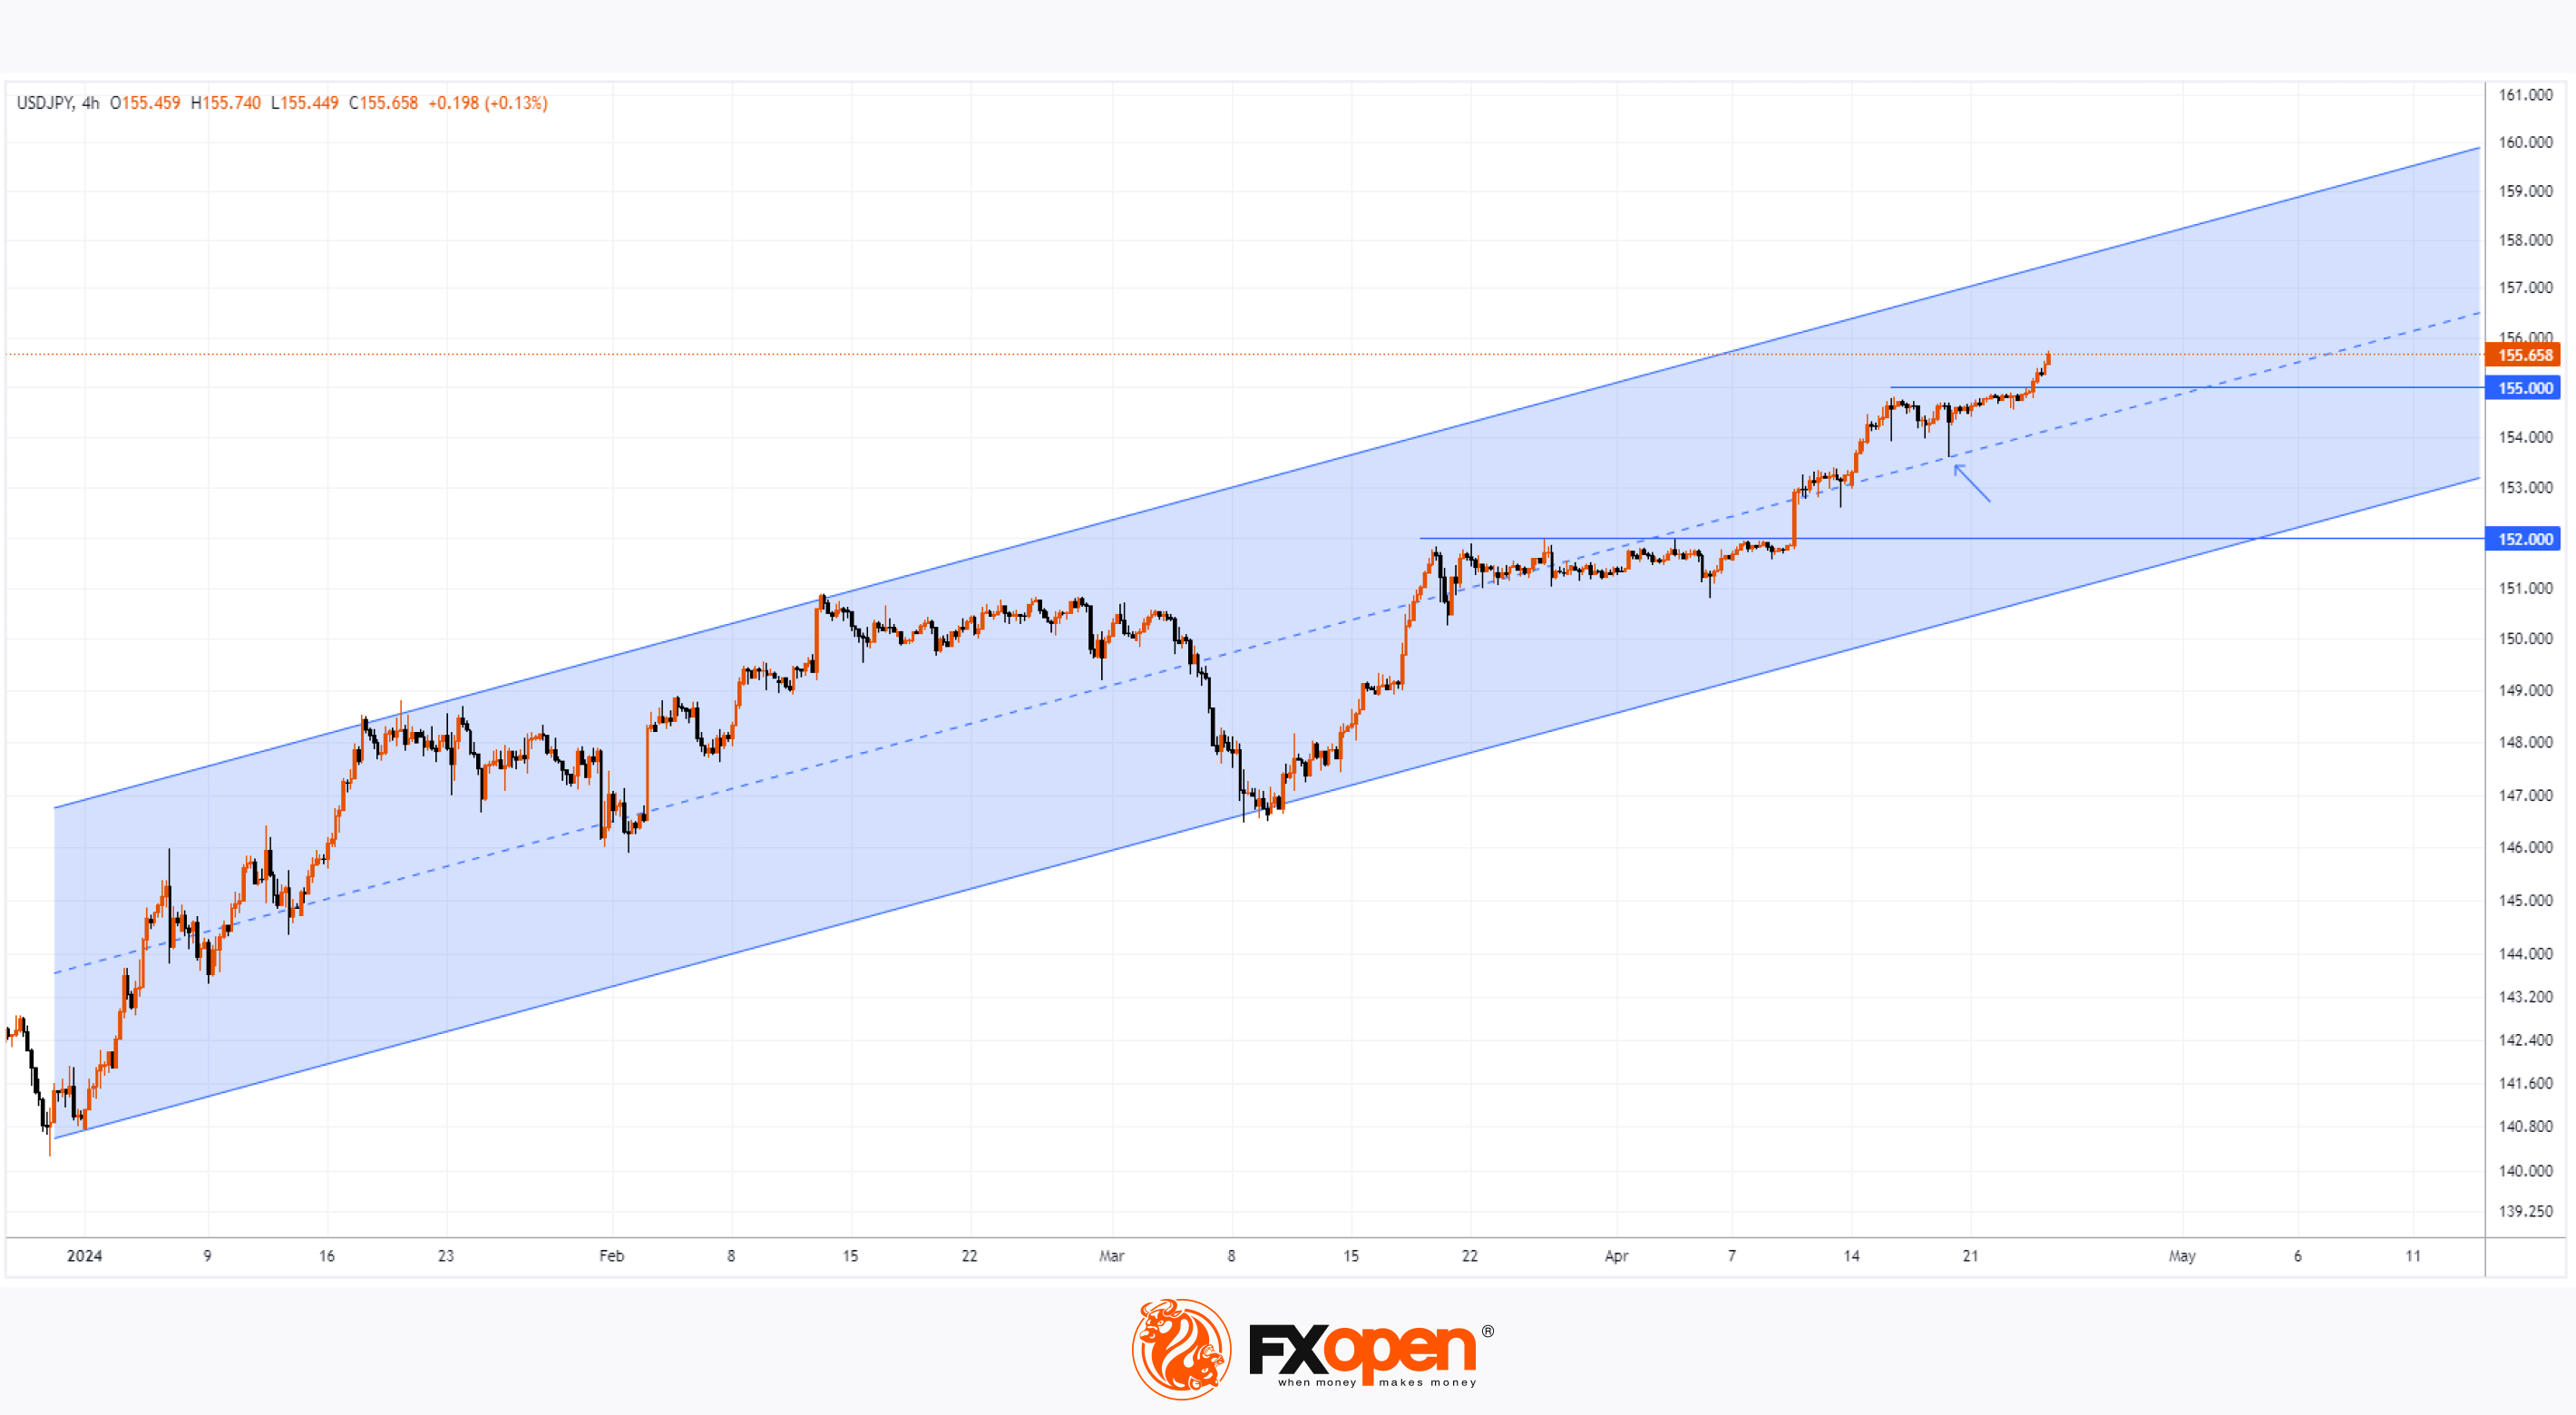
USD/JPY Analysis: The Rate Exceeds The Level of 155 Yen Per US Dollar
Today, the price of USD/JPY once again renewed its 34-year high, exceeding the level of 155 yen per dollar, which put pressure on the current authorities.
According to Reuters, officials are trying to maintain calm in the market.
"We will closely monitor market movements and respond accordingly," Finance Minister Shunichi Suzuki told parliament on Thursday as an opposition lawmaker called on him to intervene in the foreign exchange market.
Chief Cabinet Secretary Yoshimasa Hayashi confirmed that the Japanese authorities are ready to take action as necessary: "It is important that exchange rates move steadily, reflecting fundamental data. Excessive volatility is undesirable." He declined to comment on the yen's recent movements or the possibility of currency intervention.
As technical analysis of the USD/JPY chart shows:
→ The price moves within the ascending channel (shown in blue), which has been in effect since the beginning of 2024.
→ The long lower shadow on the candle on April 19 (shown by the arrow) marked a test of the median line, which acts as support for the price.
→ Pay attention to the nature of the growth after the breakdown of the level of 152 yen per dollar, in the area of which the 2022 maximum was recorded. The price did not test this level after the breakout, indicating the strength of demand. If bullish sentiment remains as stable, the price of USD/JPY may continue to rise towards the upper border of the ascending channel. But everything can change the fundamental background.
Market participants' attention is now focused on the Bank of Japan's interest rate decision tomorrow. Although analysts expect rates to remain unchanged, according to ForexFactory, it is possible that announcements could be sharp enough to dramatically change the situation for the extremely weakened yen.
Trade over 50 forex markets 24 hours a day with FXOpen. Take advantage of low commissions, deep liquidity, and spreads from 0.0 pips. Open your FXOpen account now or learn more about trading forex with FXOpen.
CFDs are complex instruments and come with a high risk of losing your money.
This article represents the opinion of the Companies operating under the FXOpen brand only. It is not to be construed as an offer, solicitation, or recommendation with respect to products and services provided by the Companies operating under the FXOpen brand, nor is it to be considered financial advice.
USD/JPY Analysis: The Rate Exceeds The Level of 155 Yen Per US Dollar
Today, the price of USD/JPY once again renewed its 34-year high, exceeding the level of 155 yen per dollar, which put pressure on the current authorities.
According to Reuters, officials are trying to maintain calm in the market.
"We will closely monitor market movements and respond accordingly," Finance Minister Shunichi Suzuki told parliament on Thursday as an opposition lawmaker called on him to intervene in the foreign exchange market.
Chief Cabinet Secretary Yoshimasa Hayashi confirmed that the Japanese authorities are ready to take action as necessary: "It is important that exchange rates move steadily, reflecting fundamental data. Excessive volatility is undesirable." He declined to comment on the yen's recent movements or the possibility of currency intervention.
As technical analysis of the USD/JPY chart shows:
→ The price moves within the ascending channel (shown in blue), which has been in effect since the beginning of 2024.
→ The long lower shadow on the candle on April 19 (shown by the arrow) marked a test of the median line, which acts as support for the price.
→ Pay attention to the nature of the growth after the breakdown of the level of 152 yen per dollar, in the area of which the 2022 maximum was recorded. The price did not test this level after the breakout, indicating the strength of demand. If bullish sentiment remains as stable, the price of USD/JPY may continue to rise towards the upper border of the ascending channel. But everything can change the fundamental background.
Market participants' attention is now focused on the Bank of Japan's interest rate decision tomorrow. Although analysts expect rates to remain unchanged, according to ForexFactory, it is possible that announcements could be sharp enough to dramatically change the situation for the extremely weakened yen.
Trade over 50 forex markets 24 hours a day with FXOpen. Take advantage of low commissions, deep liquidity, and spreads from 0.0 pips. Open your FXOpen account now or learn more about trading forex with FXOpen.
CFDs are complex instruments and come with a high risk of losing your money.
This article represents the opinion of the Companies operating under the FXOpen brand only. It is not to be construed as an offer, solicitation, or recommendation with respect to products and services provided by the Companies operating under the FXOpen brand, nor is it to be considered financial advice.
👍2
#marketanalysis #stockmarket #stocktrading #meta
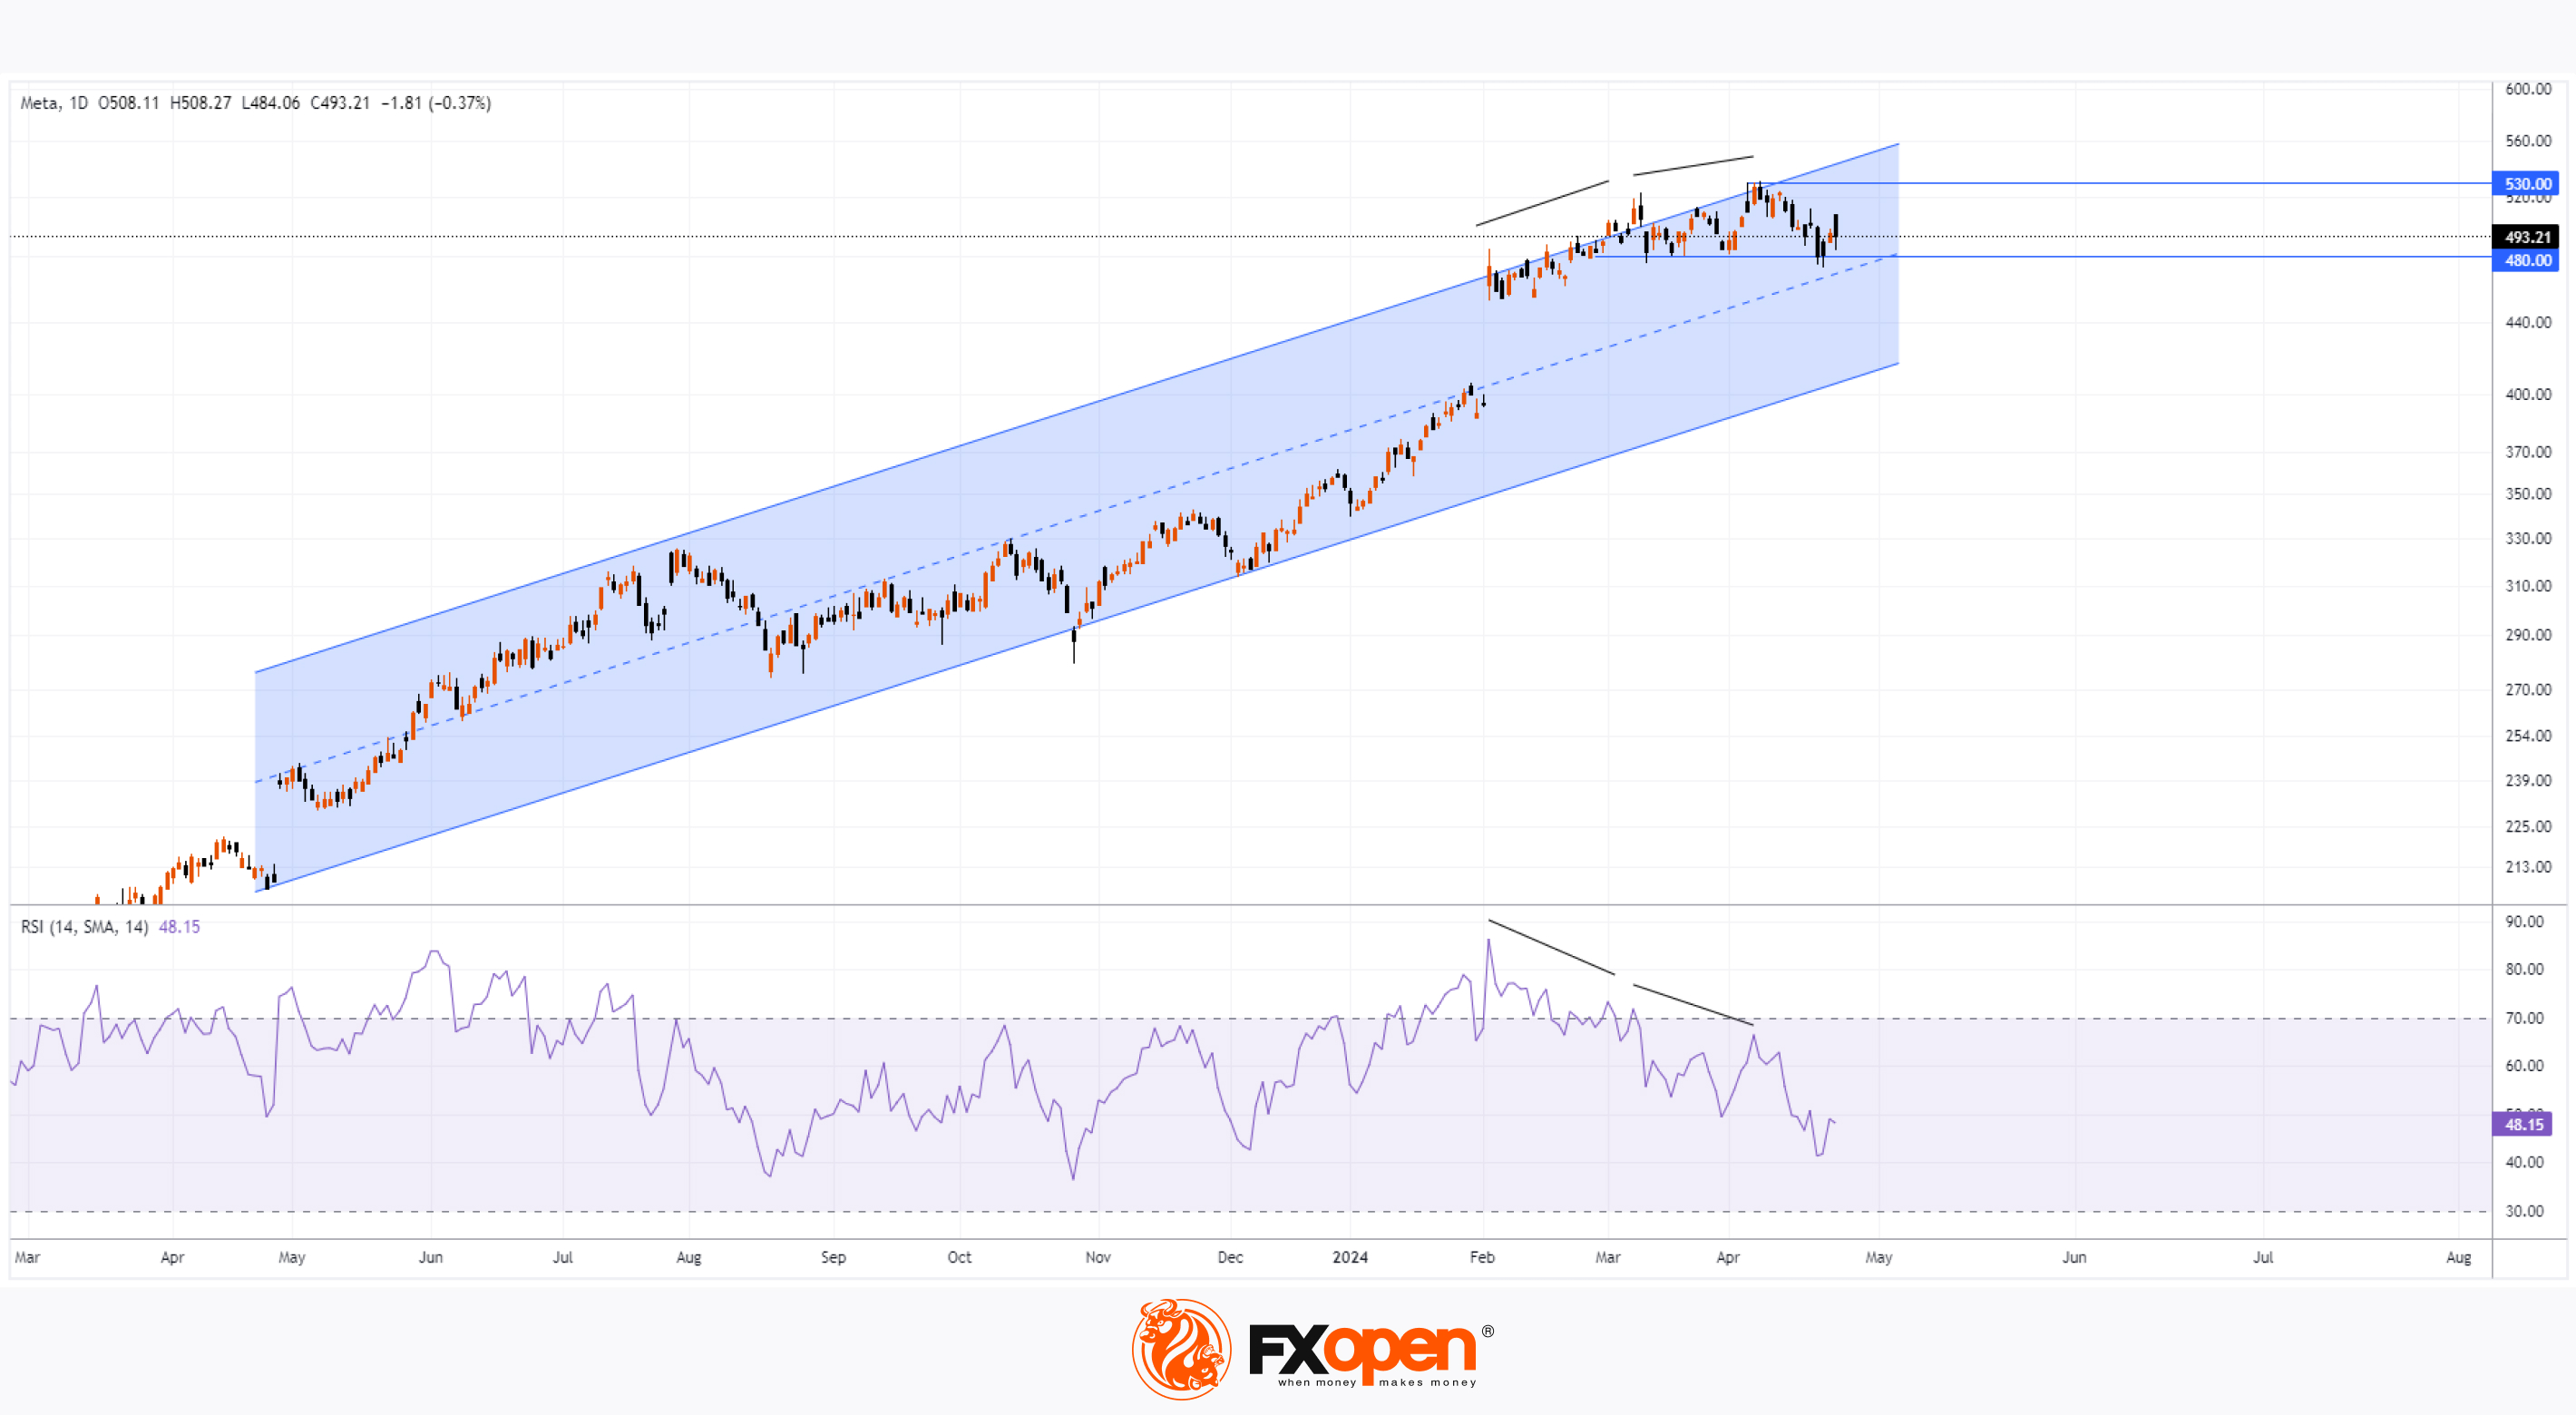
META Share Price Collapses after Publication of Quarterly Report
Just yesterday, META's stock price closed at USD 493.50, up approximately 40% since the start of 2024 and up nearly 300% since the start of 2023.
However, following the release of Meta's quarterly report, its shares plummeted to USD 400 in post-market trading, representing a decline of more than -15%.
It is noteworthy that the report exceeded expectations in some of the main indicators:
→ earnings per share: actual = USD 4.70, forecast = USD 4.32;
→ revenue: actual = USD 36.4 billion, forecast = USD 36.1 billion.
However, investors were disappointed by plans for the coming months, as Meta said second-quarter revenue would be between USD 36.5 billion and USD 39 billion, below the average estimate of USD 38.24 billion. This could be due to increased investment in developing AI-based products , which do not yet generate income.
At pre-market today, the META share price is around USD 418.
The technical analysis of the META stock chart shows:
→ The price still remains within the long-term ascending channel (marked in blue), which describes the price increase in 2023-2024.
→ The pattern of decline from the high around USD 530 towards the lower boundary may be a sign that indicates a potential change in sentiment - optimism is not endless.
→ Divergence on the RSI indicator turned out to be an effective warning for a price decline.
Market participants who bought META stock at prices between USD 480 and USD 530 will find their positions in the red when trading opens today, most likely with a bearish gap — somewhere around the lower boundary of the mentioned channel. So it is safe to assume that any rise in price towards the specified range will represent an opportunity for them to exit the position and minimize losses, which in turn will put pressure on potential attempts by the bulls to resume the multi-month trend. Resistance may also come from the median line of the channel, which today lies right at the lower limit of the range between USD 480 and USD 530.
Buy and sell stocks of the world's biggest publicly-listed companies with CFDs on FXOpen’s trading platform. Open your FXOpen account now or learn more about trading share CFDs with FXOpen.
CFDs are complex instruments and come with a high risk of losing your money.
This article represents the opinion of the Companies operating under the FXOpen brand only. It is not to be construed as an offer, solicitation, or recommendation with respect to products and services provided by the Companies operating under the FXOpen brand, nor is it to be considered financial advice.
META Share Price Collapses after Publication of Quarterly Report
Just yesterday, META's stock price closed at USD 493.50, up approximately 40% since the start of 2024 and up nearly 300% since the start of 2023.
However, following the release of Meta's quarterly report, its shares plummeted to USD 400 in post-market trading, representing a decline of more than -15%.
It is noteworthy that the report exceeded expectations in some of the main indicators:
→ earnings per share: actual = USD 4.70, forecast = USD 4.32;
→ revenue: actual = USD 36.4 billion, forecast = USD 36.1 billion.
However, investors were disappointed by plans for the coming months, as Meta said second-quarter revenue would be between USD 36.5 billion and USD 39 billion, below the average estimate of USD 38.24 billion. This could be due to increased investment in developing AI-based products , which do not yet generate income.
At pre-market today, the META share price is around USD 418.
The technical analysis of the META stock chart shows:
→ The price still remains within the long-term ascending channel (marked in blue), which describes the price increase in 2023-2024.
→ The pattern of decline from the high around USD 530 towards the lower boundary may be a sign that indicates a potential change in sentiment - optimism is not endless.
→ Divergence on the RSI indicator turned out to be an effective warning for a price decline.
Market participants who bought META stock at prices between USD 480 and USD 530 will find their positions in the red when trading opens today, most likely with a bearish gap — somewhere around the lower boundary of the mentioned channel. So it is safe to assume that any rise in price towards the specified range will represent an opportunity for them to exit the position and minimize losses, which in turn will put pressure on potential attempts by the bulls to resume the multi-month trend. Resistance may also come from the median line of the channel, which today lies right at the lower limit of the range between USD 480 and USD 530.
Buy and sell stocks of the world's biggest publicly-listed companies with CFDs on FXOpen’s trading platform. Open your FXOpen account now or learn more about trading share CFDs with FXOpen.
CFDs are complex instruments and come with a high risk of losing your money.
This article represents the opinion of the Companies operating under the FXOpen brand only. It is not to be construed as an offer, solicitation, or recommendation with respect to products and services provided by the Companies operating under the FXOpen brand, nor is it to be considered financial advice.
👍2
#sp500 #stockmarket #stocktrading
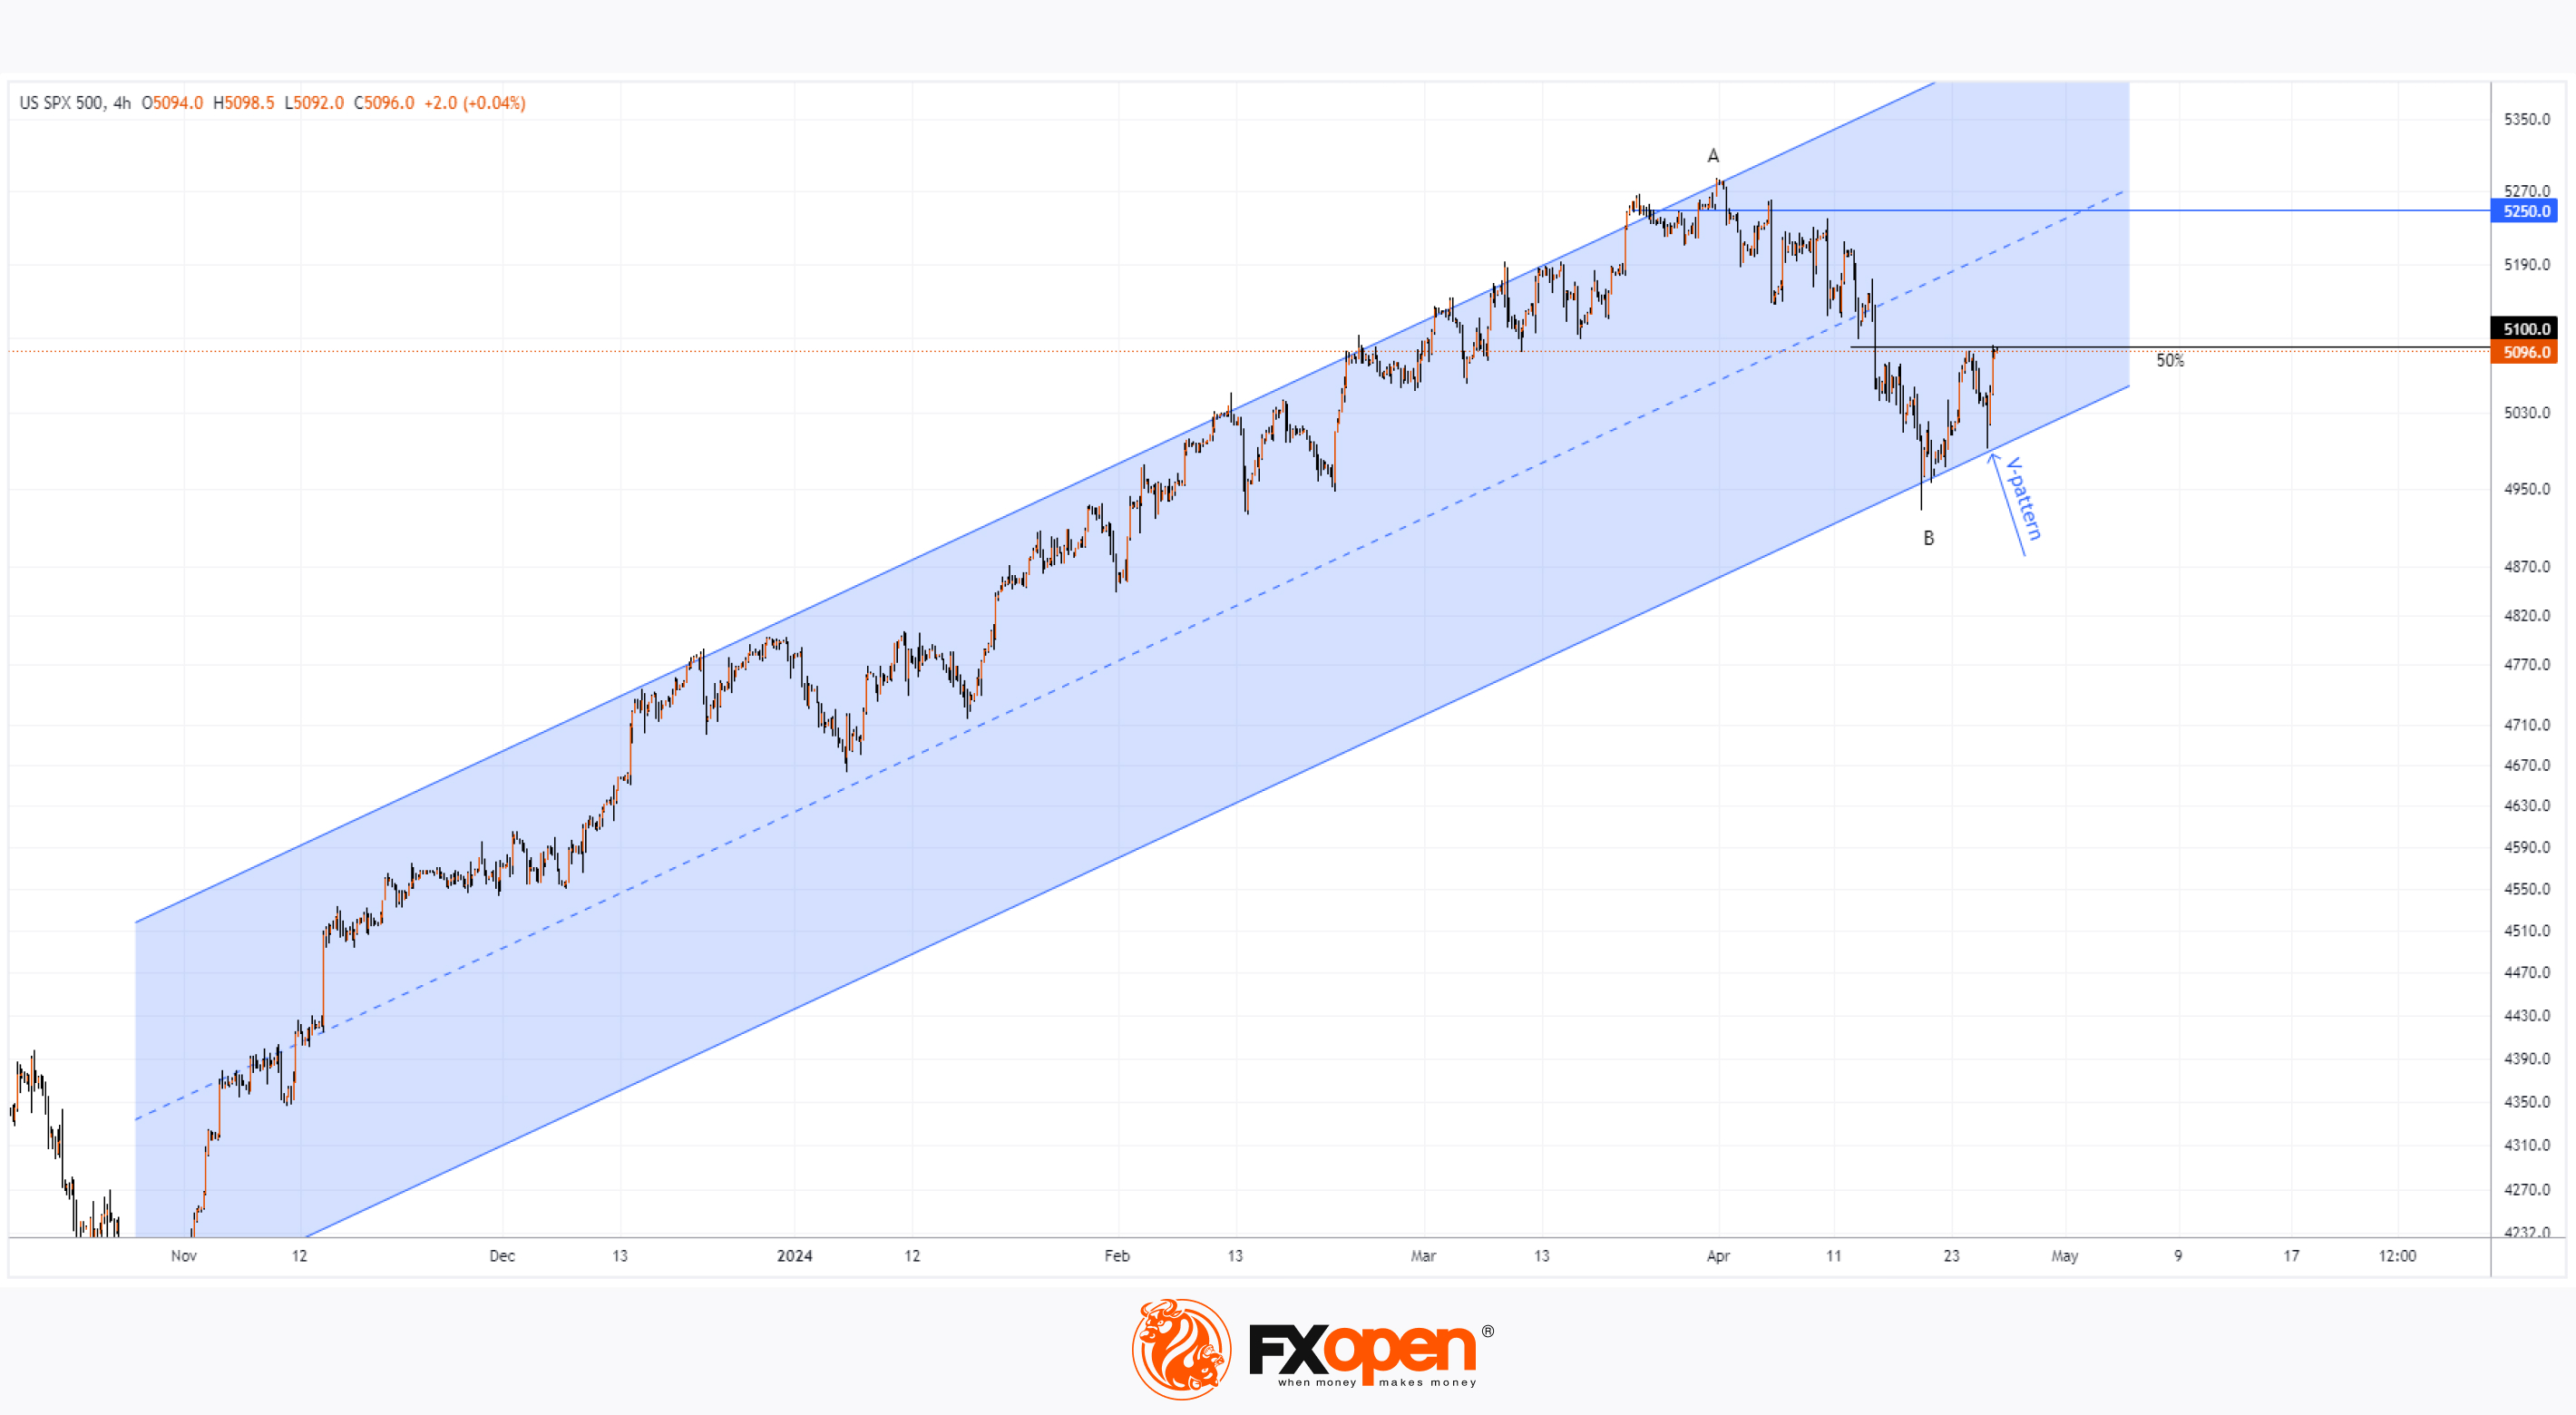
S&P 500 Rebounds after Negative GDP News
Data released yesterday showed US GDP growth slowed to 1.6% in the first quarter of the year. According to ForexFactory: forecast = 2.2%, past value = 2.4%.
Reaction to the news sent the S&P 500 mini stock index (US SPX 500 mini on FXOpen) sharply lower as market participants may fear a period of stagflation — a period when economic growth slows and inflation remains stubbornly high.
Speaking at the Economic Club of New York on Tuesday, JPMorgan Chase CEO Jamie Dimon warned investors: “Stagflation has the negative effect of lack of growth and inflation. It hurts profits, consumers and jobs. And yes, I think there is a chance it could happen again,” he said.
However, this morning the 4-hour chart of the US SPX 500 mini shows that the stock market is recovering thanks to gains in Google and Microsoft, which reported strongly after the close of the main trading session.
According to the technical analysis of the US SPX 500 mini:
→ the price forms a V-shaped rebound pattern from the lower border of the ascending channel (shown in blue)
→ this rebound can also be considered as a test of the April 19-22 range and the market’s “unpreparedness” to fall below the psychological mark of 5,000 points.
That is, the situation looks like a correction to the lower border of the channel as part of the 2024 rally, after which the logical development of the scenario would be an attempt by the bulls to resume the upward trend and try to attack the level of 5,250 again. How successful will the attempt be?
From a technical point of view, valuable information about the seriousness of the bulls' intentions can be provided by the ability of the US SPX 500 price to return to the upper half of the channel and consolidate above the resistance at 5100, which approximately corresponds to the 50% distance from the bearish A→B impulse.
From a fundamental analysis point of view, of course, we need signs that the US economy will avoid stagflation. According to an analysis by Ben Carlson of Ritholtz Wealth Management, between 1966 and 1981, a period spanning much of the stagflation era, investors in the US stock market lost more than 35% of their capital, CNN writes.
Trade global index CFDs with zero commission and tight spreads. Open your FXOpen account now or learn more about trading index CFDs with FXOpen.
CFDs are complex instruments and come with a high risk of losing your money.
This article represents the opinion of the Companies operating under the FXOpen brand only. It is not to be construed as an offer, solicitation, or recommendation with respect to products and services provided by the Companies operating under the FXOpen brand, nor is it to be considered financial advice.
S&P 500 Rebounds after Negative GDP News
Data released yesterday showed US GDP growth slowed to 1.6% in the first quarter of the year. According to ForexFactory: forecast = 2.2%, past value = 2.4%.
Reaction to the news sent the S&P 500 mini stock index (US SPX 500 mini on FXOpen) sharply lower as market participants may fear a period of stagflation — a period when economic growth slows and inflation remains stubbornly high.
Speaking at the Economic Club of New York on Tuesday, JPMorgan Chase CEO Jamie Dimon warned investors: “Stagflation has the negative effect of lack of growth and inflation. It hurts profits, consumers and jobs. And yes, I think there is a chance it could happen again,” he said.
However, this morning the 4-hour chart of the US SPX 500 mini shows that the stock market is recovering thanks to gains in Google and Microsoft, which reported strongly after the close of the main trading session.
According to the technical analysis of the US SPX 500 mini:
→ the price forms a V-shaped rebound pattern from the lower border of the ascending channel (shown in blue)
→ this rebound can also be considered as a test of the April 19-22 range and the market’s “unpreparedness” to fall below the psychological mark of 5,000 points.
That is, the situation looks like a correction to the lower border of the channel as part of the 2024 rally, after which the logical development of the scenario would be an attempt by the bulls to resume the upward trend and try to attack the level of 5,250 again. How successful will the attempt be?
From a technical point of view, valuable information about the seriousness of the bulls' intentions can be provided by the ability of the US SPX 500 price to return to the upper half of the channel and consolidate above the resistance at 5100, which approximately corresponds to the 50% distance from the bearish A→B impulse.
From a fundamental analysis point of view, of course, we need signs that the US economy will avoid stagflation. According to an analysis by Ben Carlson of Ritholtz Wealth Management, between 1966 and 1981, a period spanning much of the stagflation era, investors in the US stock market lost more than 35% of their capital, CNN writes.
Trade global index CFDs with zero commission and tight spreads. Open your FXOpen account now or learn more about trading index CFDs with FXOpen.
CFDs are complex instruments and come with a high risk of losing your money.
This article represents the opinion of the Companies operating under the FXOpen brand only. It is not to be construed as an offer, solicitation, or recommendation with respect to products and services provided by the Companies operating under the FXOpen brand, nor is it to be considered financial advice.
👍2
#stockmarket #stocktrading #GOOGL
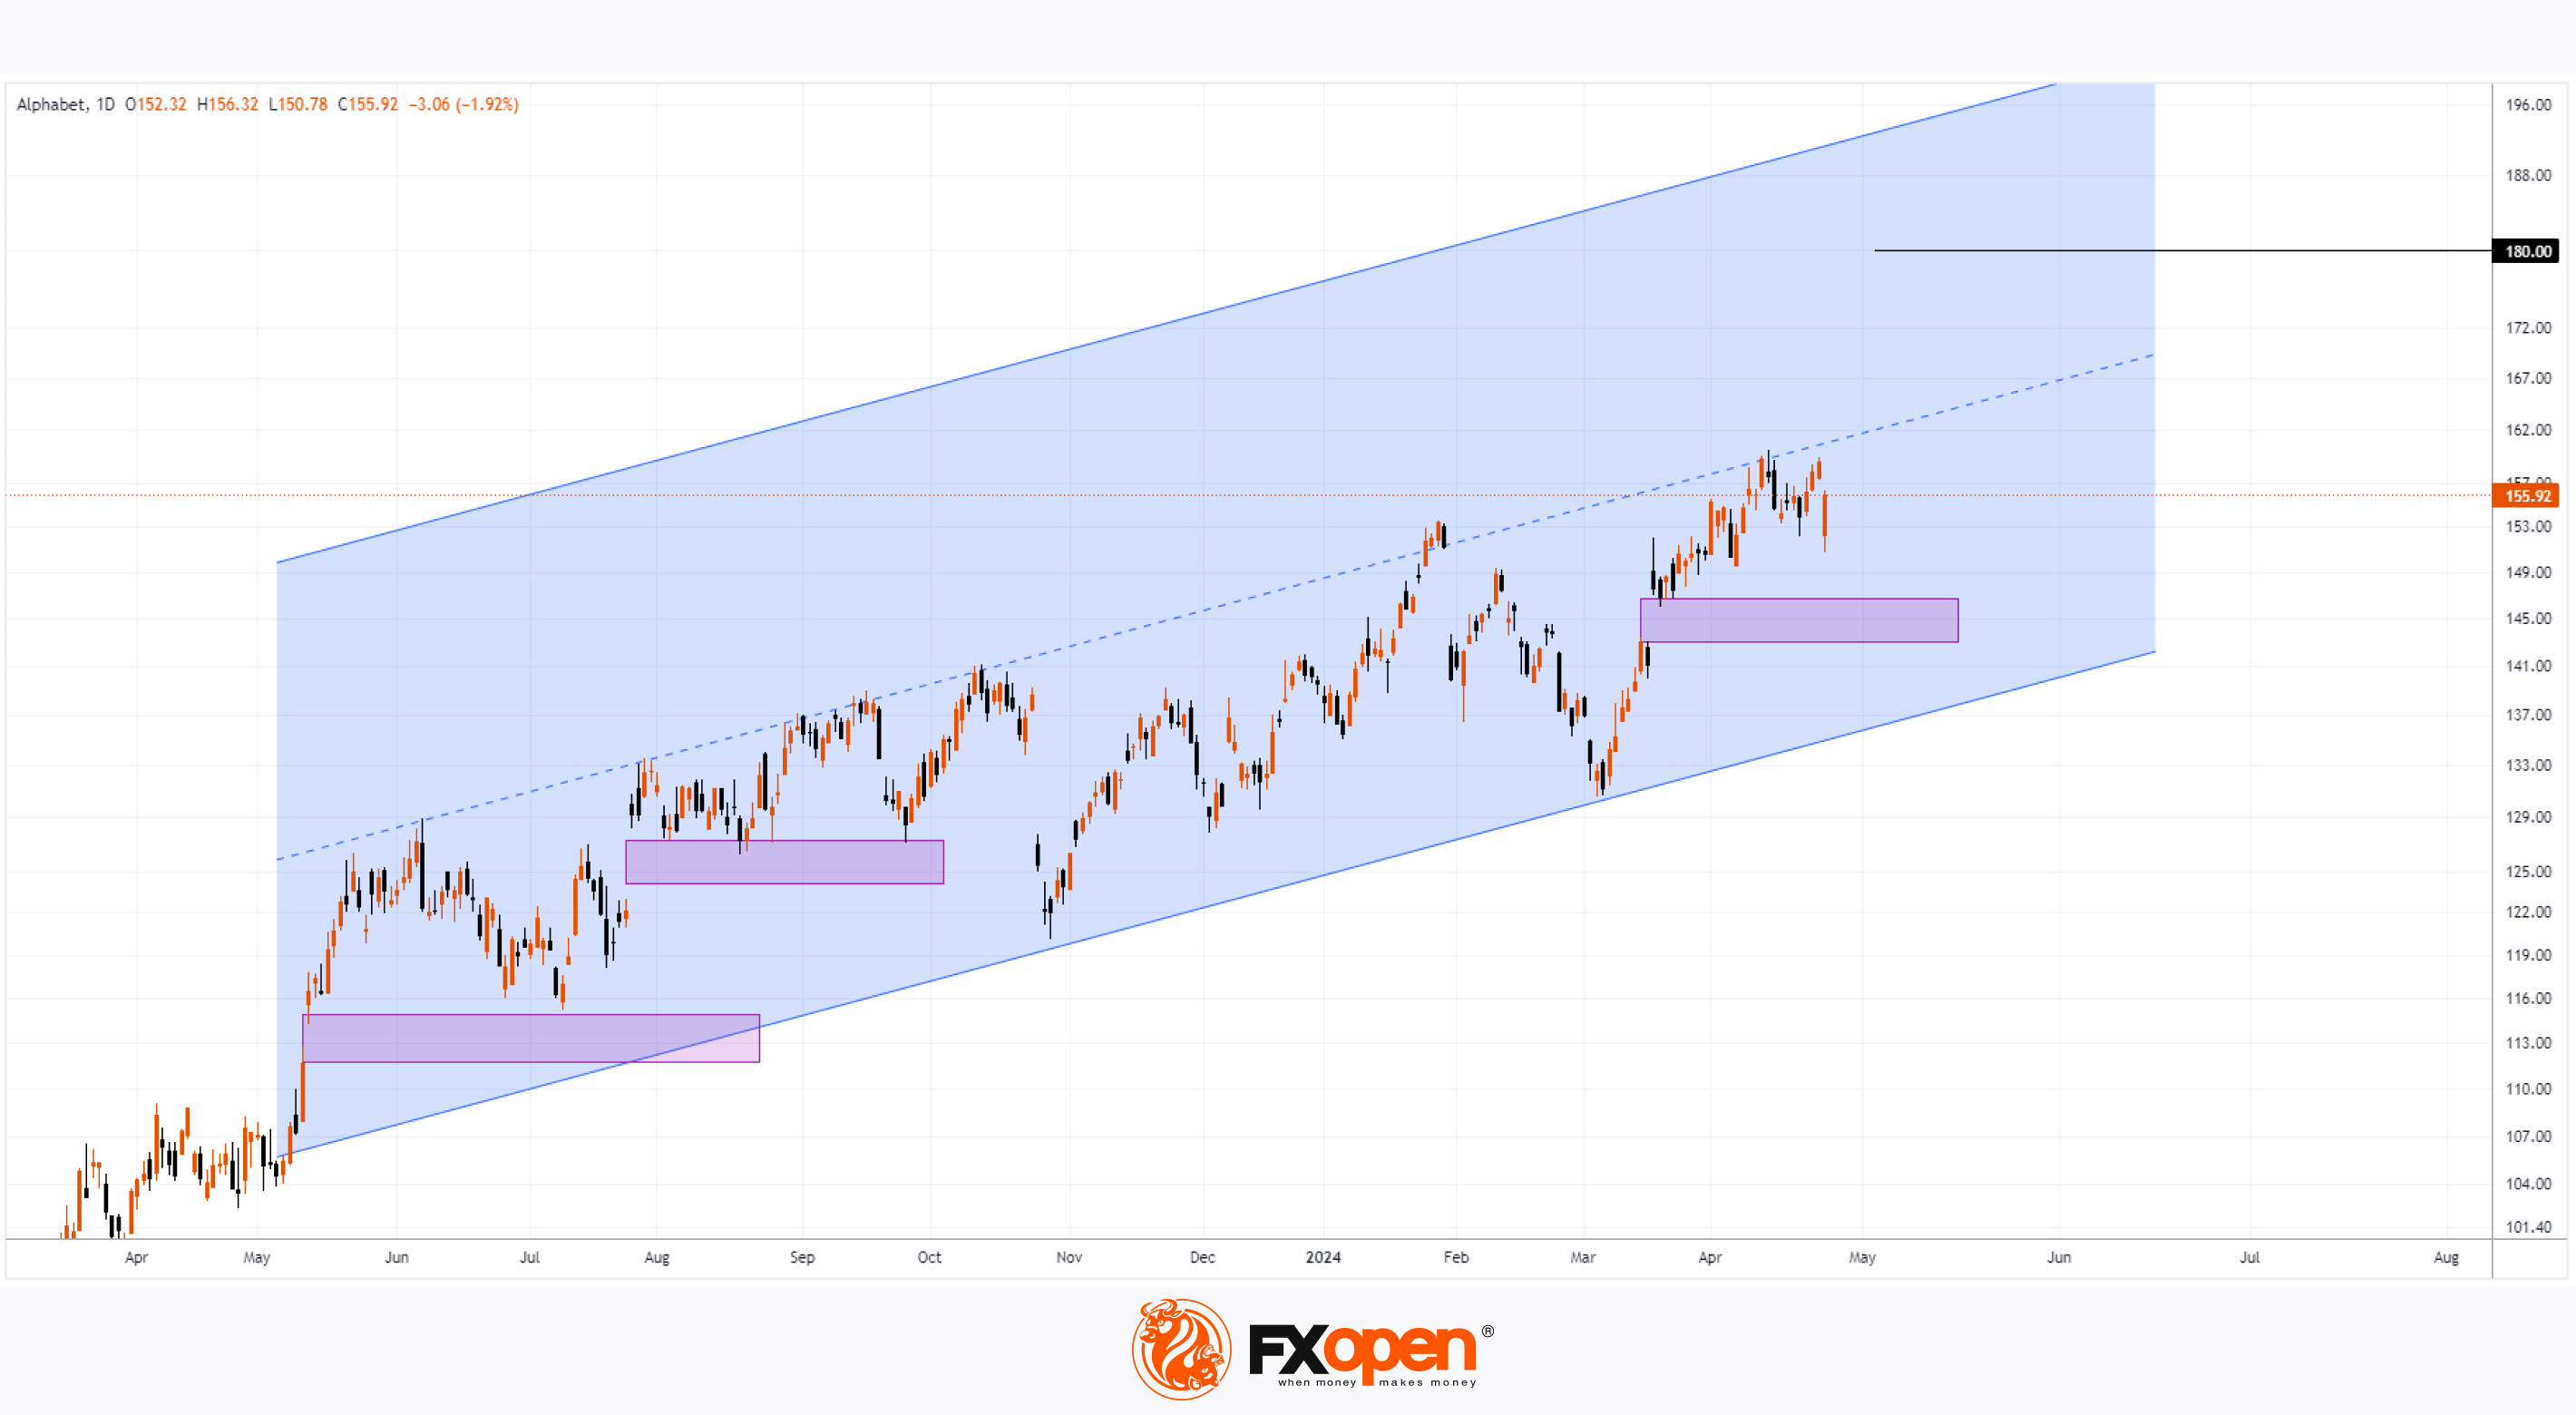
Google Share Price Rose Post-market to a New All-time Record
Yesterday, after the close of the main trading session, a report on activities for the 1st quarter of Alphabet Inc. (Google's parent company) was published. The report was strong, exceeding investors' expectations.
→ Quarterly EPS = USD 1.89 (expected = USD 1.51), which represents a 15% increase year-over-year;
→ gross revenue = USD 80.539 billion (expected = USD 78.73 billion).
It was the fifth straight quarter in which Alphabet beat analysts' expectations on both revenue and profit. But the main surprise was the company’s decision to start paying dividends and increase the amount allocated for share buybacks to USD 70 billion.
According to Benzinga, Alphabet CEO Sundar Pichai made a number of important announcements about the future:
→ The company's combined YouTube and Cloud business revenues will be USD 100 billion in 2024, indicating a growth rate of 25% in each of the next three quarters.
→ Pichai also expressed confidence in Alphabet's ability to manage investments in AI, announcing capital expenditures of USD 12 billion.
As a result, the share price of Alphabet Inc. Class A (GOOGL) surpassed USD 180 in post-market trading, setting a new all-time record. In premarket trading today, GOOGL is trading around USD 176.
According to technical analysis of GOOGL stock price:
→ The ascending channel, in which the price fluctuated during 2023-2024, is now expanding upward. Its upper limit of USD 200 per share could be considered a target for bulls, provided the current positive sentiment continues;
→ Surely, at the opening of today's main trading session, a bullish gap will form on the GOOGL stock price chart, which in the future may serve as an area of support, as it did in the past (as shown by the purple figures).
According to TipRanks, the average analyst price forecast for GOOGL is = USD 167 in 12 months, but given recent events, it would not be surprising to see forecasts revised upward.
Buy and sell stocks of the world's biggest publicly-listed companies with CFDs on FXOpen’s trading platform. Open your FXOpen account now or learn more about trading share CFDs with FXOpen.
CFDs are complex instruments and come with a high risk of losing your money.
This article represents the opinion of the Companies operating under the FXOpen brand only. It is not to be construed as an offer, solicitation, or recommendation with respect to products and services provided by the Companies operating under the FXOpen brand, nor is it to be considered financial advice.
Google Share Price Rose Post-market to a New All-time Record
Yesterday, after the close of the main trading session, a report on activities for the 1st quarter of Alphabet Inc. (Google's parent company) was published. The report was strong, exceeding investors' expectations.
→ Quarterly EPS = USD 1.89 (expected = USD 1.51), which represents a 15% increase year-over-year;
→ gross revenue = USD 80.539 billion (expected = USD 78.73 billion).
It was the fifth straight quarter in which Alphabet beat analysts' expectations on both revenue and profit. But the main surprise was the company’s decision to start paying dividends and increase the amount allocated for share buybacks to USD 70 billion.
According to Benzinga, Alphabet CEO Sundar Pichai made a number of important announcements about the future:
→ The company's combined YouTube and Cloud business revenues will be USD 100 billion in 2024, indicating a growth rate of 25% in each of the next three quarters.
→ Pichai also expressed confidence in Alphabet's ability to manage investments in AI, announcing capital expenditures of USD 12 billion.
As a result, the share price of Alphabet Inc. Class A (GOOGL) surpassed USD 180 in post-market trading, setting a new all-time record. In premarket trading today, GOOGL is trading around USD 176.
According to technical analysis of GOOGL stock price:
→ The ascending channel, in which the price fluctuated during 2023-2024, is now expanding upward. Its upper limit of USD 200 per share could be considered a target for bulls, provided the current positive sentiment continues;
→ Surely, at the opening of today's main trading session, a bullish gap will form on the GOOGL stock price chart, which in the future may serve as an area of support, as it did in the past (as shown by the purple figures).
According to TipRanks, the average analyst price forecast for GOOGL is = USD 167 in 12 months, but given recent events, it would not be surprising to see forecasts revised upward.
Buy and sell stocks of the world's biggest publicly-listed companies with CFDs on FXOpen’s trading platform. Open your FXOpen account now or learn more about trading share CFDs with FXOpen.
CFDs are complex instruments and come with a high risk of losing your money.
This article represents the opinion of the Companies operating under the FXOpen brand only. It is not to be construed as an offer, solicitation, or recommendation with respect to products and services provided by the Companies operating under the FXOpen brand, nor is it to be considered financial advice.
👍2
#USDJPY #tradingtips #MarketNews #marketanalysis
USD/JPY: Rate Falls Rapidly after Exceeding Psychological Mark of 160 Yen Per Dollar
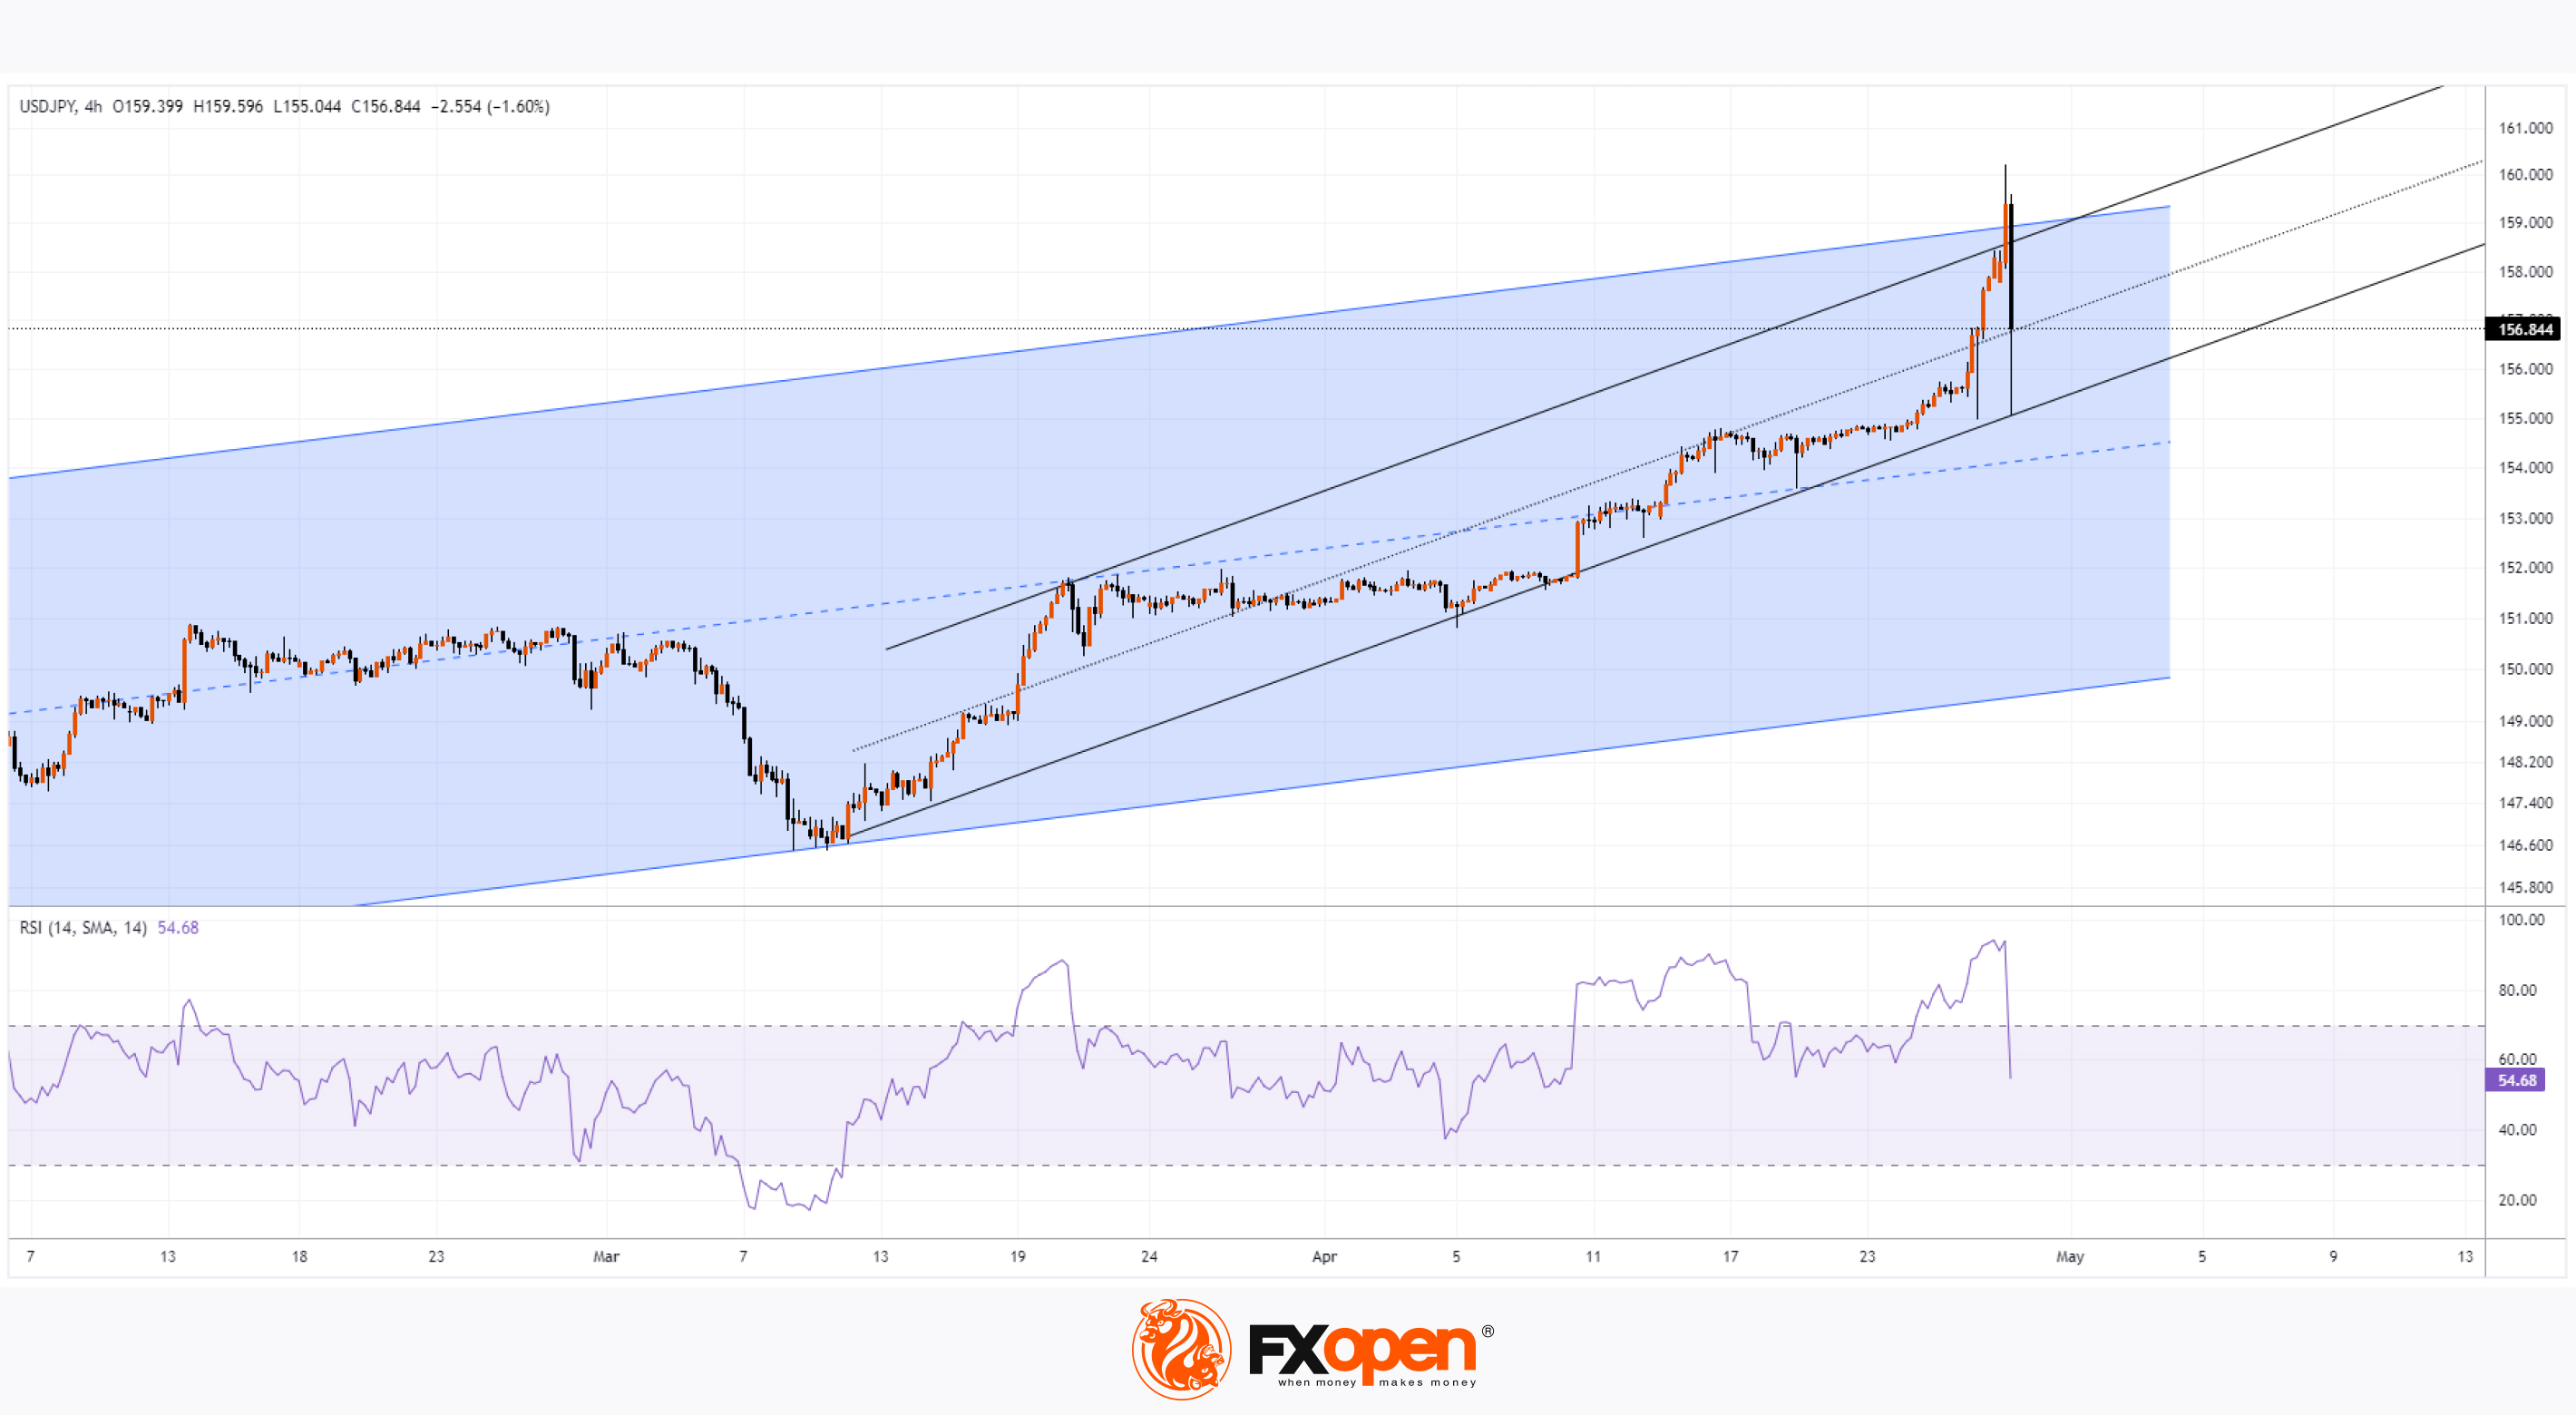
Despite the fact that today is a holiday in Japan, the foreign exchange market is experiencing extreme volatility — wide candles are forming on the USD/JPY chart, and the rate briefly exceeded the psychological level of 160 yen per dollar, reaching a new high in 34 years.
The weakening of the yen in the first hours of trading occurred against the background of the fact that:
→ On Friday, the Bank of Japan decided to leave interest rates at the same level = 0.1%.
→ At the same time, market participants did not hear clear signals from the Bank of Japan that the weakening yen would be supported.
→ On Wednesday, May 1, the Fed will announce its decision on the interest rate. It is also expected to remain unchanged at 5.5%, highlighting the difference in monetary policy between Japan and the United States.
However, shortly after the yen surpassed the psychological level of 160.00, USD/JPY fell sharply to 155.50 and below — traders, according to Reuters, saw signs of intervention from Japanese financial authorities after a 13% increase since the beginning of the year.
Let us recall that Tokyo previously intervened in the foreign exchange market in September and October 2022, when the US dollar exchange rate was about 146.00 and 152.00 yen, respectively.
Technical analysis of the 4-hour USD/JPY chart shows that:
→ the price has exceeded the upper limit of the ascending channel (shown in blue);
→ the price has exceeded the upper limit of a steeper ascending channel, which originates in March (shown in black);
→ the RSI indicator exceeded the value = 93, indicating that the market was extremely overbought.
Having reached the lower black line, the USD/JPY rate bounced from it to the black median line — thus, a decrease of 2.5% took only 1 hour.
If official statements follow soon, they may confirm the assumption that the 160 yen per US dollar level is a tolerance limit that Tokyo cannot afford to allow to be breached. Such statements have the potential to change the balance of power in the market, cooling the ardor of the bulls.
It is possible that the peak reached this morning will be a peak that can hold for many months.
Trade over 50 forex markets 24 hours a day with FXOpen. Take advantage of low commissions, deep liquidity, and spreads from 0.0 pips. Open your FXOpen account now or learn more about trading forex with FXOpen.
CFDs are complex instruments and come with a high risk of losing your money.
This article represents the opinion of the Companies operating under the FXOpen brand only. It is not to be construed as an offer, solicitation, or recommendation with respect to products and services provided by the Companies operating under the FXOpen brand, nor is it to be considered financial advice.
USD/JPY: Rate Falls Rapidly after Exceeding Psychological Mark of 160 Yen Per Dollar
Despite the fact that today is a holiday in Japan, the foreign exchange market is experiencing extreme volatility — wide candles are forming on the USD/JPY chart, and the rate briefly exceeded the psychological level of 160 yen per dollar, reaching a new high in 34 years.
The weakening of the yen in the first hours of trading occurred against the background of the fact that:
→ On Friday, the Bank of Japan decided to leave interest rates at the same level = 0.1%.
→ At the same time, market participants did not hear clear signals from the Bank of Japan that the weakening yen would be supported.
→ On Wednesday, May 1, the Fed will announce its decision on the interest rate. It is also expected to remain unchanged at 5.5%, highlighting the difference in monetary policy between Japan and the United States.
However, shortly after the yen surpassed the psychological level of 160.00, USD/JPY fell sharply to 155.50 and below — traders, according to Reuters, saw signs of intervention from Japanese financial authorities after a 13% increase since the beginning of the year.
Let us recall that Tokyo previously intervened in the foreign exchange market in September and October 2022, when the US dollar exchange rate was about 146.00 and 152.00 yen, respectively.
Technical analysis of the 4-hour USD/JPY chart shows that:
→ the price has exceeded the upper limit of the ascending channel (shown in blue);
→ the price has exceeded the upper limit of a steeper ascending channel, which originates in March (shown in black);
→ the RSI indicator exceeded the value = 93, indicating that the market was extremely overbought.
Having reached the lower black line, the USD/JPY rate bounced from it to the black median line — thus, a decrease of 2.5% took only 1 hour.
If official statements follow soon, they may confirm the assumption that the 160 yen per US dollar level is a tolerance limit that Tokyo cannot afford to allow to be breached. Such statements have the potential to change the balance of power in the market, cooling the ardor of the bulls.
It is possible that the peak reached this morning will be a peak that can hold for many months.
Trade over 50 forex markets 24 hours a day with FXOpen. Take advantage of low commissions, deep liquidity, and spreads from 0.0 pips. Open your FXOpen account now or learn more about trading forex with FXOpen.
CFDs are complex instruments and come with a high risk of losing your money.
This article represents the opinion of the Companies operating under the FXOpen brand only. It is not to be construed as an offer, solicitation, or recommendation with respect to products and services provided by the Companies operating under the FXOpen brand, nor is it to be considered financial advice.
👍3
#stockmarket #MarketNews #stocks
CRON Stock Price Forms a Bullish Pattern ahead of the Report
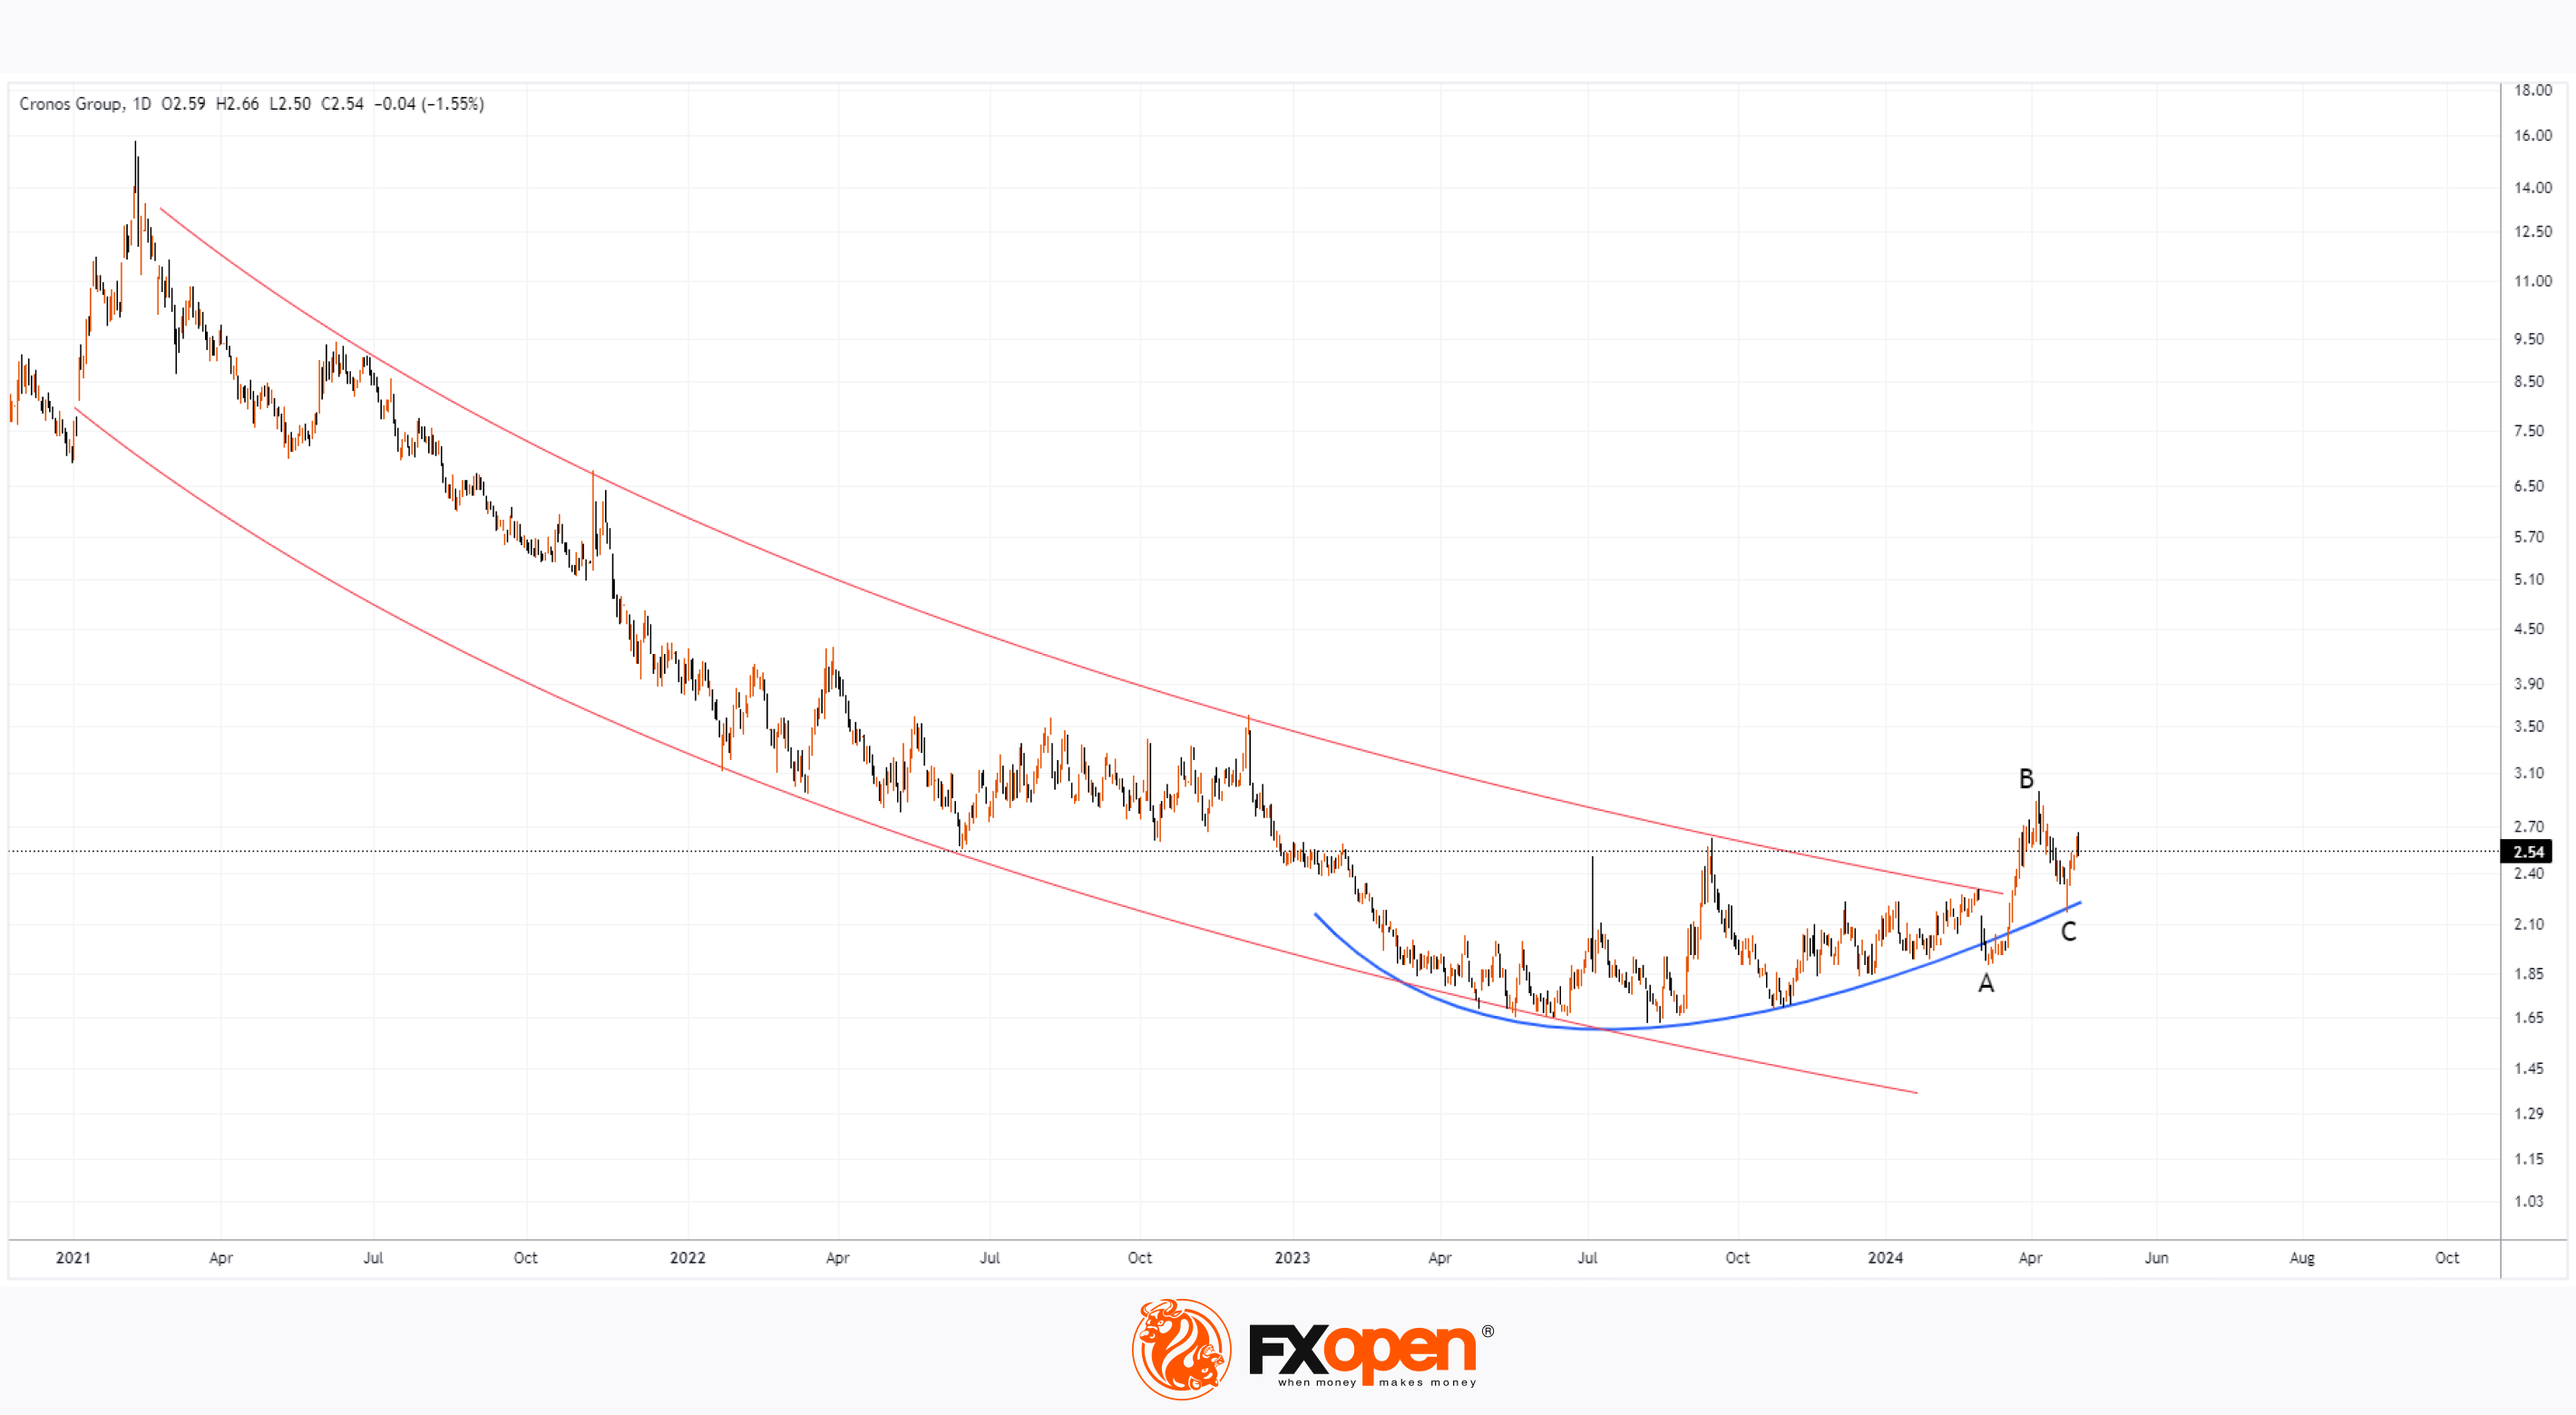
The Cannabis Stocks market has experienced a significant decline since its peak in the spring of 2019. The share of the Canadian company Cronos (CRON) then formed a high above USD 24, and trading yesterday closed at USD 2.55.
However, even after the CRON share price fell 10 times, there are still reasons for optimism:
→ Cronos recently announced its first entry into the edible chocolate category with the introduction of Chocolate Fusions. Cronos' newest edible innovation was developed by an expert team of culinary experts, nutritional scientists and leaders in cannabis product development.
→ InvestorPlace named CRON to its list of top Cannabis Stocks to Consider Buying in Spring 2024. The argument is a reminder that Altria invested USD 1.8 billion in Cronos.
At the same time, technical analysis of the CRON stock shows bullish signs:
→ The CRON stock price forms a rounding bottom pattern, or sometimes called a saucer bottom. The pattern is shown as a blue curve.
→ The B→C move is approximately 50% of the A→B move, which meets the criteria for an intermediate correction after a bullish impulse. It is also seen as a bullish sign that a candle with a long lower shadow is noticeable at point C.
→ The price has broken the upper boundary of the long-term channel (shown in red), indicating that the period of decline may be over.
Meanwhile, Wall Street is not very optimistic yet. According to analysts surveyed by TipRanks, the average price target for CRON in 12 months is USD 2.31.
Whether the bulls will be able to confirm the seriousness of their intentions will become more clear after the reaction of the CRON share price to the publication of financial statements for the 1st quarter. The event is scheduled for the evening of Thursday, May 9.
Buy and sell stocks of the world's biggest publicly-listed companies with CFDs on FXOpen’s trading platform. Open your FXOpen account now or learn more about trading share CFDs with FXOpen.
CFDs are complex instruments and come with a high risk of losing your money.
This article represents the opinion of the Companies operating under the FXOpen brand only. It is not to be construed as an offer, solicitation, or recommendation with respect to products and services provided by the Companies operating under the FXOpen brand, nor is it to be considered financial advice.
CRON Stock Price Forms a Bullish Pattern ahead of the Report
The Cannabis Stocks market has experienced a significant decline since its peak in the spring of 2019. The share of the Canadian company Cronos (CRON) then formed a high above USD 24, and trading yesterday closed at USD 2.55.
However, even after the CRON share price fell 10 times, there are still reasons for optimism:
→ Cronos recently announced its first entry into the edible chocolate category with the introduction of Chocolate Fusions. Cronos' newest edible innovation was developed by an expert team of culinary experts, nutritional scientists and leaders in cannabis product development.
→ InvestorPlace named CRON to its list of top Cannabis Stocks to Consider Buying in Spring 2024. The argument is a reminder that Altria invested USD 1.8 billion in Cronos.
At the same time, technical analysis of the CRON stock shows bullish signs:
→ The CRON stock price forms a rounding bottom pattern, or sometimes called a saucer bottom. The pattern is shown as a blue curve.
→ The B→C move is approximately 50% of the A→B move, which meets the criteria for an intermediate correction after a bullish impulse. It is also seen as a bullish sign that a candle with a long lower shadow is noticeable at point C.
→ The price has broken the upper boundary of the long-term channel (shown in red), indicating that the period of decline may be over.
Meanwhile, Wall Street is not very optimistic yet. According to analysts surveyed by TipRanks, the average price target for CRON in 12 months is USD 2.31.
Whether the bulls will be able to confirm the seriousness of their intentions will become more clear after the reaction of the CRON share price to the publication of financial statements for the 1st quarter. The event is scheduled for the evening of Thursday, May 9.
Buy and sell stocks of the world's biggest publicly-listed companies with CFDs on FXOpen’s trading platform. Open your FXOpen account now or learn more about trading share CFDs with FXOpen.
CFDs are complex instruments and come with a high risk of losing your money.
This article represents the opinion of the Companies operating under the FXOpen brand only. It is not to be construed as an offer, solicitation, or recommendation with respect to products and services provided by the Companies operating under the FXOpen brand, nor is it to be considered financial advice.
👍2
#USDJPY #usdollar #marketanalysis #MarketNews
USD/JPY Analysis: US Dollar Weakens After Statements from the Federal Reserve Chair
Last night, the Federal Reserve's decision regarding interest rates was published, which, as expected, remained unchanged at 5.5%. The subsequent press conference by Powell was of particular interest to market participants.
According to CNBC, during the conference, the Fed Chair almost ruled out a rate hike as the next step, emphasizing the monetary policy's independence from the upcoming presidential elections. Additionally, he stated that:
▪️Concerns regarding stagflation are exaggerated;
▪️The Fed intends to lower rates smoothly and gradually;
▪️The duration of maintaining high rates is increasing indefinitely.
The market's reaction to the Fed's news was a weakening of the dollar – apparently, concerns about another rate hike as the next step have diminished.
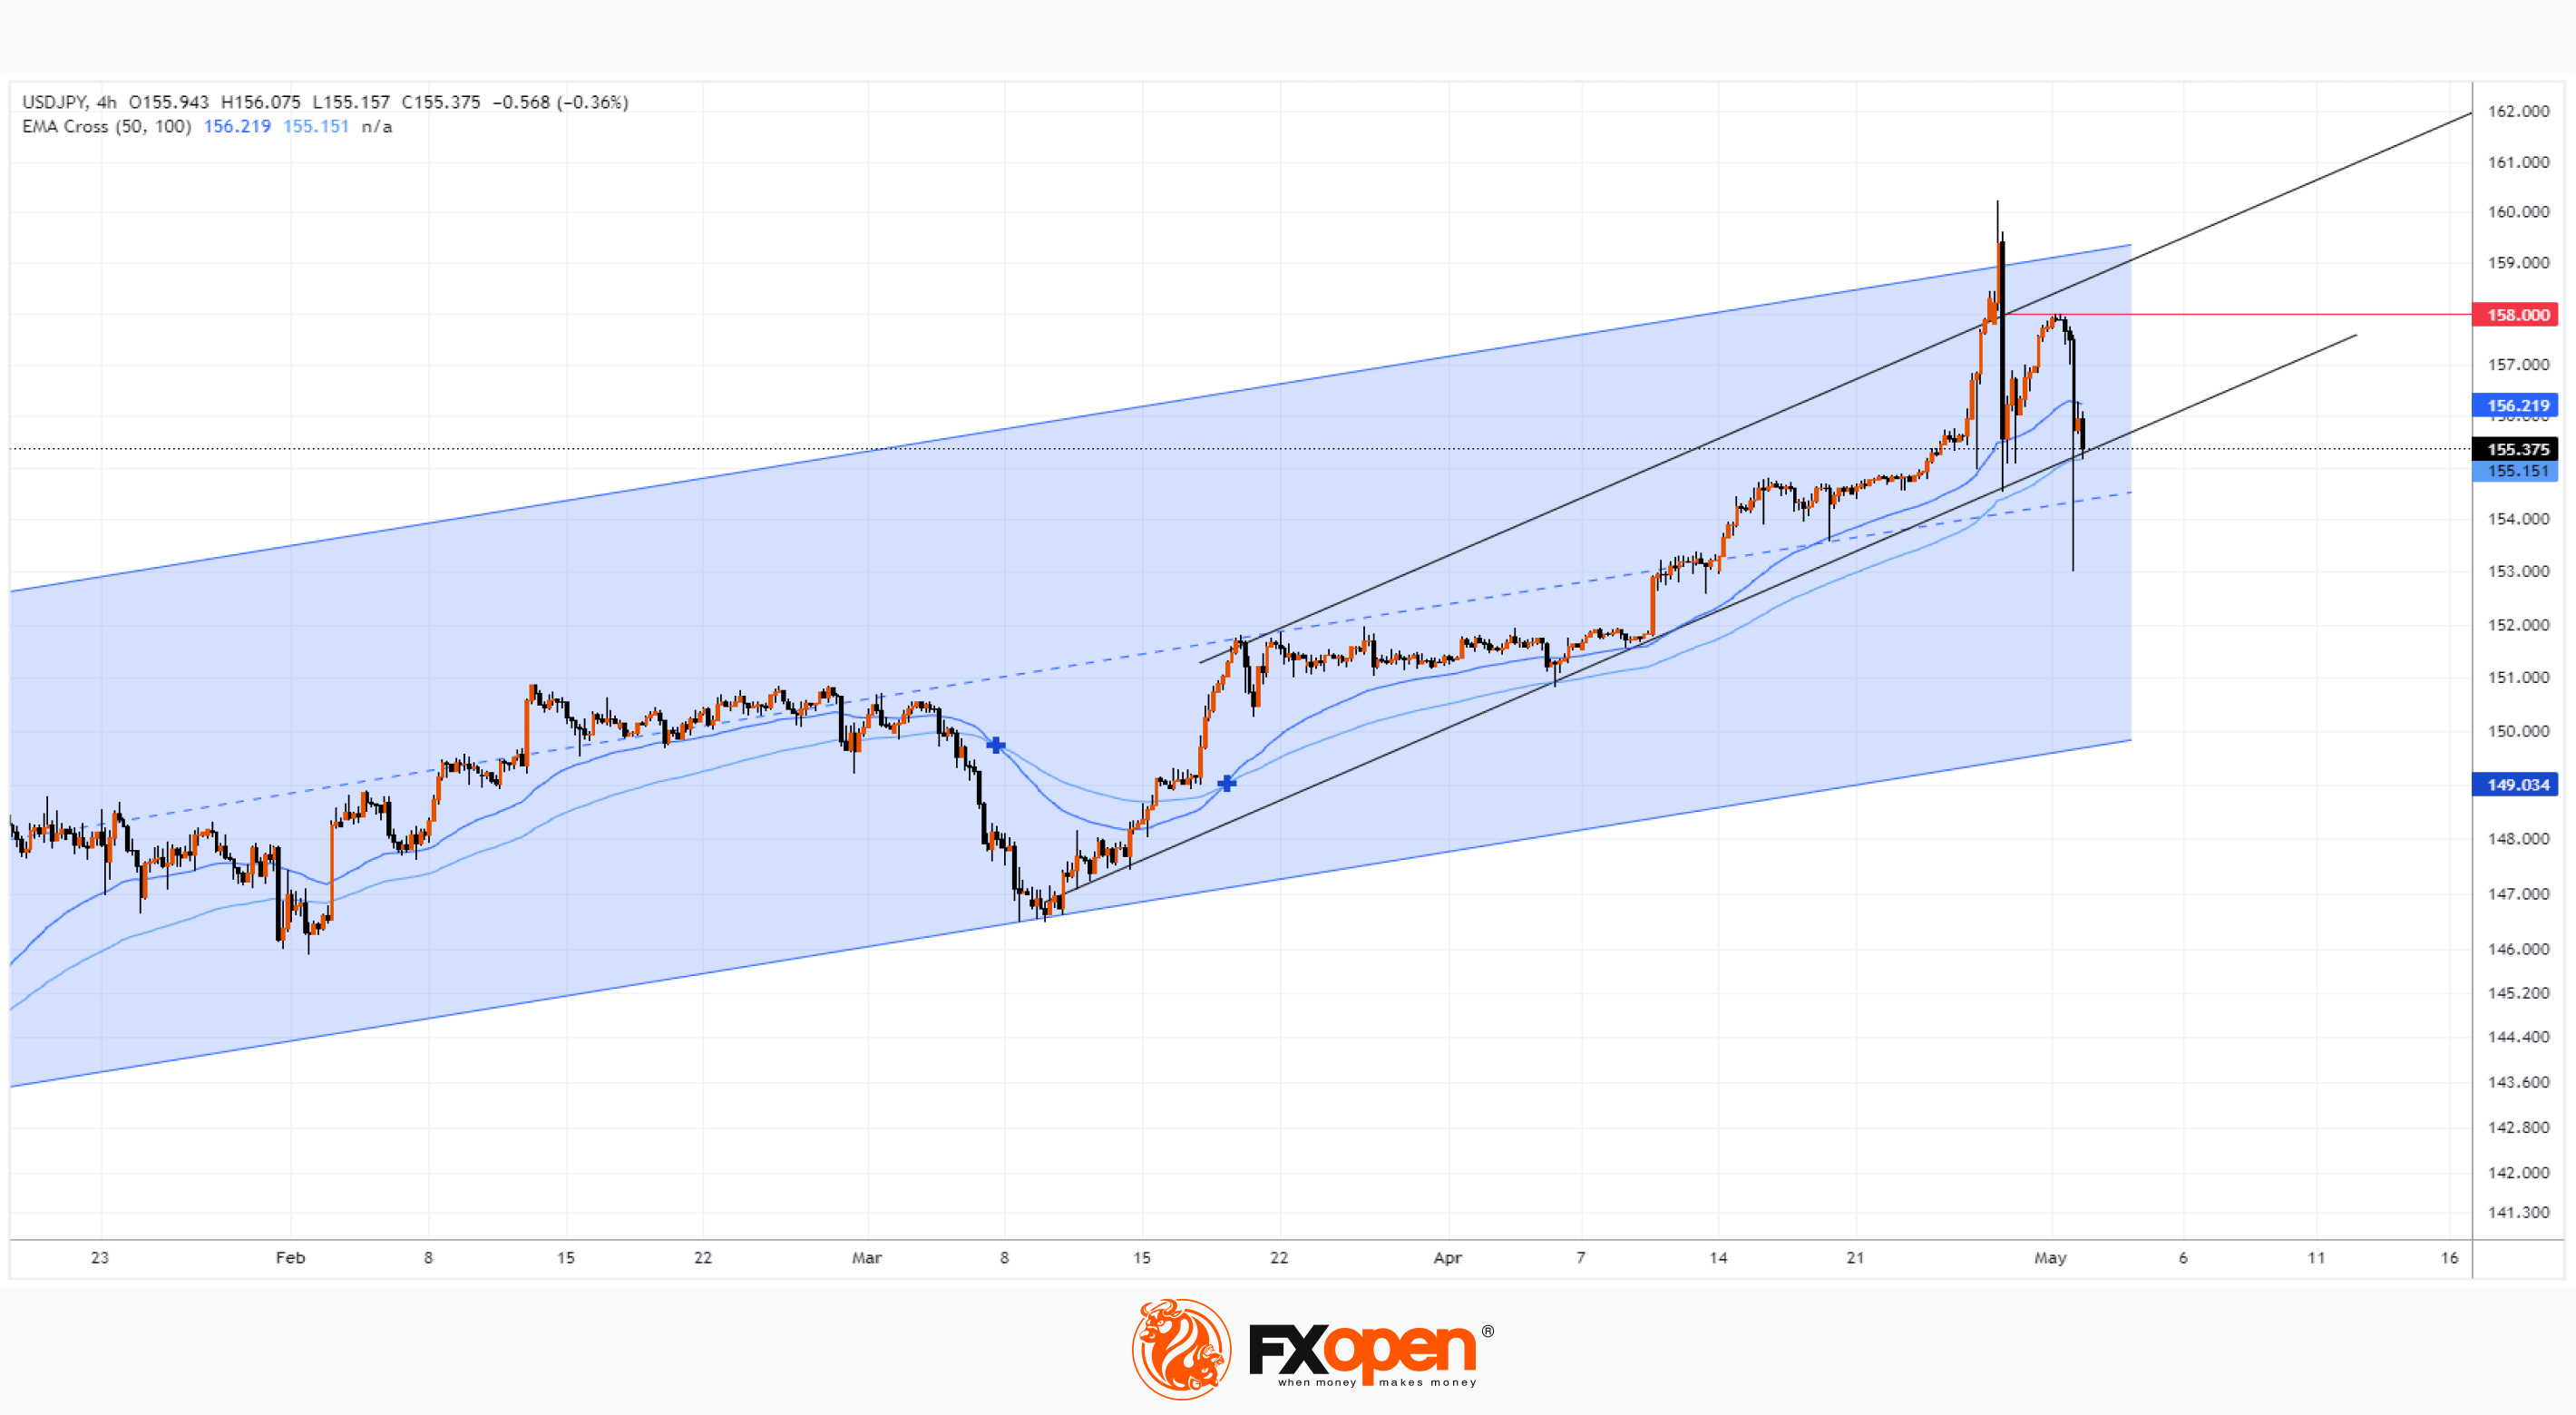
The dollar weakened significantly against the yen – the USD/JPY rate dropped from 157.50 to 153.10 yen per dollar yesterday evening (approximately -2.7%) in less than an hour, although the rate later recovered. The reason lies in the context, specifically the yen's strong strengthening on Monday, when the rate exceeded 160 yen per dollar, as we wrote on the morning of April 29. Perhaps there was another intervention yesterday?
However, official sources refuse to comment. Tokyo may be adhering to a tactic of keeping investors in the dark about its currency intervention strategy. Although, as reported by the Japan Times, fluctuations of 5 yen per dollar indicate interventions.
Today's technical analysis of the USD/JPY chart shows:
→ Following Monday's intervention (assuming it occurred), the USD/JPY rate rebounded from the lower boundary of the ascending channel shown in black;
→ At the rebound peak, the 158 yen per dollar level acted as resistance;
→ After yesterday's weakening of the US dollar, the rate broke below the previous week's minimum, falling below the median line of the blue channel.
Although the EMA 50 is above the EMA 100, a change in market sentiment can be assumed. This would be evidenced by the price consolidating below the short-term (black) channel, which would open the path towards the long-term (blue) channel's lower boundary.
Trade over 50 forex markets 24 hours a day with FXOpen. Take advantage of low commissions, deep liquidity, and spreads from 0.0 pips. Open your FXOpen account now or learn more about trading forex with FXOpen.
CFDs are complex instruments and come with a high risk of losing your money.
This article represents the opinion of the Companies operating under the FXOpen brand only. It is not to be construed as an offer, solicitation, or recommendation with respect to products and services provided by the Companies operating under the FXOpen brand, nor is it to be considered financial advice.
USD/JPY Analysis: US Dollar Weakens After Statements from the Federal Reserve Chair
Last night, the Federal Reserve's decision regarding interest rates was published, which, as expected, remained unchanged at 5.5%. The subsequent press conference by Powell was of particular interest to market participants.
According to CNBC, during the conference, the Fed Chair almost ruled out a rate hike as the next step, emphasizing the monetary policy's independence from the upcoming presidential elections. Additionally, he stated that:
▪️Concerns regarding stagflation are exaggerated;
▪️The Fed intends to lower rates smoothly and gradually;
▪️The duration of maintaining high rates is increasing indefinitely.
The market's reaction to the Fed's news was a weakening of the dollar – apparently, concerns about another rate hike as the next step have diminished.
The dollar weakened significantly against the yen – the USD/JPY rate dropped from 157.50 to 153.10 yen per dollar yesterday evening (approximately -2.7%) in less than an hour, although the rate later recovered. The reason lies in the context, specifically the yen's strong strengthening on Monday, when the rate exceeded 160 yen per dollar, as we wrote on the morning of April 29. Perhaps there was another intervention yesterday?
However, official sources refuse to comment. Tokyo may be adhering to a tactic of keeping investors in the dark about its currency intervention strategy. Although, as reported by the Japan Times, fluctuations of 5 yen per dollar indicate interventions.
Today's technical analysis of the USD/JPY chart shows:
→ Following Monday's intervention (assuming it occurred), the USD/JPY rate rebounded from the lower boundary of the ascending channel shown in black;
→ At the rebound peak, the 158 yen per dollar level acted as resistance;
→ After yesterday's weakening of the US dollar, the rate broke below the previous week's minimum, falling below the median line of the blue channel.
Although the EMA 50 is above the EMA 100, a change in market sentiment can be assumed. This would be evidenced by the price consolidating below the short-term (black) channel, which would open the path towards the long-term (blue) channel's lower boundary.
Trade over 50 forex markets 24 hours a day with FXOpen. Take advantage of low commissions, deep liquidity, and spreads from 0.0 pips. Open your FXOpen account now or learn more about trading forex with FXOpen.
CFDs are complex instruments and come with a high risk of losing your money.
This article represents the opinion of the Companies operating under the FXOpen brand only. It is not to be construed as an offer, solicitation, or recommendation with respect to products and services provided by the Companies operating under the FXOpen brand, nor is it to be considered financial advice.
👍2
#AAPL #stockmarket #stocktrading #MarketNews
AAPL Share Price Soars after Record Buyback Announced
Yesterday, after the end of the main trading session, Apple published its report on its activities for the 1st quarter:
→ Earnings per share: actual = $1.53; expected = $1.505;
→ Gross income: actual = $90.75; expected = $90.36.
The better-than-expected report came as a relief to investors after reporting lower sales in five of the last six quarters. In addition, the following could give positive feedback to market participants:
→ Apple's forecast is that its iPad manufacturing and services business will grow at double-digit rates;
→ company investments in AI. “We think we're well positioned,” Chief Financial Officer Luca Maestri told Bloomberg Television's Emily Chang. CEO Tim Cook is expected to outline Apple's artificial intelligence strategy at its annual Worldwide Developers Conference in June.
→ Apple Inc.'s big plan to restore investor confidence. It consists of a record $110 billion share buyback and a 4% dividend increase.
As a result, AAPL's price rose nearly 8% in post-market trading, exceeding $185 per share, although yesterday's close was around $173.
Technical analysis of the APPL chart today shows that:
→ if trading opens today at a price above $180, a significant bullish gap will form on the chart, which can serve as support in the future;
→ price dynamics suggest that the bulls are trying to break the downward trend channel (shown in red), and send the price further within the ascending channel (shown in blue), which begins in 2023;
→ with the B→C move being approximately 50% of the A→B move, this is a long-term bullish sign that allows us to evaluate the pullback from the important psychological resistance at $200 as a correction within the long-term uptrend.
According to TipRanks, the average analyst price forecast for AAPL stock is $200 in 12 months. But it's possible that AAPL's target price could be raised given recent strong fundamentals.
Buy and sell stocks of the world's biggest publicly-listed companies with CFDs on FXOpen’s trading platform. Open your FXOpen account now or learn more about trading share CFDs with FXOpen.
CFDs are complex instruments and come with a high risk of losing your money.
This article represents the opinion of the Companies operating under the FXOpen brand only. It is not to be construed as an offer, solicitation, or recommendation with respect to products and services provided by the Companies operating under the FXOpen brand, nor is it to be considered financial advice.
AAPL Share Price Soars after Record Buyback Announced
Yesterday, after the end of the main trading session, Apple published its report on its activities for the 1st quarter:
→ Earnings per share: actual = $1.53; expected = $1.505;
→ Gross income: actual = $90.75; expected = $90.36.
The better-than-expected report came as a relief to investors after reporting lower sales in five of the last six quarters. In addition, the following could give positive feedback to market participants:
→ Apple's forecast is that its iPad manufacturing and services business will grow at double-digit rates;
→ company investments in AI. “We think we're well positioned,” Chief Financial Officer Luca Maestri told Bloomberg Television's Emily Chang. CEO Tim Cook is expected to outline Apple's artificial intelligence strategy at its annual Worldwide Developers Conference in June.
→ Apple Inc.'s big plan to restore investor confidence. It consists of a record $110 billion share buyback and a 4% dividend increase.
As a result, AAPL's price rose nearly 8% in post-market trading, exceeding $185 per share, although yesterday's close was around $173.
Technical analysis of the APPL chart today shows that:
→ if trading opens today at a price above $180, a significant bullish gap will form on the chart, which can serve as support in the future;
→ price dynamics suggest that the bulls are trying to break the downward trend channel (shown in red), and send the price further within the ascending channel (shown in blue), which begins in 2023;
→ with the B→C move being approximately 50% of the A→B move, this is a long-term bullish sign that allows us to evaluate the pullback from the important psychological resistance at $200 as a correction within the long-term uptrend.
According to TipRanks, the average analyst price forecast for AAPL stock is $200 in 12 months. But it's possible that AAPL's target price could be raised given recent strong fundamentals.
Buy and sell stocks of the world's biggest publicly-listed companies with CFDs on FXOpen’s trading platform. Open your FXOpen account now or learn more about trading share CFDs with FXOpen.
CFDs are complex instruments and come with a high risk of losing your money.
This article represents the opinion of the Companies operating under the FXOpen brand only. It is not to be construed as an offer, solicitation, or recommendation with respect to products and services provided by the Companies operating under the FXOpen brand, nor is it to be considered financial advice.

👍2
#marketanalysis #MarketNews #XAGUSD
The Price of Silver (XAG/USD) is Falling for the Second Consecutive Week
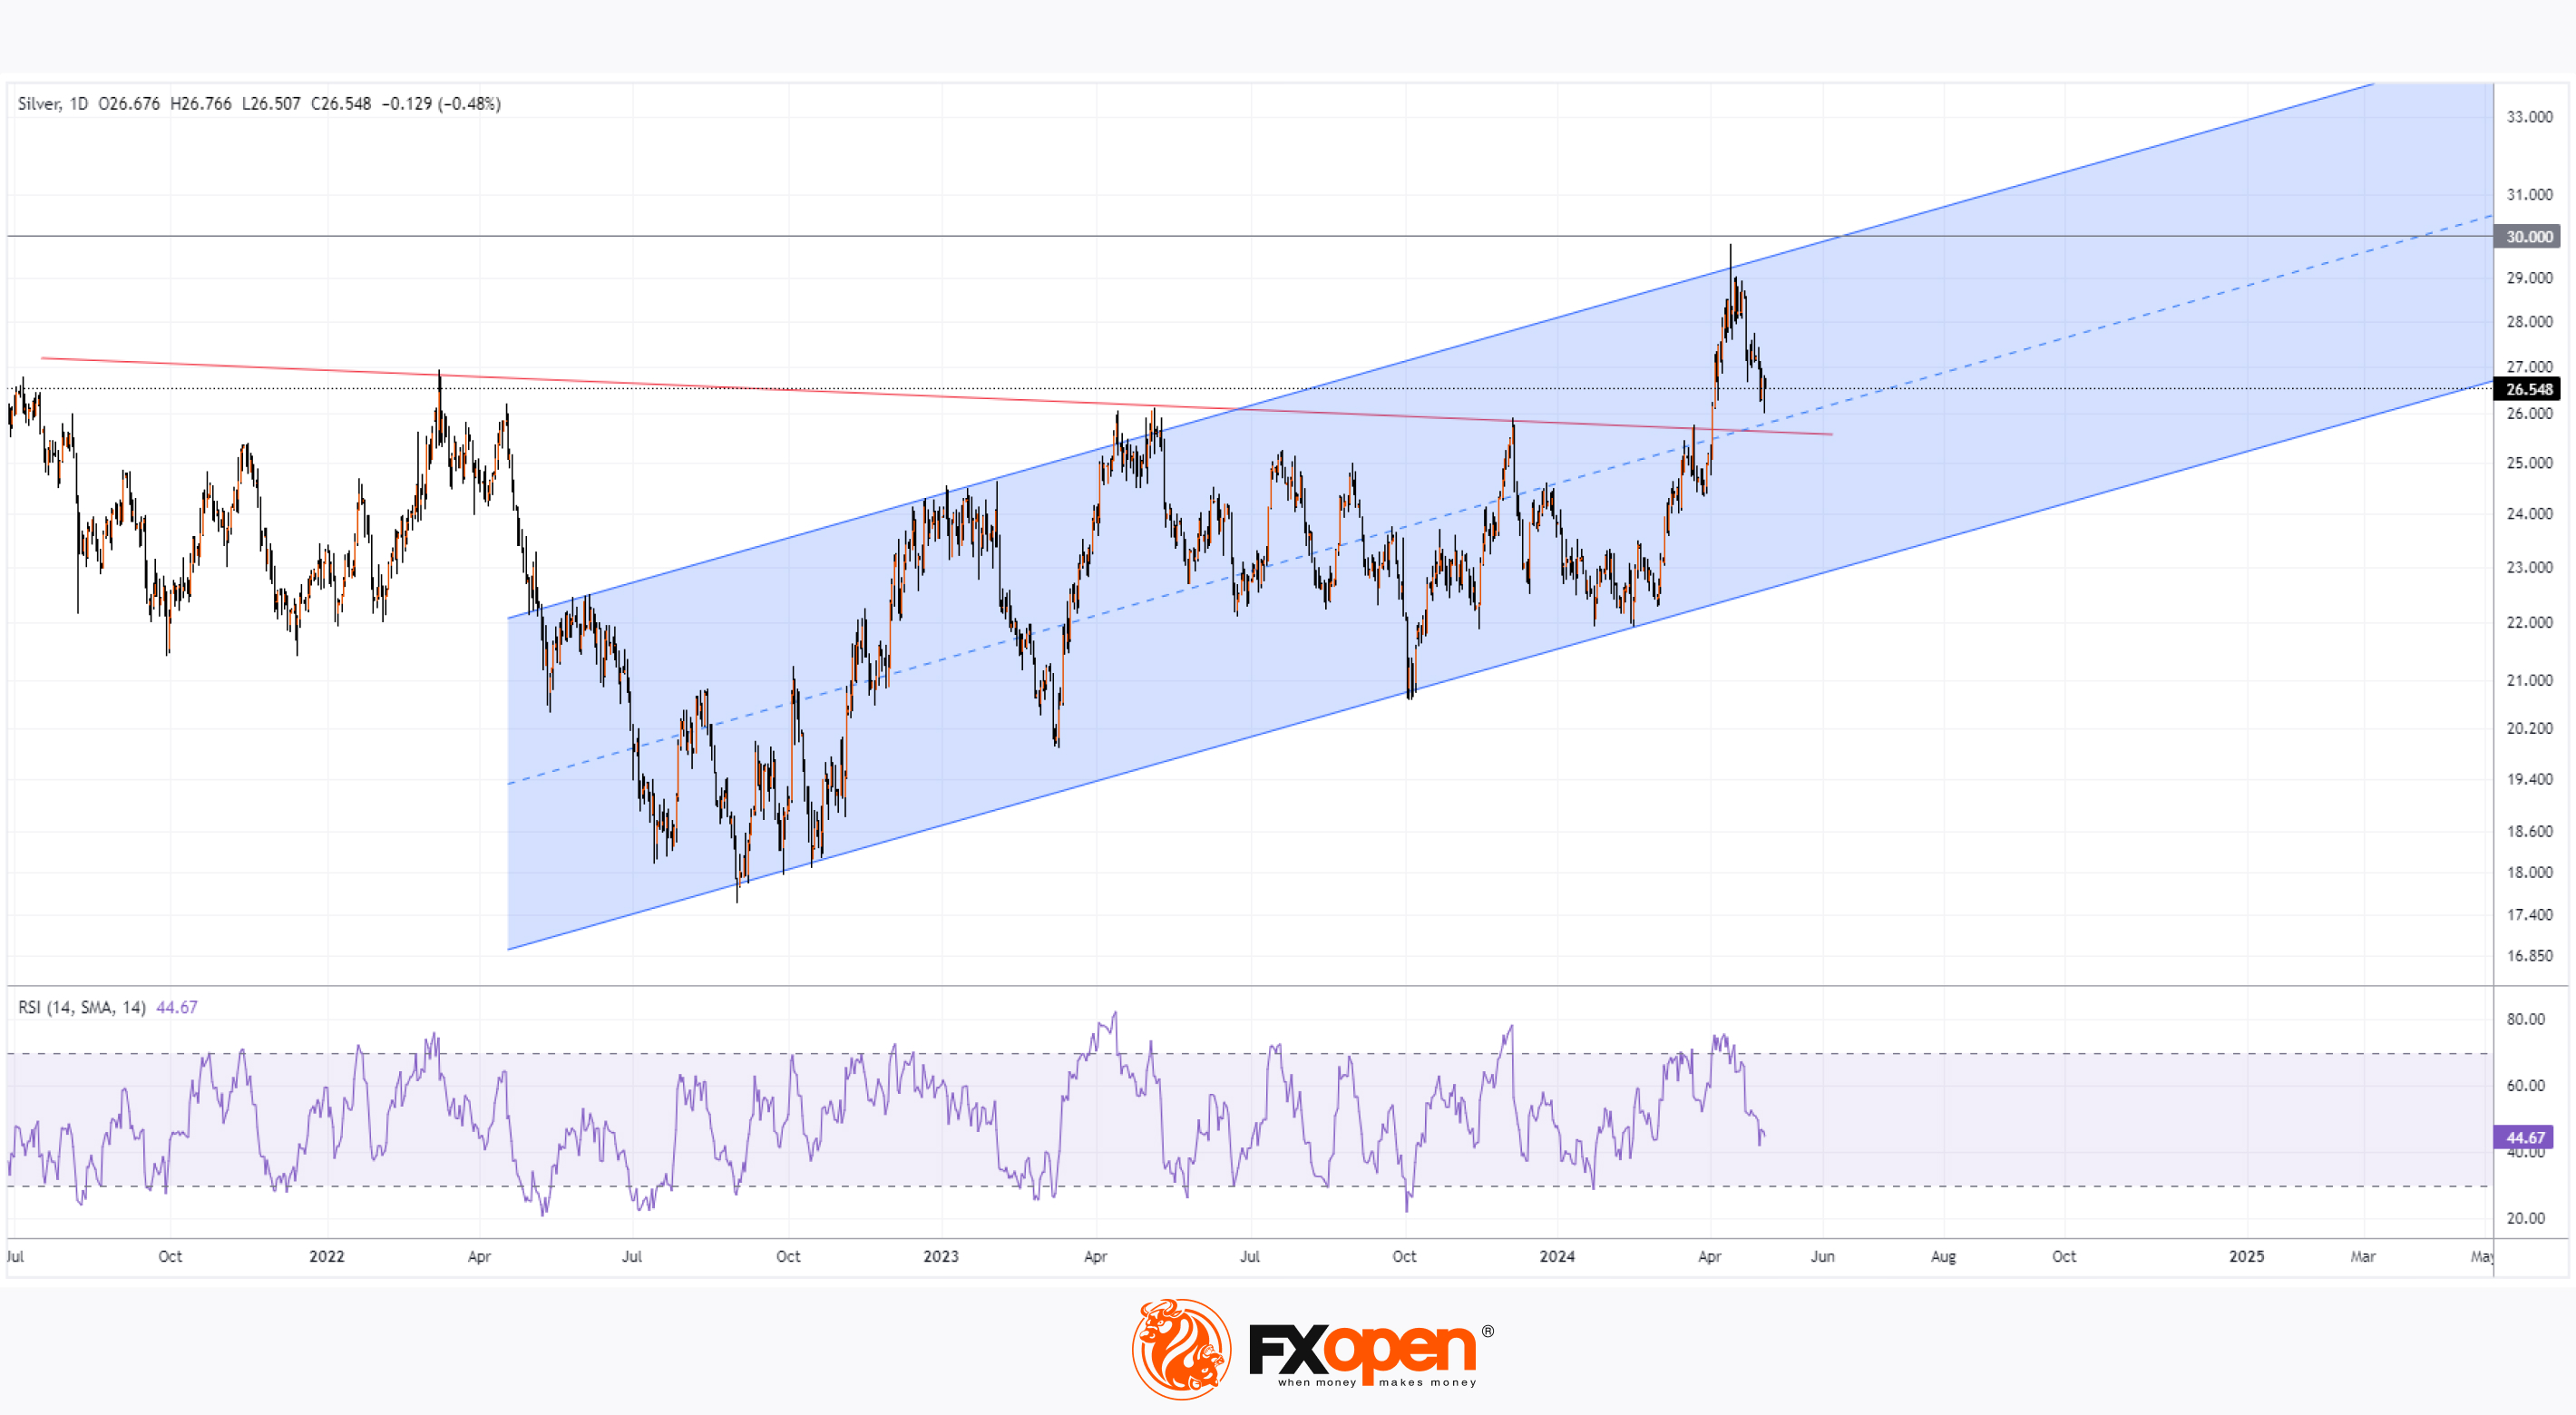
Following a surge in the price of silver close to the important psychological level of $30 per ounce on April 12, bearish momentum is now evident - concluding the week may mark the second consecutive week of decline for XAG/USD.
The decline in demand for silver could be linked to the decrease in gold prices.
Conversely, gold is losing its appeal due to:
→ easing geopolitical tensions in the Middle East;
→ gold's lack of yield, which is deemed unattractive in a high interest rate environment that may persist due to the Federal Reserve's policy - investors are given reason to favour low-risk bonds in their portfolios.
Technical analysis of the XAG/USD chart today shows that:
→ the price of silver is descending towards the breakout area of significant resistance (shown by the red line) - this line could now act as support;
→ support can also be expected from the median line of the ascending channel (shown in blue).
Note that the RSI indicator on the daily chart is below the 50.0 level. This makes it reasonable to expect bulls to attempt to resume the upward trend from the mentioned support levels around $25.75 per ounce of silver.
Start trading commodity CFDs with tight spreads. Open your trading account now or learn more about trading commodity CFDs with FXOpen.
CFDs are complex instruments and come with a high risk of losing your money.
This article represents the opinion of the Companies operating under the FXOpen brand only. It is not to be construed as an offer, solicitation, or recommendation with respect to products and services provided by the Companies operating under the FXOpen brand, nor is it to be considered financial advice.
The Price of Silver (XAG/USD) is Falling for the Second Consecutive Week
Following a surge in the price of silver close to the important psychological level of $30 per ounce on April 12, bearish momentum is now evident - concluding the week may mark the second consecutive week of decline for XAG/USD.
The decline in demand for silver could be linked to the decrease in gold prices.
Conversely, gold is losing its appeal due to:
→ easing geopolitical tensions in the Middle East;
→ gold's lack of yield, which is deemed unattractive in a high interest rate environment that may persist due to the Federal Reserve's policy - investors are given reason to favour low-risk bonds in their portfolios.
Technical analysis of the XAG/USD chart today shows that:
→ the price of silver is descending towards the breakout area of significant resistance (shown by the red line) - this line could now act as support;
→ support can also be expected from the median line of the ascending channel (shown in blue).
Note that the RSI indicator on the daily chart is below the 50.0 level. This makes it reasonable to expect bulls to attempt to resume the upward trend from the mentioned support levels around $25.75 per ounce of silver.
Start trading commodity CFDs with tight spreads. Open your trading account now or learn more about trading commodity CFDs with FXOpen.
CFDs are complex instruments and come with a high risk of losing your money.
This article represents the opinion of the Companies operating under the FXOpen brand only. It is not to be construed as an offer, solicitation, or recommendation with respect to products and services provided by the Companies operating under the FXOpen brand, nor is it to be considered financial advice.
👍3
#stockmarket #FTSE100 #USDJPY #ETF
Weekly Market Wrap With Gary Thomson: FTSE 100, US Dollar, USD/JPY, BTC/USD
Get the latest scoop on the week's hottest headlines, all in one convenient video. Join Gary Thomson, the COO of FXOpen UK, as he breaks down the most significant news reports and shares his expert insights.
🔸London Calling! FTSE 100 Stocks Flying High Once Again;
🔸The Dollar Is Declining: The Outcome Of The Fed Meeting Disappointed Investors;
🔸USD/JPY Analysis: US Dollar Weakens After Statements From The Federal Reserve Chair;
🔸April Became The Worst Month For BTC/USD Since November 2022.
Stay in the know and empower yourself with our short, yet power-packed video. Watch it now and stay updated with FXOpen. Don't miss out on this invaluable opportunity to sharpen your trading skills and make informed decisions.
https://cutt.ly/teq4KBtO
To take advantage of price fluctuations in the foreign exchange markets, consider enlisting the services of a reliable broker like FXOpen.
⚠️
This forecast represents FXOpen Companies opinion only, it should not be construed as an offer, invitation or recommendation in respect to FXOpen Companies products and services or as financial advice
Weekly Market Wrap With Gary Thomson: FTSE 100, US Dollar, USD/JPY, BTC/USD
Get the latest scoop on the week's hottest headlines, all in one convenient video. Join Gary Thomson, the COO of FXOpen UK, as he breaks down the most significant news reports and shares his expert insights.
🔸London Calling! FTSE 100 Stocks Flying High Once Again;
🔸The Dollar Is Declining: The Outcome Of The Fed Meeting Disappointed Investors;
🔸USD/JPY Analysis: US Dollar Weakens After Statements From The Federal Reserve Chair;
🔸April Became The Worst Month For BTC/USD Since November 2022.
Stay in the know and empower yourself with our short, yet power-packed video. Watch it now and stay updated with FXOpen. Don't miss out on this invaluable opportunity to sharpen your trading skills and make informed decisions.
https://cutt.ly/teq4KBtO
To take advantage of price fluctuations in the foreign exchange markets, consider enlisting the services of a reliable broker like FXOpen.
⚠️
This forecast represents FXOpen Companies opinion only, it should not be construed as an offer, invitation or recommendation in respect to FXOpen Companies products and services or as financial advice
YouTube
Weekly Market Wrap With Gary Thomson: FTSE 100, US Dollar, USD/JPY, BTC/USD
Get the latest scoop on the week's hottest headlines, all in one convenient video. Join Gary Thomson, the COO of FXOpen UK, as he breaks down the most significant news reports and shares his expert insights. Read the latest news on Market Pulse https://f…
👍3
#marketanalysis #MarketNews #stockmarket #stocks
What Did Buffett Say at the Shareholders' Meeting?
Warren Buffett, aged 93, held his first Berkshire Hathaway shareholders' meeting this weekend without Charlie Munger, his longtime partner at Berkshire Hathaway, who passed away at the age of 99.
Following the meeting, it was revealed that Berkshire Hathaway's cash reserves are at record levels and continuing to grow, reflecting the challenge of finding stocks for the value investing strategy that has defined billionaire Warren Buffett's success.
Cash, cash equivalents, and short-term Treasury bills for Buffett's group totaled $189 billion at the end of March, up 13% from the end of 2023. "It is fair to assume that by the end of this quarter they will probably be around $200 billion," Buffett said.
According to the legendary investor:
Berkshire sold about 13% of its Apple shares;
-reduced its stake in Chevron by approximately 2%;
-Coca-Cola and American Express are "wonderful companies";
-the Indian stock market may present "untapped opportunities";
"We only pick those areas that we like."
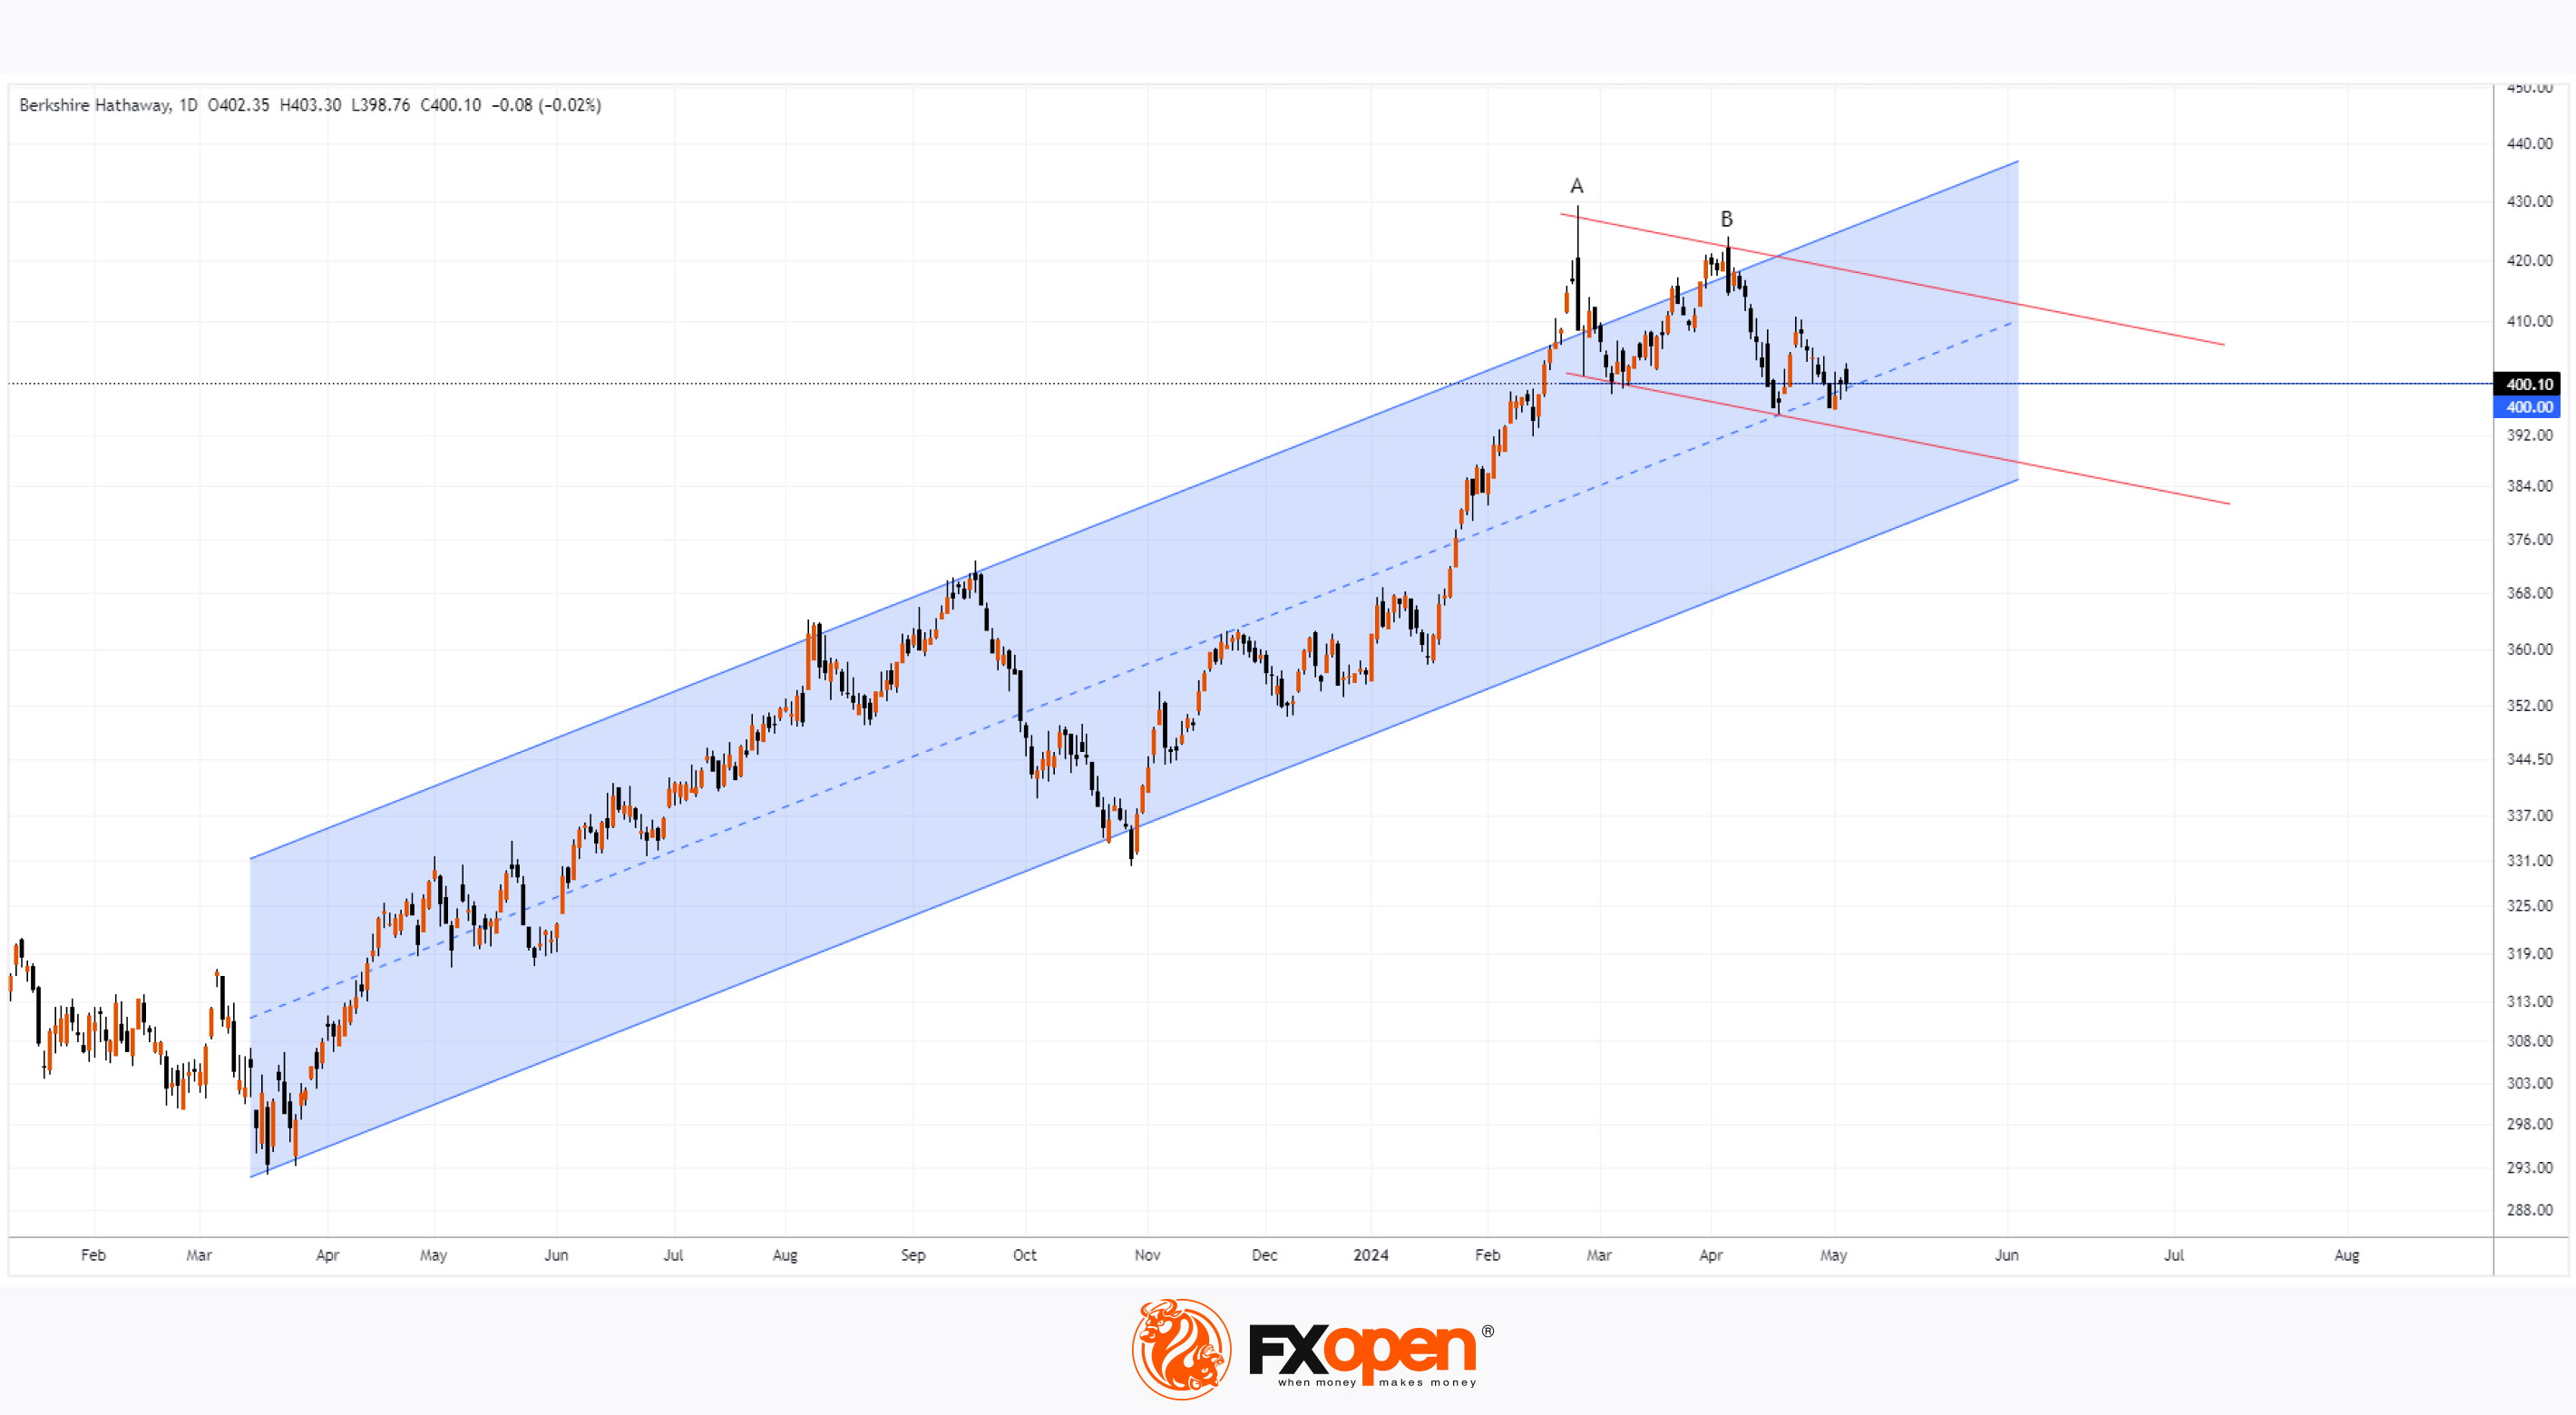
Technical analysis of Berkshire Hathaway stock B (BRK.B) shows that:
-the price is forming an ascending channel (shown in blue);
-after forming a historical high (A), the price showed a sharp decline – a bearish sign;
-attempts to surpass this high were unsuccessful, with peak B ending at a lower level – confirming supply-side activity at price levels around $420 per share of BRK.B;
-bulls have the opportunity to bounce off the channel's median line to demonstrate their determination – aided by psychological support around $400 per share.
However, with each candle on the price chart of BRK.B, a descending channel (shown in red) becomes clearer – indicating a correction within the current upward trend and suggesting potential price decline of BRK.B towards the channel's lower boundary.
According to TipRanks, the average price target for BRK.B is $443 over the next 12 months.
Buy and sell stocks of the world's biggest publicly-listed companies with CFDs on FXOpen’s trading platform. Open your FXOpen account now or learn more about trading share CFDs with FXOpen.
CFDs are complex instruments and come with a high risk of losing your money.
This article represents the opinion of the Companies operating under the FXOpen brand only. It is not to be construed as an offer, solicitation, or recommendation with respect to products and services provided by the Companies operating under the FXOpen brand, nor is it to be considered financial advice.
What Did Buffett Say at the Shareholders' Meeting?
Warren Buffett, aged 93, held his first Berkshire Hathaway shareholders' meeting this weekend without Charlie Munger, his longtime partner at Berkshire Hathaway, who passed away at the age of 99.
Following the meeting, it was revealed that Berkshire Hathaway's cash reserves are at record levels and continuing to grow, reflecting the challenge of finding stocks for the value investing strategy that has defined billionaire Warren Buffett's success.
Cash, cash equivalents, and short-term Treasury bills for Buffett's group totaled $189 billion at the end of March, up 13% from the end of 2023. "It is fair to assume that by the end of this quarter they will probably be around $200 billion," Buffett said.
According to the legendary investor:
Berkshire sold about 13% of its Apple shares;
-reduced its stake in Chevron by approximately 2%;
-Coca-Cola and American Express are "wonderful companies";
-the Indian stock market may present "untapped opportunities";
"We only pick those areas that we like."
Technical analysis of Berkshire Hathaway stock B (BRK.B) shows that:
-the price is forming an ascending channel (shown in blue);
-after forming a historical high (A), the price showed a sharp decline – a bearish sign;
-attempts to surpass this high were unsuccessful, with peak B ending at a lower level – confirming supply-side activity at price levels around $420 per share of BRK.B;
-bulls have the opportunity to bounce off the channel's median line to demonstrate their determination – aided by psychological support around $400 per share.
However, with each candle on the price chart of BRK.B, a descending channel (shown in red) becomes clearer – indicating a correction within the current upward trend and suggesting potential price decline of BRK.B towards the channel's lower boundary.
According to TipRanks, the average price target for BRK.B is $443 over the next 12 months.
Buy and sell stocks of the world's biggest publicly-listed companies with CFDs on FXOpen’s trading platform. Open your FXOpen account now or learn more about trading share CFDs with FXOpen.
CFDs are complex instruments and come with a high risk of losing your money.
This article represents the opinion of the Companies operating under the FXOpen brand only. It is not to be construed as an offer, solicitation, or recommendation with respect to products and services provided by the Companies operating under the FXOpen brand, nor is it to be considered financial advice.
👍2
#stockmarket #stocktrading #MarketNews
UK100 Analysis: Stock Market Optimistic Ahead of Bank of England News
On Monday, the UK observed a bank holiday for May Day, and on Tuesday, the stock market demonstrated accumulated optimism.
The FTSE index (UK100) today surpassed the 8300 mark. Additionally:
→ The opening occurred with a bullish gap;
→ On the daily chart of UK100, today the RSI indicator is in overbought territory, unseen since the beginning of 2023.
One of the significant drivers of bullish sentiments could be considered events on Thursday – at 14:00 GMT+3, news from the Bank of England is expected: market participants will learn about the decision on the interest rate, followed by a press conference.
As Econoday writes:
→ A decision to cut interest rates is unlikely at Thursday's meeting, with autumn being seen as the most probable period for a 0.25-point rate cut from the current level of 5.25 points.
→ Members of the rate-setting committee are concerned that inflation is slowing down too slowly. However, the trend is in the right direction, and the Bank of England has already stated that the 2 percent target does not necessarily need to be reached before interest rates are lowered.
Perhaps the anticipation of signals for monetary policy easing instils confidence in the bulls, but how sustainable can the current growth be?
As shown by the technical analysis of the UK100 chart:
→ The price is moving within a long-term ascending channel (shown in blue). Meanwhile, its upper boundary is around the price level of 8500, which could serve as resistance if market sentiment remains equally optimistic;
→ On the other hand, the price of UK100 is vulnerable to some correction. If it occurs, former resistance at 8200 may provide support. As indicated by the violet lines, successful tests of former resistance underscore the bullish nature of the market.
Trade global index CFDs with zero commission and tight spreads. Open your FXOpen account now or learn more about trading index CFDs with FXOpen.
CFDs are complex instruments and come with a high risk of losing your money.
This article represents the opinion of the Companies operating under the FXOpen brand only. It is not to be construed as an offer, solicitation, or recommendation with respect to products and services provided by the Companies operating under the FXOpen brand, nor is it to be considered financial advice.
UK100 Analysis: Stock Market Optimistic Ahead of Bank of England News
On Monday, the UK observed a bank holiday for May Day, and on Tuesday, the stock market demonstrated accumulated optimism.
The FTSE index (UK100) today surpassed the 8300 mark. Additionally:
→ The opening occurred with a bullish gap;
→ On the daily chart of UK100, today the RSI indicator is in overbought territory, unseen since the beginning of 2023.
One of the significant drivers of bullish sentiments could be considered events on Thursday – at 14:00 GMT+3, news from the Bank of England is expected: market participants will learn about the decision on the interest rate, followed by a press conference.
As Econoday writes:
→ A decision to cut interest rates is unlikely at Thursday's meeting, with autumn being seen as the most probable period for a 0.25-point rate cut from the current level of 5.25 points.
→ Members of the rate-setting committee are concerned that inflation is slowing down too slowly. However, the trend is in the right direction, and the Bank of England has already stated that the 2 percent target does not necessarily need to be reached before interest rates are lowered.
Perhaps the anticipation of signals for monetary policy easing instils confidence in the bulls, but how sustainable can the current growth be?
As shown by the technical analysis of the UK100 chart:
→ The price is moving within a long-term ascending channel (shown in blue). Meanwhile, its upper boundary is around the price level of 8500, which could serve as resistance if market sentiment remains equally optimistic;
→ On the other hand, the price of UK100 is vulnerable to some correction. If it occurs, former resistance at 8200 may provide support. As indicated by the violet lines, successful tests of former resistance underscore the bullish nature of the market.
Trade global index CFDs with zero commission and tight spreads. Open your FXOpen account now or learn more about trading index CFDs with FXOpen.
CFDs are complex instruments and come with a high risk of losing your money.
This article represents the opinion of the Companies operating under the FXOpen brand only. It is not to be construed as an offer, solicitation, or recommendation with respect to products and services provided by the Companies operating under the FXOpen brand, nor is it to be considered financial advice.
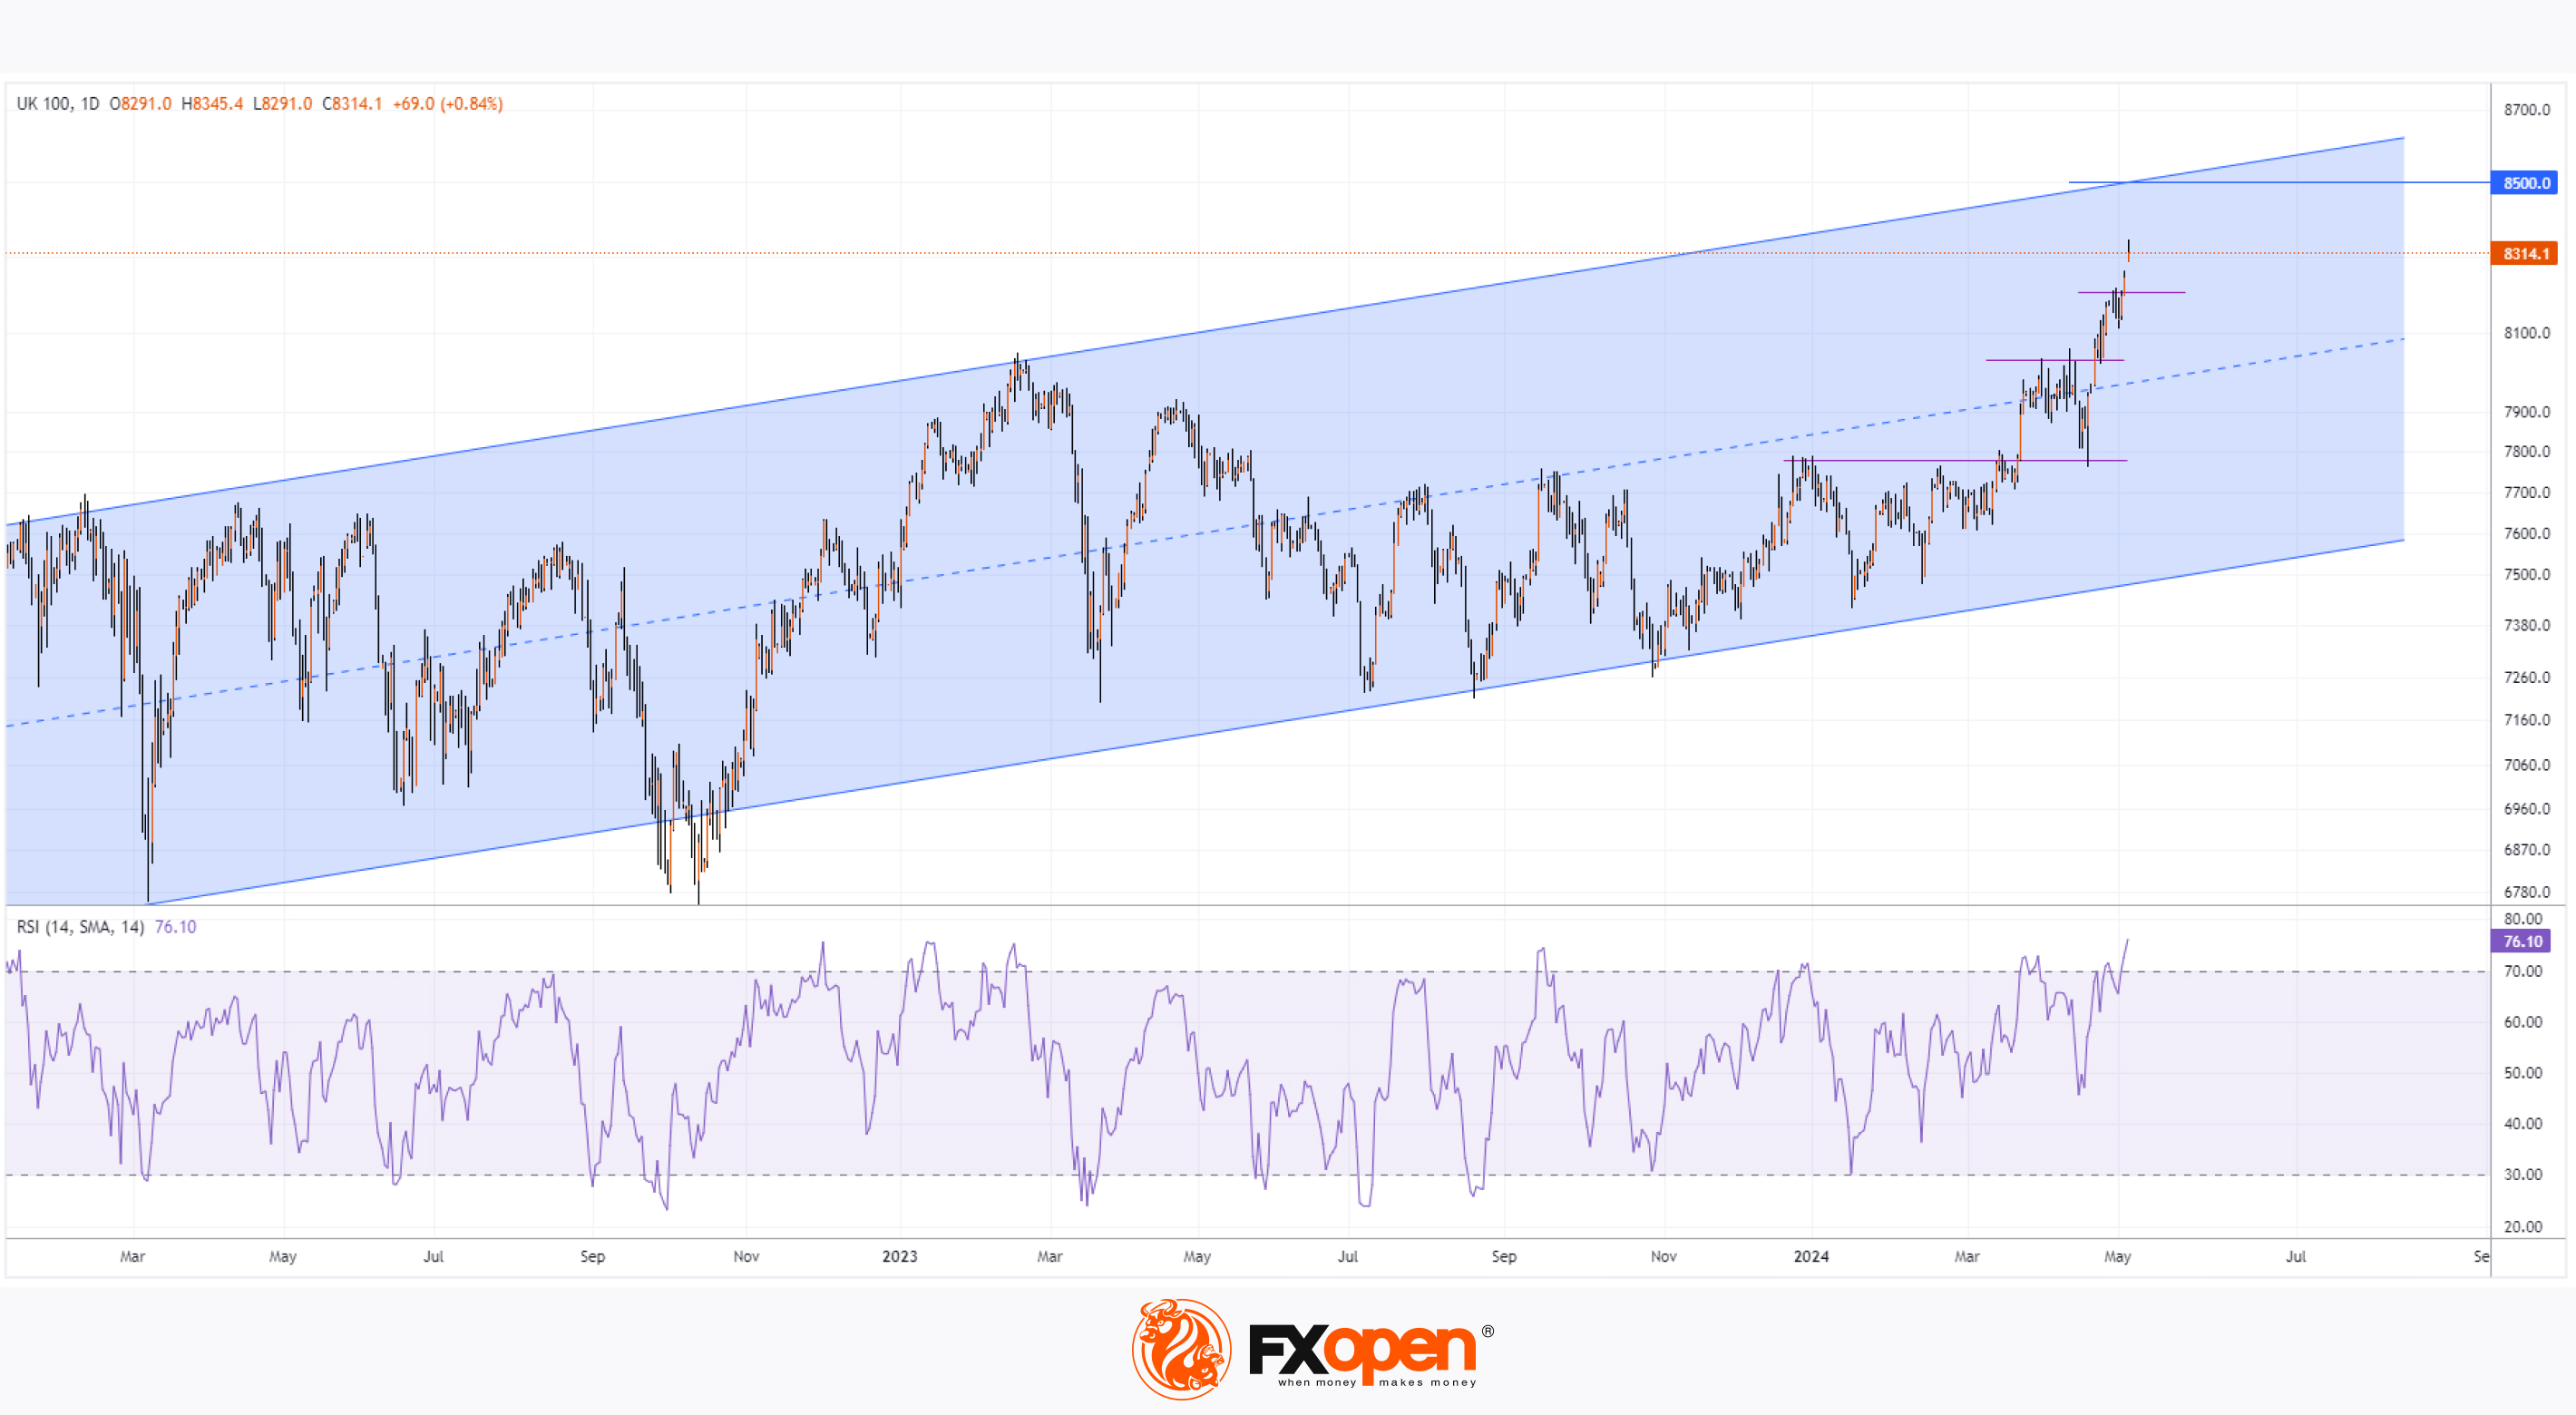
👍2
#marketanalysis #MarketNews #stockmarket #stocktrading
The Hang Seng Index Has risen by Over 13% in 2 Weeks
Analyzing the Hang Seng (Hong Kong 50 at FXOpen) chart, we wrote on January 30th that the price was near an important support level formed by the lower boundary (shown in orange) of a long-term channel, which has been relevant since 1995.
According to Reuters, Goldman Sachs representatives noted in a client note that hedge funds were actively buying Chinese stocks – the period from January 23 to 25 saw the largest capital inflow in 5 years.
As of the beginning of May, price action suggests that hedge fund purchases are justifiable – with the Hang Seng 50 (Hong Kong 50 at FXOpen) index rising by over 13% in the past two weeks.
This was partly driven by:
- Economic stimulus from Beijing.
- The Hong Kong Monetary Authority's (HKMA) decision to keep the base rate unchanged at 5.75%. As reported by the South China Morning Post, HKMA's decisions correlate with the Federal Reserve's policy since 1983, reflecting the local currency's peg to the US dollar.
Technical analysis of the Hang Seng (Hong Kong 50 at FXOpen) weekly chart shows signs of bullish strength:
- The HSI (Hong Kong 50 at FXOpen) penprice remains within the orange long-term channel. After fluctuations in January 2024 around the psychological level of 16,000 points, the price stabilized above this level.
- In mid-April, bears attempted to breach the psychological level of 16,000 points but failed.
- The last two closed candles on the chart were bullish, with wide bodies closing near the highs – indicating demand dominance.
If bulls maintain control, the HSI (Hong Kong 50 at FXOpen) price could break above the upper boundary of the descending channel (shown in red) and open up prospects for a significant rally.
Trade global index CFDs with zero commission and tight spreads. Open your FXOpen account now or learn more about trading index CFDs with FXOpen.
CFDs are complex instruments and come with a high risk of losing your money.
This article represents the opinion of the Companies operating under the FXOpen brand only. It is not to be construed as an offer, solicitation, or recommendation with respect to products and services provided by the Companies operating under the FXOpen brand, nor is it to be considered financial advice.
The Hang Seng Index Has risen by Over 13% in 2 Weeks
Analyzing the Hang Seng (Hong Kong 50 at FXOpen) chart, we wrote on January 30th that the price was near an important support level formed by the lower boundary (shown in orange) of a long-term channel, which has been relevant since 1995.
According to Reuters, Goldman Sachs representatives noted in a client note that hedge funds were actively buying Chinese stocks – the period from January 23 to 25 saw the largest capital inflow in 5 years.
As of the beginning of May, price action suggests that hedge fund purchases are justifiable – with the Hang Seng 50 (Hong Kong 50 at FXOpen) index rising by over 13% in the past two weeks.
This was partly driven by:
- Economic stimulus from Beijing.
- The Hong Kong Monetary Authority's (HKMA) decision to keep the base rate unchanged at 5.75%. As reported by the South China Morning Post, HKMA's decisions correlate with the Federal Reserve's policy since 1983, reflecting the local currency's peg to the US dollar.
Technical analysis of the Hang Seng (Hong Kong 50 at FXOpen) weekly chart shows signs of bullish strength:
- The HSI (Hong Kong 50 at FXOpen) penprice remains within the orange long-term channel. After fluctuations in January 2024 around the psychological level of 16,000 points, the price stabilized above this level.
- In mid-April, bears attempted to breach the psychological level of 16,000 points but failed.
- The last two closed candles on the chart were bullish, with wide bodies closing near the highs – indicating demand dominance.
If bulls maintain control, the HSI (Hong Kong 50 at FXOpen) price could break above the upper boundary of the descending channel (shown in red) and open up prospects for a significant rally.
Trade global index CFDs with zero commission and tight spreads. Open your FXOpen account now or learn more about trading index CFDs with FXOpen.
CFDs are complex instruments and come with a high risk of losing your money.
This article represents the opinion of the Companies operating under the FXOpen brand only. It is not to be construed as an offer, solicitation, or recommendation with respect to products and services provided by the Companies operating under the FXOpen brand, nor is it to be considered financial advice.
Market Pulse
The Hang Seng Index is Near Important Support
The economy of China is hit by the decision to liquidate the developer Evergrande due to a debt of USD 300 billion.
👍2
#marketanalysis #MarketNews #forextrading
AUD/USD Analysis: Aussie Weakens After RBA Decision
Following its decision on 7th May, the Reserve Bank of Australia (RBA) opted to maintain the interest rate at 4.35%, despite inflation continuing to decrease at a slower pace than anticipated by the RBA.
"I think we still think they’re reasonably balanced with perhaps a little bit of a signal that we need to be very watchful on the upside," RBA governor Michele Bullock said.
According to The Guardian, the absence of more aggressive language led to a decline in the Australian dollar.
Specifically, on the morning of 8th May, the AUD/USD rate fell below the 0.657 level, whereas on 7th May, the rate was at 0.664 - a decrease of approximately 1.3% in 30 hours.
Technical analysis of the AUD/USD chart indicates that:
→ The 0.664 level serves as a significant resistance - the price turned down from this level several times since March;
→ The price may continue to decline, staying within the channel shown in red.
Current bearish sentiments point towards a potential decline in the AUD/USD price towards the median line of the red channel. Support may be found around the 0.6555 level, where:
→ The lower boundary of the intermediate rising channel (shown in black);
→ 50% correction level from the bull impulse A→B. → EMA (100).
The near-term fluctuations in the AUD/USD exchange rate (as well as other financial assets denominated in USD) could be influenced by comments from Federal Reserve representatives expected on Thursday and Friday.
Trade over 50 forex markets 24 hours a day with FXOpen. Take advantage of low commissions, deep liquidity, and spreads from 0.0 pips. Open your FXOpen account now or learn more about trading forex with FXOpen.
CFDs are complex instruments and come with a high risk of losing your money.
This article represents the opinion of the Companies operating under the FXOpen brand only. It is not to be construed as an offer, solicitation, or recommendation with respect to products and services provided by the Companies operating under the FXOpen brand, nor is it to be considered financial advice.
AUD/USD Analysis: Aussie Weakens After RBA Decision
Following its decision on 7th May, the Reserve Bank of Australia (RBA) opted to maintain the interest rate at 4.35%, despite inflation continuing to decrease at a slower pace than anticipated by the RBA.
"I think we still think they’re reasonably balanced with perhaps a little bit of a signal that we need to be very watchful on the upside," RBA governor Michele Bullock said.
According to The Guardian, the absence of more aggressive language led to a decline in the Australian dollar.
Specifically, on the morning of 8th May, the AUD/USD rate fell below the 0.657 level, whereas on 7th May, the rate was at 0.664 - a decrease of approximately 1.3% in 30 hours.
Technical analysis of the AUD/USD chart indicates that:
→ The 0.664 level serves as a significant resistance - the price turned down from this level several times since March;
→ The price may continue to decline, staying within the channel shown in red.
Current bearish sentiments point towards a potential decline in the AUD/USD price towards the median line of the red channel. Support may be found around the 0.6555 level, where:
→ The lower boundary of the intermediate rising channel (shown in black);
→ 50% correction level from the bull impulse A→B. → EMA (100).
The near-term fluctuations in the AUD/USD exchange rate (as well as other financial assets denominated in USD) could be influenced by comments from Federal Reserve representatives expected on Thursday and Friday.
Trade over 50 forex markets 24 hours a day with FXOpen. Take advantage of low commissions, deep liquidity, and spreads from 0.0 pips. Open your FXOpen account now or learn more about trading forex with FXOpen.
CFDs are complex instruments and come with a high risk of losing your money.
This article represents the opinion of the Companies operating under the FXOpen brand only. It is not to be construed as an offer, solicitation, or recommendation with respect to products and services provided by the Companies operating under the FXOpen brand, nor is it to be considered financial advice.
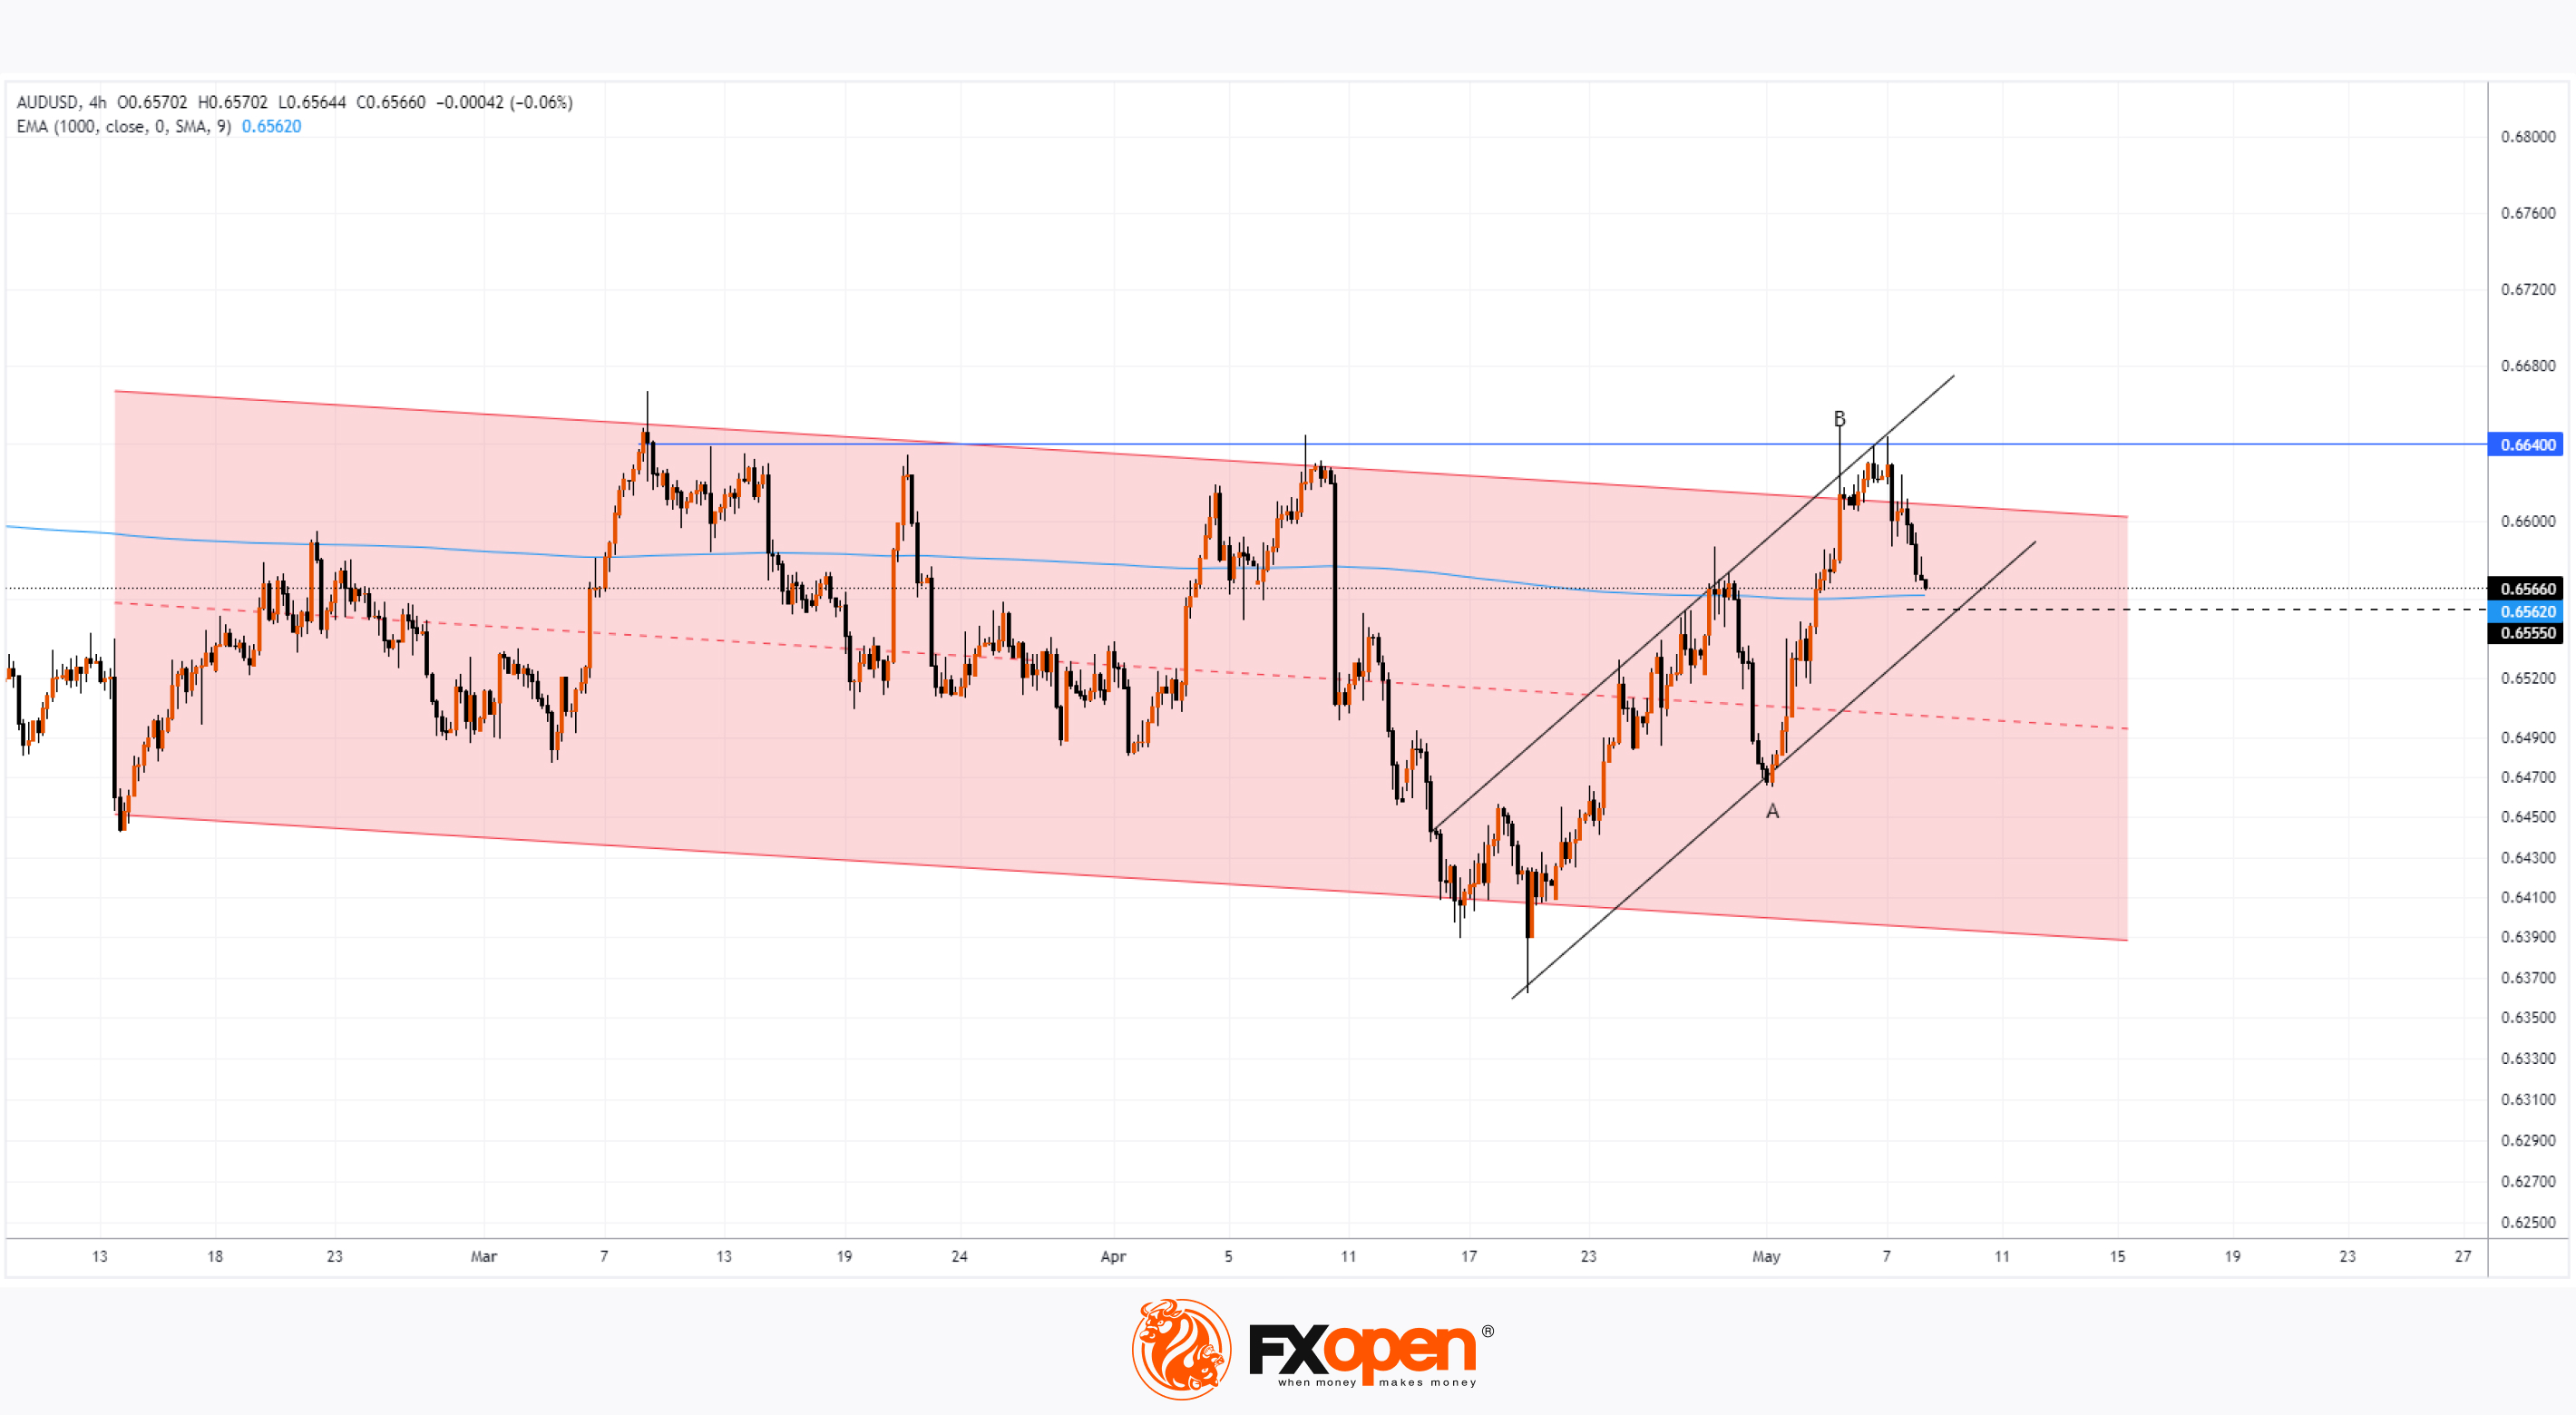
👍3
#GBPUSD #marketanalysis #forextrading #tradingtips
GBP/USD Analysis: Pound Recovers After the Bank of England Decision
Yesterday, the Bank of England published its interest rate decision. According to ForexFactory, the votes were distributed as follows:
→ rate hike - 0 votes, cut - 2 votes, unchanged - 7 (0 - 2 - 7);
→ forecast: 0 - 0 - 9;
→ previous values: 0 - 1 - 8.
For the first time in the current cycle of interest rate hikes aimed at inflation lowering, two members of the Monetary Policy Committee voted in favour of the rate cut. The dovish tone was echoed by Bank of England Governor Andrew Bailey: “It is likely that we will need to cut the bank rate over coming quarters, possibly more so than is currently priced into markets.”
The market's first reaction to the clear signals of the imminent easing monetary policy was the weakening of the pound, including against the US dollar. Thus, yesterday, the GBP/USD rate dropped below the low of April 26 at around 1.245.
However:
→ the US dollar is also affected by the prospect of the Fed's easing monetary policy because the current tight policy puts pressure on the labour market - according to data from May 9, the number of applications for unemployment benefits in the US was the highest since November 2023;
→ Today's UK GDP data (which turned out to be better than expected) supported the pound.
As a result, today, the GBP/USD rate surged to 1.2537 from yesterday's low below 1.2450.
Technical analysis of the GBP/USD chart shows:
→ the price is within the channel (shown in blue);
→ the median line (as shown by the arrow) acts as resistance - a long upper shadow can be interpreted as evidence of sellers' activity above 1.26;
→ recent events have shown the presence of demand in the area of the psychological level of 1.25.
Thus, fluctuations in the GBP/USD rate may continue to compress within the formation between the trendline – resistance – (shown in red) and support around 1.25. The exit from this consolidation pattern may develop into a stable trend against the background of prospects for lowering interest rates by central banks.
Trade over 50 forex markets 24 hours a day with FXOpen. Take advantage of low commissions, deep liquidity, and spreads from 0.0 pips. Open your FXOpen account now or learn more about trading forex with FXOpen.
CFDs are complex instruments and come with a high risk of losing your money.
This article represents the opinion of the Companies operating under the FXOpen brand only. It is not to be construed as an offer, solicitation, or recommendation with respect to products and services provided by the Companies operating under the FXOpen brand, nor is it to be considered financial advice.
GBP/USD Analysis: Pound Recovers After the Bank of England Decision
Yesterday, the Bank of England published its interest rate decision. According to ForexFactory, the votes were distributed as follows:
→ rate hike - 0 votes, cut - 2 votes, unchanged - 7 (0 - 2 - 7);
→ forecast: 0 - 0 - 9;
→ previous values: 0 - 1 - 8.
For the first time in the current cycle of interest rate hikes aimed at inflation lowering, two members of the Monetary Policy Committee voted in favour of the rate cut. The dovish tone was echoed by Bank of England Governor Andrew Bailey: “It is likely that we will need to cut the bank rate over coming quarters, possibly more so than is currently priced into markets.”
The market's first reaction to the clear signals of the imminent easing monetary policy was the weakening of the pound, including against the US dollar. Thus, yesterday, the GBP/USD rate dropped below the low of April 26 at around 1.245.
However:
→ the US dollar is also affected by the prospect of the Fed's easing monetary policy because the current tight policy puts pressure on the labour market - according to data from May 9, the number of applications for unemployment benefits in the US was the highest since November 2023;
→ Today's UK GDP data (which turned out to be better than expected) supported the pound.
As a result, today, the GBP/USD rate surged to 1.2537 from yesterday's low below 1.2450.
Technical analysis of the GBP/USD chart shows:
→ the price is within the channel (shown in blue);
→ the median line (as shown by the arrow) acts as resistance - a long upper shadow can be interpreted as evidence of sellers' activity above 1.26;
→ recent events have shown the presence of demand in the area of the psychological level of 1.25.
Thus, fluctuations in the GBP/USD rate may continue to compress within the formation between the trendline – resistance – (shown in red) and support around 1.25. The exit from this consolidation pattern may develop into a stable trend against the background of prospects for lowering interest rates by central banks.
Trade over 50 forex markets 24 hours a day with FXOpen. Take advantage of low commissions, deep liquidity, and spreads from 0.0 pips. Open your FXOpen account now or learn more about trading forex with FXOpen.
CFDs are complex instruments and come with a high risk of losing your money.
This article represents the opinion of the Companies operating under the FXOpen brand only. It is not to be construed as an offer, solicitation, or recommendation with respect to products and services provided by the Companies operating under the FXOpen brand, nor is it to be considered financial advice.
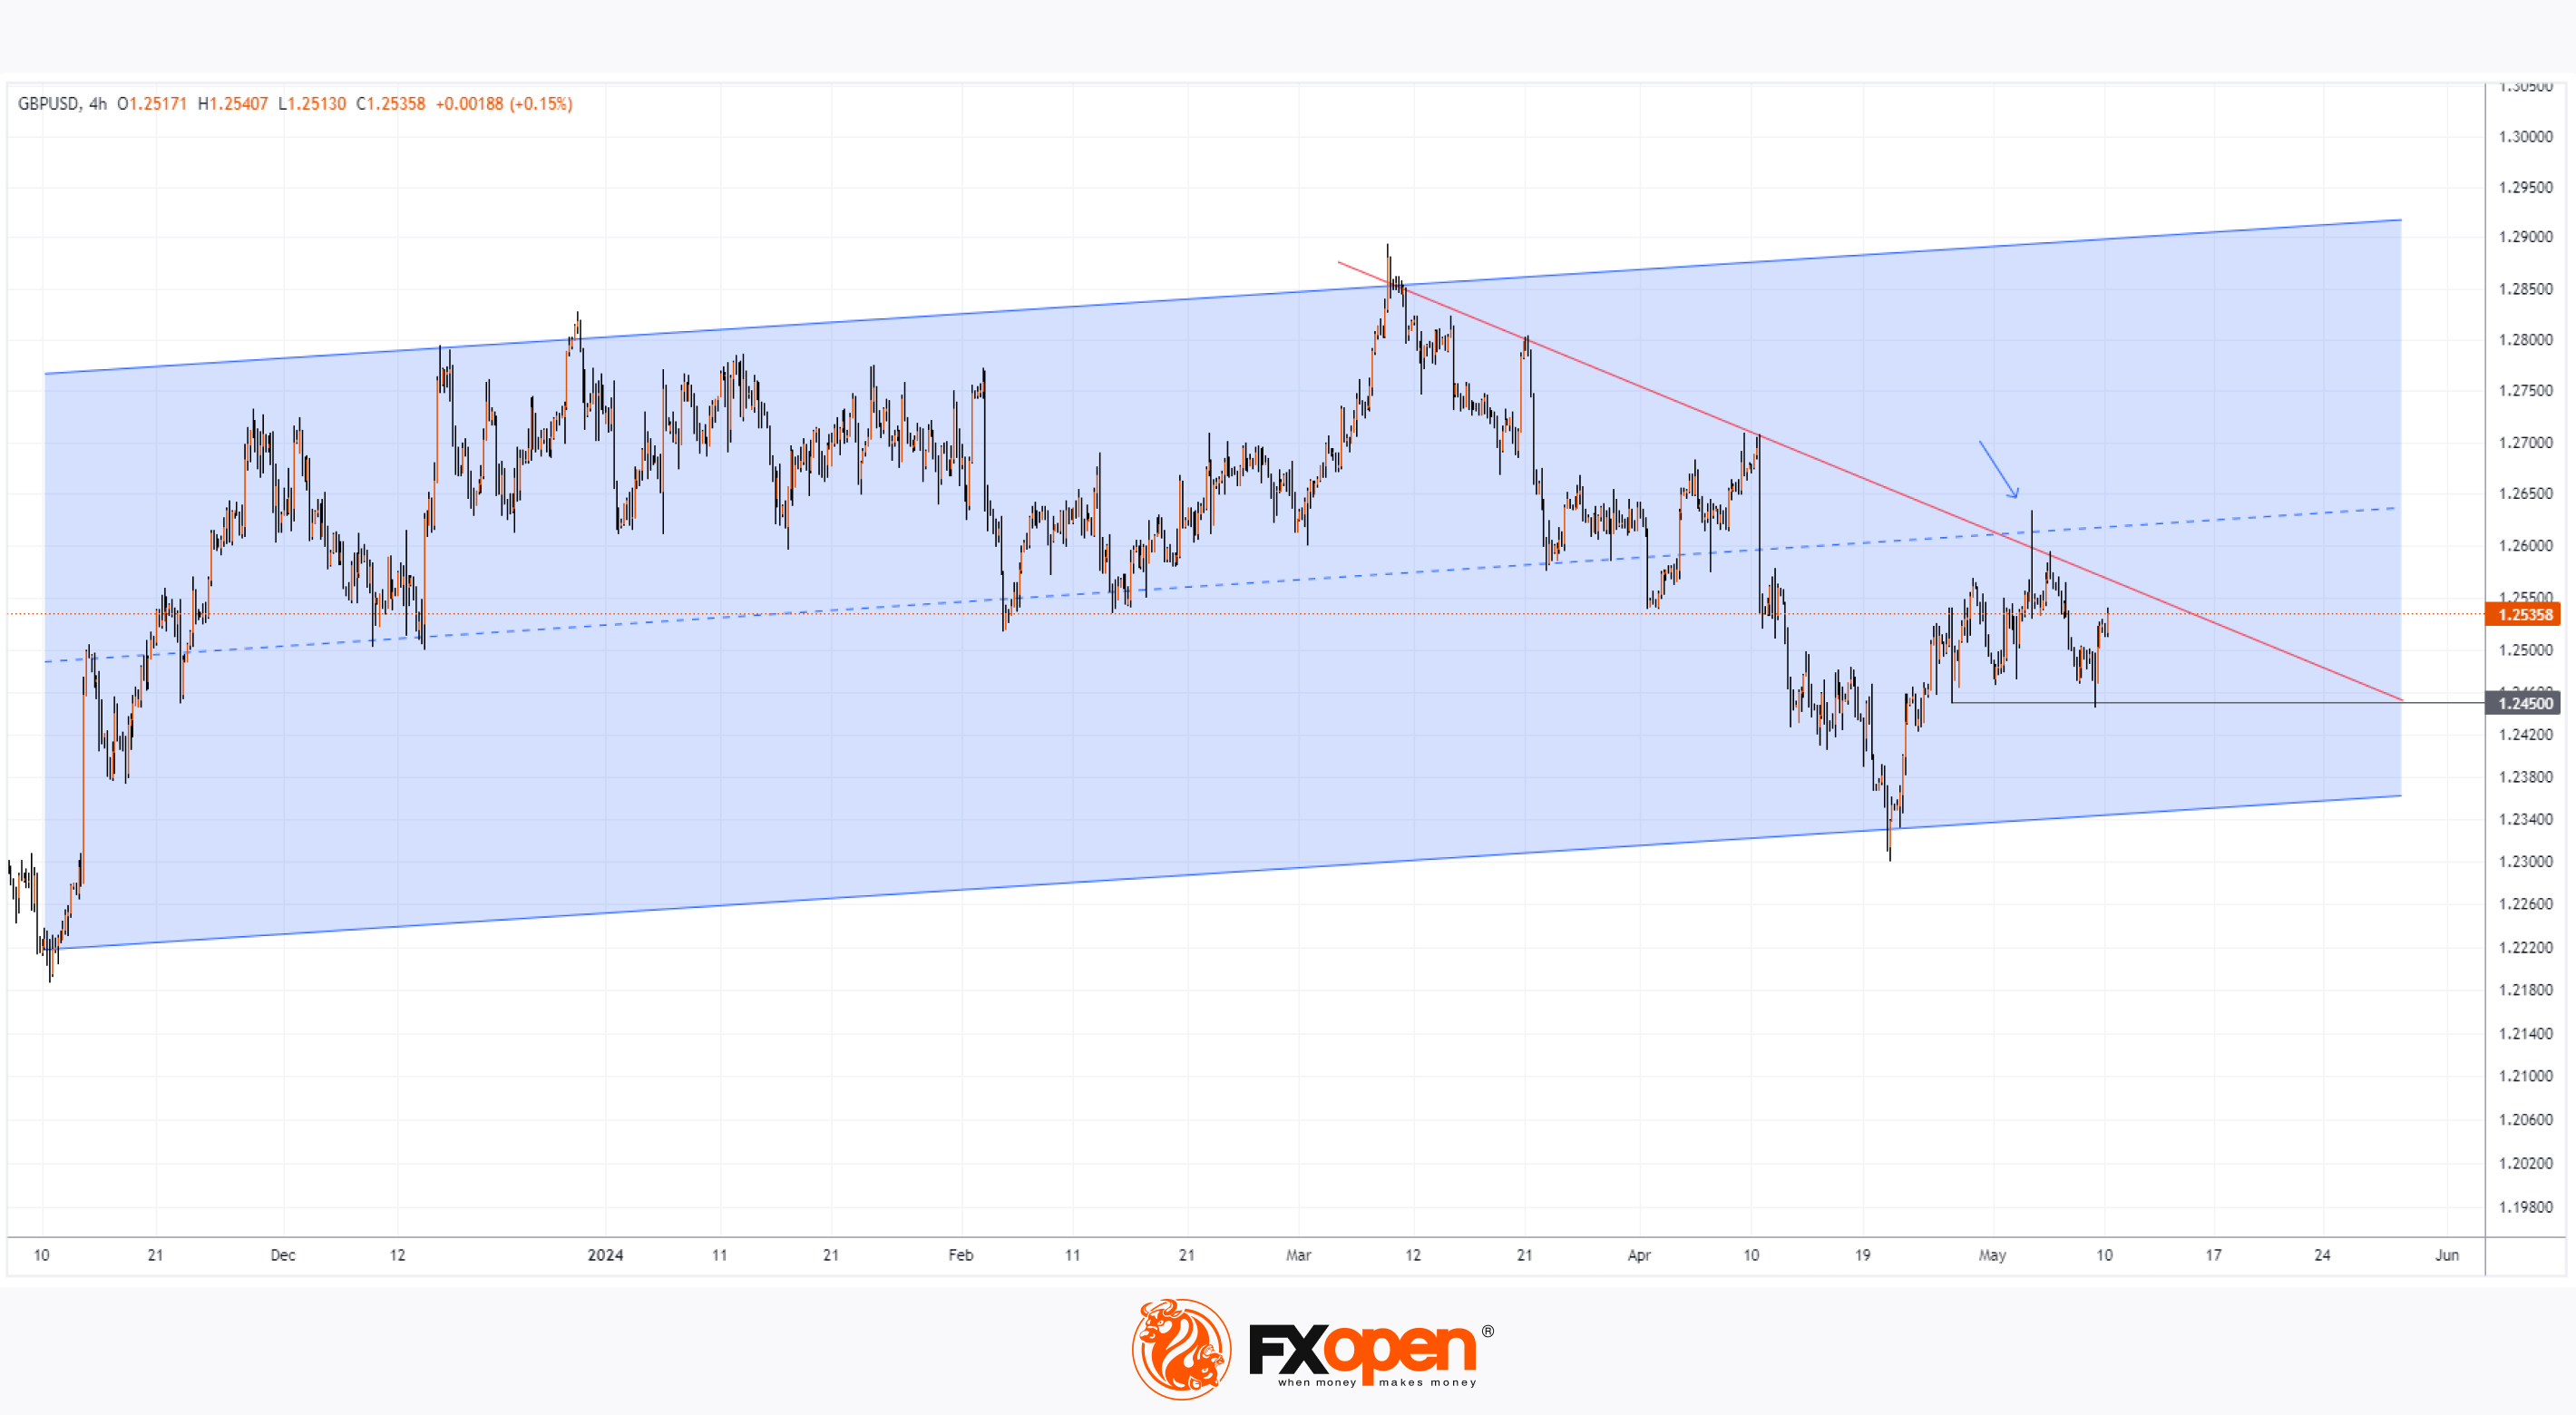
👍4