
#sp500 #stockmarket #stocktrading #marketanalysis
S&P 500 Index Hits Record After Major News
Yesterday, significant news regarding US inflation was released. According to ForexFactory:
→ Year-on-year Consumer Price Index (CPI): actual = 3.3%, forecast = 3.4%, previous = 3.4%;
→ Month-on-month CPI: actual = 0.0%, forecast = 0.1%, previous = 0.3%;
→ Month-on-month Core CPI (excluding food and energy): actual = 0.2%, forecast = 0.3%, previous = 0.3%.
These official figures indicate that US inflation is slowing down.
This bolstered expectations that the current tight monetary policy might ease. Consequently:
→ the dollar weakened (as we anticipated yesterday while analysing the USD/CAD chart);
→ stock markets surged. Notably, the S&P 500 index (US SPX 500 mini on FXOpen) surpassed 5,444, rising approximately 1.1% within two hours following the inflation news release.
Later that day, the Fed's rate decision and Powell's press conference took place:
→ the Fed rate remained unchanged at 5.5% (as expected);
→ Jerome Powell signalled a possible rate cut before the end of the year, hinting at the possibility of two cuts.
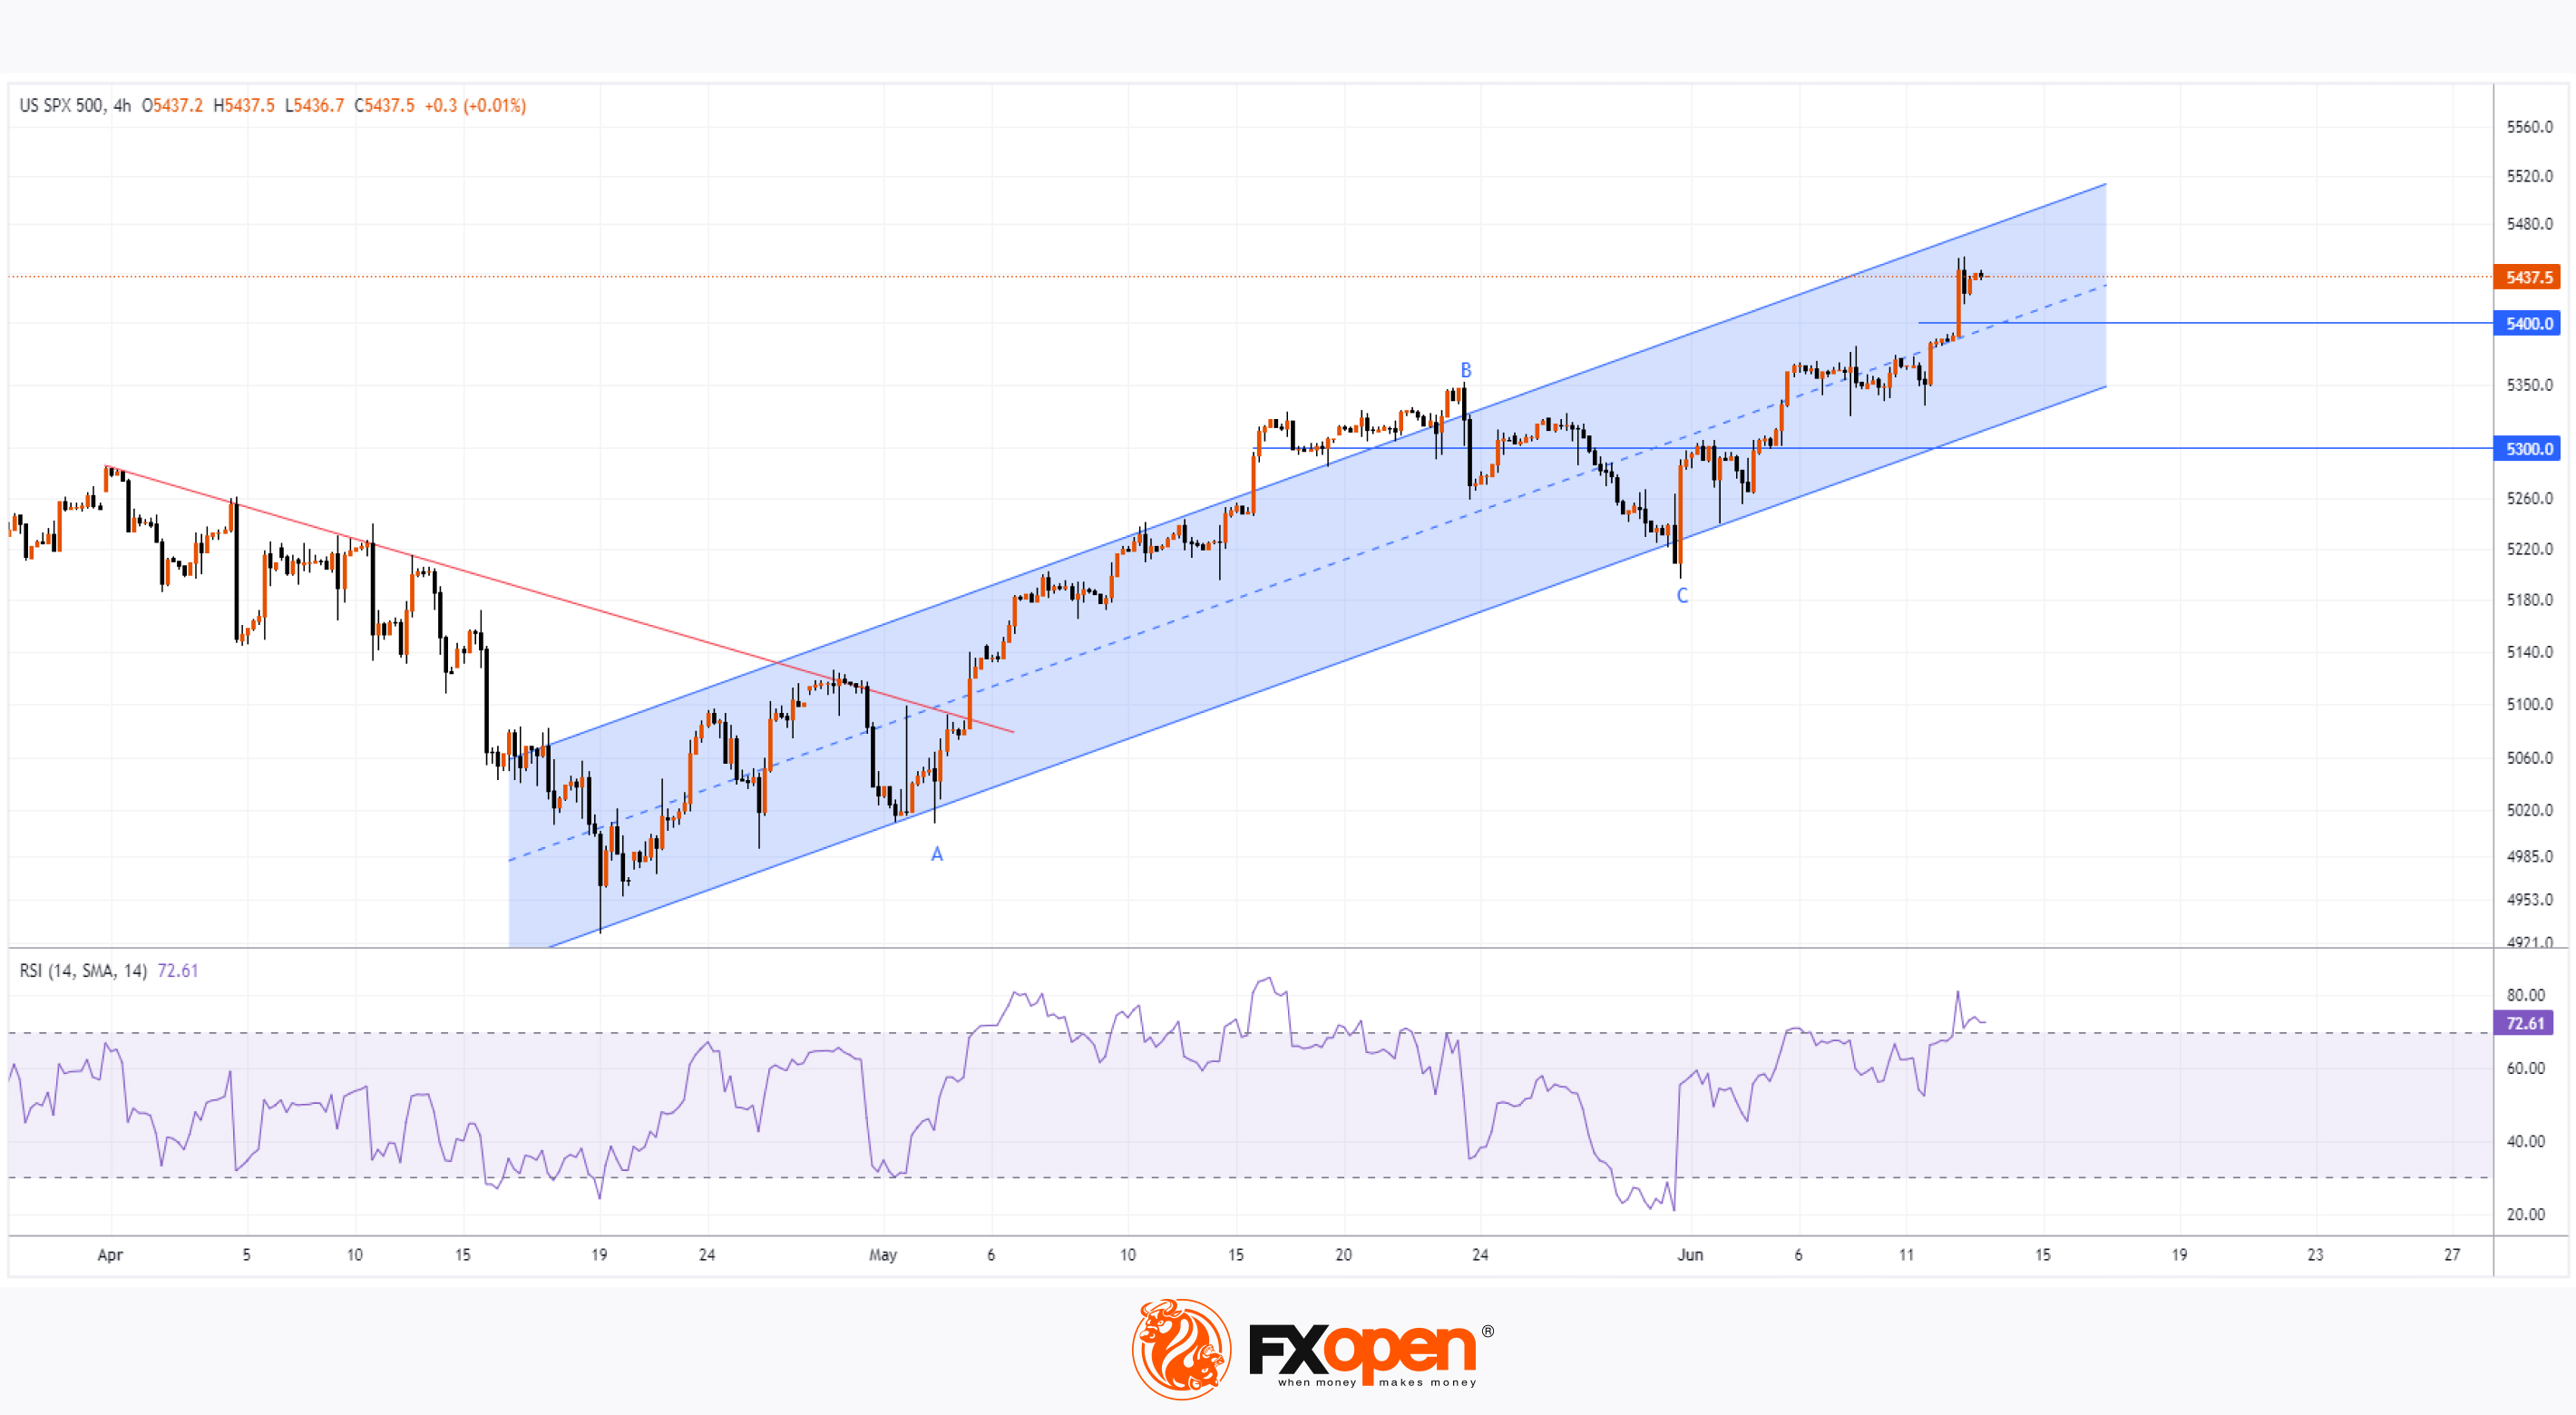
Today's technical analysis of the S&P 500 index (US SPX 500 mini on FXOpen) shows that:
→ the market is moving within an ascending channel (shown in blue);
→ before the news release, the price was near the channel’s median, but it rose towards the upper boundary in the evening;
→ the price crossed the psychological level of 5400, and the RSI entered overbought territory.
Will the rally continue? As the chart shows, the decline from B to C is less than 50% of the rise from A to B, which can be interpreted as a normal correction within an uptrend.
However, the sustainability of this trend will depend on the S&P 500 index (US SPX 500 mini on FXOpen) maintaining its position above 5400. Note the 5300 level: it acted as support from 16-22 May but became resistance on 3-4 June.
Support for bulls in keeping the price above 5400 could come from the median line and more dovish news regarding inflation and Fed rates.
Trade global index CFDs with zero commission and tight spreads. Open your FXOpen account now or learn more about trading index CFDs with FXOpen.
CFDs are complex instruments and come with a high risk of losing your money.
This article represents the opinion of the Companies operating under the FXOpen brand only. It is not to be construed as an offer, solicitation, or recommendation with respect to products and services provided by the Companies operating under the FXOpen brand, nor is it to be considered financial advice.
S&P 500 Index Hits Record After Major News
Yesterday, significant news regarding US inflation was released. According to ForexFactory:
→ Year-on-year Consumer Price Index (CPI): actual = 3.3%, forecast = 3.4%, previous = 3.4%;
→ Month-on-month CPI: actual = 0.0%, forecast = 0.1%, previous = 0.3%;
→ Month-on-month Core CPI (excluding food and energy): actual = 0.2%, forecast = 0.3%, previous = 0.3%.
These official figures indicate that US inflation is slowing down.
This bolstered expectations that the current tight monetary policy might ease. Consequently:
→ the dollar weakened (as we anticipated yesterday while analysing the USD/CAD chart);
→ stock markets surged. Notably, the S&P 500 index (US SPX 500 mini on FXOpen) surpassed 5,444, rising approximately 1.1% within two hours following the inflation news release.
Later that day, the Fed's rate decision and Powell's press conference took place:
→ the Fed rate remained unchanged at 5.5% (as expected);
→ Jerome Powell signalled a possible rate cut before the end of the year, hinting at the possibility of two cuts.
Today's technical analysis of the S&P 500 index (US SPX 500 mini on FXOpen) shows that:
→ the market is moving within an ascending channel (shown in blue);
→ before the news release, the price was near the channel’s median, but it rose towards the upper boundary in the evening;
→ the price crossed the psychological level of 5400, and the RSI entered overbought territory.
Will the rally continue? As the chart shows, the decline from B to C is less than 50% of the rise from A to B, which can be interpreted as a normal correction within an uptrend.
However, the sustainability of this trend will depend on the S&P 500 index (US SPX 500 mini on FXOpen) maintaining its position above 5400. Note the 5300 level: it acted as support from 16-22 May but became resistance on 3-4 June.
Support for bulls in keeping the price above 5400 could come from the median line and more dovish news regarding inflation and Fed rates.
Trade global index CFDs with zero commission and tight spreads. Open your FXOpen account now or learn more about trading index CFDs with FXOpen.
CFDs are complex instruments and come with a high risk of losing your money.
This article represents the opinion of the Companies operating under the FXOpen brand only. It is not to be construed as an offer, solicitation, or recommendation with respect to products and services provided by the Companies operating under the FXOpen brand, nor is it to be considered financial advice.
👍3
#stockmarket #marketanalysis #MarketNews
NZD/USD Exchange Rate Falls from Nearly 5-Month High
The NZD/USD exchange rate has dropped from its highest level in nearly five months. On Wednesday, following the release of US inflation data, the NZD/USD rate exceeded 0.6220 for the first time since 15 January 2024.
However, today the rate has fallen approximately 1.3% from Friday’s peak, suggesting that the market's reaction to the US inflation news was overly emotional.
According to Reuters:
→ Fed Chair Jerome Powell indicated a readiness to keep rates steady until clearer economic signals suggest a need for cuts.
→ Traders have reduced the likelihood of a Fed rate cut at the September meeting.
Meanwhile, the Reserve Bank of New Zealand does not plan to cut rates at all in 2024. According to Trading Economics, any rate cuts are unlikely before mid-2025.
Thus, the policies of the two central banks are balanced, and the current drop from nearly a 5-month high may be a return to a more balanced valuation after an emotional surge into overbought territory.
The RSI indicator supports this view.
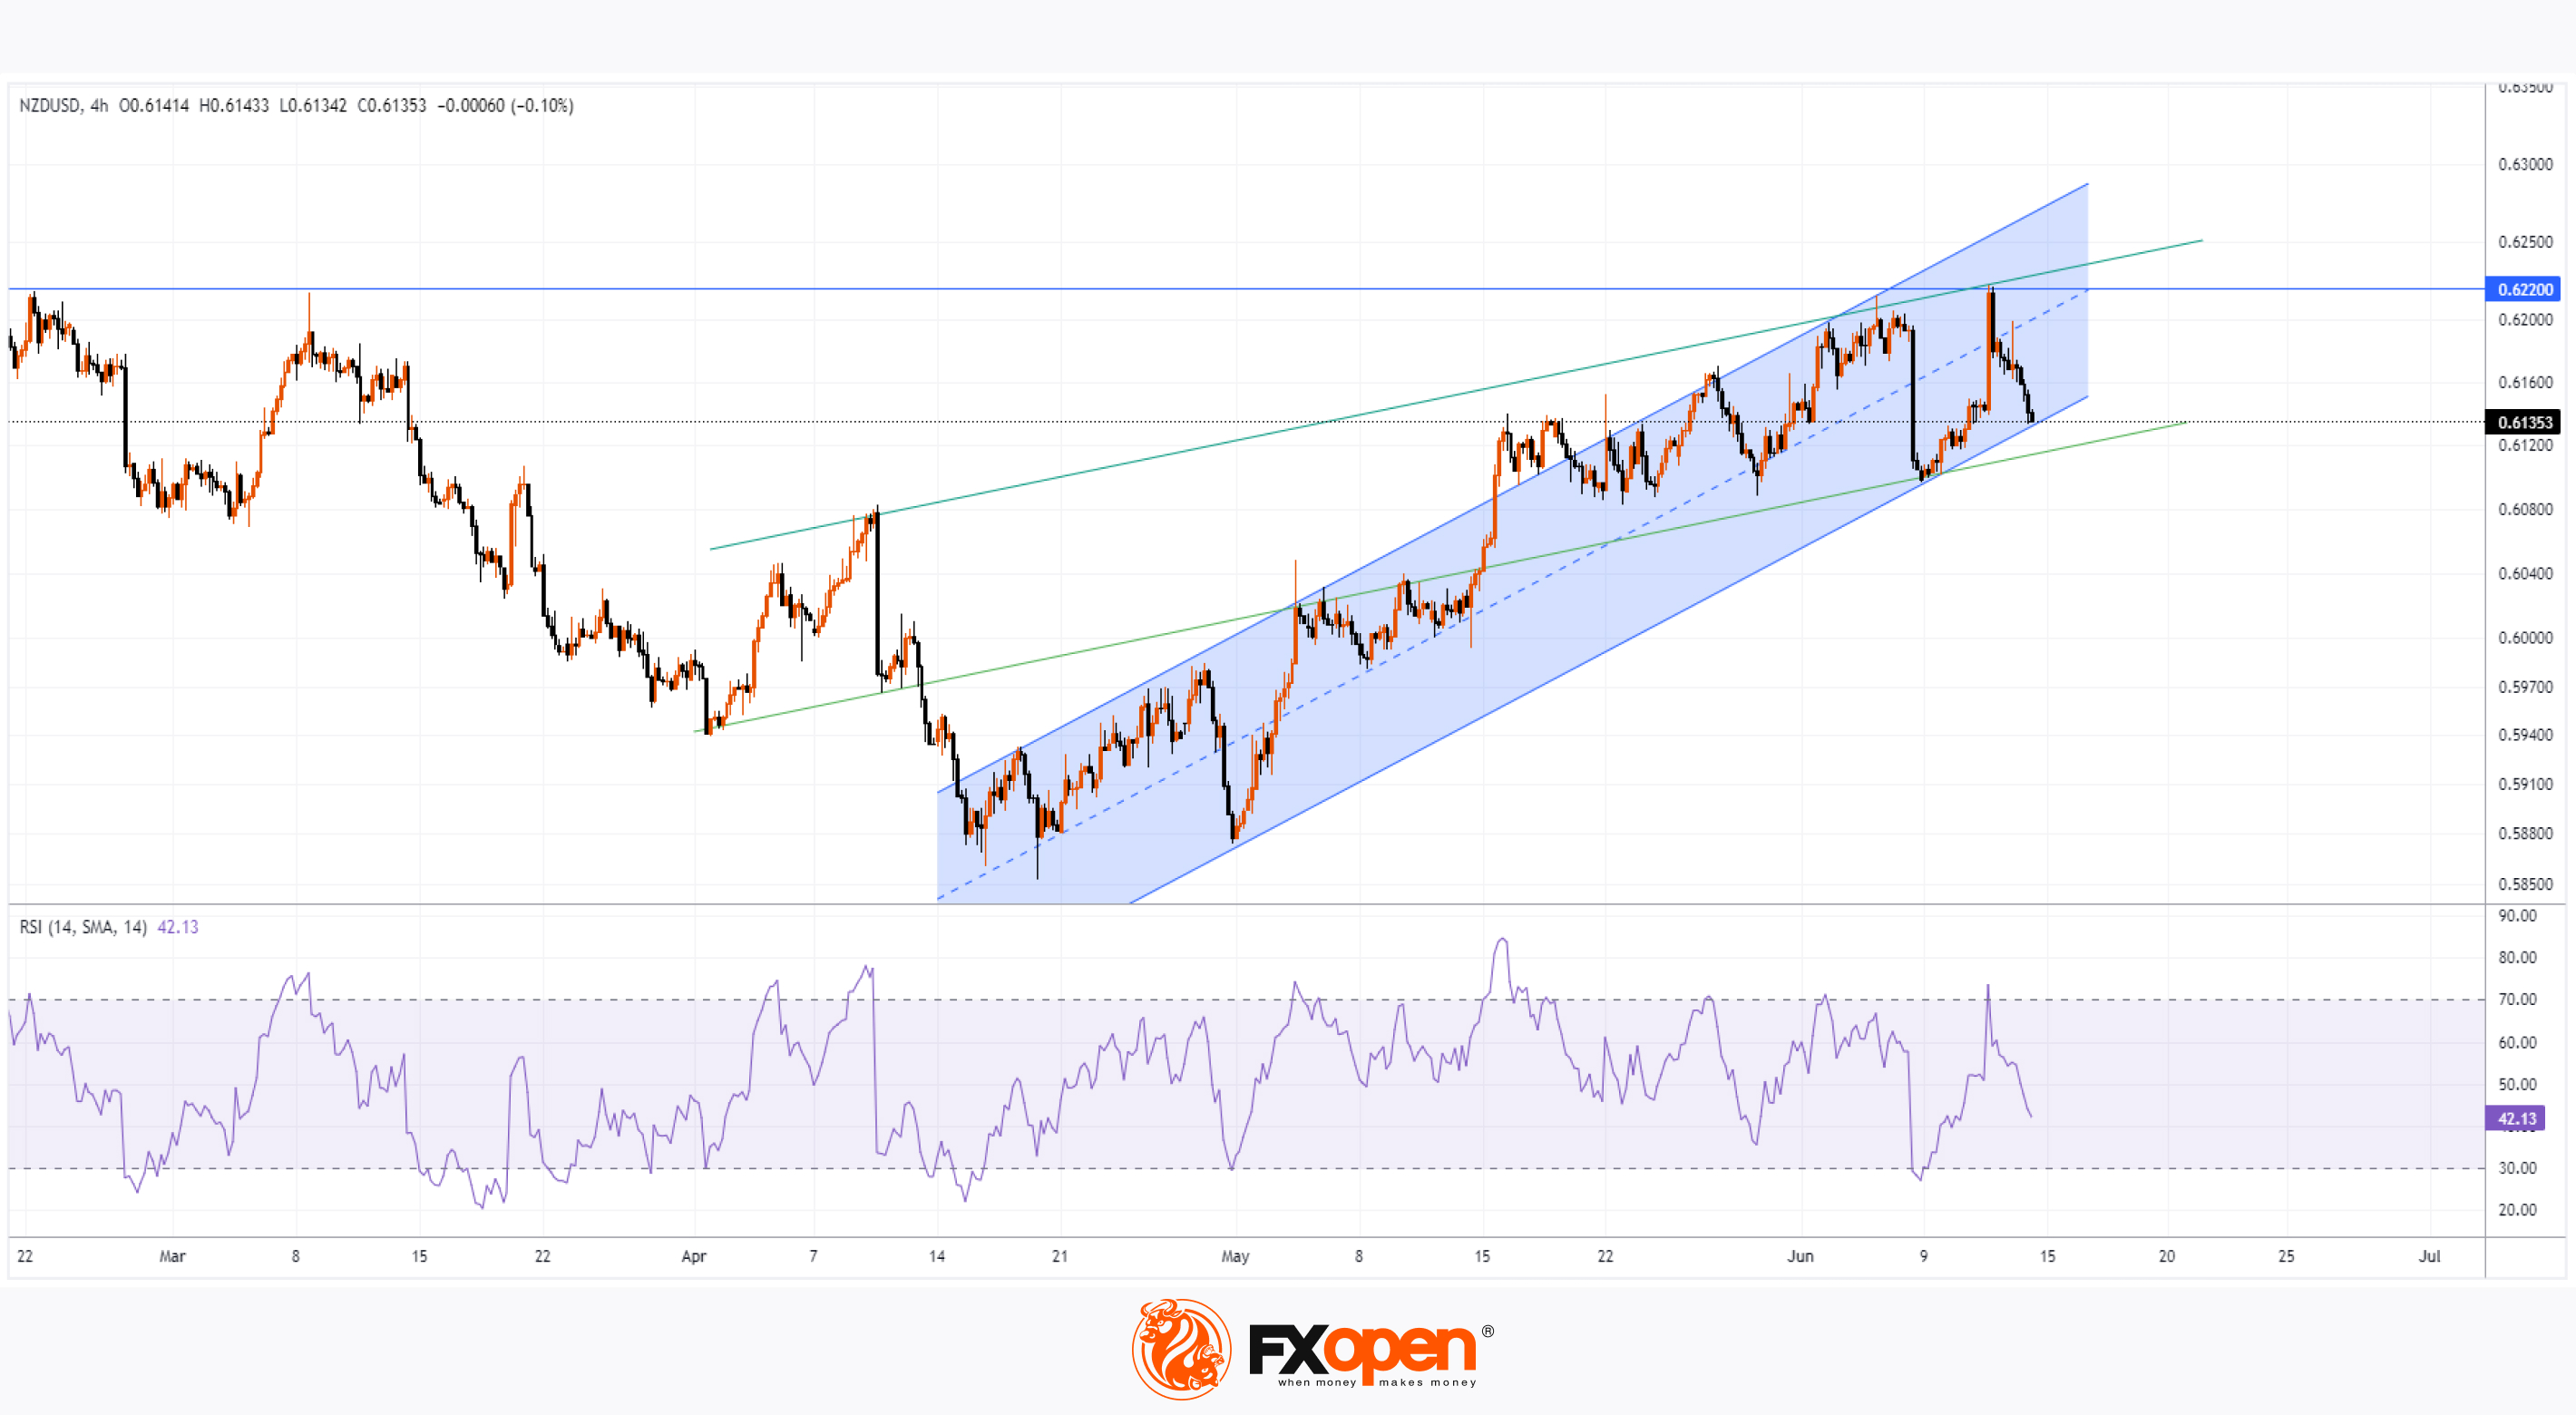
Further technical analysis of the NZD/USD chart provides more valuable insights:
→ Since mid-April, the market has been in an ascending channel (shown in blue);
→ The June peak appears to be a false breakout of the April-March highs;
→ This week, the price failed to reach the upper boundary of the channel and fell sharply to the lower boundary – a bearish sign.
The lower boundary may provide support after Thursday's decline, but if this only leads to a weak rebound, the channel could become more vulnerable to a bearish breakout.
Trade over 50 forex markets 24 hours a day with FXOpen. Take advantage of low commissions, deep liquidity, and spreads from 0.0 pips. Open your FXOpen account now or learn more about trading forex with FXOpen.
CFDs are complex instruments and come with a high risk of losing your money.
This article represents the opinion of the Companies operating under the FXOpen brand only. It is not to be construed as an offer, solicitation, or recommendation with respect to products and services provided by the Companies operating under the FXOpen brand, nor is it to be considered financial advice.
NZD/USD Exchange Rate Falls from Nearly 5-Month High
The NZD/USD exchange rate has dropped from its highest level in nearly five months. On Wednesday, following the release of US inflation data, the NZD/USD rate exceeded 0.6220 for the first time since 15 January 2024.
However, today the rate has fallen approximately 1.3% from Friday’s peak, suggesting that the market's reaction to the US inflation news was overly emotional.
According to Reuters:
→ Fed Chair Jerome Powell indicated a readiness to keep rates steady until clearer economic signals suggest a need for cuts.
→ Traders have reduced the likelihood of a Fed rate cut at the September meeting.
Meanwhile, the Reserve Bank of New Zealand does not plan to cut rates at all in 2024. According to Trading Economics, any rate cuts are unlikely before mid-2025.
Thus, the policies of the two central banks are balanced, and the current drop from nearly a 5-month high may be a return to a more balanced valuation after an emotional surge into overbought territory.
The RSI indicator supports this view.
Further technical analysis of the NZD/USD chart provides more valuable insights:
→ Since mid-April, the market has been in an ascending channel (shown in blue);
→ The June peak appears to be a false breakout of the April-March highs;
→ This week, the price failed to reach the upper boundary of the channel and fell sharply to the lower boundary – a bearish sign.
The lower boundary may provide support after Thursday's decline, but if this only leads to a weak rebound, the channel could become more vulnerable to a bearish breakout.
Trade over 50 forex markets 24 hours a day with FXOpen. Take advantage of low commissions, deep liquidity, and spreads from 0.0 pips. Open your FXOpen account now or learn more about trading forex with FXOpen.
CFDs are complex instruments and come with a high risk of losing your money.
This article represents the opinion of the Companies operating under the FXOpen brand only. It is not to be construed as an offer, solicitation, or recommendation with respect to products and services provided by the Companies operating under the FXOpen brand, nor is it to be considered financial advice.
👍3
#sp500 #stockmarket #USDollar #xau #xauusd #goldprice #ftse100 #FTSE
Weekly Market Wrap With Gary Thomson: S&P 500 Index, US Dollar, FTSE 100 Index, Gold Price
Get the latest scoop on the week's hottest headlines, all in one convenient video. Join Gary Thomson, the COO of FXOpen UK, as he breaks down the most significant news reports and shares his expert insights.
🔸 S&P 500 Index Hits Record after Major News
🔸 Dollar Falls after Inflation Data: is a Change in Medium-Term Trends on the Horizon?
🔸 FTSE 100 Index Declines after Labour Market News
🔸 Gold Price Drops after US Employment Report
Stay in the know and empower yourself with our short, yet power-packed video. Watch it now and stay updated with FXOpen. Don't miss out on this invaluable opportunity to sharpen your trading skills and make informed decisions.
https://cutt.ly/tepuhBjZ
To take advantage of price fluctuations in the foreign exchange markets, consider enlisting the services of a reliable broker like FXOpen.
⚠️
This forecast represents FXOpen Companies opinion only, it should not be construed as an offer, invitation or recommendation in respect to FXOpen Companies products and services or as financial advice
Weekly Market Wrap With Gary Thomson: S&P 500 Index, US Dollar, FTSE 100 Index, Gold Price
Get the latest scoop on the week's hottest headlines, all in one convenient video. Join Gary Thomson, the COO of FXOpen UK, as he breaks down the most significant news reports and shares his expert insights.
🔸 S&P 500 Index Hits Record after Major News
🔸 Dollar Falls after Inflation Data: is a Change in Medium-Term Trends on the Horizon?
🔸 FTSE 100 Index Declines after Labour Market News
🔸 Gold Price Drops after US Employment Report
Stay in the know and empower yourself with our short, yet power-packed video. Watch it now and stay updated with FXOpen. Don't miss out on this invaluable opportunity to sharpen your trading skills and make informed decisions.
https://cutt.ly/tepuhBjZ
To take advantage of price fluctuations in the foreign exchange markets, consider enlisting the services of a reliable broker like FXOpen.
⚠️
This forecast represents FXOpen Companies opinion only, it should not be construed as an offer, invitation or recommendation in respect to FXOpen Companies products and services or as financial advice
YouTube
Weekly Market Wrap With Gary Thomson: S&P 500 Index, US Dollar, FTSE 100 Index, Gold Price
Get the latest scoop on the week's hottest headlines, all in one convenient video. Join Gary Thomson, the COO of FXOpen UK, as he breaks down the most significant news reports and shares his expert insights.
00:43 S&P 500 Index Hits Record after Major News…
00:43 S&P 500 Index Hits Record after Major News…
👍2
#nikkei225 #stockmarket #stocktrading #marketanalysis
Nikkei Index Falls Below 38,000 Points This Month for First Time
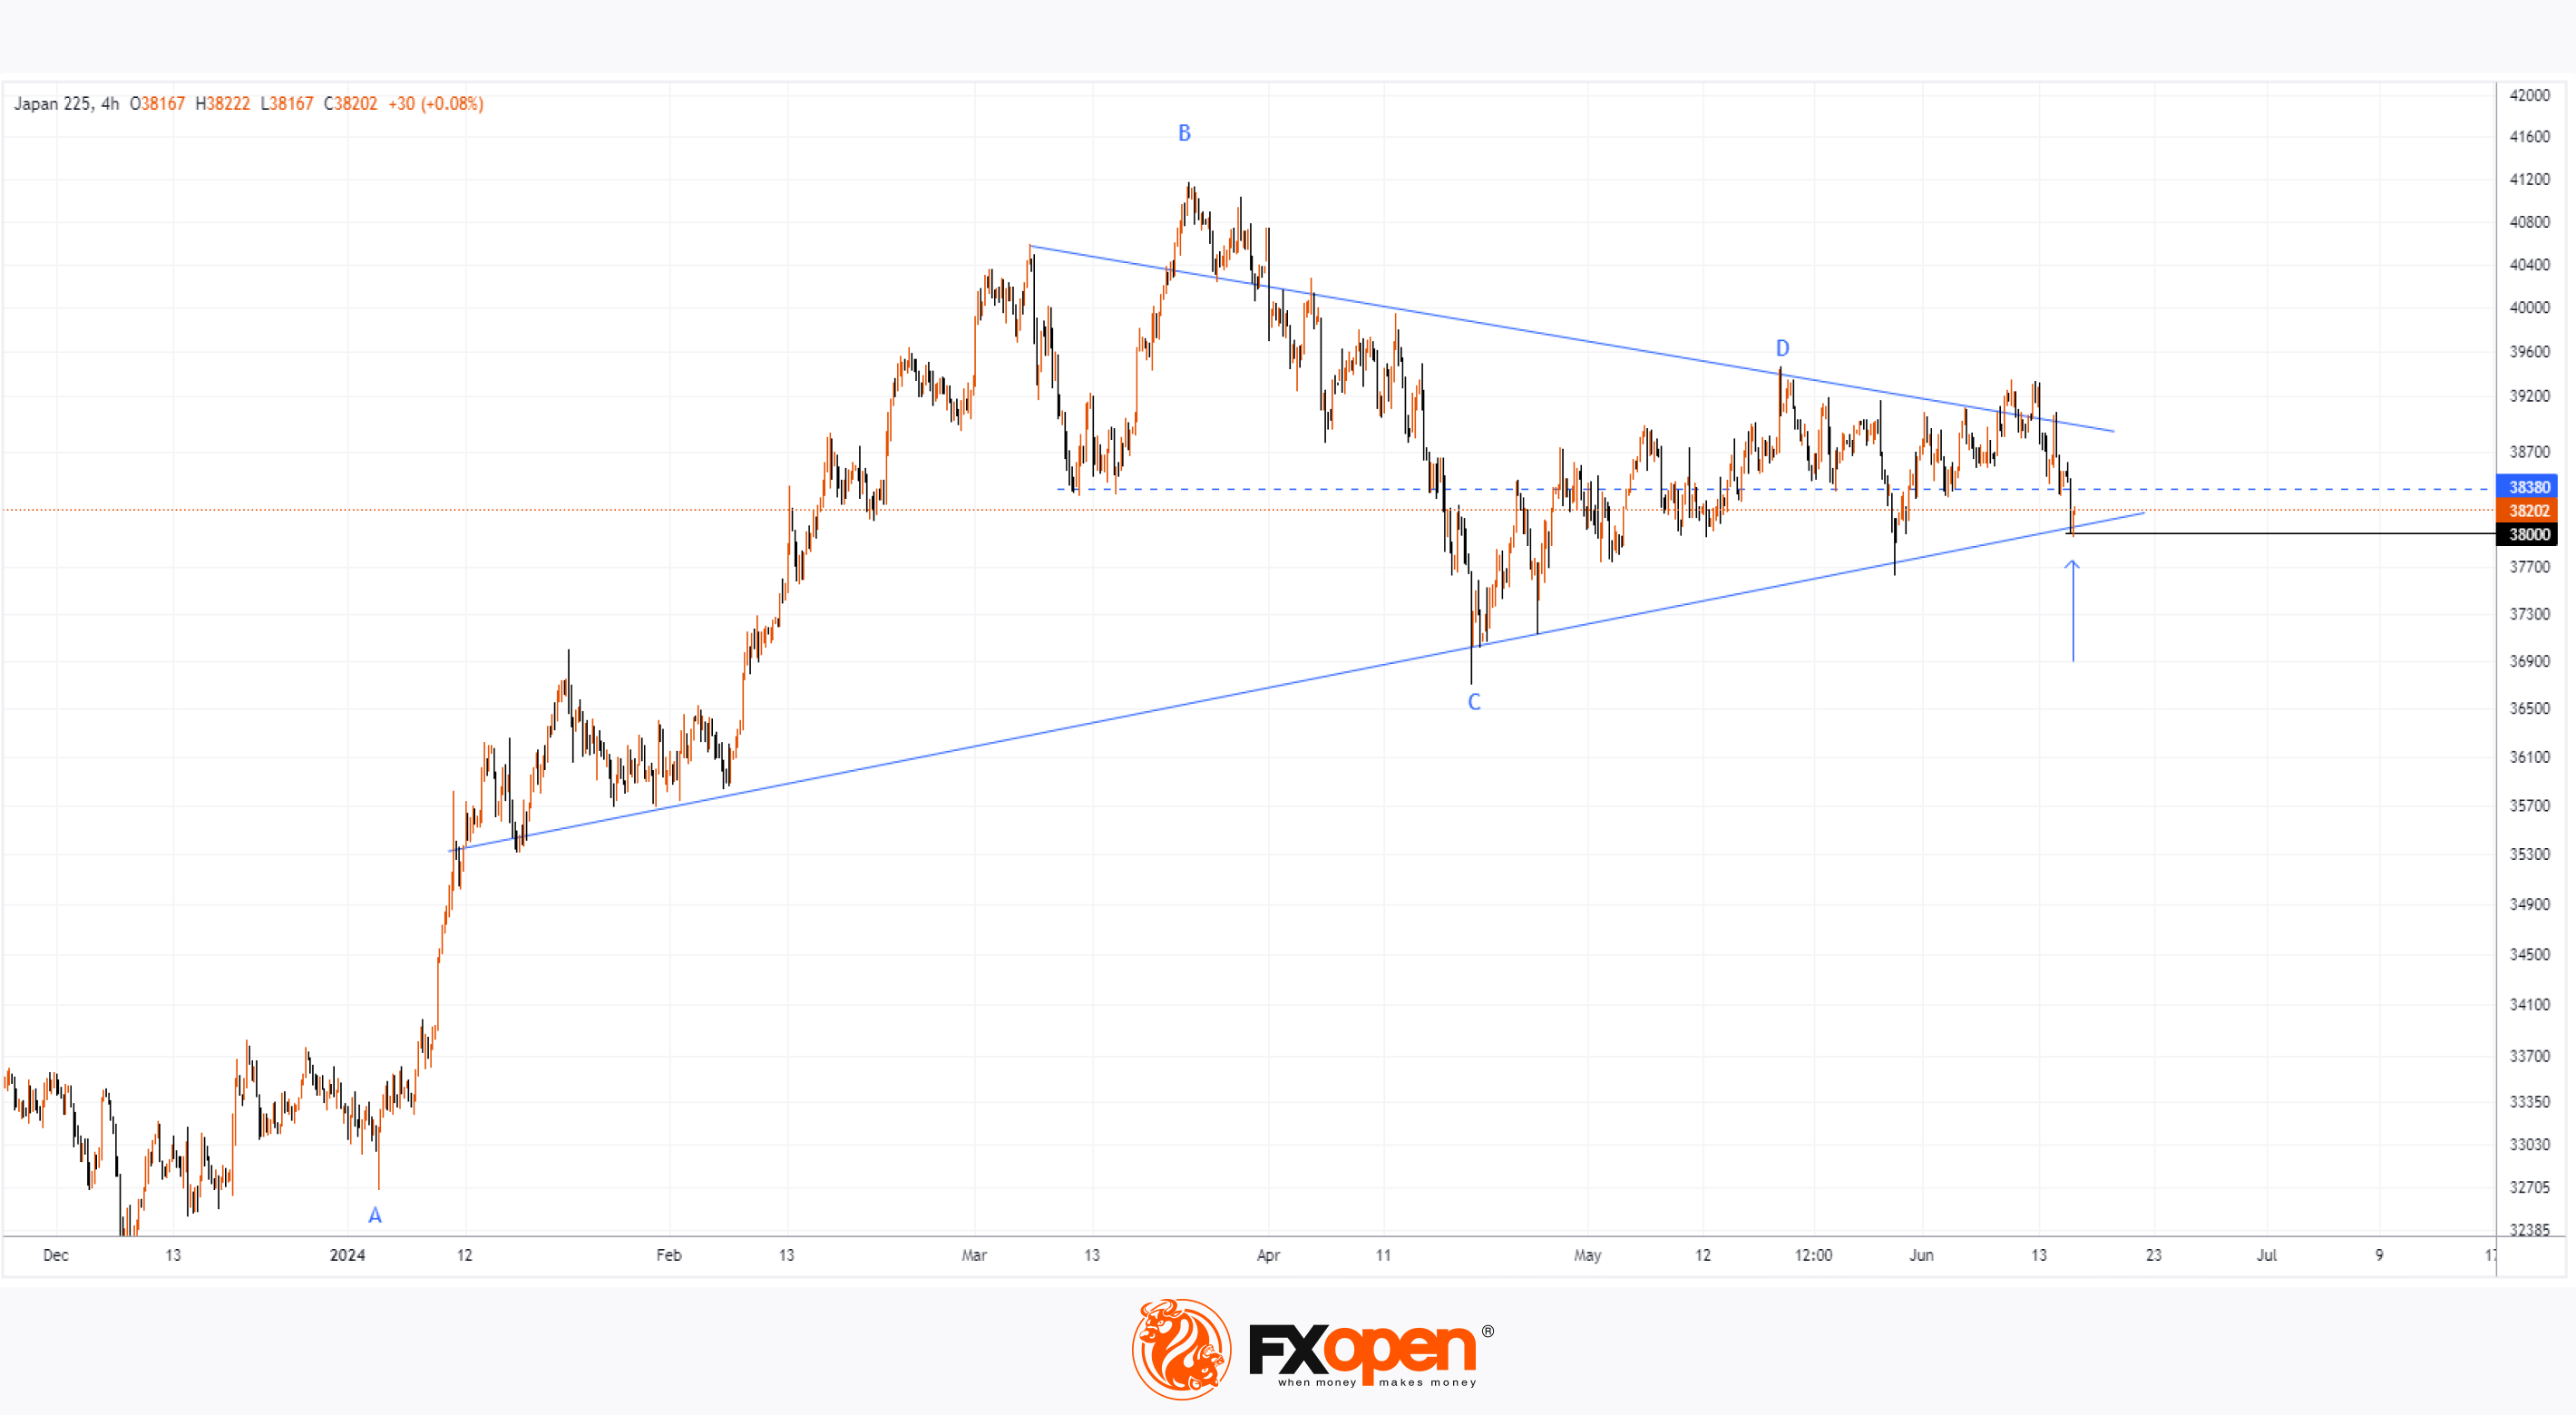
According to today's Nikkei 225 (Japan 225 on FXOpen) chart, the index quote dropped below 38,000 points at Monday's low, followed by a recovery (shown by an arrow).
One of the drivers of the decline was the automotive sector, whose shares led during the downturn. In particular, according to Reuters, Toyota Motors' shares fell by more than 2% as the company faces difficulties due to a certification scandal. Japanese national broadcaster NHK reported that Toyota will extend the production halt for some models until the end of July.
The fact that the Nikkei 225 (Japan 225 on FXOpen) price is recovering after dropping below the 38,000 mark suggests a false bearish breakout below this psychological level.
Technical analysis of the Nikkei 225 (Japan 225 on FXOpen) chart provides more insight into market dynamics:
→ Since the beginning of 2024, there has been a sharp rise from point A to point B by more than 20%;
→ This was followed by a retracement to point C, which constituted a Fibonacci 0.500 proportion of the A→B impulse;
→ Then there was a rise from C to D, forming a Fibonacci 0.382 proportion of the B→C impulse.
Thus, in the first half of the year, there has been a series of diminishing oscillations forming a triangle pattern, indicating a balance between demand and supply around the 38,380 axis.
Today's potential bullish reversal (which is not yet fully formed) could confirm the relevance of the triangle's lower boundary and direct the price towards its axis.
It is worth noting that the triangle boundaries are narrowing, and a possible imminent breakout of this graphical pattern, formed in the first half of 2024, could lead to the establishment of a noticeable trend.
Trade global index CFDs with zero commission and tight spreads. Open your FXOpen account now or learn more about trading index CFDs with FXOpen.
CFDs are complex instruments and come with a high risk of losing your money.
This article represents the opinion of the Companies operating under the FXOpen brand only. It is not to be construed as an offer, solicitation, or recommendation with respect to products and services provided by the Companies operating under the FXOpen brand, nor is it to be considered financial advice.
Nikkei Index Falls Below 38,000 Points This Month for First Time
According to today's Nikkei 225 (Japan 225 on FXOpen) chart, the index quote dropped below 38,000 points at Monday's low, followed by a recovery (shown by an arrow).
One of the drivers of the decline was the automotive sector, whose shares led during the downturn. In particular, according to Reuters, Toyota Motors' shares fell by more than 2% as the company faces difficulties due to a certification scandal. Japanese national broadcaster NHK reported that Toyota will extend the production halt for some models until the end of July.
The fact that the Nikkei 225 (Japan 225 on FXOpen) price is recovering after dropping below the 38,000 mark suggests a false bearish breakout below this psychological level.
Technical analysis of the Nikkei 225 (Japan 225 on FXOpen) chart provides more insight into market dynamics:
→ Since the beginning of 2024, there has been a sharp rise from point A to point B by more than 20%;
→ This was followed by a retracement to point C, which constituted a Fibonacci 0.500 proportion of the A→B impulse;
→ Then there was a rise from C to D, forming a Fibonacci 0.382 proportion of the B→C impulse.
Thus, in the first half of the year, there has been a series of diminishing oscillations forming a triangle pattern, indicating a balance between demand and supply around the 38,380 axis.
Today's potential bullish reversal (which is not yet fully formed) could confirm the relevance of the triangle's lower boundary and direct the price towards its axis.
It is worth noting that the triangle boundaries are narrowing, and a possible imminent breakout of this graphical pattern, formed in the first half of 2024, could lead to the establishment of a noticeable trend.
Trade global index CFDs with zero commission and tight spreads. Open your FXOpen account now or learn more about trading index CFDs with FXOpen.
CFDs are complex instruments and come with a high risk of losing your money.
This article represents the opinion of the Companies operating under the FXOpen brand only. It is not to be construed as an offer, solicitation, or recommendation with respect to products and services provided by the Companies operating under the FXOpen brand, nor is it to be considered financial advice.
👍2
#ADBE #stockmarket #stocktrading #marketanalysis
Adobe's Stock Surges Approximately 15% After Report Publication
On June 5th in the article "Is ADBE Stock Undervalued?", we highlighted several bullish signs, suggesting that the report published on June 13th could be a driver for a resumption of the uptrend.
Adobe's report released on June 13th proved to be strong:
→ Earnings per share: Actual = $4.48, Forecast = $4.39;
→ Revenue: Actual = $5.309 billion, Forecast = $5.291 billion. A 10% increase compared to the same quarter last year.
Furthermore, the company stated that:
→ AI is more of an advantage than a hindrance to business development;
→ “We’re seeing early success monetizing new AI technologies across our Digital Media and Digital Experience businesses,” said Shantanu Narayen, Adobe's CEO.
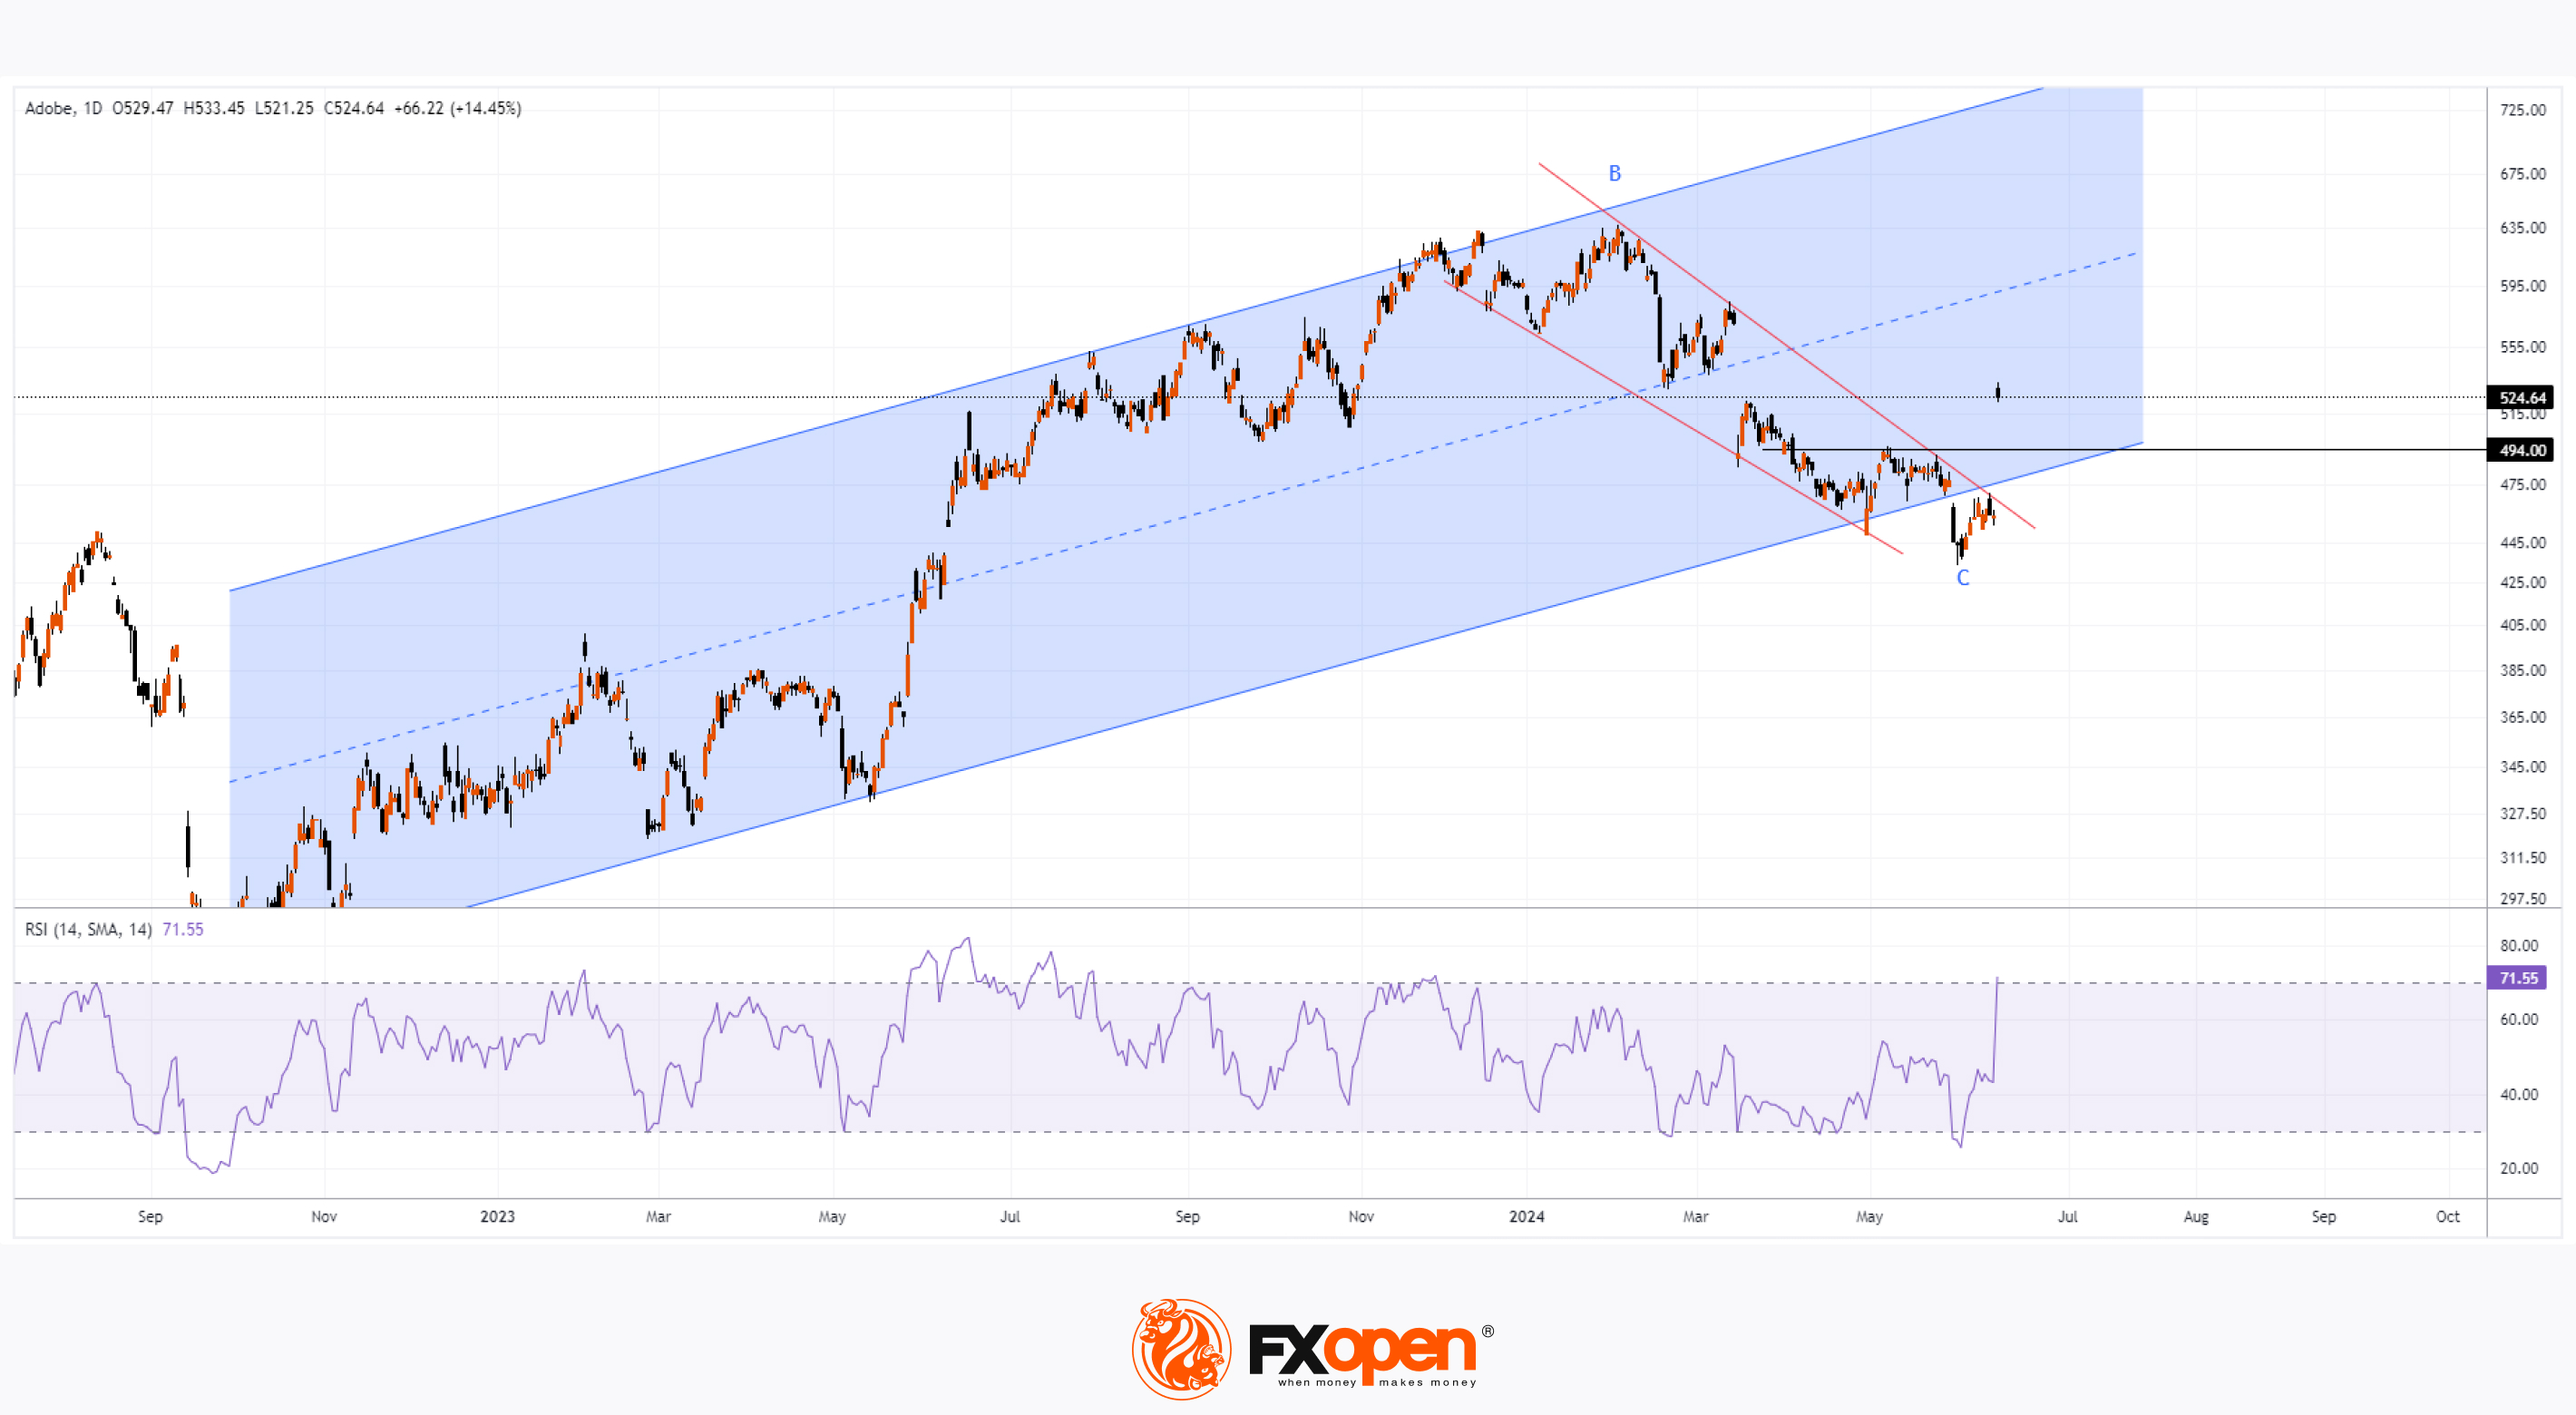
Technical analysis of Adobe's stock shows that:
→ The price has returned to an upward channel (shown in blue) starting from 2023;
→ The price broke a descending formation (shown with red lines), potentially marking a significant correction from point A to point B by approximately 50%;
→ The price surpassed the psychological mark of $500 per share;
→ The price is in the area of the bearish gap from March 15th, which may act as resistance.
Although the RSI indicator on the daily chart of Adobe's stock was in oversold territory at the end of May, today it indicates overbought conditions. There is a possibility that a correction may follow the sharp change in market sentiment, associated with a more thorough evaluation of Adobe's stock prospects.
In such a scenario, support for Adobe's stock price may come from:
→ The psychological level at $500;
→ The lower boundary of the channel;
→ Former resistance at $494.
According to TipRanks, the average price target for Adobe's stock is $613 in 12 months, indicating a growth potential of +16% from current levels.
Trade global index CFDs with zero commission and tight spreads. Open your FXOpen account now or learn more about trading index CFDs with FXOpen.
CFDs are complex instruments and come with a high risk of losing your money.
This article represents the opinion of the Companies operating under the FXOpen brand only. It is not to be construed as an offer, solicitation, or recommendation with respect to products and services provided by the Companies operating under the FXOpen brand, nor is it to be considered financial advice.
Adobe's Stock Surges Approximately 15% After Report Publication
On June 5th in the article "Is ADBE Stock Undervalued?", we highlighted several bullish signs, suggesting that the report published on June 13th could be a driver for a resumption of the uptrend.
Adobe's report released on June 13th proved to be strong:
→ Earnings per share: Actual = $4.48, Forecast = $4.39;
→ Revenue: Actual = $5.309 billion, Forecast = $5.291 billion. A 10% increase compared to the same quarter last year.
Furthermore, the company stated that:
→ AI is more of an advantage than a hindrance to business development;
→ “We’re seeing early success monetizing new AI technologies across our Digital Media and Digital Experience businesses,” said Shantanu Narayen, Adobe's CEO.
Technical analysis of Adobe's stock shows that:
→ The price has returned to an upward channel (shown in blue) starting from 2023;
→ The price broke a descending formation (shown with red lines), potentially marking a significant correction from point A to point B by approximately 50%;
→ The price surpassed the psychological mark of $500 per share;
→ The price is in the area of the bearish gap from March 15th, which may act as resistance.
Although the RSI indicator on the daily chart of Adobe's stock was in oversold territory at the end of May, today it indicates overbought conditions. There is a possibility that a correction may follow the sharp change in market sentiment, associated with a more thorough evaluation of Adobe's stock prospects.
In such a scenario, support for Adobe's stock price may come from:
→ The psychological level at $500;
→ The lower boundary of the channel;
→ Former resistance at $494.
According to TipRanks, the average price target for Adobe's stock is $613 in 12 months, indicating a growth potential of +16% from current levels.
Trade global index CFDs with zero commission and tight spreads. Open your FXOpen account now or learn more about trading index CFDs with FXOpen.
CFDs are complex instruments and come with a high risk of losing your money.
This article represents the opinion of the Companies operating under the FXOpen brand only. It is not to be construed as an offer, solicitation, or recommendation with respect to products and services provided by the Companies operating under the FXOpen brand, nor is it to be considered financial advice.
👍2
#NASDAQ #stockmarket #stocktrading #marketanalysis
Nasdaq 100 Index Reaches 20,000 Points for the First Time
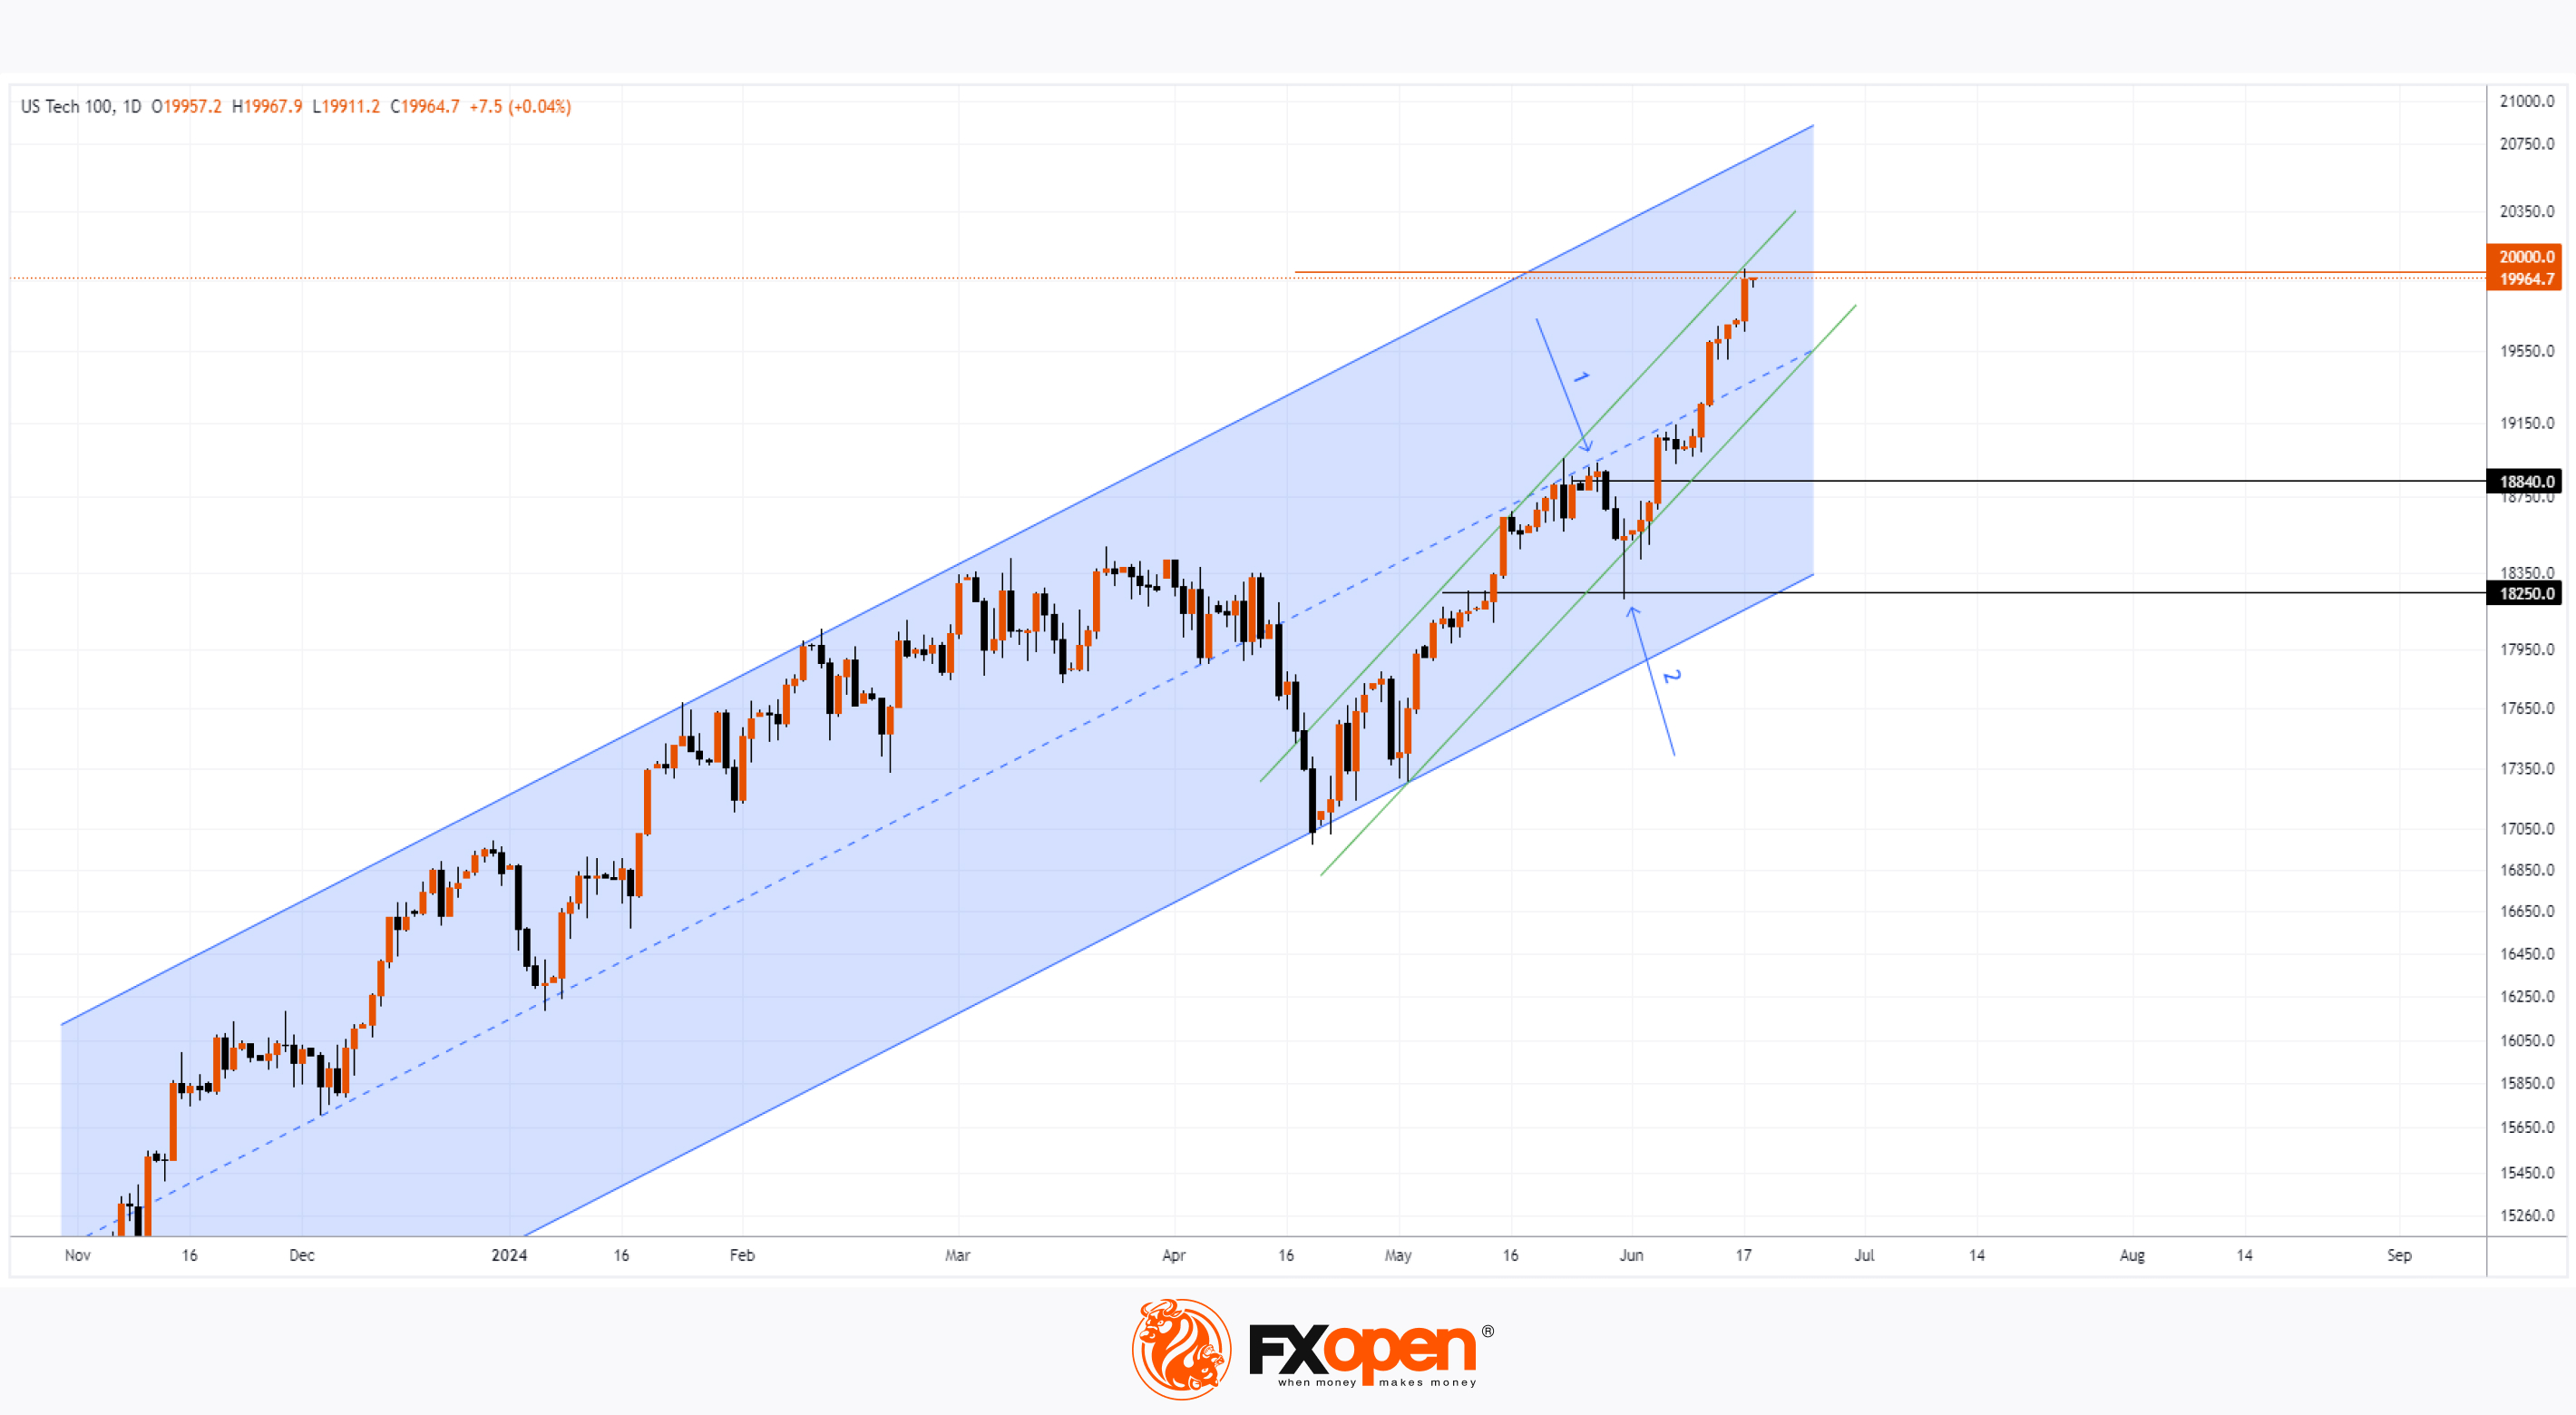
On 30 May, we noted some uncertainty in the price behaviour of the Nasdaq 100 (US Tech 100 mini on FXOpen) near the resistance level of 18,840, as shown by arrow #1.
Following this, the price declined and tested the former resistance at 18,250 (indicated by arrow #2) – the long lower shadow on the candle indicated aggressive demand (more details in the article on the Hammer pattern).
This test gave the bulls confidence to break through the 18,840 resistance.
In June, the price continued to rally within the ascending channel (shown in green), which is part of a larger ascending channel (shown in blue), driven by:
→ prospects for AI implementation;
→ prospects of Fed rate cuts.
Yesterday, the Nasdaq 100 (US Tech 100 mini on FXOpen) rose by approximately 1.2%, reaching the psychological level of 20,000 points. This record was supported by influential analysts raising their forecasts for US stock markets. For example:
→ Goldman Sachs raised the year-end 2024 target for the S&P 500 (US SPX 500 mini on FXOpen) from 5200 to 5600;
→ Evercore ISI increased its forecast for the same index from 4750 to 6000.
Market sentiment was also buoyed by the anticipation of several comments from FOMC members scheduled for this week. These might confirm the Fed's intention to cut rates as early as September this year.
Technical analysis of the Nasdaq 100 (US Tech 100 mini on FXOpen) shows that:
→ The price is in the upper half of the blue channel, with its median line potentially serving as support.
→ The price is near the upper boundary of the green channel, which can be considered resistance. This suggests that the price might retreat from the psychological level of 20k towards the lower boundary of the green channel.
It is possible that the current bullish drivers will remain relevant until September, allowing the Nasdaq 100 (US Tech 100 mini on FXOpen) to continue rising towards the upper boundary of the blue channel.
Trade global index CFDs with zero commission and tight spreads. Open your FXOpen account now or learn more about trading index CFDs with FXOpen.
CFDs are complex instruments and come with a high risk of losing your money.
This article represents the opinion of the Companies operating under the FXOpen brand only. It is not to be construed as an offer, solicitation, or recommendation with respect to products and services provided by the Companies operating under the FXOpen brand, nor is it to be considered financial advice.
Nasdaq 100 Index Reaches 20,000 Points for the First Time
On 30 May, we noted some uncertainty in the price behaviour of the Nasdaq 100 (US Tech 100 mini on FXOpen) near the resistance level of 18,840, as shown by arrow #1.
Following this, the price declined and tested the former resistance at 18,250 (indicated by arrow #2) – the long lower shadow on the candle indicated aggressive demand (more details in the article on the Hammer pattern).
This test gave the bulls confidence to break through the 18,840 resistance.
In June, the price continued to rally within the ascending channel (shown in green), which is part of a larger ascending channel (shown in blue), driven by:
→ prospects for AI implementation;
→ prospects of Fed rate cuts.
Yesterday, the Nasdaq 100 (US Tech 100 mini on FXOpen) rose by approximately 1.2%, reaching the psychological level of 20,000 points. This record was supported by influential analysts raising their forecasts for US stock markets. For example:
→ Goldman Sachs raised the year-end 2024 target for the S&P 500 (US SPX 500 mini on FXOpen) from 5200 to 5600;
→ Evercore ISI increased its forecast for the same index from 4750 to 6000.
Market sentiment was also buoyed by the anticipation of several comments from FOMC members scheduled for this week. These might confirm the Fed's intention to cut rates as early as September this year.
Technical analysis of the Nasdaq 100 (US Tech 100 mini on FXOpen) shows that:
→ The price is in the upper half of the blue channel, with its median line potentially serving as support.
→ The price is near the upper boundary of the green channel, which can be considered resistance. This suggests that the price might retreat from the psychological level of 20k towards the lower boundary of the green channel.
It is possible that the current bullish drivers will remain relevant until September, allowing the Nasdaq 100 (US Tech 100 mini on FXOpen) to continue rising towards the upper boundary of the blue channel.
Trade global index CFDs with zero commission and tight spreads. Open your FXOpen account now or learn more about trading index CFDs with FXOpen.
CFDs are complex instruments and come with a high risk of losing your money.
This article represents the opinion of the Companies operating under the FXOpen brand only. It is not to be construed as an offer, solicitation, or recommendation with respect to products and services provided by the Companies operating under the FXOpen brand, nor is it to be considered financial advice.
👍3
#tsla #stockmarket #marketanalysis #stocktrading
TSLA Shares Revive After Shareholder Meeting
Last week, Tesla held a shareholder meeting where the main events included:
→ Shareholders approving Elon Musk’s $56 billion compensation package in TSLA stock options;
→ Relocating the company’s legal headquarters to Texas;
→ Elon Musk’s statements on robotics, asserting that Optimus robots could make Tesla a $25 trillion company.
Approving the massive compensation eliminated the risk of Musk leaving the company (which would likely have caused a sharp drop in TSLA stock price). The billionaire thanked shareholders and today, 18 June, posted on X (Twitter) announcing that he is working on a new master plan for Tesla’s development, likely focusing on the prospects of Optimus robots.
Additionally, news emerged about the launch of Tesla Model 3 sales at a new price in China. This spurred activity in the TSLA stock market.
According to today’s TSLA stock technical chart:
→ The price is in a downtrend (shown in red);
→ Throughout May, the price fluctuated with low amplitude around the $177 per share level – this led to the ADX indicator dropping to minimal values. However, recent events suggest increasing volatility.
→ If Musk’s increased activity with Tesla gains investor support, this could lead to heightened demand and a bullish breakout of the median line of the red channel;
→ The price may then continue to form an ascending channel (shown in blue), which is becoming more apparent – for instance, rising towards the upper boundary of the red channel.
However, analysts remain sceptical for now. According to TipRanks, the average 12-month price target for TSLA shares is $176.96 (a 5.59% decrease from current levels).
Trade global index CFDs with zero commission and tight spreads. Open your FXOpen account now or learn more about trading index CFDs with FXOpen.
CFDs are complex instruments and come with a high risk of losing your money.
This article represents the opinion of the Companies operating under the FXOpen brand only. It is not to be construed as an offer, solicitation, or recommendation with respect to products and services provided by the Companies operating under the FXOpen brand, nor is it to be considered financial advice.
TSLA Shares Revive After Shareholder Meeting
Last week, Tesla held a shareholder meeting where the main events included:
→ Shareholders approving Elon Musk’s $56 billion compensation package in TSLA stock options;
→ Relocating the company’s legal headquarters to Texas;
→ Elon Musk’s statements on robotics, asserting that Optimus robots could make Tesla a $25 trillion company.
Approving the massive compensation eliminated the risk of Musk leaving the company (which would likely have caused a sharp drop in TSLA stock price). The billionaire thanked shareholders and today, 18 June, posted on X (Twitter) announcing that he is working on a new master plan for Tesla’s development, likely focusing on the prospects of Optimus robots.
Additionally, news emerged about the launch of Tesla Model 3 sales at a new price in China. This spurred activity in the TSLA stock market.
According to today’s TSLA stock technical chart:
→ The price is in a downtrend (shown in red);
→ Throughout May, the price fluctuated with low amplitude around the $177 per share level – this led to the ADX indicator dropping to minimal values. However, recent events suggest increasing volatility.
→ If Musk’s increased activity with Tesla gains investor support, this could lead to heightened demand and a bullish breakout of the median line of the red channel;
→ The price may then continue to form an ascending channel (shown in blue), which is becoming more apparent – for instance, rising towards the upper boundary of the red channel.
However, analysts remain sceptical for now. According to TipRanks, the average 12-month price target for TSLA shares is $176.96 (a 5.59% decrease from current levels).
Trade global index CFDs with zero commission and tight spreads. Open your FXOpen account now or learn more about trading index CFDs with FXOpen.
CFDs are complex instruments and come with a high risk of losing your money.
This article represents the opinion of the Companies operating under the FXOpen brand only. It is not to be construed as an offer, solicitation, or recommendation with respect to products and services provided by the Companies operating under the FXOpen brand, nor is it to be considered financial advice.

👍1
#NVDA #nvidia #stockmarket #stocks
Nvidia Becomes World's Most Valuable Company
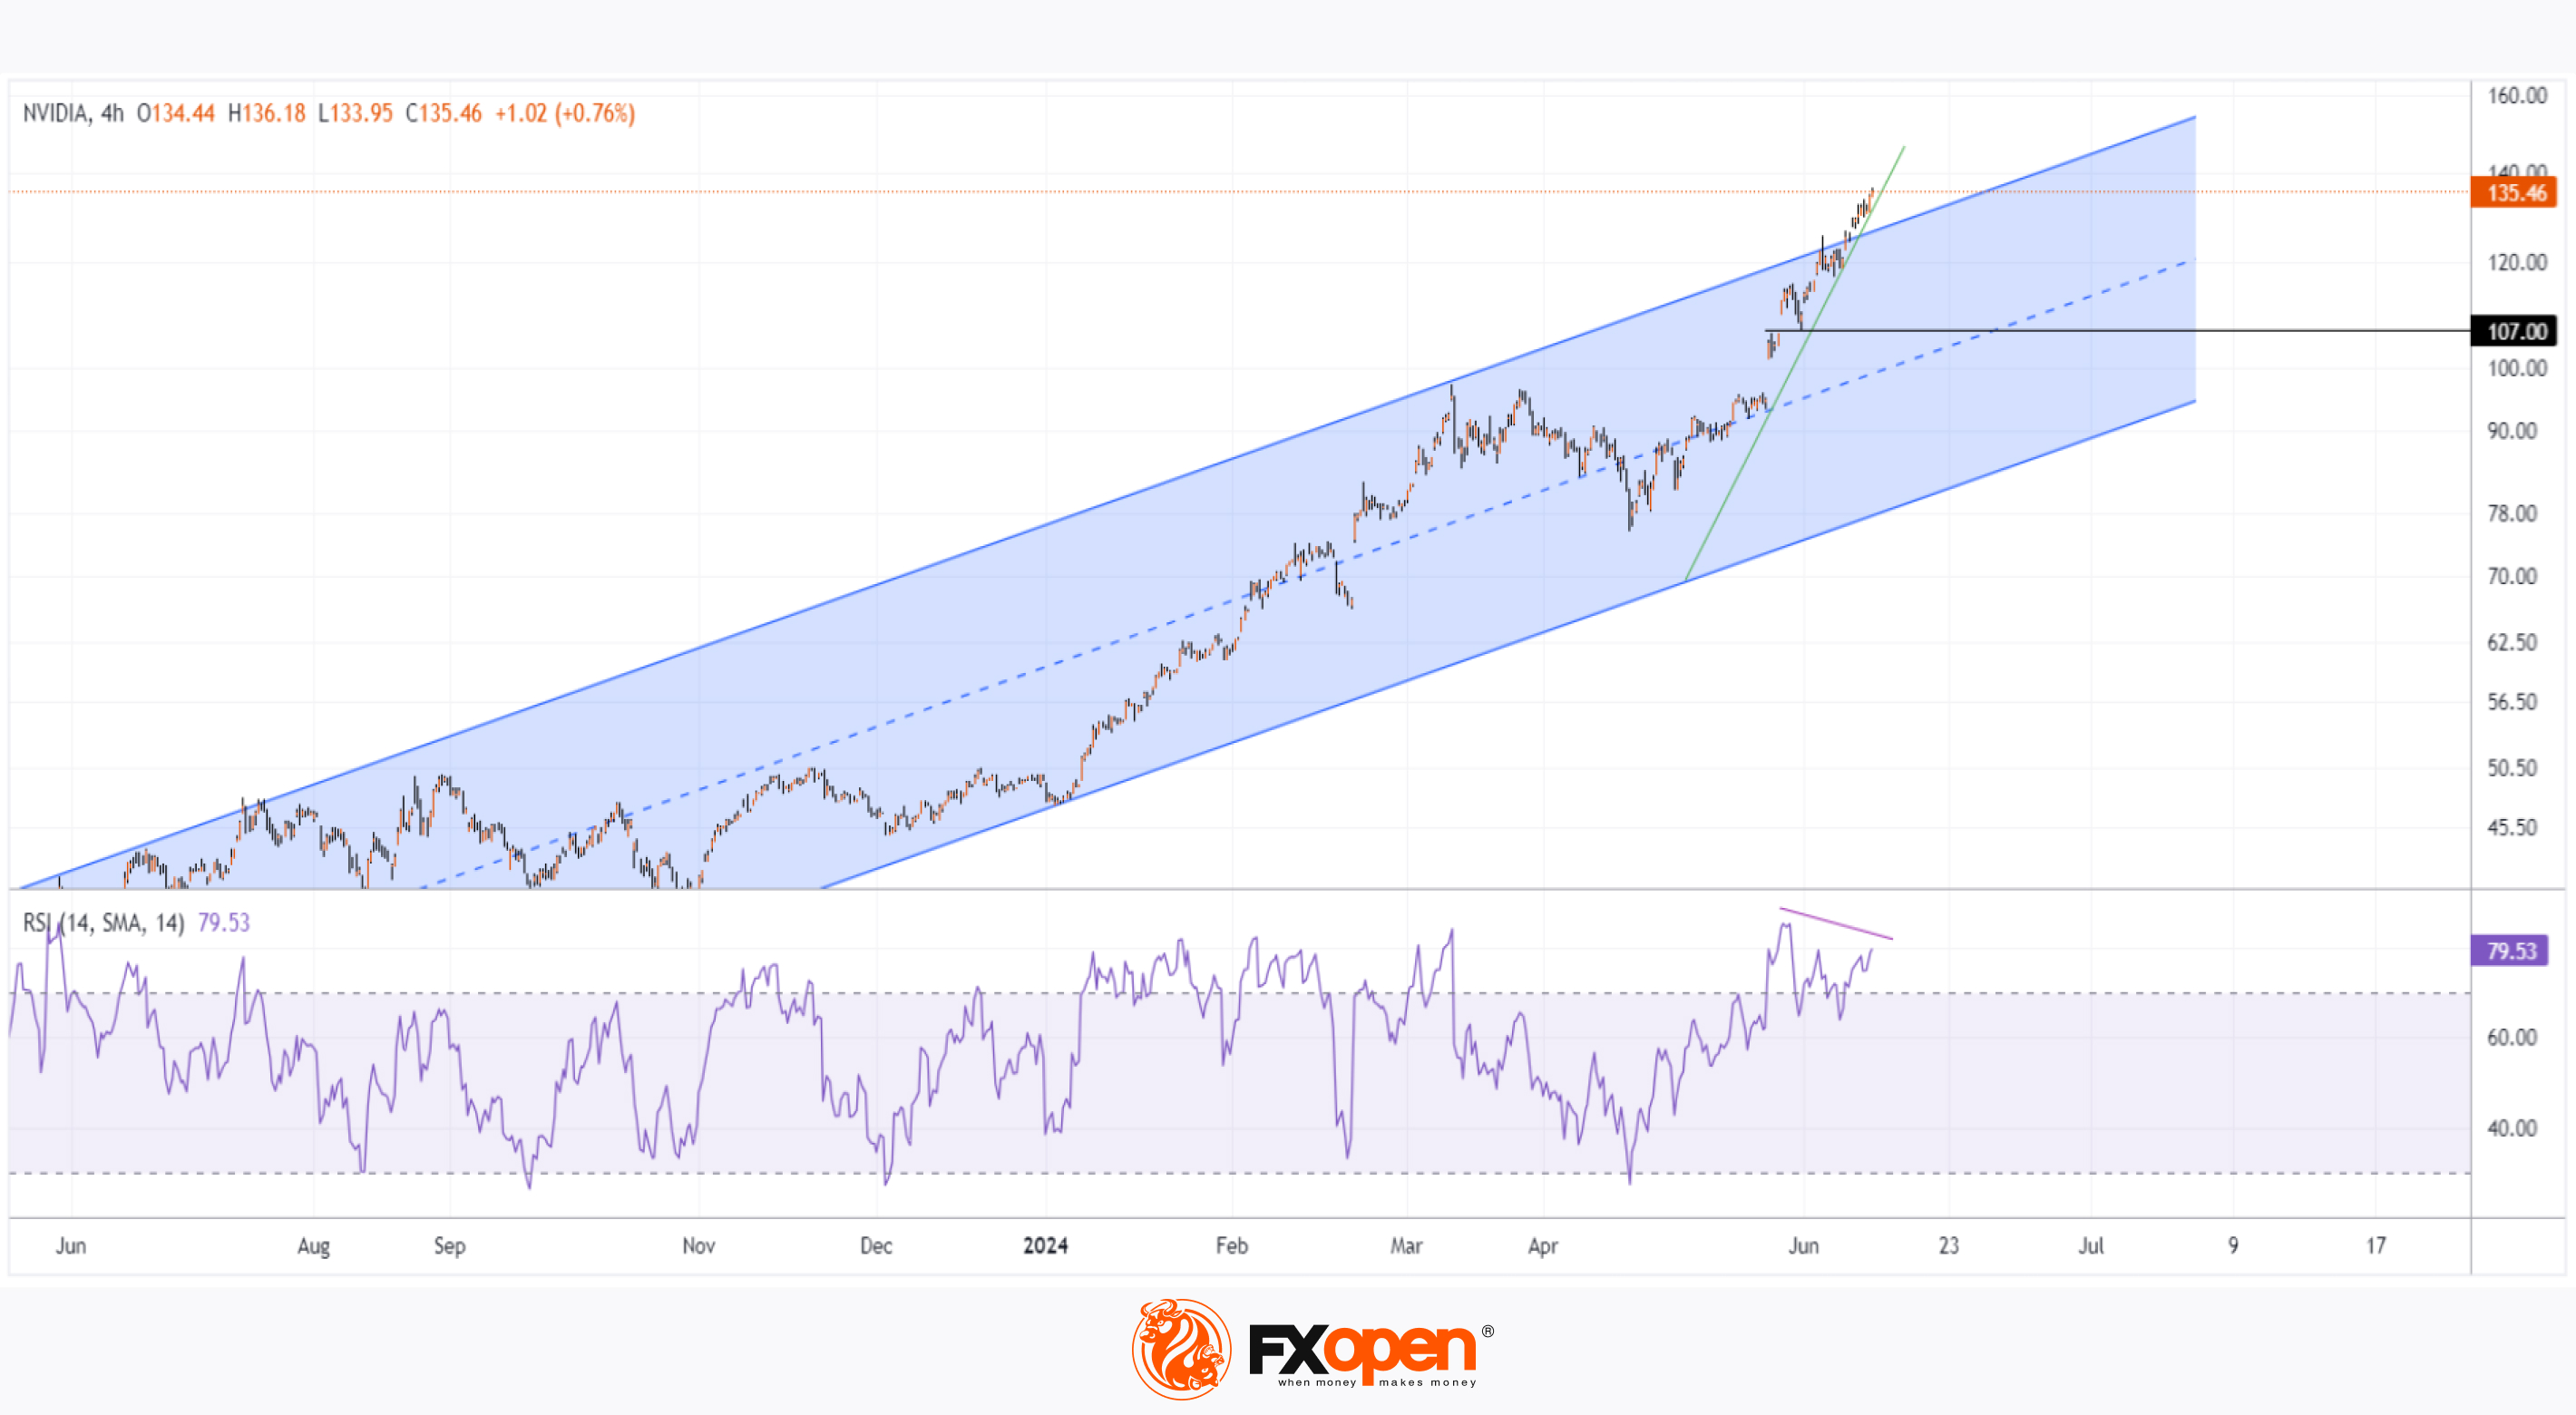
According to the NVDA chart today, the share price rose yesterday to a new all-time high, surpassing $135 (after a 10-to-1 split). This pushed Nvidia's market capitalisation to $3.34 trillion, overtaking Microsoft, which is currently valued at $3.32 trillion.
As CNBC reports:
→ Nvidia shares have risen by more than 170% this year, with a strong driver being the first-quarter earnings report released in May.
→ Since the end of 2022, the shares have increased more than ninefold, driven by the emergence of generative artificial intelligence.
→ Nvidia holds around 80% of the AI chip market used in data centres, with this business expanding thanks to purchases by OpenAI, Microsoft, Alphabet, Amazon, and Meta.
What are the prospects for NVDA's share price? Will the company be able to maintain its status as the most valuable company, a title that has traditionally belonged to either Apple or Microsoft?
Technical analysis of the NVDA chart shows that:
→ The price is moving within an ascending channel (shown in blue);
→ In mid-May, the price found temporary balance along the median line of the blue channel;
→ But then, following the positive wave from the 22nd May report, the NVDA price soared to the upper boundary of the channel, forming a trajectory highlighted by the green trend line.
In fact, with such a channel construction, the market is in an overbought state. This thesis is confirmed by the RSI indicator (where signs of divergence are noticeable).
Therefore, it is reasonable to assume that the price is in a position vulnerable to correction. Although the extremely strong fundamental background related to AI is unlikely to contribute to a deep correction (if it occurs).
According to TipRanks, the average price target for NVDA, as forecasted by Wall Street analysts, is $130.29 (approximately 3% below current levels) over the next 12 months. This could indicate that NVDA's price already fully reflects all bullish factors, making the prospects for further growth uncertain.
Trade global index CFDs with zero commission and tight spreads. Open your FXOpen account now or learn more about trading index CFDs with FXOpen.
CFDs are complex instruments and come with a high risk of losing your money.
This article represents the opinion of the Companies operating under the FXOpen brand only. It is not to be construed as an offer, solicitation, or recommendation with respect to products and services provided by the Companies operating under the FXOpen brand, nor is it to be considered financial advice.
Nvidia Becomes World's Most Valuable Company
According to the NVDA chart today, the share price rose yesterday to a new all-time high, surpassing $135 (after a 10-to-1 split). This pushed Nvidia's market capitalisation to $3.34 trillion, overtaking Microsoft, which is currently valued at $3.32 trillion.
As CNBC reports:
→ Nvidia shares have risen by more than 170% this year, with a strong driver being the first-quarter earnings report released in May.
→ Since the end of 2022, the shares have increased more than ninefold, driven by the emergence of generative artificial intelligence.
→ Nvidia holds around 80% of the AI chip market used in data centres, with this business expanding thanks to purchases by OpenAI, Microsoft, Alphabet, Amazon, and Meta.
What are the prospects for NVDA's share price? Will the company be able to maintain its status as the most valuable company, a title that has traditionally belonged to either Apple or Microsoft?
Technical analysis of the NVDA chart shows that:
→ The price is moving within an ascending channel (shown in blue);
→ In mid-May, the price found temporary balance along the median line of the blue channel;
→ But then, following the positive wave from the 22nd May report, the NVDA price soared to the upper boundary of the channel, forming a trajectory highlighted by the green trend line.
In fact, with such a channel construction, the market is in an overbought state. This thesis is confirmed by the RSI indicator (where signs of divergence are noticeable).
Therefore, it is reasonable to assume that the price is in a position vulnerable to correction. Although the extremely strong fundamental background related to AI is unlikely to contribute to a deep correction (if it occurs).
According to TipRanks, the average price target for NVDA, as forecasted by Wall Street analysts, is $130.29 (approximately 3% below current levels) over the next 12 months. This could indicate that NVDA's price already fully reflects all bullish factors, making the prospects for further growth uncertain.
Trade global index CFDs with zero commission and tight spreads. Open your FXOpen account now or learn more about trading index CFDs with FXOpen.
CFDs are complex instruments and come with a high risk of losing your money.
This article represents the opinion of the Companies operating under the FXOpen brand only. It is not to be construed as an offer, solicitation, or recommendation with respect to products and services provided by the Companies operating under the FXOpen brand, nor is it to be considered financial advice.
👍2
#oilprices #crudeoil #marketanalysis #MarketNews
Brent Crude Oil Price Hits Highest Since 1 May
As the chart shows, yesterday the price of Brent crude oil rose to $84.40, which is the highest level since 1 May 2024.
The demand for Brent crude oil was driven by the following factors:
The holiday season and increasing consumption from automotive and aviation transport. We wrote about this in the Brent market analysis on 11 June. Let us recall that Goldman Sachs analysts suggest that by the end of the summer, the price of Brent may rise to $86 per barrel with a “ceiling” around $90.
Geopolitical tension, namely:
→ Ukrainian drone strikes on Russian oil refining bases.
→ The likelihood of escalation in the Middle East. For instance, Reuters reports that Israel’s Foreign Minister Israel Katz warned of an impending “total war” with Lebanon’s Hezbollah, which is backed by Iran.
Meanwhile, the technical analysis of the Brent crude oil price chart shows that:
→ The price continues to be within the narrowing triangle (shown in blue), which we wrote about on 11 June, but has risen above its median, approximately at the $83.0 level.
→ Additionally, the price is consolidating above the descending trend line (shown in red).
→ The fact that today the Brent price is pulling back after setting yesterday's high appears to be a false bullish breakout of the 29 May peak.
It is possible that, by forming a bull trap, the price will retreat to the median around the $83 level. Additional support could be provided at $81.66, where the bulls found support before breaking through the red line.
However, with the prospect of an increasingly hot summer, the price may continue to rise to the upper boundary of the channel, thereby confirming the Brent crude oil price forecast by Goldman Sachs analysts.
Start trading commodities with tight spreads. Open your trading account now or learn more about trading commodity CFDs with FXOpen.
CFDs are complex instruments and come with a high risk of losing your money.
This article represents the opinion of the Companies operating under the FXOpen brand only. It is not to be construed as an offer, solicitation, or recommendation with respect to products and services provided by the Companies operating under the FXOpen brand, nor is it to be considered financial advice.
Brent Crude Oil Price Hits Highest Since 1 May
As the chart shows, yesterday the price of Brent crude oil rose to $84.40, which is the highest level since 1 May 2024.
The demand for Brent crude oil was driven by the following factors:
The holiday season and increasing consumption from automotive and aviation transport. We wrote about this in the Brent market analysis on 11 June. Let us recall that Goldman Sachs analysts suggest that by the end of the summer, the price of Brent may rise to $86 per barrel with a “ceiling” around $90.
Geopolitical tension, namely:
→ Ukrainian drone strikes on Russian oil refining bases.
→ The likelihood of escalation in the Middle East. For instance, Reuters reports that Israel’s Foreign Minister Israel Katz warned of an impending “total war” with Lebanon’s Hezbollah, which is backed by Iran.
Meanwhile, the technical analysis of the Brent crude oil price chart shows that:
→ The price continues to be within the narrowing triangle (shown in blue), which we wrote about on 11 June, but has risen above its median, approximately at the $83.0 level.
→ Additionally, the price is consolidating above the descending trend line (shown in red).
→ The fact that today the Brent price is pulling back after setting yesterday's high appears to be a false bullish breakout of the 29 May peak.
It is possible that, by forming a bull trap, the price will retreat to the median around the $83 level. Additional support could be provided at $81.66, where the bulls found support before breaking through the red line.
However, with the prospect of an increasingly hot summer, the price may continue to rise to the upper boundary of the channel, thereby confirming the Brent crude oil price forecast by Goldman Sachs analysts.
Start trading commodities with tight spreads. Open your trading account now or learn more about trading commodity CFDs with FXOpen.
CFDs are complex instruments and come with a high risk of losing your money.
This article represents the opinion of the Companies operating under the FXOpen brand only. It is not to be construed as an offer, solicitation, or recommendation with respect to products and services provided by the Companies operating under the FXOpen brand, nor is it to be considered financial advice.

👍2
#marketanalysis #MarketNews
SNB Unexpectedly Lowers Interest Rate from 1.50% to 1.25%
Today, it was announced that the Swiss National Bank (SNB) decided to lower the interest rate to 1.25%. According to ForexFactory, the analyst consensus had expected the rate to remain at 1.50%, making this decision a surprise.
According to SNB Chairman Thomas Jordan:
→ Inflation in Switzerland is decreasing;
→ In recent weeks, the Swiss franc has significantly strengthened due to geopolitical tensions, and the SNB is prepared to be active in the Forex market if necessary.
The market's reaction to the SNB's decision and the statements from its chairman resulted in a sharp weakening of the Swiss franc. Specifically, the USD/CHF rate rose by approximately 0.7% in the first few minutes.
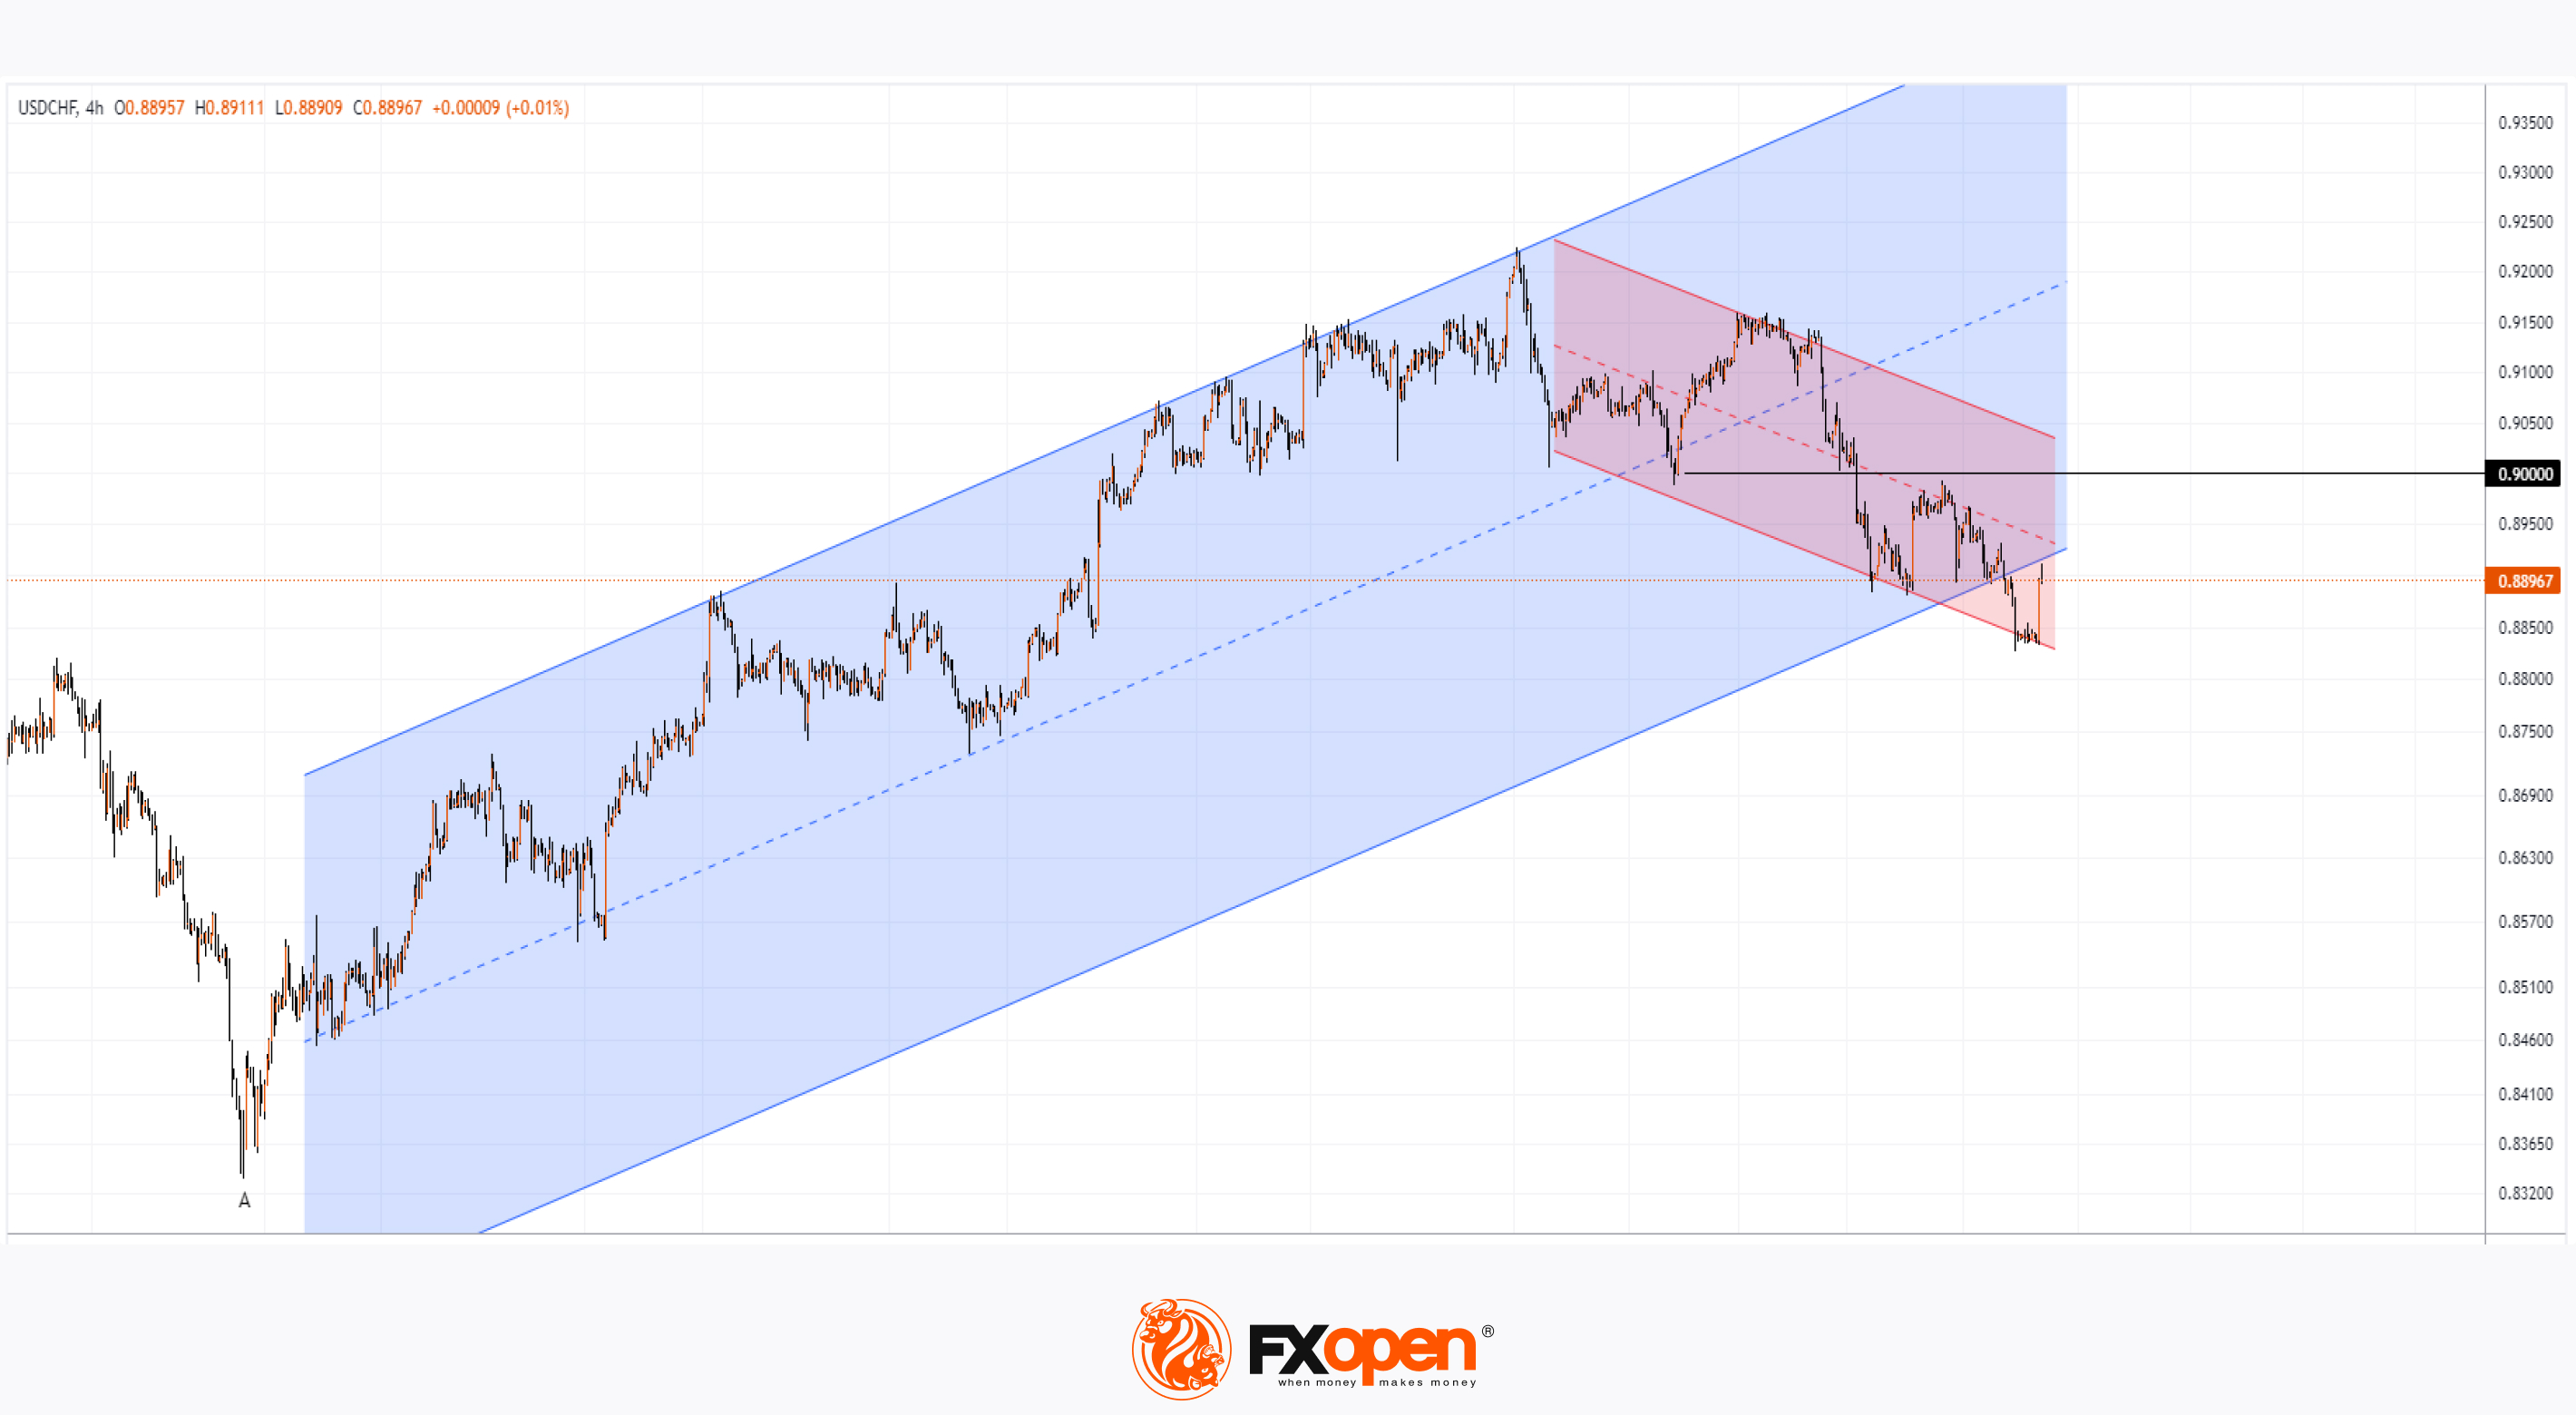
Today's technical analysis of the USD/CHF chart shows:
→ From the beginning of 2024 to May 1 (point B), the market was in an uptrend (shown by the blue channel).
→ From May 1 to today, the USD/CHF price decreased, forming a descending channel (shown in red).
→ The downward movement since May 1 may be a correction within a larger upward trend that began from the low at point A, reached on December 28.
→ Today's upward reversal on the unexpected news from the SNB may indicate the end of the B→C correction. If so, the correction was slightly less than the classic 50%.
If the hypothesis about the end of the correction is correct, it is possible that the USD/CHF price will return to the blue ascending channel. This scenario could be hindered by resistance lines – the median and upper boundary of the red channel. Additionally, the psychological level of 0.900 is seen as an important resistance.
Trade over 50 forex markets 24 hours a day with FXOpen. Take advantage of low commissions, deep liquidity, and spreads from 0.0 pips. Open your FXOpen account now or learn more about trading forex with FXOpen.
CFDs are complex instruments and come with a high risk of losing your money.
This article represents the opinion of the Companies operating under the FXOpen brand only. It is not to be construed as an offer, solicitation, or recommendation with respect to products and services provided by the Companies operating under the FXOpen brand, nor is it to be considered financial advice.
SNB Unexpectedly Lowers Interest Rate from 1.50% to 1.25%
Today, it was announced that the Swiss National Bank (SNB) decided to lower the interest rate to 1.25%. According to ForexFactory, the analyst consensus had expected the rate to remain at 1.50%, making this decision a surprise.
According to SNB Chairman Thomas Jordan:
→ Inflation in Switzerland is decreasing;
→ In recent weeks, the Swiss franc has significantly strengthened due to geopolitical tensions, and the SNB is prepared to be active in the Forex market if necessary.
The market's reaction to the SNB's decision and the statements from its chairman resulted in a sharp weakening of the Swiss franc. Specifically, the USD/CHF rate rose by approximately 0.7% in the first few minutes.
Today's technical analysis of the USD/CHF chart shows:
→ From the beginning of 2024 to May 1 (point B), the market was in an uptrend (shown by the blue channel).
→ From May 1 to today, the USD/CHF price decreased, forming a descending channel (shown in red).
→ The downward movement since May 1 may be a correction within a larger upward trend that began from the low at point A, reached on December 28.
→ Today's upward reversal on the unexpected news from the SNB may indicate the end of the B→C correction. If so, the correction was slightly less than the classic 50%.
If the hypothesis about the end of the correction is correct, it is possible that the USD/CHF price will return to the blue ascending channel. This scenario could be hindered by resistance lines – the median and upper boundary of the red channel. Additionally, the psychological level of 0.900 is seen as an important resistance.
Trade over 50 forex markets 24 hours a day with FXOpen. Take advantage of low commissions, deep liquidity, and spreads from 0.0 pips. Open your FXOpen account now or learn more about trading forex with FXOpen.
CFDs are complex instruments and come with a high risk of losing your money.
This article represents the opinion of the Companies operating under the FXOpen brand only. It is not to be construed as an offer, solicitation, or recommendation with respect to products and services provided by the Companies operating under the FXOpen brand, nor is it to be considered financial advice.
👍2
#MarketNews #XAUUSD #goldprice
The Price of Gold Reached a Two-Week High
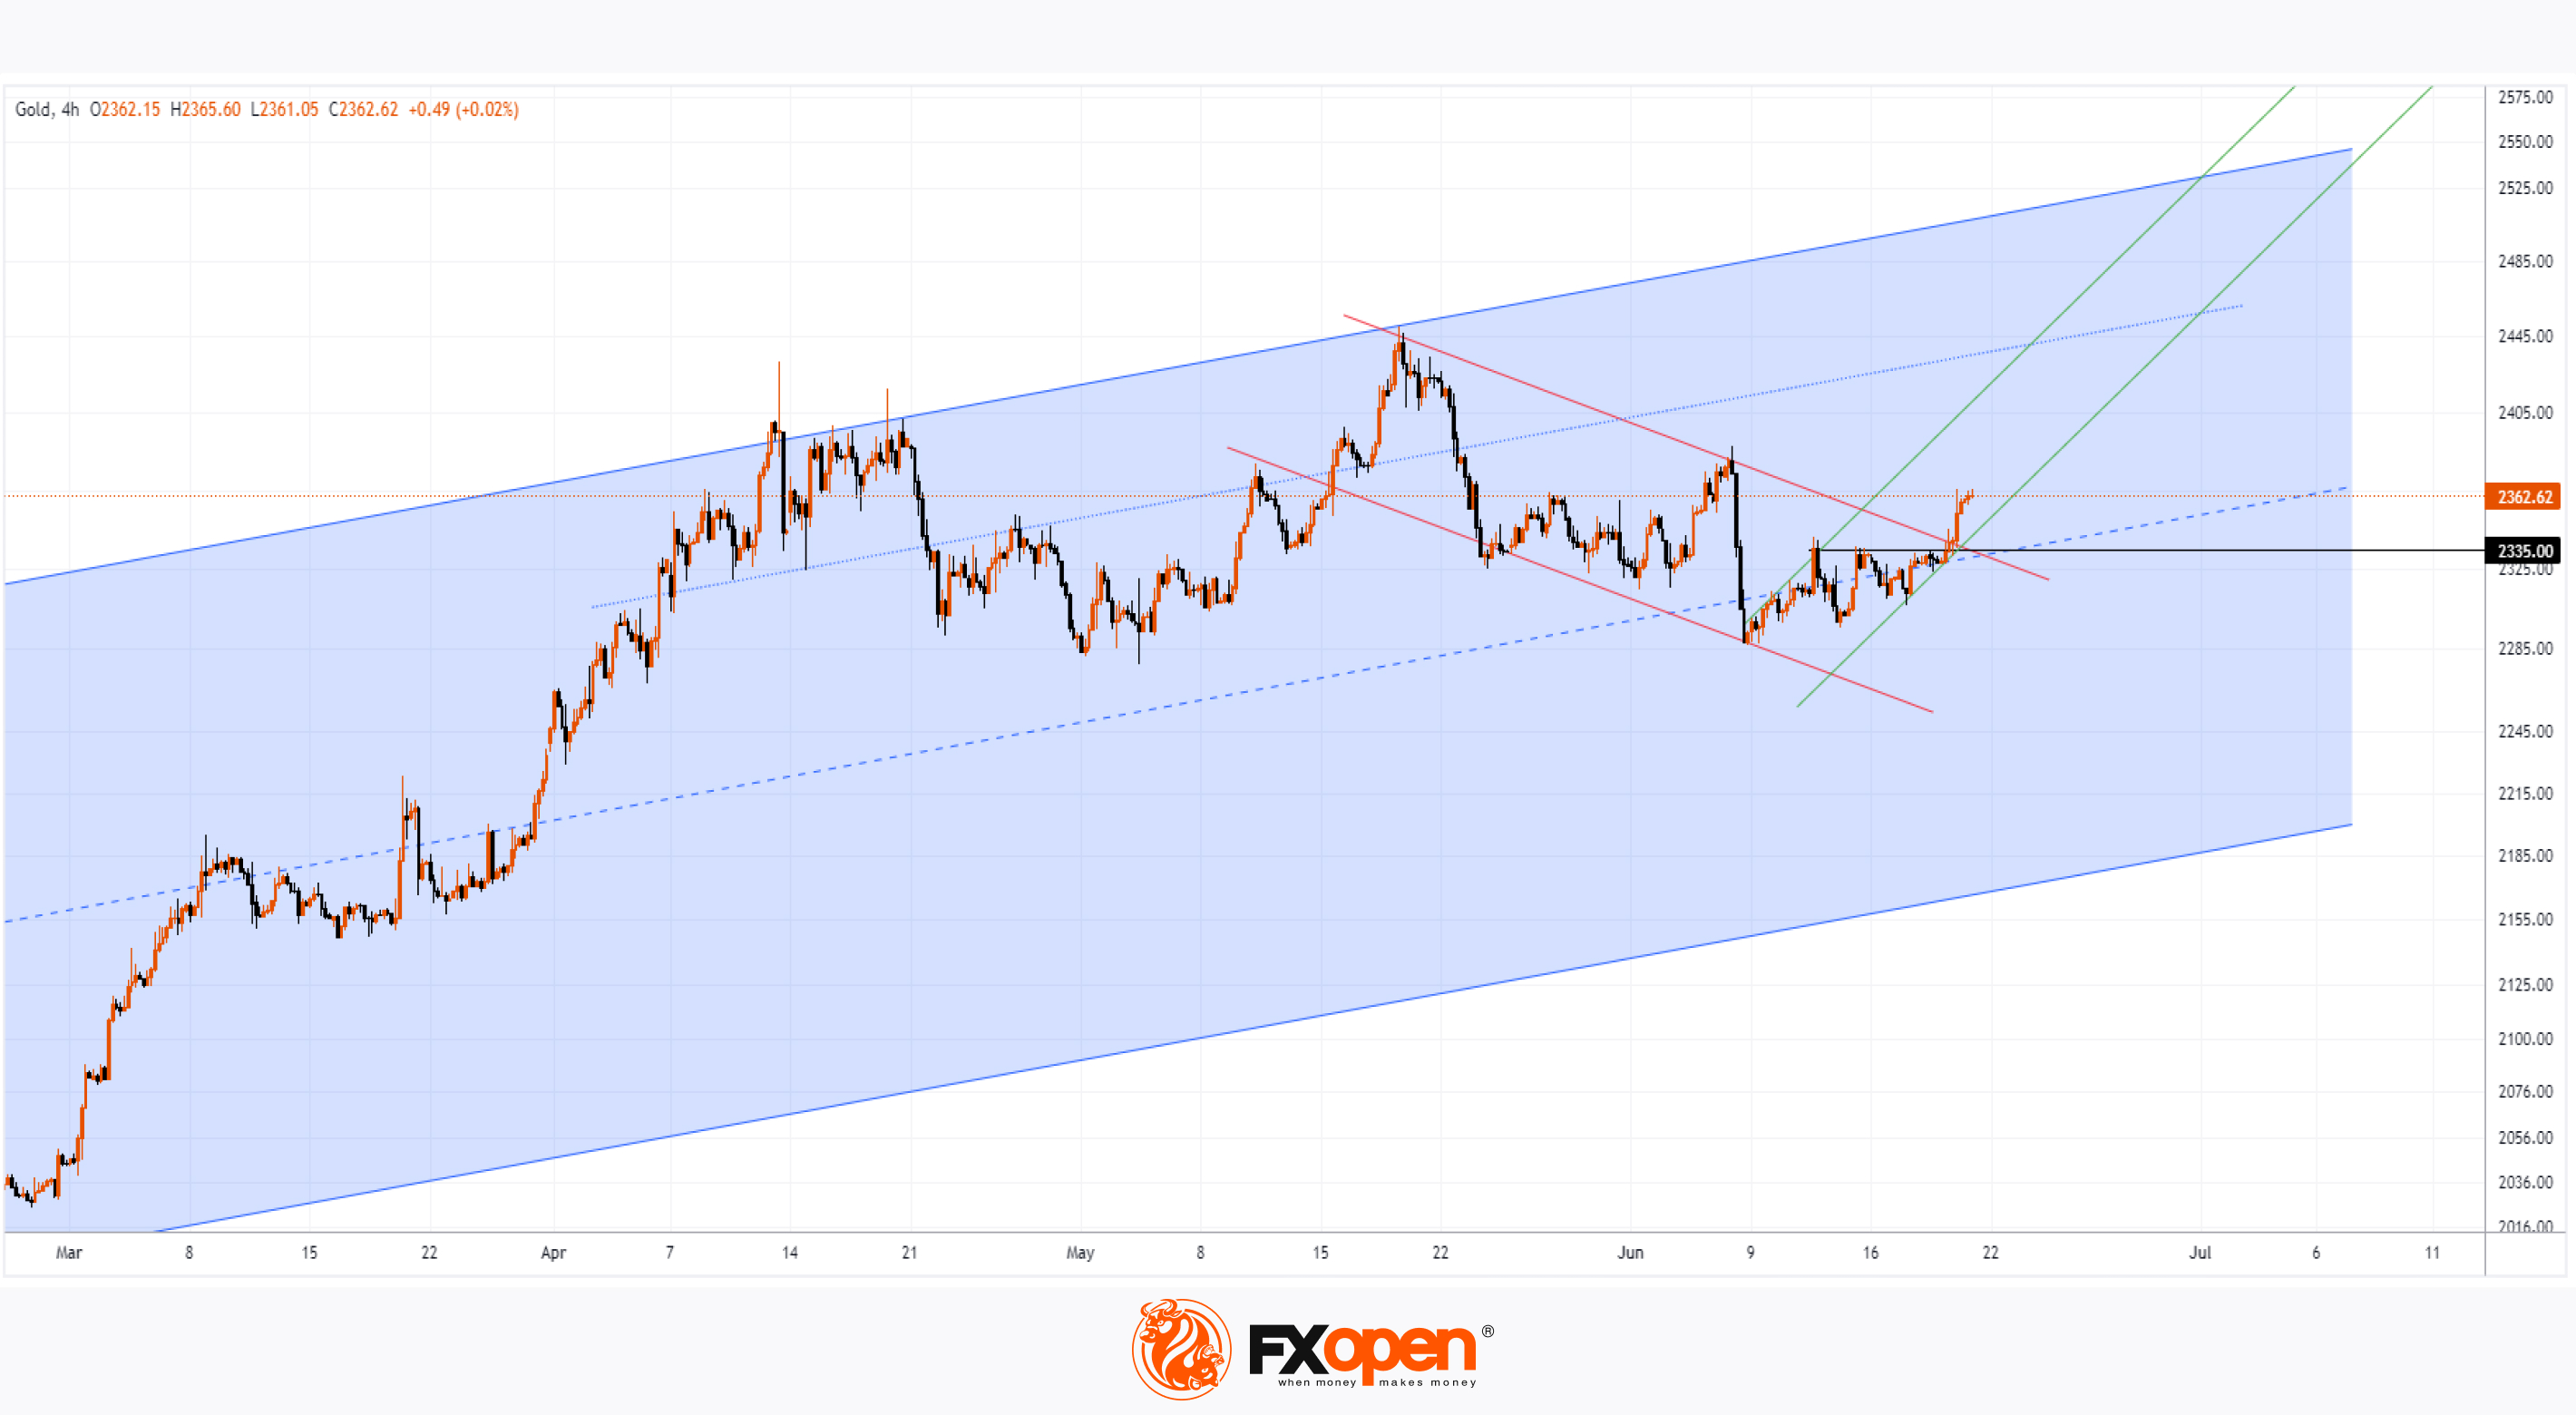
As shown on the XAU/USD chart, this morning the price of gold exceeded $2360 per ounce (approximately +1.5% since the start of the week).
According to Reuters, the increase in the price of gold was driven by:
→ Rising geopolitical tensions in the Middle East.
Hezbollah leader Sayyed Hassan Nasrallah warns of an "all-out war" if Israel launches a full-scale invasion against the Lebanese militia after concluding a military cooperation agreement with Cyprus, with Cyprus potentially becoming a target for Hezbollah.
→ Expectations of a decrease in Fed interest rates.
ANZ Research analysts note that the latest US economic data has shown improved conditions for the Fed to lower rates. High rates typically reduce the attractiveness of gold bars, which do not generate income.
Technical analysis of the XAU/USD chart today provides more valuable information:
→ Having formed a historical high around $2450 on 20th May (which turned out to be a false breakout of the previous high on 12th February), the price of gold entered a correction (shown by the red channel), dropping below $2300.
→ In mid-June, the price of gold fluctuated around the median line of the large ascending channel (shown in blue), which began in October 2023. These diminishing fluctuations around $2313 indicated a temporary equilibrium between supply and demand.
→ The current rise is breaking through both the local resistance at $2335 and the upper red correction line, suggesting that the balance has shifted in favour of the bulls.
It is possible that the rise in the price of gold may attract new buyers, forming a sustainable upward trend on the XAU/USD chart – for example, by creating a channel (shown in green).
Start trading commodities with tight spreads. Open your trading account now or learn more about trading commodity CFDs with FXOpen.
CFDs are complex instruments and come with a high risk of losing your money.
This article represents the opinion of the Companies operating under the FXOpen brand only. It is not to be construed as an offer, solicitation, or recommendation with respect to products and services provided by the Companies operating under the FXOpen brand, nor is it to be considered financial advice.
The Price of Gold Reached a Two-Week High
As shown on the XAU/USD chart, this morning the price of gold exceeded $2360 per ounce (approximately +1.5% since the start of the week).
According to Reuters, the increase in the price of gold was driven by:
→ Rising geopolitical tensions in the Middle East.
Hezbollah leader Sayyed Hassan Nasrallah warns of an "all-out war" if Israel launches a full-scale invasion against the Lebanese militia after concluding a military cooperation agreement with Cyprus, with Cyprus potentially becoming a target for Hezbollah.
→ Expectations of a decrease in Fed interest rates.
ANZ Research analysts note that the latest US economic data has shown improved conditions for the Fed to lower rates. High rates typically reduce the attractiveness of gold bars, which do not generate income.
Technical analysis of the XAU/USD chart today provides more valuable information:
→ Having formed a historical high around $2450 on 20th May (which turned out to be a false breakout of the previous high on 12th February), the price of gold entered a correction (shown by the red channel), dropping below $2300.
→ In mid-June, the price of gold fluctuated around the median line of the large ascending channel (shown in blue), which began in October 2023. These diminishing fluctuations around $2313 indicated a temporary equilibrium between supply and demand.
→ The current rise is breaking through both the local resistance at $2335 and the upper red correction line, suggesting that the balance has shifted in favour of the bulls.
It is possible that the rise in the price of gold may attract new buyers, forming a sustainable upward trend on the XAU/USD chart – for example, by creating a channel (shown in green).
Start trading commodities with tight spreads. Open your trading account now or learn more about trading commodity CFDs with FXOpen.
CFDs are complex instruments and come with a high risk of losing your money.
This article represents the opinion of the Companies operating under the FXOpen brand only. It is not to be construed as an offer, solicitation, or recommendation with respect to products and services provided by the Companies operating under the FXOpen brand, nor is it to be considered financial advice.
👍2
#marketanalysis #MarketNews #gasprices
Natural Gas Price: Bullish Trend Weakens
Forecasts of a hotter summer, published during April and May, led to a sustained bullish trend in the natural gas market, as this commodity is heavily used for air conditioning.
Specifically:
→ The XNG/USD chart indicates that from 1st April to today, the price of natural gas has increased by more than 55%.
→ According to Bloomberg, there is a 61% chance that 2024 will be the hottest year on record, surpassing 2023.
→ Natural gas supplies may be unstable due to an unforeseen maintenance shutdown at the Freeport plant.
According to the technical analysis of the 4-hour XNG/USD chart:
→ The price of natural gas has formed an ascending channel (shown in blue).
→ On 23rd May, the price reached a 2024 high around the 3.160 level, breaking the upper boundary and entering the overbought zone on the RSI indicator.
→ On 11th June, this high was marginally exceeded, but the price then turned down, forming a false bullish breakout pattern.
Thus, the 3.160 level appears to adequately factor in the risks of an extremely hot summer. Therefore, the bullish trend weakens as it approaches this level.
Meanwhile, bears are becoming more active, indicated by:
→ The price of natural gas twice breaking below the green lines of intermediate upward trends.
→ The price broke below the median line of the blue channel (shown by the arrow).
→ This week, the psychological level of 3.000 acted as resistance.
It is possible that the bears could drive the price down to the lower boundary of the blue channel.
Start trading commodities with tight spreads. Open your trading account now or learn more about trading commodity CFDs with FXOpen.
CFDs are complex instruments and come with a high risk of losing your money.
This article represents the opinion of the Companies operating under the FXOpen brand only. It is not to be construed as an offer, solicitation, or recommendation with respect to products and services provided by the Companies operating under the FXOpen brand, nor is it to be considered financial advice.
Natural Gas Price: Bullish Trend Weakens
Forecasts of a hotter summer, published during April and May, led to a sustained bullish trend in the natural gas market, as this commodity is heavily used for air conditioning.
Specifically:
→ The XNG/USD chart indicates that from 1st April to today, the price of natural gas has increased by more than 55%.
→ According to Bloomberg, there is a 61% chance that 2024 will be the hottest year on record, surpassing 2023.
→ Natural gas supplies may be unstable due to an unforeseen maintenance shutdown at the Freeport plant.
According to the technical analysis of the 4-hour XNG/USD chart:
→ The price of natural gas has formed an ascending channel (shown in blue).
→ On 23rd May, the price reached a 2024 high around the 3.160 level, breaking the upper boundary and entering the overbought zone on the RSI indicator.
→ On 11th June, this high was marginally exceeded, but the price then turned down, forming a false bullish breakout pattern.
Thus, the 3.160 level appears to adequately factor in the risks of an extremely hot summer. Therefore, the bullish trend weakens as it approaches this level.
Meanwhile, bears are becoming more active, indicated by:
→ The price of natural gas twice breaking below the green lines of intermediate upward trends.
→ The price broke below the median line of the blue channel (shown by the arrow).
→ This week, the psychological level of 3.000 acted as resistance.
It is possible that the bears could drive the price down to the lower boundary of the blue channel.
Start trading commodities with tight spreads. Open your trading account now or learn more about trading commodity CFDs with FXOpen.
CFDs are complex instruments and come with a high risk of losing your money.
This article represents the opinion of the Companies operating under the FXOpen brand only. It is not to be construed as an offer, solicitation, or recommendation with respect to products and services provided by the Companies operating under the FXOpen brand, nor is it to be considered financial advice.

👍3
#stockmarket #NASDAQ #GBP #oilprices #crudeoil #interestrates #Nasdaq100
Weekly Market Wrap With Gary Thomson: Nasdaq 100 Index, GBP, SNB Interest rate, Brent Crude Oil
Get the latest scoop on the week's hottest headlines, all in one convenient video. Join Gary Thomson, the COO of FXOpen UK, as he breaks down the most significant news reports and shares his expert insights.
🔸Nasdaq 100 Index Reaches 20,000 points for the First Time
🔸GBP Awaits Bank of England Verdict: Volatility Ahead?
🔸SNB Unexpectedly Lowers Interest Rate from 1.50% to 1.25%
🔸Brent Crude Oil Price Hits Highest Since 1 May
Stay in the know and empower yourself with our short, yet power-packed video. Watch it now and stay updated with FXOpen. Don't miss out on this invaluable opportunity to sharpen your trading skills and make informed decisions.
https://cutt.ly/xeaUlkly
To take advantage of price fluctuations in the foreign exchange markets, consider enlisting the services of a reliable broker like FXOpen.
⚠️
This forecast represents FXOpen Companies opinion only, it should not be construed as an offer, invitation or recommendation in respect to FXOpen Companies products and services or as financial advice.
Weekly Market Wrap With Gary Thomson: Nasdaq 100 Index, GBP, SNB Interest rate, Brent Crude Oil
Get the latest scoop on the week's hottest headlines, all in one convenient video. Join Gary Thomson, the COO of FXOpen UK, as he breaks down the most significant news reports and shares his expert insights.
🔸Nasdaq 100 Index Reaches 20,000 points for the First Time
🔸GBP Awaits Bank of England Verdict: Volatility Ahead?
🔸SNB Unexpectedly Lowers Interest Rate from 1.50% to 1.25%
🔸Brent Crude Oil Price Hits Highest Since 1 May
Stay in the know and empower yourself with our short, yet power-packed video. Watch it now and stay updated with FXOpen. Don't miss out on this invaluable opportunity to sharpen your trading skills and make informed decisions.
https://cutt.ly/xeaUlkly
To take advantage of price fluctuations in the foreign exchange markets, consider enlisting the services of a reliable broker like FXOpen.
⚠️
This forecast represents FXOpen Companies opinion only, it should not be construed as an offer, invitation or recommendation in respect to FXOpen Companies products and services or as financial advice.
YouTube
Weekly Market Wrap With Gary Thomson: Nasdaq 100 Index, GBP, SNB Interest rate, Brent Crude Oil
Get the latest scoop on the week's hottest headlines, all in one convenient video. Join Gary Thomson, the COO of FXOpen UK, as he breaks down the most significant news reports and shares his expert insights.
00:36 Nasdaq 100 Index Reaches 20,000 points…
00:36 Nasdaq 100 Index Reaches 20,000 points…
👍2
#stockmarket #stocktrading #marketanalysis #sp500
S&P 500 Falls from Record High in Anticipation of Key News
On Friday, at 15:30 GMT+3, the Core PCE Price Index values will be released – an economic indicator to which the Federal Reserve pays special attention when assessing inflation levels in the US. This event is likely to cause a surge of news in the financial markets, and its anticipation will influence sentiments throughout the week.
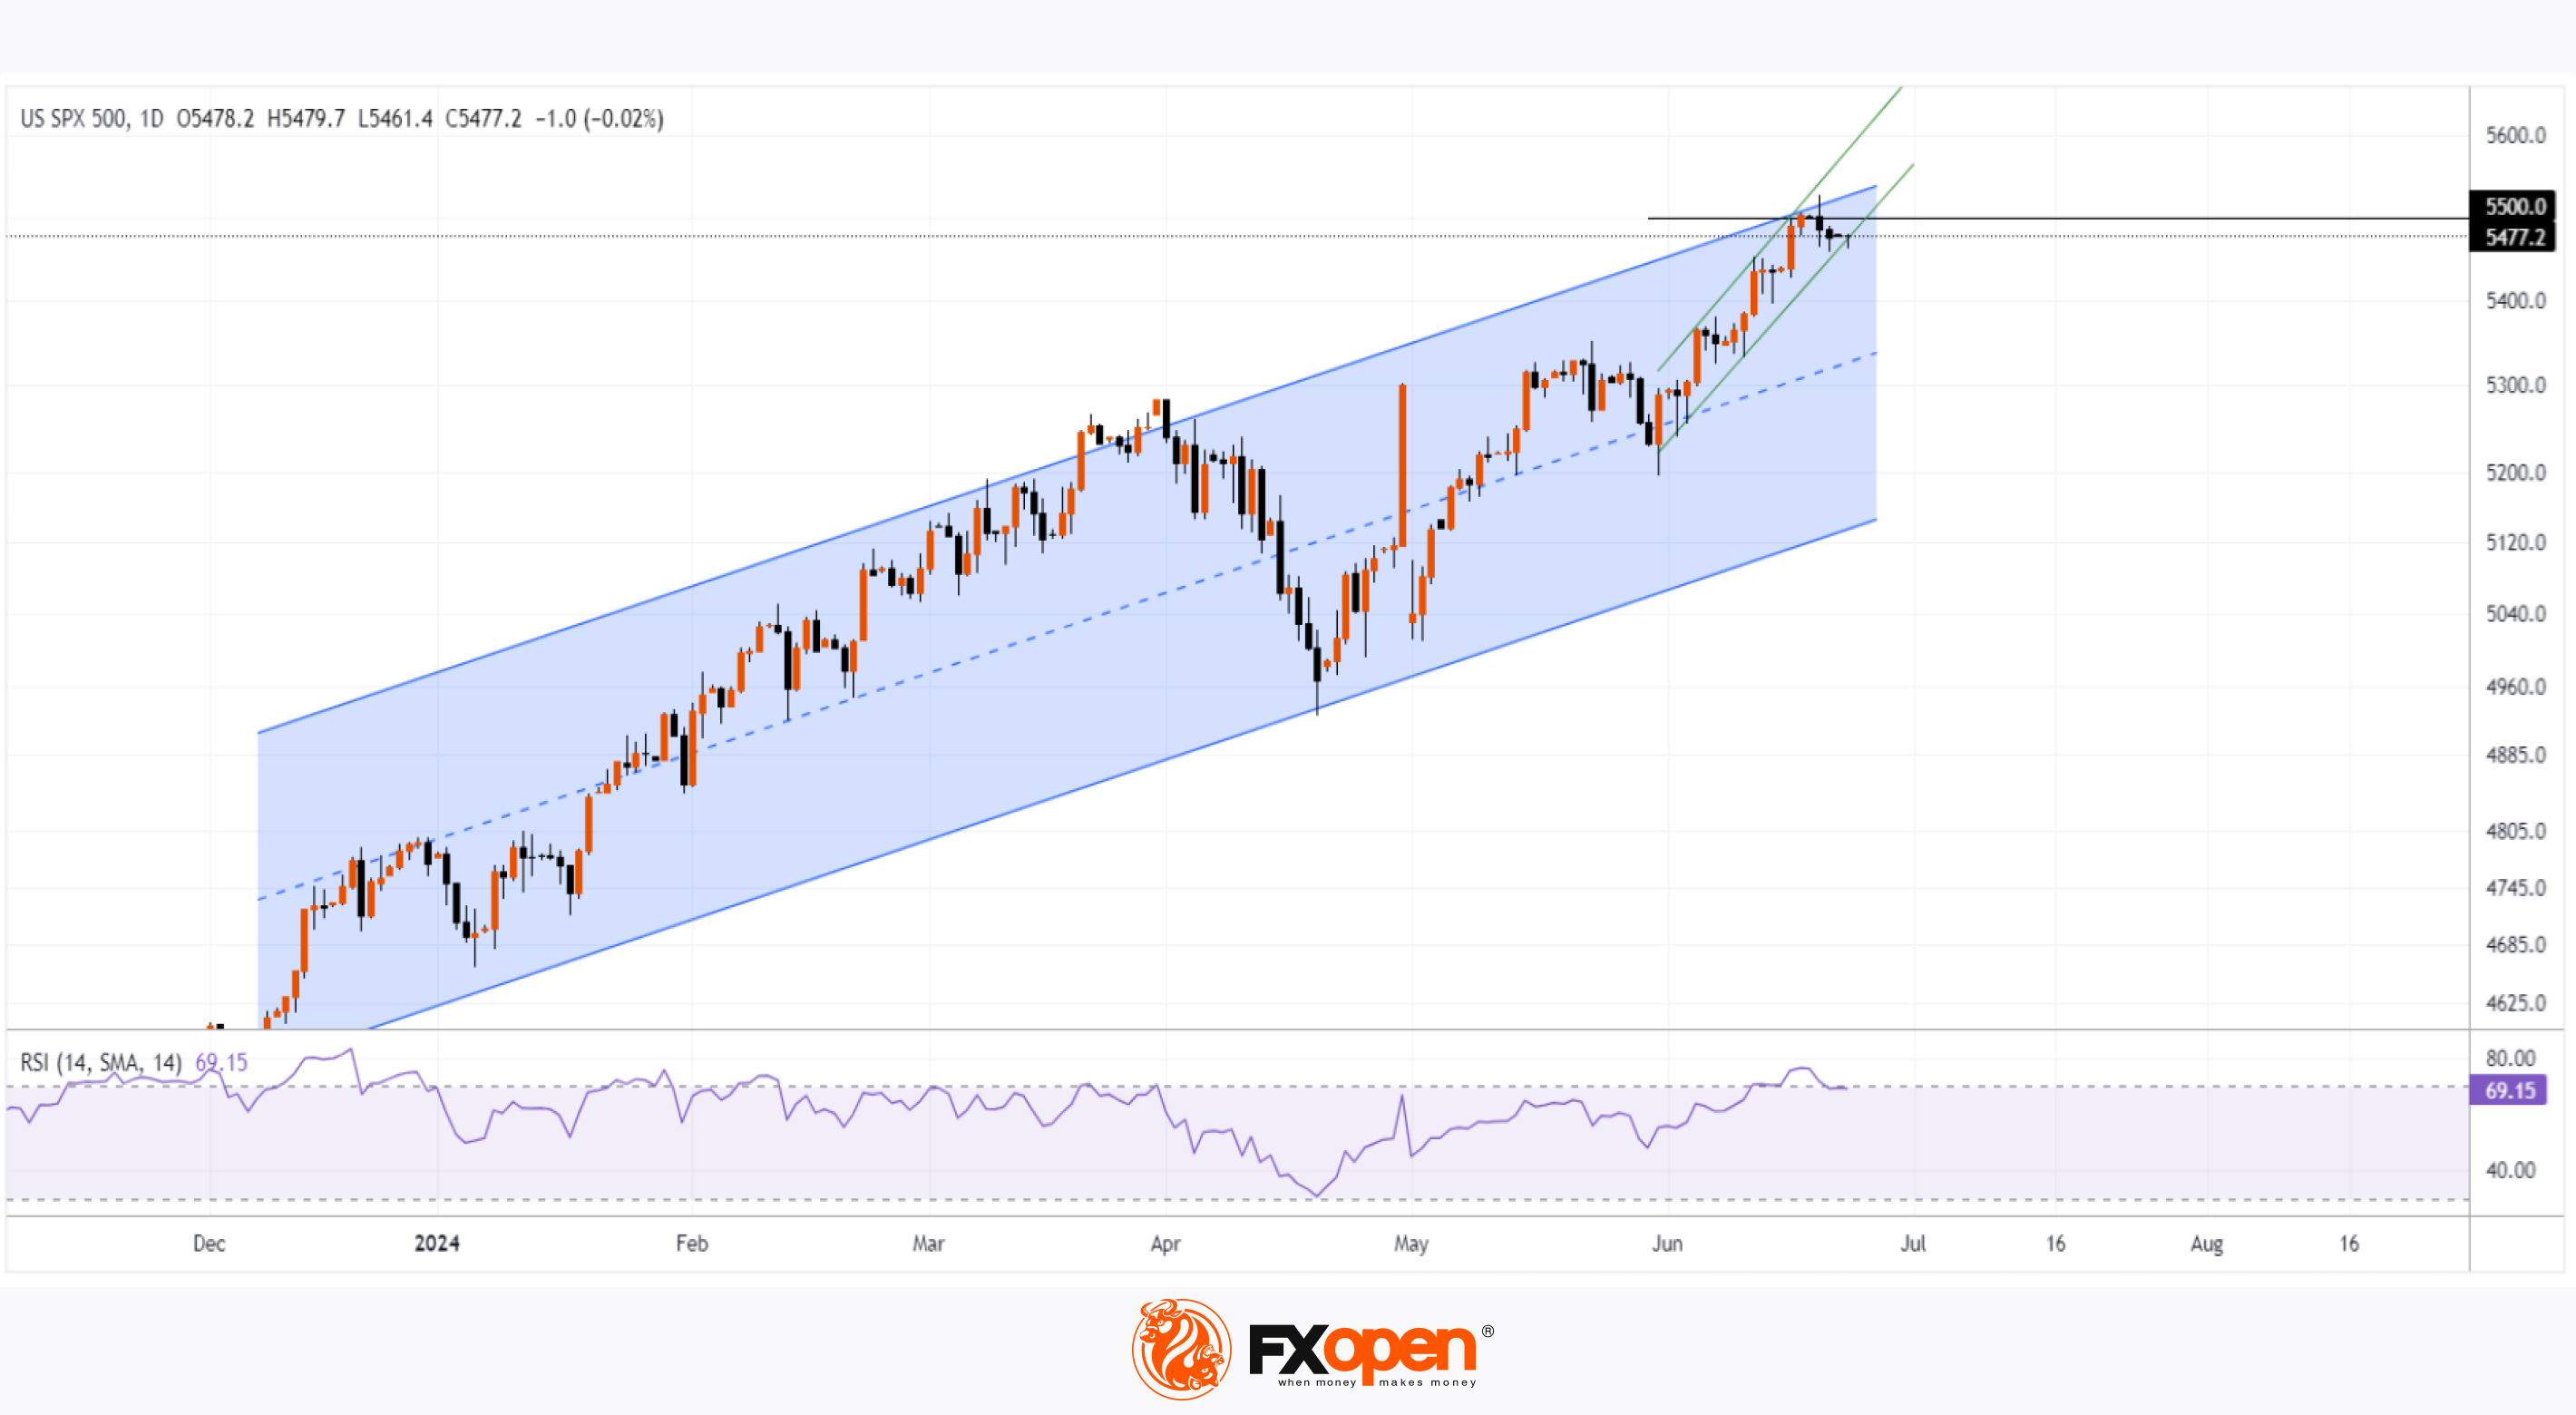
On Monday morning, the S&P 500 Index (US SPX 500 mini on FXOpen) fell to 5465 points after a historical record above 5500 points was set on June 20th. The decline was contributed by Friday’s report from the National Association of Realtors, which showed a drop in existing home sales in May compared to the previous month.
Technical analysis of the daily chart of the S&P 500 Index (US SPX 500 mini on FXOpen) shows that:
→ the price is in a large upward trend that began last year;
→ the price is near the upper boundary of this channel;
→ the price has fallen below the psychological level of 5500;
→ the price is still in the June upward trend (shown in green);
→ the RSI indicator points to some market overbought conditions.
Given these facts, it is reasonable to assume that the S&P 500 Index (US SPX 500 mini on FXOpen) is in a vulnerable position for a pullback from the resistance block formed by the psychological level of 5500 and the upper boundary of the channel. The June upward trend may be broken.
Moreover, a possible correction might take on a threatening character if Friday’s news shows that US inflation is not slowing down – which would strengthen market participants’ belief that the period of high rates will last longer than expected.
Trade global index CFDs with zero commission and tight spreads. Open your FXOpen account now or learn more about trading index CFDs with FXOpen.
CFDs are complex instruments and come with a high risk of losing your money.
This article represents the opinion of the Companies operating under the FXOpen brand only. It is not to be construed as an offer, solicitation, or recommendation with respect to products and services provided by the Companies operating under the FXOpen brand, nor is it to be considered financial advice.
S&P 500 Falls from Record High in Anticipation of Key News
On Friday, at 15:30 GMT+3, the Core PCE Price Index values will be released – an economic indicator to which the Federal Reserve pays special attention when assessing inflation levels in the US. This event is likely to cause a surge of news in the financial markets, and its anticipation will influence sentiments throughout the week.
On Monday morning, the S&P 500 Index (US SPX 500 mini on FXOpen) fell to 5465 points after a historical record above 5500 points was set on June 20th. The decline was contributed by Friday’s report from the National Association of Realtors, which showed a drop in existing home sales in May compared to the previous month.
Technical analysis of the daily chart of the S&P 500 Index (US SPX 500 mini on FXOpen) shows that:
→ the price is in a large upward trend that began last year;
→ the price is near the upper boundary of this channel;
→ the price has fallen below the psychological level of 5500;
→ the price is still in the June upward trend (shown in green);
→ the RSI indicator points to some market overbought conditions.
Given these facts, it is reasonable to assume that the S&P 500 Index (US SPX 500 mini on FXOpen) is in a vulnerable position for a pullback from the resistance block formed by the psychological level of 5500 and the upper boundary of the channel. The June upward trend may be broken.
Moreover, a possible correction might take on a threatening character if Friday’s news shows that US inflation is not slowing down – which would strengthen market participants’ belief that the period of high rates will last longer than expected.
Trade global index CFDs with zero commission and tight spreads. Open your FXOpen account now or learn more about trading index CFDs with FXOpen.
CFDs are complex instruments and come with a high risk of losing your money.
This article represents the opinion of the Companies operating under the FXOpen brand only. It is not to be construed as an offer, solicitation, or recommendation with respect to products and services provided by the Companies operating under the FXOpen brand, nor is it to be considered financial advice.
👍2
#USDJPY #marketanalysis #forextrading
USD/JPY Analysis: Rate Rises Above 159.9 Yen per Dollar
The yen was last this weak against the US dollar in late April, leading to currency interventions as the Bank of Japan deemed a rate above the psychological mark of 160 yen per USD unacceptable.
The current weakness of the yen has triggered the usual warnings from Japanese officials against "excessive" volatility, which can be interpreted as a sign of a new wave of interventions.
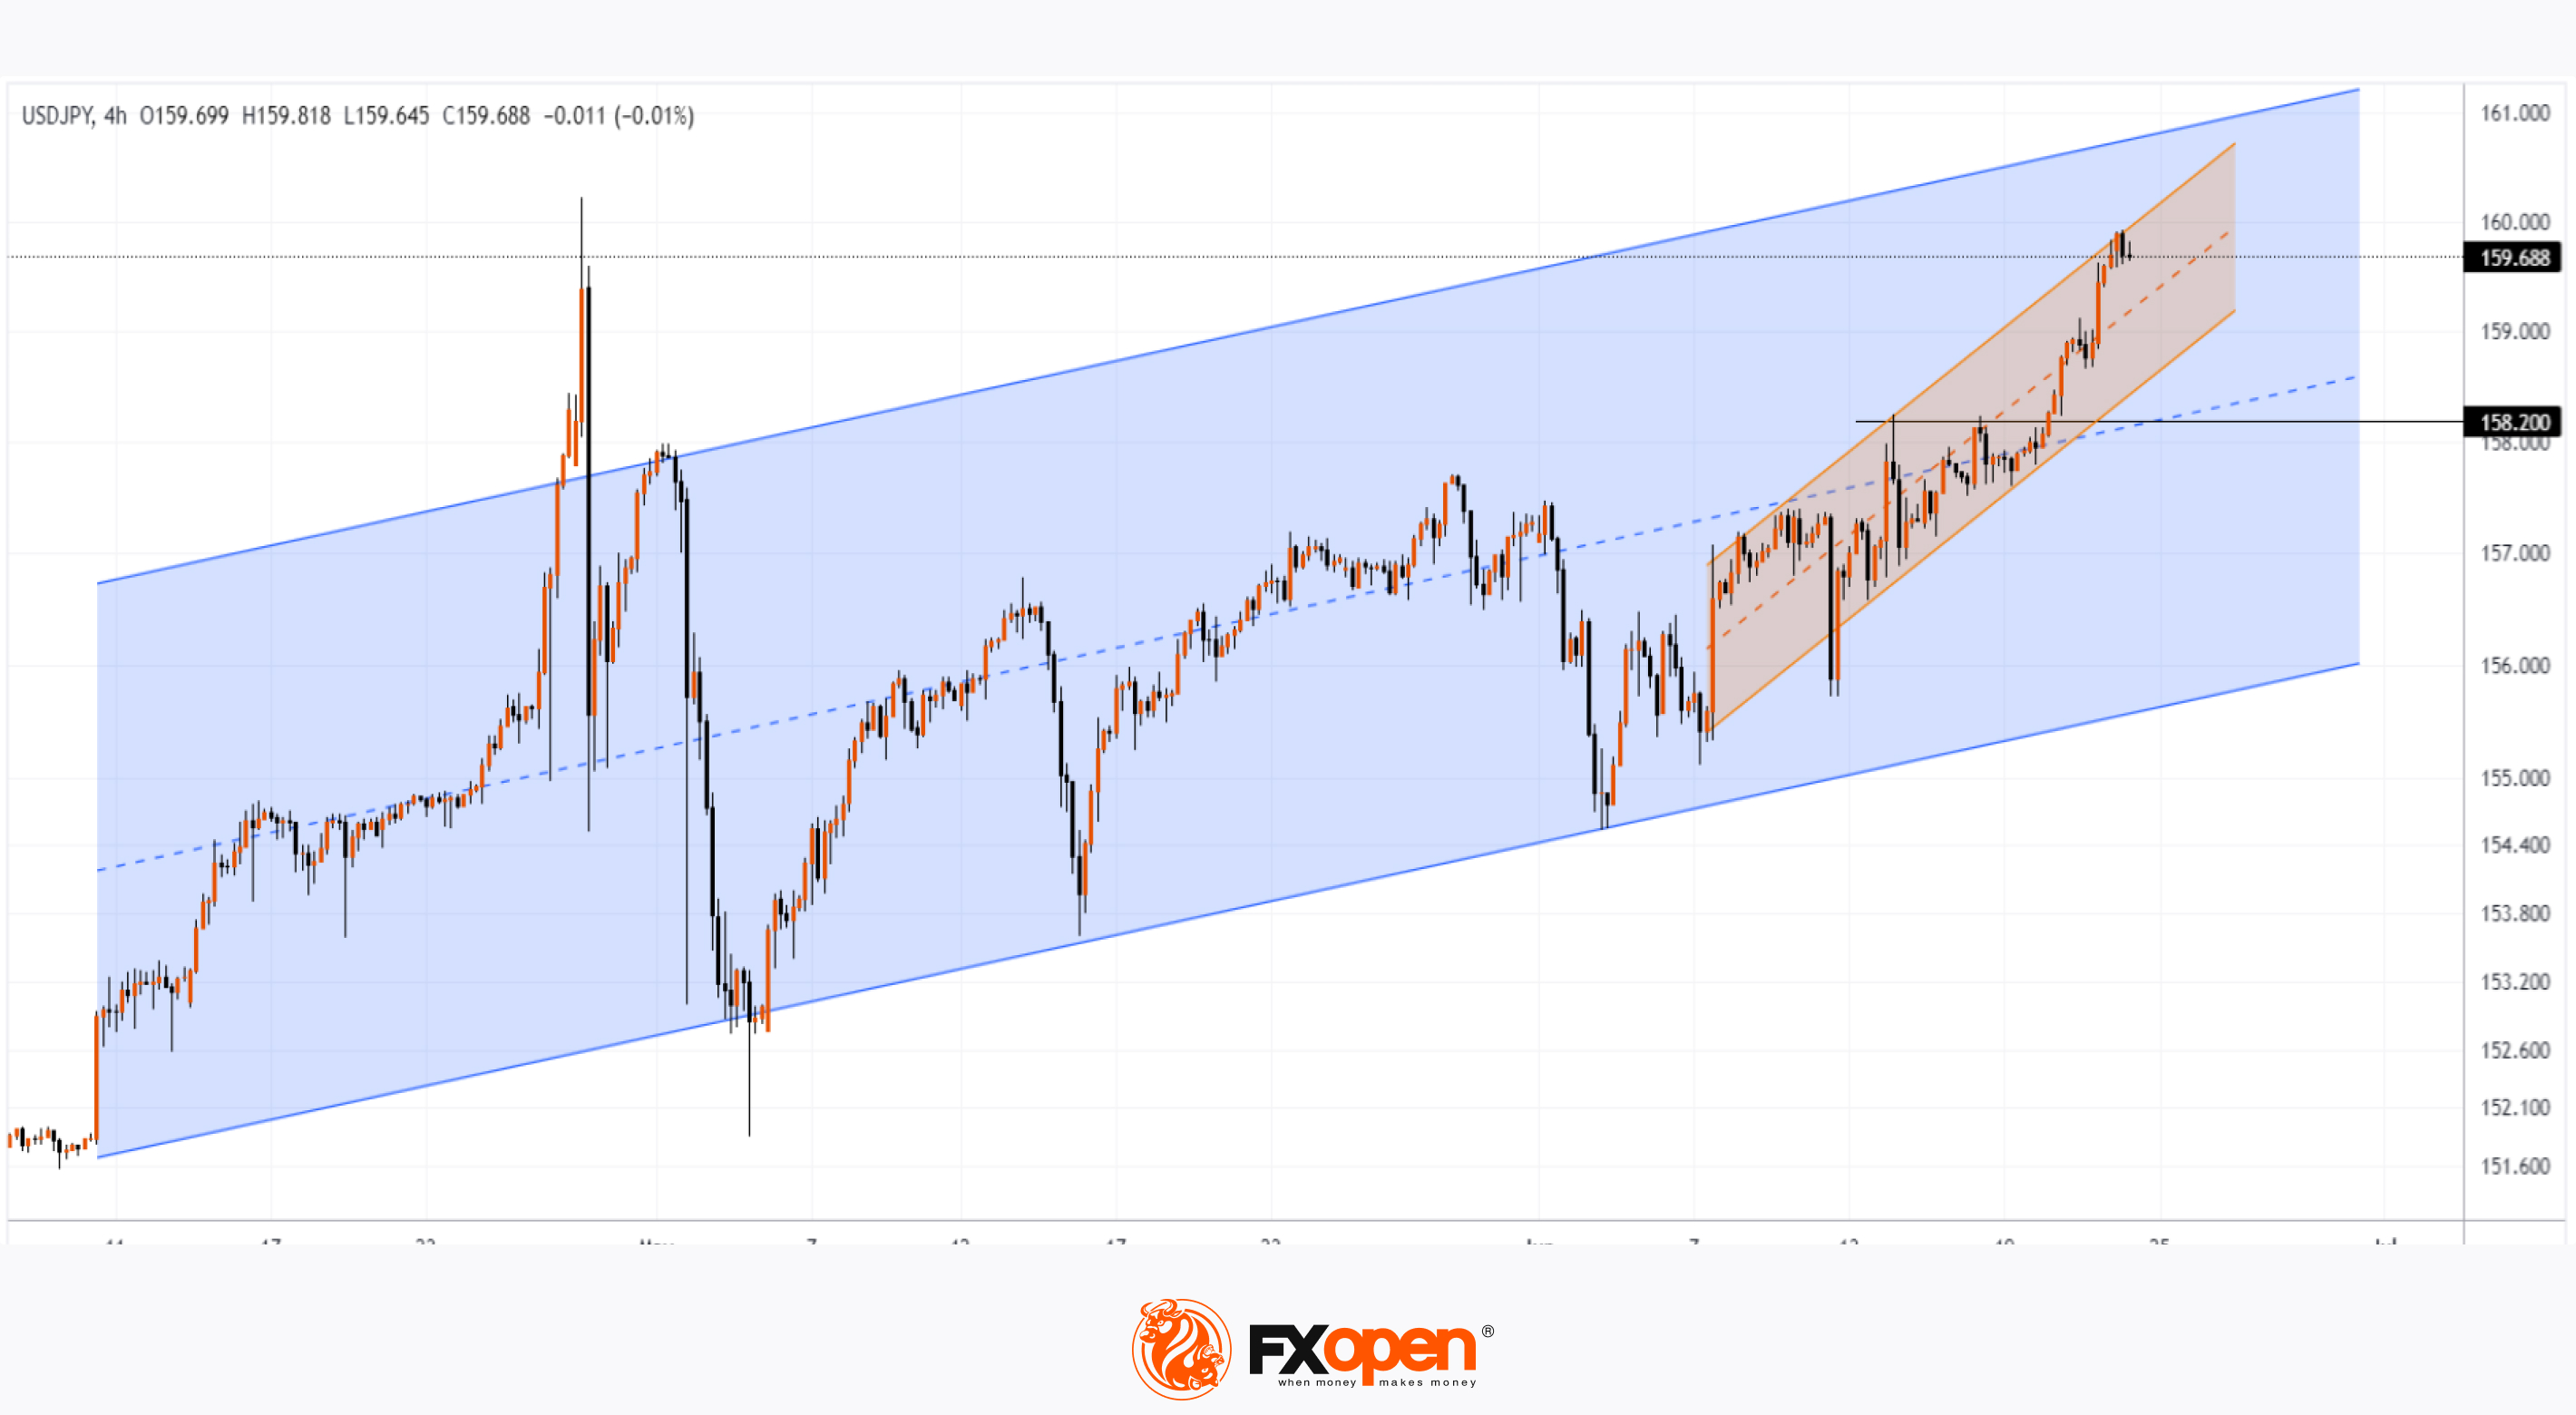
It is noteworthy that following the intervention in late April (when the yen strengthened by 4.5% by the first days of May), it took the market less than two months to negate almost the entire effect of the Bank of Japan's actions. This indicates a strong upward trend (shown in blue), driven by the interest rate differential between Japan and the US.
According to Reuters:
→ The 160.00 level is seen as a red line for the Japanese, considering that yen weakness increases imported inflation and pressures the Bank of Japan (BoJ) to further unwind its ultra-loose policy.
→ The minutes from the latest central bank meeting confirmed extensive discussions about reducing bond purchases and raising rates.
Technical analysis of the USD/JPY chart shows that:
→ In June, the rate is in an upward trend (shown in orange), which has lifted the dollar from the lower to the upper half of the blue channel;
→ The 158.20 level may serve as support (as it is former resistance, reinforced by the median of the blue channel).
It is possible that within the orange channel, the USD/JPY rate could reach the upper boundary of the blue channel and even surpass the multi-month peak of April, making a reaction from the Bank of Japan almost inevitable.
Trade over 50 forex markets 24 hours a day with FXOpen. Take advantage of low commissions, deep liquidity, and spreads from 0.0 pips. Open your FXOpen account now or learn more about trading forex with FXOpen.
CFDs are complex instruments and come with a high risk of losing your money.
This article represents the opinion of the Companies operating under the FXOpen brand only. It is not to be construed as an offer, solicitation, or recommendation with respect to products and services provided by the Companies operating under the FXOpen brand, nor is it to be considered financial advice.
USD/JPY Analysis: Rate Rises Above 159.9 Yen per Dollar
The yen was last this weak against the US dollar in late April, leading to currency interventions as the Bank of Japan deemed a rate above the psychological mark of 160 yen per USD unacceptable.
The current weakness of the yen has triggered the usual warnings from Japanese officials against "excessive" volatility, which can be interpreted as a sign of a new wave of interventions.
It is noteworthy that following the intervention in late April (when the yen strengthened by 4.5% by the first days of May), it took the market less than two months to negate almost the entire effect of the Bank of Japan's actions. This indicates a strong upward trend (shown in blue), driven by the interest rate differential between Japan and the US.
According to Reuters:
→ The 160.00 level is seen as a red line for the Japanese, considering that yen weakness increases imported inflation and pressures the Bank of Japan (BoJ) to further unwind its ultra-loose policy.
→ The minutes from the latest central bank meeting confirmed extensive discussions about reducing bond purchases and raising rates.
Technical analysis of the USD/JPY chart shows that:
→ In June, the rate is in an upward trend (shown in orange), which has lifted the dollar from the lower to the upper half of the blue channel;
→ The 158.20 level may serve as support (as it is former resistance, reinforced by the median of the blue channel).
It is possible that within the orange channel, the USD/JPY rate could reach the upper boundary of the blue channel and even surpass the multi-month peak of April, making a reaction from the Bank of Japan almost inevitable.
Trade over 50 forex markets 24 hours a day with FXOpen. Take advantage of low commissions, deep liquidity, and spreads from 0.0 pips. Open your FXOpen account now or learn more about trading forex with FXOpen.
CFDs are complex instruments and come with a high risk of losing your money.
This article represents the opinion of the Companies operating under the FXOpen brand only. It is not to be construed as an offer, solicitation, or recommendation with respect to products and services provided by the Companies operating under the FXOpen brand, nor is it to be considered financial advice.
👍2
#stockmarket #NASDAQ #stocktrading #MarketNews
Nasdaq 100 Index Failed to Hold Above 20,000 Points
On 18th June, we reported that the Nasdaq 100 (US Tech 100 mini on FXOpen) market had recorded a historic high by surpassing the psychological level of 20,000.
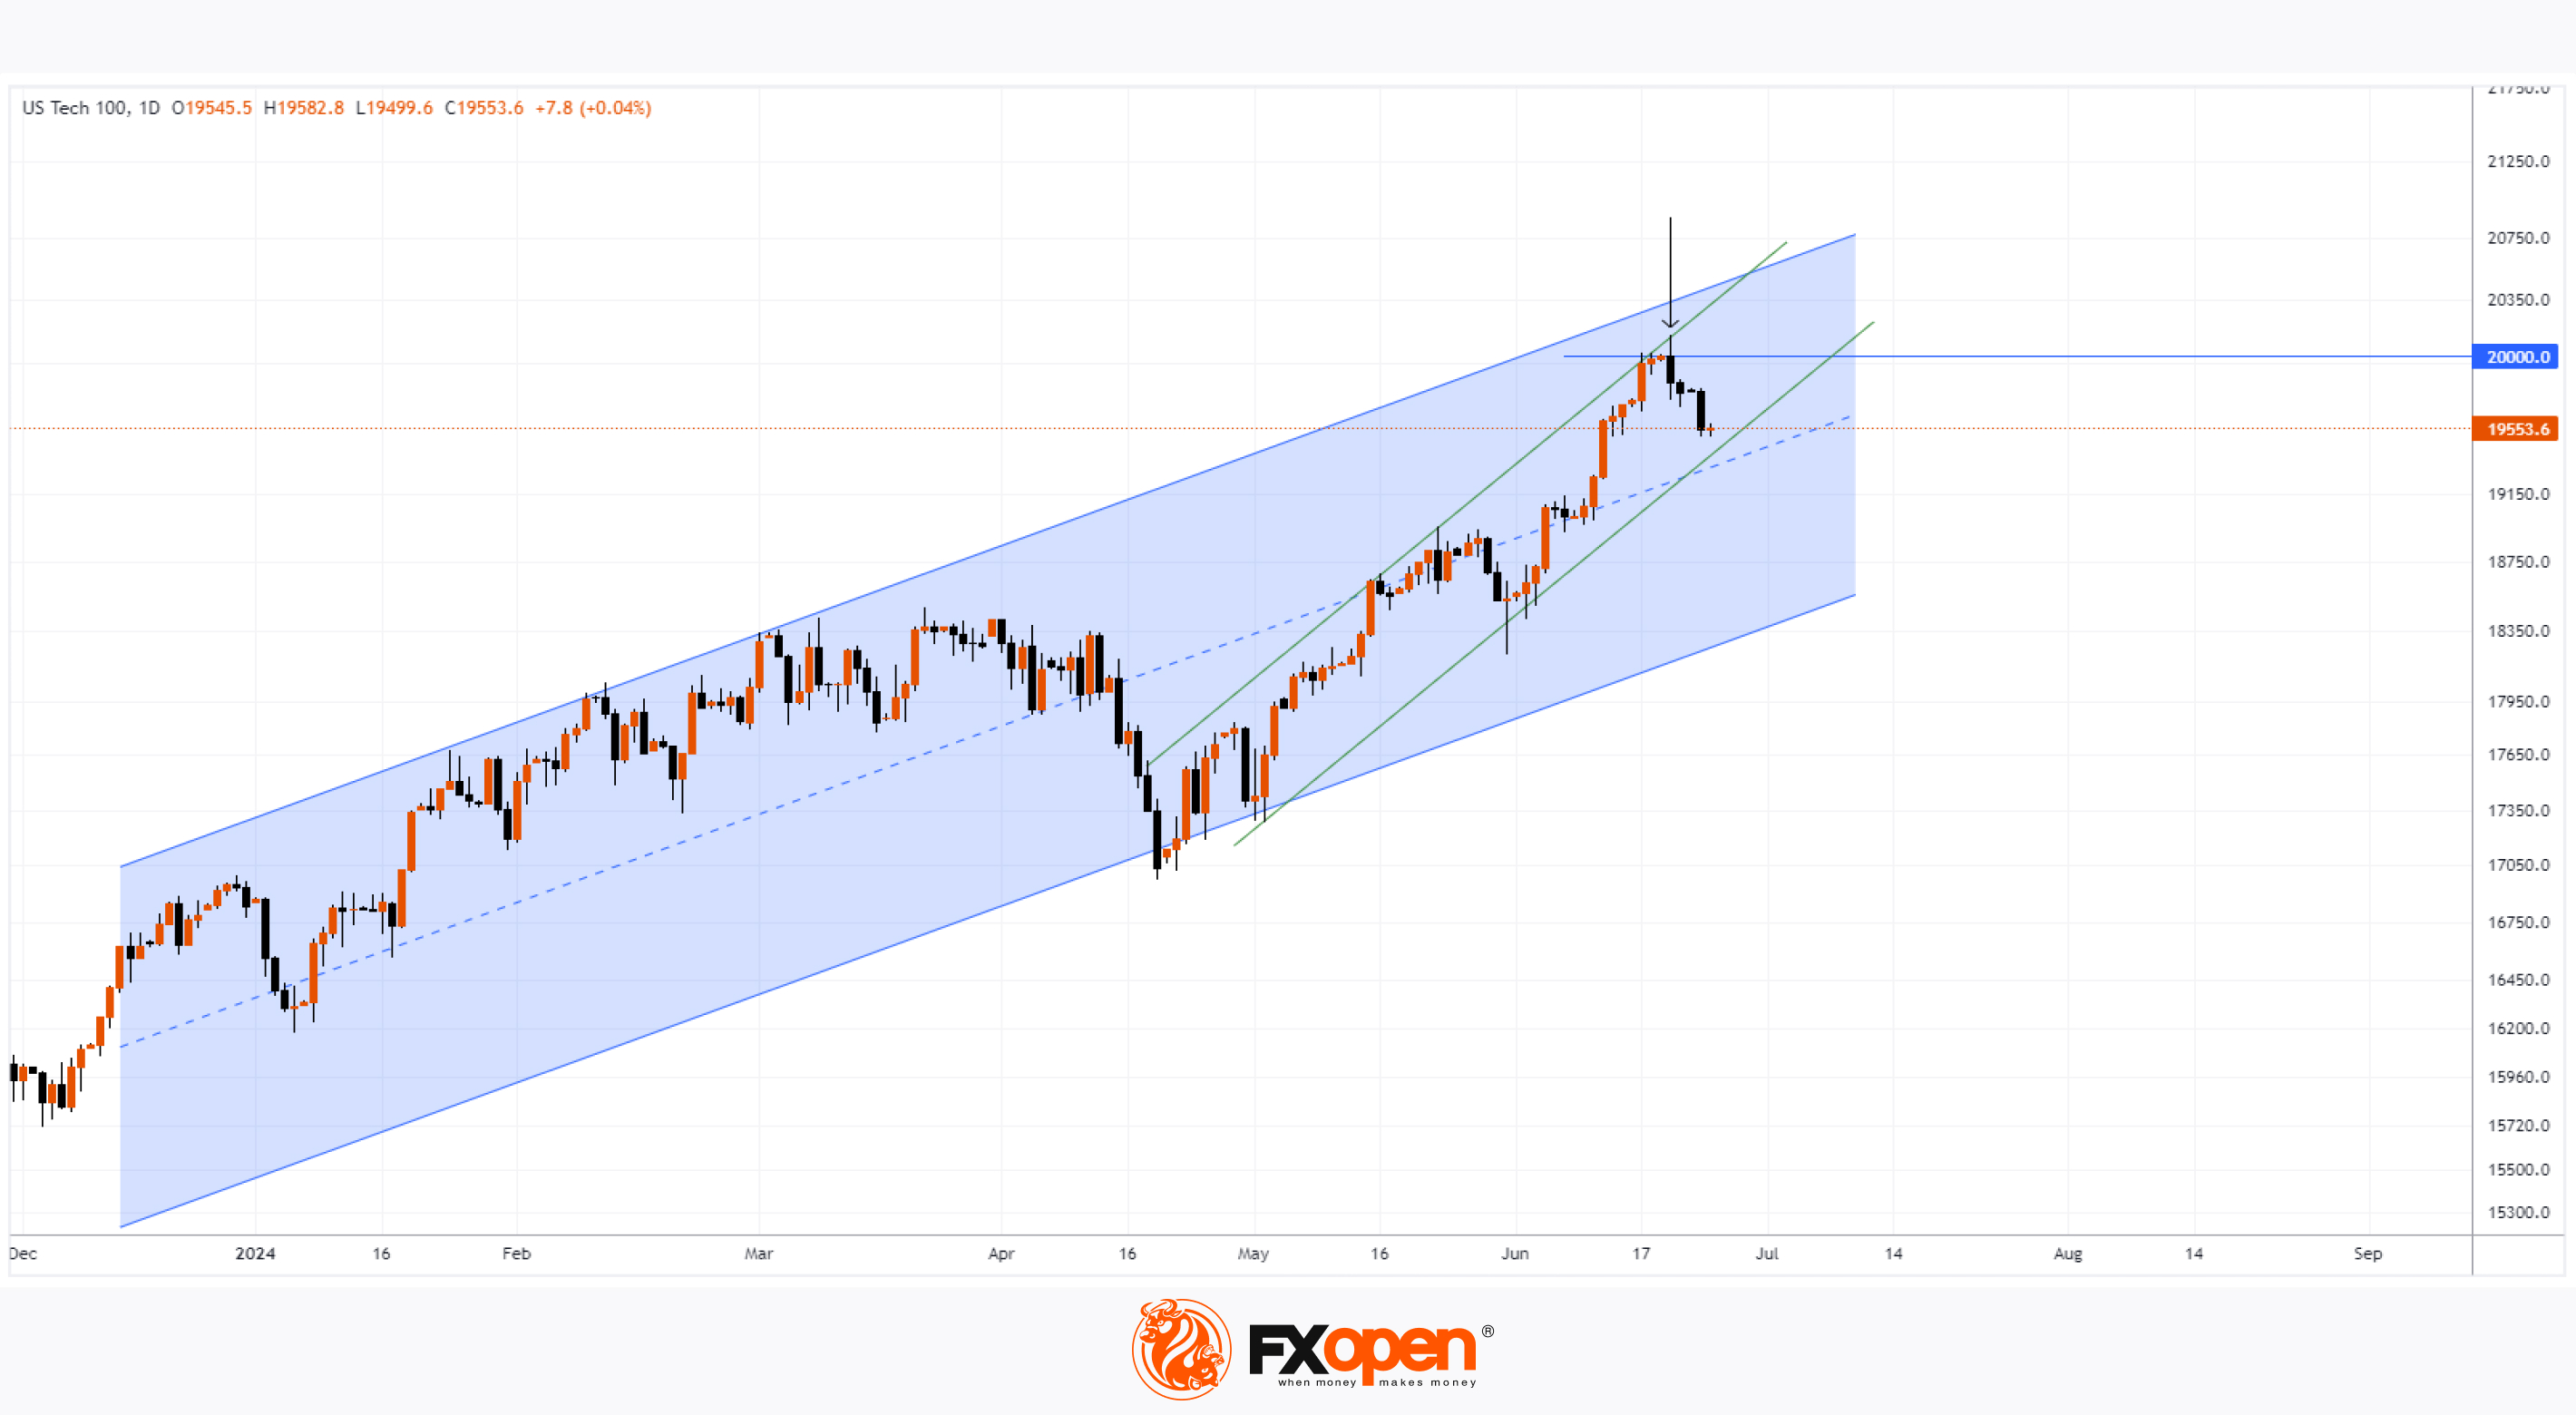
At that time, we pointed to the upper line of the ascending channel (shown in green), which has been in place since 19th April, as a potential resistance level.
About a week has passed, and the Nasdaq 100 (US Tech 100 mini on FXOpen) chart indicates that the price failed to hold above the psychological level and turned downwards from the upper green line.
One of the drivers of the decline was NVDA shares, which fell by approximately 15% over three trading sessions.
Meanwhile, Bloomberg quotes Buff Dormeier, Chief Technical Analyst at Kingsview Partners, stating that Nvidia’s share price decline occurred following potentially bullish news:
→ a stock split, making the shares more accessible to a wider range of retail investors;
→ attaining the status of the company with the largest market capitalisation (a status now lost);
→ strong fundamental data related to the company's leadership in the AI-related industry. By some estimates, the company controls about 80% of the chip market needed for AI model development.
Bearish behaviour of NVDA’s price amidst bullish news is a bearish sign.
Technical analysis of the Nasdaq 100 (US Tech 100 mini on FXOpen) chart gives further cause for concern:
→ the price failed to reach the upper boundary of the long-term blue channel (shown in blue);
→ according to Nasdaq data on 20th June (this day is marked with an arrow), approximately 890 thousand E-mini futures contracts were traded on the derivatives market – the highest volume since 19th April (when an important low was recorded).
High volumes are a sign of large player activity, who may use the surge in demand caused by good news to close their substantial long positions. The thesis of large seller activation is confirmed by:
→ a candlestick with a long upper shadow formed on the chart on 20th June;
→ the Nasdaq 100 (US Tech 100 mini on FXOpen) index price continued to decline on 21st and 24th June.
Therefore, it is reasonable to conclude that the bears have revealed their presence on the chart. If weak attempts by bulls to resume the upward trend with a hold above the psychological level of 20,000 (e.g., with a rebound from the median line) appear on the chart in the near future, this could provoke more aggressive behaviour from the bears.
Trade global index CFDs with zero commission and tight spreads. Open your FXOpen account now or learn more about trading index CFDs with FXOpen.
CFDs are complex instruments and come with a high risk of losing your money.
This article represents the opinion of the Companies operating under the FXOpen brand only. It is not to be construed as an offer, solicitation, or recommendation with respect to products and services provided by the Companies operating under the FXOpen brand, nor is it to be considered financial advice.
Nasdaq 100 Index Failed to Hold Above 20,000 Points
On 18th June, we reported that the Nasdaq 100 (US Tech 100 mini on FXOpen) market had recorded a historic high by surpassing the psychological level of 20,000.
At that time, we pointed to the upper line of the ascending channel (shown in green), which has been in place since 19th April, as a potential resistance level.
About a week has passed, and the Nasdaq 100 (US Tech 100 mini on FXOpen) chart indicates that the price failed to hold above the psychological level and turned downwards from the upper green line.
One of the drivers of the decline was NVDA shares, which fell by approximately 15% over three trading sessions.
Meanwhile, Bloomberg quotes Buff Dormeier, Chief Technical Analyst at Kingsview Partners, stating that Nvidia’s share price decline occurred following potentially bullish news:
→ a stock split, making the shares more accessible to a wider range of retail investors;
→ attaining the status of the company with the largest market capitalisation (a status now lost);
→ strong fundamental data related to the company's leadership in the AI-related industry. By some estimates, the company controls about 80% of the chip market needed for AI model development.
Bearish behaviour of NVDA’s price amidst bullish news is a bearish sign.
Technical analysis of the Nasdaq 100 (US Tech 100 mini on FXOpen) chart gives further cause for concern:
→ the price failed to reach the upper boundary of the long-term blue channel (shown in blue);
→ according to Nasdaq data on 20th June (this day is marked with an arrow), approximately 890 thousand E-mini futures contracts were traded on the derivatives market – the highest volume since 19th April (when an important low was recorded).
High volumes are a sign of large player activity, who may use the surge in demand caused by good news to close their substantial long positions. The thesis of large seller activation is confirmed by:
→ a candlestick with a long upper shadow formed on the chart on 20th June;
→ the Nasdaq 100 (US Tech 100 mini on FXOpen) index price continued to decline on 21st and 24th June.
Therefore, it is reasonable to conclude that the bears have revealed their presence on the chart. If weak attempts by bulls to resume the upward trend with a hold above the psychological level of 20,000 (e.g., with a rebound from the median line) appear on the chart in the near future, this could provoke more aggressive behaviour from the bears.
Trade global index CFDs with zero commission and tight spreads. Open your FXOpen account now or learn more about trading index CFDs with FXOpen.
CFDs are complex instruments and come with a high risk of losing your money.
This article represents the opinion of the Companies operating under the FXOpen brand only. It is not to be construed as an offer, solicitation, or recommendation with respect to products and services provided by the Companies operating under the FXOpen brand, nor is it to be considered financial advice.
👍2
#marketanalysis #MarketNews #forextrading
USD/CAD Rate Reaches Significant Support Level
On June 12, we wrote about bearish signs observed on the USD/CAD chart, pointing to the prospect of USD weakening.
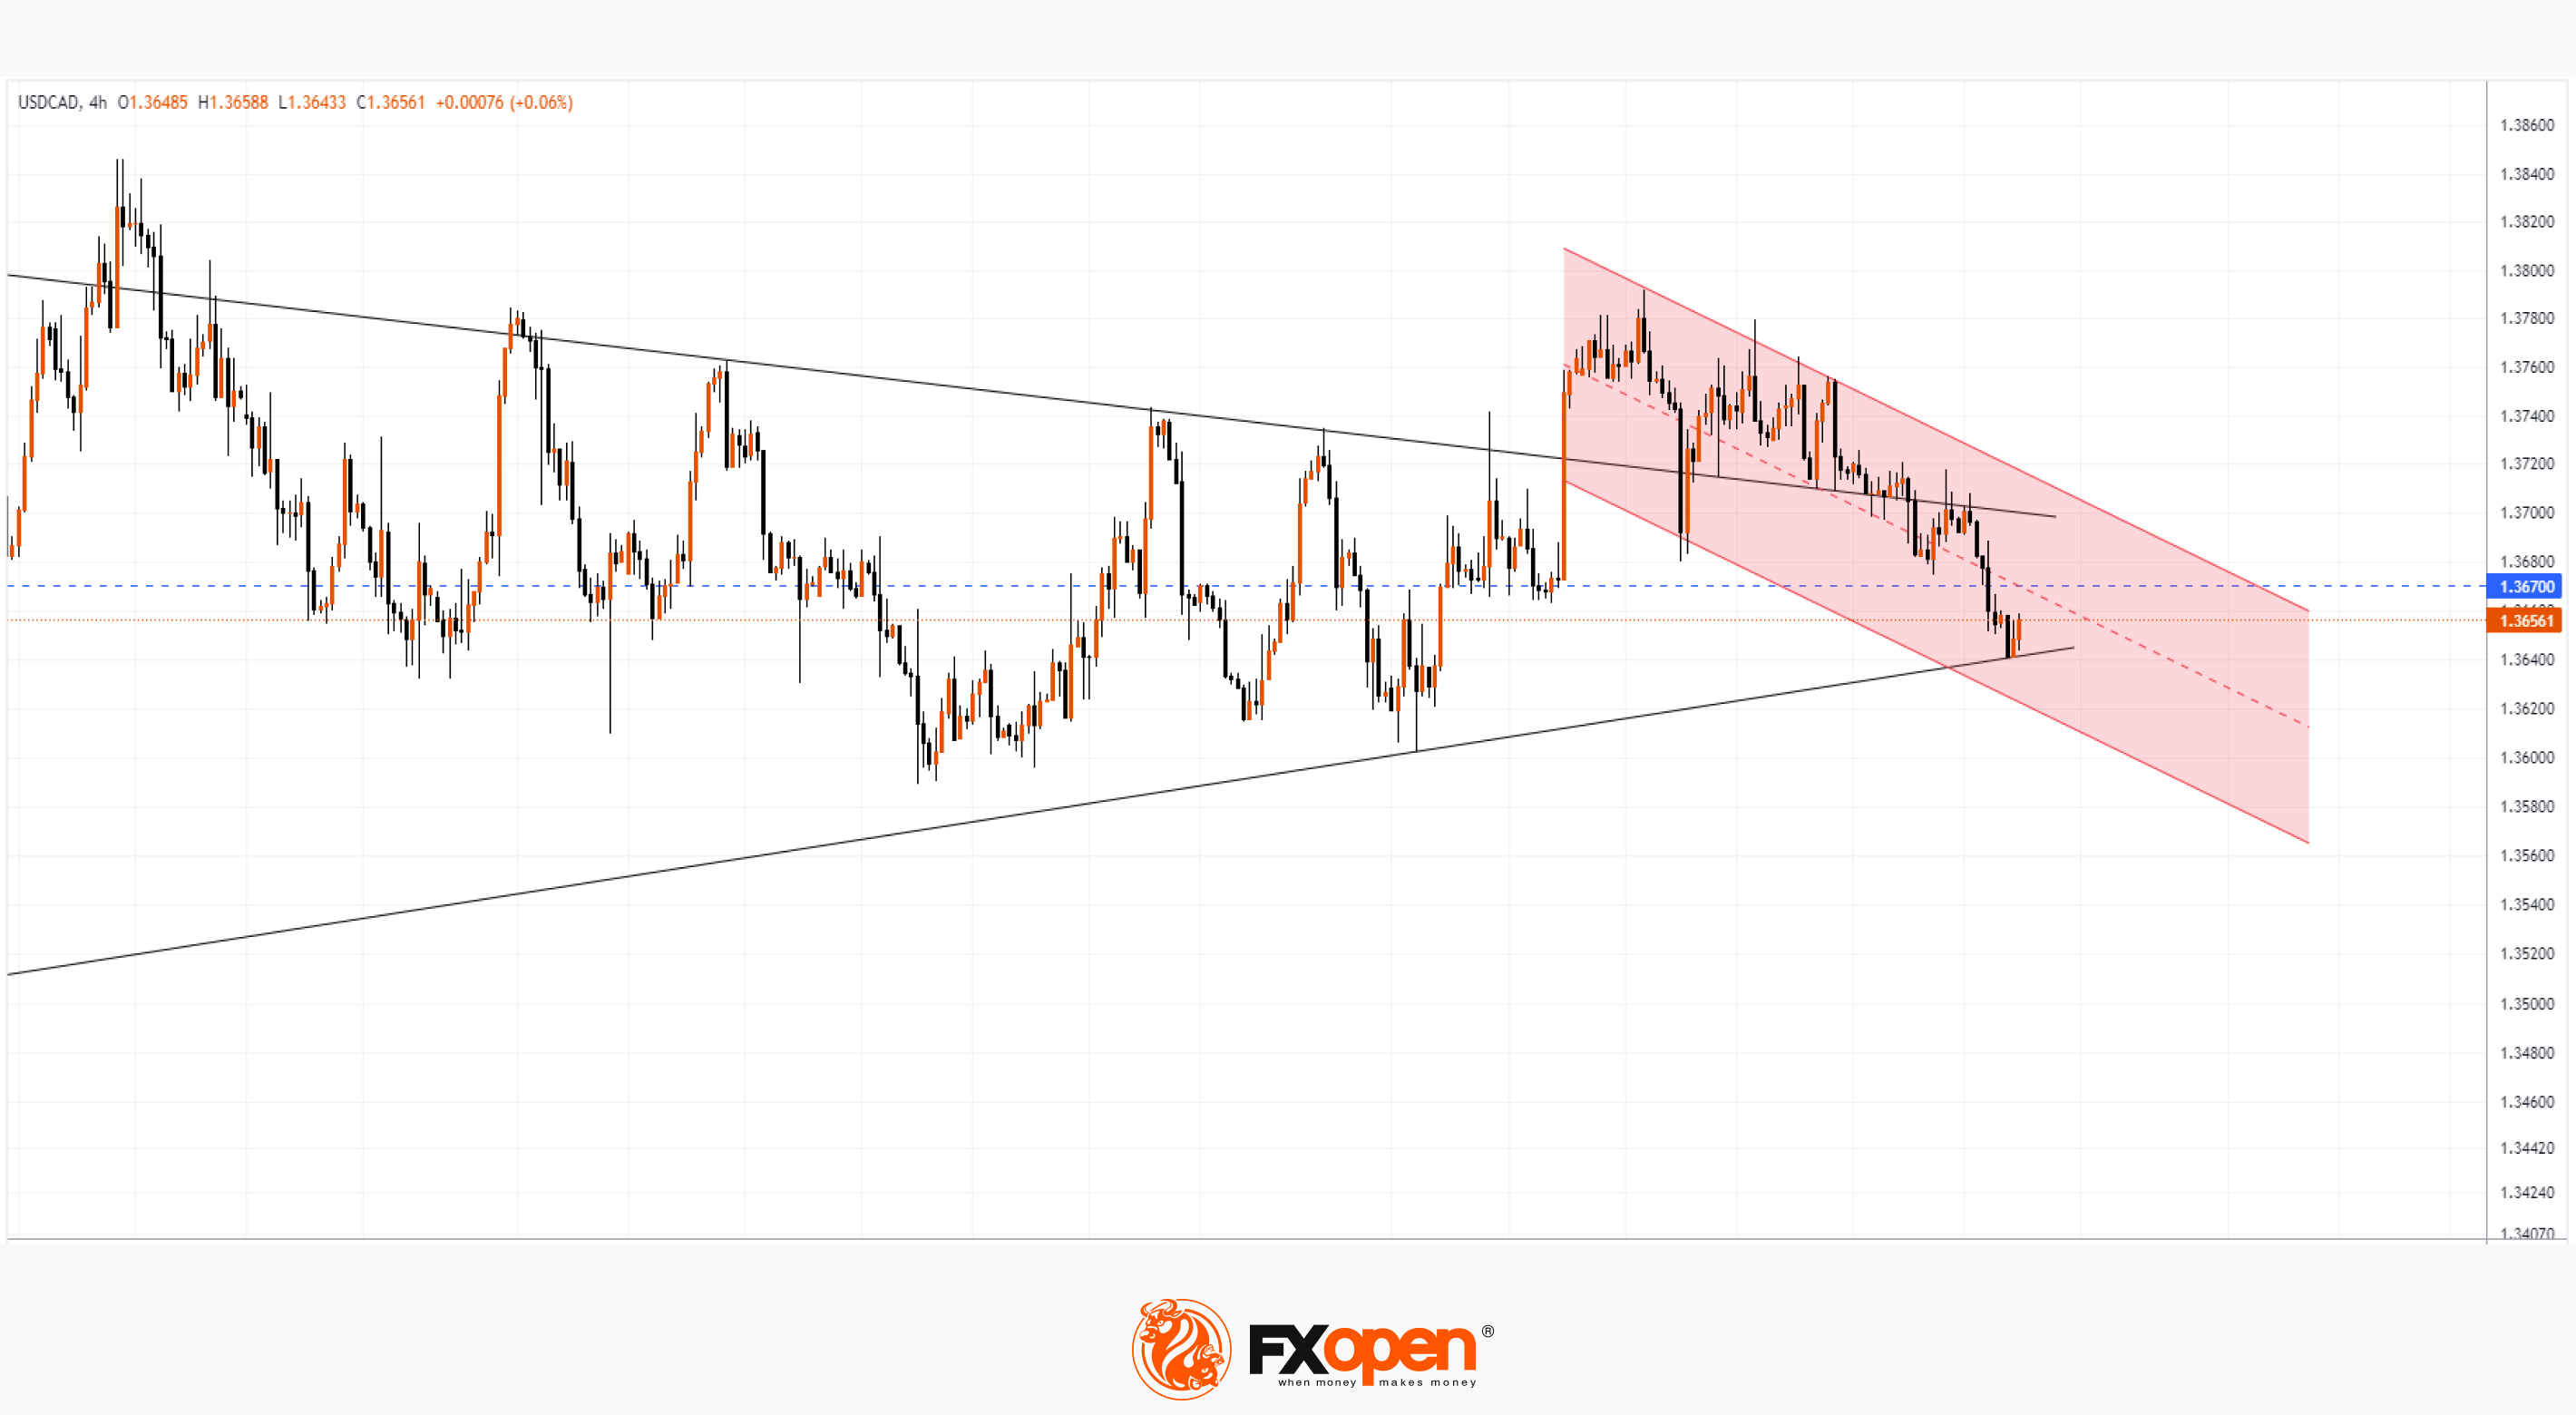
Since then, the USD/CAD rate has decreased by approximately 0.75% and has reached an important support level, specifically the lower boundary of the descending triangle (with the median around 1.36700), which indicates a long-term balance of supply and demand among market participants.
The fact that today the USD/CAD rate is rising from yesterday's minimum on June 4 at the level of 1.36408 confirms the importance of the support formed by the lower boundary of the triangle.
According to today's technical analysis of the USD/CAD chart:
→ the price in the second half of June is moving within a downtrend (shown by the red channel);
→ the price has dropped into the lower half of the red channel, indicating bearish preference;
→ bulls attempted to push the price upward in mid-June, breaking through the upper boundary of the triangle, but failed – a bearish sign.
Could the lower boundary be breached? Certainly, if there are fundamental drivers for it.
Such drivers could be the Canadian inflation news – they are set to be released today at 15:30 GMT+3.
According to ForexFactory, it is expected that the CPI index will decrease on a monthly basis and will be 0.3% (compared to 0.5% a month ago).
Be prepared for volatility spikes tonight.
Trade over 50 forex markets 24 hours a day with FXOpen. Take advantage of low commissions, deep liquidity, and spreads from 0.0 pips. Open your FXOpen account now or learn more about trading forex with FXOpen.
CFDs are complex instruments and come with a high risk of losing your money.
This article represents the opinion of the Companies operating under the FXOpen brand only. It is not to be construed as an offer, solicitation, or recommendation with respect to products and services provided by the Companies operating under the FXOpen brand, nor is it to be considered financial advice.
USD/CAD Rate Reaches Significant Support Level
On June 12, we wrote about bearish signs observed on the USD/CAD chart, pointing to the prospect of USD weakening.
Since then, the USD/CAD rate has decreased by approximately 0.75% and has reached an important support level, specifically the lower boundary of the descending triangle (with the median around 1.36700), which indicates a long-term balance of supply and demand among market participants.
The fact that today the USD/CAD rate is rising from yesterday's minimum on June 4 at the level of 1.36408 confirms the importance of the support formed by the lower boundary of the triangle.
According to today's technical analysis of the USD/CAD chart:
→ the price in the second half of June is moving within a downtrend (shown by the red channel);
→ the price has dropped into the lower half of the red channel, indicating bearish preference;
→ bulls attempted to push the price upward in mid-June, breaking through the upper boundary of the triangle, but failed – a bearish sign.
Could the lower boundary be breached? Certainly, if there are fundamental drivers for it.
Such drivers could be the Canadian inflation news – they are set to be released today at 15:30 GMT+3.
According to ForexFactory, it is expected that the CPI index will decrease on a monthly basis and will be 0.3% (compared to 0.5% a month ago).
Be prepared for volatility spikes tonight.
Trade over 50 forex markets 24 hours a day with FXOpen. Take advantage of low commissions, deep liquidity, and spreads from 0.0 pips. Open your FXOpen account now or learn more about trading forex with FXOpen.
CFDs are complex instruments and come with a high risk of losing your money.
This article represents the opinion of the Companies operating under the FXOpen brand only. It is not to be construed as an offer, solicitation, or recommendation with respect to products and services provided by the Companies operating under the FXOpen brand, nor is it to be considered financial advice.
👍2
Forwarded from Finance Feeds
FXOpen adds German, French, Spanish, Portuguese, Turkish, Arabic
FXOpen has expanded its TickTrader trading platform’s language options to include German, French, Spanish, Portuguese, Turkish, and Arabic.
https://financefeeds.com/fxopen-adds-german-french-spanish-portuguese-turkish-arabic/
FXOpen has expanded its TickTrader trading platform’s language options to include German, French, Spanish, Portuguese, Turkish, and Arabic.
https://financefeeds.com/fxopen-adds-german-french-spanish-portuguese-turkish-arabic/
👍4
#AUDUSD #forextrading #MarketNews #marketanalysis
AUD/USD Surges on Inflation News in Australia
This morning, the Consumer Price Index (CPI) figures for Australia were released – according to ForexFactory, the annual CPI stood at 4.0% (expected = 3.8%, previous = 3.6%).
As Bloomberg reports:
→ Rent was the main driver of inflation due to a housing shortage.
→ The spike in inflation increases the risk of an RBA rate hike (a decision might be announced on 5th August).
→ Following the release of the high CPI figures, the AUD/USD exchange rate surged by 0.6%.
Moreover, the news from Australia could be a harbinger of a new wave of inflation that may manifest in other countries as well.
Technical analysis of the 4-hour AUD/USD chart shows that:
→ Since May, the price has formed a range (shown by blue lines) with a slight upward tilt.
→ If we assume that this range represents a bull flag pattern, we might soon see a breakout in an upward direction.
→ The bull flag hypothesis is supported by Fibonacci proportions: the B→C decline found support at the 0.618 level of the A→B rise.
The dominance of bulls in the AUD/USD market today is indicated by the following:
→ The price is above the upward-sloping EMA (100).
→ The price has broken through the local resistance at 0.667, which can now be expected to act as support.
However, the upper boundary of the blue range appears strong (as it slowed down the price increase after the CPI release), and it is possible that the bulls may need another fundamental driver to break through it.
Trade over 50 forex markets 24 hours a day with FXOpen. Take advantage of low commissions, deep liquidity, and spreads from 0.0 pips. Open your FXOpen account now or learn more about trading forex with FXOpen.
CFDs are complex instruments and come with a high risk of losing your money.
This article represents the opinion of the Companies operating under the FXOpen brand only. It is not to be construed as an offer, solicitation, or recommendation with respect to products and services provided by the Companies operating under the FXOpen brand, nor is it to be considered financial advice.
AUD/USD Surges on Inflation News in Australia
This morning, the Consumer Price Index (CPI) figures for Australia were released – according to ForexFactory, the annual CPI stood at 4.0% (expected = 3.8%, previous = 3.6%).
As Bloomberg reports:
→ Rent was the main driver of inflation due to a housing shortage.
→ The spike in inflation increases the risk of an RBA rate hike (a decision might be announced on 5th August).
→ Following the release of the high CPI figures, the AUD/USD exchange rate surged by 0.6%.
Moreover, the news from Australia could be a harbinger of a new wave of inflation that may manifest in other countries as well.
Technical analysis of the 4-hour AUD/USD chart shows that:
→ Since May, the price has formed a range (shown by blue lines) with a slight upward tilt.
→ If we assume that this range represents a bull flag pattern, we might soon see a breakout in an upward direction.
→ The bull flag hypothesis is supported by Fibonacci proportions: the B→C decline found support at the 0.618 level of the A→B rise.
The dominance of bulls in the AUD/USD market today is indicated by the following:
→ The price is above the upward-sloping EMA (100).
→ The price has broken through the local resistance at 0.667, which can now be expected to act as support.
However, the upper boundary of the blue range appears strong (as it slowed down the price increase after the CPI release), and it is possible that the bulls may need another fundamental driver to break through it.
Trade over 50 forex markets 24 hours a day with FXOpen. Take advantage of low commissions, deep liquidity, and spreads from 0.0 pips. Open your FXOpen account now or learn more about trading forex with FXOpen.
CFDs are complex instruments and come with a high risk of losing your money.
This article represents the opinion of the Companies operating under the FXOpen brand only. It is not to be construed as an offer, solicitation, or recommendation with respect to products and services provided by the Companies operating under the FXOpen brand, nor is it to be considered financial advice.
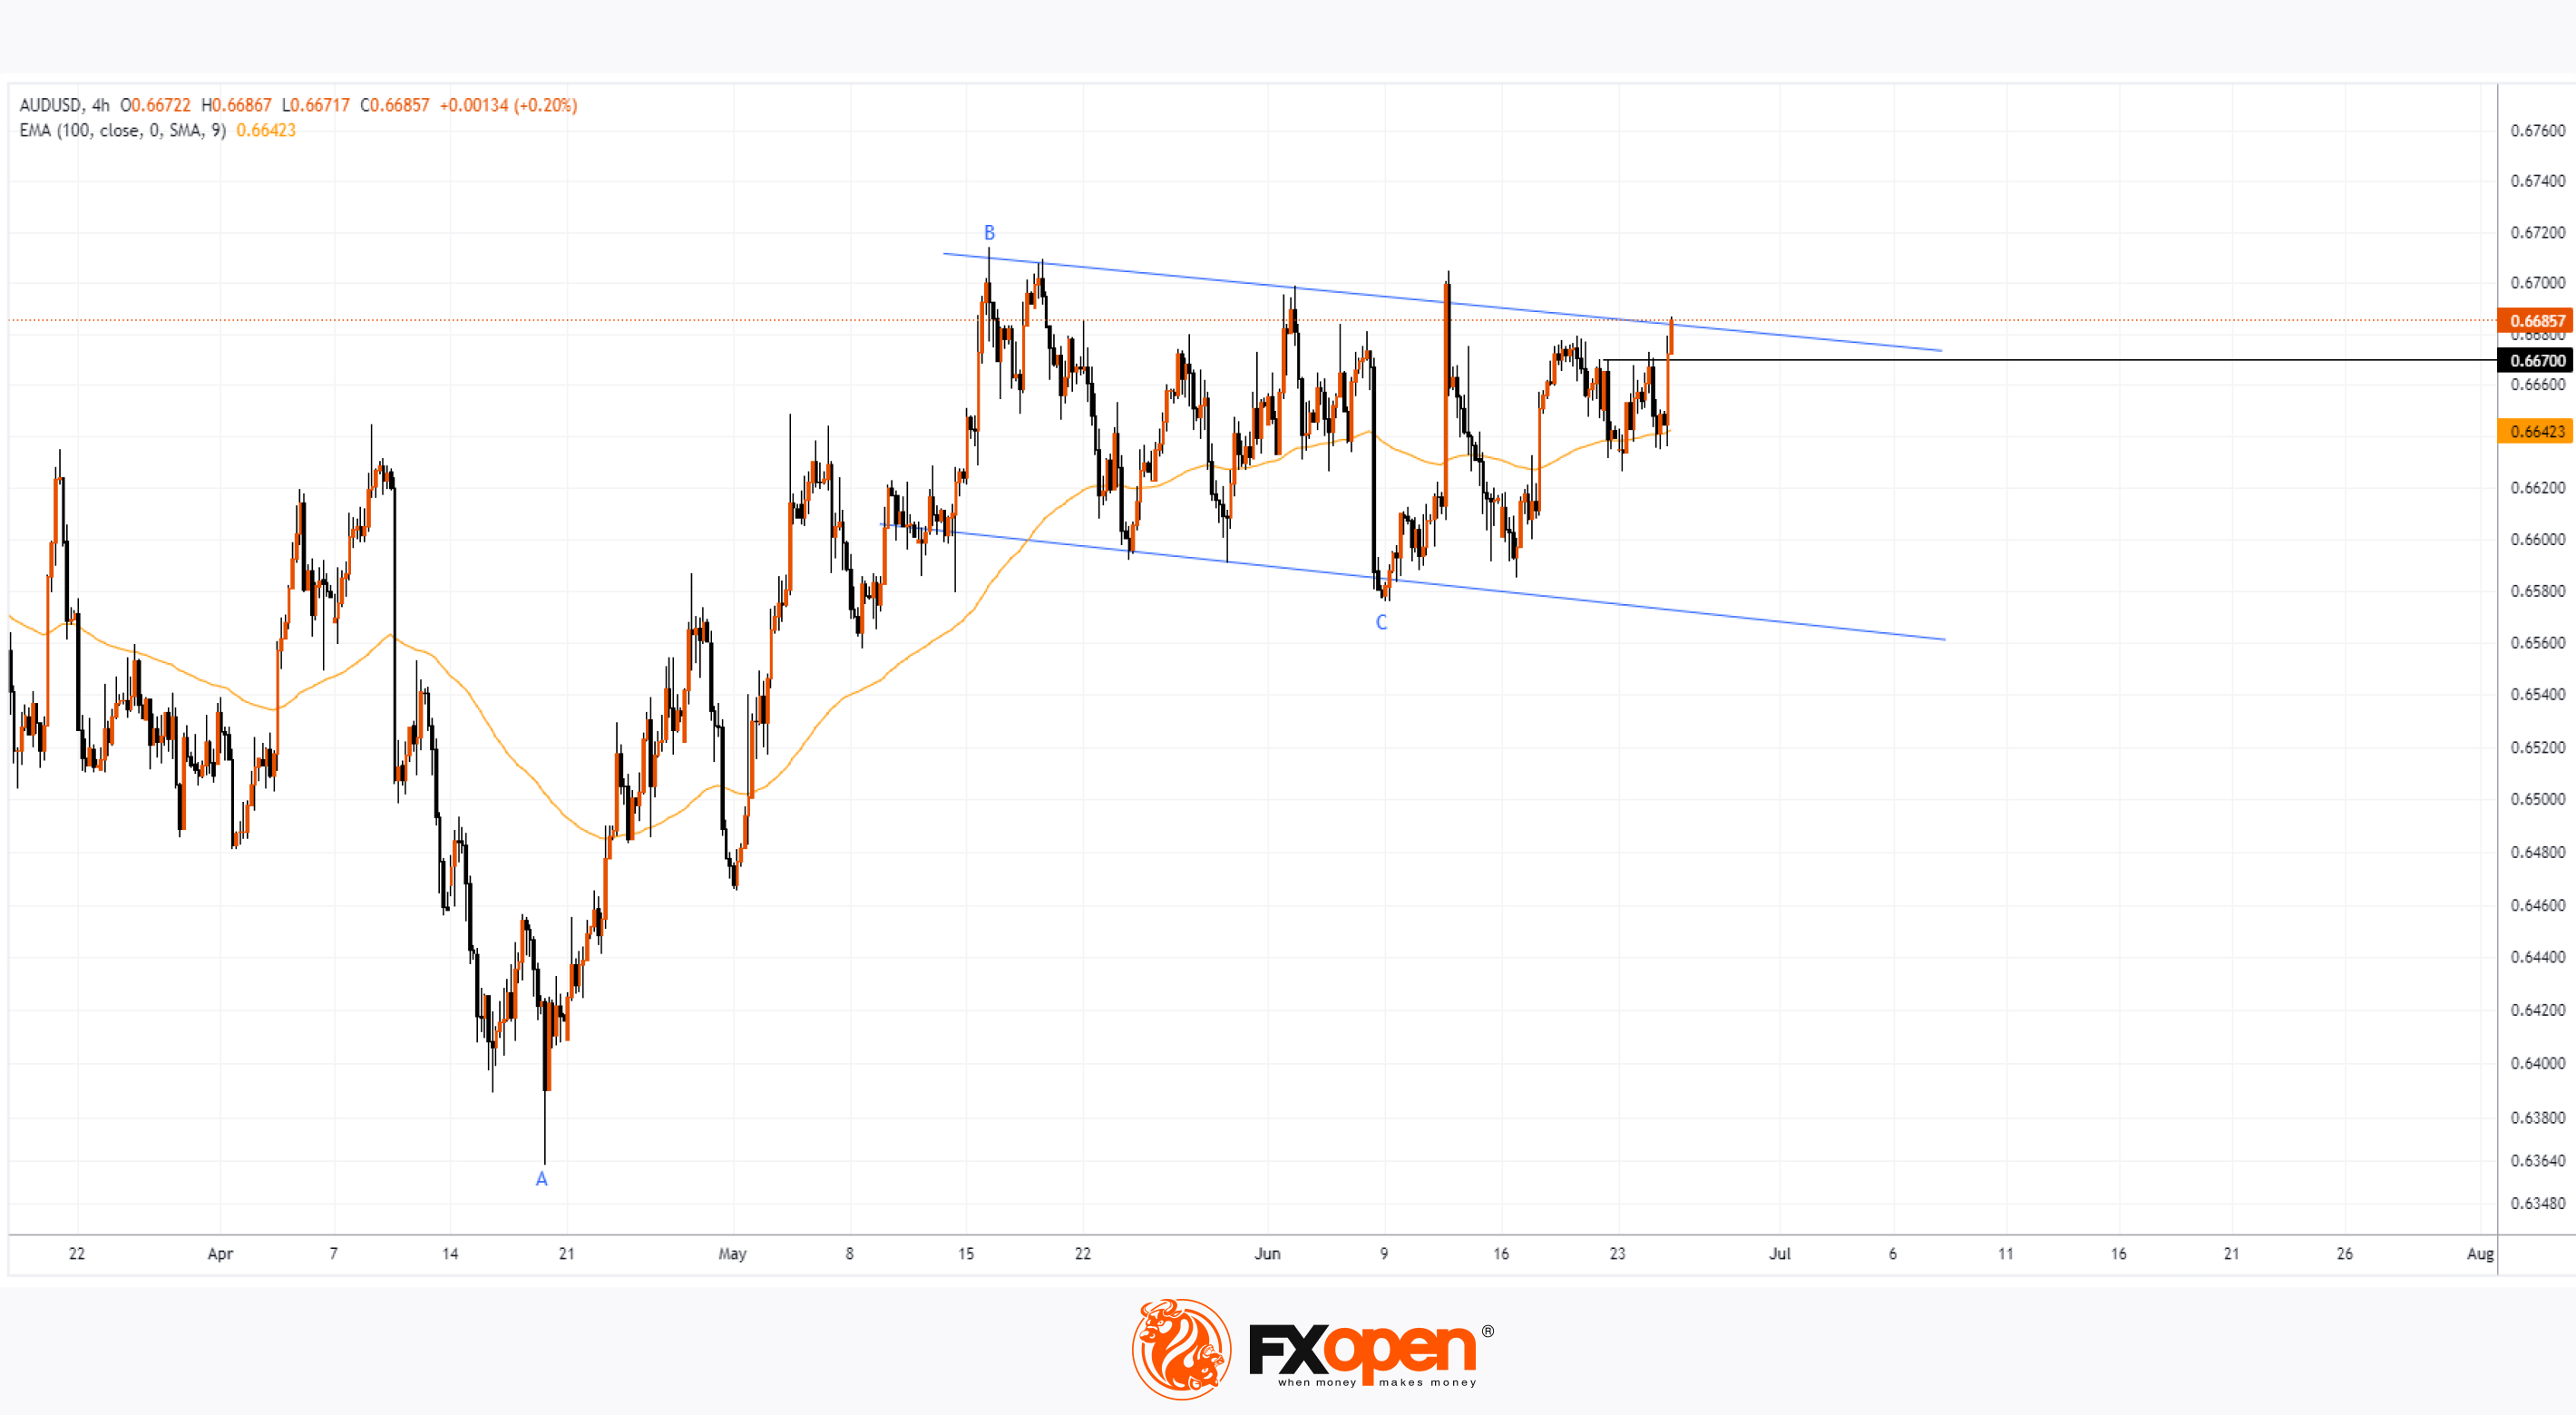
👍2
#nikkei225 #stockmarket #stocktrading #marketanalysis
The Nikkei Index Has Risen to a 2-Month High
As we wrote on June 17th, analyzing the Nikkei 225 chart (Japan 225 on FXOpen):
→ the price formed a consolidation pattern (in the shape of a narrowing triangle);
→ the price formed a bullish reversal from the 38,000 points level (indicated by an arrow), suggesting potential growth and trend establishment upon pattern breakout.
Since then, the price has broken out of the consolidation triangle and today exceeded the 39,800 level - marking the highest point since mid-April.
Technical analysis of the Nikkei 225 chart (Japan 225 on FXOpen) provides more information:
→ the price is in a significant uptrend (shown by the blue channel);
→ after breaking out of the consolidation triangle, the price reached the median line of the channel - implying that the bullish momentum may weaken here, but not necessarily come to an end completely.
It is possible that the Nikkei 225 index (Japan 225 on FXOpen) will continue to rise steadily along the median line, but fundamental factors should be considered as key drivers:
Firstly, the ultra-loose policy of the Bank of Japan, which is beneficial for the growth of Japan's export-oriented enterprises. However, the central bank's policy is increasingly criticized, especially with the USD/JPY exchange rate nearing the 'red line' of 160 yen per dollar.
Secondly, the influence of the US stock market. In this regard, it should be noted that:
→ the current rise in the Nikkei 225 index (Japan 225 on FXOpen) is linked to the strong recovery of NVDA shares after three days of decline;
→ upcoming news on US inflation. The Personal Consumption Expenditures (PCE) index values will be published on Friday at 15:30 GMT+3 and could cause significant volatility in financial markets, potentially affecting the price of the Nikkei 225 index (Japan 225 on FXOpen).
A significant resistance level is seen at the psychological level of 40,000. After the price surpassed it in March (but failed to hold above it on two attempts), it retraced by more than 9% with the formation of the aforementioned consolidation triangle.
Trade global index CFDs with zero commission and tight spreads. Open your FXOpen account now or learn more about trading index CFDs with FXOpen.
CFDs are complex instruments and come with a high risk of losing your money.
This article represents the opinion of the Companies operating under the FXOpen brand only. It is not to be construed as an offer, solicitation, or recommendation with respect to products and services provided by the Companies operating under the FXOpen brand, nor is it to be considered financial advice.
The Nikkei Index Has Risen to a 2-Month High
As we wrote on June 17th, analyzing the Nikkei 225 chart (Japan 225 on FXOpen):
→ the price formed a consolidation pattern (in the shape of a narrowing triangle);
→ the price formed a bullish reversal from the 38,000 points level (indicated by an arrow), suggesting potential growth and trend establishment upon pattern breakout.
Since then, the price has broken out of the consolidation triangle and today exceeded the 39,800 level - marking the highest point since mid-April.
Technical analysis of the Nikkei 225 chart (Japan 225 on FXOpen) provides more information:
→ the price is in a significant uptrend (shown by the blue channel);
→ after breaking out of the consolidation triangle, the price reached the median line of the channel - implying that the bullish momentum may weaken here, but not necessarily come to an end completely.
It is possible that the Nikkei 225 index (Japan 225 on FXOpen) will continue to rise steadily along the median line, but fundamental factors should be considered as key drivers:
Firstly, the ultra-loose policy of the Bank of Japan, which is beneficial for the growth of Japan's export-oriented enterprises. However, the central bank's policy is increasingly criticized, especially with the USD/JPY exchange rate nearing the 'red line' of 160 yen per dollar.
Secondly, the influence of the US stock market. In this regard, it should be noted that:
→ the current rise in the Nikkei 225 index (Japan 225 on FXOpen) is linked to the strong recovery of NVDA shares after three days of decline;
→ upcoming news on US inflation. The Personal Consumption Expenditures (PCE) index values will be published on Friday at 15:30 GMT+3 and could cause significant volatility in financial markets, potentially affecting the price of the Nikkei 225 index (Japan 225 on FXOpen).
A significant resistance level is seen at the psychological level of 40,000. After the price surpassed it in March (but failed to hold above it on two attempts), it retraced by more than 9% with the formation of the aforementioned consolidation triangle.
Trade global index CFDs with zero commission and tight spreads. Open your FXOpen account now or learn more about trading index CFDs with FXOpen.
CFDs are complex instruments and come with a high risk of losing your money.
This article represents the opinion of the Companies operating under the FXOpen brand only. It is not to be construed as an offer, solicitation, or recommendation with respect to products and services provided by the Companies operating under the FXOpen brand, nor is it to be considered financial advice.

👍2