
#marketanalysis #MarketNews #EURUSD
EUR/USD Exchange Rate Has Fallen Below 1.08 Level
As the EUR/USD chart today shows, yesterday the rate dropped by 0.46% – the most significant strengthening of the US dollar against the euro in one day this month. Moreover, the rate fell below the psychological mark of 1.08 euros per dollar (in the first half of May, it served as resistance).
Yesterday's movement was influenced by:
→ news of rising inflation in Germany. As reported by Think.ING, inflation reached 2.4% year-on-year, up from 2.2% in April – highlighting uncertainty and the resilience of inflation;
→ the rise of the US dollar, driven by falling Treasury bonds, which increased the appeal of the American currency due to both higher yields in the US and demand for safe-haven assets.
Analysing the chart on 23 May in the article "EUR/USD Price Forms Bullish Reversal," we:
→ drew an ascending channel (shown in blue);
→ highlighted the importance of resistance at the 1.0875 level.
Since then, the price has risen from 1.08393, bouncing off the lower boundary to the aforementioned resistance at 1.0875, but it failed to break through. This was followed by yesterday's decline.
In addition:
→ the EUR/USD price broke below the lower boundary of the blue channel, putting its relevance into serious doubt;
→ the price formed an A-B-C-D structure (with the D low possibly yet to be rewritten) of two lower lows and highs, indicating a potential shift in the May trend from bullish to bearish.
For now, the market is holding above the 1.08 level, but it is possible that upcoming news (notably the release of the US PCE index tomorrow at 15:30 GMT+3) could disrupt the balance. If a new batch of fundamental drivers leads to another bearish impulse, we could assume that a broader downtrend (indicated by the red channel, originating from the July 2023 peak) is resuming.
Trade over 50 forex markets 24 hours a day with FXOpen. Take advantage of low commissions, deep liquidity, and spreads from 0.0 pips. Open your FXOpen account now or learn more about trading forex with FXOpen.
CFDs are complex instruments and come with a high risk of losing your money.
This article represents the opinion of the Companies operating under the FXOpen brand only. It is not to be construed as an offer, solicitation, or recommendation with respect to products and services provided by the Companies operating under the FXOpen brand, nor is it to be considered financial advice.
EUR/USD Exchange Rate Has Fallen Below 1.08 Level
As the EUR/USD chart today shows, yesterday the rate dropped by 0.46% – the most significant strengthening of the US dollar against the euro in one day this month. Moreover, the rate fell below the psychological mark of 1.08 euros per dollar (in the first half of May, it served as resistance).
Yesterday's movement was influenced by:
→ news of rising inflation in Germany. As reported by Think.ING, inflation reached 2.4% year-on-year, up from 2.2% in April – highlighting uncertainty and the resilience of inflation;
→ the rise of the US dollar, driven by falling Treasury bonds, which increased the appeal of the American currency due to both higher yields in the US and demand for safe-haven assets.
Analysing the chart on 23 May in the article "EUR/USD Price Forms Bullish Reversal," we:
→ drew an ascending channel (shown in blue);
→ highlighted the importance of resistance at the 1.0875 level.
Since then, the price has risen from 1.08393, bouncing off the lower boundary to the aforementioned resistance at 1.0875, but it failed to break through. This was followed by yesterday's decline.
In addition:
→ the EUR/USD price broke below the lower boundary of the blue channel, putting its relevance into serious doubt;
→ the price formed an A-B-C-D structure (with the D low possibly yet to be rewritten) of two lower lows and highs, indicating a potential shift in the May trend from bullish to bearish.
For now, the market is holding above the 1.08 level, but it is possible that upcoming news (notably the release of the US PCE index tomorrow at 15:30 GMT+3) could disrupt the balance. If a new batch of fundamental drivers leads to another bearish impulse, we could assume that a broader downtrend (indicated by the red channel, originating from the July 2023 peak) is resuming.
Trade over 50 forex markets 24 hours a day with FXOpen. Take advantage of low commissions, deep liquidity, and spreads from 0.0 pips. Open your FXOpen account now or learn more about trading forex with FXOpen.
CFDs are complex instruments and come with a high risk of losing your money.
This article represents the opinion of the Companies operating under the FXOpen brand only. It is not to be construed as an offer, solicitation, or recommendation with respect to products and services provided by the Companies operating under the FXOpen brand, nor is it to be considered financial advice.

👍2
#stockmarket #stocktrading #NASDAQ #MarketNews
Nasdaq Index Shows Uncertainty Ahead of PCE Release
The main event of the week is the release of the Personal Consumption Expenditures (PCE) index, which the Federal Reserve particularly focuses on when assessing inflation in the US. The release is scheduled for Friday at 15:30 GMT+3. As this important event approaches, rumours and trader expectations about the news increasingly impact the current price on the stock market.
According to ForexFactory, the Core PCE Price Index on a monthly basis is as follows:
→ forecast for Friday = 0.3%.
→ previous value (a month ago) = 0.3%;
→ value two months ago = 0.3%.
These figures indicate stable inflation, but surprises are not ruled out, which could certainly lead to a spike in volatility.
The price of the Nasdaq index (US Tech 100 mini on FXOpen) has decreased since the beginning of the week – this may indicate market participants' uncertainty about whether inflation will decrease. Meanwhile, as CNBC reports, the president of the Federal Reserve Bank of Minneapolis, Neel Kashkari, believes that the Fed should wait for significant progress in combating inflation before lowering interest rates.
In his opinion, rates could potentially even be raised if inflation fails to decrease further. “I don’t think we should rule anything out at this point,” Kashkari added.
Technical analysis of the Nasdaq index (US Tech 100 mini on FXOpen) chart shows that:
→ the price is in an uptrend (shown by the blue channel);
→ the 18840 level is acting as resistance (indicated by the arrow).
Note the behaviour of the Nasdaq index price (US Tech 100 mini on FXOpen):
→ the upward impulse A→B was sharp, but it failed to hold above the 18840 level;
→ the upward impulse C→D is less sharp, judging by the slope of the trajectory. After overcoming the 18840 level, the price formed a rounding pattern (a sign of demand deficit) and decreased (confirmation of weakness). Notably, the price did not reach the upper boundary of the channel (shown by the red circle).
Today, the price is near the median line of the ascending channel, which could lead to some consolidation in anticipation of the news. If the news indicates a slowdown in inflation, we might see a new attack on the 18840 level; otherwise, the Nasdaq index price (US Tech 100 mini on FXOpen) could decrease to the lower boundary of the current channel.
Trade global index CFDs with zero commission and tight spreads. Open your FXOpen account now or learn more about trading index CFDs with FXOpen.
CFDs are complex instruments and come with a high risk of losing your money.
This article represents the opinion of the Companies operating under the FXOpen brand only. It is not to be construed as an offer, solicitation, or recommendation with respect to products and services provided by the Companies operating under the FXOpen brand, nor is it to be considered financial advice.
Nasdaq Index Shows Uncertainty Ahead of PCE Release
The main event of the week is the release of the Personal Consumption Expenditures (PCE) index, which the Federal Reserve particularly focuses on when assessing inflation in the US. The release is scheduled for Friday at 15:30 GMT+3. As this important event approaches, rumours and trader expectations about the news increasingly impact the current price on the stock market.
According to ForexFactory, the Core PCE Price Index on a monthly basis is as follows:
→ forecast for Friday = 0.3%.
→ previous value (a month ago) = 0.3%;
→ value two months ago = 0.3%.
These figures indicate stable inflation, but surprises are not ruled out, which could certainly lead to a spike in volatility.
The price of the Nasdaq index (US Tech 100 mini on FXOpen) has decreased since the beginning of the week – this may indicate market participants' uncertainty about whether inflation will decrease. Meanwhile, as CNBC reports, the president of the Federal Reserve Bank of Minneapolis, Neel Kashkari, believes that the Fed should wait for significant progress in combating inflation before lowering interest rates.
In his opinion, rates could potentially even be raised if inflation fails to decrease further. “I don’t think we should rule anything out at this point,” Kashkari added.
Technical analysis of the Nasdaq index (US Tech 100 mini on FXOpen) chart shows that:
→ the price is in an uptrend (shown by the blue channel);
→ the 18840 level is acting as resistance (indicated by the arrow).
Note the behaviour of the Nasdaq index price (US Tech 100 mini on FXOpen):
→ the upward impulse A→B was sharp, but it failed to hold above the 18840 level;
→ the upward impulse C→D is less sharp, judging by the slope of the trajectory. After overcoming the 18840 level, the price formed a rounding pattern (a sign of demand deficit) and decreased (confirmation of weakness). Notably, the price did not reach the upper boundary of the channel (shown by the red circle).
Today, the price is near the median line of the ascending channel, which could lead to some consolidation in anticipation of the news. If the news indicates a slowdown in inflation, we might see a new attack on the 18840 level; otherwise, the Nasdaq index price (US Tech 100 mini on FXOpen) could decrease to the lower boundary of the current channel.
Trade global index CFDs with zero commission and tight spreads. Open your FXOpen account now or learn more about trading index CFDs with FXOpen.
CFDs are complex instruments and come with a high risk of losing your money.
This article represents the opinion of the Companies operating under the FXOpen brand only. It is not to be construed as an offer, solicitation, or recommendation with respect to products and services provided by the Companies operating under the FXOpen brand, nor is it to be considered financial advice.

👍3
#marketanalysis #stockmarket #stocktrading
NIO Shares Surged Over 9% on Sales Growth Expectations
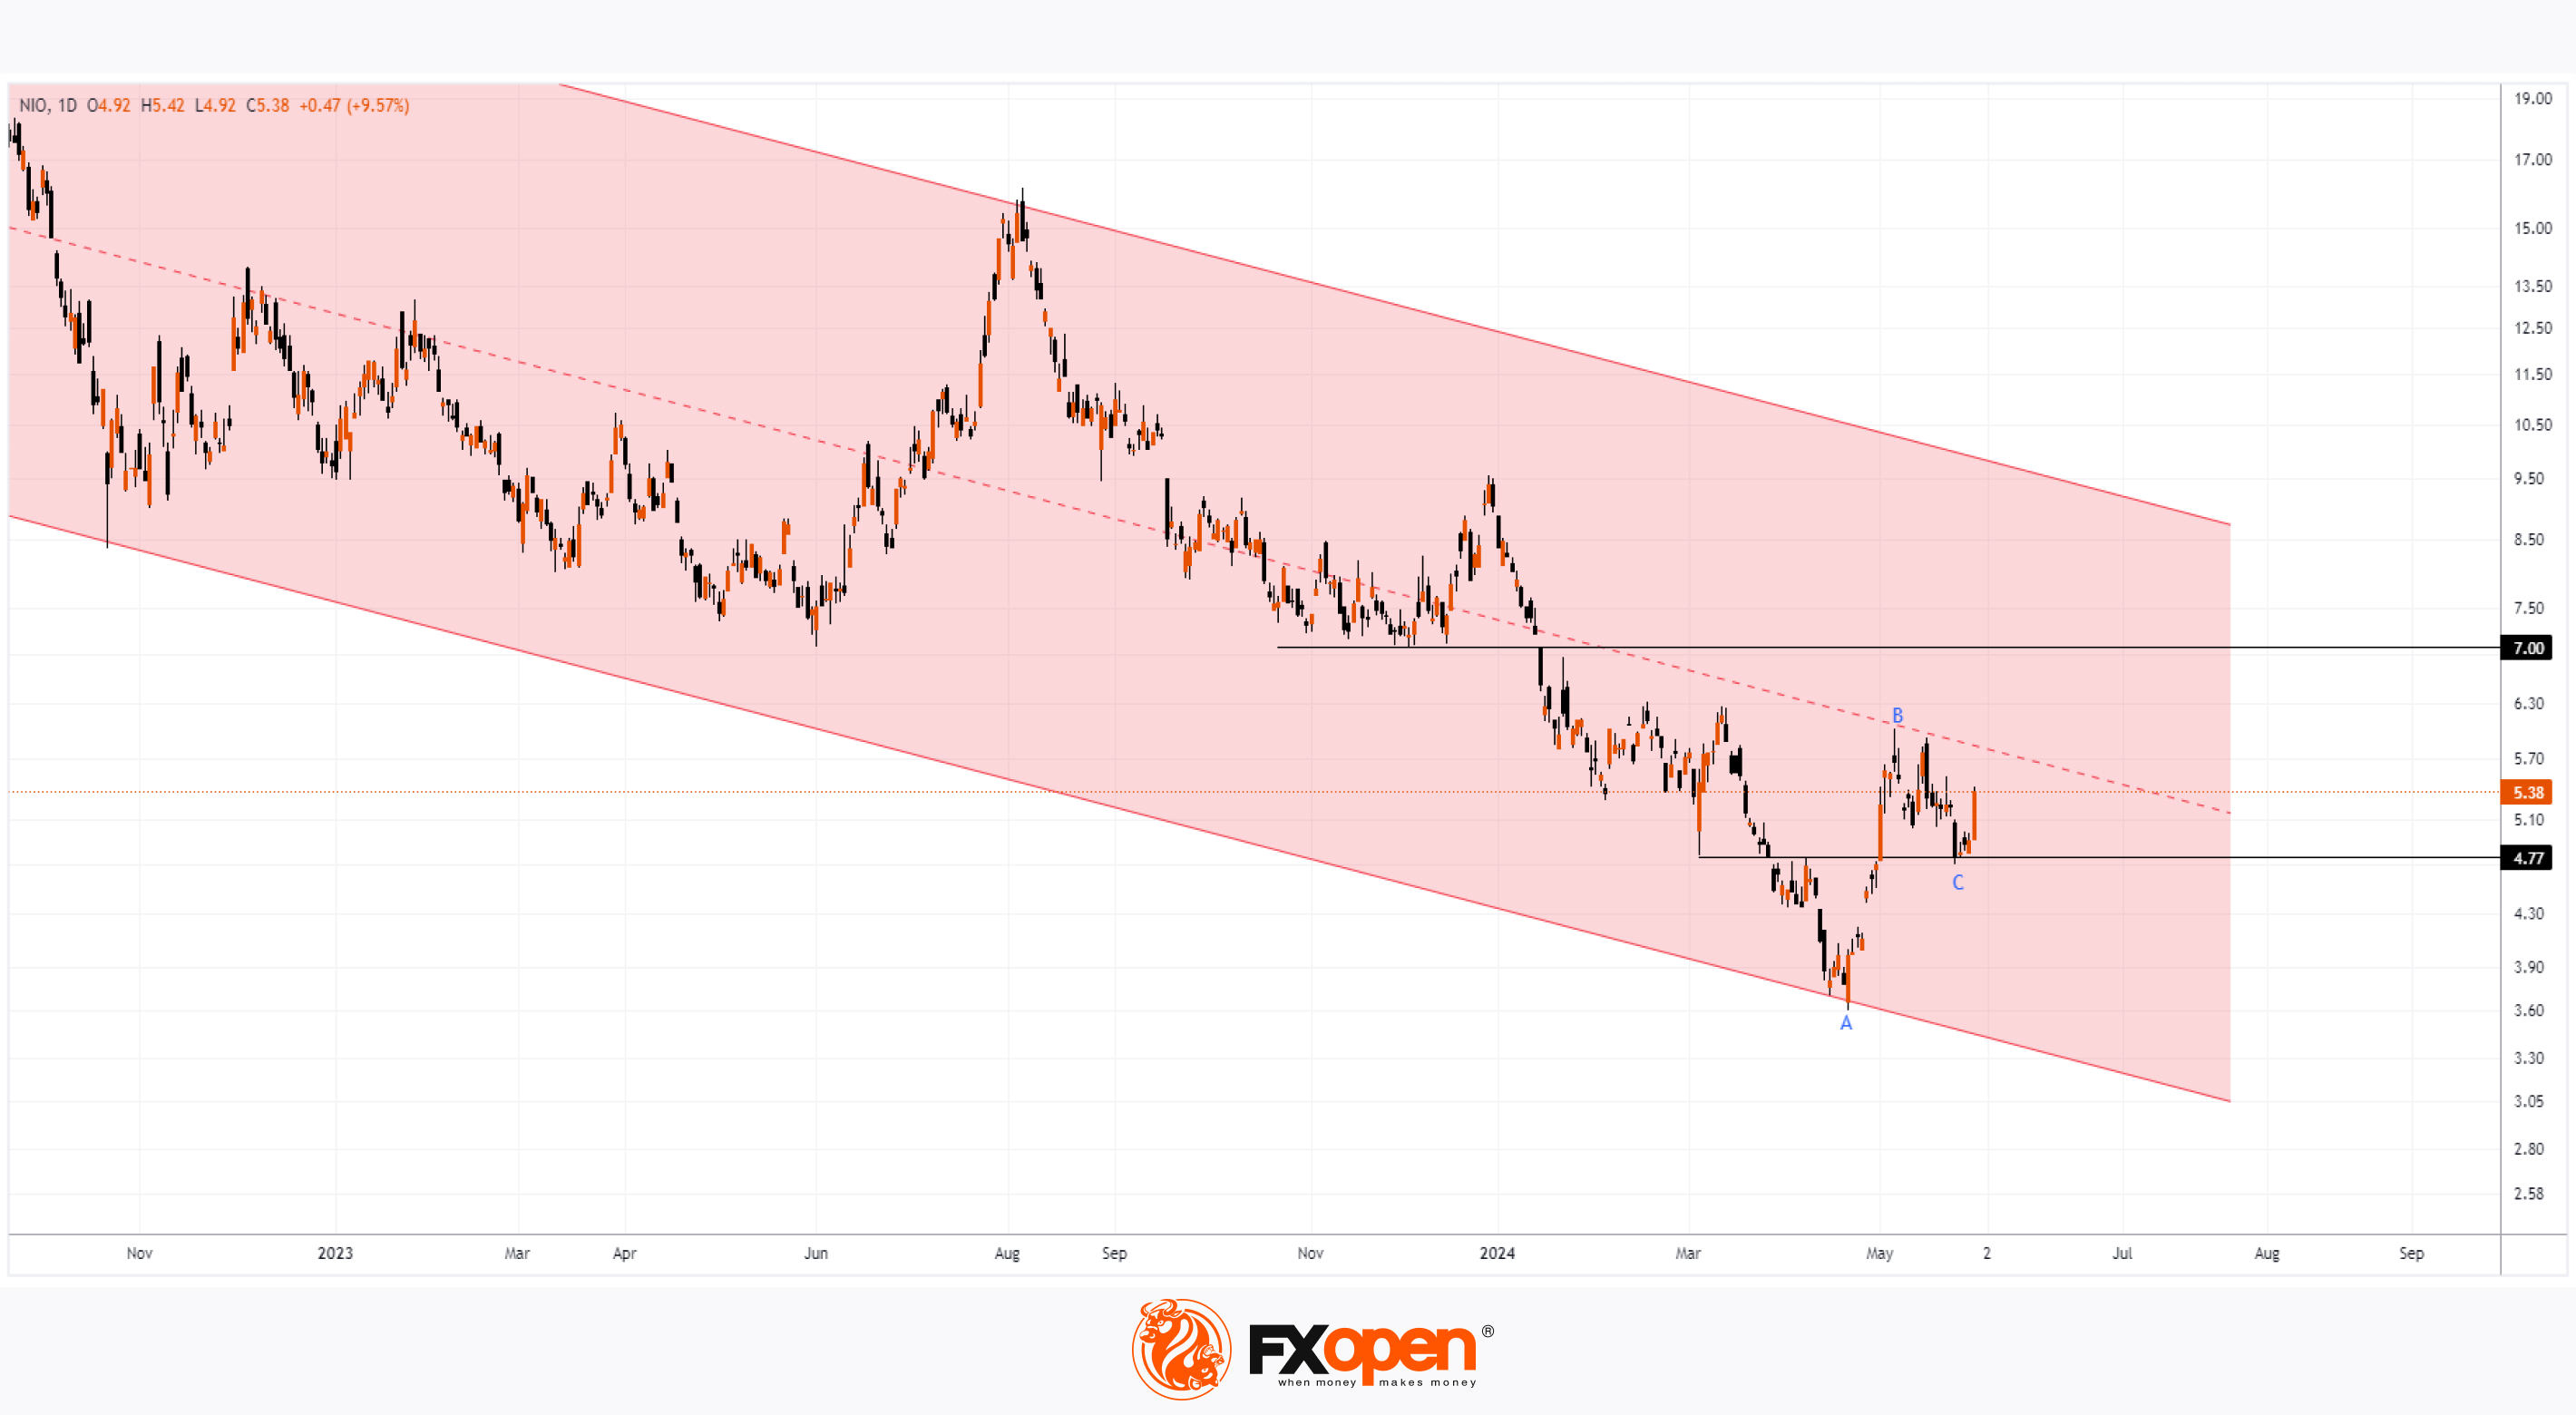
As evidenced by the NIO stock price chart, yesterday's trading closed at $4.93, while today the NIO share price is around $5.40, indicating an increase of over 9%.
According to MarketWatch, the rise is driven by expectations that the Chinese electric vehicle manufacturer's deliveries are likely to reach record levels.
The existing record was set in July last year when the company achieved monthly sales of 20,462 cars. However, analysts believe this result could be surpassed in May this year due to ongoing discounts on new cars and batteries.
The daily chart of NIO shares today shows that the price is in a long-term downtrend (indicated by the red trend channel) due to the global decline in demand for electric vehicles.
However, there are fundamental reasons to expect that the downward trend will be broken:
→ China is intensifying its efforts to develop electric vehicles – the State Council has presented an action plan for decarbonisation.
→ This month, the International Monetary Fund raised its forecast for China's economic growth in 2024 from 4.6% to 5%.
Technical analysis of the NIO stock chart shows that:
→ The price is in a downtrend and below the median line, which can be expected to provide resistance.
→ Resistance may also be encountered at the $7 per share level, which acted as support at the end of 2023.
→ The $4.77 level has changed its role several times but has provided support over the past 10 days, giving the bulls a foothold.
→ The minimum C is at the 50% level of the A→B impulse, which is a sign of a bull market.
On June 6, NIO will present its report for the first quarter of 2024. If the report is strong, it could give the bulls more confidence and lead to attempts to reverse the long-term downtrend.
Trade global index CFDs with zero commission and tight spreads. Open your FXOpen account now or learn more about trading index CFDs with FXOpen.
CFDs are complex instruments and come with a high risk of losing your money.
This article represents the opinion of the Companies operating under the FXOpen brand only. It is not to be construed as an offer, solicitation, or recommendation with respect to products and services provided by the Companies operating under the FXOpen brand, nor is it to be considered financial advice.
NIO Shares Surged Over 9% on Sales Growth Expectations
As evidenced by the NIO stock price chart, yesterday's trading closed at $4.93, while today the NIO share price is around $5.40, indicating an increase of over 9%.
According to MarketWatch, the rise is driven by expectations that the Chinese electric vehicle manufacturer's deliveries are likely to reach record levels.
The existing record was set in July last year when the company achieved monthly sales of 20,462 cars. However, analysts believe this result could be surpassed in May this year due to ongoing discounts on new cars and batteries.
The daily chart of NIO shares today shows that the price is in a long-term downtrend (indicated by the red trend channel) due to the global decline in demand for electric vehicles.
However, there are fundamental reasons to expect that the downward trend will be broken:
→ China is intensifying its efforts to develop electric vehicles – the State Council has presented an action plan for decarbonisation.
→ This month, the International Monetary Fund raised its forecast for China's economic growth in 2024 from 4.6% to 5%.
Technical analysis of the NIO stock chart shows that:
→ The price is in a downtrend and below the median line, which can be expected to provide resistance.
→ Resistance may also be encountered at the $7 per share level, which acted as support at the end of 2023.
→ The $4.77 level has changed its role several times but has provided support over the past 10 days, giving the bulls a foothold.
→ The minimum C is at the 50% level of the A→B impulse, which is a sign of a bull market.
On June 6, NIO will present its report for the first quarter of 2024. If the report is strong, it could give the bulls more confidence and lead to attempts to reverse the long-term downtrend.
Trade global index CFDs with zero commission and tight spreads. Open your FXOpen account now or learn more about trading index CFDs with FXOpen.
CFDs are complex instruments and come with a high risk of losing your money.
This article represents the opinion of the Companies operating under the FXOpen brand only. It is not to be construed as an offer, solicitation, or recommendation with respect to products and services provided by the Companies operating under the FXOpen brand, nor is it to be considered financial advice.
👍2
#marketanalysis #tradingtips #tradingforex
USD/CHF Rate Falls Over 1% After SNB Chief's Statements
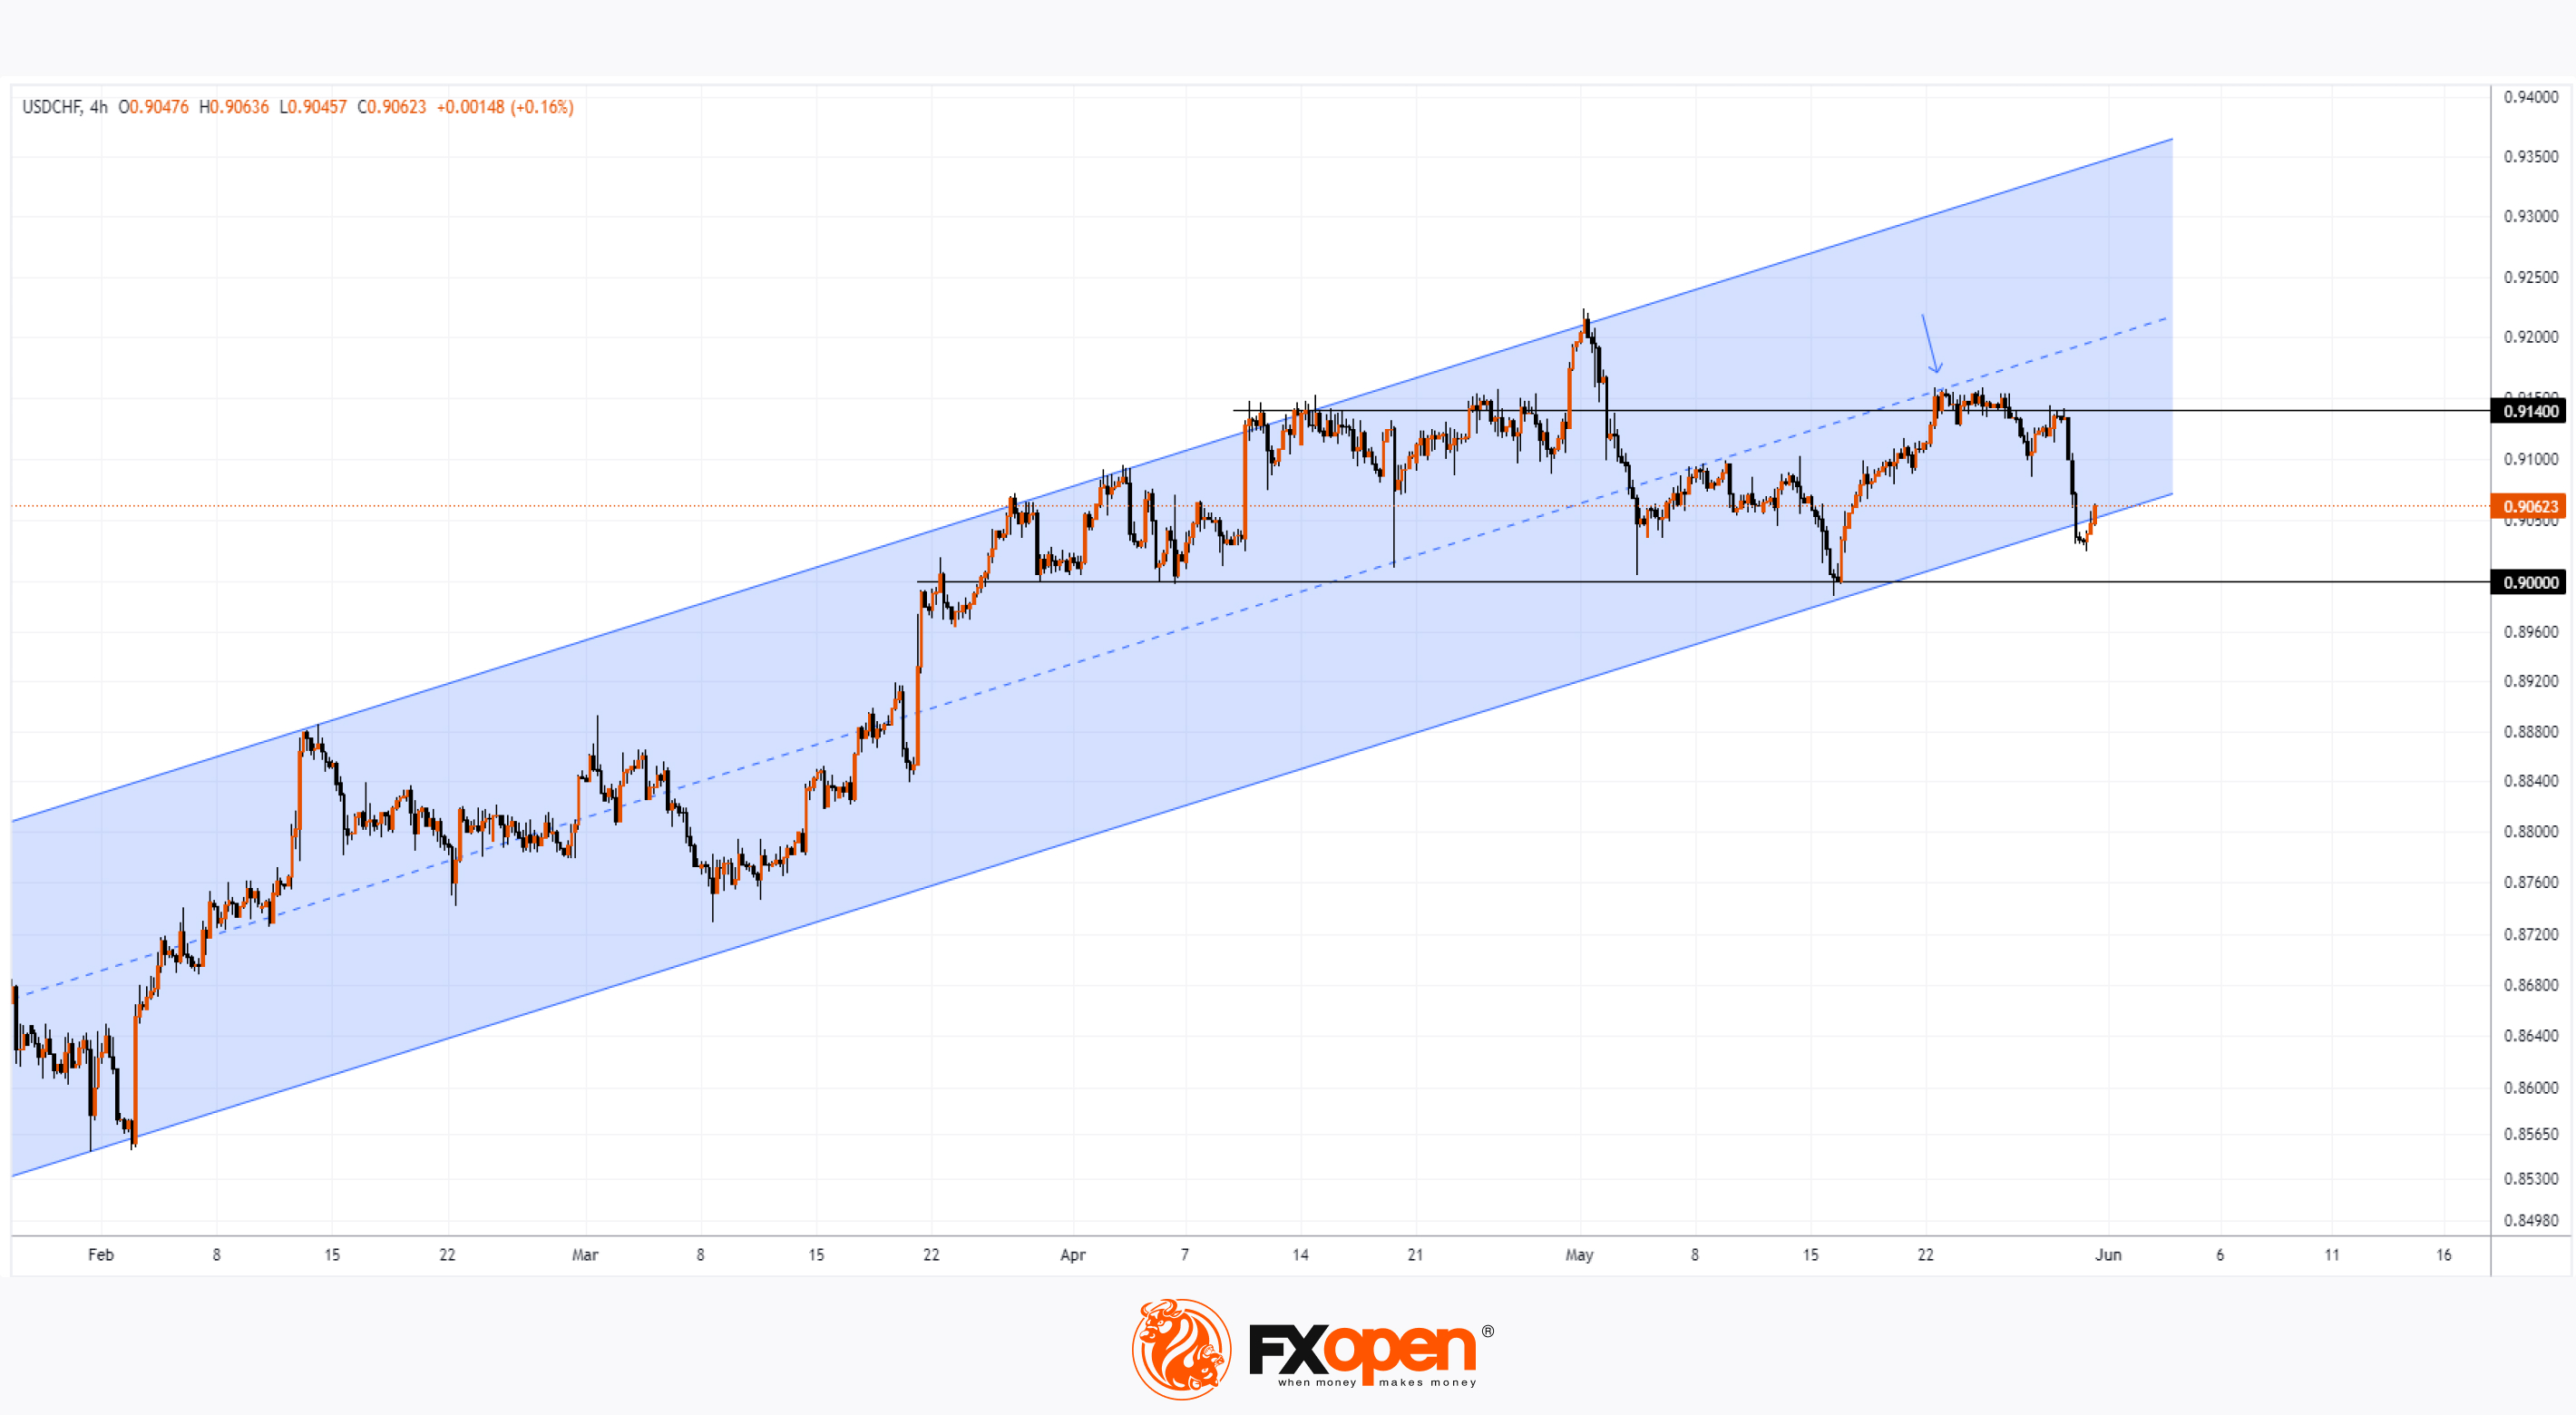
As evidenced by the USD/CHF chart, yesterday one US dollar was worth 0.913 Swiss francs, but today it is already 0.903, indicating a rate drop of approximately 1%.
According to MT Newswires, the franc's strengthening is attributed to statements by Swiss National Bank (SNB) President Thomas Jordan. In his view, an overly weak franc is the most likely source of higher inflation in Switzerland.
Notably, since the beginning of 2024, the Swiss franc has weakened against the US dollar by more than 7%, one of the worst performances among G10 currencies. The exchange rate has formed an ascending trend channel (indicated in blue).
Today's USD/CHF chart shows two important resistance lines:
→ The 0.913 level – the price could not consolidate above this level despite several attempts;
→ The median line of the channel.
On May 22, a downward reversal occurred from this resistance block (indicated by an arrow), and today the USD/CHF price is near the lower boundary of the channel.
Bullish arguments:
→ Near the lower boundary of the channel, demand may increase;
→ The psychological level of 0.9 CHF per 1 USD may provide support – this has occurred several times during the spring.
It is likely that the SNB does not want the upward trend to continue, and if so, in the near future, we might see a consolidation in the USD/CHF market within the range of 0.900 – 0.913, until significant fundamental news emerges to disrupt the balance that has been forming since April.
Trade over 50 forex markets 24 hours a day with FXOpen. Take advantage of low commissions, deep liquidity, and spreads from 0.0 pips. Open your FXOpen account now or learn more about trading forex with FXOpen.
CFDs are complex instruments and come with a high risk of losing your money.
This article represents the opinion of the Companies operating under the FXOpen brand only. It is not to be construed as an offer, solicitation, or recommendation with respect to products and services provided by the Companies operating under the FXOpen brand, nor is it to be considered financial advice.
USD/CHF Rate Falls Over 1% After SNB Chief's Statements
As evidenced by the USD/CHF chart, yesterday one US dollar was worth 0.913 Swiss francs, but today it is already 0.903, indicating a rate drop of approximately 1%.
According to MT Newswires, the franc's strengthening is attributed to statements by Swiss National Bank (SNB) President Thomas Jordan. In his view, an overly weak franc is the most likely source of higher inflation in Switzerland.
Notably, since the beginning of 2024, the Swiss franc has weakened against the US dollar by more than 7%, one of the worst performances among G10 currencies. The exchange rate has formed an ascending trend channel (indicated in blue).
Today's USD/CHF chart shows two important resistance lines:
→ The 0.913 level – the price could not consolidate above this level despite several attempts;
→ The median line of the channel.
On May 22, a downward reversal occurred from this resistance block (indicated by an arrow), and today the USD/CHF price is near the lower boundary of the channel.
Bullish arguments:
→ Near the lower boundary of the channel, demand may increase;
→ The psychological level of 0.9 CHF per 1 USD may provide support – this has occurred several times during the spring.
It is likely that the SNB does not want the upward trend to continue, and if so, in the near future, we might see a consolidation in the USD/CHF market within the range of 0.900 – 0.913, until significant fundamental news emerges to disrupt the balance that has been forming since April.
Trade over 50 forex markets 24 hours a day with FXOpen. Take advantage of low commissions, deep liquidity, and spreads from 0.0 pips. Open your FXOpen account now or learn more about trading forex with FXOpen.
CFDs are complex instruments and come with a high risk of losing your money.
This article represents the opinion of the Companies operating under the FXOpen brand only. It is not to be construed as an offer, solicitation, or recommendation with respect to products and services provided by the Companies operating under the FXOpen brand, nor is it to be considered financial advice.
👍2
#oilprices #MarketNews #opec #oiltrading
WTI Oil Price Unchanged After OPEC+ Meeting
The OPEC+ meeting over the weekend did not have a substantial impact on the price of crude oil. As the chart shows, WTI oil opened today at $76.72 per barrel, while on Friday it closed at $76.57 – indicating that the decision made by oil producers is ambiguous.
The bullish argument is that restrictions on oil production to maintain its price will continue. According to Reuters, on Sunday, OPEC+ members agreed to extend the production cuts of 3.66 million barrels per day until the end of 2025.
The bearish argument is that eight OPEC+ countries have already signalled plans to gradually phase out voluntary cuts of 2.2 million barrels per day from October 2024 to September 2025.
Goldman Sachs analysts overall assessed the results of the meeting as more bearish for the market. "The communication of a gradual unwind reflects a strong desire to bring back production of several members given high spare capacity," they wrote.
The WTI crude oil chart shows that the market is breaking the upward trend (shown in blue), which we mentioned in our review on 10 May.
Since then, bulls attempted to resume the upward trend, but this only resulted in a false breakout of the psychological level of $80 per barrel on 29 May (indicated by an arrow).
Afterwards, bears regained control and sharply pushed the price below the lower boundary of the blue upward channel, making the downward channel (shown in red), which began in April, more relevant.
According to the technical analysis of the oil chart:
→ the price is near the median line of the red channel – a sign of temporary equilibrium between supply and demand;
→ below the current WTI crude oil price is an important level of $75.75, which provided support back at the end of winter.
If the bulls attempt a comeback (which would require fundamental drivers), the upper boundary of the downward channel may resist the price.
If the geopolitical situation in the Middle East does not escalate, the bears may continue to exert pressure aiming to break the $75.75 level – which would likely slow inflation and benefit the current U.S. administration ahead of the upcoming presidential elections.
Start trading commodities with tight spreads. Open your trading account now or learn more about trading commodity CFDs with FXOpen.
CFDs are complex instruments and come with a high risk of losing your money.
This article represents the opinion of the Companies operating under the FXOpen brand only. It is not to be construed as an offer, solicitation, or recommendation with respect to products and services provided by the Companies operating under the FXOpen brand, nor is it to be considered financial advice.
WTI Oil Price Unchanged After OPEC+ Meeting
The OPEC+ meeting over the weekend did not have a substantial impact on the price of crude oil. As the chart shows, WTI oil opened today at $76.72 per barrel, while on Friday it closed at $76.57 – indicating that the decision made by oil producers is ambiguous.
The bullish argument is that restrictions on oil production to maintain its price will continue. According to Reuters, on Sunday, OPEC+ members agreed to extend the production cuts of 3.66 million barrels per day until the end of 2025.
The bearish argument is that eight OPEC+ countries have already signalled plans to gradually phase out voluntary cuts of 2.2 million barrels per day from October 2024 to September 2025.
Goldman Sachs analysts overall assessed the results of the meeting as more bearish for the market. "The communication of a gradual unwind reflects a strong desire to bring back production of several members given high spare capacity," they wrote.
The WTI crude oil chart shows that the market is breaking the upward trend (shown in blue), which we mentioned in our review on 10 May.
Since then, bulls attempted to resume the upward trend, but this only resulted in a false breakout of the psychological level of $80 per barrel on 29 May (indicated by an arrow).
Afterwards, bears regained control and sharply pushed the price below the lower boundary of the blue upward channel, making the downward channel (shown in red), which began in April, more relevant.
According to the technical analysis of the oil chart:
→ the price is near the median line of the red channel – a sign of temporary equilibrium between supply and demand;
→ below the current WTI crude oil price is an important level of $75.75, which provided support back at the end of winter.
If the bulls attempt a comeback (which would require fundamental drivers), the upper boundary of the downward channel may resist the price.
If the geopolitical situation in the Middle East does not escalate, the bears may continue to exert pressure aiming to break the $75.75 level – which would likely slow inflation and benefit the current U.S. administration ahead of the upcoming presidential elections.
Start trading commodities with tight spreads. Open your trading account now or learn more about trading commodity CFDs with FXOpen.
CFDs are complex instruments and come with a high risk of losing your money.
This article represents the opinion of the Companies operating under the FXOpen brand only. It is not to be construed as an offer, solicitation, or recommendation with respect to products and services provided by the Companies operating under the FXOpen brand, nor is it to be considered financial advice.

👍2
#MSFT #stockmarket #stocktrading #marketanalysis
MSFT Shares Surge on Record Yearly Volumes
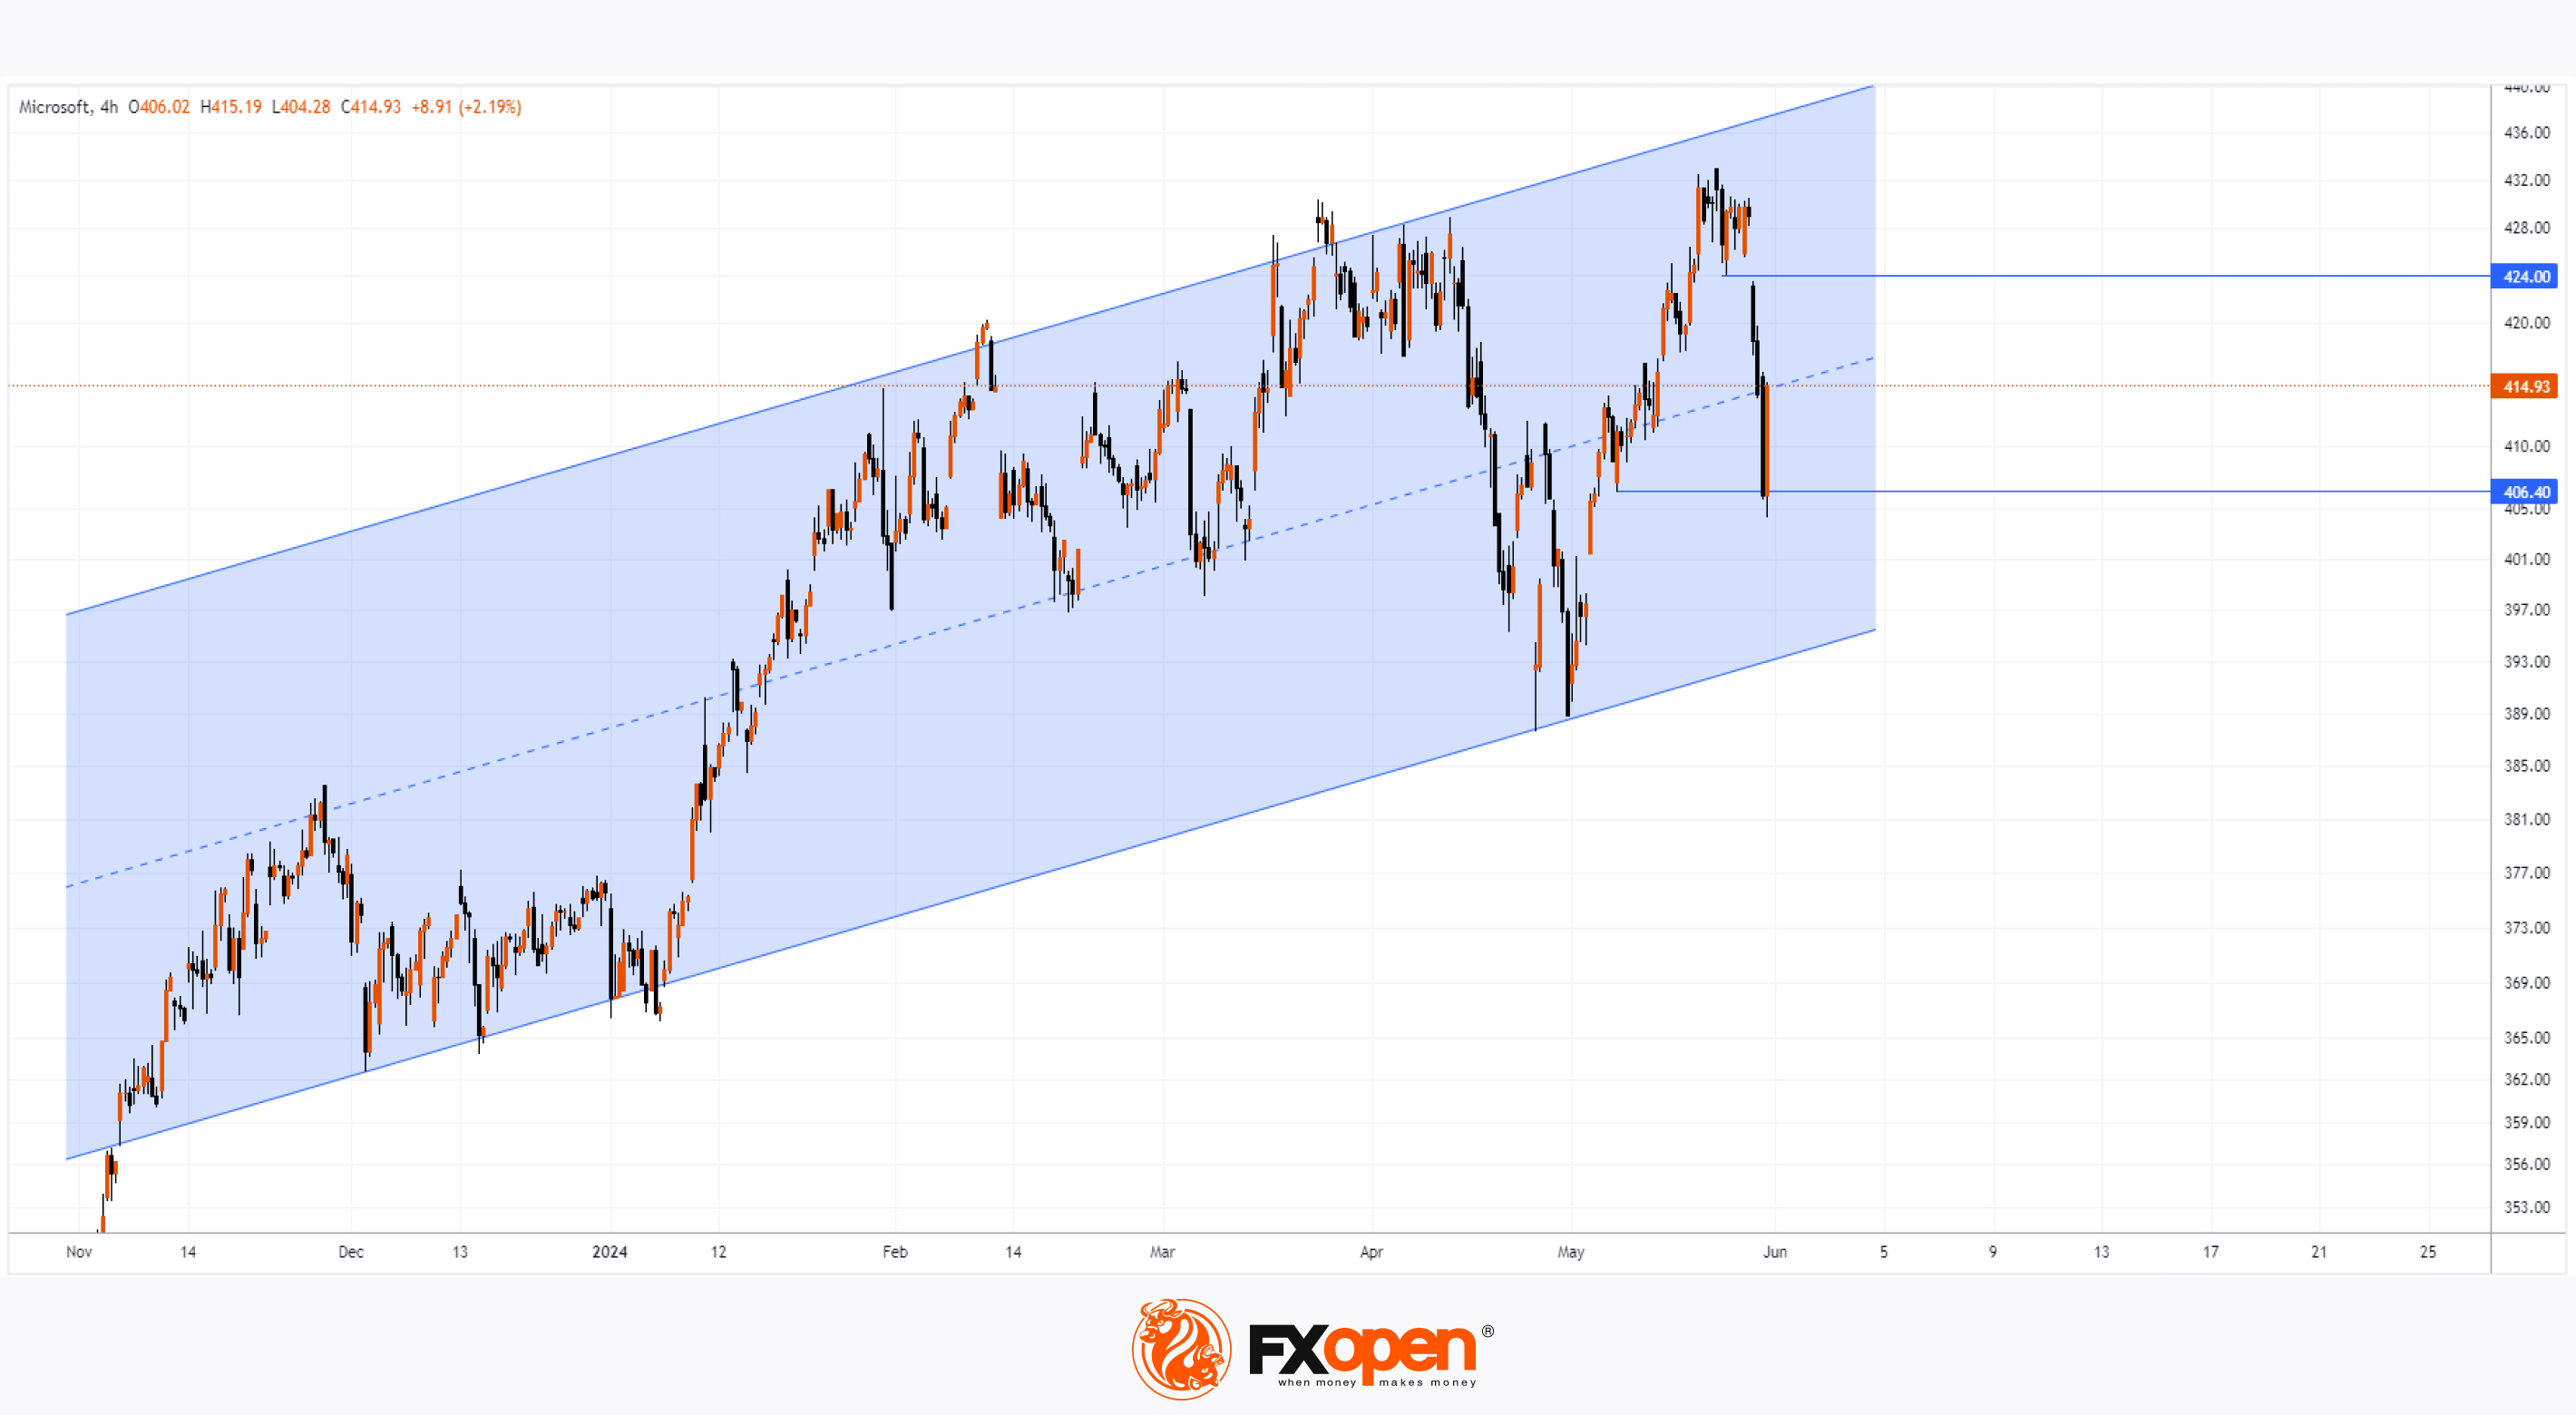
On Friday, 31 May, almost 48 million Microsoft shares were traded on the NASDAQ – the highest number since the start of 2024. Meanwhile, the MSFT price chart formed a “hammer” candle:
→ trading opened at $416.75 per MSFT share;
→ mid-session, the price dropped below $406;
→ however, by the end of trading, the price had recovered to $415.13.
Fundamentally, it is difficult to pinpoint a single piece of news that served as the bullish driver. According to Barron's, a significant incentive for investing in MSFT shares should be considered the prospect of high dividend payouts.
From the perspective of MSFT chart technical analysis, the price action can be interpreted as evidence of demand absorbing all selling pressure:
→ the share price is within an ascending channel;
→ having dropped to the $406 level, the price pierced the $406.40 support from 8 May – this likely triggered mass activation of buyers' stop-losses and led to a shift in the balance of buyers and sellers;
→ in the pre-market today, the MSFT price is around the median – thus, it can be assumed that the market will consolidate at the beginning of the week. If Friday's bullish momentum continues, the price may encounter resistance around the bearish gap at $424 per MSFT share.
A crucial driver for the price of MSFT and other market leaders in the near future will be the upcoming Fed meeting on interest rates, scheduled for Wednesday, 12 June.
According to TipRanks, the average forecasted price of MSFT shares in 12 months is $491.90 (+18.49% from current levels).
Trade global index CFDs with zero commission and tight spreads. Open your FXOpen account now or learn more about trading index CFDs with FXOpen.
CFDs are complex instruments and come with a high risk of losing your money.
This article represents the opinion of the Companies operating under the FXOpen brand only. It is not to be construed as an offer, solicitation, or recommendation with respect to products and services provided by the Companies operating under the FXOpen brand, nor is it to be considered financial advice.
MSFT Shares Surge on Record Yearly Volumes
On Friday, 31 May, almost 48 million Microsoft shares were traded on the NASDAQ – the highest number since the start of 2024. Meanwhile, the MSFT price chart formed a “hammer” candle:
→ trading opened at $416.75 per MSFT share;
→ mid-session, the price dropped below $406;
→ however, by the end of trading, the price had recovered to $415.13.
Fundamentally, it is difficult to pinpoint a single piece of news that served as the bullish driver. According to Barron's, a significant incentive for investing in MSFT shares should be considered the prospect of high dividend payouts.
From the perspective of MSFT chart technical analysis, the price action can be interpreted as evidence of demand absorbing all selling pressure:
→ the share price is within an ascending channel;
→ having dropped to the $406 level, the price pierced the $406.40 support from 8 May – this likely triggered mass activation of buyers' stop-losses and led to a shift in the balance of buyers and sellers;
→ in the pre-market today, the MSFT price is around the median – thus, it can be assumed that the market will consolidate at the beginning of the week. If Friday's bullish momentum continues, the price may encounter resistance around the bearish gap at $424 per MSFT share.
A crucial driver for the price of MSFT and other market leaders in the near future will be the upcoming Fed meeting on interest rates, scheduled for Wednesday, 12 June.
According to TipRanks, the average forecasted price of MSFT shares in 12 months is $491.90 (+18.49% from current levels).
Trade global index CFDs with zero commission and tight spreads. Open your FXOpen account now or learn more about trading index CFDs with FXOpen.
CFDs are complex instruments and come with a high risk of losing your money.
This article represents the opinion of the Companies operating under the FXOpen brand only. It is not to be construed as an offer, solicitation, or recommendation with respect to products and services provided by the Companies operating under the FXOpen brand, nor is it to be considered financial advice.
👍2
#marketanalysis #forextrading #AUDUSD #tradingtips
AUD/USD Analysis: US Dollar Rebounds from Decline
Yesterday, the PMI Manufacturing indices for several countries were published. The news turned out to be disappointing for the US - according to ForexFactory:
→ Final Manufacturing PMI: actual = 51.3; expected = 50.9; previous value = 50.9;
→ ISM Manufacturing PMI: actual = 48.7; expected = 49.8; previous value = 49.2;
This led to a weakening of the US dollar yesterday, as the not-so-strong manufacturing activity data, as reported by Trading Economics, supported arguments in favor of the Federal Reserve lowering interest rates.
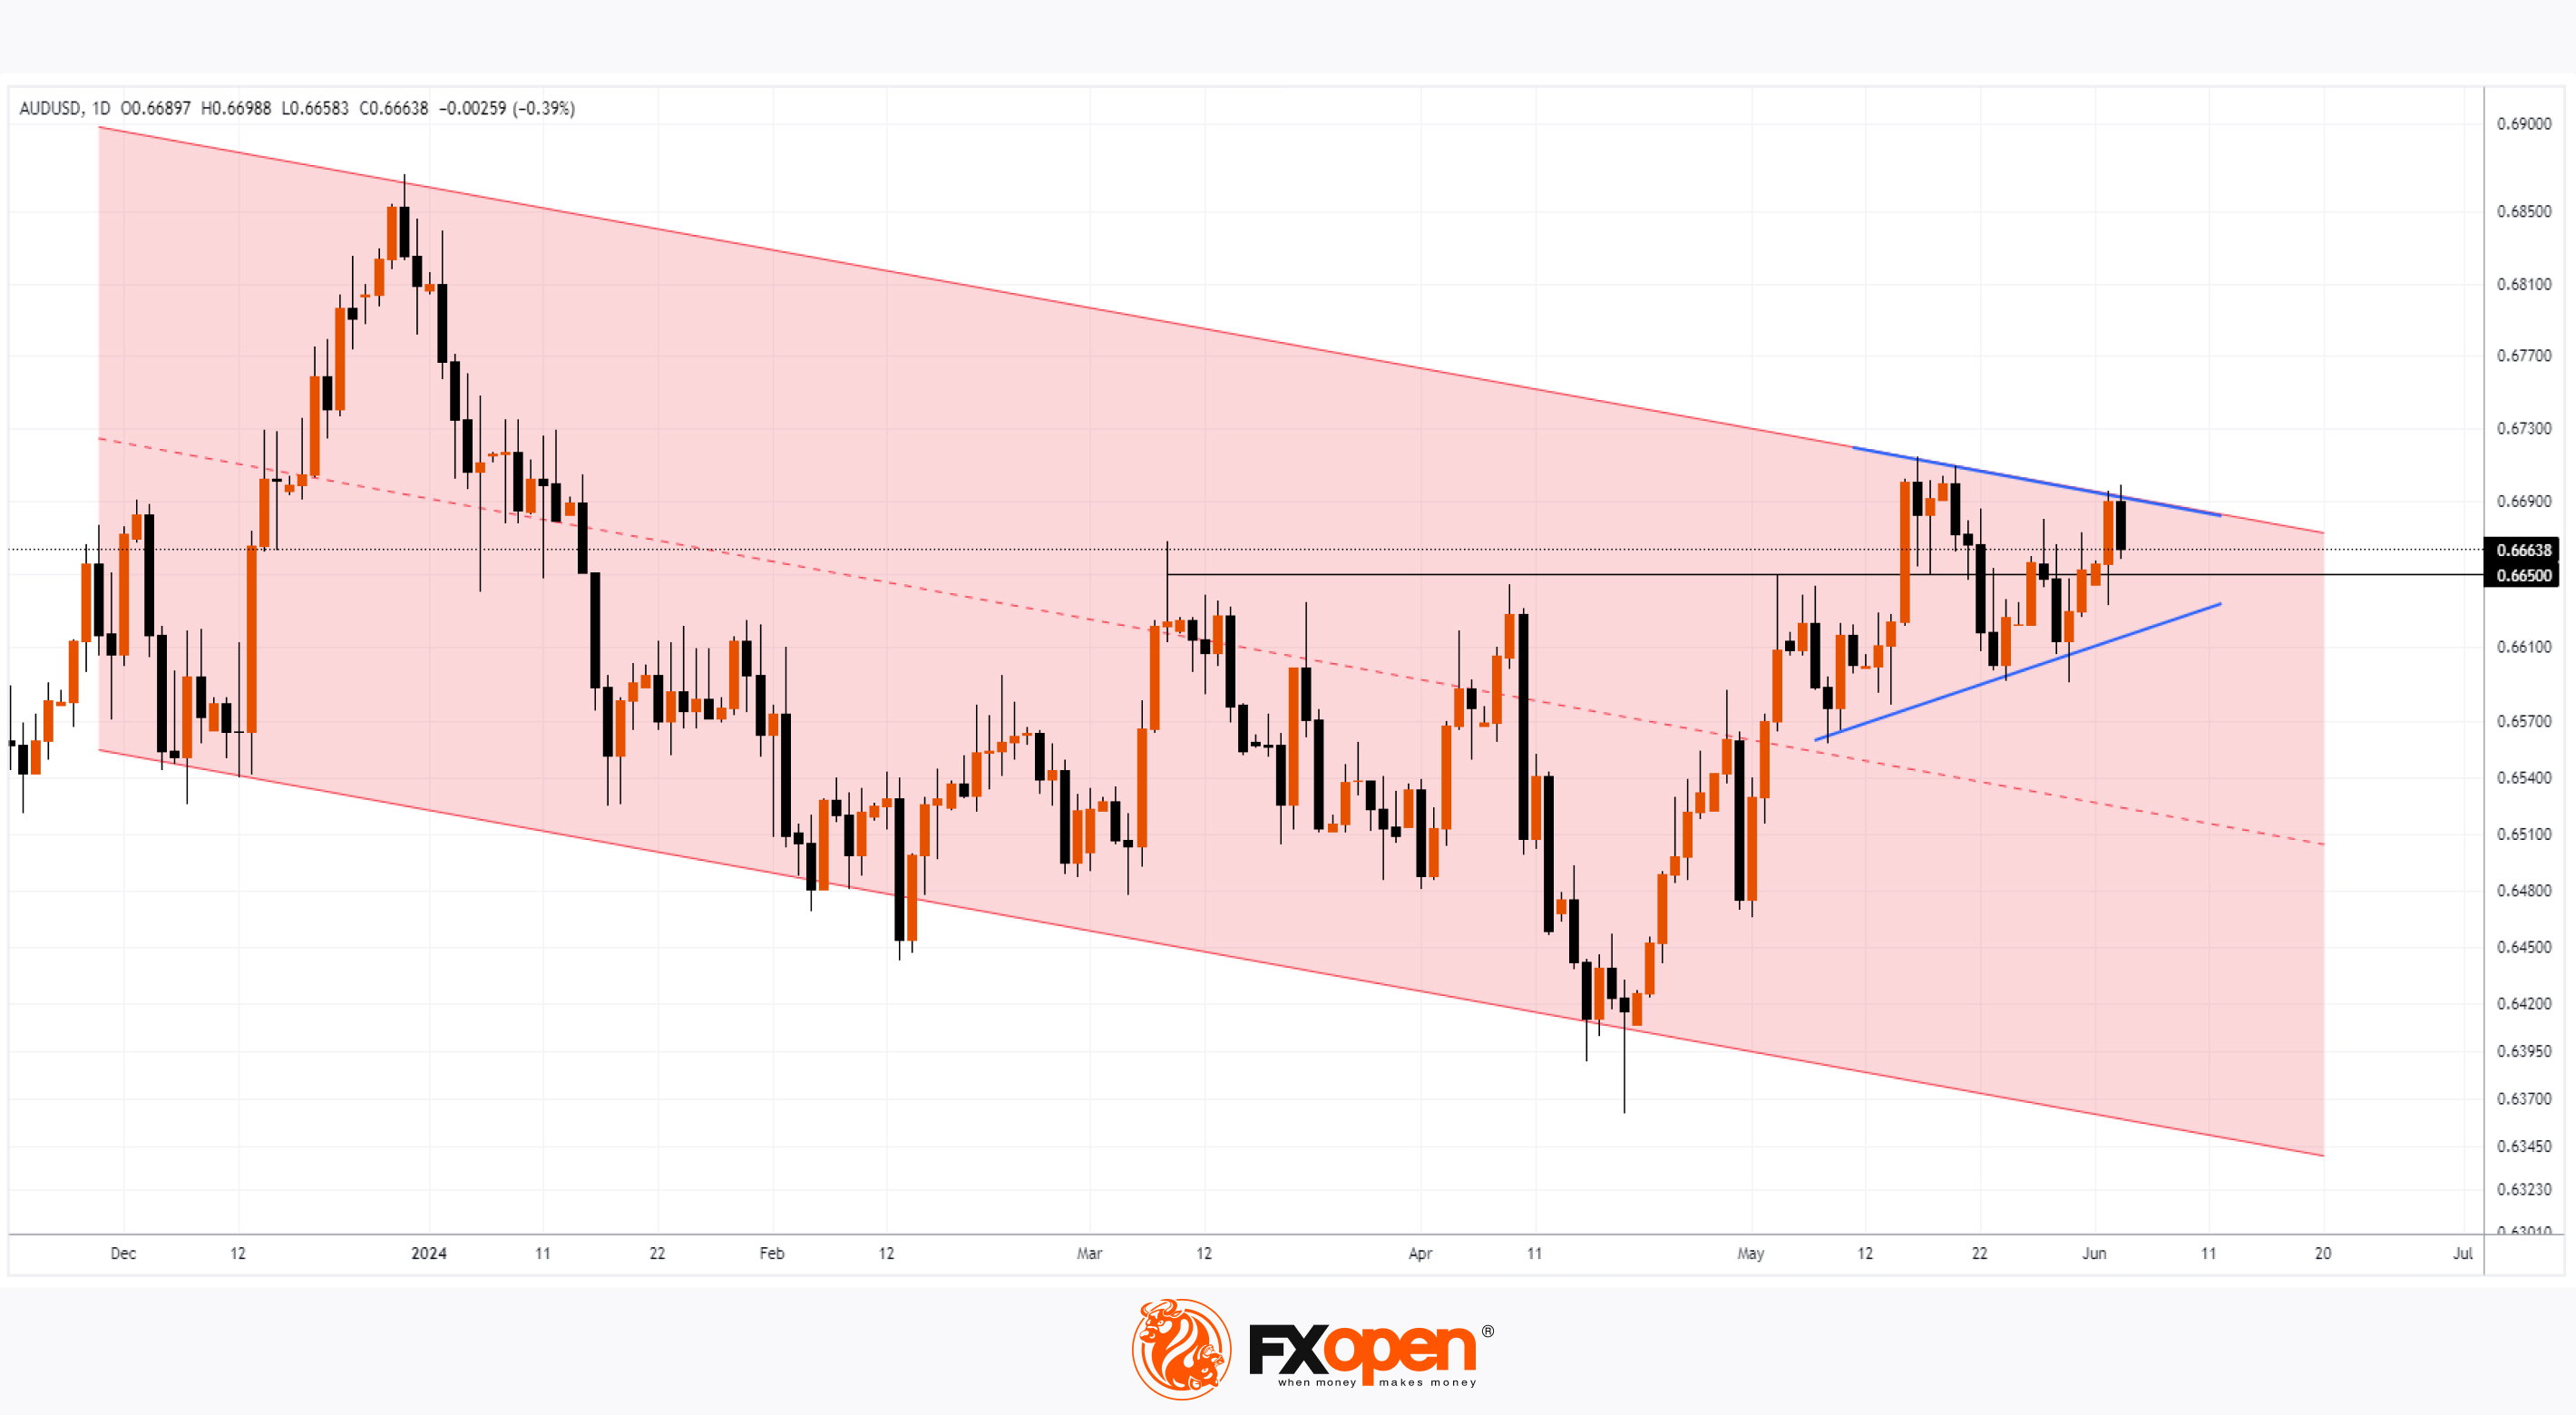
As a result, currencies of other countries strengthened against the dollar, notably the AUD/USD exchange rate rose above 0.669 - the highest level in 2 weeks.
However, today the US Dollar is rebounding from yesterday's decline - and this is more clearly visible on the AUD/USD chart, indicating potential internal weakness for the Australian dollar.
Technical analysis of the daily chart of AUD/USD shows that:
→ since the end of 2023, the market has been in a downtrend (indicated by the red channel);
→ the AUD/USD price is near the upper boundary of this channel;
→ price action is forming a symmetrical triangle pattern (shown by the blue lines), which usually indicates a temporary balance between supply and demand forces. In this case, it could be interpreted as demand exhaustion after a rise of approximately 2.75% in May;
→ the key level of 0.665, which acted as resistance since March, now serves as the central axis of the mentioned triangle;
→ yesterday's and today's (not yet closed) candles may form a bearish engulfing pattern, indicating ongoing selling pressure above the 0.668 level.
It is possible that during June, bears will attempt to break downwards from the consolidation triangle and resume the prevailing downtrend in the AUD/USD market. A key driver for this scenario to unfold will be the FOMC meeting scheduled for June 12th.
Trade over 50 forex markets 24 hours a day with FXOpen. Take advantage of low commissions, deep liquidity, and spreads from 0.0 pips. Open your FXOpen account now or learn more about trading forex with FXOpen.
CFDs are complex instruments and come with a high risk of losing your money.
This article represents the opinion of the Companies operating under the FXOpen brand only. It is not to be construed as an offer, solicitation, or recommendation with respect to products and services provided by the Companies operating under the FXOpen brand, nor is it to be considered financial advice.
AUD/USD Analysis: US Dollar Rebounds from Decline
Yesterday, the PMI Manufacturing indices for several countries were published. The news turned out to be disappointing for the US - according to ForexFactory:
→ Final Manufacturing PMI: actual = 51.3; expected = 50.9; previous value = 50.9;
→ ISM Manufacturing PMI: actual = 48.7; expected = 49.8; previous value = 49.2;
This led to a weakening of the US dollar yesterday, as the not-so-strong manufacturing activity data, as reported by Trading Economics, supported arguments in favor of the Federal Reserve lowering interest rates.
As a result, currencies of other countries strengthened against the dollar, notably the AUD/USD exchange rate rose above 0.669 - the highest level in 2 weeks.
However, today the US Dollar is rebounding from yesterday's decline - and this is more clearly visible on the AUD/USD chart, indicating potential internal weakness for the Australian dollar.
Technical analysis of the daily chart of AUD/USD shows that:
→ since the end of 2023, the market has been in a downtrend (indicated by the red channel);
→ the AUD/USD price is near the upper boundary of this channel;
→ price action is forming a symmetrical triangle pattern (shown by the blue lines), which usually indicates a temporary balance between supply and demand forces. In this case, it could be interpreted as demand exhaustion after a rise of approximately 2.75% in May;
→ the key level of 0.665, which acted as resistance since March, now serves as the central axis of the mentioned triangle;
→ yesterday's and today's (not yet closed) candles may form a bearish engulfing pattern, indicating ongoing selling pressure above the 0.668 level.
It is possible that during June, bears will attempt to break downwards from the consolidation triangle and resume the prevailing downtrend in the AUD/USD market. A key driver for this scenario to unfold will be the FOMC meeting scheduled for June 12th.
Trade over 50 forex markets 24 hours a day with FXOpen. Take advantage of low commissions, deep liquidity, and spreads from 0.0 pips. Open your FXOpen account now or learn more about trading forex with FXOpen.
CFDs are complex instruments and come with a high risk of losing your money.
This article represents the opinion of the Companies operating under the FXOpen brand only. It is not to be construed as an offer, solicitation, or recommendation with respect to products and services provided by the Companies operating under the FXOpen brand, nor is it to be considered financial advice.
👍2
#stockmarket #stocktrading #marketanalysis #sp500
Analysis of PFE Price: Is the Stock Undervalued?
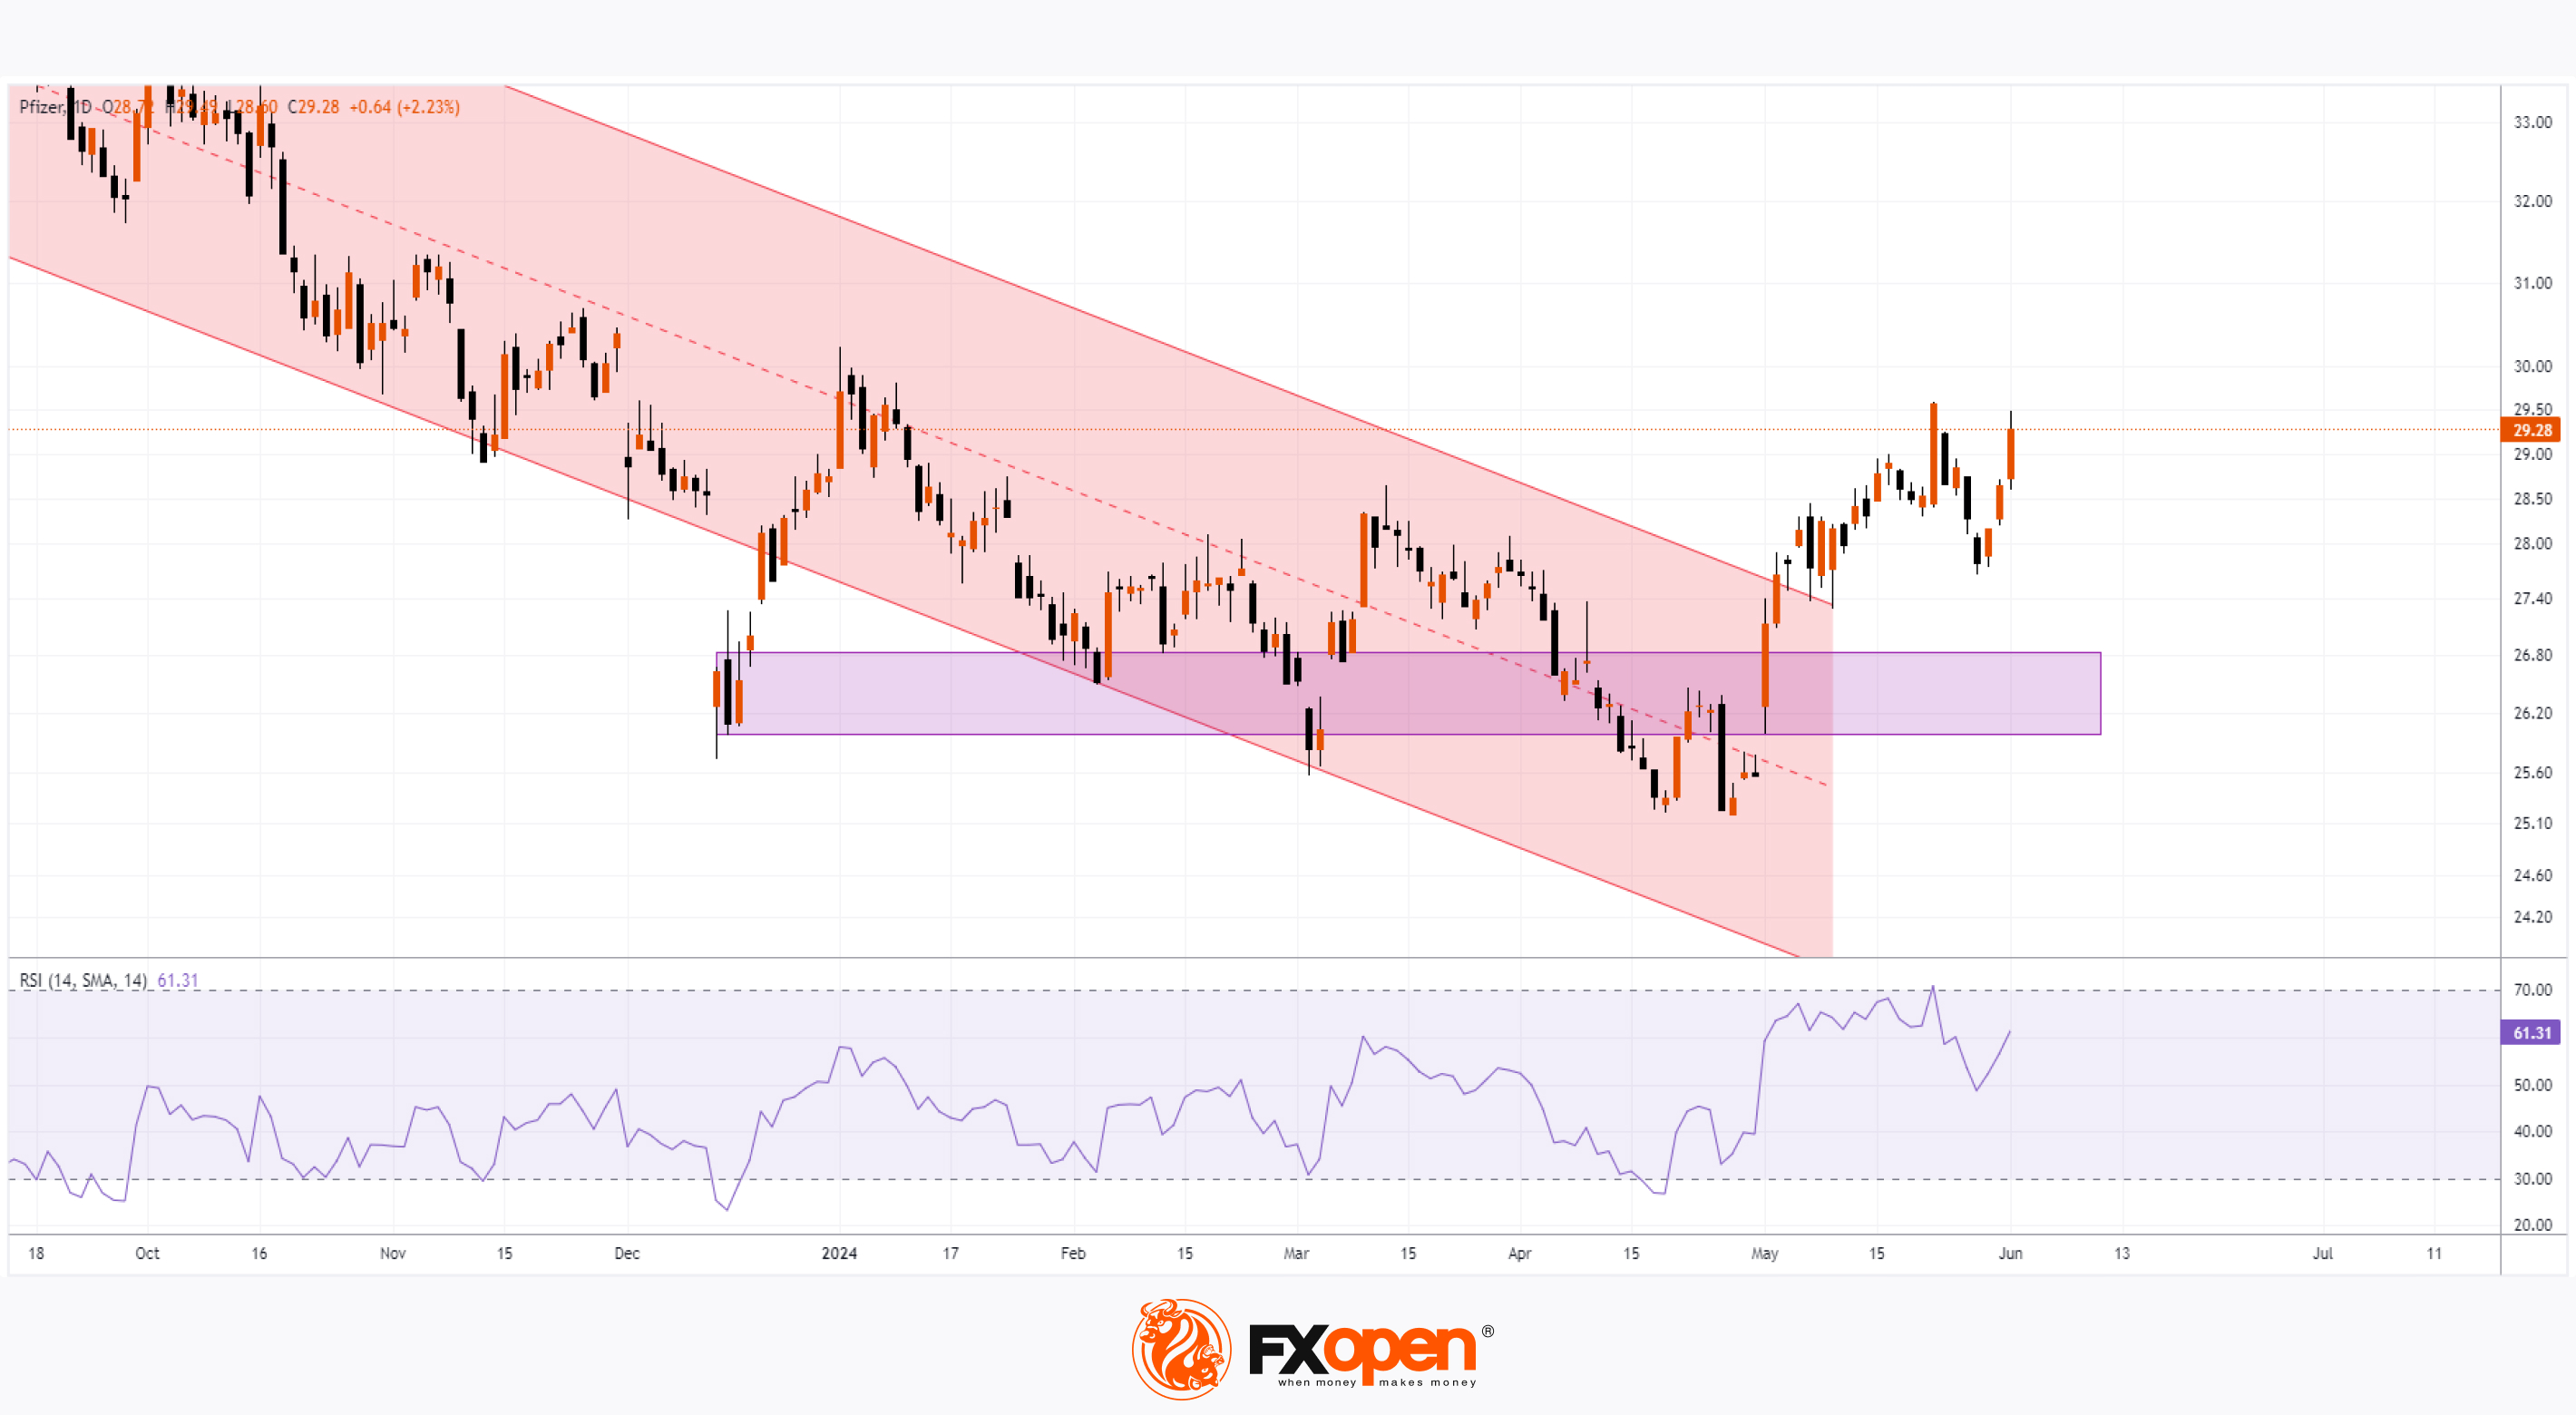
Yesterday, the price of Pfizer's stock rose by more than 2.2%, while the S&P 500 index remained almost unchanged from the opening to the closing of trading. This fact is noteworthy, considering that for many months the price of PFE stock performed worse than the market - if the S&P 500 grew by 23% during 2023, then the price of PFE decreased by approximately 43%.
The decline in 2023 (shown by the red channel) was disappointing. But what about now - is the situation changing? Are investors missing out on something important by turning away from PFE?
Several factors indicate that PFE stock may have optimistic prospects.
Fundamentally - Investors Place has included PFE in the list of the most undervalued stocks for reasons such as:
→ 2023 saw a record number of FDA approvals. New drugs could boost sales;
→ Pfizer acquired Seagen, significantly expanding its capabilities in cancer research. This supports the company's strategy to become a world-class leader in oncology.
→ By 2030, Pfizer plans to release 8 drugs that could become "blockbusters."
From a technical analysis perspective of the daily chart of PFE:
→ Attention is drawn to the 3 candles from December 13-15, 2023 - on each of these days, over 100 million shares were traded on the NYSE, which is unusually high for this market. Large investors may have been building long positions - as the price of PFE rose out of the zone marked by the 3 candles in purple.
→ Throughout 2024, the price attempted to drop below the indicated zone, but each time it did not make progress;
→ The decline on April 25 looks like a Final Shakeout pattern in Richard Wyckoff's terminology, indicating the completion of the stock accumulation process.
The price action in May 2024 looks extremely bullish:
→ PFE stock is outperforming the market,
→ The RSI indicator remains above the level of 50.
→ The downtrend has been broken.
According to TipRanks, the average forecasted price of PFE stock by Wall Street analysts is $33.15 (+13.10% from current levels).
Trade global index CFDs with zero commission and tight spreads. Open your FXOpen account now or learn more about trading index CFDs with FXOpen.
CFDs are complex instruments and come with a high risk of losing your money.
This article represents the opinion of the Companies operating under the FXOpen brand only. It is not to be construed as an offer, solicitation, or recommendation with respect to products and services provided by the Companies operating under the FXOpen brand, nor is it to be considered financial advice.
Analysis of PFE Price: Is the Stock Undervalued?
Yesterday, the price of Pfizer's stock rose by more than 2.2%, while the S&P 500 index remained almost unchanged from the opening to the closing of trading. This fact is noteworthy, considering that for many months the price of PFE stock performed worse than the market - if the S&P 500 grew by 23% during 2023, then the price of PFE decreased by approximately 43%.
The decline in 2023 (shown by the red channel) was disappointing. But what about now - is the situation changing? Are investors missing out on something important by turning away from PFE?
Several factors indicate that PFE stock may have optimistic prospects.
Fundamentally - Investors Place has included PFE in the list of the most undervalued stocks for reasons such as:
→ 2023 saw a record number of FDA approvals. New drugs could boost sales;
→ Pfizer acquired Seagen, significantly expanding its capabilities in cancer research. This supports the company's strategy to become a world-class leader in oncology.
→ By 2030, Pfizer plans to release 8 drugs that could become "blockbusters."
From a technical analysis perspective of the daily chart of PFE:
→ Attention is drawn to the 3 candles from December 13-15, 2023 - on each of these days, over 100 million shares were traded on the NYSE, which is unusually high for this market. Large investors may have been building long positions - as the price of PFE rose out of the zone marked by the 3 candles in purple.
→ Throughout 2024, the price attempted to drop below the indicated zone, but each time it did not make progress;
→ The decline on April 25 looks like a Final Shakeout pattern in Richard Wyckoff's terminology, indicating the completion of the stock accumulation process.
The price action in May 2024 looks extremely bullish:
→ PFE stock is outperforming the market,
→ The RSI indicator remains above the level of 50.
→ The downtrend has been broken.
According to TipRanks, the average forecasted price of PFE stock by Wall Street analysts is $33.15 (+13.10% from current levels).
Trade global index CFDs with zero commission and tight spreads. Open your FXOpen account now or learn more about trading index CFDs with FXOpen.
CFDs are complex instruments and come with a high risk of losing your money.
This article represents the opinion of the Companies operating under the FXOpen brand only. It is not to be construed as an offer, solicitation, or recommendation with respect to products and services provided by the Companies operating under the FXOpen brand, nor is it to be considered financial advice.
👍1
#sp500 #stockmarket #stocktrading #marketanalysis
S&P 500 Index: Latest Analysts’ Forecasts
Over the three spring months, the S&P 500 (US SPX 500 mini on FXOpen) rose by 3.5% – not the worst result, but it might be disappointing considering that in the first two months of the year the index increased by 7.8%.
This trend suggests that:
→ the rally driven by interest in AI is slowing down;
→ stock market participants are concerned that Fed rates will remain high.
What could be the scenarios for future developments until the end of the year and beyond?
The media publish fresh forecasts on the S&P 500 (US SPX 500 mini on FXOpen) price from Wall Street analysts:
→ MarketWatch: Analysts at JP Morgan believe that the growth potential is exhausted and the market may “hit a wall” preventing further growth. They maintain a forecast that the index value at the end of 2024 will be 4200 points.
→ MarketWatch: Experts at Wells Fargo think it would be too optimistic to expect stocks to reach new record highs ahead of the US elections in November; however, further growth related to the election results looks likely in 2025. They estimate the index could reach a record 5700 points by the end of next year.
→ BusinessInsider: According to Capital Economics, the index could rise if Treasury yields fall and the momentum from AI adoption remains strong. Their forecast is 6500 points by the end of 2025, followed by a sharp correction in 2026.
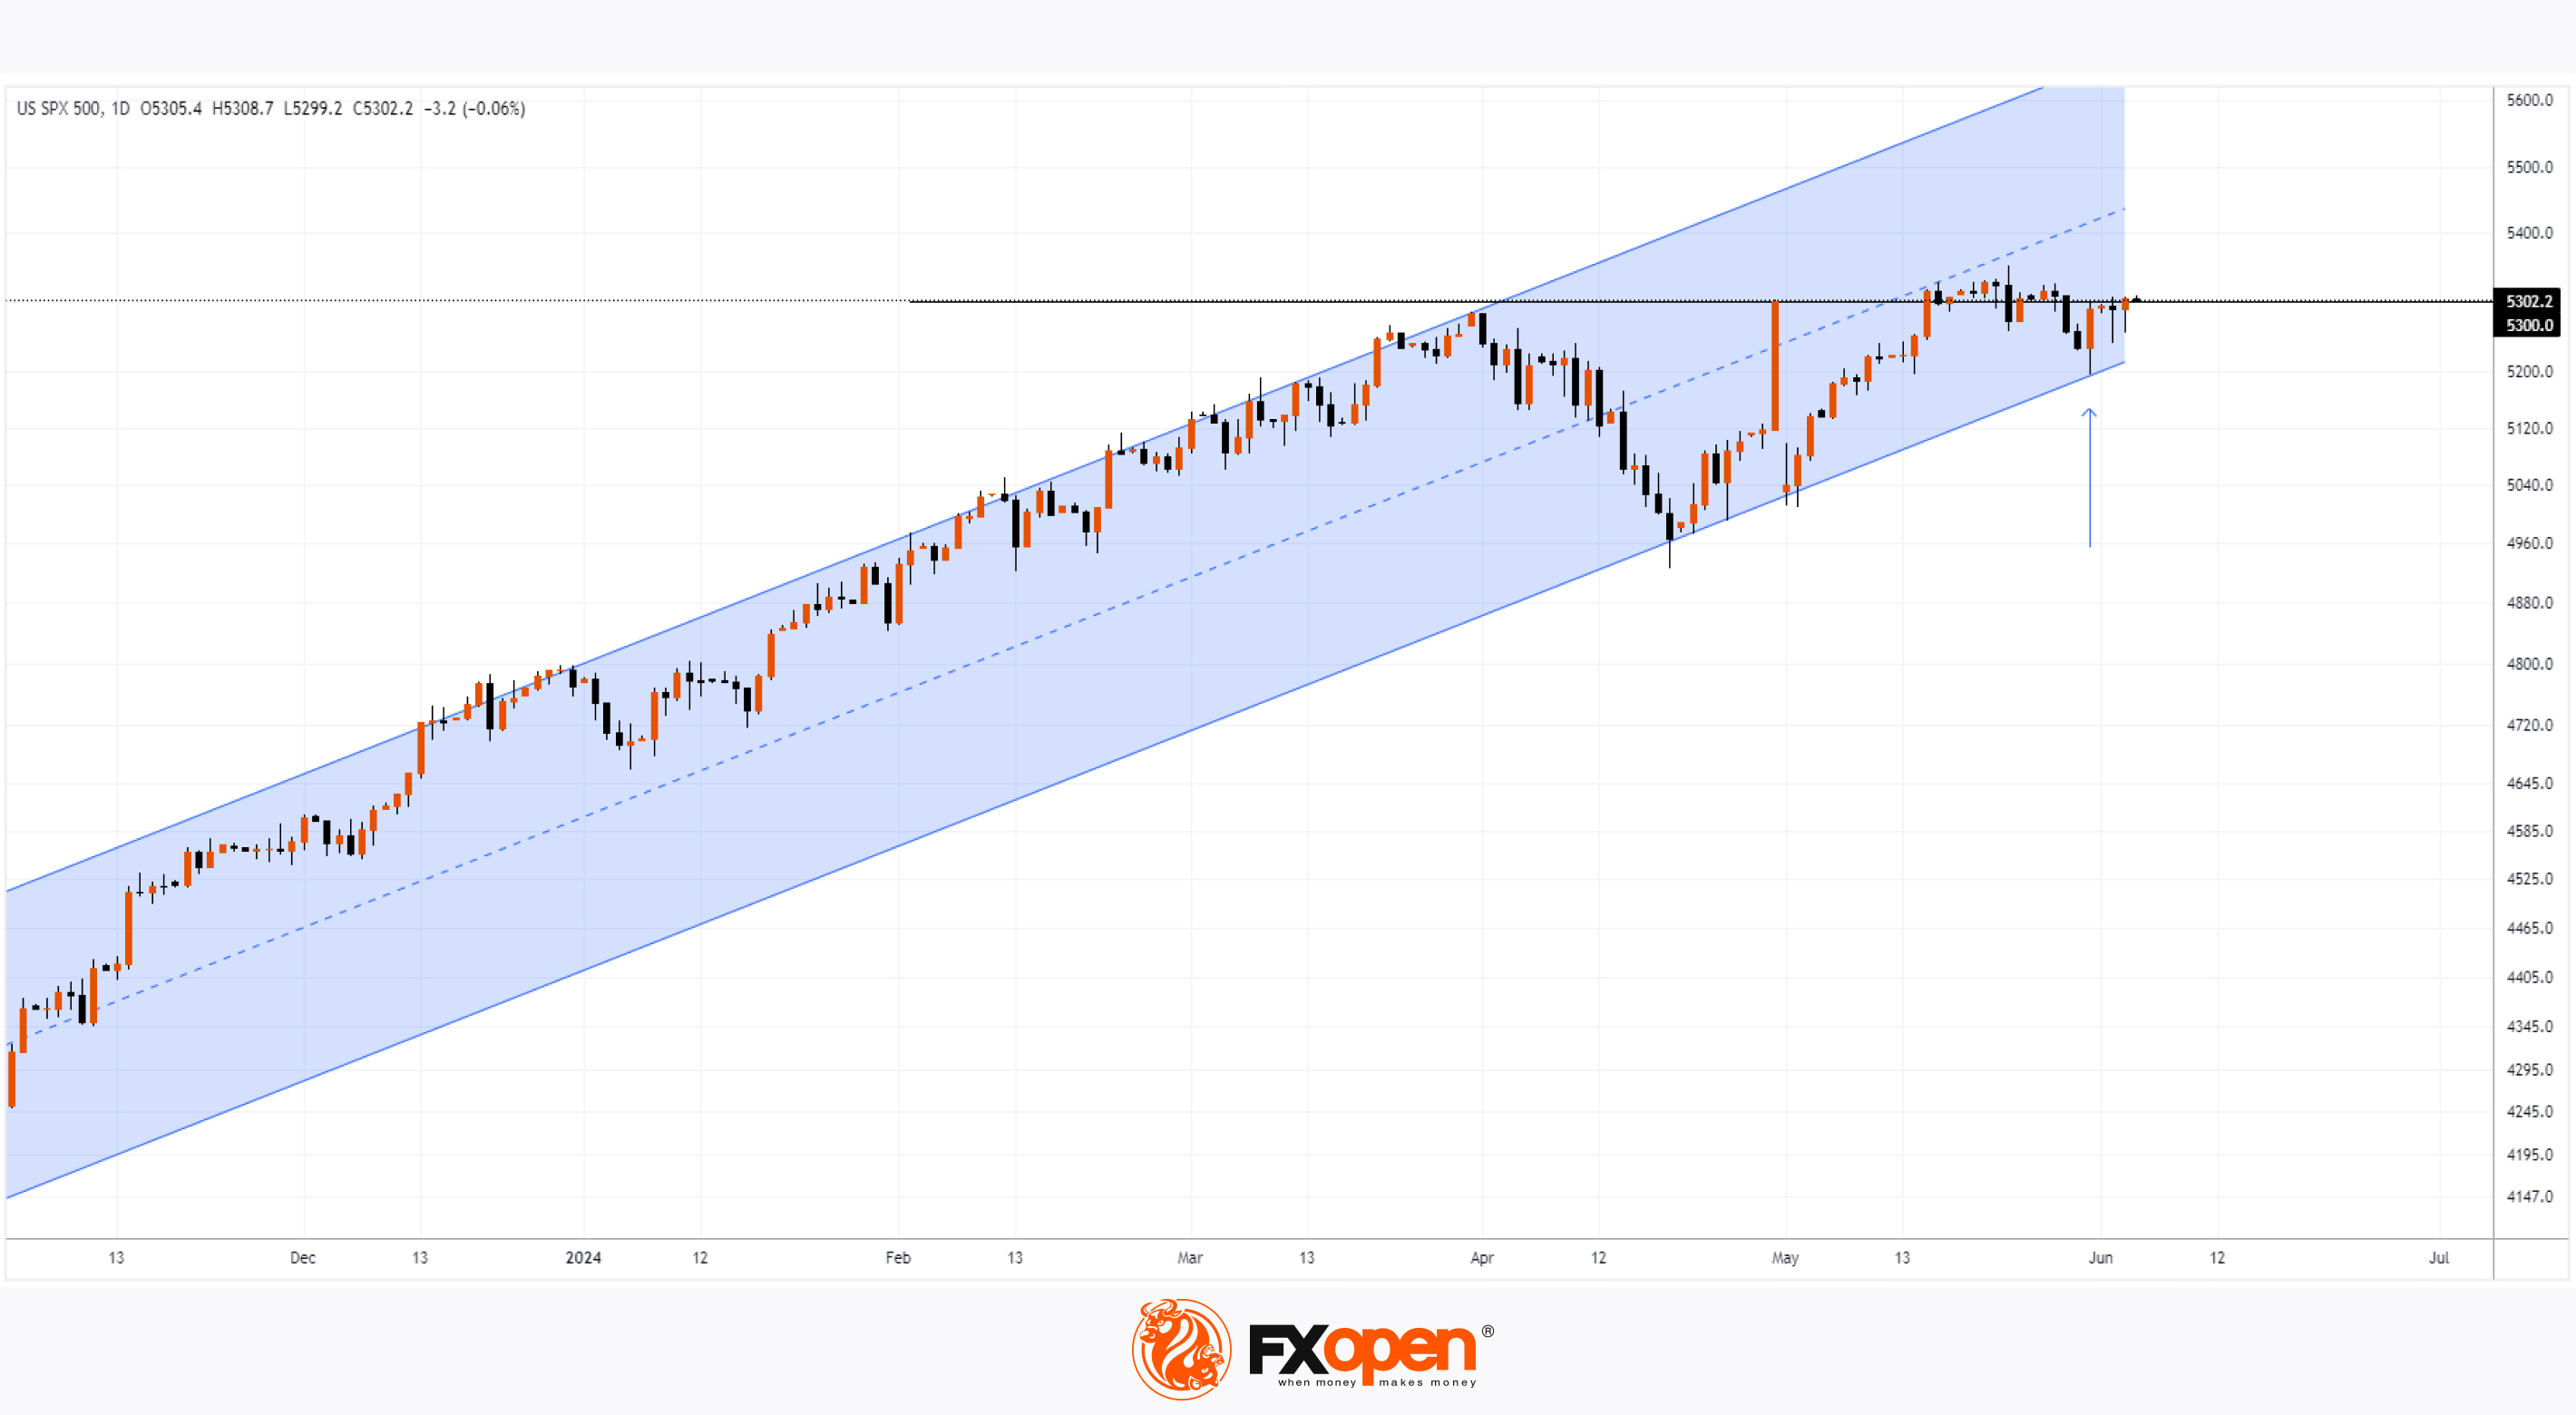
Technical analysis of the daily chart of the S&P 500 (US SPX 500 mini on FXOpen) today shows that:
→ the market is in an uptrend (marked by a blue channel);
→ the price has moved from the upper half to the lower half of the channel – a sign of weakening bullish strength;
→ the 5300 level acts as resistance;
→ the broad bullish candle on 31 May (marked by an arrow) closing near its highs indicates strong demand at the lower boundary of the channel, but whether it will be sufficient to overcome the 5300 level and consolidate above it will largely depend on the upcoming Fed rate decision (scheduled for 12 June).
Trade global index CFDs with zero commission and tight spreads. Open your FXOpen account now or learn more about trading index CFDs with FXOpen.
CFDs are complex instruments and come with a high risk of losing your money.
This article represents the opinion of the Companies operating under the FXOpen brand only. It is not to be construed as an offer, solicitation, or recommendation with respect to products and services provided by the Companies operating under the FXOpen brand, nor is it to be considered financial advice.
S&P 500 Index: Latest Analysts’ Forecasts
Over the three spring months, the S&P 500 (US SPX 500 mini on FXOpen) rose by 3.5% – not the worst result, but it might be disappointing considering that in the first two months of the year the index increased by 7.8%.
This trend suggests that:
→ the rally driven by interest in AI is slowing down;
→ stock market participants are concerned that Fed rates will remain high.
What could be the scenarios for future developments until the end of the year and beyond?
The media publish fresh forecasts on the S&P 500 (US SPX 500 mini on FXOpen) price from Wall Street analysts:
→ MarketWatch: Analysts at JP Morgan believe that the growth potential is exhausted and the market may “hit a wall” preventing further growth. They maintain a forecast that the index value at the end of 2024 will be 4200 points.
→ MarketWatch: Experts at Wells Fargo think it would be too optimistic to expect stocks to reach new record highs ahead of the US elections in November; however, further growth related to the election results looks likely in 2025. They estimate the index could reach a record 5700 points by the end of next year.
→ BusinessInsider: According to Capital Economics, the index could rise if Treasury yields fall and the momentum from AI adoption remains strong. Their forecast is 6500 points by the end of 2025, followed by a sharp correction in 2026.
Technical analysis of the daily chart of the S&P 500 (US SPX 500 mini on FXOpen) today shows that:
→ the market is in an uptrend (marked by a blue channel);
→ the price has moved from the upper half to the lower half of the channel – a sign of weakening bullish strength;
→ the 5300 level acts as resistance;
→ the broad bullish candle on 31 May (marked by an arrow) closing near its highs indicates strong demand at the lower boundary of the channel, but whether it will be sufficient to overcome the 5300 level and consolidate above it will largely depend on the upcoming Fed rate decision (scheduled for 12 June).
Trade global index CFDs with zero commission and tight spreads. Open your FXOpen account now or learn more about trading index CFDs with FXOpen.
CFDs are complex instruments and come with a high risk of losing your money.
This article represents the opinion of the Companies operating under the FXOpen brand only. It is not to be construed as an offer, solicitation, or recommendation with respect to products and services provided by the Companies operating under the FXOpen brand, nor is it to be considered financial advice.
👍2
#stockmarket #stocktrading #marketanalysis
Is ADBE Stock Undervalued?
The stock chart for Adobe Systems shows that on May 31, 2024, the price fell below $440 – for the first time since June 2023. This drop was partly due to increased competition from Canva, which released updated tools.
However, in early June, the decline did not continue, suggesting that ADBE stock is consolidating around a multi-month low.
Since the beginning of the year, ADBE has decreased by approximately 23%, while the NASDAQ index (US Tech 100 mini on FXOpen) has increased by more than 12%. Is this indicative of serious problems for the company or is the stock undervalued?
A significant amount of information will come from Adobe Systems' earnings report, which will be released on June 13, 2024. According to Yahoo Finance:
The company's earnings per share are forecasted to be $4.38, representing a 12.02% increase compared to the same quarter last year.
Revenue is forecasted at $5.28 billion, a 9.65% increase compared to the same quarter last year.
It is noteworthy that since December 2018, Adobe has consistently exceeded expectations (though this has not always led to a rise in the stock price).
According to TipRanks, the average price target for ADBE stock is $624.83 over the next 12 months, indicating a potential upside of +39.36% from current levels – suggesting that most analysts do not believe the company has deep internal issues, as otherwise they would not be forecasting such price growth.
Technical analysis of ADBE’s daily chart shows that the price action is forming an uptrend (indicated in blue). The price is near the lower boundary of this trend, and:
→ The current price is near the 50% retracement level of the A→B growth wave;
→ The current price has closed last year’s bullish gap.
Therefore, the release of the earnings report on June 13 could be a catalyst that helps bulls resume the uptrend and push the price towards the levels indicated by analysts.
Trade global index CFDs with zero commission and tight spreads. Open your FXOpen account now or learn more about trading index CFDs with FXOpen.
CFDs are complex instruments and come with a high risk of losing your money.
This article represents the opinion of the Companies operating under the FXOpen brand only. It is not to be construed as an offer, solicitation, or recommendation with respect to products and services provided by the Companies operating under the FXOpen brand, nor is it to be considered financial advice.
Is ADBE Stock Undervalued?
The stock chart for Adobe Systems shows that on May 31, 2024, the price fell below $440 – for the first time since June 2023. This drop was partly due to increased competition from Canva, which released updated tools.
However, in early June, the decline did not continue, suggesting that ADBE stock is consolidating around a multi-month low.
Since the beginning of the year, ADBE has decreased by approximately 23%, while the NASDAQ index (US Tech 100 mini on FXOpen) has increased by more than 12%. Is this indicative of serious problems for the company or is the stock undervalued?
A significant amount of information will come from Adobe Systems' earnings report, which will be released on June 13, 2024. According to Yahoo Finance:
The company's earnings per share are forecasted to be $4.38, representing a 12.02% increase compared to the same quarter last year.
Revenue is forecasted at $5.28 billion, a 9.65% increase compared to the same quarter last year.
It is noteworthy that since December 2018, Adobe has consistently exceeded expectations (though this has not always led to a rise in the stock price).
According to TipRanks, the average price target for ADBE stock is $624.83 over the next 12 months, indicating a potential upside of +39.36% from current levels – suggesting that most analysts do not believe the company has deep internal issues, as otherwise they would not be forecasting such price growth.
Technical analysis of ADBE’s daily chart shows that the price action is forming an uptrend (indicated in blue). The price is near the lower boundary of this trend, and:
→ The current price is near the 50% retracement level of the A→B growth wave;
→ The current price has closed last year’s bullish gap.
Therefore, the release of the earnings report on June 13 could be a catalyst that helps bulls resume the uptrend and push the price towards the levels indicated by analysts.
Trade global index CFDs with zero commission and tight spreads. Open your FXOpen account now or learn more about trading index CFDs with FXOpen.
CFDs are complex instruments and come with a high risk of losing your money.
This article represents the opinion of the Companies operating under the FXOpen brand only. It is not to be construed as an offer, solicitation, or recommendation with respect to products and services provided by the Companies operating under the FXOpen brand, nor is it to be considered financial advice.

👍2
#XAGUSD #silverprice #marketanalysis #MarketNews
The Price of Silver Is Acting Weaker Than Gold
According to Reuters, precious metal prices have risen in the past 1-2 days as Treasury yields have fallen, enhancing metals' appeal as a "safe haven" for investor portfolios.
Currently:
→ Expectations are growing that US interest rate cuts may begin as early as September;
→ Market participants are focusing on non-farm employment data and other US market data, set to be released on Friday at 15:30 GMT+3.
In this context, it is notable that the gold market is clearly stronger than silver.
The XAU/USD chart shows that the price of gold today rose above $2370 per ounce, a high not seen since 23 May, more than 10 days ago.
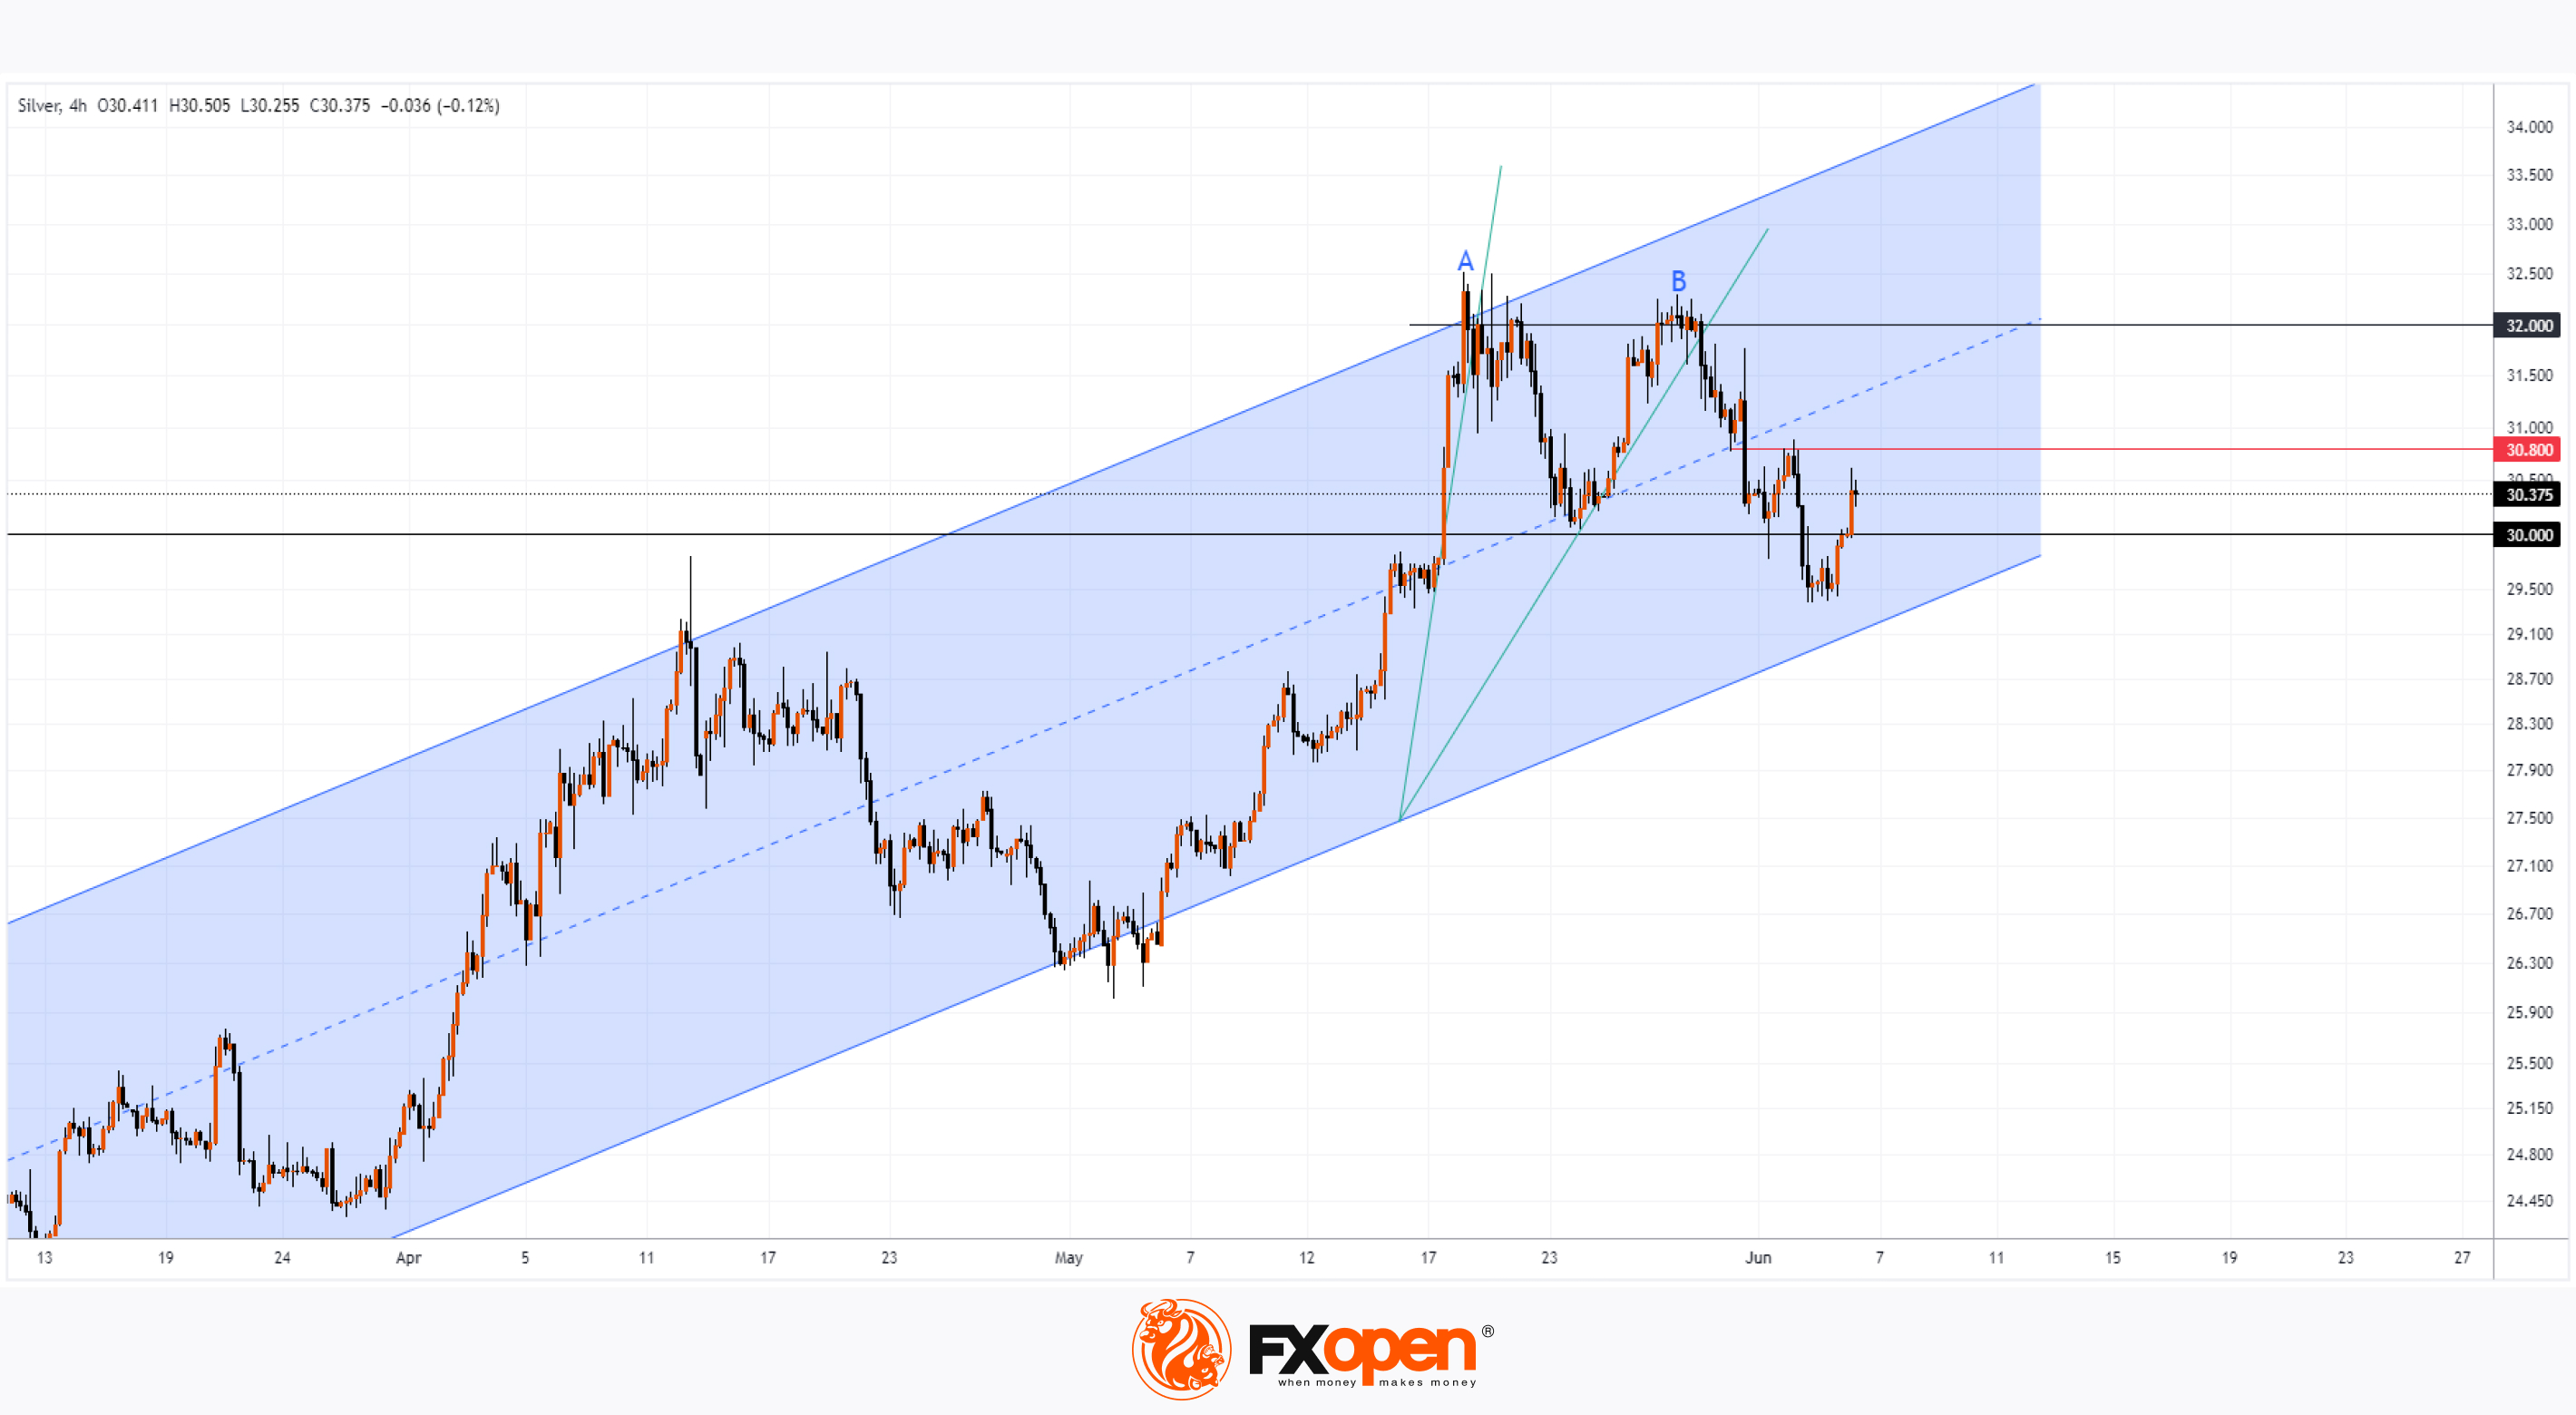
Meanwhile, the price of silver experienced a decline of over 8% from 29 May to 4 June. Today’s rise appears to be an attempt by bulls to offset this bearish momentum, during which the price of gold remained stable.
Technical analysis of the XAG/USD chart shows that:
→ Since March, there has been an upward trend in the market (indicated by a blue channel);
→ On 17 May, we noted in our analysis of the XAG/USD chart that we might witness a new bull attack on the psychological level of $30 per ounce of silver. Indeed, the bullish breakout occurred immediately after publication.
→ Following the breakout, the price of silver reached the upper boundary of the ascending channel (A), retreated to the key level of $30, and then formed a new peak (B), demonstrating an inability to reach the upper boundary – a bearish sign. Thus, a double top pattern has formed around the $32 per ounce level on the silver price chart.
Additionally, the steepness of the ascending trend lines is decreasing (shown in green), indicating a potential exhaustion of demand – fewer buyers are willing to pay more than $30 per ounce of silver.
The $30.80 level is already showing resistance. Bulls may attempt to break through it and resume the uptrend from the lower boundary of the channel, but there are no guarantees that this will subsequently activate demand forces around the double top area.
Start trading commodities with tight spreads. Open your trading account now or learn more about trading commodity CFDs with FXOpen.
CFDs are complex instruments and come with a high risk of losing your money.
This article represents the opinion of the Companies operating under the FXOpen brand only. It is not to be construed as an offer, solicitation, or recommendation with respect to products and services provided by the Companies operating under the FXOpen brand, nor is it to be considered financial advice.
The Price of Silver Is Acting Weaker Than Gold
According to Reuters, precious metal prices have risen in the past 1-2 days as Treasury yields have fallen, enhancing metals' appeal as a "safe haven" for investor portfolios.
Currently:
→ Expectations are growing that US interest rate cuts may begin as early as September;
→ Market participants are focusing on non-farm employment data and other US market data, set to be released on Friday at 15:30 GMT+3.
In this context, it is notable that the gold market is clearly stronger than silver.
The XAU/USD chart shows that the price of gold today rose above $2370 per ounce, a high not seen since 23 May, more than 10 days ago.
Meanwhile, the price of silver experienced a decline of over 8% from 29 May to 4 June. Today’s rise appears to be an attempt by bulls to offset this bearish momentum, during which the price of gold remained stable.
Technical analysis of the XAG/USD chart shows that:
→ Since March, there has been an upward trend in the market (indicated by a blue channel);
→ On 17 May, we noted in our analysis of the XAG/USD chart that we might witness a new bull attack on the psychological level of $30 per ounce of silver. Indeed, the bullish breakout occurred immediately after publication.
→ Following the breakout, the price of silver reached the upper boundary of the ascending channel (A), retreated to the key level of $30, and then formed a new peak (B), demonstrating an inability to reach the upper boundary – a bearish sign. Thus, a double top pattern has formed around the $32 per ounce level on the silver price chart.
Additionally, the steepness of the ascending trend lines is decreasing (shown in green), indicating a potential exhaustion of demand – fewer buyers are willing to pay more than $30 per ounce of silver.
The $30.80 level is already showing resistance. Bulls may attempt to break through it and resume the uptrend from the lower boundary of the channel, but there are no guarantees that this will subsequently activate demand forces around the double top area.
Start trading commodities with tight spreads. Open your trading account now or learn more about trading commodity CFDs with FXOpen.
CFDs are complex instruments and come with a high risk of losing your money.
This article represents the opinion of the Companies operating under the FXOpen brand only. It is not to be construed as an offer, solicitation, or recommendation with respect to products and services provided by the Companies operating under the FXOpen brand, nor is it to be considered financial advice.
👍2
#usdcad #tradingforex #tradingtips #marketanalysis
USD/CAD Analysis: Bank of Canada Cuts Interest Rate by 0.25%
This occurred yesterday and was in line with analysts' forecasts, according to a Bloomberg survey.
According to statements from the Bank of Canada:
→ Price growth indicators for consumer price index components have further decreased and are close to their historical average;
→ Recent data has increased confidence that inflation will continue moving towards the 2% target;
→ Monetary policy no longer needs to be as restrictive.
At the press conference, Governor Tiff Macklem stated that there is “compelling evidence” of weakening inflation and it is “reasonable to expect” further rate cuts if inflation continues to slow.
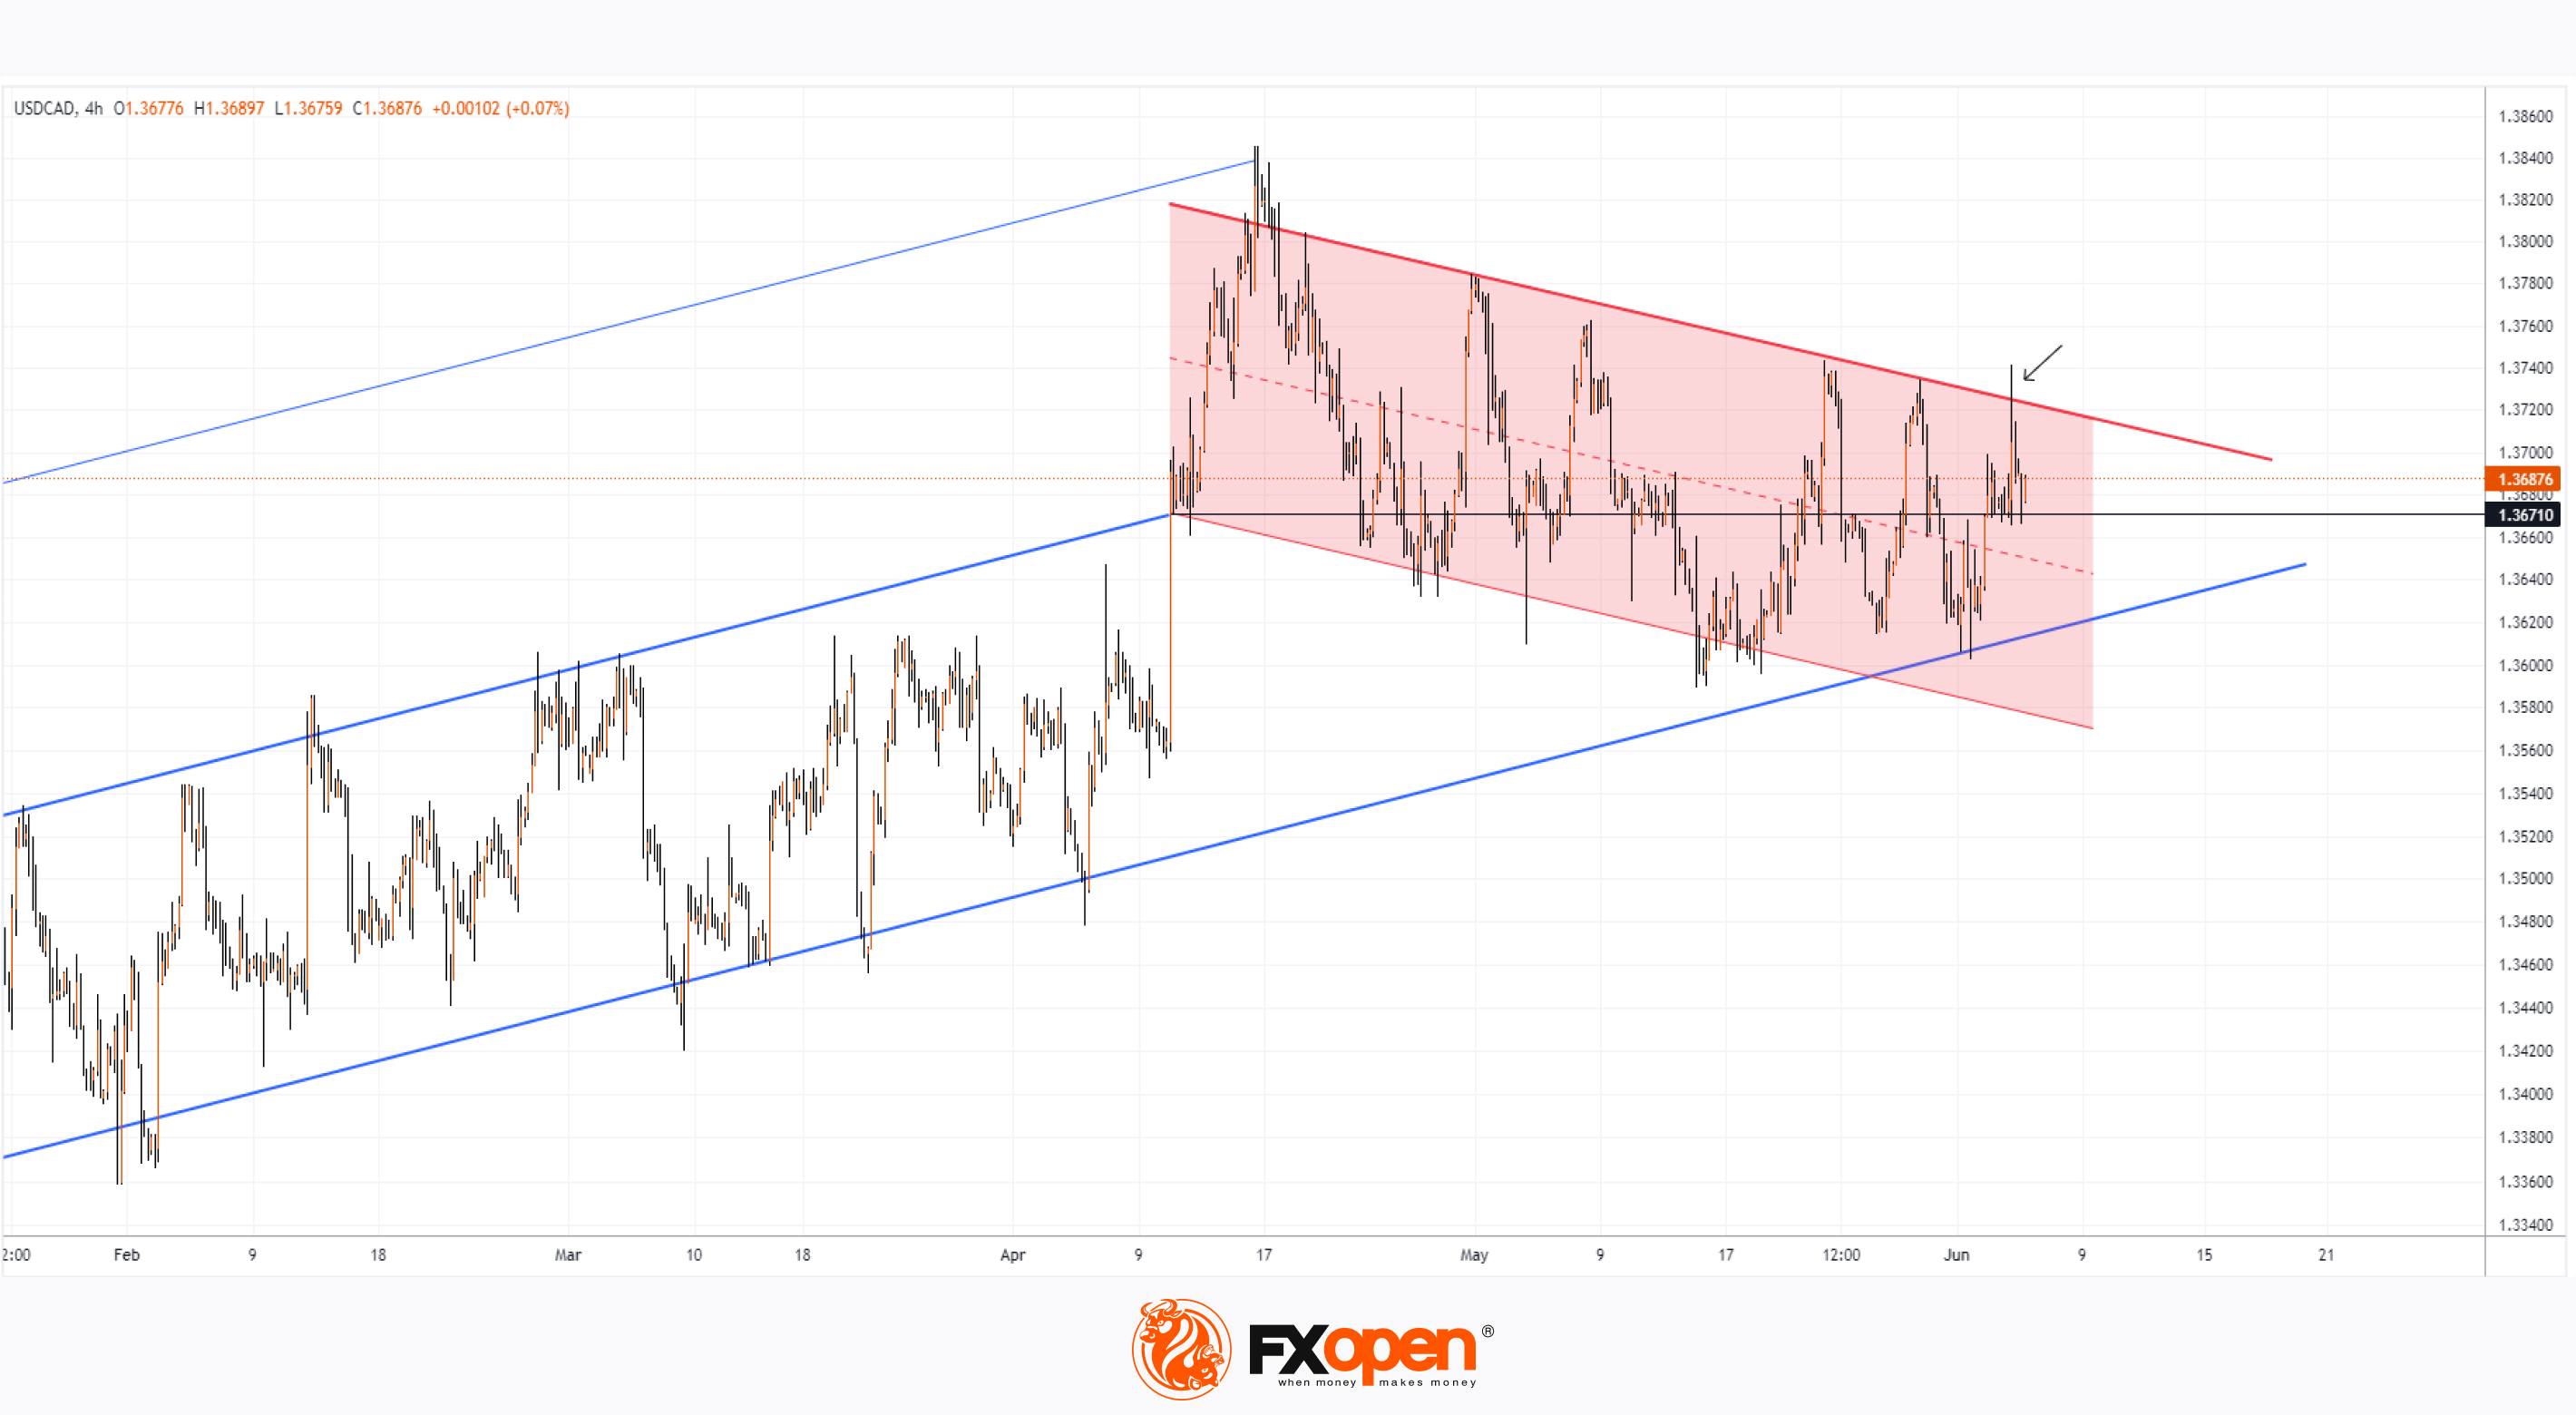
Technical analysis of the USD/CAD chart:
→ Since mid-April, the market has been in a downtrend (indicated by red lines);
→ Simultaneously, a longer-term uptrend is shown by the blue channel;
→ Overall, the price is being squeezed into a symmetrical triangle between the upper red and lower blue lines, with the axis around the 1.3671 level acting as a "magnet," indicating a stable balance of supply and demand. Yesterday’s news caused a spike in volatility, with the USD/CAD price attempting to break the upper boundary, but the breakout was false (indicated by an arrow), and the price returned to the axis where it was before the announcement.
Thus, it can be concluded that the market had anticipated the rate cut, and it was not a surprise. This means that fluctuations within the triangle may continue until a fundamental event occurs that can lead to a breakout of this consolidation pattern in technical analysis.
Analysts at Think.ING predict a possible decline in the USD/CAD rate to the 1.35 level in the second half of 2024.
Trade over 50 forex markets 24 hours a day with FXOpen. Take advantage of low commissions, deep liquidity, and spreads from 0.0 pips. Open your FXOpen account now or learn more about trading forex with FXOpen.
CFDs are complex instruments and come with a high risk of losing your money.
This article represents the opinion of the Companies operating under the FXOpen brand only. It is not to be construed as an offer, solicitation, or recommendation with respect to products and services provided by the Companies operating under the FXOpen brand, nor is it to be considered financial advice.
USD/CAD Analysis: Bank of Canada Cuts Interest Rate by 0.25%
This occurred yesterday and was in line with analysts' forecasts, according to a Bloomberg survey.
According to statements from the Bank of Canada:
→ Price growth indicators for consumer price index components have further decreased and are close to their historical average;
→ Recent data has increased confidence that inflation will continue moving towards the 2% target;
→ Monetary policy no longer needs to be as restrictive.
At the press conference, Governor Tiff Macklem stated that there is “compelling evidence” of weakening inflation and it is “reasonable to expect” further rate cuts if inflation continues to slow.
Technical analysis of the USD/CAD chart:
→ Since mid-April, the market has been in a downtrend (indicated by red lines);
→ Simultaneously, a longer-term uptrend is shown by the blue channel;
→ Overall, the price is being squeezed into a symmetrical triangle between the upper red and lower blue lines, with the axis around the 1.3671 level acting as a "magnet," indicating a stable balance of supply and demand. Yesterday’s news caused a spike in volatility, with the USD/CAD price attempting to break the upper boundary, but the breakout was false (indicated by an arrow), and the price returned to the axis where it was before the announcement.
Thus, it can be concluded that the market had anticipated the rate cut, and it was not a surprise. This means that fluctuations within the triangle may continue until a fundamental event occurs that can lead to a breakout of this consolidation pattern in technical analysis.
Analysts at Think.ING predict a possible decline in the USD/CAD rate to the 1.35 level in the second half of 2024.
Trade over 50 forex markets 24 hours a day with FXOpen. Take advantage of low commissions, deep liquidity, and spreads from 0.0 pips. Open your FXOpen account now or learn more about trading forex with FXOpen.
CFDs are complex instruments and come with a high risk of losing your money.
This article represents the opinion of the Companies operating under the FXOpen brand only. It is not to be construed as an offer, solicitation, or recommendation with respect to products and services provided by the Companies operating under the FXOpen brand, nor is it to be considered financial advice.
👍2
#EURUSD #forextrading #marketanalysis
EUR/USD Analysis: ECB Cuts Interest Rate for First Time Since 2019
By its decision, the ECB followed the example of the Bank of Canada, which lowered interest rates by 0.25%, as we reported yesterday. Consequently, this trend might continue with the Federal Reserve, marking the development of easing monetary policy cycles in Western economies.
According to ForexFactory:
→ the interest rate had been at 4.50% since September 2023;
→ it was reduced to 4.25%;
→ the reduction was accurately predicted by experts.
According to CNBC:
→ the ECB forecasts inflation at 2.5% in 2024 and 2.2% in 2025;
→″Based on an updated assessment of the inflation outlook, the dynamics of underlying inflation and the strength of monetary policy transmission, it is now appropriate to moderate the degree of monetary policy restriction after nine months of holding rates steady,” stated the ECB Governing Council.
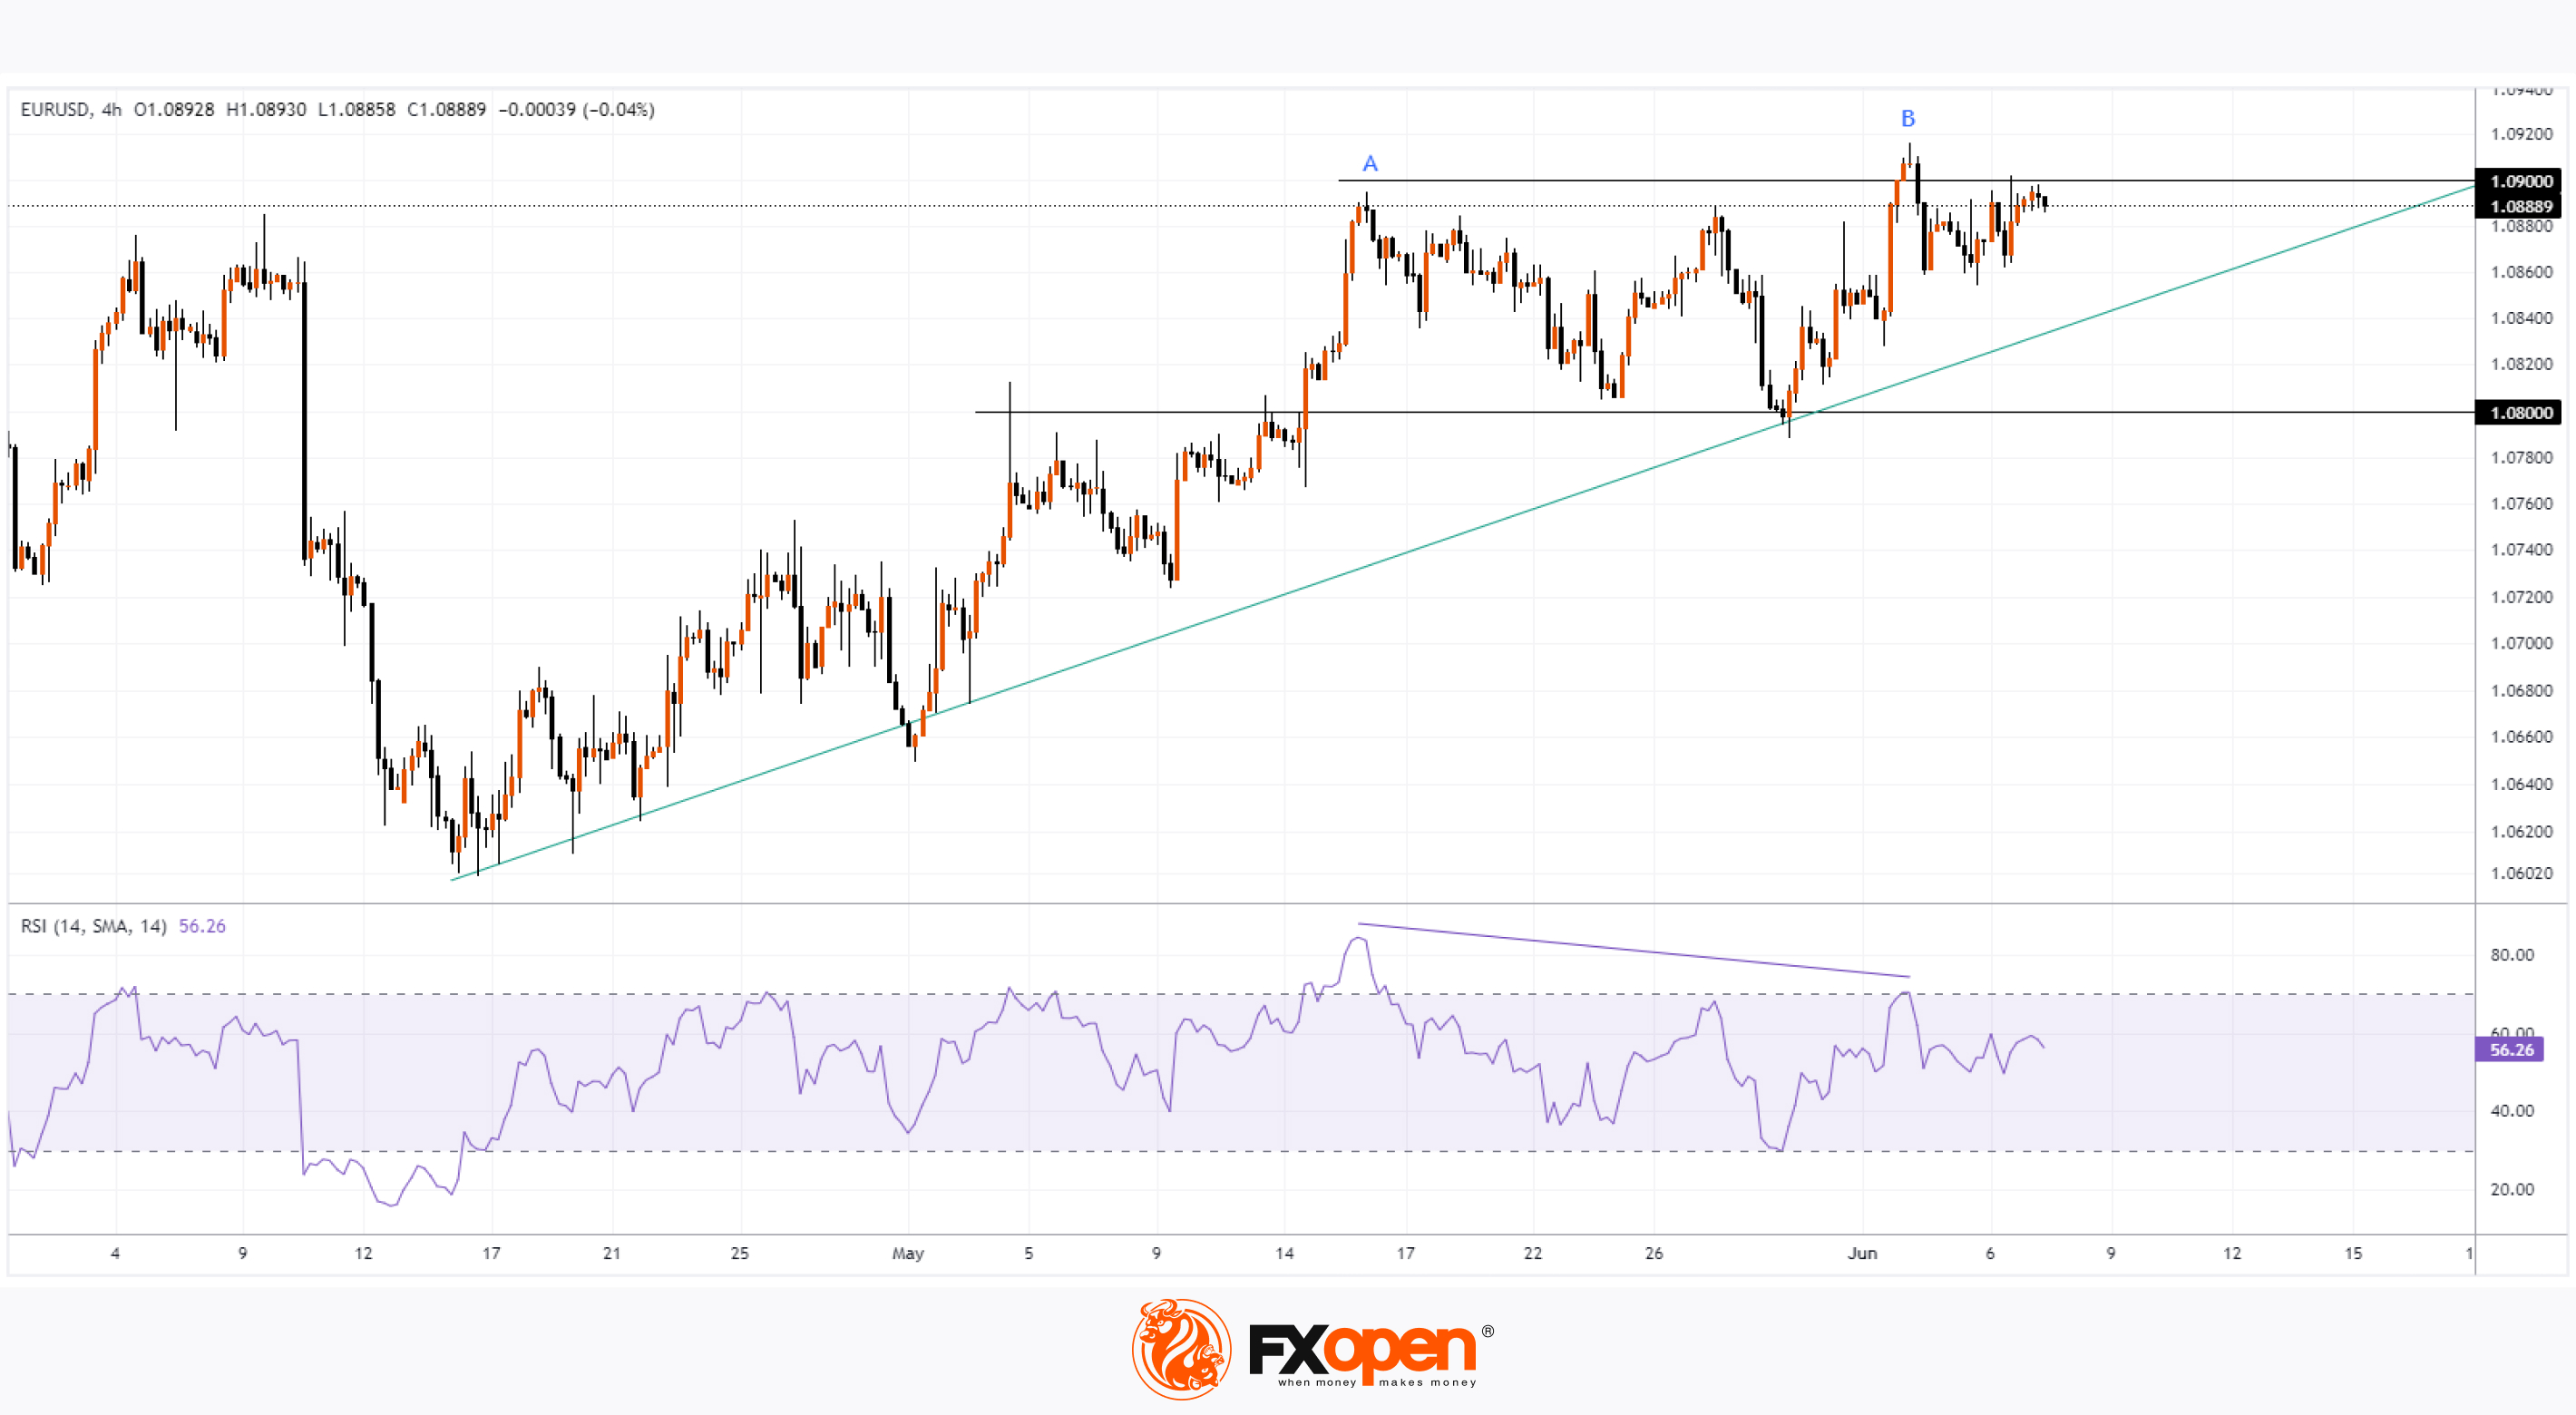
Given that the rate cut was anticipated, the EUR/USD rate hasn't changed significantly today, despite a noticeable spike in volatility.
Analysing the EUR/USD chart on 30 May, we highlighted the importance of the 1.08 level.
Since then, the bulls have shown the ability to bounce off this level and rise to 1.09.
The technical analysis of the EUR/USD chart, considering fresh data, provides important insights:
→ the 1.09 level shows signs of resistance, as the price struggles to stay above it for long;
→ this is evident from the price action forming peak B, as well as from yesterday’s action following the ECB news release;
→ the RSI indicator is forming a bearish divergence between peaks A and B.
Thus, the EUR/USD price is forming a narrowing triangle between the ascending trendline (shown in green) and the 1.09 level. It’s possible that a breakout of this pattern, which can be interpreted as a temporary consolidation, will lead to a new significant trend. The impetus for this could be the results of the European Parliament elections taking place from 6-9 June.
Trade over 50 forex markets 24 hours a day with FXOpen. Take advantage of low commissions, deep liquidity, and spreads from 0.0 pips. Open your FXOpen account now or learn more about trading forex with FXOpen.
CFDs are complex instruments and come with a high risk of losing your money.
This article represents the opinion of the Companies operating under the FXOpen brand only. It is not to be construed as an offer, solicitation, or recommendation with respect to products and services provided by the Companies operating under the FXOpen brand, nor is it to be considered financial advice.
EUR/USD Analysis: ECB Cuts Interest Rate for First Time Since 2019
By its decision, the ECB followed the example of the Bank of Canada, which lowered interest rates by 0.25%, as we reported yesterday. Consequently, this trend might continue with the Federal Reserve, marking the development of easing monetary policy cycles in Western economies.
According to ForexFactory:
→ the interest rate had been at 4.50% since September 2023;
→ it was reduced to 4.25%;
→ the reduction was accurately predicted by experts.
According to CNBC:
→ the ECB forecasts inflation at 2.5% in 2024 and 2.2% in 2025;
→″Based on an updated assessment of the inflation outlook, the dynamics of underlying inflation and the strength of monetary policy transmission, it is now appropriate to moderate the degree of monetary policy restriction after nine months of holding rates steady,” stated the ECB Governing Council.
Given that the rate cut was anticipated, the EUR/USD rate hasn't changed significantly today, despite a noticeable spike in volatility.
Analysing the EUR/USD chart on 30 May, we highlighted the importance of the 1.08 level.
Since then, the bulls have shown the ability to bounce off this level and rise to 1.09.
The technical analysis of the EUR/USD chart, considering fresh data, provides important insights:
→ the 1.09 level shows signs of resistance, as the price struggles to stay above it for long;
→ this is evident from the price action forming peak B, as well as from yesterday’s action following the ECB news release;
→ the RSI indicator is forming a bearish divergence between peaks A and B.
Thus, the EUR/USD price is forming a narrowing triangle between the ascending trendline (shown in green) and the 1.09 level. It’s possible that a breakout of this pattern, which can be interpreted as a temporary consolidation, will lead to a new significant trend. The impetus for this could be the results of the European Parliament elections taking place from 6-9 June.
Trade over 50 forex markets 24 hours a day with FXOpen. Take advantage of low commissions, deep liquidity, and spreads from 0.0 pips. Open your FXOpen account now or learn more about trading forex with FXOpen.
CFDs are complex instruments and come with a high risk of losing your money.
This article represents the opinion of the Companies operating under the FXOpen brand only. It is not to be construed as an offer, solicitation, or recommendation with respect to products and services provided by the Companies operating under the FXOpen brand, nor is it to be considered financial advice.
👍2
#sp500 #stockmarket #USDollar #xagusd #silverprice #MSFT
Weekly Market Wrap With Gary Thomson: S&P 500, US Dollar, Gold and Silver, MSFT Shares
Get the latest scoop on the week's hottest headlines, all in one convenient video. Join Gary Thomson, the COO of FXOpen UK, as he breaks down the most significant news reports and shares his expert insights.
🔸S&P 500 Index: Latest Analysts’ Forecasts
🔸The Dollar Continues Range-Bound Trading Ahead of US Employment Data
🔸The Price of Silver Is Acting Weaker Than Gold
🔸MSFT Shares Surge on Record Yearly Volumes
Stay in the know and empower yourself with our short, yet power-packed video. Watch it now and stay updated with FXOpen. Don't miss out on this invaluable opportunity to sharpen your trading skills and make informed decisions.
https://cutt.ly/9eiJADm2
To take advantage of price fluctuations in the foreign exchange markets, consider enlisting the services of a reliable broker like FXOpen.
⚠️
This forecast represents FXOpen Companies opinion only, it should not be construed as an offer, invitation or recommendation in respect to FXOpen Companies products and services or as financial advice
Weekly Market Wrap With Gary Thomson: S&P 500, US Dollar, Gold and Silver, MSFT Shares
Get the latest scoop on the week's hottest headlines, all in one convenient video. Join Gary Thomson, the COO of FXOpen UK, as he breaks down the most significant news reports and shares his expert insights.
🔸S&P 500 Index: Latest Analysts’ Forecasts
🔸The Dollar Continues Range-Bound Trading Ahead of US Employment Data
🔸The Price of Silver Is Acting Weaker Than Gold
🔸MSFT Shares Surge on Record Yearly Volumes
Stay in the know and empower yourself with our short, yet power-packed video. Watch it now and stay updated with FXOpen. Don't miss out on this invaluable opportunity to sharpen your trading skills and make informed decisions.
https://cutt.ly/9eiJADm2
To take advantage of price fluctuations in the foreign exchange markets, consider enlisting the services of a reliable broker like FXOpen.
⚠️
This forecast represents FXOpen Companies opinion only, it should not be construed as an offer, invitation or recommendation in respect to FXOpen Companies products and services or as financial advice
YouTube
Weekly Market Wrap With Gary Thomson: S&P 500, US Dollar, Gold and Silver, MSFT Shares
Get the latest scoop on the week's hottest headlines, all in one convenient video. Join Gary Thomson, the COO of FXOpen UK, as he breaks down the most significant news reports and shares his expert insights.
00:37 S&P 500 Index: Latest Analysts’ Forecasts…
00:37 S&P 500 Index: Latest Analysts’ Forecasts…
👍2
#EURGBP #forextrading #tradingtips #marketanalysis
EUR/GBP Rate at 21-Month Low Post-European Parliament Elections
Investors will begin the week in a state of uncertainty regarding the outlook of Europe's political landscape.
The four-day European Parliament elections concluded on Sunday. According to Reuters, the results showed a significant gain for eurosceptic-nationalists, who have displaced liberals and greens.
Additionally, President Emmanuel Macron dissolved the French Parliament, calling for early legislative elections later this month after losing to Marine Le Pen's far-right party in the European Union elections.
All this puts pressure on the structure of the European Union, weakening the euro's value.
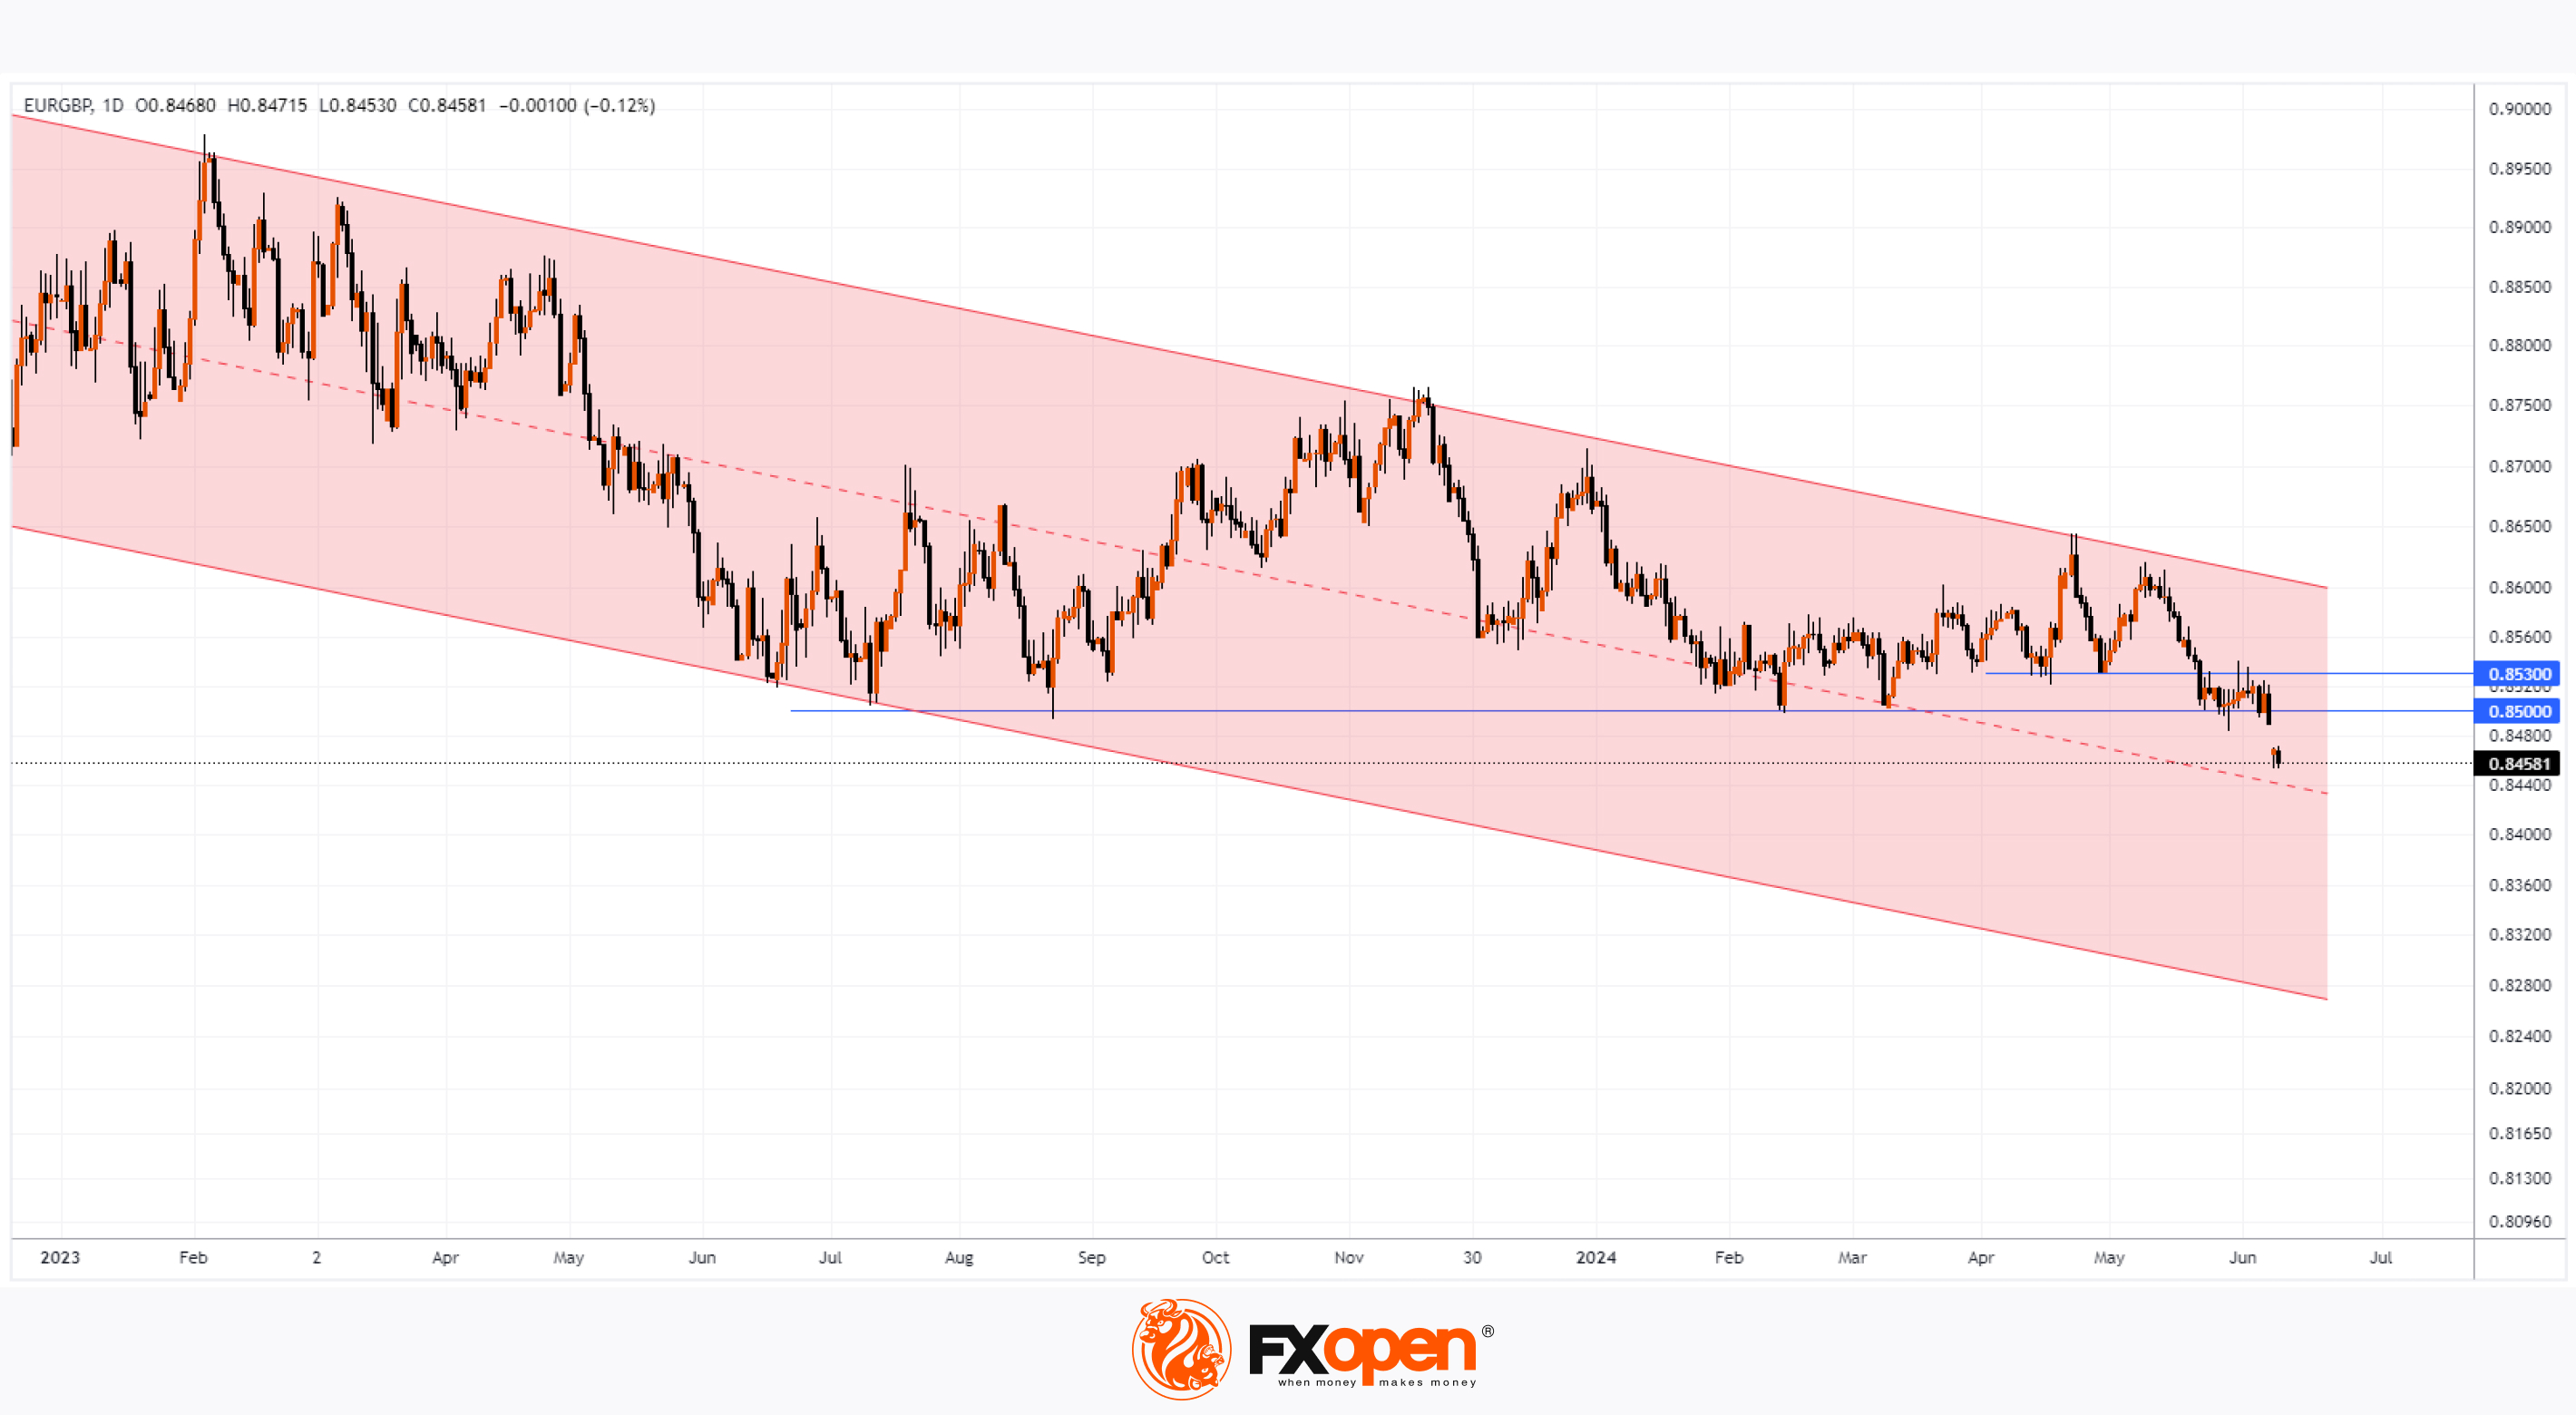
As shown by the EUR/GBP chart, trading on the currency markets opened on Monday around the 0.8465 level—a price not seen since August 2022.
According to the technical analysis of EUR/GBP today:
→ The price broke below the critical support level of 0.85, which had been in place since 2023;
→ In terms of price dynamics since autumn 2022, the market is in a downward trend (as indicated by the red channel). The bearish break of 0.85 reinforces this trend;
→ The median line of the channel could serve as a consolidation zone below 0.85, confirming the relevance of the channel;
→ The 0.85-0.853 zone may provide significant resistance in the future if bulls attempt to rectify the situation.
In a negative scenario for the market (e.g., a political crisis within Europe), the EUR/GBP price could potentially reach the lower boundary of the indicated channel.
Trade over 50 forex markets 24 hours a day with FXOpen. Take advantage of low commissions, deep liquidity, and spreads from 0.0 pips. Open your FXOpen account now or learn more about trading forex with FXOpen.
CFDs are complex instruments and come with a high risk of losing your money.
This article represents the opinion of the Companies operating under the FXOpen brand only. It is not to be construed as an offer, solicitation, or recommendation with respect to products and services provided by the Companies operating under the FXOpen brand, nor is it to be considered financial advice.
EUR/GBP Rate at 21-Month Low Post-European Parliament Elections
Investors will begin the week in a state of uncertainty regarding the outlook of Europe's political landscape.
The four-day European Parliament elections concluded on Sunday. According to Reuters, the results showed a significant gain for eurosceptic-nationalists, who have displaced liberals and greens.
Additionally, President Emmanuel Macron dissolved the French Parliament, calling for early legislative elections later this month after losing to Marine Le Pen's far-right party in the European Union elections.
All this puts pressure on the structure of the European Union, weakening the euro's value.
As shown by the EUR/GBP chart, trading on the currency markets opened on Monday around the 0.8465 level—a price not seen since August 2022.
According to the technical analysis of EUR/GBP today:
→ The price broke below the critical support level of 0.85, which had been in place since 2023;
→ In terms of price dynamics since autumn 2022, the market is in a downward trend (as indicated by the red channel). The bearish break of 0.85 reinforces this trend;
→ The median line of the channel could serve as a consolidation zone below 0.85, confirming the relevance of the channel;
→ The 0.85-0.853 zone may provide significant resistance in the future if bulls attempt to rectify the situation.
In a negative scenario for the market (e.g., a political crisis within Europe), the EUR/GBP price could potentially reach the lower boundary of the indicated channel.
Trade over 50 forex markets 24 hours a day with FXOpen. Take advantage of low commissions, deep liquidity, and spreads from 0.0 pips. Open your FXOpen account now or learn more about trading forex with FXOpen.
CFDs are complex instruments and come with a high risk of losing your money.
This article represents the opinion of the Companies operating under the FXOpen brand only. It is not to be construed as an offer, solicitation, or recommendation with respect to products and services provided by the Companies operating under the FXOpen brand, nor is it to be considered financial advice.
👍2
#XAUUSD #goldprice #MarketNews #marketanalysis
Gold Price Drops After US Employment Report
As per ForexFactory, the Non-Farm Employment Change report revealed an actual increase of 272 thousand jobs (expected = 182k, previous value = 165k).
A robust job market provides further arguments for the Federal Reserve to continue its tight monetary policy. Consequently, the news led to a rise in the dollar index and a decrease in assets denominated in US dollars:
→ Currencies depreciated; for instance, the NZD/USD rate decreased by approximately 1.5%;
→ Cryptocurrencies declined; Bitcoin dropped by roughly 3%;
→ Gold also decreased in price.
The situation worsens for the gold price with the news that China has stopped buying the metal for reserves after doing so for 18 months. According to ING, China's appetite showed signs of weakening in April when the central bank purchased only 60,000 ounces compared to 160,000 ounces in March.
Today's XAU/USD chart shows that the gold price fell below the $2300 level for the first time since May 6th.
According to the technical analysis of the gold chart:
→ The price has been moving in an ascending trend (shown by the blue channel) since last autumn;
→ However, after reaching a historical peak on May 20th, the price shows a downward trend (shown by the red channel);
→ The red channel may indicate a developing correction within the current bullish market.
Using Friday's news release, bears managed to lower the price of gold into the lower half of the ascending blue channel, confirming the thesis of a correction. It is possible that the XAU/USD price will continue to decline within the red correctional channel.
Furthermore, the target for bears may be around the $2200 level, as approximately:
→ It aligns with the lower boundary of the blue channel, from which bulls may attempt to resume the ascending trend;
→ It corresponds to the 50% Fibonacci retracement level from the bullish impulse A→B.
Potential resistance levels in case bulls attempt to recover from Friday's decline:
→ $2323, which acted as support since late May but was breached;
→ The median line of the blue channel.
Start trading commodities with tight spreads. Open your trading account now or learn more about trading commodity CFDs with FXOpen.
CFDs are complex instruments and come with a high risk of losing your money.
This article represents the opinion of the Companies operating under the FXOpen brand only. It is not to be construed as an offer, solicitation, or recommendation with respect to products and services provided by the Companies operating under the FXOpen brand, nor is it to be considered financial advice.
Gold Price Drops After US Employment Report
As per ForexFactory, the Non-Farm Employment Change report revealed an actual increase of 272 thousand jobs (expected = 182k, previous value = 165k).
A robust job market provides further arguments for the Federal Reserve to continue its tight monetary policy. Consequently, the news led to a rise in the dollar index and a decrease in assets denominated in US dollars:
→ Currencies depreciated; for instance, the NZD/USD rate decreased by approximately 1.5%;
→ Cryptocurrencies declined; Bitcoin dropped by roughly 3%;
→ Gold also decreased in price.
The situation worsens for the gold price with the news that China has stopped buying the metal for reserves after doing so for 18 months. According to ING, China's appetite showed signs of weakening in April when the central bank purchased only 60,000 ounces compared to 160,000 ounces in March.
Today's XAU/USD chart shows that the gold price fell below the $2300 level for the first time since May 6th.
According to the technical analysis of the gold chart:
→ The price has been moving in an ascending trend (shown by the blue channel) since last autumn;
→ However, after reaching a historical peak on May 20th, the price shows a downward trend (shown by the red channel);
→ The red channel may indicate a developing correction within the current bullish market.
Using Friday's news release, bears managed to lower the price of gold into the lower half of the ascending blue channel, confirming the thesis of a correction. It is possible that the XAU/USD price will continue to decline within the red correctional channel.
Furthermore, the target for bears may be around the $2200 level, as approximately:
→ It aligns with the lower boundary of the blue channel, from which bulls may attempt to resume the ascending trend;
→ It corresponds to the 50% Fibonacci retracement level from the bullish impulse A→B.
Potential resistance levels in case bulls attempt to recover from Friday's decline:
→ $2323, which acted as support since late May but was breached;
→ The median line of the blue channel.
Start trading commodities with tight spreads. Open your trading account now or learn more about trading commodity CFDs with FXOpen.
CFDs are complex instruments and come with a high risk of losing your money.
This article represents the opinion of the Companies operating under the FXOpen brand only. It is not to be construed as an offer, solicitation, or recommendation with respect to products and services provided by the Companies operating under the FXOpen brand, nor is it to be considered financial advice.
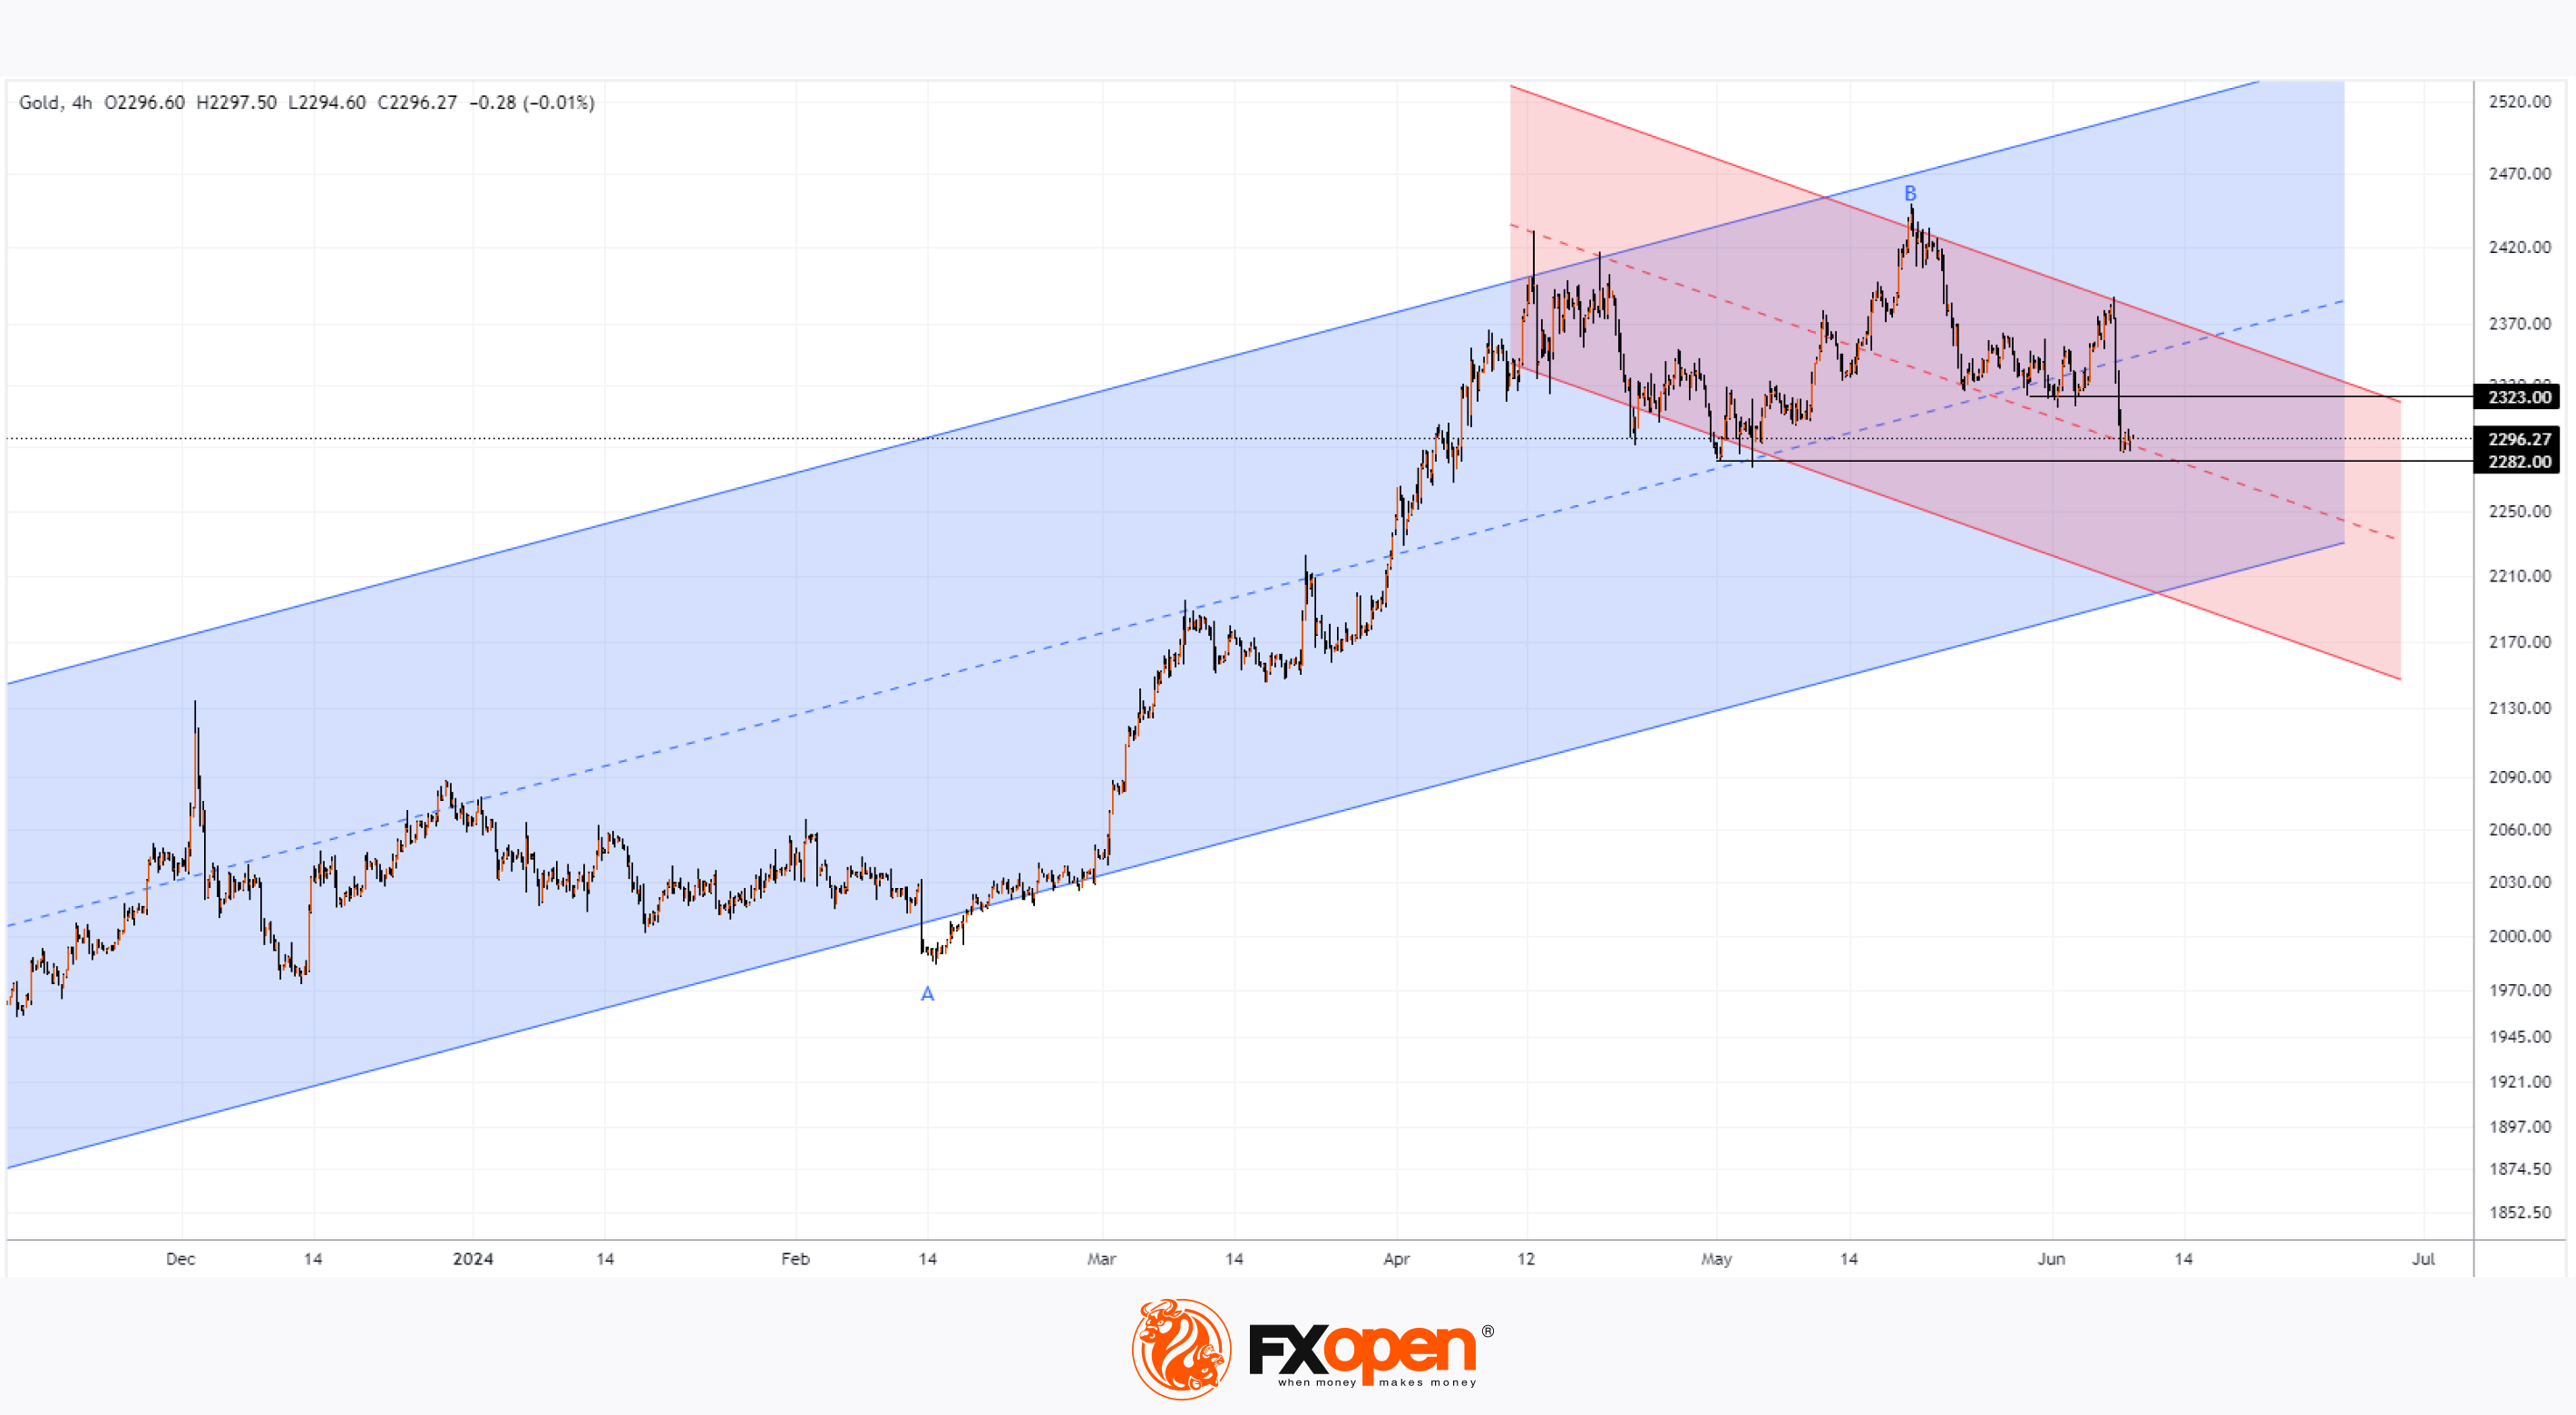
👍3
#MarketNews #oilprices #oilindustry
Goldman Sachs Predicts a Rise in Brent Crude Oil Prices
According to CNBC, Goldman Sachs analysts believe that Brent crude oil prices should increase in the third quarter due to summer fuel demand leading to a “significant” deficit—approximately 1.3 million barrels per day. They forecast that the price of Brent could rise to $86 per barrel with a “ceiling” around $90.
This implies an approximate +7% increase from current levels and a continued rise from the low set on 4 June. How realistic is this?
Technical analysis of the XBR/USD chart indicates that:
→ In the long term, Brent crude oil prices are forming oscillations with diminishing amplitude—pattern A-B-C-D-E. This is a large-scale narrowing triangle, reflecting the balance of supply and demand around the median level, which is approximately around $83.50. This balance has been apparent since 2023.
→ A sharp bullish reversal and rise from the lower line indicates strong demand for Brent crude below $78.
→ Yesterday, bulls broke through the former support at $80.40 after an intraday correction, confirming their dominance.
If the bullish momentum doesn’t completely fade around the median line of the narrowing triangle, technically, the price of Brent crude oil could reach its upper boundary, which coincides with the ceiling forecasted by Goldman Sachs analysts.
Additionally, inflation news could have a significant impact on the XBR/USD exchange rate—the Consumer Price Index (CPI) release is scheduled for tomorrow at 15:30 GMT+3.
Start trading commodities with tight spreads. Open your trading account now or learn more about trading commodity CFDs with FXOpen.
CFDs are complex instruments and come with a high risk of losing your money.
This article represents the opinion of the Companies operating under the FXOpen brand only. It is not to be construed as an offer, solicitation, or recommendation with respect to products and services provided by the Companies operating under the FXOpen brand, nor is it to be considered financial advice.
Goldman Sachs Predicts a Rise in Brent Crude Oil Prices
According to CNBC, Goldman Sachs analysts believe that Brent crude oil prices should increase in the third quarter due to summer fuel demand leading to a “significant” deficit—approximately 1.3 million barrels per day. They forecast that the price of Brent could rise to $86 per barrel with a “ceiling” around $90.
This implies an approximate +7% increase from current levels and a continued rise from the low set on 4 June. How realistic is this?
Technical analysis of the XBR/USD chart indicates that:
→ In the long term, Brent crude oil prices are forming oscillations with diminishing amplitude—pattern A-B-C-D-E. This is a large-scale narrowing triangle, reflecting the balance of supply and demand around the median level, which is approximately around $83.50. This balance has been apparent since 2023.
→ A sharp bullish reversal and rise from the lower line indicates strong demand for Brent crude below $78.
→ Yesterday, bulls broke through the former support at $80.40 after an intraday correction, confirming their dominance.
If the bullish momentum doesn’t completely fade around the median line of the narrowing triangle, technically, the price of Brent crude oil could reach its upper boundary, which coincides with the ceiling forecasted by Goldman Sachs analysts.
Additionally, inflation news could have a significant impact on the XBR/USD exchange rate—the Consumer Price Index (CPI) release is scheduled for tomorrow at 15:30 GMT+3.
Start trading commodities with tight spreads. Open your trading account now or learn more about trading commodity CFDs with FXOpen.
CFDs are complex instruments and come with a high risk of losing your money.
This article represents the opinion of the Companies operating under the FXOpen brand only. It is not to be construed as an offer, solicitation, or recommendation with respect to products and services provided by the Companies operating under the FXOpen brand, nor is it to be considered financial advice.
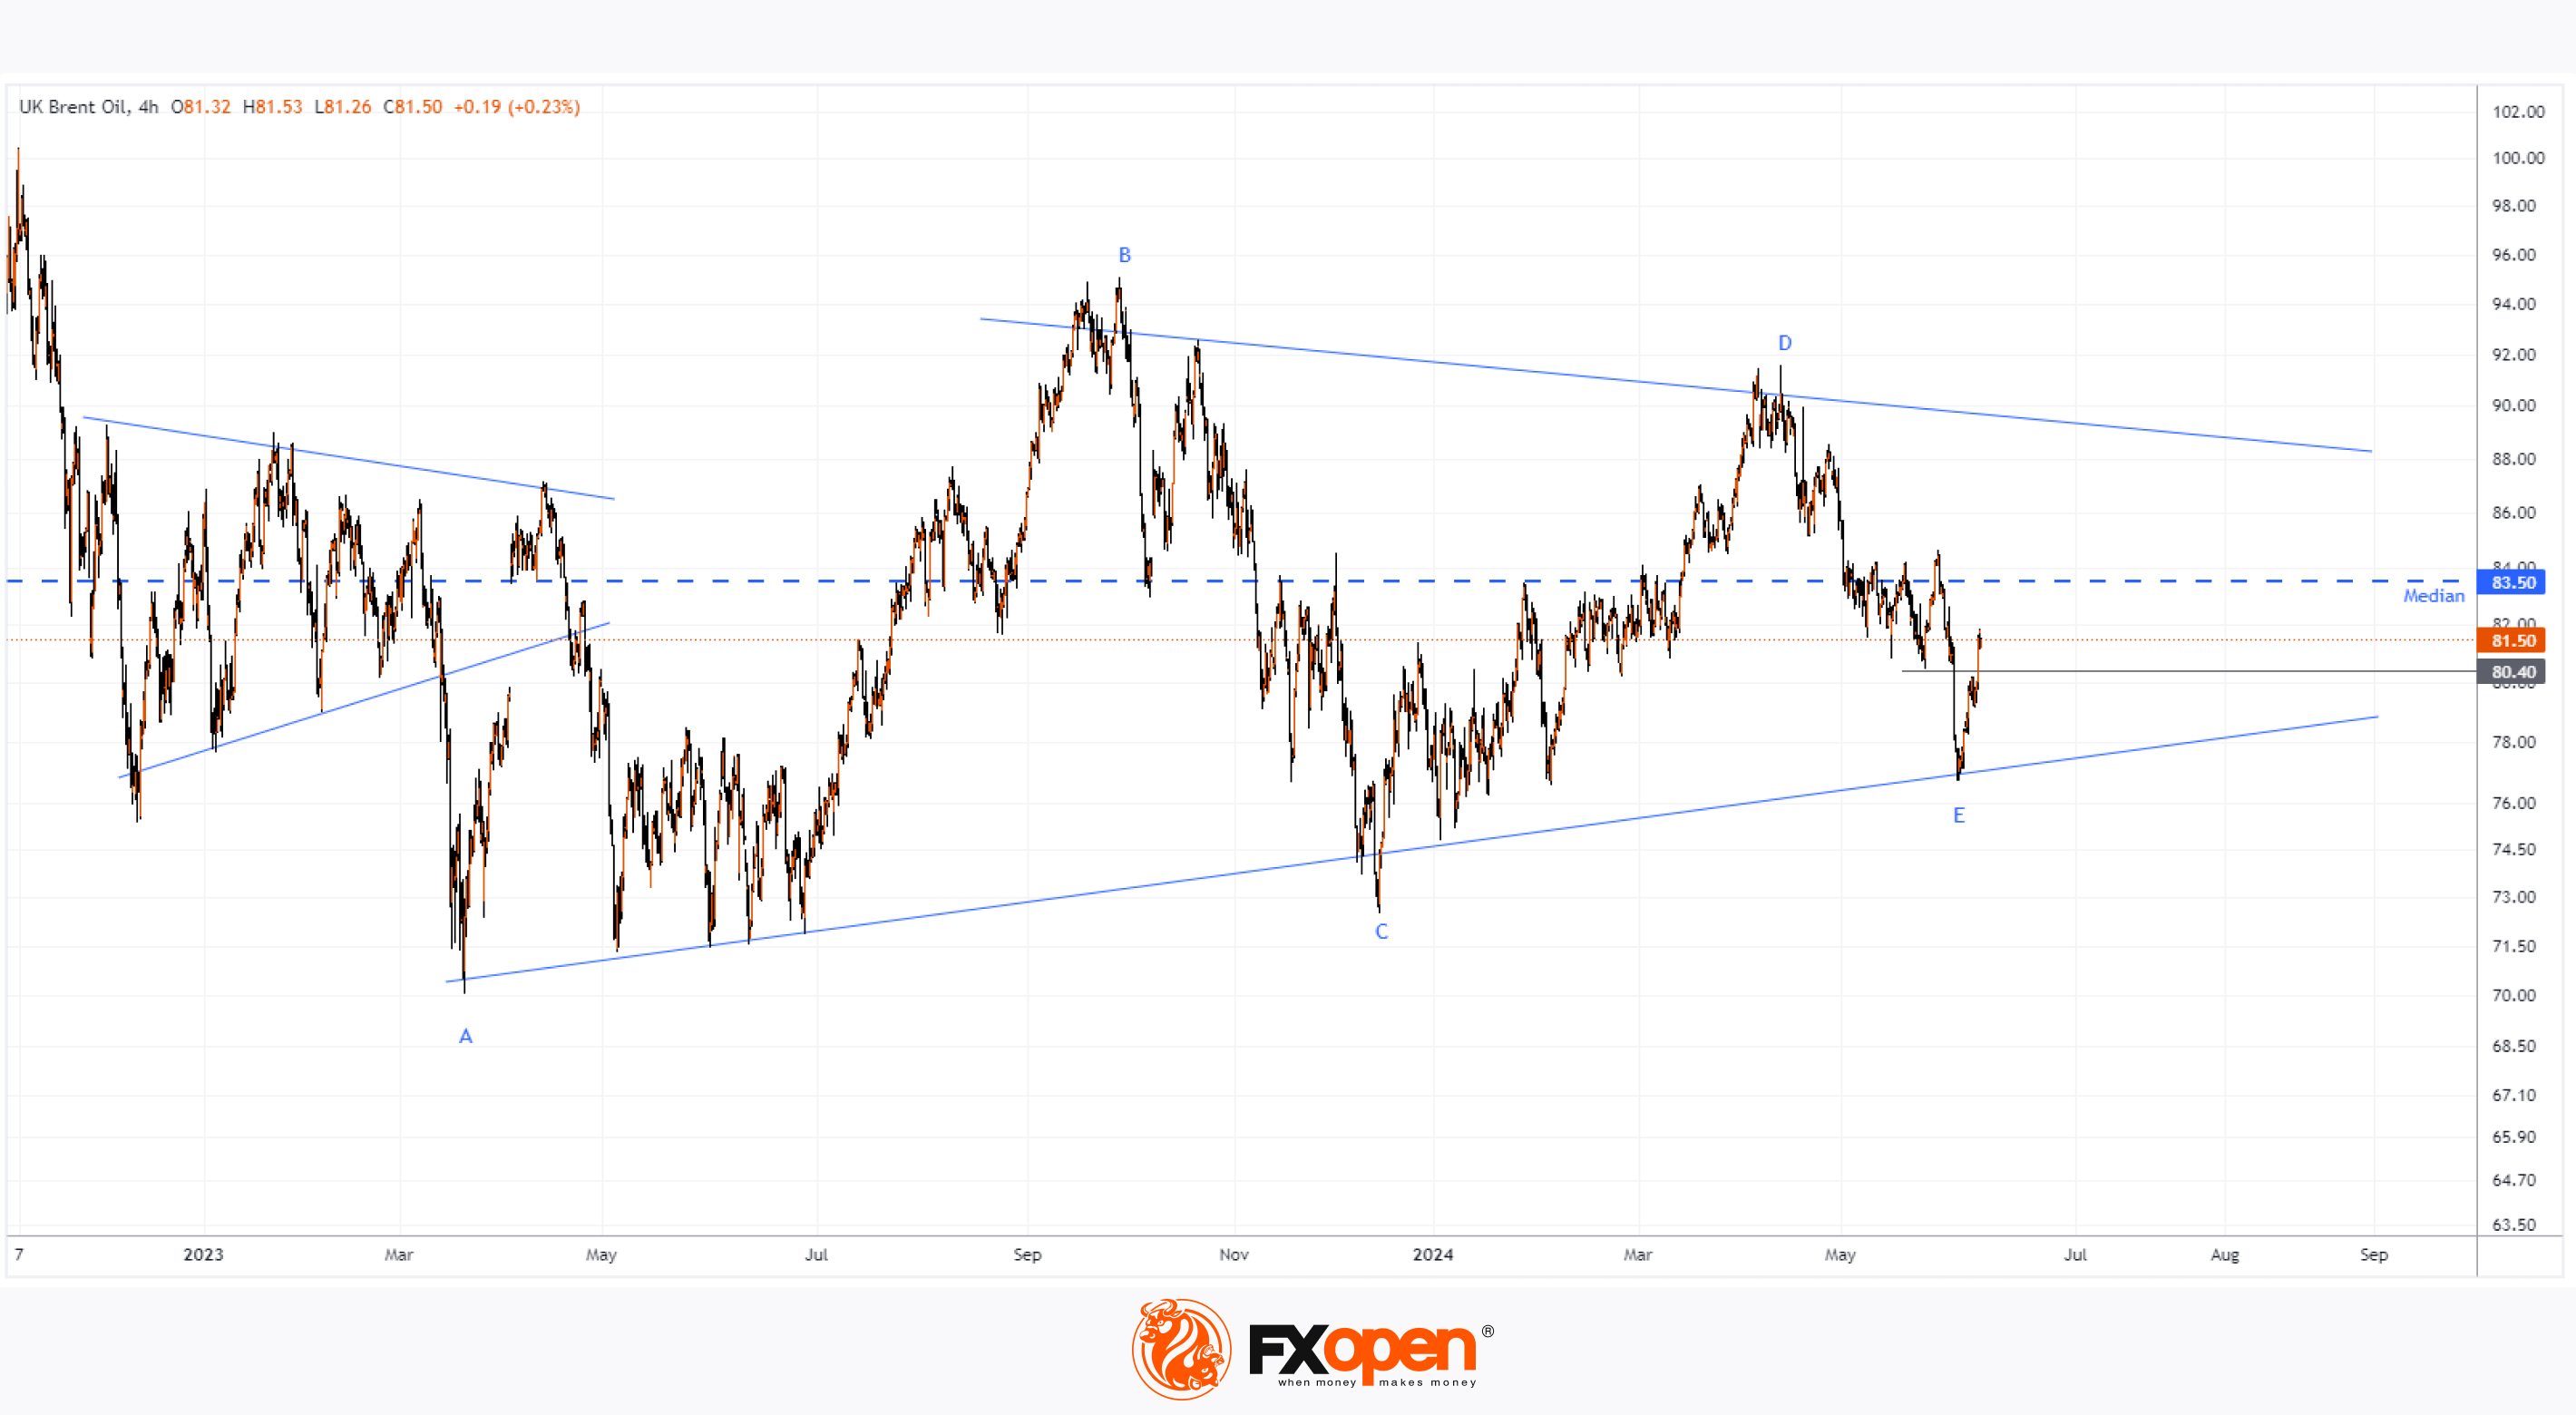
👍2
#AAPL #stockmarket #stocktrading #tradingtips
AAPL Shares Drop Following the Apple Intelligence Presentation
Yesterday, 10 June, at the WWDC2024 conference, the American corporation Apple unveiled its new artificial intelligence system, Apple Intelligence (AI).
Apple Intelligence will allow users to enhance their text and communicate more effectively: rewriting, proofreading, and summarising text almost everywhere, including in mail, notes, pages, and third-party applications. The Rewrite function will enable changing the tone of messages, adding jokes, and rephrasing sentences.
Key features include:
→ AI's capability to understand the user's "personal context."
→ AI's ability to generate unique photos, sketches, and illustrations in Notes, Freeform, and Pages.
→ Apple confirmed its collaboration with OpenAI during the presentation.
However, on the same day, AAPL shares fell nearly 2%, with high trading volumes on the Nasdaq—over 97 million shares were traded, compared to an average volume of about 59 million.
Is this a sign that investors were disappointed with the presentation? Looking at AAPL’s stock chart today, it suggests that the decline might be due to the significant $195 level per AAPL share.
Technical analysis of AAPL’s chart shows that:
→ The price attempted to hold above $195 three times (end of July 2023, December 2023, end of January 2024) but failed. The proximity to the crucial psychological mark of $200 per share seems to be a factor.
→ The RSI indicator is near the overbought zone, motivating a price correction and profit-taking near key resistance (after a rally from A to B of almost 20% in less than two months)—this could have driven yesterday’s decline.
→ Yesterday’s candle formed a bearish engulfing pattern.
If the correction continues, AAPL’s price may fall within the ascending channel (shown in blue) to its lower boundary. A key support level might be around $180.40:
→ Approximately the 50% Fibonacci retracement level from the bullish impulse A to B.
→ The upper boundary of the bullish gap from early May.
Trade global index CFDs with zero commission and tight spreads. Open your FXOpen account now or learn more about trading index CFDs with FXOpen.
CFDs are complex instruments and come with a high risk of losing your money.
This article represents the opinion of the Companies operating under the FXOpen brand only. It is not to be construed as an offer, solicitation, or recommendation with respect to products and services provided by the Companies operating under the FXOpen brand, nor is it to be considered financial advice.
AAPL Shares Drop Following the Apple Intelligence Presentation
Yesterday, 10 June, at the WWDC2024 conference, the American corporation Apple unveiled its new artificial intelligence system, Apple Intelligence (AI).
Apple Intelligence will allow users to enhance their text and communicate more effectively: rewriting, proofreading, and summarising text almost everywhere, including in mail, notes, pages, and third-party applications. The Rewrite function will enable changing the tone of messages, adding jokes, and rephrasing sentences.
Key features include:
→ AI's capability to understand the user's "personal context."
→ AI's ability to generate unique photos, sketches, and illustrations in Notes, Freeform, and Pages.
→ Apple confirmed its collaboration with OpenAI during the presentation.
However, on the same day, AAPL shares fell nearly 2%, with high trading volumes on the Nasdaq—over 97 million shares were traded, compared to an average volume of about 59 million.
Is this a sign that investors were disappointed with the presentation? Looking at AAPL’s stock chart today, it suggests that the decline might be due to the significant $195 level per AAPL share.
Technical analysis of AAPL’s chart shows that:
→ The price attempted to hold above $195 three times (end of July 2023, December 2023, end of January 2024) but failed. The proximity to the crucial psychological mark of $200 per share seems to be a factor.
→ The RSI indicator is near the overbought zone, motivating a price correction and profit-taking near key resistance (after a rally from A to B of almost 20% in less than two months)—this could have driven yesterday’s decline.
→ Yesterday’s candle formed a bearish engulfing pattern.
If the correction continues, AAPL’s price may fall within the ascending channel (shown in blue) to its lower boundary. A key support level might be around $180.40:
→ Approximately the 50% Fibonacci retracement level from the bullish impulse A to B.
→ The upper boundary of the bullish gap from early May.
Trade global index CFDs with zero commission and tight spreads. Open your FXOpen account now or learn more about trading index CFDs with FXOpen.
CFDs are complex instruments and come with a high risk of losing your money.
This article represents the opinion of the Companies operating under the FXOpen brand only. It is not to be construed as an offer, solicitation, or recommendation with respect to products and services provided by the Companies operating under the FXOpen brand, nor is it to be considered financial advice.
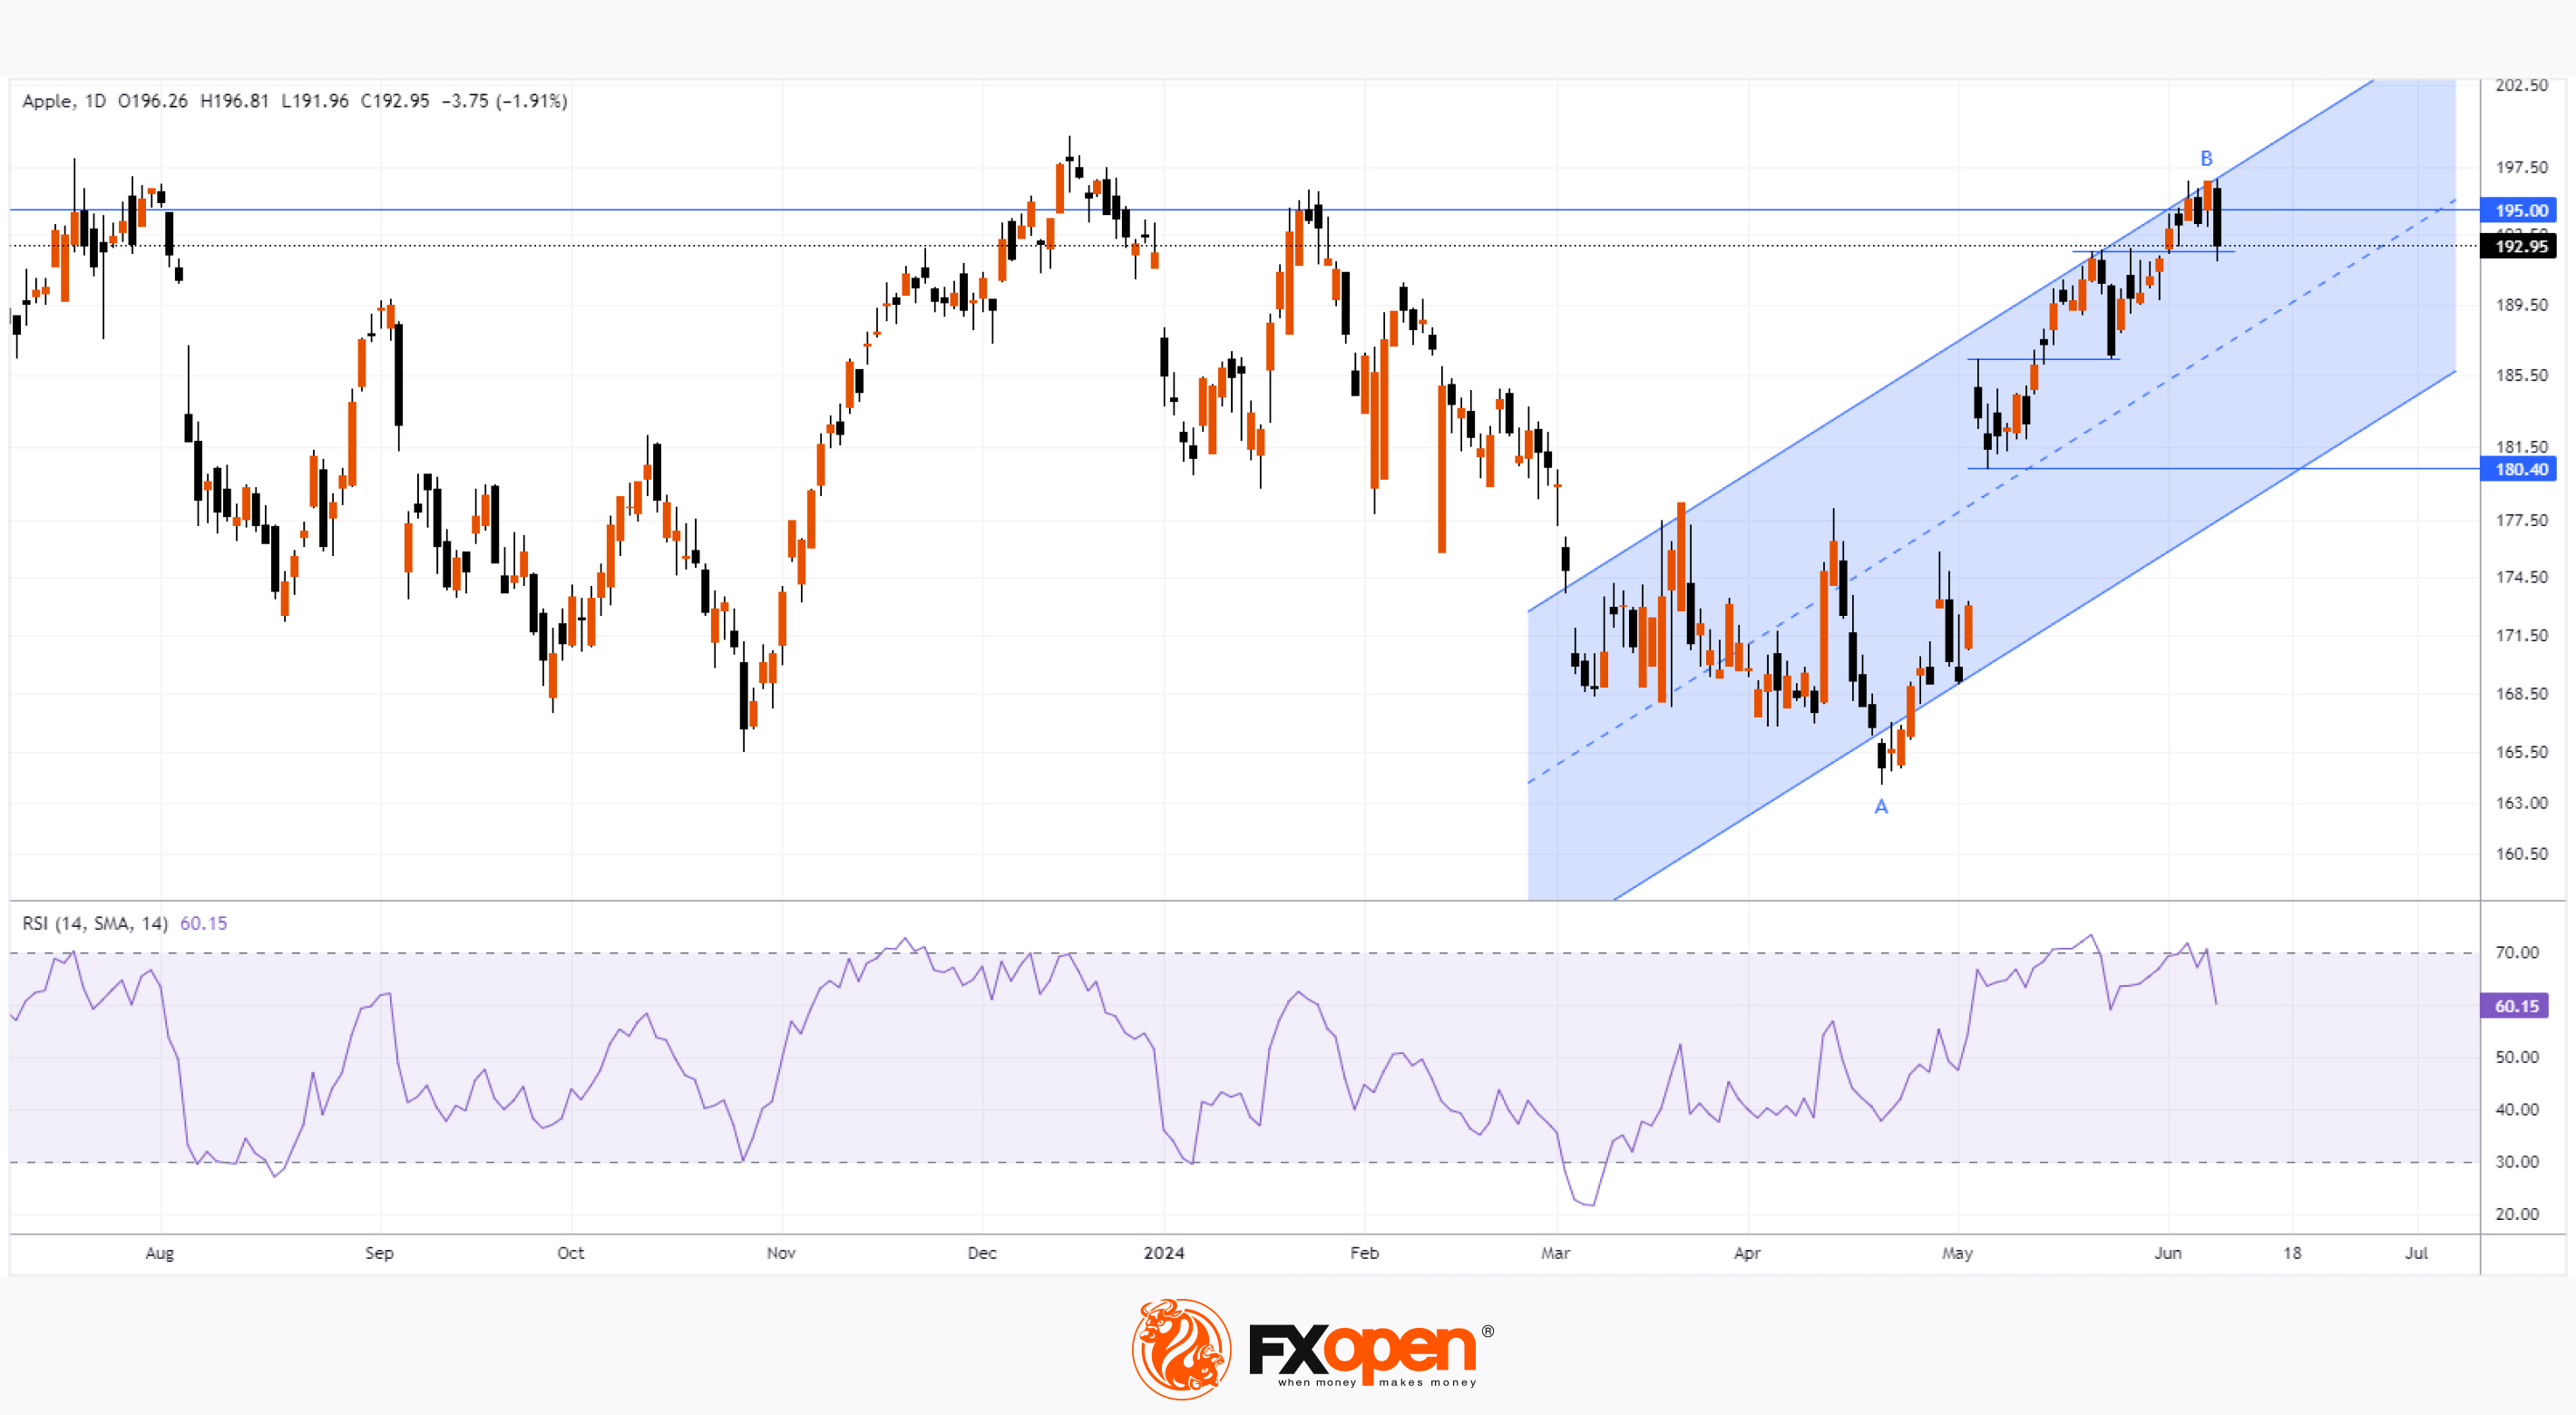
👍2
#FTSE #stockmarket #stocktrading #MarketNews
FTSE 100 Index Declines After Labour Market News
The British stock index FTSE 100 (UK 100 on FXOpen) dropped nearly 1% yesterday due to the release of economic data indicating a rise in unemployment.
According to ForexFactory:
→ The Claimant Count Change (number of unemployment benefit claims) was 50,000 (expected = 10.2k, previous month = 8.4k). This is the highest number since March 2021.
→ The unemployment rate slightly increased to 4.4% compared to the previous value of 4.3%.
However, today the FTSE 100 (UK 100 on FXOpen) chart is showing signs of recovery.
Fundamentally:
→ GDP news did not bring any unpleasant surprises;
→ Weakening in the labour market might prompt the Bank of England to lower the interest rate to stimulate the economy, which should support the stock index.
From a Technical Analysis Perspective of the FTSE 100 (UK 100 on FXOpen):
→ At the low of the decline, the price found support at the median line of the upward channel that has been in place since last autumn (shown in blue);
→ The median line is reinforced by the 50% Fibonacci retracement level from the bullish impulse A→B;
→ The price failed to consolidate below the late May low around the 8150 level, indicating a local capitulation of bears.
Bulls, on the other hand, might use these technical support factors to attempt to resume the upward trend within the blue channel. To do this, they will need to break the resistance of the trend line (shown in red).
Trade global index CFDs with zero commission and tight spreads. Open your FXOpen account now or learn more about trading index CFDs with FXOpen.
CFDs are complex instruments and come with a high risk of losing your money.
This article represents the opinion of the Companies operating under the FXOpen brand only. It is not to be construed as an offer, solicitation, or recommendation with respect to products and services provided by the Companies operating under the FXOpen brand, nor is it to be considered financial advice.
FTSE 100 Index Declines After Labour Market News
The British stock index FTSE 100 (UK 100 on FXOpen) dropped nearly 1% yesterday due to the release of economic data indicating a rise in unemployment.
According to ForexFactory:
→ The Claimant Count Change (number of unemployment benefit claims) was 50,000 (expected = 10.2k, previous month = 8.4k). This is the highest number since March 2021.
→ The unemployment rate slightly increased to 4.4% compared to the previous value of 4.3%.
However, today the FTSE 100 (UK 100 on FXOpen) chart is showing signs of recovery.
Fundamentally:
→ GDP news did not bring any unpleasant surprises;
→ Weakening in the labour market might prompt the Bank of England to lower the interest rate to stimulate the economy, which should support the stock index.
From a Technical Analysis Perspective of the FTSE 100 (UK 100 on FXOpen):
→ At the low of the decline, the price found support at the median line of the upward channel that has been in place since last autumn (shown in blue);
→ The median line is reinforced by the 50% Fibonacci retracement level from the bullish impulse A→B;
→ The price failed to consolidate below the late May low around the 8150 level, indicating a local capitulation of bears.
Bulls, on the other hand, might use these technical support factors to attempt to resume the upward trend within the blue channel. To do this, they will need to break the resistance of the trend line (shown in red).
Trade global index CFDs with zero commission and tight spreads. Open your FXOpen account now or learn more about trading index CFDs with FXOpen.
CFDs are complex instruments and come with a high risk of losing your money.
This article represents the opinion of the Companies operating under the FXOpen brand only. It is not to be construed as an offer, solicitation, or recommendation with respect to products and services provided by the Companies operating under the FXOpen brand, nor is it to be considered financial advice.
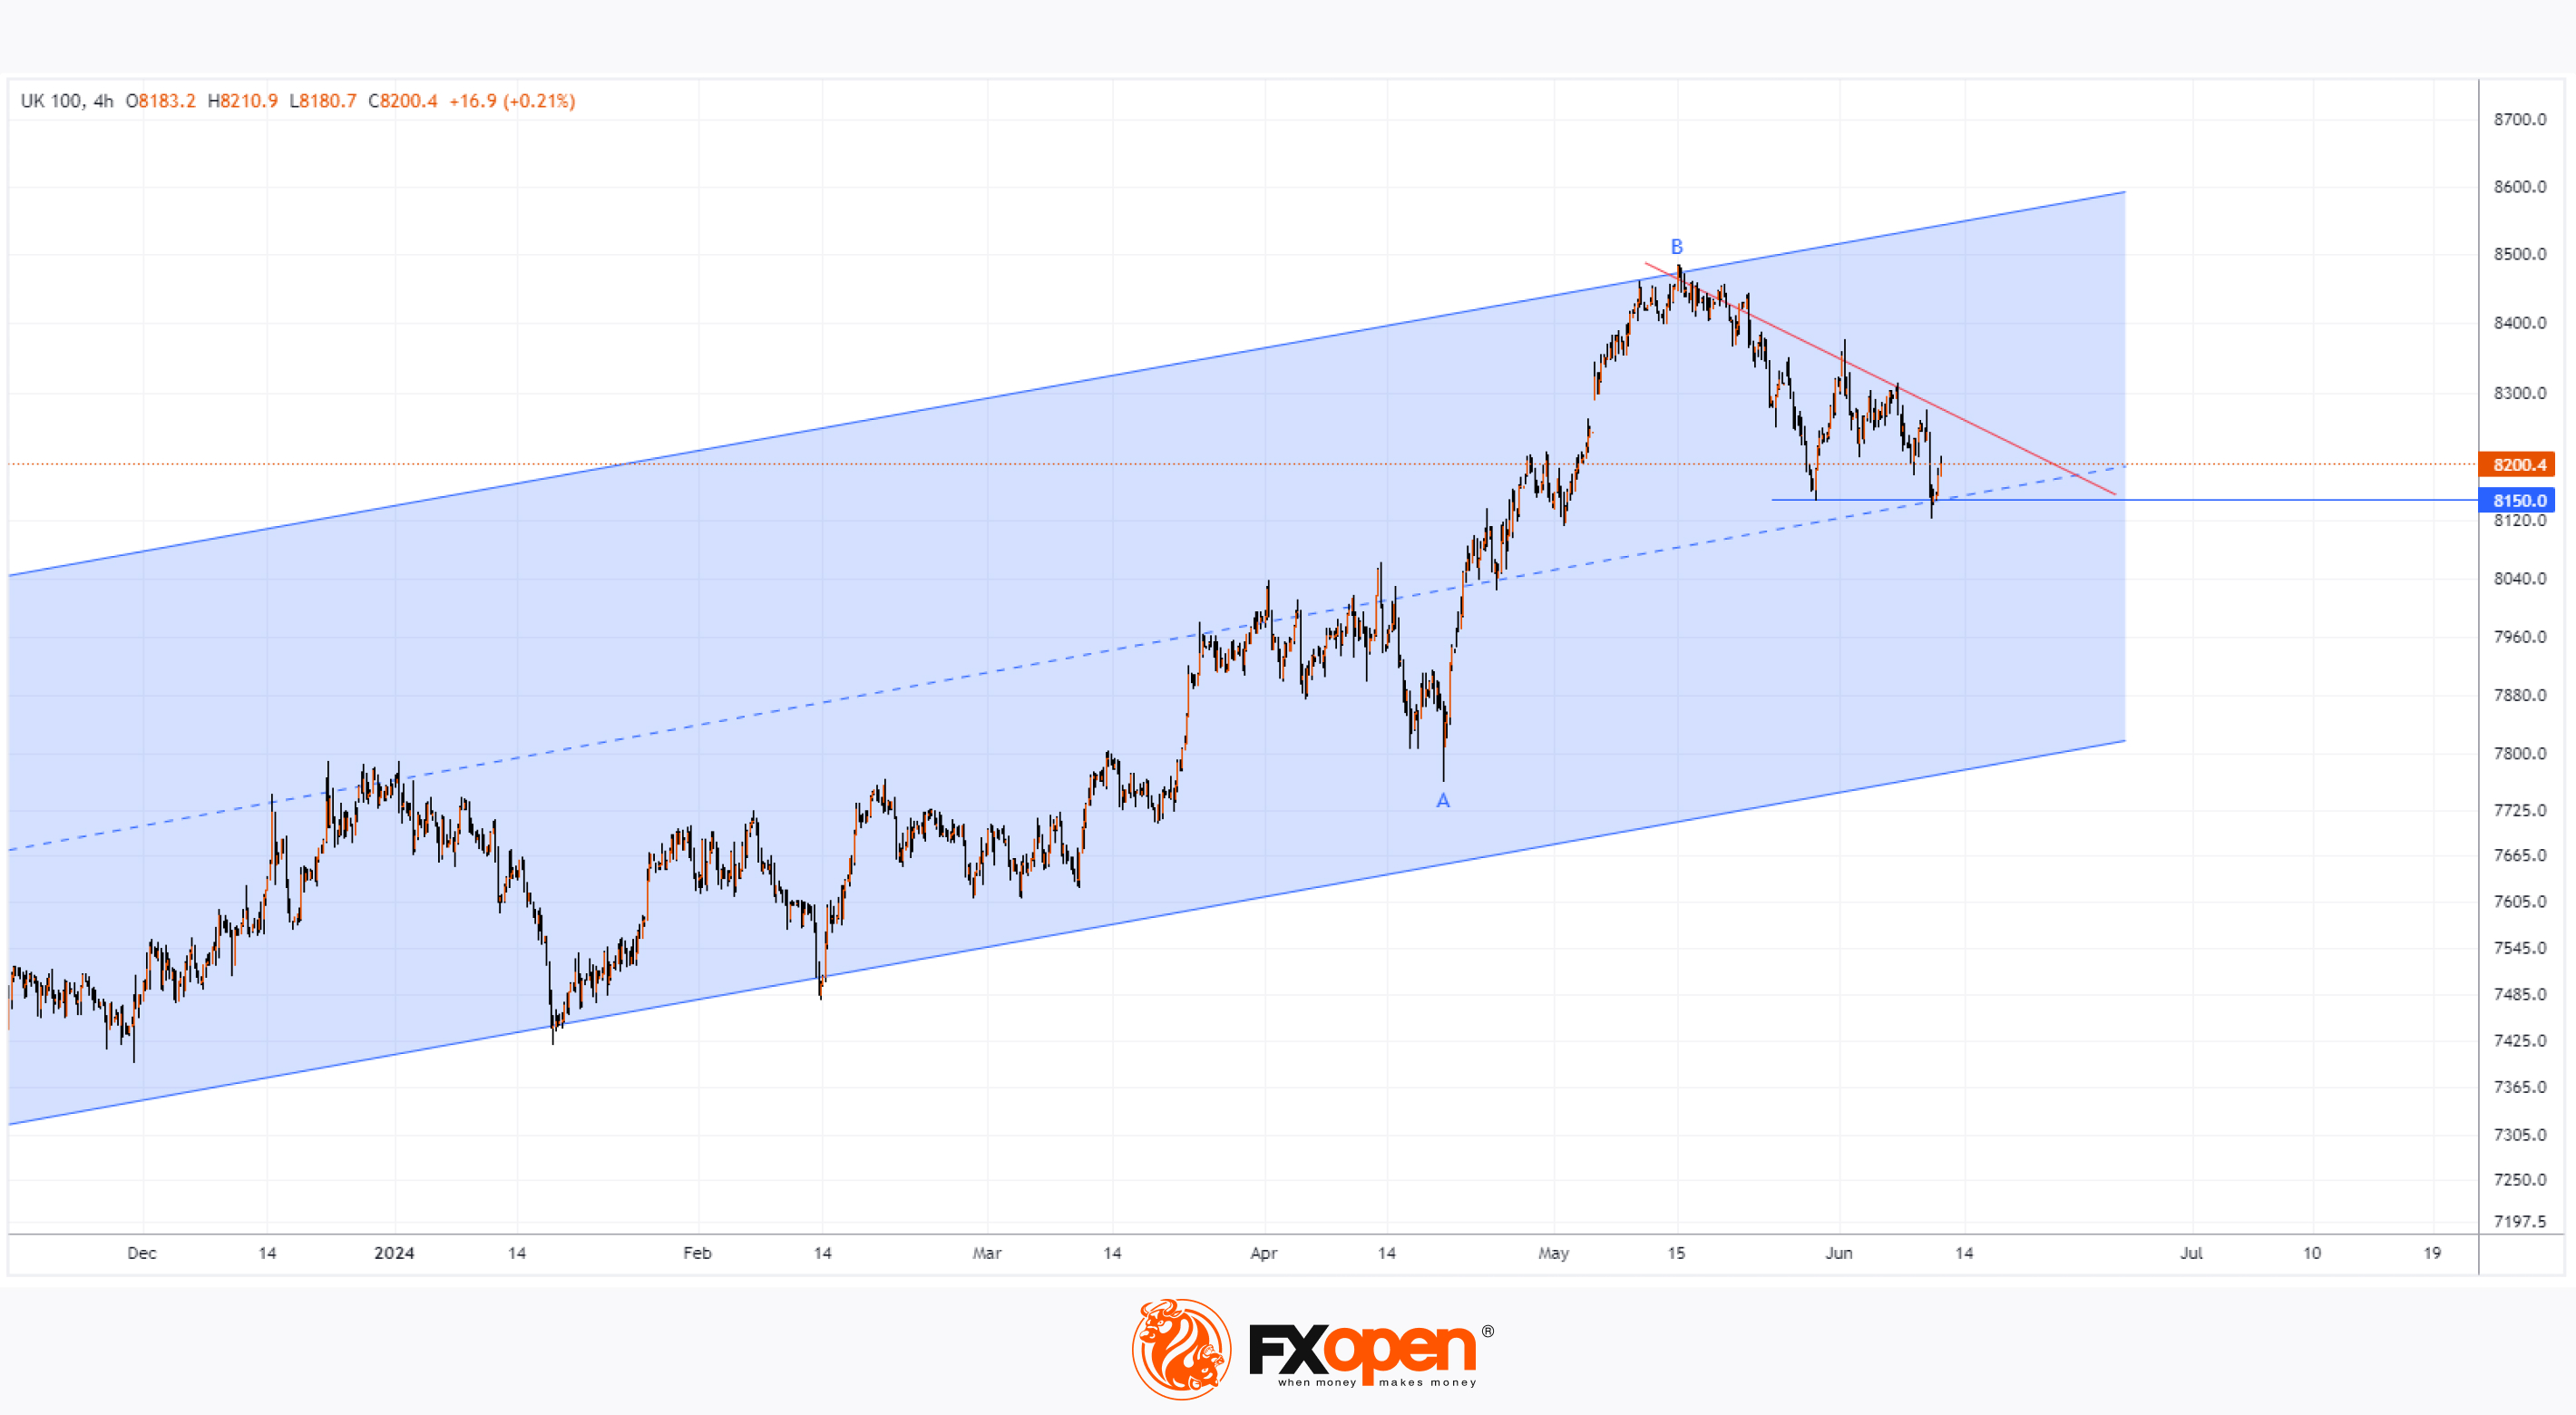
👍2
#marketanalysis #usdcad #MarketNews #forextrading
USD/CAD Retracts from Nearly 2-Month High
Yesterday, the USD/CAD exchange rate climbed above 1.3785 for the first time since mid-April.
However, today's USD/CAD chart shows that it failed to consolidate at this peak and has dropped to a weekly low.
These fluctuations might be interpreted as traders positioning themselves ahead of today's critical events. According to ForexFactory:
- At 15:30 GMT+3, US inflation data will be released;
- At 21:00 GMT+3, the Fed's interest rate decision will be announced;
- At 21:30 GMT+3, Powell's press conference will take place.
Technical analysis of the USD/CAD chart:
- The price made a false bullish breakout of the 1.3785 level, which is a bearish signal;
- The red arrow indicates a bearish engulfing pattern that formed during this failed breakout;
- The proximity to the psychological level of 1.3800 may have influenced the increase in selling pressure.
In any case, the USD/CAD rate is heading downwards today towards the triangle with its median around the 1.368 level, reflecting market sentiment ahead of the news. The 1.37370 level (former resistance) might provide market support.
What to expect?
Considering that the Bank of Canada and the ECB already cut interest rates last week (as we reported here and here), it is possible that the Fed will also lean dovish, continuing the rate-cutting cycle. If so, this could weaken the USD relative to other currencies.
Prepare for spikes in market volatility today.
Trade over 50 forex markets 24 hours a day with FXOpen. Take advantage of low commissions, deep liquidity, and spreads from 0.0 pips. Open your FXOpen account now or learn more about trading forex with FXOpen.
CFDs are complex instruments and come with a high risk of losing your money.
This article represents the opinion of the Companies operating under the FXOpen brand only. It is not to be construed as an offer, solicitation, or recommendation with respect to products and services provided by the Companies operating under the FXOpen brand, nor is it to be considered financial advice.
USD/CAD Retracts from Nearly 2-Month High
Yesterday, the USD/CAD exchange rate climbed above 1.3785 for the first time since mid-April.
However, today's USD/CAD chart shows that it failed to consolidate at this peak and has dropped to a weekly low.
These fluctuations might be interpreted as traders positioning themselves ahead of today's critical events. According to ForexFactory:
- At 15:30 GMT+3, US inflation data will be released;
- At 21:00 GMT+3, the Fed's interest rate decision will be announced;
- At 21:30 GMT+3, Powell's press conference will take place.
Technical analysis of the USD/CAD chart:
- The price made a false bullish breakout of the 1.3785 level, which is a bearish signal;
- The red arrow indicates a bearish engulfing pattern that formed during this failed breakout;
- The proximity to the psychological level of 1.3800 may have influenced the increase in selling pressure.
In any case, the USD/CAD rate is heading downwards today towards the triangle with its median around the 1.368 level, reflecting market sentiment ahead of the news. The 1.37370 level (former resistance) might provide market support.
What to expect?
Considering that the Bank of Canada and the ECB already cut interest rates last week (as we reported here and here), it is possible that the Fed will also lean dovish, continuing the rate-cutting cycle. If so, this could weaken the USD relative to other currencies.
Prepare for spikes in market volatility today.
Trade over 50 forex markets 24 hours a day with FXOpen. Take advantage of low commissions, deep liquidity, and spreads from 0.0 pips. Open your FXOpen account now or learn more about trading forex with FXOpen.
CFDs are complex instruments and come with a high risk of losing your money.
This article represents the opinion of the Companies operating under the FXOpen brand only. It is not to be construed as an offer, solicitation, or recommendation with respect to products and services provided by the Companies operating under the FXOpen brand, nor is it to be considered financial advice.
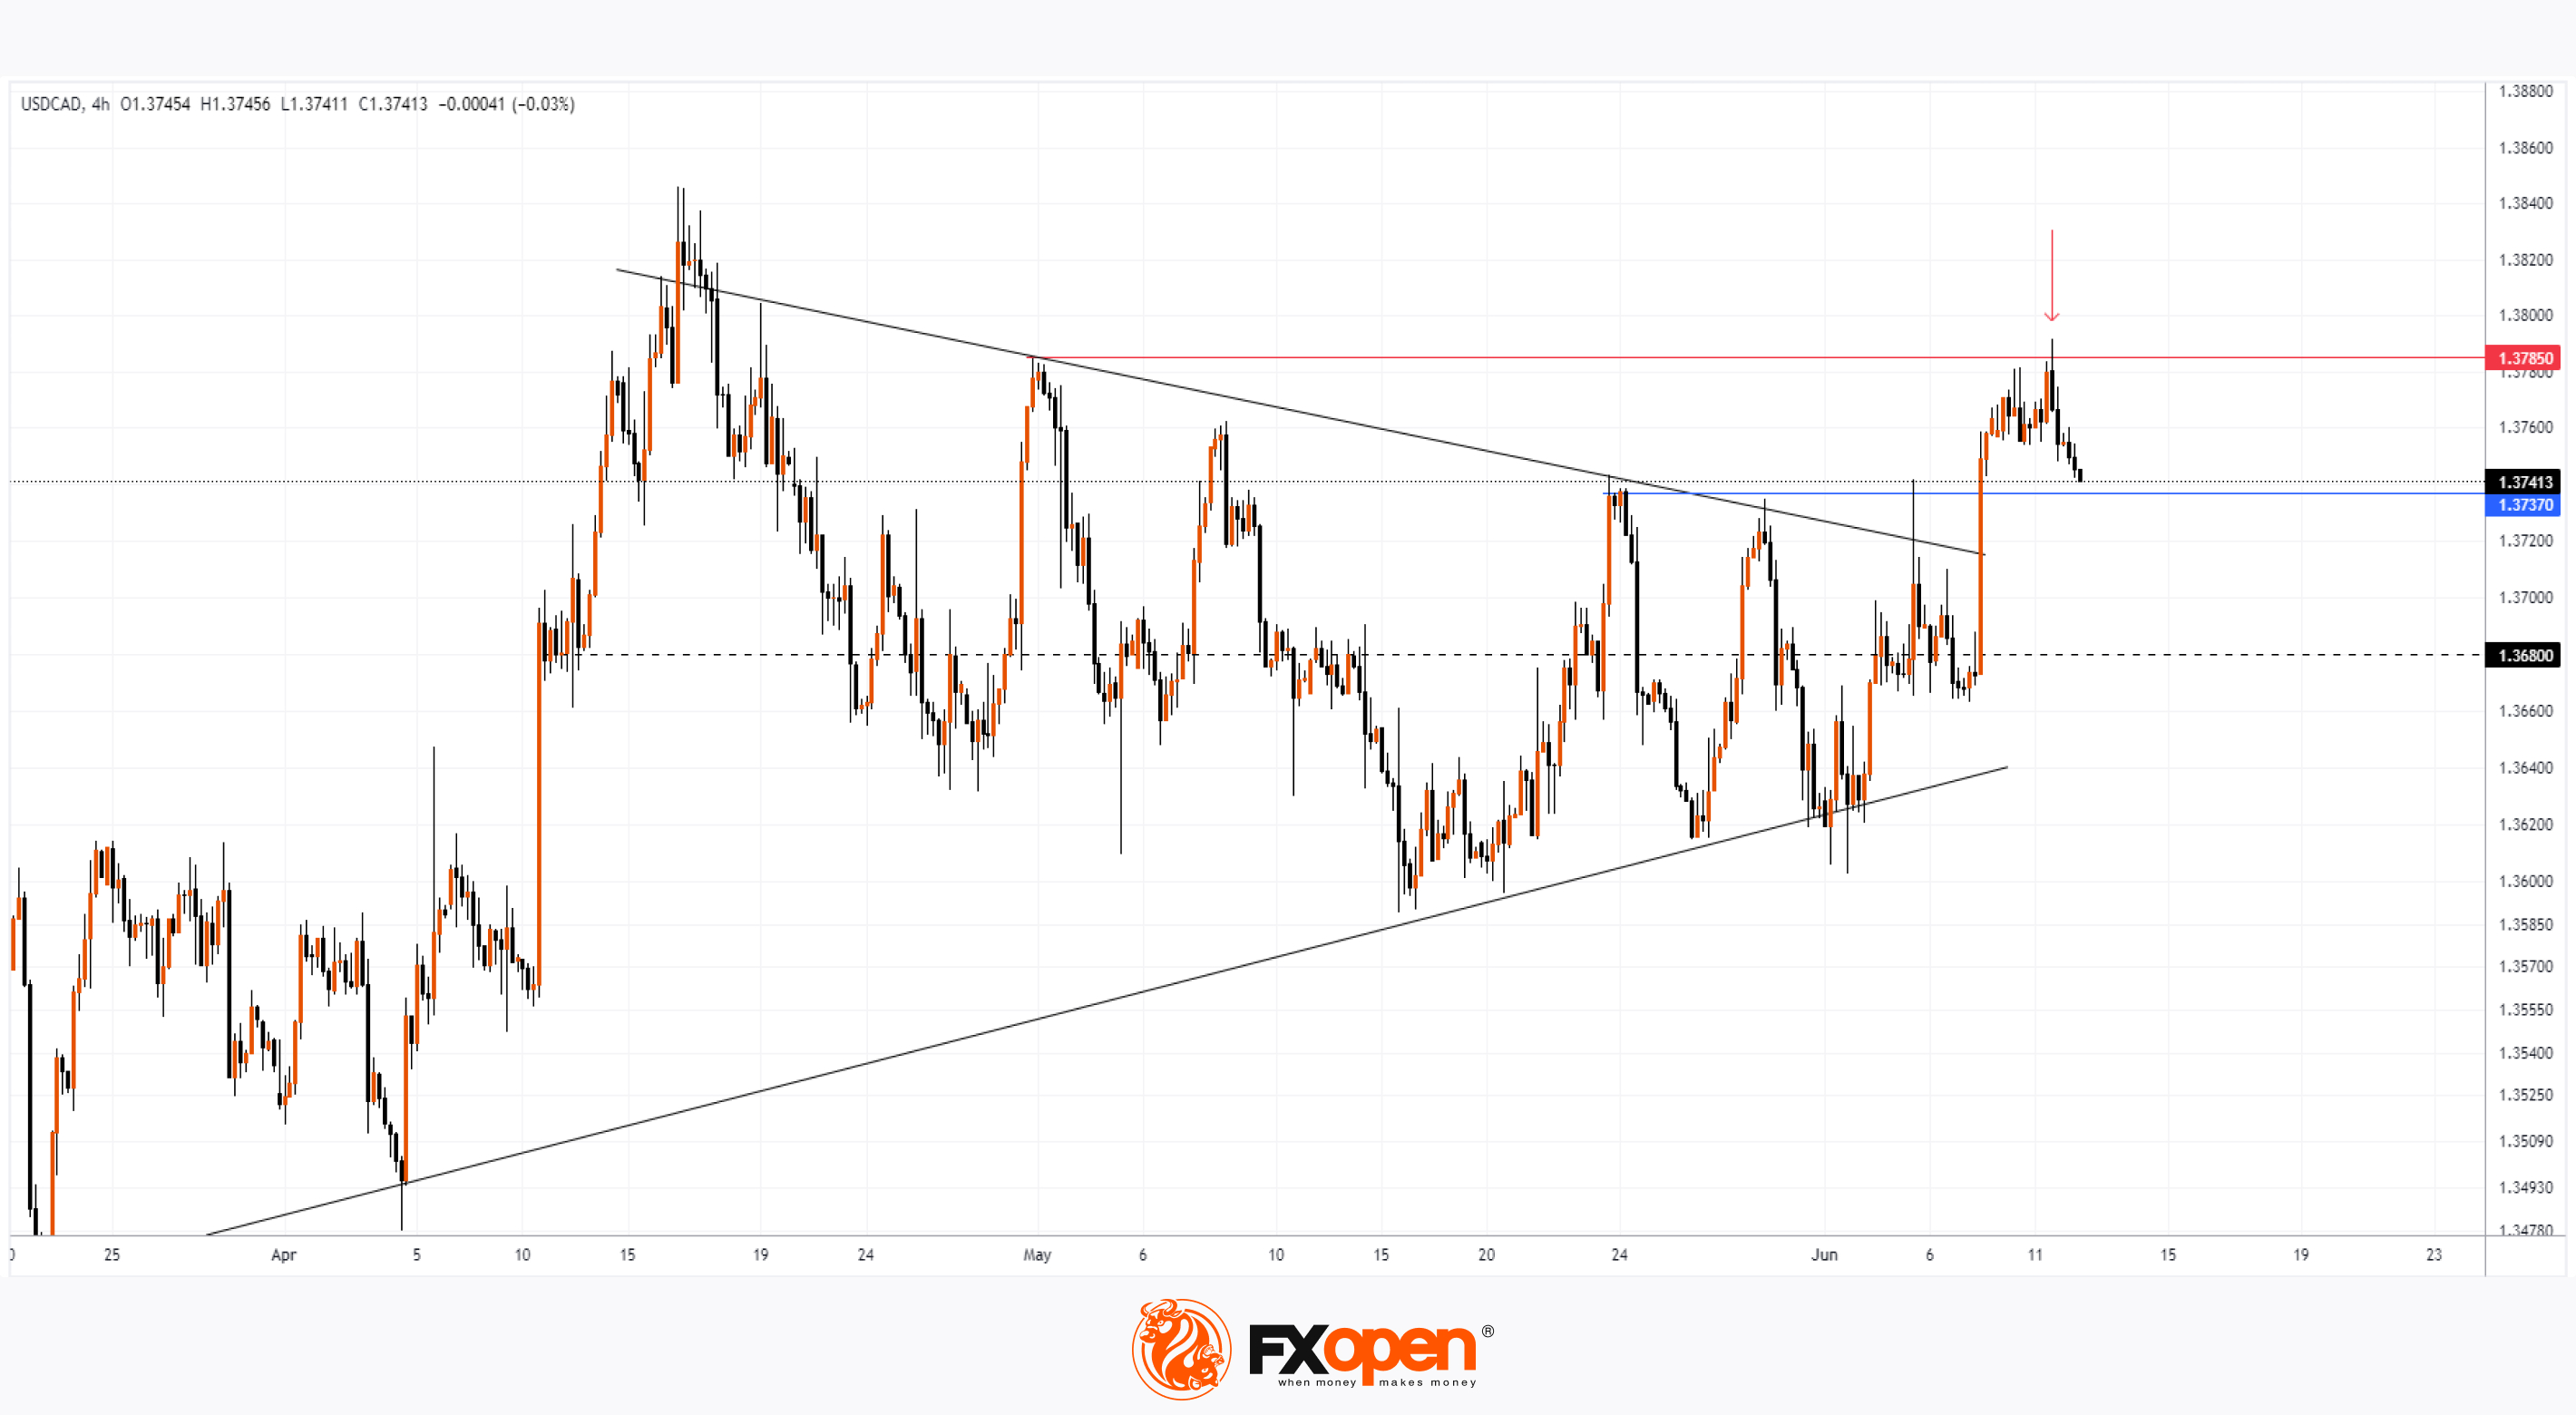
👍2