#marketanalysis #EURUSD #forextrading
EURUSD Analysis: New Test for Support Level of 1.0500
Yesterday, another indicator of inflation in the United States was published — the CPI (Consumer Price Index). Like the PPI (Producer Price Index), the values of which were published on Wednesday, the CPI index indicated that inflation in the US remains stable (actual = 3.7%, forecast = 3.6%, a month earlier = 3.7%, two months earlier = 3.2%), however, this time, the reaction of market participants was sharper:
→ the stock market declined;
→ gold fell in price (although buyers in the Asian session on Friday contributed to the recovery);
→ the dollar index rose sharply.
Before the publication of news about inflation, the probability of a rate hike at the December Fed meeting was at 28%, but now it is 40%. The thesis “higher rates for a longer time” has returned to relevance.
For a technical analyst, changes in sentiment and spikes in volatility provide a new piece of valuable information. Let's take the EUR/USD chart for example.
Yesterday's news reversed the course from top to bottom, with the price of the euro falling towards the important level of 1.0500:
→ it is a round level, so it has a psychological effect;
→ at the end of September (A), level 1.05 served as a support for a rebound to top B;
→ after a slight dip below the 1.05 level in October, which can be interpreted as a false bearish breakout, the bulls demonstrated the ability to form a C→D rally — quite stable for the current downward channel (shown in blue).
The bearish impulse that appeared after yesterday's news created intrigue — will the level of 1.05 be able to resist? If yes, we can see the inverted head-and-shoulders pattern as the basis for an upward exit from a protracted bearish trend.
To benefit from trends in the currency markets, consider enlisting the services of a trusted broker like FXOpen.
CFDs are complex instruments and come with a high risk of losing your money.
This article represents the opinion of the Companies operating under the FXOpen brand only. It is not to be construed as an offer, solicitation, or recommendation with respect to products and services provided by the Companies operating under the FXOpen brand, nor is it to be considered financial advice.
EURUSD Analysis: New Test for Support Level of 1.0500
Yesterday, another indicator of inflation in the United States was published — the CPI (Consumer Price Index). Like the PPI (Producer Price Index), the values of which were published on Wednesday, the CPI index indicated that inflation in the US remains stable (actual = 3.7%, forecast = 3.6%, a month earlier = 3.7%, two months earlier = 3.2%), however, this time, the reaction of market participants was sharper:
→ the stock market declined;
→ gold fell in price (although buyers in the Asian session on Friday contributed to the recovery);
→ the dollar index rose sharply.
Before the publication of news about inflation, the probability of a rate hike at the December Fed meeting was at 28%, but now it is 40%. The thesis “higher rates for a longer time” has returned to relevance.
For a technical analyst, changes in sentiment and spikes in volatility provide a new piece of valuable information. Let's take the EUR/USD chart for example.
Yesterday's news reversed the course from top to bottom, with the price of the euro falling towards the important level of 1.0500:
→ it is a round level, so it has a psychological effect;
→ at the end of September (A), level 1.05 served as a support for a rebound to top B;
→ after a slight dip below the 1.05 level in October, which can be interpreted as a false bearish breakout, the bulls demonstrated the ability to form a C→D rally — quite stable for the current downward channel (shown in blue).
The bearish impulse that appeared after yesterday's news created intrigue — will the level of 1.05 be able to resist? If yes, we can see the inverted head-and-shoulders pattern as the basis for an upward exit from a protracted bearish trend.
To benefit from trends in the currency markets, consider enlisting the services of a trusted broker like FXOpen.
CFDs are complex instruments and come with a high risk of losing your money.
This article represents the opinion of the Companies operating under the FXOpen brand only. It is not to be construed as an offer, solicitation, or recommendation with respect to products and services provided by the Companies operating under the FXOpen brand, nor is it to be considered financial advice.
#marketanalysis #oilprices #oilindustry
Market Analysis: The Probability of Oil Prices Rising to $100 Is Increasing
This week, Saudi energy minister Prince Abdulaziz bin Salman visited Moscow to discuss plans for oil production in the context of the Israeli-Palestinian conflict. The Russian president announced that Saudi Arabia and Russia's production cuts are "likely" to continue.
Meanwhile, Magid Shenouda, deputy chief executive of commodities trading giant Mercuria, told the industry conference in the UAE that oil prices could reach USD 100 a barrel if the situation in the Middle East worsens.
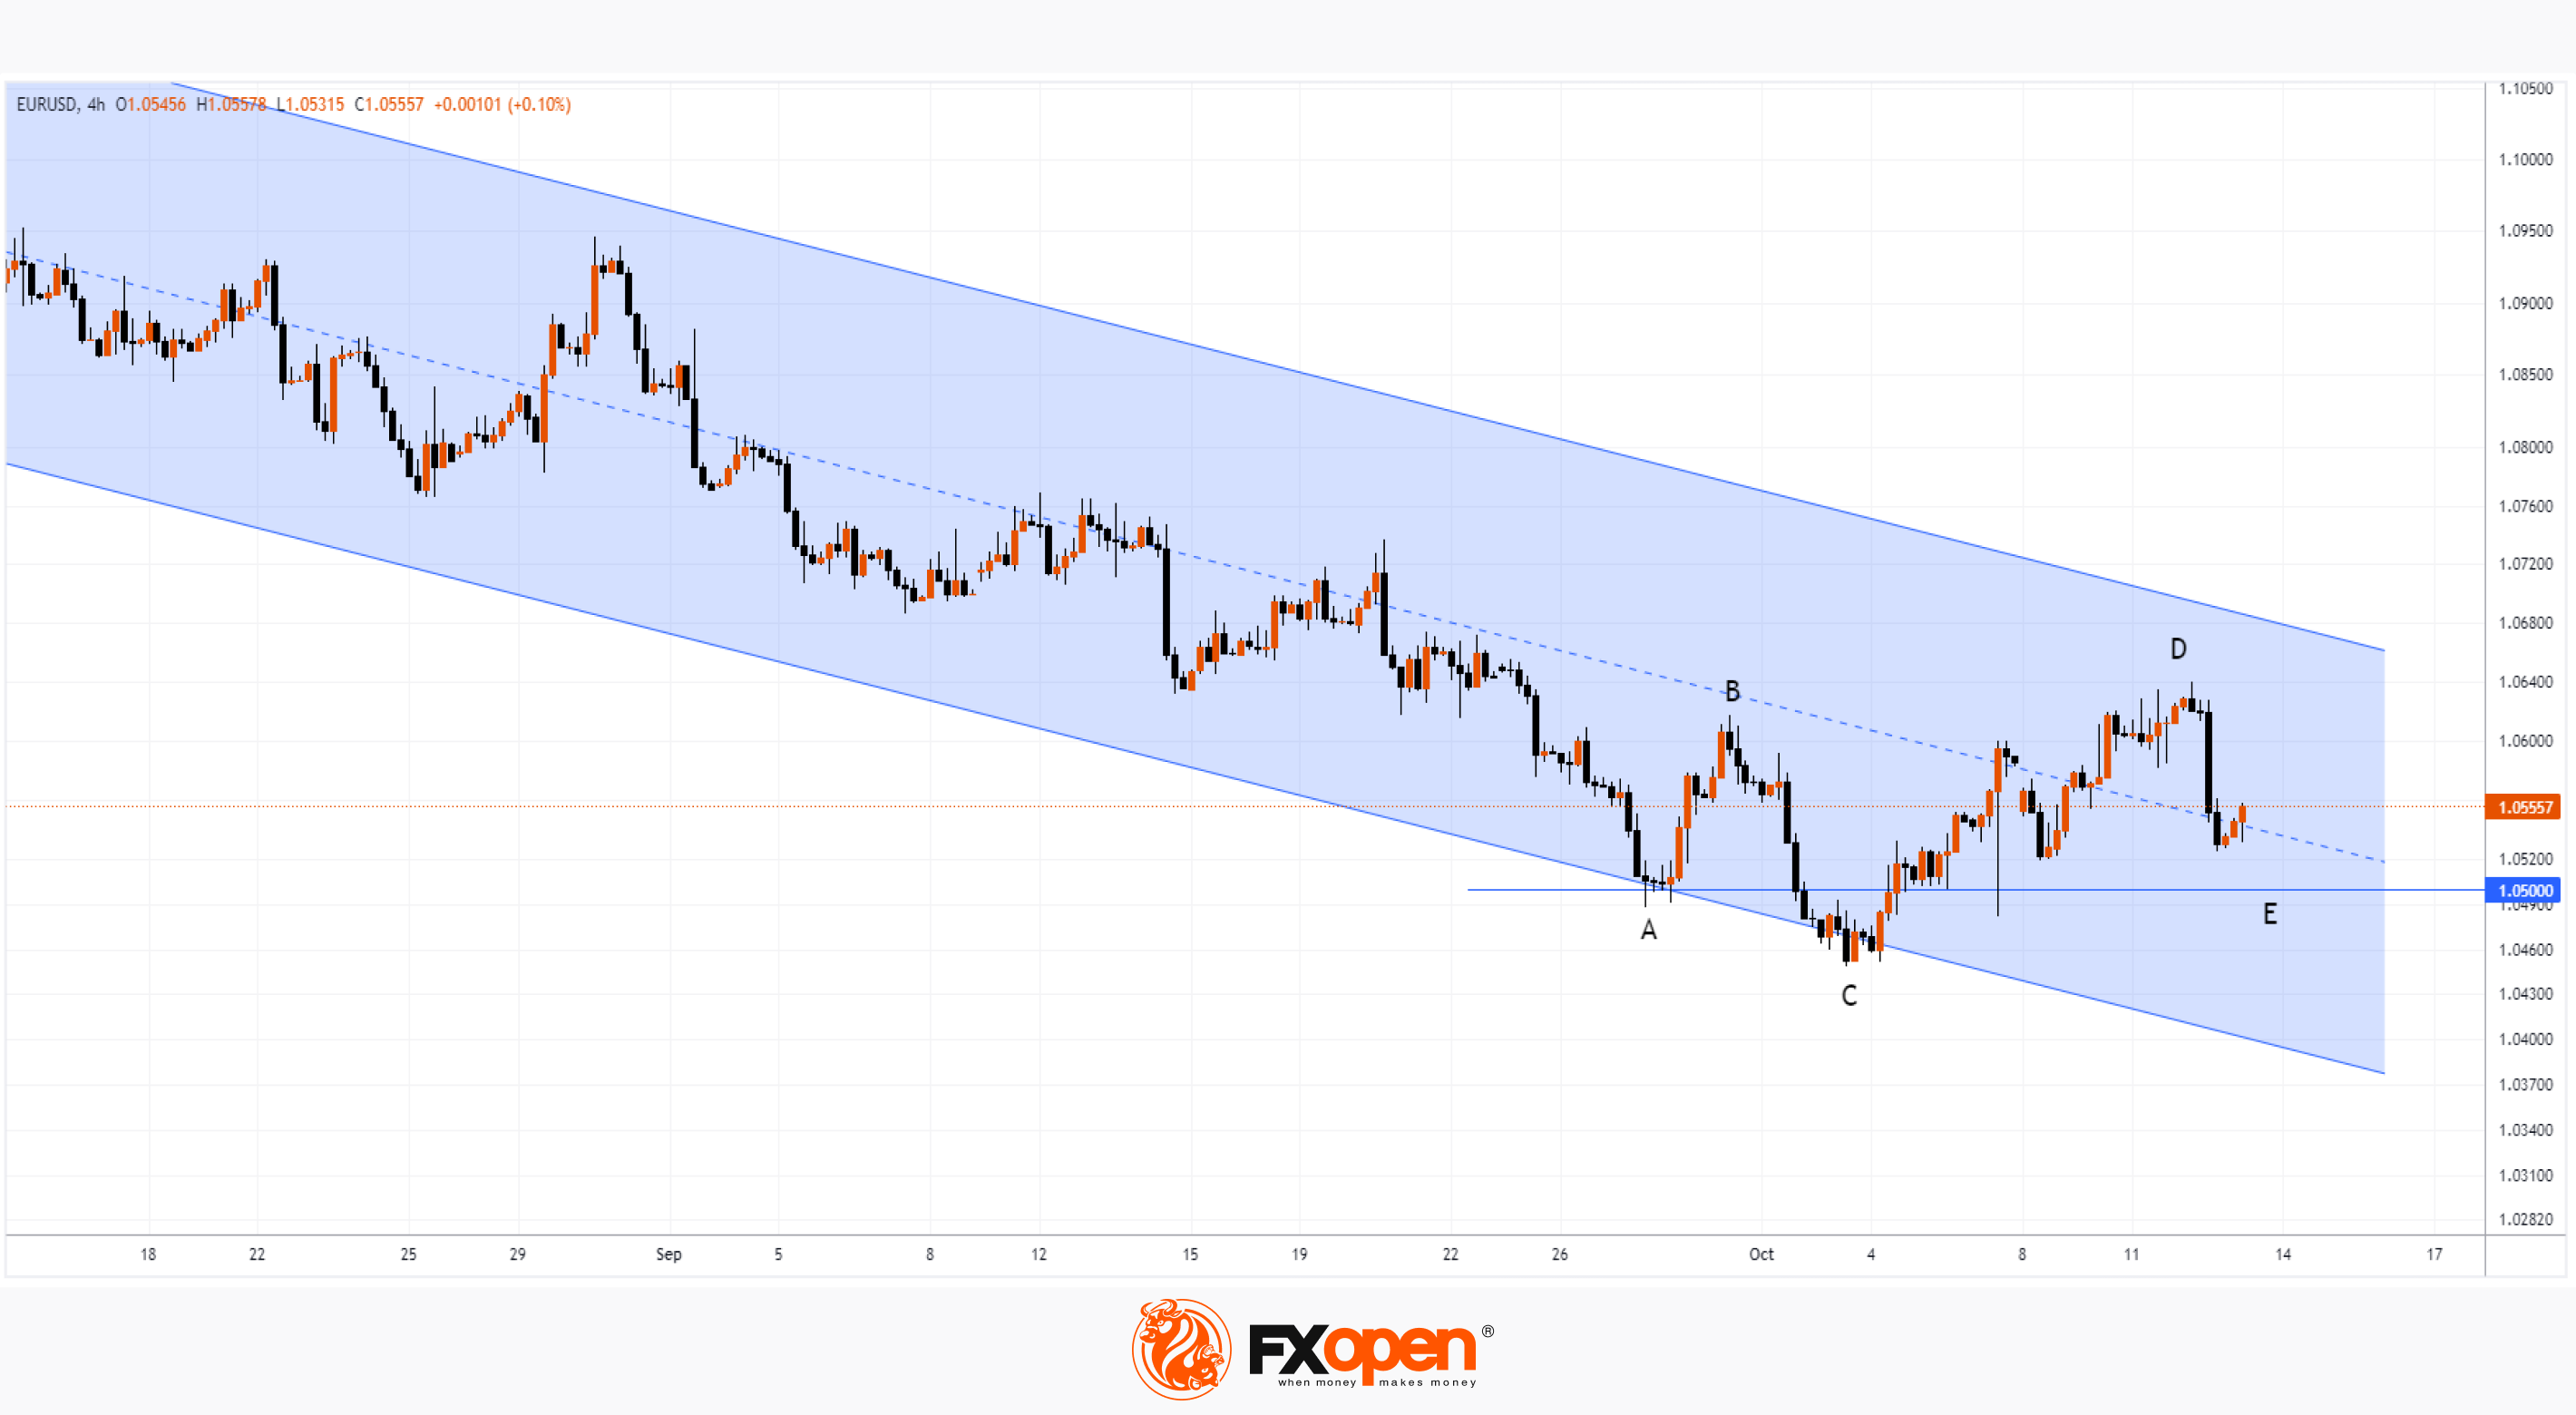
The chart shows that USD 100 a barrel has become more likely due to price action:
→ in August, a range was formed (shown in purple), from which the price moved up, indicating that demand had gained dominance over supply. And it looks like this zone may provide support to the bulls;
→ bulls can also count on support from the lower border of the parallel channel (shown in blue) and events this week show that this line provides significant support;
→ the price closed the bullish gap of Monday – from the point of view of technical analysis, the chances of growth have increased.
The weekend is approaching. If the coming days also bring an escalation in Israel, it is possible that this will give a new impetus to the price towards the psychological mark of USD 100 per barrel.
To benefit from fluctuations in oil and gas prices, consider enlisting the services of a trusted broker like FXOpen.
CFDs are complex instruments and come with a high risk of losing your money.
This article represents the opinion of the Companies operating under the FXOpen brand only. It is not to be construed as an offer, solicitation, or recommendation with respect to products and services provided by the Companies operating under the FXOpen brand, nor is it to be considered financial advice.
Market Analysis: The Probability of Oil Prices Rising to $100 Is Increasing
This week, Saudi energy minister Prince Abdulaziz bin Salman visited Moscow to discuss plans for oil production in the context of the Israeli-Palestinian conflict. The Russian president announced that Saudi Arabia and Russia's production cuts are "likely" to continue.
Meanwhile, Magid Shenouda, deputy chief executive of commodities trading giant Mercuria, told the industry conference in the UAE that oil prices could reach USD 100 a barrel if the situation in the Middle East worsens.
The chart shows that USD 100 a barrel has become more likely due to price action:
→ in August, a range was formed (shown in purple), from which the price moved up, indicating that demand had gained dominance over supply. And it looks like this zone may provide support to the bulls;
→ bulls can also count on support from the lower border of the parallel channel (shown in blue) and events this week show that this line provides significant support;
→ the price closed the bullish gap of Monday – from the point of view of technical analysis, the chances of growth have increased.
The weekend is approaching. If the coming days also bring an escalation in Israel, it is possible that this will give a new impetus to the price towards the psychological mark of USD 100 per barrel.
To benefit from fluctuations in oil and gas prices, consider enlisting the services of a trusted broker like FXOpen.
CFDs are complex instruments and come with a high risk of losing your money.
This article represents the opinion of the Companies operating under the FXOpen brand only. It is not to be construed as an offer, solicitation, or recommendation with respect to products and services provided by the Companies operating under the FXOpen brand, nor is it to be considered financial advice.
#oilprices #MarketNews #israelconflict #sp500 #goldprice
Weekly Market Wrap With Gary Thomson: OIL & ISRAEL-GAZA CONFLICT , S&P 500 POSITIVE, GOLD RISEN.
Get the latest scoop on the week's hottest headlines, all in one convenient video. Join Gary Thomson, the COO of FXOpen UK, as he breaks down the most significant news reports and shares his expert insights.
🔸 Geopolitical Tensions Rattle Markets: US Stocks Decline, Oil Surges Amid Israel-Gaza Conflict
🔸 E-mini S&P 500 Positive Ahead of Earnings Season #eminiS&P500
🔸 Markets awaiting US inflation data
🔸 The price of gold has risen more than 5% since last Friday
Stay in the know and empower yourself with our short, yet power-packed video. Watch it now and stay updated with FXOpen.
Don't miss out on this invaluable opportunity to sharpen your trading skills and make informed decisions.
https://cutt.ly/awm3cVij
CFDs are complex instruments and come with a high risk of losing your money.
Weekly Market Wrap With Gary Thomson: OIL & ISRAEL-GAZA CONFLICT , S&P 500 POSITIVE, GOLD RISEN.
Get the latest scoop on the week's hottest headlines, all in one convenient video. Join Gary Thomson, the COO of FXOpen UK, as he breaks down the most significant news reports and shares his expert insights.
🔸 Geopolitical Tensions Rattle Markets: US Stocks Decline, Oil Surges Amid Israel-Gaza Conflict
🔸 E-mini S&P 500 Positive Ahead of Earnings Season #eminiS&P500
🔸 Markets awaiting US inflation data
🔸 The price of gold has risen more than 5% since last Friday
Stay in the know and empower yourself with our short, yet power-packed video. Watch it now and stay updated with FXOpen.
Don't miss out on this invaluable opportunity to sharpen your trading skills and make informed decisions.
https://cutt.ly/awm3cVij
CFDs are complex instruments and come with a high risk of losing your money.
YouTube
Weekly Market Wrap With Gary Thomson: OIL & ISRAEL-GAZA CONFLICT , S&P 500 POSITIVE, GOLD RISEN.
Get the latest scoop on the week's hottest headlines, all in one convenient video. Join Gary Thomson, the COO of FXOpen UK, as he breaks down the most significant news reports and shares his expert insights.
- Geopolitical Tensions Rattle Markets: US Stocks…
- Geopolitical Tensions Rattle Markets: US Stocks…
#MarketNews #goldprice #XAUUSD
In One Session, Price of Gold Rose by Approximately $60
The opening price on Friday was around 1,870, the closing price was around 1,930. The reason for the rapid growth of the XAU/USD quote is geopolitical tension. Israeli forces announced a ground operation in the Gaza Strip, which may be why before the weekend the markets were dominated by the forces of demand for gold as a defensive asset.
The Chinese Foreign Ministry said Israel's actions went beyond self-defense. And the famous investor Ray Dalio expressed the opinion that the risk of global war is 50% due to the situation in the Middle East.
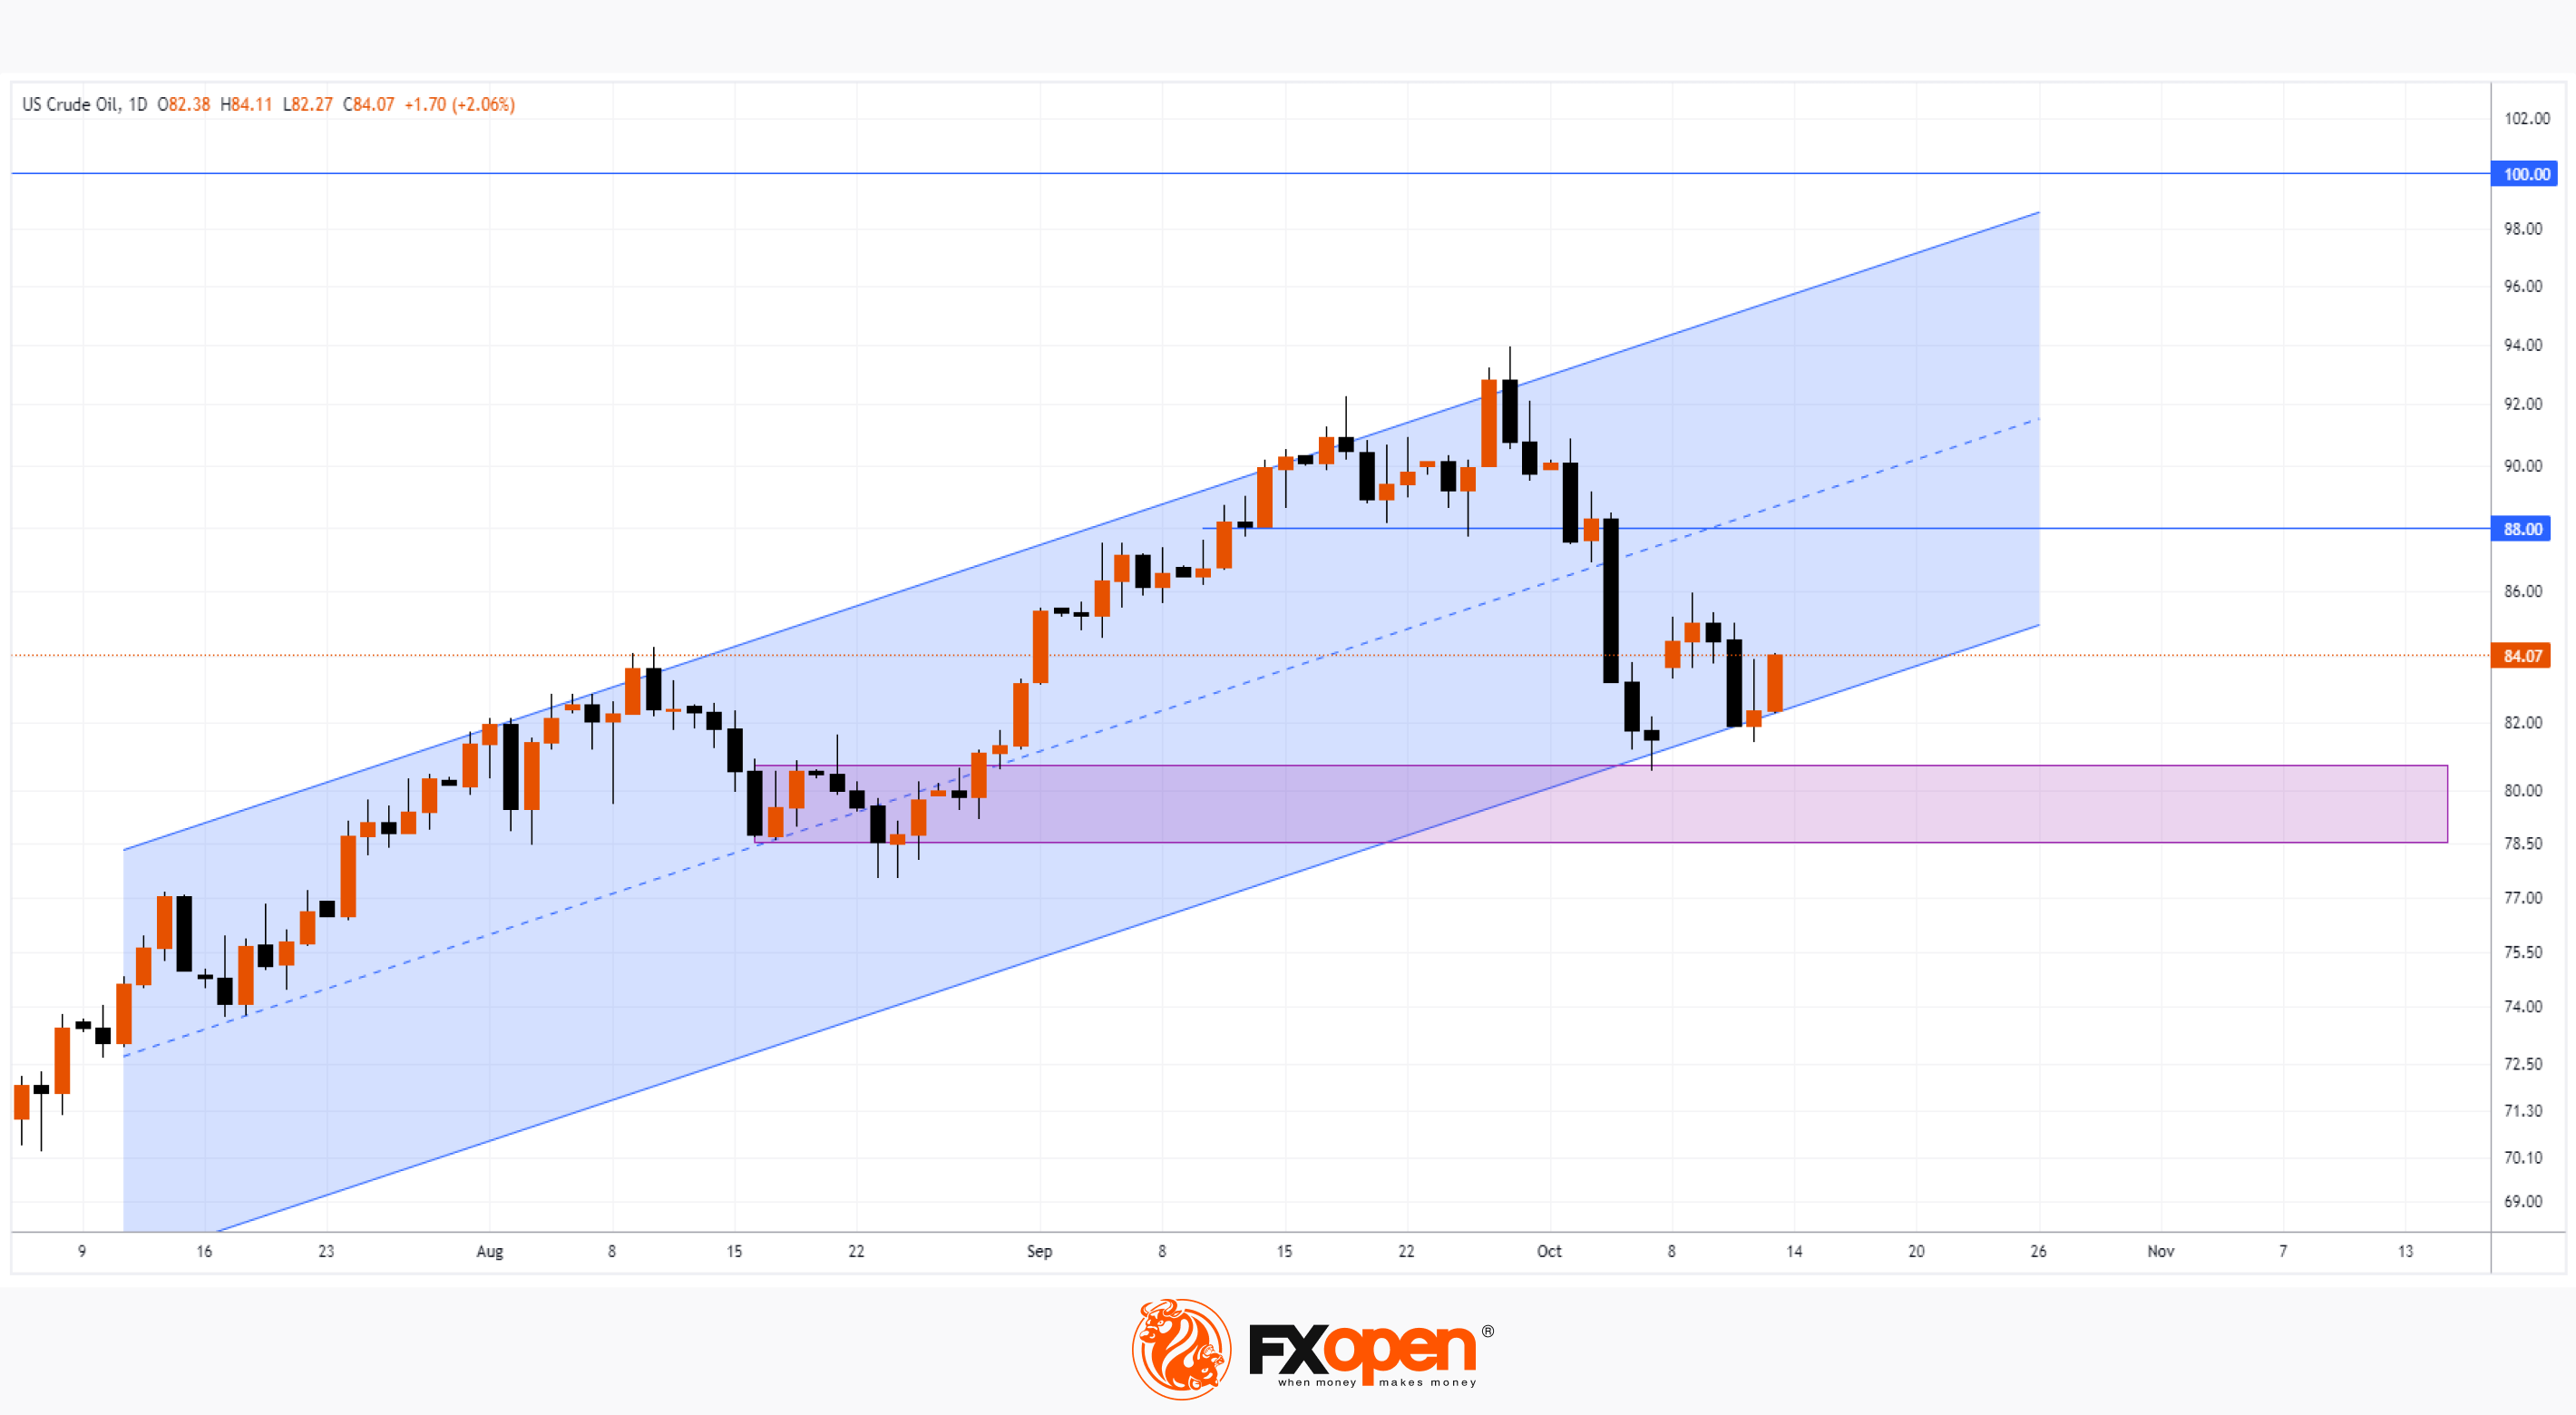
The XAU/USD chart shows that the price of gold has reached the upper limit of the downward channel.
Technically:
→ the price of gold may encounter resistance from the upper border;
→ the price may roll back from the overbought zone, which is indicated by the stochastic oscillator;
→ the price may be supported by the psychological level of 1,900;
→ support may be provided by the level of 1,885; previously the price formed reversals from it.
However, the main driver of the price of gold will likely remain the fundamental factor. Steps aimed at resolving the military conflict will help ensure that the price of gold remains within the descending channel that has been in effect since the first half of the year.
To benefit from trends in the gold market, consider enlisting the services of a trusted broker like FXOpen.
CFDs are complex instruments and come with a high risk of losing your money.
This article represents the opinion of the Companies operating under the FXOpen brand only. It is not to be construed as an offer, solicitation, or recommendation with respect to products and services provided by the Companies operating under the FXOpen brand, nor is it to be considered financial advice.
In One Session, Price of Gold Rose by Approximately $60
The opening price on Friday was around 1,870, the closing price was around 1,930. The reason for the rapid growth of the XAU/USD quote is geopolitical tension. Israeli forces announced a ground operation in the Gaza Strip, which may be why before the weekend the markets were dominated by the forces of demand for gold as a defensive asset.
The Chinese Foreign Ministry said Israel's actions went beyond self-defense. And the famous investor Ray Dalio expressed the opinion that the risk of global war is 50% due to the situation in the Middle East.
The XAU/USD chart shows that the price of gold has reached the upper limit of the downward channel.
Technically:
→ the price of gold may encounter resistance from the upper border;
→ the price may roll back from the overbought zone, which is indicated by the stochastic oscillator;
→ the price may be supported by the psychological level of 1,900;
→ support may be provided by the level of 1,885; previously the price formed reversals from it.
However, the main driver of the price of gold will likely remain the fundamental factor. Steps aimed at resolving the military conflict will help ensure that the price of gold remains within the descending channel that has been in effect since the first half of the year.
To benefit from trends in the gold market, consider enlisting the services of a trusted broker like FXOpen.
CFDs are complex instruments and come with a high risk of losing your money.
This article represents the opinion of the Companies operating under the FXOpen brand only. It is not to be construed as an offer, solicitation, or recommendation with respect to products and services provided by the Companies operating under the FXOpen brand, nor is it to be considered financial advice.
👍1
#marketanalysis #bitcoin #BTCUSD
Market Analysis: Bitcoin Tests Psychological Level of $30k
Paradoxically, cryptocurrencies, which conceptually pursue decentralization goals, have become overly sensitive to regulatory news.
Surprising news from Cointelegraph that the SEC would approve an application for a spot Bitcoin ETF from BlackRock raised the price of the coin to USD 30,000.
The market’s positivity was added by the opinion of SkyBridge Capital founder Anthony Scaramucci, who believes that Bitcoin’s capitalization can with ease reach USD 15 trillion due to the actions of the Fed and global de-dollarization.
On some crypto exchanges, the price of derivatives associated with the main cryptocurrency even significantly exceeded the psychological mark of USD 30k.
However, Cointelegraph later deleted the post.
And on Tuesday morning, the BTC/USD rate consolidated below 29k USD.
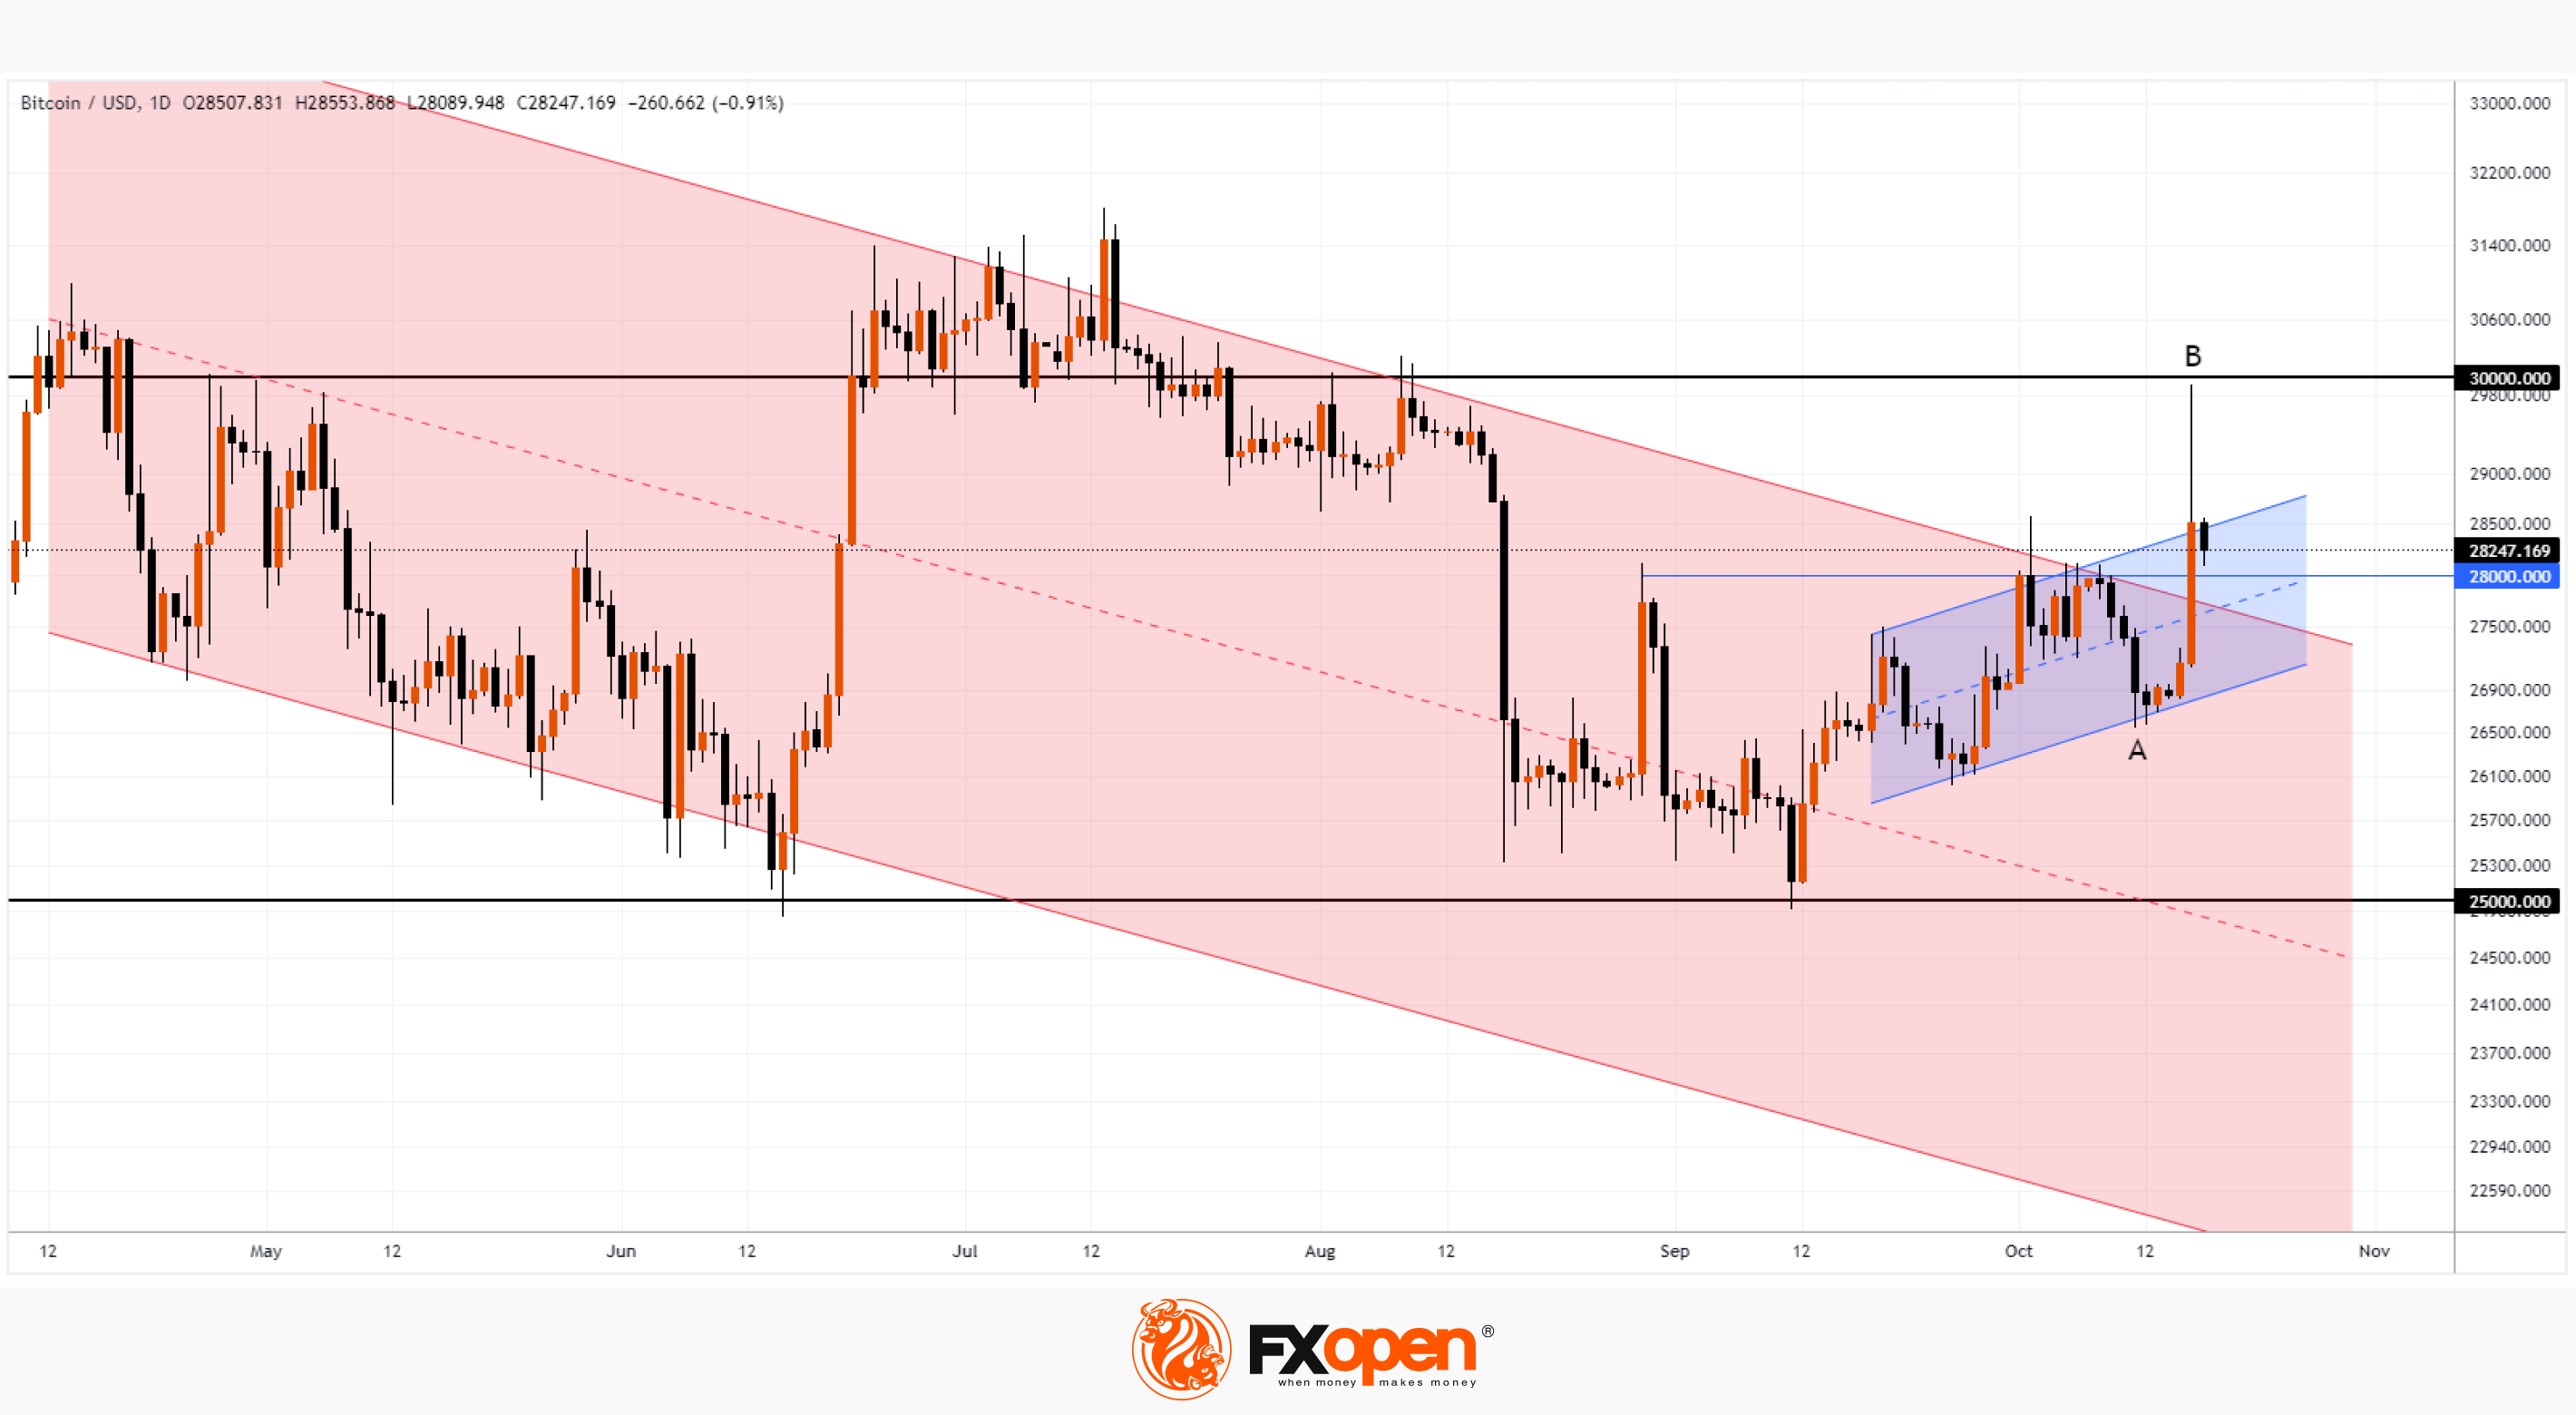
In our October 10 Bitcoin market analysis, we wrote that the price of BTC could rise as part of an uptrend (shown in blue). And what now?
→ the price tested the USD 30k level, and the bears confirmed their presence at this level, pushing it down;
→ the price may find support from the level of 28,000, which previously served as resistance, which was noticeable in the candles from the end of August to the beginning of October;
→ the price decreased by approximately 50% of the increase in A→B.
If the USD 28k level does not help bulls maintain the progress made on the rumored approval of the application from BlackRock, then the price may return to the descending channel (shown in red), making the prospect of reaching a capitalization of USD 15 trillion even more elusive.
To benefit from the rise and fall of cryptocurrency prices, consider enlisting the services of a trusted broker like FXOpen.
CFDs are complex instruments and come with a high risk of losing your money.
This article represents the opinion of the Companies operating under the FXOpen brand only. It is not to be construed as an offer, solicitation, or recommendation with respect to products and services provided by the Companies operating under the FXOpen brand, nor is it to be considered financial advice.
At FXOpen UK and FXOpen AU, Cryptocurrency CFDs are only available for trading by those clients categorised as Professional clients under FCA Rules and Professional clients under ASIC Rules, respectively. They are not available for trading by Retail clients.
Market Analysis: Bitcoin Tests Psychological Level of $30k
Paradoxically, cryptocurrencies, which conceptually pursue decentralization goals, have become overly sensitive to regulatory news.
Surprising news from Cointelegraph that the SEC would approve an application for a spot Bitcoin ETF from BlackRock raised the price of the coin to USD 30,000.
The market’s positivity was added by the opinion of SkyBridge Capital founder Anthony Scaramucci, who believes that Bitcoin’s capitalization can with ease reach USD 15 trillion due to the actions of the Fed and global de-dollarization.
On some crypto exchanges, the price of derivatives associated with the main cryptocurrency even significantly exceeded the psychological mark of USD 30k.
However, Cointelegraph later deleted the post.
And on Tuesday morning, the BTC/USD rate consolidated below 29k USD.
In our October 10 Bitcoin market analysis, we wrote that the price of BTC could rise as part of an uptrend (shown in blue). And what now?
→ the price tested the USD 30k level, and the bears confirmed their presence at this level, pushing it down;
→ the price may find support from the level of 28,000, which previously served as resistance, which was noticeable in the candles from the end of August to the beginning of October;
→ the price decreased by approximately 50% of the increase in A→B.
If the USD 28k level does not help bulls maintain the progress made on the rumored approval of the application from BlackRock, then the price may return to the descending channel (shown in red), making the prospect of reaching a capitalization of USD 15 trillion even more elusive.
To benefit from the rise and fall of cryptocurrency prices, consider enlisting the services of a trusted broker like FXOpen.
CFDs are complex instruments and come with a high risk of losing your money.
This article represents the opinion of the Companies operating under the FXOpen brand only. It is not to be construed as an offer, solicitation, or recommendation with respect to products and services provided by the Companies operating under the FXOpen brand, nor is it to be considered financial advice.
At FXOpen UK and FXOpen AU, Cryptocurrency CFDs are only available for trading by those clients categorised as Professional clients under FCA Rules and Professional clients under ASIC Rules, respectively. They are not available for trading by Retail clients.
👍1
#marketanalysis #NFLX #sp500 #stockmarket
Market Analysis: Wall Street Awaits Earnings from Tesla and Netflix
According to Yahoo Finance, the third-quarter earnings season started well despite the uncertain macroeconomic environment.
Already, 32 companies in the S&P 500 have reported earnings, according to Bank of America Research's equity strategy group. Moreover:
→ actual earnings per share exceeded Wall Street expectations by an average of 9%;
→ EPS increased 1% compared to the same quarter last year, which is a positive sign.
This week's headliners could be reports from Tesla and Netflix, which are important components of the S&P 500 and Nasdaq indices.
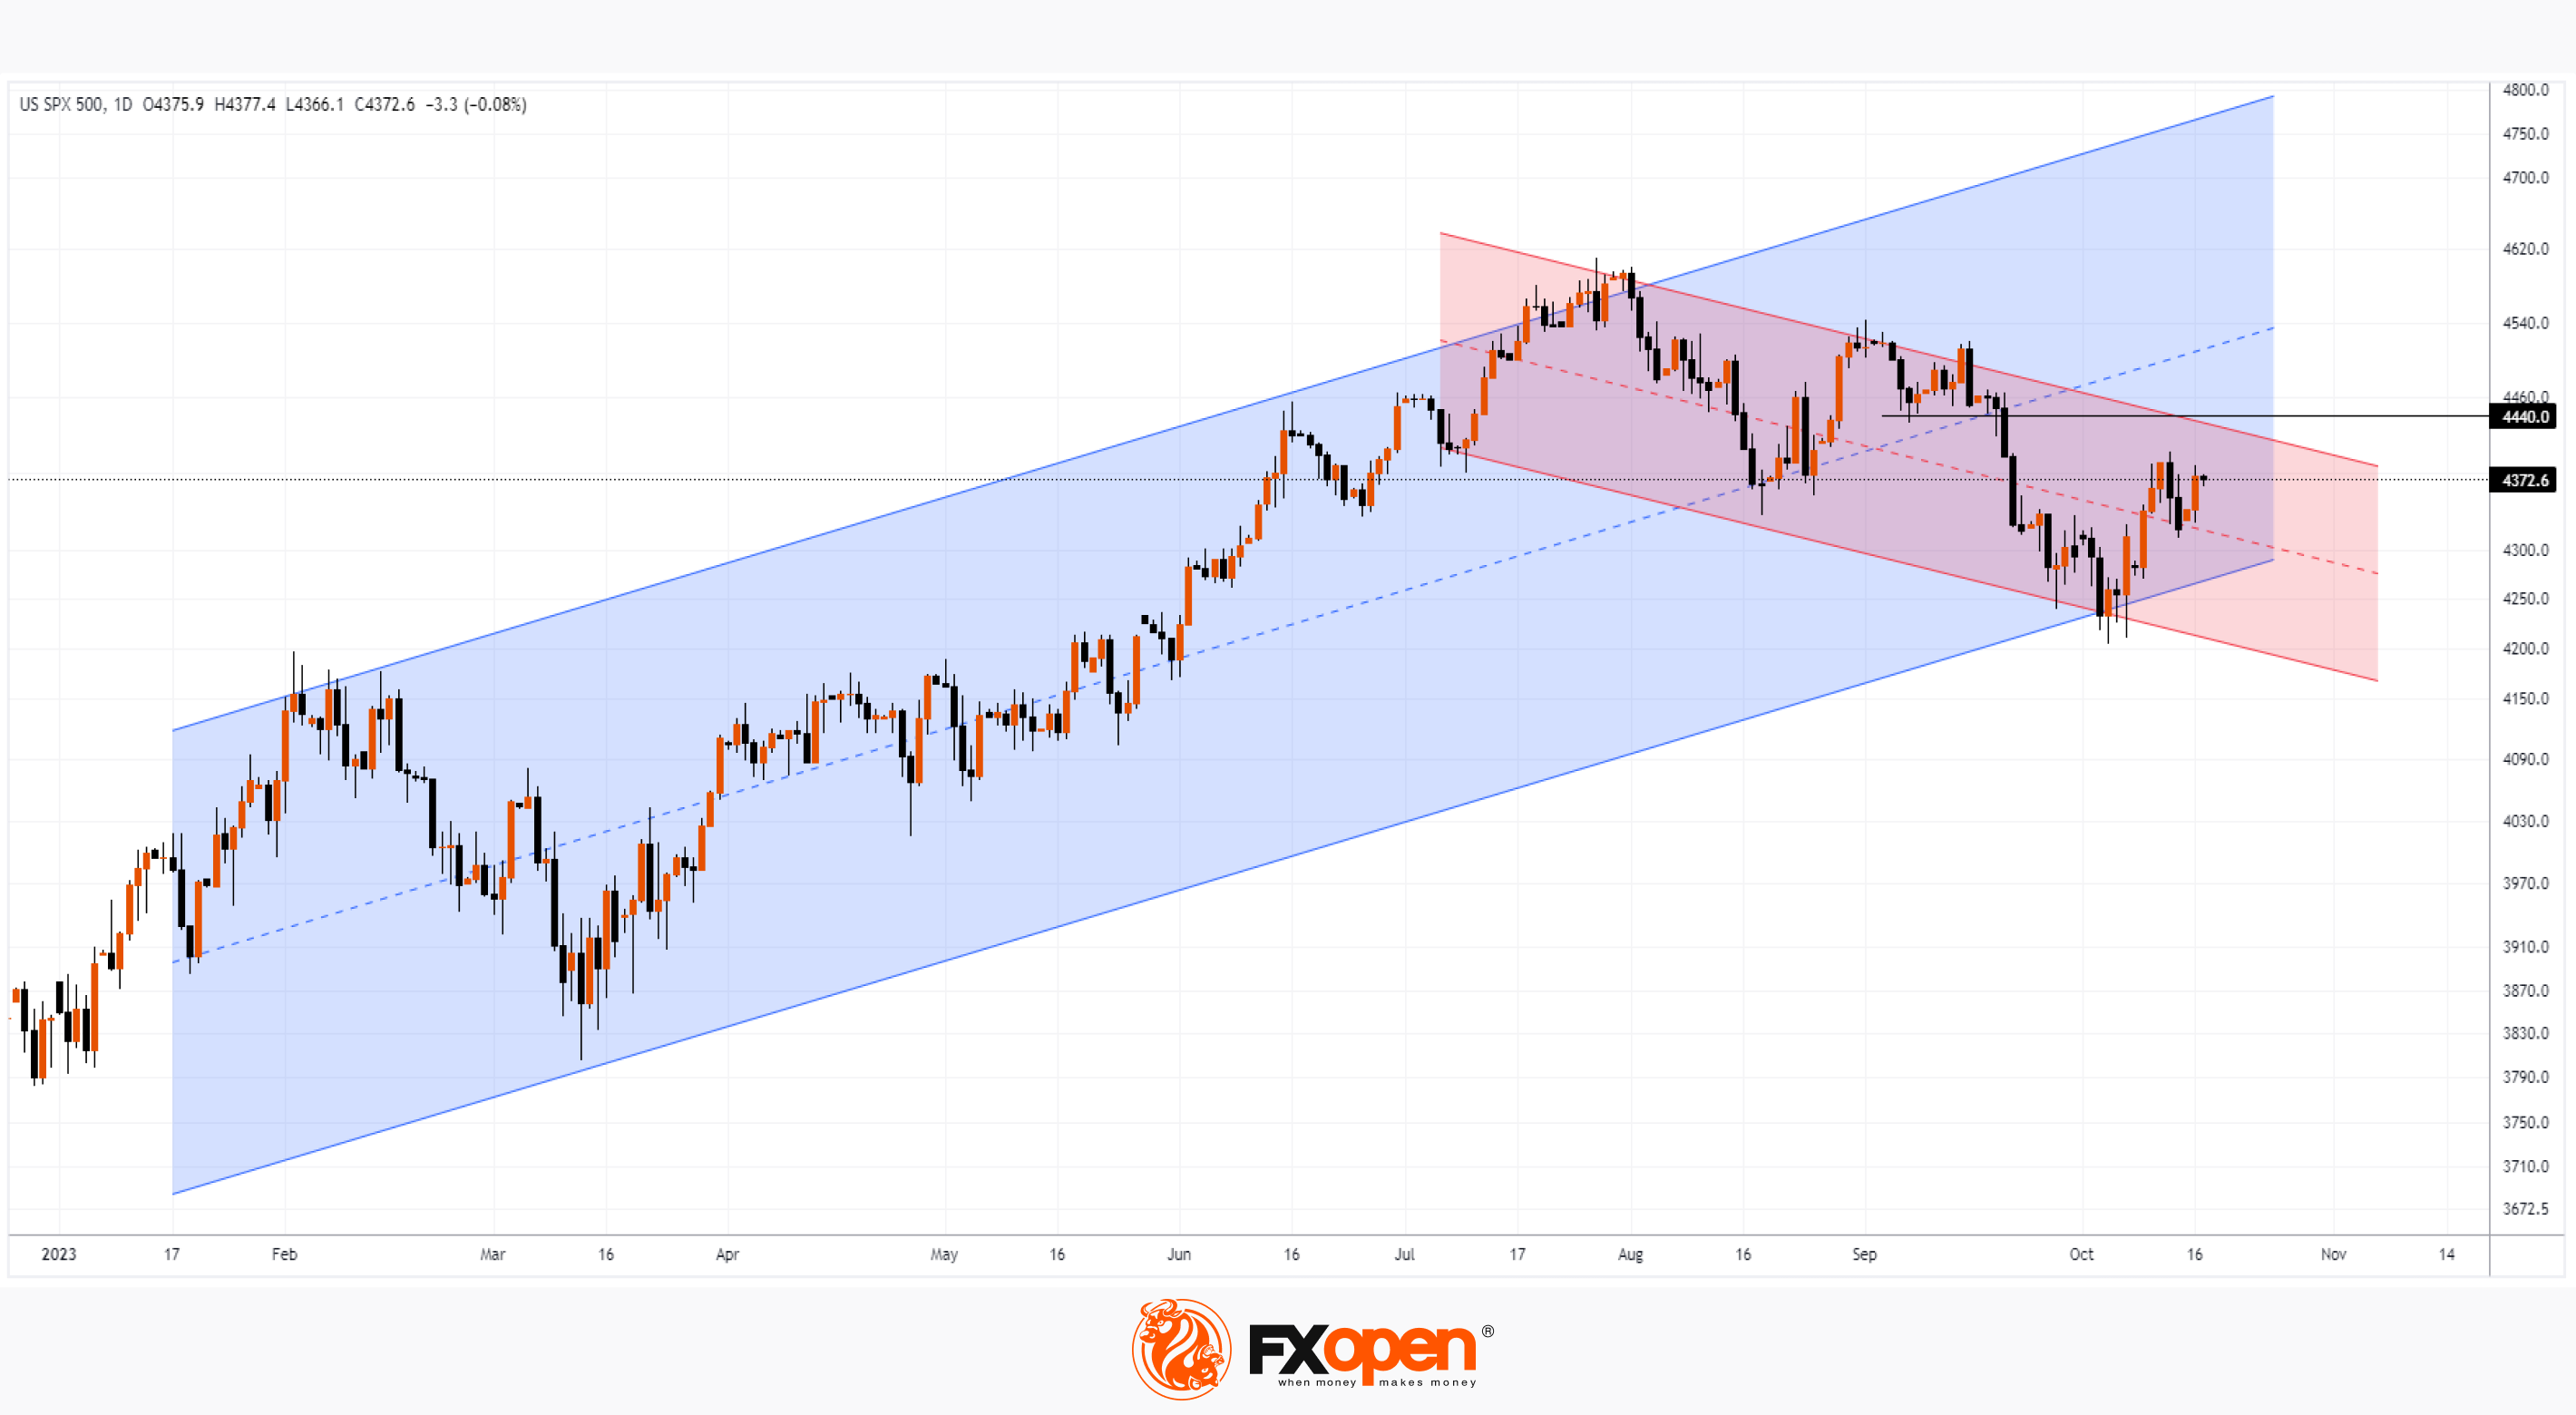
Meanwhile, the S&P 500 Index chart shows its price:
→ pushed off from the lower border of the ascending channel;
→ has already exceeded the median line of the descending channel.
So the decline, which has been going on since early August, could become a technical correction as part of a longer-term rally. Barriers to its resumption may be:
→ upper boundary of the downward channel;
→ level 4,440, which served as support, but was broken by a strong bearish impulse on September 20-21.
Are bulls up to this task? If the news from Tesla and Netflix (expected tomorrow) turns out to be positive, it will help a good earnings season and a corresponding rise in the S&P 500 index amid global tensions.
To benefit from the rise and fall of the S&P 500 index, consider enlisting the services of a trusted broker like FXOpen.
CFDs are complex instruments and come with a high risk of losing your money.
This article represents the opinion of the Companies operating under the FXOpen brand only. It is not to be construed as an offer, solicitation, or recommendation with respect to products and services provided by the Companies operating under the FXOpen brand, nor is it to be considered financial advice.
Market Analysis: Wall Street Awaits Earnings from Tesla and Netflix
According to Yahoo Finance, the third-quarter earnings season started well despite the uncertain macroeconomic environment.
Already, 32 companies in the S&P 500 have reported earnings, according to Bank of America Research's equity strategy group. Moreover:
→ actual earnings per share exceeded Wall Street expectations by an average of 9%;
→ EPS increased 1% compared to the same quarter last year, which is a positive sign.
This week's headliners could be reports from Tesla and Netflix, which are important components of the S&P 500 and Nasdaq indices.
Meanwhile, the S&P 500 Index chart shows its price:
→ pushed off from the lower border of the ascending channel;
→ has already exceeded the median line of the descending channel.
So the decline, which has been going on since early August, could become a technical correction as part of a longer-term rally. Barriers to its resumption may be:
→ upper boundary of the downward channel;
→ level 4,440, which served as support, but was broken by a strong bearish impulse on September 20-21.
Are bulls up to this task? If the news from Tesla and Netflix (expected tomorrow) turns out to be positive, it will help a good earnings season and a corresponding rise in the S&P 500 index amid global tensions.
To benefit from the rise and fall of the S&P 500 index, consider enlisting the services of a trusted broker like FXOpen.
CFDs are complex instruments and come with a high risk of losing your money.
This article represents the opinion of the Companies operating under the FXOpen brand only. It is not to be construed as an offer, solicitation, or recommendation with respect to products and services provided by the Companies operating under the FXOpen brand, nor is it to be considered financial advice.
#marketanalysis #forextrading #GBPUSD
GBP/USD Analysis: Inflation Stabilises, Pound Rises in Price
UK inflation data was released this morning, showing that consumer price inflation (CPI) held steady at 6.7% in September, although economists had expected 6.6%, which would mean the CPI would continue to decline from its peak of 11.1%, achieved at the end of last year.
These data provide evidence to suggest that inflation has stalled. And the Bank of England will have to make another interest rate increase. Tighter monetary policy → more expensive currency. Therefore, the pound reacted to the news that inflation had not changed with short-term growth relative to other currencies.
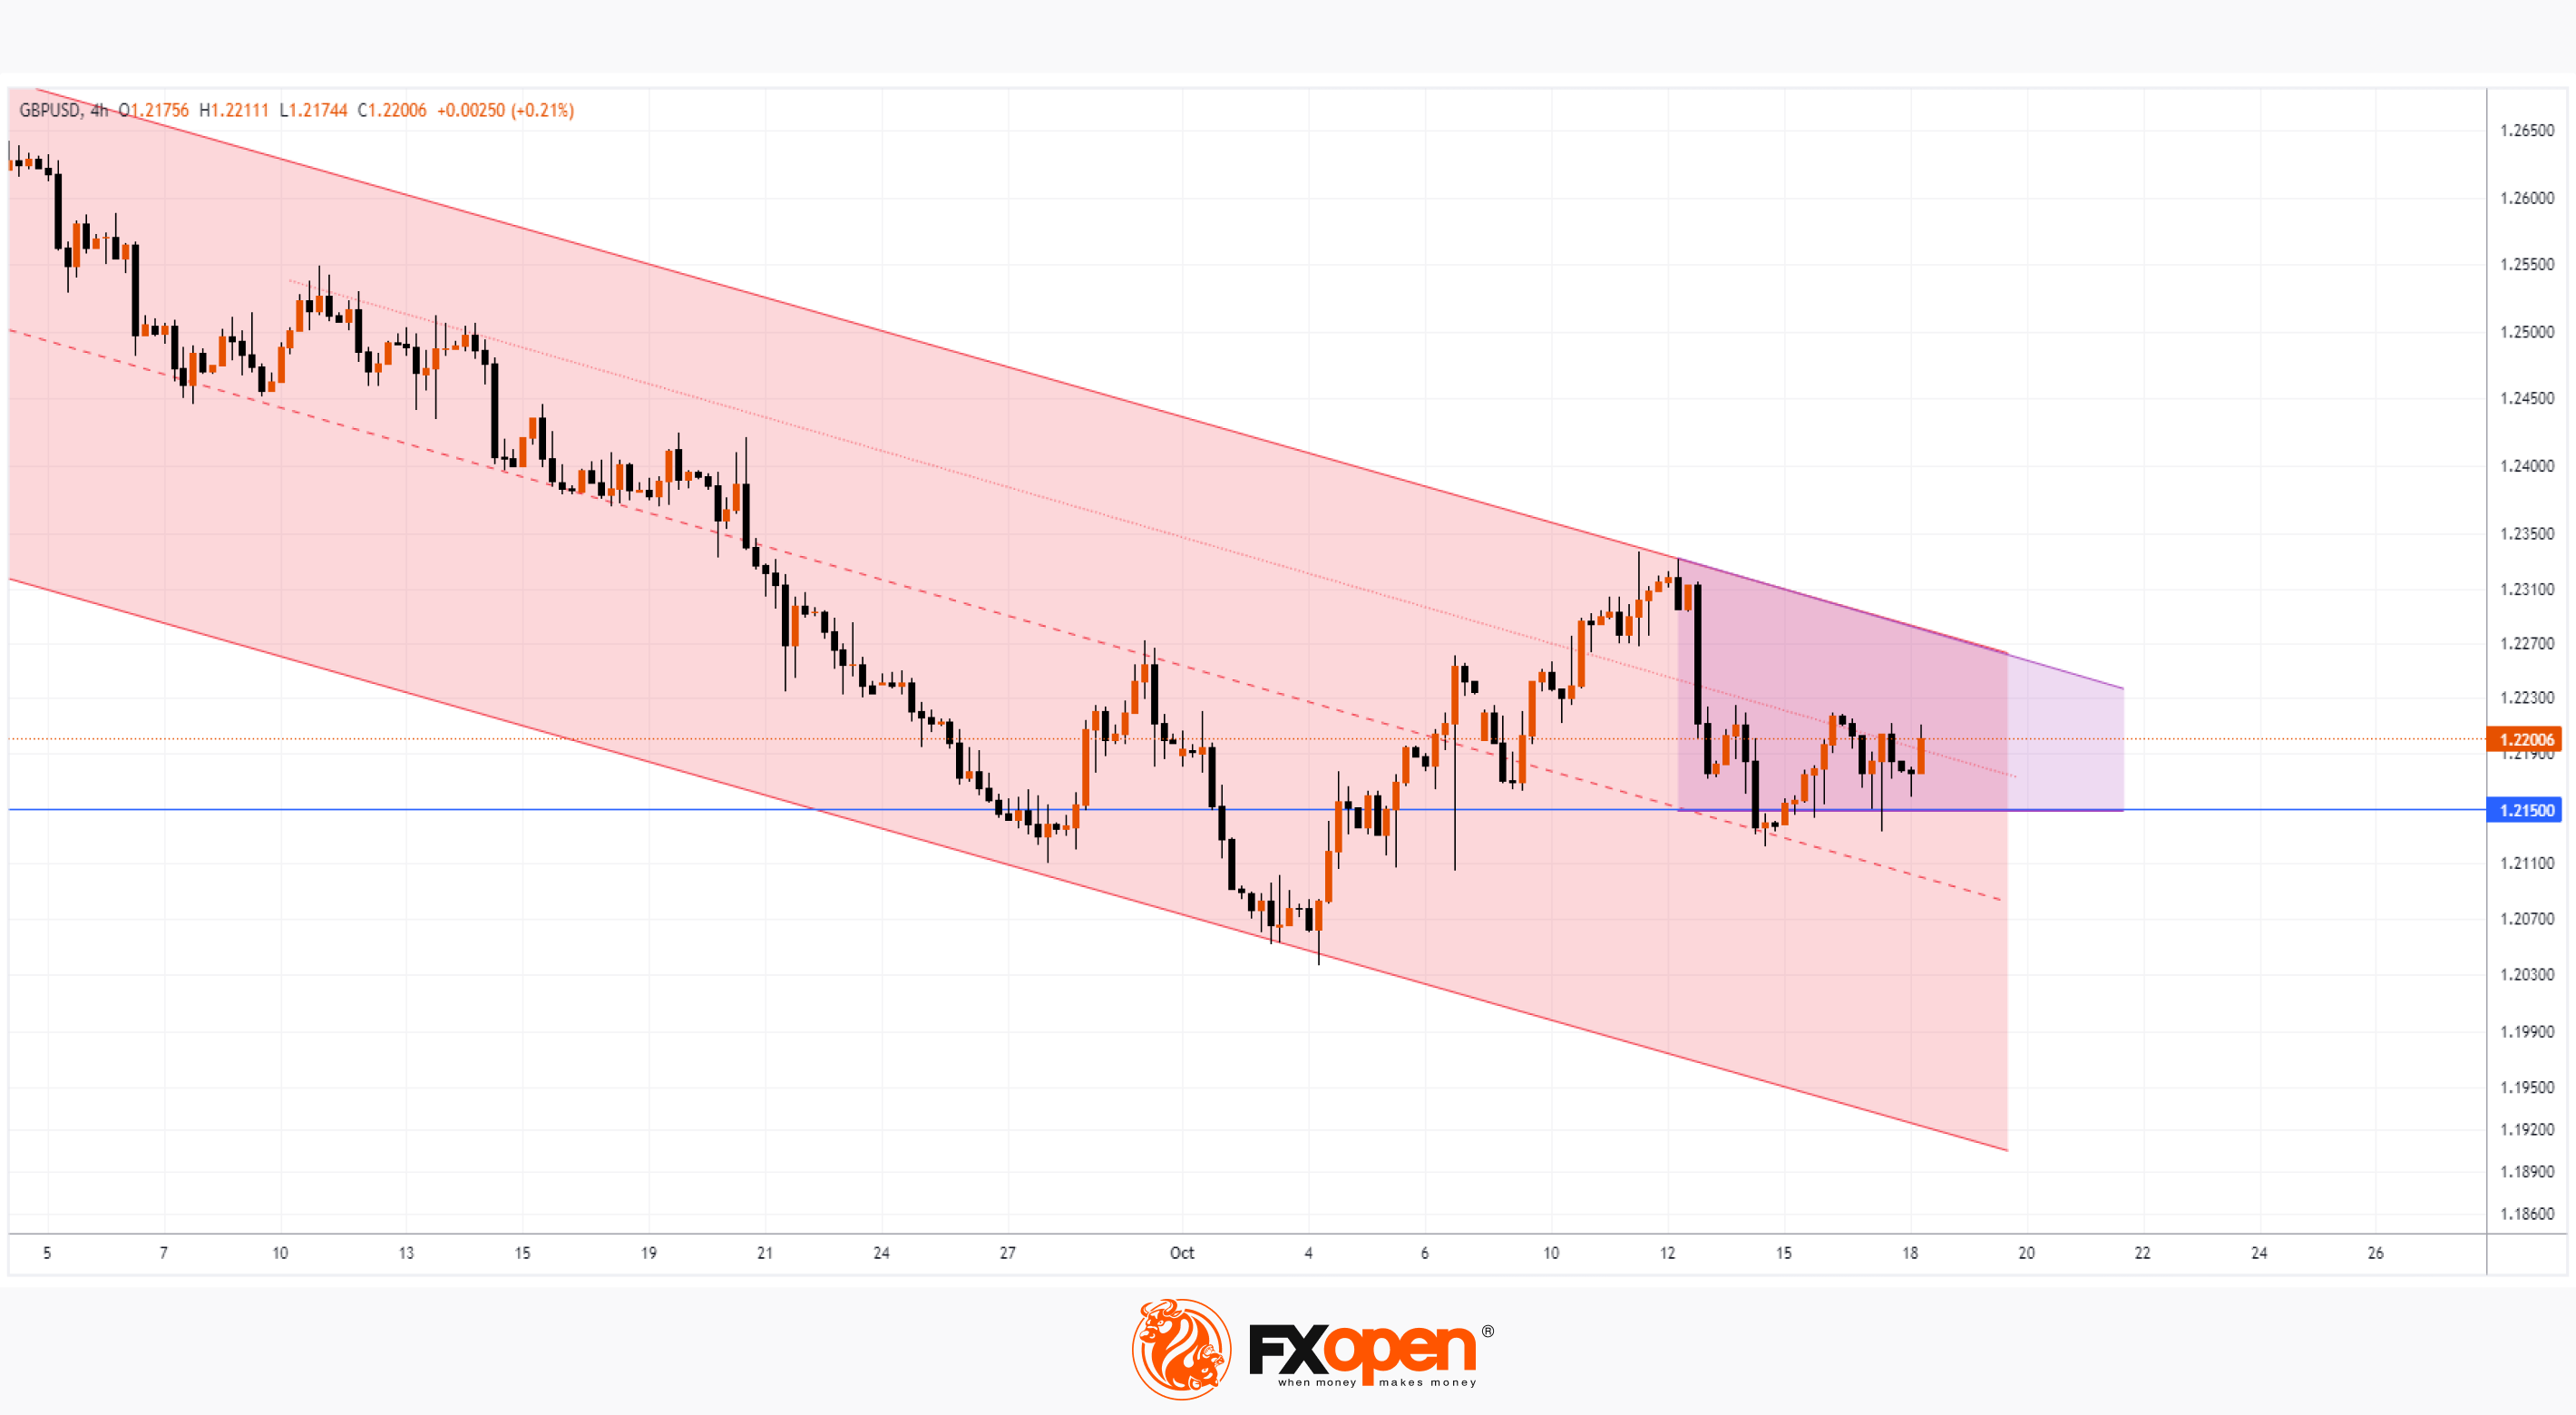
On the GBP/USD chart, a picture emerges indicating that the pound has found important support at the level of 1.215. Judge for yourself:
→ On September 27, the rate dropped lower very uncertainly, but rose very confidently the next day;
→ On October 3, the dive below the level of 1.215 was more significant, but the recovery again was not long in coming. And the bulls were able to lift the GBP/USD rate from the October 4 low by more than 2%;
→ Long lower shadows on the candles (the most noticeable on October 6) indicate demand strength around 1.215;
→ Analysis of the price movement on October 13 shows that this horizontal continues to provide support.
From the bears' point of view, the downward channel is still relevant, but note that its median line is already gaining support properties (judging by the price action at the end of Friday, October 13th).
Considering the facts presented, we can assume that the rate is clamped into a triangle (shown in purple), and if it breaks through, an important impulse can form. Moreover, the drivers for the breakdown may arrive as early as tomorrow: at 15:30 GMT+3, unemployment data in the US will be published, and at 21:00, the head of the Fed will give a speech.
To benefit from the rise and fall of currency rates, consider enlisting the services of a trusted broker like FXOpen.
CFDs are complex instruments and come with a high risk of losing your money.
This article represents the opinion of the Companies operating under the FXOpen brand only. It is not to be construed as an offer, solicitation, or recommendation with respect to products and services provided by the Companies operating under the FXOpen brand, nor is it to be considered financial advice.
GBP/USD Analysis: Inflation Stabilises, Pound Rises in Price
UK inflation data was released this morning, showing that consumer price inflation (CPI) held steady at 6.7% in September, although economists had expected 6.6%, which would mean the CPI would continue to decline from its peak of 11.1%, achieved at the end of last year.
These data provide evidence to suggest that inflation has stalled. And the Bank of England will have to make another interest rate increase. Tighter monetary policy → more expensive currency. Therefore, the pound reacted to the news that inflation had not changed with short-term growth relative to other currencies.
On the GBP/USD chart, a picture emerges indicating that the pound has found important support at the level of 1.215. Judge for yourself:
→ On September 27, the rate dropped lower very uncertainly, but rose very confidently the next day;
→ On October 3, the dive below the level of 1.215 was more significant, but the recovery again was not long in coming. And the bulls were able to lift the GBP/USD rate from the October 4 low by more than 2%;
→ Long lower shadows on the candles (the most noticeable on October 6) indicate demand strength around 1.215;
→ Analysis of the price movement on October 13 shows that this horizontal continues to provide support.
From the bears' point of view, the downward channel is still relevant, but note that its median line is already gaining support properties (judging by the price action at the end of Friday, October 13th).
Considering the facts presented, we can assume that the rate is clamped into a triangle (shown in purple), and if it breaks through, an important impulse can form. Moreover, the drivers for the breakdown may arrive as early as tomorrow: at 15:30 GMT+3, unemployment data in the US will be published, and at 21:00, the head of the Fed will give a speech.
To benefit from the rise and fall of currency rates, consider enlisting the services of a trusted broker like FXOpen.
CFDs are complex instruments and come with a high risk of losing your money.
This article represents the opinion of the Companies operating under the FXOpen brand only. It is not to be construed as an offer, solicitation, or recommendation with respect to products and services provided by the Companies operating under the FXOpen brand, nor is it to be considered financial advice.
#marketanalysis #stockmarket #NFLX
Market Analysis: NFLX Price Soars 12% after Strong Report
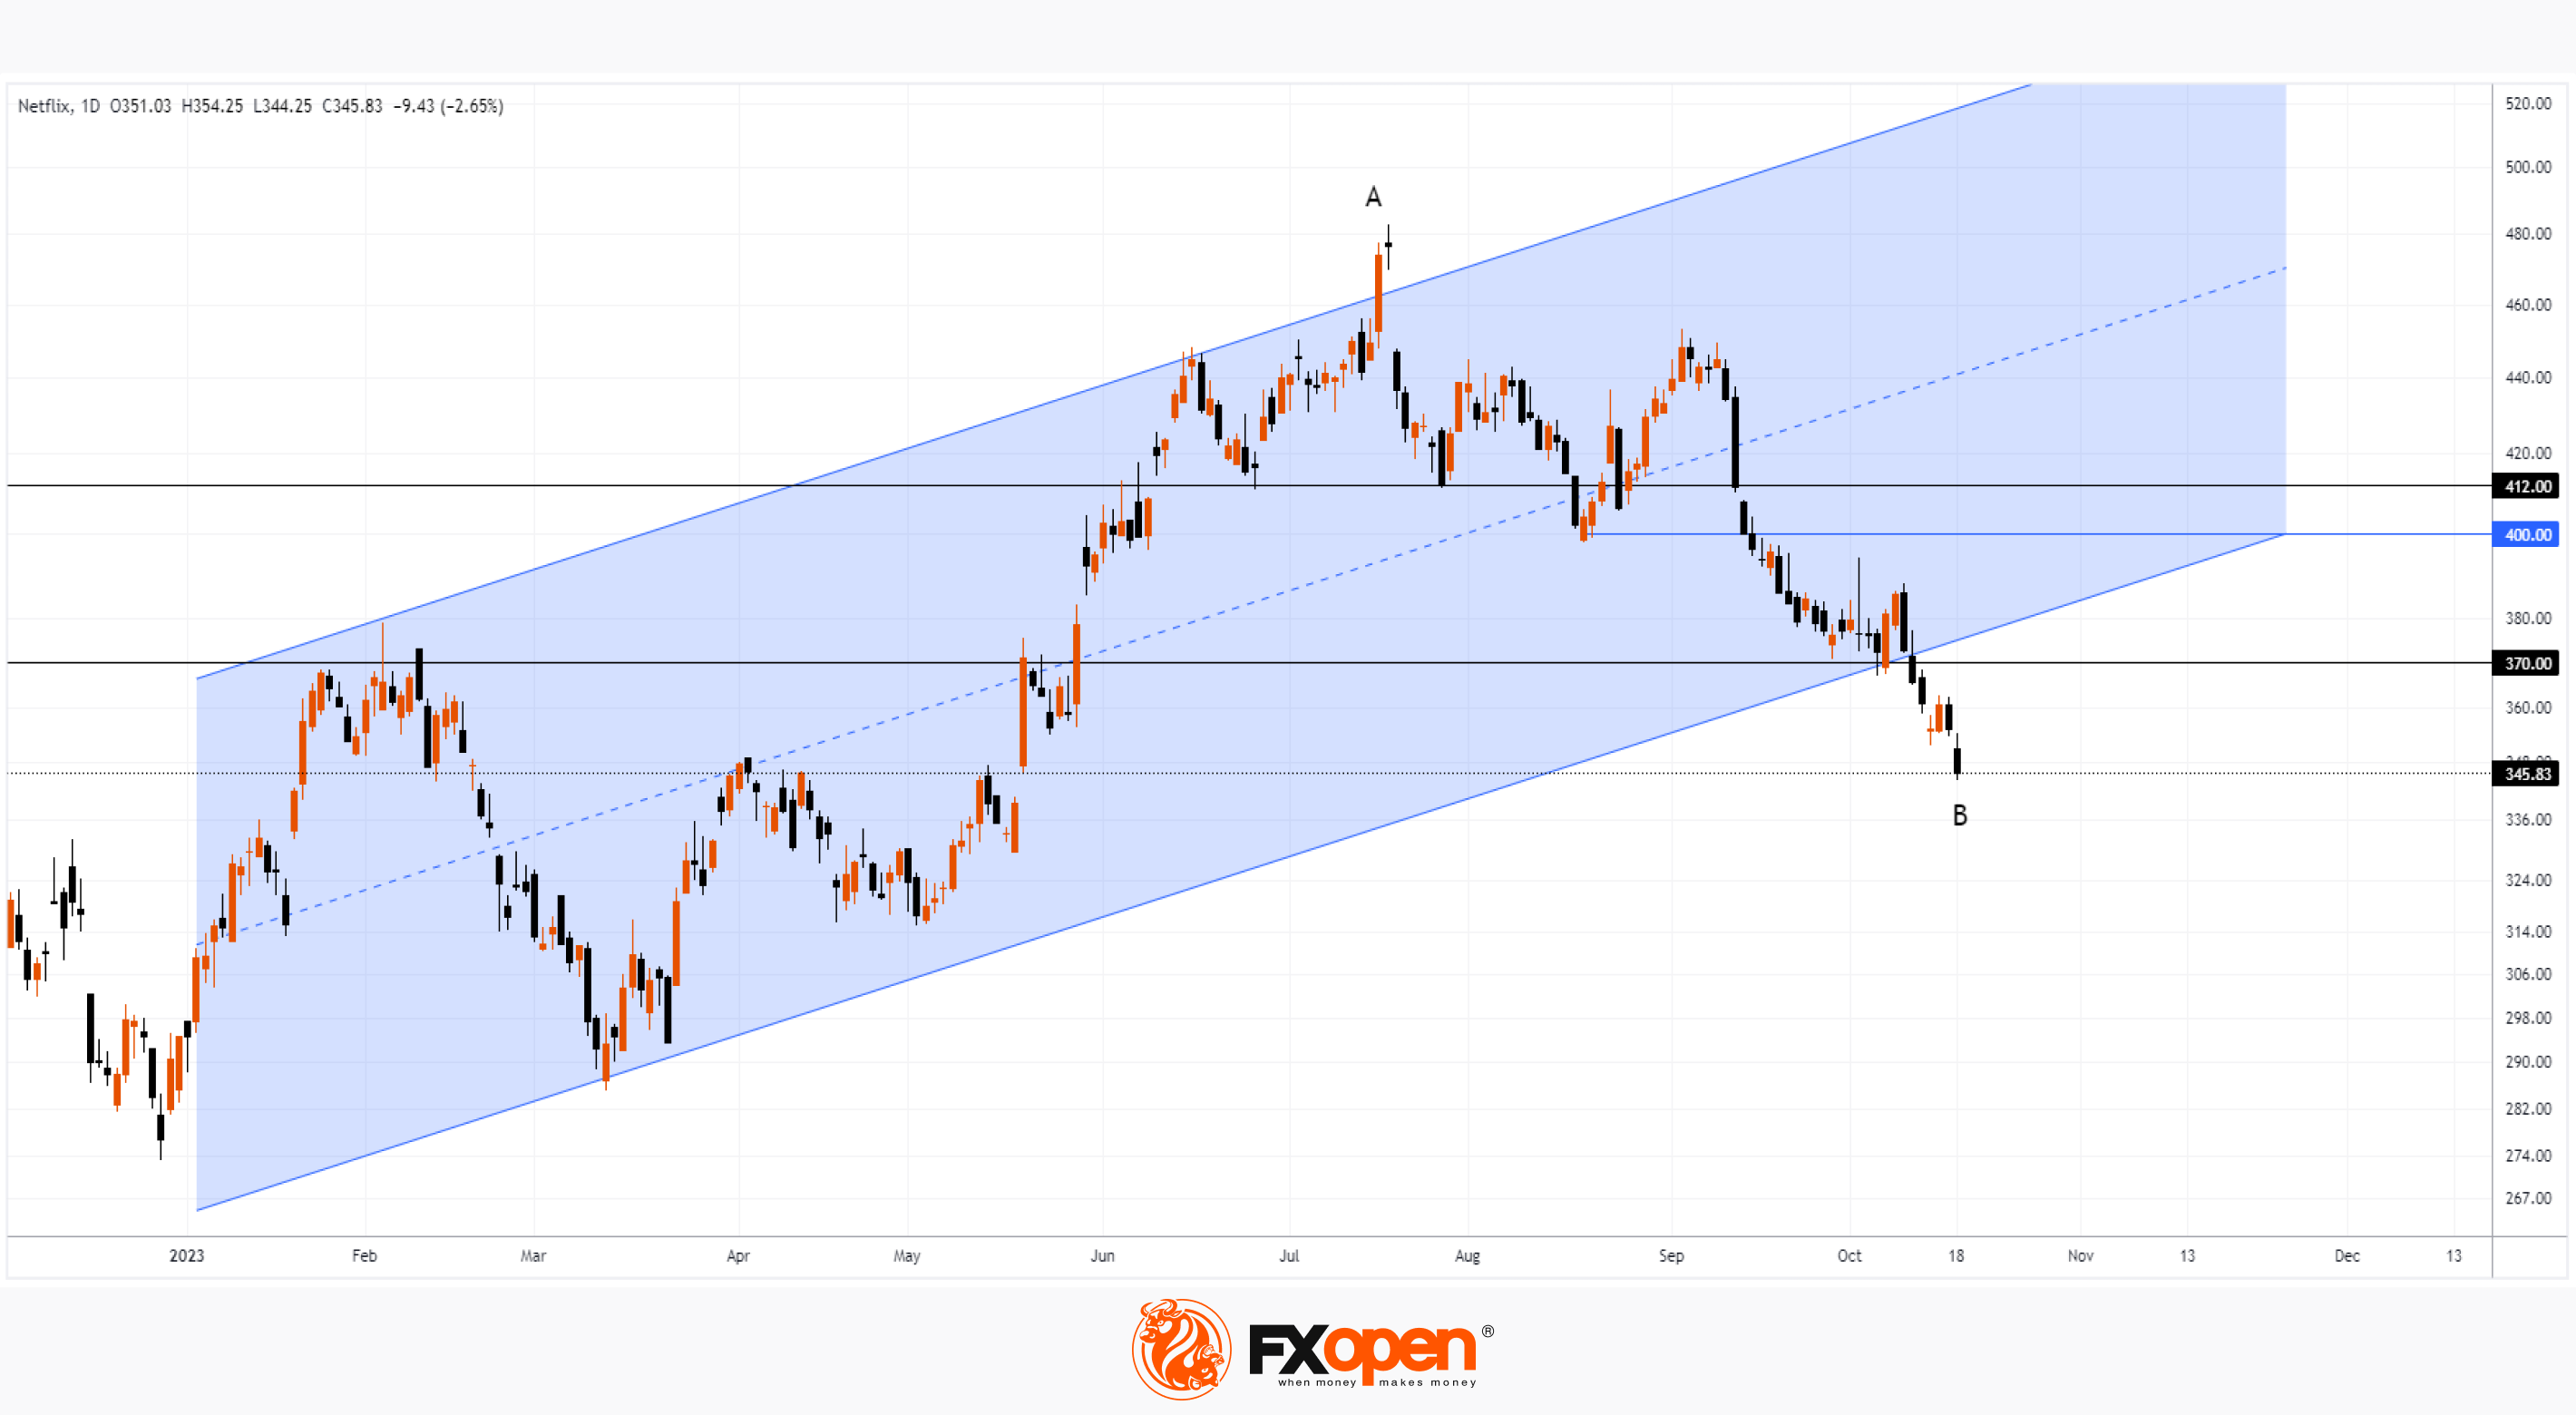
Yesterday's closing price was 345.83, but this morning, NFLX's price rose above USD 390 per share in premarket trading. The reason is a strong report:
→ earnings per share = USD 3.73, expected = USD 3.49;
→ revenue = USD 8.54 billion, a year ago = USD 7.9 billion.
→ the main surprise is that the number of subscribers grew by an impressive 8.76 million in the third quarter (about 6 million were expected). The number of subscribers worldwide is approaching 250 million.
Given the increase in demand for its service, Netflix has decided to raise the price of its basic plan in the US to USD 11.99 per month from USD 9.99, and raise the price of its premium subscription to USD 22.99 per month from USD 19.99. This could attract more earnings per share in the future, which is what has helped NFLX's price soar.
From the technical analysis point of view:
→ NFLX price returns to the ascending channel that was in effect in 2023 and seems to be becoming relevant again. The false breakout pattern could become a support zone in the future.
→ NFLX price exceeded USD 370 per share.
Since early September, NFLX has been a laggard in the NASDAQ index, but after the report it may become one of the leaders. "While we have much work to do to build out this business, we're making good progress and laying the foundation for what we believe should be a multibillion-dollar revenue stream over time," Netflix executives wrote in a letter to shareholders.
Resistance to a powerful bullish impulse may come from:
→ psychological level of USD 400;
→ level at USD 412 – during the summer, the level provided support. But it was broken on September 13-14, and with a bearish gap, which could slow down the rally if the price of NFLX reaches this level. Also note that here is the Fibo resistance level of 50% of the decline A→B.
According to TipRanks, analysts have a target price of USD 454 for NFLX, but given its recent performance, the forecast could be raised.
To benefit from the rise and fall in the share price of popular companies, consider enlisting the services of a trusted broker like FXOpen.
CFDs are complex instruments and come with a high risk of losing your money.
This article represents the opinion of the Companies operating under the FXOpen brand only. It is not to be construed as an offer, solicitation, or recommendation with respect to products and services provided by the Companies operating under the FXOpen brand, nor is it to be considered financial advice.
Market Analysis: NFLX Price Soars 12% after Strong Report
Yesterday's closing price was 345.83, but this morning, NFLX's price rose above USD 390 per share in premarket trading. The reason is a strong report:
→ earnings per share = USD 3.73, expected = USD 3.49;
→ revenue = USD 8.54 billion, a year ago = USD 7.9 billion.
→ the main surprise is that the number of subscribers grew by an impressive 8.76 million in the third quarter (about 6 million were expected). The number of subscribers worldwide is approaching 250 million.
Given the increase in demand for its service, Netflix has decided to raise the price of its basic plan in the US to USD 11.99 per month from USD 9.99, and raise the price of its premium subscription to USD 22.99 per month from USD 19.99. This could attract more earnings per share in the future, which is what has helped NFLX's price soar.
From the technical analysis point of view:
→ NFLX price returns to the ascending channel that was in effect in 2023 and seems to be becoming relevant again. The false breakout pattern could become a support zone in the future.
→ NFLX price exceeded USD 370 per share.
Since early September, NFLX has been a laggard in the NASDAQ index, but after the report it may become one of the leaders. "While we have much work to do to build out this business, we're making good progress and laying the foundation for what we believe should be a multibillion-dollar revenue stream over time," Netflix executives wrote in a letter to shareholders.
Resistance to a powerful bullish impulse may come from:
→ psychological level of USD 400;
→ level at USD 412 – during the summer, the level provided support. But it was broken on September 13-14, and with a bearish gap, which could slow down the rally if the price of NFLX reaches this level. Also note that here is the Fibo resistance level of 50% of the decline A→B.
According to TipRanks, analysts have a target price of USD 454 for NFLX, but given its recent performance, the forecast could be raised.
To benefit from the rise and fall in the share price of popular companies, consider enlisting the services of a trusted broker like FXOpen.
CFDs are complex instruments and come with a high risk of losing your money.
This article represents the opinion of the Companies operating under the FXOpen brand only. It is not to be construed as an offer, solicitation, or recommendation with respect to products and services provided by the Companies operating under the FXOpen brand, nor is it to be considered financial advice.
#marketanalysis #MarketNews #oilprices #oilmarket
Market Analysis. On Factors Influencing the Price of Oil: Biden, Israel, Venezuela
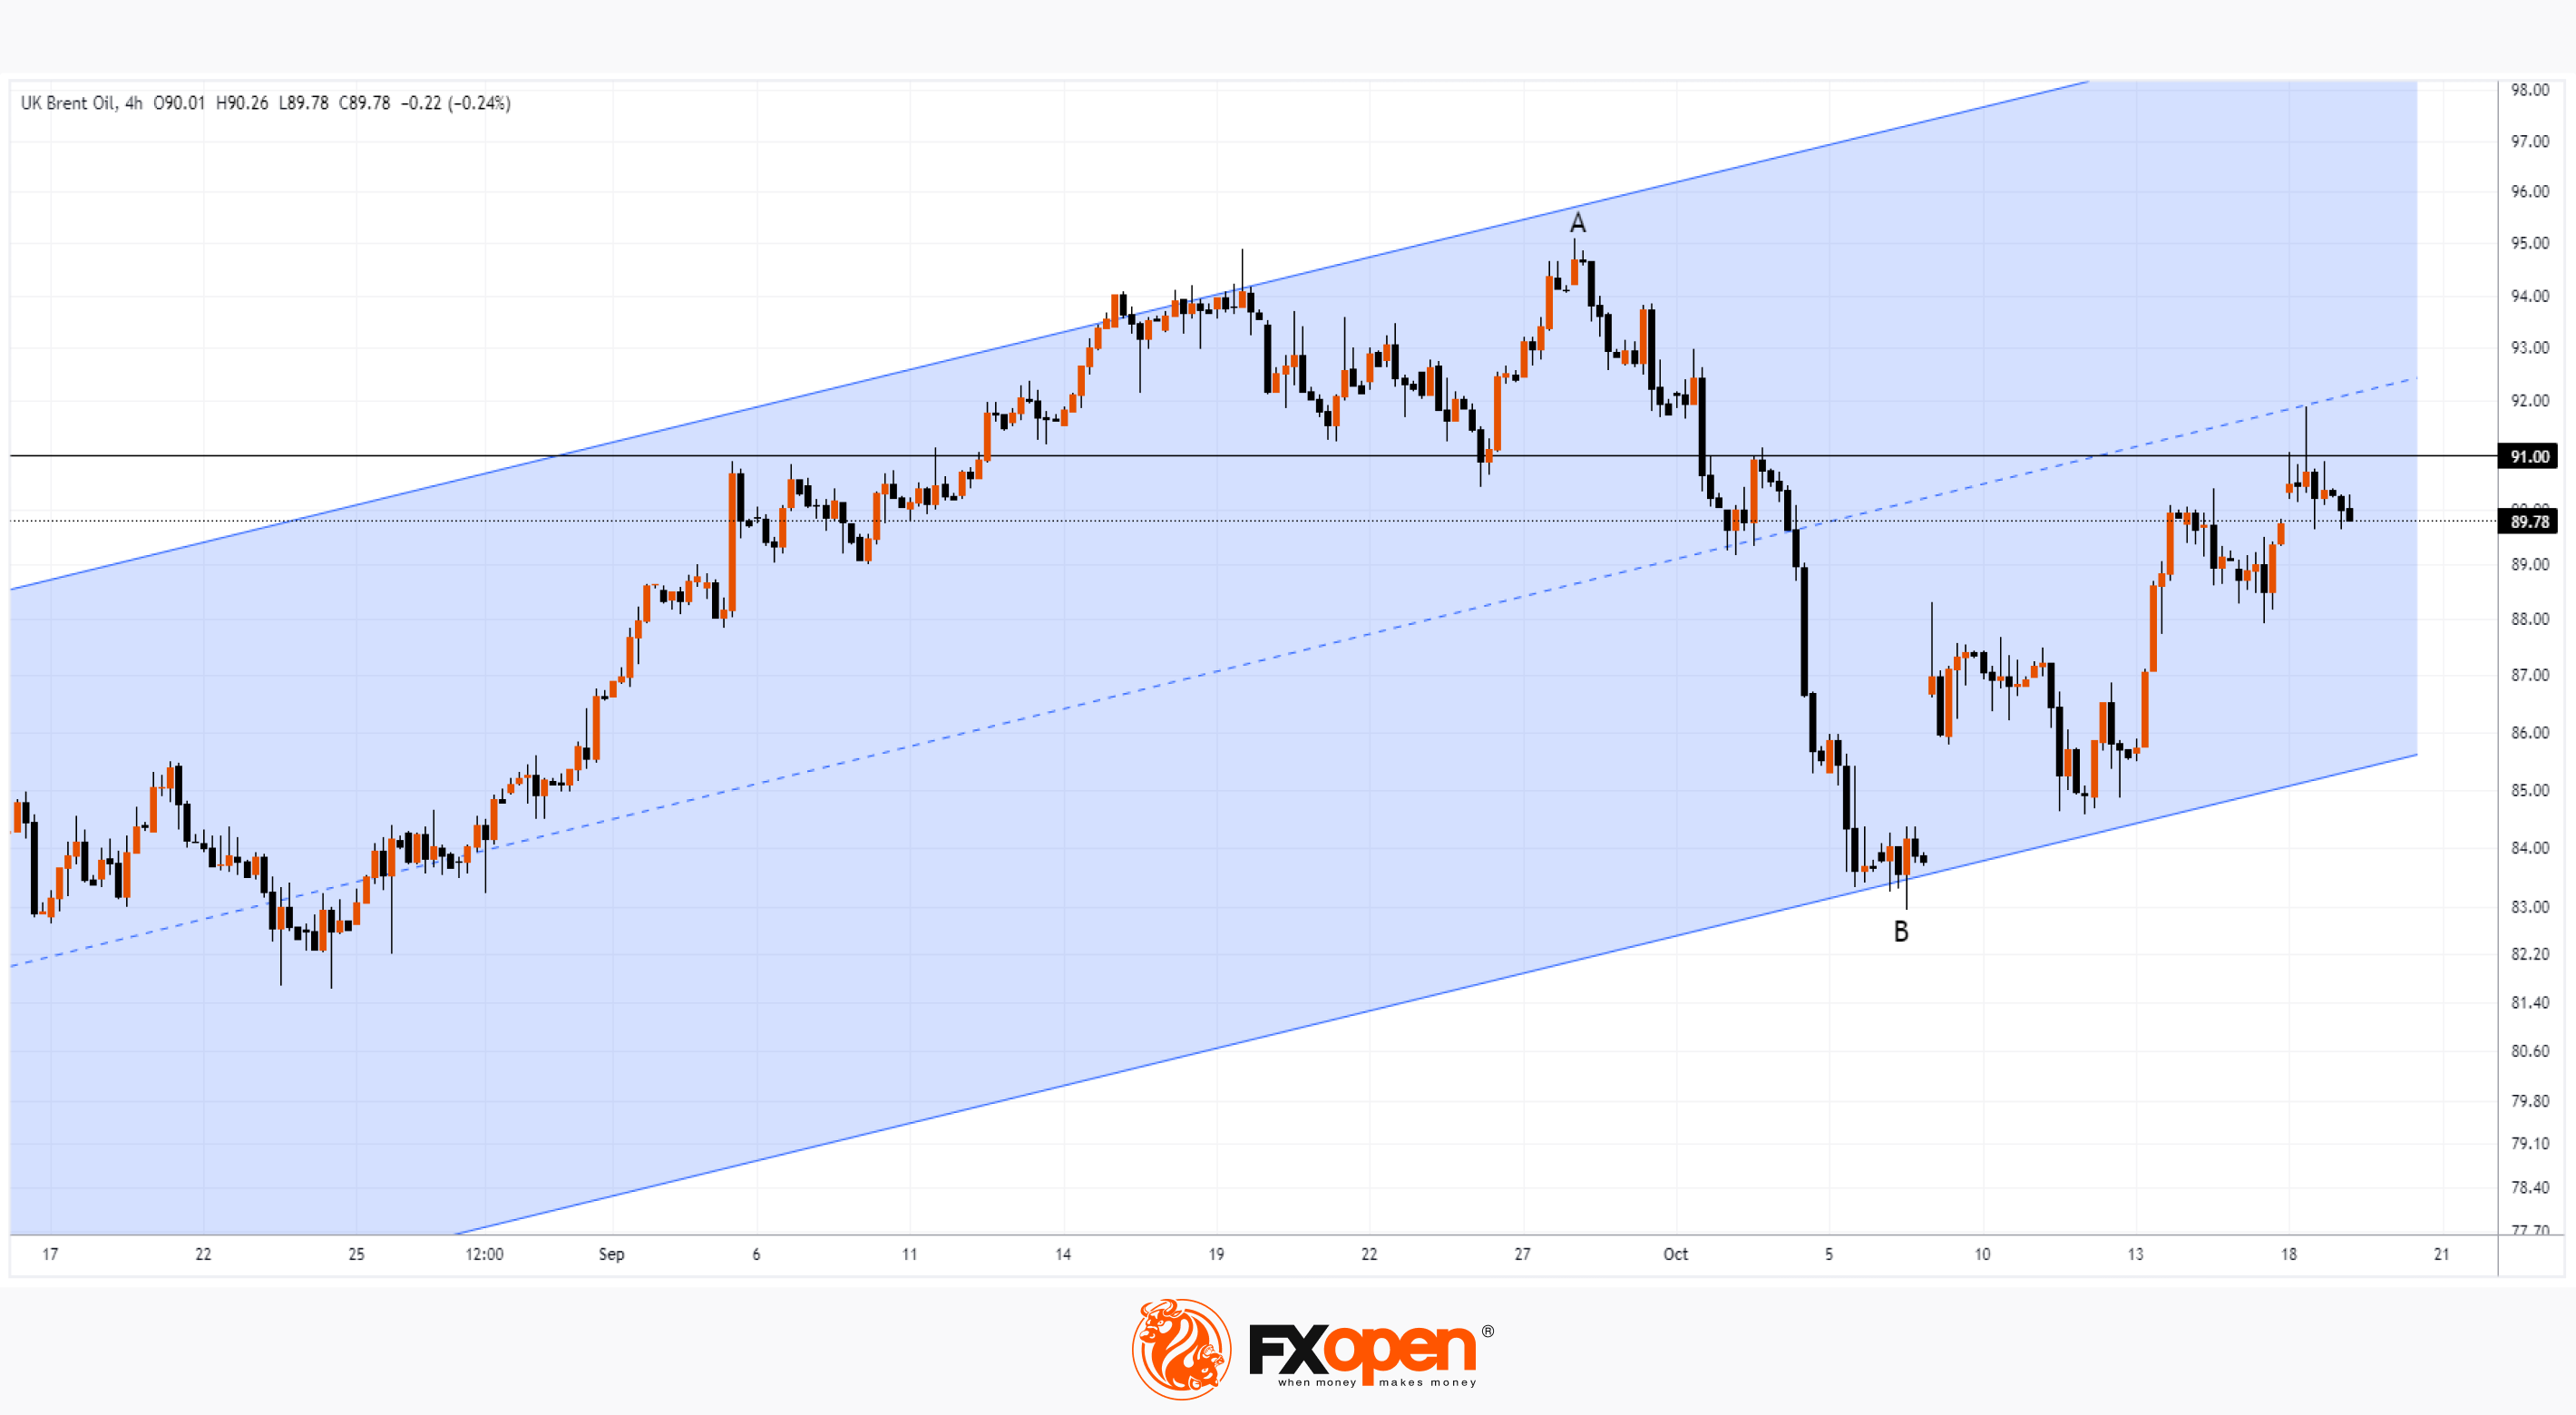
Pushing off the lower boundary of the ascending channel, the price of Brent oil rose by more than 8% amid fears of an escalation of conflict in the Middle East, which should pose a problem both for the US economy, which suffers from high inflation, and for President Biden personally on the eve of the elections.
The situation is aggravated by the fact that oil reserves in US strategic storage facilities are near minimums since 2014. That is why:
→ it can be assumed that the goal of containing the rise in oil prices was one of the motives for Biden’s visit to Israel on Wednesday. It is expected that the price of oil may be affected by Biden's speech from the Oval Office, scheduled for Thursday evening 20:00 ET (or Friday night at 03:00 GMT+3);
→ the United States has eased sanctions against Venezuela, which has the largest oil reserves in the world.
From a technical analysis perspective, a rally from the October lows (B) after a decline from the September highs (A) may confirm that important divergent drivers are battling in the market.
The Brent crude oil chart shows that:
→ resistance is provided by the median line of the ascending channel;
→ resistance is also observed from the level of USD 91, which served as support in September;
→ the presence of selling pressure is also evidenced by the long upper shadow on yesterday’s candle.
However, will the resistance be able to hold out if the situation in the Middle East, which provides a third of world oil consumption, continues to escalate? According to Bloomberg, there are concerns that Israel's expected ground offensive on the Gaza Strip could provoke a more aggressive response from Iran-backed Hezbollah in southern Lebanon and perhaps from Tehran itself.
To benefit from oil price movements, consider enlisting the services of a trusted broker like FXOpen.
CFDs are complex instruments and come with a high risk of losing your money.
This article represents the opinion of the Companies operating under the FXOpen brand only. It is not to be construed as an offer, solicitation, or recommendation with respect to products and services provided by the Companies operating under the FXOpen brand, nor is it to be considered financial advice.
Market Analysis. On Factors Influencing the Price of Oil: Biden, Israel, Venezuela
Pushing off the lower boundary of the ascending channel, the price of Brent oil rose by more than 8% amid fears of an escalation of conflict in the Middle East, which should pose a problem both for the US economy, which suffers from high inflation, and for President Biden personally on the eve of the elections.
The situation is aggravated by the fact that oil reserves in US strategic storage facilities are near minimums since 2014. That is why:
→ it can be assumed that the goal of containing the rise in oil prices was one of the motives for Biden’s visit to Israel on Wednesday. It is expected that the price of oil may be affected by Biden's speech from the Oval Office, scheduled for Thursday evening 20:00 ET (or Friday night at 03:00 GMT+3);
→ the United States has eased sanctions against Venezuela, which has the largest oil reserves in the world.
From a technical analysis perspective, a rally from the October lows (B) after a decline from the September highs (A) may confirm that important divergent drivers are battling in the market.
The Brent crude oil chart shows that:
→ resistance is provided by the median line of the ascending channel;
→ resistance is also observed from the level of USD 91, which served as support in September;
→ the presence of selling pressure is also evidenced by the long upper shadow on yesterday’s candle.
However, will the resistance be able to hold out if the situation in the Middle East, which provides a third of world oil consumption, continues to escalate? According to Bloomberg, there are concerns that Israel's expected ground offensive on the Gaza Strip could provoke a more aggressive response from Iran-backed Hezbollah in southern Lebanon and perhaps from Tehran itself.
To benefit from oil price movements, consider enlisting the services of a trusted broker like FXOpen.
CFDs are complex instruments and come with a high risk of losing your money.
This article represents the opinion of the Companies operating under the FXOpen brand only. It is not to be construed as an offer, solicitation, or recommendation with respect to products and services provided by the Companies operating under the FXOpen brand, nor is it to be considered financial advice.
#stockmarket #stocks #teslastock #tsla
Market Analysis: TSLA Stock Price Breaks 2023 Trend
According to the earnings report published yesterday:
→ Tesla's revenue for the 3rd quarter amounted to USD 23.35 billion, expected USD 24.18 billion;
→ earnings per share amounted to USD 0.66, expected USD 0.73.
That is, the actual numbers turned out to be worse than forecasts. But the main negative can be considered the statements of Elon Musk, according to which:
→ investors' expectations from Cybertruck should be moderated; it may take from a year to 18 months for a positive effect from this product. Although the company already has about 1 million applications, the company will be able to start producing about a quarter of a million cars per year approximately in 2025;
→ the company is currently pausing the construction of a plant in Mexico;
→ the policy of high interest rates has a great impact on the activities of both the company and the global economy.
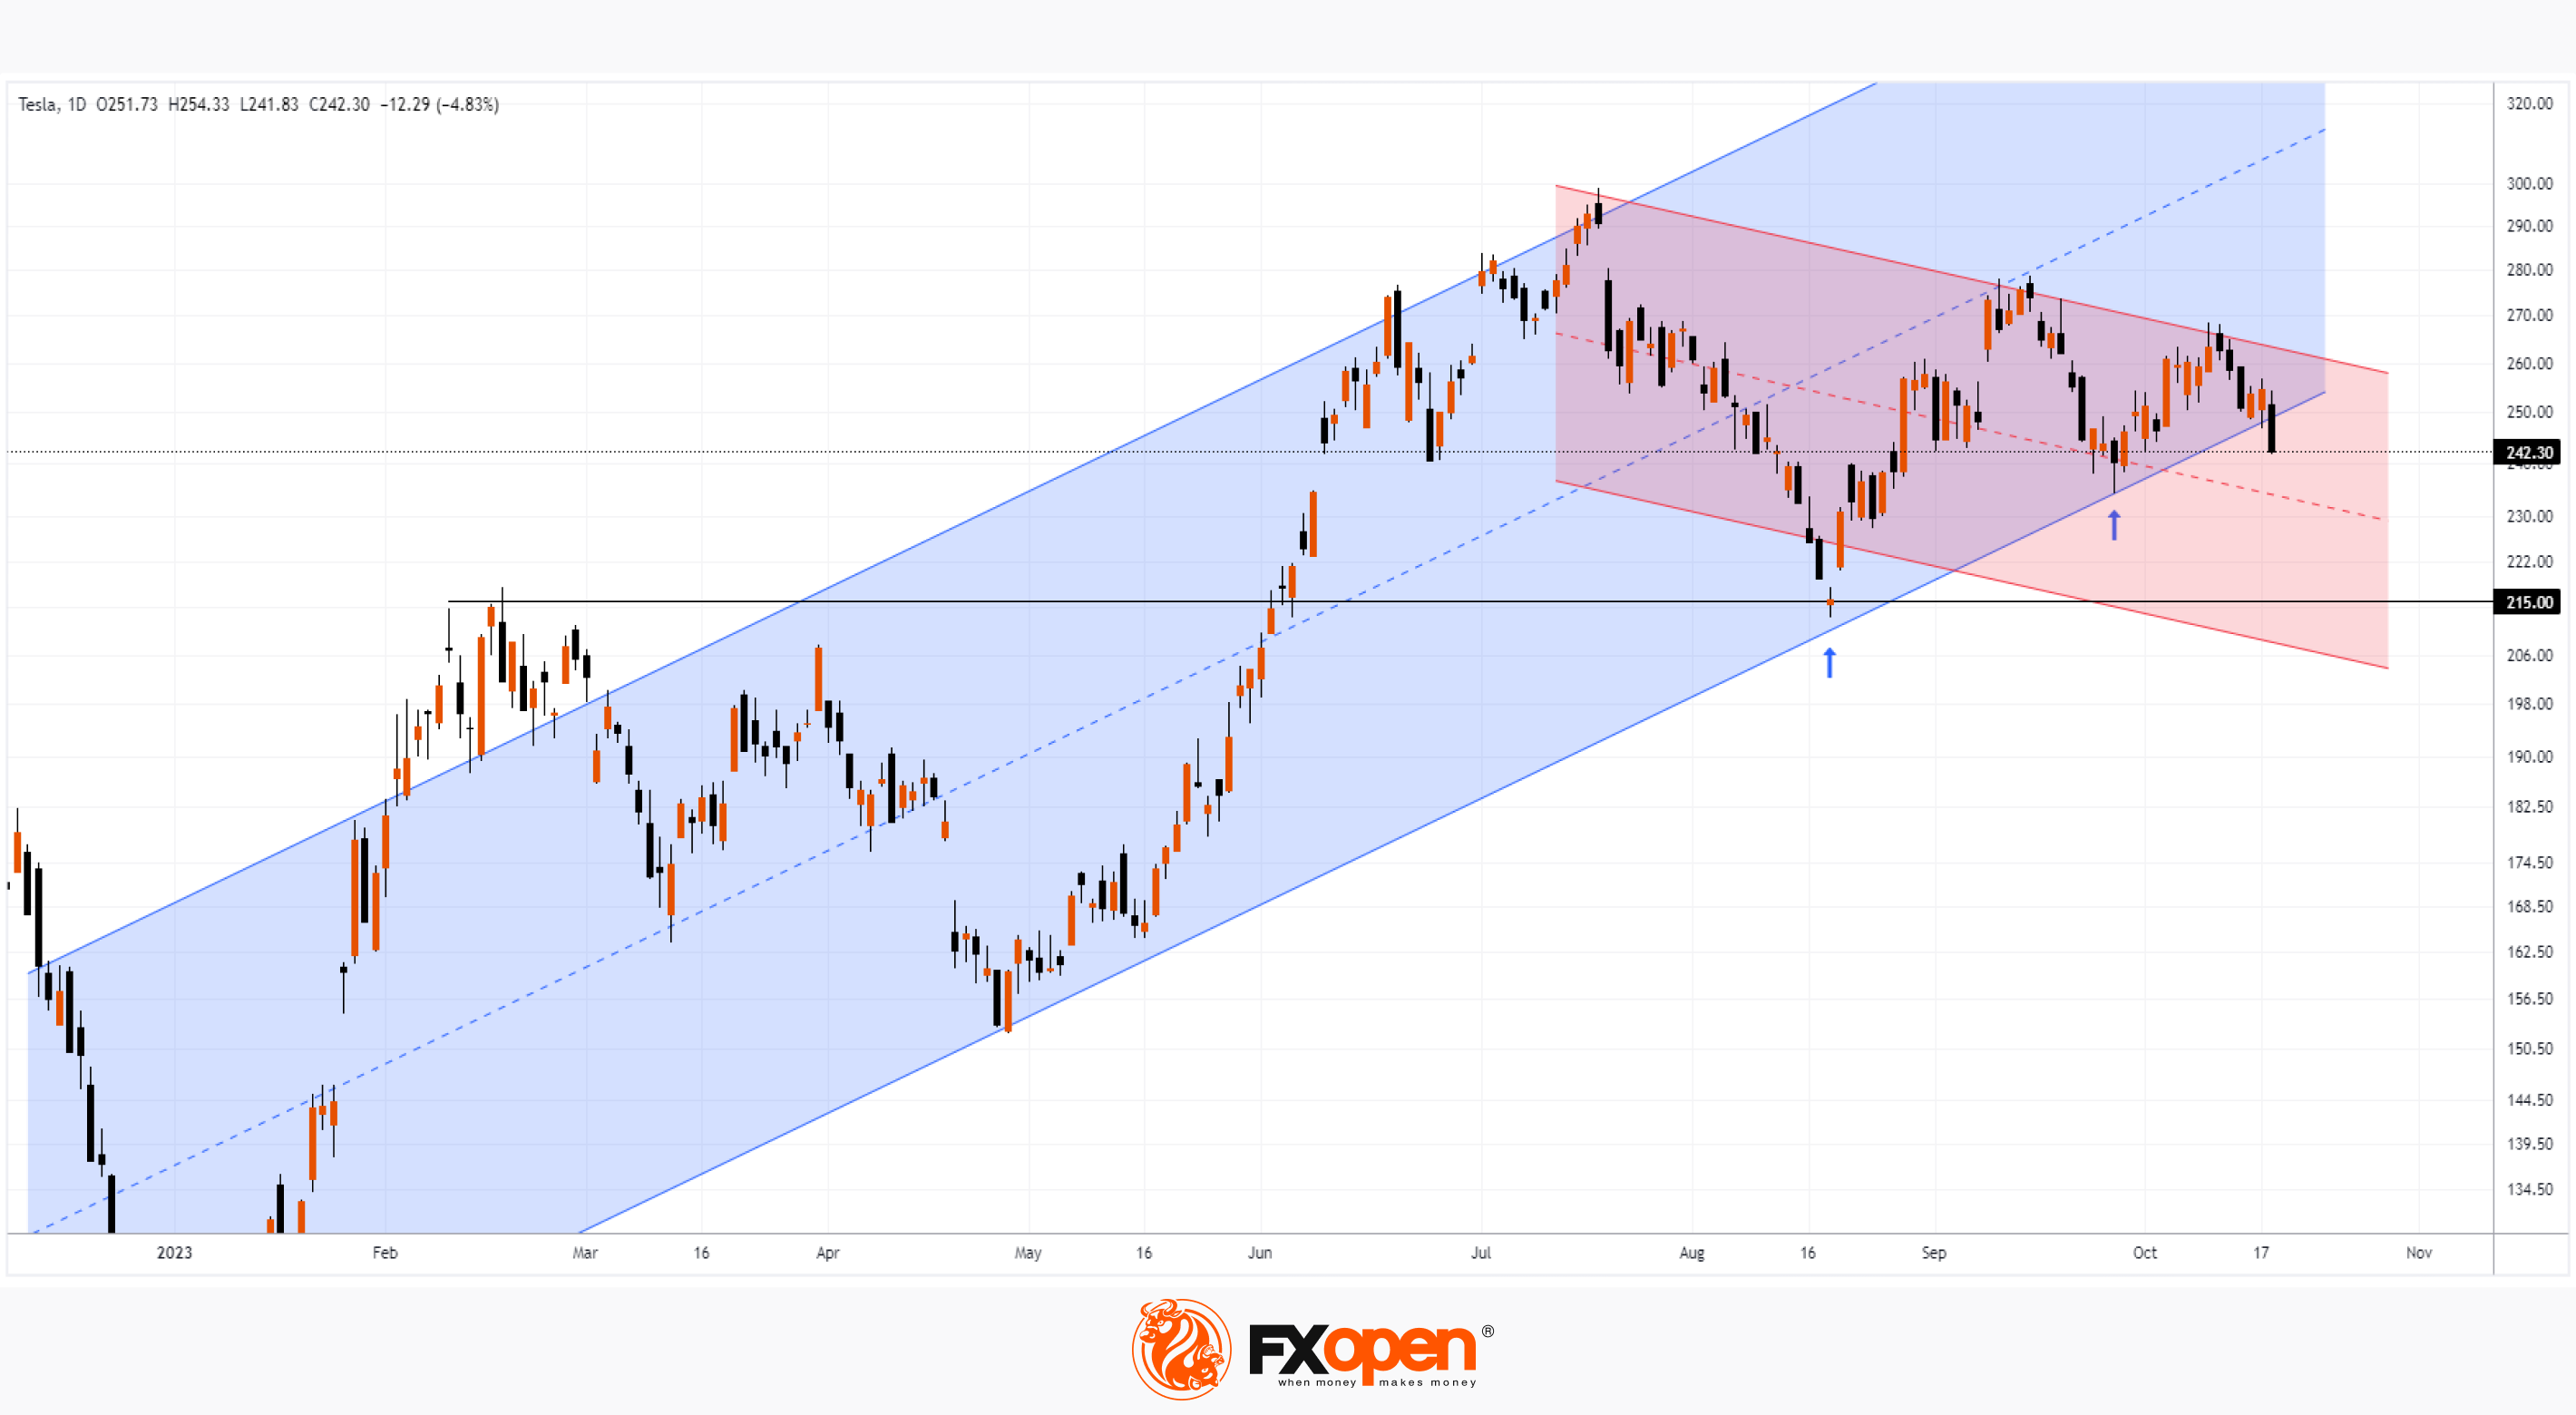
In response to the report, TSLA's share price declined. In the premarket on the morning of October 19, the share price is slightly above USD 231, although at the beginning of the week trading was above USD 255, and yesterday the closing price was above USD 242.
At the same time, it can be observed that the breakdown of the lower boundary of the ascending channel is becoming more and more obvious. The bullish trend (shown in blue) for 2023 did not hold. There were two bounce attempts (shown by arrows), but the second one demonstrated worse dynamics (the dead cat bounce pattern).
Now the downward channel, the contours of which are indicated in red, becomes relevant. Wherein:
→ the opening price today can be fixed near its median line;
→ if the dynamics continue to be bearish, then the price of TSLA may reach important support at USD 215 this year.
To benefit from the rise and fall of popular stock prices, consider enlisting the services of a trusted broker like FXOpen.
CFDs are complex instruments and come with a high risk of losing your money.
This article represents the opinion of the Companies operating under the FXOpen brand only. It is not to be construed as an offer, solicitation, or recommendation with respect to products and services provided by the Companies operating under the FXOpen brand, nor is it to be considered financial advice.
Market Analysis: TSLA Stock Price Breaks 2023 Trend
According to the earnings report published yesterday:
→ Tesla's revenue for the 3rd quarter amounted to USD 23.35 billion, expected USD 24.18 billion;
→ earnings per share amounted to USD 0.66, expected USD 0.73.
That is, the actual numbers turned out to be worse than forecasts. But the main negative can be considered the statements of Elon Musk, according to which:
→ investors' expectations from Cybertruck should be moderated; it may take from a year to 18 months for a positive effect from this product. Although the company already has about 1 million applications, the company will be able to start producing about a quarter of a million cars per year approximately in 2025;
→ the company is currently pausing the construction of a plant in Mexico;
→ the policy of high interest rates has a great impact on the activities of both the company and the global economy.
In response to the report, TSLA's share price declined. In the premarket on the morning of October 19, the share price is slightly above USD 231, although at the beginning of the week trading was above USD 255, and yesterday the closing price was above USD 242.
At the same time, it can be observed that the breakdown of the lower boundary of the ascending channel is becoming more and more obvious. The bullish trend (shown in blue) for 2023 did not hold. There were two bounce attempts (shown by arrows), but the second one demonstrated worse dynamics (the dead cat bounce pattern).
Now the downward channel, the contours of which are indicated in red, becomes relevant. Wherein:
→ the opening price today can be fixed near its median line;
→ if the dynamics continue to be bearish, then the price of TSLA may reach important support at USD 215 this year.
To benefit from the rise and fall of popular stock prices, consider enlisting the services of a trusted broker like FXOpen.
CFDs are complex instruments and come with a high risk of losing your money.
This article represents the opinion of the Companies operating under the FXOpen brand only. It is not to be construed as an offer, solicitation, or recommendation with respect to products and services provided by the Companies operating under the FXOpen brand, nor is it to be considered financial advice.
#marketanalysis #sp500 #stockmarket
S&P 500 Analysis: Threat of an Important Support Breakdown is Growing
On September 19, we analyzed the S&P 500 index, indicating that the market is under pressure. This was an important long term analysis, and let's see what has changed in a month with the news that happened yesterday.
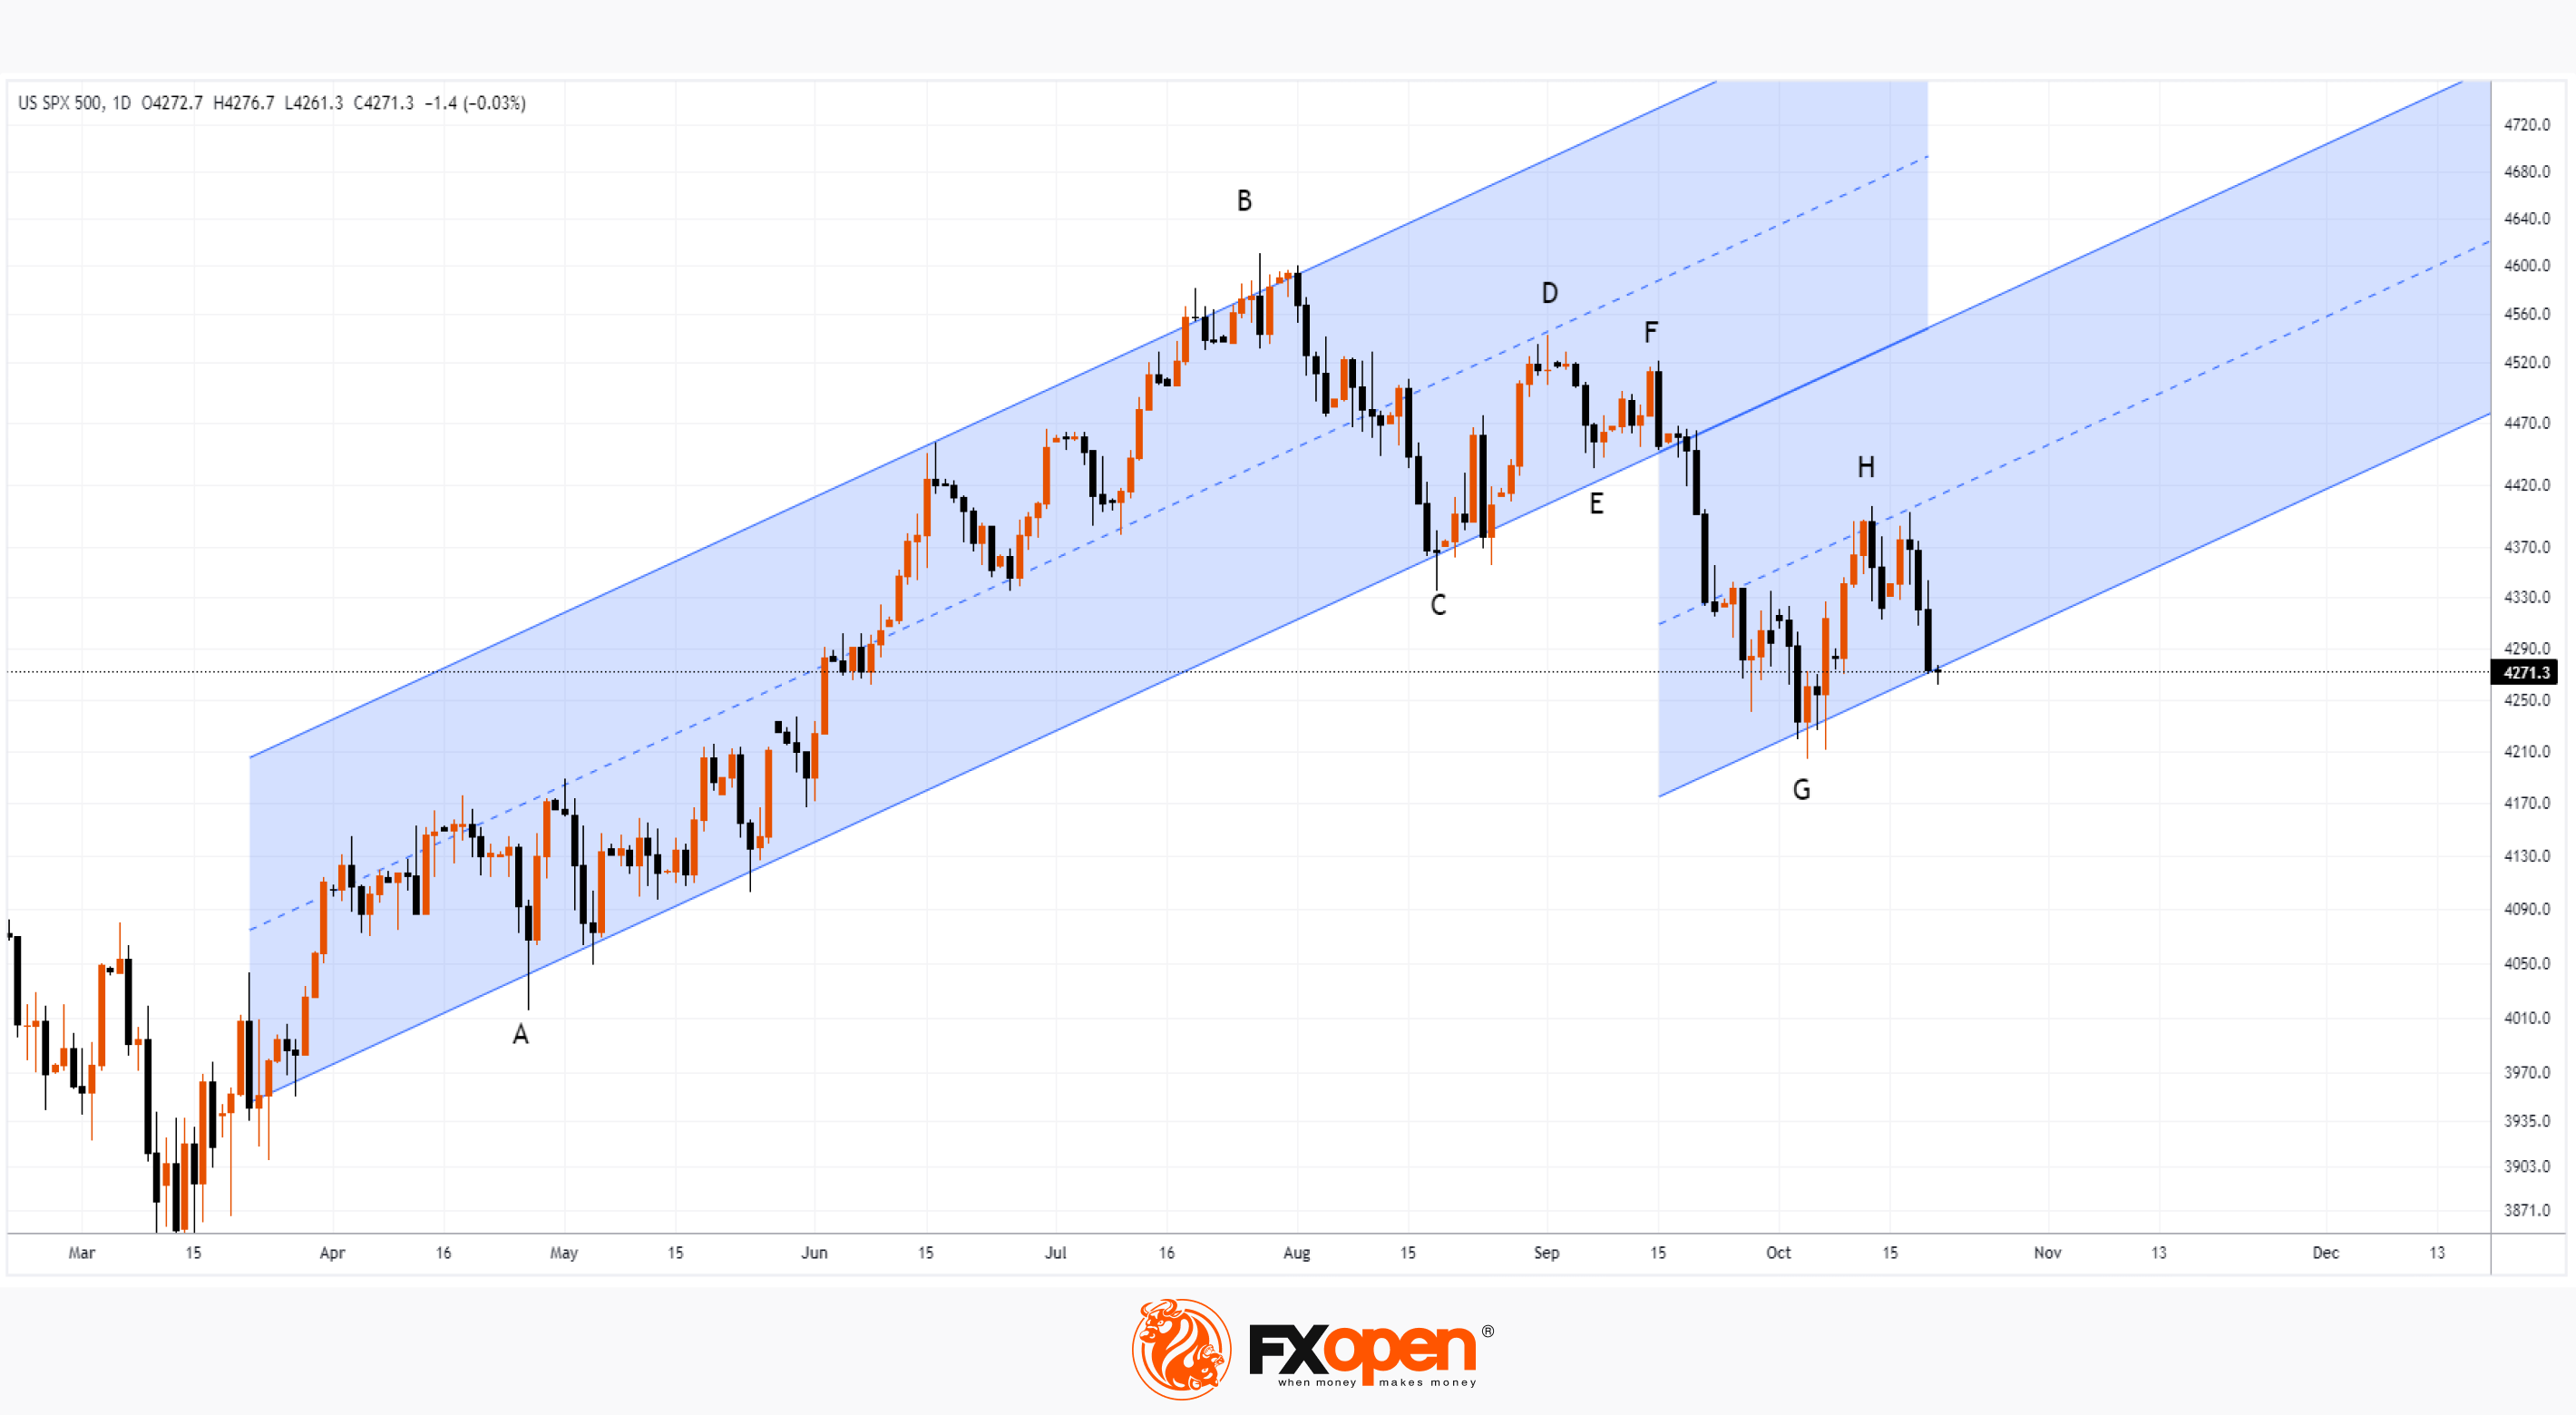
A month ago we marked turning points A, B, C, D on the chart.
Since then, new turning points have appeared: E, F, G, H.
As we indicated, in the pulse sequence A→B, B→C, C→D, D→E, each subsequent pulse was 50% shorter than the previous one. The same observation is true for the E→F movement, which is the last in a series of contracting impulses. That is, the market either compressed into a spring or formed an important balance of supply and demand.
However, the F→G impulse violated this trend. This means that the market has left the state of balance in a bearish direction. At the same time, the channel expanded by 2 times (according to the principle of a parallel channel), and the market found new support G at its lower border. Further, it is important that the movement G→H amounted to 50% of the decline, which corresponds to a bullish corrective movement within the framework of the dominant downward trend (as you understand, the trend began when the market came out of balance).
This assumes 2 basic scenarios:
1) the S&P 500 index will balance around the lower boundary, which will mean fluctuations in the area of 4,250-4,350;
2) the index price will develop a downward movement, breaking through important support, which, as we showed earlier, originates from the bottom of the panic associated with the spread of coronavirus in 2020.
Considering that on Wednesday and Thursday the E-mini S&P 500 futures declined with acceleration and increasing volume, the odds may be on the side of the second scenario.
This can be facilitated by:
→ fears that the United States may be drawn into the escalating military conflict in the Middle East. In a speech yesterday, President Biden said that support for Israel, like Ukraine, is important for the country's future;
→ the Fed policy with high rates. Inflation is still too high, Powell said in yesterday's speech;
→ disappointing company data during earnings season. An example is Tesla. We will soon find out how other large companies included in the index will report.
To benefit from the rise and fall of stock indices, consider enlisting the services of a trusted broker like FXOpen.
CFDs are complex instruments and come with a high risk of losing your money.
S&P 500 Analysis: Threat of an Important Support Breakdown is Growing
On September 19, we analyzed the S&P 500 index, indicating that the market is under pressure. This was an important long term analysis, and let's see what has changed in a month with the news that happened yesterday.
A month ago we marked turning points A, B, C, D on the chart.
Since then, new turning points have appeared: E, F, G, H.
As we indicated, in the pulse sequence A→B, B→C, C→D, D→E, each subsequent pulse was 50% shorter than the previous one. The same observation is true for the E→F movement, which is the last in a series of contracting impulses. That is, the market either compressed into a spring or formed an important balance of supply and demand.
However, the F→G impulse violated this trend. This means that the market has left the state of balance in a bearish direction. At the same time, the channel expanded by 2 times (according to the principle of a parallel channel), and the market found new support G at its lower border. Further, it is important that the movement G→H amounted to 50% of the decline, which corresponds to a bullish corrective movement within the framework of the dominant downward trend (as you understand, the trend began when the market came out of balance).
This assumes 2 basic scenarios:
1) the S&P 500 index will balance around the lower boundary, which will mean fluctuations in the area of 4,250-4,350;
2) the index price will develop a downward movement, breaking through important support, which, as we showed earlier, originates from the bottom of the panic associated with the spread of coronavirus in 2020.
Considering that on Wednesday and Thursday the E-mini S&P 500 futures declined with acceleration and increasing volume, the odds may be on the side of the second scenario.
This can be facilitated by:
→ fears that the United States may be drawn into the escalating military conflict in the Middle East. In a speech yesterday, President Biden said that support for Israel, like Ukraine, is important for the country's future;
→ the Fed policy with high rates. Inflation is still too high, Powell said in yesterday's speech;
→ disappointing company data during earnings season. An example is Tesla. We will soon find out how other large companies included in the index will report.
To benefit from the rise and fall of stock indices, consider enlisting the services of a trusted broker like FXOpen.
CFDs are complex instruments and come with a high risk of losing your money.
#marketanalysis #MarketNews #tradingforex
GBP/JPY Analysis: a Deceptive Calm
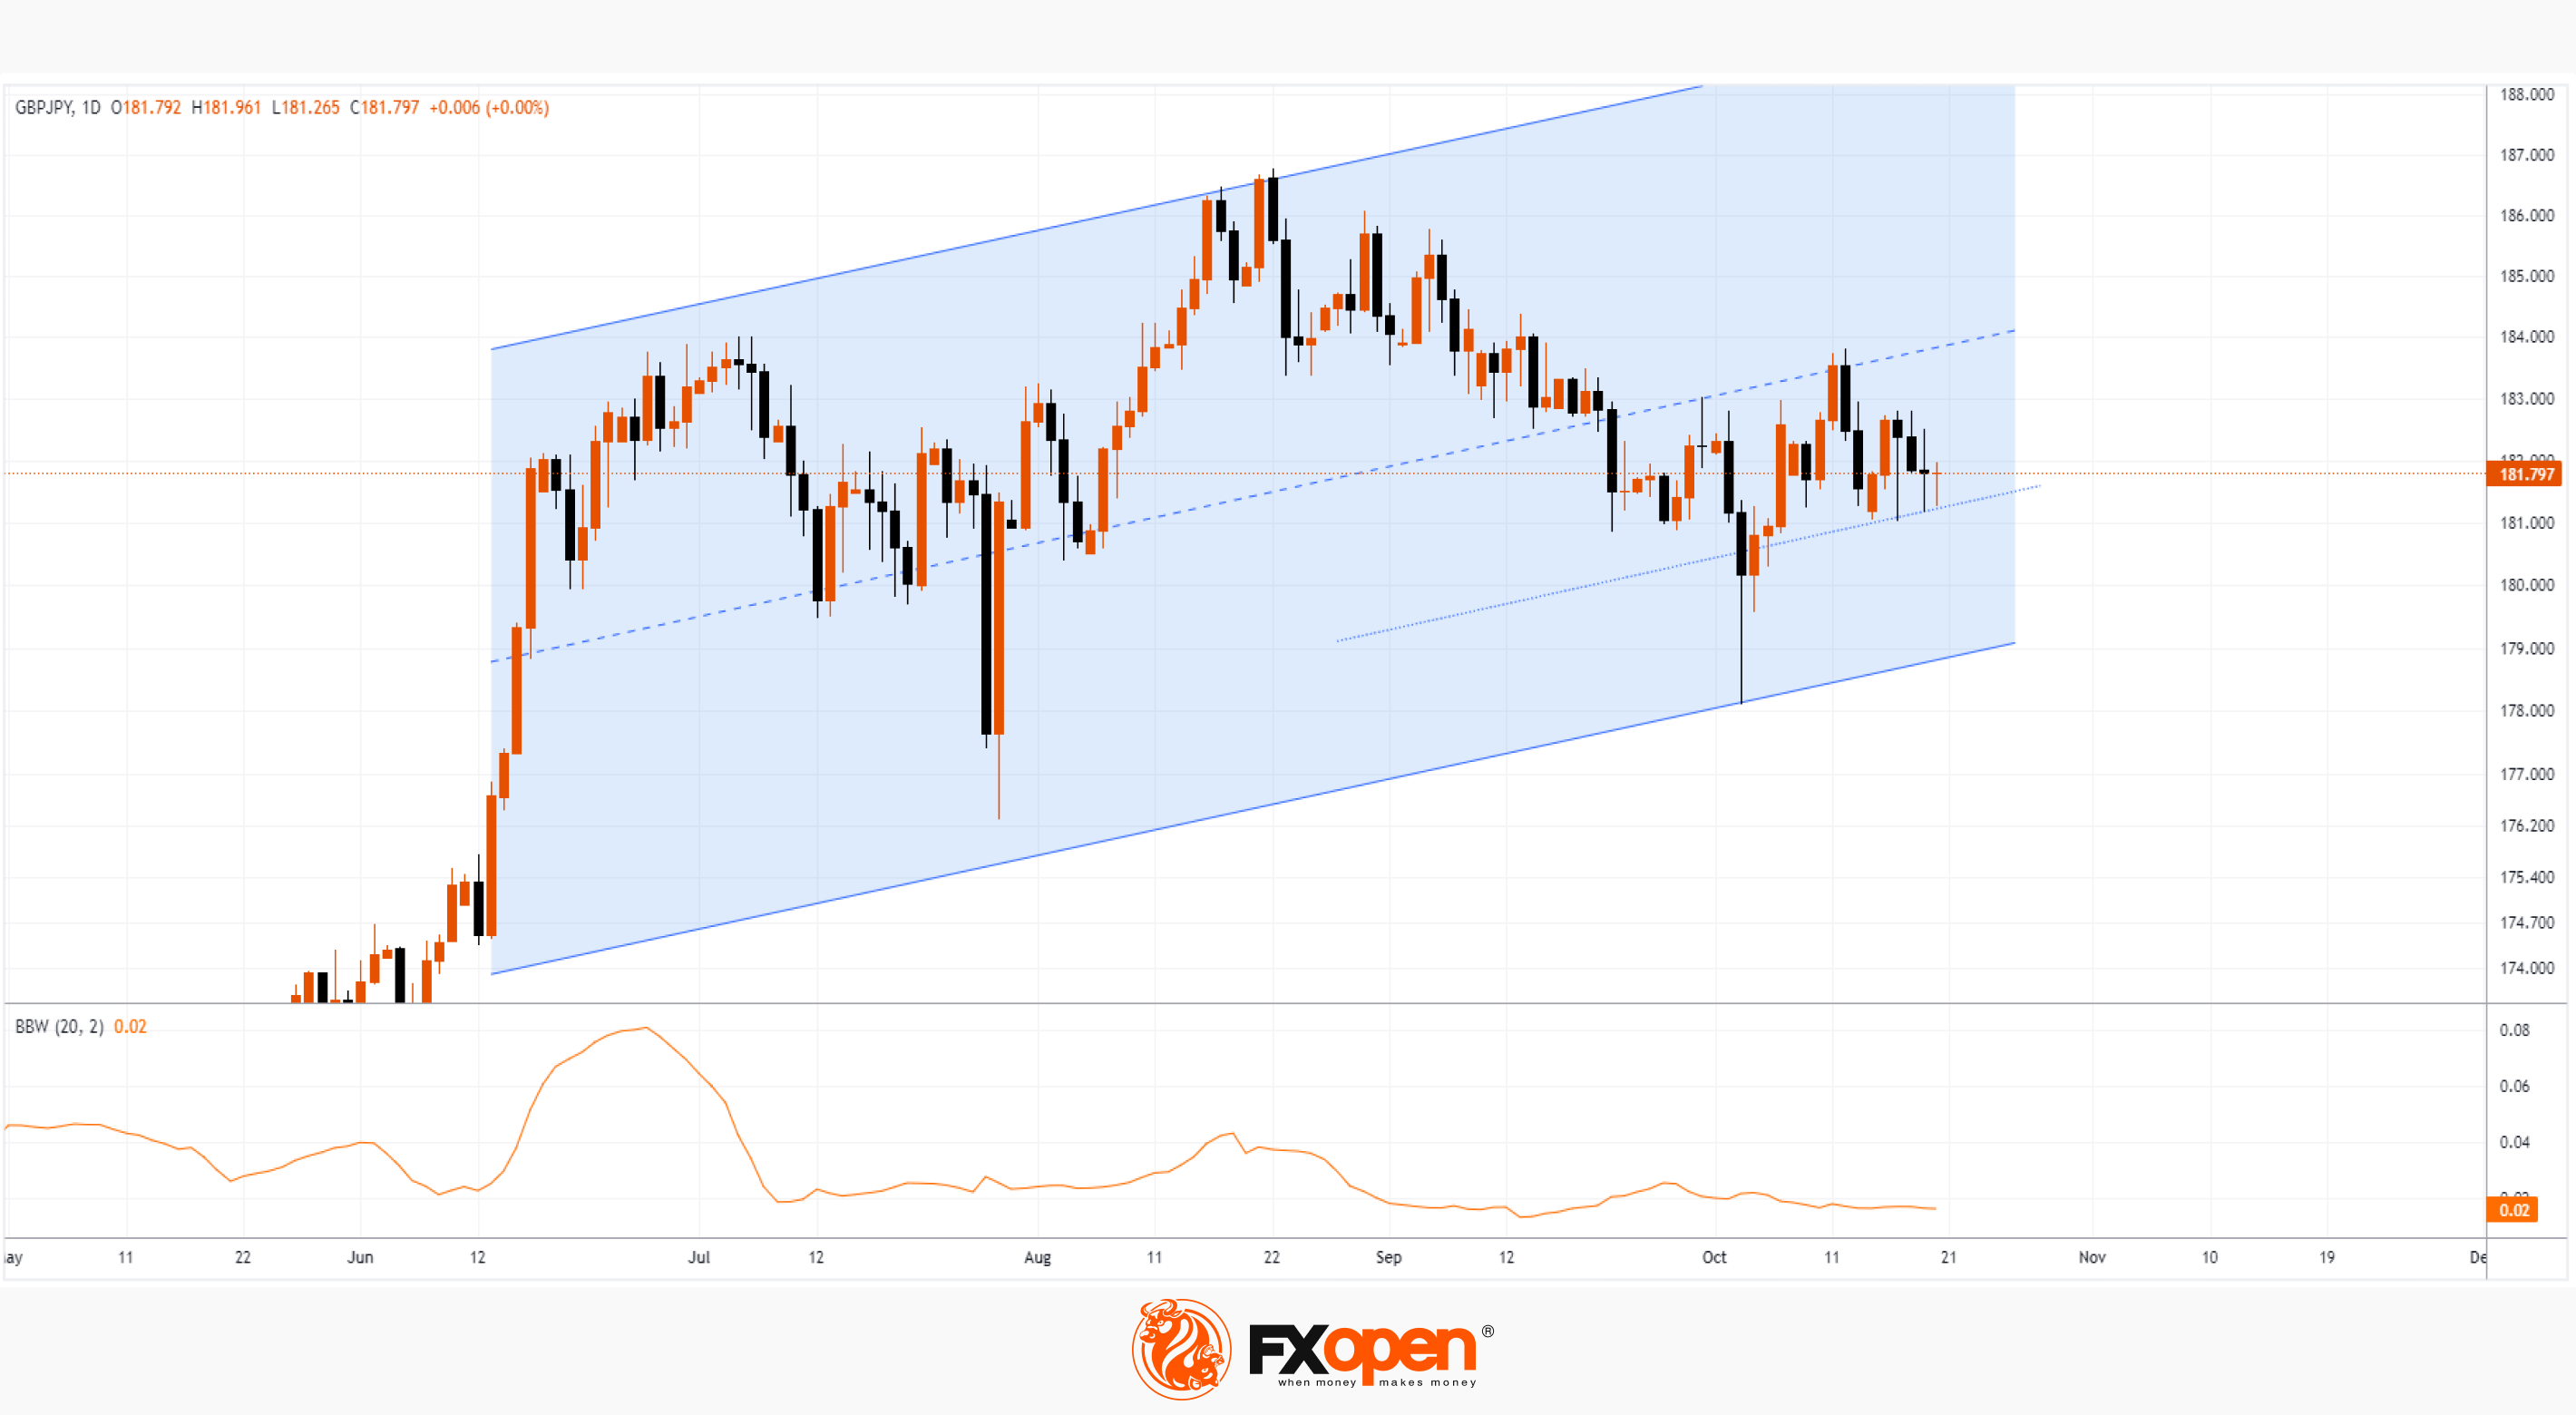
From early January to today, the GBP/JPY rate has risen by approximately 17%, driven by the Bank of Japan's ultra-loose policy of keeping rates below zero.
But since August, the upward trend began to weaken — perhaps faith in the pound was undermined by high inflation (the highest among the G7). This week:
→ data published on Wednesday showed that inflation in the UK has stabilized at 6.7%. In an interview with the Belfast Telegraph published on Friday, Andrew Bailey appeared calm when he said the Bank of England did not expect big changes in the data anyway;
→ retail sales data for September in the UK published on Friday turned out to be worse than expected: actual = -0.9%, expected = -0.3%, a month ago = +0.4%
At the same time, the Bollinger Band width indicator is near record lows for the year, as if someone wants to lull the attention of market participants before an important movement. It is possible that this could happen if the Bank of Japan intervenes to support the weakening yen. And then the balance in which GBP/JPY has been since the summer will be disrupted, and a bearish breakdown of the ascending channel will form on the chart (shown in blue).
To benefit from trends in the foreign exchange markets, consider enlisting the services of a trusted broker like FXOpen.
CFDs are complex instruments and come with a high risk of losing your money.
This article represents the opinion of the Companies operating under the FXOpen brand only. It is not to be construed as an offer, solicitation, or recommendation with respect to products and services provided by the Companies operating under the FXOpen brand, nor is it to be considered financial advice.
GBP/JPY Analysis: a Deceptive Calm
From early January to today, the GBP/JPY rate has risen by approximately 17%, driven by the Bank of Japan's ultra-loose policy of keeping rates below zero.
But since August, the upward trend began to weaken — perhaps faith in the pound was undermined by high inflation (the highest among the G7). This week:
→ data published on Wednesday showed that inflation in the UK has stabilized at 6.7%. In an interview with the Belfast Telegraph published on Friday, Andrew Bailey appeared calm when he said the Bank of England did not expect big changes in the data anyway;
→ retail sales data for September in the UK published on Friday turned out to be worse than expected: actual = -0.9%, expected = -0.3%, a month ago = +0.4%
At the same time, the Bollinger Band width indicator is near record lows for the year, as if someone wants to lull the attention of market participants before an important movement. It is possible that this could happen if the Bank of Japan intervenes to support the weakening yen. And then the balance in which GBP/JPY has been since the summer will be disrupted, and a bearish breakdown of the ascending channel will form on the chart (shown in blue).
To benefit from trends in the foreign exchange markets, consider enlisting the services of a trusted broker like FXOpen.
CFDs are complex instruments and come with a high risk of losing your money.
This article represents the opinion of the Companies operating under the FXOpen brand only. It is not to be construed as an offer, solicitation, or recommendation with respect to products and services provided by the Companies operating under the FXOpen brand, nor is it to be considered financial advice.
#marketanalysis #inflation #marketvolatility #tradingforex
Weekly Market Wrap With Gary Thomson: POUND RISES, NASDAQ SEES A DIP, NFLX PRICE SOARS 12%, OIL.
Get the latest scoop on the week's hottest headlines, all in one convenient video. Join Gary Thomson, the COO of FXOpen UK, as he breaks down the most significant news reports and shares his expert insights.
🔸 Inflation Stabilizes, Pound Rises in Price #Inflation #GBP
🔸 Volatility and Geopolitics Grip US Stocks as NASDAQ Sees a Dip #NASDAQ
🔸 On Factors Influencing the Price of Oil: Biden, Israel, Venezuela #Oil
🔸 NFLX price soars 12% after strong report #NFLX #Netflix #earningsreport
Stay in the know and empower yourself with our short, yet power-packed video. Watch it now and stay updated with FXOpen.
Don't miss out on this invaluable opportunity to sharpen your trading skills and make informed decisions.
https://cutt.ly/YwWisoEz
To take advantage of price fluctuations in the foreign exchange markets, consider enlisting the services of a reliable broker like FXOpen.
⚠️
This forecast represents FXOpen Companies opinion only, it should not be construed as an offer, invitation or recommendation in respect to FXOpen Companies products and services or as financial advice
Weekly Market Wrap With Gary Thomson: POUND RISES, NASDAQ SEES A DIP, NFLX PRICE SOARS 12%, OIL.
Get the latest scoop on the week's hottest headlines, all in one convenient video. Join Gary Thomson, the COO of FXOpen UK, as he breaks down the most significant news reports and shares his expert insights.
🔸 Inflation Stabilizes, Pound Rises in Price #Inflation #GBP
🔸 Volatility and Geopolitics Grip US Stocks as NASDAQ Sees a Dip #NASDAQ
🔸 On Factors Influencing the Price of Oil: Biden, Israel, Venezuela #Oil
🔸 NFLX price soars 12% after strong report #NFLX #Netflix #earningsreport
Stay in the know and empower yourself with our short, yet power-packed video. Watch it now and stay updated with FXOpen.
Don't miss out on this invaluable opportunity to sharpen your trading skills and make informed decisions.
https://cutt.ly/YwWisoEz
To take advantage of price fluctuations in the foreign exchange markets, consider enlisting the services of a reliable broker like FXOpen.
⚠️
This forecast represents FXOpen Companies opinion only, it should not be construed as an offer, invitation or recommendation in respect to FXOpen Companies products and services or as financial advice
YouTube
Weekly Market Wrap With Gary Thomson: POUND RISES, NASDAQ SEES A DIP, NFLX PRICE SOARS 12%, OIL.
Get the latest scoop on the week's hottest headlines, all in one convenient video. Join Gary Thomson, the COO of FXOpen UK, as he breaks down the most significant news reports and shares his expert insights.
- Inflation Stabilizes, Pound Rises in Price #Inflation…
- Inflation Stabilizes, Pound Rises in Price #Inflation…
#marketanalysis #bitcoin #crypto
Market Analysis: Bitcoin Breaks Psychological Level of $30k
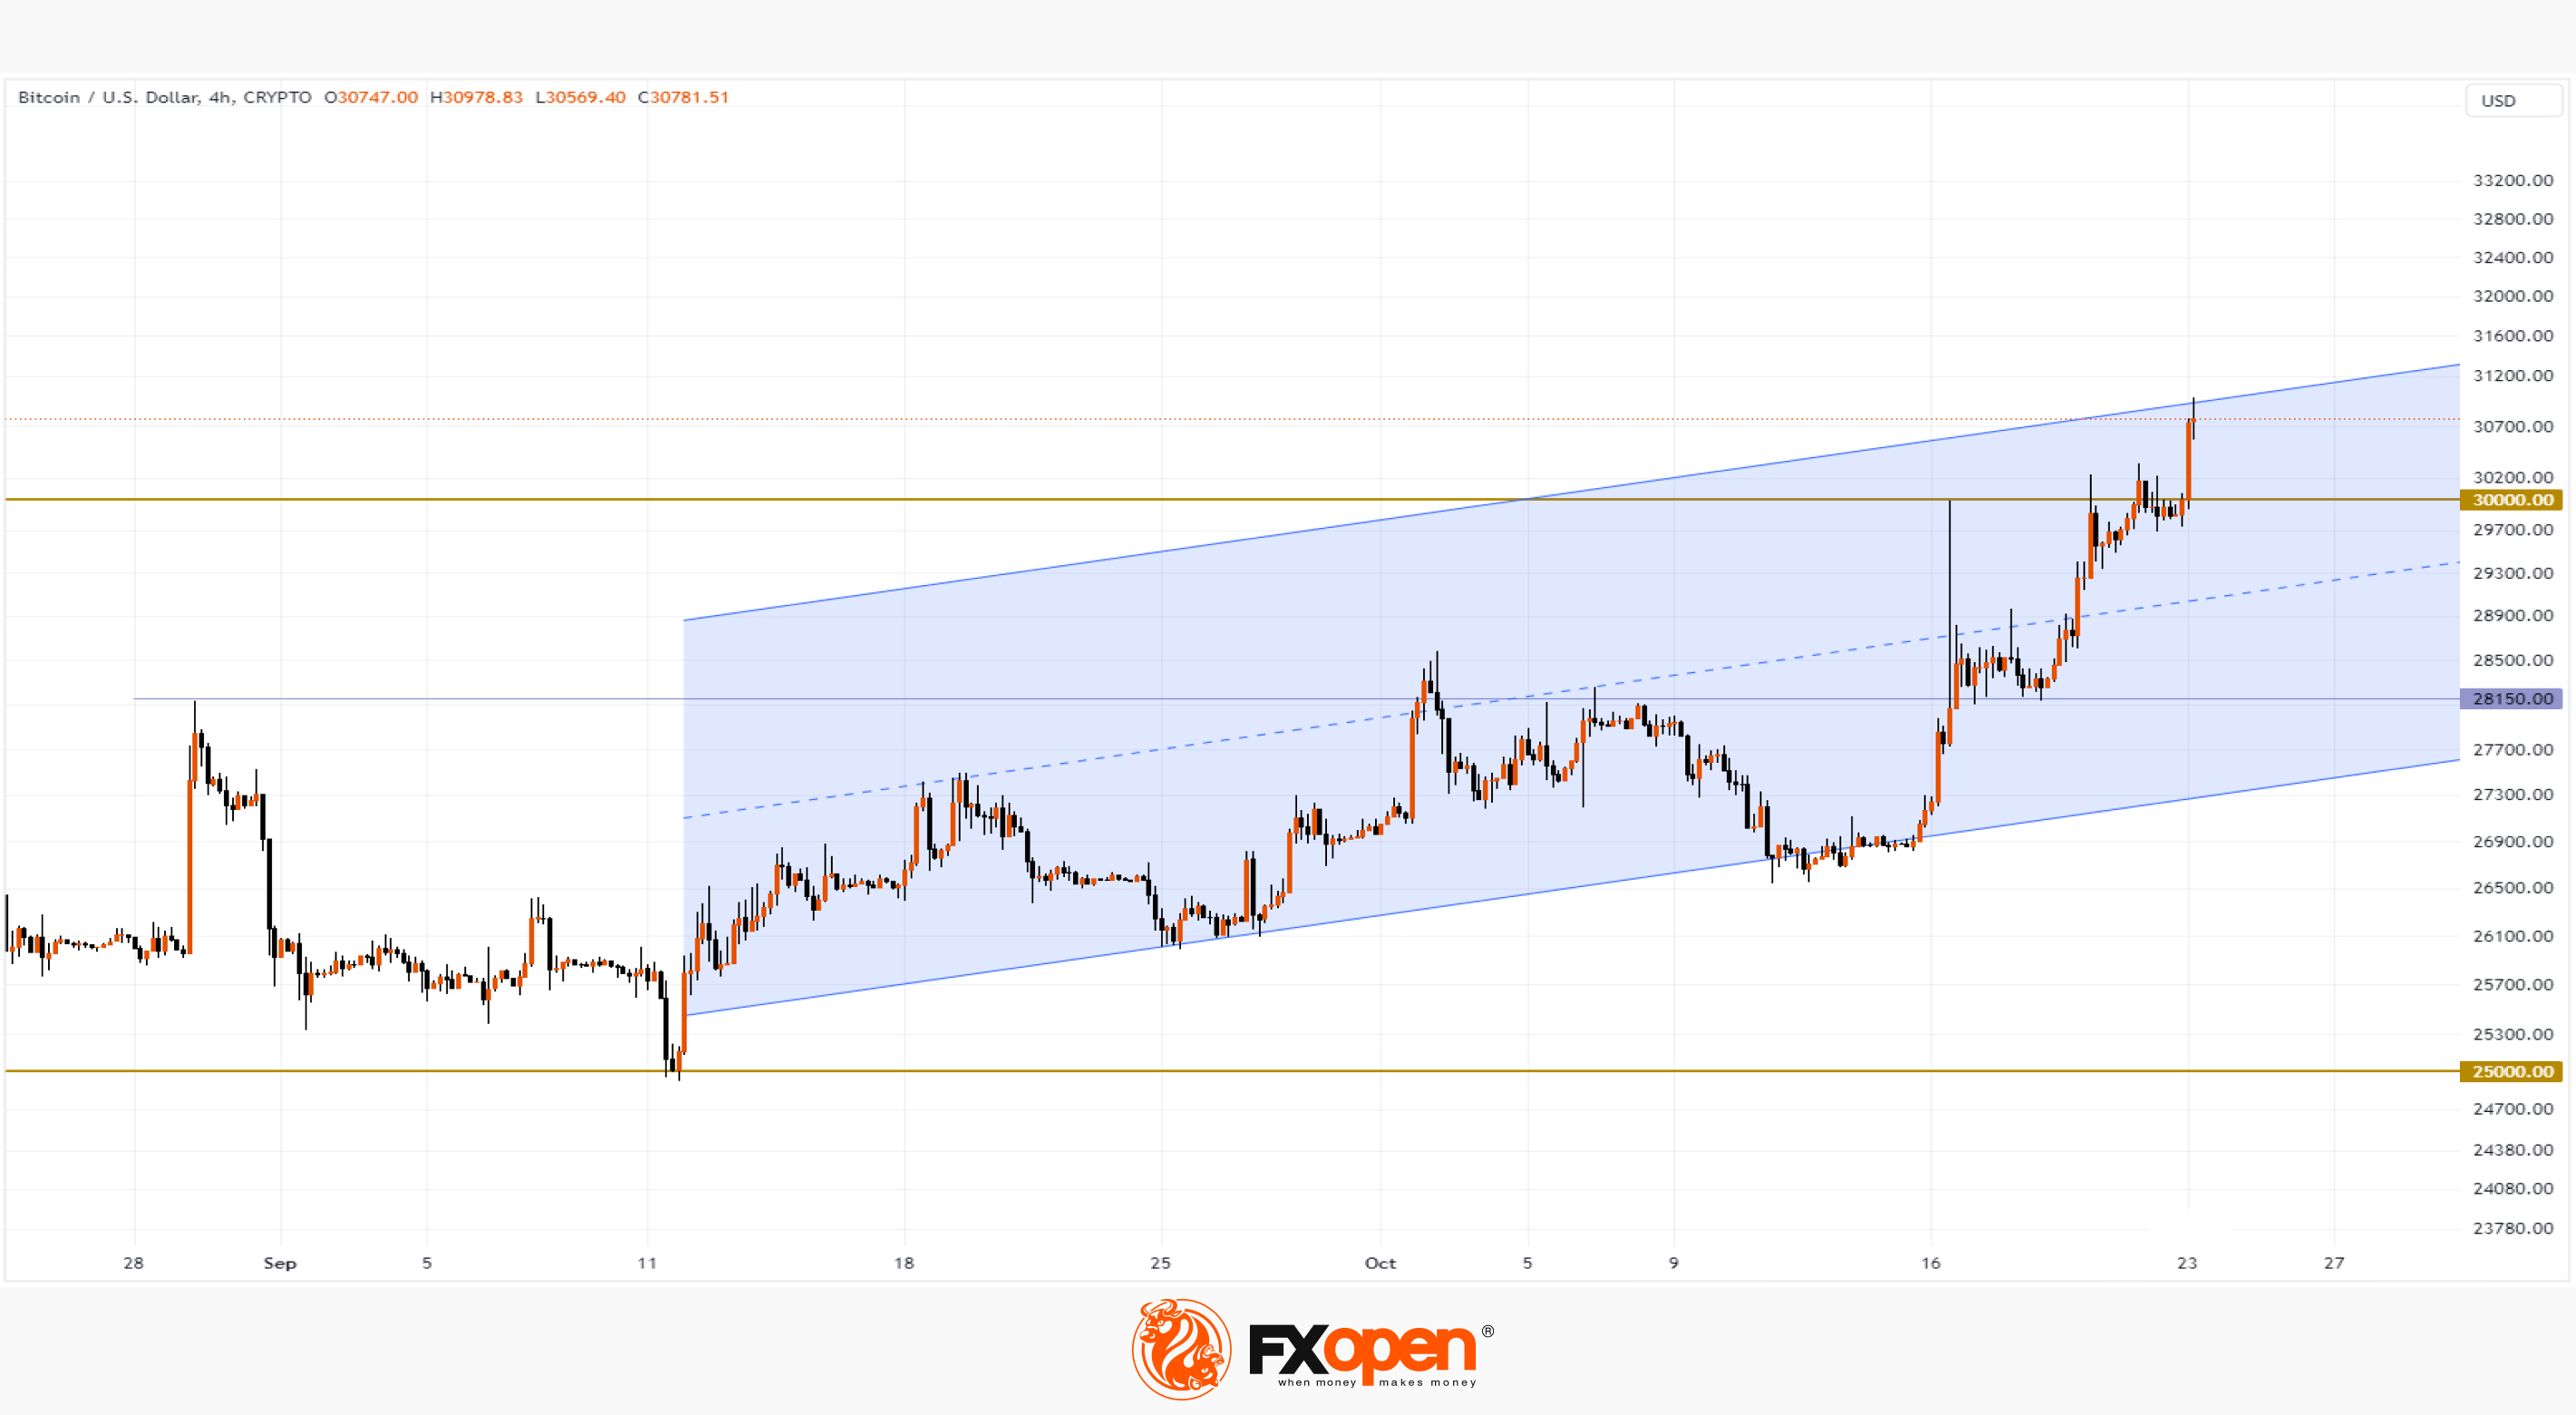
On Friday-Sunday, the price of BTC/USD several times exceeded the round level of 30,000, but the excess was short-lived; soon, the price rolled back down. But the pressure of the bulls did not weaken, and since the beginning of Monday, the price of bitcoin rose above 37,000.
A combination of bullish factors contributed to the rise in bitcoin prices:
→ the threat of a financial crisis in the USA. Congress without a speaker, the budget has not been approved, the S&P-500 is near its 5-month low. Legendary investor Peter Schiff expresses the opinion that a crisis is inevitable due to the actions of the Fed.
→ Expectations that the SEC will approve a bitcoin ETF in the near future, and this will open bitcoin to institutional investors. According to JPMorgan, this will happen within a few months. Positive signals will come from BlackRock and VanEck, which have filed bids.
→ Refusal by the SEC to claim against Ripple Labs.
→ Geopolitical tensions in the Middle East. Bitcoin is gaining relevance as an asset that can become a safe haven for capital.
The graph shows that:
→ the former resistance of 28,100 served as a support for a successful attack on USD 30k;
→ bitcoin price actions since mid-September have formed an ascending channel.
At the peak of the morning bullish momentum on October 23, the BTC/USD rate reached the upper limit of this ascending channel. From a short-term point of view, the price may roll back due to the activation of sellers in the area of the highs of the year and the upper border of the specified channel. But given the fundamental background, it is permissible to assume that the bulls are capable of new achievements.
To benefit from the rise and fall of cryptocurrencies, consider enlisting the services of a trusted broker like FXOpen.
CFDs are complex instruments and come with a high risk of losing your money.
This article represents the opinion of the Companies operating under the FXOpen brand only. It is not to be construed as an offer, solicitation, or recommendation with respect to products and services provided by the Companies operating under the FXOpen brand, nor is it to be considered financial advice.
At FXOpen UK and FXOpen AU, Cryptocurrency CFDs are only available for trading by those clients categorised as Professional clients under FCA Rules and Professional clients under ASIC Rules, respectively. They are not available for trading by Retail clients.
Market Analysis: Bitcoin Breaks Psychological Level of $30k
On Friday-Sunday, the price of BTC/USD several times exceeded the round level of 30,000, but the excess was short-lived; soon, the price rolled back down. But the pressure of the bulls did not weaken, and since the beginning of Monday, the price of bitcoin rose above 37,000.
A combination of bullish factors contributed to the rise in bitcoin prices:
→ the threat of a financial crisis in the USA. Congress without a speaker, the budget has not been approved, the S&P-500 is near its 5-month low. Legendary investor Peter Schiff expresses the opinion that a crisis is inevitable due to the actions of the Fed.
→ Expectations that the SEC will approve a bitcoin ETF in the near future, and this will open bitcoin to institutional investors. According to JPMorgan, this will happen within a few months. Positive signals will come from BlackRock and VanEck, which have filed bids.
→ Refusal by the SEC to claim against Ripple Labs.
→ Geopolitical tensions in the Middle East. Bitcoin is gaining relevance as an asset that can become a safe haven for capital.
The graph shows that:
→ the former resistance of 28,100 served as a support for a successful attack on USD 30k;
→ bitcoin price actions since mid-September have formed an ascending channel.
At the peak of the morning bullish momentum on October 23, the BTC/USD rate reached the upper limit of this ascending channel. From a short-term point of view, the price may roll back due to the activation of sellers in the area of the highs of the year and the upper border of the specified channel. But given the fundamental background, it is permissible to assume that the bulls are capable of new achievements.
To benefit from the rise and fall of cryptocurrencies, consider enlisting the services of a trusted broker like FXOpen.
CFDs are complex instruments and come with a high risk of losing your money.
This article represents the opinion of the Companies operating under the FXOpen brand only. It is not to be construed as an offer, solicitation, or recommendation with respect to products and services provided by the Companies operating under the FXOpen brand, nor is it to be considered financial advice.
At FXOpen UK and FXOpen AU, Cryptocurrency CFDs are only available for trading by those clients categorised as Professional clients under FCA Rules and Professional clients under ASIC Rules, respectively. They are not available for trading by Retail clients.
#marketanalysis #crypto #bitcoin
Cryptocurrency Market Capitalization Sets Year's High
Amid the frenzy over expectations that the SEC will approve applications for spot bitcoin ETFs, the cryptocurrency market capitalization reached USD 1.25 trillion this morning, for the first time in 2023. Expectations have increased following reports that the US Securities and Exchange Commission will not appeal a court ruling that the rejection of Grayscale Investments' ETF application was improper.
It is important to understand that an ETF is a financial instrument that will allow a wide range of people to easily officially invest in bitcoin without opening an account on a crypto exchange, which can be associated with difficulties and dangers.
Although there has been no official announcement yet, the news background is extremely positive:
→ Blackrock is rumoured to have informed the SEC that it will begin buying BTC for its BTC ETF;
→ Blackrock spot BTC ETF has appeared on the lists of clearing house DTCC with the ticker IBTC.
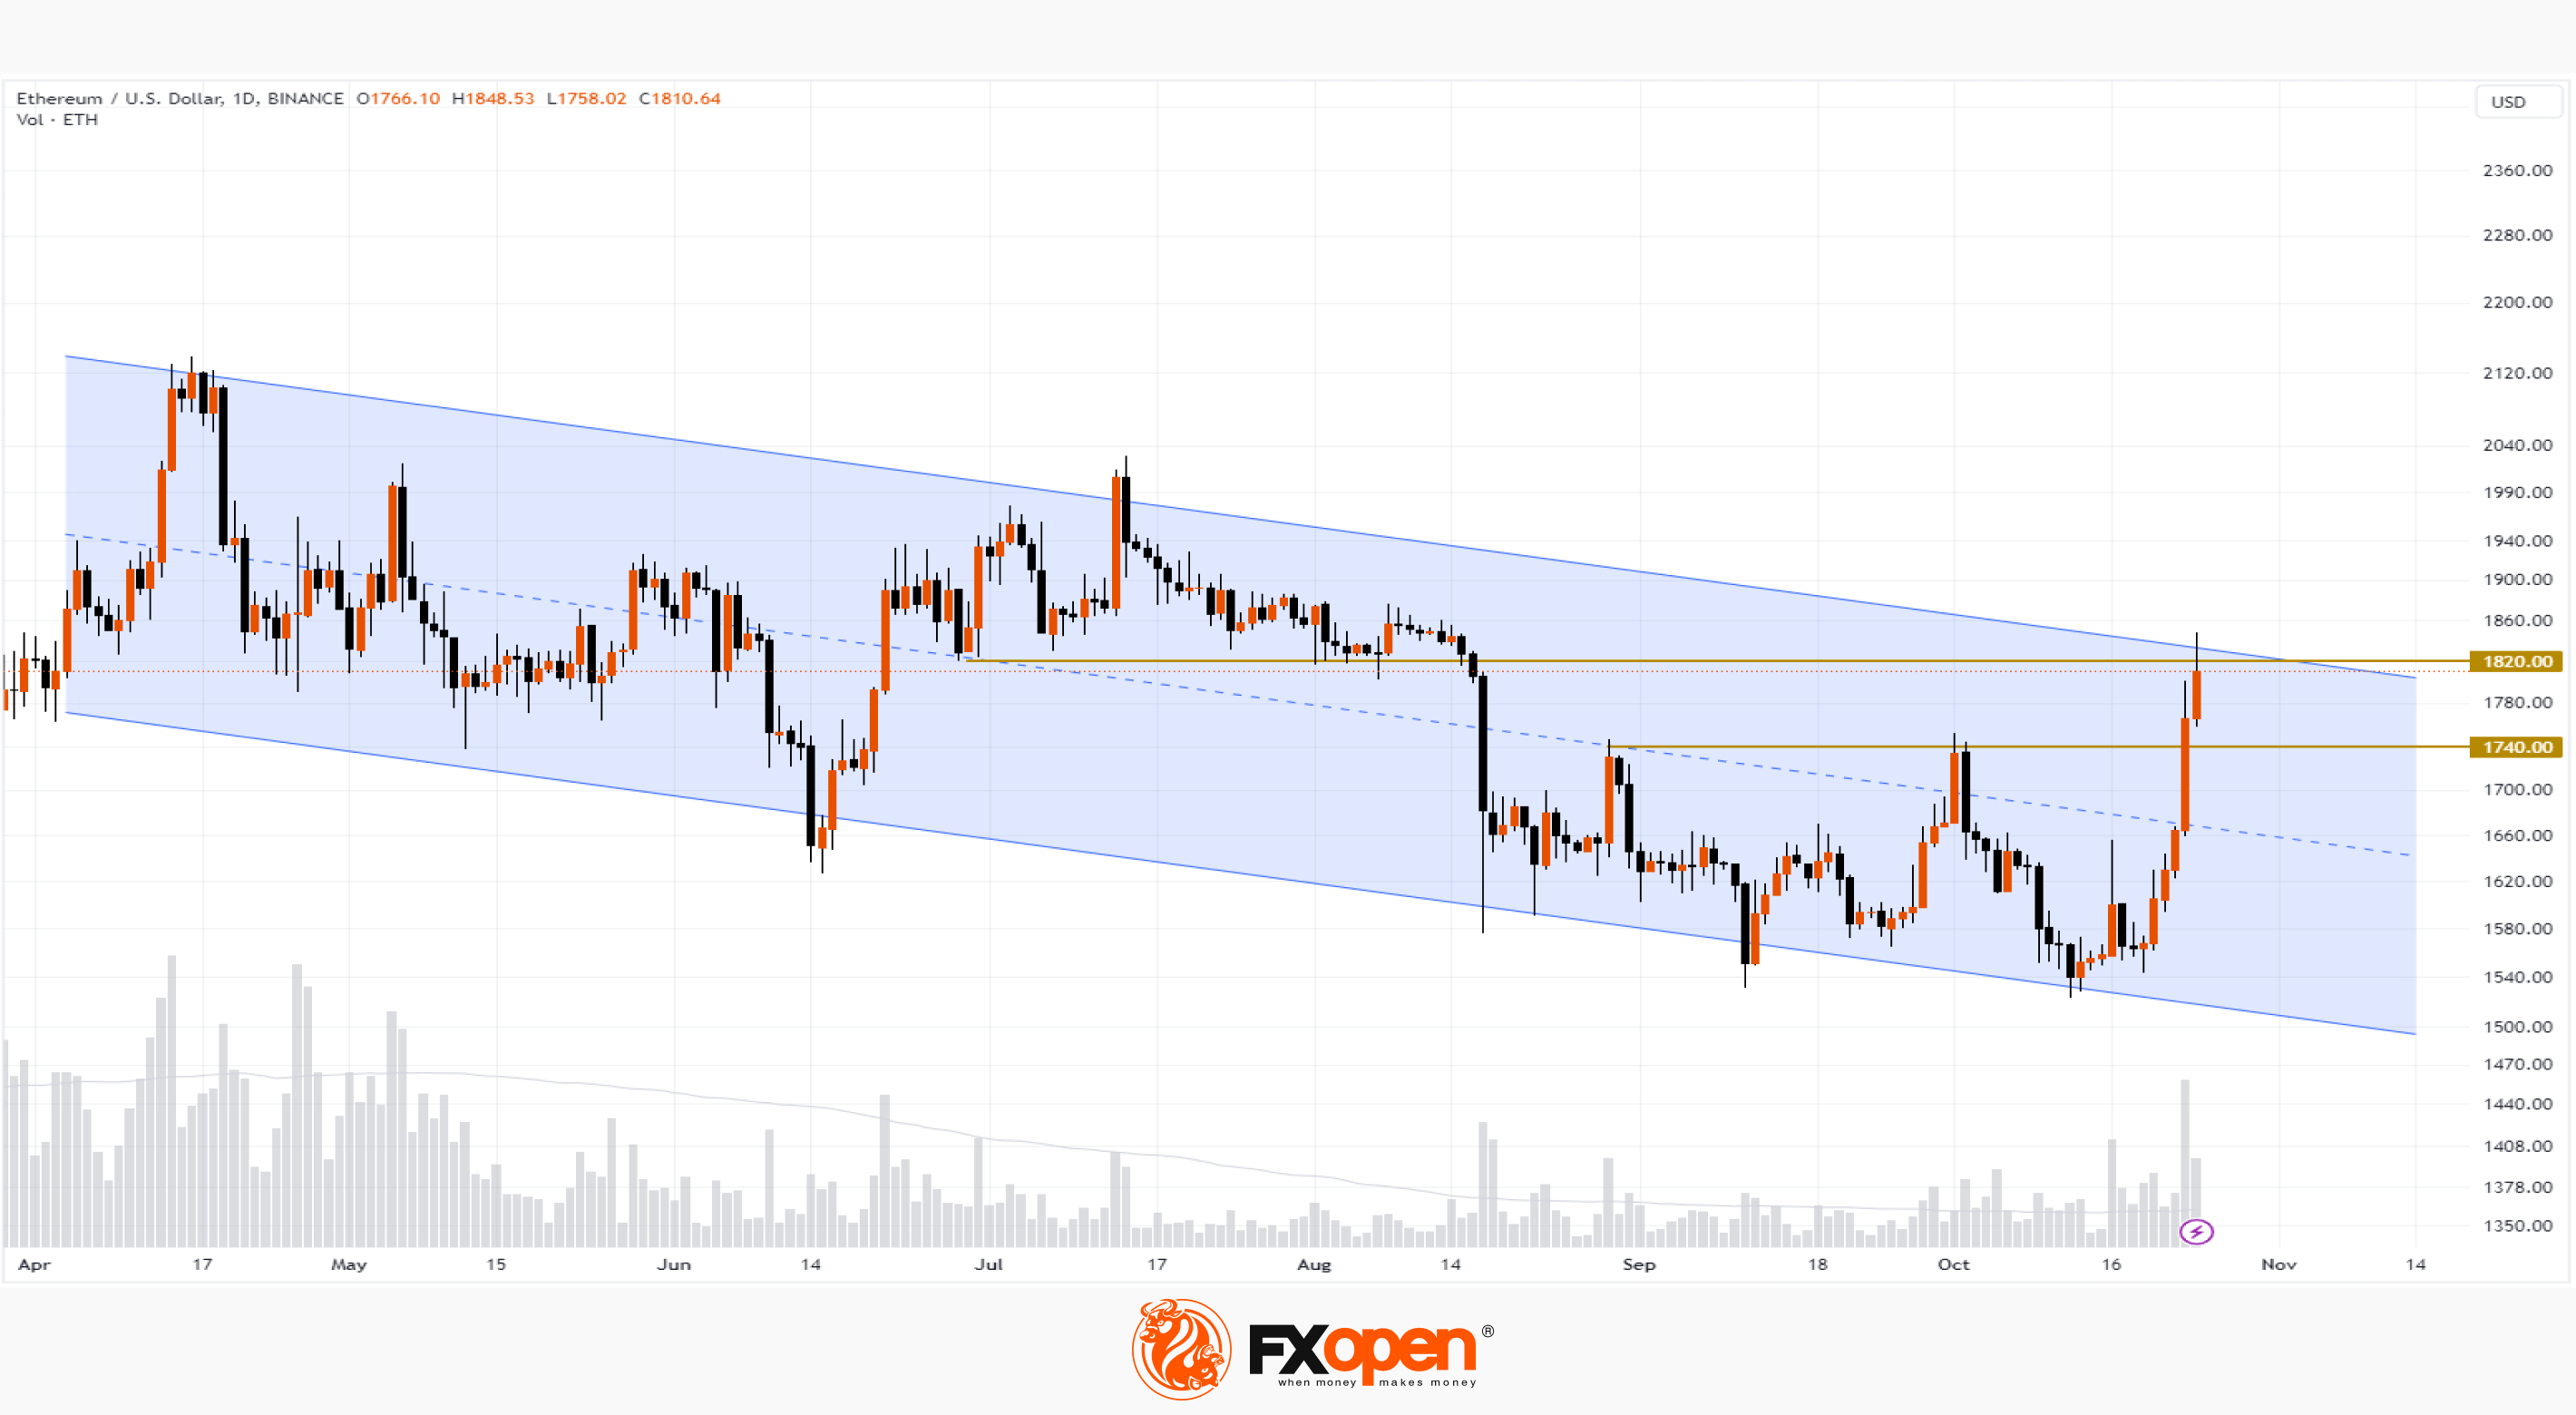
The growth leader, of course, is bitcoin. Its price reached USD 35k this morning — for the first time since May 2022. Following this, other assets also perked up – in particular, Ethereum, the second most important cryptocurrency, rose above USD 1,800.
The chart shows that ETH/USD:
→ the ETH price is near the upper limit of the downward channel that has been in effect since May of this year;
→ level 1,820 may provide resistance;
→ the price of ETH has exceeded the level of 1,740, which can now provide support.
It is worth noting that when (and if) the application for a bitcoin ETF is officially approved, the price of the coin may even weaken, since the market looks overbought and is already taking into account the effect of what will happen. However, BTC could be followed by a rush for Ethereum ETFs.
To benefit from the rise and fall of cryptocurrency prices, consider enlisting the services of a trusted broker like FXOpen.
CFDs are complex instruments and come with a high risk of losing your money.
This article represents the opinion of the Companies operating under the FXOpen brand only. It is not to be construed as an offer, solicitation, or recommendation with respect to products and services provided by the Companies operating under the FXOpen brand, nor is it to be considered financial advice.
At FXOpen UK and FXOpen AU, Cryptocurrency CFDs are only available for trading by those clients categorised as Professional clients under FCA Rules and Professional clients under ASIC Rules, respectively. They are not available for trading by Retail clients.
Cryptocurrency Market Capitalization Sets Year's High
Amid the frenzy over expectations that the SEC will approve applications for spot bitcoin ETFs, the cryptocurrency market capitalization reached USD 1.25 trillion this morning, for the first time in 2023. Expectations have increased following reports that the US Securities and Exchange Commission will not appeal a court ruling that the rejection of Grayscale Investments' ETF application was improper.
It is important to understand that an ETF is a financial instrument that will allow a wide range of people to easily officially invest in bitcoin without opening an account on a crypto exchange, which can be associated with difficulties and dangers.
Although there has been no official announcement yet, the news background is extremely positive:
→ Blackrock is rumoured to have informed the SEC that it will begin buying BTC for its BTC ETF;
→ Blackrock spot BTC ETF has appeared on the lists of clearing house DTCC with the ticker IBTC.
The growth leader, of course, is bitcoin. Its price reached USD 35k this morning — for the first time since May 2022. Following this, other assets also perked up – in particular, Ethereum, the second most important cryptocurrency, rose above USD 1,800.
The chart shows that ETH/USD:
→ the ETH price is near the upper limit of the downward channel that has been in effect since May of this year;
→ level 1,820 may provide resistance;
→ the price of ETH has exceeded the level of 1,740, which can now provide support.
It is worth noting that when (and if) the application for a bitcoin ETF is officially approved, the price of the coin may even weaken, since the market looks overbought and is already taking into account the effect of what will happen. However, BTC could be followed by a rush for Ethereum ETFs.
To benefit from the rise and fall of cryptocurrency prices, consider enlisting the services of a trusted broker like FXOpen.
CFDs are complex instruments and come with a high risk of losing your money.
This article represents the opinion of the Companies operating under the FXOpen brand only. It is not to be construed as an offer, solicitation, or recommendation with respect to products and services provided by the Companies operating under the FXOpen brand, nor is it to be considered financial advice.
At FXOpen UK and FXOpen AU, Cryptocurrency CFDs are only available for trading by those clients categorised as Professional clients under FCA Rules and Professional clients under ASIC Rules, respectively. They are not available for trading by Retail clients.
#marketanalysis #stockmarket #stocks
Market Analysis: Eurostoxx 50 at Important Support. Production in Europe is Declining
As data released this morning showed:
→ Purchasing Managers' Index (PMI) in France: actual = 42.6, expected = 44.4, a month ago = 43.6. Thus, the index dropped to its lowest level since the panic associated with the spread of coronavirus.
→ PMI in Germany: actual = 40.7, expected = 40.1, a month ago = 39.8.
Since the values of the PMI index (considered a leading indicator of the state of the economy, calculated by S&P Global) are significantly below 50, this indicates a contraction of the economy in the 2 most important countries of Europe in the context of high interest rates.
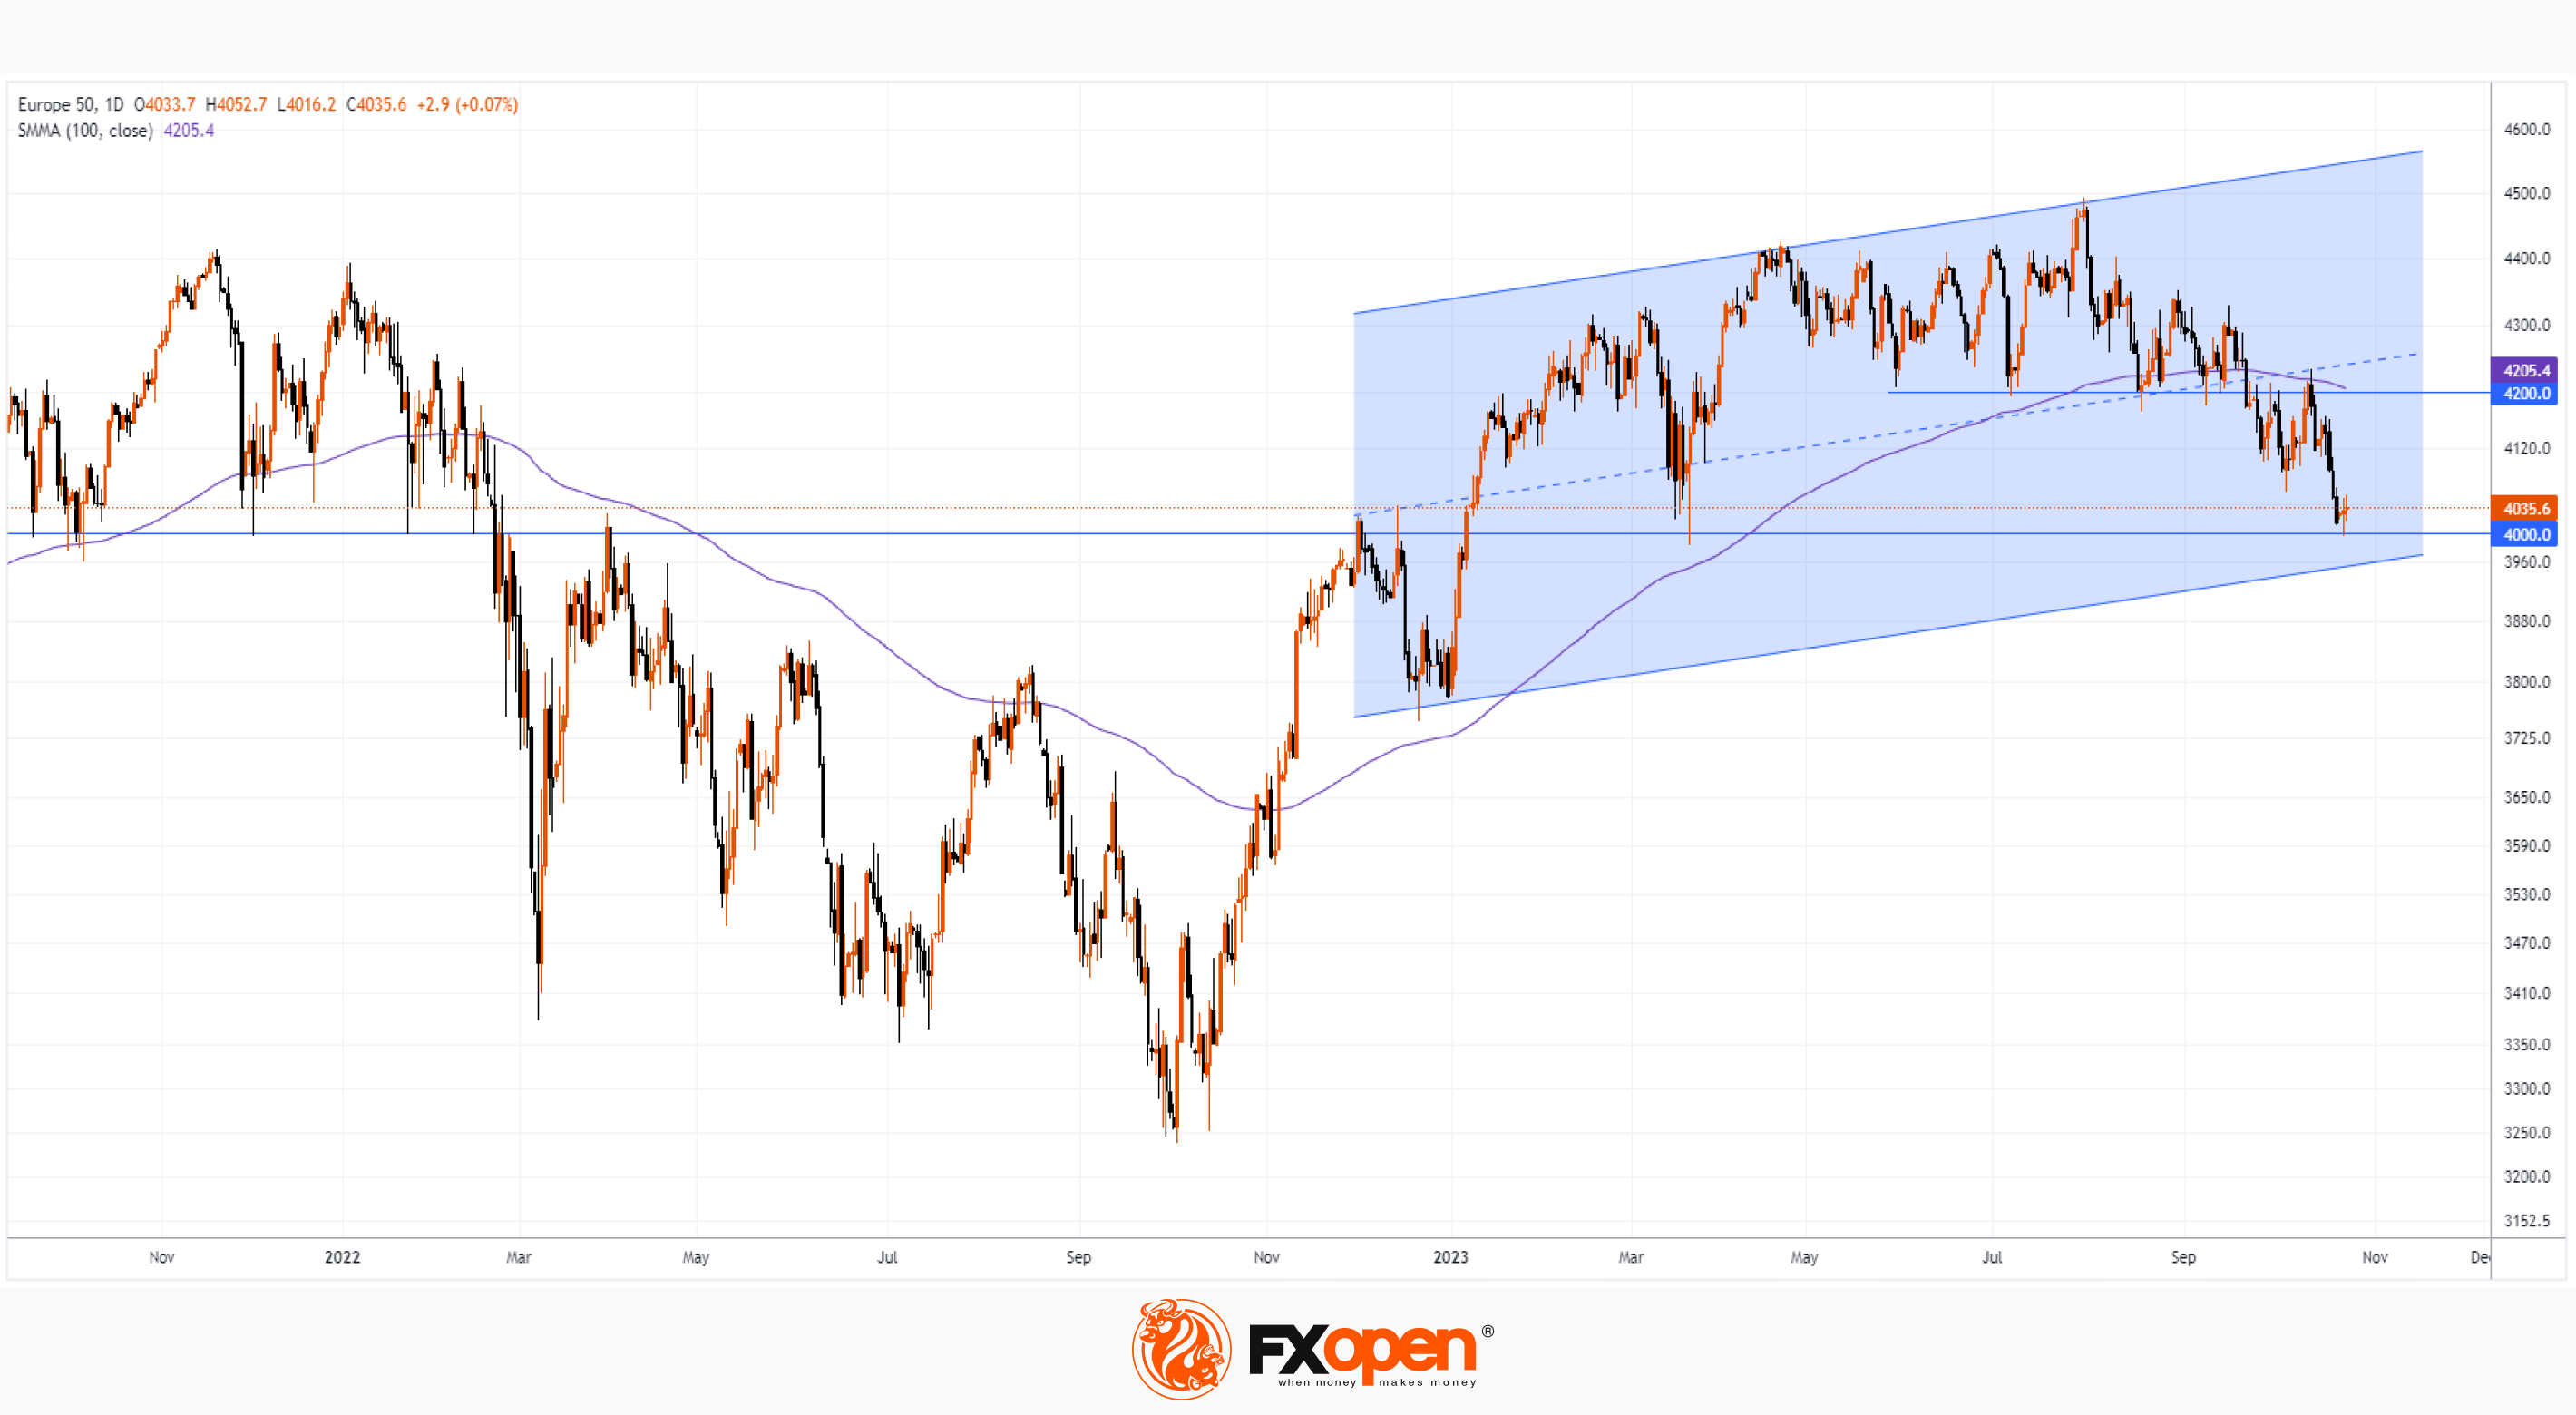
It is not surprising that the European stock index Eurostoxx 50 shows bearish dynamics: the price is below the SMA (100), which is directed downwards. The publication of PMI values added negativity. Will the bearish trend continue?
The Eurostoxx 50 chart gives hope, because the Eurostoxx 50 has dropped to key support, which is located at the psychological level of 4,000. In the past, this level has had a noticeable impact on market dynamics: the price either bounced or made a breakout with a subsequent test. This psychological level property can be used to find an entry point into a position while reducing risk.
It is possible that the level of 4,000 may become a factor for the emergence of a bullish impulse, which will lead to a noticeable rebound; the proximity to the lower line of the ascending channel (shown in blue) can also add courage to the bulls.
But for the rebound to develop into a sustainable upward trend, it can be assumed that positive evidence about the state of the European economy will be required.
To benefit from trends in the stock index markets, consider enlisting the services of a trusted broker like FXOpen.
CFDs are complex instruments and come with a high risk of losing your money.
This article represents the opinion of the Companies operating under the FXOpen brand only. It is not to be construed as an offer, solicitation, or recommendation with respect to products and services provided by the Companies operating under the FXOpen brand, nor is it to be considered financial advice.
Market Analysis: Eurostoxx 50 at Important Support. Production in Europe is Declining
As data released this morning showed:
→ Purchasing Managers' Index (PMI) in France: actual = 42.6, expected = 44.4, a month ago = 43.6. Thus, the index dropped to its lowest level since the panic associated with the spread of coronavirus.
→ PMI in Germany: actual = 40.7, expected = 40.1, a month ago = 39.8.
Since the values of the PMI index (considered a leading indicator of the state of the economy, calculated by S&P Global) are significantly below 50, this indicates a contraction of the economy in the 2 most important countries of Europe in the context of high interest rates.
It is not surprising that the European stock index Eurostoxx 50 shows bearish dynamics: the price is below the SMA (100), which is directed downwards. The publication of PMI values added negativity. Will the bearish trend continue?
The Eurostoxx 50 chart gives hope, because the Eurostoxx 50 has dropped to key support, which is located at the psychological level of 4,000. In the past, this level has had a noticeable impact on market dynamics: the price either bounced or made a breakout with a subsequent test. This psychological level property can be used to find an entry point into a position while reducing risk.
It is possible that the level of 4,000 may become a factor for the emergence of a bullish impulse, which will lead to a noticeable rebound; the proximity to the lower line of the ascending channel (shown in blue) can also add courage to the bulls.
But for the rebound to develop into a sustainable upward trend, it can be assumed that positive evidence about the state of the European economy will be required.
To benefit from trends in the stock index markets, consider enlisting the services of a trusted broker like FXOpen.
CFDs are complex instruments and come with a high risk of losing your money.
This article represents the opinion of the Companies operating under the FXOpen brand only. It is not to be construed as an offer, solicitation, or recommendation with respect to products and services provided by the Companies operating under the FXOpen brand, nor is it to be considered financial advice.
#marketanalysis #tradingforex #tradingtips
AUD/USD Analysis: The Rate Reacts Sharply to News About Inflation
Today in Australia, data from the CPI indicator was published, which came as an unpleasant surprise, indicating that inflation in Australia does not want to decline:
Core Price Index was: actual = 5.6%, expected = 5.3%, a month earlier = 5.2%, two months earlier = 4.9%.
Perhaps the reason that inflation is raising its head again is high prices on the world oil market.
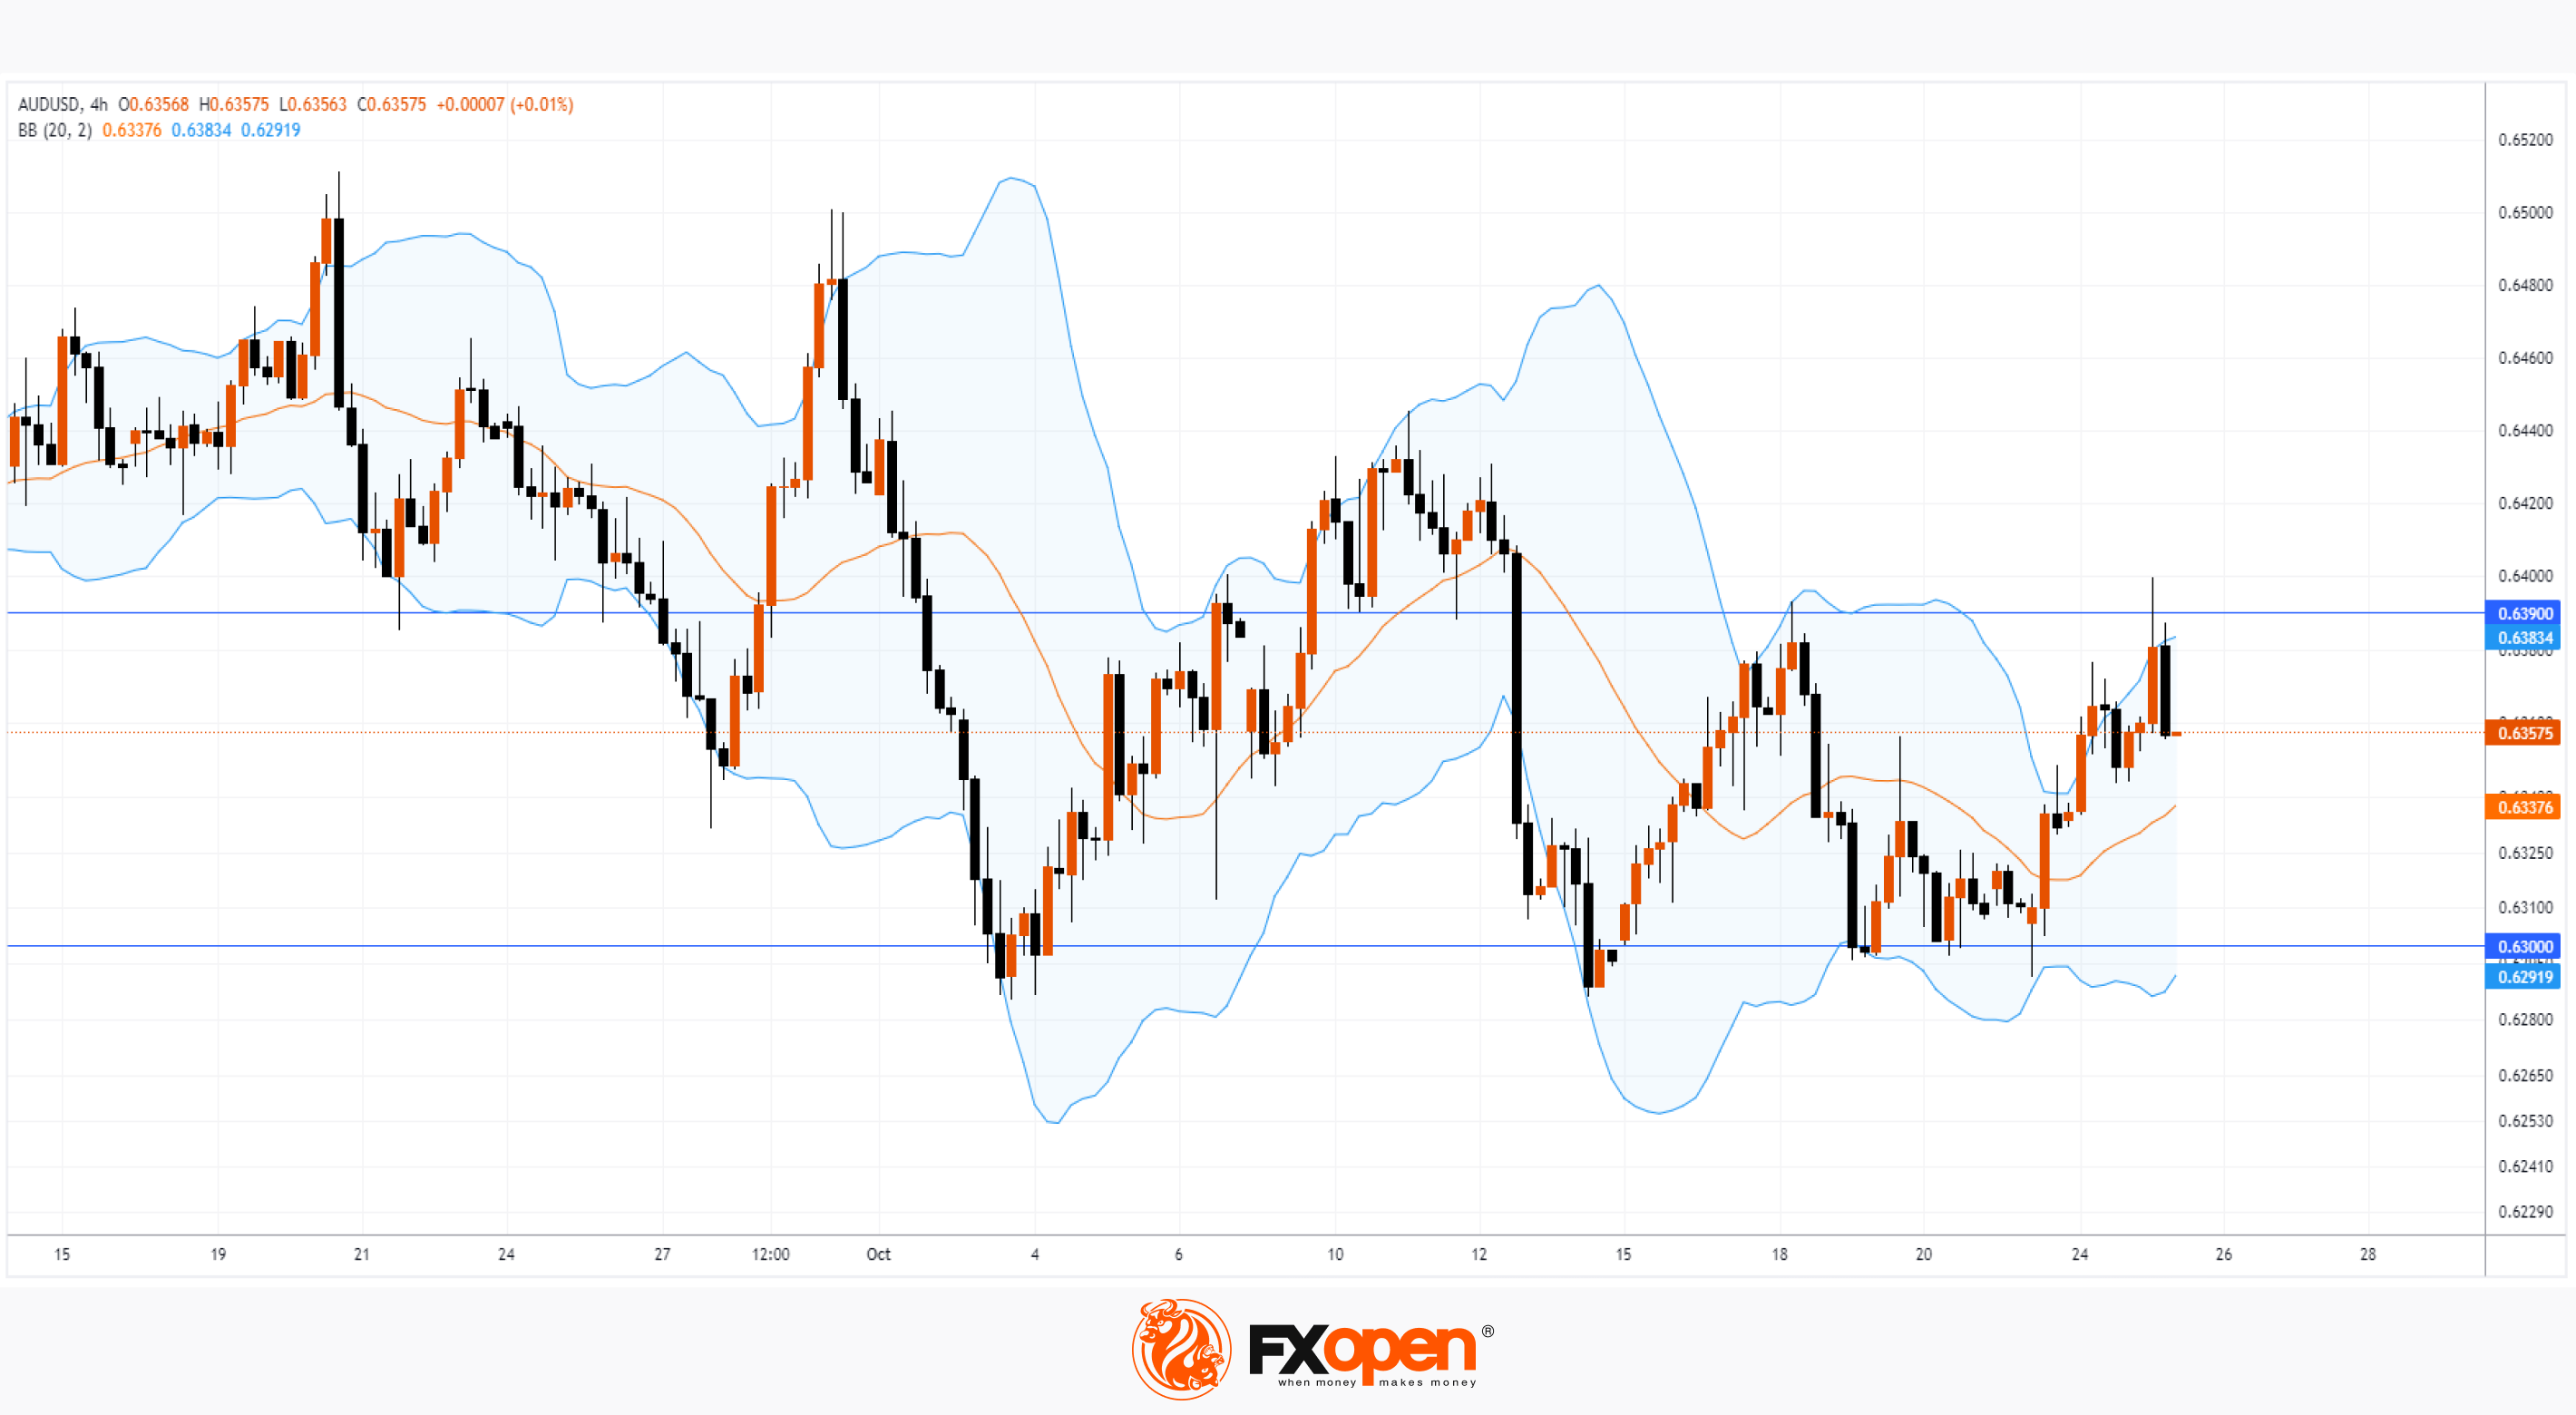
One way or another, the AUD/USD chart shows a surge in volatility and a sharp downward reversal from the level of 0.63900. The multidirectionality of impulses may indicate that the news was indeed unexpected.
According to Reuters, two of Australia's four largest banks — the Commonwealth Bank of Australia and ANZ — now expect a quarter-point rate hike in November. “While the current level of 4.35% could mark the peak of the cash rate, there is a risk that policy could tighten further. Any easing is still a long way off,” bank analysts say.
Meanwhile, the last two candles on the chart show the change in sentiment today. At the same time, the price returned to the channel formed by Bollinger bands.
It is possible that:
→ candles will complete the formation of a bearish engulfing pattern;
→ the momentum will continue, and the price will drop to the lower Bollinger band, where there is important support at 0.630. Note that in the fall of 2022, large trading volumes were recorded at this level, from which the AUD/USD rate rose sharply to a maximum of 2023. Surely, the level of 0.630 is important from a fundamental point of view.
Note that a speech by the head of the Central Bank of Australia is scheduled for tomorrow 01:00 GMT+3, whose statements may cause new impulses.
To benefit from price fluctuations in the foreign exchange market, consider enlisting the services of a trusted broker like FXOpen.
CFDs are complex instruments and come with a high risk of losing your money.
This article represents the opinion of the Companies operating under the FXOpen brand only. It is not to be construed as an offer, solicitation, or recommendation with respect to products and services provided by the Companies operating under the FXOpen brand, nor is it to be considered financial advice.
AUD/USD Analysis: The Rate Reacts Sharply to News About Inflation
Today in Australia, data from the CPI indicator was published, which came as an unpleasant surprise, indicating that inflation in Australia does not want to decline:
Core Price Index was: actual = 5.6%, expected = 5.3%, a month earlier = 5.2%, two months earlier = 4.9%.
Perhaps the reason that inflation is raising its head again is high prices on the world oil market.
One way or another, the AUD/USD chart shows a surge in volatility and a sharp downward reversal from the level of 0.63900. The multidirectionality of impulses may indicate that the news was indeed unexpected.
According to Reuters, two of Australia's four largest banks — the Commonwealth Bank of Australia and ANZ — now expect a quarter-point rate hike in November. “While the current level of 4.35% could mark the peak of the cash rate, there is a risk that policy could tighten further. Any easing is still a long way off,” bank analysts say.
Meanwhile, the last two candles on the chart show the change in sentiment today. At the same time, the price returned to the channel formed by Bollinger bands.
It is possible that:
→ candles will complete the formation of a bearish engulfing pattern;
→ the momentum will continue, and the price will drop to the lower Bollinger band, where there is important support at 0.630. Note that in the fall of 2022, large trading volumes were recorded at this level, from which the AUD/USD rate rose sharply to a maximum of 2023. Surely, the level of 0.630 is important from a fundamental point of view.
Note that a speech by the head of the Central Bank of Australia is scheduled for tomorrow 01:00 GMT+3, whose statements may cause new impulses.
To benefit from price fluctuations in the foreign exchange market, consider enlisting the services of a trusted broker like FXOpen.
CFDs are complex instruments and come with a high risk of losing your money.
This article represents the opinion of the Companies operating under the FXOpen brand only. It is not to be construed as an offer, solicitation, or recommendation with respect to products and services provided by the Companies operating under the FXOpen brand, nor is it to be considered financial advice.
#marketanalysis #stockmarket #GOOGL #stockprice
Google Report Crashes Stock Price
Shares of GOOG and GOOGL fell about 9.5% on Wednesday, wiping Google's parent company's market value by USD 166.64 billion, the fifth-largest decline in capitalization history, according to Dow Jones Market Data.
It is noteworthy that the drop occurred as a result of the publication of a report that turned out to be better than expected:
→ earnings per share: actual = USD 1.55, forecast = USD 1.45;
→ gross income: actual = USD 76.69 billion; forecast = USD 75.95.
Why did Google's stock price collapse? Among the reasons may be the fact that revenue from cloud-based services has shown a decline. It amounted to USD 8.41 billion, which is about 2% below expectations of USD 8.6 billion, although in the same quarter last year it was equal to USD 6.87 billion, that is, an increase of 22% over the year.
However, Dan Ives of Wedbush Securities said the stock's negative reaction was "overblown." And according to analysts at Mizuho Americas, the decline in cloud revenue will be "temporary," based on what they've seen in rival Amazon's cloud business.
If the price decline continues, how deep can it be?
From a technical analysis perspective, there has been a bearish breakout of the contracting triangle (bearish wedge pattern, shown in blue lines). Having estimated the width of the wedge at points A and B, approximately = USD 126 - USD 106 = USD 20, we can plot this distance down from the breakout point C to get a guideline for point D = USD 134 - USD 20 = USD 114. That is, presumably, the price is aimed at the May gap zone.
However, to reach this level, the bears will have to overcome support around the USD 126 level, where the price now lies, having found support during yesterday's history-making decline. This support comes from a line (shown as a dotted line) parallel to the upper boundary of the bearish wedge, as well as from the $126 horizontal, which has interacted significantly with the stock price in the past. It is possible that the bears will be helped by a negative political and geopolitical background.
To benefit from the rise and fall of major stocks, consider enlisting the services of a trusted broker like FXOpen.
CFDs are complex instruments and come with a high risk of losing your money.
This article represents the opinion of the Companies operating under the FXOpen brand only. It is not to be construed as an offer, solicitation, or recommendation with respect to products and services provided by the Companies operating under the FXOpen brand, nor is it to be considered financial advice.
Google Report Crashes Stock Price
Shares of GOOG and GOOGL fell about 9.5% on Wednesday, wiping Google's parent company's market value by USD 166.64 billion, the fifth-largest decline in capitalization history, according to Dow Jones Market Data.
It is noteworthy that the drop occurred as a result of the publication of a report that turned out to be better than expected:
→ earnings per share: actual = USD 1.55, forecast = USD 1.45;
→ gross income: actual = USD 76.69 billion; forecast = USD 75.95.
Why did Google's stock price collapse? Among the reasons may be the fact that revenue from cloud-based services has shown a decline. It amounted to USD 8.41 billion, which is about 2% below expectations of USD 8.6 billion, although in the same quarter last year it was equal to USD 6.87 billion, that is, an increase of 22% over the year.
However, Dan Ives of Wedbush Securities said the stock's negative reaction was "overblown." And according to analysts at Mizuho Americas, the decline in cloud revenue will be "temporary," based on what they've seen in rival Amazon's cloud business.
If the price decline continues, how deep can it be?
From a technical analysis perspective, there has been a bearish breakout of the contracting triangle (bearish wedge pattern, shown in blue lines). Having estimated the width of the wedge at points A and B, approximately = USD 126 - USD 106 = USD 20, we can plot this distance down from the breakout point C to get a guideline for point D = USD 134 - USD 20 = USD 114. That is, presumably, the price is aimed at the May gap zone.
However, to reach this level, the bears will have to overcome support around the USD 126 level, where the price now lies, having found support during yesterday's history-making decline. This support comes from a line (shown as a dotted line) parallel to the upper boundary of the bearish wedge, as well as from the $126 horizontal, which has interacted significantly with the stock price in the past. It is possible that the bears will be helped by a negative political and geopolitical background.
To benefit from the rise and fall of major stocks, consider enlisting the services of a trusted broker like FXOpen.
CFDs are complex instruments and come with a high risk of losing your money.
This article represents the opinion of the Companies operating under the FXOpen brand only. It is not to be construed as an offer, solicitation, or recommendation with respect to products and services provided by the Companies operating under the FXOpen brand, nor is it to be considered financial advice.
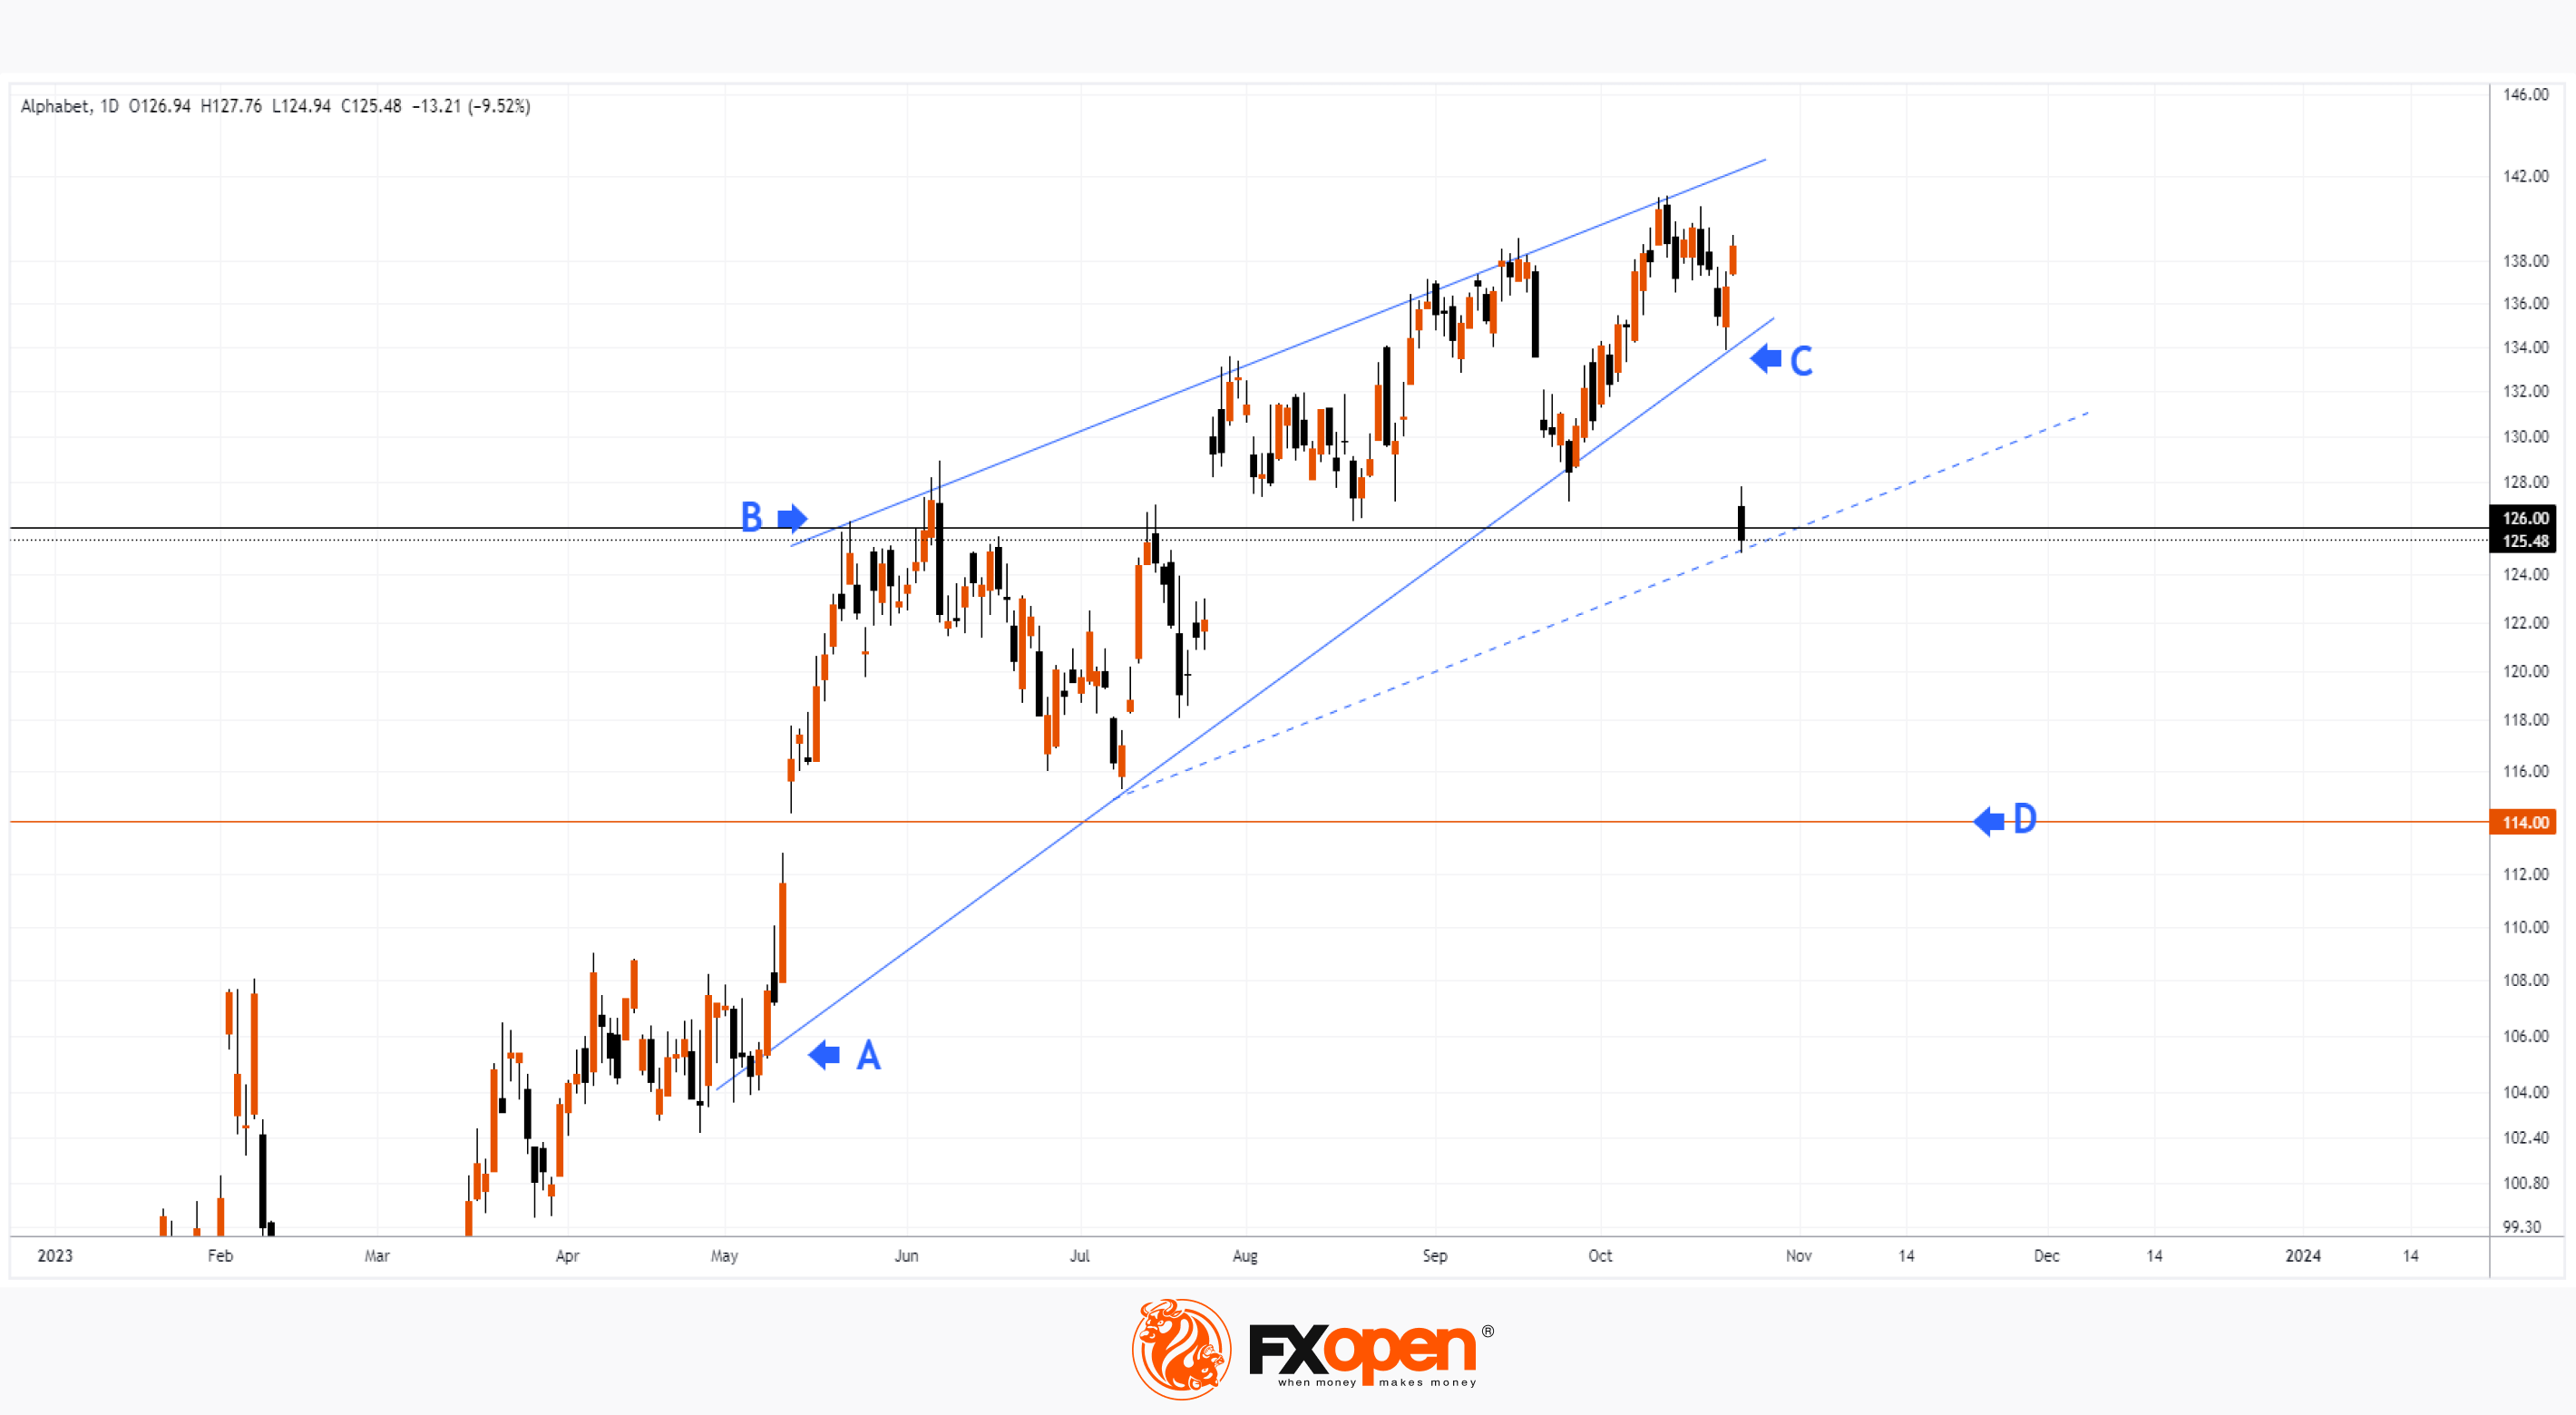
#marketanalysis #META #stockmarket #stocktrading
Market Analysis: Despite Strong Report, META Shares Fall 3%
Like Google, META demonstrated that the price can fall if the quarterly report is better than expected:
→ Earnings per share: actual = USD 4.39, expectation = USD 3.63.
→ Revenue: actual = USD 34.15 billion, expectations = USD 33.56 billion
→ Number of daily active users: fact = 2.09 billion, expectation = 2.07 billion according to StreetAccount.
META's share price initially rose in post-market trading but then reversed course and fell more than 3% following cautionary comments from CFO Susan Lee about the impact of military conflict in the Middle East on the advertising market.
Thus, the META stock price may have received a bullish boost from the psychological level of USD 300, but it is possible that it will receive a bearish one because the opening price on Thursday could be around USD 290.
In the analysis of the META share price on October 3, we paid attention to the candle from July 27, when the high of the year was formed — then, extremely high volumes were recorded on the NASDAQ exchange. They can be interpreted as the desire of large players to fix profits from long positions.
Since then, the price has updated its high of the year around the USD 325 level, but this update turned into a classic bear trap. Thus, a large-scale double top pattern has formed on the chart, which will most likely lead to a bearish breakout of the ascending channel (shown in blue).
When a breakout occurs, a gap will likely form, which can serve as resistance. The bulls may be given hope by the level of USD 175 per share, which previously supported META shares.
To benefit from price movements in the popular stock markets, consider enlisting the services of a trusted broker like FXOpen.
CFDs are complex instruments and come with a high risk of losing your money.
This article represents the opinion of the Companies operating under the FXOpen brand only. It is not to be construed as an offer, solicitation, or recommendation with respect to products and services provided by the Companies operating under the FXOpen brand, nor is it to be considered financial advice.
Market Analysis: Despite Strong Report, META Shares Fall 3%
Like Google, META demonstrated that the price can fall if the quarterly report is better than expected:
→ Earnings per share: actual = USD 4.39, expectation = USD 3.63.
→ Revenue: actual = USD 34.15 billion, expectations = USD 33.56 billion
→ Number of daily active users: fact = 2.09 billion, expectation = 2.07 billion according to StreetAccount.
META's share price initially rose in post-market trading but then reversed course and fell more than 3% following cautionary comments from CFO Susan Lee about the impact of military conflict in the Middle East on the advertising market.
Thus, the META stock price may have received a bullish boost from the psychological level of USD 300, but it is possible that it will receive a bearish one because the opening price on Thursday could be around USD 290.
In the analysis of the META share price on October 3, we paid attention to the candle from July 27, when the high of the year was formed — then, extremely high volumes were recorded on the NASDAQ exchange. They can be interpreted as the desire of large players to fix profits from long positions.
Since then, the price has updated its high of the year around the USD 325 level, but this update turned into a classic bear trap. Thus, a large-scale double top pattern has formed on the chart, which will most likely lead to a bearish breakout of the ascending channel (shown in blue).
When a breakout occurs, a gap will likely form, which can serve as resistance. The bulls may be given hope by the level of USD 175 per share, which previously supported META shares.
To benefit from price movements in the popular stock markets, consider enlisting the services of a trusted broker like FXOpen.
CFDs are complex instruments and come with a high risk of losing your money.
This article represents the opinion of the Companies operating under the FXOpen brand only. It is not to be construed as an offer, solicitation, or recommendation with respect to products and services provided by the Companies operating under the FXOpen brand, nor is it to be considered financial advice.
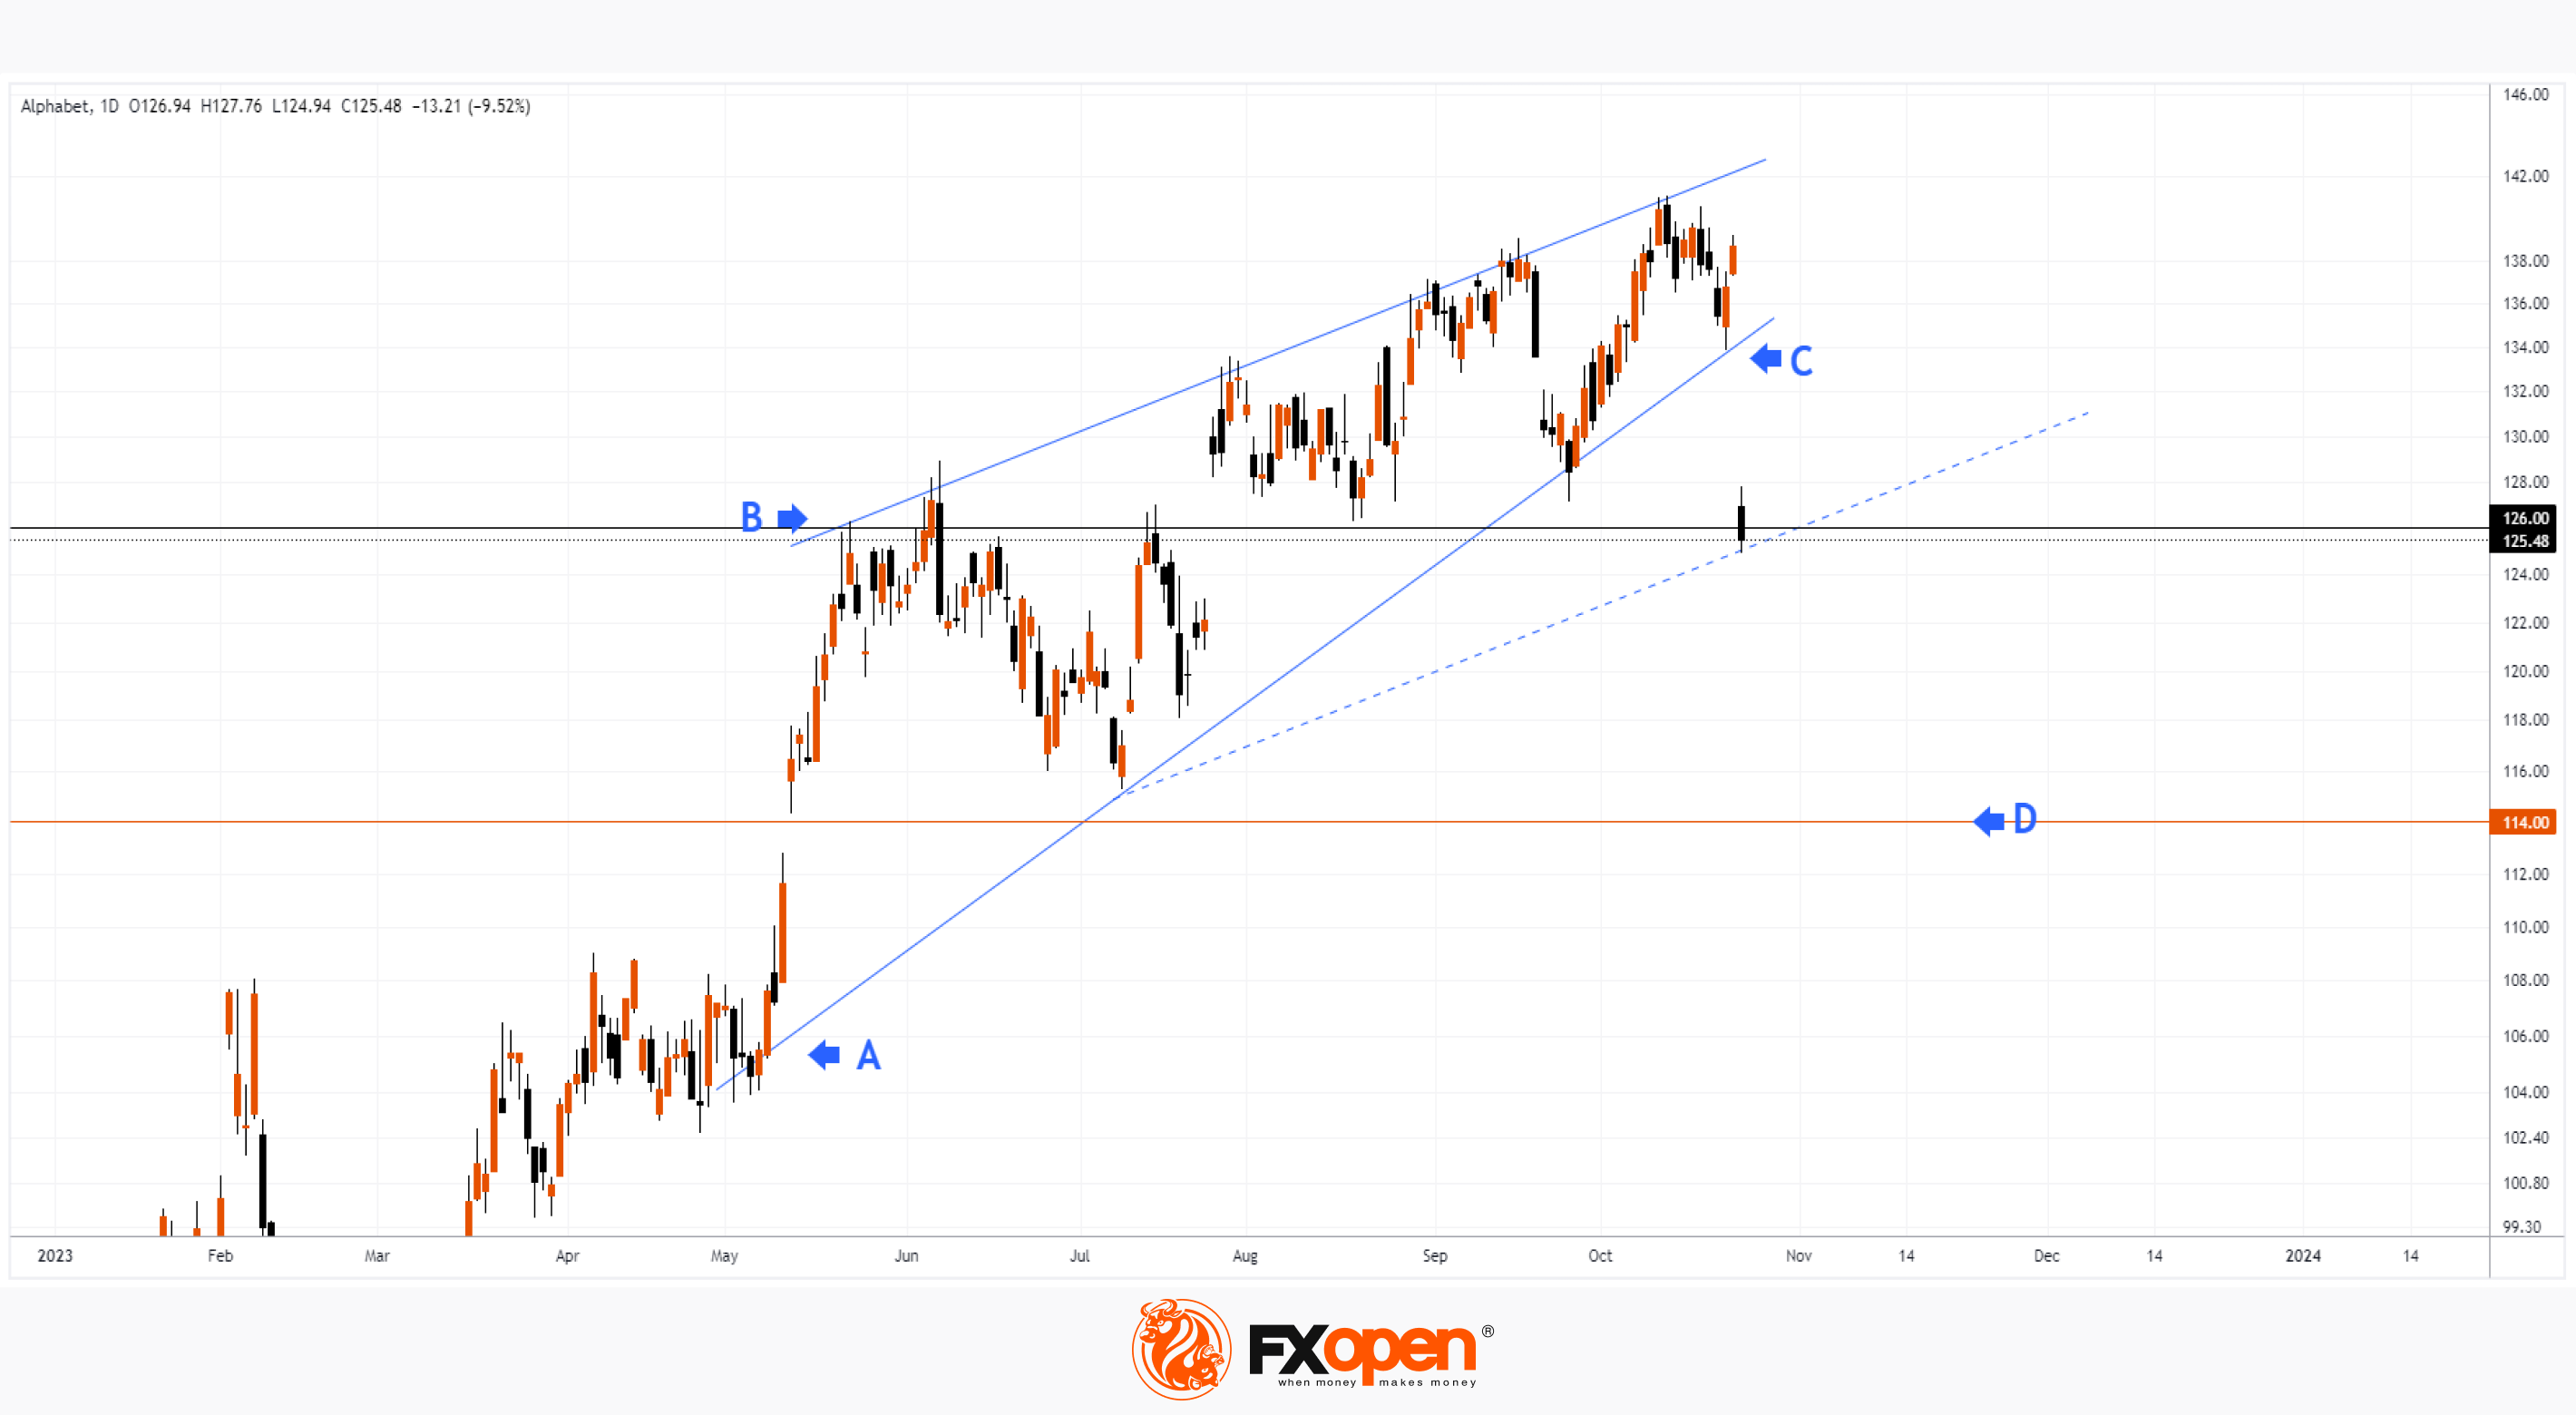
#marketanalysis #stockmarket #NASDAQ
Market Analysis: The NASDAQ Index Officially Enters Correction
The decline to current levels from the peak of the top of the year, set on July 19, exceeded 10%, which is generally considered to be the trigger for the start of the correction. According to statistics, this is the 70th official correction since the index was created in February 1971.
Despite the positive report from Microsoft, the bearish dynamics of the NASDAQ index were determined by the decline in shares of Tesla and Google, as well as the rise in the yield of long-term treasury bonds, which increased the cost of borrowing.
Futures for the NASDAQ index are declining amid falling META shares. How strong can the correction be? According to the Dow Jones Industrial Average for the last 20 corrections:
→ it took Nasdaq an average of 3 months to improve its performance;
→ after 1 year, the index added an average of 14.4%.
Time will tell how the correction that has begun will fit into the statistics. The chart shows that the median line of the downward channel, shown in red, is already exerting pressure, as can be seen from the price action on October 24th.
So far, the index price is close to the lower boundary of the ascending channel, shown in blue, which describes the prevailing bullish trend; within its framework, the NASDAQ price was able to rise by more than 45% in less than 7 months this year. So the correction looks really appropriate.
In the near future, we may witness the formation of fluctuations caused by the support of the lower border of the blue channel and the current bearish sentiment. Growth may be resisted by the level of 14,460, which acted as support in September.
The AAPL report (expected next week), as well as geopolitical news, will have an important impact.
To benefit from fluctuations in stock indices, consider enlisting the services of a trusted broker like FXOpen.
CFDs are complex instruments and come with a high risk of losing your money.
This article represents the opinion of the Companies operating under the FXOpen brand only. It is not to be construed as an offer, solicitation, or recommendation with respect to products and services provided by the Companies operating under the FXOpen brand, nor is it to be considered financial advice.
Market Analysis: The NASDAQ Index Officially Enters Correction
The decline to current levels from the peak of the top of the year, set on July 19, exceeded 10%, which is generally considered to be the trigger for the start of the correction. According to statistics, this is the 70th official correction since the index was created in February 1971.
Despite the positive report from Microsoft, the bearish dynamics of the NASDAQ index were determined by the decline in shares of Tesla and Google, as well as the rise in the yield of long-term treasury bonds, which increased the cost of borrowing.
Futures for the NASDAQ index are declining amid falling META shares. How strong can the correction be? According to the Dow Jones Industrial Average for the last 20 corrections:
→ it took Nasdaq an average of 3 months to improve its performance;
→ after 1 year, the index added an average of 14.4%.
Time will tell how the correction that has begun will fit into the statistics. The chart shows that the median line of the downward channel, shown in red, is already exerting pressure, as can be seen from the price action on October 24th.
So far, the index price is close to the lower boundary of the ascending channel, shown in blue, which describes the prevailing bullish trend; within its framework, the NASDAQ price was able to rise by more than 45% in less than 7 months this year. So the correction looks really appropriate.
In the near future, we may witness the formation of fluctuations caused by the support of the lower border of the blue channel and the current bearish sentiment. Growth may be resisted by the level of 14,460, which acted as support in September.
The AAPL report (expected next week), as well as geopolitical news, will have an important impact.
To benefit from fluctuations in stock indices, consider enlisting the services of a trusted broker like FXOpen.
CFDs are complex instruments and come with a high risk of losing your money.
This article represents the opinion of the Companies operating under the FXOpen brand only. It is not to be construed as an offer, solicitation, or recommendation with respect to products and services provided by the Companies operating under the FXOpen brand, nor is it to be considered financial advice.