
#MarketNews #TSLA #meta
Market Analysis: Musk vs Zuckerberg
Since the beginning of 2021, META and TSLA shares have seemingly been in competition with each other. Either the price of META is higher than the price of TSLA, or vice versa. The turn has come to the rivalry of the CEOs, in the literal sense.
It started when Zuckerberg announced the idea to create a competitor to Twitter. Musk probably didn’t like it, and in response he offered to fight. Zuckerberg accepted the challenge, asking him to name a venue. Musk chose an arena in Vegas as the venue for the fight.
Musk has a size advantage, and according to him, he has experience in tough street fights in South Africa. Zuckerberg has an age advantage as well as a jiu-jitsu belt.
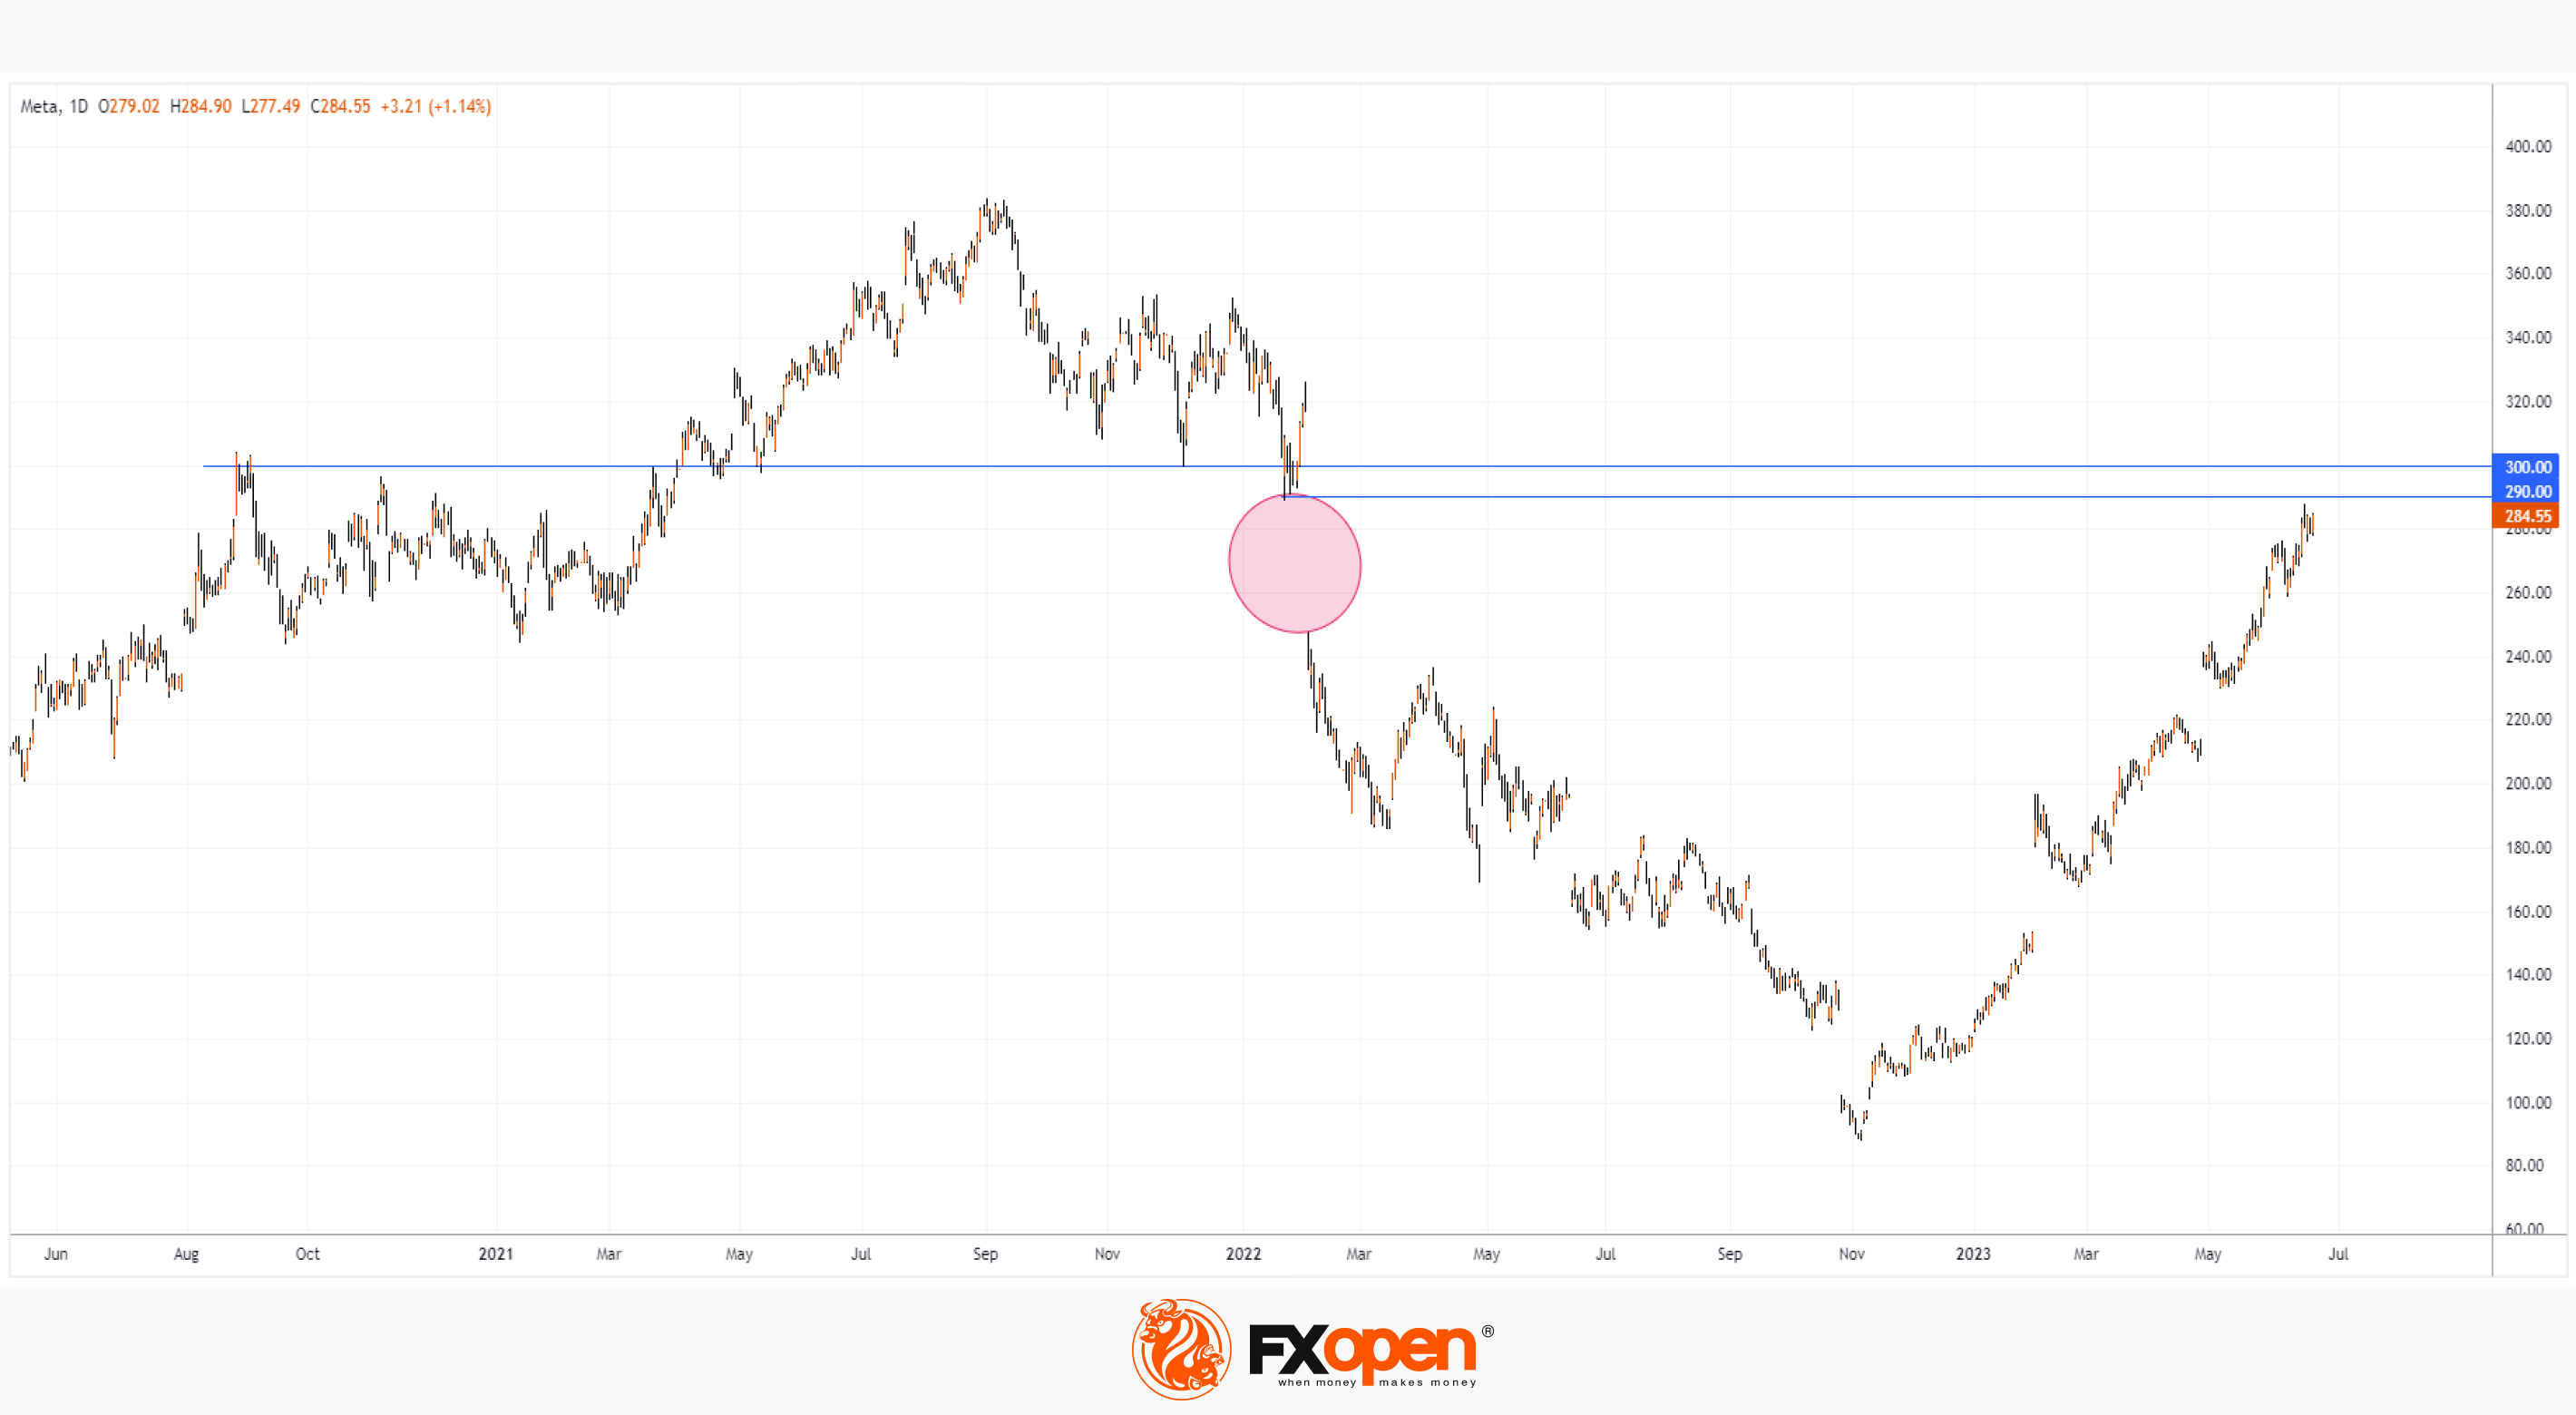
In anticipation of the battle of billionaires, it is worth paying attention to the META stock chart.
The price of META is near the level of USD 290 per share, which practically means the closing of the gap that formed in 2022. Also, the price of META shares is near the psychological mark of USD 300 – it has influenced the price more than once since 2021. So the 290-300 resistance area may well contribute to the start of a correction for the META share price, which has risen by more than 140% since the beginning of the year.
To benefit from the movement of stock prices of popular companies, consider enlisting the services of a reliable broker like FXOpen.
⚠️
CFDs are complex instruments and come with a high risk of losing your money.
This article represents the opinion of the Companies operating under the FXOpen brand only. It is not to be construed as an offer, solicitation, or recommendation with respect to products and services provided by the Companies operating under the FXOpen brand, nor is it to be considered financial advice.
#marketanalysis #meta #stockmarket
META Analysis: Price Target Raised to $390
Last week, the Meta Connect event took place, where the following were presented:
→ new Ray-Ban Meta Smart Glasses with a camera and microphones, including for broadcasting on social networks. The price of the gadget is USD 299;
→ Meta Quest 3 virtual reality helmet priced at USD 499;
→ AI characters for social networks, as well as Meta AI chatbot.
Overall, the products were received favourably. And now analysts are making predictions about how this will affect the stock price. Thus, Truist Securities analyst Youssef Squali raised his target price to USD 390 per META share, expecting that:
→ revenue will increase by 21% year on year;
→ the company will receive many benefits through the implementation of AI (for example, Emu — an image generation model; Studio AI — a platform for developers that allows one to create new and customized AI).
Add to this that the increase in revenue should be facilitated by the company’s intention to offer a subscription fee of USD 14 per month for using Instagram and Facebook, which will allow one to disable advertising.
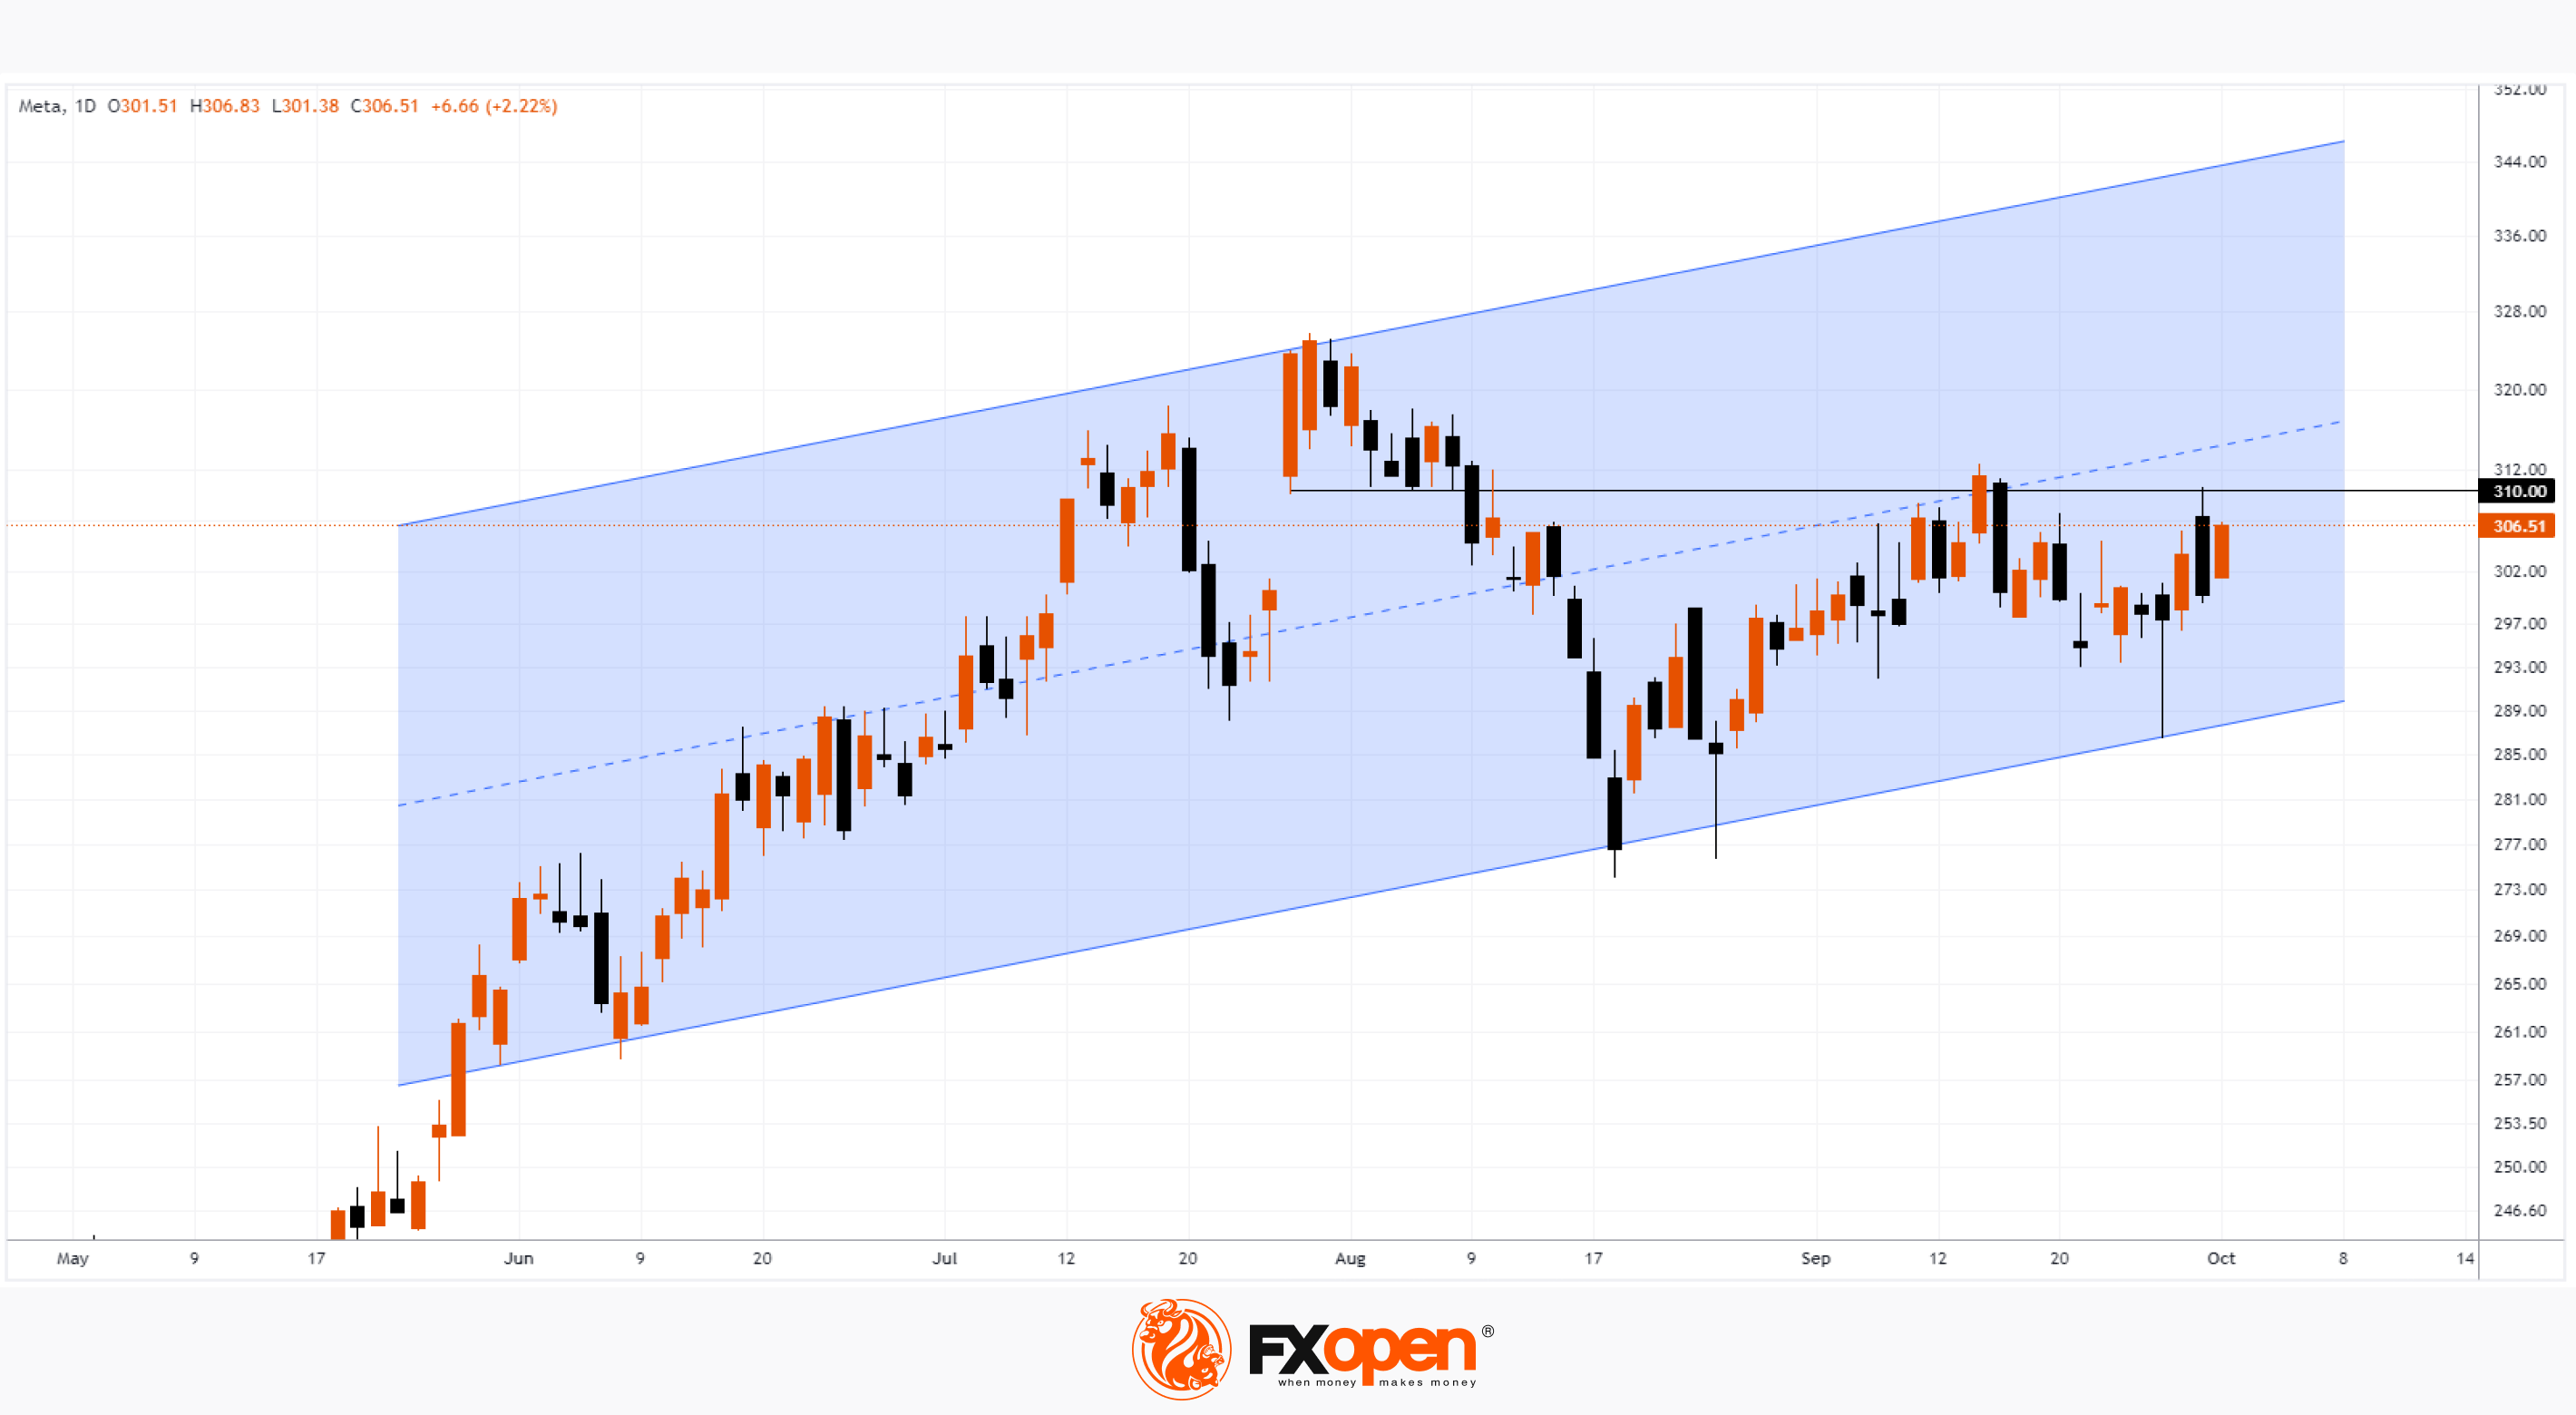
The daily chart of META stock, meanwhile, shows a mixed picture.
Bullish arguments:
→ META stock is stronger than the S&P 500 market;
→ the price forms a movement within the ascending channel;
→ the price formed quick energetic rebounds from the lower border of the channel, thereby indicating the strength of demand.
Bearish arguments:
→ On July 27, when the high of the year was formed, extremely high volumes were recorded on the NASDAQ exchange. They can be interpreted as the desire of large players to fix profits from long positions. Since then, the July 27 candle area has acted as resistance. Price action near the USD 310 level (roughly the low of the July 27 candlestick) confirms bearish activity.
It is possible that in the coming weeks, the forces of supply and demand will balance out in the market, however, if the fundamental backdrop for META stock remains strong, it will help the bulls prove their superiority in the long term.
To benefit from the rise and fall of popular stock prices, consider enlisting the services of a trusted broker like FXOpen.
CFDs are complex instruments and come with a high risk of losing your money.
This article represents the opinion of the Companies operating under the FXOpen brand only. It is not to be construed as an offer, solicitation, or recommendation with respect to products and services provided by the Companies operating under the FXOpen brand, nor is it to be considered financial advice.
#marketanalysis #META #stockmarket #stocktrading
Market Analysis: Despite Strong Report, META Shares Fall 3%
Like Google, META demonstrated that the price can fall if the quarterly report is better than expected:
→ Earnings per share: actual = USD 4.39, expectation = USD 3.63.
→ Revenue: actual = USD 34.15 billion, expectations = USD 33.56 billion
→ Number of daily active users: fact = 2.09 billion, expectation = 2.07 billion according to StreetAccount.
META's share price initially rose in post-market trading but then reversed course and fell more than 3% following cautionary comments from CFO Susan Lee about the impact of military conflict in the Middle East on the advertising market.
Thus, the META stock price may have received a bullish boost from the psychological level of USD 300, but it is possible that it will receive a bearish one because the opening price on Thursday could be around USD 290.
In the analysis of the META share price on October 3, we paid attention to the candle from July 27, when the high of the year was formed — then, extremely high volumes were recorded on the NASDAQ exchange. They can be interpreted as the desire of large players to fix profits from long positions.
Since then, the price has updated its high of the year around the USD 325 level, but this update turned into a classic bear trap. Thus, a large-scale double top pattern has formed on the chart, which will most likely lead to a bearish breakout of the ascending channel (shown in blue).
When a breakout occurs, a gap will likely form, which can serve as resistance. The bulls may be given hope by the level of USD 175 per share, which previously supported META shares.
To benefit from price movements in the popular stock markets, consider enlisting the services of a trusted broker like FXOpen.
CFDs are complex instruments and come with a high risk of losing your money.
This article represents the opinion of the Companies operating under the FXOpen brand only. It is not to be construed as an offer, solicitation, or recommendation with respect to products and services provided by the Companies operating under the FXOpen brand, nor is it to be considered financial advice.
#marketanalysis #stockmarket #stocktrading #meta
META Share Price Collapses after Publication of Quarterly Report
Just yesterday, META's stock price closed at USD 493.50, up approximately 40% since the start of 2024 and up nearly 300% since the start of 2023.
However, following the release of Meta's quarterly report, its shares plummeted to USD 400 in post-market trading, representing a decline of more than -15%.
It is noteworthy that the report exceeded expectations in some of the main indicators:
→ earnings per share: actual = USD 4.70, forecast = USD 4.32;
→ revenue: actual = USD 36.4 billion, forecast = USD 36.1 billion.
However, investors were disappointed by plans for the coming months, as Meta said second-quarter revenue would be between USD 36.5 billion and USD 39 billion, below the average estimate of USD 38.24 billion. This could be due to increased investment in developing AI-based products , which do not yet generate income.
At pre-market today, the META share price is around USD 418.
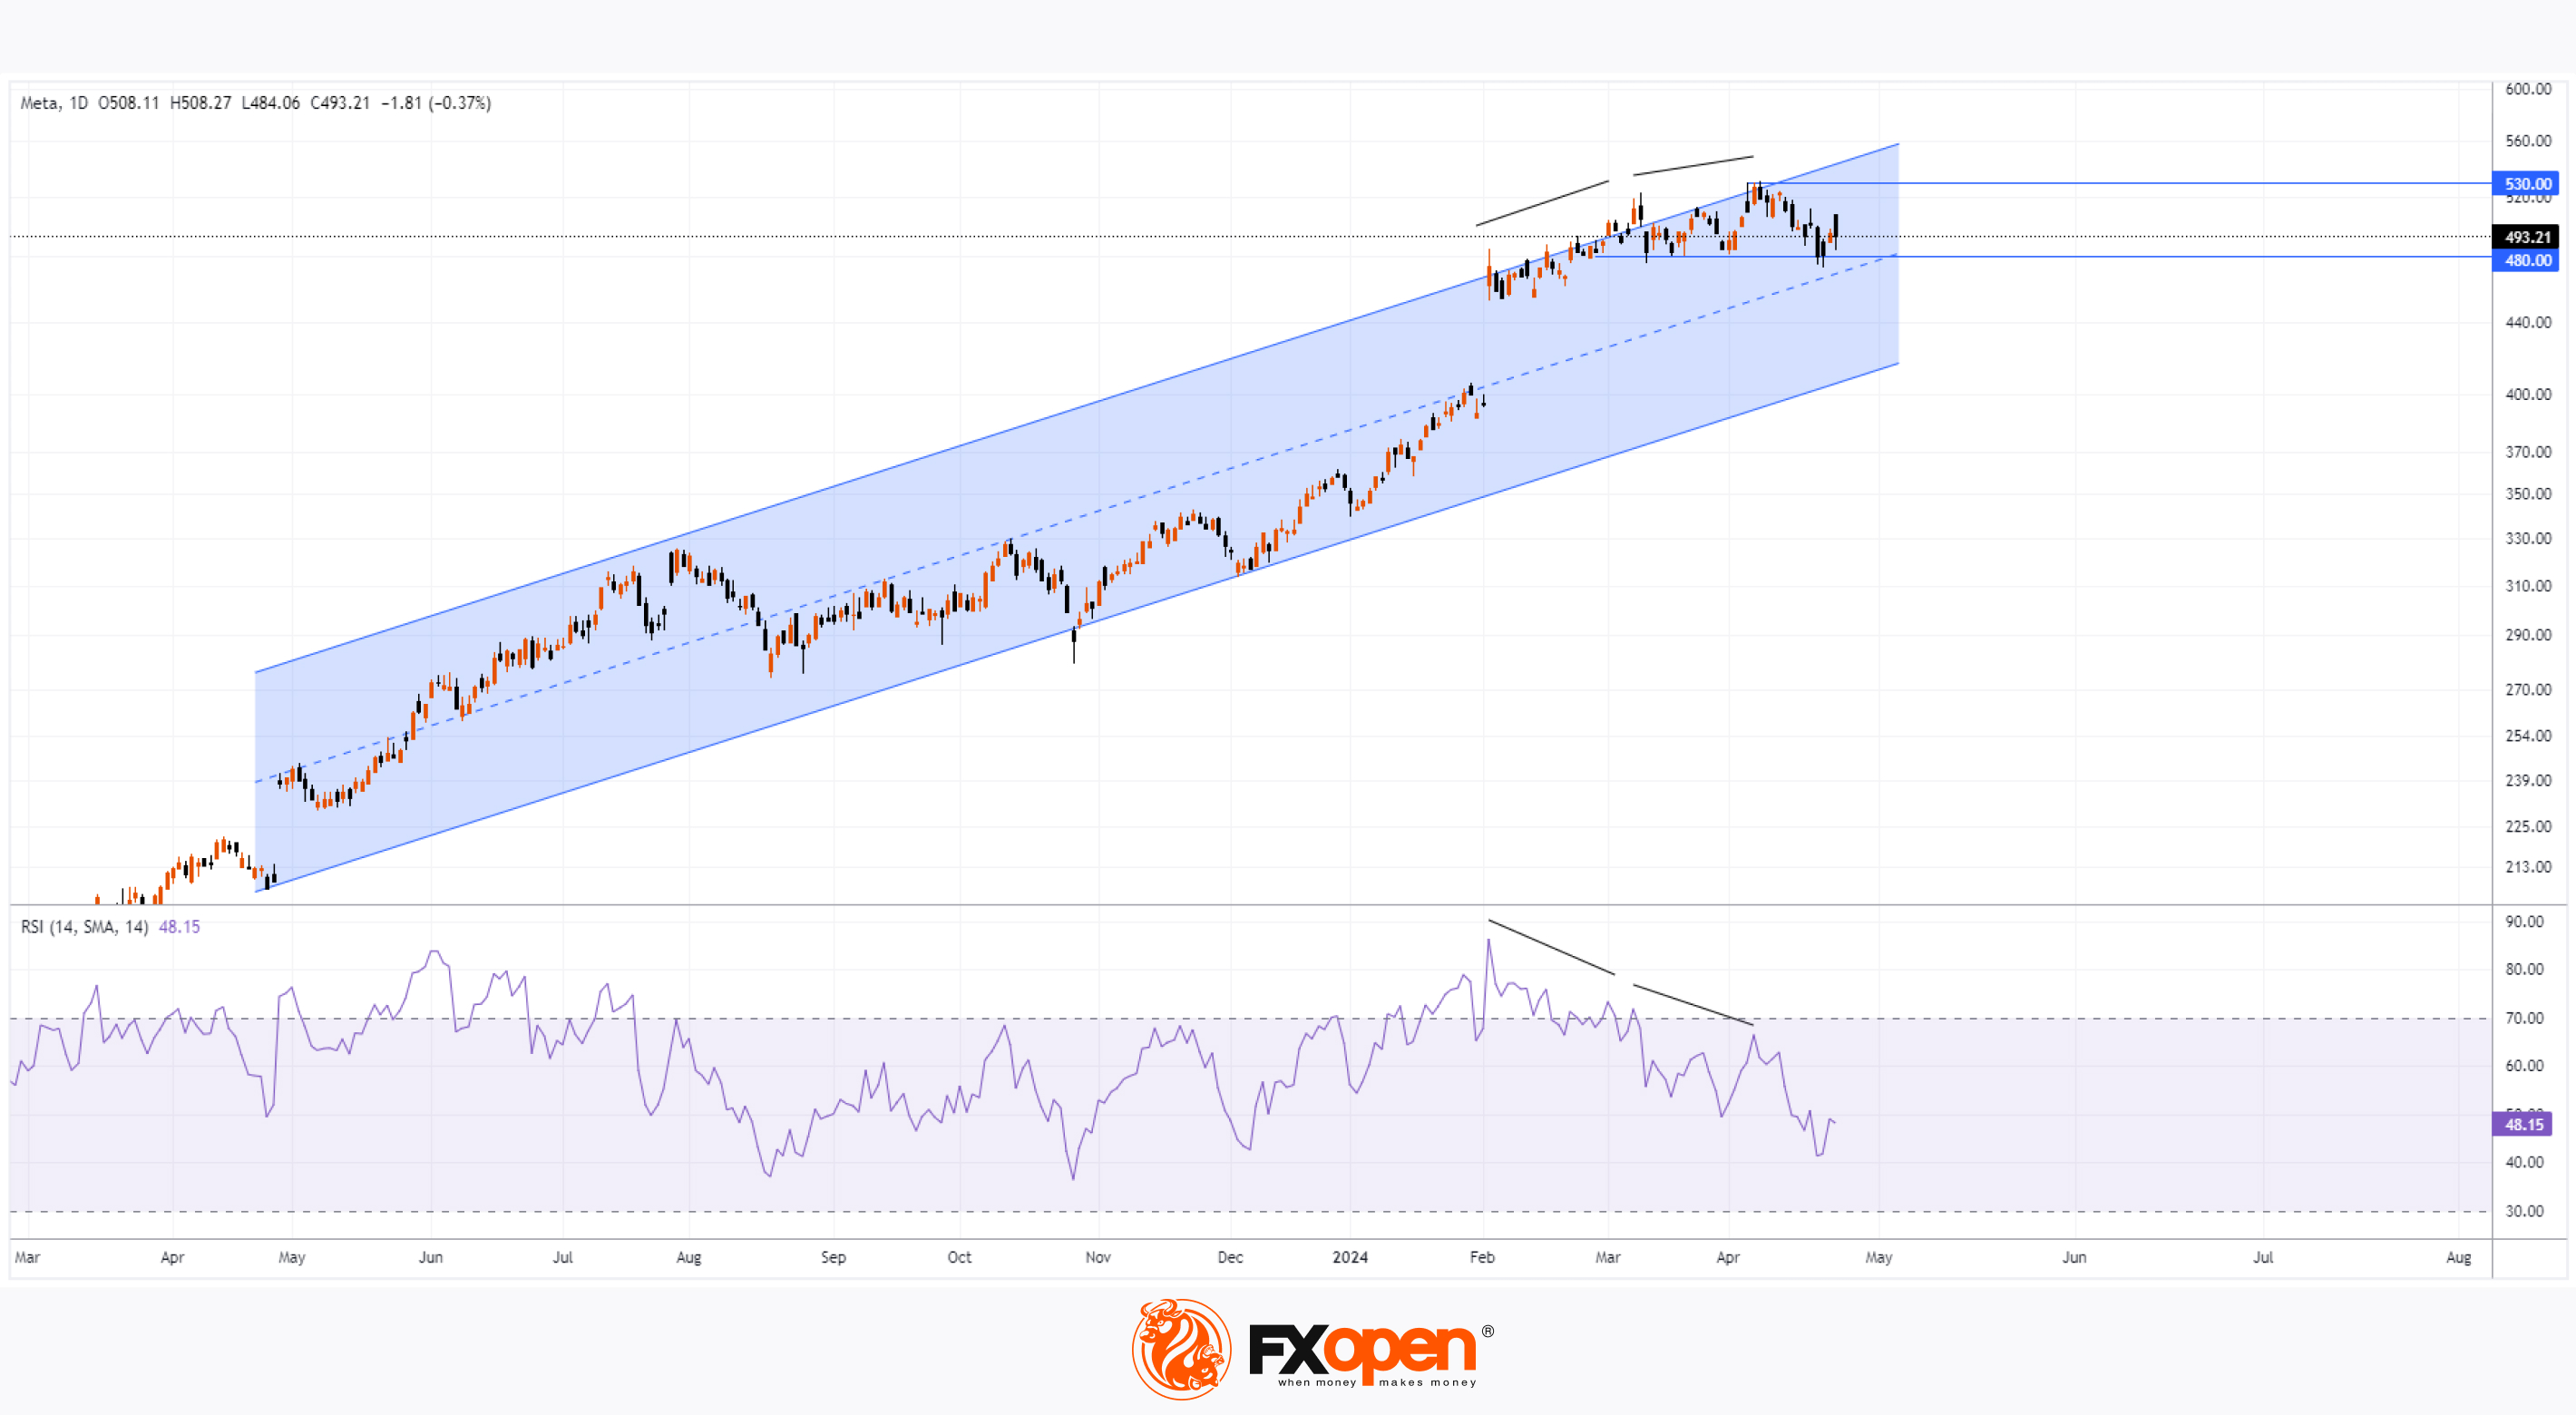
The technical analysis of the META stock chart shows:
→ The price still remains within the long-term ascending channel (marked in blue), which describes the price increase in 2023-2024.
→ The pattern of decline from the high around USD 530 towards the lower boundary may be a sign that indicates a potential change in sentiment - optimism is not endless.
→ Divergence on the RSI indicator turned out to be an effective warning for a price decline.
Market participants who bought META stock at prices between USD 480 and USD 530 will find their positions in the red when trading opens today, most likely with a bearish gap — somewhere around the lower boundary of the mentioned channel. So it is safe to assume that any rise in price towards the specified range will represent an opportunity for them to exit the position and minimize losses, which in turn will put pressure on potential attempts by the bulls to resume the multi-month trend. Resistance may also come from the median line of the channel, which today lies right at the lower limit of the range between USD 480 and USD 530.
Buy and sell stocks of the world's biggest publicly-listed companies with CFDs on FXOpen’s trading platform. Open your FXOpen account now or learn more about trading share CFDs with FXOpen.
CFDs are complex instruments and come with a high risk of losing your money.
This article represents the opinion of the Companies operating under the FXOpen brand only. It is not to be construed as an offer, solicitation, or recommendation with respect to products and services provided by the Companies operating under the FXOpen brand, nor is it to be considered financial advice.
👍2
#META #stockmarket #stocktrading #marketanalysis
The META Price Is Holding Around a Key Support Level. But for How Long?
According to TipRanks, the average target price for META, as forecasted by Wall Street analysts, is $537.41 (a 12.94% increase from current levels) over the next 12 months. However, not all analysts remain positive. Craig Johnson, Chief Market Technician at Piper Sandler, issued a warning about the future of the "Magnificent Seven" stocks, which include Microsoft (MSFT), Apple (AAPL), NVIDIA (NVDA), Meta Platforms (META), Tesla (TSLA), Amazon.com (AMZN), and Alphabet Inc. (GOOG and GOOGL). "These charts are reversing, and they need further correction," he said on CNBC's Last Call programme.
Indeed, the market is sending alarming signals regarding the leaders. Yesterday, we wrote about the increasing signs of bearish aggression on Nvidia's stock chart; today, we'll assess the price action of Meta Platforms Inc.
Technical analysis of META's daily chart shows that since the second half of last year, the price action is best described by an upward trend (indicated by the blue channel).
However:
→ The price has fallen into the lower half of the channel, and the median shows signs of resistance (judging by the price action from 8-10 July).
→ The formation of peaks A-B-C indicates a worrying trend: the price is unable to consolidate at the achieved peaks. We see only a slight excess over the previous maximum – a sign of bullish uncertainty.
→ Meanwhile, the bears are aggressive. Look at the bearish gaps (shown with red arrows) in July.
How might the situation develop further?
Currently, the META stock price is holding around the lower boundary of the trend channel, which is reinforced by the $455 level that previously acted as support (shown with blue arrows). But, given the aggressive activity of the bears, it is reasonable to assume that the lower boundary is under significant pressure.
Trade global index CFDs with zero commission and tight spreads. Open your FXOpen account now or learn more about trading index CFDs with FXOpen.
CFDs are complex instruments and come with a high risk of losing your money.
This article represents the opinion of the Companies operating under the FXOpen brand only. It is not to be construed as an offer, solicitation, or recommendation with respect to products and services provided by the Companies operating under the FXOpen brand, nor is it to be considered financial advice.

👍1
#StockMarket #USDJPY #MSFT #meta #Investing #finance #marketupdate
Weekly Market Wrap With Gary Thomson: GBP/USD, USD/JPY, MSFT and META Shares
Get the latest scoop on the week's hottest headlines, all in one convenient video. Join Gary Thomson, the COO of FXOpen UK, as he breaks down the most significant news reports and shares his expert insights.
🔸 Market Reacts Mildly To Fed Decision, Focus Shifts To Nonfarm Payrolls
🔸 USD/JPY Falls Below 150 Yen Per Dollar
🔸 MSFT Share Price Plummets After Earnings Report, But It’s Not All Bad
🔸 META Shares Rise Above $500
Stay in the know and empower yourself with our short, yet power-packed video. Watch it now and stay updated with FXOpen. Don't miss out on this invaluable opportunity to sharpen your trading skills and make informed decisions.
https://cutt.ly/KezJn2Ni
To take advantage of price fluctuations in the foreign exchange markets, consider enlisting the services of a reliable broker like FXOpen.
⚠️
This forecast represents FXOpen Companies opinion only, it should not be construed as an offer, invitation or recommendation in respect to FXOpen Companies products and services or as financial advice.
YouTube
Weekly Market Wrap With Gary Thomson: GBP/USD, USD/JPY, MSFT and META Shares
Get the latest scoop on the week's hottest headlines, all in one convenient video. Join Gary Thomson, the COO of FXOpen UK, as he breaks down the most significant news reports and shares his expert insights.
00:34 Market Reacts Mildly To Fed Decision, Focus…
00:34 Market Reacts Mildly To Fed Decision, Focus…
👍2
#META #stockmarket #stocktrading #MarketNews
Meta Platforms (META) Shares Dip Below $550
On 7 October, we analysed the Meta Platforms (META) price chart and highlighted:
→ The formation of a long-term upward channel (marked in blue).
→ The key drivers supporting bullish sentiment.
We also emphasised the psychological significance of the $600 level.
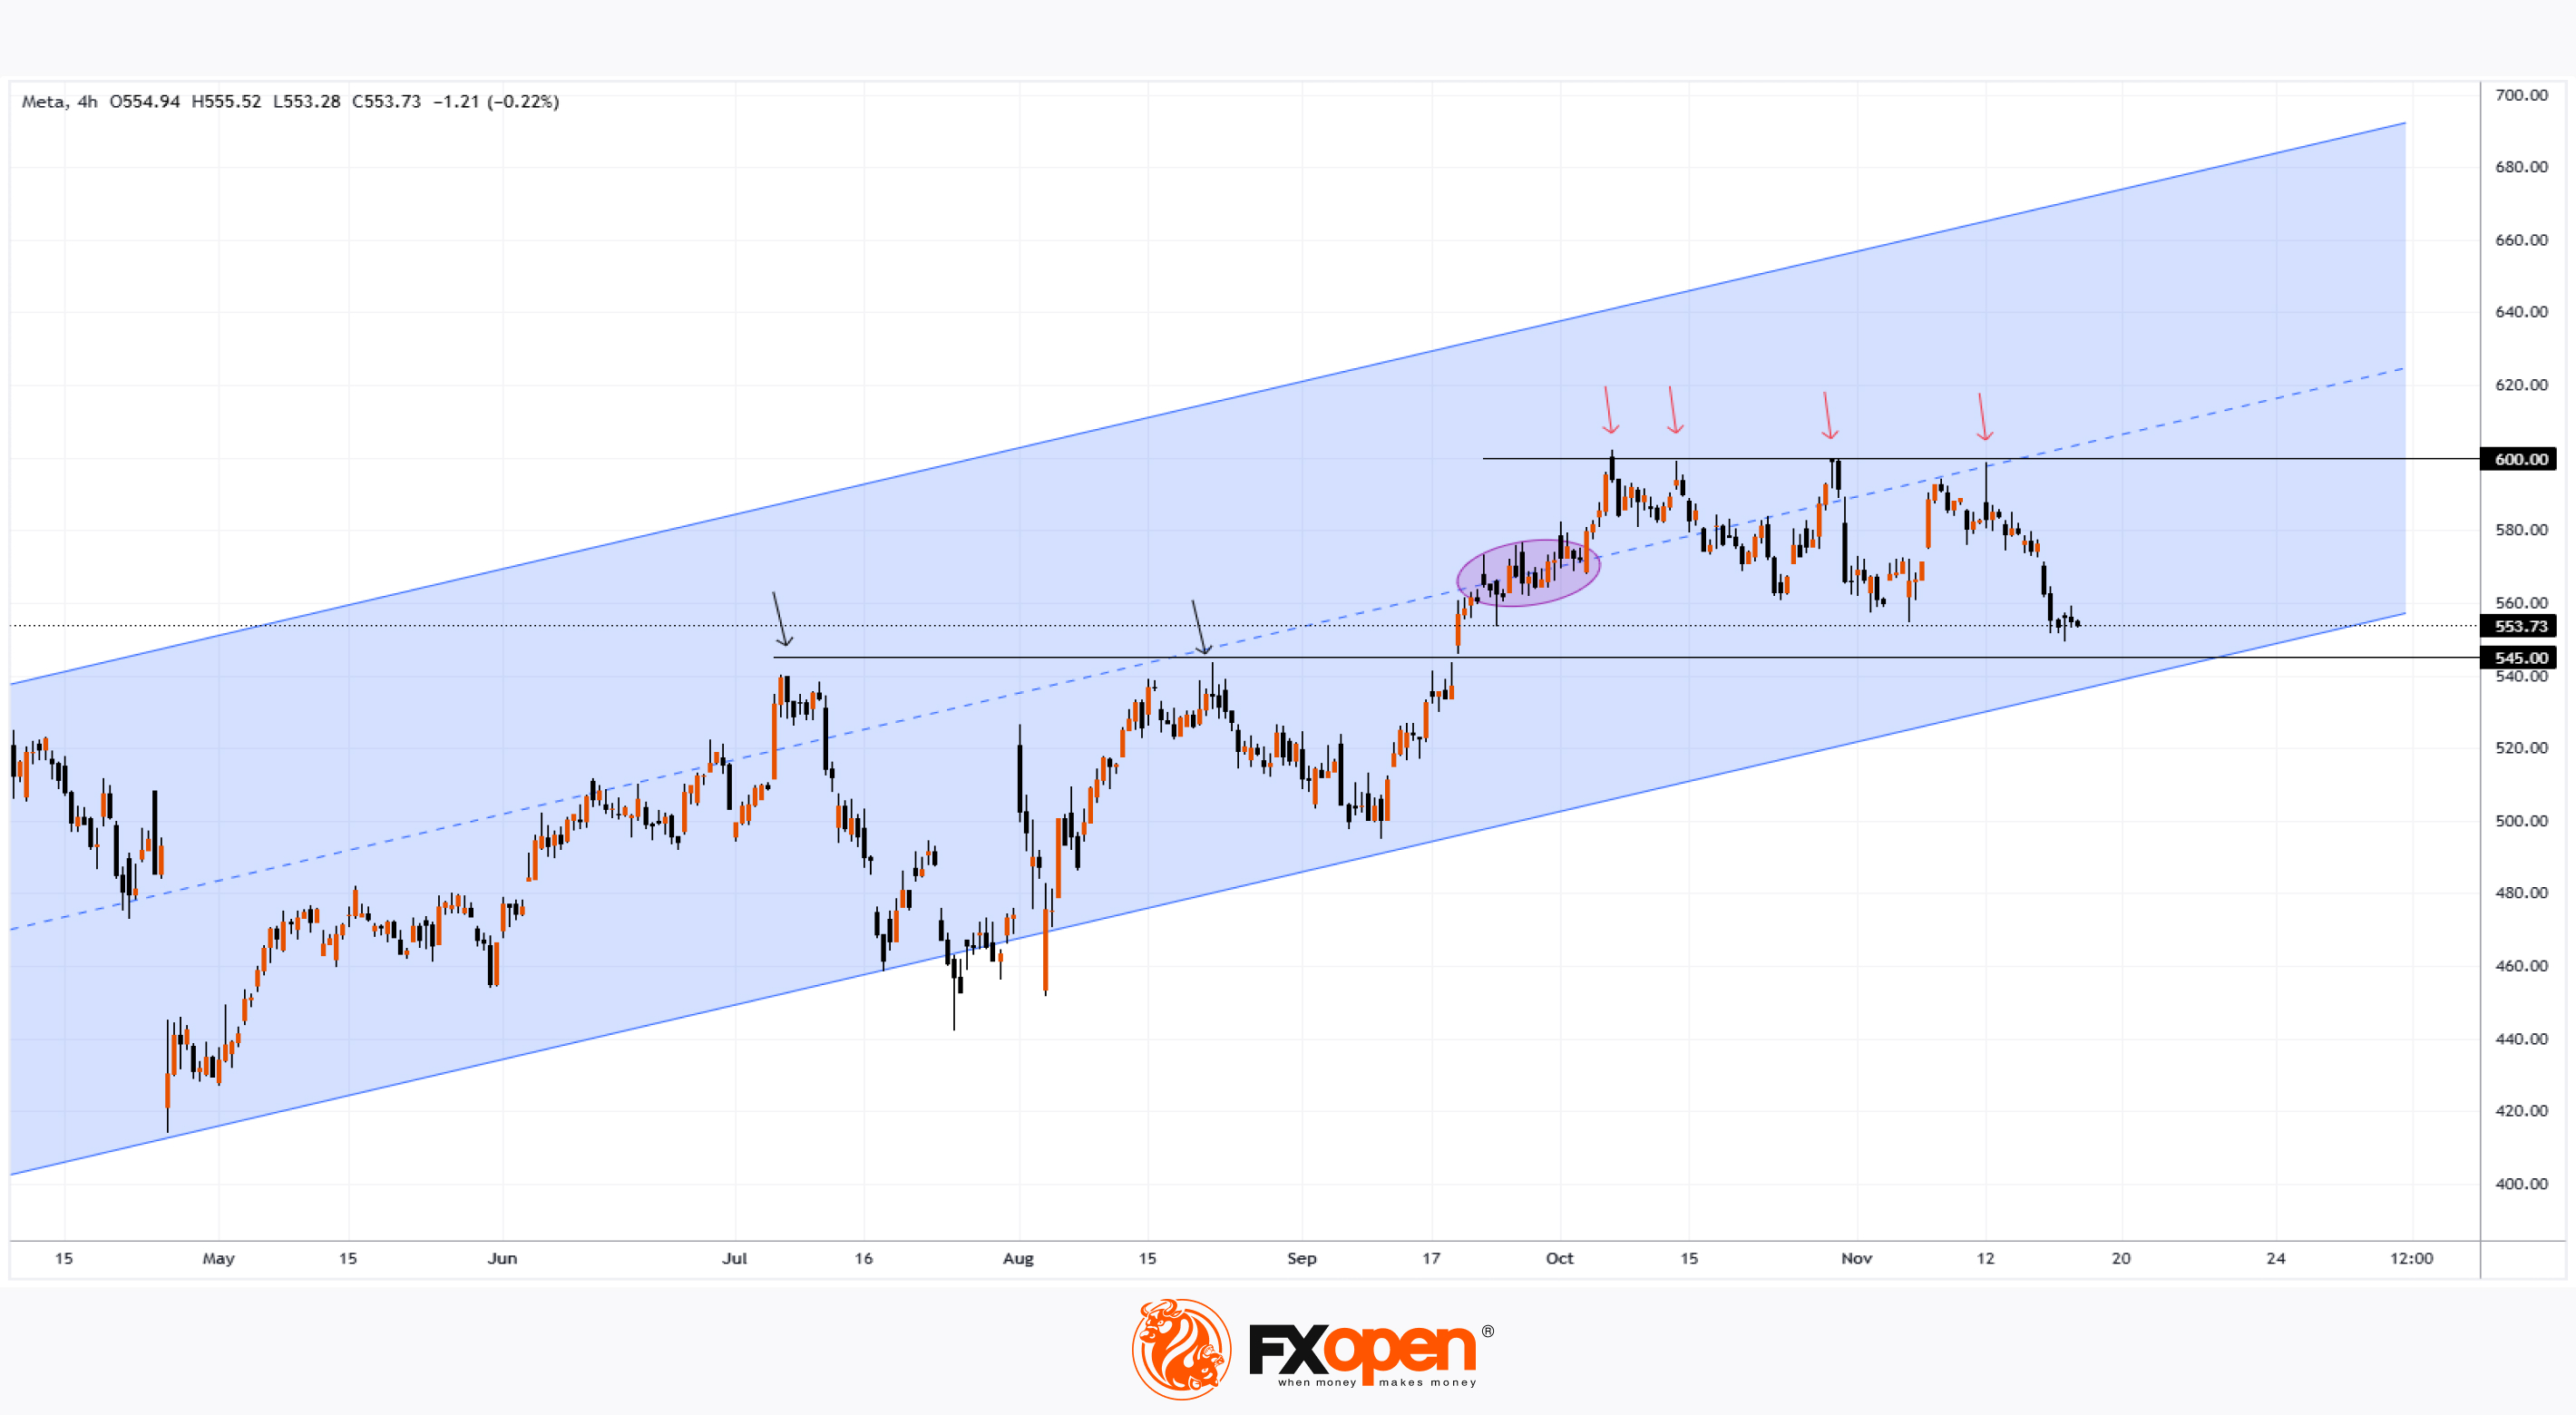
Since then, the price has approached this level four times, only to be met with resistance each time (indicated by red arrows).
Yesterday, for the first time since mid-September, META’s price fell below $550, suggesting that the stock underperformed the broader market during October and November.
What’s Next?
Technical analysis of the META price chart reveals that the stock is trading within a range defined by:
→ Resistance at $600, which has consistently proven robust.
→ Support at $545, a level that previously acted as resistance (marked by arrows).
While the channel median initially acted as a “magnet” for the price (highlighted with an oval), November patterns suggest the median now "repels" the price downward, a bearish indicator.
Bullish momentum might regain strength if the price approaches the lower boundary of the blue channel. However, the sustainability of demand at these levels and whether it can drive a successful breakout above $600 remains uncertain.
Analysts remain optimistic. According to a TipRanks survey:
→ 40 out of 44 analysts recommend buying META shares.
→ The average 12-month price target for META is $662.
Trade global index CFDs with zero commission and tight spreads. Open your FXOpen account now or learn more about trading index CFDs with FXOpen.
CFDs are complex instruments and come with a high risk of losing your money.
This article represents the opinion of the Companies operating under the FXOpen brand only. It is not to be construed as an offer, solicitation, or recommendation with respect to products and services provided by the Companies operating under the FXOpen brand, nor is it to be considered financial advice.
👍3
#META #marketanalysis #MarketNews #stockmarket
Meta Platforms (META) Stock Surges Above $600
On 19 November, we analysed the Meta Platforms (META) stock chart, highlighting:
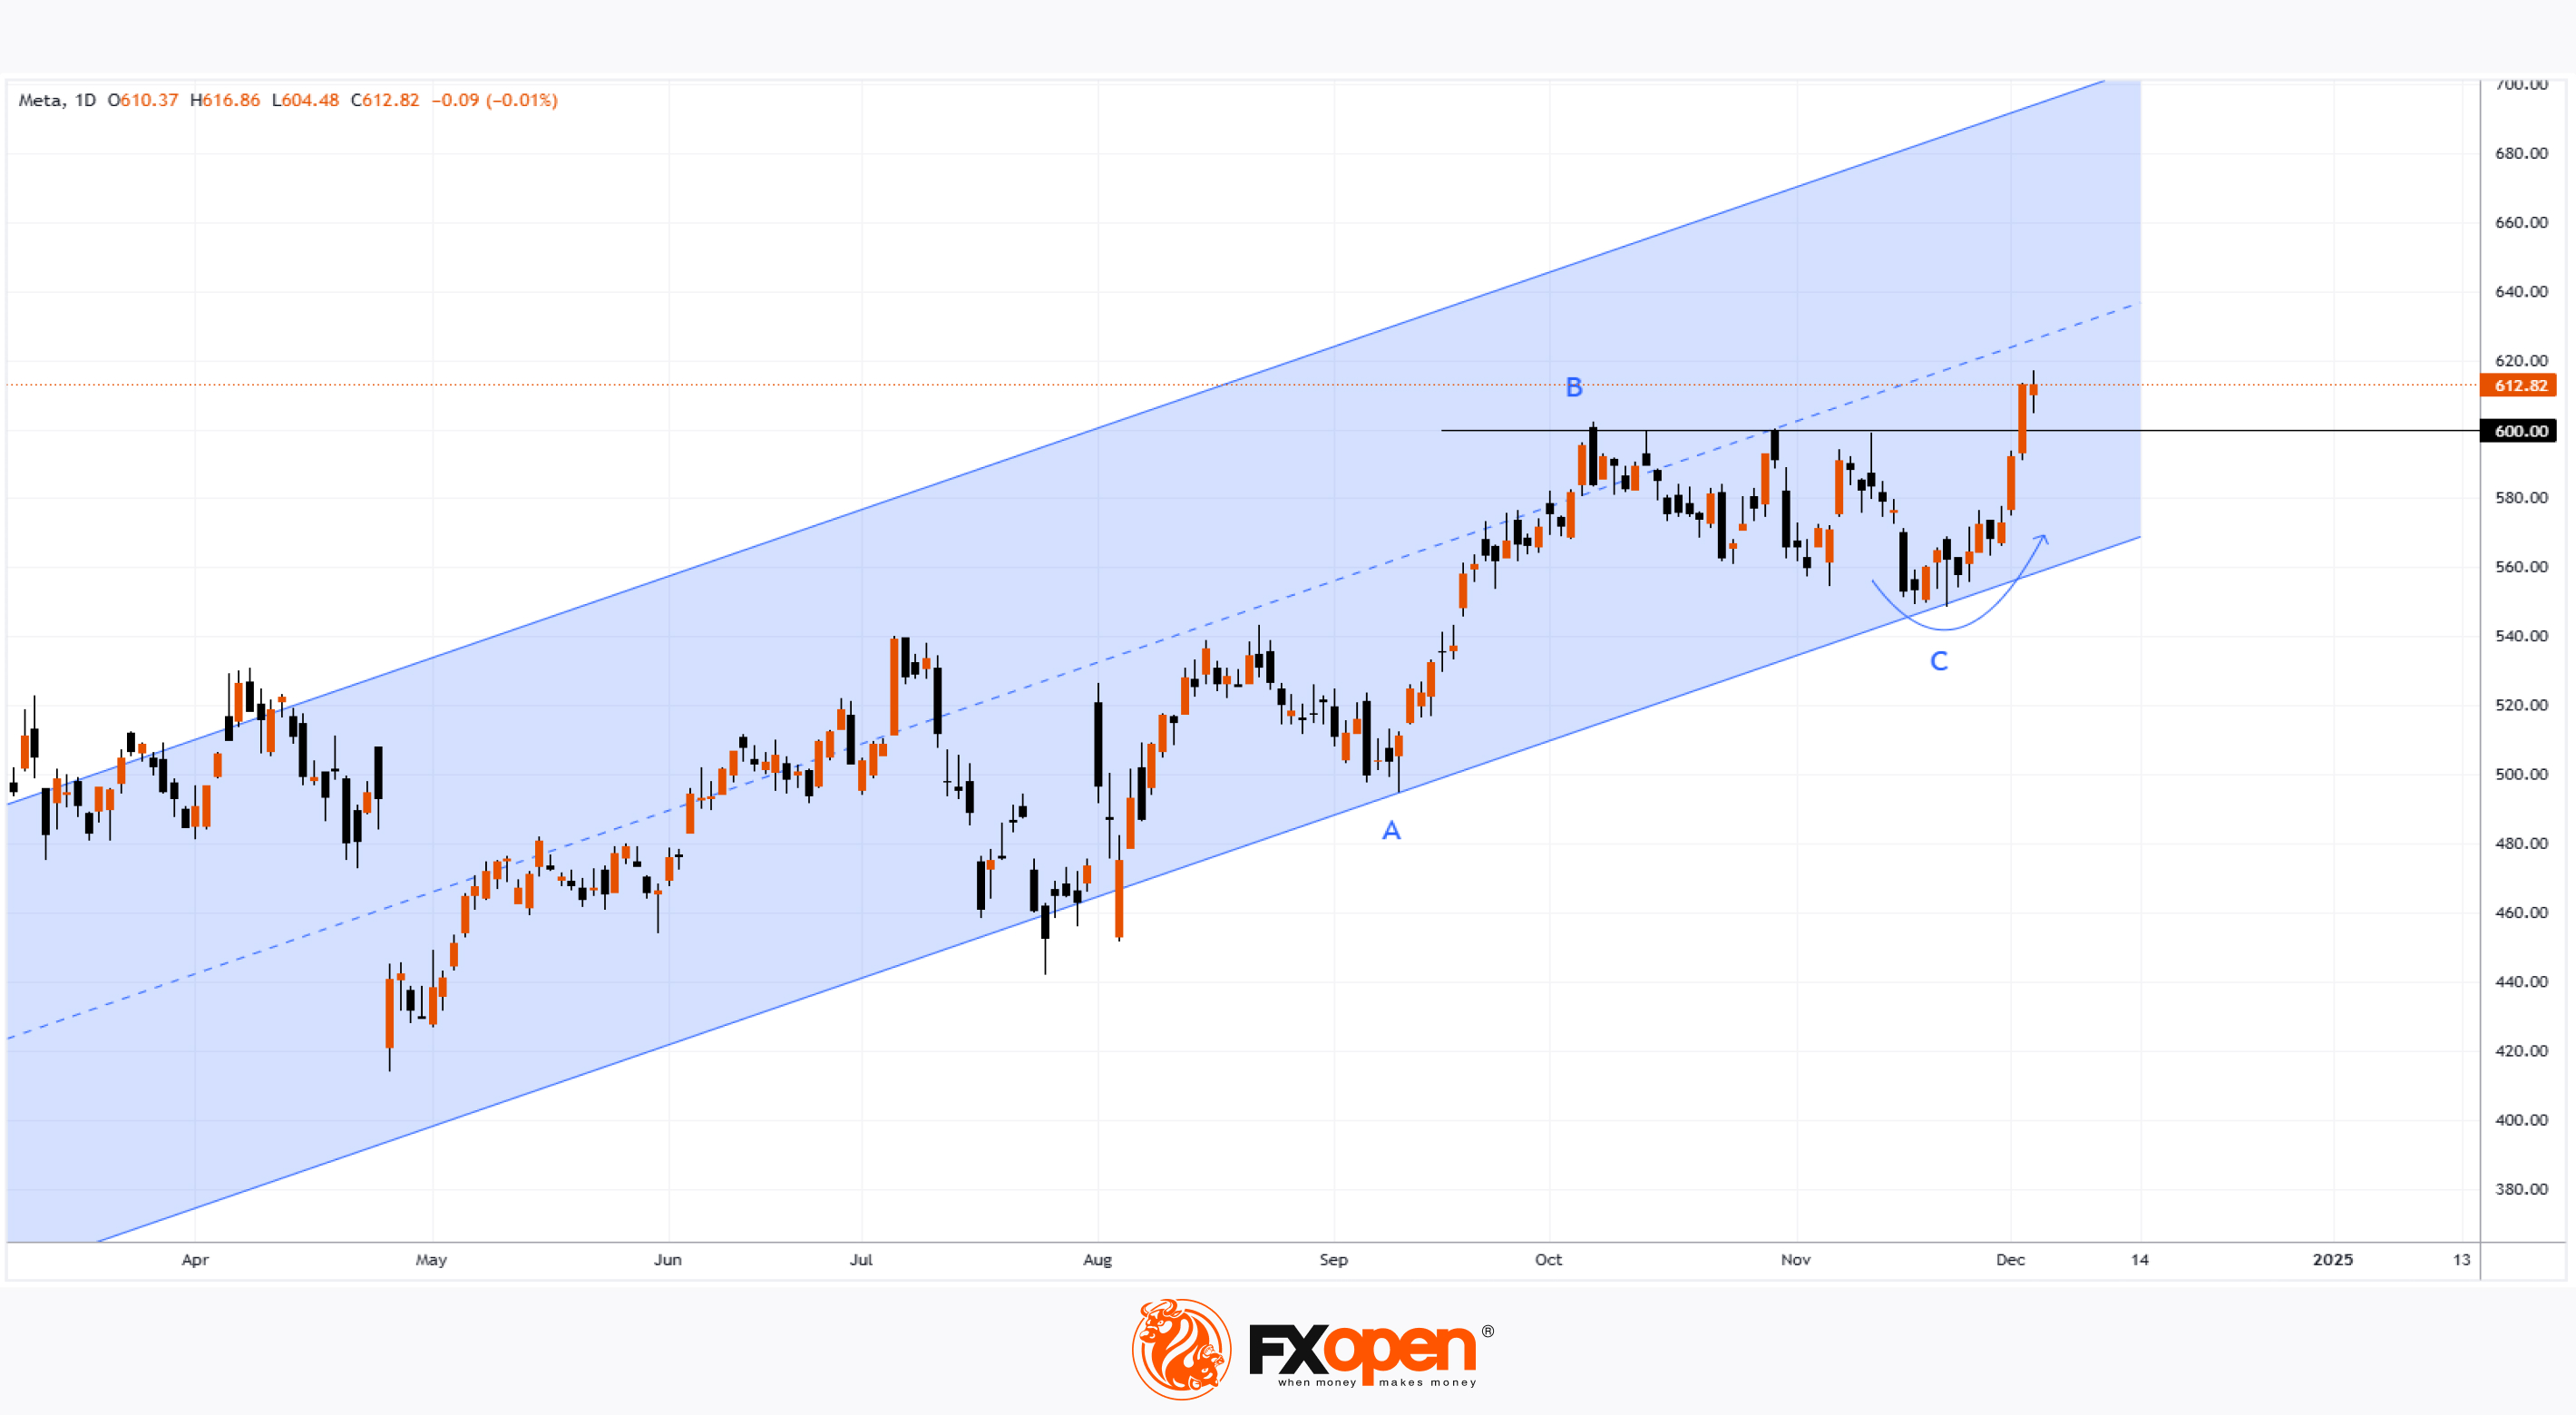
→ the formation of a long-term upward channel (shown in blue);
→ the importance of the psychological $600 level;
→ the scenario of a bullish trend resumption with a rebound from the channel's lower boundary.
Since then:
→ as anticipated, the price reversed upwards (indicated by an arrow);
→ it broke key resistance at $600, reaching an all-time high.
The bullish momentum in META's stock price was supported by reports that:
→ AI-based tools are helping the company better monetise its vast user base and boost advertising revenue;
→ CEO Mark Zuckerberg dined with Donald Trump, suggesting their relationship may improve after Trump's prior criticism of Zuckerberg's platforms over information policies.
What’s Next?
Technical analysis of Meta Platforms (META) stock shows:
→ the decline from B to C represents approximately 50% of the rise from A to B – a bullish signal;
→ after two strong candles on Monday and Tuesday, price growth slowed on Wednesday – a bearish signal.
This suggests that buying momentum may be weakening, and bulls might now focus on maintaining levels above $600.
Analysts remain optimistic. According to TipRanks:
→ 40 out of 44 surveyed analysts recommend buying META stock;
→ the average 12-month price target for META is $662.
Trade global index CFDs with zero commission and tight spreads. Open your FXOpen account now or learn more about trading index CFDs with FXOpen.
CFDs are complex instruments and come with a high risk of losing your money.
This article represents the opinion of the Companies operating under the FXOpen brand only. It is not to be construed as an offer, solicitation, or recommendation with respect to products and services provided by the Companies operating under the FXOpen brand, nor is it to be considered financial advice.
👍2
#stockmarket #stocktrading #META #MarketUpdates
META Stock Rises for 19 Consecutive Sessions
According to the Meta Platforms (META) stock chart:
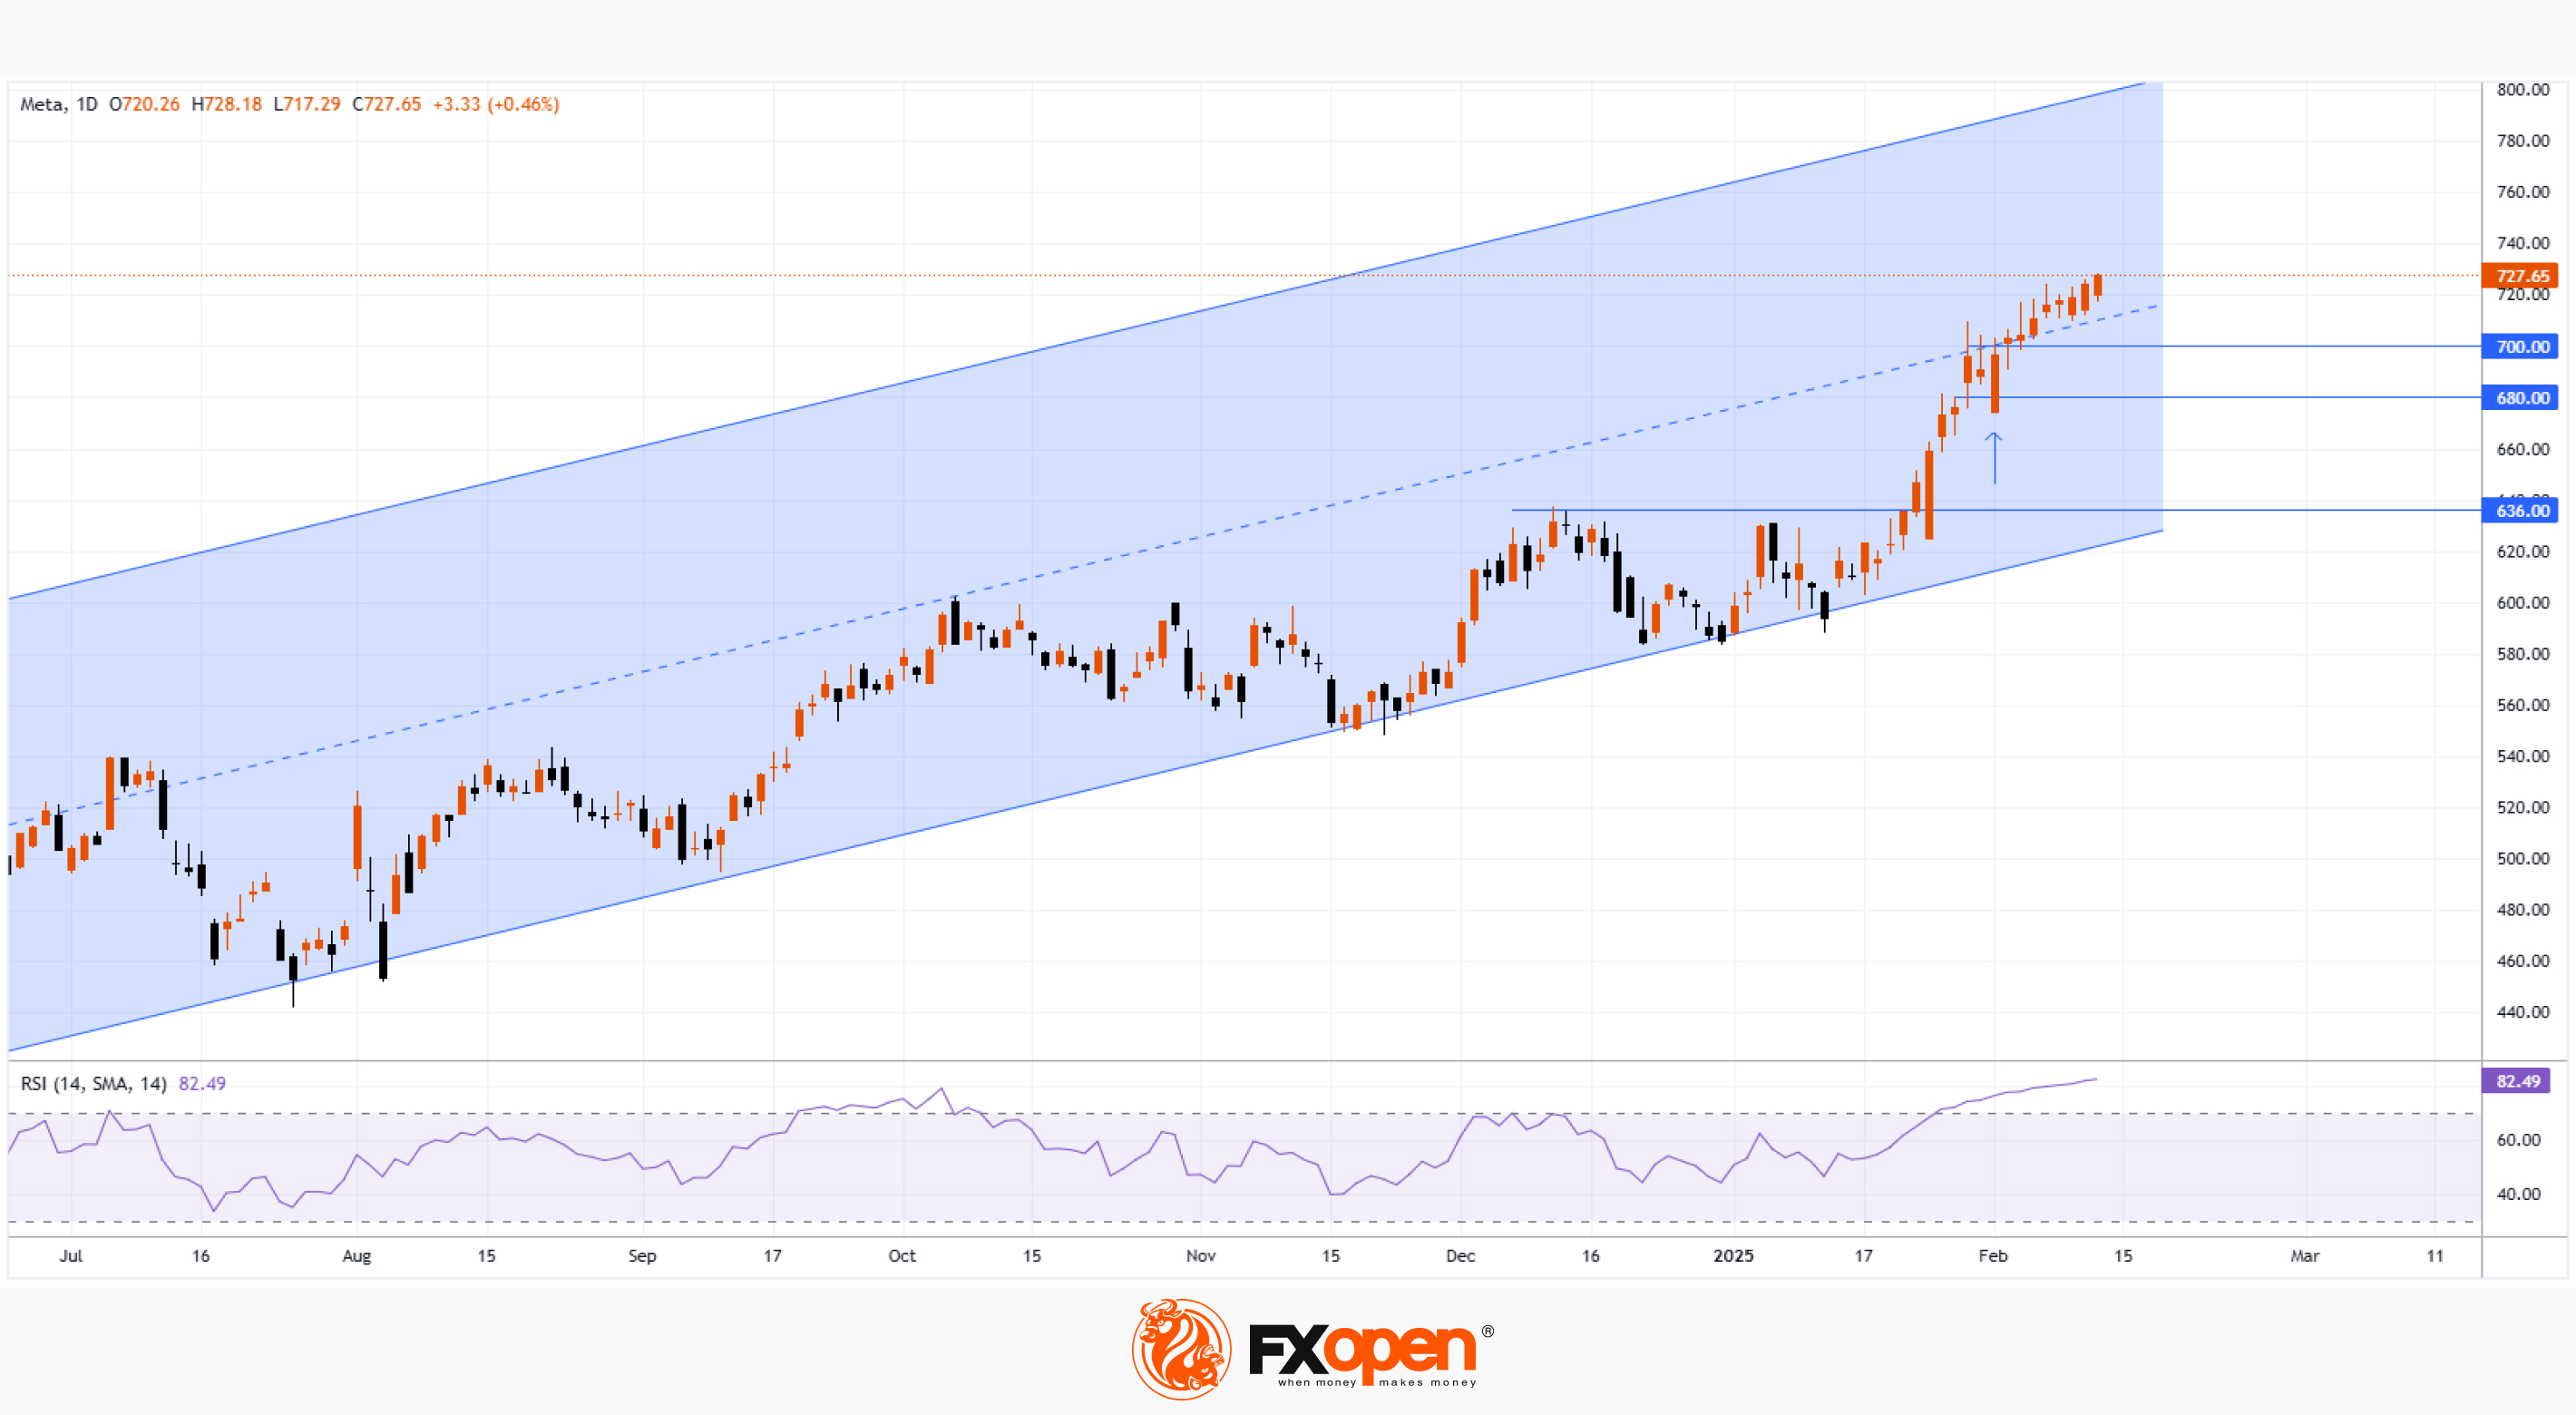
→ Based on closing prices, the stock has posted 19 consecutive daily gains since 17 January.
→ META has reached an all-time high, solidifying above the key $700 per share level.
Bullish sentiment was driven by a strong Q4 earnings report that exceeded analyst expectations:
→ Earnings per share: reported $8.01 vs. expected $6.75.
→ Revenue: reported $48.38 billion vs. expected $46.99 billion.
Additionally, media reports highlighted:
→ Meta Platforms announced a 5% dividend increase.
→ Over 3.3 billion people interact with its apps daily.
→ Mark Zuckerberg stated that 2025 will be a turning point for AI at Meta.
→ Strong ties between the company’s CEO and President Trump.
Technical Analysis of Meta Platforms (META) Stock
Price movements have formed an ascending trend channel (blue) since 2024, with its lower boundary acting as stable support. However, the daily RSI indicator has entered extreme overbought territory, signalling potential vulnerability to a pullback.
If a correction occurs, the $700 psychological level may be tested, similar to how $680 was previously.
Former resistance at $636, reinforced by the channel's lower boundary, appears to be a strong support level.
Analyst Forecasts for Meta Platforms (META) Stock
According to Yahoo Finance:
→ In the past week, 23 analysts raised their earnings per share estimates for META in 2025.
→ 56 out of 65 analysts rate META stock as a "strong buy" or "buy."
TipRanks data indicates an average 12-month price target of $764.61 for META stock.
Trade global index CFDs with zero commission and tight spreads. Open your FXOpen account now or learn more about trading index CFDs with FXOpen.
CFDs are complex instruments and come with a high risk of losing your money.
This article represents the opinion of the Companies operating under the FXOpen brand only. It is not to be construed as an offer, solicitation, or recommendation with respect to products and services provided by the Companies operating under the FXOpen brand, nor is it to be considered financial advice.
👍3
#stockmarket #stocktrading #MarketUpdates #marketanalysis #META
META Share Price Rises Cautiously Ahead of Earnings Report
As shown on the Meta Platforms (META) chart, the share price rose by approximately 1% yesterday. This movement was supported by the announcement of the launch of the Meta AI app—an artificial intelligence-based application that will function as a personal assistant on mobile phones (similar to Google Gemini).
In a different market environment, the news might have prompted a more positive reaction. However, traders currently appear to be exercising caution, as Meta Platforms (META) is due to report its quarterly results after the close of the main trading session today. According to media reports, expectations include:
→ Revenue in the range of $41.35–$41.5 billion, which implies a year-on-year increase of roughly 13–14%.
→ Earnings per share (EPS) between $5.22 and $5.29, indicating a 11–12% rise compared to the same period last year.
Key Factors in Meta’s Quarterly Report
The following areas are likely to have a significant impact on META's share price in the wake of the report:
→ Advertising business, Meta’s primary revenue stream (around 96%). There is a possibility that US tariff policies could prompt major Chinese advertisers—such as Temu—to reduce their advertising spend in the United States.
→ Investment in Artificial Intelligence (AI) and Augmented Reality. Market participants may revise their valuation of the stock downwards if there are lingering concerns over the long-term return on these investments.
→ Forward guidance on revenue and earnings for the next quarter and full year 2025. These forecasts will carry particular weight in an environment of elevated uncertainty linked to US trade policy.
Most Wall Street analysts maintain a “Buy” rating on Meta shares. However, some have lowered their price targets in April, noting that the stock has lost roughly a third of its value since its all-time high in February.
Technical Analysis of Meta Platforms (META)
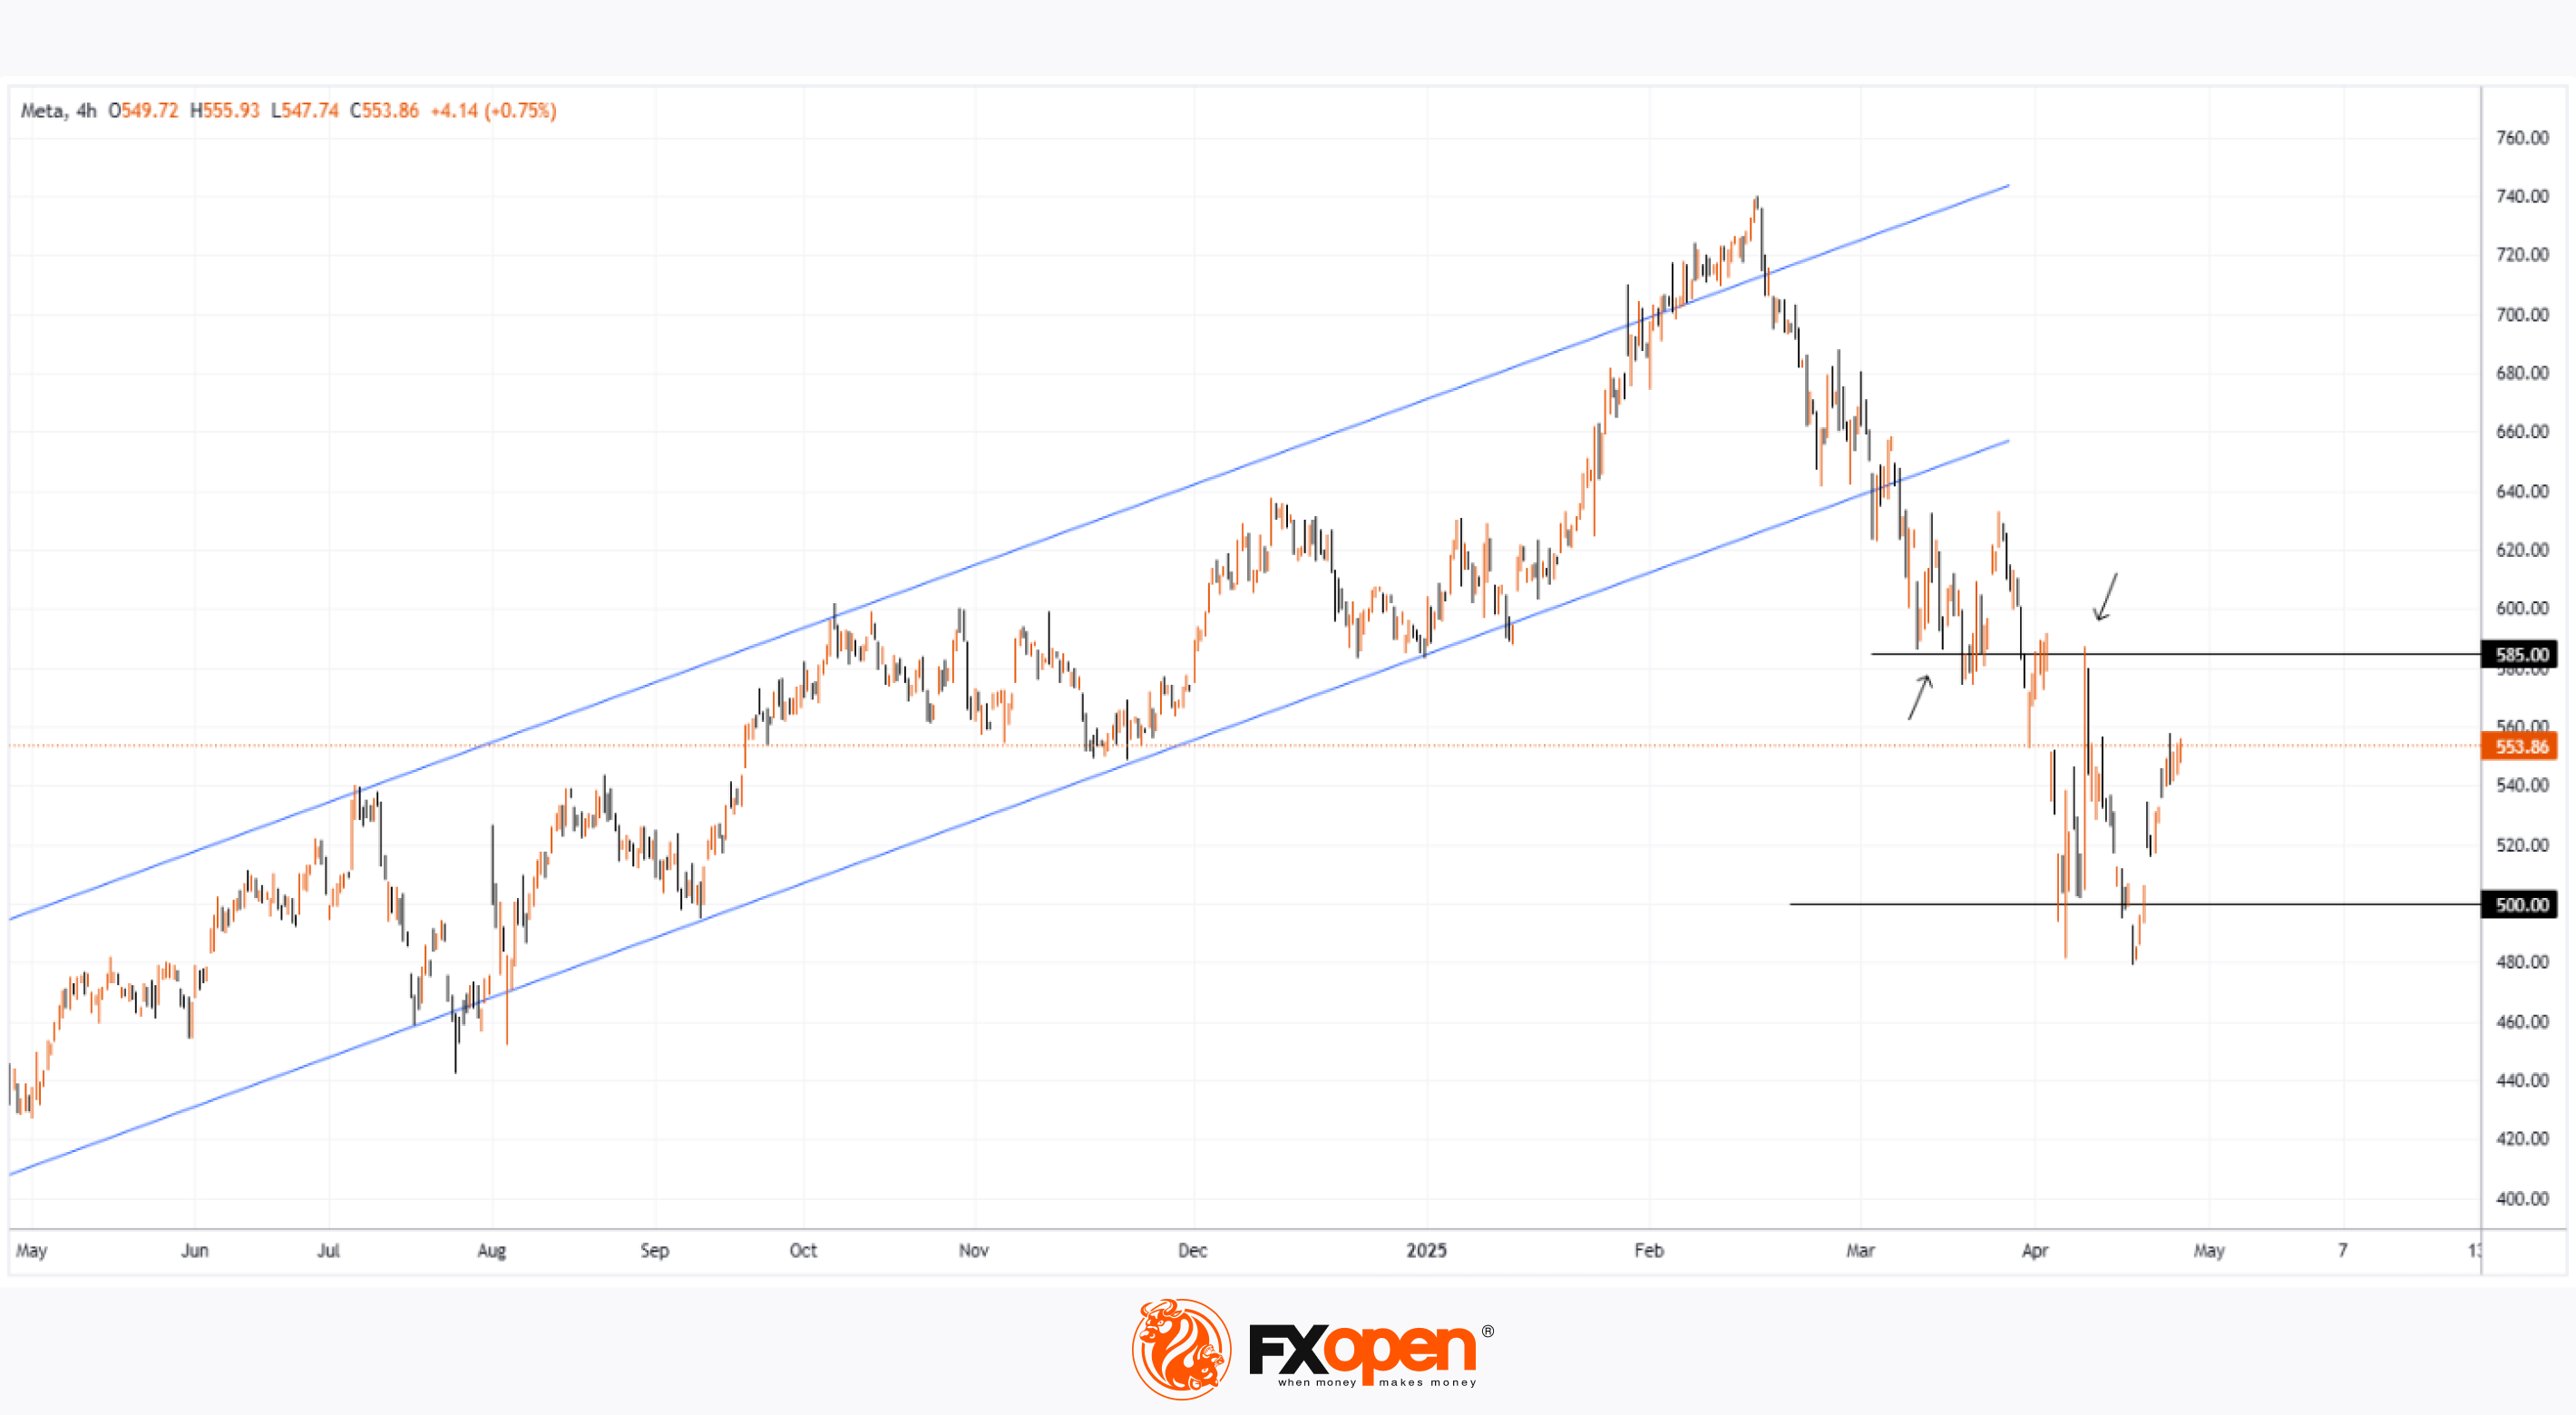
Price movements earlier in 2025 continued to trace a rising trend channel (shown in blue), with a run of 19 consecutive days of gains in February following upbeat news. However, this trend channel appears to have lost relevance at this stage.
The psychological level of $500 now offers strong support, while the $585 level has turned into resistance. It is reasonable to expect that the earnings report could trigger heightened volatility and a test of one of these key price levels.
Trade global index CFDs with zero commission and tight spreads. Open your FXOpen account now or learn more about trading index CFDs with FXOpen.
CFDs are complex instruments and come with a high risk of losing your money.
This article represents the opinion of the Companies operating under the FXOpen brand only. It is not to be construed as an offer, solicitation, or recommendation with respect to products and services provided by the Companies operating under the FXOpen brand, nor is it to be considered financial advice.
👍3
#META #stocktrading #stocks #MarketNews #marketanalysis
Meta Platforms (META) Shares Surge Over 3% in a Day
Shares of American tech giant Meta Platforms (META) rose approximately 3.6% yesterday, continuing their upward trend after gaining about 18% in May.
Why Is META Stock Rising?
Reports emerged yesterday that the company plans to fully automate the ad creation process using artificial intelligence.
According to the Wall Street Journal, Meta Platforms (META) is developing a system that will allow ads to be fully created and targeted using artificial intelligence tools by the end of next year.
How Could AI-Based Social Media Advertising Work?
A brand provides a product image and budget, and Meta’s AI then:
→ generates ads that include images, videos, and text;
→ identifies the target audience across Instagram and Facebook (with a combined audience of over 3 billion users);
→ enables advertisers to personalise ads so that users see different versions of the same ad in real-time, based on factors like geolocation.
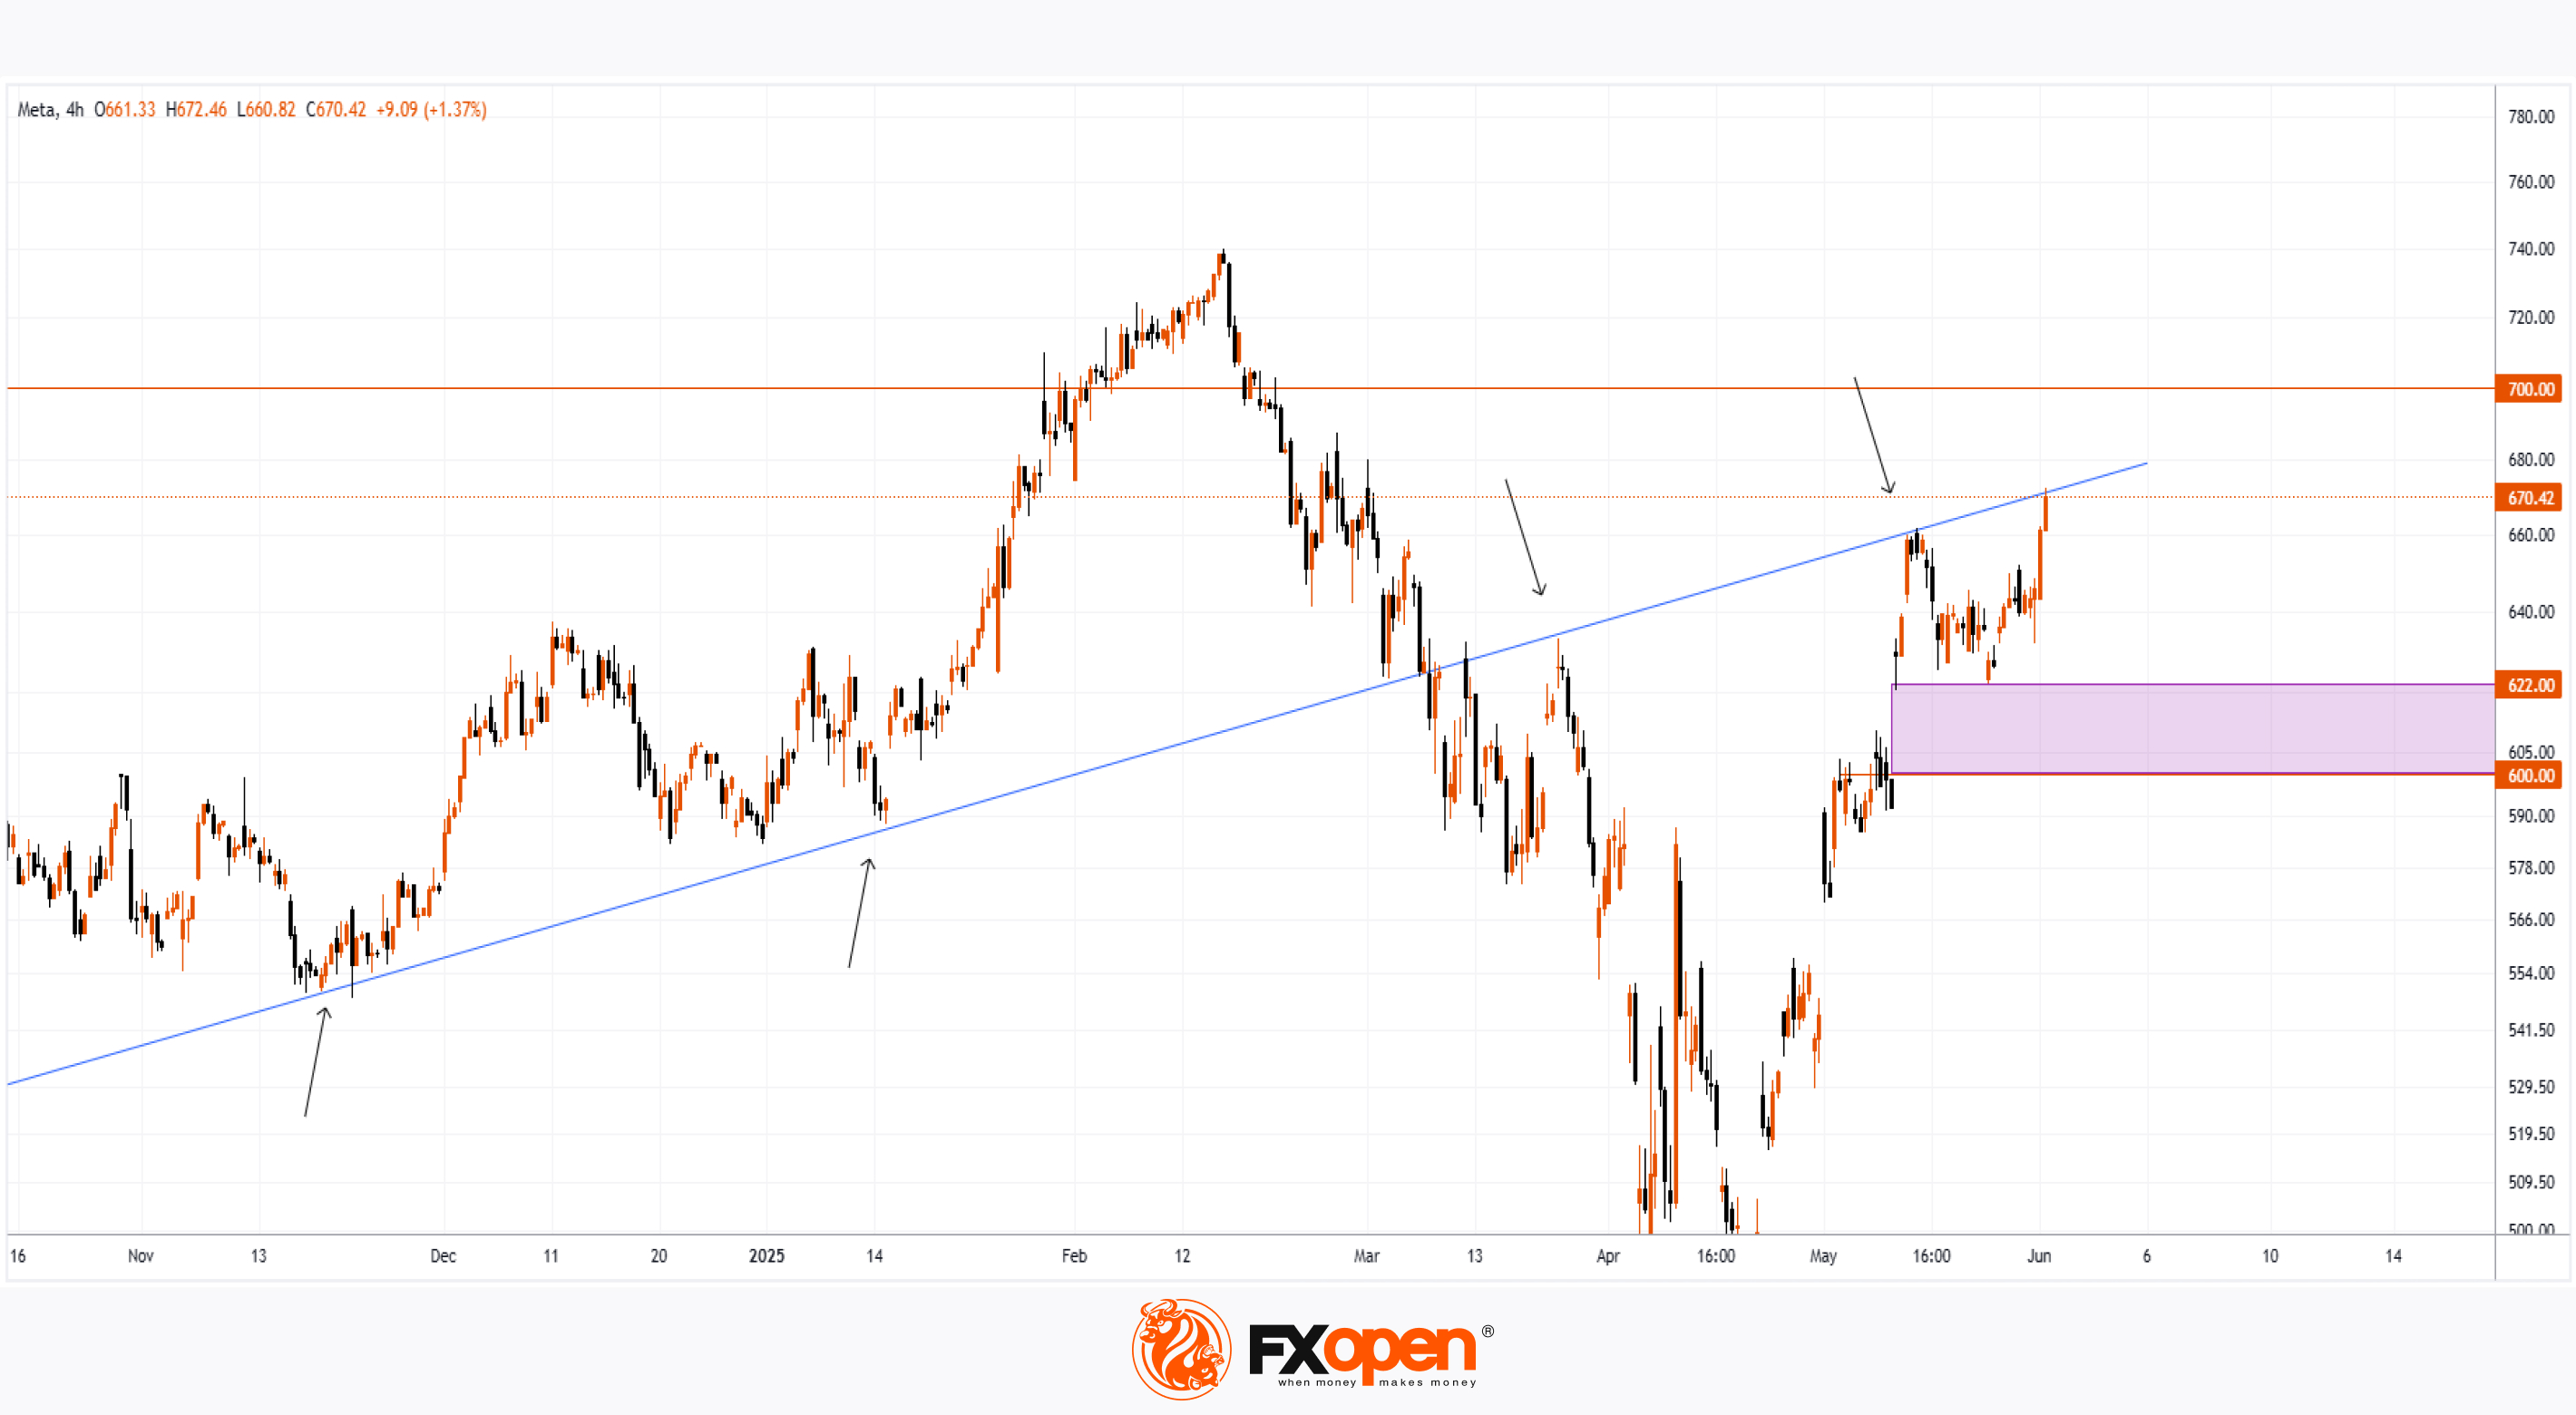
Technical Analysis of META Chart
From a bearish perspective:
→ the price has reached a line that previously acted as support but has now shown signs of becoming resistance (as indicated by arrows);
→ the round $700 level is seen as a psychological barrier, which the price failed to break above in February.
From a bullish perspective, a key support zone lies between the psychological level of $600 and the upper boundary of the bullish gap from 12th May around $622.
It’s worth noting that META's stock rally is underpinned by strong fundamentals:
→ the latest earnings report exceeded analysts’ expectations;
→ optimistic revenue forecasts through the end of the year;
→ hopes that trade wars will have minimal impact on social media platforms.
Therefore, it’s reasonable to assume that buyers may retain control and push towards new all-time highs above $700.
Trade global index CFDs with zero commission and tight spreads. Open your FXOpen account now or learn more about trading index CFDs with FXOpen.
CFDs are complex instruments and come with a high risk of losing your money.
This article represents the opinion of the Companies operating under the FXOpen brand only. It is not to be construed as an offer, solicitation, or recommendation with respect to products and services provided by the Companies operating under the FXOpen brand, nor is it to be considered financial advice.
👍2
#META #stockmarket #stocktrading #marketanalysis #MarketNews
Meta Platforms (META) Shares Decline
Shares of the US tech giant Meta Platforms (META) hit a record high last week, climbing above $780 following the release of a strong earnings report:
→ Earnings per share (EPS) came in at $7.14, significantly exceeding the forecast of $5.88.
→ The company also outperformed expectations on key metrics related to advertising growth.
→ Additionally, the media has highlighted the growing importance of AI technology to Meta’s business.
However, shortly after reaching an all-time high, META shares began to show bearish momentum.
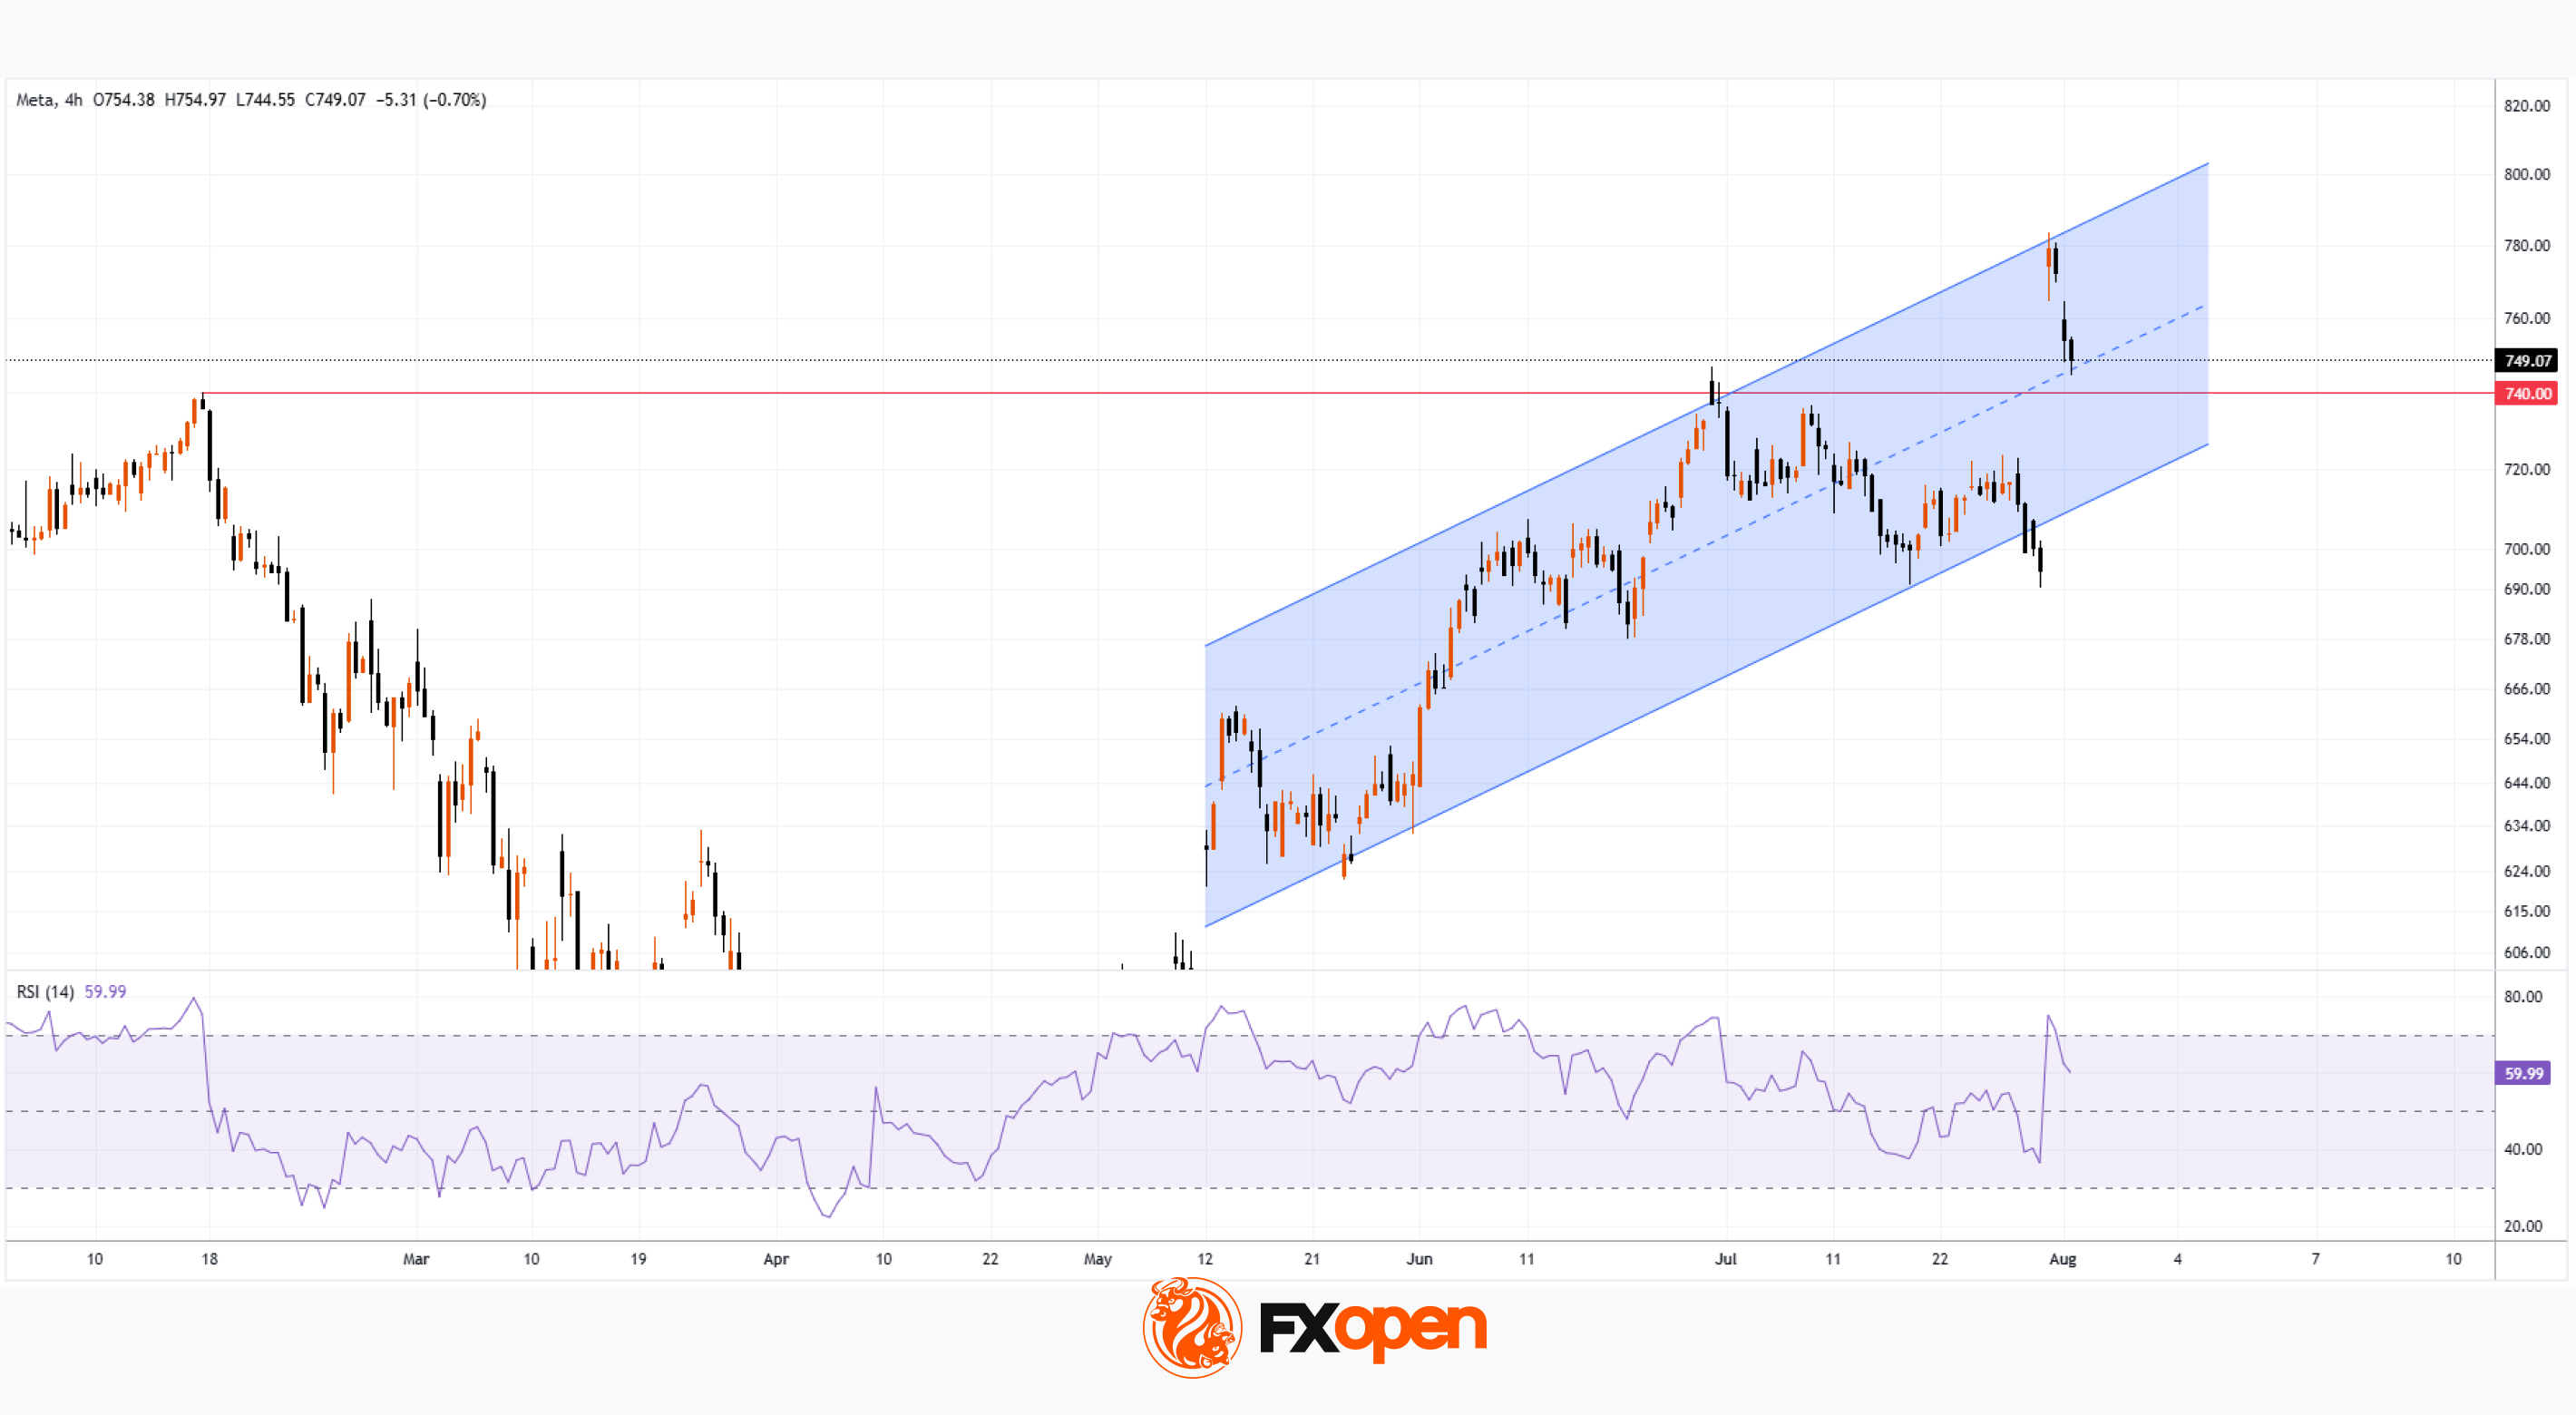
Technical Analysis of the META Chart
On the four-hour chart, the following signals are visible:
→ A bearish engulfing pattern formed on Thursday;
→ A bearish gap appeared at Friday’s market open, followed by a continuation of the downward move.
This represents a notable pullback from the historical peak — potentially indicating that the initial bullish reaction to the earnings report has faded. The share price decline suggests a correction from overbought territory, as confirmed by the RSI indicator.
The $740 level appears to be a key support zone — previously acting as major resistance before the breakout. Bulls could also find support from the median line and the lower boundary of the ascending channel that has been developing since mid-May.
Given this context, a scenario in which bulls attempt to resume the uptrend within the ascending channel cannot be ruled out, especially considering the company’s strong fundamentals and the presence of multiple technical support levels.
Trade global index CFDs with zero commission and tight spreads. Open your FXOpen account now or learn more about trading index CFDs with FXOpen.
CFDs are complex instruments and come with a high risk of losing your money.
This article represents the opinion of the Companies operating under the FXOpen brand only. It is not to be construed as an offer, solicitation, or recommendation with respect to products and services provided by the Companies operating under the FXOpen brand, nor is it to be considered financial advice.
👍2
#META #stockmarket #stocks #MarketUpdates #marketanalysis
Meta Platforms (META) Shares Hold Steady After Mishap
An awkward moment occurred at the Meta Connect 2025 product presentation, where Mark Zuckerberg showcased innovations but ran into technical glitches:
→ The AI assistant built into the Ray-Ban Display smart glasses froze;
→ The neural bracelet, designed to control the interface with gestures, failed to answer a video call.
News of the mishap quickly spread across social media, with the blame for the issues pinned on Wi-Fi. Despite the reputational blow, META shares showed resilience. This suggests that investors are focusing on deeper, fundamental factors, including the potential of augmented reality and the social media giant’s drive for greater efficiency.
Technical Analysis of META Chart
Analysing META’s chart a month ago, we:
→ Drew an ascending channel and a resistance area from the bearish gap (shown in purple);
→ Noted that the price was around its median;
→ Listed bearish signals and suggested a correction, pointing out that in such a case bulls might step in at support around $747 or the channel’s lower boundary.
Indeed, since then (as shown by the dashed arrow):
→ The price fell to the channel’s lower boundary and then rebounded (confirming bullish activity);
→ A bearish breakout attempt failed, and the price returned to the channel, forming a bullish gap (shown in yellow), which acted as support on 12 September.
How Might the Price Move Next?
From a bullish perspective:
→ The ascending channel remains valid, while the price is holding within a steeper growth channel (highlighted in turquoise).
→ The $764 level has switched its role from resistance to support.
→ As shown by the red lines, META’s price action over the past two months can be viewed as a large bullish flag (a corrective pattern within an uptrend) with the potential for trend continuation.
From a bearish perspective:
→ Pressure may come from the psychological $800 per share level.
→ The bearish gap area acts as resistance, as indicated by the black arrow.
→ It is possible that if the price falls below the channel’s lower boundary, the median could act as resistance.
Taking all of this into account, we could assume that bullish sentiment (supported by the Fed’s rate cut) may persist, although the $790–800 area appears to be a key obstacle for META shares.
Trade global index CFDs with zero commission and tight spreads. Learn more about trading index CFDs with FXOpen.
CFDs are complex instruments and come with a high risk of losing your money.
This article represents the opinion of the Companies operating under the FXOpen brand only. It is not to be construed as an offer, solicitation, or recommendation with respect to products and services provided by the Companies operating under the FXOpen brand, nor is it to be considered financial advice.
👍3
#META #stocktrading #stockmarket #MarketNews #marketanalysis
Meta Platforms (META) shares plunge 11%
On Wednesday, Meta Platforms (META) released its quarterly report, which included several positive highlights:
→ revenue rose to $51.2 billion (forecast: $49.5 billion);
→ the size of the daily active audience increased to 3.54 billion people.
However, META’s share price fell below the psychological threshold of $700, hitting its lowest level in almost five months. This drop was triggered by two unpleasant surprises revealed in the report.
Tax write-offs
According to media reports, due to new US tax legislation (referred to as the “One Big Beautiful Bill Act”), the company recorded a one-off income tax expense of $15.93 billion.
Because of this write-off, earnings per share (EPS) came in at $1.05 (analysts had expected $6.72). However, the company clarified that excluding this one-off item, EPS would have been $7.25, which would have been a very strong result.
AI-related expenses
Another factor that may have alarmed shareholders is that Mark Zuckerberg’s company raised its capital expenditure forecast for 2025 to $70–72 billion. These funds will go towards building data centres and purchasing AI chips.
In essence, Meta Platforms is striving to take a leading position in the AI space and is prepared to spend tens of billions to achieve that goal. For shareholders, this means that even as revenue grows, net profit is being eroded by massive spending—and it remains unclear when these costs will pay off.
Technical analysis of META’s chart
When analysing META’s chart in mid-August, we:
→ drew an ascending channel (shown in blue);
→ pointed out signs of weakness (including a bearish gap¹, shown in orange);
→ suggested that the balance could shift in favour of the bears, which might trigger a noticeable correction in META’s share price.
This scenario played out as a decline from A → B. After rebounding from the key line of the blue channel, the price rose towards the bearish gap¹, forming a lower high C. The downward movement then continued, and the channel was extended with a lower low D.
The large bearish gap² that formed this week could also act as resistance (as in the previous case), and this effect is likely to be more pronounced near the $700 psychological level.
Overall, the picture looks extremely negative:
→ the sequence of lower highs and lows A → D is likely to continue with a new lower low F;
→ the price remains in the lower half of the red channel, drawn along this sequence.
From a bullish perspective:
→ $650 serves as a psychological support level;
→ if the rise from the April low to peak A is viewed as an impulse, then the decline A → F is approaching $640, corresponding to the 50% Fibonacci retracement level.
Given the above, it is reasonable to assume that the market will now reassess the new factors revealed in the report. From a charting standpoint, this could mean a period of consolidation, with META’s share price fluctuating between the red median line and the current support level of $650.
Trade global index CFDs with zero commission and tight spreads. Learn more about trading index CFDs with FXOpen.
CFDs are complex instruments and come with a high risk of losing your money.
This article represents the opinion of the Companies operating under the FXOpen brand only. It is not to be construed as an offer, solicitation, or recommendation with respect to products and services provided by the Companies operating under the FXOpen brand, nor is it to be considered financial advice.
👍1
#META #stockmarket #stocktrading #marketanalysis #MarketNews
Meta Platforms (META) Shares Fall to Key Support
In November, Meta Platforms (META) shares have shown bearish momentum following the company’s quarterly report, which included a one-off income tax expense of $15.93 billion (as previously noted).
Investor concerns have been further fuelled by the company’s plans to raise capital expenditure to $70–72 billion in 2025, aimed at expanding data centre infrastructure and acquiring AI chips. However, after a decline of more than 20% from the autumn peak, bulls may soon attempt a comeback.
Technical Analysis of META
When analysing META’s chart on 31 October, a descending channel (shown in red) was identified. As of today, the share price has reached a support block formed by the following key elements:
→ the lower boundary of the descending channel;
→ the psychological level of $600 per share;
→ and the May bullish gap area.
It is also worth noting that the RSI is approaching oversold territory, and a false bearish breakout below the $600 psychological level could create a bullish divergence.
Therefore, it cannot be ruled out that:
→ the November decline has already priced in the post-earnings concerns;
→ and that bulls may use this support zone as a springboard to resume the broader uptrend.
Trade global index CFDs with zero commission and tight spreads. Learn more about trading index CFDs with FXOpen.
CFDs are complex instruments and come with a high risk of losing your money.
This article represents the opinion of the Companies operating under the FXOpen brand only. It is not to be construed as an offer, solicitation, or recommendation with respect to products and services provided by the Companies operating under the FXOpen brand, nor is it to be considered financial advice.
👍2
#meta #stockmarket #stocktrading #MarketNews #MarketUpdates
Meta Platforms (META) Shares Rise Above $700 After Earnings Release
Yesterday, Meta Platforms published its fourth-quarter 2025 earnings report, which made a strong impression. In after-hours trading, META shares surged by more than 10% at one point, reaching around $740.
Why META Shares Are Rising
The company not only met analysts’ expectations but significantly exceeded them:
→ Earnings per share (EPS): actual $8.88 (expected $8.19–8.21), up 11% year-on-year.
→ Revenue: actual $59.9bn (forecast around $58.35bn).
In addition, the media highlighted several positive factors:
→ A strong outlook for 2026.
→ A high operating margin of around 41%, demonstrating strong business efficiency despite substantial spending.
→ Continued growth in advertising services: the company has integrated AI into ad delivery, with growth seen both in ad pricing (+6%) and the number of impressions (+18%).
A particularly important development was Mark Zuckerberg’s statement that the Reality Labs division is expected to pass its peak loss this year. This reassured investors concerned about prolonged cash burn related to capital expenditure.
Technical Analysis of the META Chart
On higher timeframes, the price remains in an uptrend. In January, the lower boundary of the long-term channel once again acted as support (indicated by the arrow).
In pre-market trading, META is quoted around $715–720. If the main session opens in this area, two observations appear especially important:
1 → The price is breaking upwards out of a descending channel (shown in red), which can be interpreted as an intermediate correction — a classic bull flag — within the broader prevailing uptrend.
2 → The price is moving above a key area that includes the psychological $700 level, which has acted as both support and resistance since July 2025. This zone may now provide a base for bulls in their attempt to move towards the median of the long-term channel.
Trade global index CFDs with zero commission and tight spreads*. Learn more about trading index CFDs with FXOpen. *Additional fees may apply.
CFDs are complex instruments and come with a high risk of losing money rapidly due to leverage. You should consider whether you understand how CFDs work, and whether you can afford to take the high risk of losing your money. You can find the full disclaimer here: www.fxopen.com
This article represents the opinion of the Companies operating under the FXOpen brand only. It is not to be construed as an offer, solicitation, or recommendation with respect to products and services provided by the Companies operating under the FXOpen brand, nor is it to be considered financial advice.
👍2
#META #stockmarket #stocktrading #marketanalysis #MarketNews
Meta Platforms (META) Shares Fall by Around 8%
Yesterday, shares of Meta Platforms saw a sharp decline, dropping by approximately 8%, with trading closing below the $550 level for the first time since late April 2025.
Why META Shares Declined
The move was driven by a combination of factors, including:
→ Jury ruling. According to media reports, a jury ordered Meta to pay $375 million for misleading parents about the safety of Instagram and Facebook. The court also found the company liable for developing addictive algorithms that harm teenagers’ mental health.
→ Confirmed capital expenditure (CapEx) for 2026 in the range of $115–135 billion. Significant funds are being directed towards energy infrastructure, including a 6.6 GW nuclear energy deal to power the Prometheus supercomputer. The market may question whether returns on AI investments will justify such large-scale spending.
Sentiment has also been weighed down by reports of plans to cut up to 20% of the workforce. While layoffs are typically viewed positively due to cost savings, in this case they may signal that profit margins are being squeezed more than expected due to AI-related expenditure.
Technical Analysis of META
At the end of January, we:
→ constructed a system of two trend channels;
→ noted that META’s share price had moved above the psychological $700 level.
As it turned out, this was a bull trap formed in the wake of strong quarterly earnings. In early February, the price fell towards the lower boundary of the long-term ascending channel, and by the 13th, that boundary was broken under selling pressure.
As a result, the upward trajectory is losing relevance, giving way to the previously identified descending trend channel. In this context, the bearish breakout zone at $620–640 may now act as resistance, where sellers previously showed strength.
Additionally, it is worth noting that:
→ the psychological $600 level has lost its role as support;
→ yesterday’s candle featured a wide body with a close near the low, accompanied by high volumes — a clear sign of heavy selling pressure.
Against this backdrop, it cannot be ruled out that continued bearish control may push META’s price towards the lower boundary of the red channel.
Trade global index CFDs with zero commission and tight spreads*. Learn more about trading index CFDs with FXOpen. *Additional fees may apply.
CFDs are complex instruments and come with a high risk of losing money rapidly due to leverage. You should consider whether you understand how CFDs work, and whether you can afford to take the high risk of losing your money. You can find the full disclaimer here: www.fxopen.com
This article represents the opinion of the Companies operating under the FXOpen brand only. It is not to be construed as an offer, solicitation, or recommendation with respect to products and services provided by the Companies operating under the FXOpen brand, nor is it to be considered financial advice.
👍3
#META #stockmarket #stocks #marketanalysis #marketanalysis
Meta Platforms: Strong Earnings Fail to Support the Share Price
Meta's revenue rose by 33% year-on-year in the first quarter of 2026, reaching $56.3 billion. Adjusted earnings per share came in at $7.31, comfortably ahead of the consensus forecast of $6.67. However, the positive earnings results were overshadowed by other developments.
Alongside the report, the company raised its 2026 capital expenditure forecast to between $125 billion and $145 billion, which the market interpreted as a signal of potential pressure on free cash flow. Additional pressure on the share price emerged in early June following reports that Meta was considering raising tens of billions of dollars through a new share offering to finance AI infrastructure projects. The company itself dismissed these reports as "pure speculation".
Technical Picture
Since the beginning of April, Meta shares had been trading within an ascending trend structure that originated from the March low. Towards the end of April, however, a gap formed on the chart, followed by a break of the trendline. Since then, the stock has entered a sideways phase, losing its previous upward momentum.
The share price is currently trading below the lower boundary of the volume profile at 598 and below the point of control (POC) located in the 610–611 area — levels that could once again attract market attention should buying interest return.
The green support level near 565 may serve as a downside target if selling pressure continues. Meanwhile, the resistance zone around 641 remains the next major upside reference point in the event of a reversal and a break above the upper boundary of the profile.
The RSI and its moving averages currently stand at 37, 44 and 46. The oscillator has moved below the neutral zone, while the moving averages continue to confirm the prevailing bearish direction.
Key Takeaways
Following the break of the ascending trendline and the formation of the April gap, Meta shares entered a consolidation phase and are currently testing its lower boundary. Future price action will largely depend on how transparent management proves to be regarding the financing of its AI initiatives and whether the company can demonstrate that its substantial capital investments translate into tangible operational results.
Trade global index CFDs with zero commission and tight spreads*. Learn more about trading index CFDs with FXOpen. *Additional fees may apply.
CFDs are complex instruments and come with a high risk of losing money rapidly due to leverage. You should consider whether you understand how CFDs work, and whether you can afford to take the high risk of losing your money. You can find the full disclaimer here: www.fxopen.com
This article represents the opinion of the Companies operating under the FXOpen brand only. It is not to be construed as an offer, solicitation, or recommendation with respect to products and services provided by the Companies operating under the FXOpen brand, nor is it to be considered financial advice.
👍2
#META #stockmarket #trading #marketanalysis #MarketNews
Meta: One Trendline Away From Reversing an Eight-Month Downtrend
Meta just delivered a genuinely strange quarter: revenue beat, earnings missed, and the market couldn't quite decide how to feel about it. Q2 revenue came in at $60.8 billion, above the $60.22 billion consensus and up 28% year-over-year, yet EPS landed at $6.18 against $7.19 expected, sending shares down roughly 3.4% in the immediate aftermath.
The real story sits beneath the headline numbers. Free cash flow collapsed 91% year-over-year to just $784 million, a direct consequence of Zuckerberg's aggressive AI buildout, with capex alone hitting $31.1 billion in the quarter as part of a planned $130-145 billion for the full year. The company is betting big on what it calls "personal superintelligence," recently launching new Muse AI models to back that ambition, while its Family of Apps still reached 3.6 billion daily active people in June, proof the core business remains formidable.
Adding to the pressure, fresh privacy scrutiny in Europe and mounting US legal challenges around youth safety have kept sentiment cautious. With shares down roughly 11% year-to-date and trading well below their 52-week high near $796, the market is clearly still weighing whether this AI bet will pay off.
Technical Analysis of Meta Platforms
As the daily chart shows, META has been trading within a broader descending trendline since January's highs near $740, with price recently rebounding sharply off the post-earnings low near $524.75 before running into a wall of resistance at the confluence of the 200-day EMA, the 0.618 Fibonacci retracement near $622.96, and the descending trendline itself around $600. That rejection has since pulled price back toward the 0.382 retracement near $585.46.
Bullish Scenario
Should buyers defend the 0.382 support and stage another push higher, the real test remains that same trendline-EMA-Fibonacci confluence near $605-$625. A confirmed break above this zone would be a genuinely significant technical shift, opening the path toward the 0.786 retracement near $649.66, and eventually the 1.0 level at $683.67.
Bearish Scenario
Conversely, a break below the 0.382 support at $585.46 would signal renewed weakness, exposing the 0.5 retracement near $604 as a lesser hurdle already cleared, but more importantly risking a full retest of the $524.75 low that marked the post-earnings capitulation.
With price wedged between a defended support and a stubborn multi-month trendline, META's next move looks set to determine whether this rebound has real legs, or whether the broader downtrend since January is still very much in control.
Trade global index CFDs with zero commission and tight spreads*. Learn more about trading index CFDs with FXOpen. *Additional fees may apply.
CFDs are complex instruments and come with a high risk of losing money rapidly due to leverage. You should consider whether you understand how CFDs work, and whether you can afford to take the high risk of losing your money. You can find the full disclaimer here: www.fxopen.com
This article represents the opinion of the Companies operating under the FXOpen brand only. It is not to be construed as an offer, solicitation, or recommendation with respect to products and services provided by the Companies operating under the FXOpen brand, nor is it to be considered financial advice.
👍4
#META #stockmarket #MarketNews #MarketUpdates
Meta Analysis: Price Attempts to Hold Above the Pattern Amid Mixed Volume Signals
On 26 August, Meta announced an agreement with a bipartisan group of 52 state and territorial attorneys general and the Attorney General of the District of Columbia. Under the agreement, the company will pay around $18 billion over ten years and introduce additional restrictions for underage Facebook and Instagram users, including a two-hour daily usage limit and an overnight app block from midnight to 6:00 am. Around $5.3 billion of this amount will only be payable if TikTok and YouTube implement similar measures and each pay a corresponding amount. Meta also expects to recognise around $10 billion in legal expenses in Q3 2026 in connection with the agreement.
Technical Analysis of Meta
On the four-hour META chart, the medium-term picture remains range-bound, with the price continuing to move within a broad range between the 690 and 540 areas. Within this range, a short-term decline occurred between 15 and 30 July, during which a pattern resembling a converging triangle formed near the lower end of the move. The pattern’s boundaries progressively narrowed the amplitude of price fluctuations. However, the vertical volume profile throughout the pattern’s formation does not appear typical of this type of consolidation, raising questions about the technical integrity of the structure.
After breaking above the pattern’s upper boundary, the price remains within the current market profile and is now squeezed between the Point of Control (POC) at $587.00 and the upper boundary of the profile at $600.00, attempting to establish itself above the pattern. Red resistance is located around $612.00 and is relatively close to the profile. If the price returns to the pattern’s range and establishes itself below the lower boundary of the profile at $564.00, a green support level around $550.00 could come into play. This level is also relatively close to the profile.
The RSI + MAs indicator is showing readings of 62, 54 and 49. The oscillator is above the neutral zone, while the moving averages remain within the zone, meaning that it is still too early to speak of a confirmed breakout.
Key Takeaways
The atypical volume pattern within the formation, combined with the incomplete RSI + MAs signal, leaves open the question of how sustainable the price’s move above the established structure will prove to be. An additional source of uncertainty is that part of the litigation settlement remains conditional on decisions by Meta’s competitors across the industry.
Trade global index CFDs with zero commission and tight spreads*. Learn more about trading index CFDs with FXOpen. *Additional fees may apply.
CFDs are complex instruments and come with a high risk of losing money rapidly due to leverage. You should consider whether you understand how CFDs work, and whether you can afford to take the high risk of losing your money. You can find the full disclaimer here: www.fxopen.com
This article represents the opinion of the Companies operating under the FXOpen brand only. It is not to be construed as an offer, solicitation, or recommendation with respect to products and services provided by the Companies operating under the FXOpen brand, nor is it to be considered financial advice.
👍4