
#marketanalysis #MarketNews #forextrading
NZD/USD Plunges Following RBNZ Decision
The exchange rate fell by 1.1% after the Reserve Bank of New Zealand cut interest rates by 25 basis points to 5.25% and signalled further easing.
According to RBNZ Governor Adrian Orr:
→ Inflation is returning to the target range, and the bank may begin normalising rates;
→ Several scenarios were considered, and consensus was reached for a 25 basis point rate cut;
→ Forecasts indicate that New Zealand is moving towards a period of low and stable inflation;
→ The economy is meeting expectations, although high-frequency data show some weakening.
The rate cut decision was somewhat unexpected, as the RBNZ had previously forecast that the rate-cutting cycle would start later. This has resulted in increased volatility in the NZD/USD chart today.
According to technical analysis of the NZD/USD chart:
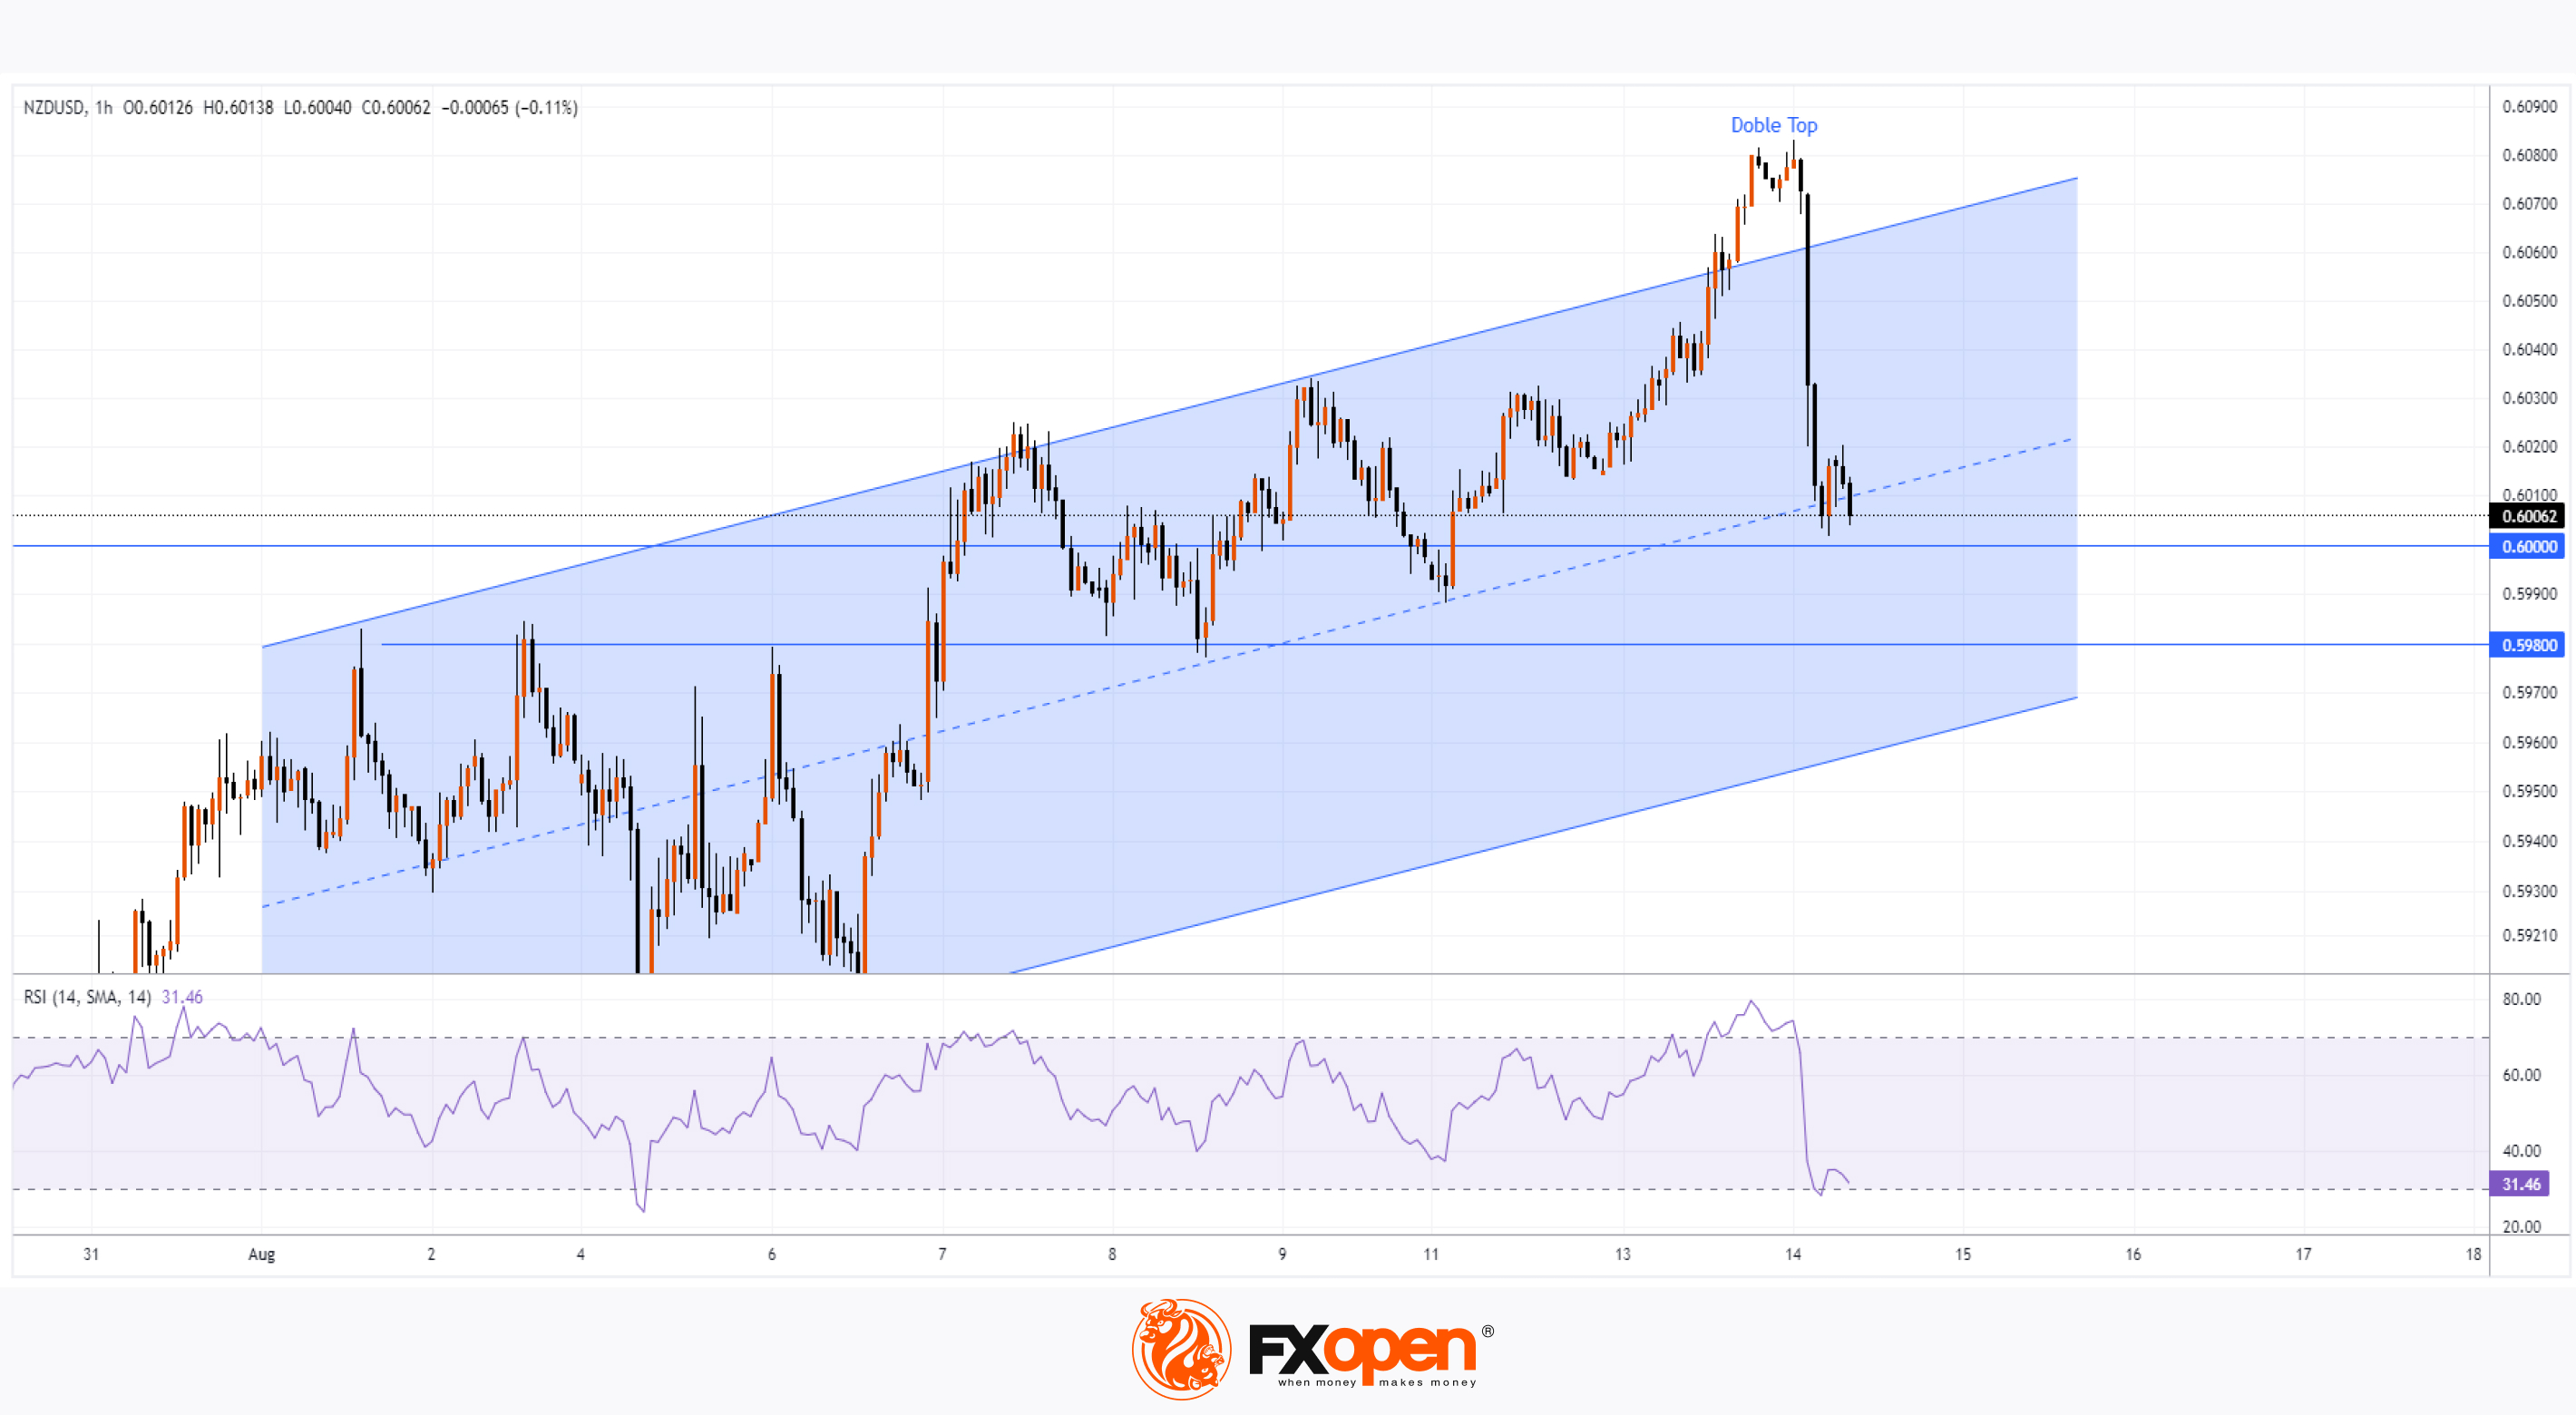
→ In August, the price formed an ascending channel (shown in blue);
→ Yesterday, a bearish Double Top pattern emerged above the upper boundary of the channel—this was a warning signal for bulls, considering that the RSI indicator was in overbought territory;
→ The RBNZ decision pushed the price to the channel’s median, which is acting as support.
It is possible that the median may be breached by bears and the decline could continue. If so, support may be anticipated at the psychological level of 0.600 and the 0.598 level, which acted as resistance in early August before switching roles.
Much of the future direction of the NZD/USD rate will depend on news from the US: today, at 15:30 GMT+3, the Consumer Price Index (CPI) figures will be released.
Trade over 50 forex markets 24 hours a day with FXOpen. Take advantage of low commissions, deep liquidity, and spreads from 0.0 pips. Open your FXOpen account now or learn more about trading forex with FXOpen.
CFDs are complex instruments and come with a high risk of losing your money.
This article represents the opinion of the Companies operating under the FXOpen brand only. It is not to be construed as an offer, solicitation, or recommendation with respect to products and services provided by the Companies operating under the FXOpen brand, nor is it to be considered financial advice.
NZD/USD Plunges Following RBNZ Decision
The exchange rate fell by 1.1% after the Reserve Bank of New Zealand cut interest rates by 25 basis points to 5.25% and signalled further easing.
According to RBNZ Governor Adrian Orr:
→ Inflation is returning to the target range, and the bank may begin normalising rates;
→ Several scenarios were considered, and consensus was reached for a 25 basis point rate cut;
→ Forecasts indicate that New Zealand is moving towards a period of low and stable inflation;
→ The economy is meeting expectations, although high-frequency data show some weakening.
The rate cut decision was somewhat unexpected, as the RBNZ had previously forecast that the rate-cutting cycle would start later. This has resulted in increased volatility in the NZD/USD chart today.
According to technical analysis of the NZD/USD chart:
→ In August, the price formed an ascending channel (shown in blue);
→ Yesterday, a bearish Double Top pattern emerged above the upper boundary of the channel—this was a warning signal for bulls, considering that the RSI indicator was in overbought territory;
→ The RBNZ decision pushed the price to the channel’s median, which is acting as support.
It is possible that the median may be breached by bears and the decline could continue. If so, support may be anticipated at the psychological level of 0.600 and the 0.598 level, which acted as resistance in early August before switching roles.
Much of the future direction of the NZD/USD rate will depend on news from the US: today, at 15:30 GMT+3, the Consumer Price Index (CPI) figures will be released.
Trade over 50 forex markets 24 hours a day with FXOpen. Take advantage of low commissions, deep liquidity, and spreads from 0.0 pips. Open your FXOpen account now or learn more about trading forex with FXOpen.
CFDs are complex instruments and come with a high risk of losing your money.
This article represents the opinion of the Companies operating under the FXOpen brand only. It is not to be construed as an offer, solicitation, or recommendation with respect to products and services provided by the Companies operating under the FXOpen brand, nor is it to be considered financial advice.
👍1
#stockmarket #stocktrading #marketanalysis #GOOGL
Alphabet Inc (GOOGL) Shares Under Pressure
On 24th July, we noted in our analysis of the Alphabet Inc (GOOGL) price chart:
→ The share price had fallen despite the report's results surpassing analysts' expectations;
→ The upward momentum in the price chart was losing strength.
Since that publication, the Alphabet Inc (GOOGL) share price has dropped by 5%. While the sharp decline in stock markets on 5th August significantly impacted it, it's worth noting that since the previous Monday, the share price has been recovering more poorly than the index.
Bearish sentiment is being driven by:
→ A delay in showcasing the capabilities of the Gemini AI assistant at the “Made by Google” event;
→ Speculation about a potential breakup of Google under US antitrust laws. According to Benzinga, the US Department of Justice (DOJ) is considering this possibility.
Technical analysis of the Alphabet Inc (GOOGL) stock chart shows that:
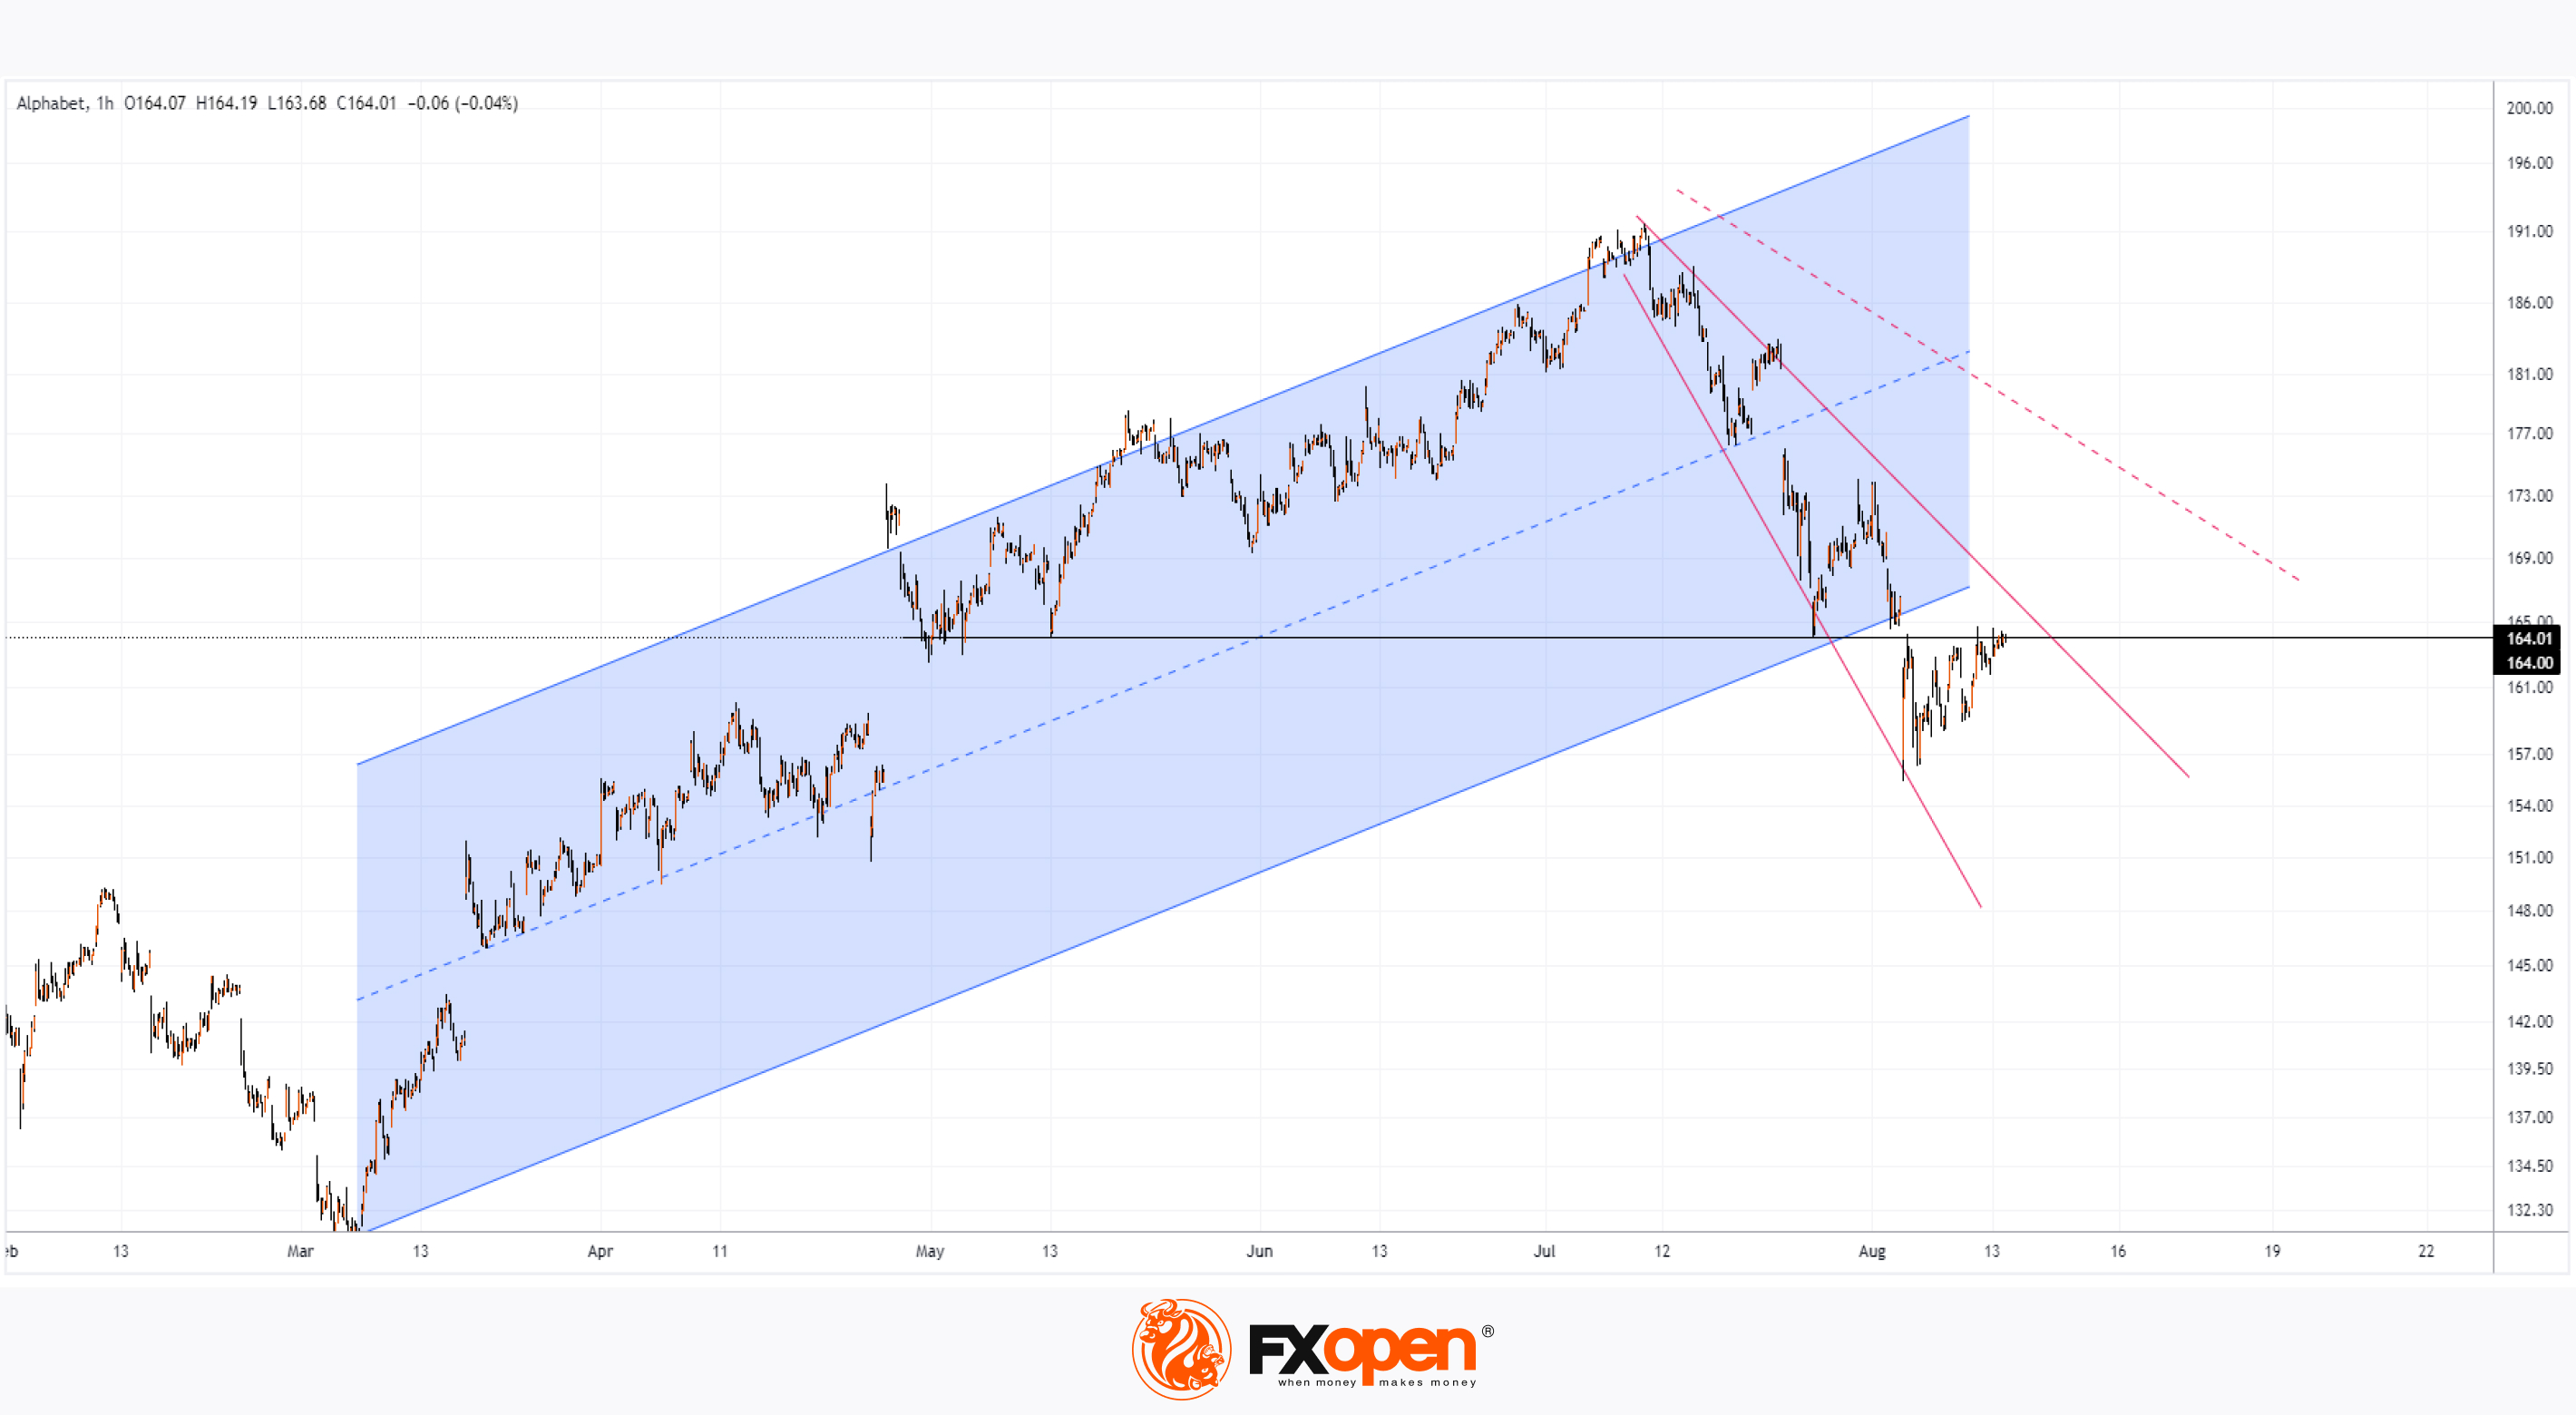
→ The price has dropped below the blue ascending channel;
→ The price has broken below the $164 level, which had acted as support since the gap formation in late April. This week, it is showing signs of resistance;
→ Price action in early August has formed the contours of an expanding fan pattern (shown in red).
If bulls manage to break through the $164 level, they may encounter resistance from the next fan line (shown as a dashed line).
Meanwhile, 37 Wall Street analysts surveyed by TipRanks have positive forecasts:
→ 30 analysts recommend buying Alphabet Inc (GOOGL) shares, with none recommending a sell;
→ The price target for Alphabet Inc (GOOGL) is $204.74 over the next 12 months (+24.72% from yesterday’s close).
Trade global index CFDs with zero commission and tight spreads. Open your FXOpen account now or learn more about trading index CFDs with FXOpen.
CFDs are complex instruments and come with a high risk of losing your money.
This article represents the opinion of the Companies operating under the FXOpen brand only. It is not to be construed as an offer, solicitation, or recommendation with respect to products and services provided by the Companies operating under the FXOpen brand, nor is it to be considered financial advice.
Alphabet Inc (GOOGL) Shares Under Pressure
On 24th July, we noted in our analysis of the Alphabet Inc (GOOGL) price chart:
→ The share price had fallen despite the report's results surpassing analysts' expectations;
→ The upward momentum in the price chart was losing strength.
Since that publication, the Alphabet Inc (GOOGL) share price has dropped by 5%. While the sharp decline in stock markets on 5th August significantly impacted it, it's worth noting that since the previous Monday, the share price has been recovering more poorly than the index.
Bearish sentiment is being driven by:
→ A delay in showcasing the capabilities of the Gemini AI assistant at the “Made by Google” event;
→ Speculation about a potential breakup of Google under US antitrust laws. According to Benzinga, the US Department of Justice (DOJ) is considering this possibility.
Technical analysis of the Alphabet Inc (GOOGL) stock chart shows that:
→ The price has dropped below the blue ascending channel;
→ The price has broken below the $164 level, which had acted as support since the gap formation in late April. This week, it is showing signs of resistance;
→ Price action in early August has formed the contours of an expanding fan pattern (shown in red).
If bulls manage to break through the $164 level, they may encounter resistance from the next fan line (shown as a dashed line).
Meanwhile, 37 Wall Street analysts surveyed by TipRanks have positive forecasts:
→ 30 analysts recommend buying Alphabet Inc (GOOGL) shares, with none recommending a sell;
→ The price target for Alphabet Inc (GOOGL) is $204.74 over the next 12 months (+24.72% from yesterday’s close).
Trade global index CFDs with zero commission and tight spreads. Open your FXOpen account now or learn more about trading index CFDs with FXOpen.
CFDs are complex instruments and come with a high risk of losing your money.
This article represents the opinion of the Companies operating under the FXOpen brand only. It is not to be construed as an offer, solicitation, or recommendation with respect to products and services provided by the Companies operating under the FXOpen brand, nor is it to be considered financial advice.
👍1
#GBPUSD #MarketNews #marketanalysis #forextrading
GBP/USD Analysis: Rate Steady After Key Data Releases
Yesterday, important U.S. inflation data was released, as reported by ForexFactory:
→ Core CPI (MoM): actual = 0.2%, forecast = 0.2%; previous = 0.1%;
→ CPI (YoY): actual = 2.9%, forecast = 3.0%; previous = 3.0%.
Today, market participants learned about the change in the UK’s monthly GDP: actual = 0.0%, forecast = 0.0%; previous = 0.4%.
However, these news releases had little impact on the GBP/USD exchange rate, likely because the actual figures were in line with expectations.
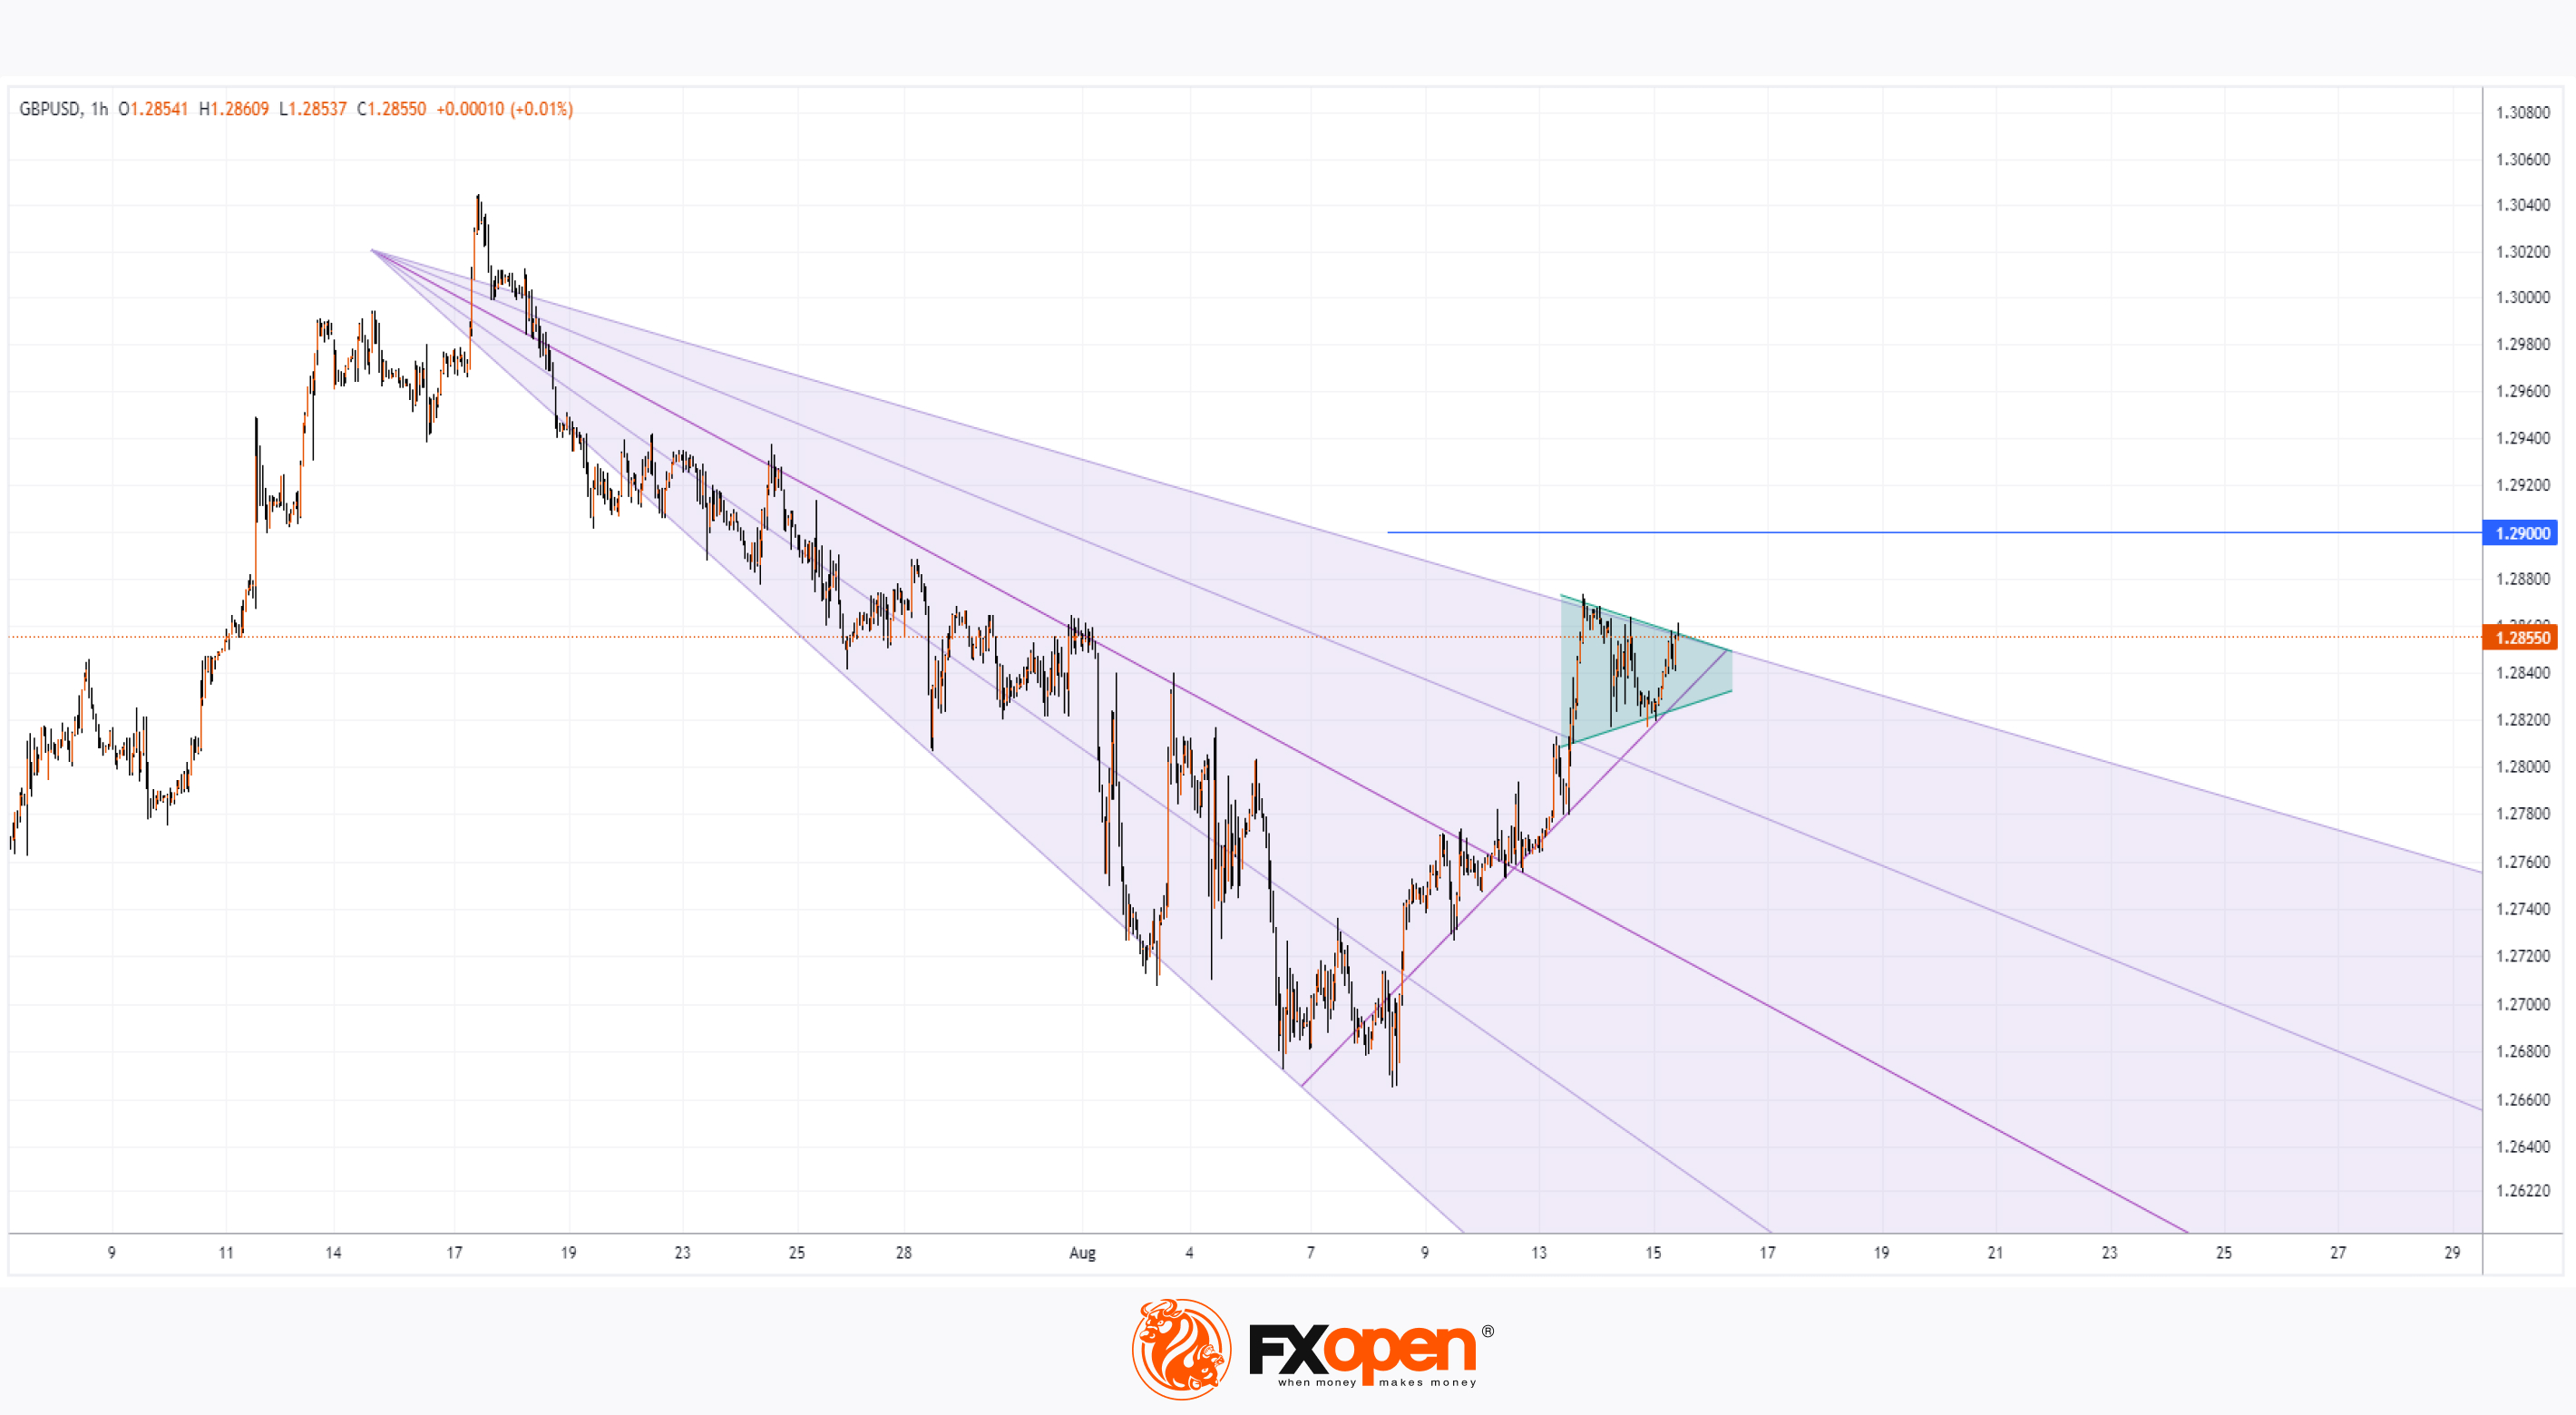
Today's technical analysis of the GBP/USD chart shows that the price is consolidating within a narrowing triangle (marked in green). The upper line of this triangle aligns with a fan line that has been expanding downwards, with price action tracing the fan's contours since the second half of July.
Which Way Will the Triangle Break?
If the bulls take the initiative and attempt to break upwards out of the triangle, they may quickly encounter resistance around the 1.2900 level—this is not only a round psychological number but also the 50% retracement level of the bearish impulse from the July 17 peak to the August 8 low (A→B).
Today, data on U.S. retail sales and the labour market will be released at 15:30 (GMT+3). There’s a possibility these reports could surprise the market, leading to sharp movements in GBP/USD and disrupting the current state of temporary stability.
Trade over 50 forex markets 24 hours a day with FXOpen. Take advantage of low commissions, deep liquidity, and spreads from 0.0 pips. Open your FXOpen account now or learn more about trading forex with FXOpen.
CFDs are complex instruments and come with a high risk of losing your money.
This article represents the opinion of the Companies operating under the FXOpen brand only. It is not to be construed as an offer, solicitation, or recommendation with respect to products and services provided by the Companies operating under the FXOpen brand, nor is it to be considered financial advice.
GBP/USD Analysis: Rate Steady After Key Data Releases
Yesterday, important U.S. inflation data was released, as reported by ForexFactory:
→ Core CPI (MoM): actual = 0.2%, forecast = 0.2%; previous = 0.1%;
→ CPI (YoY): actual = 2.9%, forecast = 3.0%; previous = 3.0%.
Today, market participants learned about the change in the UK’s monthly GDP: actual = 0.0%, forecast = 0.0%; previous = 0.4%.
However, these news releases had little impact on the GBP/USD exchange rate, likely because the actual figures were in line with expectations.
Today's technical analysis of the GBP/USD chart shows that the price is consolidating within a narrowing triangle (marked in green). The upper line of this triangle aligns with a fan line that has been expanding downwards, with price action tracing the fan's contours since the second half of July.
Which Way Will the Triangle Break?
If the bulls take the initiative and attempt to break upwards out of the triangle, they may quickly encounter resistance around the 1.2900 level—this is not only a round psychological number but also the 50% retracement level of the bearish impulse from the July 17 peak to the August 8 low (A→B).
Today, data on U.S. retail sales and the labour market will be released at 15:30 (GMT+3). There’s a possibility these reports could surprise the market, leading to sharp movements in GBP/USD and disrupting the current state of temporary stability.
Trade over 50 forex markets 24 hours a day with FXOpen. Take advantage of low commissions, deep liquidity, and spreads from 0.0 pips. Open your FXOpen account now or learn more about trading forex with FXOpen.
CFDs are complex instruments and come with a high risk of losing your money.
This article represents the opinion of the Companies operating under the FXOpen brand only. It is not to be construed as an offer, solicitation, or recommendation with respect to products and services provided by the Companies operating under the FXOpen brand, nor is it to be considered financial advice.
👍1
#AAPL #stockmarket #stocktrading
Apple Inc. (AAPL) Forms 9 Consecutive Bullish Candles on Daily Chart
If we define bullish candles as those where the closing price is higher than the opening price, we can observe a sequence of 9 such candles on Apple Inc.'s (AAPL) daily chart from August 2nd to 14th.
On August 6th, we mentioned that market participants were bearish due to news that Warren Buffett had sold half of his Apple Inc. (AAPL) shares, but the situation has since reversed.
Now, bullish sentiment is gaining support from news related to George Soros purchasing Apple Inc. (AAPL) shares. According to MarketWatch, Soros Fund Management LLC has invested in Apple Inc. along with other tech companies, including Broadcom Inc. (AVGO), Micron Technology (MU), Texas Instruments Inc. (TXN), and Super Micro Computer Inc. (SMCI).
Today's technical analysis of the AAPL chart shows that:
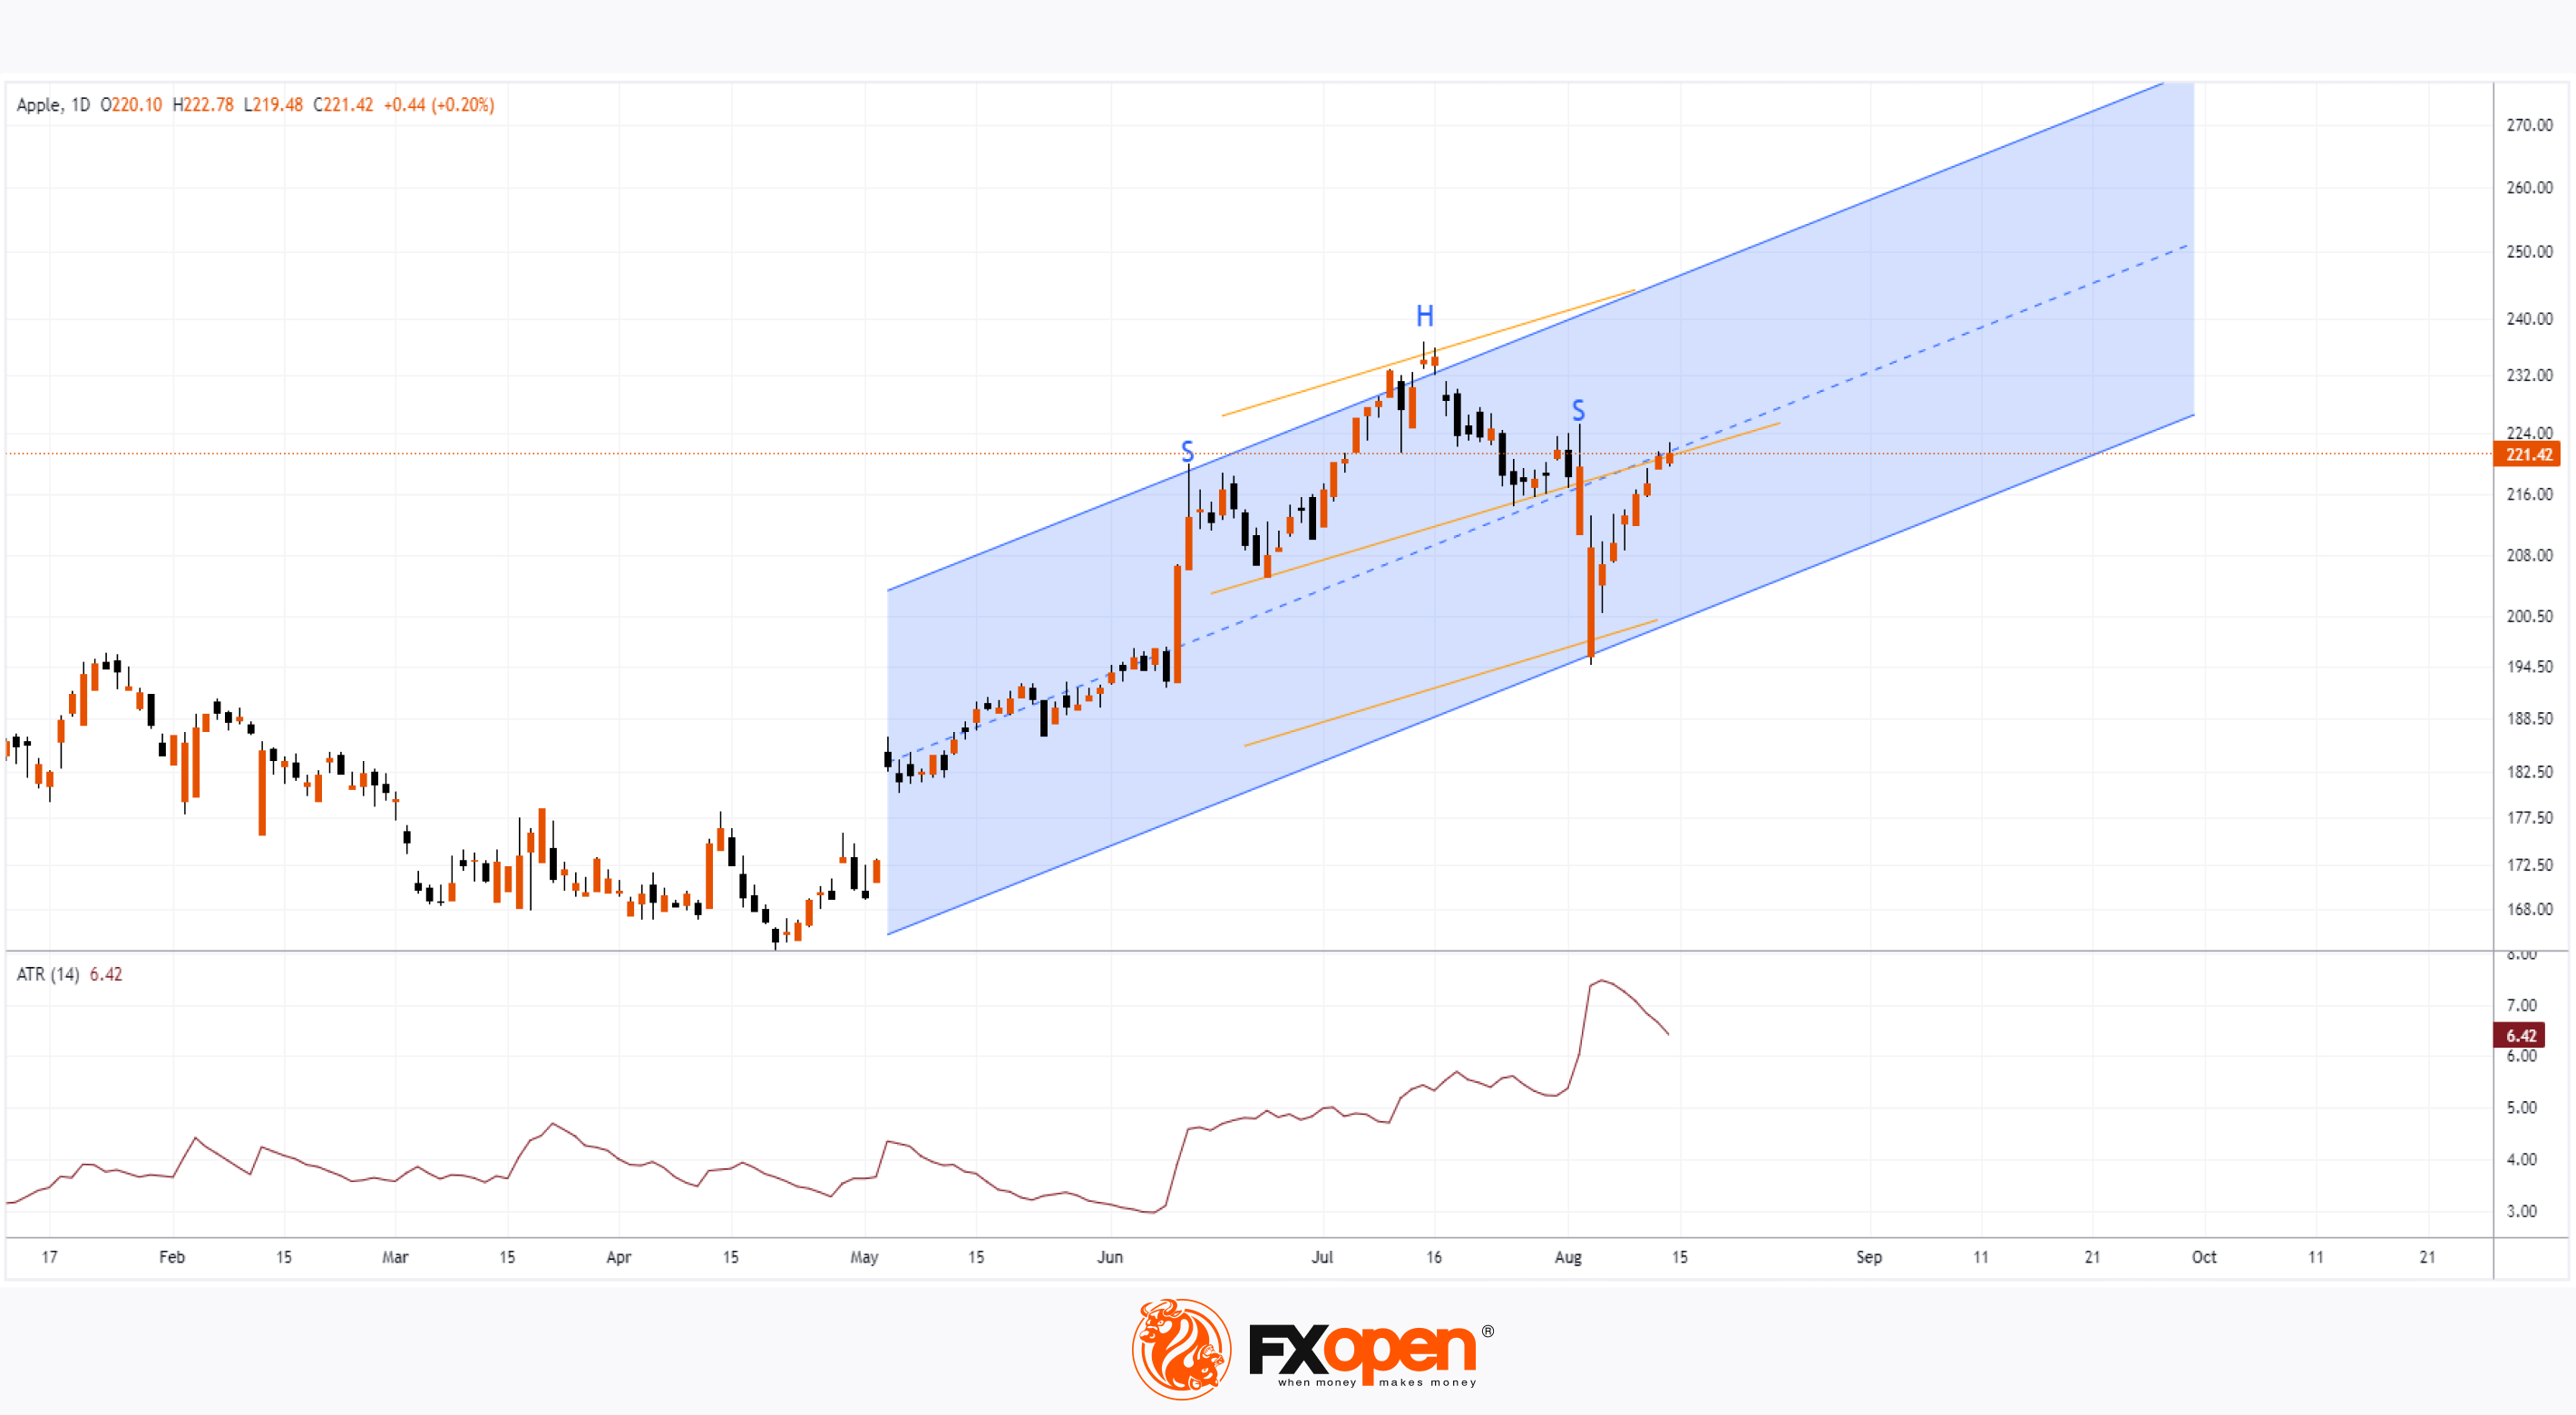
→ Bulls have recovered from the price drop to the August 5th low. It's interesting to note that the August 5th low can be calculated using the height of the Head and Shoulders pattern, measuring downward from the neckline break (as shown by the yellow lines).
→ The price is hovering around the median line of a channel constructed using the Linear Regression tool. The fact that the price is approximately in the middle between the extreme deviations suggests the possibility of consolidation. This would be appropriate, given that the ATR indicator shows the market experienced a period of extreme volatility at the beginning of August.
The chart may continue to show a series of bullish candles, but they might have small bodies, reflecting modest gains along the median line.
According to a survey of 32 Wall Street analysts by TipRanks, 24 recommend buying Apple stock. Their average price target for AAPL is $248.78 within the next 12 months.
Trade global index CFDs with zero commission and tight spreads. Open your FXOpen account now or learn more about trading index CFDs with FXOpen.
CFDs are complex instruments and come with a high risk of losing your money.
This article represents the opinion of the Companies operating under the FXOpen brand only. It is not to be construed as an offer, solicitation, or recommendation with respect to products and services provided by the Companies operating under the FXOpen brand, nor is it to be considered financial advice.
Apple Inc. (AAPL) Forms 9 Consecutive Bullish Candles on Daily Chart
If we define bullish candles as those where the closing price is higher than the opening price, we can observe a sequence of 9 such candles on Apple Inc.'s (AAPL) daily chart from August 2nd to 14th.
On August 6th, we mentioned that market participants were bearish due to news that Warren Buffett had sold half of his Apple Inc. (AAPL) shares, but the situation has since reversed.
Now, bullish sentiment is gaining support from news related to George Soros purchasing Apple Inc. (AAPL) shares. According to MarketWatch, Soros Fund Management LLC has invested in Apple Inc. along with other tech companies, including Broadcom Inc. (AVGO), Micron Technology (MU), Texas Instruments Inc. (TXN), and Super Micro Computer Inc. (SMCI).
Today's technical analysis of the AAPL chart shows that:
→ Bulls have recovered from the price drop to the August 5th low. It's interesting to note that the August 5th low can be calculated using the height of the Head and Shoulders pattern, measuring downward from the neckline break (as shown by the yellow lines).
→ The price is hovering around the median line of a channel constructed using the Linear Regression tool. The fact that the price is approximately in the middle between the extreme deviations suggests the possibility of consolidation. This would be appropriate, given that the ATR indicator shows the market experienced a period of extreme volatility at the beginning of August.
The chart may continue to show a series of bullish candles, but they might have small bodies, reflecting modest gains along the median line.
According to a survey of 32 Wall Street analysts by TipRanks, 24 recommend buying Apple stock. Their average price target for AAPL is $248.78 within the next 12 months.
Trade global index CFDs with zero commission and tight spreads. Open your FXOpen account now or learn more about trading index CFDs with FXOpen.
CFDs are complex instruments and come with a high risk of losing your money.
This article represents the opinion of the Companies operating under the FXOpen brand only. It is not to be construed as an offer, solicitation, or recommendation with respect to products and services provided by the Companies operating under the FXOpen brand, nor is it to be considered financial advice.
👍3
#USDJPY #marketanalysis #MarketNews #forextrading
USD/JPY Analysis: Rate Surpasses 149 Yen Per Dollar
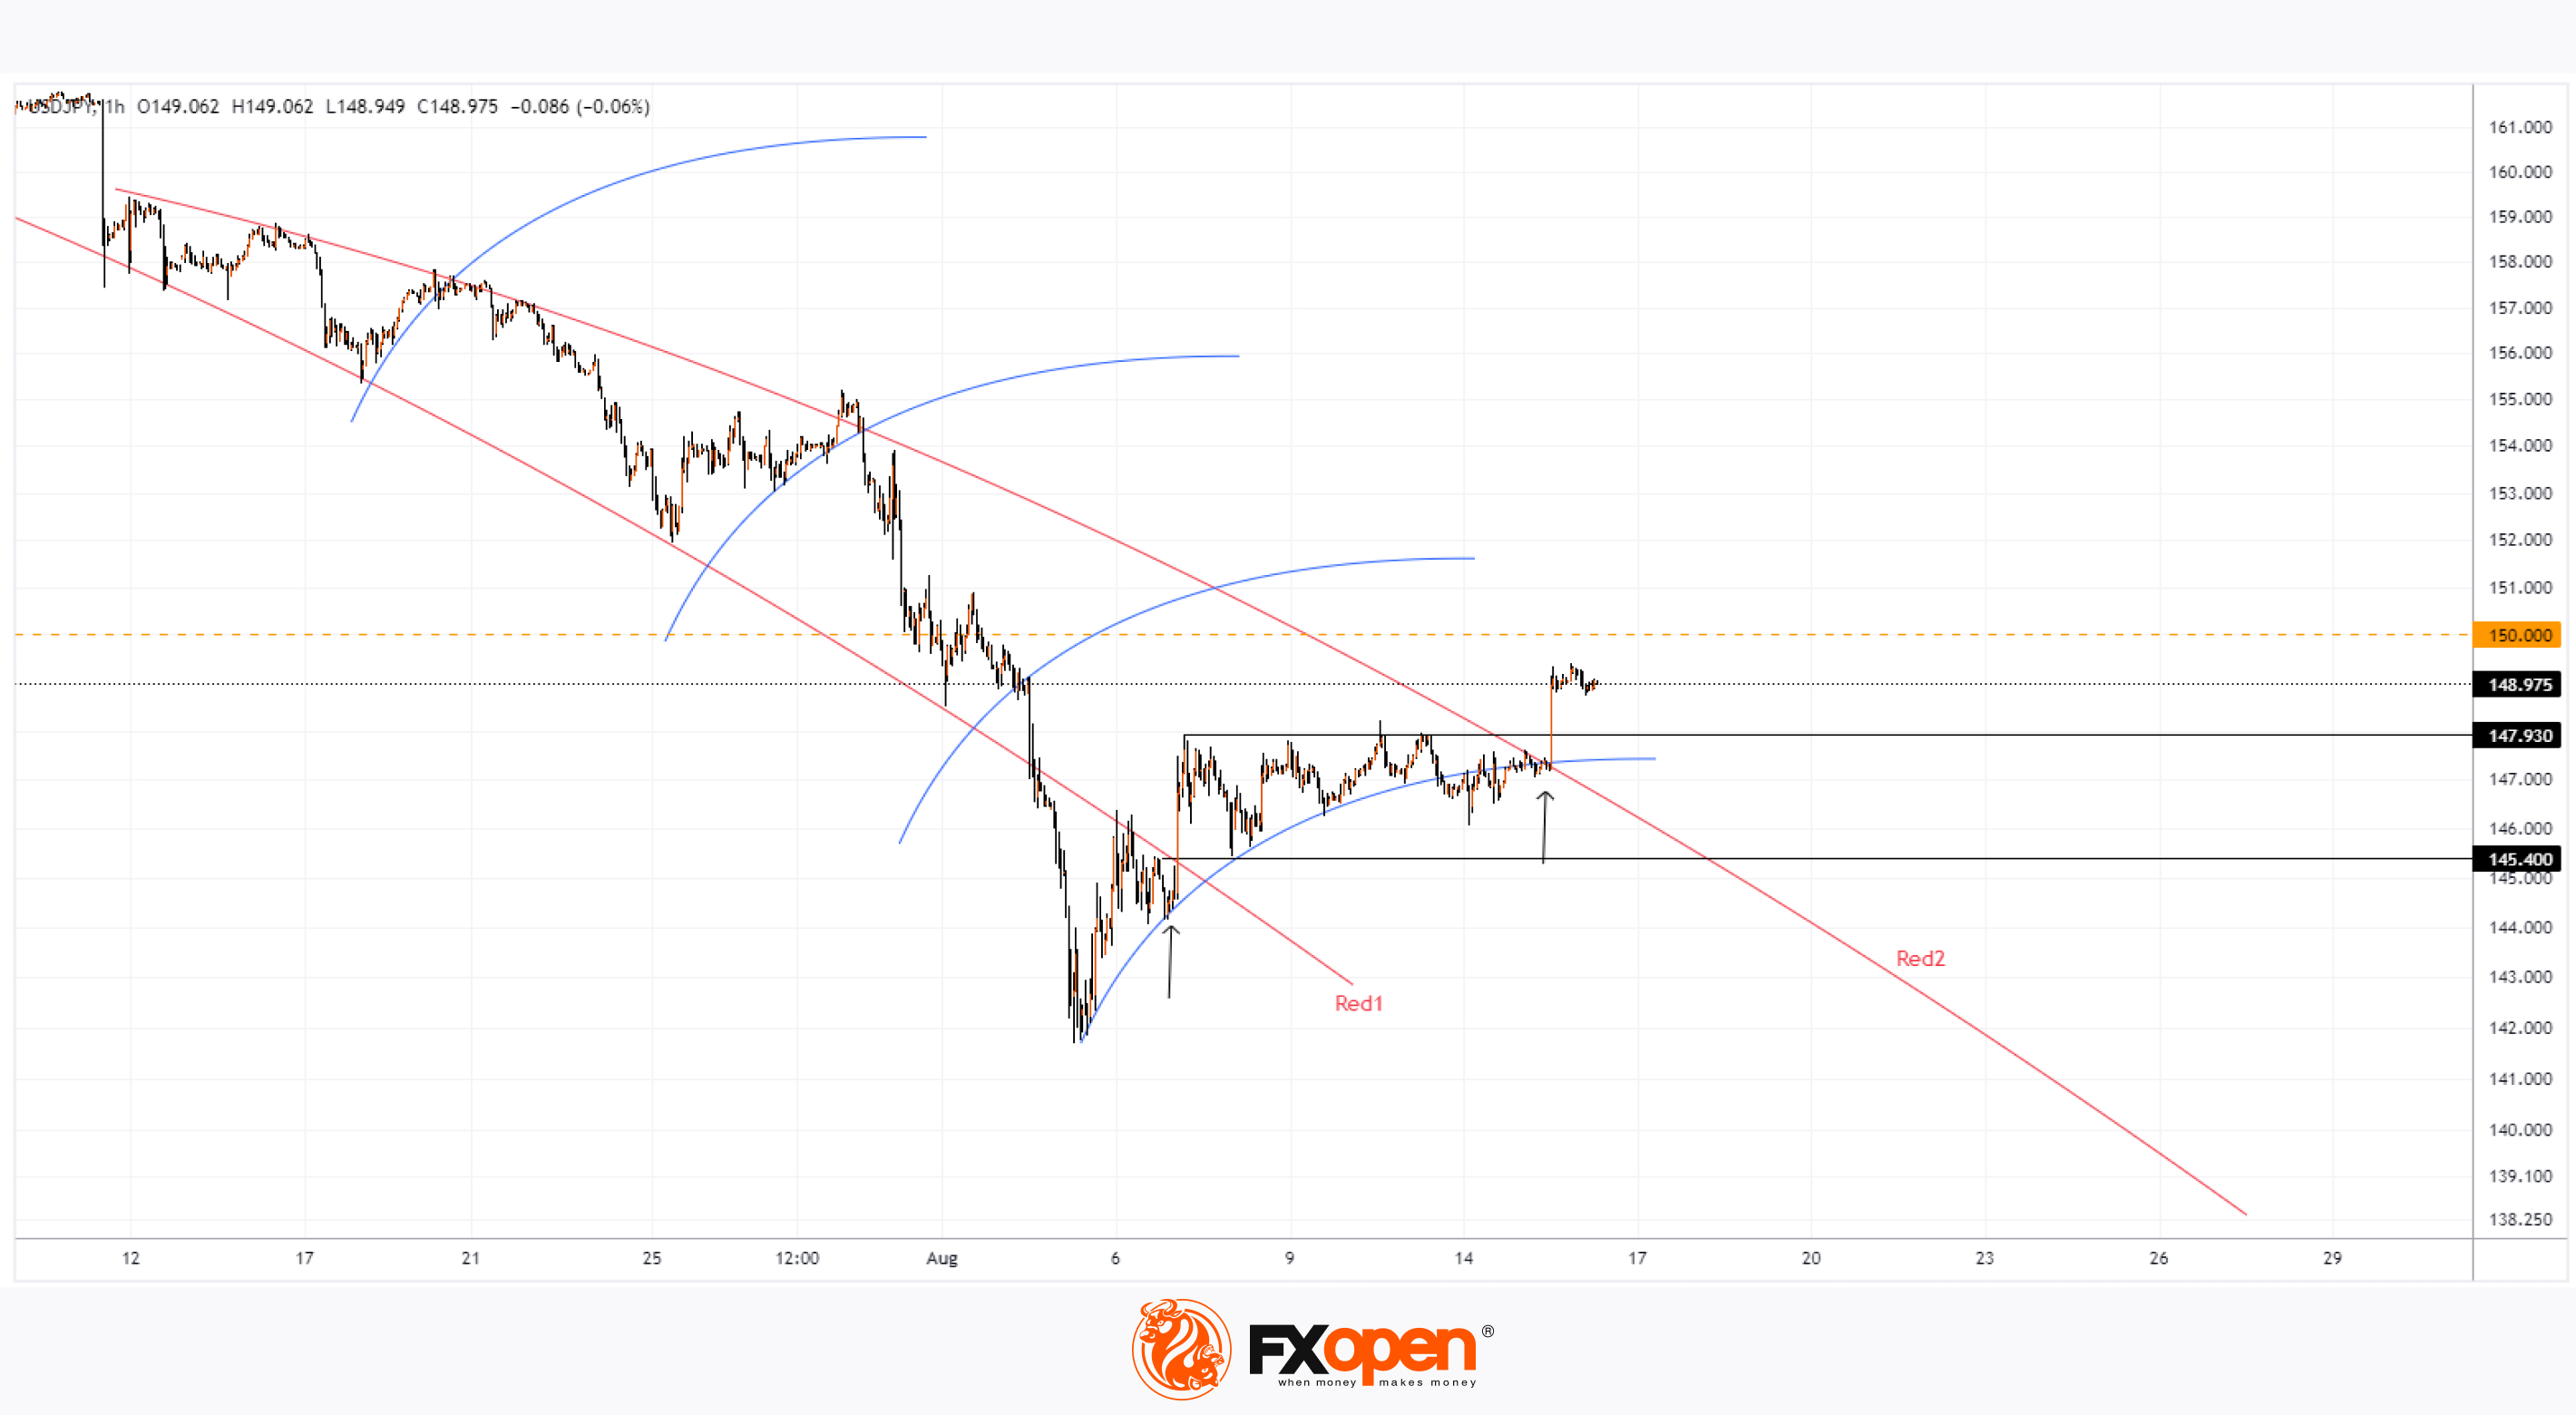
As the USD/JPY chart indicates, the rate has risen approximately 5.4% above the August 5 low.
On one hand, the yen's weakening against the U.S. dollar is partly driven by rumours that the Bank of Japan might intervene not to support the weak yen (as when the rate was above 160) but to weaken it further. "Intervention history shows that after yen-buying interventions, yen-selling interventions followed to curb excessive yen strength," Reuters reports, reflecting analysts' views.
On the other hand, the dollar strengthened yesterday as robust U.S. economic data all but dispelled fears of a recession.
Technical analysis of the USD/JPY chart shows:
→ Since the second half of July, price action has formed a broadening downward structure between two red lines.
→ The price has mostly moved within this structure, finding temporary support at levels marked by blue lines.
An interesting detail on the USD/JPY chart is that when the price broke upwards through the red line from an oversold zone (indicated by the first arrow), the 145.4 level near the breakout became a significant support.
A similar situation is now unfolding: the price is breaking through the red line (Red2) from below (indicated by the second arrow). By analogy, it's reasonable to expect the price to find support around the 147.93 level.
If the bulls gain confidence, they might attempt to challenge the psychological level of 150 yen per U.S. dollar.
Trade over 50 forex markets 24 hours a day with FXOpen. Take advantage of low commissions, deep liquidity, and spreads from 0.0 pips. Open your FXOpen account now or learn more about trading forex with FXOpen.
CFDs are complex instruments and come with a high risk of losing your money.
This article represents the opinion of the Companies operating under the FXOpen brand only. It is not to be construed as an offer, solicitation, or recommendation with respect to products and services provided by the Companies operating under the FXOpen brand, nor is it to be considered financial advice.
USD/JPY Analysis: Rate Surpasses 149 Yen Per Dollar
As the USD/JPY chart indicates, the rate has risen approximately 5.4% above the August 5 low.
On one hand, the yen's weakening against the U.S. dollar is partly driven by rumours that the Bank of Japan might intervene not to support the weak yen (as when the rate was above 160) but to weaken it further. "Intervention history shows that after yen-buying interventions, yen-selling interventions followed to curb excessive yen strength," Reuters reports, reflecting analysts' views.
On the other hand, the dollar strengthened yesterday as robust U.S. economic data all but dispelled fears of a recession.
Technical analysis of the USD/JPY chart shows:
→ Since the second half of July, price action has formed a broadening downward structure between two red lines.
→ The price has mostly moved within this structure, finding temporary support at levels marked by blue lines.
An interesting detail on the USD/JPY chart is that when the price broke upwards through the red line from an oversold zone (indicated by the first arrow), the 145.4 level near the breakout became a significant support.
A similar situation is now unfolding: the price is breaking through the red line (Red2) from below (indicated by the second arrow). By analogy, it's reasonable to expect the price to find support around the 147.93 level.
If the bulls gain confidence, they might attempt to challenge the psychological level of 150 yen per U.S. dollar.
Trade over 50 forex markets 24 hours a day with FXOpen. Take advantage of low commissions, deep liquidity, and spreads from 0.0 pips. Open your FXOpen account now or learn more about trading forex with FXOpen.
CFDs are complex instruments and come with a high risk of losing your money.
This article represents the opinion of the Companies operating under the FXOpen brand only. It is not to be construed as an offer, solicitation, or recommendation with respect to products and services provided by the Companies operating under the FXOpen brand, nor is it to be considered financial advice.
👍2
#tsla #stockmarket #stocks #marketanalysis
TSLA Stock Price Rises by Over 6%
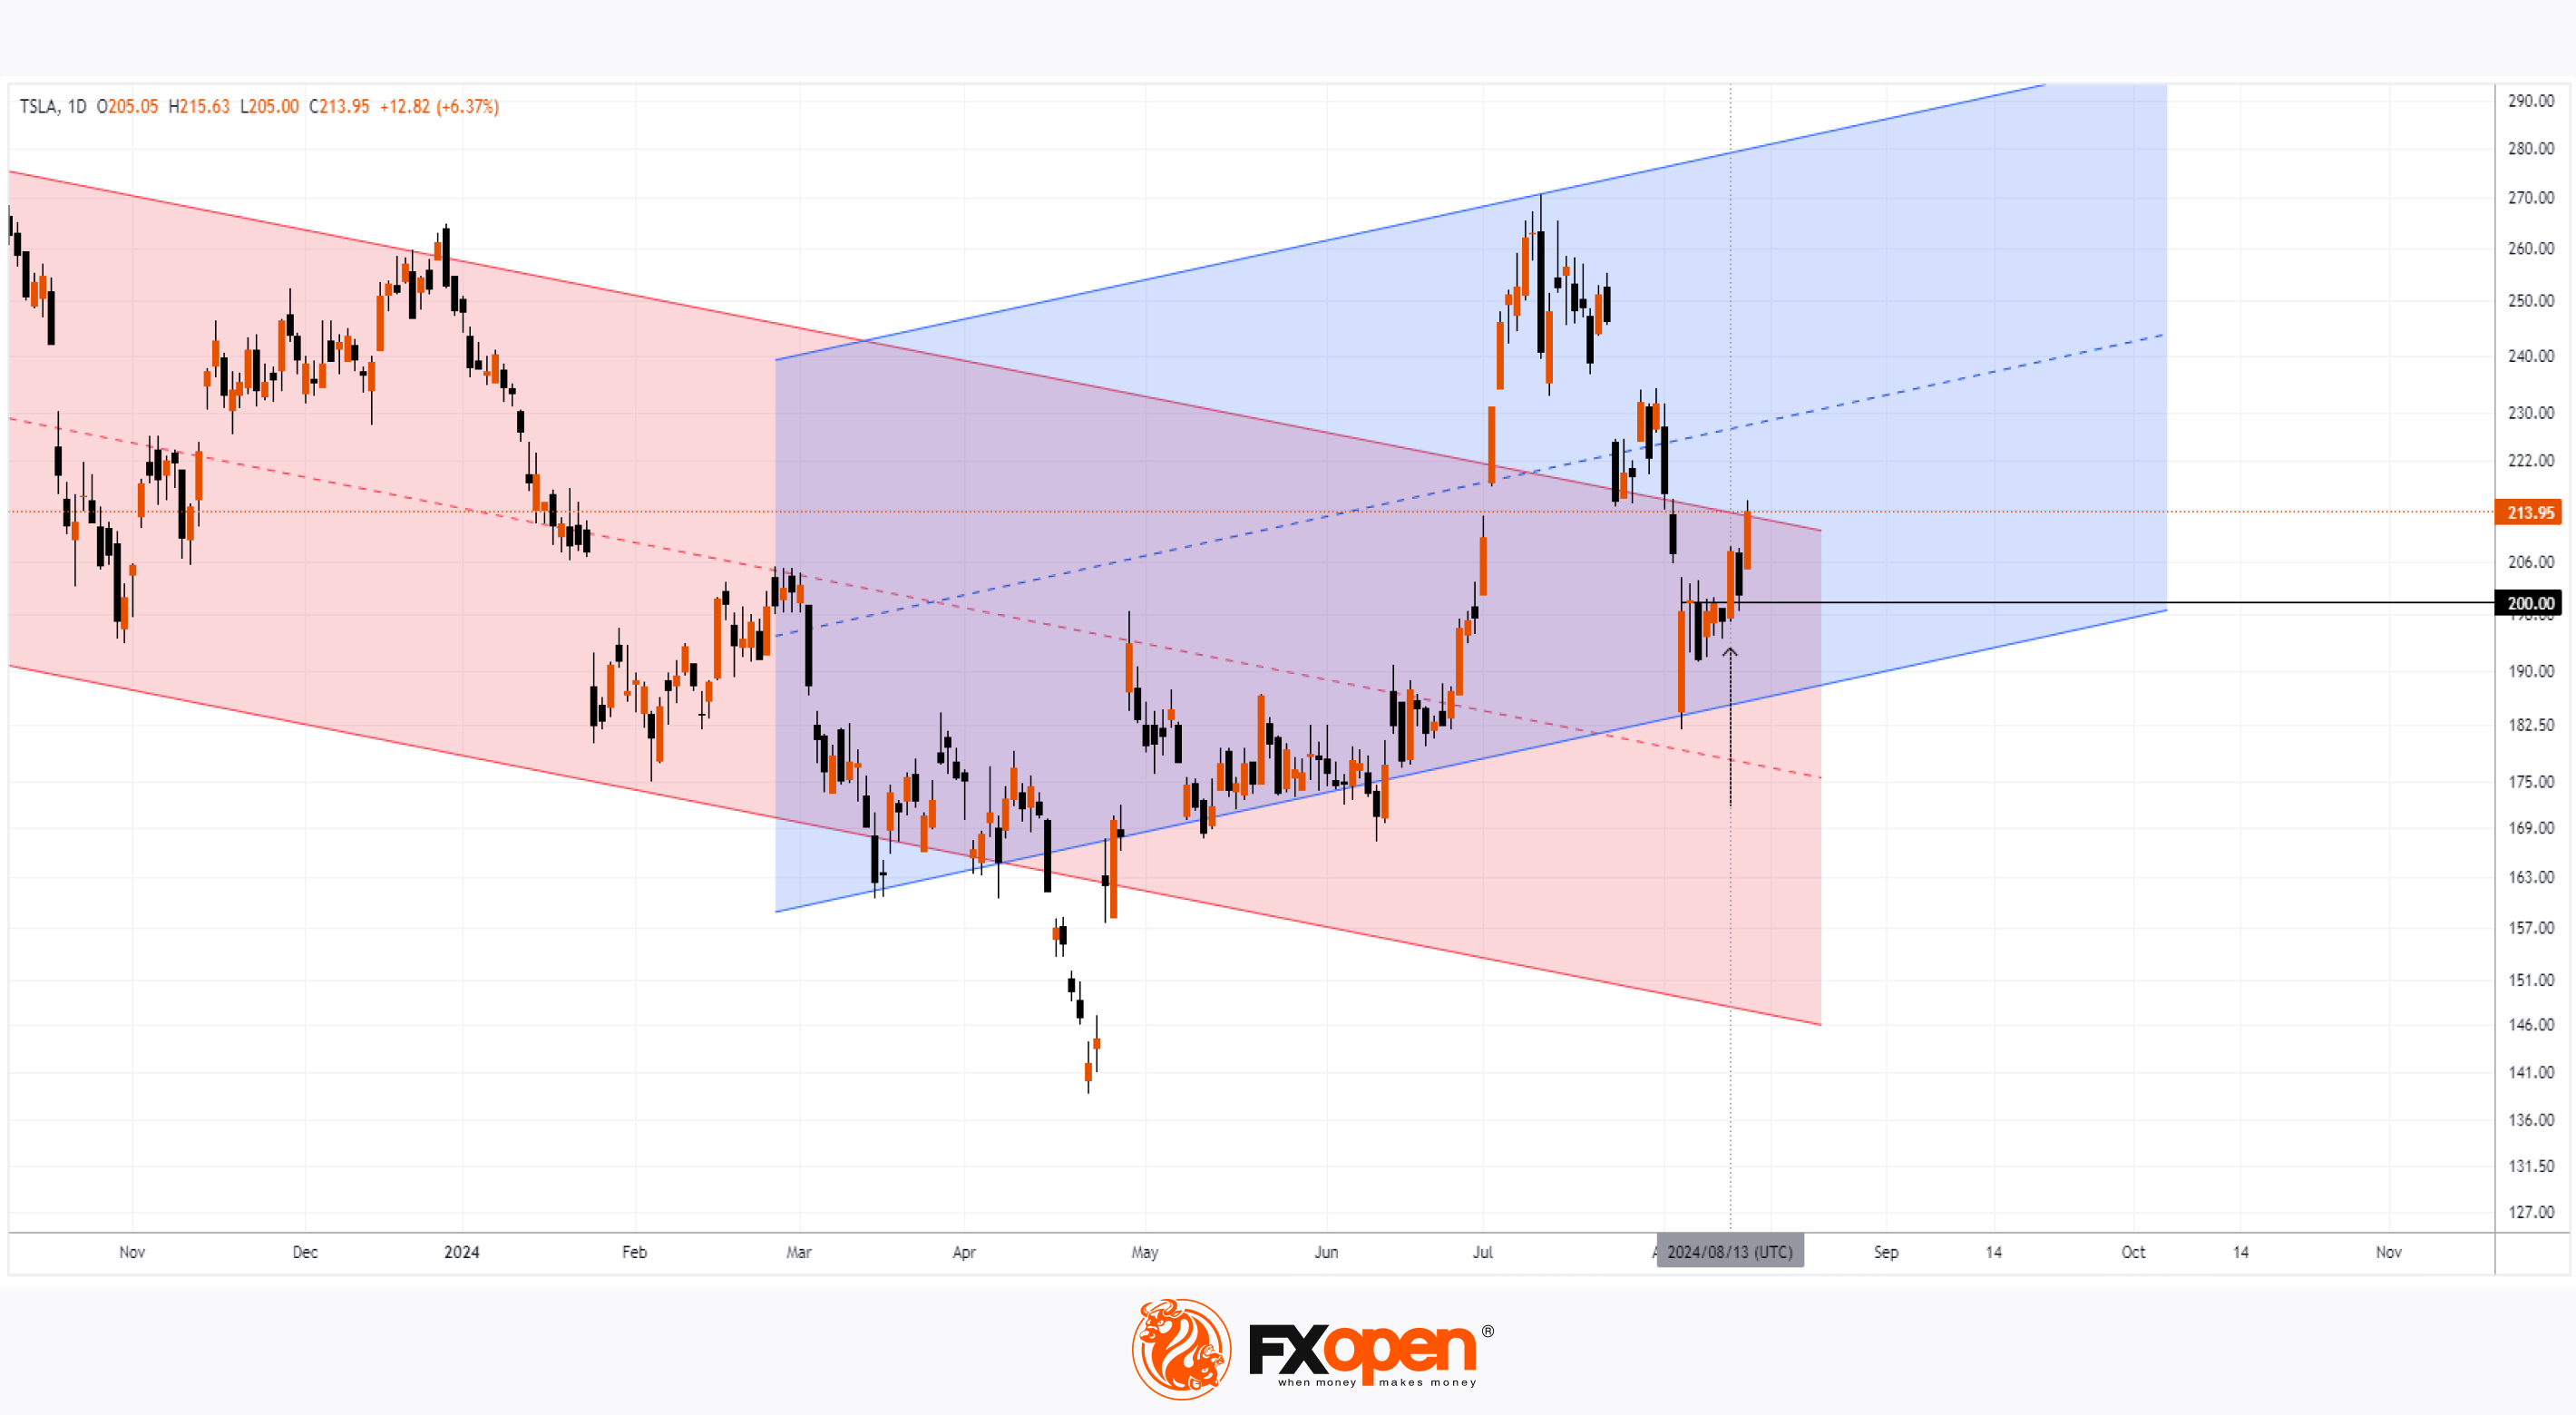
The Tesla (TSLA) stock chart today shows that the price surged by more than 6% during yesterday’s trading session, driven by a strong retail sales report released the same day.
According to ForexFactory, analysts had expected Retail Sales to increase by 0.4% month-on-month. However, the actual data showed a 1.0% rise (for comparison, previous figures indicated a decline of -0.2%).
It seems that market participants interpreted this as a sign that Tesla's sales could also rise, propelling the electric vehicle manufacturer's stock to one of the top performers.
Technical analysis of Tesla (TSLA) chart today shows:
→ Amidst the broader market decline caused by recession fears that peaked on August 5, the price returned to the red descending channel. However, yesterday's movement pushed the price towards its upper boundary.
→ Bulls may break through the upper boundary of this channel and push the price into an ascending channel (shown in blue) for Tesla (TSLA) shares.
→ The strength of the bulls can be gauged by the price action around the psychological level of $200. If this level acted as resistance after August 5, its role changed on August 13 (as indicated by the arrow). The price made a bullish breakout, followed by a successful test the next day.
If events unfold positively, the $200 level could become the launchpad for a significant rally in Tesla (TSLA) shares.
According to the average opinion of analysts surveyed by TipRanks, the 12-month price target for Tesla (TSLA) shares is $211.46, indicating cautious optimism.
Trade global index CFDs with zero commission and tight spreads. Open your FXOpen account now or learn more about trading index CFDs with FXOpen.
CFDs are complex instruments and come with a high risk of losing your money.
This article represents the opinion of the Companies operating under the FXOpen brand only. It is not to be construed as an offer, solicitation, or recommendation with respect to products and services provided by the Companies operating under the FXOpen brand, nor is it to be considered financial advice.
TSLA Stock Price Rises by Over 6%
The Tesla (TSLA) stock chart today shows that the price surged by more than 6% during yesterday’s trading session, driven by a strong retail sales report released the same day.
According to ForexFactory, analysts had expected Retail Sales to increase by 0.4% month-on-month. However, the actual data showed a 1.0% rise (for comparison, previous figures indicated a decline of -0.2%).
It seems that market participants interpreted this as a sign that Tesla's sales could also rise, propelling the electric vehicle manufacturer's stock to one of the top performers.
Technical analysis of Tesla (TSLA) chart today shows:
→ Amidst the broader market decline caused by recession fears that peaked on August 5, the price returned to the red descending channel. However, yesterday's movement pushed the price towards its upper boundary.
→ Bulls may break through the upper boundary of this channel and push the price into an ascending channel (shown in blue) for Tesla (TSLA) shares.
→ The strength of the bulls can be gauged by the price action around the psychological level of $200. If this level acted as resistance after August 5, its role changed on August 13 (as indicated by the arrow). The price made a bullish breakout, followed by a successful test the next day.
If events unfold positively, the $200 level could become the launchpad for a significant rally in Tesla (TSLA) shares.
According to the average opinion of analysts surveyed by TipRanks, the 12-month price target for Tesla (TSLA) shares is $211.46, indicating cautious optimism.
Trade global index CFDs with zero commission and tight spreads. Open your FXOpen account now or learn more about trading index CFDs with FXOpen.
CFDs are complex instruments and come with a high risk of losing your money.
This article represents the opinion of the Companies operating under the FXOpen brand only. It is not to be construed as an offer, solicitation, or recommendation with respect to products and services provided by the Companies operating under the FXOpen brand, nor is it to be considered financial advice.
👍1
#XAUUSD #xau #goldprice #marketanalysis
Gold Price Surpasses $2500 for the First Time
We noted bullish sentiment in the gold market six days ago:
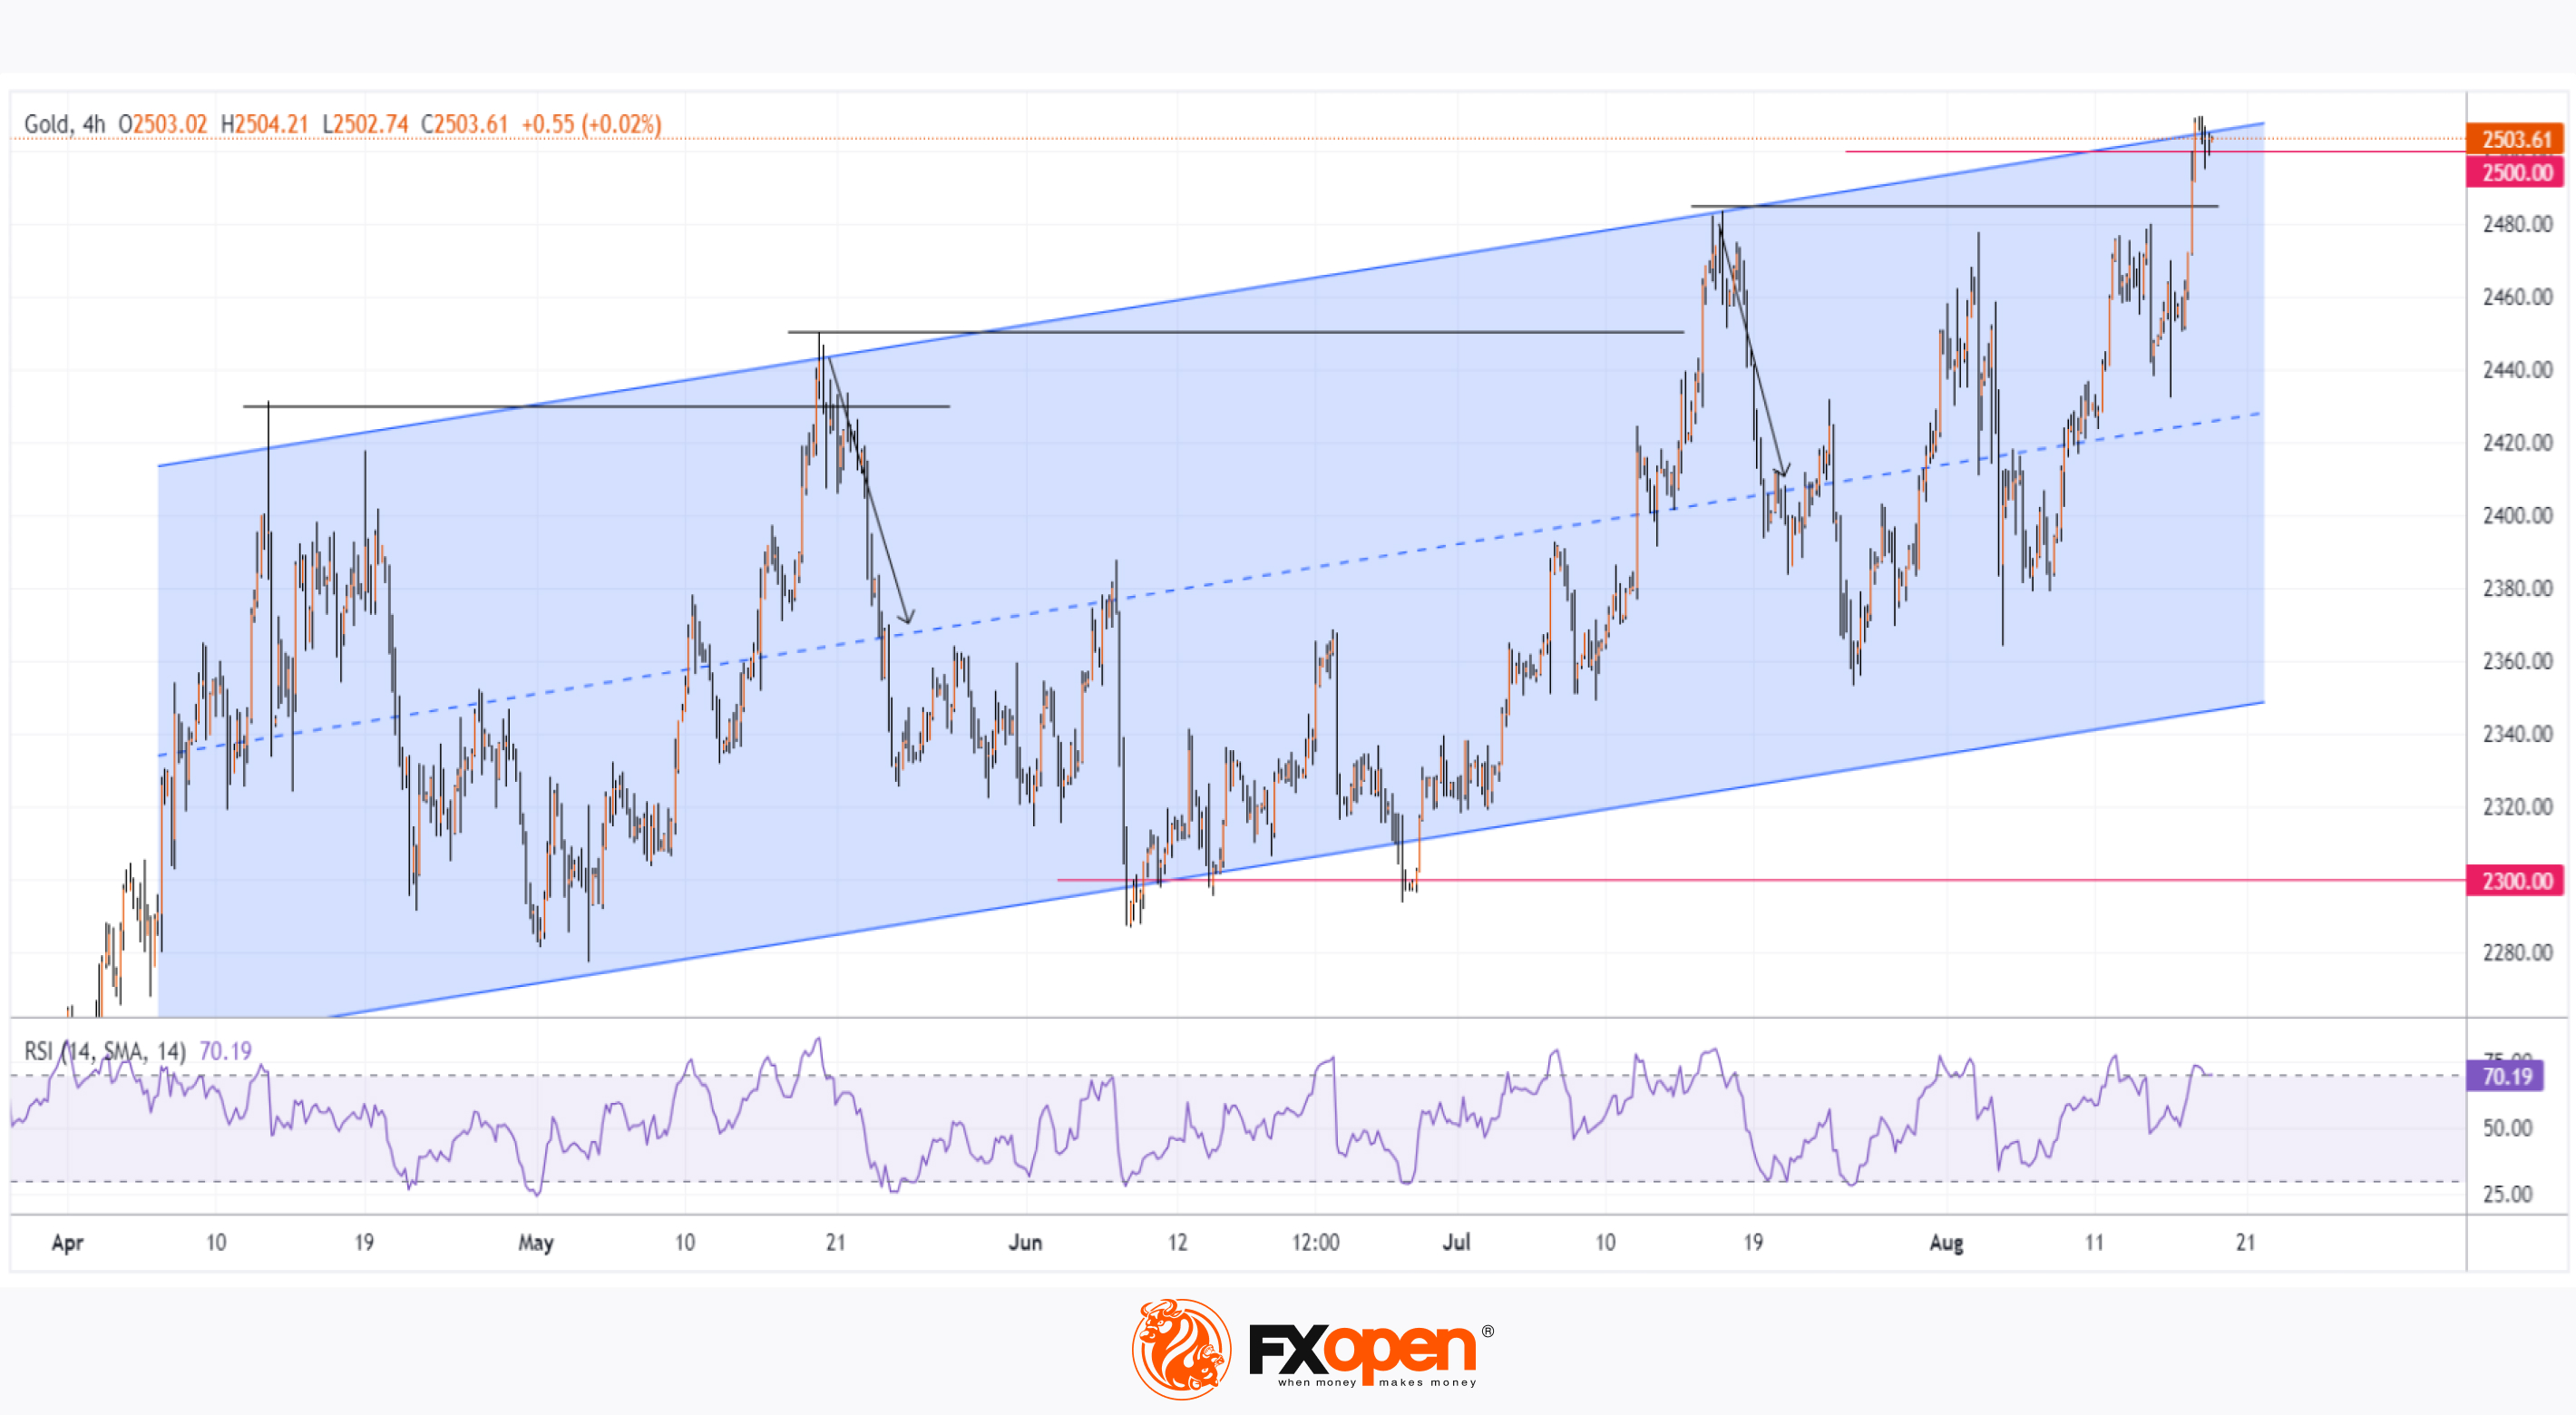
→ The price is moving within an ascending channel (shown in blue);
→ Bulls may attempt to set a historic record amid the release of economic news.
As today's XAU/USD chart shows, the gold price has risen above the psychological level of $2500. This was influenced by last week's news, indicating that market participants expect the Federal Reserve to cut rates as early as September. Notably, important signals regarding U.S. monetary policy may be given later this week at the annual economic symposium in Jackson Hole, attended by finance ministers and central bank governors.
Technical analysis of the XAU/USD chart shows that gold continues to move within the ascending channel.
It's worth noting two historical records set this year – in May and July. In both cases:
→ The price encountered resistance at the upper boundary of the channel;
→ The RSI indicator entered the overbought zone;
→ The rise above the previous peak was minimal;
→ A subsequent decline to the median line of the blue channel followed (as shown by the arrows).
It’s possible that a similar pattern could repeat for a third time, considering that the $2500 psychological level might act in favour of the bears – similar false breakouts (but in reverse) were observed at the $2300 level in June.
Start trading commodities with tight spreads. Open your trading account now or learn more about trading commodity CFDs with FXOpen.
CFDs are complex instruments and come with a high risk of losing your money.
This article represents the opinion of the Companies operating under the FXOpen brand only. It is not to be construed as an offer, solicitation, or recommendation with respect to products and services provided by the Companies operating under the FXOpen brand, nor is it to be considered financial advice.
Gold Price Surpasses $2500 for the First Time
We noted bullish sentiment in the gold market six days ago:
→ The price is moving within an ascending channel (shown in blue);
→ Bulls may attempt to set a historic record amid the release of economic news.
As today's XAU/USD chart shows, the gold price has risen above the psychological level of $2500. This was influenced by last week's news, indicating that market participants expect the Federal Reserve to cut rates as early as September. Notably, important signals regarding U.S. monetary policy may be given later this week at the annual economic symposium in Jackson Hole, attended by finance ministers and central bank governors.
Technical analysis of the XAU/USD chart shows that gold continues to move within the ascending channel.
It's worth noting two historical records set this year – in May and July. In both cases:
→ The price encountered resistance at the upper boundary of the channel;
→ The RSI indicator entered the overbought zone;
→ The rise above the previous peak was minimal;
→ A subsequent decline to the median line of the blue channel followed (as shown by the arrows).
It’s possible that a similar pattern could repeat for a third time, considering that the $2500 psychological level might act in favour of the bears – similar false breakouts (but in reverse) were observed at the $2300 level in June.
Start trading commodities with tight spreads. Open your trading account now or learn more about trading commodity CFDs with FXOpen.
CFDs are complex instruments and come with a high risk of losing your money.
This article represents the opinion of the Companies operating under the FXOpen brand only. It is not to be construed as an offer, solicitation, or recommendation with respect to products and services provided by the Companies operating under the FXOpen brand, nor is it to be considered financial advice.
👍2
#NFLX #stocktrading #marketanalysis
Netflix (NFLX) Shares Reach a Two-Month High
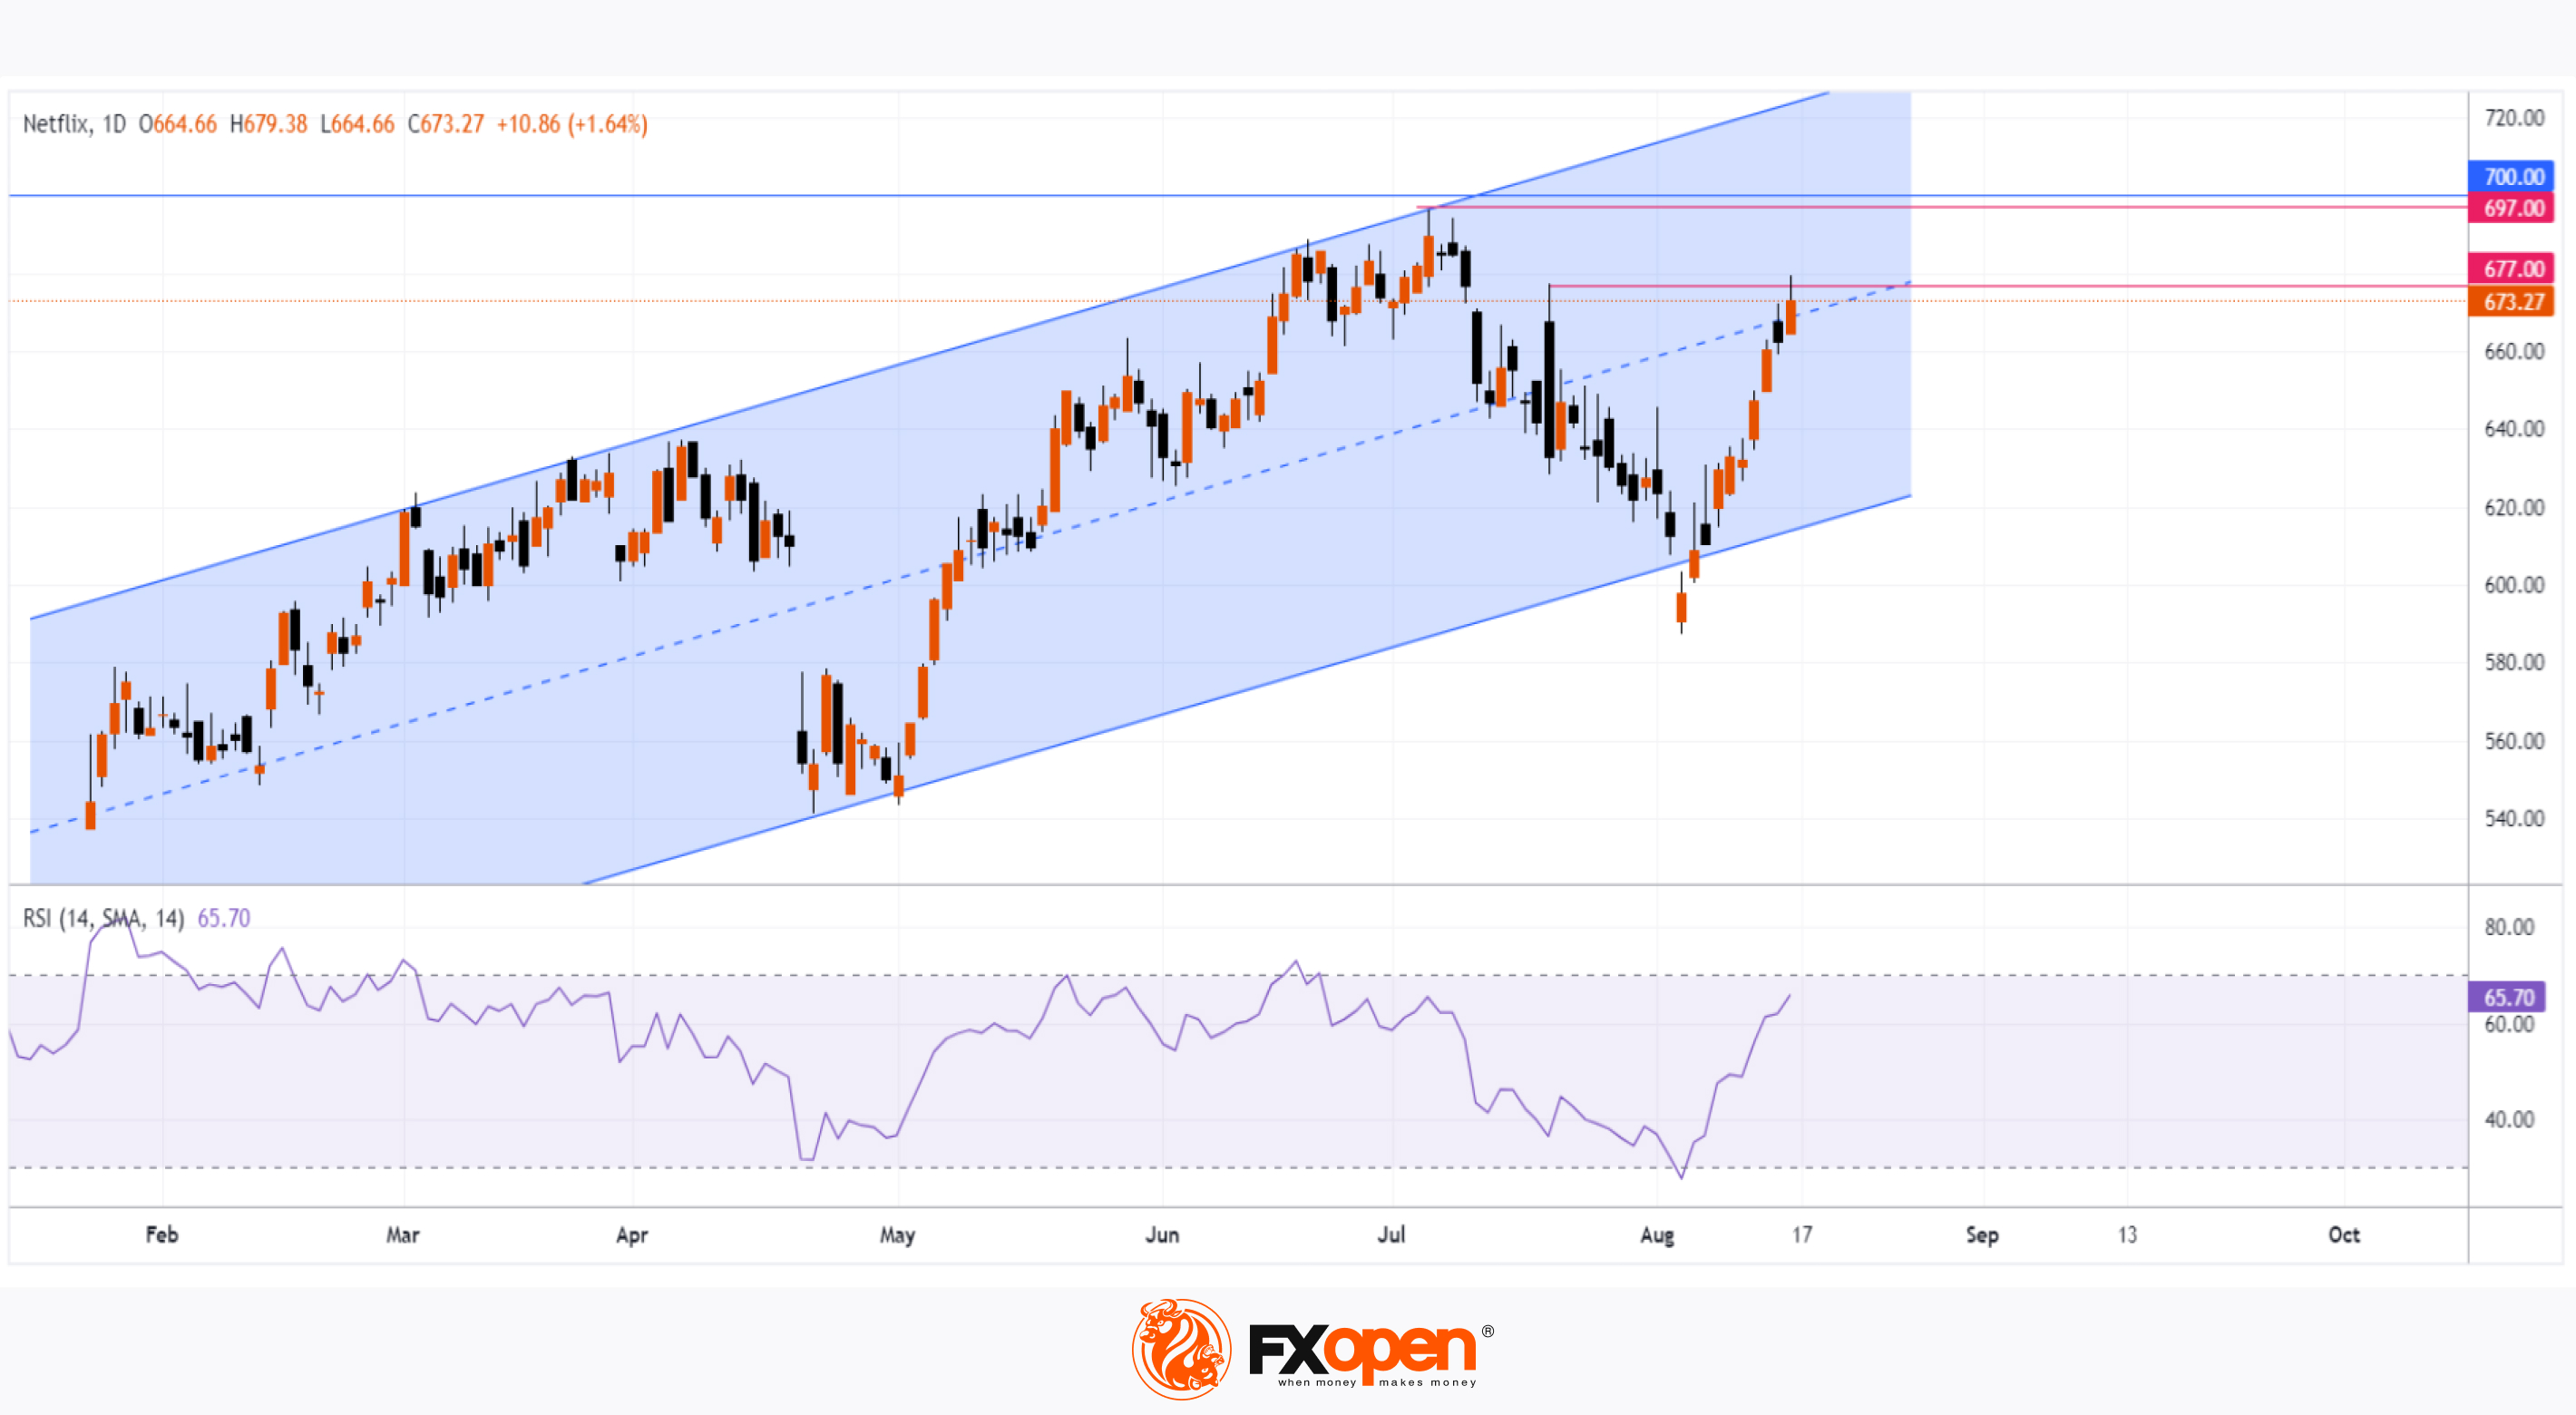
As shown on the daily chart of Netflix (NFLX) shares, the price surpassed the July 19 peak around $677 on Friday but closed well below the day’s highs. Notably:
→ Since August 5, Netflix (NFLX) has outperformed stock indices;
→ The stock has risen by about 15% from the August 5 close.
Will the rally continue?
Bullish argument:
→ Analysts expect an improvement in the company’s fundamentals following enhancements to its business model. According to Zacks, Netflix might report earnings of $5.07 per share for the current quarter, representing a year-on-year increase of +35.9%. The Zacks consensus estimate has risen by +7.9% over the past 30 days.
Bearish argument:
According to SEC filings, Netflix’s Chief Legal Officer sold $7 million worth of shares. Could this sale be motivated by insider information that might lead to a decline in the stock price?
Technical analysis of the Netflix (NFLX) daily chart indicates that the price is moving within an ascending channel (shown in blue), and the sharp rise from the August 5 low has pushed the RSI indicator from the oversold zone to the brink of the overbought zone. However, resistance levels have come into focus:
→ The median of the ascending channel;
→ The peak around $697;
→ The psychological resistance around $700.
Given Friday’s weak close and the sharp rise over the past two weeks, it’s reasonable to suggest that Netflix (NFLX) shares are vulnerable to a correction.
The average price forecast for Netflix (NFLX) is $704.94 over the next 12 months (according to a survey of analysts conducted by TipRanks).
Trade global index CFDs with zero commission and tight spreads. Open your FXOpen account now or learn more about trading index CFDs with FXOpen.
CFDs are complex instruments and come with a high risk of losing your money.
This article represents the opinion of the Companies operating under the FXOpen brand only. It is not to be construed as an offer, solicitation, or recommendation with respect to products and services provided by the Companies operating under the FXOpen brand, nor is it to be considered financial advice.
Netflix (NFLX) Shares Reach a Two-Month High
As shown on the daily chart of Netflix (NFLX) shares, the price surpassed the July 19 peak around $677 on Friday but closed well below the day’s highs. Notably:
→ Since August 5, Netflix (NFLX) has outperformed stock indices;
→ The stock has risen by about 15% from the August 5 close.
Will the rally continue?
Bullish argument:
→ Analysts expect an improvement in the company’s fundamentals following enhancements to its business model. According to Zacks, Netflix might report earnings of $5.07 per share for the current quarter, representing a year-on-year increase of +35.9%. The Zacks consensus estimate has risen by +7.9% over the past 30 days.
Bearish argument:
According to SEC filings, Netflix’s Chief Legal Officer sold $7 million worth of shares. Could this sale be motivated by insider information that might lead to a decline in the stock price?
Technical analysis of the Netflix (NFLX) daily chart indicates that the price is moving within an ascending channel (shown in blue), and the sharp rise from the August 5 low has pushed the RSI indicator from the oversold zone to the brink of the overbought zone. However, resistance levels have come into focus:
→ The median of the ascending channel;
→ The peak around $697;
→ The psychological resistance around $700.
Given Friday’s weak close and the sharp rise over the past two weeks, it’s reasonable to suggest that Netflix (NFLX) shares are vulnerable to a correction.
The average price forecast for Netflix (NFLX) is $704.94 over the next 12 months (according to a survey of analysts conducted by TipRanks).
Trade global index CFDs with zero commission and tight spreads. Open your FXOpen account now or learn more about trading index CFDs with FXOpen.
CFDs are complex instruments and come with a high risk of losing your money.
This article represents the opinion of the Companies operating under the FXOpen brand only. It is not to be construed as an offer, solicitation, or recommendation with respect to products and services provided by the Companies operating under the FXOpen brand, nor is it to be considered financial advice.
👍2
#stockmarket #stocktrading #marketanalysis
AMD Shares Soared After News of a Server Manufacturer Acquisition
Yesterday, it was announced that Analog Micro Devices (AMD) intends to acquire ZT Systems, a manufacturer of equipment for data centres, cloud computing, and artificial intelligence. The market responded positively, with investors believing this move could help AMD reduce Nvidia's substantial market share.
As shown by the AMD stock chart, the price jumped by 4.5% yesterday. What’s next?
On 30 July, we highlighted the support block formed by the $135 level and the long-term upward trendline (shown in yellow). Bears managed to push the price below this block during the overall market decline on 5 August, but only briefly.
Technical analysis of AMD’s stock chart today indicates that the price has firmly risen above this support block.
Moreover, the bulls demonstrated their ability to break through the median line of the descending channel (shown in red). This could suggest that the dominance bears have held since March 2024 is weakening.
Looking ahead, this may lead to a test of resistance at the upper boundary of the descending channel. This resistance is strengthened by a bearish gap above the $170 level.
According to forecasts from 30 Wall Street analysts surveyed by TipRanks, 24 recommend buying AMD shares. On average, they predict AMD’s price will reach $189.48 (about +22% from current levels) within the next 12 months. However, after evaluating the impact of the ZT Systems acquisition, these price forecasts may be revised upwards.
Trade global index CFDs with zero commission and tight spreads. Open your FXOpen account now or learn more about trading index CFDs with FXOpen.
CFDs are complex instruments and come with a high risk of losing your money.
This article represents the opinion of the Companies operating under the FXOpen brand only. It is not to be construed as an offer, solicitation, or recommendation with respect to products and services provided by the Companies operating under the FXOpen brand, nor is it to be considered financial advice.
AMD Shares Soared After News of a Server Manufacturer Acquisition
Yesterday, it was announced that Analog Micro Devices (AMD) intends to acquire ZT Systems, a manufacturer of equipment for data centres, cloud computing, and artificial intelligence. The market responded positively, with investors believing this move could help AMD reduce Nvidia's substantial market share.
As shown by the AMD stock chart, the price jumped by 4.5% yesterday. What’s next?
On 30 July, we highlighted the support block formed by the $135 level and the long-term upward trendline (shown in yellow). Bears managed to push the price below this block during the overall market decline on 5 August, but only briefly.
Technical analysis of AMD’s stock chart today indicates that the price has firmly risen above this support block.
Moreover, the bulls demonstrated their ability to break through the median line of the descending channel (shown in red). This could suggest that the dominance bears have held since March 2024 is weakening.
Looking ahead, this may lead to a test of resistance at the upper boundary of the descending channel. This resistance is strengthened by a bearish gap above the $170 level.
According to forecasts from 30 Wall Street analysts surveyed by TipRanks, 24 recommend buying AMD shares. On average, they predict AMD’s price will reach $189.48 (about +22% from current levels) within the next 12 months. However, after evaluating the impact of the ZT Systems acquisition, these price forecasts may be revised upwards.
Trade global index CFDs with zero commission and tight spreads. Open your FXOpen account now or learn more about trading index CFDs with FXOpen.
CFDs are complex instruments and come with a high risk of losing your money.
This article represents the opinion of the Companies operating under the FXOpen brand only. It is not to be construed as an offer, solicitation, or recommendation with respect to products and services provided by the Companies operating under the FXOpen brand, nor is it to be considered financial advice.

👍2
#marketanalysis #brentoil #oilprices #oilindustry
Brent Oil Price Drops Over 3.5% in Two Days
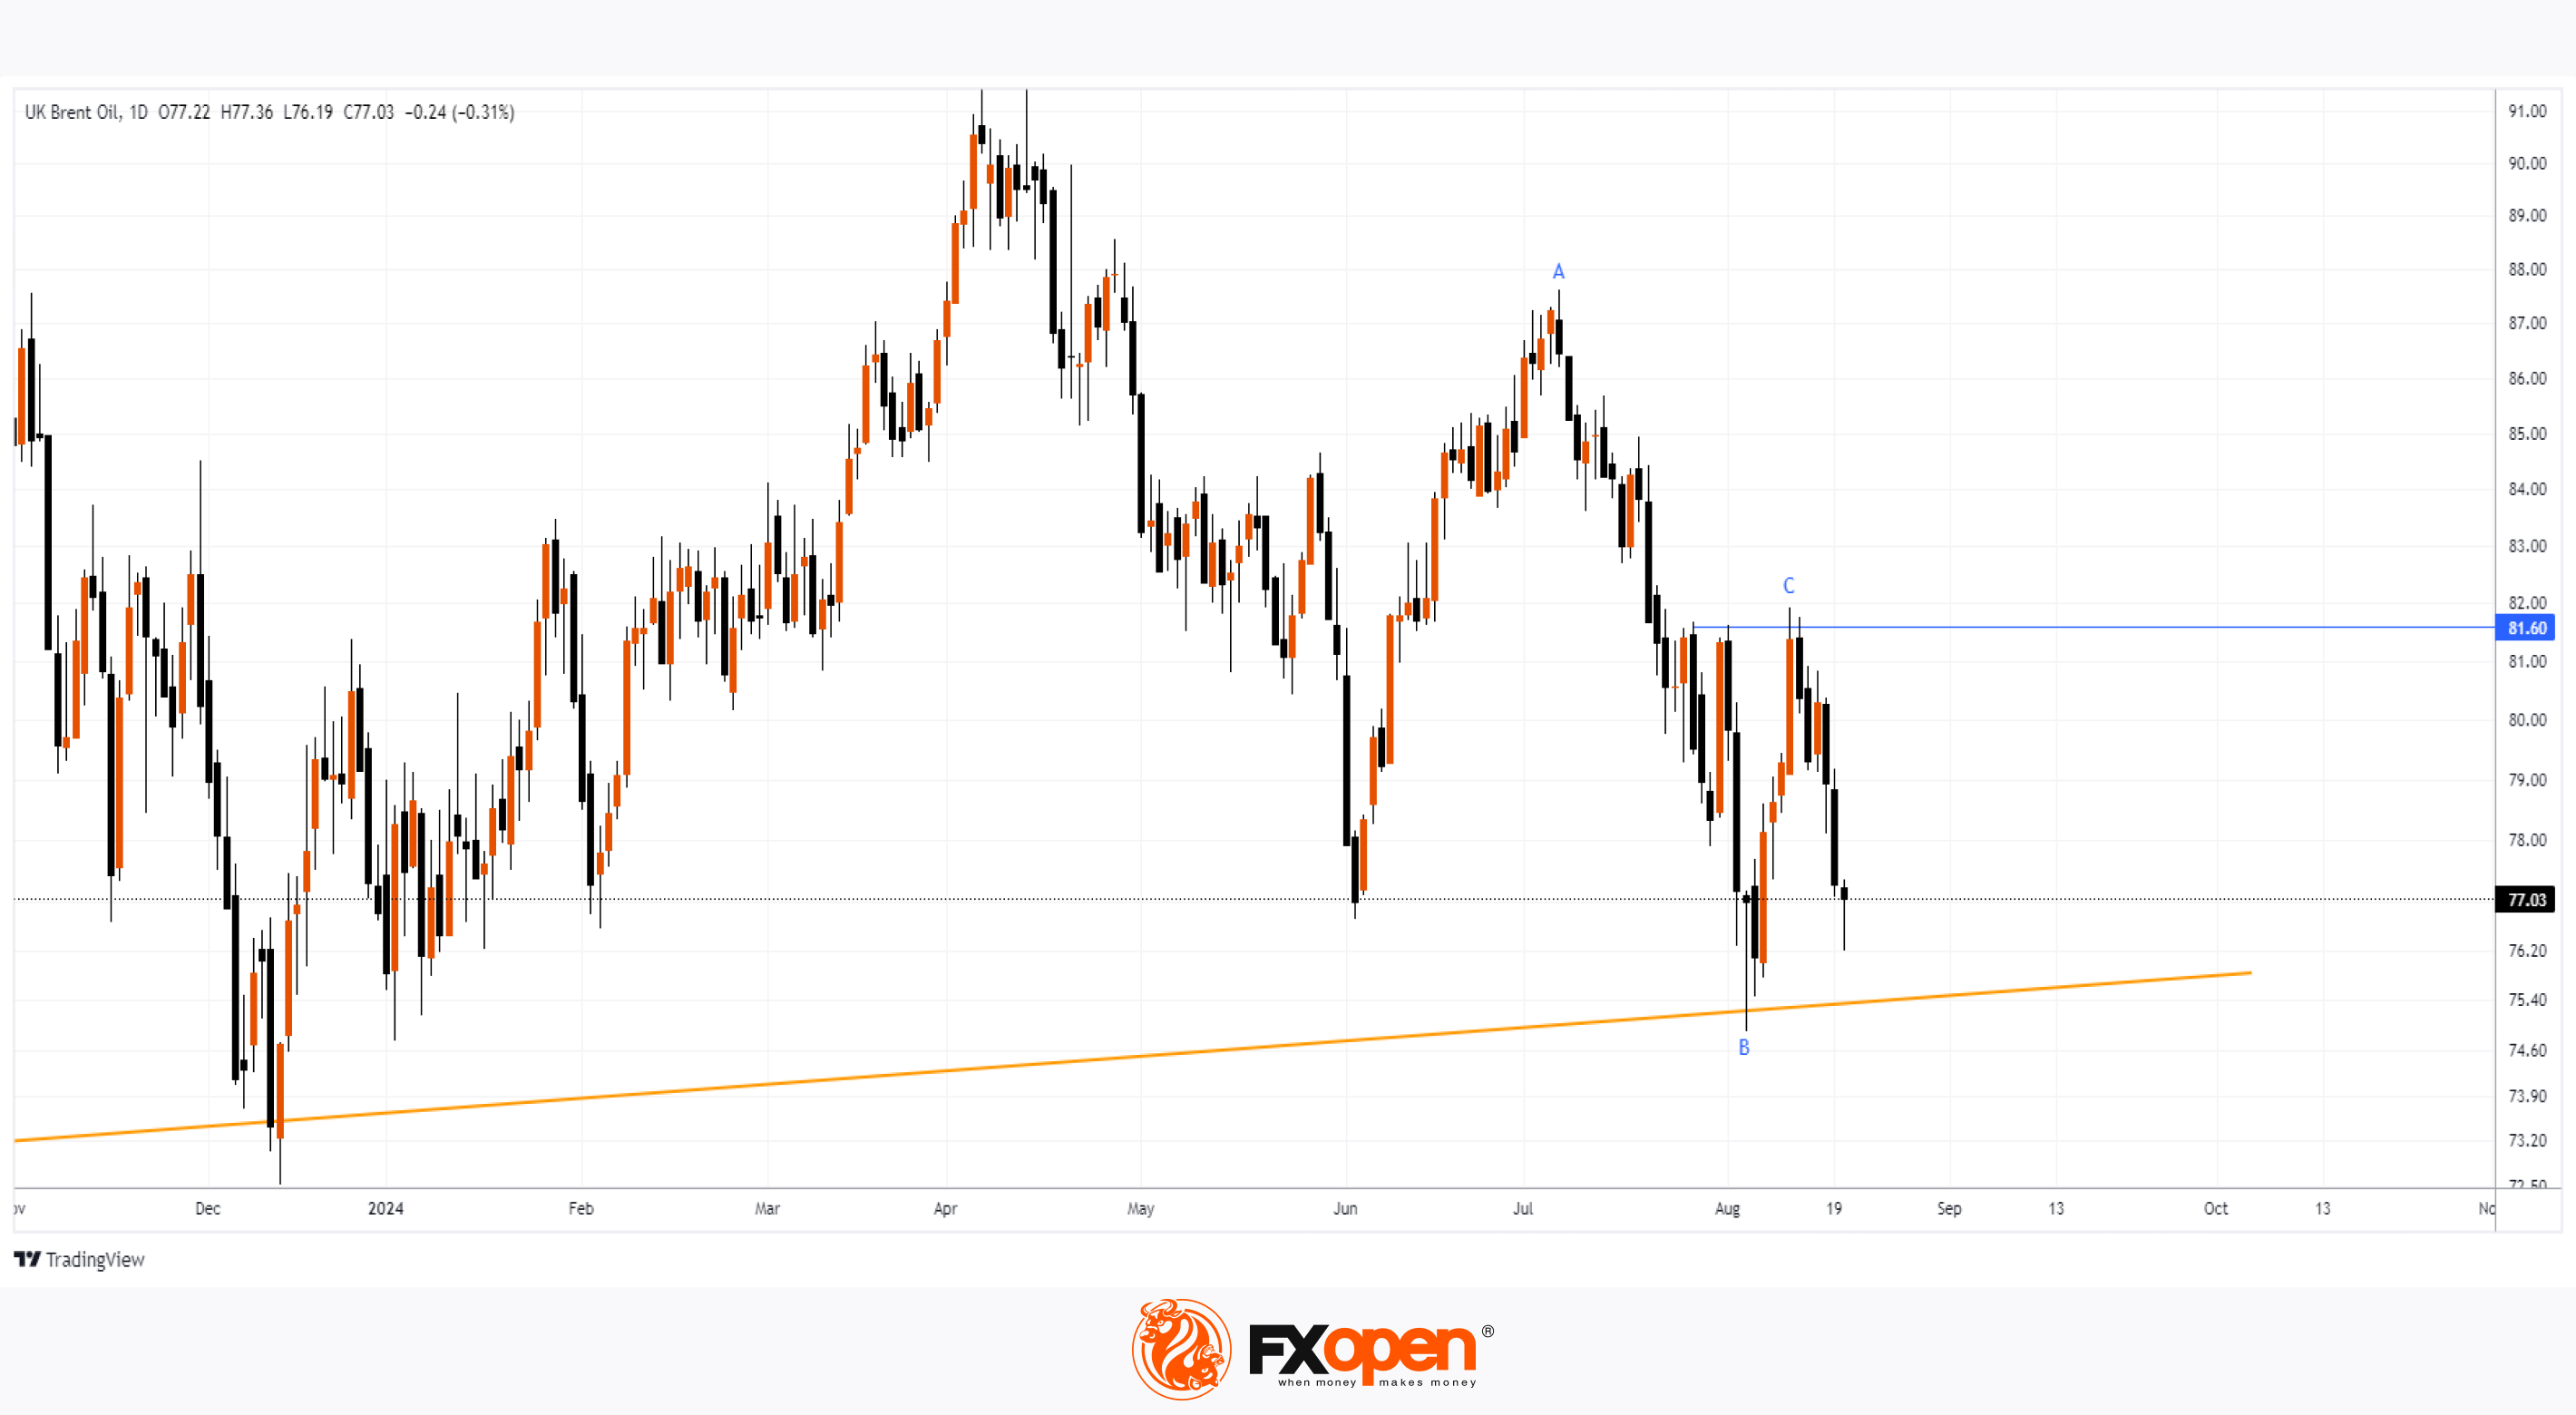
As indicated by the XBR/USD chart, the price per barrel opened at $80.28 on Friday and closed at $77.27 on Monday. Moreover, early Tuesday trading also shows a downward trend.
Bearish sentiment in the market is being influenced by geopolitical factors, particularly the easing of tensions in the Middle East. According to media reports, Israeli Prime Minister Benjamin Netanyahu has accepted a proposal aimed at resolving disagreements between Israel and Hamas.
Additionally, ANZ Bank analysts point to a reduction in petrol consumption in China due to the increasing use of electric vehicles.
Could Brent crude oil prices continue to fall further?
Technical analysis of the XBR/USD chart indicates that the price is approaching a key support level (shown in yellow) that dates back to 2023. This raises concerns, especially given the bearish indicators:
→ The recovery from B to C has retraced approximately 50% of the A to B downward impulse;
→ The formation of peak C has seen false bullish breakouts of previous local highs;
→ The bearish candles on Friday and Monday have broad bodies and closed near their lows, indicating a lack of demand (or effective selling pressure).
Thus, it is reasonable to assume that the bears might attempt to breach the critical support level, potentially leading to a new low for August.
Start trading commodities with tight spreads. Open your trading account now or learn more about trading commodity CFDs with FXOpen.
CFDs are complex instruments and come with a high risk of losing your money.
This article represents the opinion of the Companies operating under the FXOpen brand only. It is not to be construed as an offer, solicitation, or recommendation with respect to products and services provided by the Companies operating under the FXOpen brand, nor is it to be considered financial advice.
Brent Oil Price Drops Over 3.5% in Two Days
As indicated by the XBR/USD chart, the price per barrel opened at $80.28 on Friday and closed at $77.27 on Monday. Moreover, early Tuesday trading also shows a downward trend.
Bearish sentiment in the market is being influenced by geopolitical factors, particularly the easing of tensions in the Middle East. According to media reports, Israeli Prime Minister Benjamin Netanyahu has accepted a proposal aimed at resolving disagreements between Israel and Hamas.
Additionally, ANZ Bank analysts point to a reduction in petrol consumption in China due to the increasing use of electric vehicles.
Could Brent crude oil prices continue to fall further?
Technical analysis of the XBR/USD chart indicates that the price is approaching a key support level (shown in yellow) that dates back to 2023. This raises concerns, especially given the bearish indicators:
→ The recovery from B to C has retraced approximately 50% of the A to B downward impulse;
→ The formation of peak C has seen false bullish breakouts of previous local highs;
→ The bearish candles on Friday and Monday have broad bodies and closed near their lows, indicating a lack of demand (or effective selling pressure).
Thus, it is reasonable to assume that the bears might attempt to breach the critical support level, potentially leading to a new low for August.
Start trading commodities with tight spreads. Open your trading account now or learn more about trading commodity CFDs with FXOpen.
CFDs are complex instruments and come with a high risk of losing your money.
This article represents the opinion of the Companies operating under the FXOpen brand only. It is not to be construed as an offer, solicitation, or recommendation with respect to products and services provided by the Companies operating under the FXOpen brand, nor is it to be considered financial advice.
👍2
#usdcad #marketanalysis #MarketNews #tradingtips
USD/CAD Drops to 1.3600 Support Level
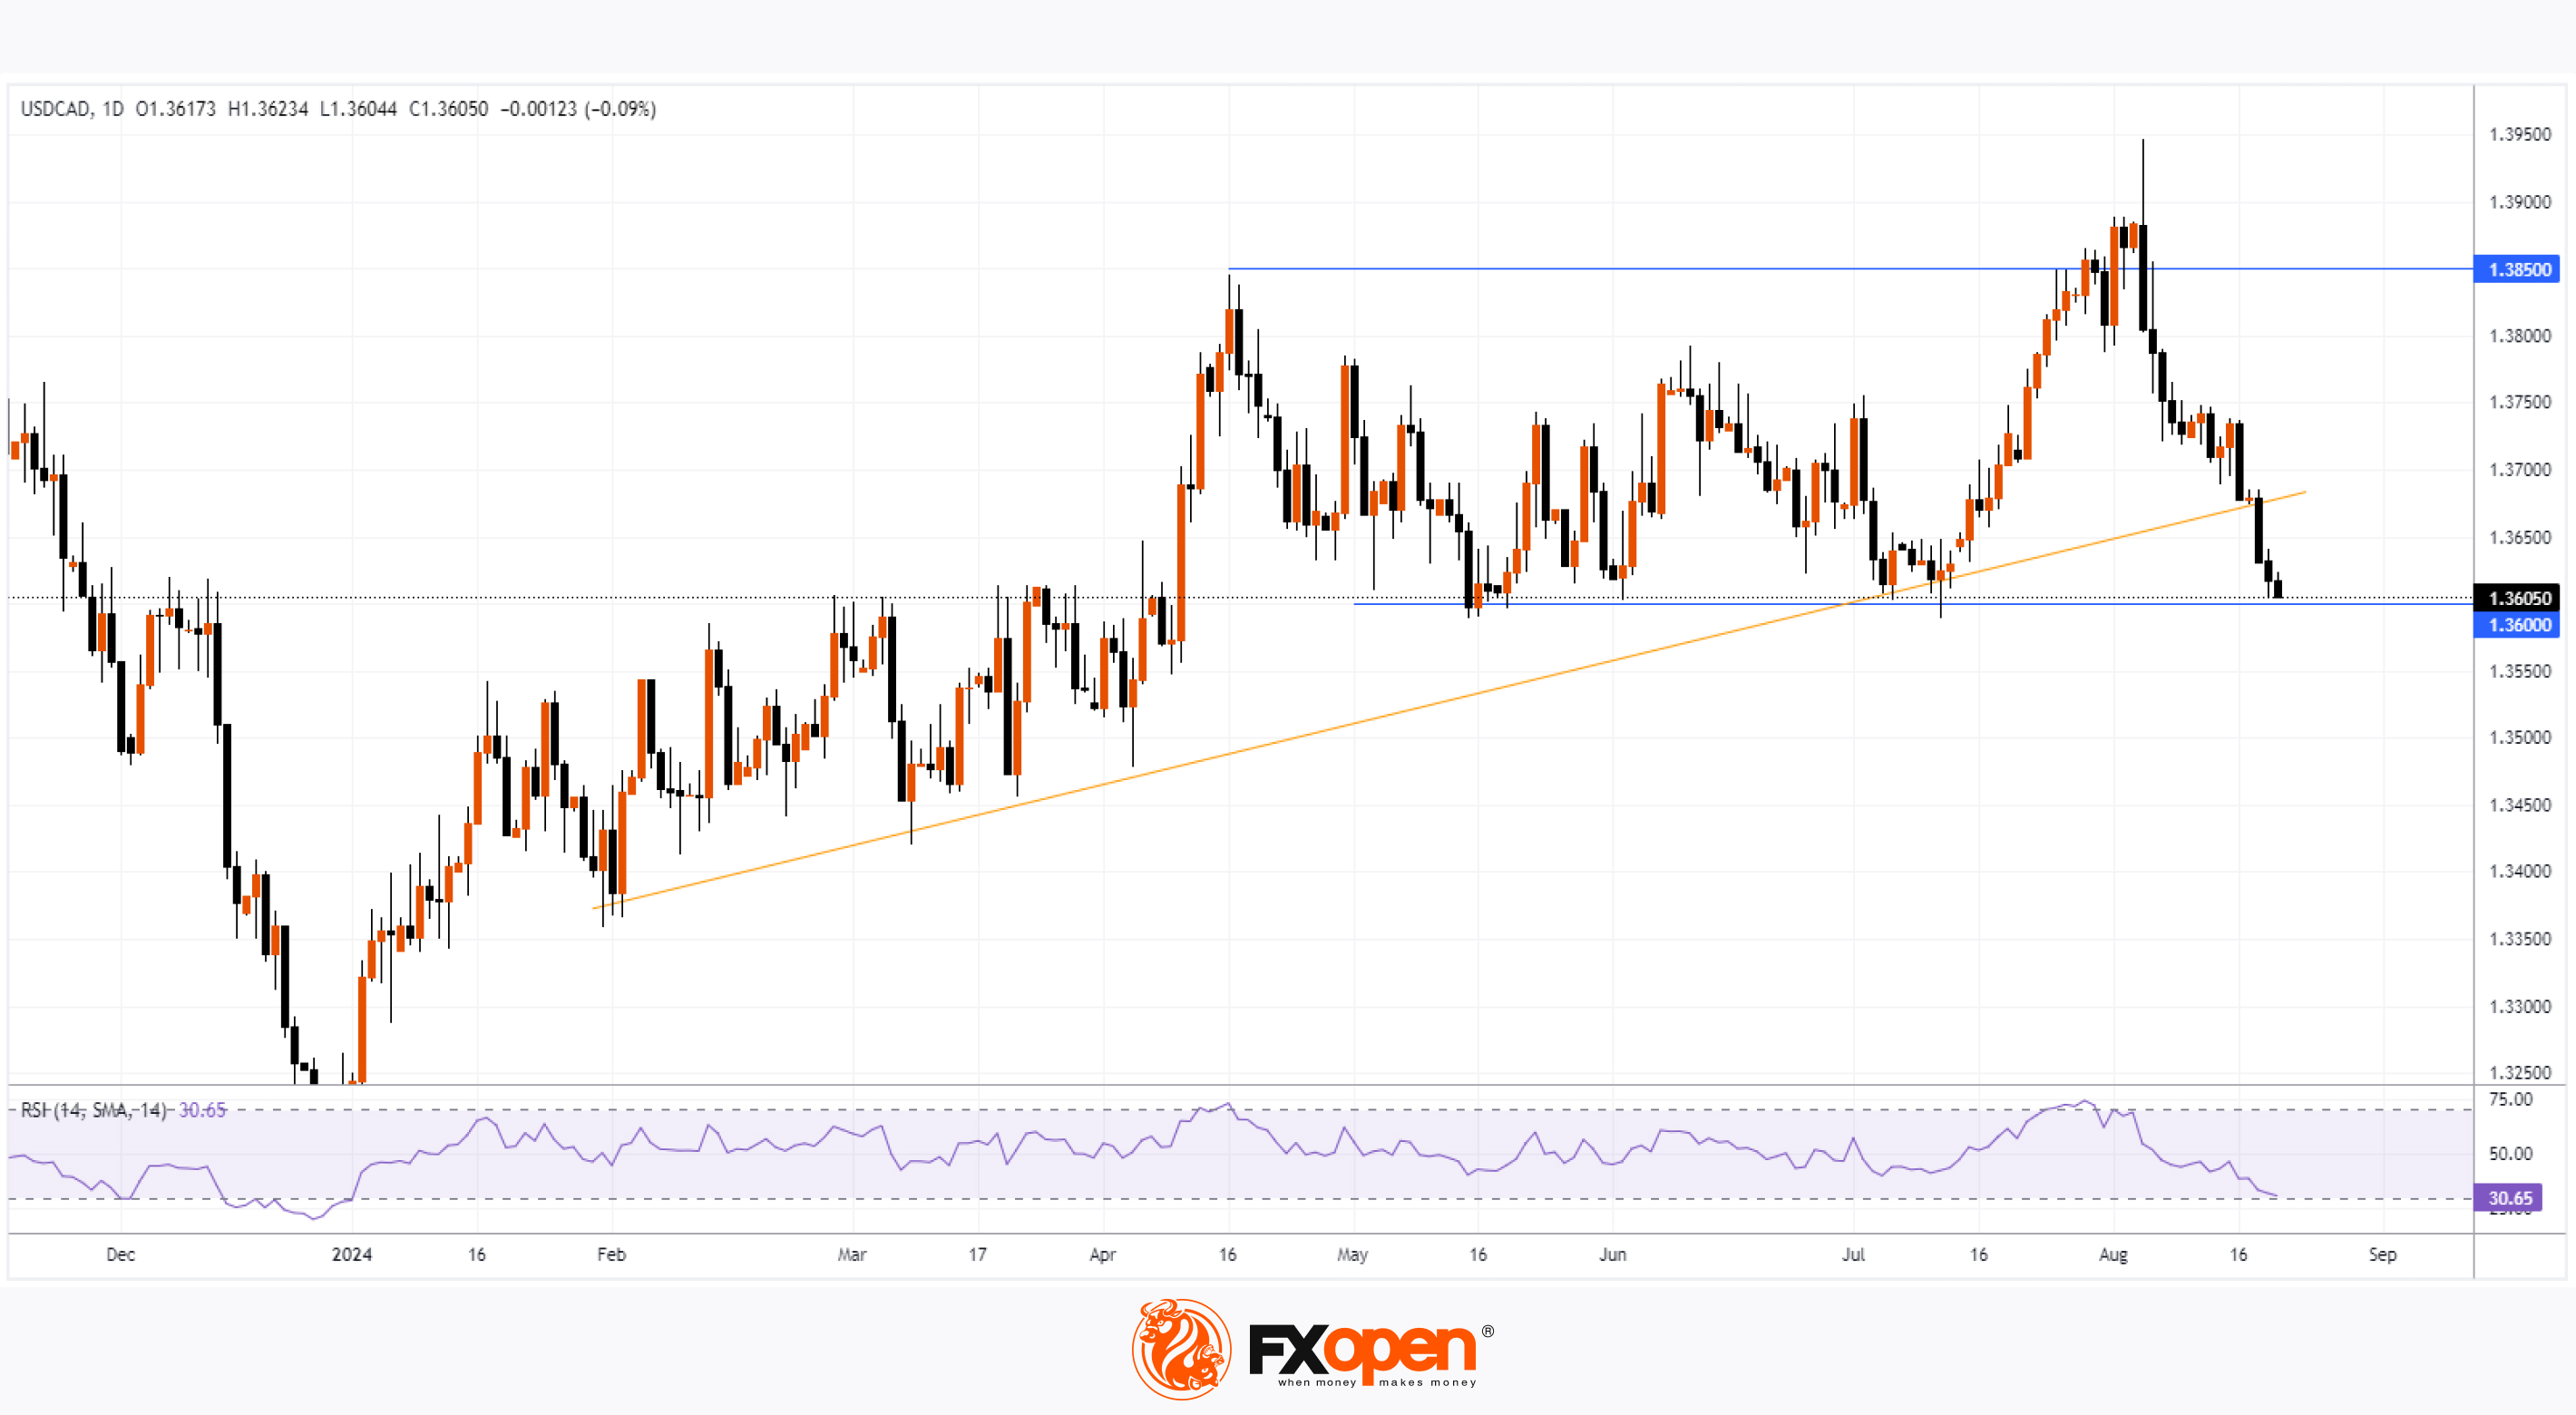
The USD/CAD chart shows the Canadian dollar strengthening against the USD to levels last seen at the end of July.
On one hand, the US dollar is weakened by expectations of an inevitable rate cut. On the other, the Canadian dollar gained strength after yesterday’s inflation data:
→ Although the initial reaction pushed USD/CAD up to 1.364,
→ Today, the market seems to have reassessed the impact, with the pair falling to yesterday's low, indicating continued bearish dominance.
Meanwhile, technical analysis of the USD/CAD chart reveals that the pair has dropped to the 1.3600 support level, which has been a key level for bulls since May.
This decline has been quite sharp, with a drop of over 2.2% from the 6th August high. Bears managed to break the trendline (shown in yellow) and push the RSI from the overbought zone close to the oversold zone within two weeks.
Notably, before the drop, the pair broke the 1.385 support level, but it turned out to be a false breakout. The 6th August candle had a long upper shadow, suggesting many traders were caught off guard.
If the bullish breakout was a false move, could a genuine breakout of the 1.3600-1.3850 range happen to the downside?
The future direction of USD/CAD will largely depend on the market’s reaction to today’s FOMC news, scheduled for release at 21:00 GMT+3.
Trade over 50 forex markets 24 hours a day with FXOpen. Take advantage of low commissions, deep liquidity, and spreads from 0.0 pips. Open your FXOpen account now or learn more about trading forex with FXOpen.
CFDs are complex instruments and come with a high risk of losing your money.
This article represents the opinion of the Companies operating under the FXOpen brand only. It is not to be construed as an offer, solicitation, or recommendation with respect to products and services provided by the Companies operating under the FXOpen brand, nor is it to be considered financial advice.
USD/CAD Drops to 1.3600 Support Level
The USD/CAD chart shows the Canadian dollar strengthening against the USD to levels last seen at the end of July.
On one hand, the US dollar is weakened by expectations of an inevitable rate cut. On the other, the Canadian dollar gained strength after yesterday’s inflation data:
→ Although the initial reaction pushed USD/CAD up to 1.364,
→ Today, the market seems to have reassessed the impact, with the pair falling to yesterday's low, indicating continued bearish dominance.
Meanwhile, technical analysis of the USD/CAD chart reveals that the pair has dropped to the 1.3600 support level, which has been a key level for bulls since May.
This decline has been quite sharp, with a drop of over 2.2% from the 6th August high. Bears managed to break the trendline (shown in yellow) and push the RSI from the overbought zone close to the oversold zone within two weeks.
Notably, before the drop, the pair broke the 1.385 support level, but it turned out to be a false breakout. The 6th August candle had a long upper shadow, suggesting many traders were caught off guard.
If the bullish breakout was a false move, could a genuine breakout of the 1.3600-1.3850 range happen to the downside?
The future direction of USD/CAD will largely depend on the market’s reaction to today’s FOMC news, scheduled for release at 21:00 GMT+3.
Trade over 50 forex markets 24 hours a day with FXOpen. Take advantage of low commissions, deep liquidity, and spreads from 0.0 pips. Open your FXOpen account now or learn more about trading forex with FXOpen.
CFDs are complex instruments and come with a high risk of losing your money.
This article represents the opinion of the Companies operating under the FXOpen brand only. It is not to be construed as an offer, solicitation, or recommendation with respect to products and services provided by the Companies operating under the FXOpen brand, nor is it to be considered financial advice.
👍2
#coinbase #stockmarket #stocks #marketanalysis
Coinbase (COIN) Shares Drop Below $200
Yesterday, shares of cryptocurrency exchange Coinbase (COIN) underperformed the broader market, falling by approximately 5%.
This decline is part of a worrying trend. While the S&P 500 (US SPX 500 mini on FXOpen) set records in mid-summer, Coinbase (COIN) struggled to surpass its March high. It seems the positive impact of the Bitcoin ETF launch earlier this year has faded.
Additionally, COIN's share price has been affected by a weak earnings report published on 1st August, where earnings per share fell significantly short of expectations (actual = $0.14 vs forecast = $0.95).
Adding to the negative sentiment is the news that if Kamala Harris wins the US presidential election, current SEC Chair Gary Gensler, known for his sceptical stance on cryptocurrencies, might be appointed as Treasury Secretary.
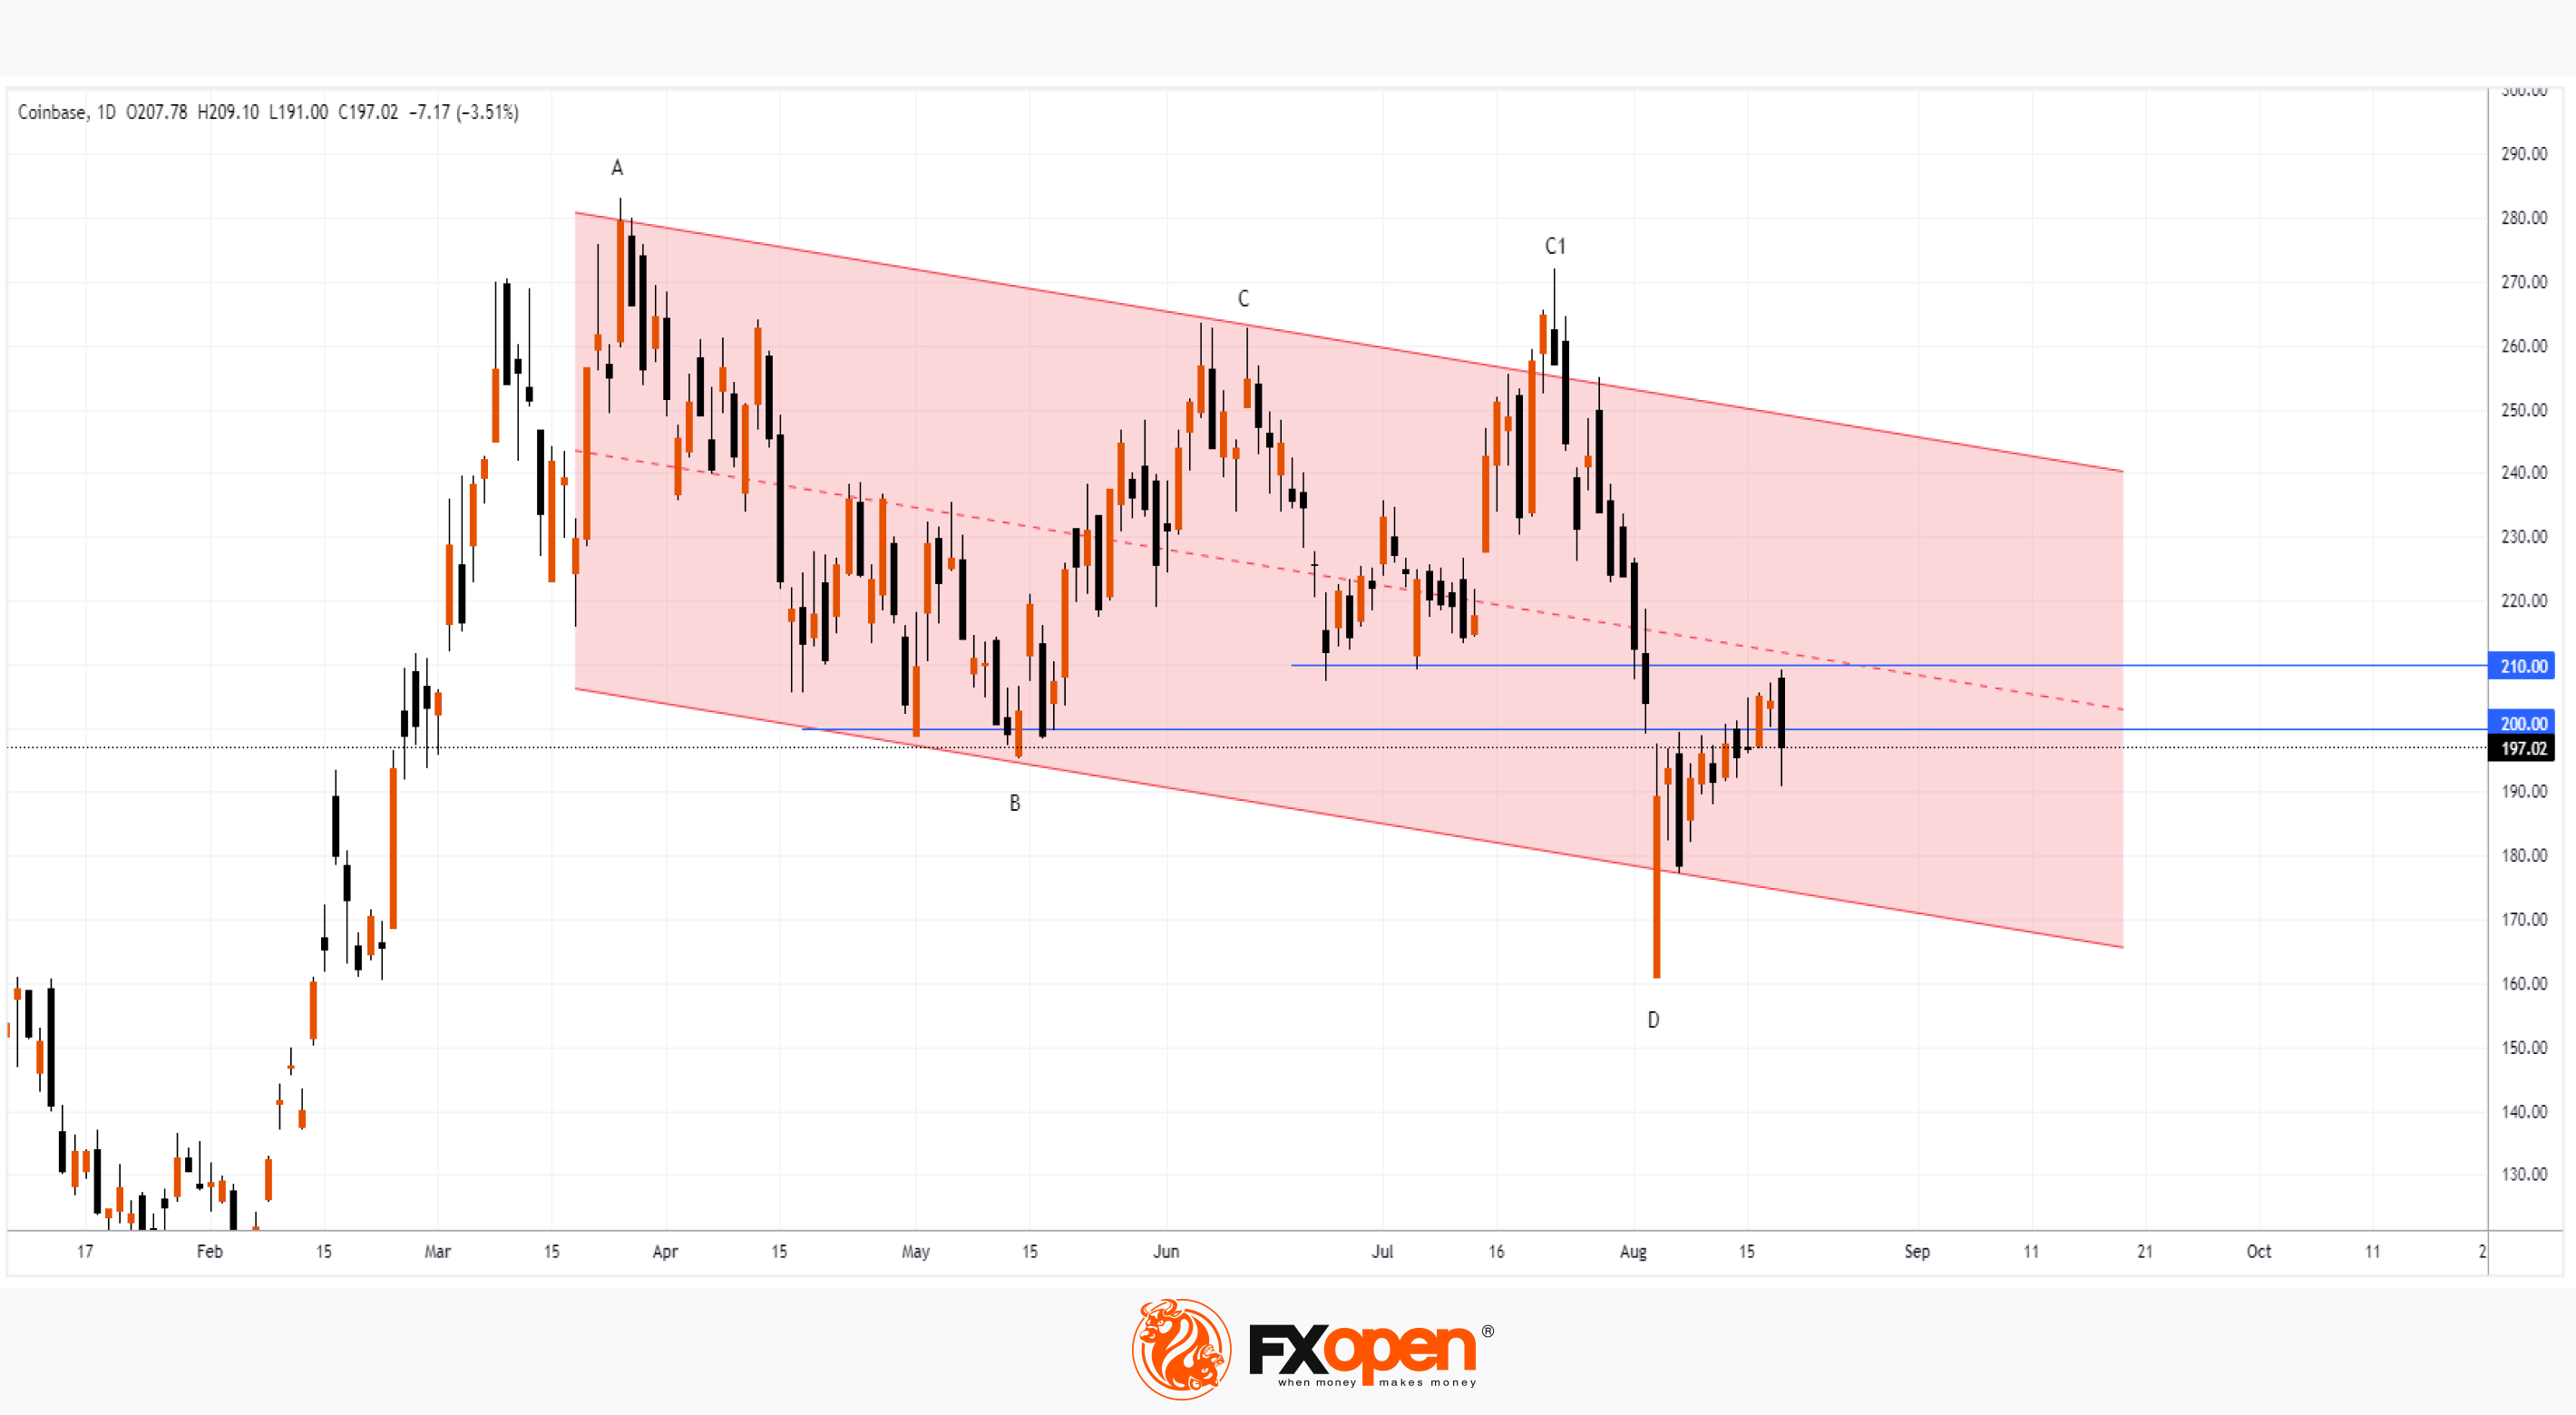
Technical analysis of the COIN chart indicates that price movements are increasingly forming a descending channel (marked in red), with:
→ Swing extremes forming a series of lower highs and lows. The false breakout at peak C1 relative to peak C can be seen as confirmation of bearish strength.
→ The psychological level of $200, which acted as support in May (during the formation of low B), may now serve as resistance, as only two trading days closed above this mark.
→ Another significant resistance level is $210, which served as support in June before being bearishly broken on 2nd August.
The bearish arguments are concerning. The $200-210 zone, reinforced by the median of the descending channel, could be a major obstacle for bulls.
However, analysts remain optimistic. According to average estimates from TipRanks, the target price for COIN is $259 over the next 12 months (+31% from current levels).
Trade global index CFDs with zero commission and tight spreads. Open your FXOpen account now or learn more about trading index CFDs with FXOpen.
CFDs are complex instruments and come with a high risk of losing your money.
This article represents the opinion of the Companies operating under the FXOpen brand only. It is not to be construed as an offer, solicitation, or recommendation with respect to products and services provided by the Companies operating under the FXOpen brand, nor is it to be considered financial advice.
Coinbase (COIN) Shares Drop Below $200
Yesterday, shares of cryptocurrency exchange Coinbase (COIN) underperformed the broader market, falling by approximately 5%.
This decline is part of a worrying trend. While the S&P 500 (US SPX 500 mini on FXOpen) set records in mid-summer, Coinbase (COIN) struggled to surpass its March high. It seems the positive impact of the Bitcoin ETF launch earlier this year has faded.
Additionally, COIN's share price has been affected by a weak earnings report published on 1st August, where earnings per share fell significantly short of expectations (actual = $0.14 vs forecast = $0.95).
Adding to the negative sentiment is the news that if Kamala Harris wins the US presidential election, current SEC Chair Gary Gensler, known for his sceptical stance on cryptocurrencies, might be appointed as Treasury Secretary.
Technical analysis of the COIN chart indicates that price movements are increasingly forming a descending channel (marked in red), with:
→ Swing extremes forming a series of lower highs and lows. The false breakout at peak C1 relative to peak C can be seen as confirmation of bearish strength.
→ The psychological level of $200, which acted as support in May (during the formation of low B), may now serve as resistance, as only two trading days closed above this mark.
→ Another significant resistance level is $210, which served as support in June before being bearishly broken on 2nd August.
The bearish arguments are concerning. The $200-210 zone, reinforced by the median of the descending channel, could be a major obstacle for bulls.
However, analysts remain optimistic. According to average estimates from TipRanks, the target price for COIN is $259 over the next 12 months (+31% from current levels).
Trade global index CFDs with zero commission and tight spreads. Open your FXOpen account now or learn more about trading index CFDs with FXOpen.
CFDs are complex instruments and come with a high risk of losing your money.
This article represents the opinion of the Companies operating under the FXOpen brand only. It is not to be construed as an offer, solicitation, or recommendation with respect to products and services provided by the Companies operating under the FXOpen brand, nor is it to be considered financial advice.
👍2
#sp500 #stockmarket #MarketNews
The S&P 500 Index Approaches Historic High
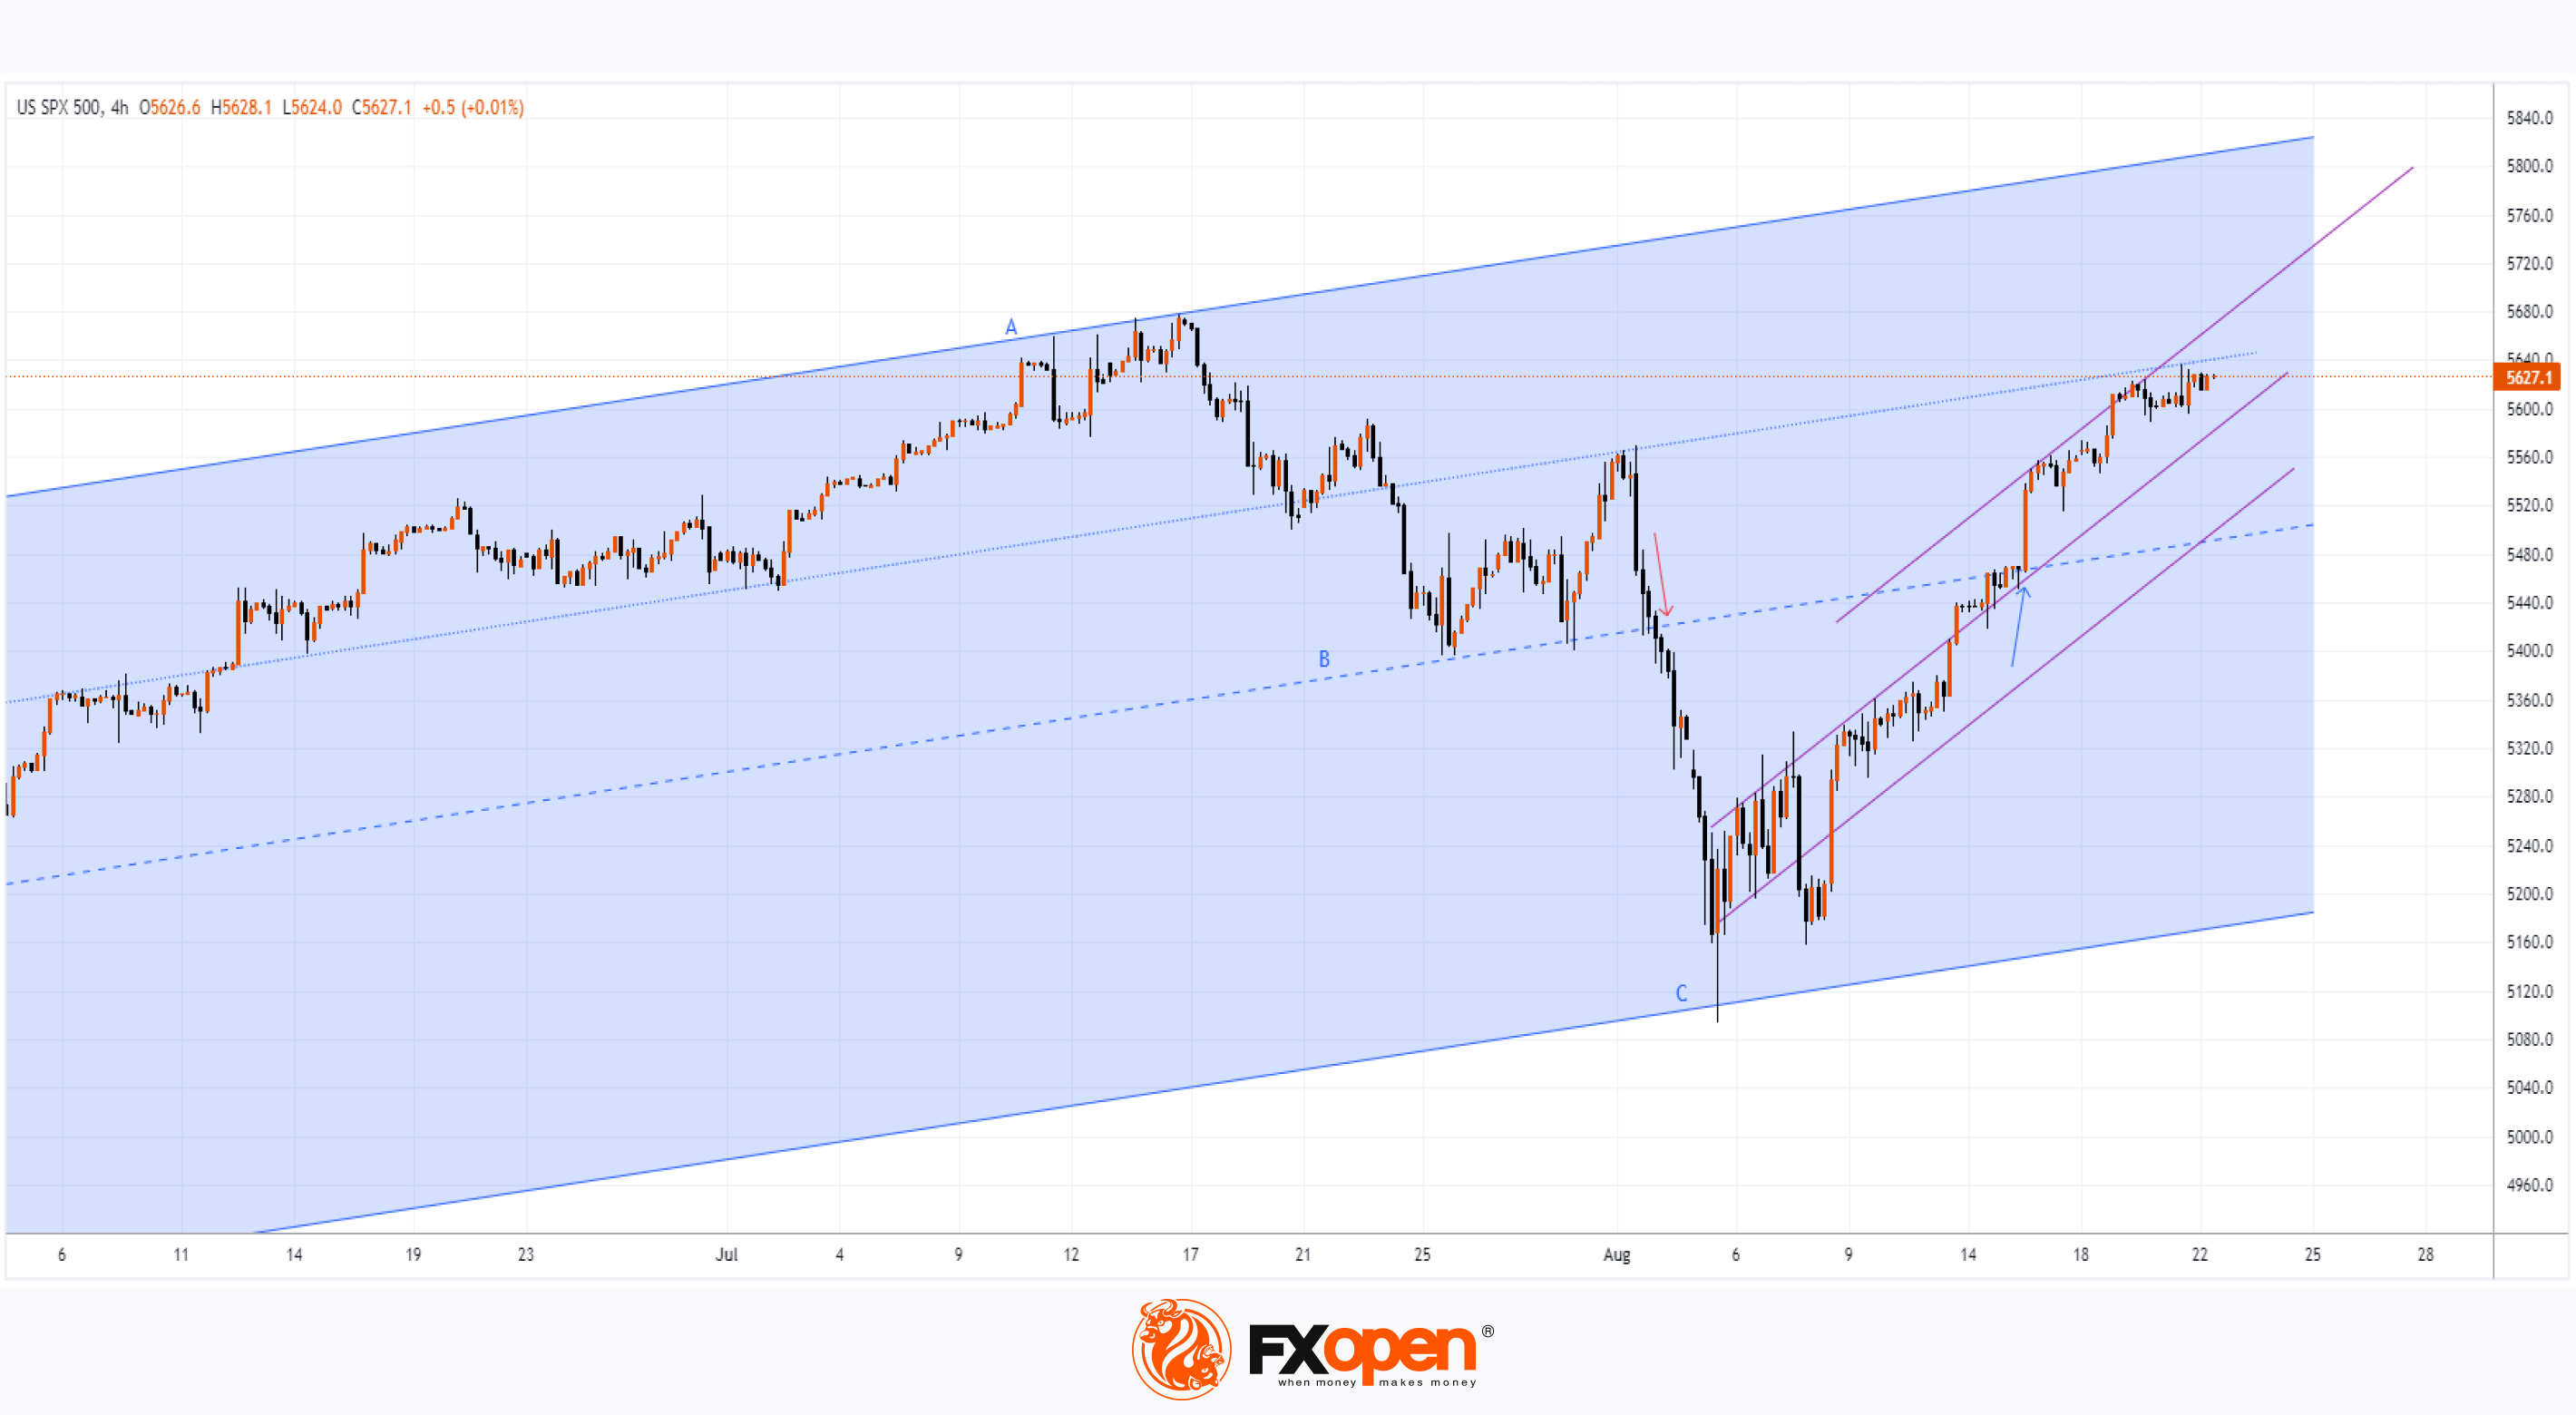
On 2 August, we analysed the S&P 500 (US SPX 500 mini on FXOpen) chart, where we:
→ Constructed an ascending channel A-B with a median line shown as a dotted line;
→ Highlighted the risk of a bearish breakout (as indicated by the red arrow).
Since then:
→ The price dropped by more than 5% to the 5 August low, doubling the width of the A-B channel towards point C – the B line became the median of a wider channel. The index's decline was driven by recession fears, based on weak US labour market data;
→ However, the price then began to recover from the lower boundary of the wider channel, indicating that recession fears have subsided and the rally continues;
→ The price has now returned close to historical highs.
Yesterday, the minutes from the FOMC meeting on 30-31 July were released, revealing that the vast majority of participants noted that if data continues to align with expectations, it might be appropriate to ease policy at the next meeting.
The S&P 500 (US SPX 500 mini on FXOpen) index remained largely unchanged on this news – this indicates market participants' belief that interest rates will likely be cut in September, which would stimulate economic growth, company performance, and stock indices.
Technical analysis of the S&P 500 (US SPX 500 mini on FXOpen) chart today shows that:
→ On 7-8 August, bears attempted to resume the downward trend but failed;
→ In mid-August, price action made the trendlines shown in purple relevant;
→ On 15 August, the B line was confidently broken (indicated by the blue arrow);
→ The dotted line is showing signs of resistance.
Thus, it is reasonable to assume that bulls have regained control of the market after the sharp decline in the S&P 500 (US SPX 500 mini on FXOpen) in early August. If the sentiment remains unchanged, we could see attempts to reach a new historical high.
Trade global index CFDs with zero commission and tight spreads. Open your FXOpen account now or learn more about trading index CFDs with FXOpen.
CFDs are complex instruments and come with a high risk of losing your money.
This article represents the opinion of the Companies operating under the FXOpen brand only. It is not to be construed as an offer, solicitation, or recommendation with respect to products and services provided by the Companies operating under the FXOpen brand, nor is it to be considered financial advice.
The S&P 500 Index Approaches Historic High
On 2 August, we analysed the S&P 500 (US SPX 500 mini on FXOpen) chart, where we:
→ Constructed an ascending channel A-B with a median line shown as a dotted line;
→ Highlighted the risk of a bearish breakout (as indicated by the red arrow).
Since then:
→ The price dropped by more than 5% to the 5 August low, doubling the width of the A-B channel towards point C – the B line became the median of a wider channel. The index's decline was driven by recession fears, based on weak US labour market data;
→ However, the price then began to recover from the lower boundary of the wider channel, indicating that recession fears have subsided and the rally continues;
→ The price has now returned close to historical highs.
Yesterday, the minutes from the FOMC meeting on 30-31 July were released, revealing that the vast majority of participants noted that if data continues to align with expectations, it might be appropriate to ease policy at the next meeting.
The S&P 500 (US SPX 500 mini on FXOpen) index remained largely unchanged on this news – this indicates market participants' belief that interest rates will likely be cut in September, which would stimulate economic growth, company performance, and stock indices.
Technical analysis of the S&P 500 (US SPX 500 mini on FXOpen) chart today shows that:
→ On 7-8 August, bears attempted to resume the downward trend but failed;
→ In mid-August, price action made the trendlines shown in purple relevant;
→ On 15 August, the B line was confidently broken (indicated by the blue arrow);
→ The dotted line is showing signs of resistance.
Thus, it is reasonable to assume that bulls have regained control of the market after the sharp decline in the S&P 500 (US SPX 500 mini on FXOpen) in early August. If the sentiment remains unchanged, we could see attempts to reach a new historical high.
Trade global index CFDs with zero commission and tight spreads. Open your FXOpen account now or learn more about trading index CFDs with FXOpen.
CFDs are complex instruments and come with a high risk of losing your money.
This article represents the opinion of the Companies operating under the FXOpen brand only. It is not to be construed as an offer, solicitation, or recommendation with respect to products and services provided by the Companies operating under the FXOpen brand, nor is it to be considered financial advice.
👍2
#marketanalysis #MarketNews #tradingforex
Analysis of NZD/USD: Price Approaches Key Resistance Zone
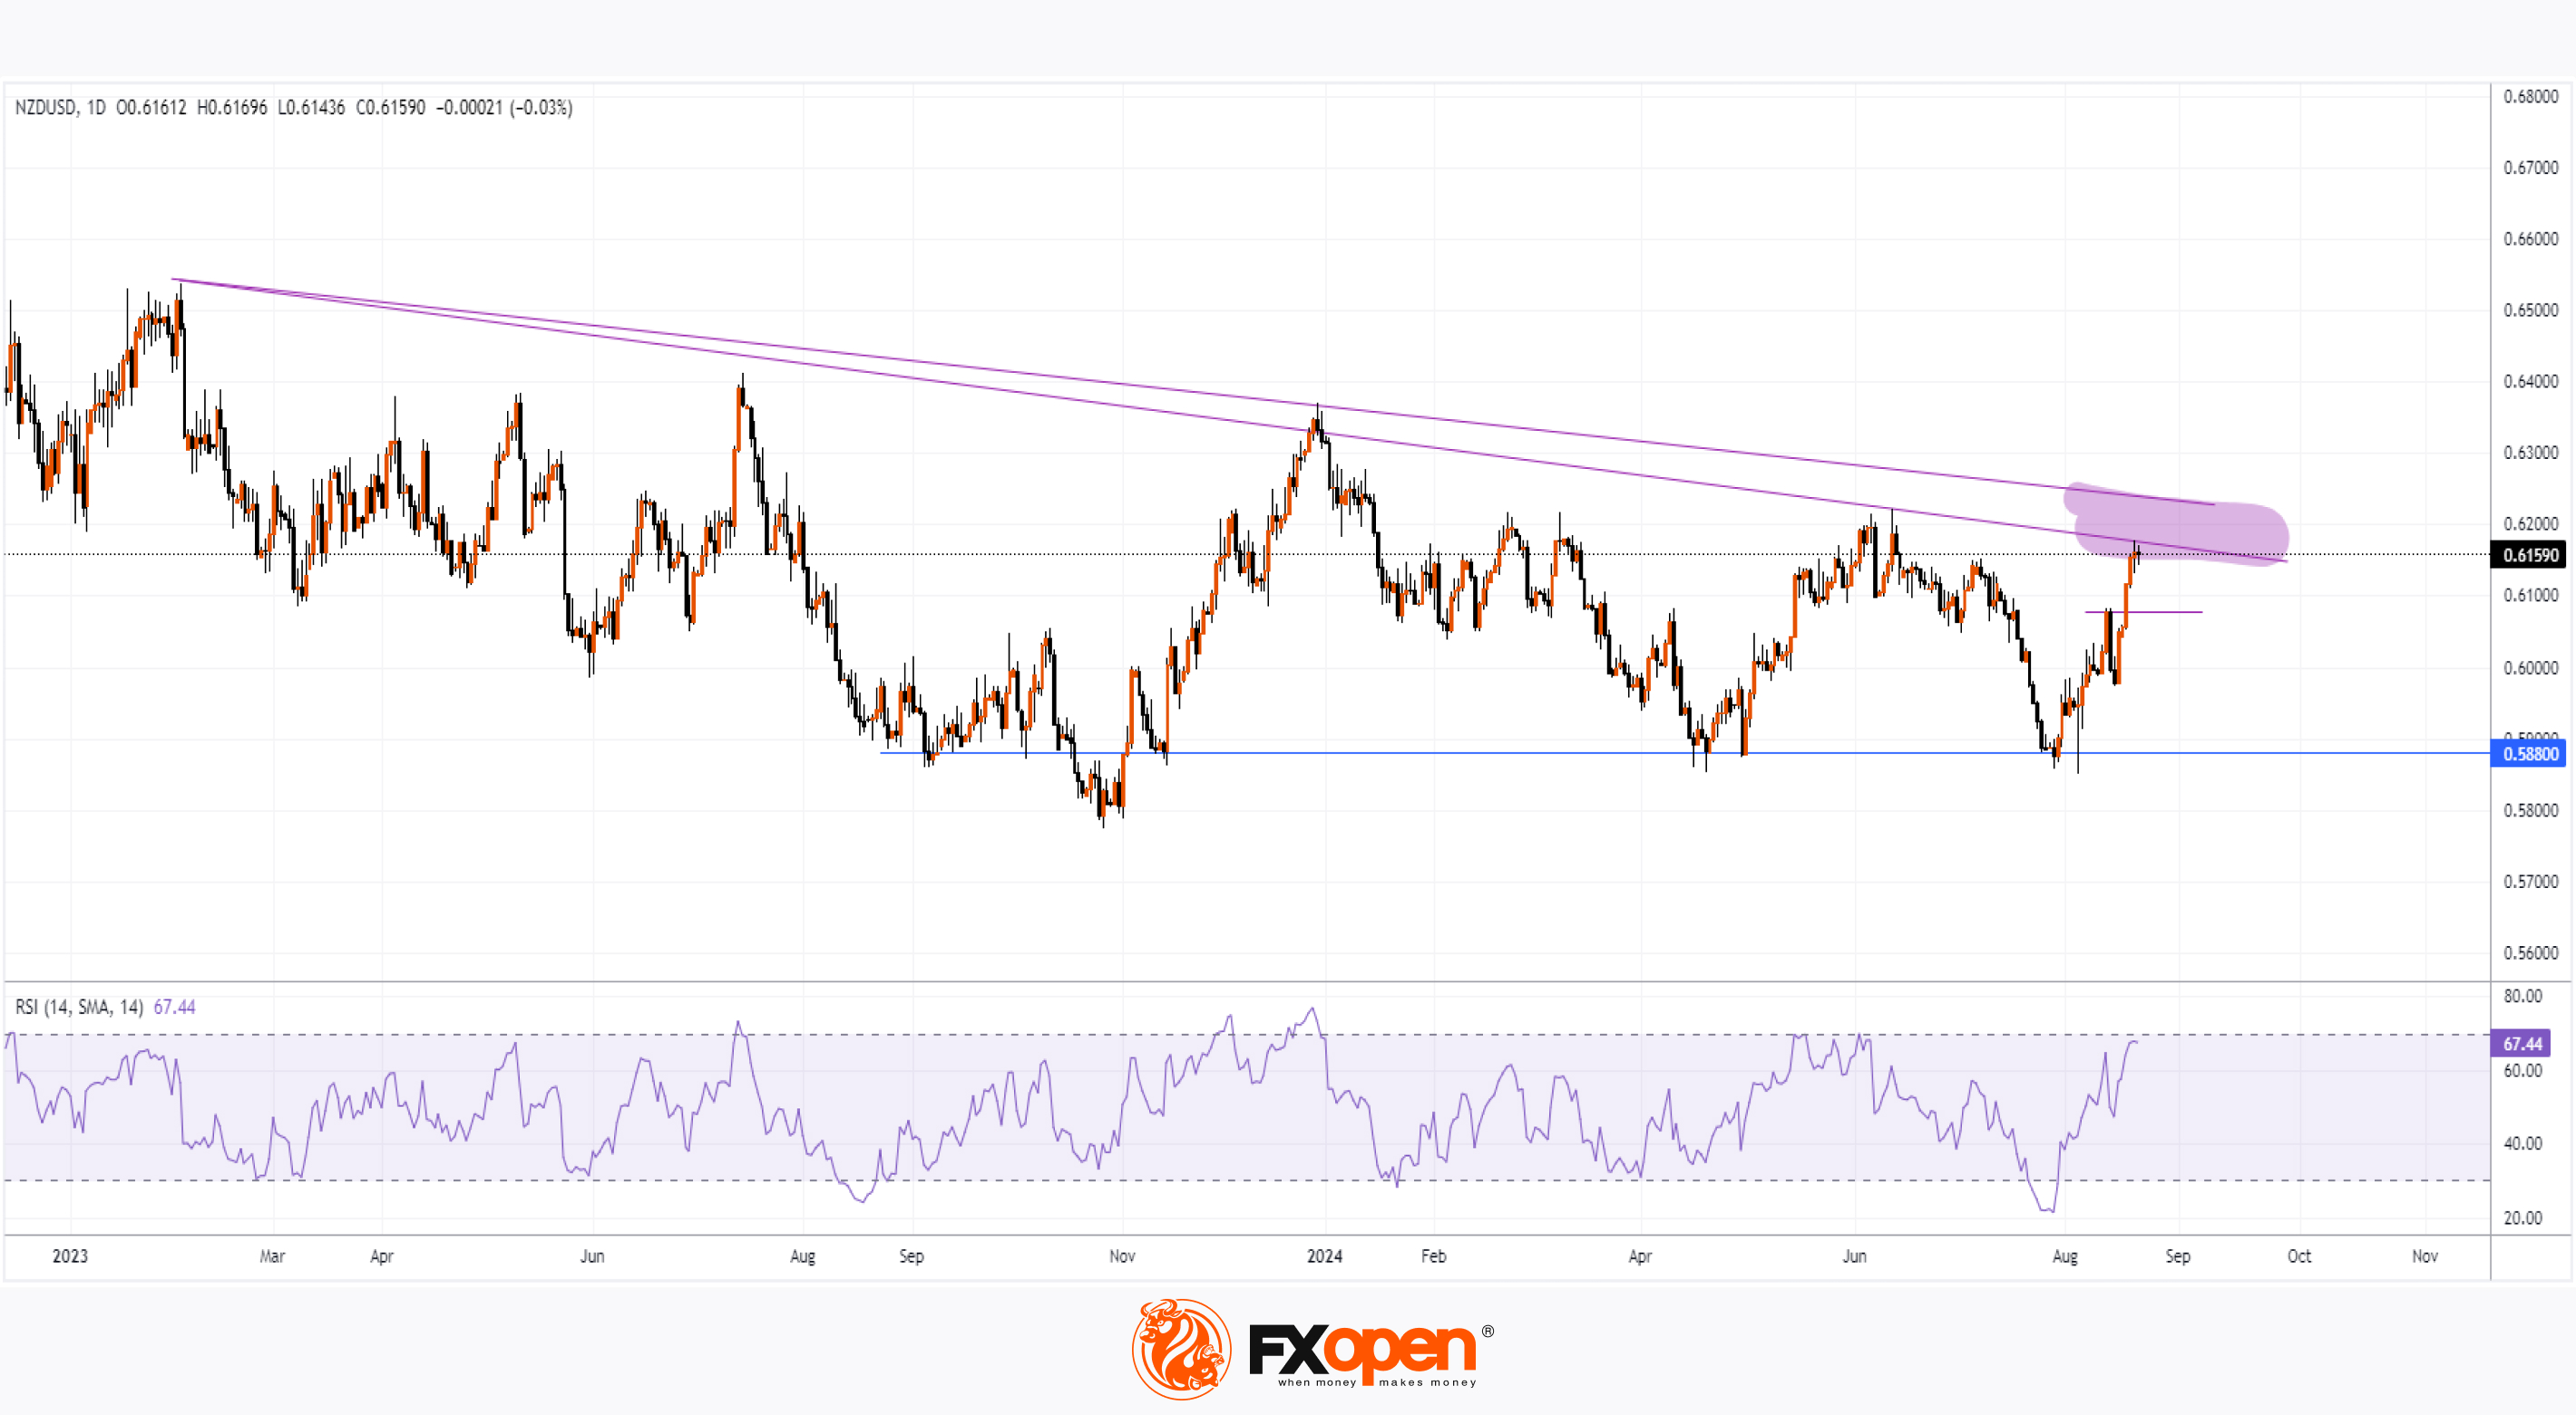
The NZD/USD chart today shows that the New Zealand dollar has risen by over 3% against the USD in less than a week. From another perspective, the NZD/USD rate has climbed more than 5% from its August low.
The volatility in the exchange rate was influenced by the Reserve Bank of New Zealand's decision to cut interest rates, as reported on 14 August.
Technical analysis of the NZD/USD chart reveals:
→ The current bullish sentiment has pushed the RSI indicator from the oversold into the overbought zone.
→ The 0.60770 level, which marked the peak on 13-14 August, may now act as support following its bullish breakout on 19 August.
More notably, the NZD/USD rate has entered a resistance zone (marked in purple), formed by trendlines drawn through key highs of 2023-2024. This could potentially slow the upward momentum.
As a result, the NZD/USD chart might continue to see significant fluctuations between this resistance zone and the critical support at 0.588 (a level where the price has repeatedly attempted, but failed, to break below over the past 12 months).
Investor attention now shifts to Federal Reserve Chair Jerome Powell's speech at the Jackson Hole symposium on Friday, which could trigger a surge in volatility and provide insights into how strongly the resistance zone is impacting the NZD/USD rate.
Trade over 50 forex markets 24 hours a day with FXOpen. Take advantage of low commissions, deep liquidity, and spreads from 0.0 pips. Open your FXOpen account now or learn more about trading forex with FXOpen.
CFDs are complex instruments and come with a high risk of losing your money.
This article represents the opinion of the Companies operating under the FXOpen brand only. It is not to be construed as an offer, solicitation, or recommendation with respect to products and services provided by the Companies operating under the FXOpen brand, nor is it to be considered financial advice.
Analysis of NZD/USD: Price Approaches Key Resistance Zone
The NZD/USD chart today shows that the New Zealand dollar has risen by over 3% against the USD in less than a week. From another perspective, the NZD/USD rate has climbed more than 5% from its August low.
The volatility in the exchange rate was influenced by the Reserve Bank of New Zealand's decision to cut interest rates, as reported on 14 August.
Technical analysis of the NZD/USD chart reveals:
→ The current bullish sentiment has pushed the RSI indicator from the oversold into the overbought zone.
→ The 0.60770 level, which marked the peak on 13-14 August, may now act as support following its bullish breakout on 19 August.
More notably, the NZD/USD rate has entered a resistance zone (marked in purple), formed by trendlines drawn through key highs of 2023-2024. This could potentially slow the upward momentum.
As a result, the NZD/USD chart might continue to see significant fluctuations between this resistance zone and the critical support at 0.588 (a level where the price has repeatedly attempted, but failed, to break below over the past 12 months).
Investor attention now shifts to Federal Reserve Chair Jerome Powell's speech at the Jackson Hole symposium on Friday, which could trigger a surge in volatility and provide insights into how strongly the resistance zone is impacting the NZD/USD rate.
Trade over 50 forex markets 24 hours a day with FXOpen. Take advantage of low commissions, deep liquidity, and spreads from 0.0 pips. Open your FXOpen account now or learn more about trading forex with FXOpen.
CFDs are complex instruments and come with a high risk of losing your money.
This article represents the opinion of the Companies operating under the FXOpen brand only. It is not to be construed as an offer, solicitation, or recommendation with respect to products and services provided by the Companies operating under the FXOpen brand, nor is it to be considered financial advice.
👍2
#GBPUSD #marketanalysis #MarketNews #tradingforex
Analysis of GBP/USD: The Pair Approaches 2023 High
Yesterday, the Purchasing Managers' Index (PMI) data for both the UK and the US were released.
According to ForexFactory, the UK figures were as follows:
→ Flash Manufacturing PMI: actual = 52.5, forecast = 52.1; previous = 52.1;
→ Flash Services PMI: actual = 53.3, forecast = 52.8; previous = 52.5.
As SPGlobal reports, the August PMI data signalled another significant expansion (the largest since April) in the UK's private sector output, supported by strong growth in new orders.
In contrast, the US figures were less encouraging:
→ Flash Manufacturing PMI: actual = 48.0, forecast = 49.5; previous = 49.6;
→ Flash Services PMI: actual = 55.2, forecast = 54.0; previous = 55.0.
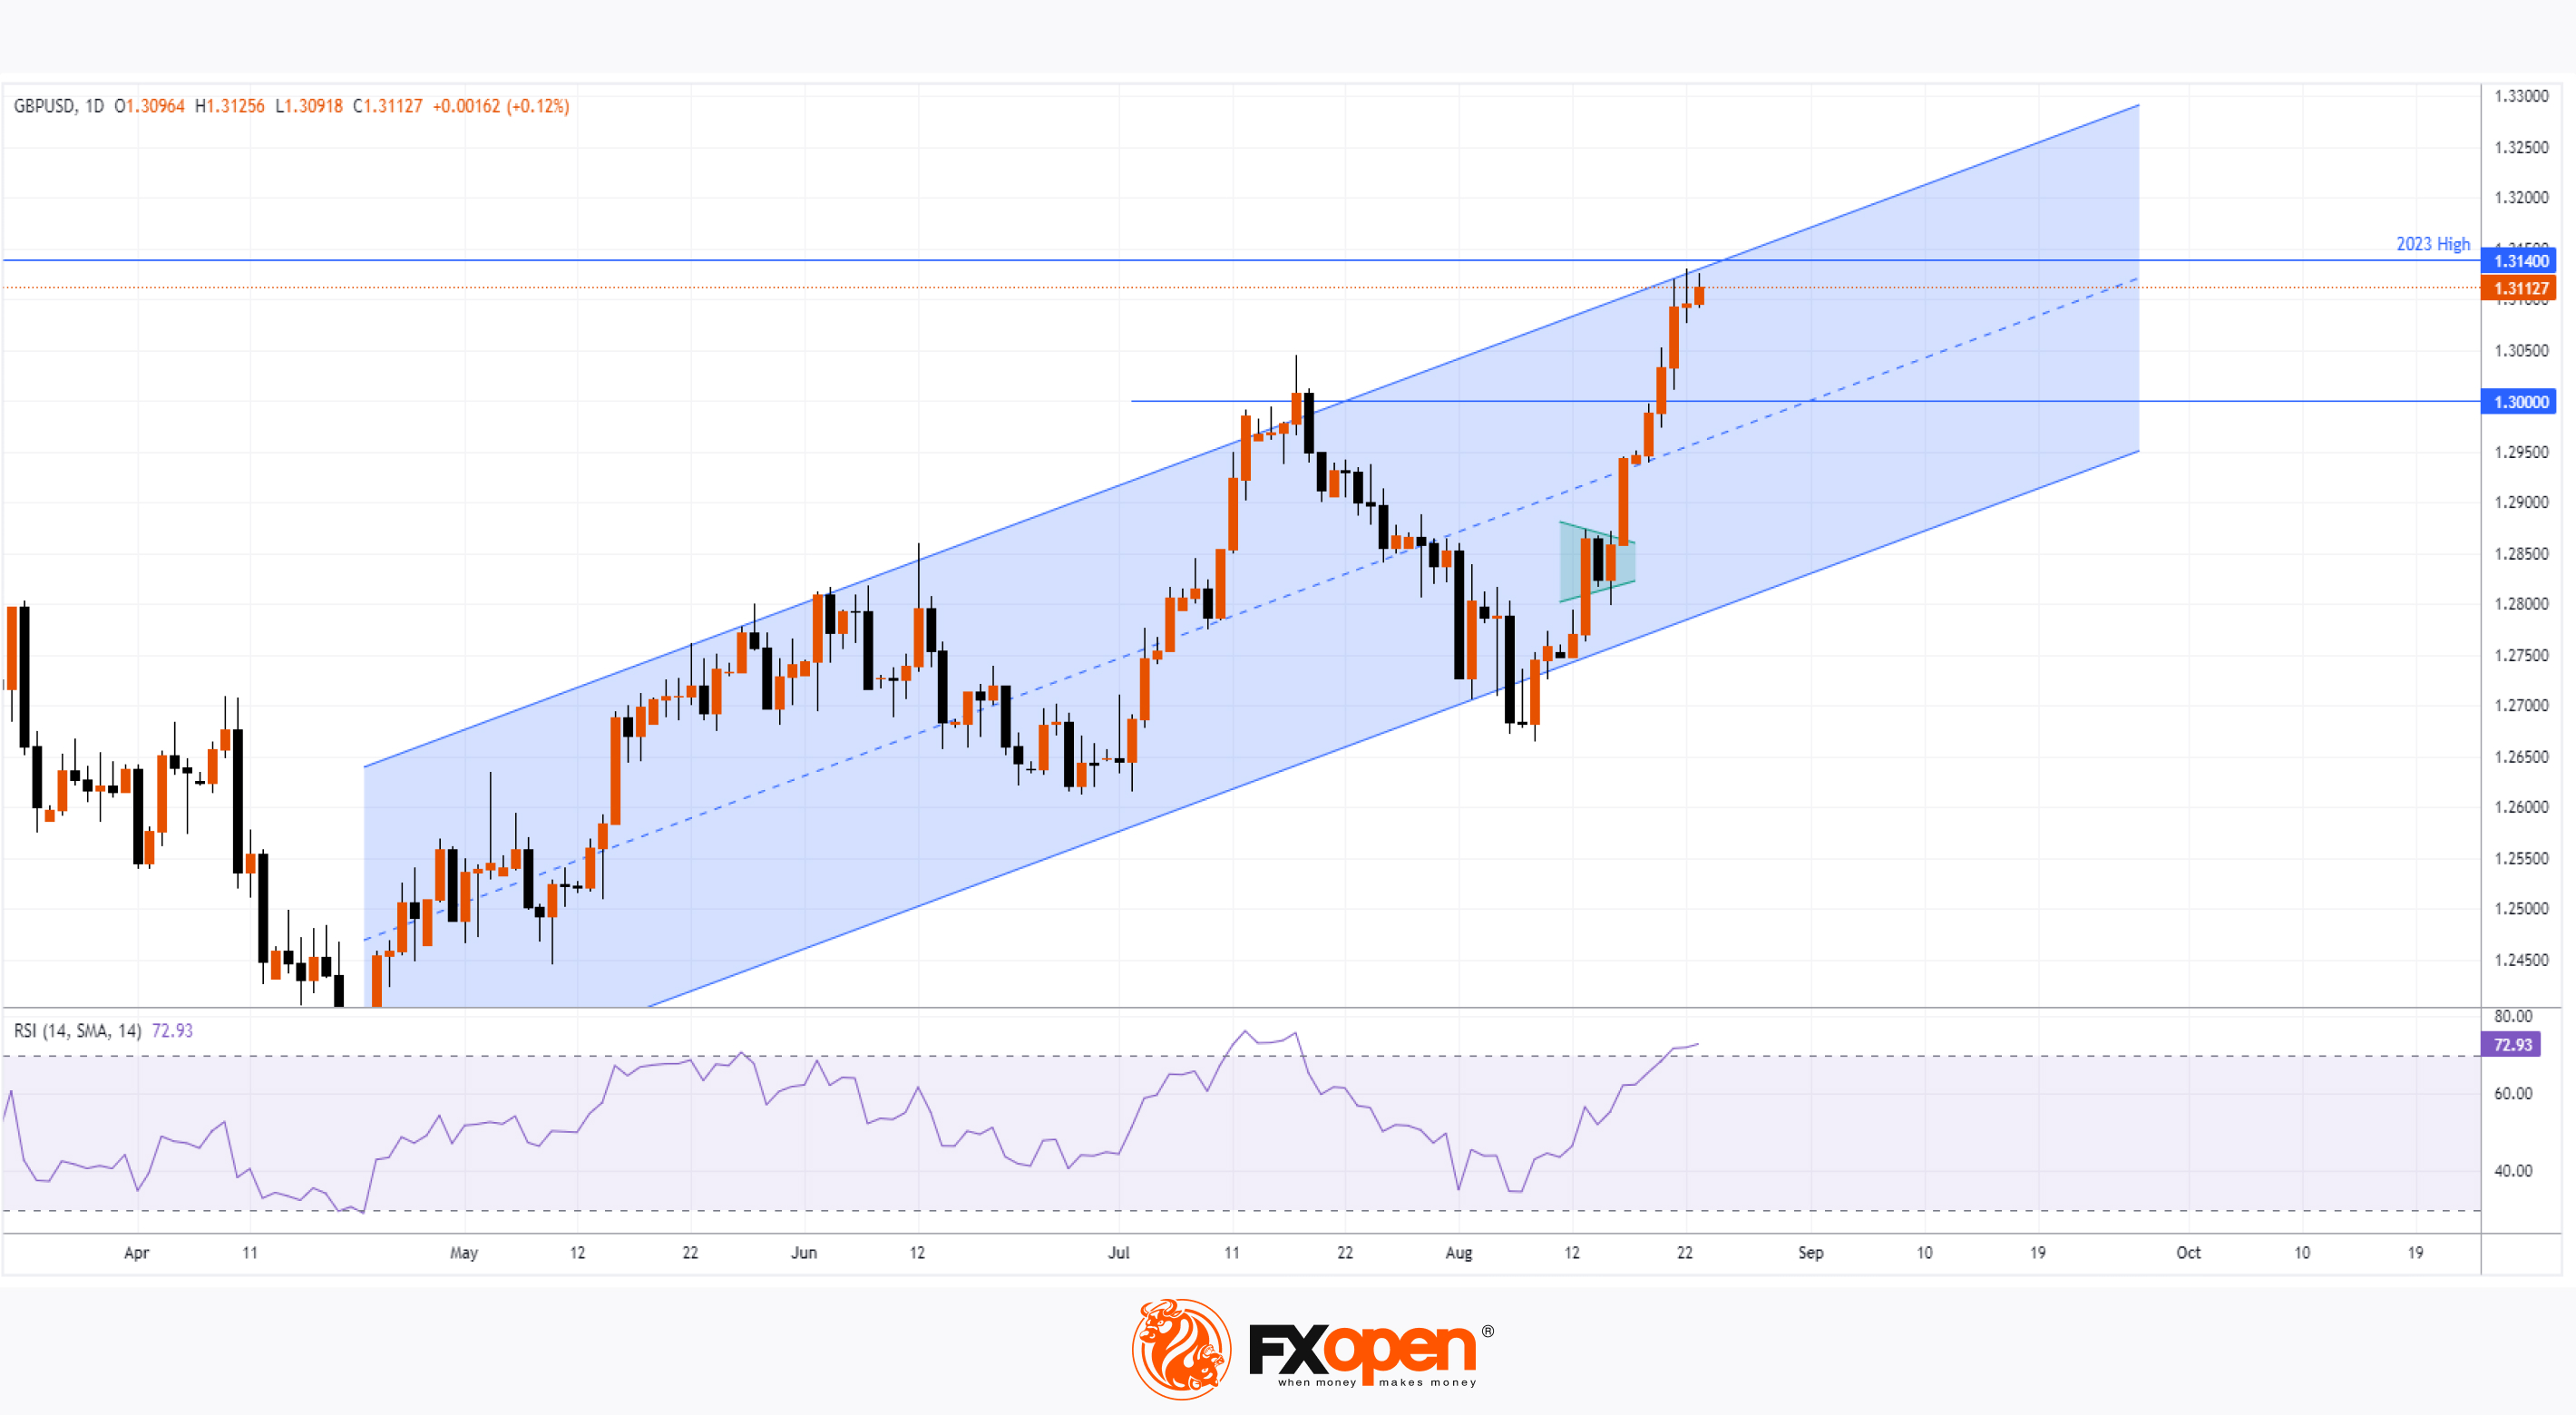
In response to yesterday’s PMI releases, the GBP/USD rate has been climbing this morning towards the 2023 high around the 1.3140 level. Notably:
→ Since the August low, the pair has risen by over 3.5%;
→ A key driver of bullish sentiment for GBP/USD is the weakness of the US dollar, driven by expectations of a Fed rate cut in September.
Technical analysis of the GBP/USD daily chart today shows:
→ The price has broken upwards out of the consolidation triangle (which we mentioned on 15 August) and confidently surpassed the psychological barrier at 1.3000;
→ The RSI indicator has entered overbought territory;
→ The last few daily candles show long upper shadows, indicating increased selling activity;
→ The upper boundary of the ascending channel (shown in blue) could act as resistance.
Given these factors, it is reasonable to suggest that the rally might be losing momentum, and even if the bulls manage to challenge the 2023 high, it could potentially result in a bull trap.
Trade over 50 forex markets 24 hours a day with FXOpen. Take advantage of low commissions, deep liquidity, and spreads from 0.0 pips. Open your FXOpen account now or learn more about trading forex with FXOpen.
CFDs are complex instruments and come with a high risk of losing your money.
This article represents the opinion of the Companies operating under the FXOpen brand only. It is not to be construed as an offer, solicitation, or recommendation with respect to products and services provided by the Companies operating under the FXOpen brand, nor is it to be considered financial advice.
Analysis of GBP/USD: The Pair Approaches 2023 High
Yesterday, the Purchasing Managers' Index (PMI) data for both the UK and the US were released.
According to ForexFactory, the UK figures were as follows:
→ Flash Manufacturing PMI: actual = 52.5, forecast = 52.1; previous = 52.1;
→ Flash Services PMI: actual = 53.3, forecast = 52.8; previous = 52.5.
As SPGlobal reports, the August PMI data signalled another significant expansion (the largest since April) in the UK's private sector output, supported by strong growth in new orders.
In contrast, the US figures were less encouraging:
→ Flash Manufacturing PMI: actual = 48.0, forecast = 49.5; previous = 49.6;
→ Flash Services PMI: actual = 55.2, forecast = 54.0; previous = 55.0.
In response to yesterday’s PMI releases, the GBP/USD rate has been climbing this morning towards the 2023 high around the 1.3140 level. Notably:
→ Since the August low, the pair has risen by over 3.5%;
→ A key driver of bullish sentiment for GBP/USD is the weakness of the US dollar, driven by expectations of a Fed rate cut in September.
Technical analysis of the GBP/USD daily chart today shows:
→ The price has broken upwards out of the consolidation triangle (which we mentioned on 15 August) and confidently surpassed the psychological barrier at 1.3000;
→ The RSI indicator has entered overbought territory;
→ The last few daily candles show long upper shadows, indicating increased selling activity;
→ The upper boundary of the ascending channel (shown in blue) could act as resistance.
Given these factors, it is reasonable to suggest that the rally might be losing momentum, and even if the bulls manage to challenge the 2023 high, it could potentially result in a bull trap.
Trade over 50 forex markets 24 hours a day with FXOpen. Take advantage of low commissions, deep liquidity, and spreads from 0.0 pips. Open your FXOpen account now or learn more about trading forex with FXOpen.
CFDs are complex instruments and come with a high risk of losing your money.
This article represents the opinion of the Companies operating under the FXOpen brand only. It is not to be construed as an offer, solicitation, or recommendation with respect to products and services provided by the Companies operating under the FXOpen brand, nor is it to be considered financial advice.
👍2
#stockmarket #stocktrading #marketanalysis
NIO Stock Price Tests the 4.2 Level
For many months, the share price of the Chinese automaker NIO has been moving within a downward channel (shown in red), driven by the company’s ongoing struggle to achieve profitability.
From a technical analysis perspective, this week has provided a discouraging signal for investors – the 4.2 level, which acted as support in June and July before being broken in early August, has now been tested:
→ On the 19th, the price rose on a narrow candle (a sign of buyer uncertainty);
→ On the 20th, the price fell on a wide candle (a sign of seller confidence);
→ This suggests that the 4.2 level has likely switched from support to resistance.
This opens the door for the price to move towards the year’s low, around the 3.650 level.
From a fundamental perspective, NIO investors have reasons for optimism:
→ For the first time in the company’s history, monthly vehicle deliveries have remained above 20,000 units;
→ NIO, which positions itself as a premium brand, plans to launch a budget sub-brand called ONVO, which will offer more affordable vehicles – according to Seeking Alpha, the first L60 model cars could be sold as early as September, with 60,000 pre-orders already placed (indicating strong demand).
→ The company is optimistic about 2025.
NIO’s Q2 earnings report, due on 24 September, could be a turning point for the stock, which currently shows signs of weakness.
Trade global index CFDs with zero commission and tight spreads. Open your FXOpen account now or learn more about trading index CFDs with FXOpen.
CFDs are complex instruments and come with a high risk of losing your money.
This article represents the opinion of the Companies operating under the FXOpen brand only. It is not to be construed as an offer, solicitation, or recommendation with respect to products and services provided by the Companies operating under the FXOpen brand, nor is it to be considered financial advice.
NIO Stock Price Tests the 4.2 Level
For many months, the share price of the Chinese automaker NIO has been moving within a downward channel (shown in red), driven by the company’s ongoing struggle to achieve profitability.
From a technical analysis perspective, this week has provided a discouraging signal for investors – the 4.2 level, which acted as support in June and July before being broken in early August, has now been tested:
→ On the 19th, the price rose on a narrow candle (a sign of buyer uncertainty);
→ On the 20th, the price fell on a wide candle (a sign of seller confidence);
→ This suggests that the 4.2 level has likely switched from support to resistance.
This opens the door for the price to move towards the year’s low, around the 3.650 level.
From a fundamental perspective, NIO investors have reasons for optimism:
→ For the first time in the company’s history, monthly vehicle deliveries have remained above 20,000 units;
→ NIO, which positions itself as a premium brand, plans to launch a budget sub-brand called ONVO, which will offer more affordable vehicles – according to Seeking Alpha, the first L60 model cars could be sold as early as September, with 60,000 pre-orders already placed (indicating strong demand).
→ The company is optimistic about 2025.
NIO’s Q2 earnings report, due on 24 September, could be a turning point for the stock, which currently shows signs of weakness.
Trade global index CFDs with zero commission and tight spreads. Open your FXOpen account now or learn more about trading index CFDs with FXOpen.
CFDs are complex instruments and come with a high risk of losing your money.
This article represents the opinion of the Companies operating under the FXOpen brand only. It is not to be construed as an offer, solicitation, or recommendation with respect to products and services provided by the Companies operating under the FXOpen brand, nor is it to be considered financial advice.

👍2
#XAUUSD #xauusdgold #oilprices #BrentOil #SP500 #stockmarket #commodity
Weekly Market Wrap With Gary Thomson: Gold, Brent Oil, European Currencies, S&P 500
Get the latest scoop on the week's hottest headlines, all in one convenient video. Join Gary Thomson, the COO of FXOpen UK, as he breaks down the most significant news reports and shares his expert insights.
🔸 The S&P 500 Index Approaches Historic High
🔸 European Currencies Strengthened Ahead of the Jackson Hole Symposium
🔸 Brent Oil Price Drops Over 3.5% in Two Days
🔸 Gold Price Surpasses $2500 for the First Time
Stay in the know and empower yourself with our short, yet power-packed video. Watch it now and stay updated with FXOpen. Don't miss out on this invaluable opportunity to sharpen your trading skills and make informed decisions.
https://cutt.ly/ZenYQWgT
To take advantage of price fluctuations in the foreign exchange markets, consider enlisting the services of a reliable broker like FXOpen.
⚠️
This forecast represents FXOpen Companies opinion only, it should not be construed as an offer, invitation or recommendation in respect to FXOpen Companies products and services or as financial advice.
Weekly Market Wrap With Gary Thomson: Gold, Brent Oil, European Currencies, S&P 500
Get the latest scoop on the week's hottest headlines, all in one convenient video. Join Gary Thomson, the COO of FXOpen UK, as he breaks down the most significant news reports and shares his expert insights.
🔸 The S&P 500 Index Approaches Historic High
🔸 European Currencies Strengthened Ahead of the Jackson Hole Symposium
🔸 Brent Oil Price Drops Over 3.5% in Two Days
🔸 Gold Price Surpasses $2500 for the First Time
Stay in the know and empower yourself with our short, yet power-packed video. Watch it now and stay updated with FXOpen. Don't miss out on this invaluable opportunity to sharpen your trading skills and make informed decisions.
https://cutt.ly/ZenYQWgT
To take advantage of price fluctuations in the foreign exchange markets, consider enlisting the services of a reliable broker like FXOpen.
⚠️
This forecast represents FXOpen Companies opinion only, it should not be construed as an offer, invitation or recommendation in respect to FXOpen Companies products and services or as financial advice.
YouTube
Weekly Market Wrap With Gary Thomson: Gold, Brent Oil, European Currencies, S&P 500
Get the latest scoop on the week's hottest headlines, all in one convenient video. Join Gary Thomson, the COO of FXOpen UK, as he breaks down the most significant news reports and shares his expert insights.
00:30 The S&P 500 Index Approaches Historic High…
00:30 The S&P 500 Index Approaches Historic High…
👍2
#EURUSD #marketanalysis #MarketNews #forextrading
The EUR/USD Exchange Rate Has Risen to the 1.12 Level
During his speech at Jackson Hole, as reported by Reuters, the Fed Chair unexpectedly focused heavily on the US labour market. Powell stated that weaker employment prospects are unacceptable. As a result of this emphasis, market expectations for a rate cut in September decreased, and the value of the US dollar increased:
→ On Monday morning, the dollar index is recovering from the year's lows, which were reached on Friday;
→ Accordingly, other currencies are depreciating against the USD.
As shown by the technical analysis of the EUR/USD chart:
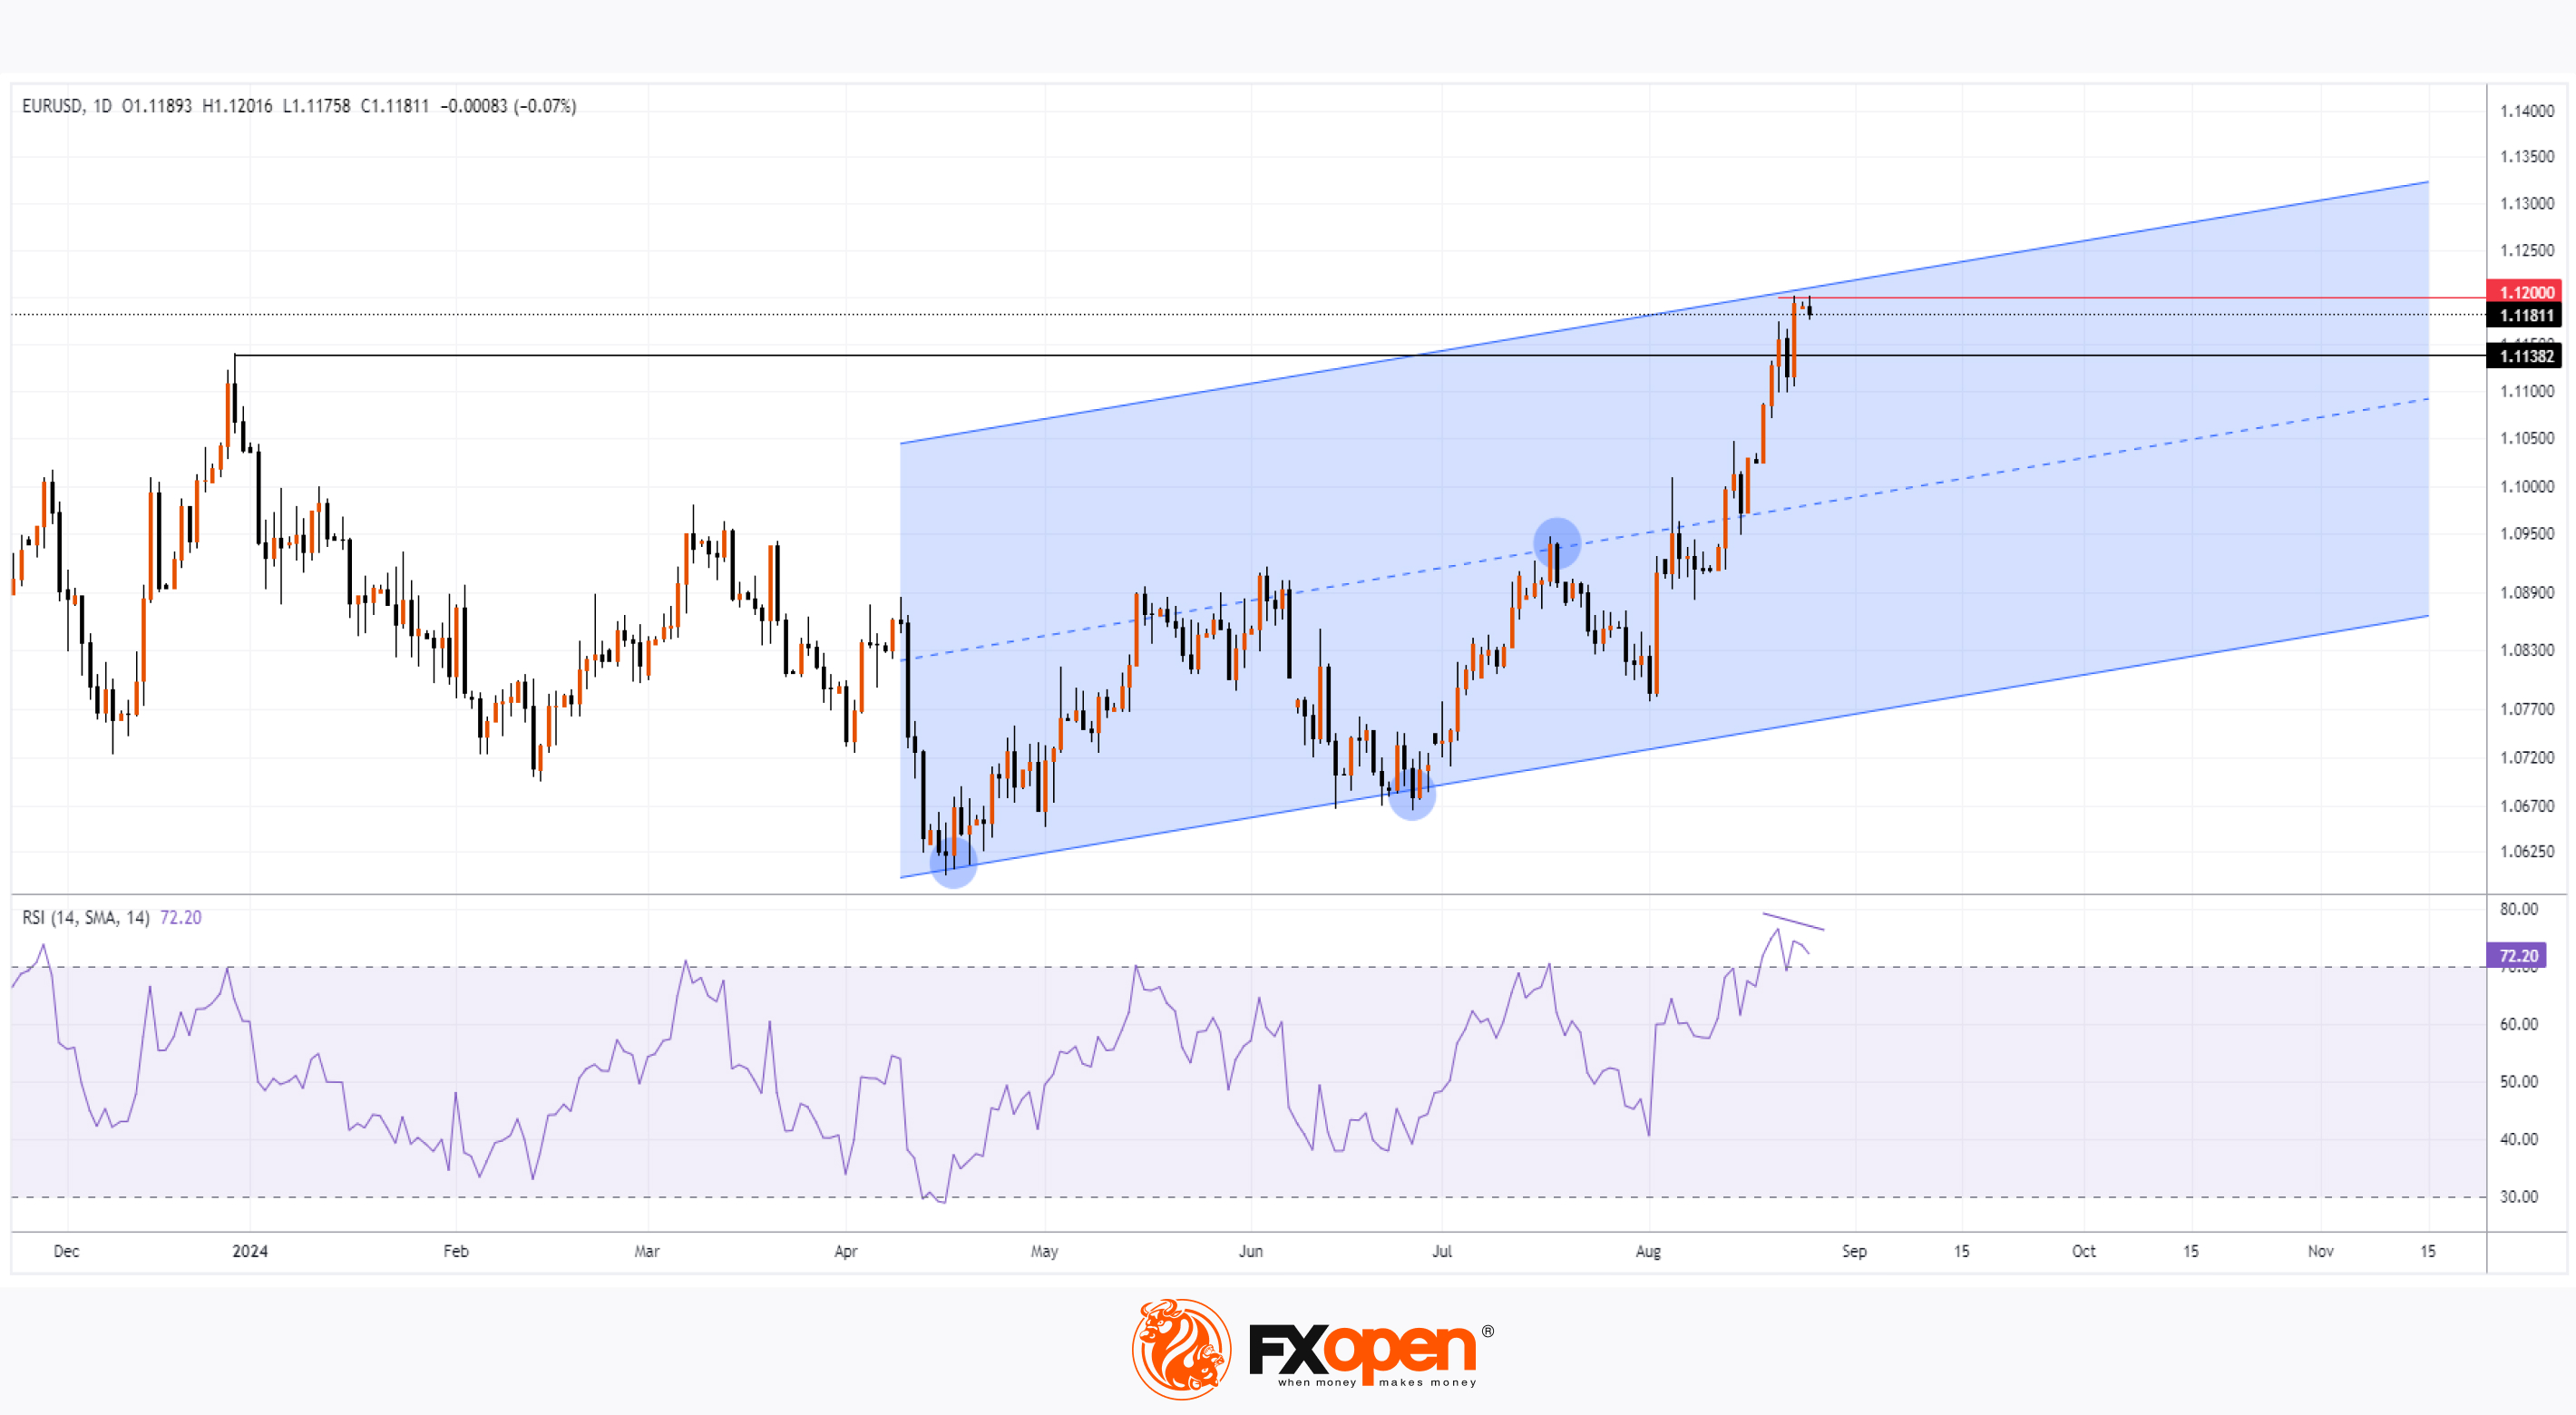
→ Since April, the exchange rate fluctuations have been forming an upward channel (marked in blue, with support points indicated by circles);
→ Within this channel, the price is near the upper boundary, from which resistance can be expected;
→ Additionally, the 1.12 level shows signs of resistance—the price slightly exceeded it before quickly falling back below. Signs of false bullish breakouts indicate weak demand.
The possible exhaustion of buyers seems plausible, considering that:
→ The EUR/USD exchange rate increased by approximately 3.7% in August, surpassing the December 2023 high of around 1.114;
→ The RSI indicator is in the overbought zone, forming a bearish divergence.
Therefore, traders should be prepared for the price to follow a scenario involving a pullback after the rally to the 1.12 level. Volatile movements may occur following this week’s news releases:
→ The US GDP data is scheduled for release at 15:30 GMT+3 on Thursday;
→ The Eurozone inflation data is scheduled for release at 12:00 GMT+3 on Friday.
Trade over 50 forex markets 24 hours a day with FXOpen. Take advantage of low commissions, deep liquidity, and spreads from 0.0 pips. Open your FXOpen account now or learn more about trading forex with FXOpen.
CFDs are complex instruments and come with a high risk of losing your money.
This article represents the opinion of the Companies operating under the FXOpen brand only. It is not to be construed as an offer, solicitation, or recommendation with respect to products and services provided by the Companies operating under the FXOpen brand, nor is it to be considered financial advice.
The EUR/USD Exchange Rate Has Risen to the 1.12 Level
During his speech at Jackson Hole, as reported by Reuters, the Fed Chair unexpectedly focused heavily on the US labour market. Powell stated that weaker employment prospects are unacceptable. As a result of this emphasis, market expectations for a rate cut in September decreased, and the value of the US dollar increased:
→ On Monday morning, the dollar index is recovering from the year's lows, which were reached on Friday;
→ Accordingly, other currencies are depreciating against the USD.
As shown by the technical analysis of the EUR/USD chart:
→ Since April, the exchange rate fluctuations have been forming an upward channel (marked in blue, with support points indicated by circles);
→ Within this channel, the price is near the upper boundary, from which resistance can be expected;
→ Additionally, the 1.12 level shows signs of resistance—the price slightly exceeded it before quickly falling back below. Signs of false bullish breakouts indicate weak demand.
The possible exhaustion of buyers seems plausible, considering that:
→ The EUR/USD exchange rate increased by approximately 3.7% in August, surpassing the December 2023 high of around 1.114;
→ The RSI indicator is in the overbought zone, forming a bearish divergence.
Therefore, traders should be prepared for the price to follow a scenario involving a pullback after the rally to the 1.12 level. Volatile movements may occur following this week’s news releases:
→ The US GDP data is scheduled for release at 15:30 GMT+3 on Thursday;
→ The Eurozone inflation data is scheduled for release at 12:00 GMT+3 on Friday.
Trade over 50 forex markets 24 hours a day with FXOpen. Take advantage of low commissions, deep liquidity, and spreads from 0.0 pips. Open your FXOpen account now or learn more about trading forex with FXOpen.
CFDs are complex instruments and come with a high risk of losing your money.
This article represents the opinion of the Companies operating under the FXOpen brand only. It is not to be construed as an offer, solicitation, or recommendation with respect to products and services provided by the Companies operating under the FXOpen brand, nor is it to be considered financial advice.
👍2
#brentoil #crudeoil #oilprices #marketanalysis
Brent Crude Oil Bounces Off Key Support
Analysing the oil market on the XBR/USD chart on 20 August, when Brent was trading around $77 per barrel, we:
→ Identified resistance around $81.60;
→ Noted that the price was approaching a key support level (shown by the yellow line), which has been in effect for several months;
→ Speculated that bears might attempt to break the August low.
This attempt by the bears can be seen in the price drop to $75.55 on 22 August.
However, the August low was not breached, as the yellow support line had an impact on the price—Brent crude oil reversed upwards (indicated by an arrow).
As shown on the XBR/USD chart, Monday's trading opened with a bullish gap, and the price is near $79 per barrel.
The price increase was supported by news of a potential escalation of conflict in the Middle East. According to Reuters:
→ On Sunday evening, Israel issued new evacuation orders for the central part of the Gaza Strip, forcing more families to flee;
→ Israel and Hezbollah exchanged heavy rocket fire;
→ Hezbollah's leader mentioned the possibility of further strikes on Israel.
From a technical analysis perspective of the XBR/USD chart today:
→ The price is forming a downward channel (shown in red) and is approaching its upper boundary, which could provide resistance;
→ Resistance could also be expected at the psychological level of $80 per barrel.
This leaves some room, albeit limited, for further growth. However, bulls will need to demonstrate their persistence when they encounter a block of resistance around the $80 level. It is possible that the RSI may be in the overbought zone at that point.
Whether Brent crude oil can break through the upper boundary of the downward channel in the coming days will largely depend on the nature of the news from the Middle East.
Start trading commodities with tight spreads. Open your trading account now or learn more about trading commodity CFDs with FXOpen.
CFDs are complex instruments and come with a high risk of losing your money.
This article represents the opinion of the Companies operating under the FXOpen brand only. It is not to be construed as an offer, solicitation, or recommendation with respect to products and services provided by the Companies operating under the FXOpen brand, nor is it to be considered financial advice.
Brent Crude Oil Bounces Off Key Support
Analysing the oil market on the XBR/USD chart on 20 August, when Brent was trading around $77 per barrel, we:
→ Identified resistance around $81.60;
→ Noted that the price was approaching a key support level (shown by the yellow line), which has been in effect for several months;
→ Speculated that bears might attempt to break the August low.
This attempt by the bears can be seen in the price drop to $75.55 on 22 August.
However, the August low was not breached, as the yellow support line had an impact on the price—Brent crude oil reversed upwards (indicated by an arrow).
As shown on the XBR/USD chart, Monday's trading opened with a bullish gap, and the price is near $79 per barrel.
The price increase was supported by news of a potential escalation of conflict in the Middle East. According to Reuters:
→ On Sunday evening, Israel issued new evacuation orders for the central part of the Gaza Strip, forcing more families to flee;
→ Israel and Hezbollah exchanged heavy rocket fire;
→ Hezbollah's leader mentioned the possibility of further strikes on Israel.
From a technical analysis perspective of the XBR/USD chart today:
→ The price is forming a downward channel (shown in red) and is approaching its upper boundary, which could provide resistance;
→ Resistance could also be expected at the psychological level of $80 per barrel.
This leaves some room, albeit limited, for further growth. However, bulls will need to demonstrate their persistence when they encounter a block of resistance around the $80 level. It is possible that the RSI may be in the overbought zone at that point.
Whether Brent crude oil can break through the upper boundary of the downward channel in the coming days will largely depend on the nature of the news from the Middle East.
Start trading commodities with tight spreads. Open your trading account now or learn more about trading commodity CFDs with FXOpen.
CFDs are complex instruments and come with a high risk of losing your money.
This article represents the opinion of the Companies operating under the FXOpen brand only. It is not to be construed as an offer, solicitation, or recommendation with respect to products and services provided by the Companies operating under the FXOpen brand, nor is it to be considered financial advice.
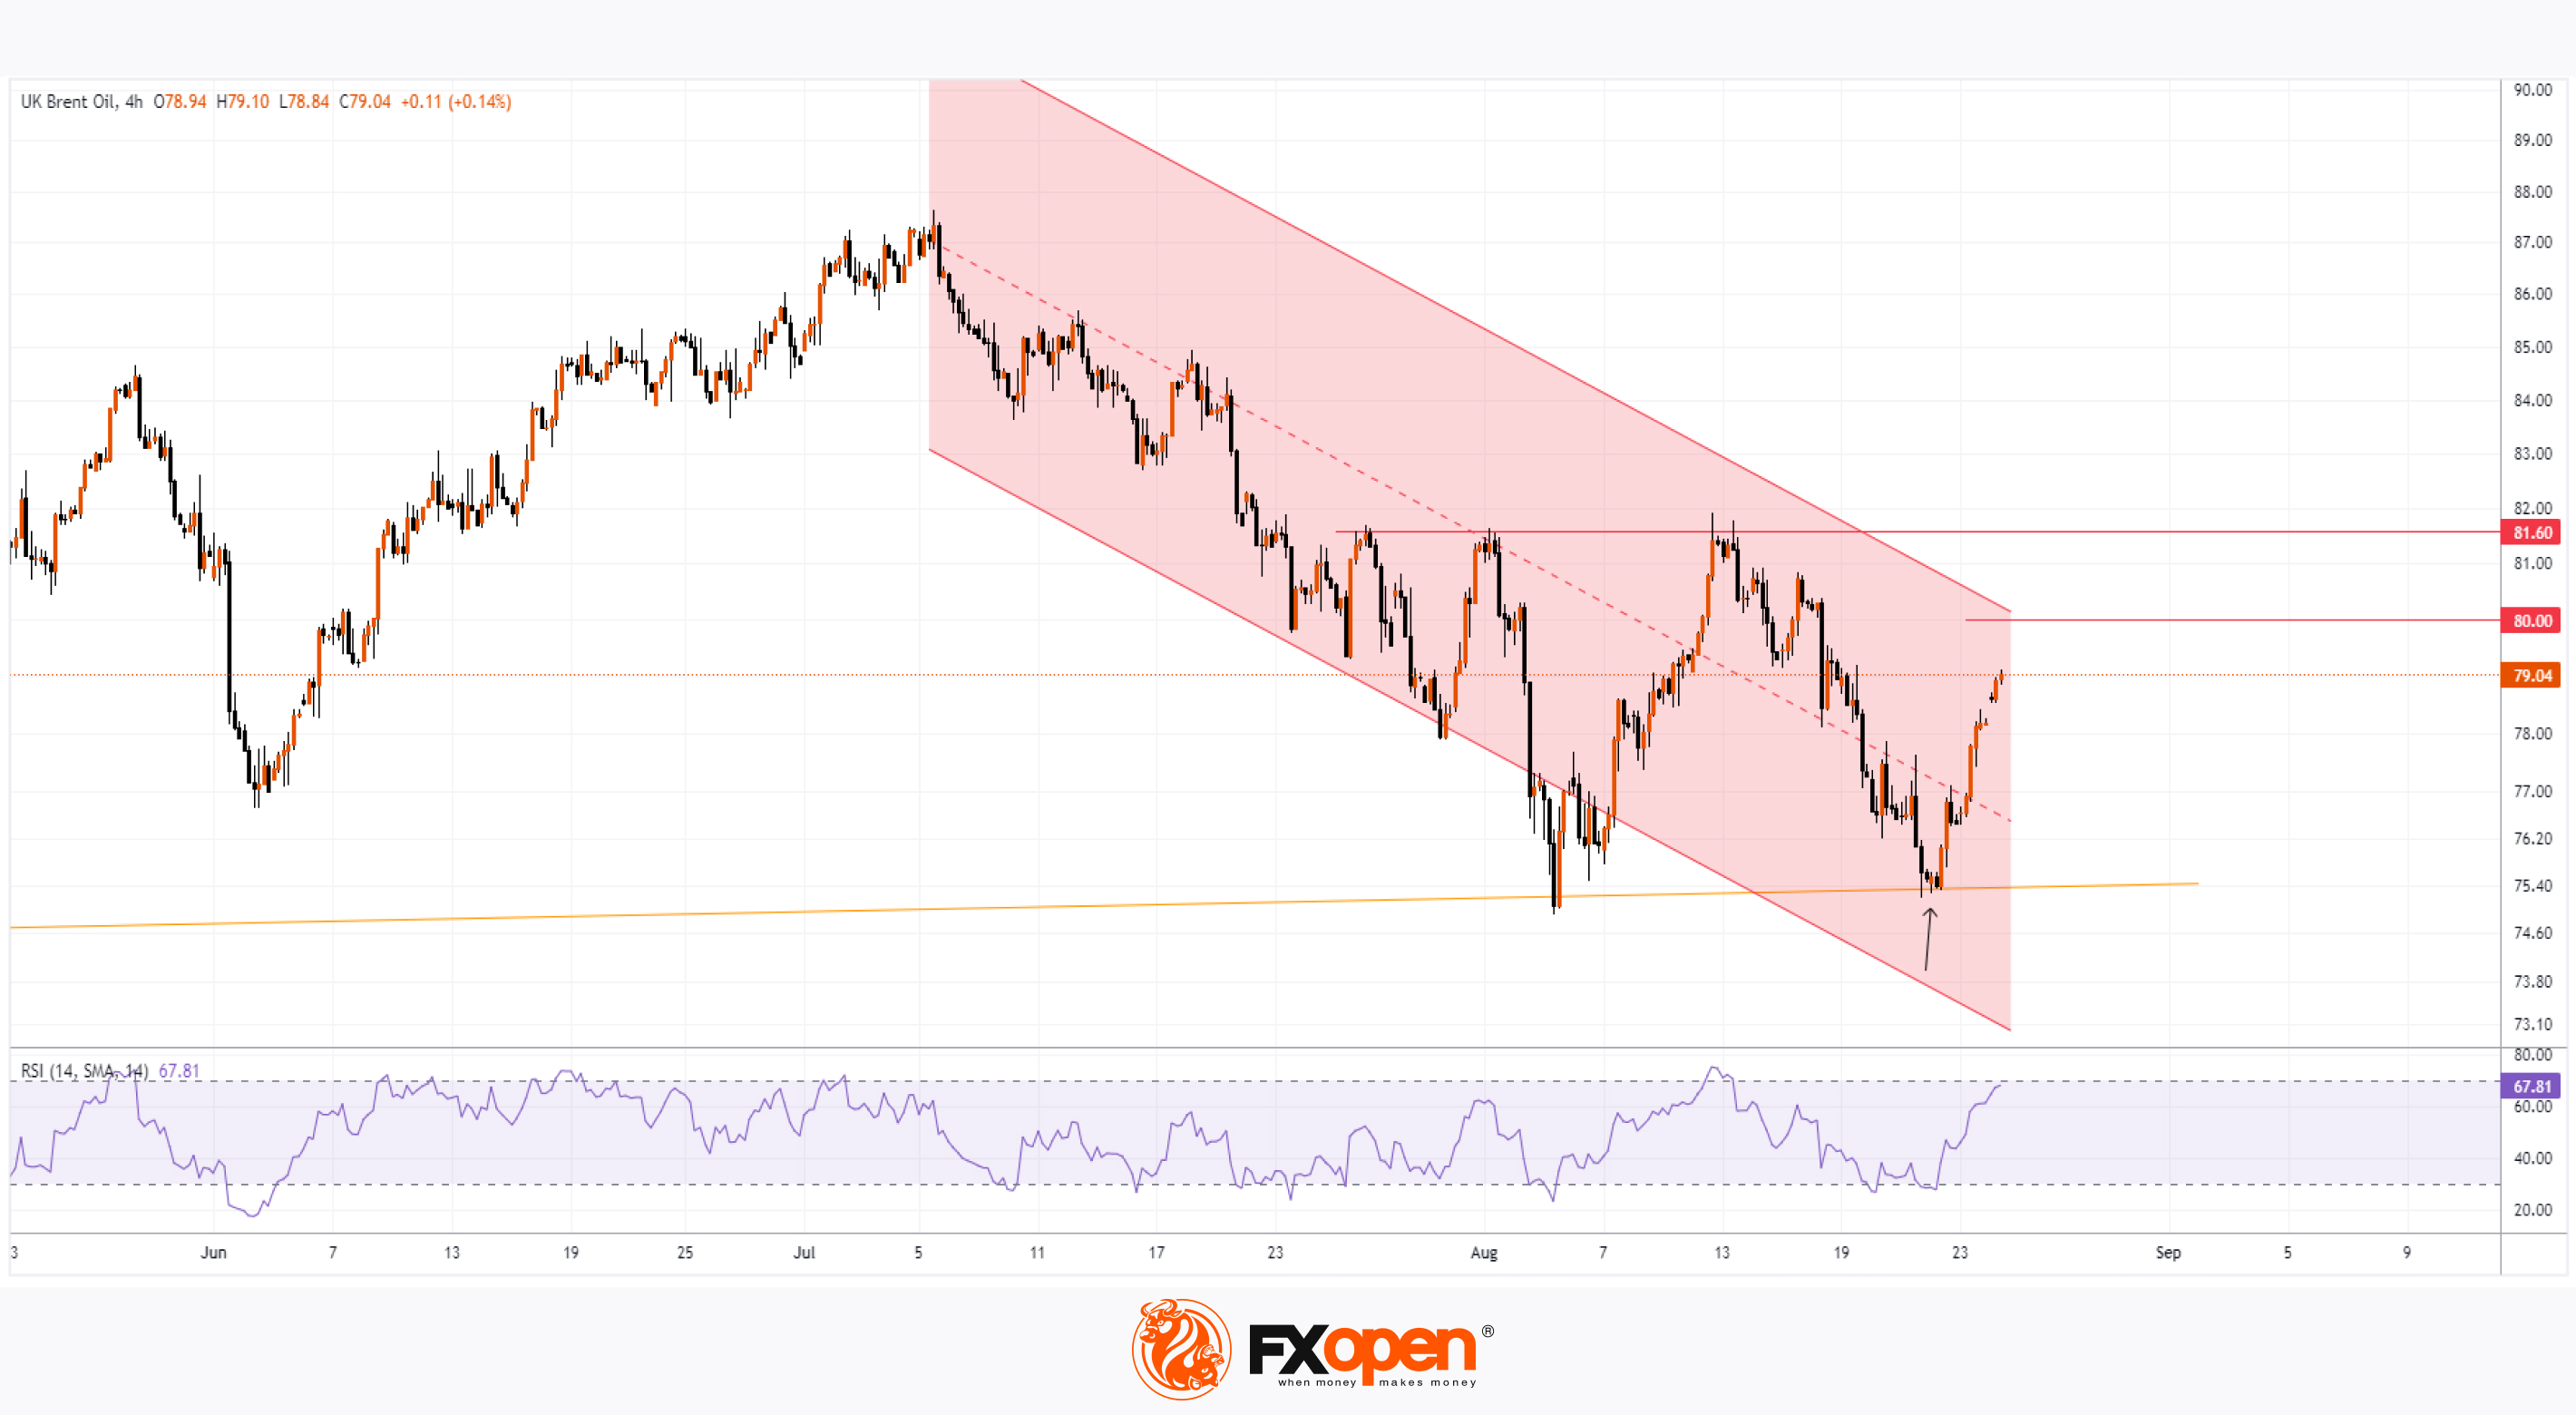
👍3
#marketanalysis #MarketNews #stockmarket #stocktrading
Broadcom Inc. (AVGO) Shares Drop Over 4%
As shown by the chart, yesterday, shares of Broadcom Inc. (AVGO)—a US technology company ranked in the top 10 by market capitalisation—were among the worst performers in terms of price movement.
This is a warning sign for those investing in semiconductor manufacturers, considering that:
→ Tomorrow, data on Nvidia’s second-quarter performance will be released;
→ Since mid-June, AVGO's share price has been underperforming the stock index.
A technical analysis of the AVGO chart provides further grounds for concern:
→ In 2024, the price formed an ascending channel (shown in blue), which remains relevant for now, despite a drop below the lower boundary on 5 August.
→ Price action in August indicates (marked by an arrow) that the median line of this channel, reinforced by the psychological level at $170, has now assumed the role of resistance.
→ In mid-July, there was a 10-for-1 stock split. It was expected that this would make investments in Broadcom Inc. more accessible to a wider range of market participants, but in reality, the price has fallen since then.
→ Since mid-June, when the RSI indicated extreme overbought conditions following the release of first-quarter results (a sign of market hype), the price has been increasingly forming the outlines of a descending channel (shown in red).
If AVGO's share price continues to underperform the market, it could lead to further bearish attacks on the lower boundary of the ascending channel.
Meanwhile, analysts remain optimistic. According to TipRanks:
→ 23 out of 24 Wall Street analysts recommend buying AVGO shares;
→ The average price target for AVGO shares is $196 (a 23% increase from current levels) within the next 12 months.
Trade global index CFDs with zero commission and tight spreads. Open your FXOpen account now or learn more about trading index CFDs with FXOpen.
CFDs are complex instruments and come with a high risk of losing your money.
This article represents the opinion of the Companies operating under the FXOpen brand only. It is not to be construed as an offer, solicitation, or recommendation with respect to products and services provided by the Companies operating under the FXOpen brand, nor is it to be considered financial advice.
Broadcom Inc. (AVGO) Shares Drop Over 4%
As shown by the chart, yesterday, shares of Broadcom Inc. (AVGO)—a US technology company ranked in the top 10 by market capitalisation—were among the worst performers in terms of price movement.
This is a warning sign for those investing in semiconductor manufacturers, considering that:
→ Tomorrow, data on Nvidia’s second-quarter performance will be released;
→ Since mid-June, AVGO's share price has been underperforming the stock index.
A technical analysis of the AVGO chart provides further grounds for concern:
→ In 2024, the price formed an ascending channel (shown in blue), which remains relevant for now, despite a drop below the lower boundary on 5 August.
→ Price action in August indicates (marked by an arrow) that the median line of this channel, reinforced by the psychological level at $170, has now assumed the role of resistance.
→ In mid-July, there was a 10-for-1 stock split. It was expected that this would make investments in Broadcom Inc. more accessible to a wider range of market participants, but in reality, the price has fallen since then.
→ Since mid-June, when the RSI indicated extreme overbought conditions following the release of first-quarter results (a sign of market hype), the price has been increasingly forming the outlines of a descending channel (shown in red).
If AVGO's share price continues to underperform the market, it could lead to further bearish attacks on the lower boundary of the ascending channel.
Meanwhile, analysts remain optimistic. According to TipRanks:
→ 23 out of 24 Wall Street analysts recommend buying AVGO shares;
→ The average price target for AVGO shares is $196 (a 23% increase from current levels) within the next 12 months.
Trade global index CFDs with zero commission and tight spreads. Open your FXOpen account now or learn more about trading index CFDs with FXOpen.
CFDs are complex instruments and come with a high risk of losing your money.
This article represents the opinion of the Companies operating under the FXOpen brand only. It is not to be construed as an offer, solicitation, or recommendation with respect to products and services provided by the Companies operating under the FXOpen brand, nor is it to be considered financial advice.
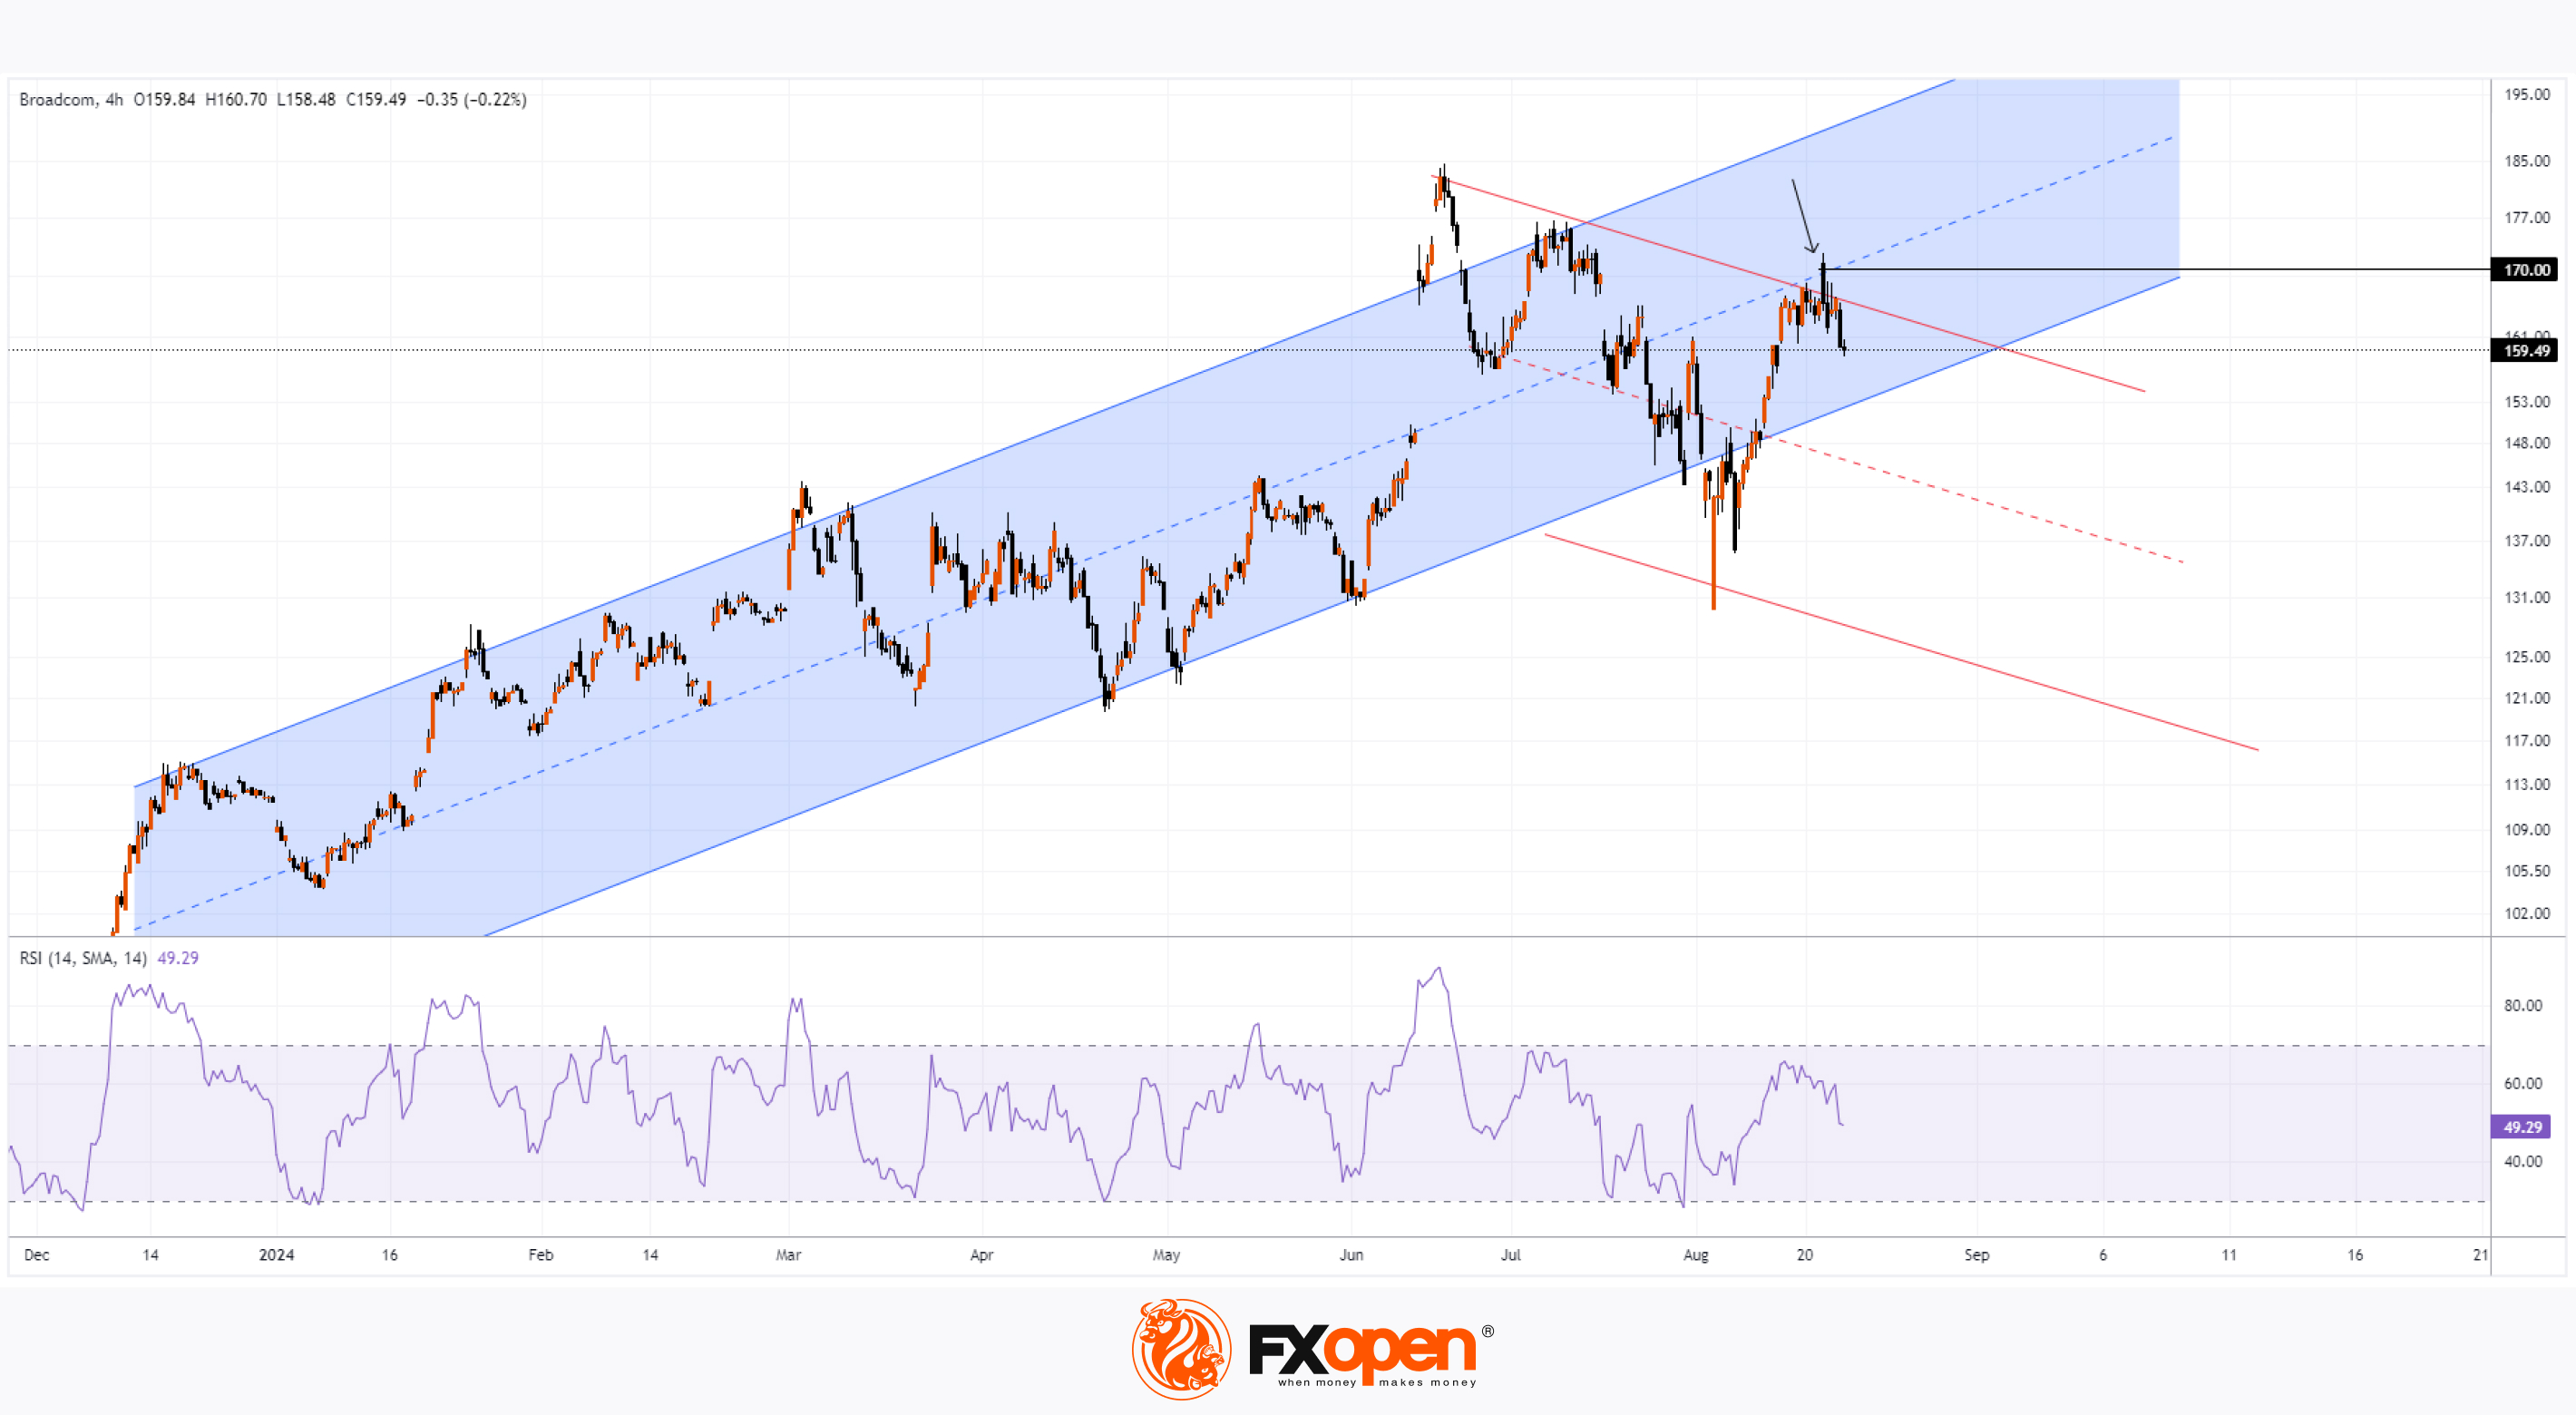
👍2