
#AMZN #stockmarket #marketanalysis #stocktrading
Analysis of AMZN Stock: Price at 1.5-Month Low
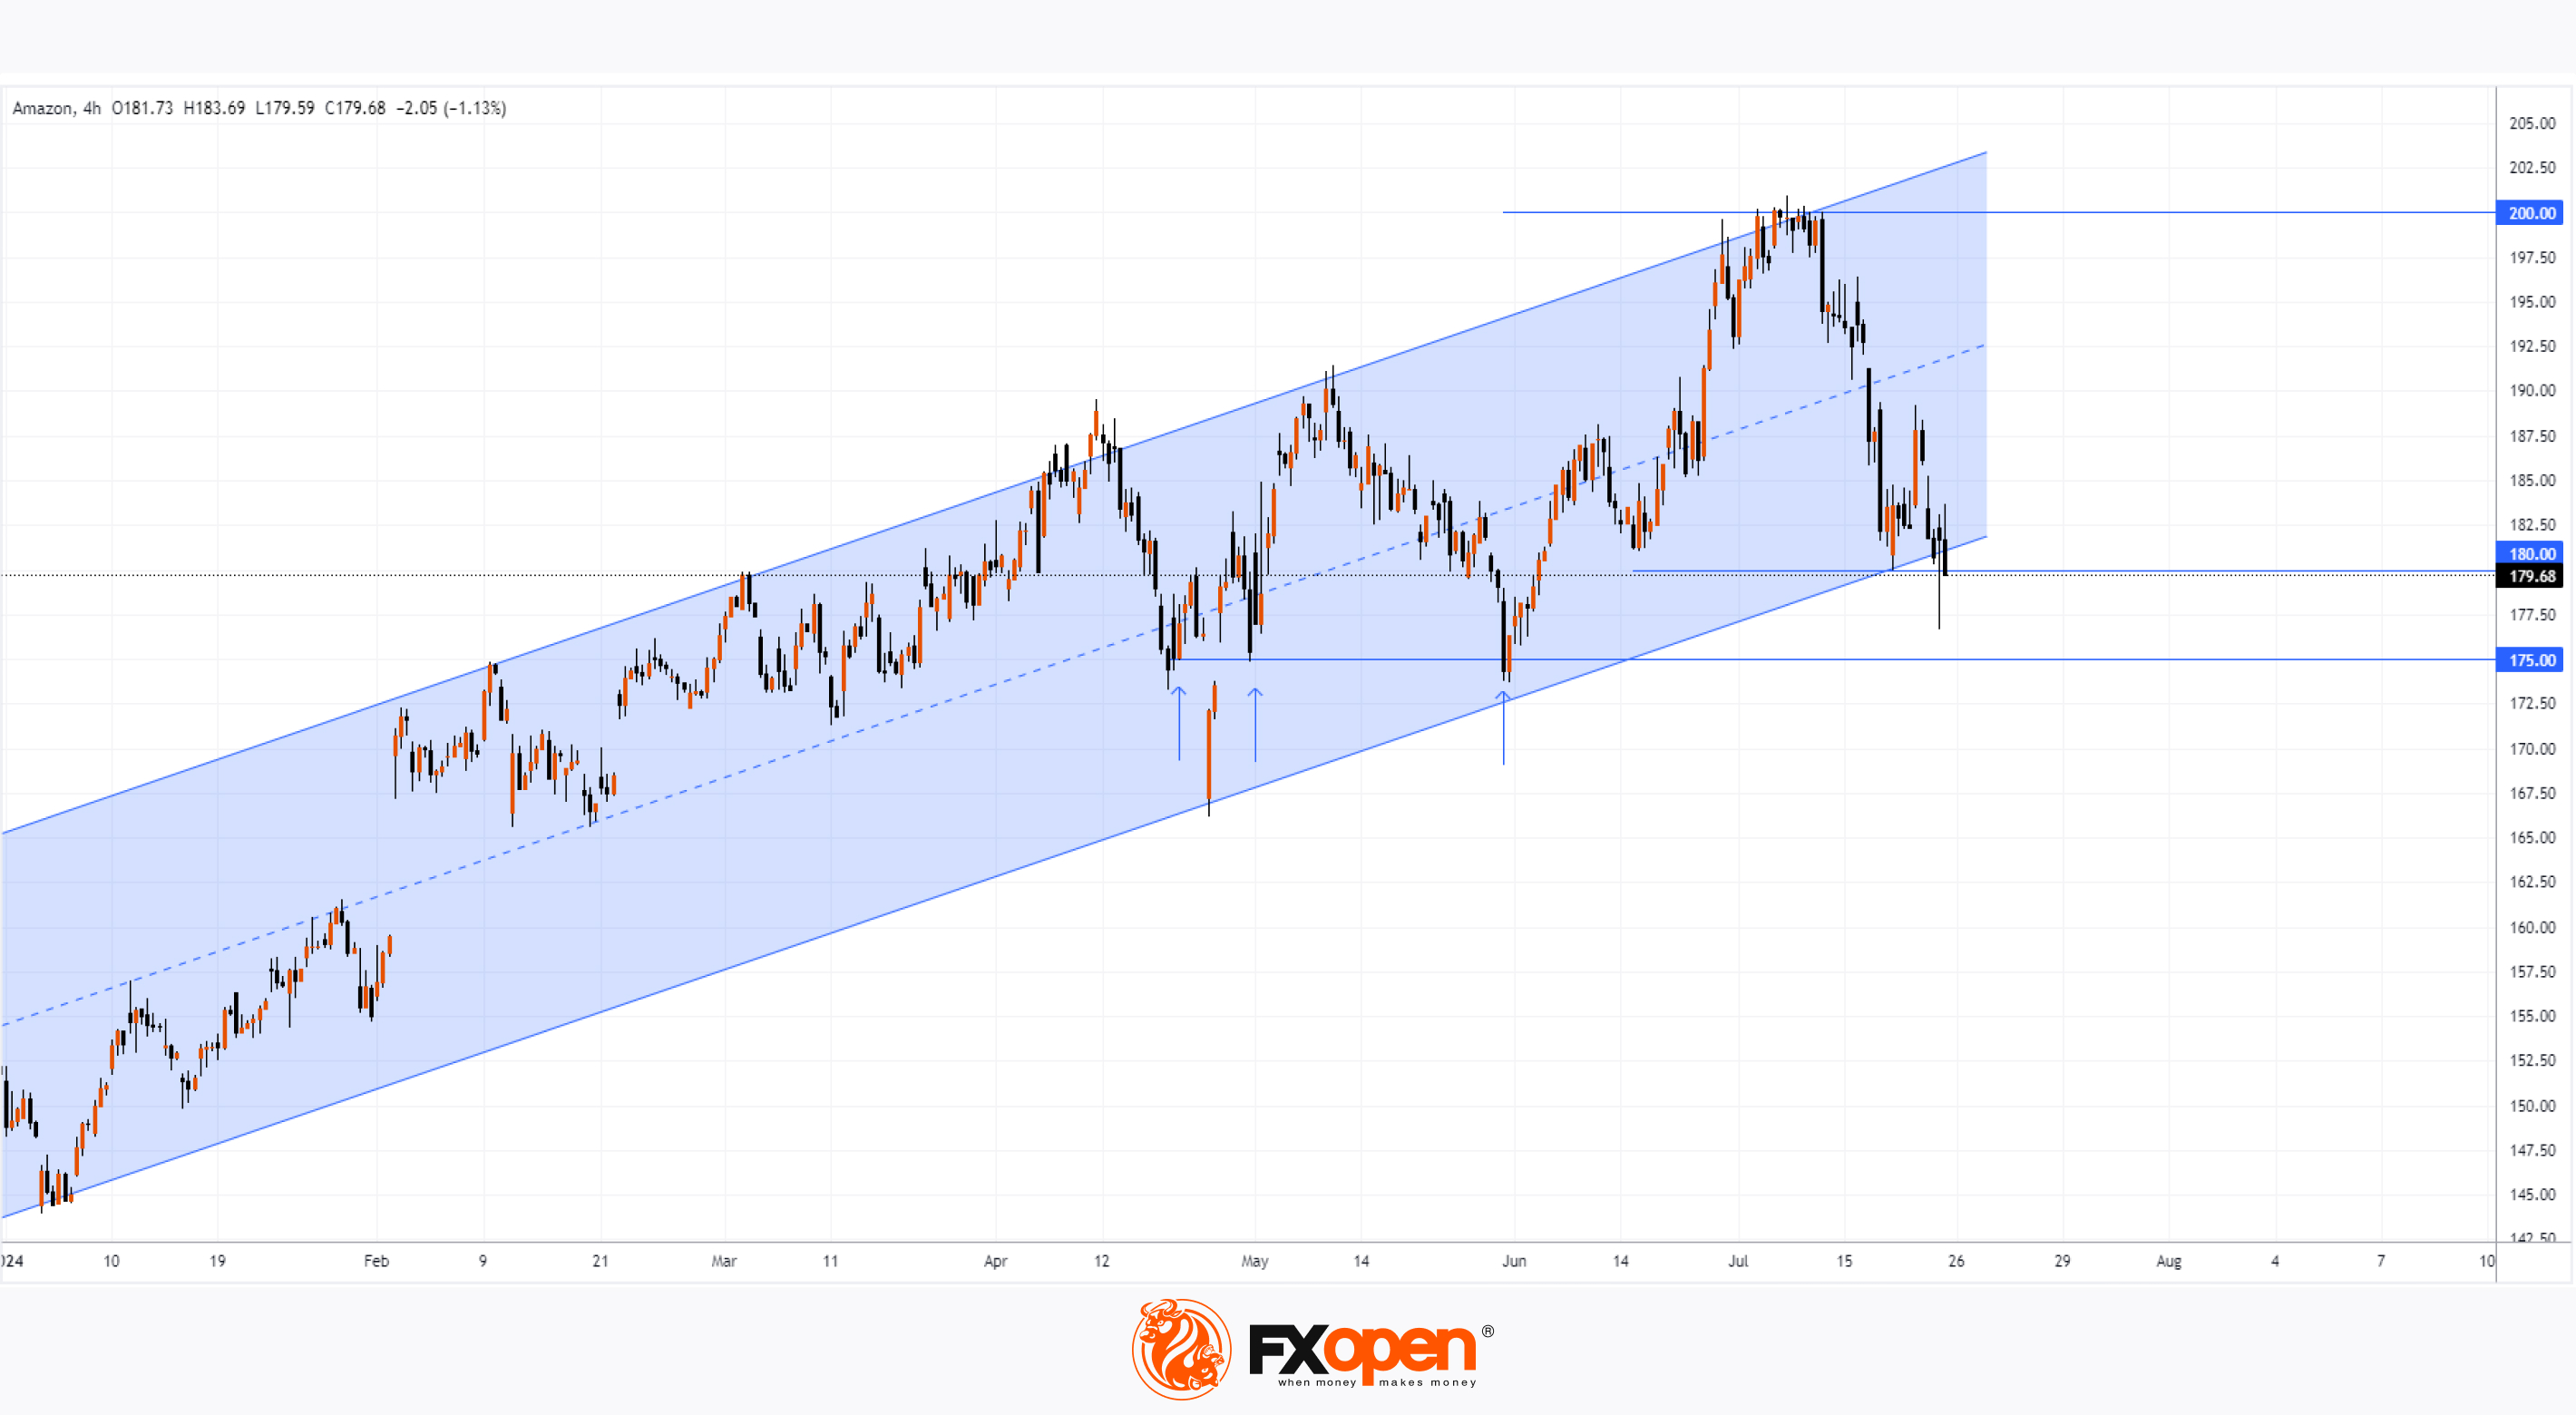
As shown in the AMZN chart, the stock price dropped below:
→ the psychological level of $180;
→ the mid-June interim low.
The last time AMZN traded below $180 was in early June. Thus, AMZN has faced sell-offs, similar to other tech stocks whose charts we've published this week. A widely mentioned reason for the sell-offs is investor rotation, moving capital from overbought tech stocks to shares in other sectors.
Will AMZN's price drop further?
Fundamentally, bulls might find hope in speculation that:
→ the company might start paying dividends. Rumours suggest the company has accumulated $100 billion in cash;
→ Amazon in Austin, Texas, is developing its own AI chip to compete with Nvidia.
Technical analysis of the AMZN stock chart also provides reasons to expect a recovery (at least in the short term):
→ The price is near the lower boundary of an ascending channel that has been in place in 2024, which may act as support.
→ The false breach of the $180 psychological level could also support the price by altering the supply-demand balance.
→ Below yesterday's low is the $175 level, which has repeatedly shown support in 2024, as indicated by arrows.
A bounce from these supports could provide valuable insights into the bulls' aggressiveness.
Meanwhile, forecasts are optimistic. According to TipRanks, all 44 Wall Street analysts recommend buying AMZN stock, with an average price target of $224.60 (nearly +25% from current levels) within 12 months, surpassing the current high around the psychological level of $200.
Note that analysts' opinions may change after the Q2 earnings report, scheduled for August 1.
Trade global index CFDs with zero commission and tight spreads. Open your FXOpen account now or learn more about trading index CFDs with FXOpen.
CFDs are complex instruments and come with a high risk of losing your money.
This article represents the opinion of the Companies operating under the FXOpen brand only. It is not to be construed as an offer, solicitation, or recommendation with respect to products and services provided by the Companies operating under the FXOpen brand, nor is it to be considered financial advice.
Analysis of AMZN Stock: Price at 1.5-Month Low
As shown in the AMZN chart, the stock price dropped below:
→ the psychological level of $180;
→ the mid-June interim low.
The last time AMZN traded below $180 was in early June. Thus, AMZN has faced sell-offs, similar to other tech stocks whose charts we've published this week. A widely mentioned reason for the sell-offs is investor rotation, moving capital from overbought tech stocks to shares in other sectors.
Will AMZN's price drop further?
Fundamentally, bulls might find hope in speculation that:
→ the company might start paying dividends. Rumours suggest the company has accumulated $100 billion in cash;
→ Amazon in Austin, Texas, is developing its own AI chip to compete with Nvidia.
Technical analysis of the AMZN stock chart also provides reasons to expect a recovery (at least in the short term):
→ The price is near the lower boundary of an ascending channel that has been in place in 2024, which may act as support.
→ The false breach of the $180 psychological level could also support the price by altering the supply-demand balance.
→ Below yesterday's low is the $175 level, which has repeatedly shown support in 2024, as indicated by arrows.
A bounce from these supports could provide valuable insights into the bulls' aggressiveness.
Meanwhile, forecasts are optimistic. According to TipRanks, all 44 Wall Street analysts recommend buying AMZN stock, with an average price target of $224.60 (nearly +25% from current levels) within 12 months, surpassing the current high around the psychological level of $200.
Note that analysts' opinions may change after the Q2 earnings report, scheduled for August 1.
Trade global index CFDs with zero commission and tight spreads. Open your FXOpen account now or learn more about trading index CFDs with FXOpen.
CFDs are complex instruments and come with a high risk of losing your money.
This article represents the opinion of the Companies operating under the FXOpen brand only. It is not to be construed as an offer, solicitation, or recommendation with respect to products and services provided by the Companies operating under the FXOpen brand, nor is it to be considered financial advice.
👍2
#AUDUSD #marketanalysis #forex #forextrading
Analysis of AUD/USD: Exchange Rate Falls to Early May Low
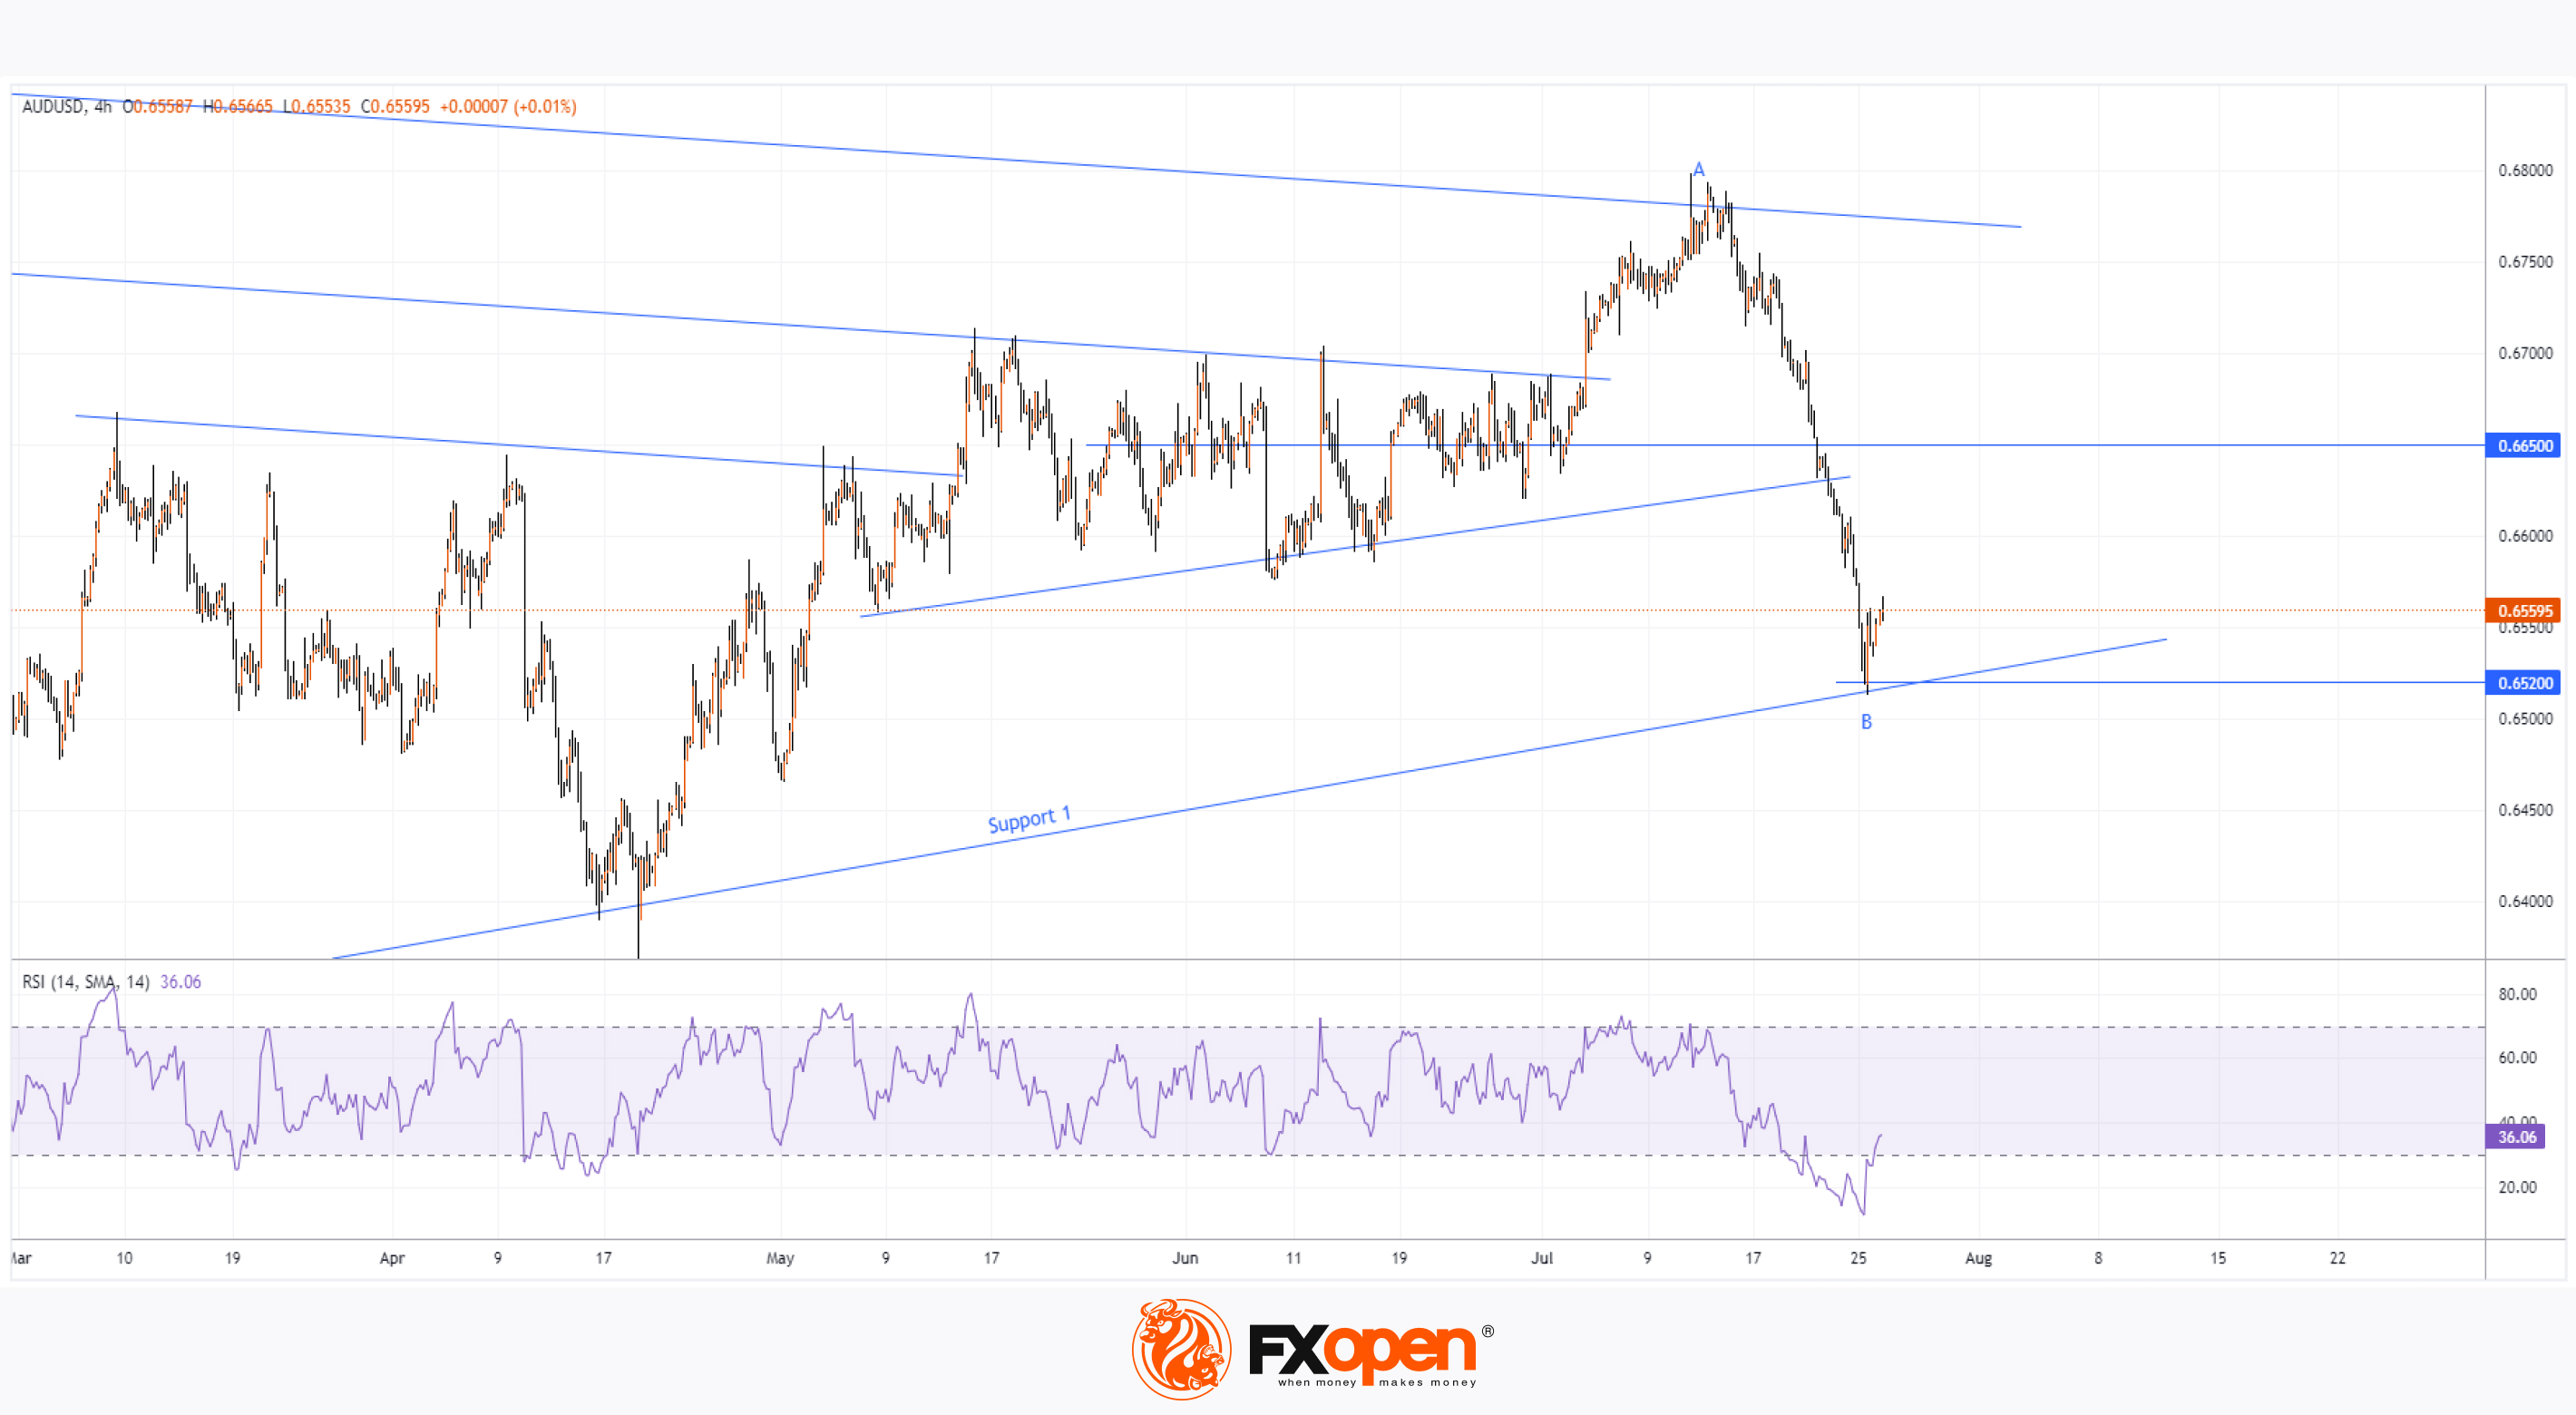
As indicated by the 4-hour AUD/USD chart today: the rate fell below 0.652, a level last seen on May 2; the RSI indicator dropped below 15, a level last seen during the panic over the spread of COVID-19 in spring 2020.
The weakening of the Australian dollar could be linked to participants' expectations of upcoming news: the US Core PCE Price Index will be published today at 15:30 GMT+3; next week, Australian inflation data and the Federal Reserve's interest rate decision (both events scheduled for Wednesday) will be released. Is further decline in the AUD/USD rate possible? It is possible that the release of significant news could trigger a surge in volatility, causing the AUD/USD rate to fall below the recent monthly low of 0.652.
However, technical analysis of the AUD/USD chart suggests a potential recovery scenario: The sequence of local extremes in the first half of 2024 forms a structure resembling a narrowing triangle. It appears the central axis is around 0.0665, and the bounce from low B indicates support from the Support 1 line.
Therefore, it is reasonable to assume that, in the context of increased volatility in the forex market, the AUD/USD rate has significantly deviated from the average values around 0.0665. At current quotes, some participants might want to lock in profits from short positions and/or position themselves for a short-term recovery of the "Aussie" from the oversold zone, following a 4% drop from A to B in 10 days.
Trade over 50 forex markets 24 hours a day with FXOpen. Take advantage of low commissions, deep liquidity, and spreads from 0.0 pips. Open your FXOpen account now or learn more about trading forex with FXOpen.
CFDs are complex instruments and come with a high risk of losing your money.
This article represents the opinion of the Companies operating under the FXOpen brand only. It is not to be construed as an offer, solicitation, or recommendation with respect to products and services provided by the Companies operating under the FXOpen brand, nor is it to be considered financial advice.
Analysis of AUD/USD: Exchange Rate Falls to Early May Low
As indicated by the 4-hour AUD/USD chart today: the rate fell below 0.652, a level last seen on May 2; the RSI indicator dropped below 15, a level last seen during the panic over the spread of COVID-19 in spring 2020.
The weakening of the Australian dollar could be linked to participants' expectations of upcoming news: the US Core PCE Price Index will be published today at 15:30 GMT+3; next week, Australian inflation data and the Federal Reserve's interest rate decision (both events scheduled for Wednesday) will be released. Is further decline in the AUD/USD rate possible? It is possible that the release of significant news could trigger a surge in volatility, causing the AUD/USD rate to fall below the recent monthly low of 0.652.
However, technical analysis of the AUD/USD chart suggests a potential recovery scenario: The sequence of local extremes in the first half of 2024 forms a structure resembling a narrowing triangle. It appears the central axis is around 0.0665, and the bounce from low B indicates support from the Support 1 line.
Therefore, it is reasonable to assume that, in the context of increased volatility in the forex market, the AUD/USD rate has significantly deviated from the average values around 0.0665. At current quotes, some participants might want to lock in profits from short positions and/or position themselves for a short-term recovery of the "Aussie" from the oversold zone, following a 4% drop from A to B in 10 days.
Trade over 50 forex markets 24 hours a day with FXOpen. Take advantage of low commissions, deep liquidity, and spreads from 0.0 pips. Open your FXOpen account now or learn more about trading forex with FXOpen.
CFDs are complex instruments and come with a high risk of losing your money.
This article represents the opinion of the Companies operating under the FXOpen brand only. It is not to be construed as an offer, solicitation, or recommendation with respect to products and services provided by the Companies operating under the FXOpen brand, nor is it to be considered financial advice.
👍2
#Nasdaq #stockmarket #EURUSD #USDCHF #OilPrices #GOOGL #CrudeOil #investing
Weekly Market Wrap With Gary Thomson: Nasdaq, EUR/USD, USD/CHF, Brent Crude Oil, Googl Shares
Get the latest scoop on the week's hottest headlines, all in one convenient video. Join Gary Thomson, the COO of FXOpen UK, as he breaks down the most significant news reports and shares his expert insights.
🔸Nasdaq Composite: Worst Session since Late 2022
🔸Market Analysis: EUR/USD Trims Gains While USD/CHF Regains Strength
🔸Brent Crude Oil Price is Declining amid De-escalation in the Middle East
🔸Googl Shares Decline after Earnings Report
Stay in the know and empower yourself with our short, yet power-packed video. Watch it now and stay updated with FXOpen. Don't miss out on this invaluable opportunity to sharpen your trading skills and make informed decisions.
https://cutt.ly/geluwM3r
To take advantage of price fluctuations in the foreign exchange markets, consider enlisting the services of a reliable broker like FXOpen.
⚠️
This forecast represents FXOpen Companies opinion only, it should not be construed as an offer, invitation or recommendation in respect to FXOpen Companies products and services or as financial advice.
Weekly Market Wrap With Gary Thomson: Nasdaq, EUR/USD, USD/CHF, Brent Crude Oil, Googl Shares
Get the latest scoop on the week's hottest headlines, all in one convenient video. Join Gary Thomson, the COO of FXOpen UK, as he breaks down the most significant news reports and shares his expert insights.
🔸Nasdaq Composite: Worst Session since Late 2022
🔸Market Analysis: EUR/USD Trims Gains While USD/CHF Regains Strength
🔸Brent Crude Oil Price is Declining amid De-escalation in the Middle East
🔸Googl Shares Decline after Earnings Report
Stay in the know and empower yourself with our short, yet power-packed video. Watch it now and stay updated with FXOpen. Don't miss out on this invaluable opportunity to sharpen your trading skills and make informed decisions.
https://cutt.ly/geluwM3r
To take advantage of price fluctuations in the foreign exchange markets, consider enlisting the services of a reliable broker like FXOpen.
⚠️
This forecast represents FXOpen Companies opinion only, it should not be construed as an offer, invitation or recommendation in respect to FXOpen Companies products and services or as financial advice.
YouTube
Weekly Market Wrap With Gary Thomson: Nasdaq, EUR/USD, USD/CHF, Crude Oil, Alphabet Inc. Shares
Get the latest scoop on the week's hottest headlines, all in one convenient video. Join Gary Thomson, the COO of FXOpen UK, as he breaks down the most significant news reports and shares his expert insights.
00:27 Nasdaq Composite: Worst Session since Late…
00:27 Nasdaq Composite: Worst Session since Late…
👍2
#marketanalysis #MarketNews
The Price of Natural Gas Finds Support. But for How Long?
On 21 June, we wrote that the trend in the market was weakening, noting that:
→ Forecasts of a hotter summer, published during April-May, led to a sustained bullish trend in the natural gas market.
→ According to the technical analysis of the 4-hour XNG/USD chart and the signs of weakness that have formed on it, the level of 3.160 appears to sufficiently account for the risks of an extremely hot summer.
→ Bears might push the price to the lower boundary of the ascending trend channel.
Since then, the price of natural gas has:
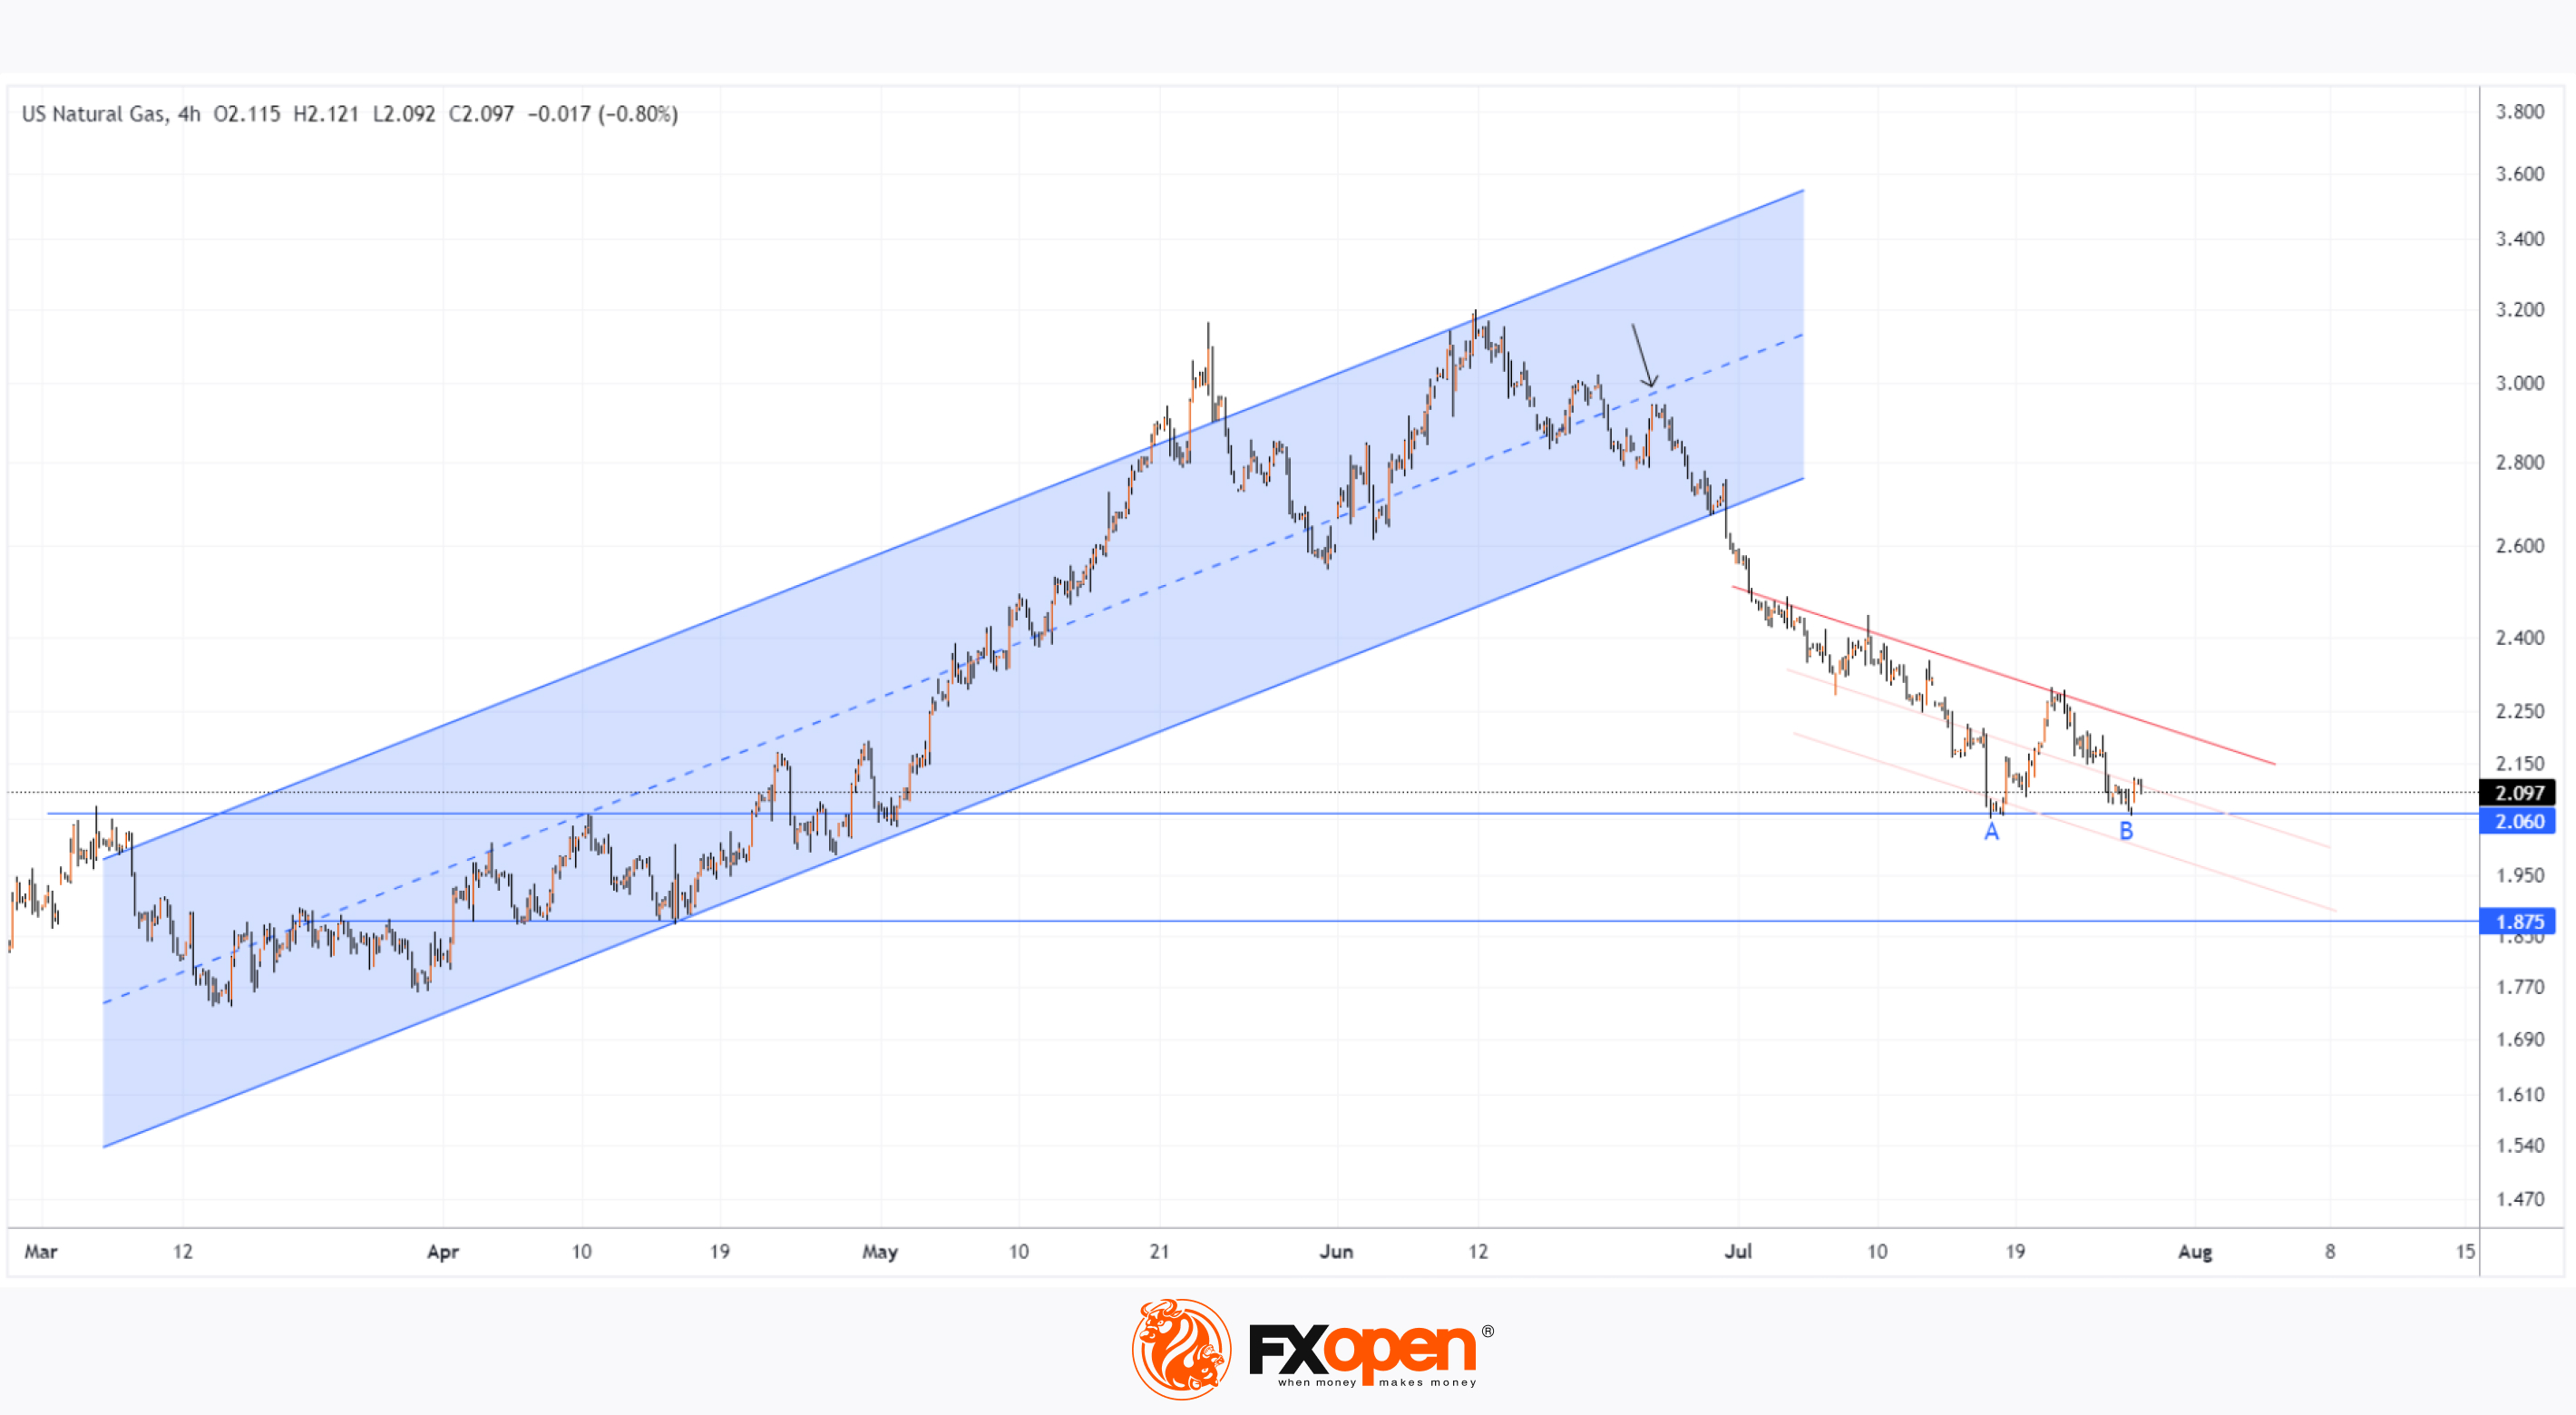
→ Tested the median of the ascending channel (shown by an arrow), which acted as resistance;
→ Broken the lower boundary of the channel;
→ Dropped to the level of 2.06 amid news of sufficient natural gas reserves in storage.
And, as the XNG/USD chart shows today, it is this level that is now forming signs of support for the market:
→ The lows A-B appear to be elements of an incomplete double bottom pattern;
→ The level of 2.06 acted as resistance in March-April, so support here is anticipated by technical analysts.
But can the bulls reverse the trend?
In the near future, the price of natural gas may consolidate within a narrowing triangle, formed by the support at 2.06 and the descending trend line (shown in red). It is possible that failures in any attempts to break through the red line will lead to a resumption of the downward trend and a subsequent decline in price towards the support at 1.875.
Start trading commodities with tight spreads. Open your trading account now or learn more about trading commodity CFDs with FXOpen.
CFDs are complex instruments and come with a high risk of losing your money.
This article represents the opinion of the Companies operating under the FXOpen brand only. It is not to be construed as an offer, solicitation, or recommendation with respect to products and services provided by the Companies operating under the FXOpen brand, nor is it to be considered financial advice.
The Price of Natural Gas Finds Support. But for How Long?
On 21 June, we wrote that the trend in the market was weakening, noting that:
→ Forecasts of a hotter summer, published during April-May, led to a sustained bullish trend in the natural gas market.
→ According to the technical analysis of the 4-hour XNG/USD chart and the signs of weakness that have formed on it, the level of 3.160 appears to sufficiently account for the risks of an extremely hot summer.
→ Bears might push the price to the lower boundary of the ascending trend channel.
Since then, the price of natural gas has:
→ Tested the median of the ascending channel (shown by an arrow), which acted as resistance;
→ Broken the lower boundary of the channel;
→ Dropped to the level of 2.06 amid news of sufficient natural gas reserves in storage.
And, as the XNG/USD chart shows today, it is this level that is now forming signs of support for the market:
→ The lows A-B appear to be elements of an incomplete double bottom pattern;
→ The level of 2.06 acted as resistance in March-April, so support here is anticipated by technical analysts.
But can the bulls reverse the trend?
In the near future, the price of natural gas may consolidate within a narrowing triangle, formed by the support at 2.06 and the descending trend line (shown in red). It is possible that failures in any attempts to break through the red line will lead to a resumption of the downward trend and a subsequent decline in price towards the support at 1.875.
Start trading commodities with tight spreads. Open your trading account now or learn more about trading commodity CFDs with FXOpen.
CFDs are complex instruments and come with a high risk of losing your money.
This article represents the opinion of the Companies operating under the FXOpen brand only. It is not to be construed as an offer, solicitation, or recommendation with respect to products and services provided by the Companies operating under the FXOpen brand, nor is it to be considered financial advice.
👍3
#marketanalysis #stockmarket #stocktrading #MarketNews
McDonald's Share Price Rises Despite Disappointing Report
On Monday, before the start of regular trading, McDonald's reported its second-quarter results:
→ Earnings per share: actual = $2.97, expected = $3.07;
→ Gross revenue: actual = $6.49 billion, expected = $6.62 billion;
→ Net profit for the quarter was $2.02 billion, 12% less than the previous year.
The company's management notes that consumers are limiting spending. CEO Chris Kempczinski mentioned that customers are buying fewer items per visit or opting for cheaper products. Many people prefer dining at home, a trend consistent across various regions of the world.
Nonetheless, McDonald's share price rose by 3.7% on Monday's trading, making it the leader of the day among Dow Jones stocks. Investors were encouraged by the following:
→ McDonald's maintains its overall forecast for new stores, capital expenditures, and operating margin for the year, whereas, for example, the Domino's Pizza chain announced it would reduce the number of new openings worldwide;
→ McDonald's is seeking ways to boost sales, such as the $5 combo meal. Initially launched for just a month, this promotion has been extended through the end of summer.
From a technical analysis perspective, McDonald's shares present concerns:
→ The upward trend (shown in blue), which had been in place for many months, has been broken – the price forcefully breached the lower boundary in May;
→ However, bulls may find hope in the fact that when the price dropped below the 2023 low of around $246 in mid-July, no further bearish momentum followed – a false bearish breakout of an important extremum formed on the chart.
But how optimistic can the prospects be?
Jefferies analysts maintain a "buy" rating for McDonald's shares, though they have lowered the target price from $320.00 to $310.00.
A significant obstacle to the rise in MCD share price is the resistance block formed by the lower boundary of the channel (as former support) and the $265 level.
Trade global index CFDs with zero commission and tight spreads. Open your FXOpen account now or learn more about trading index CFDs with FXOpen.
CFDs are complex instruments and come with a high risk of losing your money.
This article represents the opinion of the Companies operating under the FXOpen brand only. It is not to be construed as an offer, solicitation, or recommendation with respect to products and services provided by the Companies operating under the FXOpen brand, nor is it to be considered financial advice.
McDonald's Share Price Rises Despite Disappointing Report
On Monday, before the start of regular trading, McDonald's reported its second-quarter results:
→ Earnings per share: actual = $2.97, expected = $3.07;
→ Gross revenue: actual = $6.49 billion, expected = $6.62 billion;
→ Net profit for the quarter was $2.02 billion, 12% less than the previous year.
The company's management notes that consumers are limiting spending. CEO Chris Kempczinski mentioned that customers are buying fewer items per visit or opting for cheaper products. Many people prefer dining at home, a trend consistent across various regions of the world.
Nonetheless, McDonald's share price rose by 3.7% on Monday's trading, making it the leader of the day among Dow Jones stocks. Investors were encouraged by the following:
→ McDonald's maintains its overall forecast for new stores, capital expenditures, and operating margin for the year, whereas, for example, the Domino's Pizza chain announced it would reduce the number of new openings worldwide;
→ McDonald's is seeking ways to boost sales, such as the $5 combo meal. Initially launched for just a month, this promotion has been extended through the end of summer.
From a technical analysis perspective, McDonald's shares present concerns:
→ The upward trend (shown in blue), which had been in place for many months, has been broken – the price forcefully breached the lower boundary in May;
→ However, bulls may find hope in the fact that when the price dropped below the 2023 low of around $246 in mid-July, no further bearish momentum followed – a false bearish breakout of an important extremum formed on the chart.
But how optimistic can the prospects be?
Jefferies analysts maintain a "buy" rating for McDonald's shares, though they have lowered the target price from $320.00 to $310.00.
A significant obstacle to the rise in MCD share price is the resistance block formed by the lower boundary of the channel (as former support) and the $265 level.
Trade global index CFDs with zero commission and tight spreads. Open your FXOpen account now or learn more about trading index CFDs with FXOpen.
CFDs are complex instruments and come with a high risk of losing your money.
This article represents the opinion of the Companies operating under the FXOpen brand only. It is not to be construed as an offer, solicitation, or recommendation with respect to products and services provided by the Companies operating under the FXOpen brand, nor is it to be considered financial advice.

👍2
#stockmarket #marketanalysis #sp500
Analysis of AMD Share Price Ahead of Today's Report
The earnings season is in full swing: over 200 companies in the S&P 500 index (SPX 500 mini on FXOpen) have reported their current cycle results, with average earnings up 6.5% year-on-year and revenue growth of 4.1%, according to a client note from Oppenheimer Asset Management published on Monday.
This week, investors are awaiting reports from mega-cap companies, including Apple (AAPL), Microsoft (MSFT), Facebook (META), and Amazon.com (AMZN). Among other major brands are Intel (INTC), Boeing (BA), Pfizer (PFE), Exxon Mobil (XOM), as well as chipmaker AMD, whose second-quarter earnings report will be released today after the close of the main trading session.
Analysts expect AMD's earnings per share to rise from $0.62 to $0.68.
What does the AMD chart indicate?
Despite the S&P 500 index (SPX 500 mini on FXOpen) rising approximately 15% in 2024, AMD's share price remains near its January start price.
Technical analysis of AMD's share chart shows that the price was in an uptrend (shown in blue) in the first half of 2024, but the trend turned downwards (shown in red) after the price exceeded the psychological level of $200.
Today, AMD's share price is near a support block formed by:
→ the long-term trend line (shown in orange);
→ the lower boundary of the downward channel;
→ the current yearly low around $135 per share.
It is possible that today's earnings report could provide a fundamental driver (e.g., higher-than-expected earnings per share) for a reversal upwards from this support block.
Meanwhile, forecasts remain optimistic. According to predictions from 34 Wall Street analysts surveyed by TipRanks, 28 recommend buying AMD shares. On average, they forecast AMD's price to reach $194.93 (nearly +40% from current levels) within 12 months.
Trade global index CFDs with zero commission and tight spreads. Open your FXOpen account now or learn more about trading index CFDs with FXOpen.
CFDs are complex instruments and come with a high risk of losing your money.
This article represents the opinion of the Companies operating under the FXOpen brand only. It is not to be construed as an offer, solicitation, or recommendation with respect to products and services provided by the Companies operating under the FXOpen brand, nor is it to be considered financial advice.
Analysis of AMD Share Price Ahead of Today's Report
The earnings season is in full swing: over 200 companies in the S&P 500 index (SPX 500 mini on FXOpen) have reported their current cycle results, with average earnings up 6.5% year-on-year and revenue growth of 4.1%, according to a client note from Oppenheimer Asset Management published on Monday.
This week, investors are awaiting reports from mega-cap companies, including Apple (AAPL), Microsoft (MSFT), Facebook (META), and Amazon.com (AMZN). Among other major brands are Intel (INTC), Boeing (BA), Pfizer (PFE), Exxon Mobil (XOM), as well as chipmaker AMD, whose second-quarter earnings report will be released today after the close of the main trading session.
Analysts expect AMD's earnings per share to rise from $0.62 to $0.68.
What does the AMD chart indicate?
Despite the S&P 500 index (SPX 500 mini on FXOpen) rising approximately 15% in 2024, AMD's share price remains near its January start price.
Technical analysis of AMD's share chart shows that the price was in an uptrend (shown in blue) in the first half of 2024, but the trend turned downwards (shown in red) after the price exceeded the psychological level of $200.
Today, AMD's share price is near a support block formed by:
→ the long-term trend line (shown in orange);
→ the lower boundary of the downward channel;
→ the current yearly low around $135 per share.
It is possible that today's earnings report could provide a fundamental driver (e.g., higher-than-expected earnings per share) for a reversal upwards from this support block.
Meanwhile, forecasts remain optimistic. According to predictions from 34 Wall Street analysts surveyed by TipRanks, 28 recommend buying AMD shares. On average, they forecast AMD's price to reach $194.93 (nearly +40% from current levels) within 12 months.
Trade global index CFDs with zero commission and tight spreads. Open your FXOpen account now or learn more about trading index CFDs with FXOpen.
CFDs are complex instruments and come with a high risk of losing your money.
This article represents the opinion of the Companies operating under the FXOpen brand only. It is not to be construed as an offer, solicitation, or recommendation with respect to products and services provided by the Companies operating under the FXOpen brand, nor is it to be considered financial advice.

👍3
#StockMarket #USDJPY #MSFT #meta #Investing #finance #marketupdate
Weekly Market Wrap With Gary Thomson: GBP/USD, USD/JPY, MSFT and META Shares
Get the latest scoop on the week's hottest headlines, all in one convenient video. Join Gary Thomson, the COO of FXOpen UK, as he breaks down the most significant news reports and shares his expert insights.
🔸 Market Reacts Mildly To Fed Decision, Focus Shifts To Nonfarm Payrolls
🔸 USD/JPY Falls Below 150 Yen Per Dollar
🔸 MSFT Share Price Plummets After Earnings Report, But It’s Not All Bad
🔸 META Shares Rise Above $500
Stay in the know and empower yourself with our short, yet power-packed video. Watch it now and stay updated with FXOpen. Don't miss out on this invaluable opportunity to sharpen your trading skills and make informed decisions.
https://cutt.ly/KezJn2Ni
To take advantage of price fluctuations in the foreign exchange markets, consider enlisting the services of a reliable broker like FXOpen.
⚠️
This forecast represents FXOpen Companies opinion only, it should not be construed as an offer, invitation or recommendation in respect to FXOpen Companies products and services or as financial advice.
Weekly Market Wrap With Gary Thomson: GBP/USD, USD/JPY, MSFT and META Shares
Get the latest scoop on the week's hottest headlines, all in one convenient video. Join Gary Thomson, the COO of FXOpen UK, as he breaks down the most significant news reports and shares his expert insights.
🔸 Market Reacts Mildly To Fed Decision, Focus Shifts To Nonfarm Payrolls
🔸 USD/JPY Falls Below 150 Yen Per Dollar
🔸 MSFT Share Price Plummets After Earnings Report, But It’s Not All Bad
🔸 META Shares Rise Above $500
Stay in the know and empower yourself with our short, yet power-packed video. Watch it now and stay updated with FXOpen. Don't miss out on this invaluable opportunity to sharpen your trading skills and make informed decisions.
https://cutt.ly/KezJn2Ni
To take advantage of price fluctuations in the foreign exchange markets, consider enlisting the services of a reliable broker like FXOpen.
⚠️
This forecast represents FXOpen Companies opinion only, it should not be construed as an offer, invitation or recommendation in respect to FXOpen Companies products and services or as financial advice.
YouTube
Weekly Market Wrap With Gary Thomson: GBP/USD, USD/JPY, MSFT and META Shares
Get the latest scoop on the week's hottest headlines, all in one convenient video. Join Gary Thomson, the COO of FXOpen UK, as he breaks down the most significant news reports and shares his expert insights.
00:34 Market Reacts Mildly To Fed Decision, Focus…
00:34 Market Reacts Mildly To Fed Decision, Focus…
👍2
#stockmarket #MarketNews #marketanalysis #nikkei225
The Nikkei 225 Index Has Plummeted to a Nine-Month Low
As shown by the Nikkei 225 (Japan 225 on FXOpen) chart:
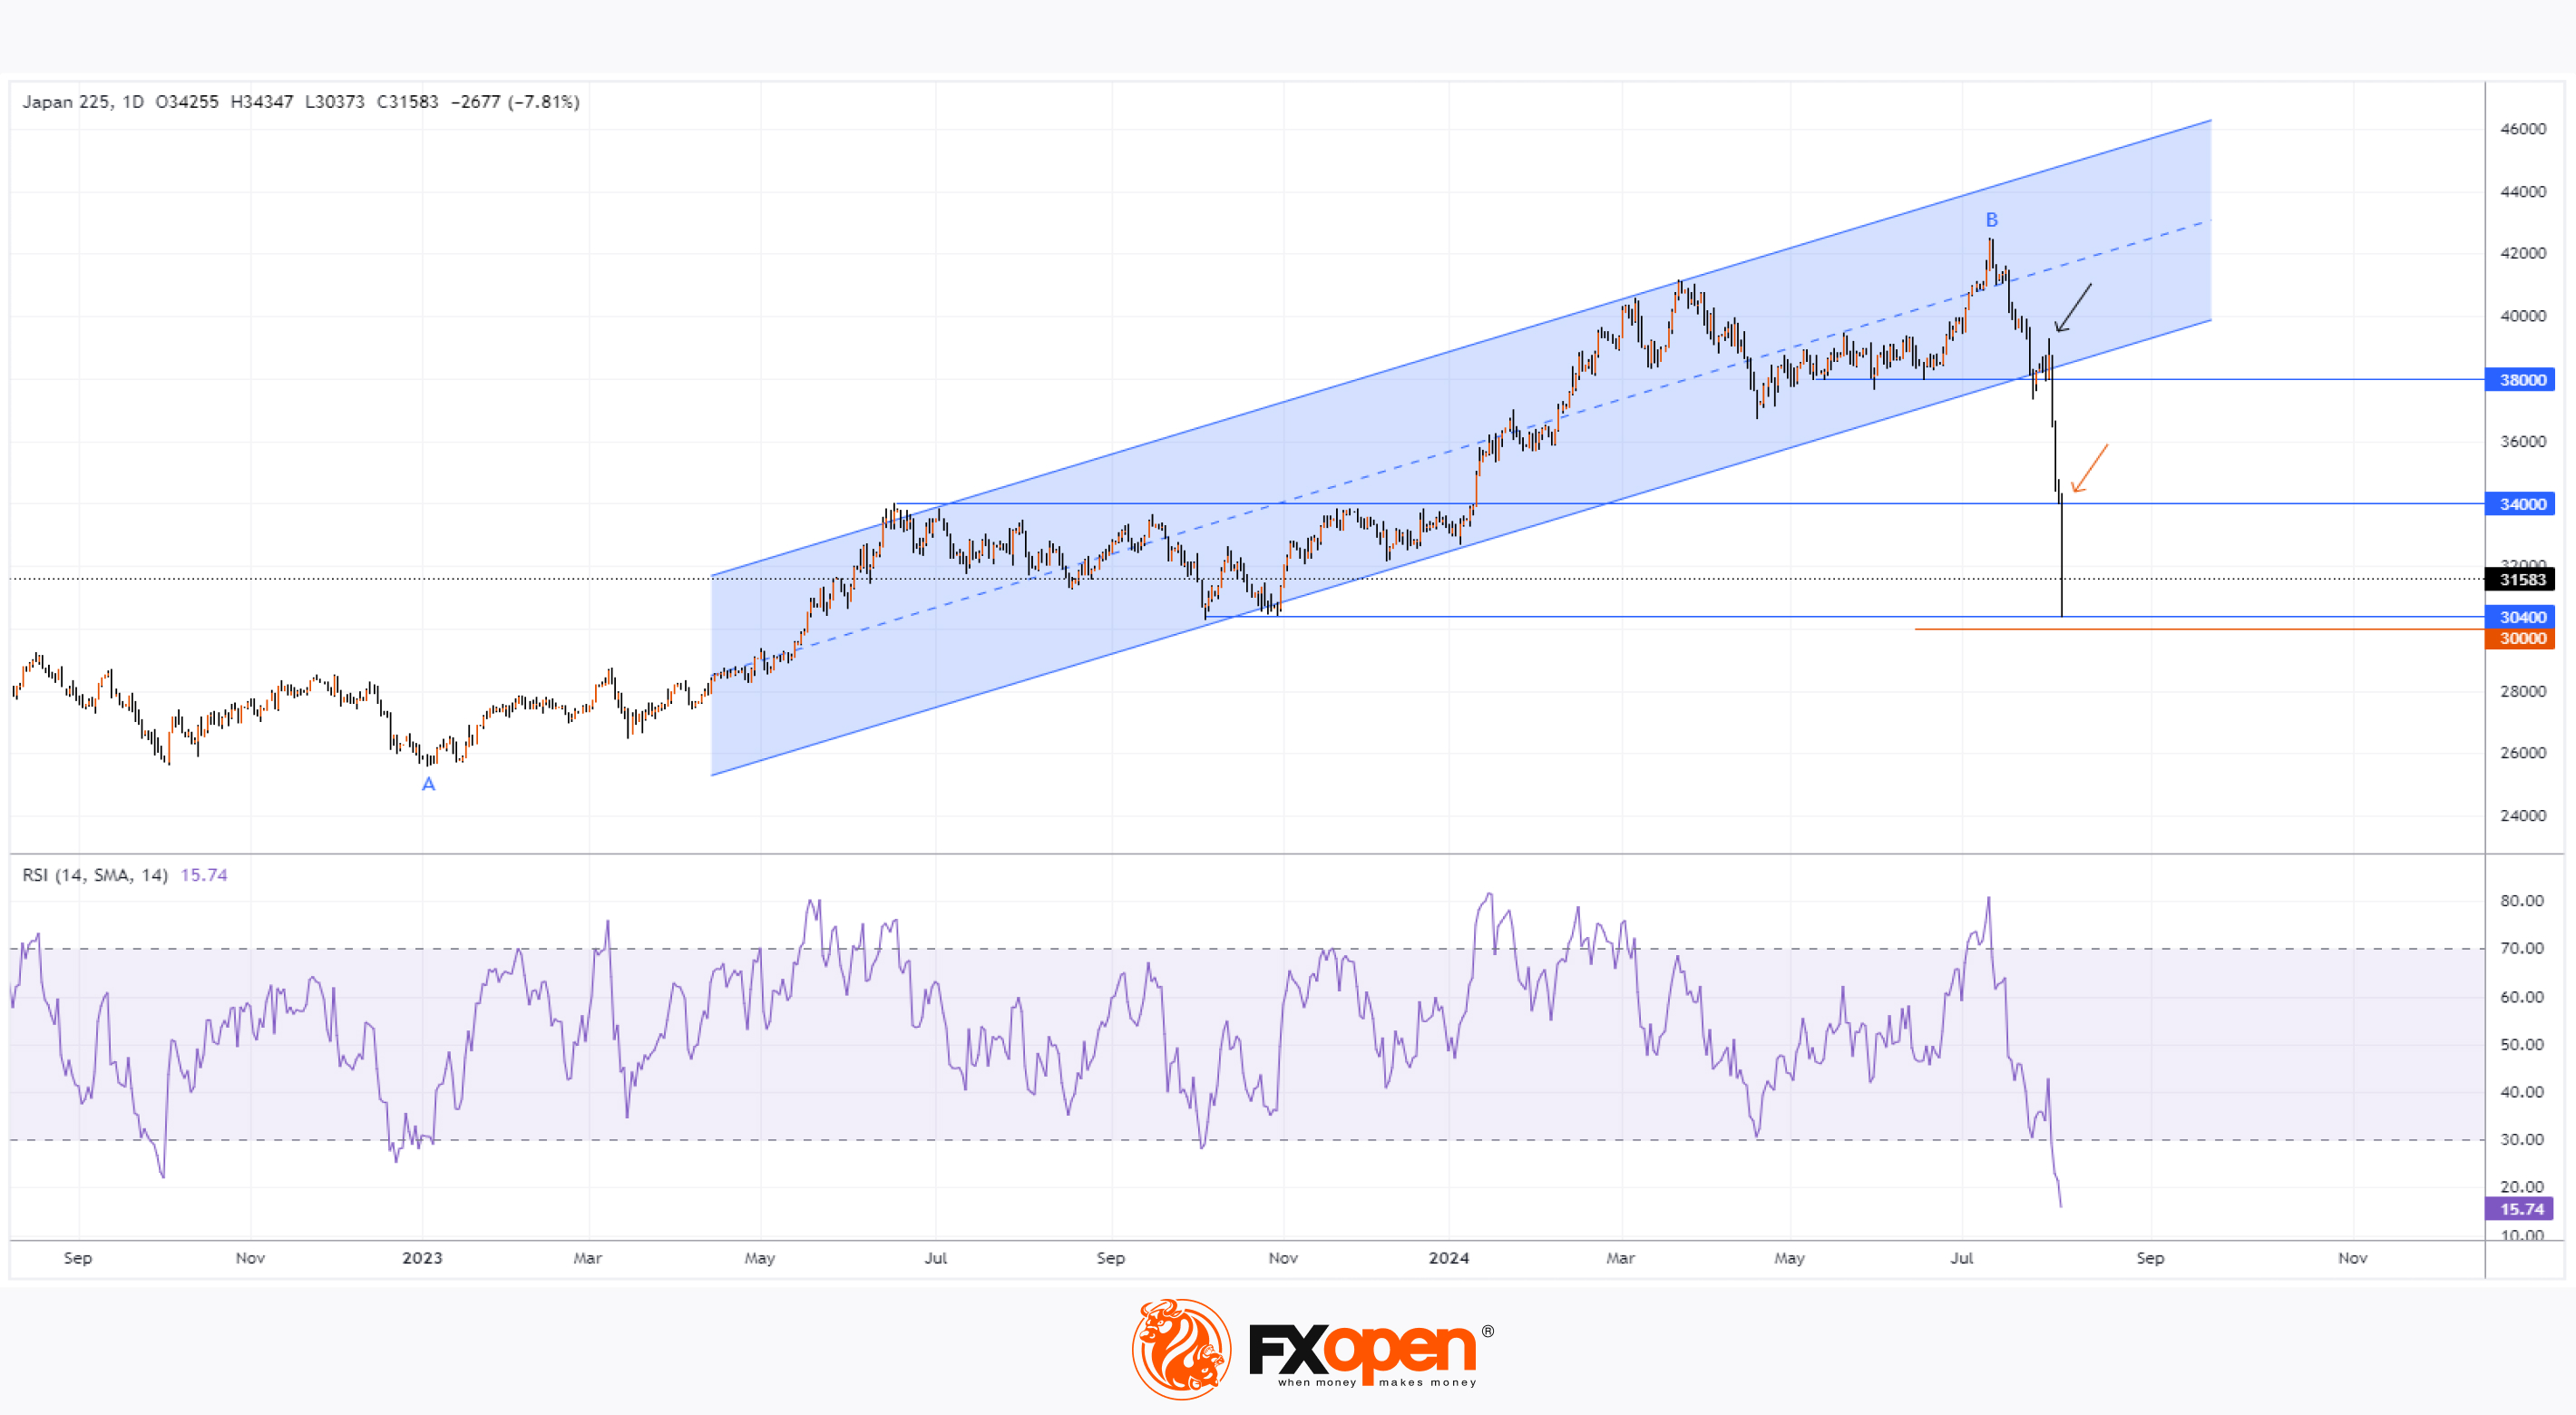
→ In less than a month, the index price has dropped by more than 25%, providing grounds to suggest the start of a bear market.
→ The price has approached the psychological level of 30,000 points – the last time the price was this low was in autumn 2023.
Bearish sentiment is being driven by a combination of the following factors:
→ Negative news from the US labour market, published on Friday – this has significantly increased discussions about the likelihood of a recession.
→ The Bank of Japan’s interest rate hike last Wednesday to support the excessively weak yen.
As we wrote on 15 July, while analysing the Nikkei 225 index (Japan 225 on FXOpen):
→ Signs of bearish activity were observed around the 41,330 level.
→ The upward channel may break in the second half of the year.
It turned out that the bullish channel was broken much earlier and in an extremely aggressive manner – the bulls attempted to resume the trend from its lower boundary (shown by the black arrow), taking advantage of the 38,000 support, but were defeated.
What could happen next?
Technical analysis of the Nikkei 225 (Japan 225 on FXOpen) chart shows:
→ The price broke through (shown by the orange arrow) the previous resistance at 34,000, which is around 50% of the upward move from A to B.
→ The RSI index has moved into deep oversold territory.
→ The price has fallen into the region of the block formed by the 30,400 support and the psychological level of 30,000 – note the strong rebound from it, indicating the activation of demand (these are signs of an emotional selling climax in Wyckoff method terminology).
Given the abnormal surge in volatility, it is reasonable to assume that the market may enter a consolidation phase to establish a new balance of supply and demand, taking into account the latest news releases. It is possible that the mentioned support block will hold, and the 34,000 level will influence the Nikkei 225 (Japan 225 on FXOpen) price in forming the upper boundary of the anticipated consolidation range.
Trade global index CFDs with zero commission and tight spreads. Open your FXOpen account now or learn more about trading index CFDs with FXOpen.
CFDs are complex instruments and come with a high risk of losing your money.
This article represents the opinion of the Companies operating under the FXOpen brand only. It is not to be construed as an offer, solicitation, or recommendation with respect to products and services provided by the Companies operating under the FXOpen brand, nor is it to be considered financial advice.
The Nikkei 225 Index Has Plummeted to a Nine-Month Low
As shown by the Nikkei 225 (Japan 225 on FXOpen) chart:
→ In less than a month, the index price has dropped by more than 25%, providing grounds to suggest the start of a bear market.
→ The price has approached the psychological level of 30,000 points – the last time the price was this low was in autumn 2023.
Bearish sentiment is being driven by a combination of the following factors:
→ Negative news from the US labour market, published on Friday – this has significantly increased discussions about the likelihood of a recession.
→ The Bank of Japan’s interest rate hike last Wednesday to support the excessively weak yen.
As we wrote on 15 July, while analysing the Nikkei 225 index (Japan 225 on FXOpen):
→ Signs of bearish activity were observed around the 41,330 level.
→ The upward channel may break in the second half of the year.
It turned out that the bullish channel was broken much earlier and in an extremely aggressive manner – the bulls attempted to resume the trend from its lower boundary (shown by the black arrow), taking advantage of the 38,000 support, but were defeated.
What could happen next?
Technical analysis of the Nikkei 225 (Japan 225 on FXOpen) chart shows:
→ The price broke through (shown by the orange arrow) the previous resistance at 34,000, which is around 50% of the upward move from A to B.
→ The RSI index has moved into deep oversold territory.
→ The price has fallen into the region of the block formed by the 30,400 support and the psychological level of 30,000 – note the strong rebound from it, indicating the activation of demand (these are signs of an emotional selling climax in Wyckoff method terminology).
Given the abnormal surge in volatility, it is reasonable to assume that the market may enter a consolidation phase to establish a new balance of supply and demand, taking into account the latest news releases. It is possible that the mentioned support block will hold, and the 34,000 level will influence the Nikkei 225 (Japan 225 on FXOpen) price in forming the upper boundary of the anticipated consolidation range.
Trade global index CFDs with zero commission and tight spreads. Open your FXOpen account now or learn more about trading index CFDs with FXOpen.
CFDs are complex instruments and come with a high risk of losing your money.
This article represents the opinion of the Companies operating under the FXOpen brand only. It is not to be construed as an offer, solicitation, or recommendation with respect to products and services provided by the Companies operating under the FXOpen brand, nor is it to be considered financial advice.
👍2
#EURUSD #forextrading #marketanalysis #MarketNews
EUR/USD Analysis: The Rate Has Risen to a Nearly 5-Month High
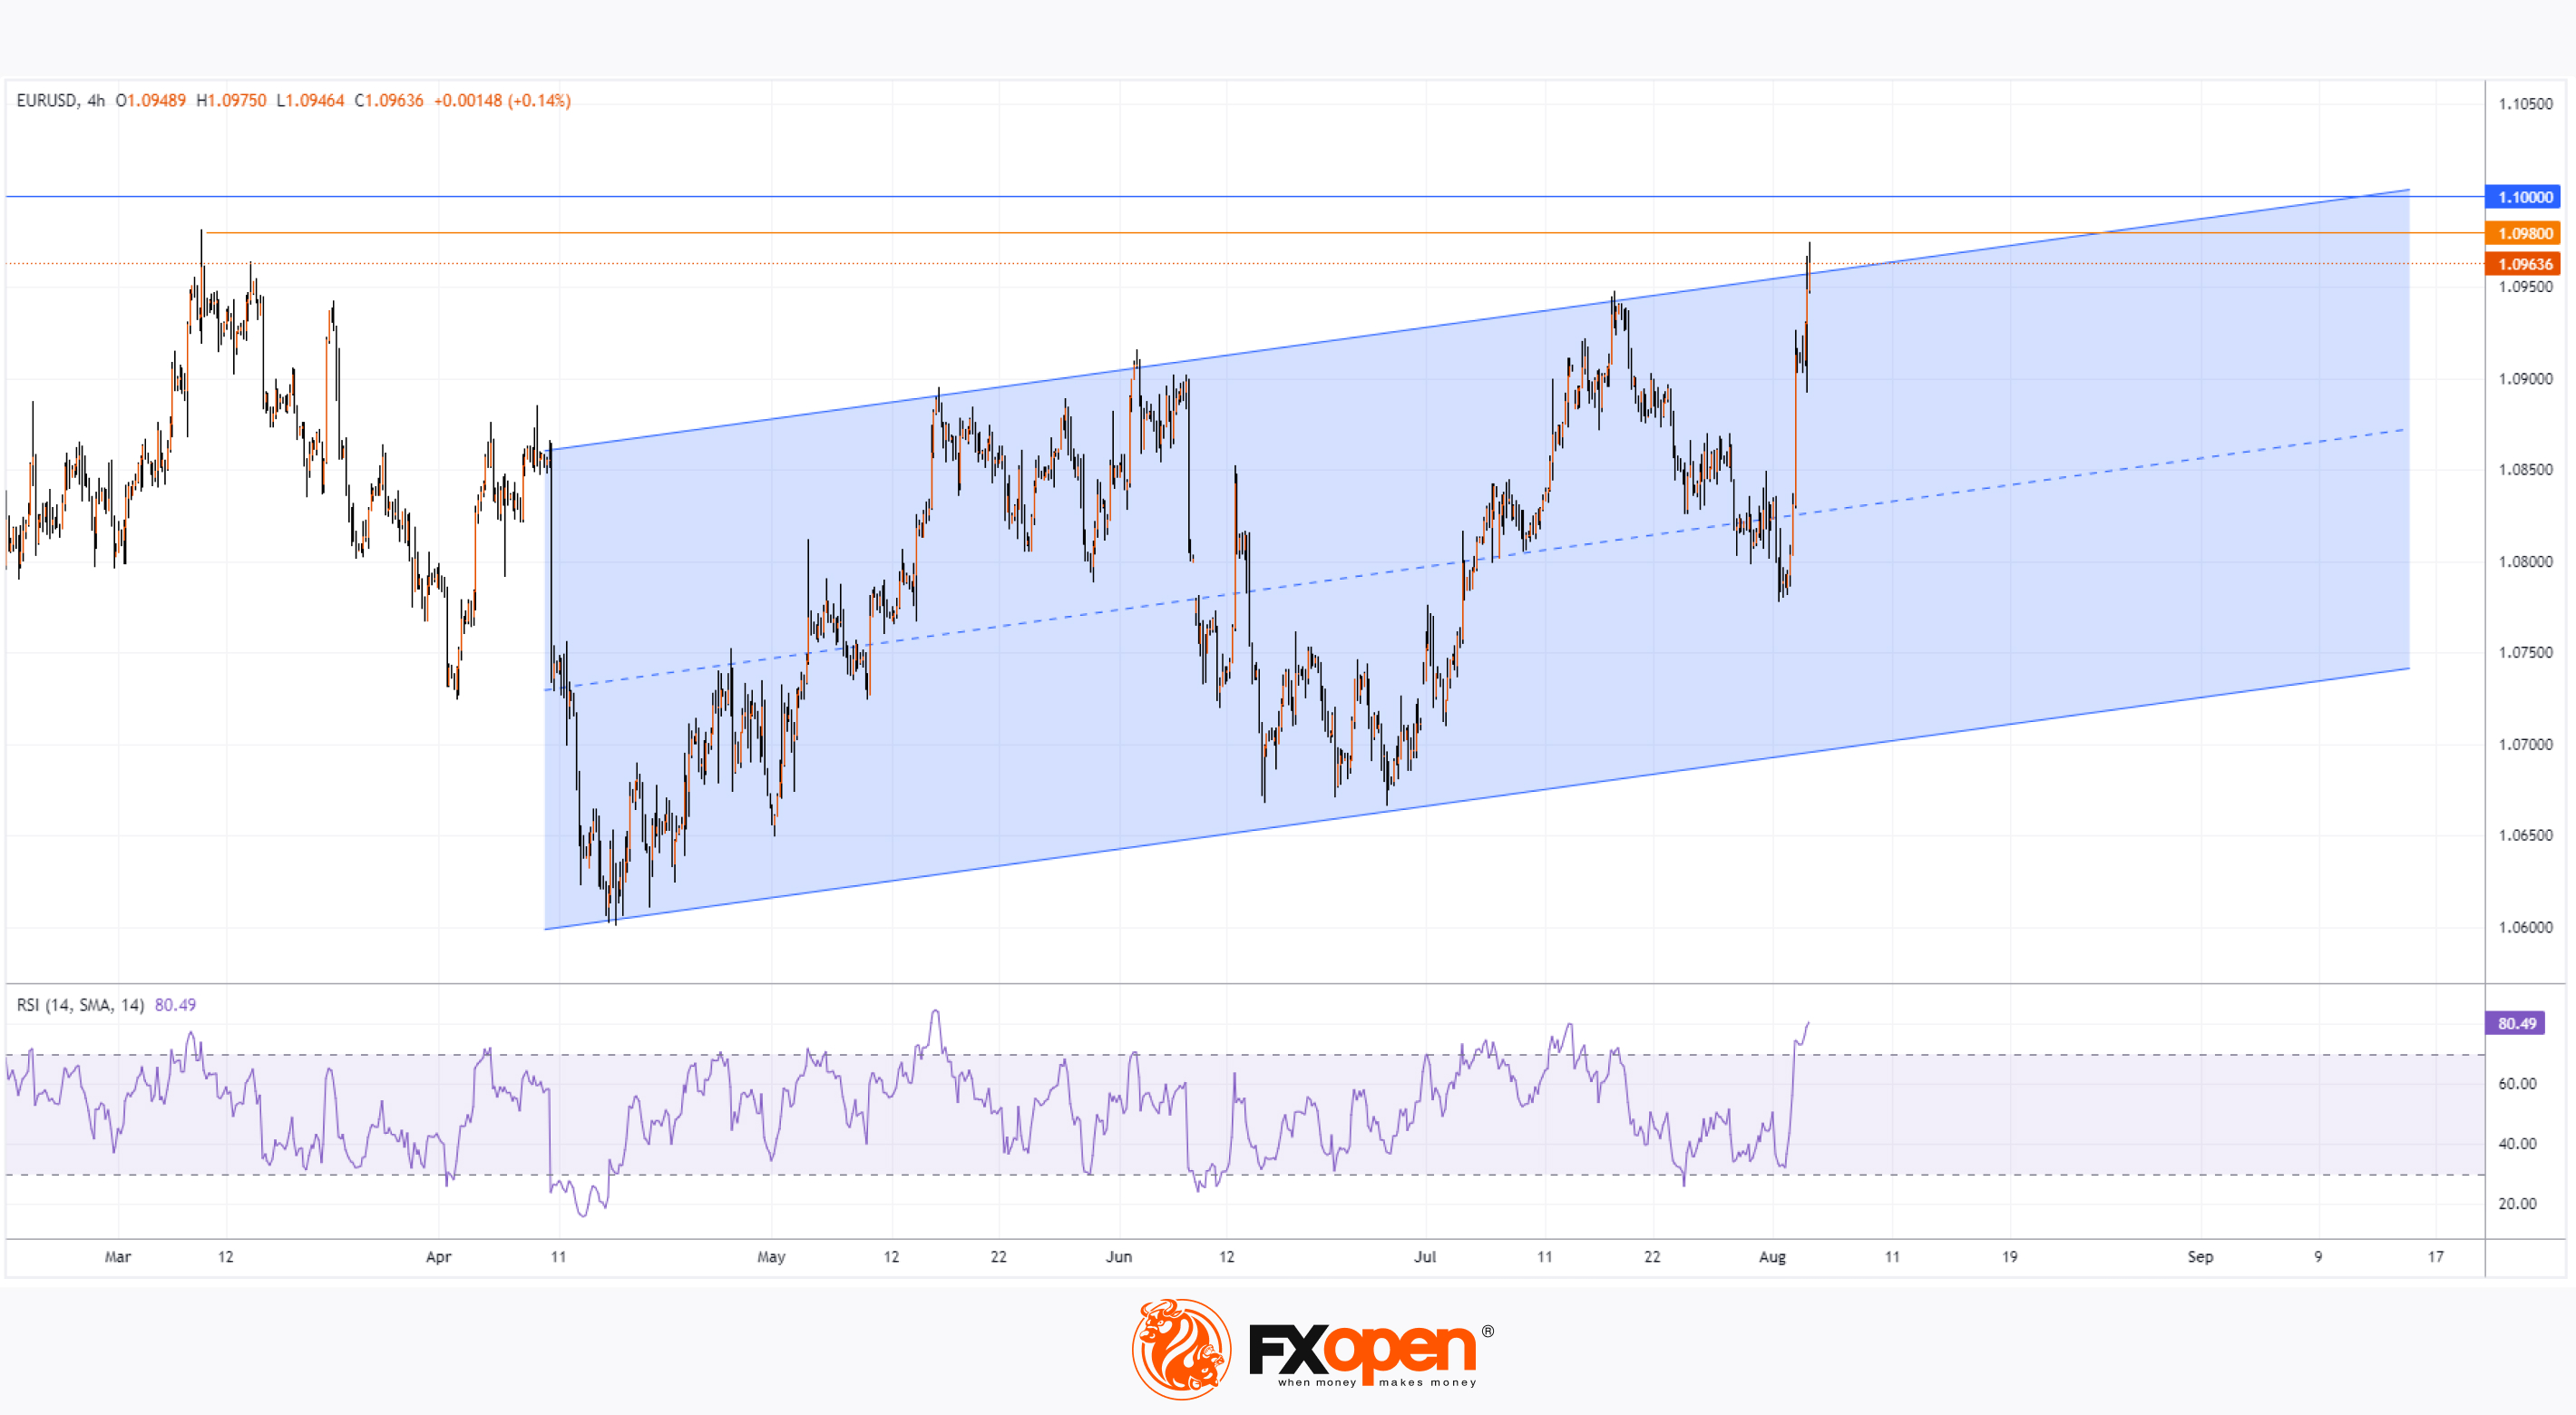
As shown by today’s EUR/USD chart, the rate rose this morning to 1.096 – its highest level since mid-March.
On one hand, this was driven by the weakness of the dollar. The USD fell sharply against other currencies following the release of labour market news on Friday (data from ForexFactory hereafter):
→ The unemployment rate reached 4.3% – the highest since autumn 2021;
→ In July, employers created only 114,000 jobs (excluding the agricultural sector) compared to the forecast of 175,000. Last month’s figure was 179,000;
→ Wage growth is showing signs of slowing down.
The rapid deterioration of the labour market is an early sign of a recession. This is indicated by the rule of Claudia Sahm, who worked at the Federal Reserve for over 10 years.
On the other hand, the EUR/USD is rising due to the strength of the euro. Today, the Purchasing Managers' Index (PMI) figures were released in Europe – all are above the 50.0 level, indicating growth in the Eurozone economies.
As today's technical analysis of the EUR/USD chart shows:
→ The price movement since mid-April has formed the bounds of an upward channel (shown in blue);
→ This morning, the price is above the upper boundary, and the RSI indicator points to a strongly overbought market;
→ The price is close to a resistance block formed by the psychological level of 1.1 and the April high around 1.098.
This creates a vulnerable situation for a false breakout of the resistance block. Thus, the EUR/USD rate may form a similar pattern to what happened with GBP/USD:
→ On 18 July, we noted bearish signs when it breached the psychological level of 1.300;
→ Over the following 15 days, the rate dropped by approximately 2.5%.
Trade over 50 forex markets 24 hours a day with FXOpen. Take advantage of low commissions, deep liquidity, and spreads from 0.0 pips. Open your FXOpen account now or learn more about trading forex with FXOpen.
CFDs are complex instruments and come with a high risk of losing your money.
This article represents the opinion of the Companies operating under the FXOpen brand only. It is not to be construed as an offer, solicitation, or recommendation with respect to products and services provided by the Companies operating under the FXOpen brand, nor is it to be considered financial advice.
EUR/USD Analysis: The Rate Has Risen to a Nearly 5-Month High
As shown by today’s EUR/USD chart, the rate rose this morning to 1.096 – its highest level since mid-March.
On one hand, this was driven by the weakness of the dollar. The USD fell sharply against other currencies following the release of labour market news on Friday (data from ForexFactory hereafter):
→ The unemployment rate reached 4.3% – the highest since autumn 2021;
→ In July, employers created only 114,000 jobs (excluding the agricultural sector) compared to the forecast of 175,000. Last month’s figure was 179,000;
→ Wage growth is showing signs of slowing down.
The rapid deterioration of the labour market is an early sign of a recession. This is indicated by the rule of Claudia Sahm, who worked at the Federal Reserve for over 10 years.
On the other hand, the EUR/USD is rising due to the strength of the euro. Today, the Purchasing Managers' Index (PMI) figures were released in Europe – all are above the 50.0 level, indicating growth in the Eurozone economies.
As today's technical analysis of the EUR/USD chart shows:
→ The price movement since mid-April has formed the bounds of an upward channel (shown in blue);
→ This morning, the price is above the upper boundary, and the RSI indicator points to a strongly overbought market;
→ The price is close to a resistance block formed by the psychological level of 1.1 and the April high around 1.098.
This creates a vulnerable situation for a false breakout of the resistance block. Thus, the EUR/USD rate may form a similar pattern to what happened with GBP/USD:
→ On 18 July, we noted bearish signs when it breached the psychological level of 1.300;
→ Over the following 15 days, the rate dropped by approximately 2.5%.
Trade over 50 forex markets 24 hours a day with FXOpen. Take advantage of low commissions, deep liquidity, and spreads from 0.0 pips. Open your FXOpen account now or learn more about trading forex with FXOpen.
CFDs are complex instruments and come with a high risk of losing your money.
This article represents the opinion of the Companies operating under the FXOpen brand only. It is not to be construed as an offer, solicitation, or recommendation with respect to products and services provided by the Companies operating under the FXOpen brand, nor is it to be considered financial advice.
👍3
#marketanalysis #MarketNews #stockmarket #NASDAQ
Nasdaq Composite Index: A Ray of Hope
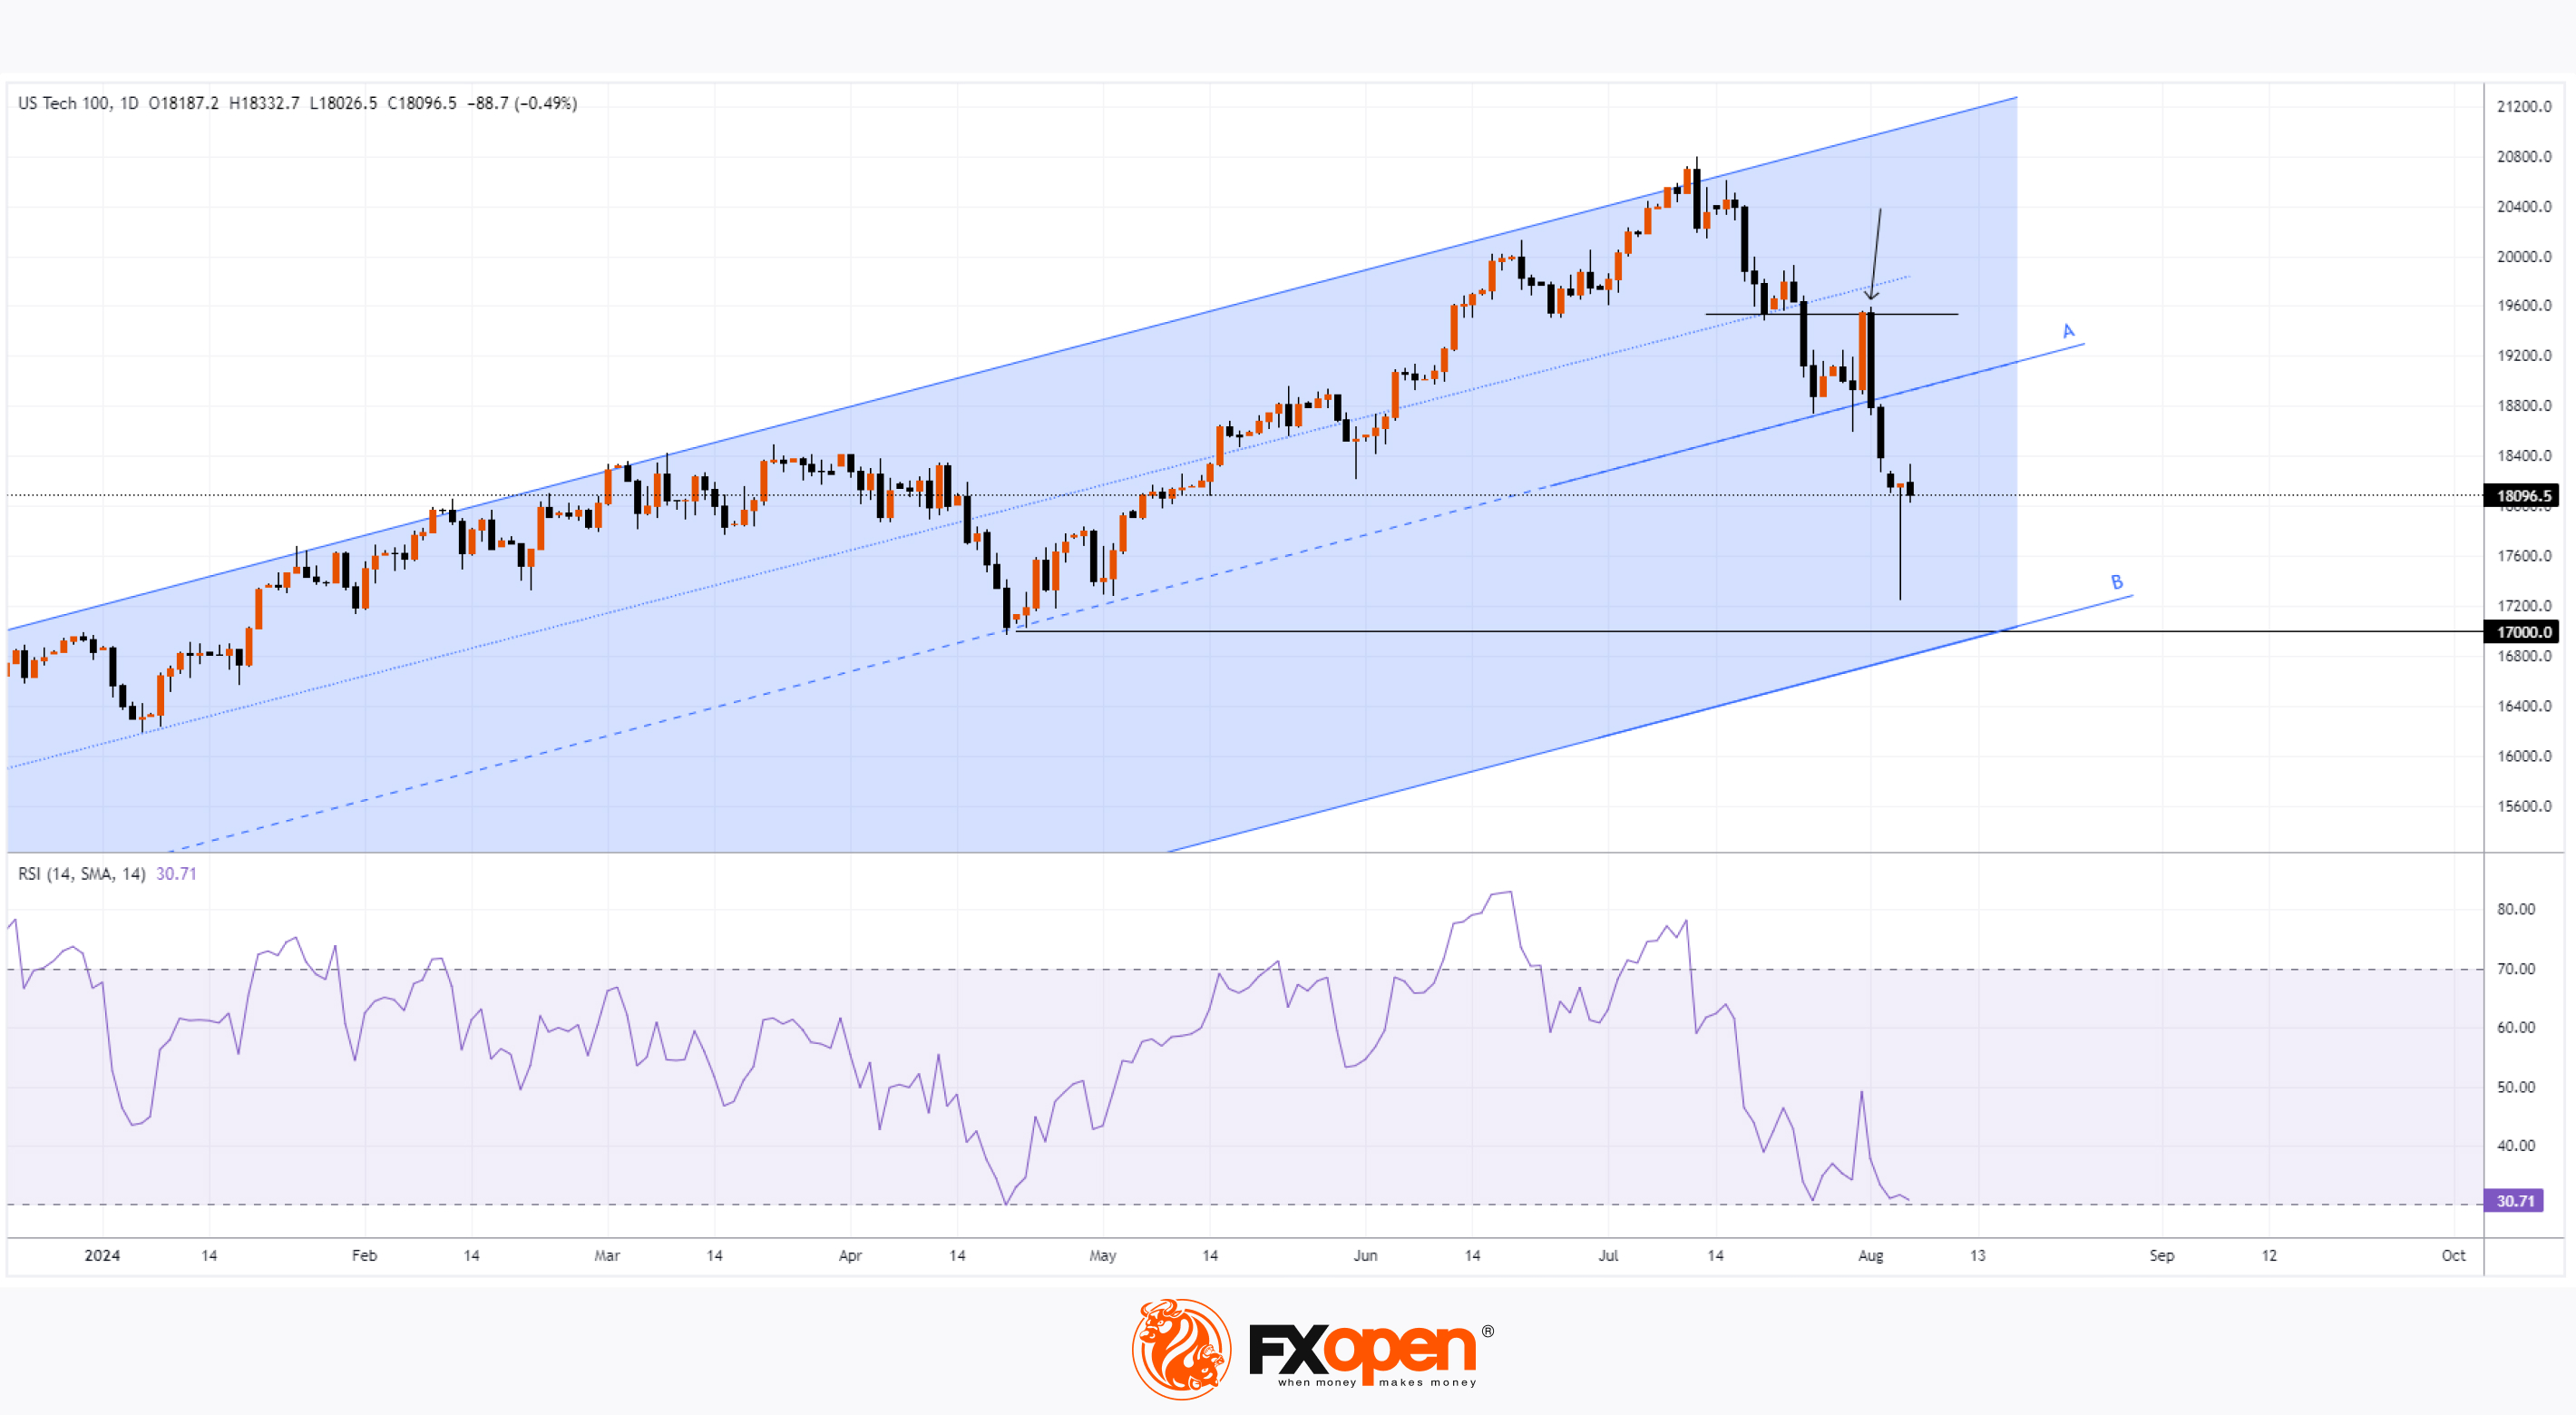
On July 31, we noted that the Nasdaq Composite Index (US Tech 100 mini on FXOpen) had reached significant support, highlighting trendline A and warning of potential volatility spikes due to fundamental news from the Federal Reserve and earnings season.
Since then, the price of the Nasdaq Composite Index (US Tech 100 mini on FXOpen):
→ Jumped to the 19540 level;
→ But encountered resistance there (indicated by an arrow), as this was previous support;
→ And returned to trendline A.
Thus, we have an argument that can be interpreted as the bulls' inability to resume the upward trend. The bears seized the opportunity to take control and break below trendline A on August 2.
Contributing factors included:
→ The decline in the Japanese stock market, which we wrote about yesterday. It is possible that the extremely strong sell-off of Japanese company shares affected sentiments in the US.
→ Increasing talks of a recession due to very weak US labour market data (published on Friday, which we also covered yesterday).
At the low point yesterday, the Nasdaq Composite Index (US Tech 100 mini on FXOpen) dropped by 7% from Friday's close. Of course, this isn't comparable to March 16, 2020, when the index fell by 12.32%, or October 19, 1987 (known as "Black Monday"), when it dropped by 11.35%. Nonetheless, the mood was grim – as CNBC reports, the stock market had its worst day in about two years. The RSI index fell to the oversold boundary.
But not all is bleak.
Technical analysis of the Nasdaq Composite Index (US Tech 100 mini on FXOpen) chart shows that:
→ The price is near line B, which is drawn parallel to line A at a distance equal to the height of the previous channel.
→ And this line B shows signs of support – by Monday's close, the bulls managed to reclaim almost all the progress made by the bears since the start of the session.
→ Yesterday's candlestick forms a "Hammer" pattern, which is a reversal pattern appearing after a decline and suggests seller capitulation and a potential upward reversal.
→ In the background is the important April low around the psychological level of 17k.
According to CandleScanner's research on the US stock market over 20 years, this pattern failed in about 21% of cases. Therefore, signs of weakening selling pressure will indicate that this time the pattern, appearing near line B, may be effective.
Trade global index CFDs with zero commission and tight spreads. Open your FXOpen account now or learn more about trading index CFDs with FXOpen.
CFDs are complex instruments and come with a high risk of losing your money.
This article represents the opinion of the Companies operating under the FXOpen brand only. It is not to be construed as an offer, solicitation, or recommendation with respect to products and services provided by the Companies operating under the FXOpen brand, nor is it to be considered financial advice.
Nasdaq Composite Index: A Ray of Hope
On July 31, we noted that the Nasdaq Composite Index (US Tech 100 mini on FXOpen) had reached significant support, highlighting trendline A and warning of potential volatility spikes due to fundamental news from the Federal Reserve and earnings season.
Since then, the price of the Nasdaq Composite Index (US Tech 100 mini on FXOpen):
→ Jumped to the 19540 level;
→ But encountered resistance there (indicated by an arrow), as this was previous support;
→ And returned to trendline A.
Thus, we have an argument that can be interpreted as the bulls' inability to resume the upward trend. The bears seized the opportunity to take control and break below trendline A on August 2.
Contributing factors included:
→ The decline in the Japanese stock market, which we wrote about yesterday. It is possible that the extremely strong sell-off of Japanese company shares affected sentiments in the US.
→ Increasing talks of a recession due to very weak US labour market data (published on Friday, which we also covered yesterday).
At the low point yesterday, the Nasdaq Composite Index (US Tech 100 mini on FXOpen) dropped by 7% from Friday's close. Of course, this isn't comparable to March 16, 2020, when the index fell by 12.32%, or October 19, 1987 (known as "Black Monday"), when it dropped by 11.35%. Nonetheless, the mood was grim – as CNBC reports, the stock market had its worst day in about two years. The RSI index fell to the oversold boundary.
But not all is bleak.
Technical analysis of the Nasdaq Composite Index (US Tech 100 mini on FXOpen) chart shows that:
→ The price is near line B, which is drawn parallel to line A at a distance equal to the height of the previous channel.
→ And this line B shows signs of support – by Monday's close, the bulls managed to reclaim almost all the progress made by the bears since the start of the session.
→ Yesterday's candlestick forms a "Hammer" pattern, which is a reversal pattern appearing after a decline and suggests seller capitulation and a potential upward reversal.
→ In the background is the important April low around the psychological level of 17k.
According to CandleScanner's research on the US stock market over 20 years, this pattern failed in about 21% of cases. Therefore, signs of weakening selling pressure will indicate that this time the pattern, appearing near line B, may be effective.
Trade global index CFDs with zero commission and tight spreads. Open your FXOpen account now or learn more about trading index CFDs with FXOpen.
CFDs are complex instruments and come with a high risk of losing your money.
This article represents the opinion of the Companies operating under the FXOpen brand only. It is not to be construed as an offer, solicitation, or recommendation with respect to products and services provided by the Companies operating under the FXOpen brand, nor is it to be considered financial advice.
👍2
#marketanalysis #stockmarket #AAPL #stocktrading
Apple (AAPL) Share Price Influenced by Psychological Factors
The first factor is the news that Warren Buffett is halving his position in AAPL shares. Whether this indicates that the legendary investor foresees the company losing its market leadership or a recession threat, Buffett's authority may create a psychological effect on retail investors and prompt them to sell their shares.
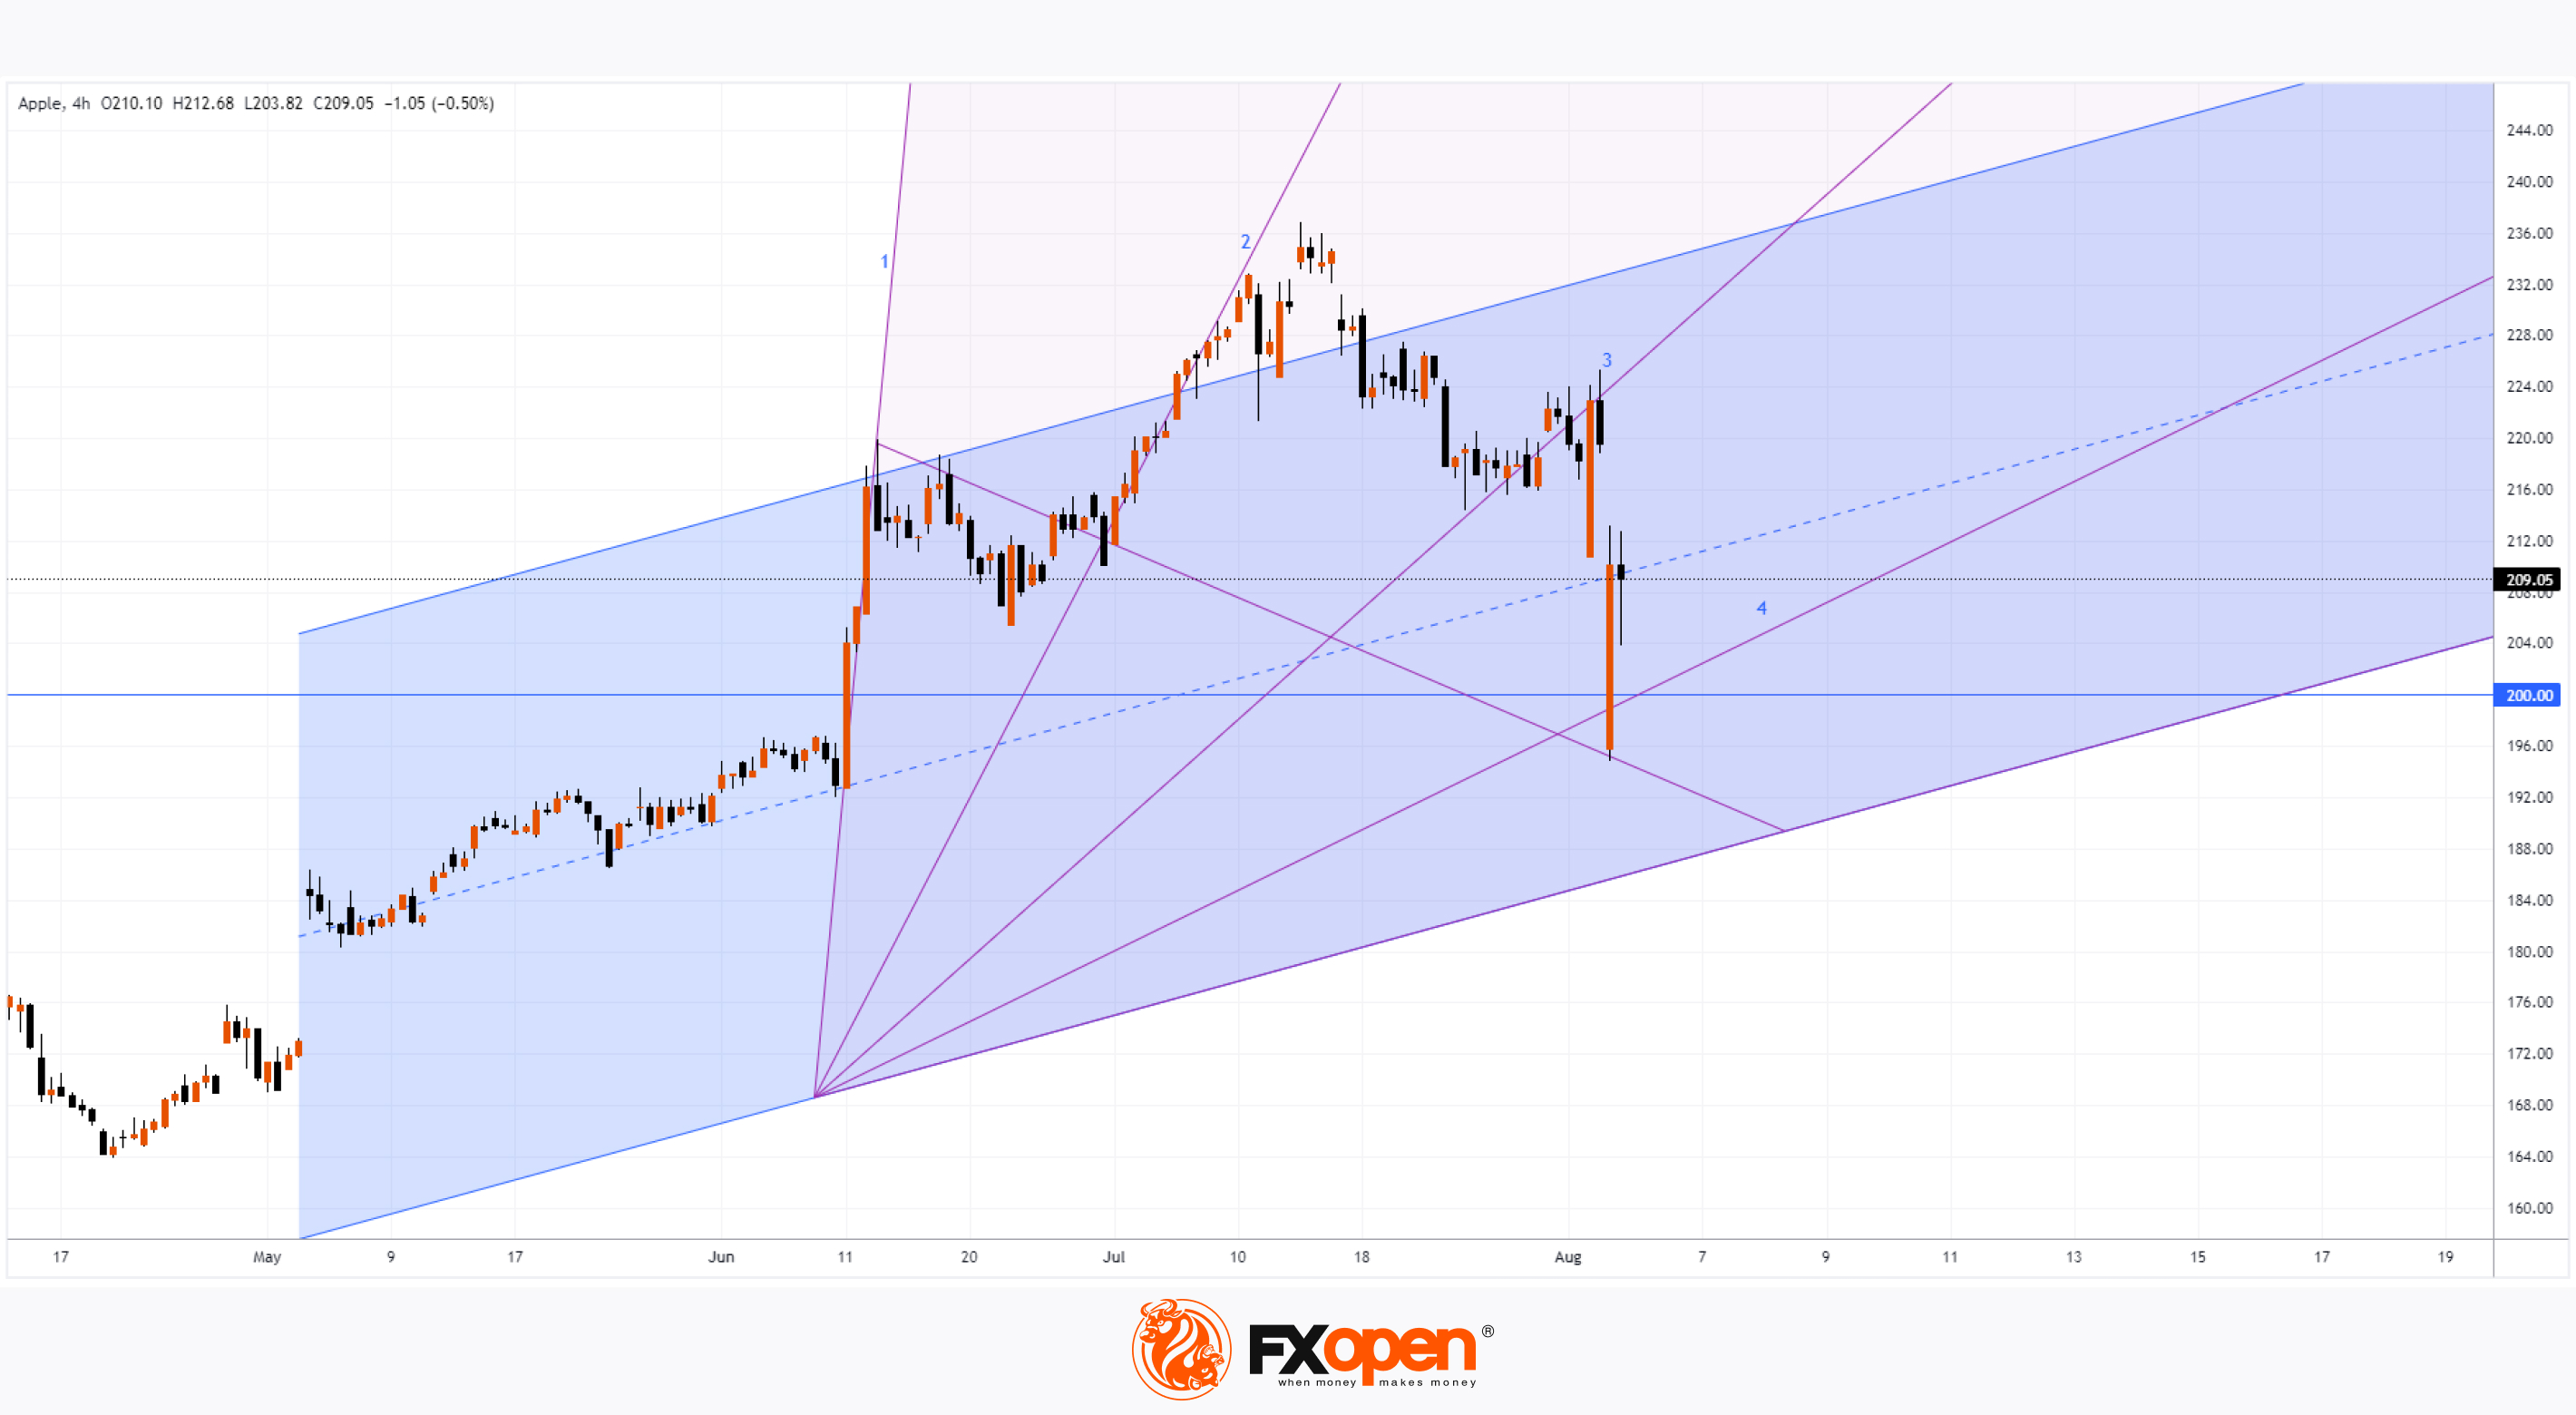
The second factor is the breach of the $200 psychological level. After the strong rise above $200 per share in June, it seemed the price had securely settled above this round number. However, it's not uncommon for breakout tests to occur, stop-loss orders to be triggered, and the supply-demand balance to shift, resulting in price growth. For example, yesterday's price action saw the bulls nearly close a 7% bearish gap.
Today's technical analysis of the AAPL stock chart shows that:
→ Opening at the lows and closing at the highs for the last two wide candles indicates demand activity.
→ Since May, the stock price has been moving within an ascending channel (shown in blue). Yesterday, the price closed near the median line, where it might stabilize.
→ If the bears attempt to resume pressure, pitchfan ray #4 may provide support. As the AAPL chart shows, the stock price found support in the previous three instances, visualized on the chart as days of upward trends with decreasing angle steepness.
Interestingly, CNN Money's Fear & Greed Index showed a further decline in overall market sentiment, moving into the "Extreme Fear" zone on Monday. Would Buffett now follow his famous 1986 advice: "Be fearful when others are greedy, and be greedy when others are fearful"?
According to a survey of 32 Wall Street analysts by TipRanks, 24 recommend buying Apple stock. Their average price forecast for AAPL is $248.96 over the next 12 months.
Read analytical AAPL price forecasts for 2024 and beyond.
Trade global index CFDs with zero commission and tight spreads. Open your FXOpen account now or learn more about trading index CFDs with FXOpen.
CFDs are complex instruments and come with a high risk of losing your money.
This article represents the opinion of the Companies operating under the FXOpen brand only. It is not to be construed as an offer, solicitation, or recommendation with respect to products and services provided by the Companies operating under the FXOpen brand, nor is it to be considered financial advice.
Apple (AAPL) Share Price Influenced by Psychological Factors
The first factor is the news that Warren Buffett is halving his position in AAPL shares. Whether this indicates that the legendary investor foresees the company losing its market leadership or a recession threat, Buffett's authority may create a psychological effect on retail investors and prompt them to sell their shares.
The second factor is the breach of the $200 psychological level. After the strong rise above $200 per share in June, it seemed the price had securely settled above this round number. However, it's not uncommon for breakout tests to occur, stop-loss orders to be triggered, and the supply-demand balance to shift, resulting in price growth. For example, yesterday's price action saw the bulls nearly close a 7% bearish gap.
Today's technical analysis of the AAPL stock chart shows that:
→ Opening at the lows and closing at the highs for the last two wide candles indicates demand activity.
→ Since May, the stock price has been moving within an ascending channel (shown in blue). Yesterday, the price closed near the median line, where it might stabilize.
→ If the bears attempt to resume pressure, pitchfan ray #4 may provide support. As the AAPL chart shows, the stock price found support in the previous three instances, visualized on the chart as days of upward trends with decreasing angle steepness.
Interestingly, CNN Money's Fear & Greed Index showed a further decline in overall market sentiment, moving into the "Extreme Fear" zone on Monday. Would Buffett now follow his famous 1986 advice: "Be fearful when others are greedy, and be greedy when others are fearful"?
According to a survey of 32 Wall Street analysts by TipRanks, 24 recommend buying Apple stock. Their average price forecast for AAPL is $248.96 over the next 12 months.
Read analytical AAPL price forecasts for 2024 and beyond.
Trade global index CFDs with zero commission and tight spreads. Open your FXOpen account now or learn more about trading index CFDs with FXOpen.
CFDs are complex instruments and come with a high risk of losing your money.
This article represents the opinion of the Companies operating under the FXOpen brand only. It is not to be construed as an offer, solicitation, or recommendation with respect to products and services provided by the Companies operating under the FXOpen brand, nor is it to be considered financial advice.
👍2
#marketanalysis #stockmarket #AMZN #stocktrading
Analysis of Amazon (AMZN) Share Price After Disappointing Report
On Thursday, Amazon released its second-quarter report:
→ Earnings per share: actual = $1.26, forecast = $1.03;
→ Gross sales: actual = $147.98 billion, forecast = $148.66 billion.
Amazon’s CFO, Brian Olsavsky, attributed the decline in sales to distractions caused by Trump’s news coverage and the Olympics, suggesting people spent more time reading news and less time shopping on Amazon.
As a result, the sales forecast for the third quarter fell short of expectations, with management estimating between $154 billion and $158.5 billion, while analysts’ average estimate was $158.24 billion.
Investors were disappointed by this news, causing Amazon’s share price to drop approximately 9% on Friday, creating a wide bearish gap. On Monday, the price also opened with a bearish gap and continued to fall, creating a precarious situation.
However, by Monday’s close, the bulls had recovered the early trading losses, and on Tuesday, AMZN showed some stability, staying close to Monday’s closing price.
Does this mean the downward trend (with AMZN’s price now more than 20% below its July all-time high) has run its course?
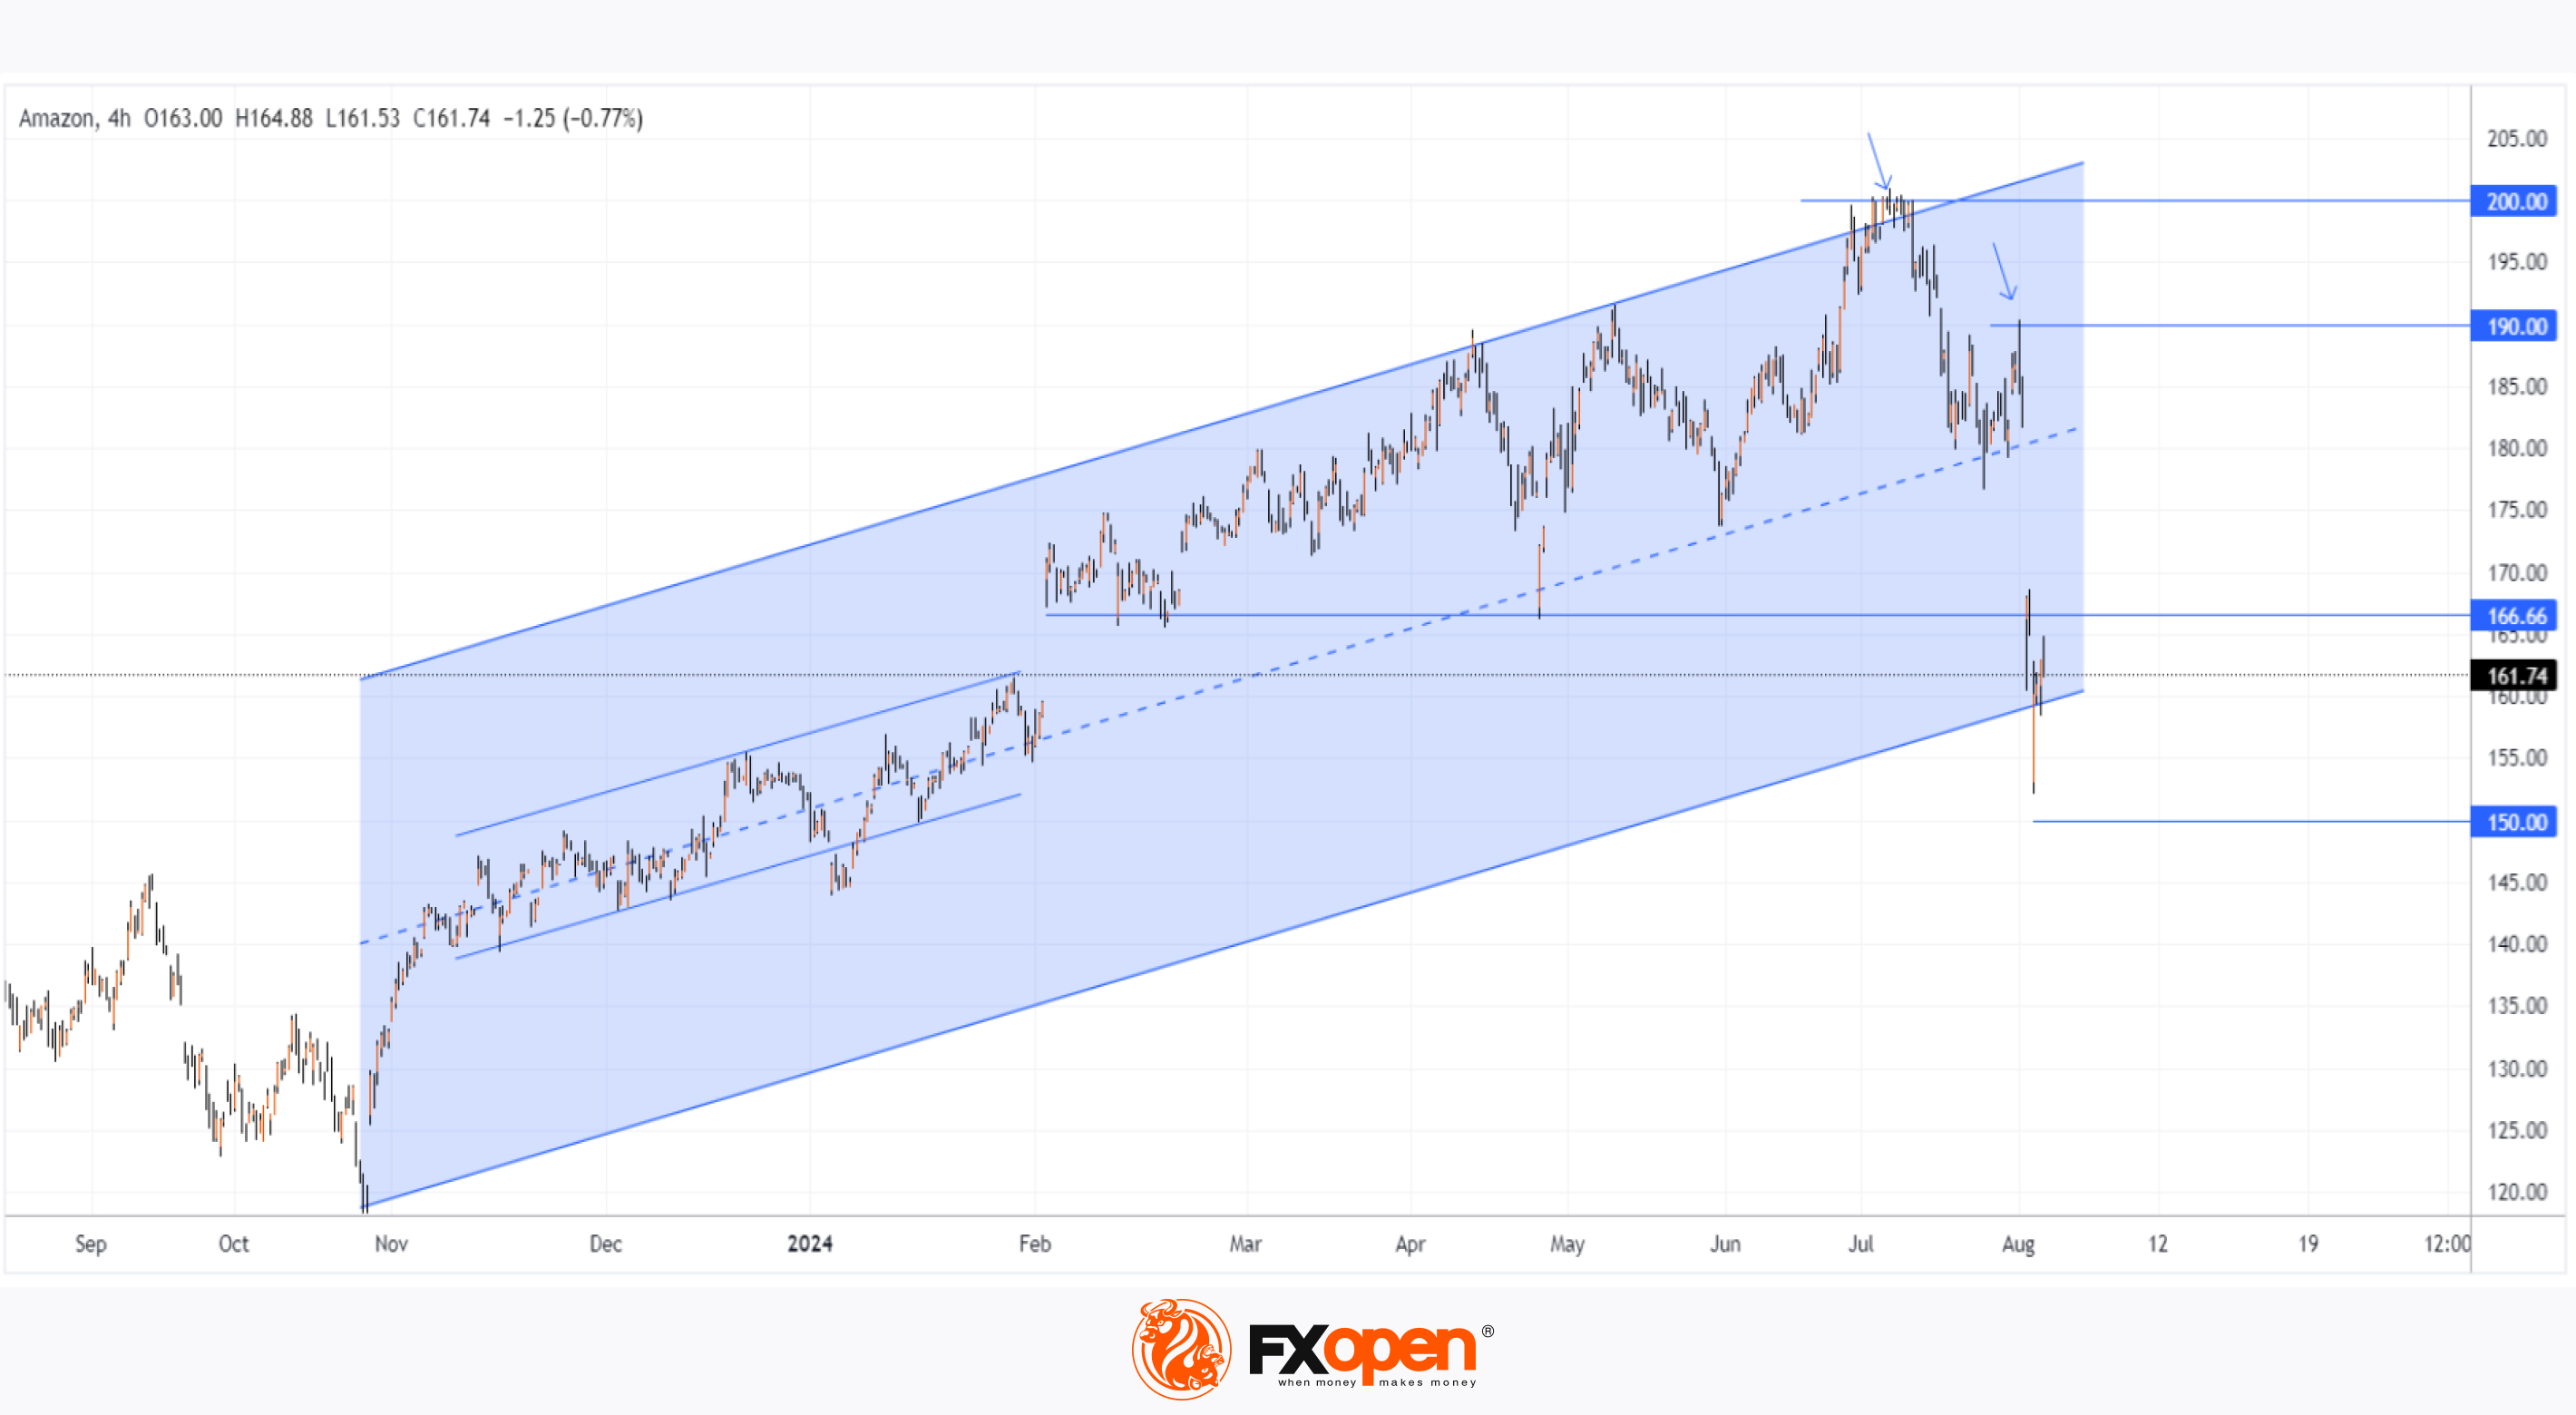
Today's technical analysis of Amazon’s stock chart provides valuable insights:
→ In late 2023 and early 2024, the price gradually increased within a narrow range along the median of an ascending blue channel, indicating a consensus between buyers and sellers on the stock’s fair value.
→ Good news in early February pushed the price up, accelerating growth towards the upper boundary of the channel, which acted as resistance.
→ Last week’s report had the opposite effect. On the bad news, AMZN’s price fell to the lower boundary of the channel, where it found support. This price action shows the impact of news on deviations from the median, which may still be relevant.
It’s worth noting the importance of breaking psychological levels (indicated by arrows showing false bullish breakouts at $200 and $190). It’s possible that:
→ AMZN’s price will continue to consolidate around the lower boundary of the channel, with former support at $166.66 acting as resistance;
→ We may see a false bearish breakout at the $150 level.
Price forecasts for AMZN have slightly worsened since the report, as we warned on July 26. According to current forecasts by 41 Wall Street analysts surveyed by TipRanks, 40 analysts recommend buying AMZN. On average, they predict AMZN’s price will reach $223.60 (about 38% above current levels) over the next 12 months.
Trade global index CFDs with zero commission and tight spreads. Open your FXOpen account now or learn more about trading index CFDs with FXOpen.
CFDs are complex instruments and come with a high risk of losing your money.
This article represents the opinion of the Companies operating under the FXOpen brand only. It is not to be construed as an offer, solicitation, or recommendation with respect to products and services provided by the Companies operating under the FXOpen brand, nor is it to be considered financial advice.
Analysis of Amazon (AMZN) Share Price After Disappointing Report
On Thursday, Amazon released its second-quarter report:
→ Earnings per share: actual = $1.26, forecast = $1.03;
→ Gross sales: actual = $147.98 billion, forecast = $148.66 billion.
Amazon’s CFO, Brian Olsavsky, attributed the decline in sales to distractions caused by Trump’s news coverage and the Olympics, suggesting people spent more time reading news and less time shopping on Amazon.
As a result, the sales forecast for the third quarter fell short of expectations, with management estimating between $154 billion and $158.5 billion, while analysts’ average estimate was $158.24 billion.
Investors were disappointed by this news, causing Amazon’s share price to drop approximately 9% on Friday, creating a wide bearish gap. On Monday, the price also opened with a bearish gap and continued to fall, creating a precarious situation.
However, by Monday’s close, the bulls had recovered the early trading losses, and on Tuesday, AMZN showed some stability, staying close to Monday’s closing price.
Does this mean the downward trend (with AMZN’s price now more than 20% below its July all-time high) has run its course?
Today's technical analysis of Amazon’s stock chart provides valuable insights:
→ In late 2023 and early 2024, the price gradually increased within a narrow range along the median of an ascending blue channel, indicating a consensus between buyers and sellers on the stock’s fair value.
→ Good news in early February pushed the price up, accelerating growth towards the upper boundary of the channel, which acted as resistance.
→ Last week’s report had the opposite effect. On the bad news, AMZN’s price fell to the lower boundary of the channel, where it found support. This price action shows the impact of news on deviations from the median, which may still be relevant.
It’s worth noting the importance of breaking psychological levels (indicated by arrows showing false bullish breakouts at $200 and $190). It’s possible that:
→ AMZN’s price will continue to consolidate around the lower boundary of the channel, with former support at $166.66 acting as resistance;
→ We may see a false bearish breakout at the $150 level.
Price forecasts for AMZN have slightly worsened since the report, as we warned on July 26. According to current forecasts by 41 Wall Street analysts surveyed by TipRanks, 40 analysts recommend buying AMZN. On average, they predict AMZN’s price will reach $223.60 (about 38% above current levels) over the next 12 months.
Trade global index CFDs with zero commission and tight spreads. Open your FXOpen account now or learn more about trading index CFDs with FXOpen.
CFDs are complex instruments and come with a high risk of losing your money.
This article represents the opinion of the Companies operating under the FXOpen brand only. It is not to be construed as an offer, solicitation, or recommendation with respect to products and services provided by the Companies operating under the FXOpen brand, nor is it to be considered financial advice.
👍2
#USDJPY #forextrading #tradingtips #marketanalysis
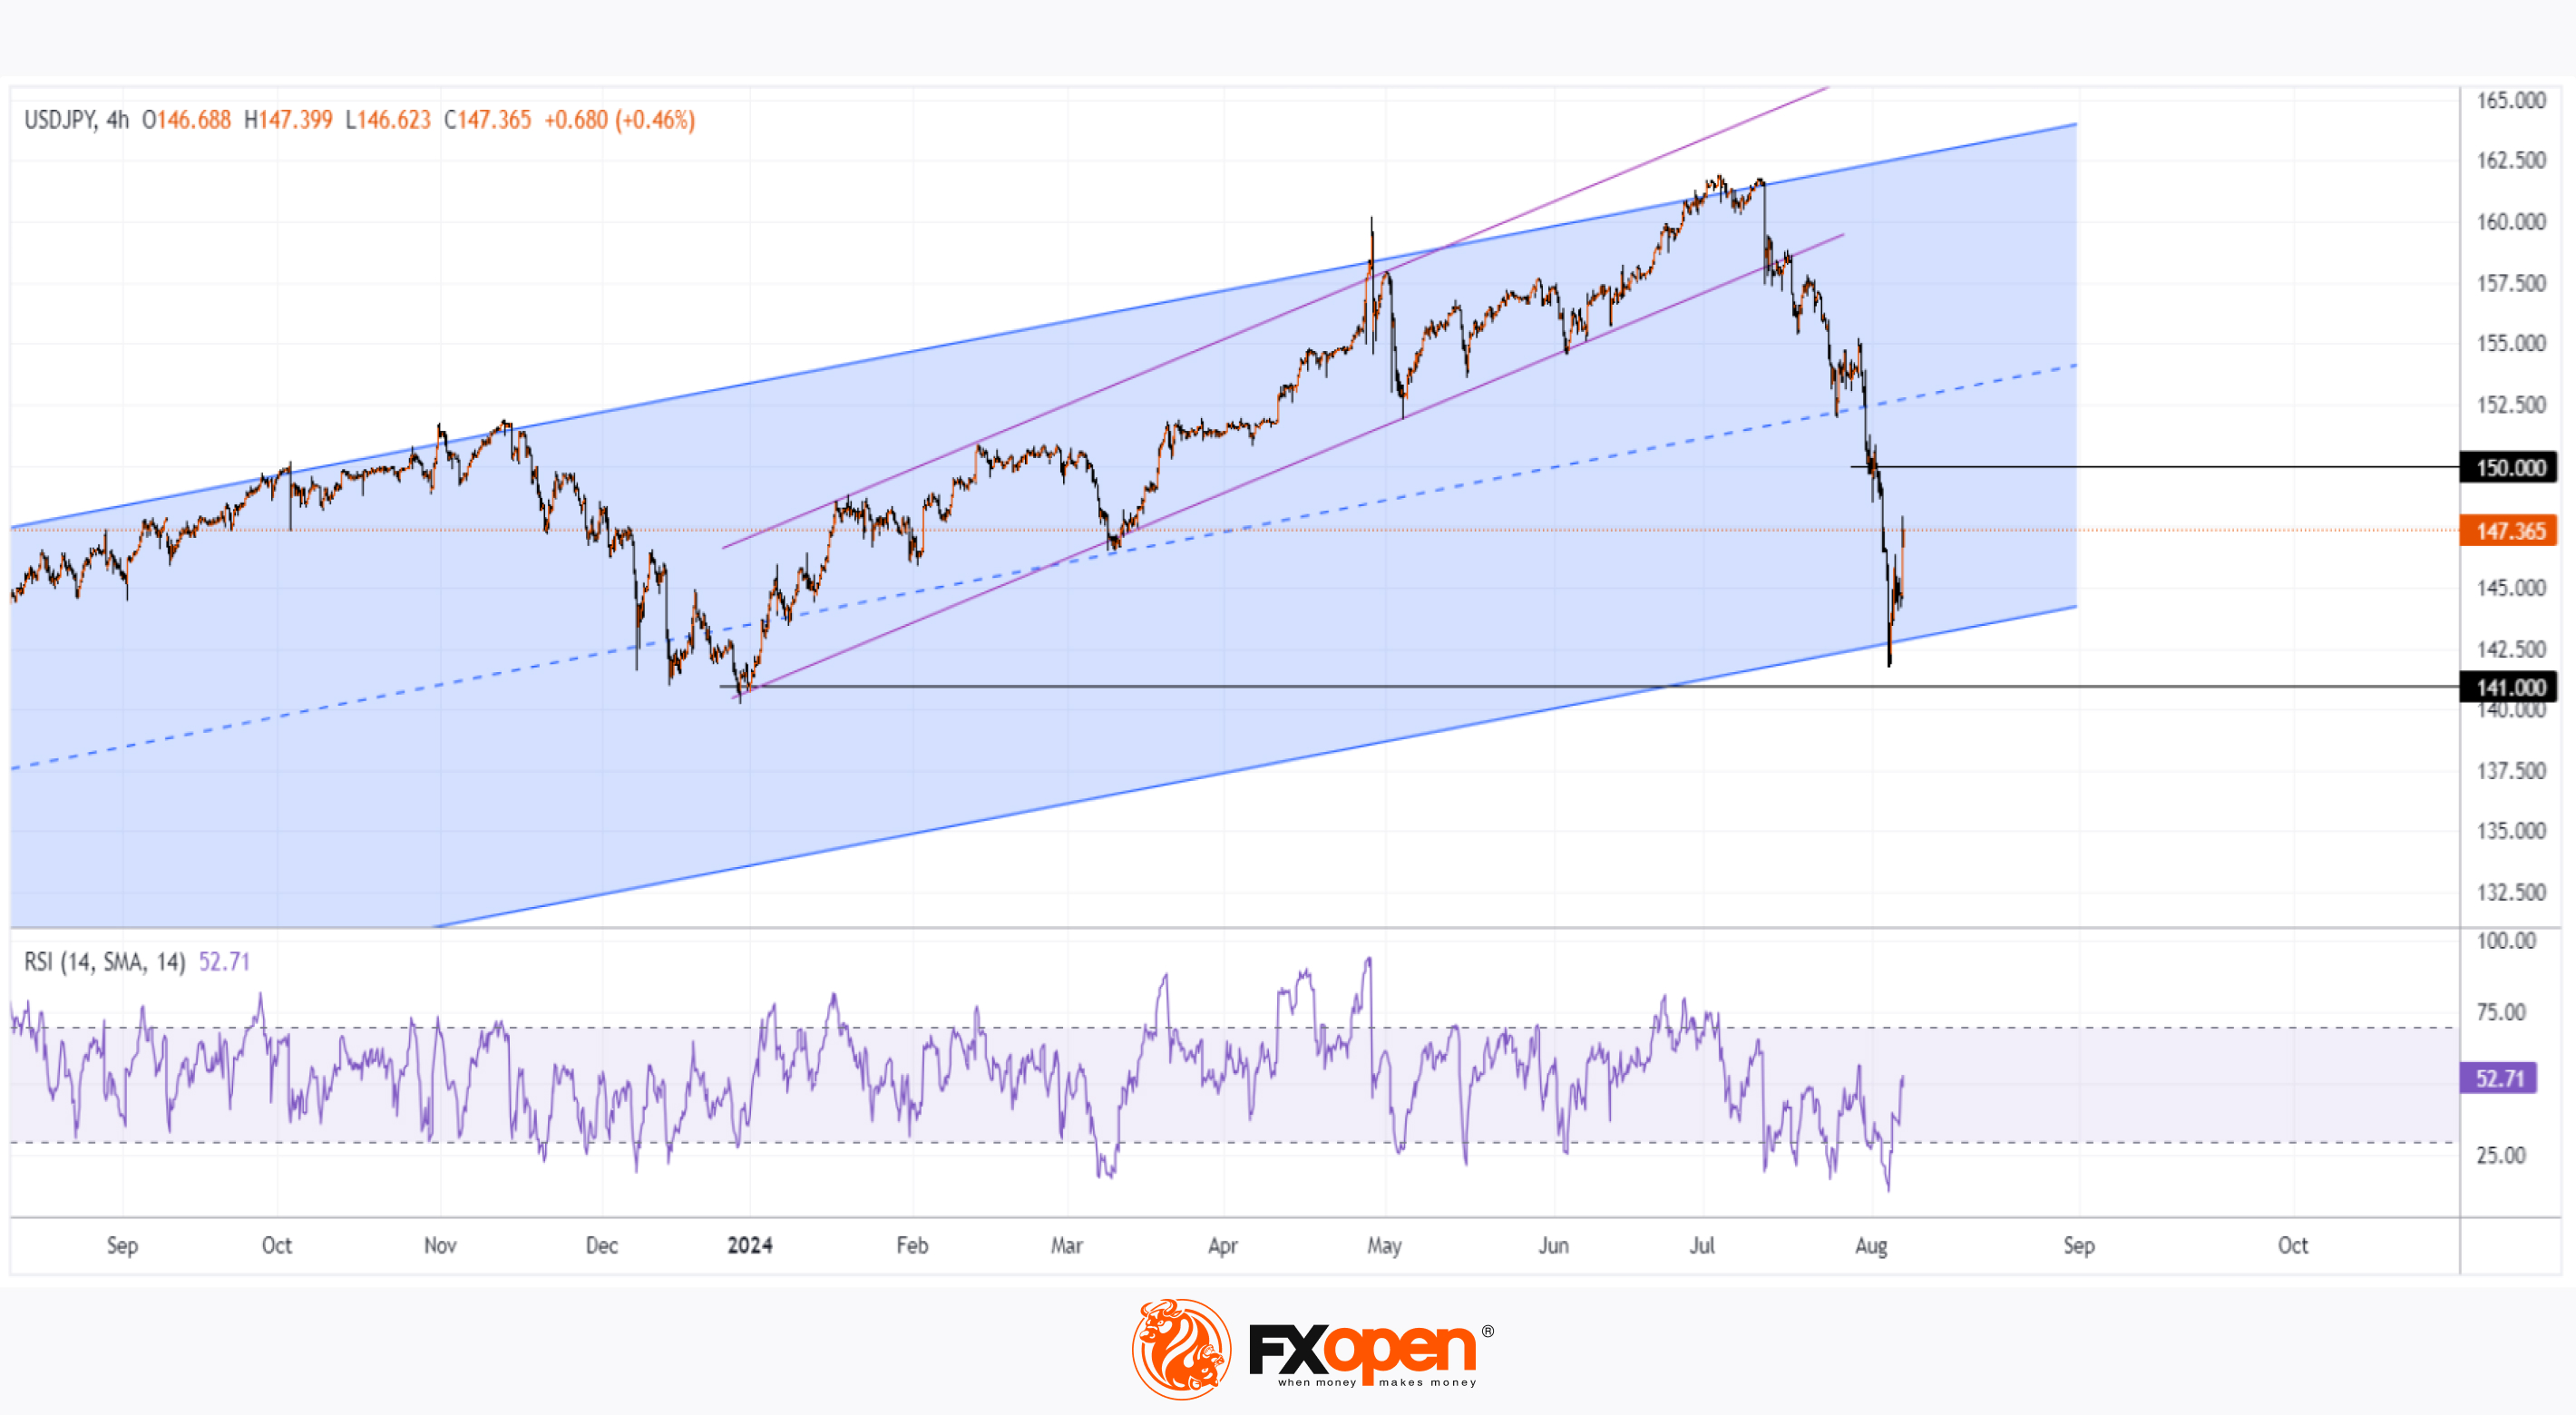
USD/JPY Analysis: Rate Stabilizes After Tsunami
Less than a month ago, the rate was above 161 yen per US dollar. This week, it dropped below 142.5 yen (approximately -12%).
The strengthening of the Japanese yen was driven by actions from the Bank of Japan and financial authorities:
→ Intervention to support the yen in mid-July;
→ An interest rate hike last week.
On its downward trajectory, the USD/JPY rate broke through:
→ The ascending trendline (shown in purple);
→ The median line of a large ascending channel (shown in blue) that began in 2023;
→ The psychological levels of 160 and 150 yen per dollar.
The bears' aggression seems to have exhausted near the lower boundary of the blue channel. This was aided by statements from authorities aimed at stabilising financial markets, including the Japanese stock market.
Specifically, Bank of Japan Deputy Governor Shinichi Uchida said: “I believe that the bank needs to maintain monetary easing with the current policy interest rate for the time being, with developments in financial and capital markets at home and abroad being extremely volatile.” He also noted that concerns about the US economy, combined with actions from the Bank of Japan, triggered the volatility.
Technical analysis of the USD/JPY chart shows that:
→ Following the "dovish" comments from authorities, the price returned within the blue channel, and the RSI is recovering after falling below the 15 level.
→ If the bears resume pressure, support may come from both the lower boundary of the channel and the December 2023 lows around 141 yen per dollar.
→ Resistance can be expected at the psychological level of 150 yen per dollar, where the bears proved their strength after brief fluctuations around this level at the start of the week.
It is possible that, following the volatility "tsunami," the market's turbulence will subside, and the forces of supply and demand will more accurately indicate the fair value of the yen relative to the US dollar in light of the latest news.
Trade over 50 forex markets 24 hours a day with FXOpen. Take advantage of low commissions, deep liquidity, and spreads from 0.0 pips. Open your FXOpen account now or learn more about trading forex with FXOpen.
CFDs are complex instruments and come with a high risk of losing your money.
This article represents the opinion of the Companies operating under the FXOpen brand only. It is not to be construed as an offer, solicitation, or recommendation with respect to products and services provided by the Companies operating under the FXOpen brand, nor is it to be considered financial advice.
USD/JPY Analysis: Rate Stabilizes After Tsunami
Less than a month ago, the rate was above 161 yen per US dollar. This week, it dropped below 142.5 yen (approximately -12%).
The strengthening of the Japanese yen was driven by actions from the Bank of Japan and financial authorities:
→ Intervention to support the yen in mid-July;
→ An interest rate hike last week.
On its downward trajectory, the USD/JPY rate broke through:
→ The ascending trendline (shown in purple);
→ The median line of a large ascending channel (shown in blue) that began in 2023;
→ The psychological levels of 160 and 150 yen per dollar.
The bears' aggression seems to have exhausted near the lower boundary of the blue channel. This was aided by statements from authorities aimed at stabilising financial markets, including the Japanese stock market.
Specifically, Bank of Japan Deputy Governor Shinichi Uchida said: “I believe that the bank needs to maintain monetary easing with the current policy interest rate for the time being, with developments in financial and capital markets at home and abroad being extremely volatile.” He also noted that concerns about the US economy, combined with actions from the Bank of Japan, triggered the volatility.
Technical analysis of the USD/JPY chart shows that:
→ Following the "dovish" comments from authorities, the price returned within the blue channel, and the RSI is recovering after falling below the 15 level.
→ If the bears resume pressure, support may come from both the lower boundary of the channel and the December 2023 lows around 141 yen per dollar.
→ Resistance can be expected at the psychological level of 150 yen per dollar, where the bears proved their strength after brief fluctuations around this level at the start of the week.
It is possible that, following the volatility "tsunami," the market's turbulence will subside, and the forces of supply and demand will more accurately indicate the fair value of the yen relative to the US dollar in light of the latest news.
Trade over 50 forex markets 24 hours a day with FXOpen. Take advantage of low commissions, deep liquidity, and spreads from 0.0 pips. Open your FXOpen account now or learn more about trading forex with FXOpen.
CFDs are complex instruments and come with a high risk of losing your money.
This article represents the opinion of the Companies operating under the FXOpen brand only. It is not to be construed as an offer, solicitation, or recommendation with respect to products and services provided by the Companies operating under the FXOpen brand, nor is it to be considered financial advice.
👍3
#stockmarket #stocktrading #nikkei225 #marketanalysis
Is the Japanese Stock Market Stable Today?
On July 11, the Nikkei 225 index (Japan 225 on FXOpen) started to decline. Notably, on July 15, we observed bearish activity around the 41330 level.
Interestingly, US stock indices also began to fall on July 11. However, the Japanese stock market saw a more dramatic drop, exceeding 25% by the August 5 low.
Has the Japanese stock market continued to fall? No. After a alarming Monday on August 5, the price has been recovering. It closed higher on Tuesday and Wednesday, with bullish signs observed today, Thursday.
Analyzing the Nikkei 225 (Japan 225 on FXOpen) chart on Monday, we noted that:
→ The price dropped to a support block between 30,400 and the psychological level of 30k.
→ A strong bounce from this block could indicate activated demand (a sign of an emotional selling climax in Wyckoff's terminology).
We then suggested that this support block would hold, and the Japanese stock market might enter a consolidation phase to establish a new balance of supply and demand.
Today, the technical analysis of the Nikkei 225 (Japan 225 on FXOpen) chart shows:
→ The price has risen from the support block around 30,400 and is currently near 35,000.
→ Notably, the price found support at the lower boundary of the linear regression channel, indicating deviations from average values (shown in light purple). The lower boundary acted as support.
→ The price is below 38,000, where previous supports, including the lower boundary of a significant ascending channel (shown with blue lines), were breached. These are now expected to act as resistance.
Thus, after an extremely volatile Monday, the market may continue to develop a consolidation phase with decreasing amplitude, within the range of 30k to 38k. This phase will help establish a clearer consensus on the fair valuation of the Japanese stock market, considering the Bank of Japan's rate hike last week and the risks of a US recession.
Trade global index CFDs with zero commission and tight spreads. Open your FXOpen account now or learn more about trading index CFDs with FXOpen.
CFDs are complex instruments and come with a high risk of losing your money.
This article represents the opinion of the Companies operating under the FXOpen brand only. It is not to be construed as an offer, solicitation, or recommendation with respect to products and services provided by the Companies operating under the FXOpen brand, nor is it to be considered financial advice.
Is the Japanese Stock Market Stable Today?
On July 11, the Nikkei 225 index (Japan 225 on FXOpen) started to decline. Notably, on July 15, we observed bearish activity around the 41330 level.
Interestingly, US stock indices also began to fall on July 11. However, the Japanese stock market saw a more dramatic drop, exceeding 25% by the August 5 low.
Has the Japanese stock market continued to fall? No. After a alarming Monday on August 5, the price has been recovering. It closed higher on Tuesday and Wednesday, with bullish signs observed today, Thursday.
Analyzing the Nikkei 225 (Japan 225 on FXOpen) chart on Monday, we noted that:
→ The price dropped to a support block between 30,400 and the psychological level of 30k.
→ A strong bounce from this block could indicate activated demand (a sign of an emotional selling climax in Wyckoff's terminology).
We then suggested that this support block would hold, and the Japanese stock market might enter a consolidation phase to establish a new balance of supply and demand.
Today, the technical analysis of the Nikkei 225 (Japan 225 on FXOpen) chart shows:
→ The price has risen from the support block around 30,400 and is currently near 35,000.
→ Notably, the price found support at the lower boundary of the linear regression channel, indicating deviations from average values (shown in light purple). The lower boundary acted as support.
→ The price is below 38,000, where previous supports, including the lower boundary of a significant ascending channel (shown with blue lines), were breached. These are now expected to act as resistance.
Thus, after an extremely volatile Monday, the market may continue to develop a consolidation phase with decreasing amplitude, within the range of 30k to 38k. This phase will help establish a clearer consensus on the fair valuation of the Japanese stock market, considering the Bank of Japan's rate hike last week and the risks of a US recession.
Trade global index CFDs with zero commission and tight spreads. Open your FXOpen account now or learn more about trading index CFDs with FXOpen.
CFDs are complex instruments and come with a high risk of losing your money.
This article represents the opinion of the Companies operating under the FXOpen brand only. It is not to be construed as an offer, solicitation, or recommendation with respect to products and services provided by the Companies operating under the FXOpen brand, nor is it to be considered financial advice.

👍2
#XAGUSD #silver #marketanalysis #MarketNews
Silver Price Finds Support Near 3-Month Low
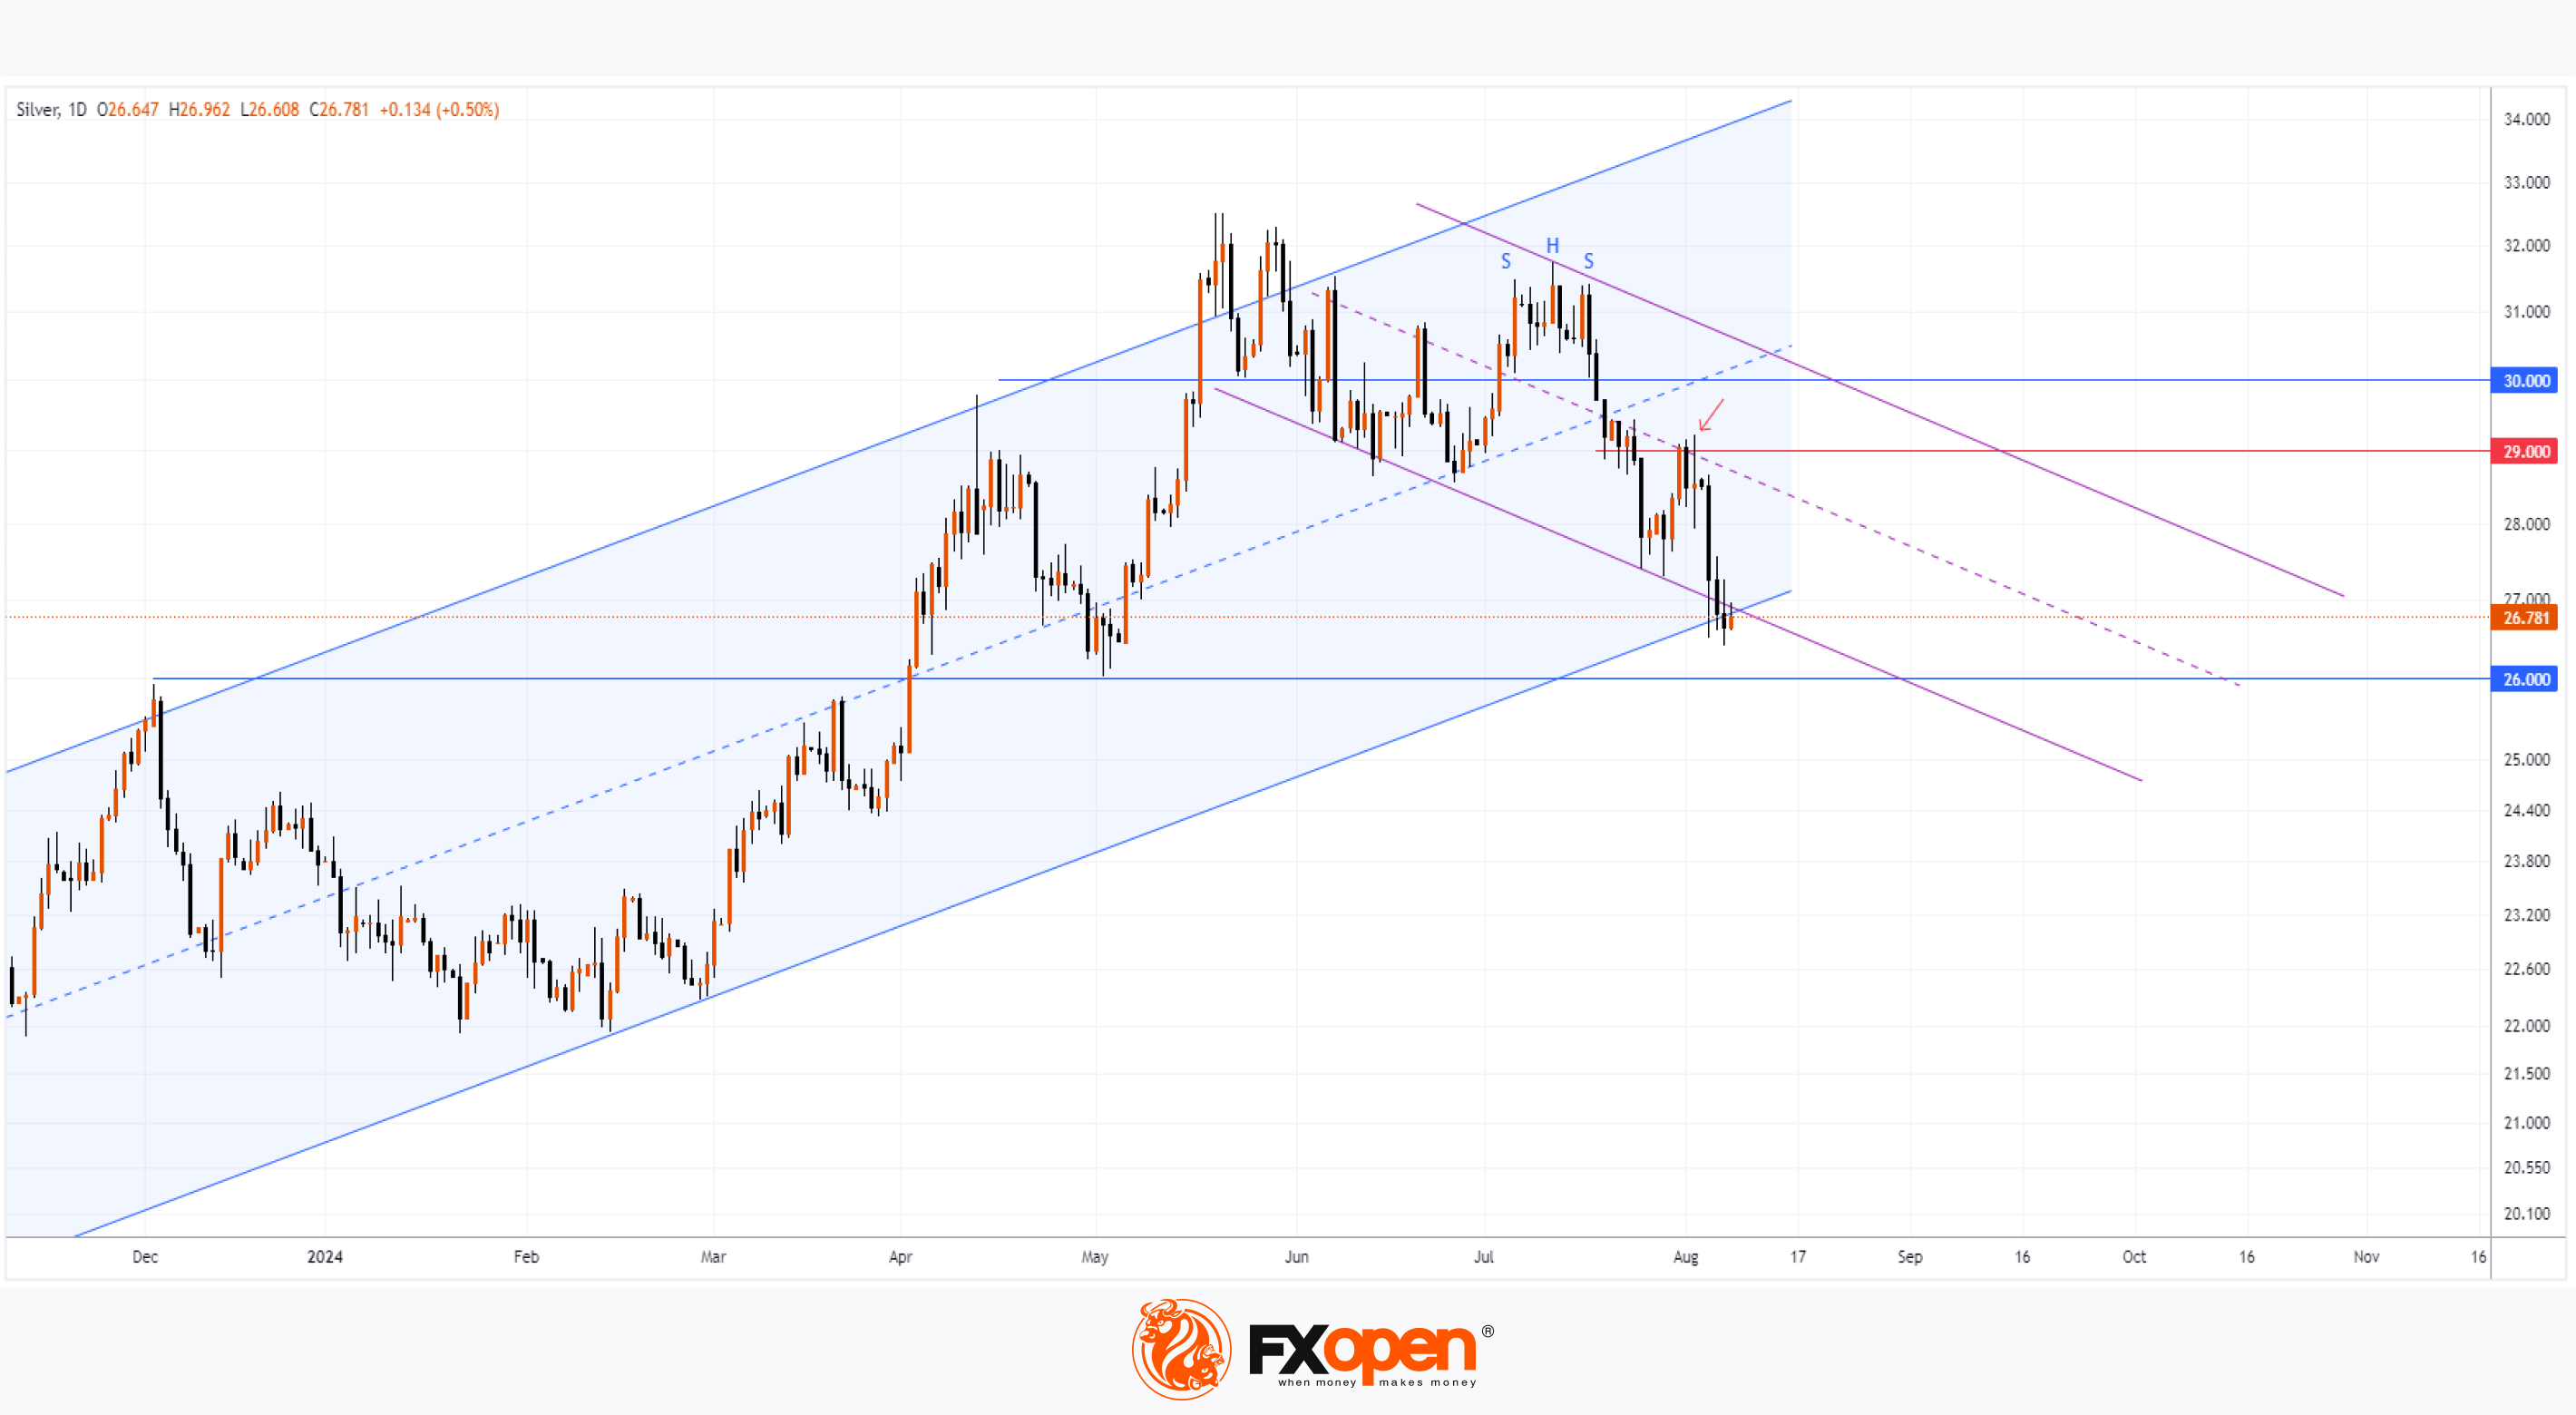
As shown on the XAG/USD chart, the price of silver is currently around $26.75 this week, marking the lowest level since early May.
In our analysis of silver on June 6, we noted:
→ Silver was underperforming gold—a bearish sign;
→ Other bearish indicators included a double top pattern near the $32 per ounce level.
Since the close on June 6, silver prices have dropped by more than 14%, with:
→ A bearish head-and-shoulders pattern forming above the psychological level of $30 per ounce;
→ The price breaking below the median line of an ascending channel (shown in blue);
→ The price establishing a downward channel (shown in purple), with the $29 level acting as resistance (indicated by an arrow).
One of the drivers of this decline has been recession fears in the U.S. economy, as commodity markets typically experience downward trends during recessions.
Could the bearish trend in silver continue?
While further declines can't be ruled out, technical analysis of the XAG/USD chart today suggests that silver is finding support at current levels:
→ Support is likely at the lower boundary of the blue channel;
→ The $26 per ounce level, which previously influenced significant price extremes, could also offer support.
Notably, yesterday's silver price dipped below Monday's low but is recovering today. This inability of the bears to extend the downward momentum suggests their pressure is weakening, and the bulls may be poised to take control.
Start trading commodities with tight spreads. Open your trading account now or learn more about trading commodity CFDs with FXOpen.
CFDs are complex instruments and come with a high risk of losing your money.
This article represents the opinion of the Companies operating under the FXOpen brand only. It is not to be construed as an offer, solicitation, or recommendation with respect to products and services provided by the Companies operating under the FXOpen brand, nor is it to be considered financial advice.
Silver Price Finds Support Near 3-Month Low
As shown on the XAG/USD chart, the price of silver is currently around $26.75 this week, marking the lowest level since early May.
In our analysis of silver on June 6, we noted:
→ Silver was underperforming gold—a bearish sign;
→ Other bearish indicators included a double top pattern near the $32 per ounce level.
Since the close on June 6, silver prices have dropped by more than 14%, with:
→ A bearish head-and-shoulders pattern forming above the psychological level of $30 per ounce;
→ The price breaking below the median line of an ascending channel (shown in blue);
→ The price establishing a downward channel (shown in purple), with the $29 level acting as resistance (indicated by an arrow).
One of the drivers of this decline has been recession fears in the U.S. economy, as commodity markets typically experience downward trends during recessions.
Could the bearish trend in silver continue?
While further declines can't be ruled out, technical analysis of the XAG/USD chart today suggests that silver is finding support at current levels:
→ Support is likely at the lower boundary of the blue channel;
→ The $26 per ounce level, which previously influenced significant price extremes, could also offer support.
Notably, yesterday's silver price dipped below Monday's low but is recovering today. This inability of the bears to extend the downward momentum suggests their pressure is weakening, and the bulls may be poised to take control.
Start trading commodities with tight spreads. Open your trading account now or learn more about trading commodity CFDs with FXOpen.
CFDs are complex instruments and come with a high risk of losing your money.
This article represents the opinion of the Companies operating under the FXOpen brand only. It is not to be construed as an offer, solicitation, or recommendation with respect to products and services provided by the Companies operating under the FXOpen brand, nor is it to be considered financial advice.
👍2
#stockmarket #marketanalysis #LLY #stocks
Eli Lilly Shares Surge Over 9% After Strong Earnings Report
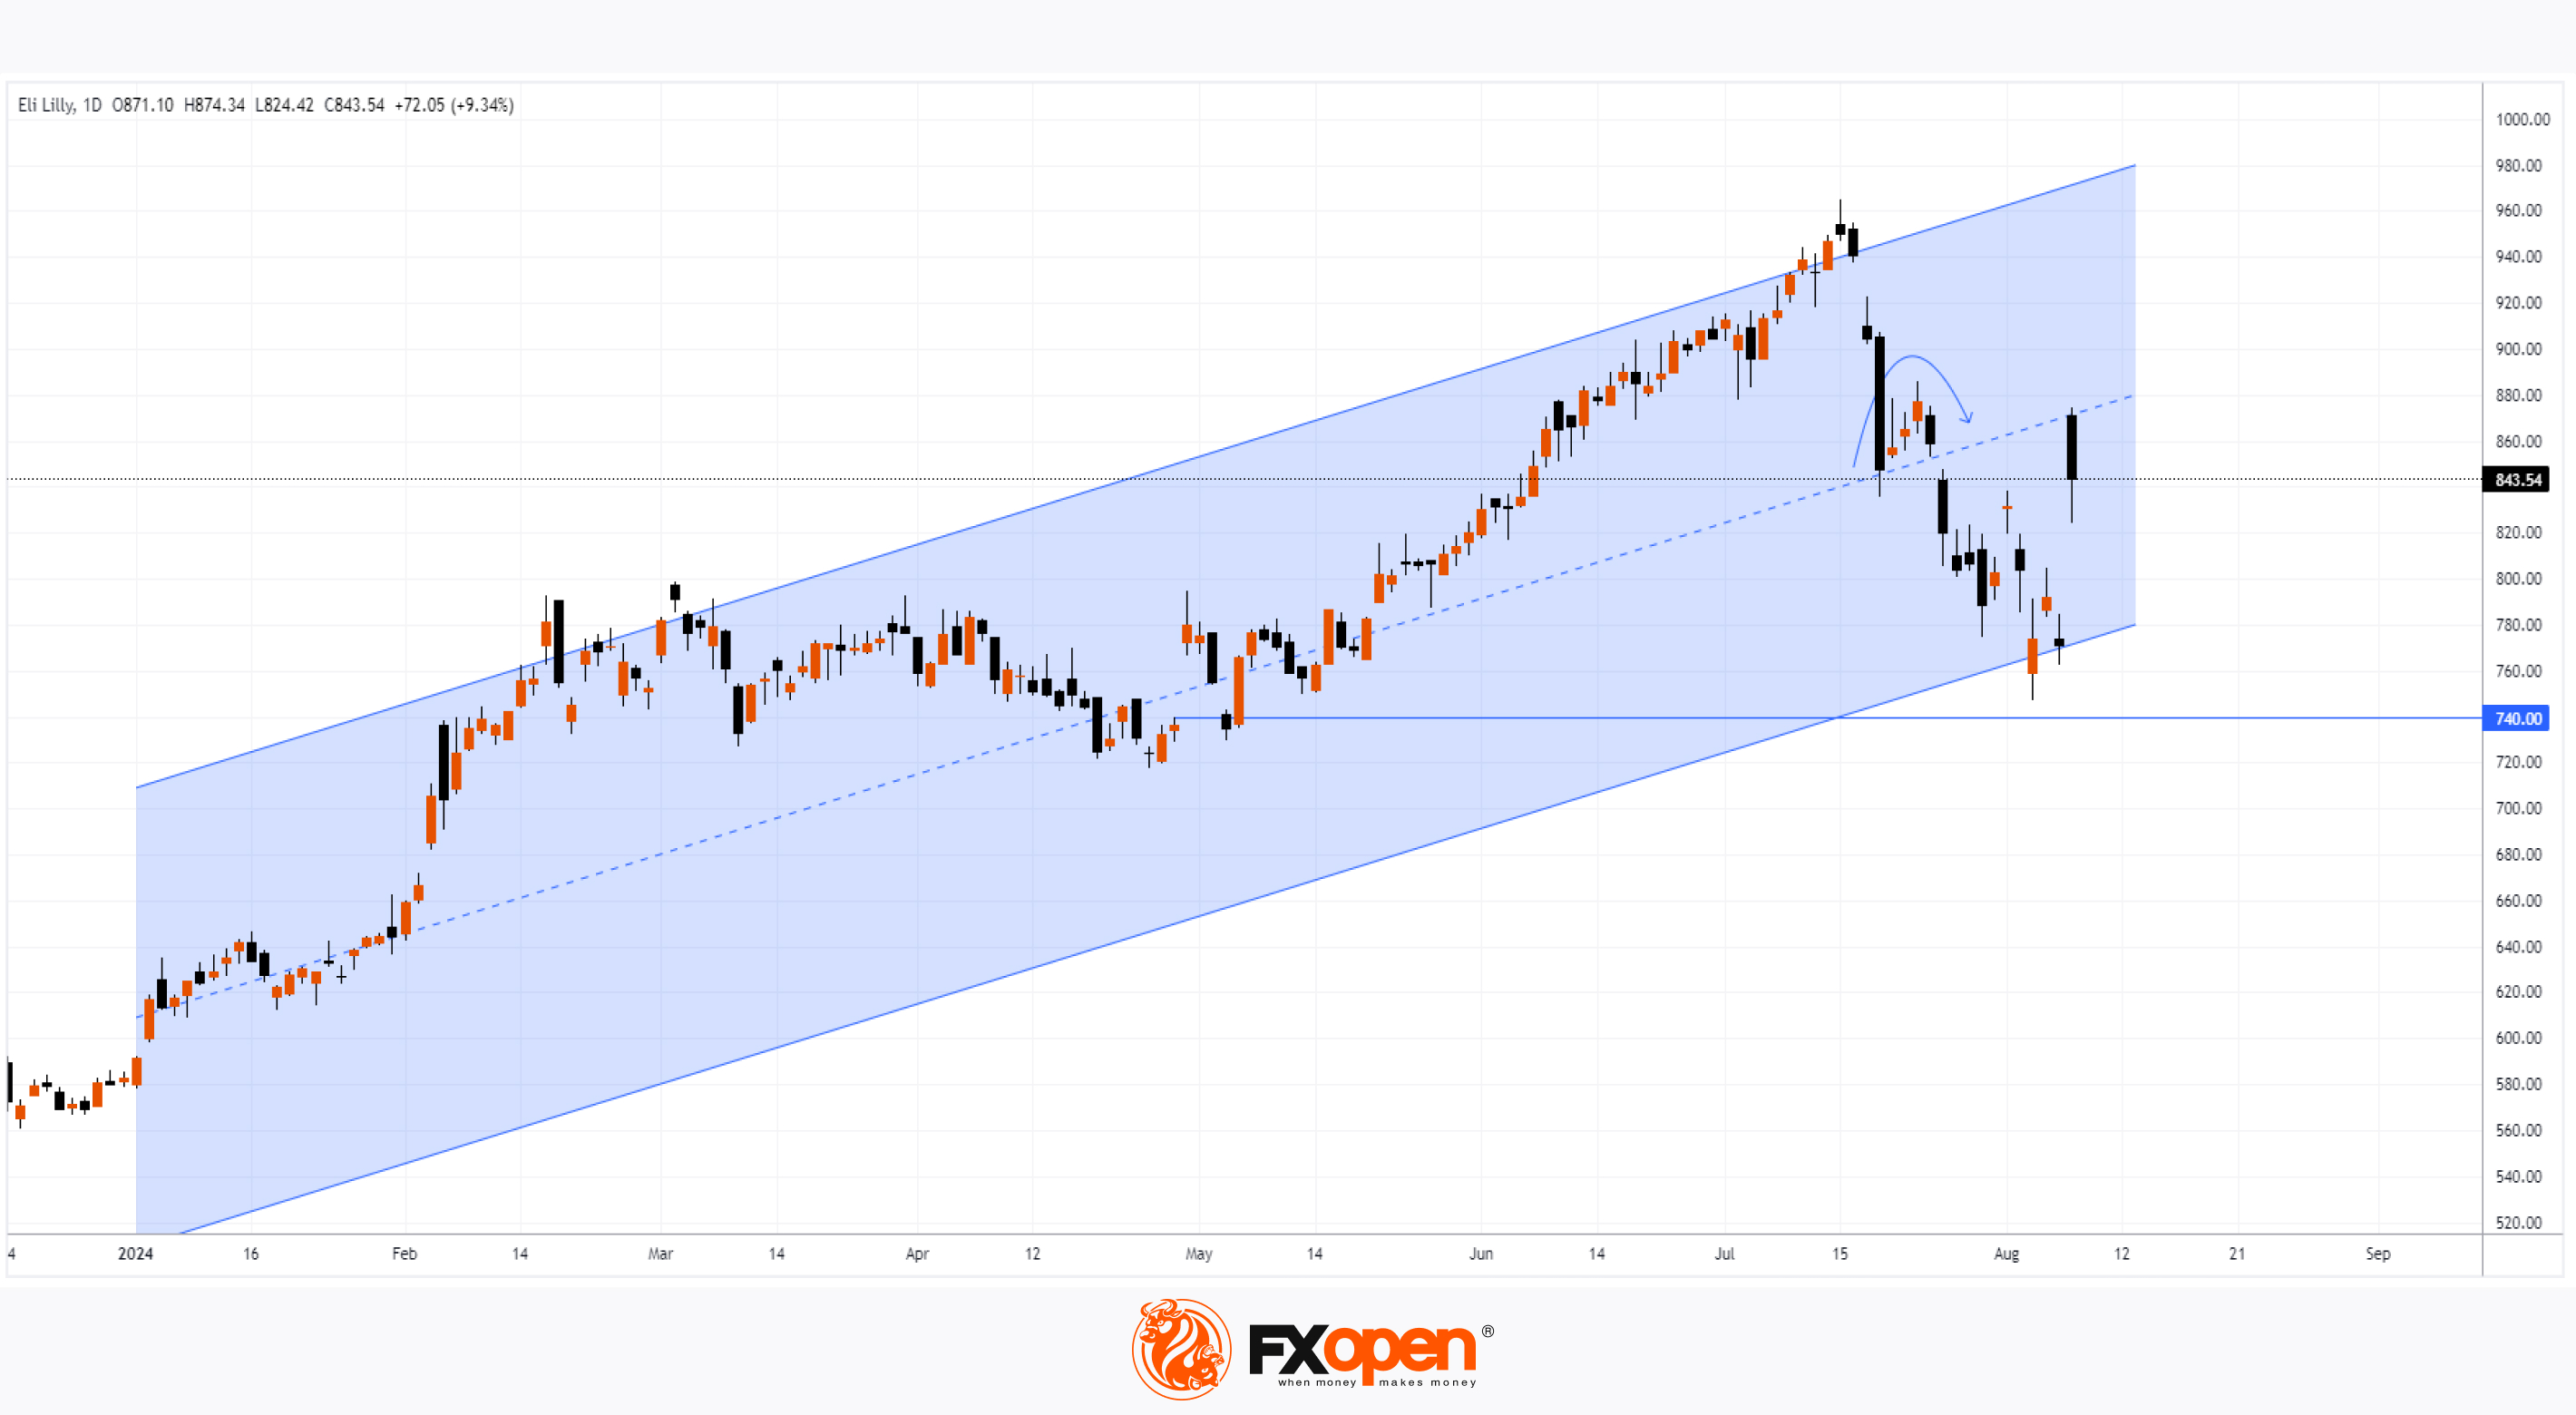
As the chart of Eli Lilly's (LLY) share price shows today, yesterday's trading closed at a level more than 9% higher than Wednesday's closing price. The main driver of this growth was a strong Q2 report:
→ Earnings per share: actual = $3.92, expected = $2.74;
→ Gross sales: actual = $11.3 billion, expected = $9.99 billion.
Market participants reacted positively not only to the fact that the American pharmaceutical company's actual results significantly exceeded forecasts but also to Eli Lilly's rising expectations for the second half of the year, driven by demand for its diabetes treatment Mounjaro and weight loss drug Zepbound.
Technical analysis of the Eli Lilly (LLY) stock chart shows that:
→ The price action is forming an upward channel in 2024 (shown in blue);
→ After a rebound, the median line of this channel was breached (as indicated by the arrow);
→ As could be expected, this line acted as resistance – as indicated by the high of yesterday's candlestick.
What is the forecast for Eli Lilly (LLY) shares?
Wall Street analysts surveyed by TipRanks remain positive – none of them recommend selling shares of the company, which has the largest market cap in the healthcare sector at over $800 billion. On average, they forecast that LLY shares will reach $955 within 12 months.
This suggests that the current upward channel may remain relevant. However, it’s possible that:
→ The lower boundary will continue to act as support;
→ The boundaries of the bullish gap formed at yesterday's opening may also provide support. A similar action can be seen on the chart – after a wide bullish gap (also formed following a strong report) on 30 April, LLY shares found support near the lower boundary of that gap around $740.
Trade global index CFDs with zero commission and tight spreads. Open your FXOpen account now or learn more about trading index CFDs with FXOpen.
CFDs are complex instruments and come with a high risk of losing your money.
This article represents the opinion of the Companies operating under the FXOpen brand only. It is not to be construed as an offer, solicitation, or recommendation with respect to products and services provided by the Companies operating under the FXOpen brand, nor is it to be considered financial advice.
Eli Lilly Shares Surge Over 9% After Strong Earnings Report
As the chart of Eli Lilly's (LLY) share price shows today, yesterday's trading closed at a level more than 9% higher than Wednesday's closing price. The main driver of this growth was a strong Q2 report:
→ Earnings per share: actual = $3.92, expected = $2.74;
→ Gross sales: actual = $11.3 billion, expected = $9.99 billion.
Market participants reacted positively not only to the fact that the American pharmaceutical company's actual results significantly exceeded forecasts but also to Eli Lilly's rising expectations for the second half of the year, driven by demand for its diabetes treatment Mounjaro and weight loss drug Zepbound.
Technical analysis of the Eli Lilly (LLY) stock chart shows that:
→ The price action is forming an upward channel in 2024 (shown in blue);
→ After a rebound, the median line of this channel was breached (as indicated by the arrow);
→ As could be expected, this line acted as resistance – as indicated by the high of yesterday's candlestick.
What is the forecast for Eli Lilly (LLY) shares?
Wall Street analysts surveyed by TipRanks remain positive – none of them recommend selling shares of the company, which has the largest market cap in the healthcare sector at over $800 billion. On average, they forecast that LLY shares will reach $955 within 12 months.
This suggests that the current upward channel may remain relevant. However, it’s possible that:
→ The lower boundary will continue to act as support;
→ The boundaries of the bullish gap formed at yesterday's opening may also provide support. A similar action can be seen on the chart – after a wide bullish gap (also formed following a strong report) on 30 April, LLY shares found support near the lower boundary of that gap around $740.
Trade global index CFDs with zero commission and tight spreads. Open your FXOpen account now or learn more about trading index CFDs with FXOpen.
CFDs are complex instruments and come with a high risk of losing your money.
This article represents the opinion of the Companies operating under the FXOpen brand only. It is not to be construed as an offer, solicitation, or recommendation with respect to products and services provided by the Companies operating under the FXOpen brand, nor is it to be considered financial advice.
👍3
#NVDA #stockmarket #stocktrading #nvidia
NVDA Share Price Holds Above Psychological Level
On 10 July, we noted strong selling pressure above the $130 per share level. Since then, the price has dropped by approximately 22%. Losing more than a fifth of its market value seems like a serious issue, but it’s not as bad as it might appear, especially with emotions running high amid fears of a potential US recession.
Technical analysis of the NVDA chart today shows that:
→ The price is forming an upward trend (shown in blue). The false breakout of the upper boundary on 20 June mirrors the false breakout of the lower boundary of the channel on 5 August (as indicated by the arrows).
→ It’s important to focus on the interaction between the price and the psychological level of $100. On 5 August, when the price dropped below the lower boundary of the channel, it fell below this round number. However, by the end of the week, NVDA's price had recovered (along with many other stocks in the US market). It’s reasonable to assume that retail traders, who had earlier in 2024 bought NVDA shares on margin due to the prospects of AI development, rushed to liquidate their long positions when they saw the price dip below $100.
Thus, the area around the psychological level of $100, reinforced by the lower boundary of the channel, proved to be an important support last week – from the 5 August low, the price has already risen by 15%, approaching the $116 level. This could act as resistance, as it represents the 50% retracement from the decline between the arrows.
Meanwhile, forecasts remain positive. According to a TipRanks survey of 41 Wall Street analysts, the average price target for NVDA is $144 within 12 months. Is this realistic?
It’s possible that by early autumn, the bulls could shift market sentiment in their favour – much will depend on the fundamental backdrop. Nvidia’s Q2 report is due on 28 August. Recall that after the Q1 report, which was published on 22 May, NVDA's price surged past the $100 psychological resistance with strong momentum. It’s likely that on 28 August, this level will continue to serve as support.
Trade global index CFDs with zero commission and tight spreads. Open your FXOpen account now or learn more about trading index CFDs with FXOpen.
CFDs are complex instruments and come with a high risk of losing your money.
This article represents the opinion of the Companies operating under the FXOpen brand only. It is not to be construed as an offer, solicitation, or recommendation with respect to products and services provided by the Companies operating under the FXOpen brand, nor is it to be considered financial advice.
NVDA Share Price Holds Above Psychological Level
On 10 July, we noted strong selling pressure above the $130 per share level. Since then, the price has dropped by approximately 22%. Losing more than a fifth of its market value seems like a serious issue, but it’s not as bad as it might appear, especially with emotions running high amid fears of a potential US recession.
Technical analysis of the NVDA chart today shows that:
→ The price is forming an upward trend (shown in blue). The false breakout of the upper boundary on 20 June mirrors the false breakout of the lower boundary of the channel on 5 August (as indicated by the arrows).
→ It’s important to focus on the interaction between the price and the psychological level of $100. On 5 August, when the price dropped below the lower boundary of the channel, it fell below this round number. However, by the end of the week, NVDA's price had recovered (along with many other stocks in the US market). It’s reasonable to assume that retail traders, who had earlier in 2024 bought NVDA shares on margin due to the prospects of AI development, rushed to liquidate their long positions when they saw the price dip below $100.
Thus, the area around the psychological level of $100, reinforced by the lower boundary of the channel, proved to be an important support last week – from the 5 August low, the price has already risen by 15%, approaching the $116 level. This could act as resistance, as it represents the 50% retracement from the decline between the arrows.
Meanwhile, forecasts remain positive. According to a TipRanks survey of 41 Wall Street analysts, the average price target for NVDA is $144 within 12 months. Is this realistic?
It’s possible that by early autumn, the bulls could shift market sentiment in their favour – much will depend on the fundamental backdrop. Nvidia’s Q2 report is due on 28 August. Recall that after the Q1 report, which was published on 22 May, NVDA's price surged past the $100 psychological resistance with strong momentum. It’s likely that on 28 August, this level will continue to serve as support.
Trade global index CFDs with zero commission and tight spreads. Open your FXOpen account now or learn more about trading index CFDs with FXOpen.
CFDs are complex instruments and come with a high risk of losing your money.
This article represents the opinion of the Companies operating under the FXOpen brand only. It is not to be construed as an offer, solicitation, or recommendation with respect to products and services provided by the Companies operating under the FXOpen brand, nor is it to be considered financial advice.
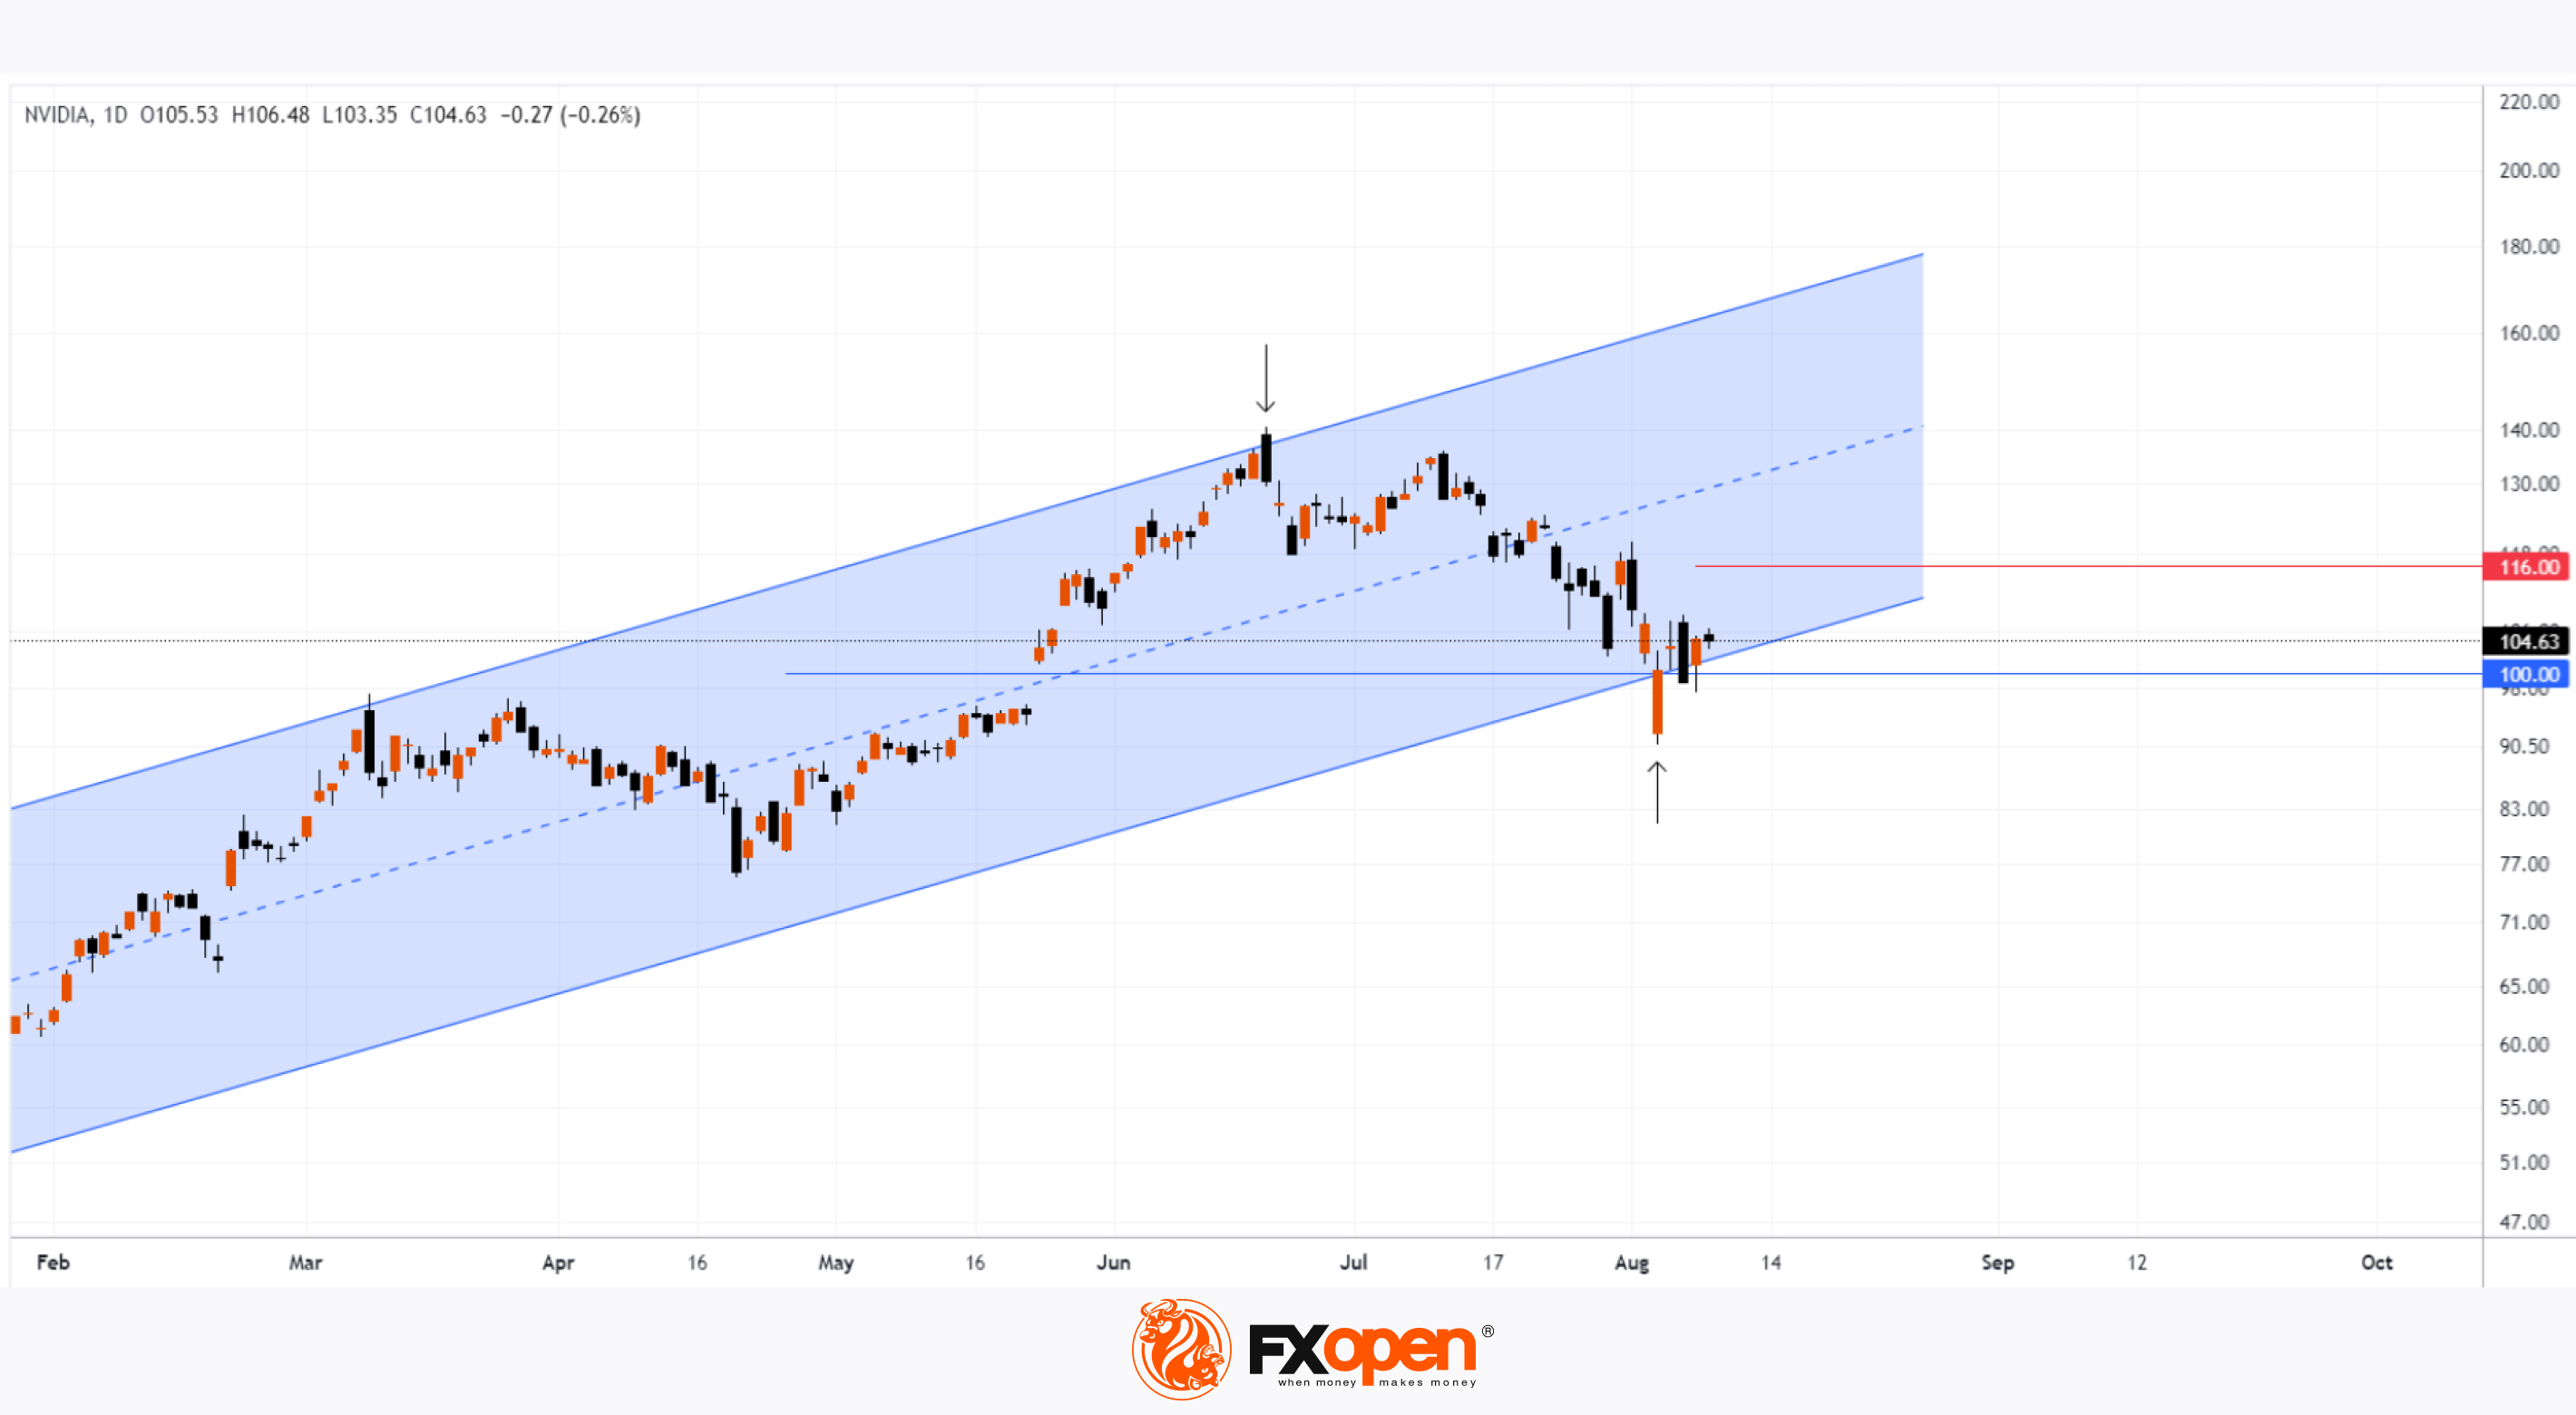
👍1
#marketanalysis #MarketNews #usdchf
USD/CHF Rises Over 2.5% in a Week
As indicated by the USD/CHF chart today, the rate is around 0.868 francs per US dollar, although it dropped below 0.85 last Monday.
The main driver of this surge in volatility (with the ATR indicator reaching its highest point since March 2023) was the decline in the Japanese stock market, which we covered twice last week: here and here. Market participants were actively buying the Swiss franc as a “safe haven” asset. However, when the Nikkei 225 (Japan 225 on FXOpen) began to recover from its nine-month lows, demand for the franc weakened.
Technical analysis of the USD/CHF chart shows that:
→ The price has extended the descending channel (shown in red). The line that provided support as the lower boundary of the channel from April to July has now become the median, and resistance can be expected from it.
→ Additionally, resistance might be provided by the black trendline, which became relevant in July.
→ From another perspective, the A-B-C-D-E structure resembles a bullish formation, where the size of the downward retracement is approximately 50% of the previous upward impulse.
And what about the fundamental backdrop?
Perhaps the most significant event of the week will be the US Consumer Price Index data for July on Wednesday (at 15:30 GMT+3), which is expected to show a slight increase in monthly inflation. This is no longer seen as a major concern. According to Reuters, Timothy Graf, senior macro strategist at State Street, said: “Inflation is no longer the problem it once was.”
Given these factors, there is reason to believe that in the coming days, the USD/CHF rate may stabilise around the red median line, after which a new impulse might form on the chart, signalling a reaction to the release of the US inflation news.
Trade over 50 forex markets 24 hours a day with FXOpen. Take advantage of low commissions, deep liquidity, and spreads from 0.0 pips. Open your FXOpen account now or learn more about trading forex with FXOpen.
CFDs are complex instruments and come with a high risk of losing your money.
This article represents the opinion of the Companies operating under the FXOpen brand only. It is not to be construed as an offer, solicitation, or recommendation with respect to products and services provided by the Companies operating under the FXOpen brand, nor is it to be considered financial advice.
USD/CHF Rises Over 2.5% in a Week
As indicated by the USD/CHF chart today, the rate is around 0.868 francs per US dollar, although it dropped below 0.85 last Monday.
The main driver of this surge in volatility (with the ATR indicator reaching its highest point since March 2023) was the decline in the Japanese stock market, which we covered twice last week: here and here. Market participants were actively buying the Swiss franc as a “safe haven” asset. However, when the Nikkei 225 (Japan 225 on FXOpen) began to recover from its nine-month lows, demand for the franc weakened.
Technical analysis of the USD/CHF chart shows that:
→ The price has extended the descending channel (shown in red). The line that provided support as the lower boundary of the channel from April to July has now become the median, and resistance can be expected from it.
→ Additionally, resistance might be provided by the black trendline, which became relevant in July.
→ From another perspective, the A-B-C-D-E structure resembles a bullish formation, where the size of the downward retracement is approximately 50% of the previous upward impulse.
And what about the fundamental backdrop?
Perhaps the most significant event of the week will be the US Consumer Price Index data for July on Wednesday (at 15:30 GMT+3), which is expected to show a slight increase in monthly inflation. This is no longer seen as a major concern. According to Reuters, Timothy Graf, senior macro strategist at State Street, said: “Inflation is no longer the problem it once was.”
Given these factors, there is reason to believe that in the coming days, the USD/CHF rate may stabilise around the red median line, after which a new impulse might form on the chart, signalling a reaction to the release of the US inflation news.
Trade over 50 forex markets 24 hours a day with FXOpen. Take advantage of low commissions, deep liquidity, and spreads from 0.0 pips. Open your FXOpen account now or learn more about trading forex with FXOpen.
CFDs are complex instruments and come with a high risk of losing your money.
This article represents the opinion of the Companies operating under the FXOpen brand only. It is not to be construed as an offer, solicitation, or recommendation with respect to products and services provided by the Companies operating under the FXOpen brand, nor is it to be considered financial advice.
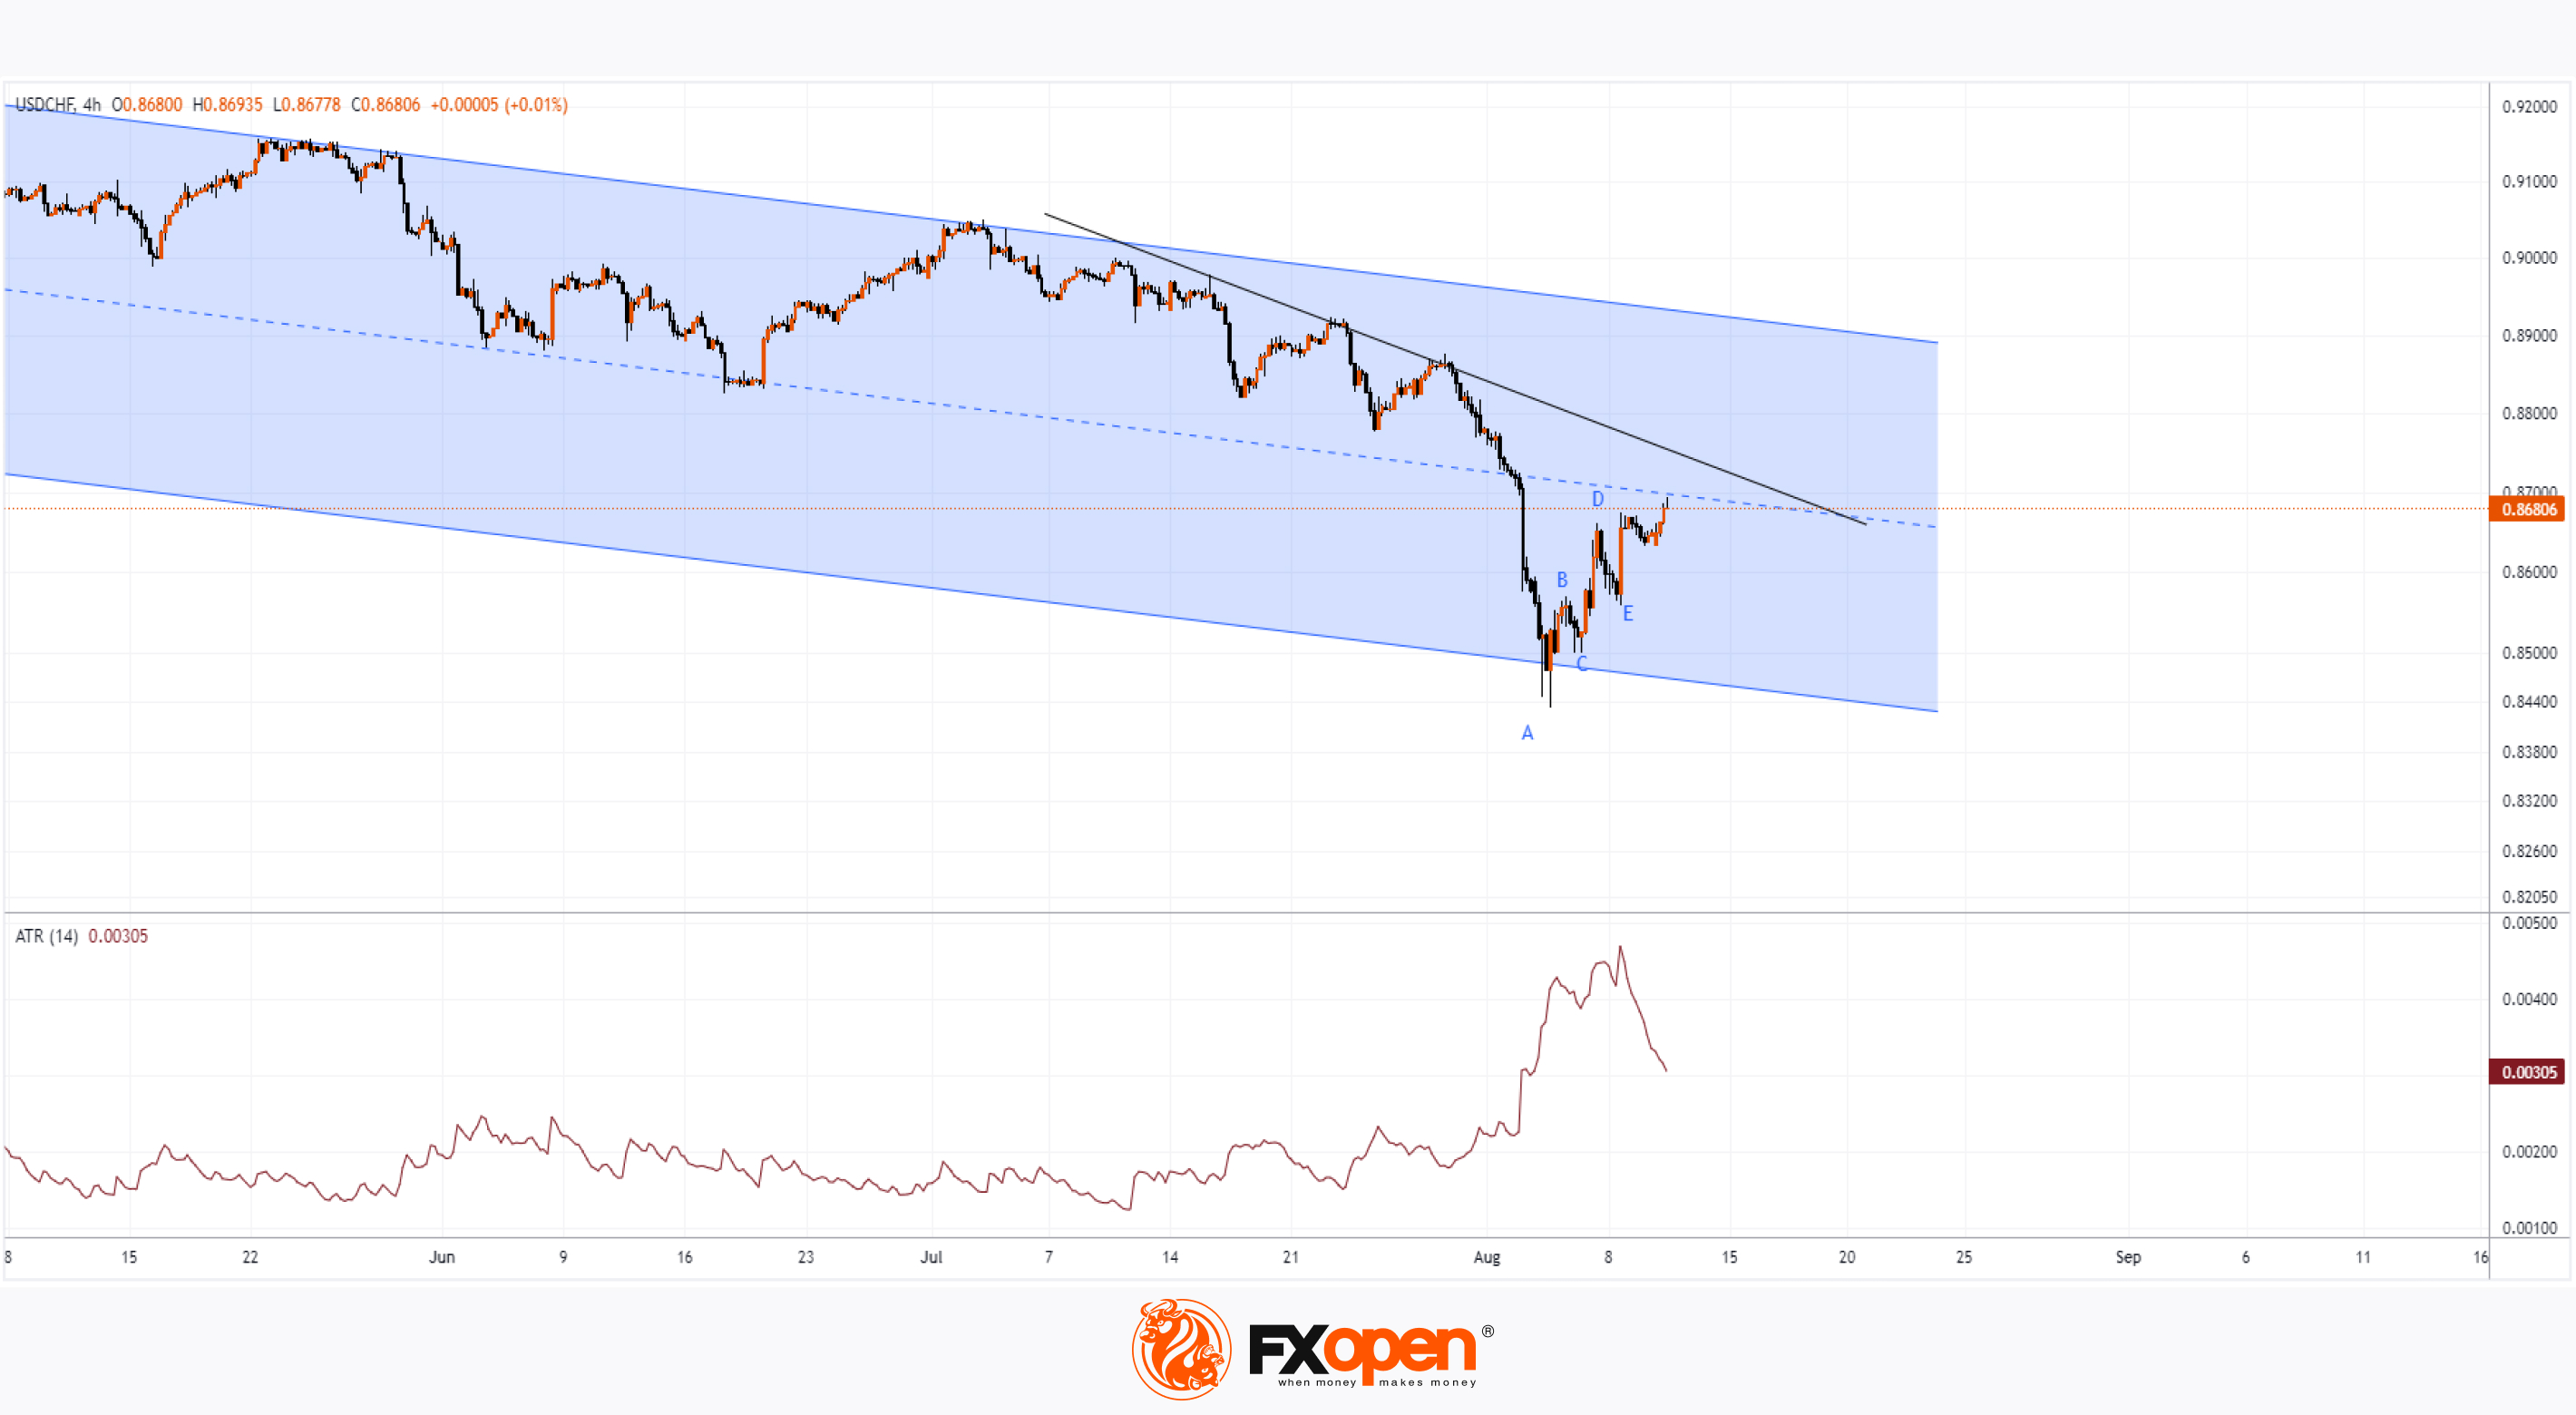
👍1
#goldprice #XAUUSD #xau #MarketNews
Gold Price Near Historic High Today
As shown on the XAU/USD chart, the gold price is near $2,460 today, despite the 8th August candle opening around $2,385. This means that in just over three full trading sessions, the price per ounce has risen by approximately 3.3%. It is now only about 1.6% away from the psychological level of $2,500.
Bullish sentiment is being driven by rising geopolitical tensions. According to Trading Economics:
→ Israeli airstrikes on Khan Yunis on Monday killed at least 18 people, with several others injured.
→ Ukrainian forces last week breached the Russian border and are holding positions in the Kursk region.
Technical Analysis of the XAU/USD Chart
The gold price is forming a trading channel (indicated in blue), with:
→ the current rise pushing the RSI indicator into overbought territory;
→ the price reaching the upper boundary of the blue channel;
→ in similar past situations (marked by yellow circles), a pullback to the channel’s median has consistently occurred, but this does not guarantee the same outcome this time;
→ the $2,436 level may act as support for the current price, having shown resistance signs on Friday before being breached by bulls.
It is possible that the gold price could set a new all-time high, driven by volatility spikes in the coming days.
The current bullish sentiment may be supported by market participants positioning themselves ahead of key US economic news: the Consumer Price Index (CPI) report will be released tomorrow (at 15:30 GMT+3), and on Thursday (also at 15:30 GMT+3), Core Retail Sales data and unemployment news will follow.
According to Dow Jones Newswires, Axis Securities research analyst Deven Gaglani believes that “a break above the $2,483 high and a weekly close above this level would be a bullish signal, potentially pushing prices to $2,550.” He also suggests that news of easing inflation could lead to a rise in gold prices.
Start trading commodities with tight spreads. Open your trading account now or learn more about trading commodity CFDs with FXOpen.
CFDs are complex instruments and come with a high risk of losing your money.
This article represents the opinion of the Companies operating under the FXOpen brand only. It is not to be construed as an offer, solicitation, or recommendation with respect to products and services provided by the Companies operating under the FXOpen brand, nor is it to be considered financial advice.
Gold Price Near Historic High Today
As shown on the XAU/USD chart, the gold price is near $2,460 today, despite the 8th August candle opening around $2,385. This means that in just over three full trading sessions, the price per ounce has risen by approximately 3.3%. It is now only about 1.6% away from the psychological level of $2,500.
Bullish sentiment is being driven by rising geopolitical tensions. According to Trading Economics:
→ Israeli airstrikes on Khan Yunis on Monday killed at least 18 people, with several others injured.
→ Ukrainian forces last week breached the Russian border and are holding positions in the Kursk region.
Technical Analysis of the XAU/USD Chart
The gold price is forming a trading channel (indicated in blue), with:
→ the current rise pushing the RSI indicator into overbought territory;
→ the price reaching the upper boundary of the blue channel;
→ in similar past situations (marked by yellow circles), a pullback to the channel’s median has consistently occurred, but this does not guarantee the same outcome this time;
→ the $2,436 level may act as support for the current price, having shown resistance signs on Friday before being breached by bulls.
It is possible that the gold price could set a new all-time high, driven by volatility spikes in the coming days.
The current bullish sentiment may be supported by market participants positioning themselves ahead of key US economic news: the Consumer Price Index (CPI) report will be released tomorrow (at 15:30 GMT+3), and on Thursday (also at 15:30 GMT+3), Core Retail Sales data and unemployment news will follow.
According to Dow Jones Newswires, Axis Securities research analyst Deven Gaglani believes that “a break above the $2,483 high and a weekly close above this level would be a bullish signal, potentially pushing prices to $2,550.” He also suggests that news of easing inflation could lead to a rise in gold prices.
Start trading commodities with tight spreads. Open your trading account now or learn more about trading commodity CFDs with FXOpen.
CFDs are complex instruments and come with a high risk of losing your money.
This article represents the opinion of the Companies operating under the FXOpen brand only. It is not to be construed as an offer, solicitation, or recommendation with respect to products and services provided by the Companies operating under the FXOpen brand, nor is it to be considered financial advice.
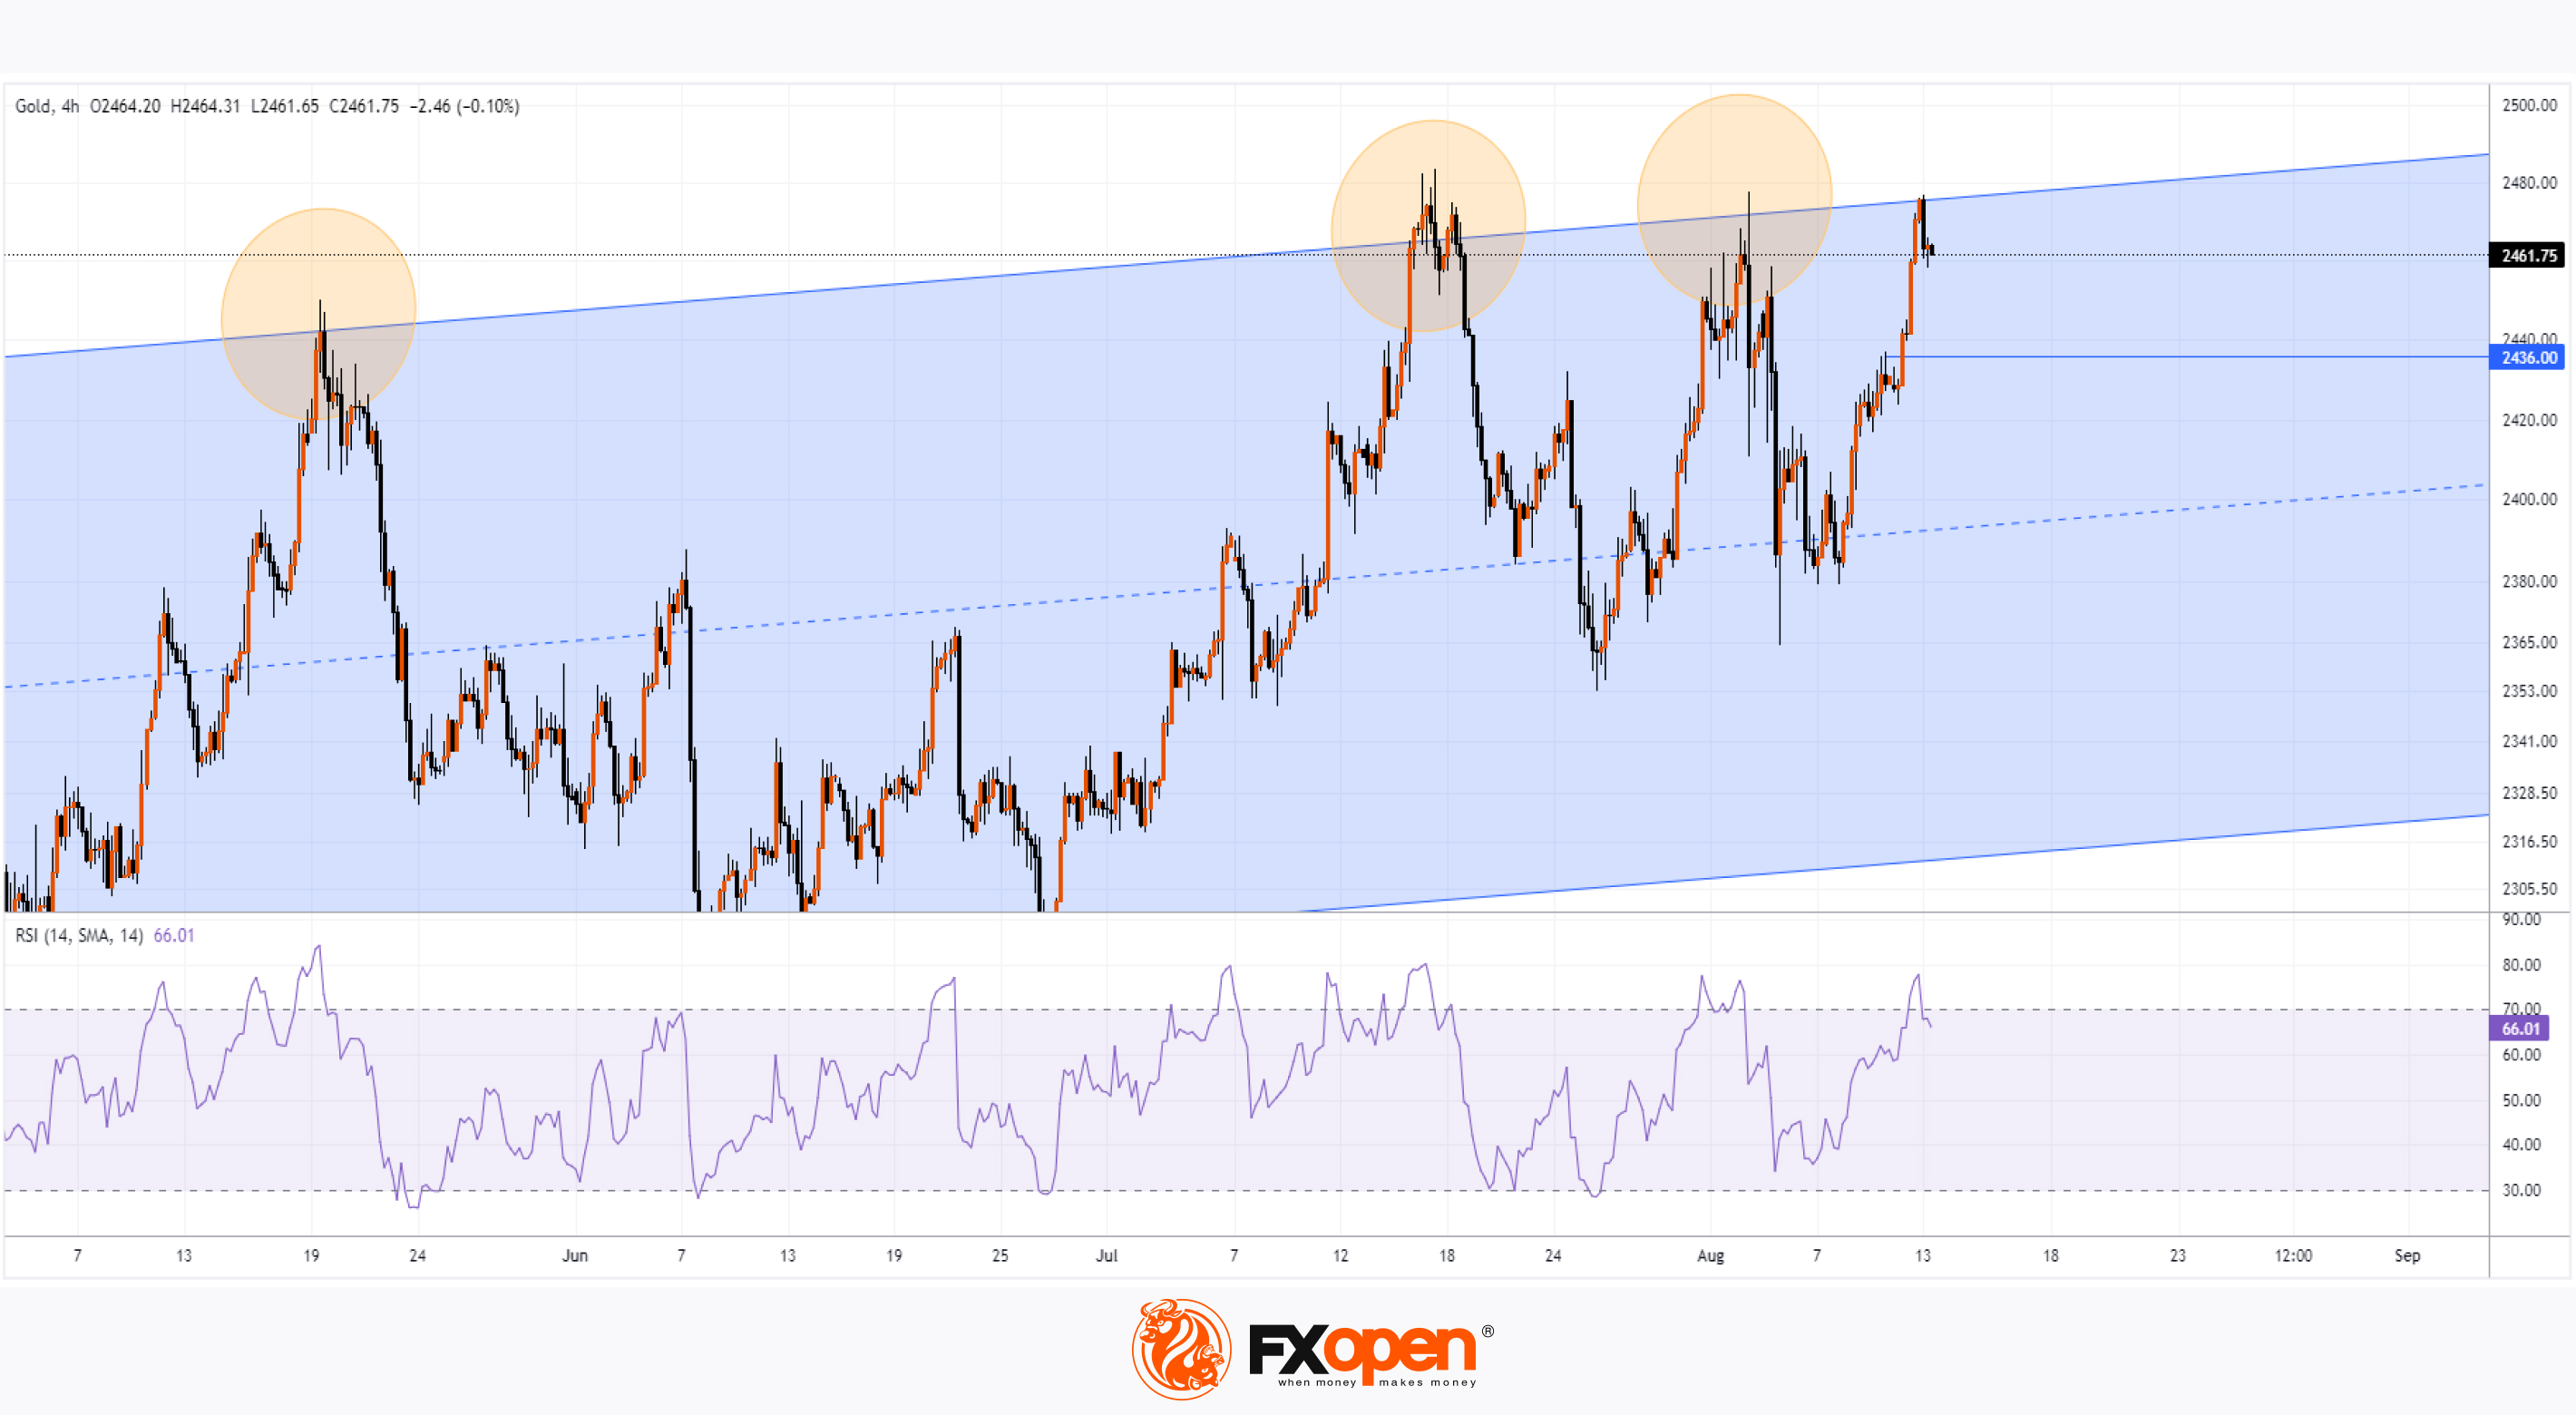
👍2
#stockmarket #stocktrading #marketanalysis
Alibaba Group (BABA) Stock Reaches Over Two-Month High
As shown on the BABA stock chart, the price today has risen to around $80.80—its highest level this summer.
The primary driver of bullish sentiment is the anticipation of a positive earnings report from Alibaba Group Holding Ltd for Q2 2024, set to be released on 15th August.
According to Dow Jones Newswires:
→ Lazada, a subsidiary of Alibaba Group, has reached a certain level of profitability, which is a promising sign for the tech giant as it seeks to boost international sales amid slowing growth in China.
→ Alibaba’s market share has stabilised after a decline in 2021. DBS analysts Sachin Mittal and Andy Yeo note that the Gross Merchandise Value (GMV) of goods sold on Taobao and Tmall has returned to double-digit growth, and Alibaba’s international e-commerce platforms could become a key driver, with an estimated compound annual growth rate of 23% from FY2024 to FY2027. DBS maintains its buy recommendation for Alibaba shares.
Technical analysis of the Alibaba (BABA) stock chart shows that:
→ The price is forming an ascending channel (shown in blue) and has already risen to its median line. However, it remains under pressure from a descending trendline that has been in place since 2023.
→ The chart shows patterns of false breakouts (marked with arrows) of previous local highs. It’s possible that a similar pattern (with a return below the psychological level of $80.00) could occur before the report is released.
Be prepared for sharp movements in Alibaba Group (BABA) stock around the time of the report’s publication. It could either meet bullish expectations or deliver a bearish surprise.
Trade global index CFDs with zero commission and tight spreads. Open your FXOpen account now or learn more about trading index CFDs with FXOpen.
CFDs are complex instruments and come with a high risk of losing your money.
This article represents the opinion of the Companies operating under the FXOpen brand only. It is not to be construed as an offer, solicitation, or recommendation with respect to products and services provided by the Companies operating under the FXOpen brand, nor is it to be considered financial advice.
Alibaba Group (BABA) Stock Reaches Over Two-Month High
As shown on the BABA stock chart, the price today has risen to around $80.80—its highest level this summer.
The primary driver of bullish sentiment is the anticipation of a positive earnings report from Alibaba Group Holding Ltd for Q2 2024, set to be released on 15th August.
According to Dow Jones Newswires:
→ Lazada, a subsidiary of Alibaba Group, has reached a certain level of profitability, which is a promising sign for the tech giant as it seeks to boost international sales amid slowing growth in China.
→ Alibaba’s market share has stabilised after a decline in 2021. DBS analysts Sachin Mittal and Andy Yeo note that the Gross Merchandise Value (GMV) of goods sold on Taobao and Tmall has returned to double-digit growth, and Alibaba’s international e-commerce platforms could become a key driver, with an estimated compound annual growth rate of 23% from FY2024 to FY2027. DBS maintains its buy recommendation for Alibaba shares.
Technical analysis of the Alibaba (BABA) stock chart shows that:
→ The price is forming an ascending channel (shown in blue) and has already risen to its median line. However, it remains under pressure from a descending trendline that has been in place since 2023.
→ The chart shows patterns of false breakouts (marked with arrows) of previous local highs. It’s possible that a similar pattern (with a return below the psychological level of $80.00) could occur before the report is released.
Be prepared for sharp movements in Alibaba Group (BABA) stock around the time of the report’s publication. It could either meet bullish expectations or deliver a bearish surprise.
Trade global index CFDs with zero commission and tight spreads. Open your FXOpen account now or learn more about trading index CFDs with FXOpen.
CFDs are complex instruments and come with a high risk of losing your money.
This article represents the opinion of the Companies operating under the FXOpen brand only. It is not to be construed as an offer, solicitation, or recommendation with respect to products and services provided by the Companies operating under the FXOpen brand, nor is it to be considered financial advice.
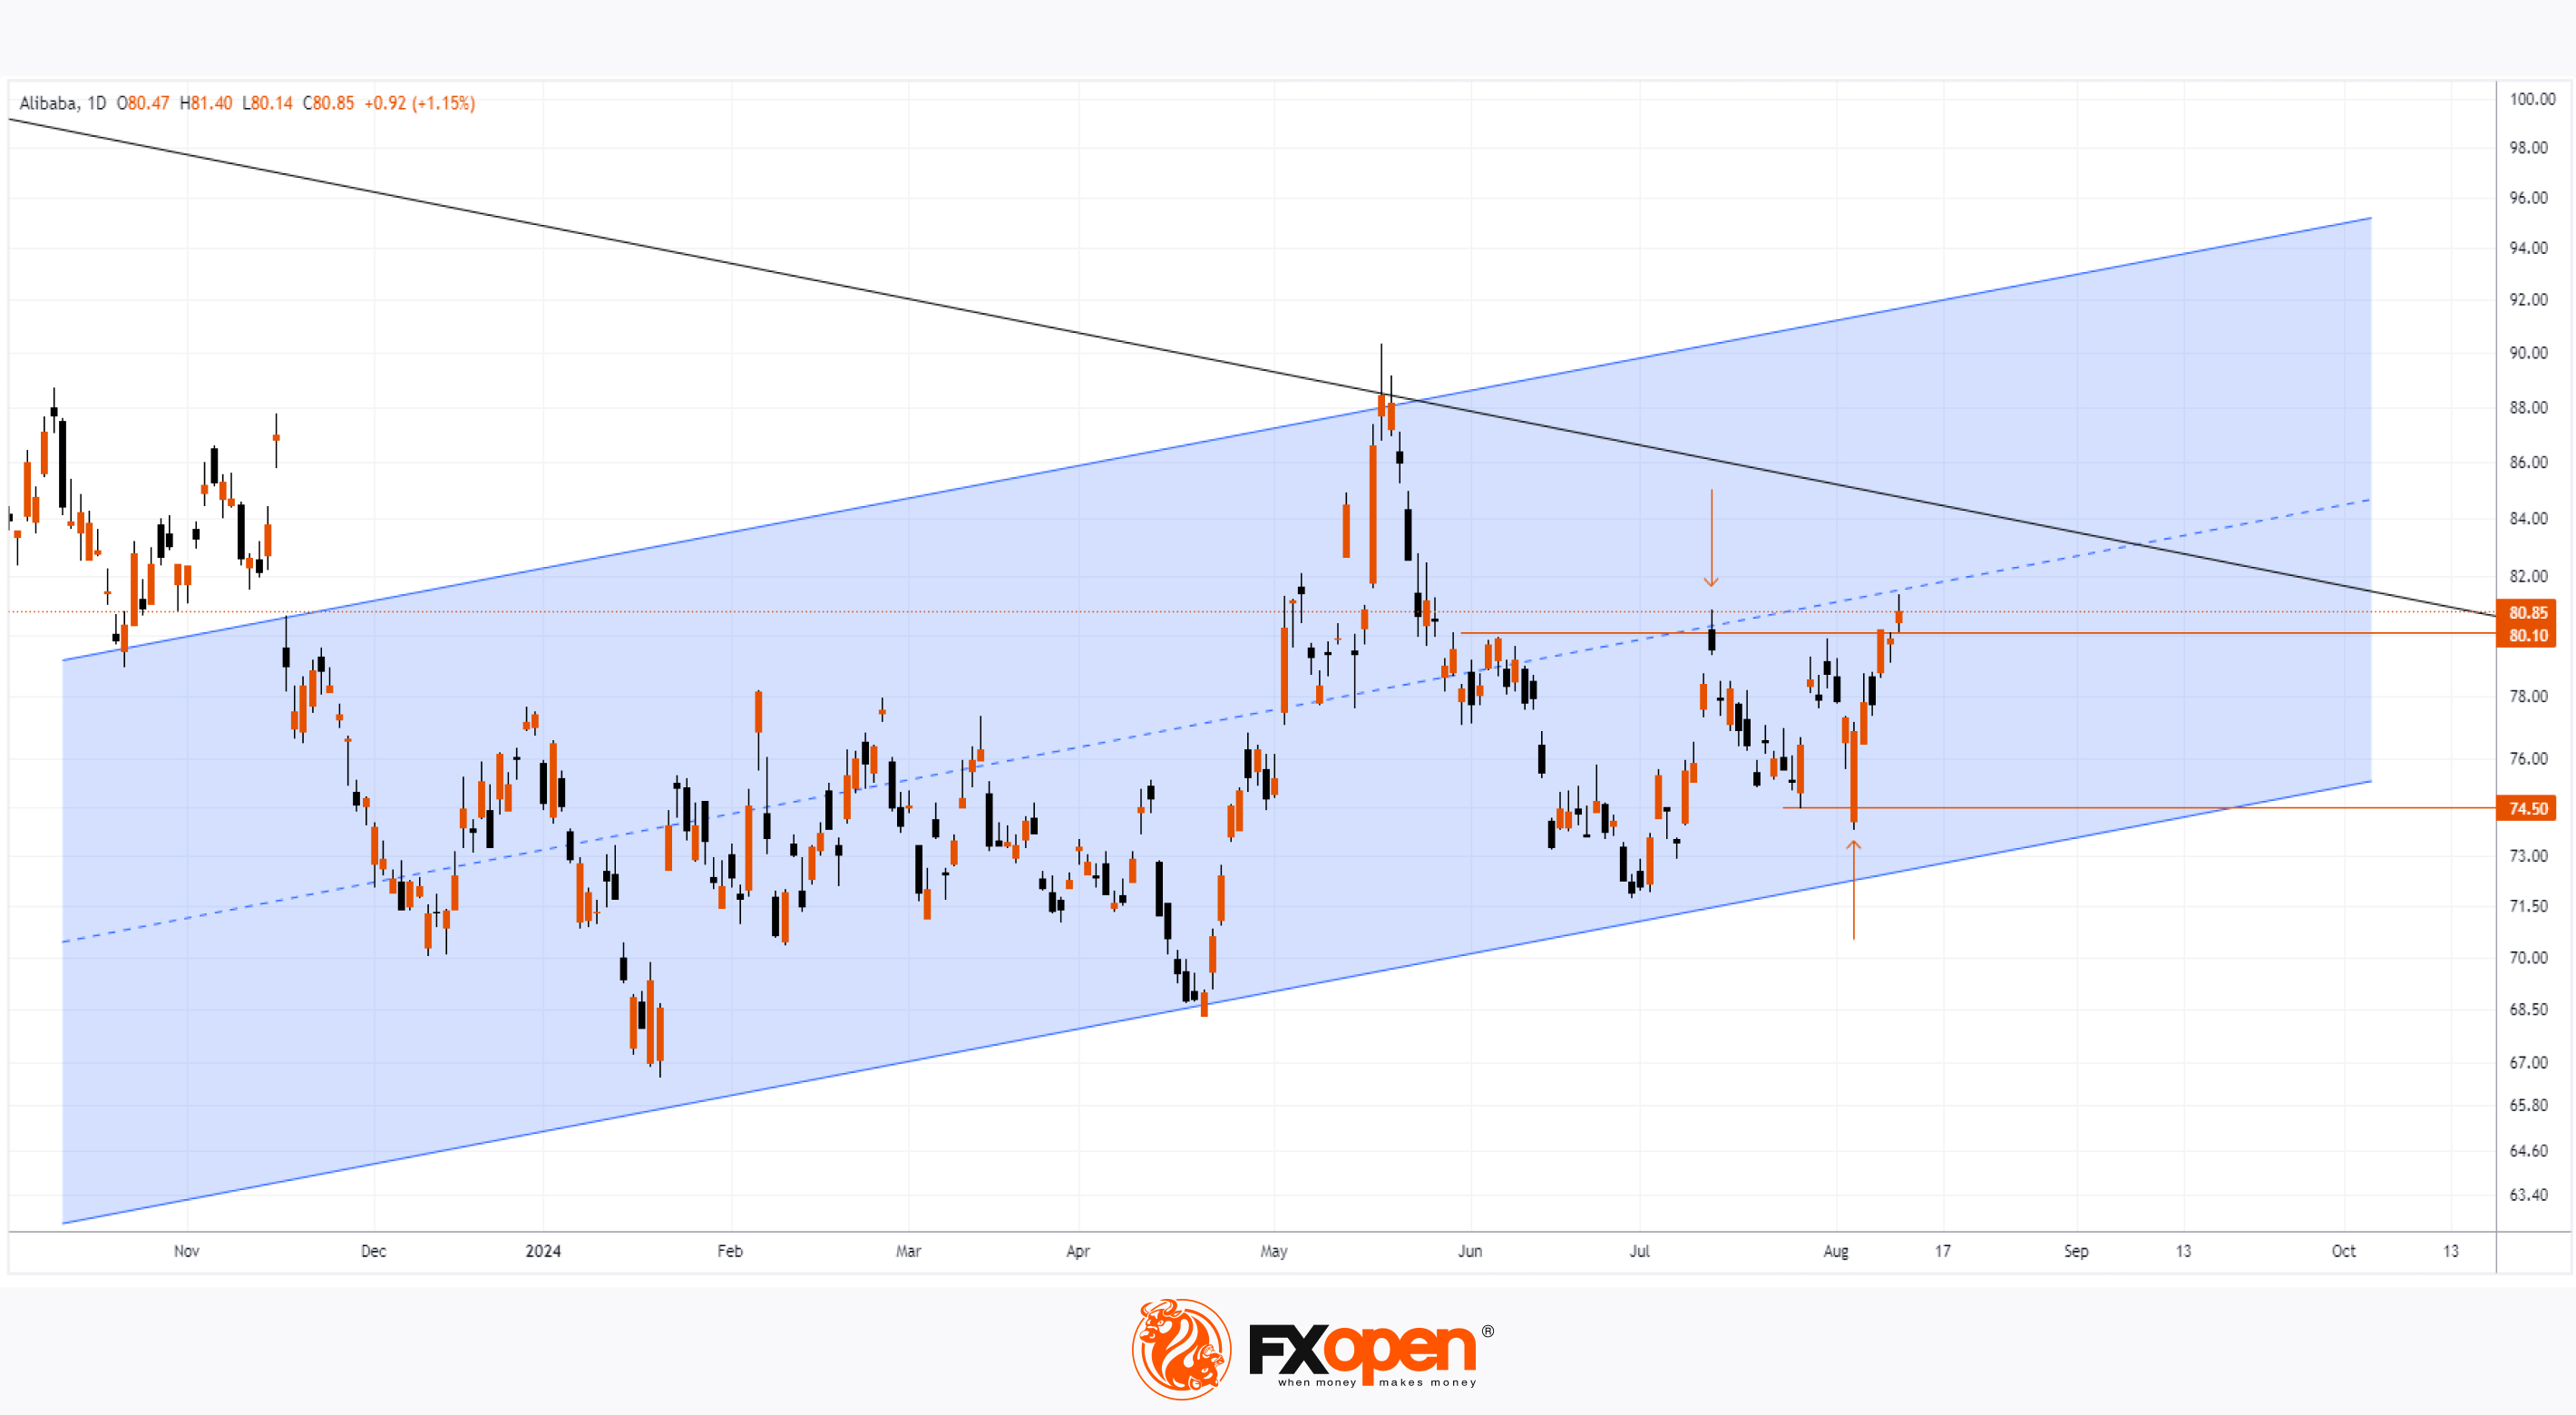
👍1