
#stockmarket #stocktrading #marketanalysis
PepsiCo Stock Rebounds from Yearly Low Ahead of Earnings Report
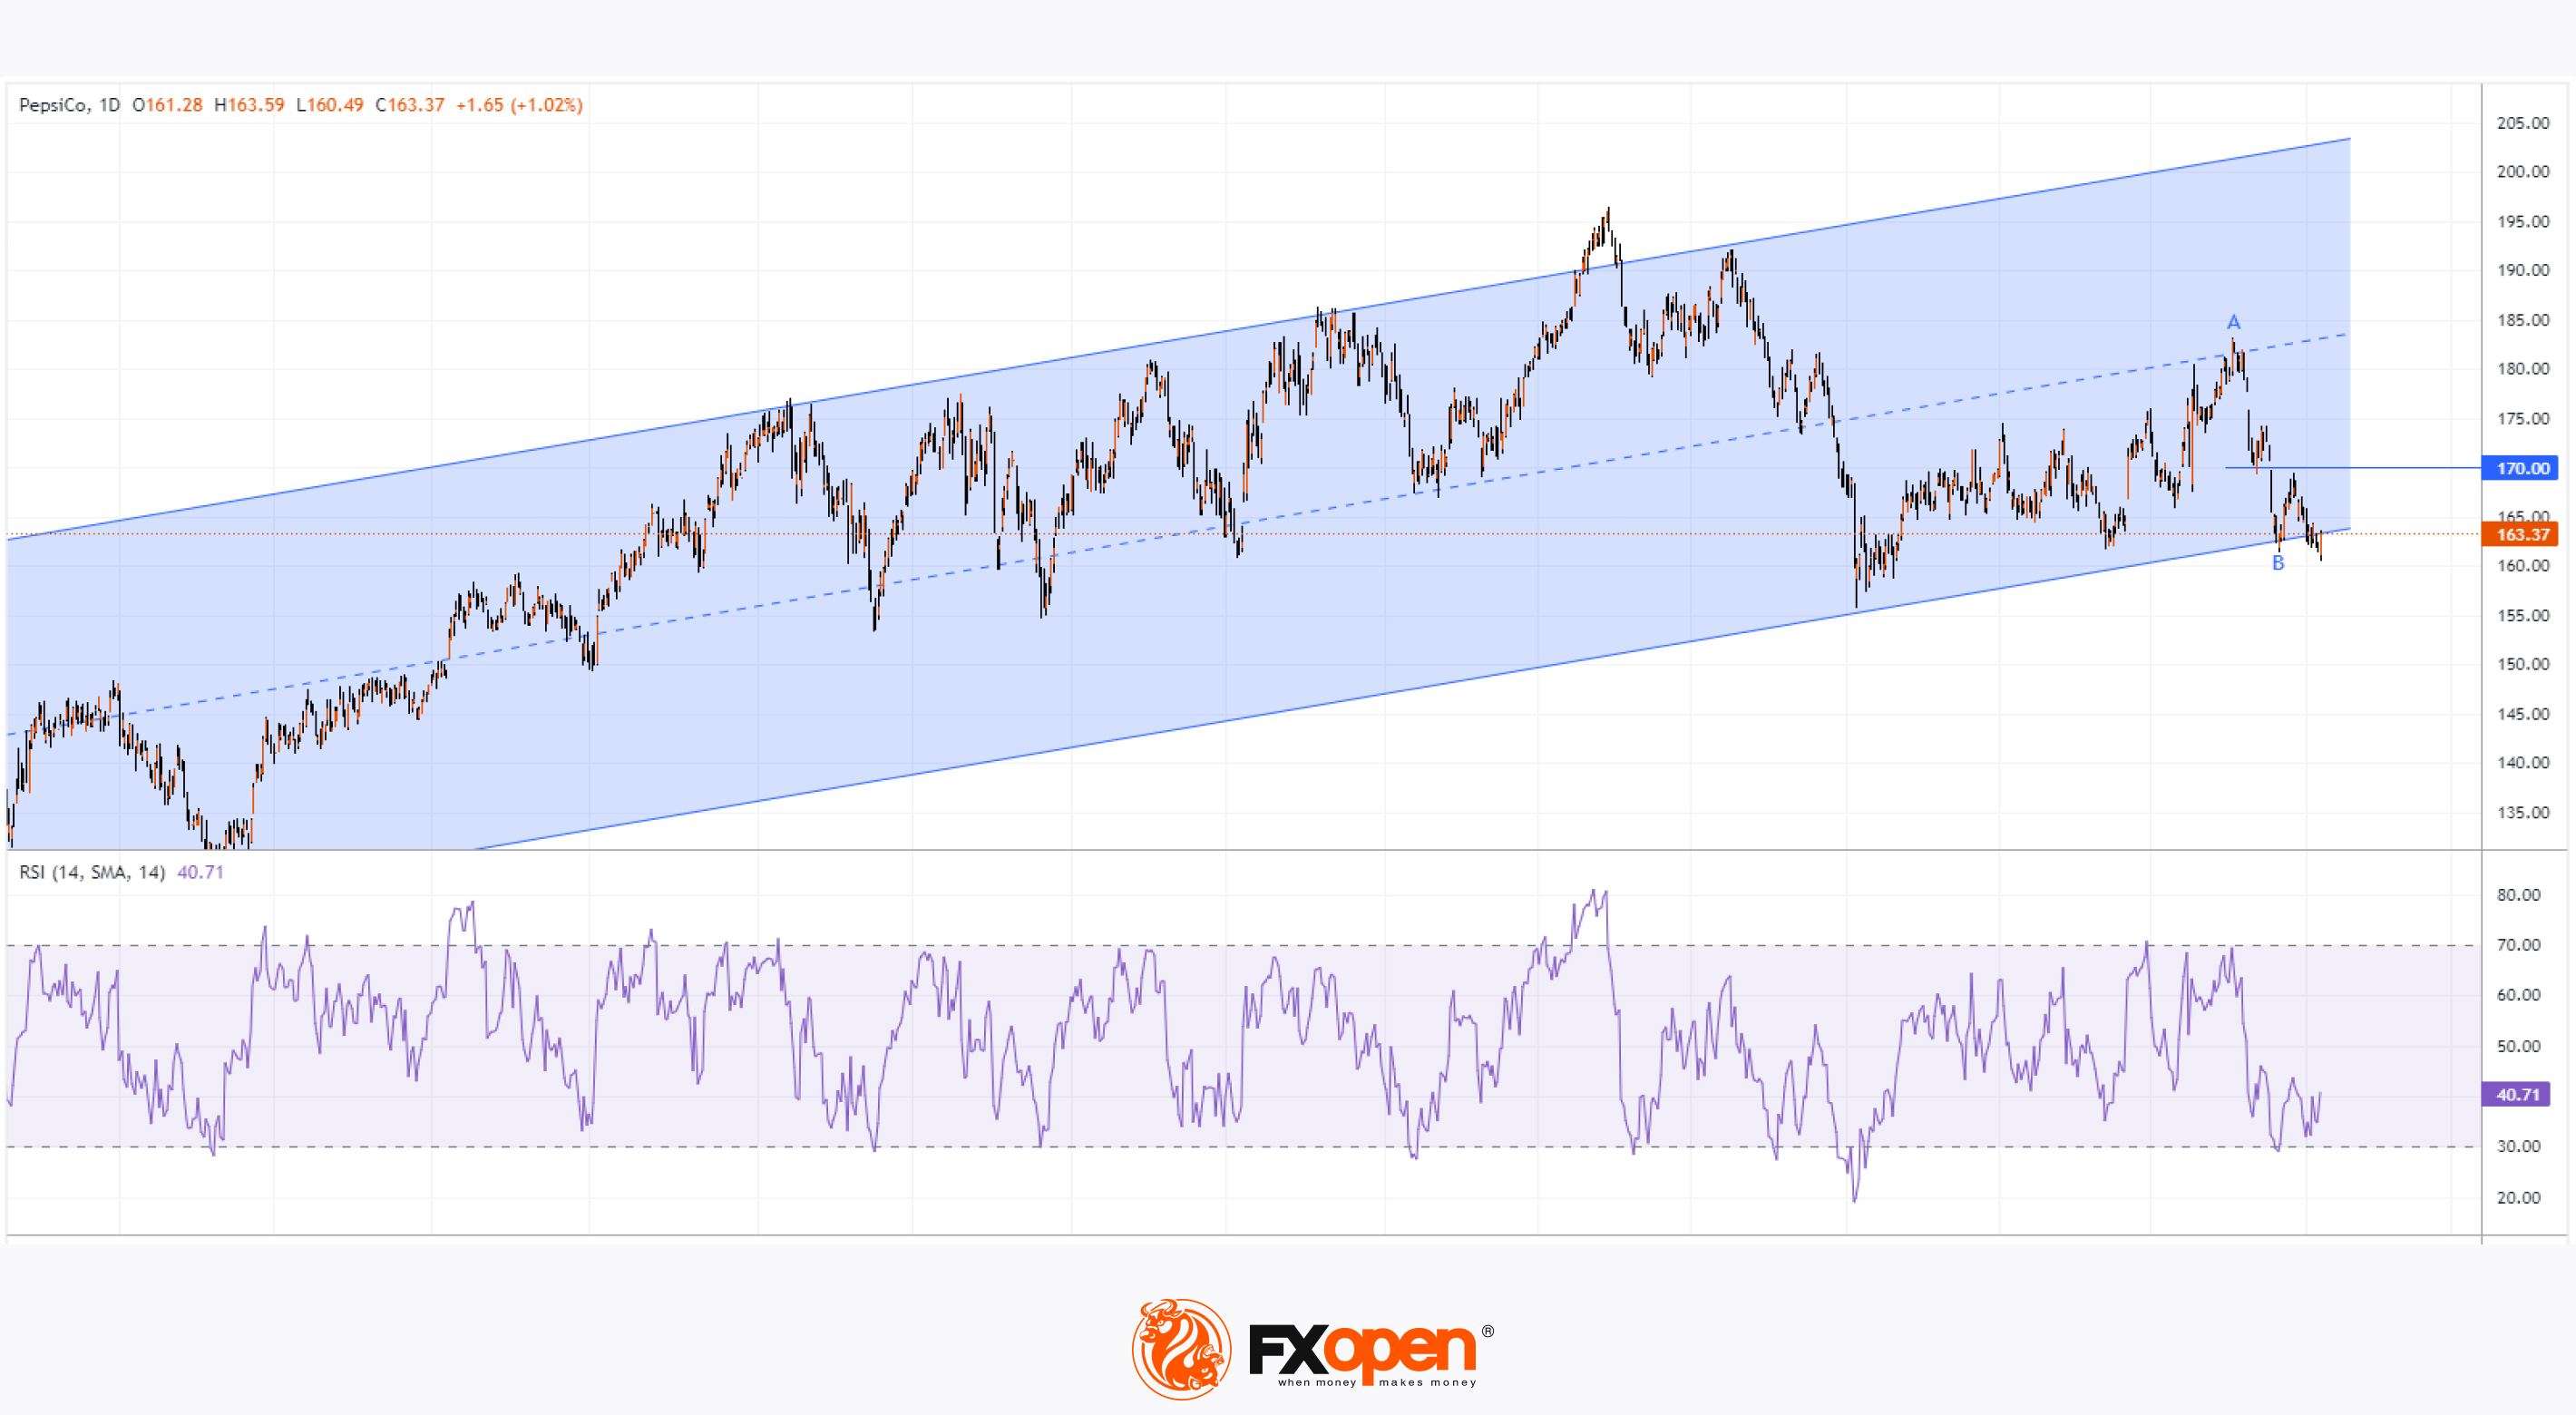
The PepsiCo stock chart indicates:
→ Yesterday, the price dropped below $161, setting a new low for 2024.
→ However, by the end of the trading day, the price rose above $163.3, closing near the day's high.
This bullish intraday behaviour might suggest positive sentiment emerging ahead of today's earnings report.
According to Dow Jones Newswires:
→ PepsiCo's management anticipates organic revenue growth of 4% and an 8% increase in earnings per share in 2024.
→ The consensus among analysts tracked by FactSet is a 3% rise in sales and a 7% increase in earnings.
PepsiCo's stock has fallen by 9% over the past two months. Investors are concerned that demand might suffer due to rising prices from inflation and the growing popularity of weight-loss drugs, which could curb people's cravings for snacks and sugary drinks.
Technical Analysis of the PEP Daily Chart Today Shows:
→ In the long term, the PEP price is in an uptrend (shown in blue).
→ The price decline from the May high (point A) has brought the price to the lower boundary of this channel, suggesting a potential buying opportunity.
→ The RSI indicator at point B (13 June) fell into the oversold zone, and yesterday's price action might be forming a bullish divergence.
Today's earnings report will provide more clarity. If investors see strong sales results, the PEP stock price might receive a bullish boost. In such a case, resistance could be encountered around the $170 level.
According to TipRanks analysts' forecast monitoring, the average target price for PEP stock is $187.40, representing a 14.55% increase from current levels in the next 12 months.
Trade global index CFDs with zero commission and tight spreads. Open your FXOpen account now or learn more about trading index CFDs with FXOpen.
CFDs are complex instruments and come with a high risk of losing your money.
This article represents the opinion of the Companies operating under the FXOpen brand only. It is not to be construed as an offer, solicitation, or recommendation with respect to products and services provided by the Companies operating under the FXOpen brand, nor is it to be considered financial advice.
PepsiCo Stock Rebounds from Yearly Low Ahead of Earnings Report
The PepsiCo stock chart indicates:
→ Yesterday, the price dropped below $161, setting a new low for 2024.
→ However, by the end of the trading day, the price rose above $163.3, closing near the day's high.
This bullish intraday behaviour might suggest positive sentiment emerging ahead of today's earnings report.
According to Dow Jones Newswires:
→ PepsiCo's management anticipates organic revenue growth of 4% and an 8% increase in earnings per share in 2024.
→ The consensus among analysts tracked by FactSet is a 3% rise in sales and a 7% increase in earnings.
PepsiCo's stock has fallen by 9% over the past two months. Investors are concerned that demand might suffer due to rising prices from inflation and the growing popularity of weight-loss drugs, which could curb people's cravings for snacks and sugary drinks.
Technical Analysis of the PEP Daily Chart Today Shows:
→ In the long term, the PEP price is in an uptrend (shown in blue).
→ The price decline from the May high (point A) has brought the price to the lower boundary of this channel, suggesting a potential buying opportunity.
→ The RSI indicator at point B (13 June) fell into the oversold zone, and yesterday's price action might be forming a bullish divergence.
Today's earnings report will provide more clarity. If investors see strong sales results, the PEP stock price might receive a bullish boost. In such a case, resistance could be encountered around the $170 level.
According to TipRanks analysts' forecast monitoring, the average target price for PEP stock is $187.40, representing a 14.55% increase from current levels in the next 12 months.
Trade global index CFDs with zero commission and tight spreads. Open your FXOpen account now or learn more about trading index CFDs with FXOpen.
CFDs are complex instruments and come with a high risk of losing your money.
This article represents the opinion of the Companies operating under the FXOpen brand only. It is not to be construed as an offer, solicitation, or recommendation with respect to products and services provided by the Companies operating under the FXOpen brand, nor is it to be considered financial advice.
👍2
#nvidia #NVDA #NASDAQ #stockmarket
The Nasdaq 100 Index Fell Despite Positive Inflation News
Yesterday, Consumer Price Index (CPI) values were published, indicating a slowdown in the rate of inflation in the USA. According to ForexFactory:
→ CPI month-on-month: actual = -0.1%, forecast = 0.1%, previous month = 0.0%;
→ CPI year-on-year: actual = 3.0%, forecast = 3.1%, previous month = 3.3%.
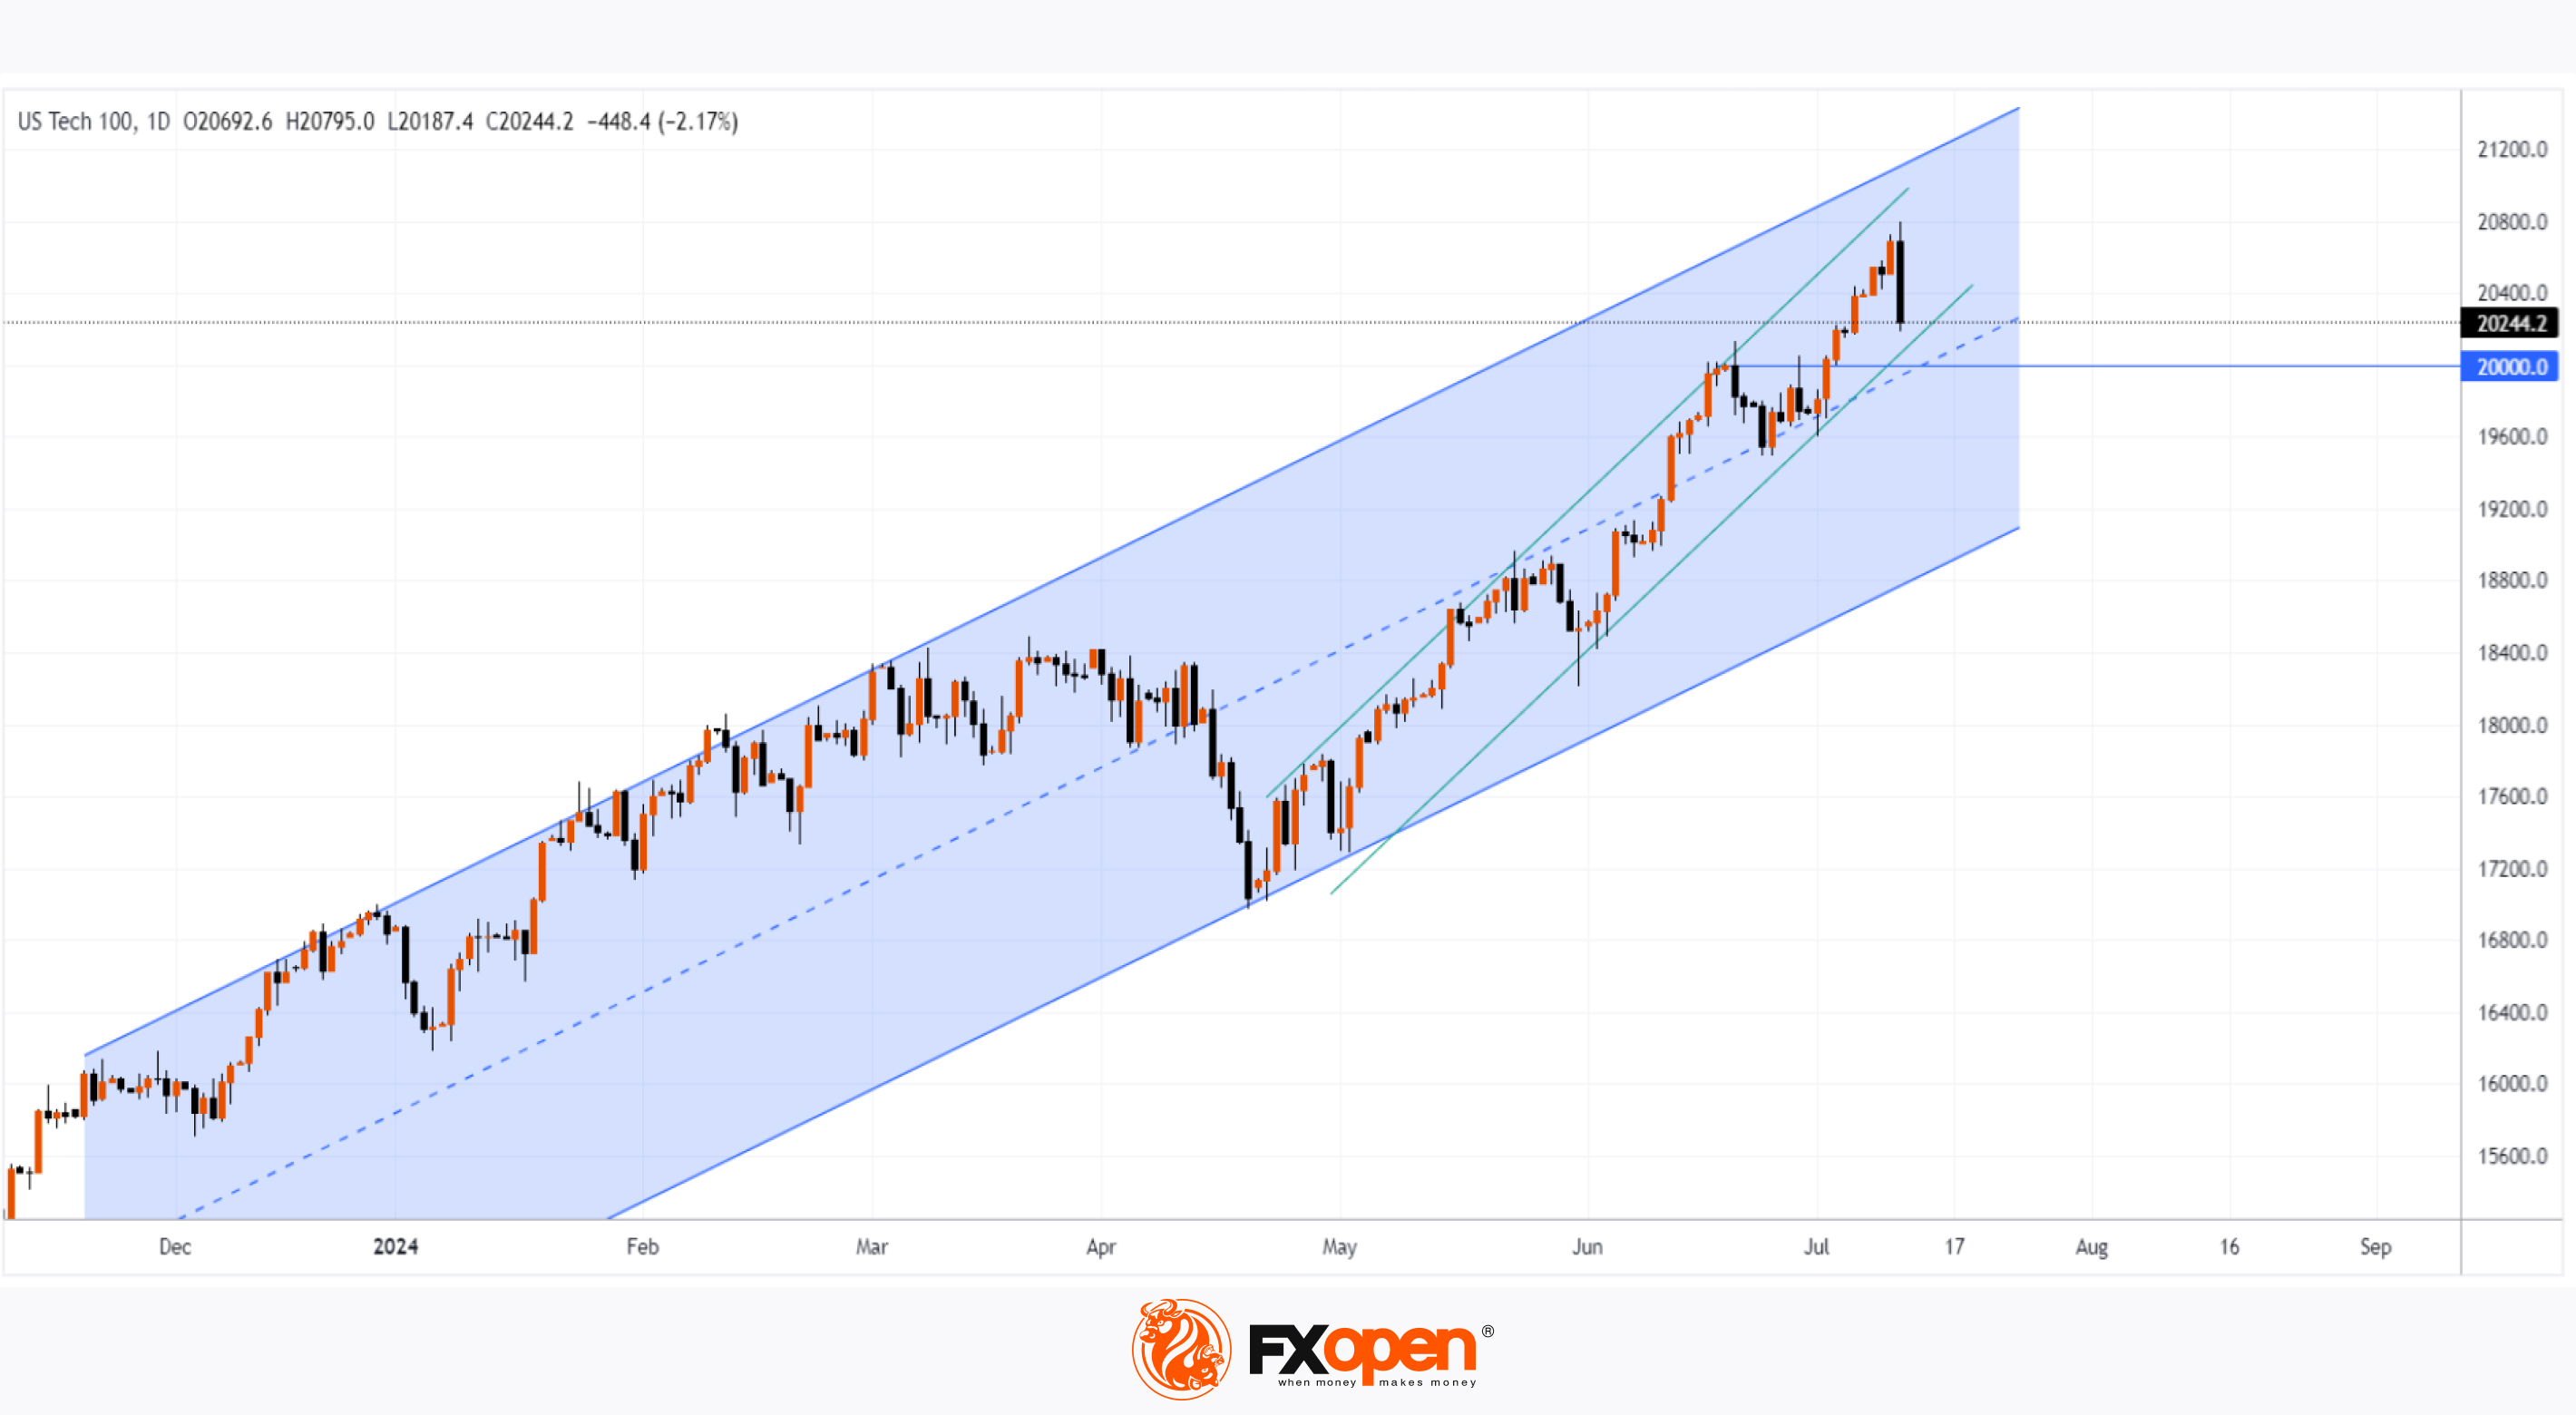
The data confirming the slowdown in inflation raised expectations that the Federal Reserve might lower interest rates as early as September. But why did the Nasdaq 100 (US Tech 100 mini on FXOpen) drop then? Yesterday, the tech stock index fell by over 2.1%, marking its worst day since early May.
The reason lies in rotation. Investors seem to have shifted their focus from the highly inflated tech stocks since the start of 2024 to other sectors. Approximately 400 companies in the S&P 500 index (US SPX 500 mini on FXOpen) showed growth. Meanwhile, the Dow Jones Industrial Average (Wall Street 30 mini on FXOpen) closed in the green yesterday.
Bloomberg reports that Kelly Cox from Ritholtz Wealth Management believes this day could be a turning point for the markets. It also serves as a good reminder of the importance of diversification.
One of the drivers of yesterday's decline was NVDA shares, which fell by more than 5% in a day (we wrote about the bearish behavior of Nvidia’s price and volumes just the day before).
What’s next?
The equal-weighted version of the S&P 500, where stocks like Nvidia have the same weight as Dollar Tree Inc., rose yesterday. This version of the index is less sensitive to the influence of large tech companies, making a case for the rally expanding to other stocks.
Technical analysis of the Nasdaq 100 (US Tech 100 mini on FXOpen) chart gives bulls some hope, as if the price continues to fall, it will encounter a series of supports:
→ from the lower boundary of the green channel;
→ from the psychological level of 20,000;
→ from the median line of the blue channel.
It is possible that the bearish momentum seen yesterday may dissipate when it meets these supports. However, it is unlikely to restore the attractiveness of tech stocks to the level they had before yesterday.
Trade global index CFDs with zero commission and tight spreads. Open your FXOpen account now or learn more about trading index CFDs with FXOpen.
CFDs are complex instruments and come with a high risk of losing your money.
This article represents the opinion of the Companies operating under the FXOpen brand only. It is not to be construed as an offer, solicitation, or recommendation with respect to products and services provided by the Companies operating under the FXOpen brand, nor is it to be considered financial advice.
The Nasdaq 100 Index Fell Despite Positive Inflation News
Yesterday, Consumer Price Index (CPI) values were published, indicating a slowdown in the rate of inflation in the USA. According to ForexFactory:
→ CPI month-on-month: actual = -0.1%, forecast = 0.1%, previous month = 0.0%;
→ CPI year-on-year: actual = 3.0%, forecast = 3.1%, previous month = 3.3%.
The data confirming the slowdown in inflation raised expectations that the Federal Reserve might lower interest rates as early as September. But why did the Nasdaq 100 (US Tech 100 mini on FXOpen) drop then? Yesterday, the tech stock index fell by over 2.1%, marking its worst day since early May.
The reason lies in rotation. Investors seem to have shifted their focus from the highly inflated tech stocks since the start of 2024 to other sectors. Approximately 400 companies in the S&P 500 index (US SPX 500 mini on FXOpen) showed growth. Meanwhile, the Dow Jones Industrial Average (Wall Street 30 mini on FXOpen) closed in the green yesterday.
Bloomberg reports that Kelly Cox from Ritholtz Wealth Management believes this day could be a turning point for the markets. It also serves as a good reminder of the importance of diversification.
One of the drivers of yesterday's decline was NVDA shares, which fell by more than 5% in a day (we wrote about the bearish behavior of Nvidia’s price and volumes just the day before).
What’s next?
The equal-weighted version of the S&P 500, where stocks like Nvidia have the same weight as Dollar Tree Inc., rose yesterday. This version of the index is less sensitive to the influence of large tech companies, making a case for the rally expanding to other stocks.
Technical analysis of the Nasdaq 100 (US Tech 100 mini on FXOpen) chart gives bulls some hope, as if the price continues to fall, it will encounter a series of supports:
→ from the lower boundary of the green channel;
→ from the psychological level of 20,000;
→ from the median line of the blue channel.
It is possible that the bearish momentum seen yesterday may dissipate when it meets these supports. However, it is unlikely to restore the attractiveness of tech stocks to the level they had before yesterday.
Trade global index CFDs with zero commission and tight spreads. Open your FXOpen account now or learn more about trading index CFDs with FXOpen.
CFDs are complex instruments and come with a high risk of losing your money.
This article represents the opinion of the Companies operating under the FXOpen brand only. It is not to be construed as an offer, solicitation, or recommendation with respect to products and services provided by the Companies operating under the FXOpen brand, nor is it to be considered financial advice.
👍1
#marketanalysis #MarketNews #tradingtips #USDJPY
Analysis of USD/JPY: Was There an Intervention?
Yesterday’s news of slowing inflation in the US sharply weakened the dollar, anticipating the Federal Reserve’s monetary easing. In the first 15 minutes after the data release:
→ EUR/USD rose by approximately 0.45% to the psychological level of 1.09;
→ GBP/USD increased by approximately 0.55%, reaching a 2024 high.
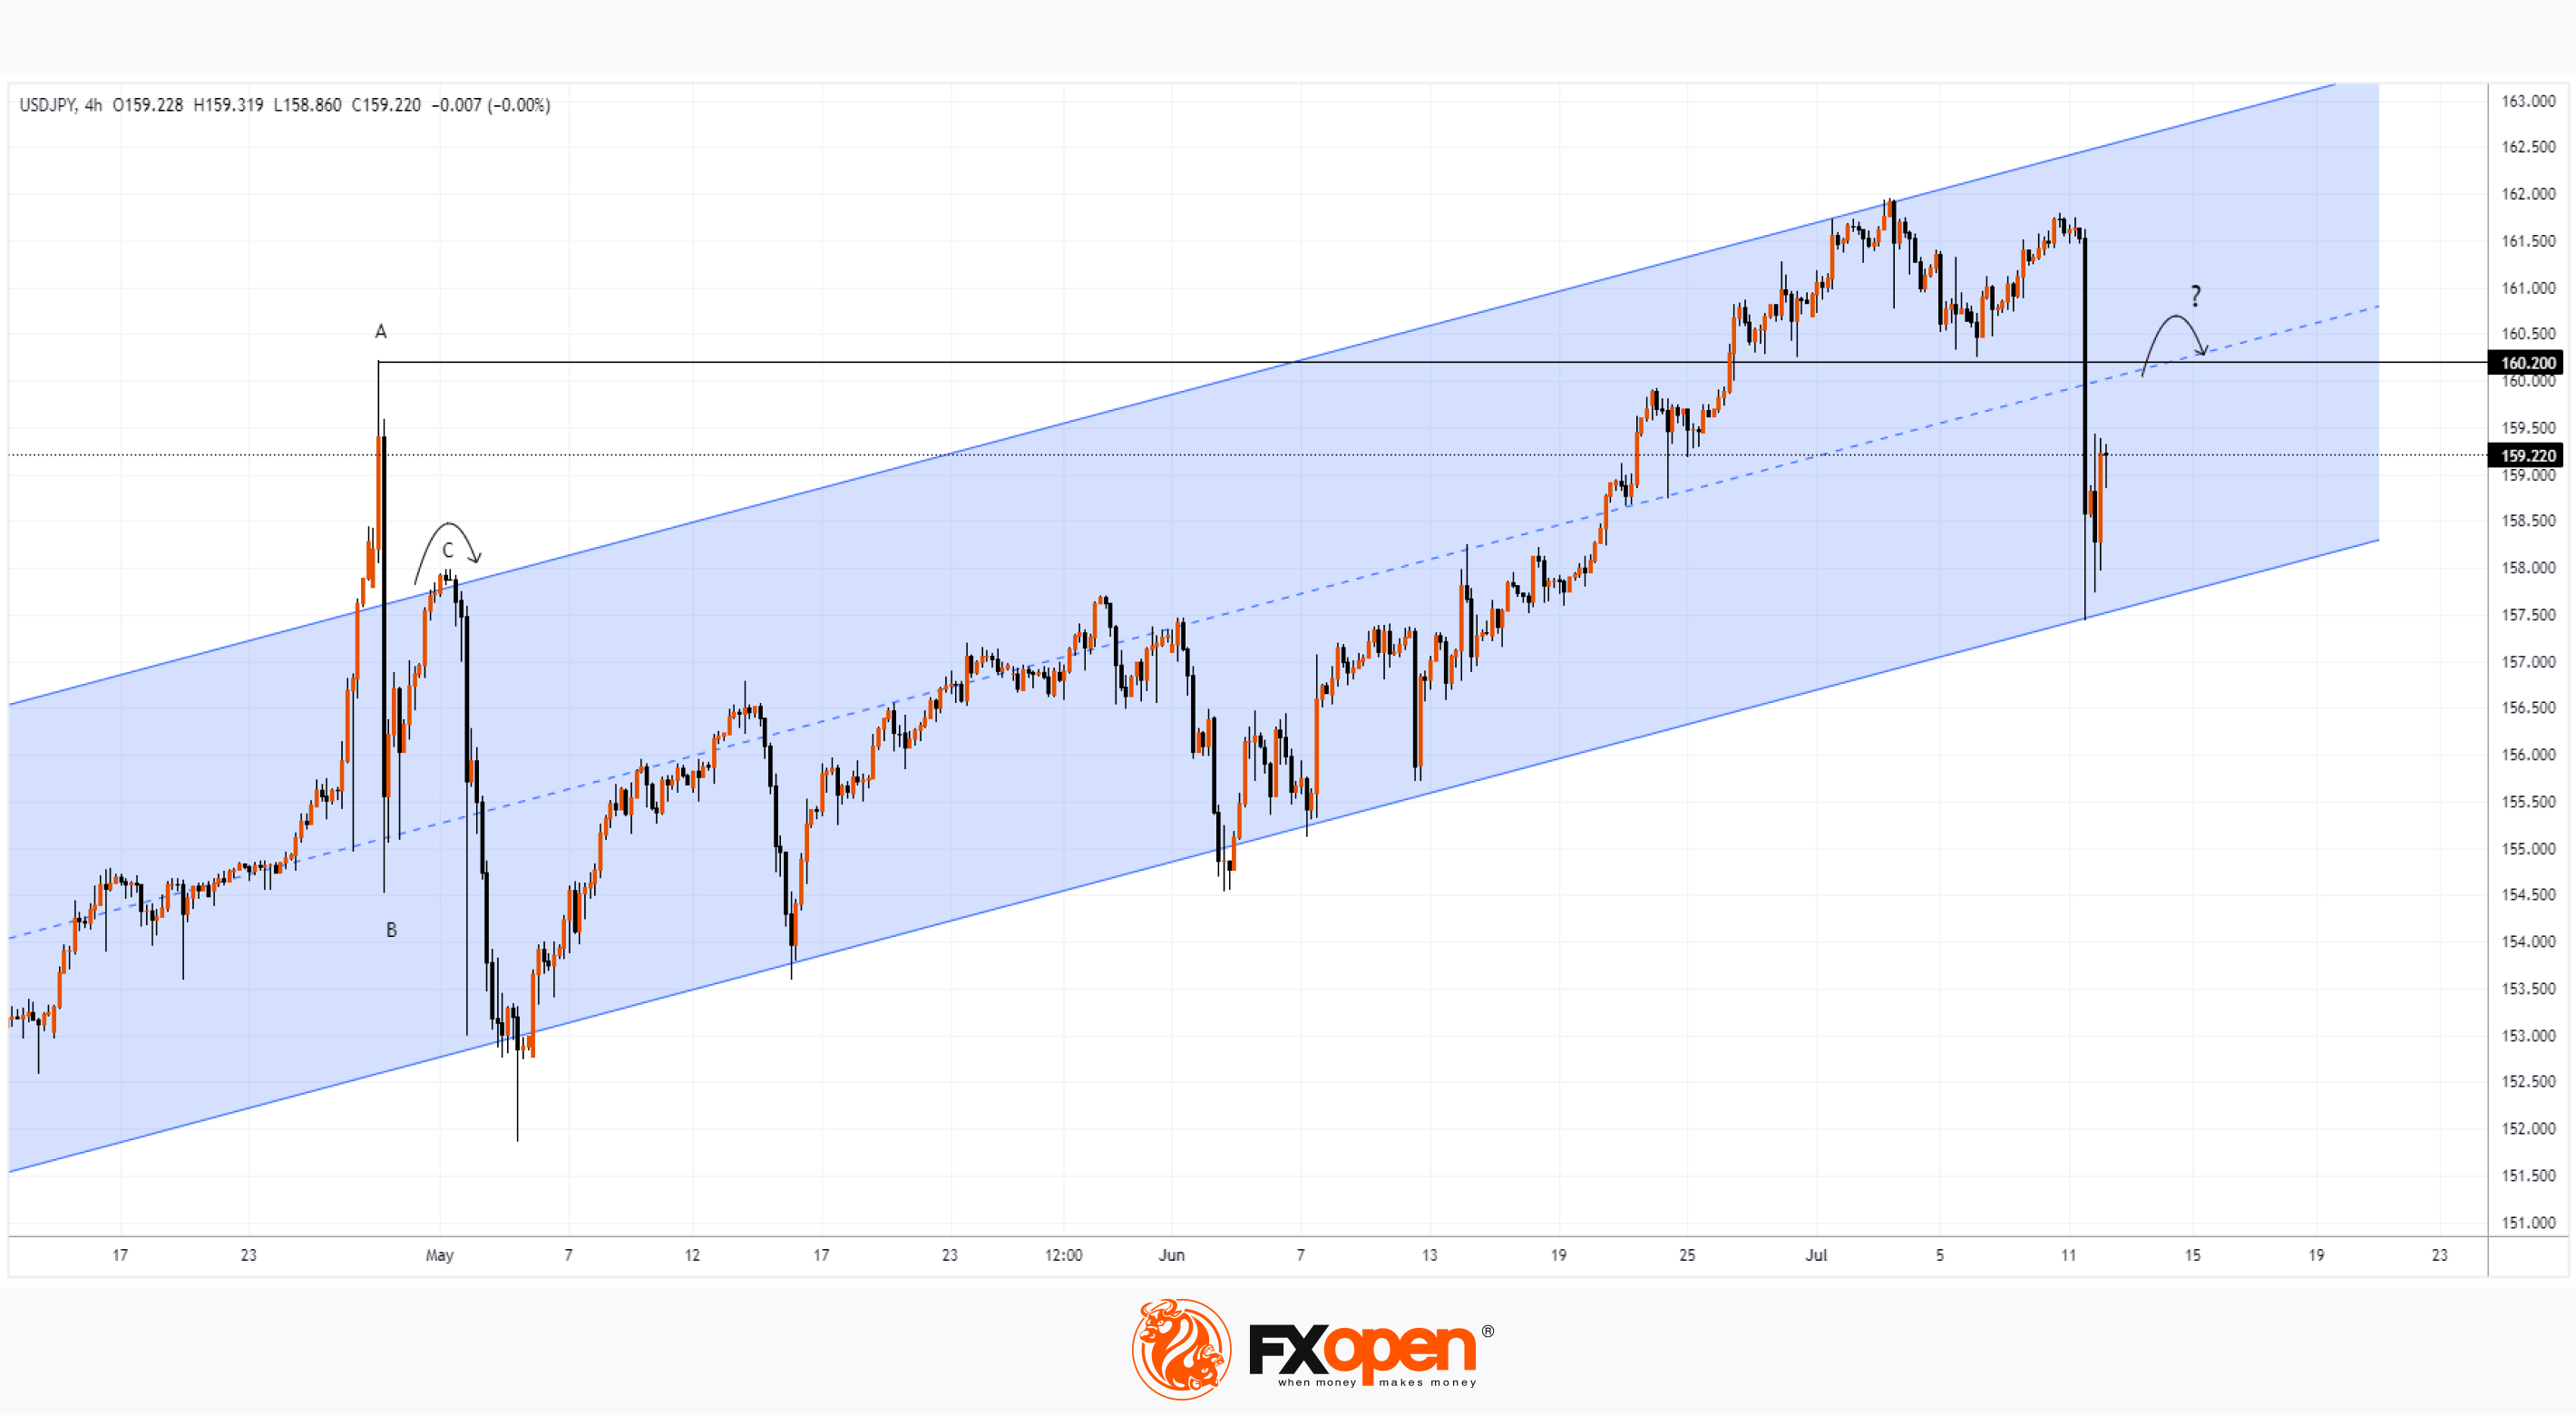
Conversely, USD/JPY fell, with a more aggressive movement. As the chart shows, the dollar weakened against the yen by about 1.8% in the first 15 minutes after the release. This suggests that amidst the US news, the Bank of Japan intervened to support its currency, which hadn’t fallen below 160 yen per USD since June 26. Reuters reports that Tokyo’s chief currency diplomat, Masato Kanda, stated on Friday that authorities would take necessary measures in the currency market but declined to comment on whether they had intervened.
Aside from the question of intervention, the future outlook for the yen against the dollar is of interest. On June 27, analysing USD/JPY, we constructed an ascending blue channel.
Technical analysis of USD/JPY with updated data shows that:
→ the price remains within the boundaries of this channel;
→ yesterday’s sharp drop began near its upper boundary, finding support at its lower boundary.
Note the price behaviour in a similar situation after the sharp fall from A→B in late April. A rebound from B→C of approximately 50% occurred, forming a Rounding Top pattern at the upper part (as indicated by the arrow). Bears then reasserted themselves. If USD/JPY follows a similar scenario, we may see a recovery to the resistance block formed by the median line of the blue channel and the 160.20 level (drawn from the April high), followed by the formation of a rounding top with renewed bearish activity (indicated by the question-marked arrow).
Trade over 50 forex markets 24 hours a day with FXOpen. Take advantage of low commissions, deep liquidity, and spreads from 0.0 pips. Open your FXOpen account now or learn more about trading forex with FXOpen.
CFDs are complex instruments and come with a high risk of losing your money.
This article represents the opinion of the Companies operating under the FXOpen brand only. It is not to be construed as an offer, solicitation, or recommendation with respect to products and services provided by the Companies operating under the FXOpen brand, nor is it to be considered financial advice.
Analysis of USD/JPY: Was There an Intervention?
Yesterday’s news of slowing inflation in the US sharply weakened the dollar, anticipating the Federal Reserve’s monetary easing. In the first 15 minutes after the data release:
→ EUR/USD rose by approximately 0.45% to the psychological level of 1.09;
→ GBP/USD increased by approximately 0.55%, reaching a 2024 high.
Conversely, USD/JPY fell, with a more aggressive movement. As the chart shows, the dollar weakened against the yen by about 1.8% in the first 15 minutes after the release. This suggests that amidst the US news, the Bank of Japan intervened to support its currency, which hadn’t fallen below 160 yen per USD since June 26. Reuters reports that Tokyo’s chief currency diplomat, Masato Kanda, stated on Friday that authorities would take necessary measures in the currency market but declined to comment on whether they had intervened.
Aside from the question of intervention, the future outlook for the yen against the dollar is of interest. On June 27, analysing USD/JPY, we constructed an ascending blue channel.
Technical analysis of USD/JPY with updated data shows that:
→ the price remains within the boundaries of this channel;
→ yesterday’s sharp drop began near its upper boundary, finding support at its lower boundary.
Note the price behaviour in a similar situation after the sharp fall from A→B in late April. A rebound from B→C of approximately 50% occurred, forming a Rounding Top pattern at the upper part (as indicated by the arrow). Bears then reasserted themselves. If USD/JPY follows a similar scenario, we may see a recovery to the resistance block formed by the median line of the blue channel and the 160.20 level (drawn from the April high), followed by the formation of a rounding top with renewed bearish activity (indicated by the question-marked arrow).
Trade over 50 forex markets 24 hours a day with FXOpen. Take advantage of low commissions, deep liquidity, and spreads from 0.0 pips. Open your FXOpen account now or learn more about trading forex with FXOpen.
CFDs are complex instruments and come with a high risk of losing your money.
This article represents the opinion of the Companies operating under the FXOpen brand only. It is not to be construed as an offer, solicitation, or recommendation with respect to products and services provided by the Companies operating under the FXOpen brand, nor is it to be considered financial advice.
👍2
#GBPUSD #EURUSD #USDJPY #XAUUSD #NVDA #goldprices #stockmarket
Weekly Market Wrap With Gary Thomson: GBP/USD, EUR/USD, USD/JPY, XAU/USD, NVDA Stock
Get the latest scoop on the week's hottest headlines, all in one convenient video. Join Gary Thomson, the COO of FXOpen UK, as he breaks down the most significant news reports and shares his expert insights.
🔸GBP/USD Hits Four-Month High Following GDP Growth News
🔸Market Analysis: EUR/USD Jumps, USD/JPY Bulls Seem Unstoppable
🔸XAU/USD Analysis: Gold Price Falls from Six-Week High
🔸Analysts Raise NVDA Forecasts, Stock Price Rises
Stay in the know and empower yourself with our short, yet power-packed video. Watch it now and stay updated with FXOpen. Don't miss out on this invaluable opportunity to sharpen your trading skills and make informed decisions.
https://cutt.ly/iehdzaIj
To take advantage of price fluctuations in the foreign exchange markets, consider enlisting the services of a reliable broker like FXOpen.
⚠️
This forecast represents FXOpen Companies opinion only, it should not be construed as an offer, invitation or recommendation in respect to FXOpen Companies products and services or as financial advice.
Weekly Market Wrap With Gary Thomson: GBP/USD, EUR/USD, USD/JPY, XAU/USD, NVDA Stock
Get the latest scoop on the week's hottest headlines, all in one convenient video. Join Gary Thomson, the COO of FXOpen UK, as he breaks down the most significant news reports and shares his expert insights.
🔸GBP/USD Hits Four-Month High Following GDP Growth News
🔸Market Analysis: EUR/USD Jumps, USD/JPY Bulls Seem Unstoppable
🔸XAU/USD Analysis: Gold Price Falls from Six-Week High
🔸Analysts Raise NVDA Forecasts, Stock Price Rises
Stay in the know and empower yourself with our short, yet power-packed video. Watch it now and stay updated with FXOpen. Don't miss out on this invaluable opportunity to sharpen your trading skills and make informed decisions.
https://cutt.ly/iehdzaIj
To take advantage of price fluctuations in the foreign exchange markets, consider enlisting the services of a reliable broker like FXOpen.
⚠️
This forecast represents FXOpen Companies opinion only, it should not be construed as an offer, invitation or recommendation in respect to FXOpen Companies products and services or as financial advice.
YouTube
Weekly Market Wrap With Gary Thomson: GBP/USD, EUR/USD, USD/JPY, XAU/USD, NVDA Stock
Get the latest scoop on the week's hottest headlines, all in one convenient video. Join Gary Thomson, the COO of FXOpen UK, as he breaks down the most significant news reports and shares his expert insights.
00:28 GBP/USD Hits Four-Month High Following GDP…
00:28 GBP/USD Hits Four-Month High Following GDP…
👍2
#marketanalysis #EURUSD #MarketNews
The EUR/USD Rate Set a 16-Week High
According to the EUR/USD chart, the euro to dollar exchange rate yesterday surpassed the peak from early June, rising above 1.092 – the last time the price was at this level was on March 21.
Bullish sentiments in the market were supported by:
→ Approaching Thursday's meeting of the European Central Bank – it is expected that interest rates will remain unchanged. However, attention will be focused on comments from its president Christine Lagarde regarding the timing of the next interest rate cut.
→ Expectations of rate cuts by the Federal Reserve in September. As Reuters reports, Powell stated yesterday that economic indicators in the US for the second quarter "to some extent bolster the confidence" that inflation is returning to the target level in a sustainable manner.
As we mentioned in our analytical review of the EUR/USD chart on July 1:
→ Against the backdrop of the French election results, the rate broke through consolidation figure A-B;
→ and could have reached the level of 1.08400.
In fact, this level (C) acted as resistance, holding bulls from July 5 to 11.
How might the situation develop further?
As today's technical analysis of the EUR/USD chart shows:
→ After surpassing the 1.092 level, the price retraced downwards. The inability of bulls to sustain above this level suggests that they may have exhausted after a rise from point A (+2.3% over half a month).
→ Assessing the peaks from July 11-15, it appears challenging for bulls to maintain the progress achieved.
→ It is possible that we are witnessing a false bullish breakthrough of the June high.
Currently, the price is holding within the ascending trend of July (shown by orange lines), the lower boundary of which could provide support. It is possible that bears could defend the 1.092 level and attempt to break below the lower boundary of the orange channel.
However, if this scenario unfolds, the fundamental background will be crucial – for example, news from the ECB on Thursday.
Trade over 50 forex markets 24 hours a day with FXOpen. Take advantage of low commissions, deep liquidity, and spreads from 0.0 pips. Open your FXOpen account now or learn more about trading forex with FXOpen.
CFDs are complex instruments and come with a high risk of losing your money.
This article represents the opinion of the Companies operating under the FXOpen brand only. It is not to be construed as an offer, solicitation, or recommendation with respect to products and services provided by the Companies operating under the FXOpen brand, nor is it to be considered financial advice.
The EUR/USD Rate Set a 16-Week High
According to the EUR/USD chart, the euro to dollar exchange rate yesterday surpassed the peak from early June, rising above 1.092 – the last time the price was at this level was on March 21.
Bullish sentiments in the market were supported by:
→ Approaching Thursday's meeting of the European Central Bank – it is expected that interest rates will remain unchanged. However, attention will be focused on comments from its president Christine Lagarde regarding the timing of the next interest rate cut.
→ Expectations of rate cuts by the Federal Reserve in September. As Reuters reports, Powell stated yesterday that economic indicators in the US for the second quarter "to some extent bolster the confidence" that inflation is returning to the target level in a sustainable manner.
As we mentioned in our analytical review of the EUR/USD chart on July 1:
→ Against the backdrop of the French election results, the rate broke through consolidation figure A-B;
→ and could have reached the level of 1.08400.
In fact, this level (C) acted as resistance, holding bulls from July 5 to 11.
How might the situation develop further?
As today's technical analysis of the EUR/USD chart shows:
→ After surpassing the 1.092 level, the price retraced downwards. The inability of bulls to sustain above this level suggests that they may have exhausted after a rise from point A (+2.3% over half a month).
→ Assessing the peaks from July 11-15, it appears challenging for bulls to maintain the progress achieved.
→ It is possible that we are witnessing a false bullish breakthrough of the June high.
Currently, the price is holding within the ascending trend of July (shown by orange lines), the lower boundary of which could provide support. It is possible that bears could defend the 1.092 level and attempt to break below the lower boundary of the orange channel.
However, if this scenario unfolds, the fundamental background will be crucial – for example, news from the ECB on Thursday.
Trade over 50 forex markets 24 hours a day with FXOpen. Take advantage of low commissions, deep liquidity, and spreads from 0.0 pips. Open your FXOpen account now or learn more about trading forex with FXOpen.
CFDs are complex instruments and come with a high risk of losing your money.
This article represents the opinion of the Companies operating under the FXOpen brand only. It is not to be construed as an offer, solicitation, or recommendation with respect to products and services provided by the Companies operating under the FXOpen brand, nor is it to be considered financial advice.

👍2
#AMZN #sp500 #stockmarket #stocktrading #MarketNews
Insiders Are Selling Shares of Large Companies
Yesterday, the S&P 500 stock index (US SPX 500 mini on FXOpen) set another historical high, closing near the 5650 level. However, similar records are not observed on the charts of rally leaders from the first half of 2024 – NVDA's price is 8.6% below its historical high, MSFT is 3.1% lower, and GOOGL is 2.6% below its record.
And this isn't the only cause for concern. Insider sales, as indicated by reports to the SEC, could add to anxieties. For instance:
→ Bezos sold over $900 million worth of AMZN shares;
→ Nvidia board member Mark Stevens continues to sell NVDA shares, as does company CEO Jensen Huang.
According to Goldman Sachs, fund managers have increased their long positions in US stock index futures to record levels. And according to a July survey of fund managers conducted by Bank Of America:
→ Market sentiment remains bullish amid expectations of a Fed rate cut and a soft landing for the economy;
→ Geopolitics now pose the biggest risk to markets, followed by inflation.
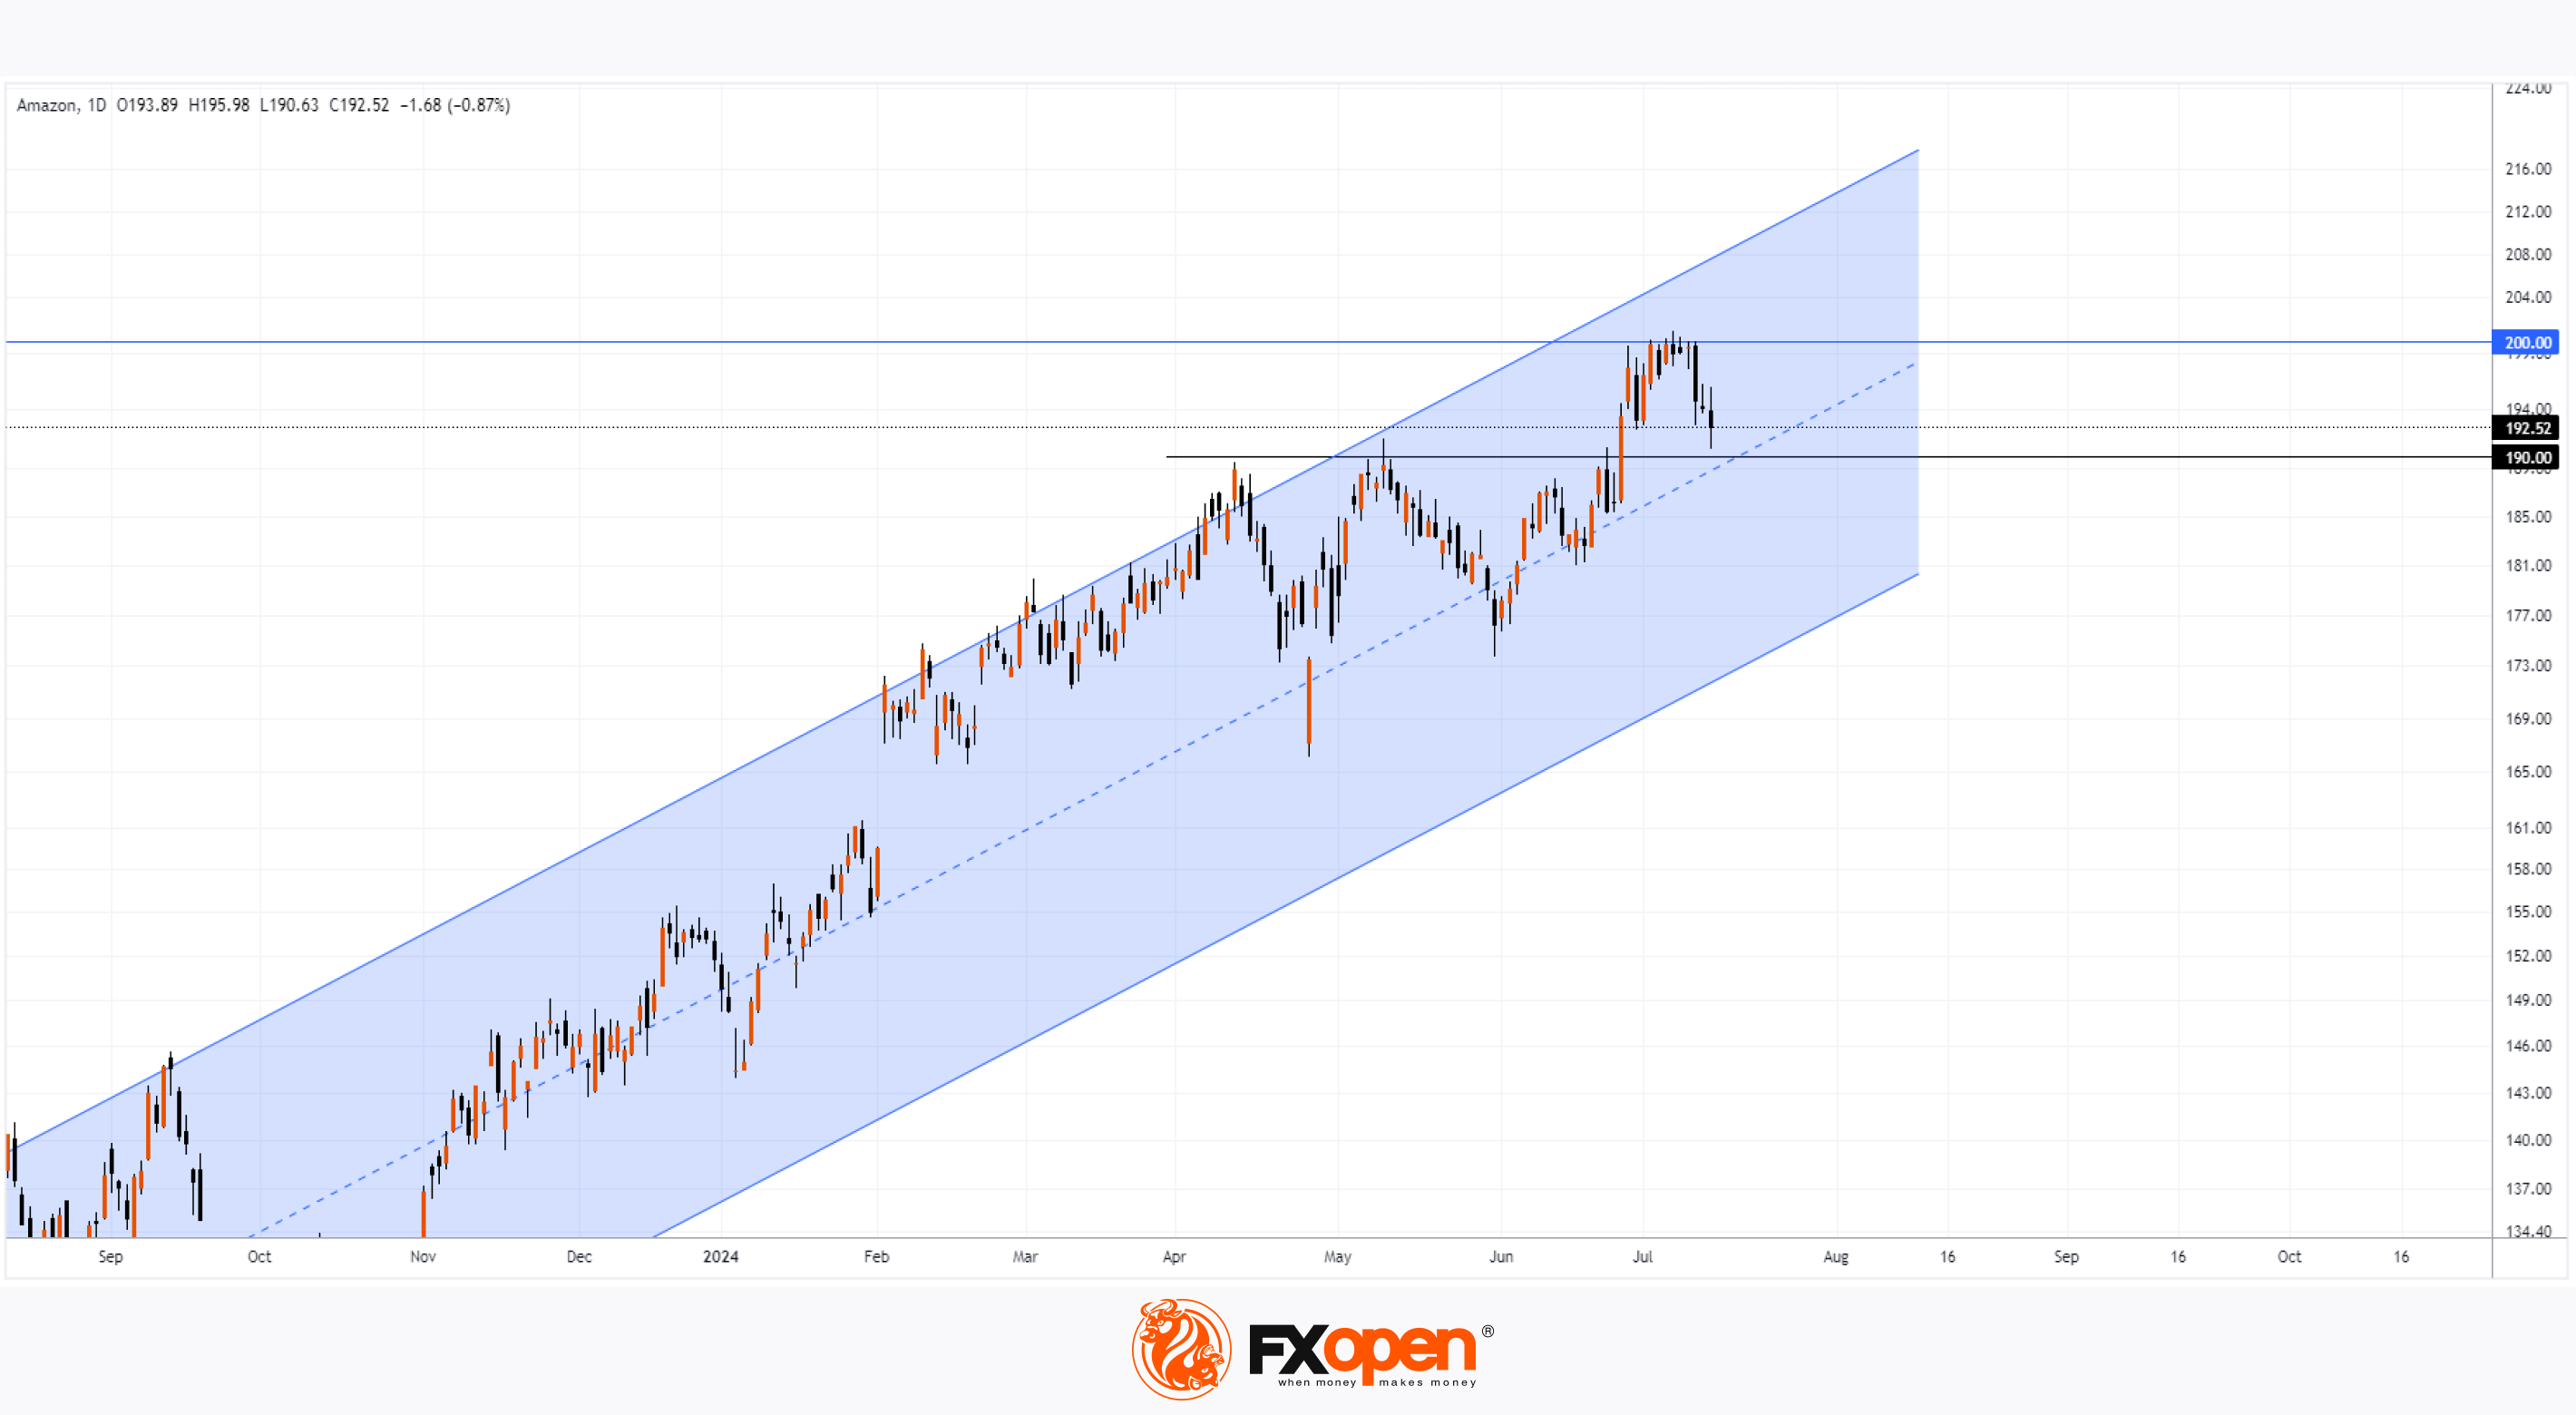
If professional market participants foresee further growth in the stock index, it might not be driven by shares of large companies. On June 27, we discussed the bullish "cup and handle" pattern near the $190 level on the AMZN price chart. Since then, bulls have shown the ability to push the price towards the psychological level of $200, but they have not managed to sustain this success.
Today's technical analysis of the daily AMZN chart shows that:
→ The price is moving within an ascending channel (shown in blue);
→ After breaking above the $190 level, the price failed to reach the upper boundary of the channel – a bearish sign;
→ The breakout above the psychological level of $200 turned out to be false ("bull trap").
Support for bulls could come from:
→ The $190 level (former resistance);
→ The median line of the blue channel.
According to TipRanks, the average price target for AMZN, forecasted by Wall Street analysts, is $222.51 (up 15.46% from current levels) in 12 months. Despite prevailing positivity in the stock market, weaker performance compared to the index and insider sales should caution regarding the future prospects of AMZN shares.
Trade global index CFDs with zero commission and tight spreads. Open your FXOpen account now or learn more about trading index CFDs with FXOpen.
CFDs are complex instruments and come with a high risk of losing your money.
This article represents the opinion of the Companies operating under the FXOpen brand only. It is not to be construed as an offer, solicitation, or recommendation with respect to products and services provided by the Companies operating under the FXOpen brand, nor is it to be considered financial advice.
Insiders Are Selling Shares of Large Companies
Yesterday, the S&P 500 stock index (US SPX 500 mini on FXOpen) set another historical high, closing near the 5650 level. However, similar records are not observed on the charts of rally leaders from the first half of 2024 – NVDA's price is 8.6% below its historical high, MSFT is 3.1% lower, and GOOGL is 2.6% below its record.
And this isn't the only cause for concern. Insider sales, as indicated by reports to the SEC, could add to anxieties. For instance:
→ Bezos sold over $900 million worth of AMZN shares;
→ Nvidia board member Mark Stevens continues to sell NVDA shares, as does company CEO Jensen Huang.
According to Goldman Sachs, fund managers have increased their long positions in US stock index futures to record levels. And according to a July survey of fund managers conducted by Bank Of America:
→ Market sentiment remains bullish amid expectations of a Fed rate cut and a soft landing for the economy;
→ Geopolitics now pose the biggest risk to markets, followed by inflation.
If professional market participants foresee further growth in the stock index, it might not be driven by shares of large companies. On June 27, we discussed the bullish "cup and handle" pattern near the $190 level on the AMZN price chart. Since then, bulls have shown the ability to push the price towards the psychological level of $200, but they have not managed to sustain this success.
Today's technical analysis of the daily AMZN chart shows that:
→ The price is moving within an ascending channel (shown in blue);
→ After breaking above the $190 level, the price failed to reach the upper boundary of the channel – a bearish sign;
→ The breakout above the psychological level of $200 turned out to be false ("bull trap").
Support for bulls could come from:
→ The $190 level (former resistance);
→ The median line of the blue channel.
According to TipRanks, the average price target for AMZN, forecasted by Wall Street analysts, is $222.51 (up 15.46% from current levels) in 12 months. Despite prevailing positivity in the stock market, weaker performance compared to the index and insider sales should caution regarding the future prospects of AMZN shares.
Trade global index CFDs with zero commission and tight spreads. Open your FXOpen account now or learn more about trading index CFDs with FXOpen.
CFDs are complex instruments and come with a high risk of losing your money.
This article represents the opinion of the Companies operating under the FXOpen brand only. It is not to be construed as an offer, solicitation, or recommendation with respect to products and services provided by the Companies operating under the FXOpen brand, nor is it to be considered financial advice.
👍2
#marketanalysis #MarketNews #stockmarket
US Banks Set a Bullish Tone at the Start of Earnings Season
Company earnings reports for the second quarter will be a crucial driver of stock market movements in the coming weeks. Traditionally, the largest banks kick off the earnings season, and their performance indicators today are setting a bullish tone.
For example:
Bank of America (BAC), report published on 16th July:
→ Earnings per share: actual = $0.83, expected = $0.797;
→ Gross income: actual = $25.37 billion, expected = $25.22 billion;
Goldman Sachs (GS), report published on 15th July:
→ Earnings per share: actual = $8.62, expected = $8.35;
→ Gross income: actual = $12.73 billion, expected = $12.35 billion.
Other major banks, including JPMorgan Chase (JPM), Citigroup (C), and Wells Fargo (WFC), have also surpassed analysts' expectations. Although following different trajectories, the stock prices of all the listed banks have generally been rising after the publication of their earnings reports.
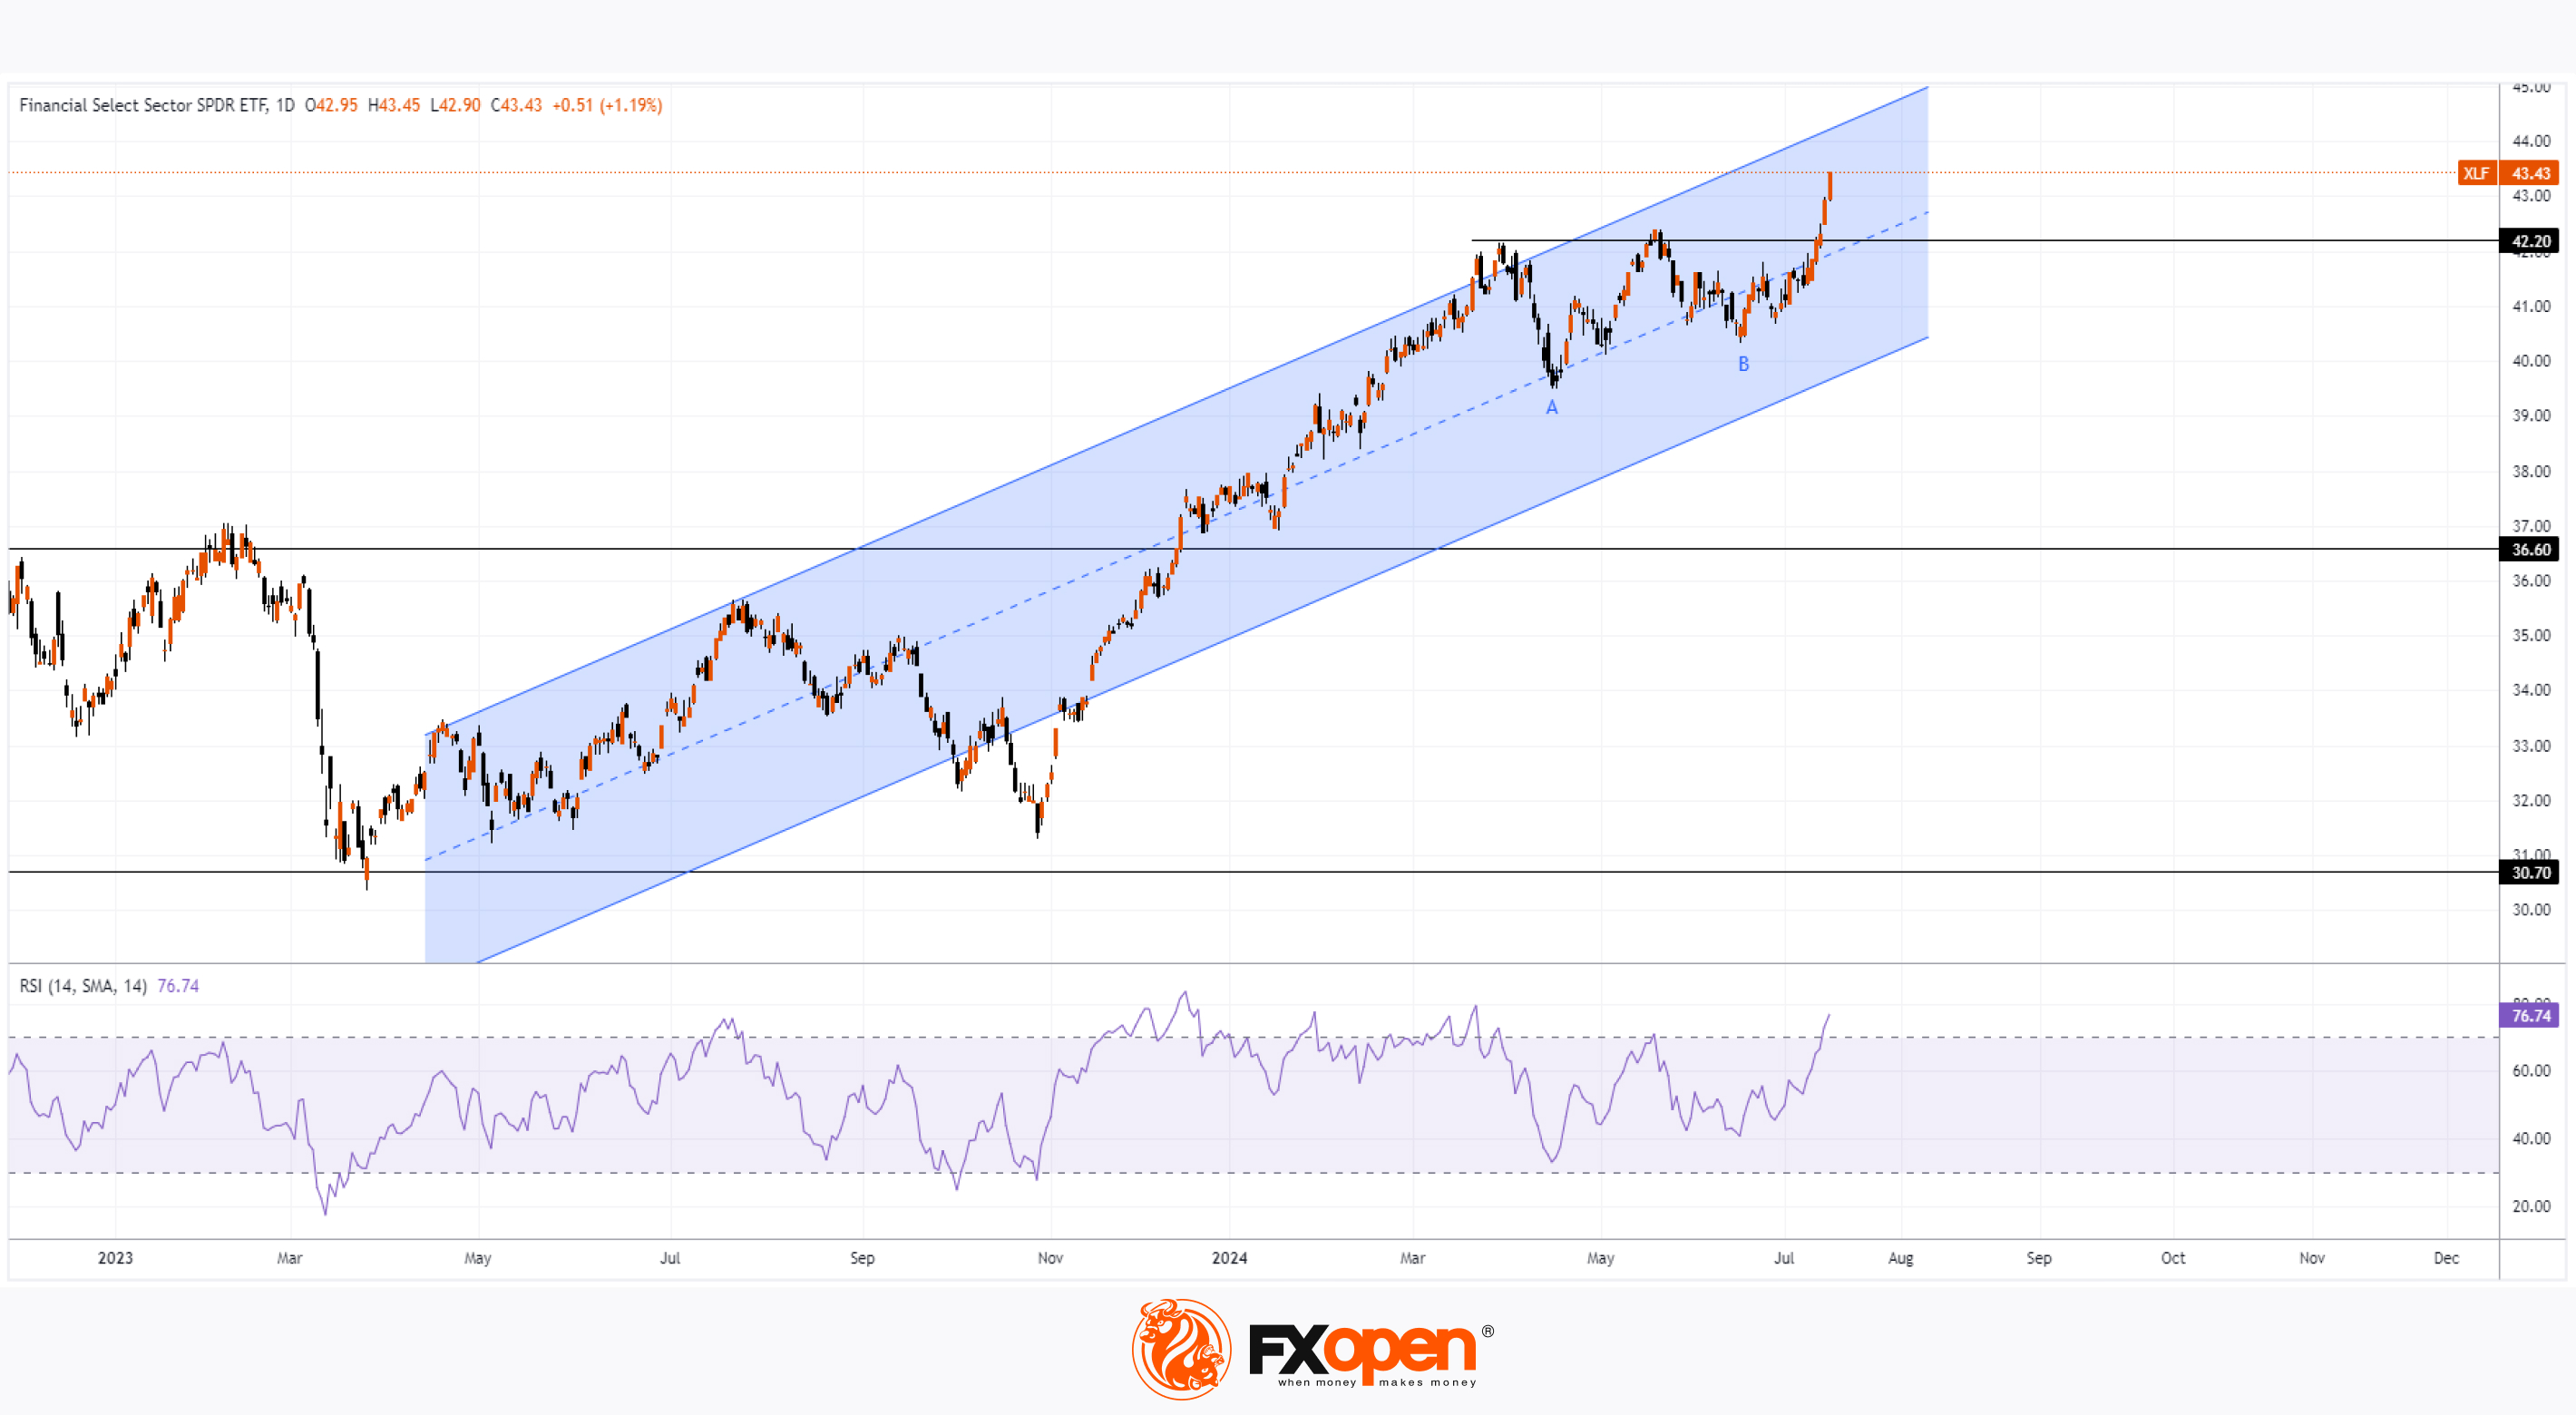
Notably, the formation on the XLF chart is interesting – this is the Financial Select Sector SPDR Fund ETF, which is focused on the financial sector and includes the shares of the largest US banks. You can trade this ETF with FXOpen, taking advantage of CFD instruments.
Technical analysis of the XLF chart shows that:
→ In 2022-2023, the price was in a broad trading range of 30.70-36.6;
→ In 2023-2024, the price formed an upward channel (shown in blue);
→ The median line of this channel acts as support;
→ Rising lows A and B resemble a bullish Cup and Handle pattern.
In the wake of the successful bank reports:
→ the XLF price broke through the 42.20 level, which had been acting as resistance since the end of March;
→ the RSI indicator entered the overbought zone.
It is possible that amid positive earnings reports from other companies in the financial sector:
→ the XLF price could reach the upper boundary of the blue channel;
→ the RSI indicator could form a divergence;
→ subsequently, a correction may form on the chart as investors may wish to lock in profits from the rapid growth.
Trade global index CFDs with zero commission and tight spreads. Open your FXOpen account now or learn more about trading index CFDs with FXOpen.
CFDs are complex instruments and come with a high risk of losing your money.
This article represents the opinion of the Companies operating under the FXOpen brand only. It is not to be construed as an offer, solicitation, or recommendation with respect to products and services provided by the Companies operating under the FXOpen brand, nor is it to be considered financial advice.
US Banks Set a Bullish Tone at the Start of Earnings Season
Company earnings reports for the second quarter will be a crucial driver of stock market movements in the coming weeks. Traditionally, the largest banks kick off the earnings season, and their performance indicators today are setting a bullish tone.
For example:
Bank of America (BAC), report published on 16th July:
→ Earnings per share: actual = $0.83, expected = $0.797;
→ Gross income: actual = $25.37 billion, expected = $25.22 billion;
Goldman Sachs (GS), report published on 15th July:
→ Earnings per share: actual = $8.62, expected = $8.35;
→ Gross income: actual = $12.73 billion, expected = $12.35 billion.
Other major banks, including JPMorgan Chase (JPM), Citigroup (C), and Wells Fargo (WFC), have also surpassed analysts' expectations. Although following different trajectories, the stock prices of all the listed banks have generally been rising after the publication of their earnings reports.
Notably, the formation on the XLF chart is interesting – this is the Financial Select Sector SPDR Fund ETF, which is focused on the financial sector and includes the shares of the largest US banks. You can trade this ETF with FXOpen, taking advantage of CFD instruments.
Technical analysis of the XLF chart shows that:
→ In 2022-2023, the price was in a broad trading range of 30.70-36.6;
→ In 2023-2024, the price formed an upward channel (shown in blue);
→ The median line of this channel acts as support;
→ Rising lows A and B resemble a bullish Cup and Handle pattern.
In the wake of the successful bank reports:
→ the XLF price broke through the 42.20 level, which had been acting as resistance since the end of March;
→ the RSI indicator entered the overbought zone.
It is possible that amid positive earnings reports from other companies in the financial sector:
→ the XLF price could reach the upper boundary of the blue channel;
→ the RSI indicator could form a divergence;
→ subsequently, a correction may form on the chart as investors may wish to lock in profits from the rapid growth.
Trade global index CFDs with zero commission and tight spreads. Open your FXOpen account now or learn more about trading index CFDs with FXOpen.
CFDs are complex instruments and come with a high risk of losing your money.
This article represents the opinion of the Companies operating under the FXOpen brand only. It is not to be construed as an offer, solicitation, or recommendation with respect to products and services provided by the Companies operating under the FXOpen brand, nor is it to be considered financial advice.
👍2
#XAUUSD #goldprice #goldtrading #marketanalysis
Analysis of XAU/USD: Gold Price Sets Historical Record
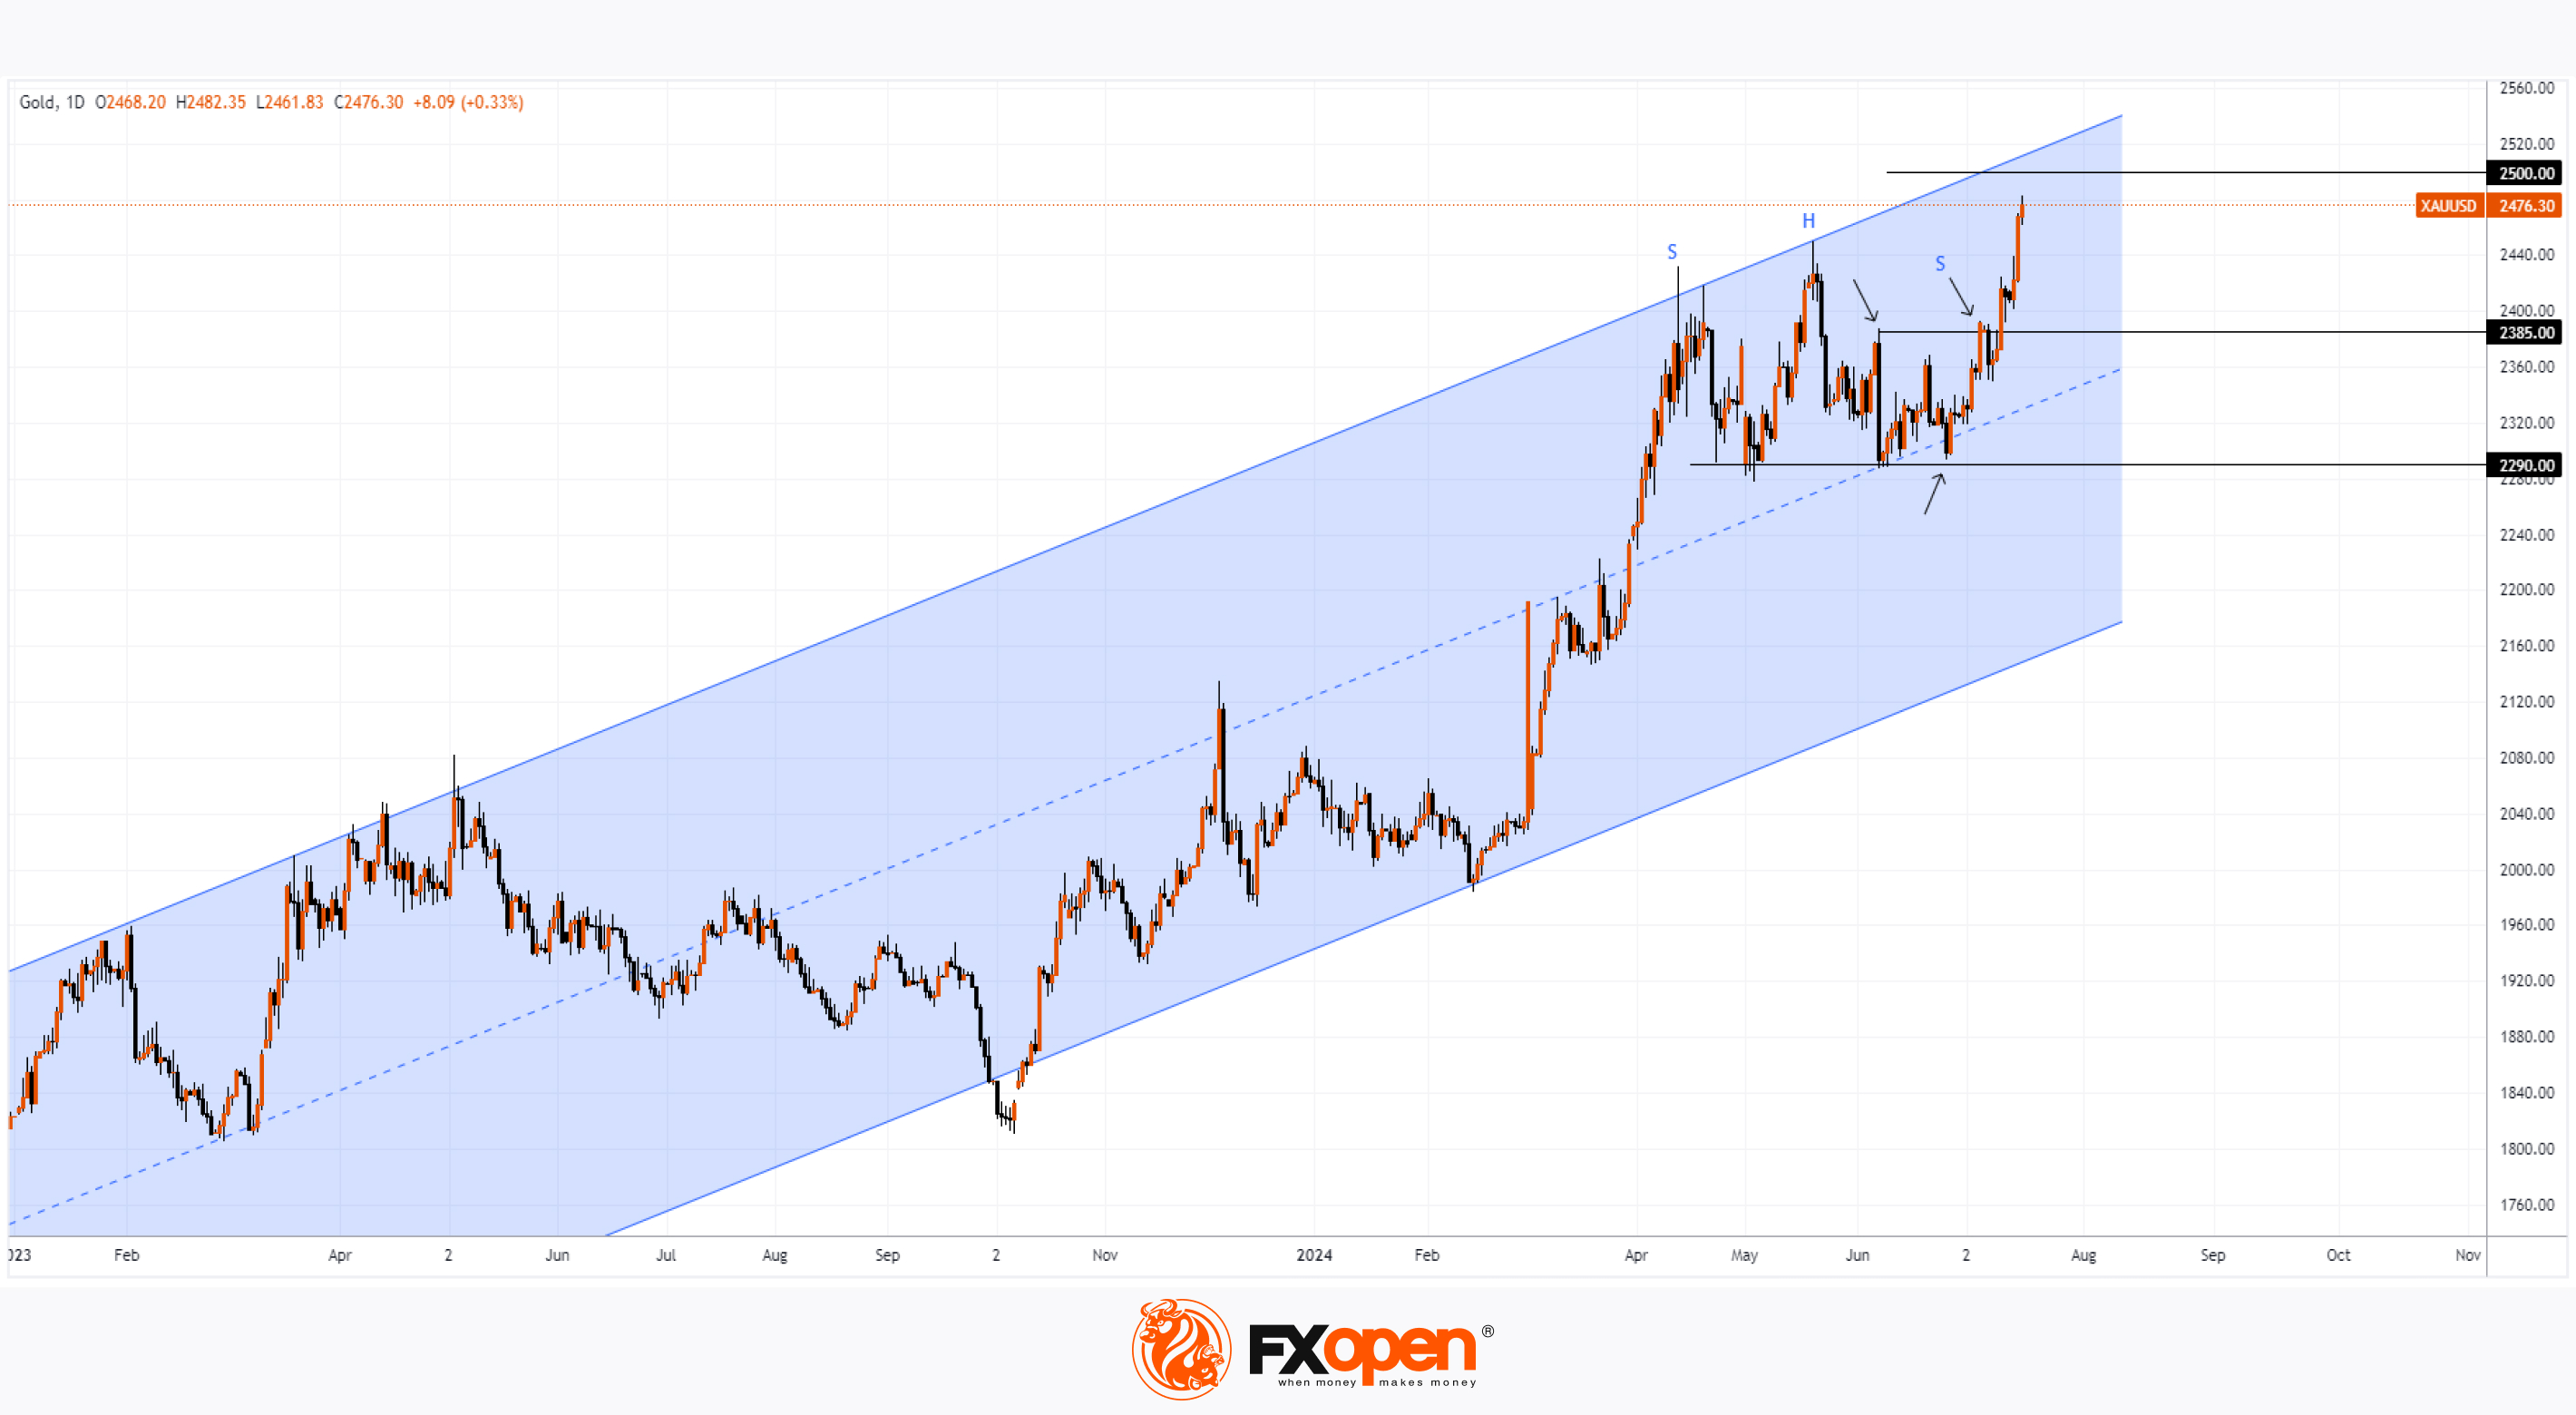
As the XAU/USD chart shows, on 16 July, the gold price rose above $2460 for the first time in history. The bullish sentiment is driven by:
→ Anticipation of Fed rate cuts, as the appeal of non-yielding bullion generally increases in low-interest-rate environments.
→ Geopolitical tensions, with an attempt on Trump's life possibly boosting demand for the "safe-haven asset."
→ Demand from central banks.
Reuters reports that analysts at Commonwealth Bank of Australia believe the gold price could exceed their forecast of $2500 per ounce by the end of 2024. "It is worth highlighting gold's ability to find support under any conditions this year," they say.
Can the gold price rise further?
Technical analysis of the XAU/USD chart provides valuable insights:
→ The gold price is in an upward trend (shown in blue).
→ The support level at $2290, reinforced by the median line of the blue channel, pushed the price up (shown by an arrow).
→ The bulls managed to break the $2385 level, which had acted as resistance since 7 June (shown by arrows).
→ The bearish head and shoulders (SHS) pattern failed.
The contours of the upward channel suggest the potential for the gold price to rise to its upper boundary, where the psychological level of $2500 per ounce also lies. Thus, the Commonwealth Bank of Australia's forecast could come true much earlier than the end of 2024.
Start trading commodities with tight spreads. Open your trading account now or learn more about trading commodity CFDs with FXOpen.
CFDs are complex instruments and come with a high risk of losing your money.
This article represents the opinion of the Companies operating under the FXOpen brand only. It is not to be construed as an offer, solicitation, or recommendation with respect to products and services provided by the Companies operating under the FXOpen brand, nor is it to be considered financial advice.
Analysis of XAU/USD: Gold Price Sets Historical Record
As the XAU/USD chart shows, on 16 July, the gold price rose above $2460 for the first time in history. The bullish sentiment is driven by:
→ Anticipation of Fed rate cuts, as the appeal of non-yielding bullion generally increases in low-interest-rate environments.
→ Geopolitical tensions, with an attempt on Trump's life possibly boosting demand for the "safe-haven asset."
→ Demand from central banks.
Reuters reports that analysts at Commonwealth Bank of Australia believe the gold price could exceed their forecast of $2500 per ounce by the end of 2024. "It is worth highlighting gold's ability to find support under any conditions this year," they say.
Can the gold price rise further?
Technical analysis of the XAU/USD chart provides valuable insights:
→ The gold price is in an upward trend (shown in blue).
→ The support level at $2290, reinforced by the median line of the blue channel, pushed the price up (shown by an arrow).
→ The bulls managed to break the $2385 level, which had acted as resistance since 7 June (shown by arrows).
→ The bearish head and shoulders (SHS) pattern failed.
The contours of the upward channel suggest the potential for the gold price to rise to its upper boundary, where the psychological level of $2500 per ounce also lies. Thus, the Commonwealth Bank of Australia's forecast could come true much earlier than the end of 2024.
Start trading commodities with tight spreads. Open your trading account now or learn more about trading commodity CFDs with FXOpen.
CFDs are complex instruments and come with a high risk of losing your money.
This article represents the opinion of the Companies operating under the FXOpen brand only. It is not to be construed as an offer, solicitation, or recommendation with respect to products and services provided by the Companies operating under the FXOpen brand, nor is it to be considered financial advice.
👍3
#GBPUSD #inflation #marketanalysis #MarketNews
Analysis of GBP/USD: Exchange Rate Rises Above 1.3000 on Inflation News
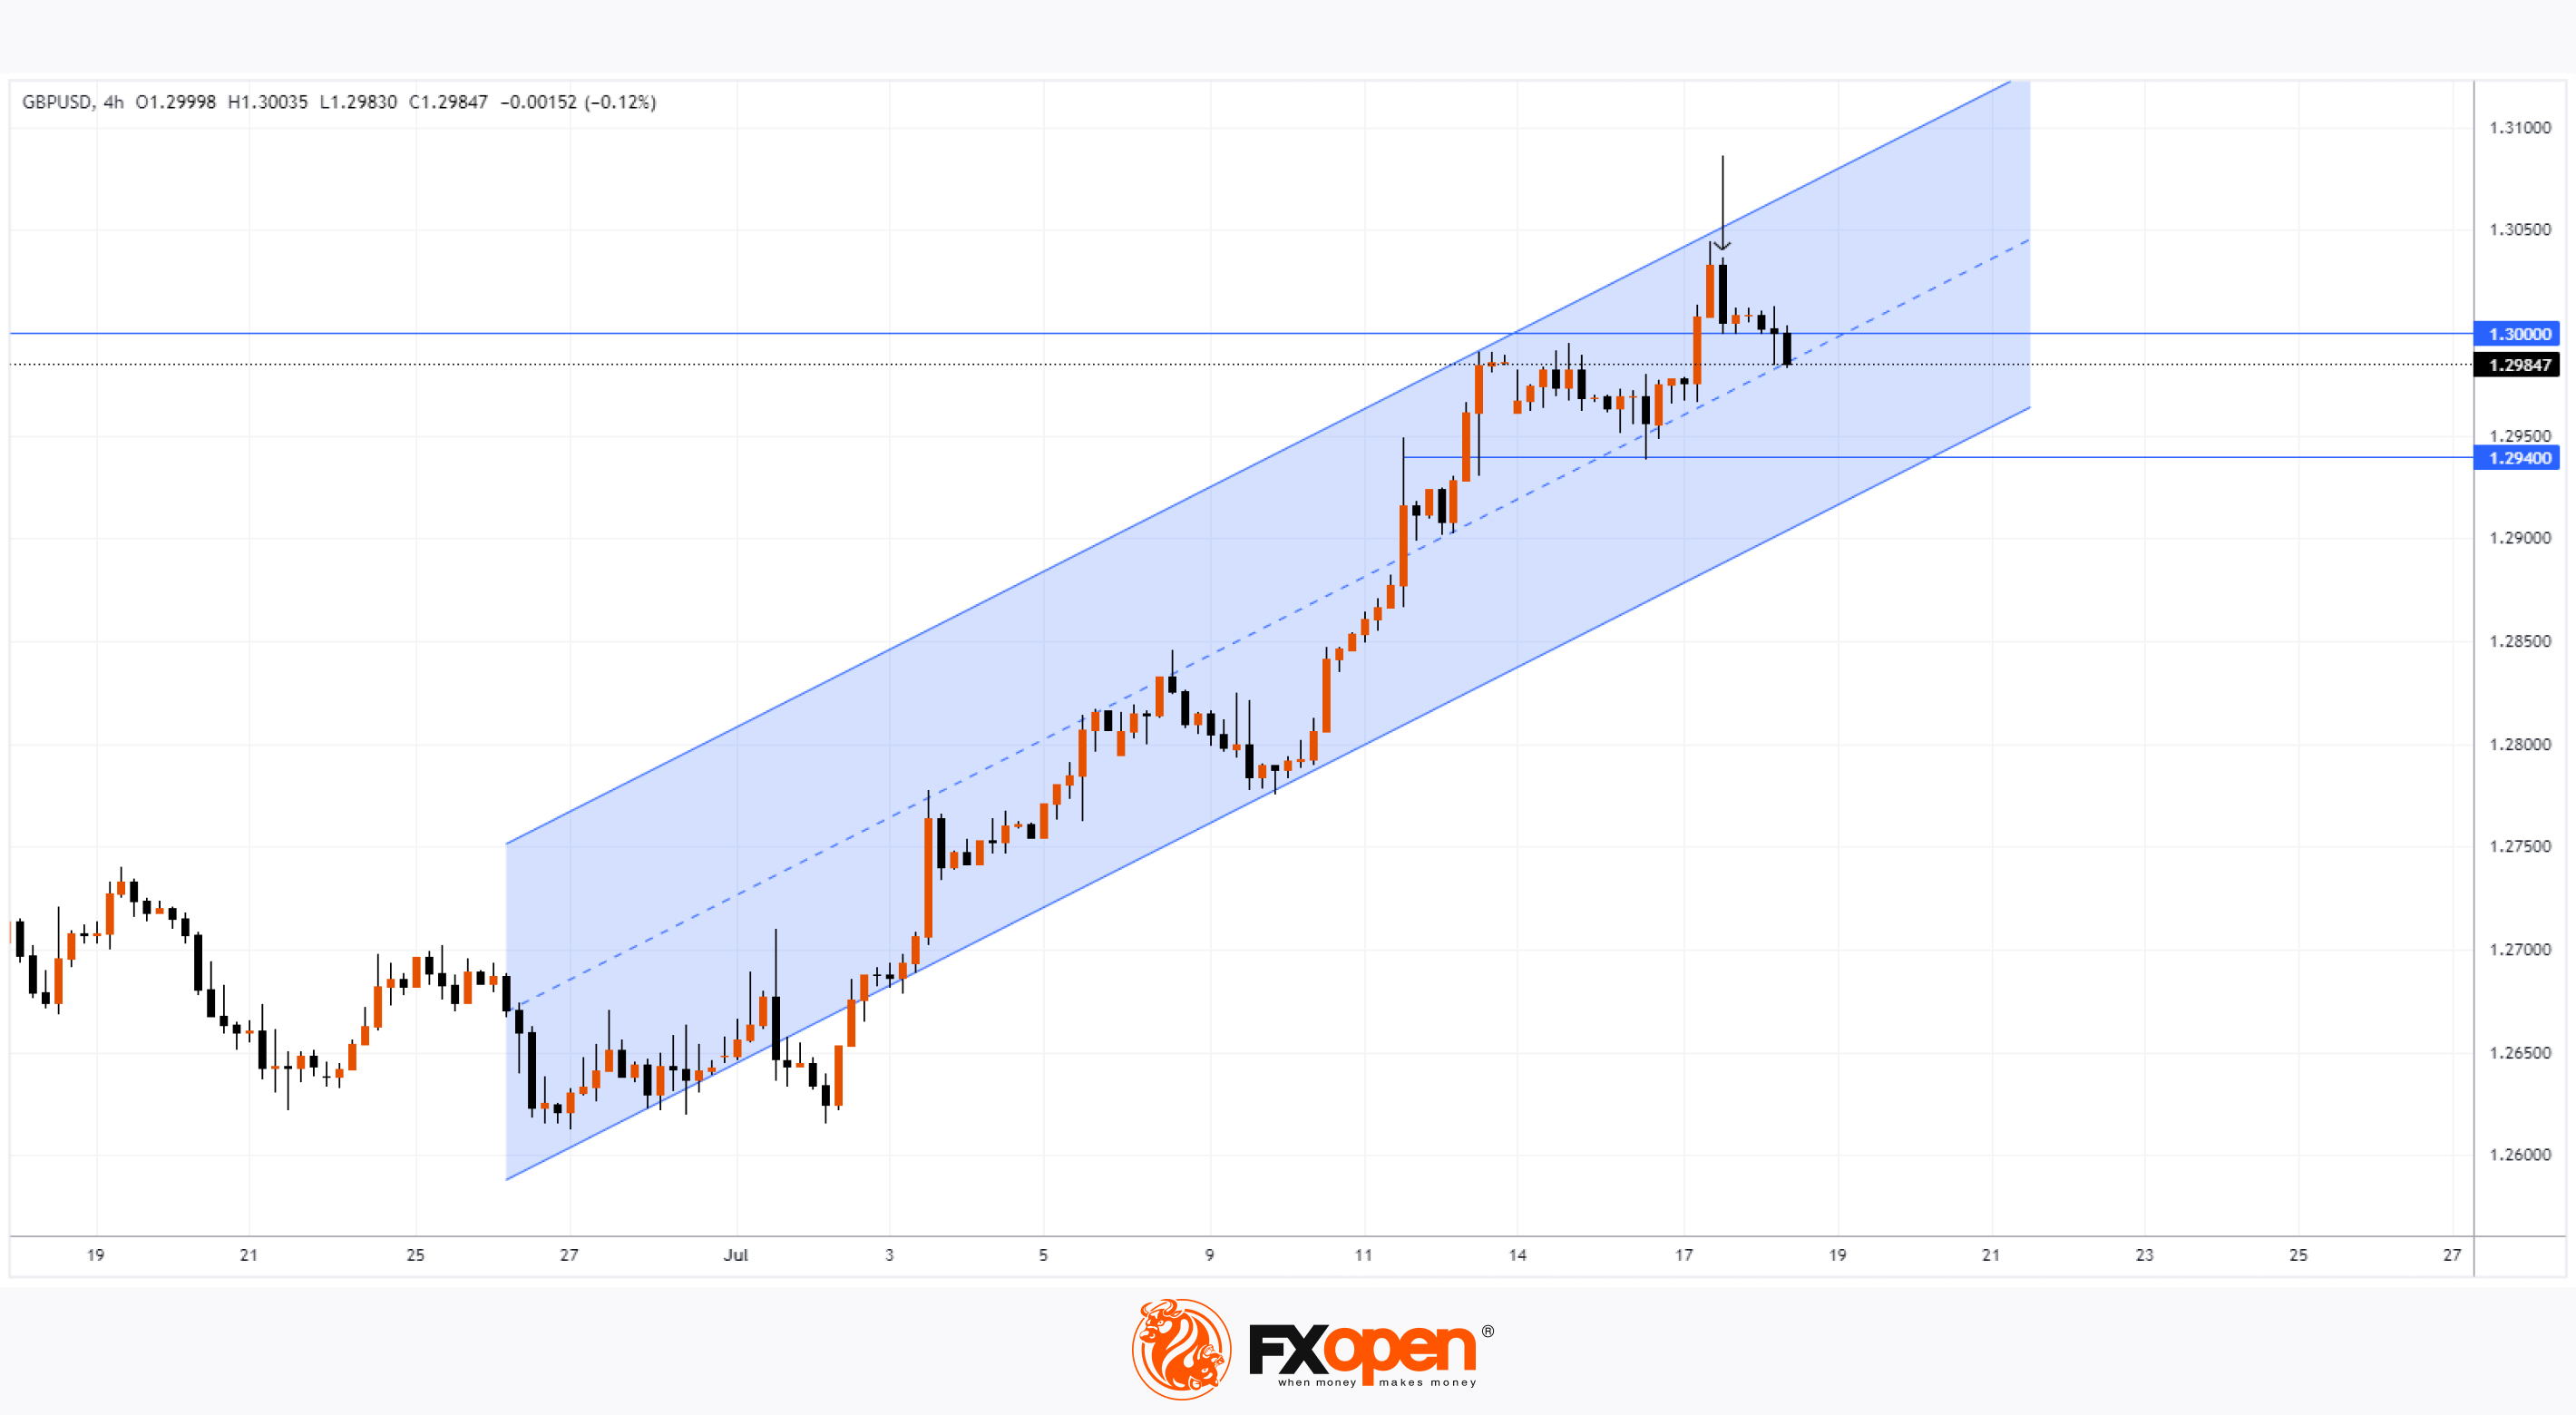
As evidenced by the GBP/USD chart, yesterday the exchange rate rose above the psychological level of 1.3000 USD per pound for the first time in 12 months. The strengthening of the British currency occurred after the release of inflation news. According to ForexFactory:
→ Year-on-year Consumer Price Index (CPI): actual = 2.0%, forecast = 1.9%, previous = 2.0%;
→ Year-on-year Core CPI: actual = 3.5%, forecast = 3.4%, previous = 3.5%.
Thus, analysts' expectations of a slowdown in inflation were not met, giving market participants a reason to believe that the Bank of England's tight policy would continue for a longer period, providing a bullish boost for the GBP.
However, in the second half of yesterday, the bears managed to “extinguish” all the progress from the bullish momentum. A bearish engulfing pattern formed on the chart (shown with an arrow). Moreover, bearish activity intensified this morning after the release of labor market news. The number of jobless claims (Claimant Count Change) filed in the previous month was 32.3K, whereas analysts had expected 23.4K. This has clouded expectations regarding the future policy of the Bank of England – whether it will keep rates at the current high level of 5.25% or start to reduce them.
In any case, the pound exchange rate fell below the psychological level of 1.3000 today, raising the possibility of a false bullish breakout. What can the chart suggest about whether this scenario will actually play out?
According to the technical analysis of GBP/USD:
→ The price is in an uptrend (shown by the blue channel);
→ After yesterday's bearish engulfing, the price is still in the upper half of the channel.
The exhaustion of bullish sentiment seems appropriate in light of the rally from the July low of approximately 3%. If so, we may see weak rebounds (the bulls' inability to resume the rally) from the median line of the channel and its lower boundary. Key support appears to be the former resistance at the 1.294 level. If the GBP/USD rate can consolidate below this level, it will become relevant to look for patterns to build a descending channel.
Trade over 50 forex markets 24 hours a day with FXOpen. Take advantage of low commissions, deep liquidity, and spreads from 0.0 pips. Open your FXOpen account now or learn more about trading forex with FXOpen.
CFDs are complex instruments and come with a high risk of losing your money.
This article represents the opinion of the Companies operating under the FXOpen brand only. It is not to be construed as an offer, solicitation, or recommendation with respect to products and services provided by the Companies operating under the FXOpen brand, nor is it to be considered financial advice.
Analysis of GBP/USD: Exchange Rate Rises Above 1.3000 on Inflation News
As evidenced by the GBP/USD chart, yesterday the exchange rate rose above the psychological level of 1.3000 USD per pound for the first time in 12 months. The strengthening of the British currency occurred after the release of inflation news. According to ForexFactory:
→ Year-on-year Consumer Price Index (CPI): actual = 2.0%, forecast = 1.9%, previous = 2.0%;
→ Year-on-year Core CPI: actual = 3.5%, forecast = 3.4%, previous = 3.5%.
Thus, analysts' expectations of a slowdown in inflation were not met, giving market participants a reason to believe that the Bank of England's tight policy would continue for a longer period, providing a bullish boost for the GBP.
However, in the second half of yesterday, the bears managed to “extinguish” all the progress from the bullish momentum. A bearish engulfing pattern formed on the chart (shown with an arrow). Moreover, bearish activity intensified this morning after the release of labor market news. The number of jobless claims (Claimant Count Change) filed in the previous month was 32.3K, whereas analysts had expected 23.4K. This has clouded expectations regarding the future policy of the Bank of England – whether it will keep rates at the current high level of 5.25% or start to reduce them.
In any case, the pound exchange rate fell below the psychological level of 1.3000 today, raising the possibility of a false bullish breakout. What can the chart suggest about whether this scenario will actually play out?
According to the technical analysis of GBP/USD:
→ The price is in an uptrend (shown by the blue channel);
→ After yesterday's bearish engulfing, the price is still in the upper half of the channel.
The exhaustion of bullish sentiment seems appropriate in light of the rally from the July low of approximately 3%. If so, we may see weak rebounds (the bulls' inability to resume the rally) from the median line of the channel and its lower boundary. Key support appears to be the former resistance at the 1.294 level. If the GBP/USD rate can consolidate below this level, it will become relevant to look for patterns to build a descending channel.
Trade over 50 forex markets 24 hours a day with FXOpen. Take advantage of low commissions, deep liquidity, and spreads from 0.0 pips. Open your FXOpen account now or learn more about trading forex with FXOpen.
CFDs are complex instruments and come with a high risk of losing your money.
This article represents the opinion of the Companies operating under the FXOpen brand only. It is not to be construed as an offer, solicitation, or recommendation with respect to products and services provided by the Companies operating under the FXOpen brand, nor is it to be considered financial advice.
👍2
#marketanalysis #MarketNews #stockmarket #nvidia
NVDA Stock Price Recovers After 1.5-Month Low
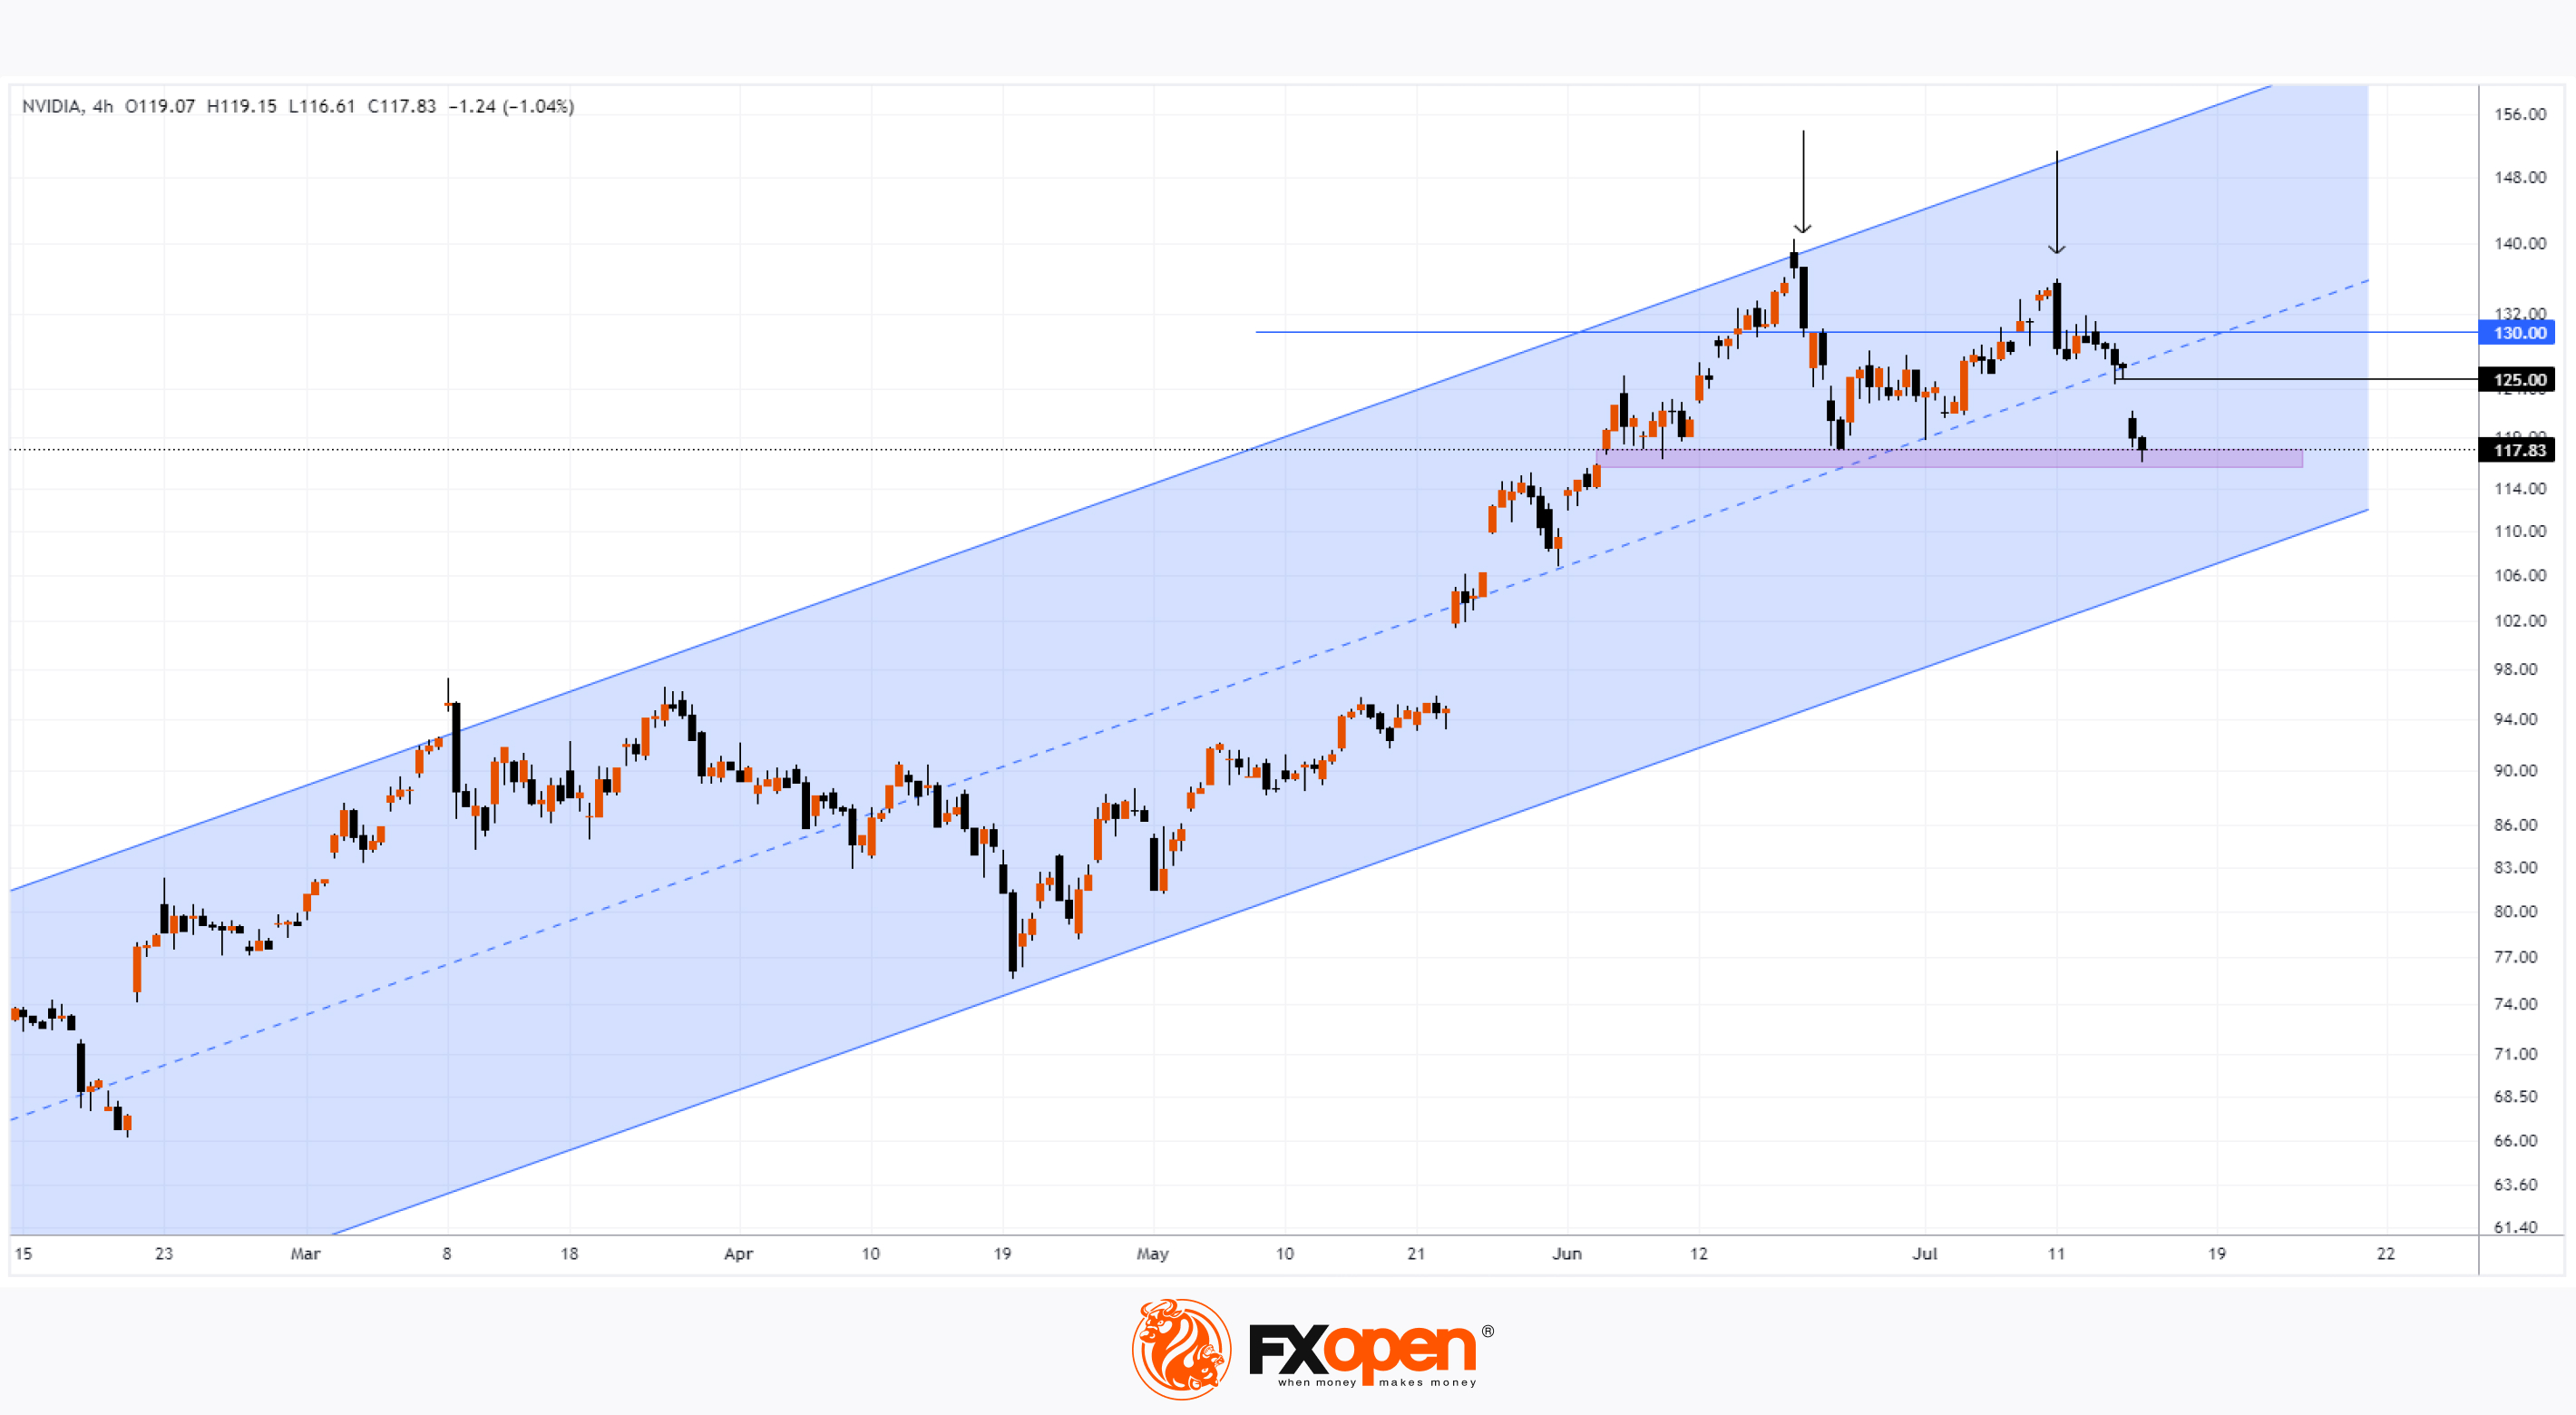
Yesterday, NVDA’s stock price fell to 116.61 – its lowest level since June 5th. The bearish sentiment was triggered by Trump’s cautious remarks regarding the necessity to defend Taiwan from the threat of military action by China. The leading pre-election candidate suggested in a Bloomberg interview that the island should pay for US defensive support, leading to a drop in semiconductor manufacturers' stock prices: TSMC fell by 8%, and Nvidia shares dropped by 6.6% during yesterday's session, as its primary AI chip producer is Taiwan Semiconductor Manufacturing.
However, today in pre-market trading, NVDA's price is recovering, rising above $120 per share. How might the situation develop further? Let us recall that on 10th July, we wrote about strong seller pressure above the $130 per share level. Since then, the price has declined by approximately 9%.
Technical analysis of NVDA’s chart today shows that:
→ Bears have twice (indicated by arrows) aggressively pushed the price down when it was above the mentioned level;
→ The price found support from the gap zone around the $115 level, where bulls broke through the May highs on June 4-5;
→ The price is still moving within the upward channel (shown in blue), but has dropped into the lower half;
→ Additionally, the price has formed a wide bearish gap with the upper boundary at $125.
Investor concerns should not only focus on Trump’s remarks but also on the fact that NVDA's price is underperforming the stock index, despite being a market leader in the first half of the year. If bears continue to hold the initiative, we may see signs of their aggression not from the $130 level, but from the $125 level – if this happens, the lower boundary of the current blue channel will be at risk of a breakout.
Trade global index CFDs with zero commission and tight spreads. Open your FXOpen account now or learn more about trading index CFDs with FXOpen.
CFDs are complex instruments and come with a high risk of losing your money.
This article represents the opinion of the Companies operating under the FXOpen brand only. It is not to be construed as an offer, solicitation, or recommendation with respect to products and services provided by the Companies operating under the FXOpen brand, nor is it to be considered financial advice.
NVDA Stock Price Recovers After 1.5-Month Low
Yesterday, NVDA’s stock price fell to 116.61 – its lowest level since June 5th. The bearish sentiment was triggered by Trump’s cautious remarks regarding the necessity to defend Taiwan from the threat of military action by China. The leading pre-election candidate suggested in a Bloomberg interview that the island should pay for US defensive support, leading to a drop in semiconductor manufacturers' stock prices: TSMC fell by 8%, and Nvidia shares dropped by 6.6% during yesterday's session, as its primary AI chip producer is Taiwan Semiconductor Manufacturing.
However, today in pre-market trading, NVDA's price is recovering, rising above $120 per share. How might the situation develop further? Let us recall that on 10th July, we wrote about strong seller pressure above the $130 per share level. Since then, the price has declined by approximately 9%.
Technical analysis of NVDA’s chart today shows that:
→ Bears have twice (indicated by arrows) aggressively pushed the price down when it was above the mentioned level;
→ The price found support from the gap zone around the $115 level, where bulls broke through the May highs on June 4-5;
→ The price is still moving within the upward channel (shown in blue), but has dropped into the lower half;
→ Additionally, the price has formed a wide bearish gap with the upper boundary at $125.
Investor concerns should not only focus on Trump’s remarks but also on the fact that NVDA's price is underperforming the stock index, despite being a market leader in the first half of the year. If bears continue to hold the initiative, we may see signs of their aggression not from the $130 level, but from the $125 level – if this happens, the lower boundary of the current blue channel will be at risk of a breakout.
Trade global index CFDs with zero commission and tight spreads. Open your FXOpen account now or learn more about trading index CFDs with FXOpen.
CFDs are complex instruments and come with a high risk of losing your money.
This article represents the opinion of the Companies operating under the FXOpen brand only. It is not to be construed as an offer, solicitation, or recommendation with respect to products and services provided by the Companies operating under the FXOpen brand, nor is it to be considered financial advice.
👍2
#META #stockmarket #stocktrading #marketanalysis
The META Price Is Holding Around a Key Support Level. But for How Long?
According to TipRanks, the average target price for META, as forecasted by Wall Street analysts, is $537.41 (a 12.94% increase from current levels) over the next 12 months. However, not all analysts remain positive. Craig Johnson, Chief Market Technician at Piper Sandler, issued a warning about the future of the "Magnificent Seven" stocks, which include Microsoft (MSFT), Apple (AAPL), NVIDIA (NVDA), Meta Platforms (META), Tesla (TSLA), Amazon.com (AMZN), and Alphabet Inc. (GOOG and GOOGL). "These charts are reversing, and they need further correction," he said on CNBC's Last Call programme.
Indeed, the market is sending alarming signals regarding the leaders. Yesterday, we wrote about the increasing signs of bearish aggression on Nvidia's stock chart; today, we'll assess the price action of Meta Platforms Inc.
Technical analysis of META's daily chart shows that since the second half of last year, the price action is best described by an upward trend (indicated by the blue channel).
However:
→ The price has fallen into the lower half of the channel, and the median shows signs of resistance (judging by the price action from 8-10 July).
→ The formation of peaks A-B-C indicates a worrying trend: the price is unable to consolidate at the achieved peaks. We see only a slight excess over the previous maximum – a sign of bullish uncertainty.
→ Meanwhile, the bears are aggressive. Look at the bearish gaps (shown with red arrows) in July.
How might the situation develop further?
Currently, the META stock price is holding around the lower boundary of the trend channel, which is reinforced by the $455 level that previously acted as support (shown with blue arrows). But, given the aggressive activity of the bears, it is reasonable to assume that the lower boundary is under significant pressure.
Trade global index CFDs with zero commission and tight spreads. Open your FXOpen account now or learn more about trading index CFDs with FXOpen.
CFDs are complex instruments and come with a high risk of losing your money.
This article represents the opinion of the Companies operating under the FXOpen brand only. It is not to be construed as an offer, solicitation, or recommendation with respect to products and services provided by the Companies operating under the FXOpen brand, nor is it to be considered financial advice.
The META Price Is Holding Around a Key Support Level. But for How Long?
According to TipRanks, the average target price for META, as forecasted by Wall Street analysts, is $537.41 (a 12.94% increase from current levels) over the next 12 months. However, not all analysts remain positive. Craig Johnson, Chief Market Technician at Piper Sandler, issued a warning about the future of the "Magnificent Seven" stocks, which include Microsoft (MSFT), Apple (AAPL), NVIDIA (NVDA), Meta Platforms (META), Tesla (TSLA), Amazon.com (AMZN), and Alphabet Inc. (GOOG and GOOGL). "These charts are reversing, and they need further correction," he said on CNBC's Last Call programme.
Indeed, the market is sending alarming signals regarding the leaders. Yesterday, we wrote about the increasing signs of bearish aggression on Nvidia's stock chart; today, we'll assess the price action of Meta Platforms Inc.
Technical analysis of META's daily chart shows that since the second half of last year, the price action is best described by an upward trend (indicated by the blue channel).
However:
→ The price has fallen into the lower half of the channel, and the median shows signs of resistance (judging by the price action from 8-10 July).
→ The formation of peaks A-B-C indicates a worrying trend: the price is unable to consolidate at the achieved peaks. We see only a slight excess over the previous maximum – a sign of bullish uncertainty.
→ Meanwhile, the bears are aggressive. Look at the bearish gaps (shown with red arrows) in July.
How might the situation develop further?
Currently, the META stock price is holding around the lower boundary of the trend channel, which is reinforced by the $455 level that previously acted as support (shown with blue arrows). But, given the aggressive activity of the bears, it is reasonable to assume that the lower boundary is under significant pressure.
Trade global index CFDs with zero commission and tight spreads. Open your FXOpen account now or learn more about trading index CFDs with FXOpen.
CFDs are complex instruments and come with a high risk of losing your money.
This article represents the opinion of the Companies operating under the FXOpen brand only. It is not to be construed as an offer, solicitation, or recommendation with respect to products and services provided by the Companies operating under the FXOpen brand, nor is it to be considered financial advice.

👍1
#usdcad #marketanalysis #tradingforex #tradingtips
USD/CAD Exchange Rate Approaches Key Resistance
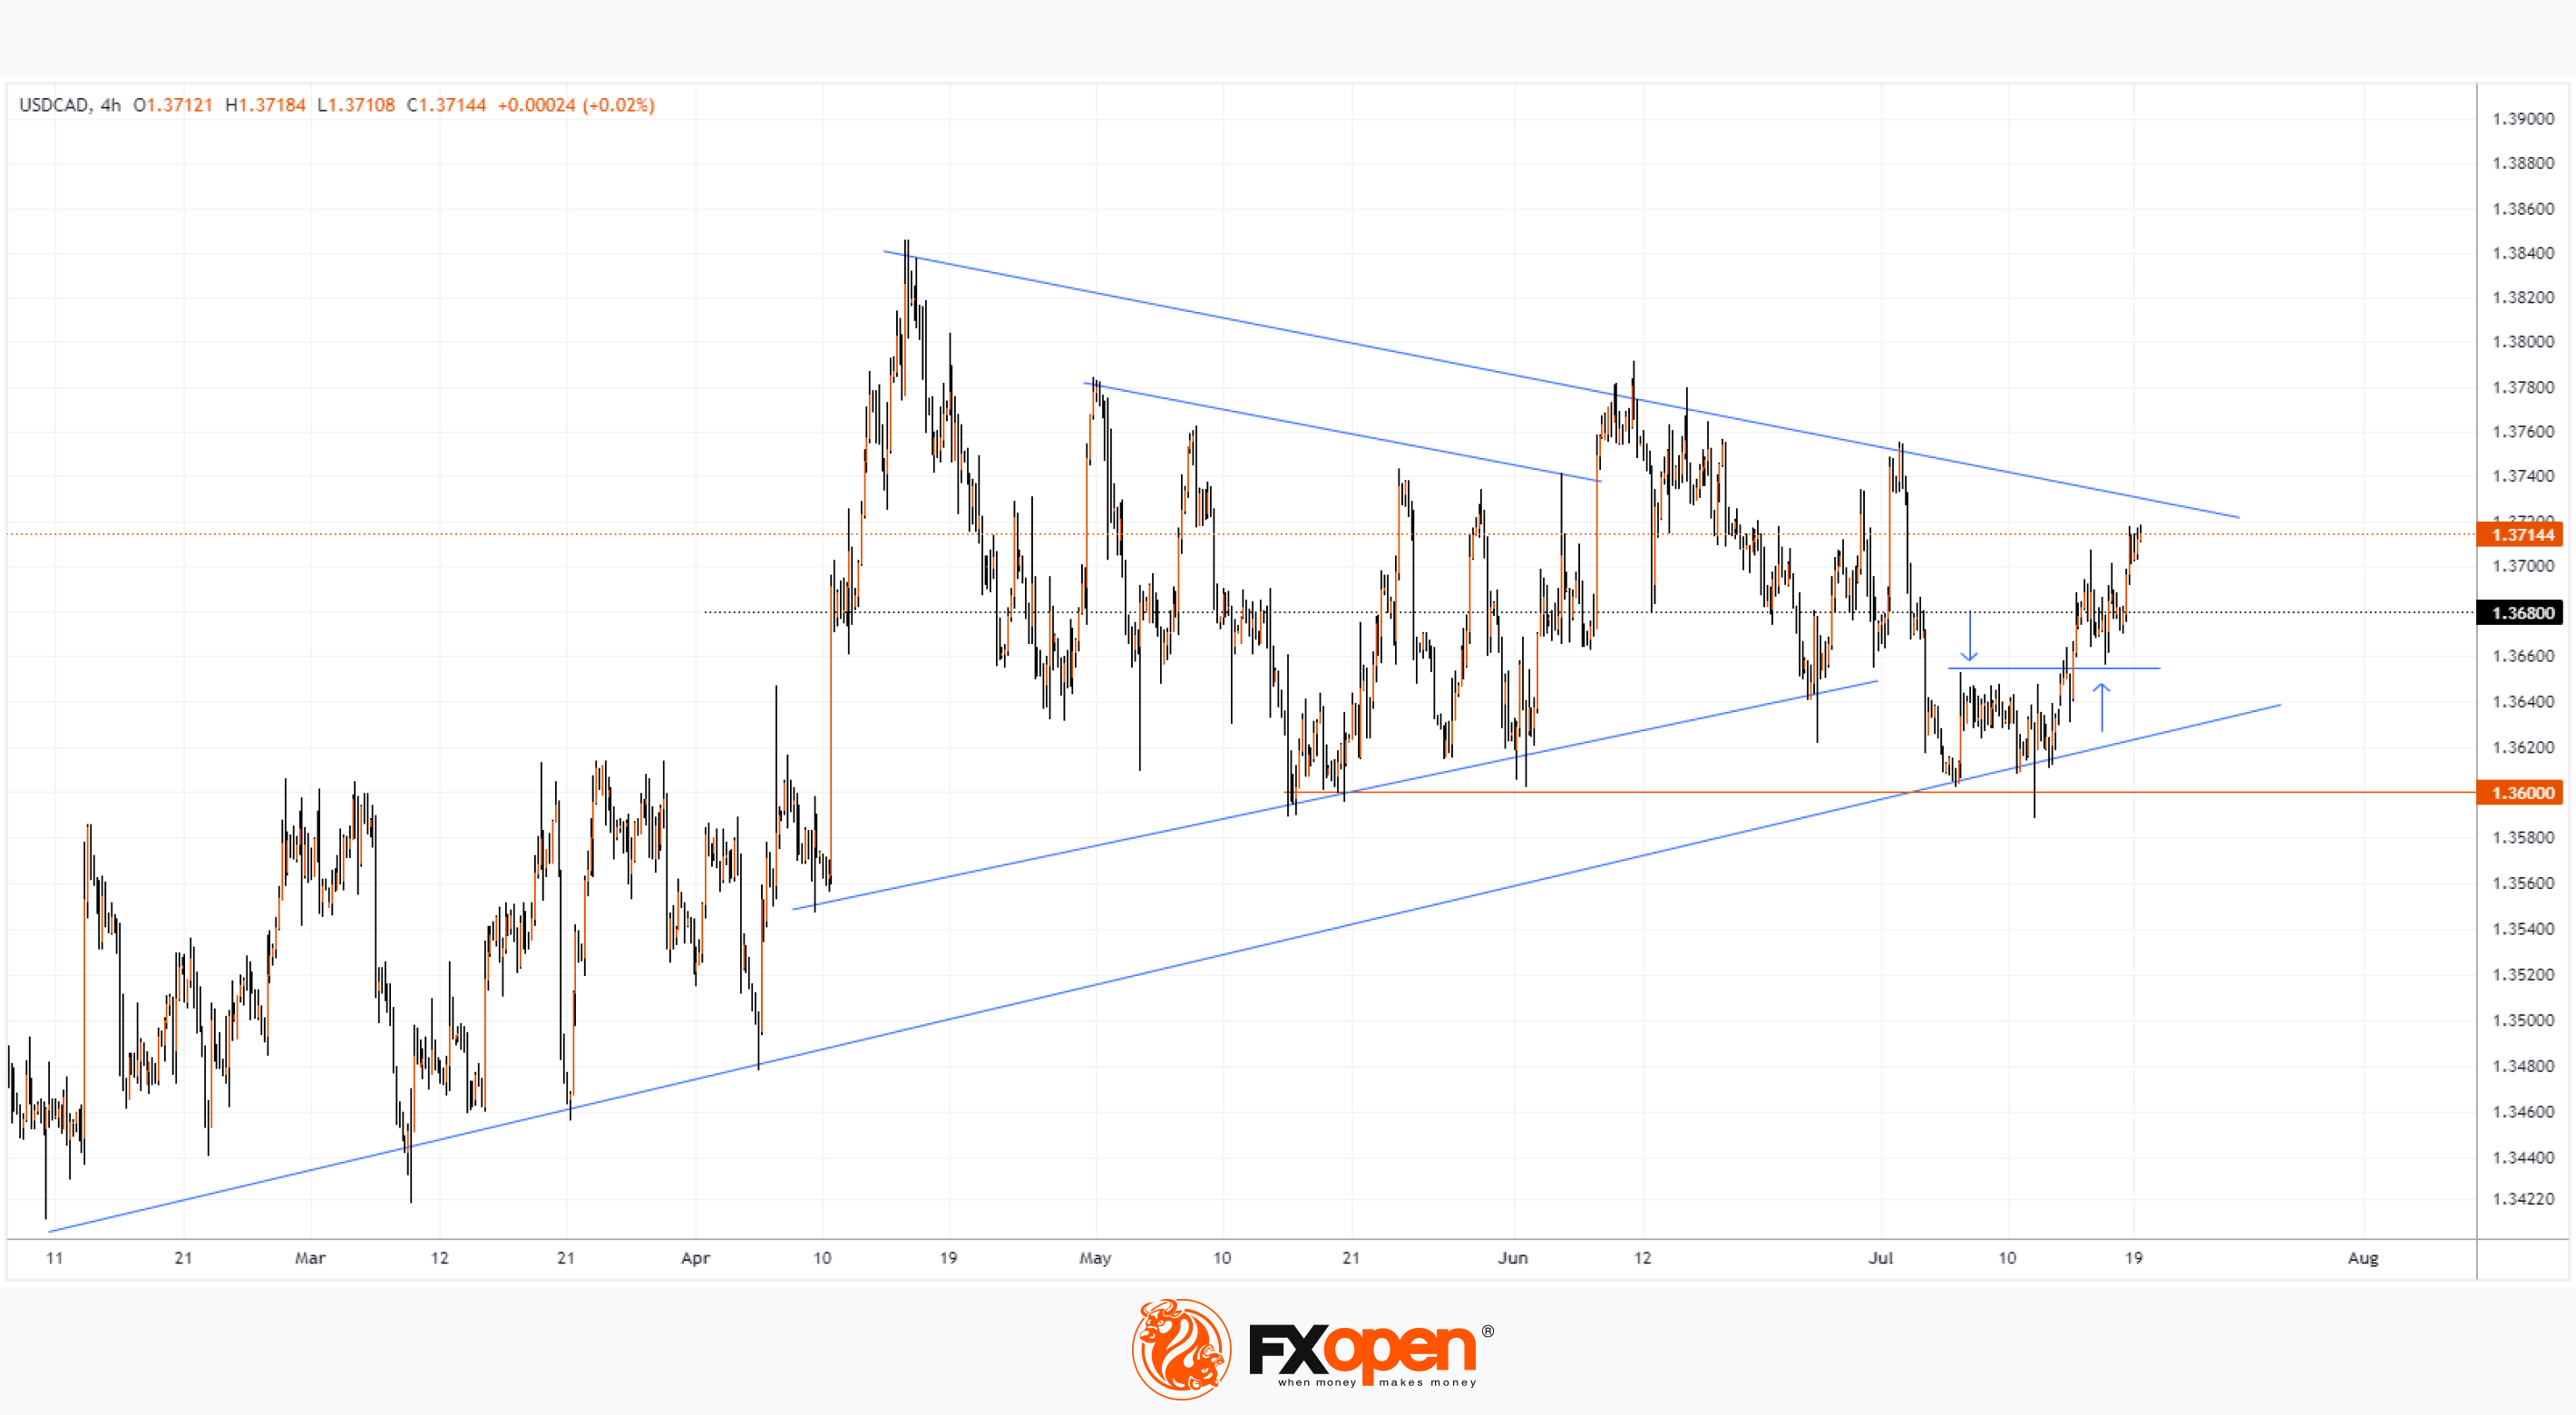
As the USD/CAD chart shows, the Canadian dollar has weakened against the US dollar over the week. Today, the USD/CAD rate is near two-week highs. According to Reuters, this has been influenced by:
- The strengthening of the USD against other currencies
- The anticipation of retail sales data, which could affect the outlook for a potential rate cut by the Bank of Canada. The Retail Sales data will be released today at 15:30 GMT+3.
How might the Canadian dollar's exchange rate change against the “greenback”? According to the technical analysis of the USD/CAD chart:
- In 2024, the price action indicates the formation of a narrowing triangle with a median around the 1.368 level, which can be interpreted as a frequent compromise price between buyers and sellers.
- On 11 July, an important event occurred – the price dropped below the 1.36 level, which is under the lower boundary of the triangle, but it sharply recovered – indicating bullish aggression and a false breakout of the multi-month low.
- After this, the price began to rise towards the upper boundary of the triangle. In this process, the 1.3655 level changed its role from resistance to support (shown with arrows).
Thus, the dominance of bullish forces in the second half of July has brought the USD/CAD rate to the upper boundary of the triangle. In light of today's news, it is possible that the price may reach this boundary. In that case, one should be prepared for the key resistance to show its influence.
Trade over 50 forex markets 24 hours a day with FXOpen. Take advantage of low commissions, deep liquidity, and spreads from 0.0 pips. Open your FXOpen account now or learn more about trading forex with FXOpen.
CFDs are complex instruments and come with a high risk of losing your money.
This article represents the opinion of the Companies operating under the FXOpen brand only. It is not to be construed as an offer, solicitation, or recommendation with respect to products and services provided by the Companies operating under the FXOpen brand, nor is it to be considered financial advice.
USD/CAD Exchange Rate Approaches Key Resistance
As the USD/CAD chart shows, the Canadian dollar has weakened against the US dollar over the week. Today, the USD/CAD rate is near two-week highs. According to Reuters, this has been influenced by:
- The strengthening of the USD against other currencies
- The anticipation of retail sales data, which could affect the outlook for a potential rate cut by the Bank of Canada. The Retail Sales data will be released today at 15:30 GMT+3.
How might the Canadian dollar's exchange rate change against the “greenback”? According to the technical analysis of the USD/CAD chart:
- In 2024, the price action indicates the formation of a narrowing triangle with a median around the 1.368 level, which can be interpreted as a frequent compromise price between buyers and sellers.
- On 11 July, an important event occurred – the price dropped below the 1.36 level, which is under the lower boundary of the triangle, but it sharply recovered – indicating bullish aggression and a false breakout of the multi-month low.
- After this, the price began to rise towards the upper boundary of the triangle. In this process, the 1.3655 level changed its role from resistance to support (shown with arrows).
Thus, the dominance of bullish forces in the second half of July has brought the USD/CAD rate to the upper boundary of the triangle. In light of today's news, it is possible that the price may reach this boundary. In that case, one should be prepared for the key resistance to show its influence.
Trade over 50 forex markets 24 hours a day with FXOpen. Take advantage of low commissions, deep liquidity, and spreads from 0.0 pips. Open your FXOpen account now or learn more about trading forex with FXOpen.
CFDs are complex instruments and come with a high risk of losing your money.
This article represents the opinion of the Companies operating under the FXOpen brand only. It is not to be construed as an offer, solicitation, or recommendation with respect to products and services provided by the Companies operating under the FXOpen brand, nor is it to be considered financial advice.
👍2
#XAUUSD #goldprice #GBPUSD #NVDA #nvidia #StockMarket #stocks
Weekly Market Wrap With Gary Thomson: US Banks Turn Bullish, GBP/USD, Gold Price, NVDA Stock
Get the latest scoop on the week's hottest headlines, all in one convenient video. Join Gary Thomson, the COO of FXOpen UK, as he breaks down the most significant news reports and shares his expert insights.
🔸US Banks Set a Bullish Tone at the Start of Earnings Season
🔸GBP/USD Exchange Rate Rises Above 1.3000 on Inflation News
🔸Analysis of XAU/USD: Gold Price Sets Historical Record
🔸NVDA Stock Price Recovers After 1.5-Month Low
Stay in the know and empower yourself with our short, yet power-packed video. Watch it now and stay updated with FXOpen. Don't miss out on this invaluable opportunity to sharpen your trading skills and make informed decisions.
https://cutt.ly/JejFgDxS
To take advantage of price fluctuations in the foreign exchange markets, consider enlisting the services of a reliable broker like FXOpen.
⚠️
This forecast represents FXOpen Companies opinion only, it should not be construed as an offer, invitation or recommendation in respect to FXOpen Companies products and services or as financial advice.
Weekly Market Wrap With Gary Thomson: US Banks Turn Bullish, GBP/USD, Gold Price, NVDA Stock
Get the latest scoop on the week's hottest headlines, all in one convenient video. Join Gary Thomson, the COO of FXOpen UK, as he breaks down the most significant news reports and shares his expert insights.
🔸US Banks Set a Bullish Tone at the Start of Earnings Season
🔸GBP/USD Exchange Rate Rises Above 1.3000 on Inflation News
🔸Analysis of XAU/USD: Gold Price Sets Historical Record
🔸NVDA Stock Price Recovers After 1.5-Month Low
Stay in the know and empower yourself with our short, yet power-packed video. Watch it now and stay updated with FXOpen. Don't miss out on this invaluable opportunity to sharpen your trading skills and make informed decisions.
https://cutt.ly/JejFgDxS
To take advantage of price fluctuations in the foreign exchange markets, consider enlisting the services of a reliable broker like FXOpen.
⚠️
This forecast represents FXOpen Companies opinion only, it should not be construed as an offer, invitation or recommendation in respect to FXOpen Companies products and services or as financial advice.
YouTube
Weekly Market Wrap With Gary Thomson: US Banks Turn Bullish, GBP/USD, Gold Price, NVDA Stock
Get the latest scoop on the week's hottest headlines, all in one convenient video. Join Gary Thomson, the COO of FXOpen UK, as he breaks down the most significant news reports and shares his expert insights.
00:29 US Banks Set a Bullish Tone at the Start…
00:29 US Banks Set a Bullish Tone at the Start…
👍2
#MSFT #stockmarket #stocktrading #stockmarket
MSFT Share Price Dropped After Global Outage
On 19th July, a global outage occurred. Numerous computers running Windows worldwide experienced "blue screens of death" (BSOD), affecting companies in different sectors, including airlines, hospitals, media, banks, and others. The outage was caused by a CrowdStrike Falcon Sensor update, a component of the Windows system that essentially works to protect computers from cyber threats. CrowdStrike quickly acknowledged the issue, stating that it was not a cyberattack but an update error, and suggested a solution.
According to CNBC, the large-scale outage did not significantly impact the operation of most financial markets. Representatives of the New York Stock Exchange and Nasdaq stated on Friday that they were operating despite the issues with the CrowdStrike update. The only noticeable unpleasant consequence for most was the inability to calculate the Russell stock indices, including the popular Russell 2000. However, the confusion was resolved later on Friday.
At the same time, the large-scale outage affected stock prices, including Microsoft. In pre-market trading on Friday, MSFT's price dropped below $430, but during the main session, the price managed to rise above it. As technical analysis of the MSFT chart shows, the $430 level is important – as it acted as resistance in March-May 2024. Therefore, its role as support might be justified by analysts. Additionally, the MSFT share price is near the lower boundary of the upward channel (shown in blue), which may provide additional support. However, no one can guarantee that the mentioned support levels will lead to a subsequent bullish impulse.
On 19th July, we wrote about bearish signs on META stock charts. These are bearish aggression signs, which are concerning:
→ the price's inability to reach the upper boundary of the blue channel in early July;
→ a wide bearish gap when breaking through the median on 17th July. Wall Street analysts remain positive for now. According to TipRanks, the average forecast for MSFT is $504.12 (+15.33% from the current price) over the next 12 months. Microsoft's Q2 earnings report, scheduled for release on 30 July, has the potential to significantly alter the balance of sentiments.
Trade global index CFDs with zero commission and tight spreads. Open your FXOpen account now or learn more about trading index CFDs with FXOpen.
CFDs are complex instruments and come with a high risk of losing your money.
This article represents the opinion of the Companies operating under the FXOpen brand only. It is not to be construed as an offer, solicitation, or recommendation with respect to products and services provided by the Companies operating under the FXOpen brand, nor is it to be considered financial advice.
MSFT Share Price Dropped After Global Outage
On 19th July, a global outage occurred. Numerous computers running Windows worldwide experienced "blue screens of death" (BSOD), affecting companies in different sectors, including airlines, hospitals, media, banks, and others. The outage was caused by a CrowdStrike Falcon Sensor update, a component of the Windows system that essentially works to protect computers from cyber threats. CrowdStrike quickly acknowledged the issue, stating that it was not a cyberattack but an update error, and suggested a solution.
According to CNBC, the large-scale outage did not significantly impact the operation of most financial markets. Representatives of the New York Stock Exchange and Nasdaq stated on Friday that they were operating despite the issues with the CrowdStrike update. The only noticeable unpleasant consequence for most was the inability to calculate the Russell stock indices, including the popular Russell 2000. However, the confusion was resolved later on Friday.
At the same time, the large-scale outage affected stock prices, including Microsoft. In pre-market trading on Friday, MSFT's price dropped below $430, but during the main session, the price managed to rise above it. As technical analysis of the MSFT chart shows, the $430 level is important – as it acted as resistance in March-May 2024. Therefore, its role as support might be justified by analysts. Additionally, the MSFT share price is near the lower boundary of the upward channel (shown in blue), which may provide additional support. However, no one can guarantee that the mentioned support levels will lead to a subsequent bullish impulse.
On 19th July, we wrote about bearish signs on META stock charts. These are bearish aggression signs, which are concerning:
→ the price's inability to reach the upper boundary of the blue channel in early July;
→ a wide bearish gap when breaking through the median on 17th July. Wall Street analysts remain positive for now. According to TipRanks, the average forecast for MSFT is $504.12 (+15.33% from the current price) over the next 12 months. Microsoft's Q2 earnings report, scheduled for release on 30 July, has the potential to significantly alter the balance of sentiments.
Trade global index CFDs with zero commission and tight spreads. Open your FXOpen account now or learn more about trading index CFDs with FXOpen.
CFDs are complex instruments and come with a high risk of losing your money.
This article represents the opinion of the Companies operating under the FXOpen brand only. It is not to be construed as an offer, solicitation, or recommendation with respect to products and services provided by the Companies operating under the FXOpen brand, nor is it to be considered financial advice.

👍2
#XAUUSD #goldprice #goldtrading #marketanalysis
Analysis of XAU/USD: Gold Price Falls for 4 Consecutive Days
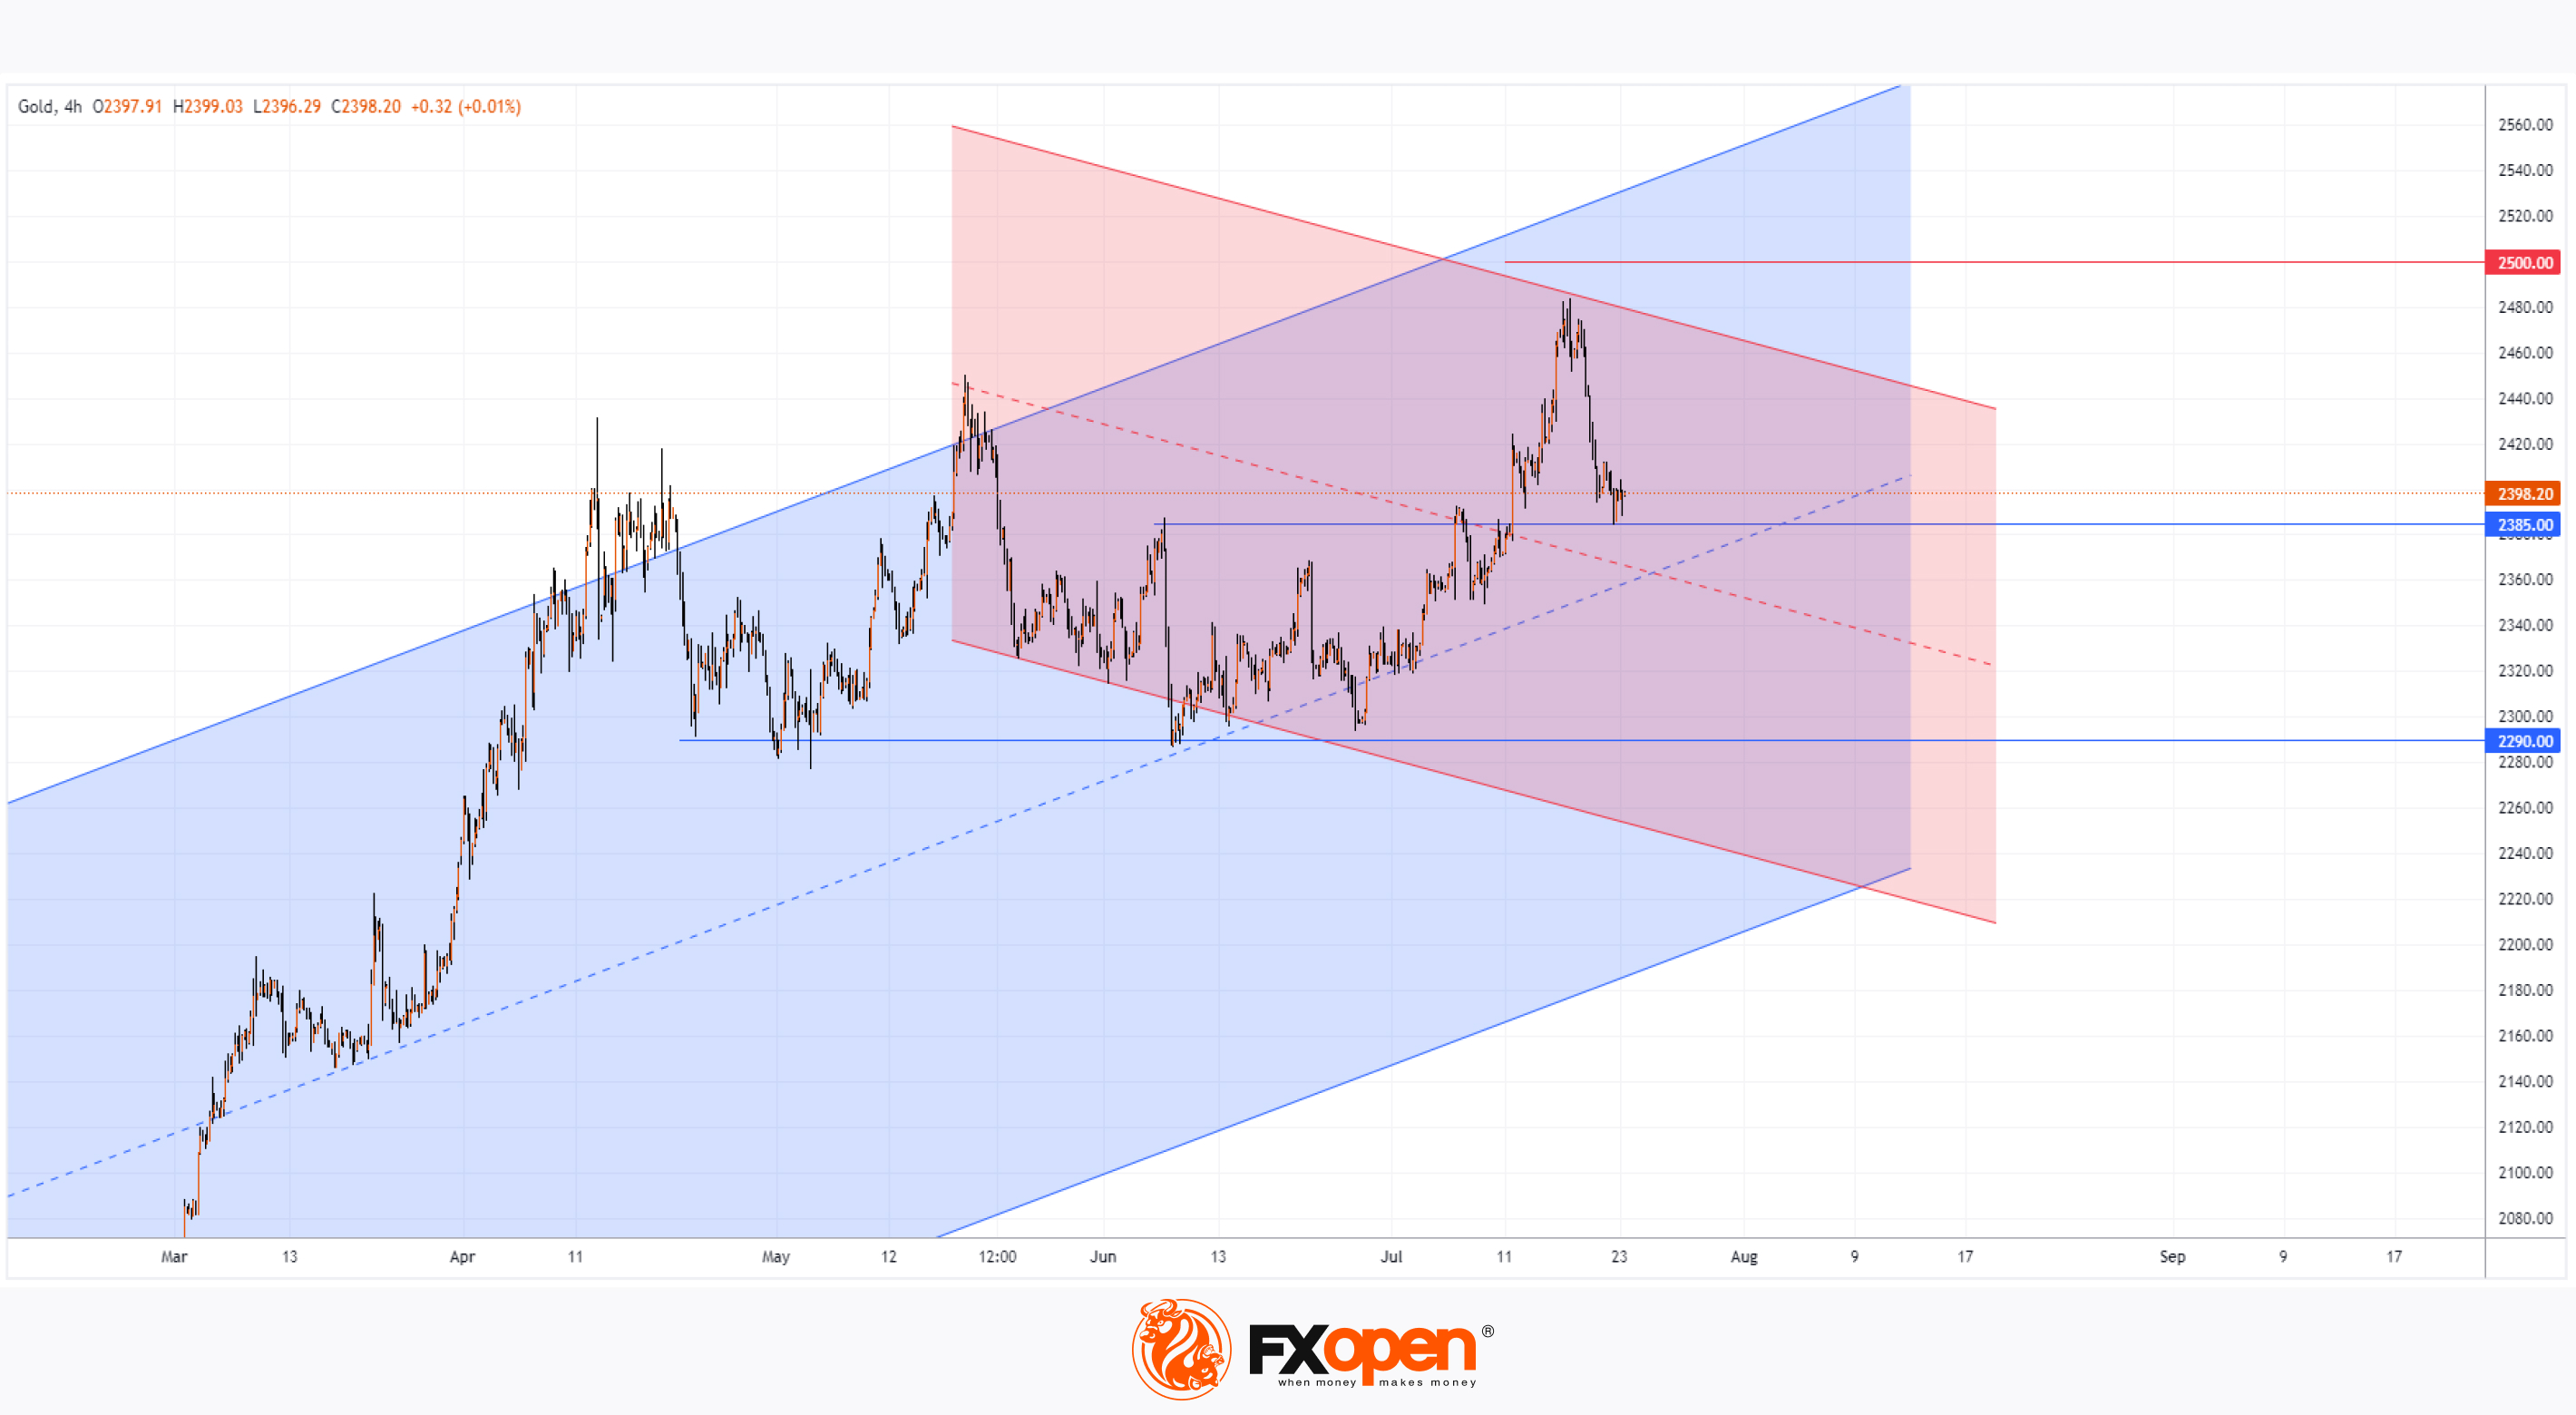
As shown on the XAU/USD chart, Monday, 22 July marked the fourth consecutive day of declining gold prices. The change from the historical peak reached on Wednesday is around -3.5%.
Bearish sentiment is driven by:
→ Market participants' assessment of prospects due to the change of the Democratic Party's presidential candidate in the US.
→ Caution in anticipation of economic news. On Thursday at 15:30 GMT+3, US GDP data will be released. On Friday at the same time, the Core PCE Price Index data will be published. Market participants may also be influenced by the psychological level of $2500. Can the Gold Price Fall Further?
Technical analysis of the XAU/USD chart provides valuable insights:
→ In June, the gold price was within the range of 2290-2385. The rise to July's peak corresponds to a target calculated by the range height: 2385 + (2385 - 2290) = 2480.
→ After reaching a record on 17 July, the price failed to hold above the May peak, which is a bearish sign.
→ The XAU/USD chart shows increasing support points for a descending channel (shown in red), which may form a corrective movement within a broader upward trend (shown in blue).
Bulls may take advantage of the gold price being near the support block of 2365-2385, which is formed by:
→ The former resistance at 2385.
→ The median lines of the blue and red channels.
However, if we see a weak rebound from this block, it may indicate that the gold price is indeed in a corrective phase.
Start trading commodities with tight spreads. Open your trading account now or learn more about trading commodity CFDs with FXOpen.
CFDs are complex instruments and come with a high risk of losing your money.
This article represents the opinion of the Companies operating under the FXOpen brand only. It is not to be construed as an offer, solicitation, or recommendation with respect to products and services provided by the Companies operating under the FXOpen brand, nor is it to be considered financial advice.
Analysis of XAU/USD: Gold Price Falls for 4 Consecutive Days
As shown on the XAU/USD chart, Monday, 22 July marked the fourth consecutive day of declining gold prices. The change from the historical peak reached on Wednesday is around -3.5%.
Bearish sentiment is driven by:
→ Market participants' assessment of prospects due to the change of the Democratic Party's presidential candidate in the US.
→ Caution in anticipation of economic news. On Thursday at 15:30 GMT+3, US GDP data will be released. On Friday at the same time, the Core PCE Price Index data will be published. Market participants may also be influenced by the psychological level of $2500. Can the Gold Price Fall Further?
Technical analysis of the XAU/USD chart provides valuable insights:
→ In June, the gold price was within the range of 2290-2385. The rise to July's peak corresponds to a target calculated by the range height: 2385 + (2385 - 2290) = 2480.
→ After reaching a record on 17 July, the price failed to hold above the May peak, which is a bearish sign.
→ The XAU/USD chart shows increasing support points for a descending channel (shown in red), which may form a corrective movement within a broader upward trend (shown in blue).
Bulls may take advantage of the gold price being near the support block of 2365-2385, which is formed by:
→ The former resistance at 2385.
→ The median lines of the blue and red channels.
However, if we see a weak rebound from this block, it may indicate that the gold price is indeed in a corrective phase.
Start trading commodities with tight spreads. Open your trading account now or learn more about trading commodity CFDs with FXOpen.
CFDs are complex instruments and come with a high risk of losing your money.
This article represents the opinion of the Companies operating under the FXOpen brand only. It is not to be construed as an offer, solicitation, or recommendation with respect to products and services provided by the Companies operating under the FXOpen brand, nor is it to be considered financial advice.
👍2
#tsla #tesla #stockmarket #stocktrading
Tesla Report May Strengthen Bullish Sentiment
President Joe Biden withdrew his bid for a second term in the White House on Sunday. It's reasonable to assume that the stock market responded optimistically to this news, as US stocks closed higher on Monday, with the S&P 500 (US SPX 500 mini on FXOpen) rising by 1.08% to 5,564.41 – its best day since 5th June. CNN Money's Fear and Greed Index showed an improvement in overall market sentiment, moving into the "Greed" zone.
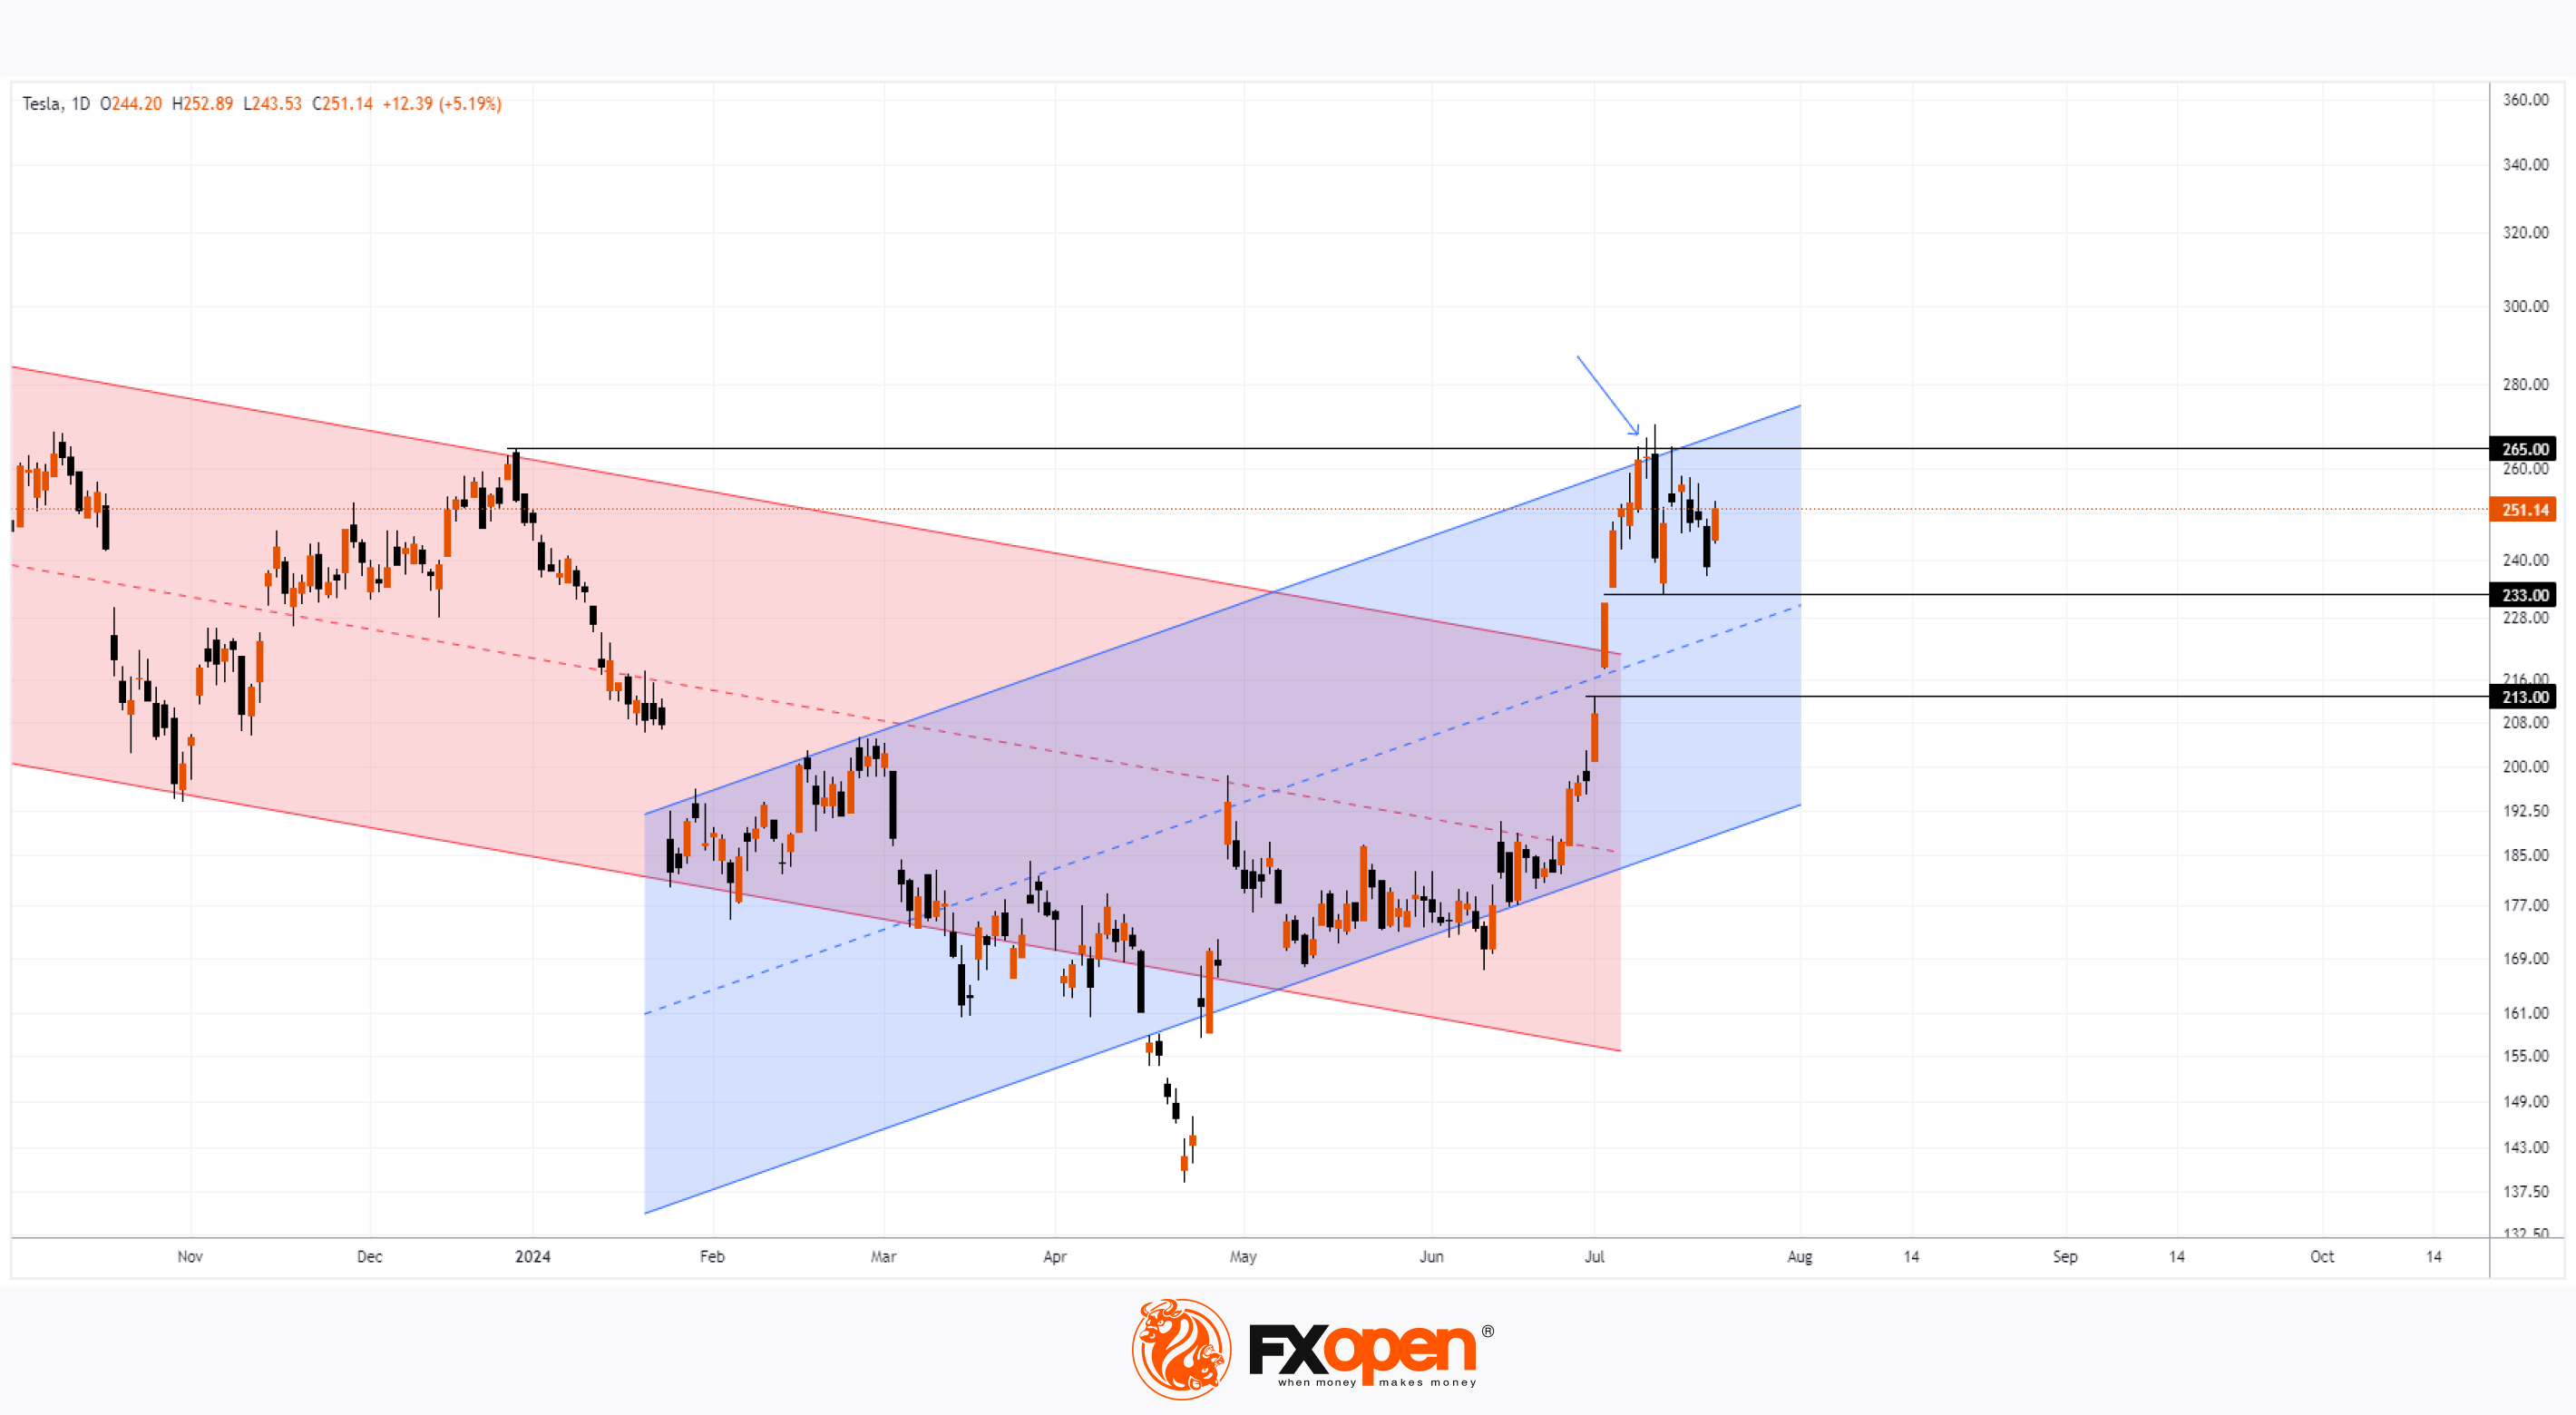
TSLA stocks showed even more positive momentum, gaining 5.15% yesterday. Recall that on 2nd July we noted that the TSLA price:
→ Was still within a descending channel (shown in red);
→ But was showing strong momentum, having crossed the median of the red channel and forming an ascending channel (shown in blue).
Since then, the TSLA price has:
→ Surpassed the upper boundary of the descending channel, breaking out of the downward trend it had been in since late 2021;
→ Continued to form a bullish channel, reaching its upper boundary last week.
Can TSLA Maintain Its Recent Highs?
Bearish arguments:
→ The upper boundary of the blue channel acts as resistance;
→ The December 2023 peak around $265 could serve as resistance;
→ Long upper shadows (indicated by arrows) suggest bearish activity around this level.
Bullish argument:
→ The strong rise when breaking through the red channel. On 2-3 July, the price formed two bullish gaps, creating a wide range of $213-233. This range could serve as significant support in the future.
However, the decisive factor could be Tesla's Q2 corporate report (expected to be published today after the close of the main session).
Trade global index CFDs with zero commission and tight spreads. Open your FXOpen account now or learn more about trading index CFDs with FXOpen.
CFDs are complex instruments and come with a high risk of losing your money.
This article represents the opinion of the Companies operating under the FXOpen brand only. It is not to be construed as an offer, solicitation, or recommendation with respect to products and services provided by the Companies operating under the FXOpen brand, nor is it to be considered financial advice.
Tesla Report May Strengthen Bullish Sentiment
President Joe Biden withdrew his bid for a second term in the White House on Sunday. It's reasonable to assume that the stock market responded optimistically to this news, as US stocks closed higher on Monday, with the S&P 500 (US SPX 500 mini on FXOpen) rising by 1.08% to 5,564.41 – its best day since 5th June. CNN Money's Fear and Greed Index showed an improvement in overall market sentiment, moving into the "Greed" zone.
TSLA stocks showed even more positive momentum, gaining 5.15% yesterday. Recall that on 2nd July we noted that the TSLA price:
→ Was still within a descending channel (shown in red);
→ But was showing strong momentum, having crossed the median of the red channel and forming an ascending channel (shown in blue).
Since then, the TSLA price has:
→ Surpassed the upper boundary of the descending channel, breaking out of the downward trend it had been in since late 2021;
→ Continued to form a bullish channel, reaching its upper boundary last week.
Can TSLA Maintain Its Recent Highs?
Bearish arguments:
→ The upper boundary of the blue channel acts as resistance;
→ The December 2023 peak around $265 could serve as resistance;
→ Long upper shadows (indicated by arrows) suggest bearish activity around this level.
Bullish argument:
→ The strong rise when breaking through the red channel. On 2-3 July, the price formed two bullish gaps, creating a wide range of $213-233. This range could serve as significant support in the future.
However, the decisive factor could be Tesla's Q2 corporate report (expected to be published today after the close of the main session).
Trade global index CFDs with zero commission and tight spreads. Open your FXOpen account now or learn more about trading index CFDs with FXOpen.
CFDs are complex instruments and come with a high risk of losing your money.
This article represents the opinion of the Companies operating under the FXOpen brand only. It is not to be construed as an offer, solicitation, or recommendation with respect to products and services provided by the Companies operating under the FXOpen brand, nor is it to be considered financial advice.
👍2
#brentoil #oilprices #marketanalysis #MarketNews
Brent crude oil prices are declining amid de-escalation in the Middle East.
On July 8th, we noted that oil prices were forming a large narrowing triangle, originating from 2022-2023, with its upper boundary being a significant resistance point. As shown on the Brent oil price chart (XBR/USD), bulls have since failed to overcome the upper boundary resistance around $87. Subsequently, the price:
→ Turned downwards, breaking the blue upward trend line;
→ Eventually breached the support level at $84, which we highlighted on July 8th;
→ Formed a descending channel (indicated in red).
Bearish sentiment is driven by:
→ News of increased oil inventories;
→ Reduced tensions in the Middle East. Israeli Prime Minister Benjamin Netanyahu stated that an agreement with Hamas on hostage release is "maturing."
What’s next?
Technical analysis of the Brent oil price chart indicates:
→ The price is at the lower boundary of the red descending channel, which may provide support.
→ The accelerated decline since Friday has resulted in a loss of over 4%, potentially prompting bears to take profits.
In the short term, a bullish correction to the median line of the red channel is possible. The holiday season, currently in full swing, could also support oil demand.
Long-term outlook? According to Reuters, Morgan Stanley analysts forecast that despite a clear market deficit, demand and supply will balance by Q4, and an oversupply may occur next year, bringing Brent prices closer to $70 per barrel by 2025. If accurate, this would mean the current narrowing triangle would be broken from the top down.
Start trading commodities with tight spreads. Open your trading account now or learn more about trading commodity CFDs with FXOpen.
CFDs are complex instruments and come with a high risk of losing your money.
This article represents the opinion of the Companies operating under the FXOpen brand only. It is not to be construed as an offer, solicitation, or recommendation with respect to products and services provided by the Companies operating under the FXOpen brand, nor is it to be considered financial advice.
Brent crude oil prices are declining amid de-escalation in the Middle East.
On July 8th, we noted that oil prices were forming a large narrowing triangle, originating from 2022-2023, with its upper boundary being a significant resistance point. As shown on the Brent oil price chart (XBR/USD), bulls have since failed to overcome the upper boundary resistance around $87. Subsequently, the price:
→ Turned downwards, breaking the blue upward trend line;
→ Eventually breached the support level at $84, which we highlighted on July 8th;
→ Formed a descending channel (indicated in red).
Bearish sentiment is driven by:
→ News of increased oil inventories;
→ Reduced tensions in the Middle East. Israeli Prime Minister Benjamin Netanyahu stated that an agreement with Hamas on hostage release is "maturing."
What’s next?
Technical analysis of the Brent oil price chart indicates:
→ The price is at the lower boundary of the red descending channel, which may provide support.
→ The accelerated decline since Friday has resulted in a loss of over 4%, potentially prompting bears to take profits.
In the short term, a bullish correction to the median line of the red channel is possible. The holiday season, currently in full swing, could also support oil demand.
Long-term outlook? According to Reuters, Morgan Stanley analysts forecast that despite a clear market deficit, demand and supply will balance by Q4, and an oversupply may occur next year, bringing Brent prices closer to $70 per barrel by 2025. If accurate, this would mean the current narrowing triangle would be broken from the top down.
Start trading commodities with tight spreads. Open your trading account now or learn more about trading commodity CFDs with FXOpen.
CFDs are complex instruments and come with a high risk of losing your money.
This article represents the opinion of the Companies operating under the FXOpen brand only. It is not to be construed as an offer, solicitation, or recommendation with respect to products and services provided by the Companies operating under the FXOpen brand, nor is it to be considered financial advice.
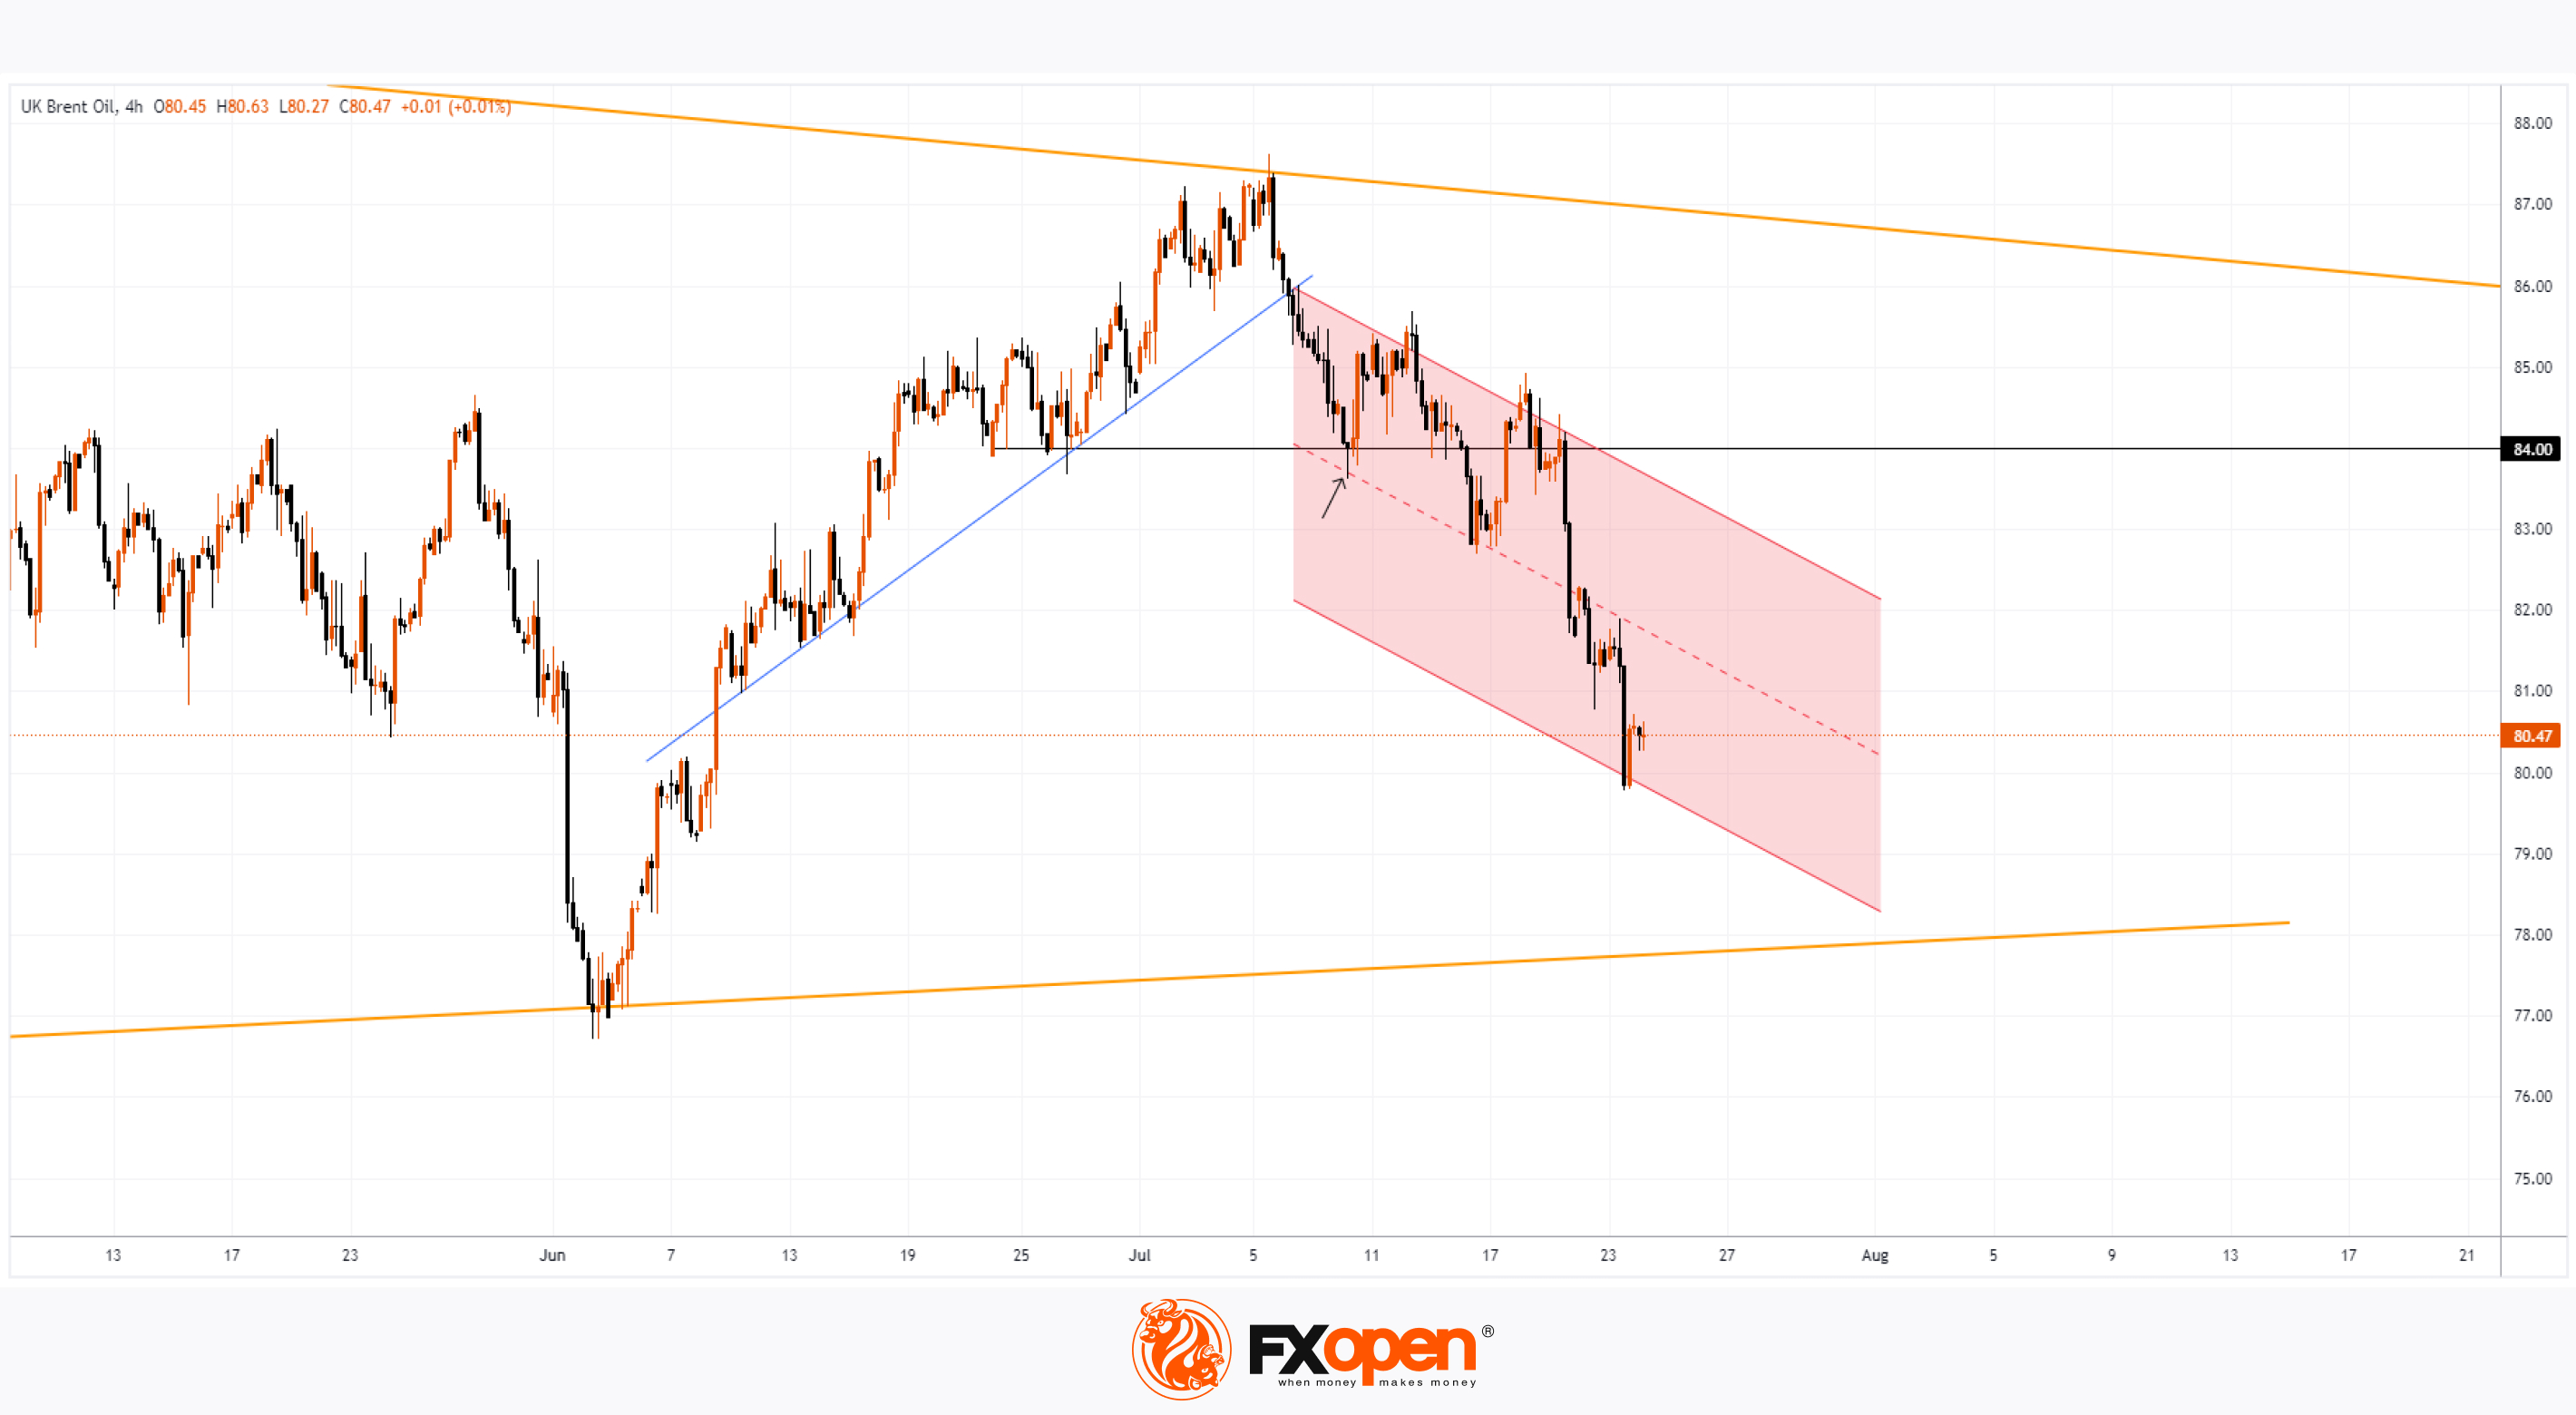
👍2
#GOOGL #stockmarket #stocktrading #MarketNews
GOOGL Shares Decline After Report
Yesterday, Alphabet released its Q2 report:
→ Earnings per share: actual = $1.89, forecast = $1.847;
→ Gross revenue: actual = $84.742 billion, forecast = $84.208 billion.
The actual figures exceeded analysts' expectations. However, today in pre-market trading, GOOGL's price fluctuates around $178.60 per share, down from $183.60 at yesterday's close. Investors might be disappointed by YouTube's ad sales growth falling short of expectations ($8.7 billion versus the projected $8.9 billion).
It appears that GOOGL shares will join other tech companies whose stocks are losing ground in the stock market.
On 18th July, analyzing NVDA's chart, we noted that the bears had the initiative.
On 19th July, we pointed out bearish signs on META's stock charts.
And on 22nd July, we highlighted bearish signs on MSFT's price chart.
Technical analysis of GOOGL's chart after the report shows:
→ In 2024, the stock has been rising within an upward channel that started in 2023. The historic high set earlier this month marked the upper boundary of this channel, which acted as resistance and turned the price downwards.
→ The bullish impulse, shown by black lines, is losing strength as the price moved closer to the median line of the blue channel after the report.
→ The July structure of local extremes A-B-C-D-E indicates bearish sentiment, as each increase is approximately 50% of the preceding decline.
Bulls might hope for support from the blue median line to try and keep the price in the upper part of the blue channel.
39 Wall Street analysts surveyed by TipRanks provide positive forecasts:
→ 33 analysts recommend buying GOOGL shares, and none recommend selling;
→ The price forecast for GOOGL shares is $203.97 in 12 months (+12.20% from yesterday's close).
However, it's possible that GOOGL's price forecasts may worsen if the blue median line is broken by the bears.
Trade global index CFDs with zero commission and tight spreads. Open your FXOpen account now or learn more about trading index CFDs with FXOpen.
CFDs are complex instruments and come with a high risk of losing your money.
This article represents the opinion of the Companies operating under the FXOpen brand only. It is not to be construed as an offer, solicitation, or recommendation with respect to products and services provided by the Companies operating under the FXOpen brand, nor is it to be considered financial advice.
GOOGL Shares Decline After Report
Yesterday, Alphabet released its Q2 report:
→ Earnings per share: actual = $1.89, forecast = $1.847;
→ Gross revenue: actual = $84.742 billion, forecast = $84.208 billion.
The actual figures exceeded analysts' expectations. However, today in pre-market trading, GOOGL's price fluctuates around $178.60 per share, down from $183.60 at yesterday's close. Investors might be disappointed by YouTube's ad sales growth falling short of expectations ($8.7 billion versus the projected $8.9 billion).
It appears that GOOGL shares will join other tech companies whose stocks are losing ground in the stock market.
On 18th July, analyzing NVDA's chart, we noted that the bears had the initiative.
On 19th July, we pointed out bearish signs on META's stock charts.
And on 22nd July, we highlighted bearish signs on MSFT's price chart.
Technical analysis of GOOGL's chart after the report shows:
→ In 2024, the stock has been rising within an upward channel that started in 2023. The historic high set earlier this month marked the upper boundary of this channel, which acted as resistance and turned the price downwards.
→ The bullish impulse, shown by black lines, is losing strength as the price moved closer to the median line of the blue channel after the report.
→ The July structure of local extremes A-B-C-D-E indicates bearish sentiment, as each increase is approximately 50% of the preceding decline.
Bulls might hope for support from the blue median line to try and keep the price in the upper part of the blue channel.
39 Wall Street analysts surveyed by TipRanks provide positive forecasts:
→ 33 analysts recommend buying GOOGL shares, and none recommend selling;
→ The price forecast for GOOGL shares is $203.97 in 12 months (+12.20% from yesterday's close).
However, it's possible that GOOGL's price forecasts may worsen if the blue median line is broken by the bears.
Trade global index CFDs with zero commission and tight spreads. Open your FXOpen account now or learn more about trading index CFDs with FXOpen.
CFDs are complex instruments and come with a high risk of losing your money.
This article represents the opinion of the Companies operating under the FXOpen brand only. It is not to be construed as an offer, solicitation, or recommendation with respect to products and services provided by the Companies operating under the FXOpen brand, nor is it to be considered financial advice.

👍2
#NASDAQ #stockmarket #stocktrading #marketanalysis
Nasdaq Composite: Worst Session Since Late 2022
As indicated by the Nasdaq Composite chart (US Tech 100 mini on FXOpen), yesterday's decline was -2.62% in a single session. Thus, tech stocks experienced the sharpest drop since late 2022, with around 75% of companies in the Nasdaq Composite index closing in the red. Alphabet (GOOG) shares, the parent company of Google, fell by 4.9% due to higher-than-expected AI expenses and disappointing YouTube advertising revenues. Tesla (TSLA) shares dropped by 12% due to a 7% decline in automotive revenue, missed earnings, and delays in the Robotaxi project. Chipmaker stocks also suffered losses.
What is the reason for the Nasdaq Composite (US Tech 100 mini on FXOpen) price decline?
According to Business Insider, renowned Wall Street investor Ed Yardeni believes that:
→ Major market players started exiting tech stocks on July 11, as news of low inflation motivated them to rotate and shift capital into stocks sensitive to the anticipated interest rate cuts;
→ The stock market is overbought and undergoing a minor correction.
Technical Analysis
Technical analysis of the Nasdaq Composite (US Tech 100 mini on FXOpen) chart provides more details:
→ The price has been in an uptrend in 2024 (shown in blue) but made a bearish reversal from the upper boundary in mid-July. This week, it aggressively moved down with wide bearish candles into the lower half of the channel;
→ The lower boundary of the channel and the support level at 18920 (in effect at the beginning of June) form a block that bulls are pinning their hopes on.
If the stock market is indeed experiencing a minor sell-off to move out of an overbought state, this support block might act as a brake and slow down the pace of the Nasdaq Composite (US Tech 100 mini on FXOpen) price decline observed this week.
Trade global index CFDs with zero commission and tight spreads. Open your FXOpen account now or learn more about trading index CFDs with FXOpen.
CFDs are complex instruments and come with a high risk of losing your money.
This article represents the opinion of the Companies operating under the FXOpen brand only. It is not to be construed as an offer, solicitation, or recommendation with respect to products and services provided by the Companies operating under the FXOpen brand, nor is it to be considered financial advice.
Nasdaq Composite: Worst Session Since Late 2022
As indicated by the Nasdaq Composite chart (US Tech 100 mini on FXOpen), yesterday's decline was -2.62% in a single session. Thus, tech stocks experienced the sharpest drop since late 2022, with around 75% of companies in the Nasdaq Composite index closing in the red. Alphabet (GOOG) shares, the parent company of Google, fell by 4.9% due to higher-than-expected AI expenses and disappointing YouTube advertising revenues. Tesla (TSLA) shares dropped by 12% due to a 7% decline in automotive revenue, missed earnings, and delays in the Robotaxi project. Chipmaker stocks also suffered losses.
What is the reason for the Nasdaq Composite (US Tech 100 mini on FXOpen) price decline?
According to Business Insider, renowned Wall Street investor Ed Yardeni believes that:
→ Major market players started exiting tech stocks on July 11, as news of low inflation motivated them to rotate and shift capital into stocks sensitive to the anticipated interest rate cuts;
→ The stock market is overbought and undergoing a minor correction.
Technical Analysis
Technical analysis of the Nasdaq Composite (US Tech 100 mini on FXOpen) chart provides more details:
→ The price has been in an uptrend in 2024 (shown in blue) but made a bearish reversal from the upper boundary in mid-July. This week, it aggressively moved down with wide bearish candles into the lower half of the channel;
→ The lower boundary of the channel and the support level at 18920 (in effect at the beginning of June) form a block that bulls are pinning their hopes on.
If the stock market is indeed experiencing a minor sell-off to move out of an overbought state, this support block might act as a brake and slow down the pace of the Nasdaq Composite (US Tech 100 mini on FXOpen) price decline observed this week.
Trade global index CFDs with zero commission and tight spreads. Open your FXOpen account now or learn more about trading index CFDs with FXOpen.
CFDs are complex instruments and come with a high risk of losing your money.
This article represents the opinion of the Companies operating under the FXOpen brand only. It is not to be construed as an offer, solicitation, or recommendation with respect to products and services provided by the Companies operating under the FXOpen brand, nor is it to be considered financial advice.
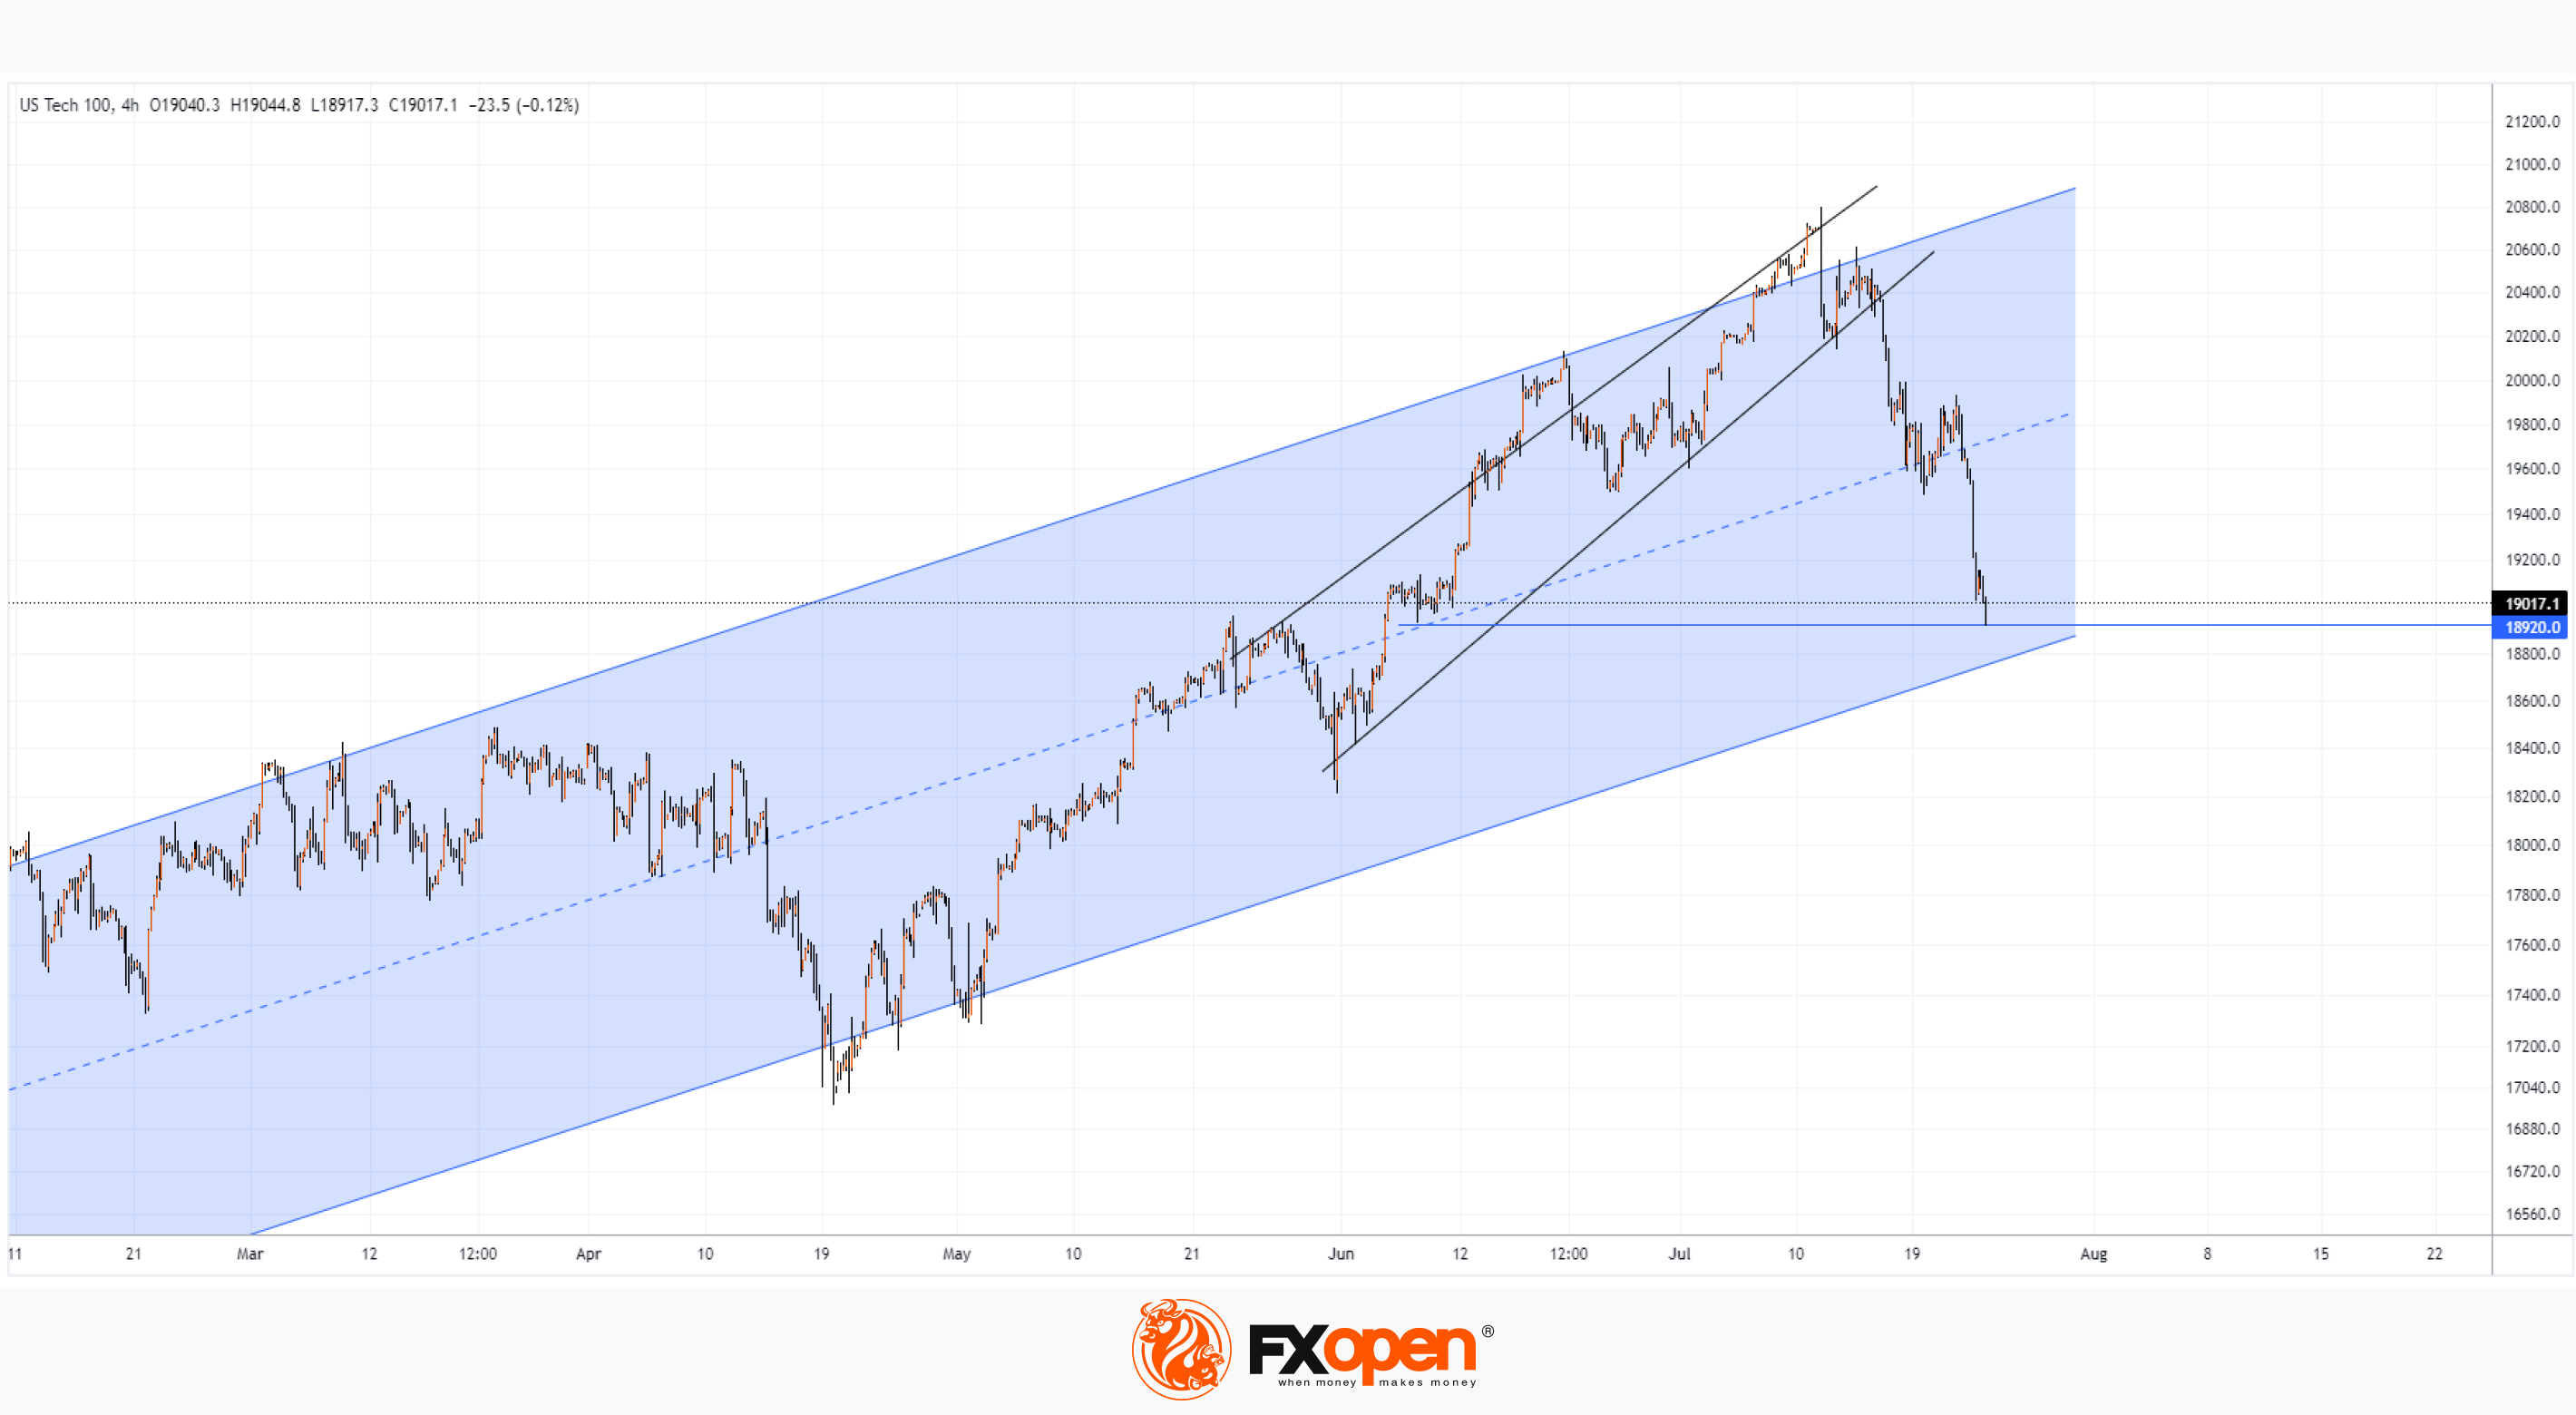
👍2
#USDJPY #usdollar #marketanalysis #forextrading
Analysis of USD/JPY: Yen Strengthens by 5.5% Against US Dollar in 2 Weeks
On Thursday, 11 July, the USD/JPY exchange rate was above 161, and today it is below 153. According to Reuters, this could be attributed to effective intervention by the Bank of Japan. While intervention was anticipated when the yen weakened to extreme levels not seen since 1983, Tokyo authorities were cryptic in their comments, maintaining uncertainty, making it harder for investors to predict when and how they might intervene.
As indicated by today's USD/JPY chart:
→ The ascending trend channel (shown in black) that has been in place since 2023 is losing its relevance.
→ Red circles indicate pivotal points where significant price action occurred, helping to define the contours for a descending channel (shown in red).
→ The USD/JPY rate is near the lower boundary of the red channel. According to technical analysis, this boundary tends to act as support for the price – a bullish argument suggesting that the decline might slow down here.
Whether there will be a rebound from the lower line of the descending channel or the bears will manage to break through the 152 level (where the price found support in May) will largely depend on next week’s news: Tuesday will bring reports on inflation and unemployment in Japan, and Wednesday will see statements from the Bank of Japan regarding the interest rate.
Trade over 50 forex markets 24 hours a day with FXOpen. Take advantage of low commissions, deep liquidity, and spreads from 0.0 pips. Open your FXOpen account now or learn more about trading forex with FXOpen.
CFDs are complex instruments and come with a high risk of losing your money.
This article represents the opinion of the Companies operating under the FXOpen brand only. It is not to be construed as an offer, solicitation, or recommendation with respect to products and services provided by the Companies operating under the FXOpen brand, nor is it to be considered financial advice.
Analysis of USD/JPY: Yen Strengthens by 5.5% Against US Dollar in 2 Weeks
On Thursday, 11 July, the USD/JPY exchange rate was above 161, and today it is below 153. According to Reuters, this could be attributed to effective intervention by the Bank of Japan. While intervention was anticipated when the yen weakened to extreme levels not seen since 1983, Tokyo authorities were cryptic in their comments, maintaining uncertainty, making it harder for investors to predict when and how they might intervene.
As indicated by today's USD/JPY chart:
→ The ascending trend channel (shown in black) that has been in place since 2023 is losing its relevance.
→ Red circles indicate pivotal points where significant price action occurred, helping to define the contours for a descending channel (shown in red).
→ The USD/JPY rate is near the lower boundary of the red channel. According to technical analysis, this boundary tends to act as support for the price – a bullish argument suggesting that the decline might slow down here.
Whether there will be a rebound from the lower line of the descending channel or the bears will manage to break through the 152 level (where the price found support in May) will largely depend on next week’s news: Tuesday will bring reports on inflation and unemployment in Japan, and Wednesday will see statements from the Bank of Japan regarding the interest rate.
Trade over 50 forex markets 24 hours a day with FXOpen. Take advantage of low commissions, deep liquidity, and spreads from 0.0 pips. Open your FXOpen account now or learn more about trading forex with FXOpen.
CFDs are complex instruments and come with a high risk of losing your money.
This article represents the opinion of the Companies operating under the FXOpen brand only. It is not to be construed as an offer, solicitation, or recommendation with respect to products and services provided by the Companies operating under the FXOpen brand, nor is it to be considered financial advice.
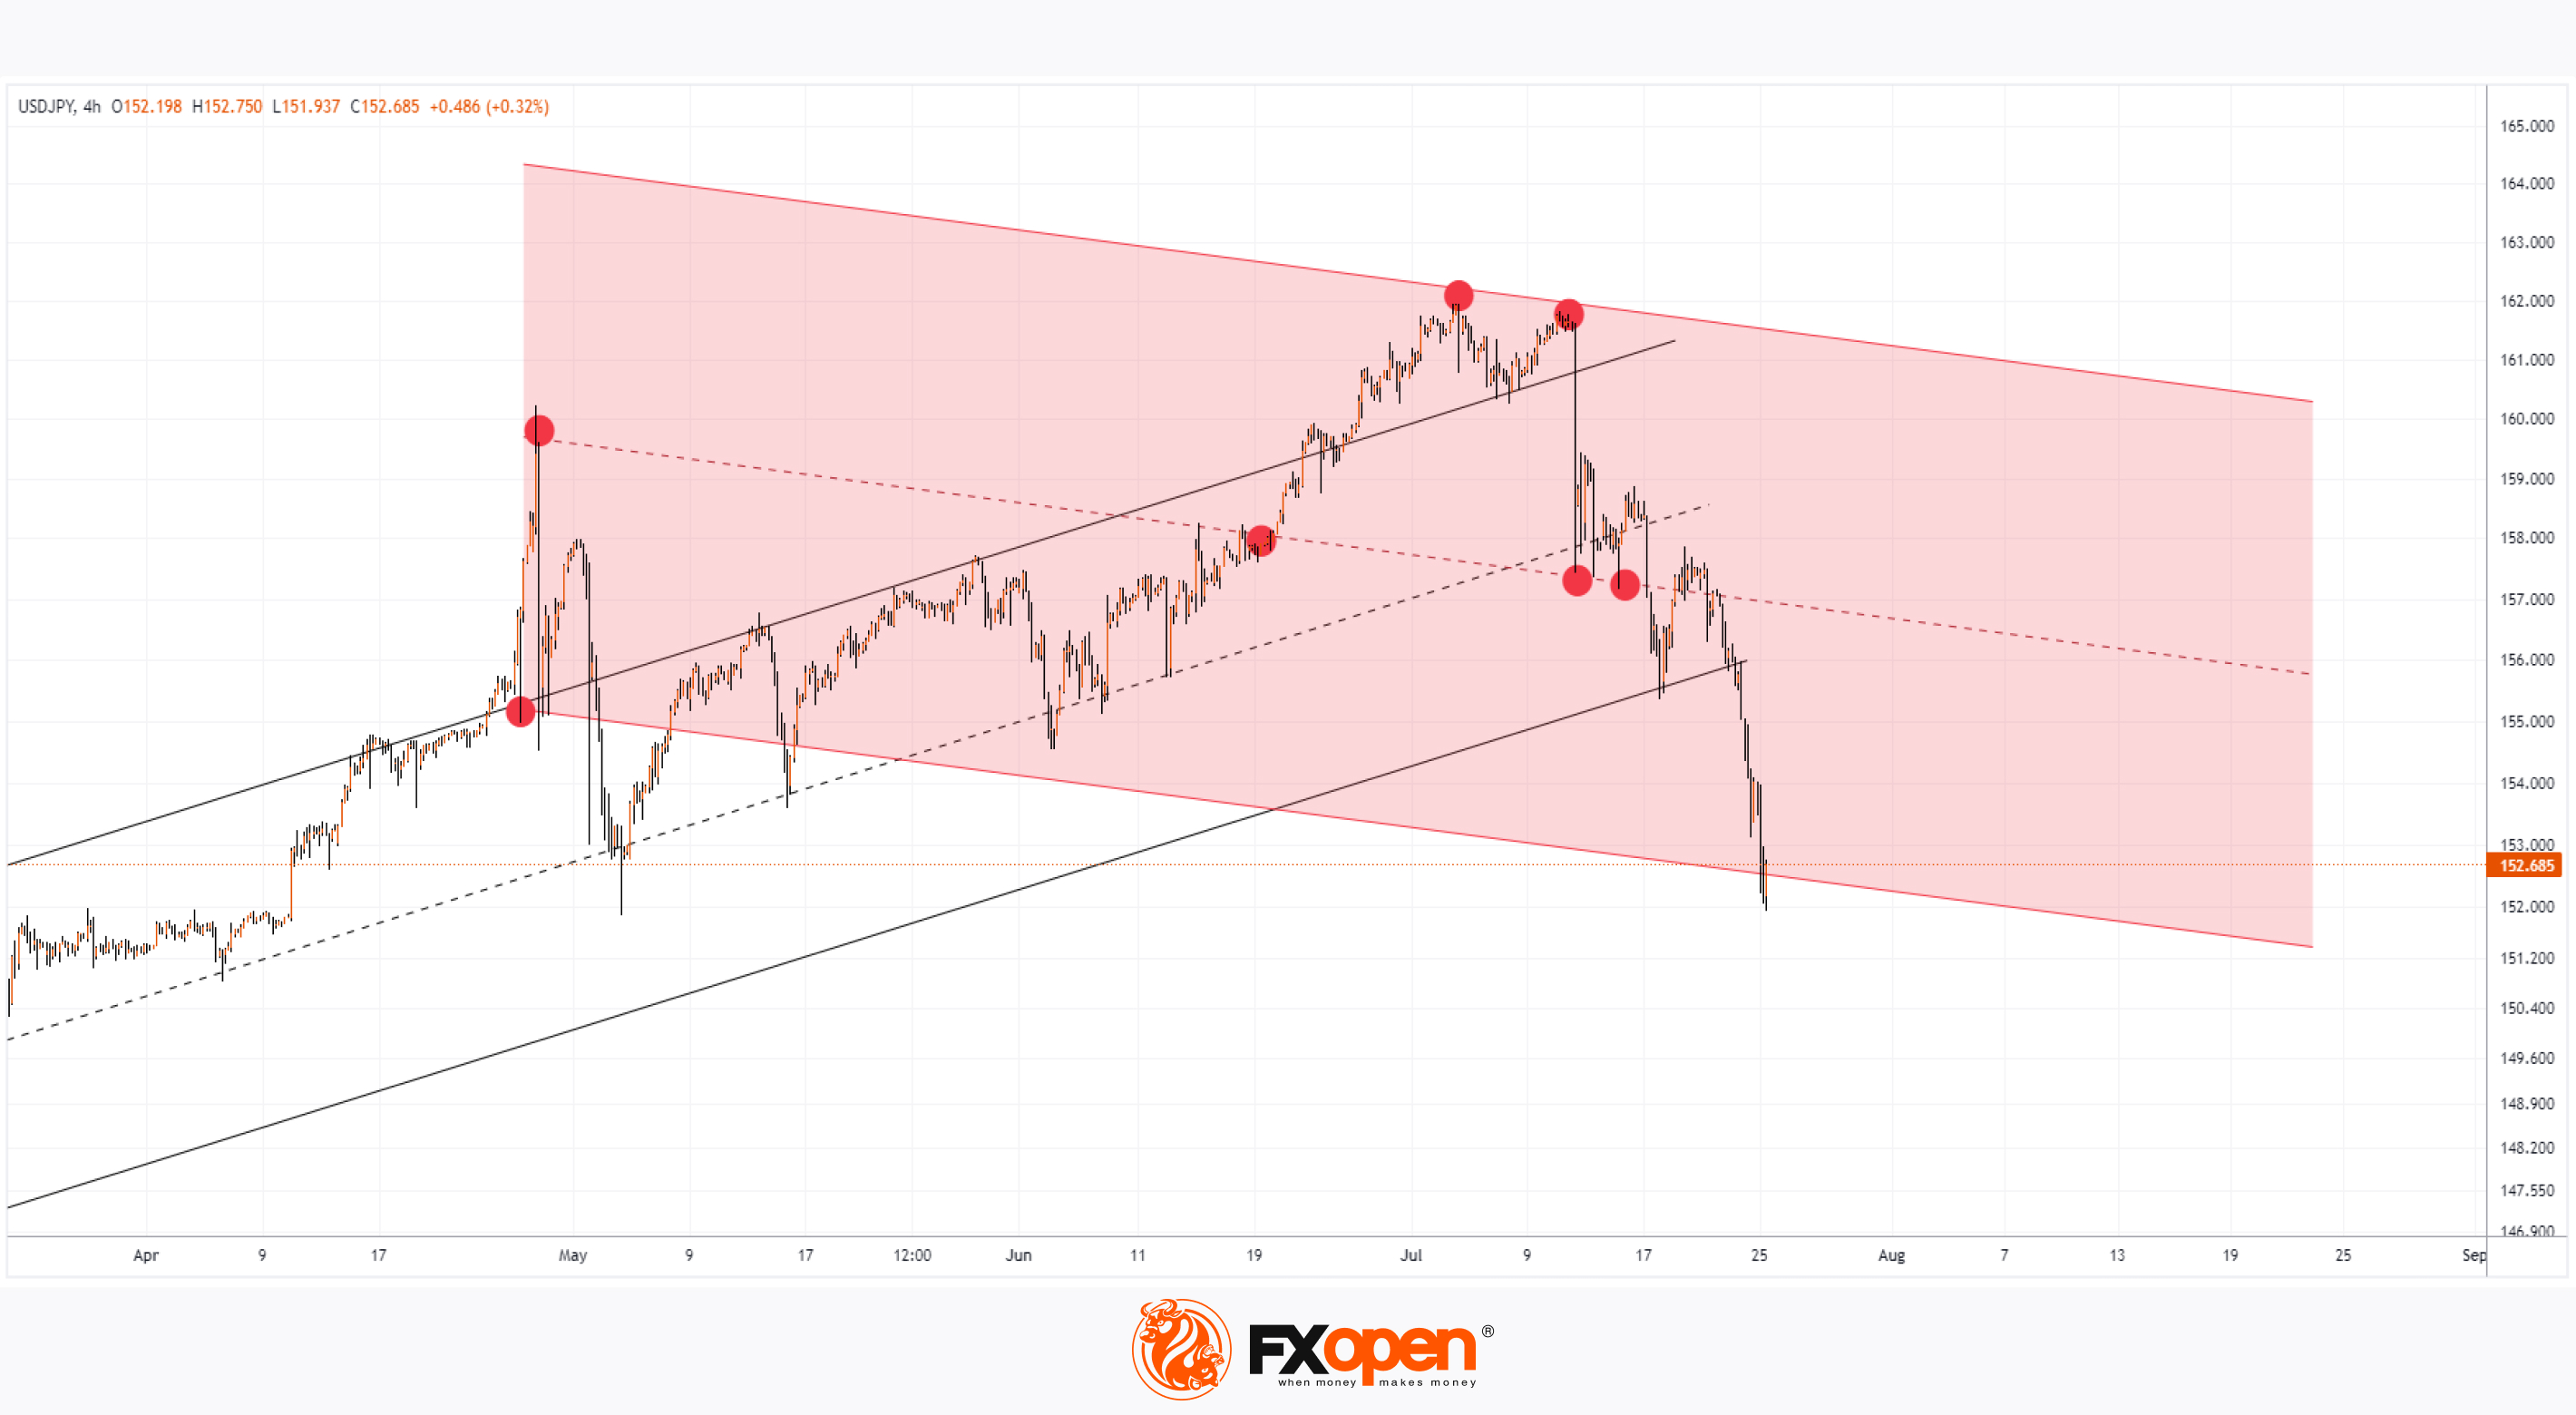
👍2