
#marketanalysis #MarketNews #gasprices
XNG/USD: Natural Gas Price Hits 2.5-Week Low
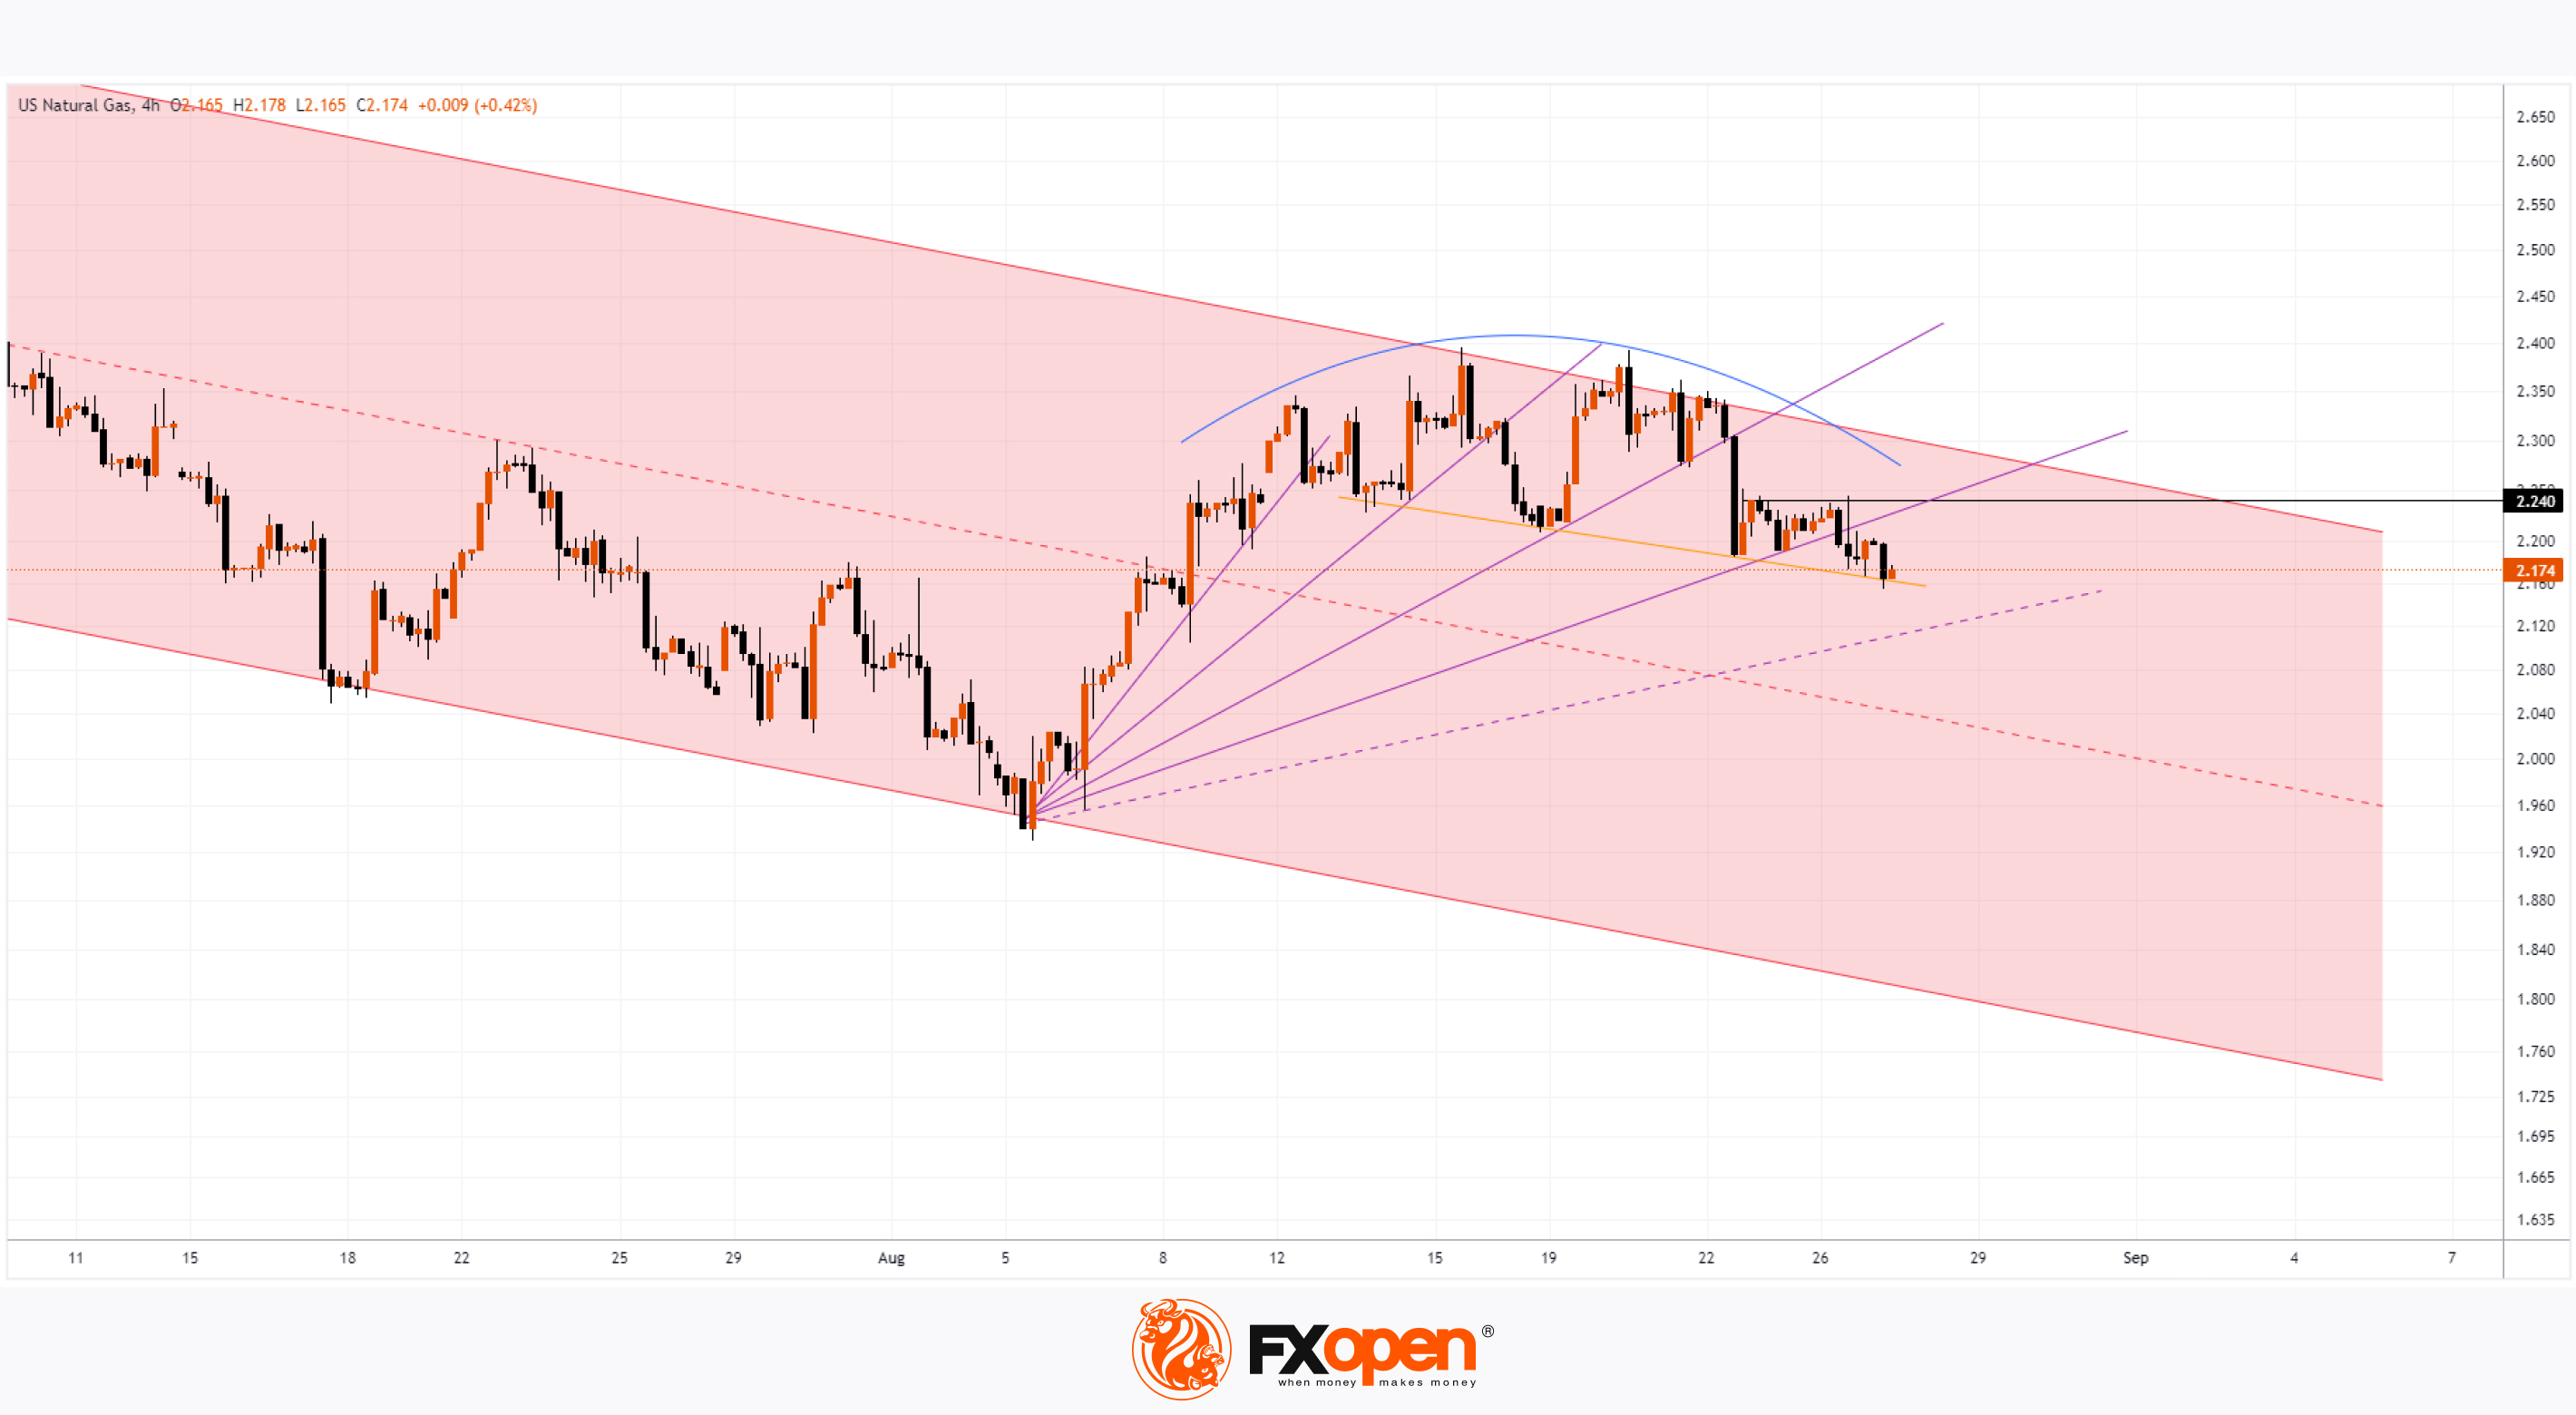
As shown on the XNG/USD chart, today, the price of natural gas fell below $2.16 for the first time since 8 August.
Bearish sentiment is being driven by the fact that: → This is the last week of summer. Gas consumption typically decreases in mid-September as the use of air conditioning declines; → Gas storage levels are abundant. According to Reuters, current stock levels exceed the seasonal average by 12%.
A technical analysis of the XNG/USD chart provides several arguments suggesting that bears hold the upper hand in the market:
→ Price action is forming a descending channel, shown in red. The upper boundary of the channel acted as resistance, with the price forming a bearish rounding reversal pattern (as indicated in blue).
→ After a large bearish candle on 22 August, the resistance level at $2.24 became more significant.
→ Support lines, forming a fan shape, are being broken one by one, with increasingly shallow angles indicating weakening demand.
Nevertheless, bulls have an opportunity to turn the situation around by using support from the trendline (shown in yellow) at least in the short term.
However, in the longer term, if the supply-demand balance remains unchanged, there is reason to believe that the price of natural gas on the XNG/USD chart may continue its downward trend within the red channel.
Start trading commodities with tight spreads. Open your trading account now or learn more about trading commodity CFDs with FXOpen.
CFDs are complex instruments and come with a high risk of losing your money.
This article represents the opinion of the Companies operating under the FXOpen brand only. It is not to be construed as an offer, solicitation, or recommendation with respect to products and services provided by the Companies operating under the FXOpen brand, nor is it to be considered financial advice.
XNG/USD: Natural Gas Price Hits 2.5-Week Low
As shown on the XNG/USD chart, today, the price of natural gas fell below $2.16 for the first time since 8 August.
Bearish sentiment is being driven by the fact that: → This is the last week of summer. Gas consumption typically decreases in mid-September as the use of air conditioning declines; → Gas storage levels are abundant. According to Reuters, current stock levels exceed the seasonal average by 12%.
A technical analysis of the XNG/USD chart provides several arguments suggesting that bears hold the upper hand in the market:
→ Price action is forming a descending channel, shown in red. The upper boundary of the channel acted as resistance, with the price forming a bearish rounding reversal pattern (as indicated in blue).
→ After a large bearish candle on 22 August, the resistance level at $2.24 became more significant.
→ Support lines, forming a fan shape, are being broken one by one, with increasingly shallow angles indicating weakening demand.
Nevertheless, bulls have an opportunity to turn the situation around by using support from the trendline (shown in yellow) at least in the short term.
However, in the longer term, if the supply-demand balance remains unchanged, there is reason to believe that the price of natural gas on the XNG/USD chart may continue its downward trend within the red channel.
Start trading commodities with tight spreads. Open your trading account now or learn more about trading commodity CFDs with FXOpen.
CFDs are complex instruments and come with a high risk of losing your money.
This article represents the opinion of the Companies operating under the FXOpen brand only. It is not to be construed as an offer, solicitation, or recommendation with respect to products and services provided by the Companies operating under the FXOpen brand, nor is it to be considered financial advice.
👍2
#AUDUSD #marketanalysis #tradingtips #forex
AUD/USD: Price Faces Resistance After CPI Release
Today, the Australian Bureau of Statistics released the Consumer Price Index (CPI) figures. According to ForexFactory, the actual annual inflation rate was 3.5% (expected = 3.4%, previous = 3.8%). In other words, inflation in Australia is declining, but not at the pace that might have been hoped for.
The initial reaction to the news was a sharp rise in the Australian dollar, with the AUD/USD rate increasing by approximately 0.4% in the first 15 minutes after the release.
However, the price then returned to levels seen before the inflation news was released. How can this be interpreted?
A technical analysis of the 4-hour AUD/USD chart shows that:
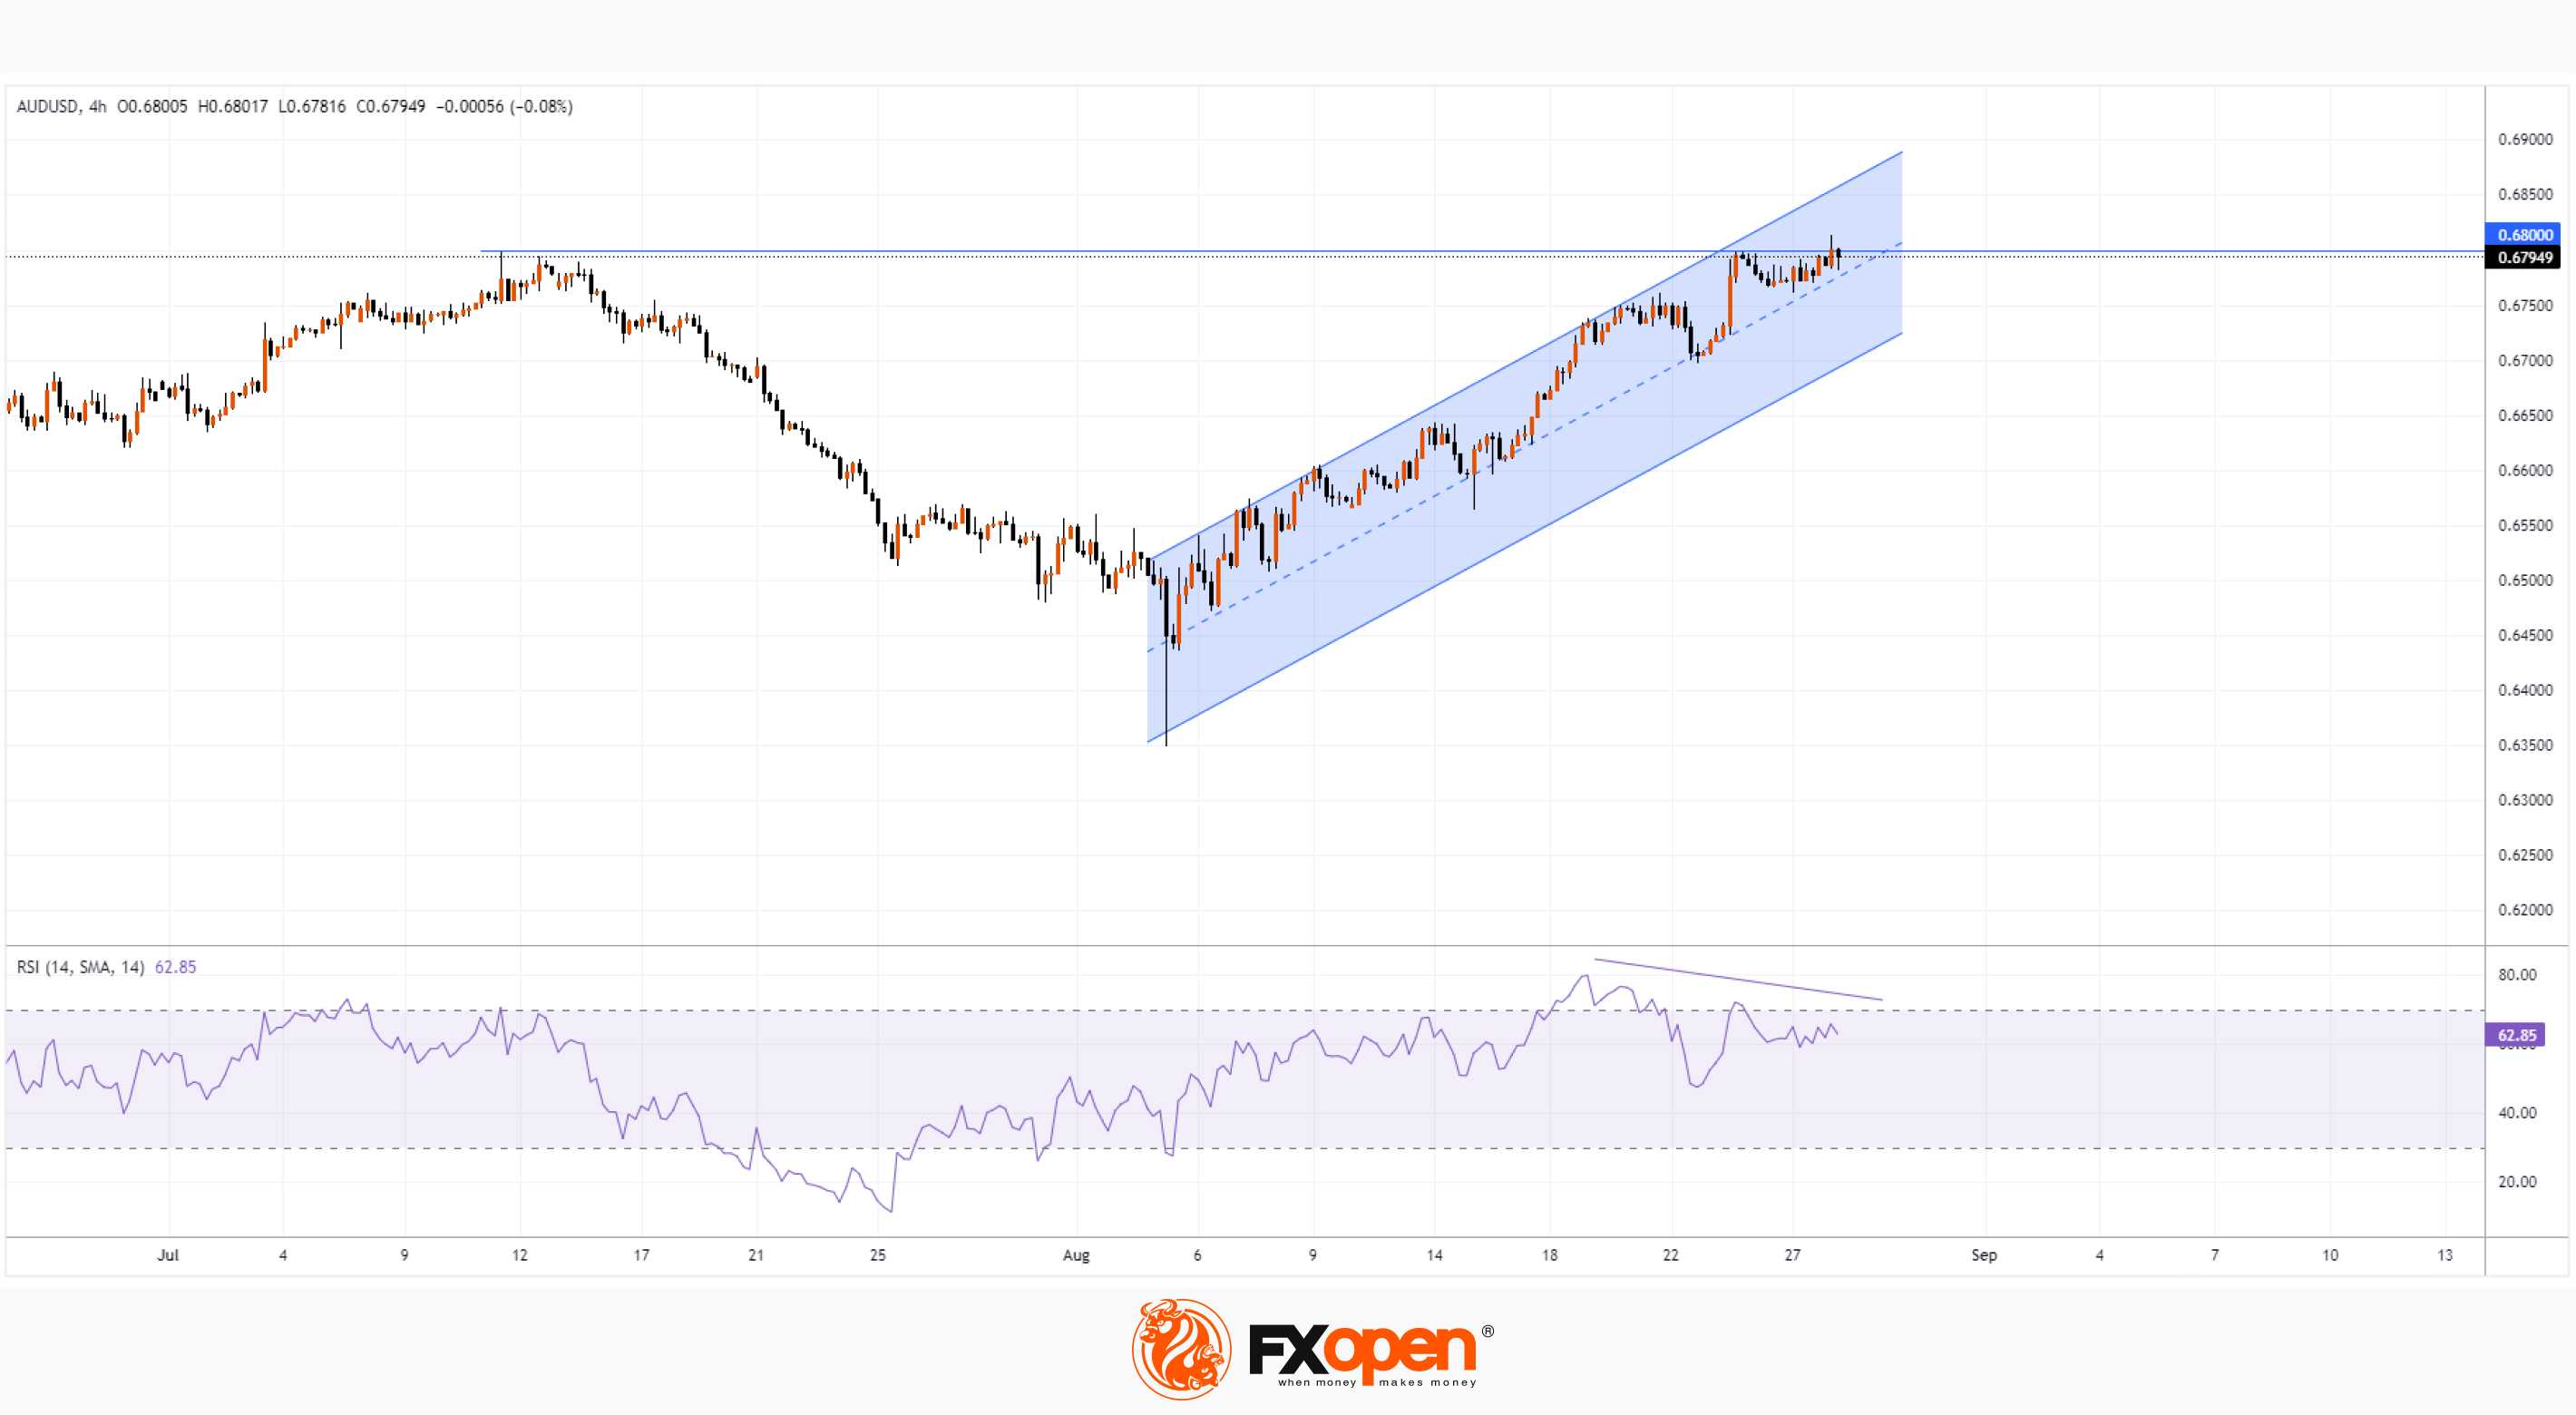
→ After the highly volatile 5 August, the price has been in an uptrend (as shown in blue). As a result of this rally, the price rose to the 0.680 level, where an important July peak was formed.
→ Following the inflation news, there was an attempt at a bullish breakout above this level, but it failed. Thus, the 0.680 level has confirmed its role as resistance.
→ The RSI indicator shows signs of bearish divergence, suggesting that the August rally may be fading.
The ascending blue channel remains relevant for now, but the 0.680 level appears to be a significant test of the bulls' intentions. The inability of the AUD/USD price to hold above the 0.680 level today may lead to a correction towards the lower boundary of the channel.
Trade over 50 forex markets 24 hours a day with FXOpen. Take advantage of low commissions, deep liquidity, and spreads from 0.0 pips. Open your FXOpen account now or learn more about trading forex with FXOpen.
CFDs are complex instruments and come with a high risk of losing your money.
This article represents the opinion of the Companies operating under the FXOpen brand only. It is not to be construed as an offer, solicitation, or recommendation with respect to products and services provided by the Companies operating under the FXOpen brand, nor is it to be considered financial advice.
AUD/USD: Price Faces Resistance After CPI Release
Today, the Australian Bureau of Statistics released the Consumer Price Index (CPI) figures. According to ForexFactory, the actual annual inflation rate was 3.5% (expected = 3.4%, previous = 3.8%). In other words, inflation in Australia is declining, but not at the pace that might have been hoped for.
The initial reaction to the news was a sharp rise in the Australian dollar, with the AUD/USD rate increasing by approximately 0.4% in the first 15 minutes after the release.
However, the price then returned to levels seen before the inflation news was released. How can this be interpreted?
A technical analysis of the 4-hour AUD/USD chart shows that:
→ After the highly volatile 5 August, the price has been in an uptrend (as shown in blue). As a result of this rally, the price rose to the 0.680 level, where an important July peak was formed.
→ Following the inflation news, there was an attempt at a bullish breakout above this level, but it failed. Thus, the 0.680 level has confirmed its role as resistance.
→ The RSI indicator shows signs of bearish divergence, suggesting that the August rally may be fading.
The ascending blue channel remains relevant for now, but the 0.680 level appears to be a significant test of the bulls' intentions. The inability of the AUD/USD price to hold above the 0.680 level today may lead to a correction towards the lower boundary of the channel.
Trade over 50 forex markets 24 hours a day with FXOpen. Take advantage of low commissions, deep liquidity, and spreads from 0.0 pips. Open your FXOpen account now or learn more about trading forex with FXOpen.
CFDs are complex instruments and come with a high risk of losing your money.
This article represents the opinion of the Companies operating under the FXOpen brand only. It is not to be construed as an offer, solicitation, or recommendation with respect to products and services provided by the Companies operating under the FXOpen brand, nor is it to be considered financial advice.
👍2
#nvidia #NVDA #NASDAQ #stockmarket #stocktrading
Nasdaq 100 Consolidates Ahead of Nvidia Report
Today, after the main trading session ends, Nvidia (NVDA) – the second-largest company by market capitalisation and the leader of 2024 amid the AI boom – will release its second-quarter earnings report.
It’s reasonable to assume that market participants are anticipating this event, which will likely trigger a surge in market volatility:
→ Nvidia shares (NVDA) have been fluctuating within the $123.50 – $131.00 range since 19 August;
→ Signs of anticipation are also evident on the technology index chart.
A technical analysis of the Nasdaq 100 chart (US Tech 100 mini on FXOpen) shows that:
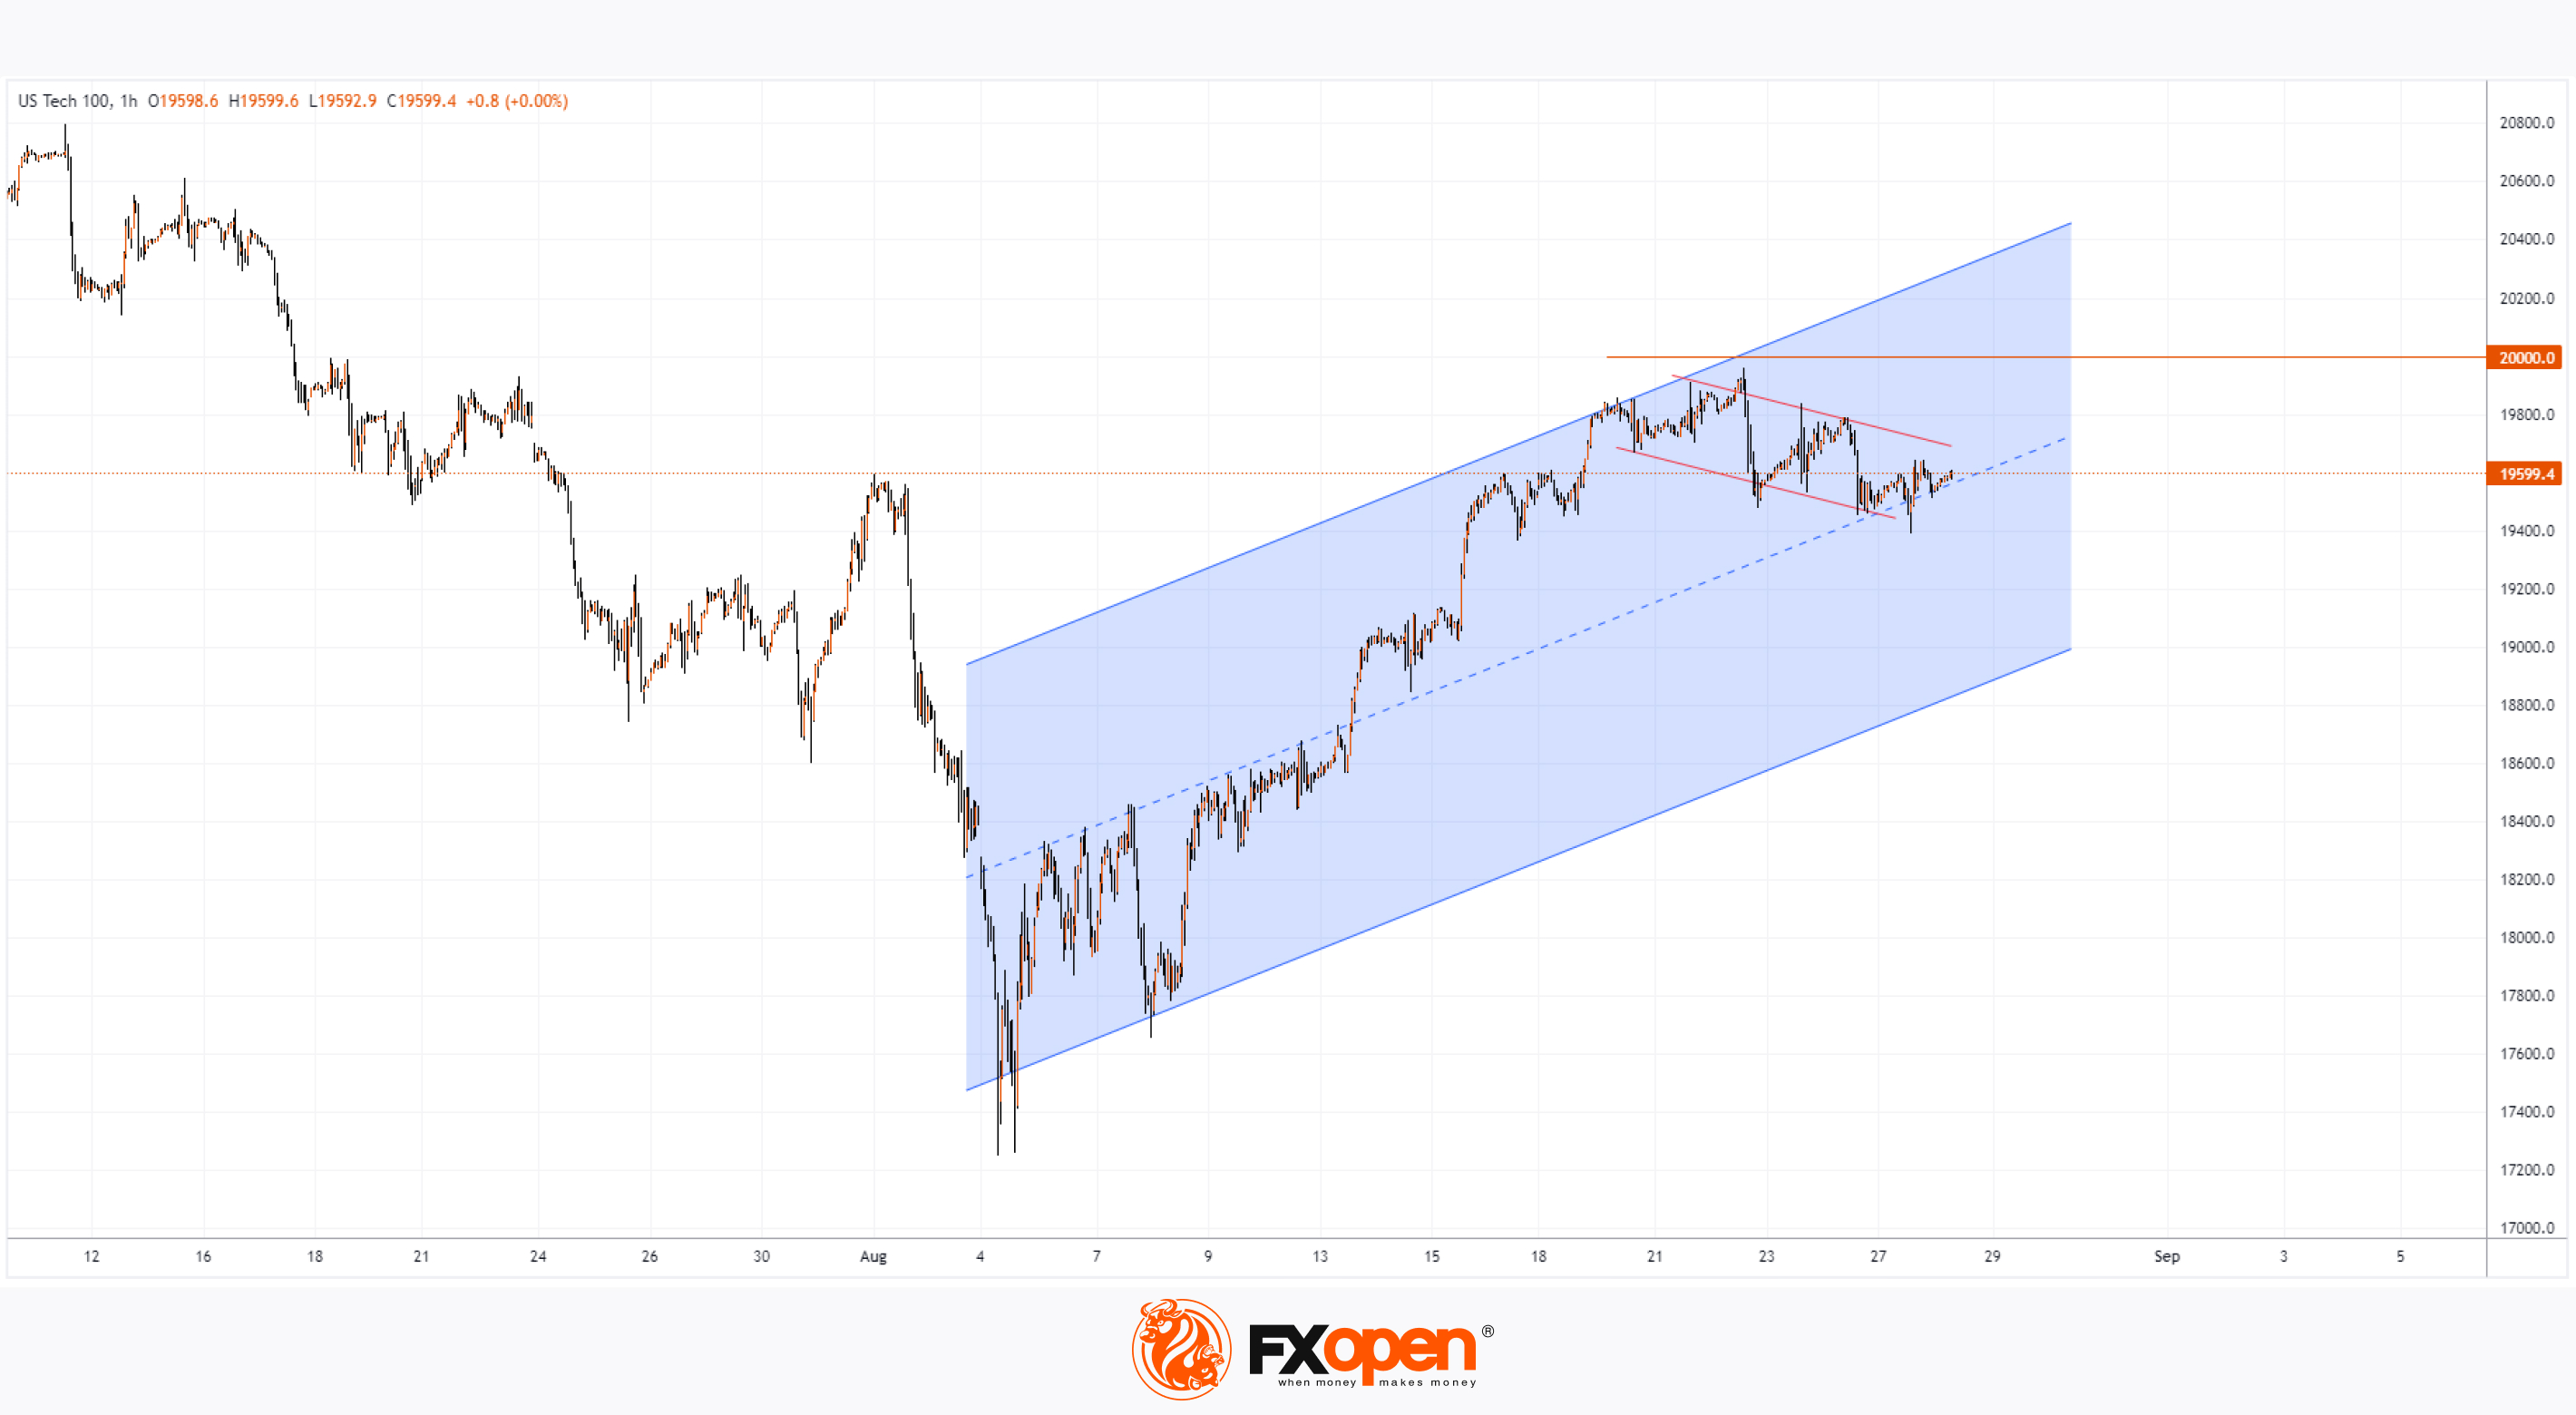
→ Starting from the 3-month low formed on 5 August, the recovery has created an ascending channel (shown in blue) – with the price in the upper half of the channel, indicating steady demand.
→ However, as the NVDA earnings report approaches, the price has retreated from the upper boundary and dropped towards the median (as indicated by the red lines). This could suggest a Bullish Flag pattern (a pattern of intermediate correction within an uptrend).
→ A concerning factor is that the growth rate slowed after the price surpassed the 1 August high. The psychological level of 20,000 points could also be acting as a barrier to further growth within the blue channel.
In the event of a strong Nvidia (NVDA) report, the Nasdaq 100 index price (US Tech 100 mini on FXOpen) could break out of the Bullish Flag and continue its upward movement within the ascending channel. However, if the company disappoints, the price could drop to the lower boundary of the channel or even attempt a bearish breakout.
Trade global index CFDs with zero commission and tight spreads. Open your FXOpen account now or learn more about trading index CFDs with FXOpen.
CFDs are complex instruments and come with a high risk of losing your money.
This article represents the opinion of the Companies operating under the FXOpen brand only. It is not to be construed as an offer, solicitation, or recommendation with respect to products and services provided by the Companies operating under the FXOpen brand, nor is it to be considered financial advice.
Nasdaq 100 Consolidates Ahead of Nvidia Report
Today, after the main trading session ends, Nvidia (NVDA) – the second-largest company by market capitalisation and the leader of 2024 amid the AI boom – will release its second-quarter earnings report.
It’s reasonable to assume that market participants are anticipating this event, which will likely trigger a surge in market volatility:
→ Nvidia shares (NVDA) have been fluctuating within the $123.50 – $131.00 range since 19 August;
→ Signs of anticipation are also evident on the technology index chart.
A technical analysis of the Nasdaq 100 chart (US Tech 100 mini on FXOpen) shows that:
→ Starting from the 3-month low formed on 5 August, the recovery has created an ascending channel (shown in blue) – with the price in the upper half of the channel, indicating steady demand.
→ However, as the NVDA earnings report approaches, the price has retreated from the upper boundary and dropped towards the median (as indicated by the red lines). This could suggest a Bullish Flag pattern (a pattern of intermediate correction within an uptrend).
→ A concerning factor is that the growth rate slowed after the price surpassed the 1 August high. The psychological level of 20,000 points could also be acting as a barrier to further growth within the blue channel.
In the event of a strong Nvidia (NVDA) report, the Nasdaq 100 index price (US Tech 100 mini on FXOpen) could break out of the Bullish Flag and continue its upward movement within the ascending channel. However, if the company disappoints, the price could drop to the lower boundary of the channel or even attempt a bearish breakout.
Trade global index CFDs with zero commission and tight spreads. Open your FXOpen account now or learn more about trading index CFDs with FXOpen.
CFDs are complex instruments and come with a high risk of losing your money.
This article represents the opinion of the Companies operating under the FXOpen brand only. It is not to be construed as an offer, solicitation, or recommendation with respect to products and services provided by the Companies operating under the FXOpen brand, nor is it to be considered financial advice.
👍2
#NVDA #nvidia #stockmarket #MarketNews
Nvidia (NVDA) Shares Fall Despite Strong Earnings
Yesterday, after the close of the main trading session, Nvidia released its second-quarter earnings report:
→ Earnings per share: actual = $0.67, expected = $0.647;
→ Revenue: $30.04 billion, expected = $28.737 billion;
→ The company also announced a $50 billion share buyback.
However, despite the strong results, Nvidia’s share price declined. While the closing price yesterday was above $125, in pre-market trading today, Nvidia's shares are down below $118.
The more than 6% drop may be due to:
→ The company’s future outlook not meeting investor expectations;
→ Waning bullish sentiment around AI adoption.
On 12 August, during a technical analysis of NVDA’s price chart, we noted:
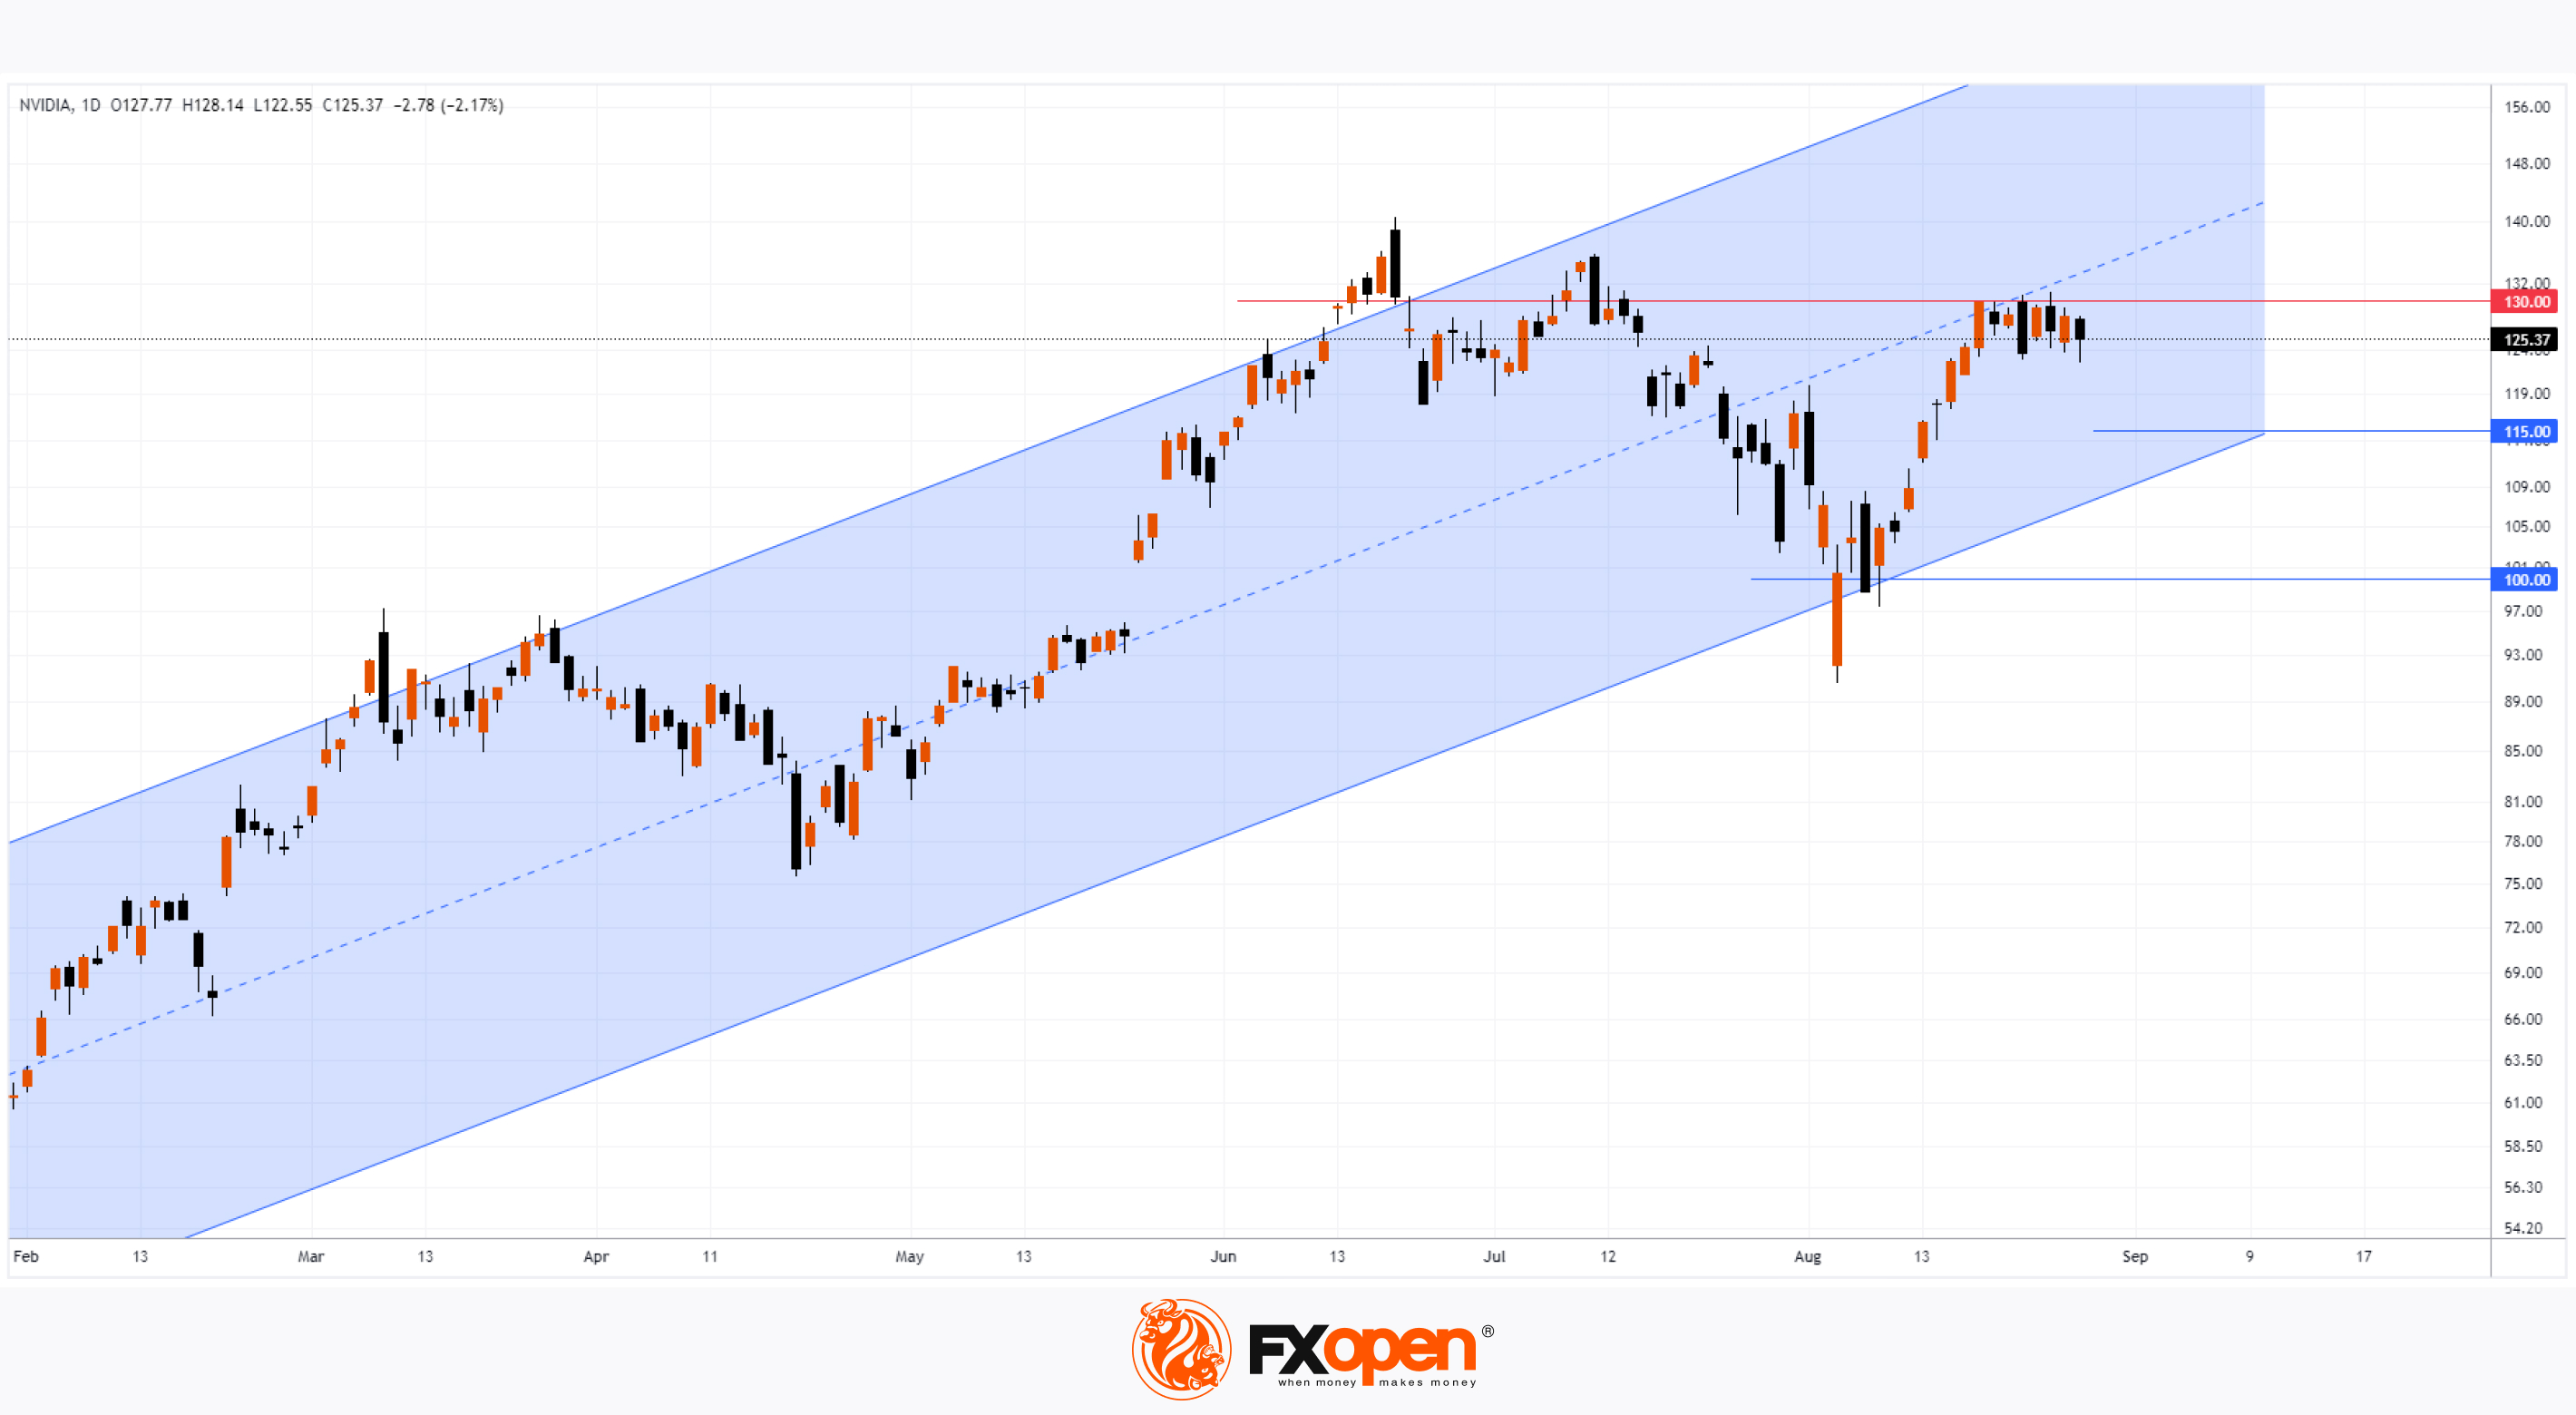
→ The price was forming an upward channel (indicated in blue);
→ The $100 level was acting as support.
Assuming the bearish momentum from the earnings reaction continues, Nvidia’s shares may open trading today around $115, close to the lower boundary of the current upward channel.
New data provides crucial insights for further predictions:
→ After retreating from the $130 resistance level, the price is likely to form a broad bearish gap around the $120 level, which could act as a future resistance zone.
→ The median line of the blue channel may then act as resistance, increasing the likelihood of a bearish breakout below the channel’s lower boundary.
Meanwhile, analysts remain optimistic. According to a Tipranks survey, 33 out of 36 analysts recommend buying NVDA stock. While the average price target is $150 over the next 12 months, it’s possible that these estimates could be revised downward if bearish sentiment intensifies.
Trade global index CFDs with zero commission and tight spreads. Open your FXOpen account now or learn more about trading index CFDs with FXOpen.
CFDs are complex instruments and come with a high risk of losing your money.
This article represents the opinion of the Companies operating under the FXOpen brand only. It is not to be construed as an offer, solicitation, or recommendation with respect to products and services provided by the Companies operating under the FXOpen brand, nor is it to be considered financial advice.
Nvidia (NVDA) Shares Fall Despite Strong Earnings
Yesterday, after the close of the main trading session, Nvidia released its second-quarter earnings report:
→ Earnings per share: actual = $0.67, expected = $0.647;
→ Revenue: $30.04 billion, expected = $28.737 billion;
→ The company also announced a $50 billion share buyback.
However, despite the strong results, Nvidia’s share price declined. While the closing price yesterday was above $125, in pre-market trading today, Nvidia's shares are down below $118.
The more than 6% drop may be due to:
→ The company’s future outlook not meeting investor expectations;
→ Waning bullish sentiment around AI adoption.
On 12 August, during a technical analysis of NVDA’s price chart, we noted:
→ The price was forming an upward channel (indicated in blue);
→ The $100 level was acting as support.
Assuming the bearish momentum from the earnings reaction continues, Nvidia’s shares may open trading today around $115, close to the lower boundary of the current upward channel.
New data provides crucial insights for further predictions:
→ After retreating from the $130 resistance level, the price is likely to form a broad bearish gap around the $120 level, which could act as a future resistance zone.
→ The median line of the blue channel may then act as resistance, increasing the likelihood of a bearish breakout below the channel’s lower boundary.
Meanwhile, analysts remain optimistic. According to a Tipranks survey, 33 out of 36 analysts recommend buying NVDA stock. While the average price target is $150 over the next 12 months, it’s possible that these estimates could be revised downward if bearish sentiment intensifies.
Trade global index CFDs with zero commission and tight spreads. Open your FXOpen account now or learn more about trading index CFDs with FXOpen.
CFDs are complex instruments and come with a high risk of losing your money.
This article represents the opinion of the Companies operating under the FXOpen brand only. It is not to be construed as an offer, solicitation, or recommendation with respect to products and services provided by the Companies operating under the FXOpen brand, nor is it to be considered financial advice.
👍2
#EURUSD #marketanalysis #MarketNews #forextrading
EUR/USD Falls Below 1.11 Support
On 26 August, we discussed the potential for a pullback after the rally to 1.12, noting:
→ The fluctuations since April formed an ascending channel (indicated in blue, with support points marked by circles), and the price was near its upper boundary, where resistance was likely;
→ The 1.12 level also showed signs of resistance – the price briefly exceeded it before quickly falling back below; → Bearish divergence on the RSI indicator.
Just three days later, bearish signals continued to develop, leading to:
→ The formation of a bearish "head and shoulders" pattern (H&S) on the chart;
→ A more than 1% decline in price, breaking below the 1.11 level, which had provided support since 21 August.
Could EUR/USD continue to decline?
Technical analysis of the EUR/USD chart shows:
→ The RSI indicator has exited the overbought zone and fallen below the 50 line, approaching the oversold zone – a sign of changing market sentiment;
→ The price has broken the trendline (indicated in orange).
Today's decline in EUR/USD was also influenced by news of weakening inflation in Germany and Spain, which could prompt the ECB to ease its monetary policy.
If this is a correction after the significant A→B rally of 3.8% since the beginning of the month, the target could be around 1.10415 – a level that acted as resistance in mid-August. Additionally, this area coincides with:
→ The 0.618 Fibonacci retracement level, drawn between points A and B;
→ The target for a decline based on the height of the H&S pattern.
However, it's possible that bulls may regain control sooner and attempt to push the price back into the 1.110-1.120 range.
Trade over 50 forex markets 24 hours a day with FXOpen. Take advantage of low commissions, deep liquidity, and spreads from 0.0 pips. Open your FXOpen account now or learn more about trading forex with FXOpen.
CFDs are complex instruments and come with a high risk of losing your money.
This article represents the opinion of the Companies operating under the FXOpen brand only. It is not to be construed as an offer, solicitation, or recommendation with respect to products and services provided by the Companies operating under the FXOpen brand, nor is it to be considered financial advice.
EUR/USD Falls Below 1.11 Support
On 26 August, we discussed the potential for a pullback after the rally to 1.12, noting:
→ The fluctuations since April formed an ascending channel (indicated in blue, with support points marked by circles), and the price was near its upper boundary, where resistance was likely;
→ The 1.12 level also showed signs of resistance – the price briefly exceeded it before quickly falling back below; → Bearish divergence on the RSI indicator.
Just three days later, bearish signals continued to develop, leading to:
→ The formation of a bearish "head and shoulders" pattern (H&S) on the chart;
→ A more than 1% decline in price, breaking below the 1.11 level, which had provided support since 21 August.
Could EUR/USD continue to decline?
Technical analysis of the EUR/USD chart shows:
→ The RSI indicator has exited the overbought zone and fallen below the 50 line, approaching the oversold zone – a sign of changing market sentiment;
→ The price has broken the trendline (indicated in orange).
Today's decline in EUR/USD was also influenced by news of weakening inflation in Germany and Spain, which could prompt the ECB to ease its monetary policy.
If this is a correction after the significant A→B rally of 3.8% since the beginning of the month, the target could be around 1.10415 – a level that acted as resistance in mid-August. Additionally, this area coincides with:
→ The 0.618 Fibonacci retracement level, drawn between points A and B;
→ The target for a decline based on the height of the H&S pattern.
However, it's possible that bulls may regain control sooner and attempt to push the price back into the 1.110-1.120 range.
Trade over 50 forex markets 24 hours a day with FXOpen. Take advantage of low commissions, deep liquidity, and spreads from 0.0 pips. Open your FXOpen account now or learn more about trading forex with FXOpen.
CFDs are complex instruments and come with a high risk of losing your money.
This article represents the opinion of the Companies operating under the FXOpen brand only. It is not to be construed as an offer, solicitation, or recommendation with respect to products and services provided by the Companies operating under the FXOpen brand, nor is it to be considered financial advice.

👍2
#stockmarket #stocks #MarketNews #marketanalysis
Buffett's Company Hits $1 Trillion Market Cap
Berkshire Hathaway's (BRK.B) Class B shares surpassed $465 this week, while Class A shares exceeded $700,000, pushing the market capitalisation of Warren Buffett's company past the $1 trillion mark. This milestone makes it the first non-tech U.S. company to join the trillion-dollar club, alongside Apple, Nvidia, Microsoft, Alphabet, Amazon, Meta, and Saudi Aramco.
Buffett's success lies in his value investing philosophy, which has allowed him to build a portfolio that consistently outperforms the market. This month is no exception—while the S&P 500 (US SPX 500 mini on FXOpen) has rebounded about 9.4% from its 5 August low, Berkshire Hathaway's Class B shares have surged over 14%.
Can the price climb even higher?
Technical analysis of the BRK.B chart reveals that:
→ Since mid-2023, the price has been forming an upward channel (shown in blue). On 5 August, the price attempted to break below the lower boundary but failed. The long lower wick on that day's candle indicates strong demand.
→ Following 5 August, a steady uptrend emerged without significant pullbacks, lifting the price to the upper half of the channel. The median line acted as support during a test (indicated by an arrow), and the RSI indicator soared into the overbought zone.
→ When analysing 2024 price action using Fibonacci proportions, the B→C retracement is about 0.50 of the A→B impulse. This suggests a target for the current rally could be at the 1.618 level, around $475, which aligns with the upper boundary of the rising channel.
Therefore, as the price approaches $475, the bullish trend may slow down. According to TipRanks, the target price for BRK.B shares is $477 over the next 12 months.
Trade global index CFDs with zero commission and tight spreads. Open your FXOpen account now or learn more about trading index CFDs with FXOpen.
CFDs are complex instruments and come with a high risk of losing your money.
This article represents the opinion of the Companies operating under the FXOpen brand only. It is not to be construed as an offer, solicitation, or recommendation with respect to products and services provided by the Companies operating under the FXOpen brand, nor is it to be considered financial advice.
Buffett's Company Hits $1 Trillion Market Cap
Berkshire Hathaway's (BRK.B) Class B shares surpassed $465 this week, while Class A shares exceeded $700,000, pushing the market capitalisation of Warren Buffett's company past the $1 trillion mark. This milestone makes it the first non-tech U.S. company to join the trillion-dollar club, alongside Apple, Nvidia, Microsoft, Alphabet, Amazon, Meta, and Saudi Aramco.
Buffett's success lies in his value investing philosophy, which has allowed him to build a portfolio that consistently outperforms the market. This month is no exception—while the S&P 500 (US SPX 500 mini on FXOpen) has rebounded about 9.4% from its 5 August low, Berkshire Hathaway's Class B shares have surged over 14%.
Can the price climb even higher?
Technical analysis of the BRK.B chart reveals that:
→ Since mid-2023, the price has been forming an upward channel (shown in blue). On 5 August, the price attempted to break below the lower boundary but failed. The long lower wick on that day's candle indicates strong demand.
→ Following 5 August, a steady uptrend emerged without significant pullbacks, lifting the price to the upper half of the channel. The median line acted as support during a test (indicated by an arrow), and the RSI indicator soared into the overbought zone.
→ When analysing 2024 price action using Fibonacci proportions, the B→C retracement is about 0.50 of the A→B impulse. This suggests a target for the current rally could be at the 1.618 level, around $475, which aligns with the upper boundary of the rising channel.
Therefore, as the price approaches $475, the bullish trend may slow down. According to TipRanks, the target price for BRK.B shares is $477 over the next 12 months.
Trade global index CFDs with zero commission and tight spreads. Open your FXOpen account now or learn more about trading index CFDs with FXOpen.
CFDs are complex instruments and come with a high risk of losing your money.
This article represents the opinion of the Companies operating under the FXOpen brand only. It is not to be construed as an offer, solicitation, or recommendation with respect to products and services provided by the Companies operating under the FXOpen brand, nor is it to be considered financial advice.

👍3
#usdchf #MarketNews #marketanalysis #forextrading
USD/CHF Rebounds from Yearly Lows
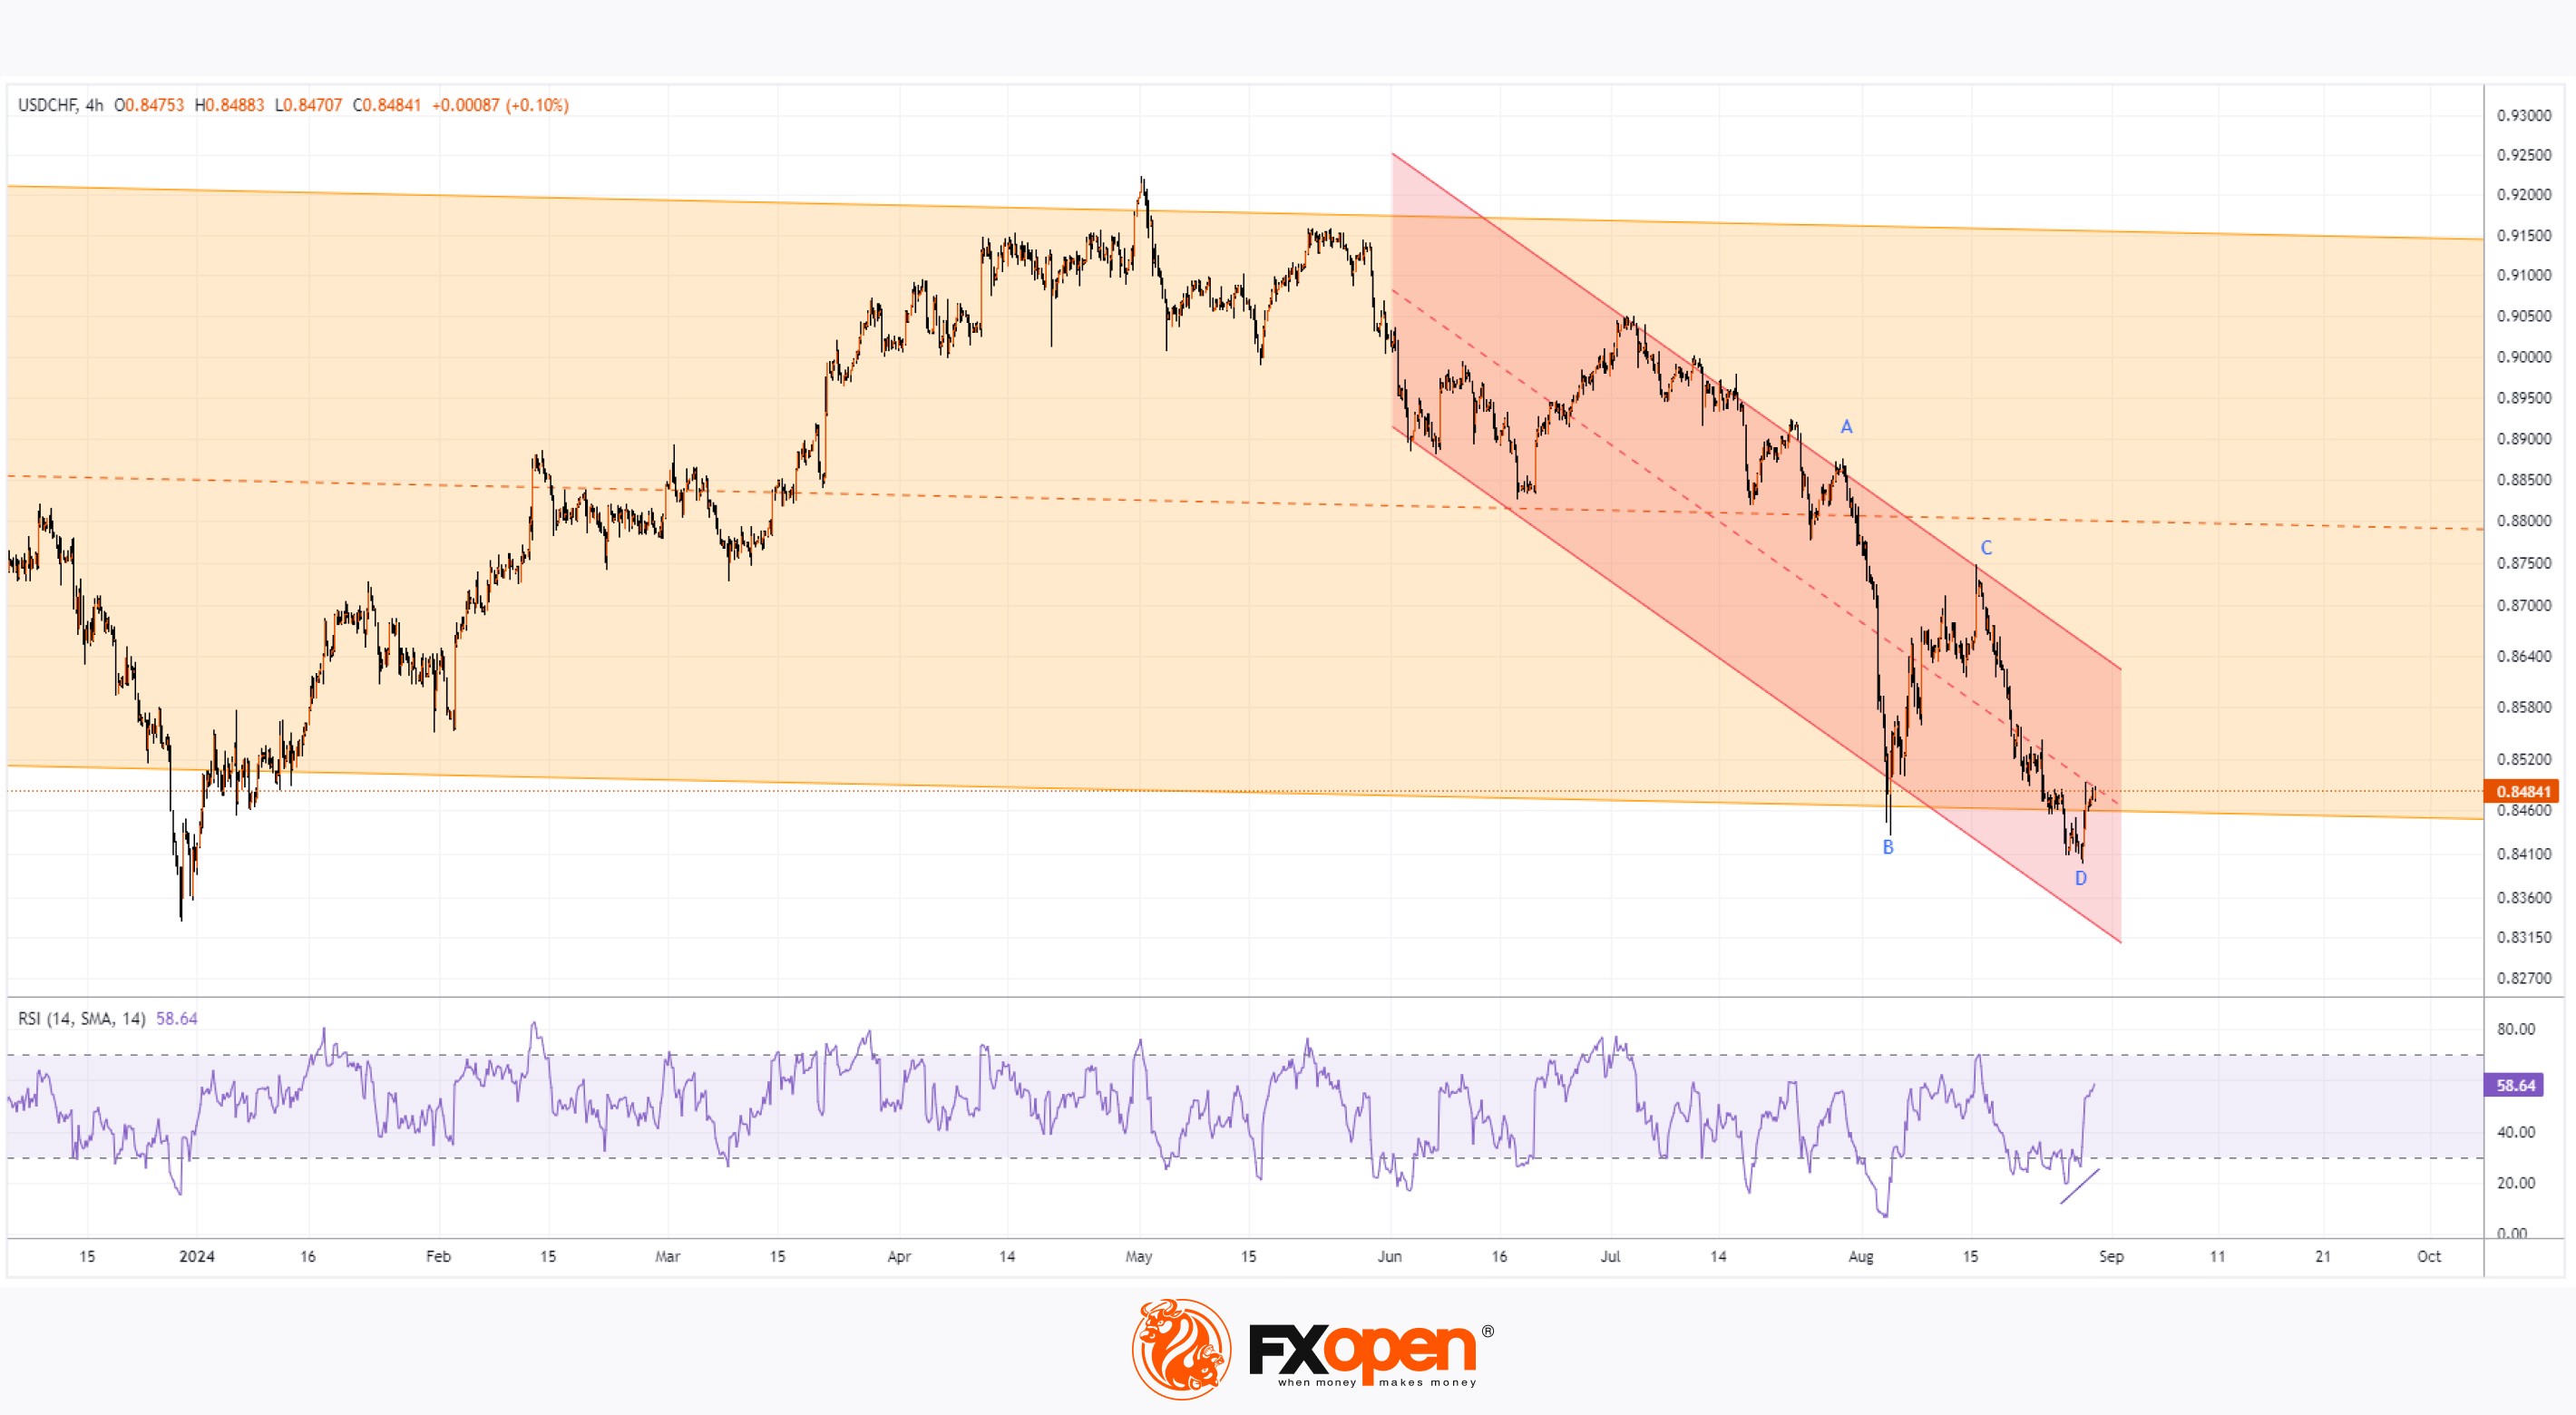
The USD/CHF pair tested its yearly low slightly below 0.84100 yesterday but has since recovered to just above 0.84800 today.
The bullish sentiment was supported by positive news about the U.S. economy—data released yesterday showed GDP growth for the second quarter at 3.0%, surpassing the expected 2.8%.
Bulls may find further encouragement from events earlier this year when the head of the Swiss National Bank (SNB) warned that an excessively strong franc could pressure the country's economy. Following this, USD/CHF rose by more than 8% over four months.
Technical analysis of the USD/CHF chart indicates that since June, the price has been forming a downward channel (shown in red). However, several factors may support a bullish reversal:
→ The price is near the lower boundary of a larger channel that began in 2022, which could act as support.
→ The RSI on the 4-hour chart not only shows a bullish divergence but also spiked above the 50 level after hovering near the lower boundary since 20 August.
→ Comparing the downward impulses A→B and C→D reveals that the first drop was more aggressive, while the second showed a less steep decline—signalling weakening selling pressure. There's also another bullish divergence between the lows at B and D.
Given these factors, there's reason to believe that the median line of the current red downward channel is at risk of a bullish breakout, potentially paving the way for USD/CHF to move towards the upper boundary of the channel.
Trade over 50 forex markets 24 hours a day with FXOpen. Take advantage of low commissions, deep liquidity, and spreads from 0.0 pips. Open your FXOpen account now or learn more about trading forex with FXOpen.
CFDs are complex instruments and come with a high risk of losing your money.
This article represents the opinion of the Companies operating under the FXOpen brand only. It is not to be construed as an offer, solicitation, or recommendation with respect to products and services provided by the Companies operating under the FXOpen brand, nor is it to be considered financial advice.
USD/CHF Rebounds from Yearly Lows
The USD/CHF pair tested its yearly low slightly below 0.84100 yesterday but has since recovered to just above 0.84800 today.
The bullish sentiment was supported by positive news about the U.S. economy—data released yesterday showed GDP growth for the second quarter at 3.0%, surpassing the expected 2.8%.
Bulls may find further encouragement from events earlier this year when the head of the Swiss National Bank (SNB) warned that an excessively strong franc could pressure the country's economy. Following this, USD/CHF rose by more than 8% over four months.
Technical analysis of the USD/CHF chart indicates that since June, the price has been forming a downward channel (shown in red). However, several factors may support a bullish reversal:
→ The price is near the lower boundary of a larger channel that began in 2022, which could act as support.
→ The RSI on the 4-hour chart not only shows a bullish divergence but also spiked above the 50 level after hovering near the lower boundary since 20 August.
→ Comparing the downward impulses A→B and C→D reveals that the first drop was more aggressive, while the second showed a less steep decline—signalling weakening selling pressure. There's also another bullish divergence between the lows at B and D.
Given these factors, there's reason to believe that the median line of the current red downward channel is at risk of a bullish breakout, potentially paving the way for USD/CHF to move towards the upper boundary of the channel.
Trade over 50 forex markets 24 hours a day with FXOpen. Take advantage of low commissions, deep liquidity, and spreads from 0.0 pips. Open your FXOpen account now or learn more about trading forex with FXOpen.
CFDs are complex instruments and come with a high risk of losing your money.
This article represents the opinion of the Companies operating under the FXOpen brand only. It is not to be construed as an offer, solicitation, or recommendation with respect to products and services provided by the Companies operating under the FXOpen brand, nor is it to be considered financial advice.
👍3
#EURUSD #ForexTrading #NASDAQ100 #NVIDIA #GoldPrices #MarketAnalysis
Weekly Market Wrap With Gary Thomson: EUR/USD, NASDAQ 100, NVIDIA, Gold and Oil
Get the latest scoop on the week's hottest headlines, all in one convenient video. Join Gary Thomson, the COO of FXOpen UK, as he breaks down the most significant news reports and shares his expert insights.
🔸EUR/USD falls below 1.11 support
🔸NASDAQ 100 consolidates ahead of NVIDIA report
🔸NVIDIA (NVDA) shares fall despite strong eargnings
🔸Market analysis: Gold and Oil prices signal more upsides
Stay in the know and empower yourself with our short, yet power-packed video. Watch it now and stay updated with FXOpen. Don't miss out on this invaluable opportunity to sharpen your trading skills and make informed decisions.
https://cutt.ly/xeQxZCL9
To take advantage of price fluctuations in the foreign exchange markets, consider enlisting the services of a reliable broker like FXOpen.
⚠️
This forecast represents FXOpen Companies opinion only, it should not be construed as an offer, invitation or recommendation in respect to FXOpen Companies products and services or as financial advice.
Weekly Market Wrap With Gary Thomson: EUR/USD, NASDAQ 100, NVIDIA, Gold and Oil
Get the latest scoop on the week's hottest headlines, all in one convenient video. Join Gary Thomson, the COO of FXOpen UK, as he breaks down the most significant news reports and shares his expert insights.
🔸EUR/USD falls below 1.11 support
🔸NASDAQ 100 consolidates ahead of NVIDIA report
🔸NVIDIA (NVDA) shares fall despite strong eargnings
🔸Market analysis: Gold and Oil prices signal more upsides
Stay in the know and empower yourself with our short, yet power-packed video. Watch it now and stay updated with FXOpen. Don't miss out on this invaluable opportunity to sharpen your trading skills and make informed decisions.
https://cutt.ly/xeQxZCL9
To take advantage of price fluctuations in the foreign exchange markets, consider enlisting the services of a reliable broker like FXOpen.
⚠️
This forecast represents FXOpen Companies opinion only, it should not be construed as an offer, invitation or recommendation in respect to FXOpen Companies products and services or as financial advice.
YouTube
Weekly Market Wrap With Gary Thomson: EUR/USD, NASDAQ 100, NVIDIA, Gold and Oil
Get the latest scoop on the week's hottest headlines, all in one convenient video. Join Gary Thomson, the COO of FXOpen UK, as he breaks down the most significant news reports and shares his expert insights.
- EUR/USD falls below 1.11 support
- NASDAQ 100…
- EUR/USD falls below 1.11 support
- NASDAQ 100…
👍4
#sp500 #marketanalysis #MarketNews #stockmarket
September – The Worst Month for the S&P 500
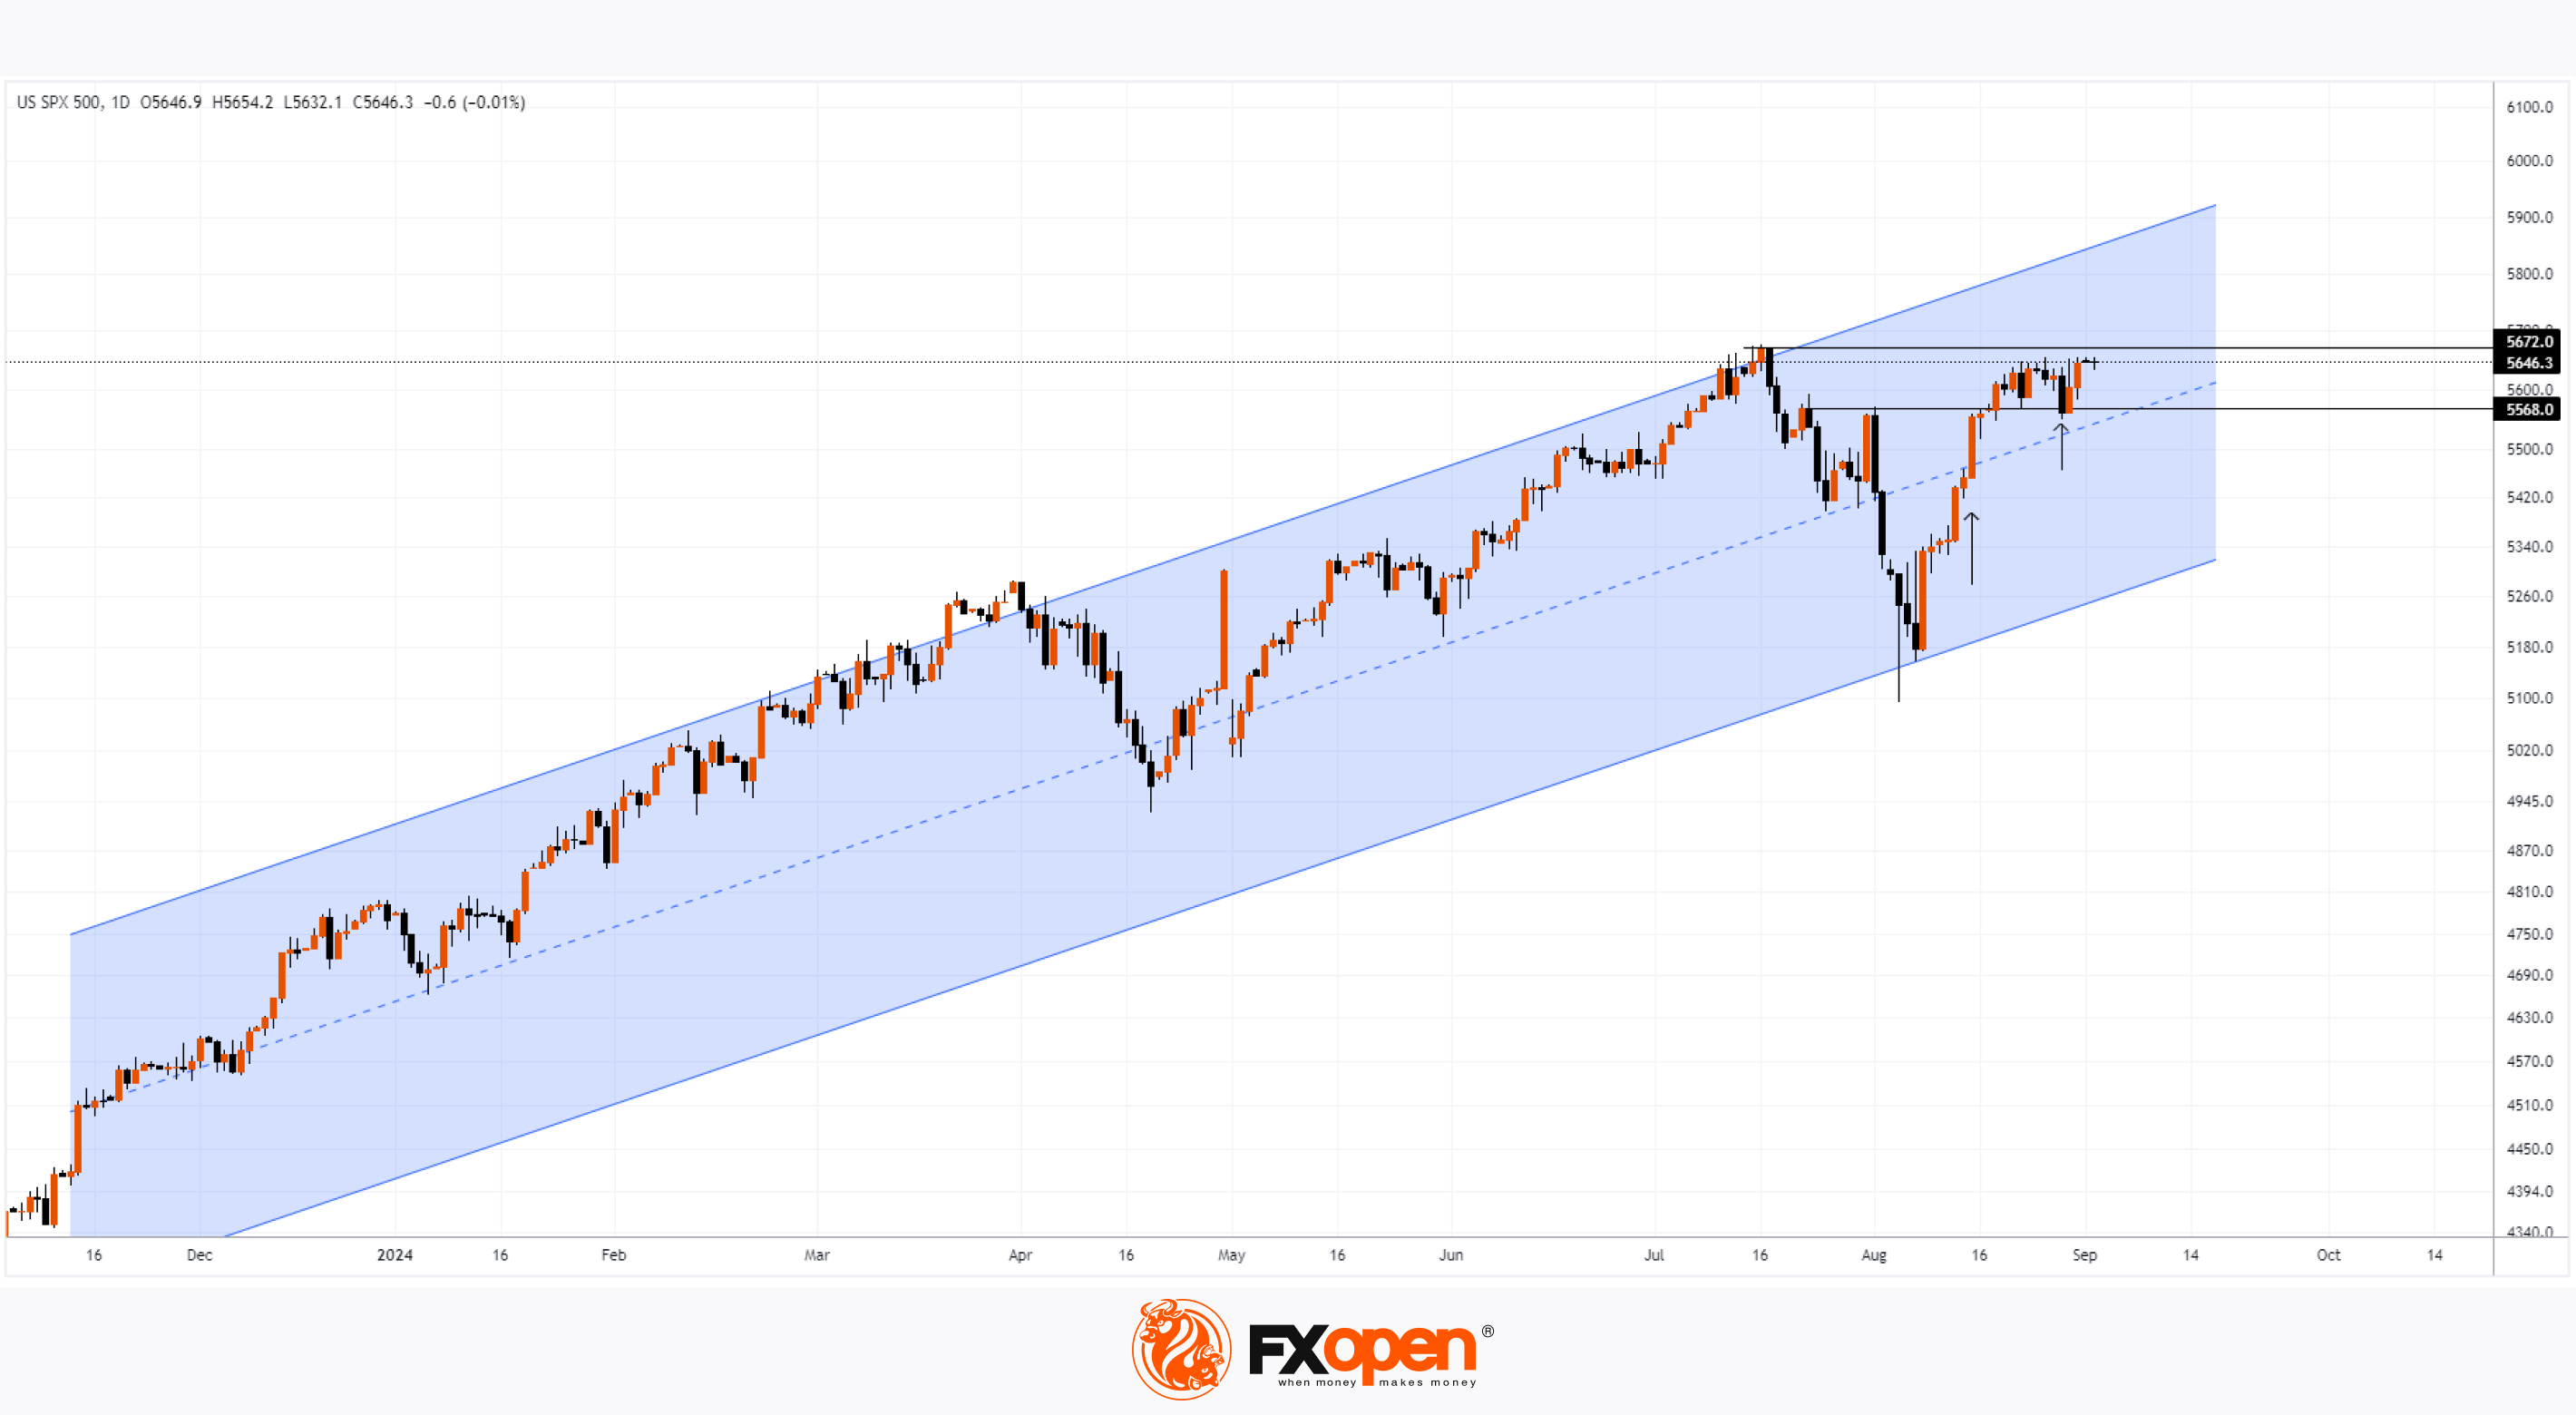
August was a turbulent month for the US stock market. On the 5th, the S&P 500 (US SPX 500 mini on FXOpen) experienced its largest daily drop since 2022, falling by 3%. However, the index ended August up by 3.7% and is now just 0.3% below its all-time high of around 5672 set in July.
What can we expect in September? Historically, it is the worst month for the S&P 500 (US SPX 500 mini on FXOpen). Statistics show that the index has typically declined by an average of 1.1% in September.
The month starts with a long weekend due to Labour Day in the US, but volatility is likely to increase as traders return from their holidays.
Technical analysis of the S&P 500 (US SPX 500 mini on FXOpen) shows:
→ The price is moving within an ascending channel (shown in blue), having tested the lower boundary of the channel on 5 August before returning to the upper half of the channel with a wide candle on 15 August (shown by the arrow).
→ The level of 5568, which showed signs of resistance at the end of July and early August, was broken to the upside on the 19th. This level, now "reinforced" by the median line of the channel, could serve as a base for bulls trying to set a new all-time high. If such an attempt occurs, it is possible that the price will reach the upper boundary of the channel, where resistance is expected.
→ The bears' attempt to lower the price on 28 August (second arrow) failed, further indicating that the bullish side has the upper hand.
Thus, the start of the month looks promising, but the fundamental backdrop will be crucial.
The key event for September is the Fed meeting on the 18th, where a 0.25% rate cut is anticipated – currently, the rate stands at a 23-year high of 5.5%. However, market sentiment may shift depending on the employment report for August, scheduled for release on 6 September.
Trade global index CFDs with zero commission and tight spreads. Open your FXOpen account now or learn more about trading index CFDs with FXOpen.
CFDs are complex instruments and come with a high risk of losing your money.
This article represents the opinion of the Companies operating under the FXOpen brand only. It is not to be construed as an offer, solicitation, or recommendation with respect to products and services provided by the Companies operating under the FXOpen brand, nor is it to be considered financial advice.
September – The Worst Month for the S&P 500
August was a turbulent month for the US stock market. On the 5th, the S&P 500 (US SPX 500 mini on FXOpen) experienced its largest daily drop since 2022, falling by 3%. However, the index ended August up by 3.7% and is now just 0.3% below its all-time high of around 5672 set in July.
What can we expect in September? Historically, it is the worst month for the S&P 500 (US SPX 500 mini on FXOpen). Statistics show that the index has typically declined by an average of 1.1% in September.
The month starts with a long weekend due to Labour Day in the US, but volatility is likely to increase as traders return from their holidays.
Technical analysis of the S&P 500 (US SPX 500 mini on FXOpen) shows:
→ The price is moving within an ascending channel (shown in blue), having tested the lower boundary of the channel on 5 August before returning to the upper half of the channel with a wide candle on 15 August (shown by the arrow).
→ The level of 5568, which showed signs of resistance at the end of July and early August, was broken to the upside on the 19th. This level, now "reinforced" by the median line of the channel, could serve as a base for bulls trying to set a new all-time high. If such an attempt occurs, it is possible that the price will reach the upper boundary of the channel, where resistance is expected.
→ The bears' attempt to lower the price on 28 August (second arrow) failed, further indicating that the bullish side has the upper hand.
Thus, the start of the month looks promising, but the fundamental backdrop will be crucial.
The key event for September is the Fed meeting on the 18th, where a 0.25% rate cut is anticipated – currently, the rate stands at a 23-year high of 5.5%. However, market sentiment may shift depending on the employment report for August, scheduled for release on 6 September.
Trade global index CFDs with zero commission and tight spreads. Open your FXOpen account now or learn more about trading index CFDs with FXOpen.
CFDs are complex instruments and come with a high risk of losing your money.
This article represents the opinion of the Companies operating under the FXOpen brand only. It is not to be construed as an offer, solicitation, or recommendation with respect to products and services provided by the Companies operating under the FXOpen brand, nor is it to be considered financial advice.
👍2
#stockmarket #marketanalysis #MarketNews #stocktrading
The Price of Intel (INTC) Shares Rose By 9.5% in a Day
The reason for the optimism is a report from Reuters that CEO Pat Gelsinger is planning to present a comprehensive plan to the board of directors in mid-September:
→ Special attention will be given to reducing capital expenditures, which is part of a broader effort to revitalise the chipmaker, whose shares have experienced a dramatic decline. It’s worth noting that on 2 August, the price of Intel (INTC) shares dropped by 26% in a single day following the release of disappointing quarterly results and projections, which greatly disheartened investors.
→ The plan also considers the sale of businesses, including the Altera division. Reportedly, Intel has enlisted Morgan Stanley and Goldman Sachs to advise on the sale of these assets.
→ Additionally, Intel aims to reduce its workforce by more than 15%, with the majority of the cuts expected to be completed by the end of 2024.
Investors were encouraged by the news that the management is ready to take decisive action. As Gelsinger recently stated, "We respect the scepticism we’ve received from the market. We believe we’re ready to meet the challenge."
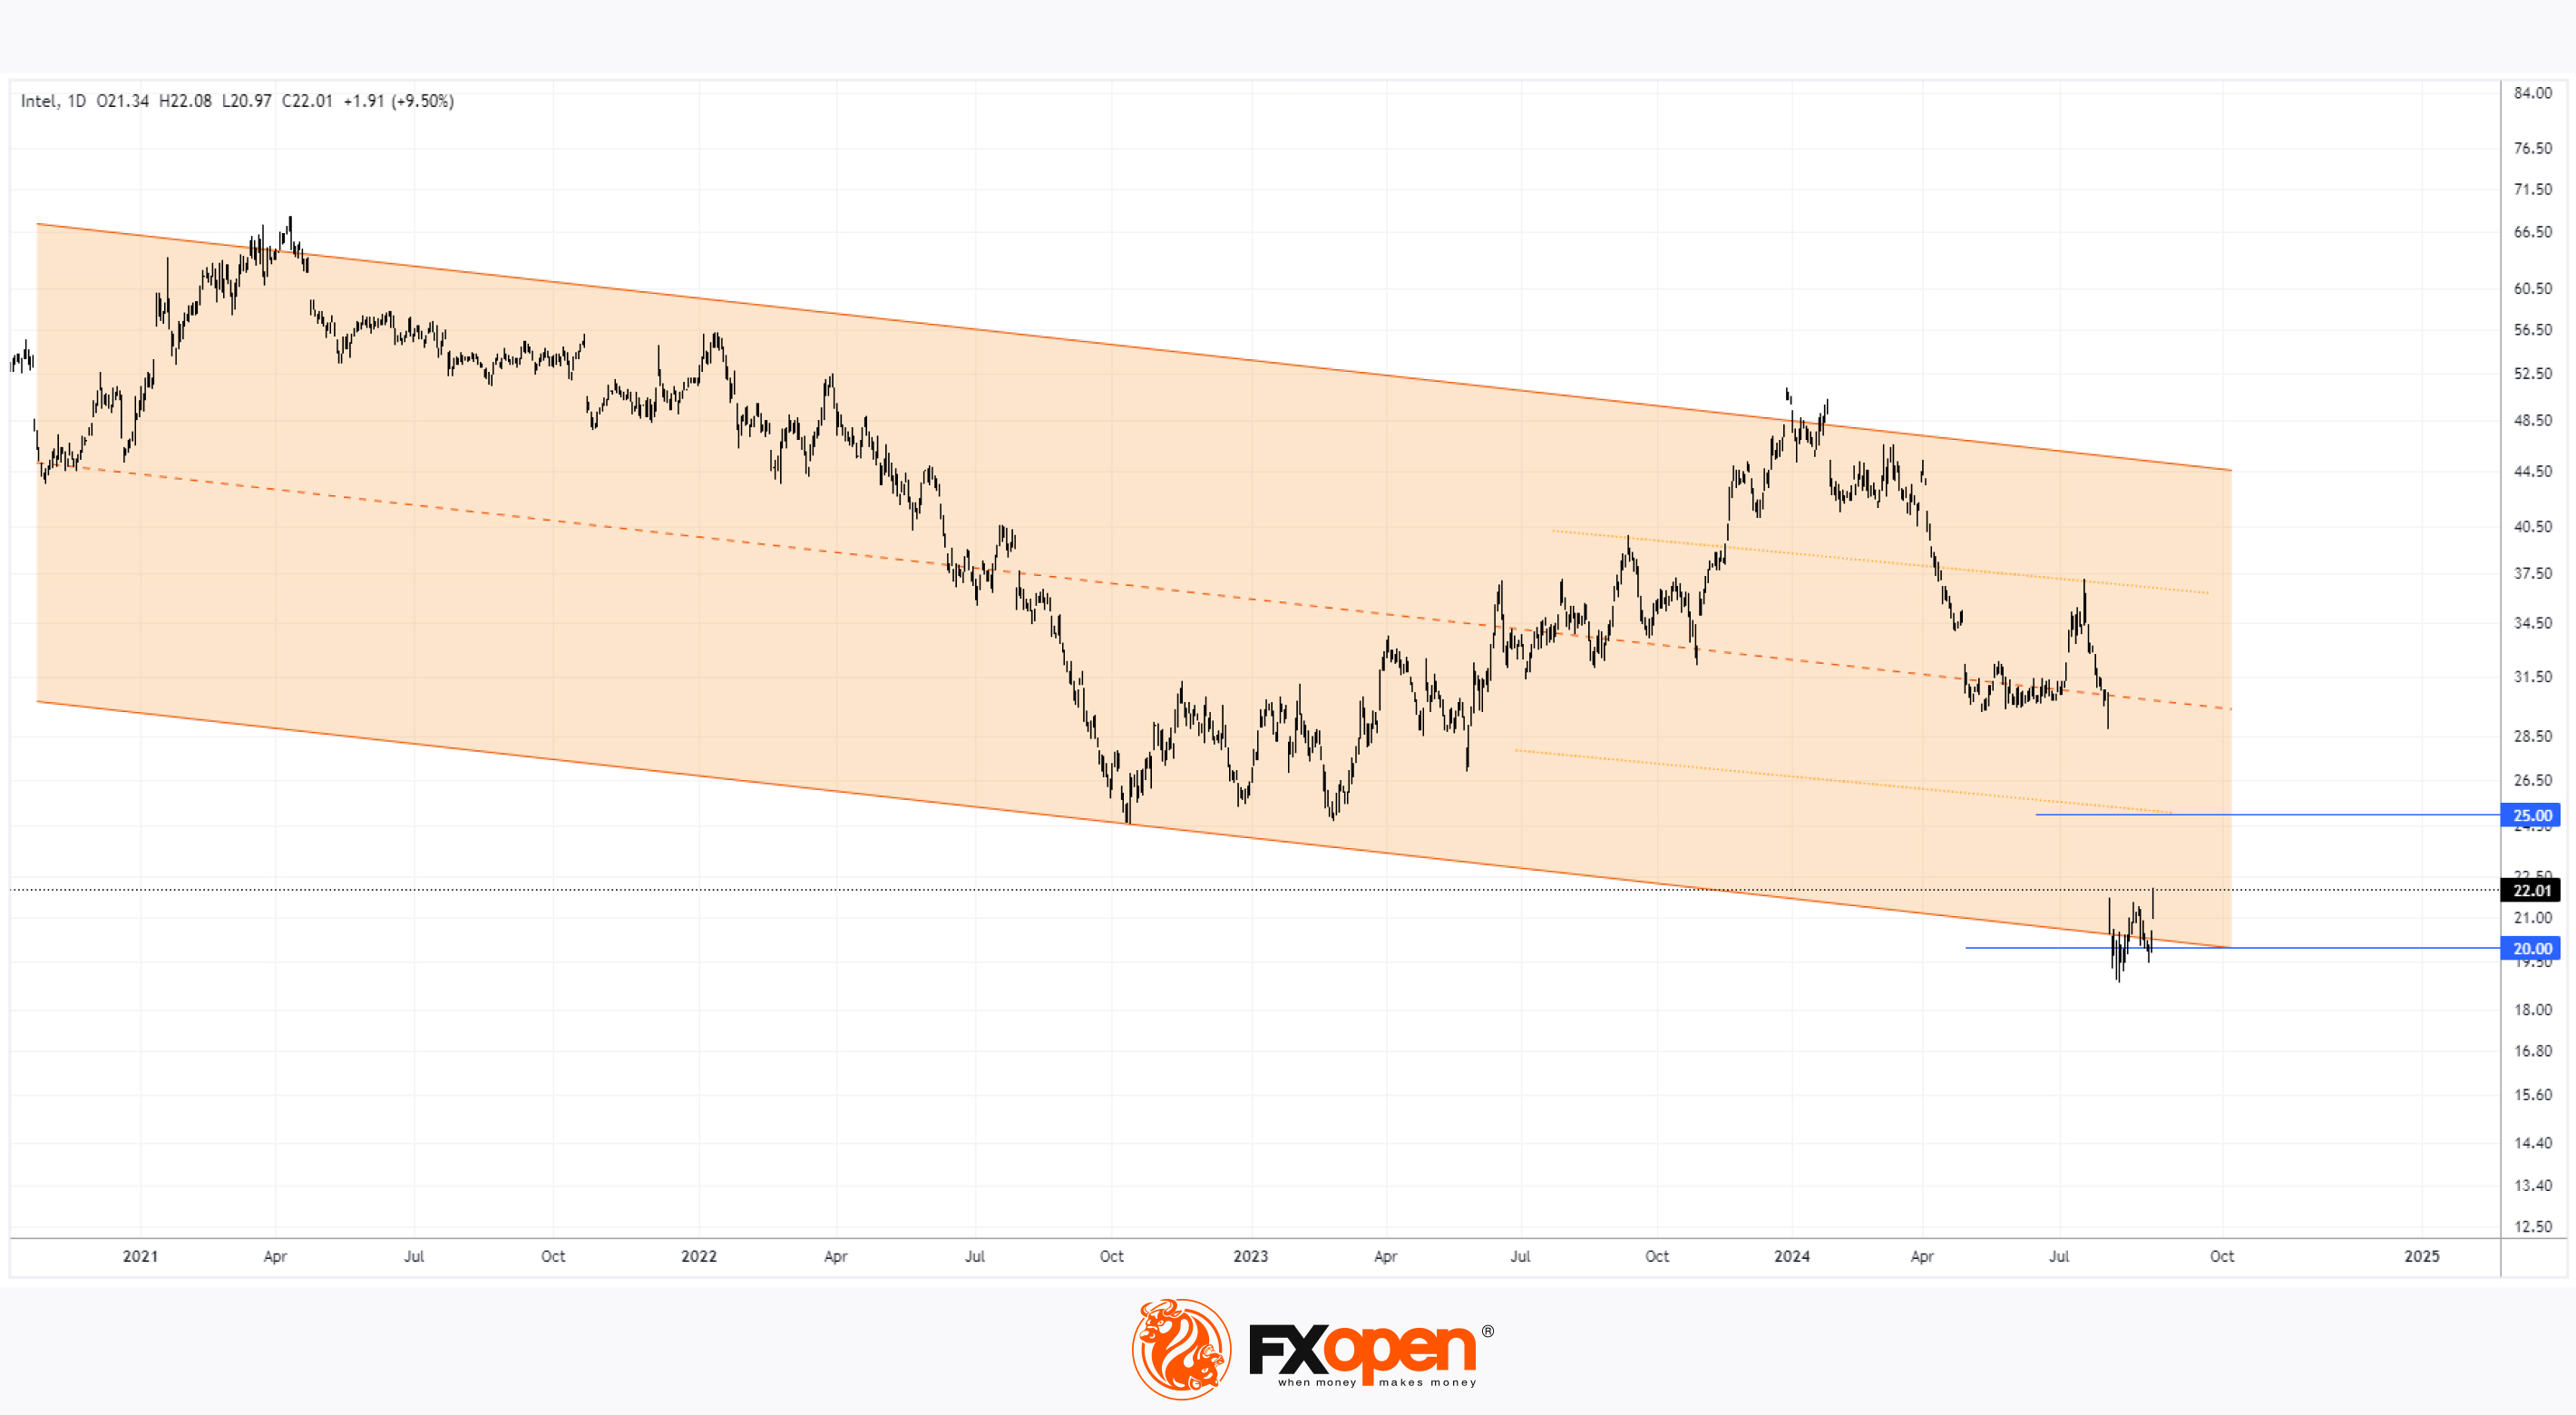
Technical analysis of the INTC stock chart indicates that:
→ Since 2021, the price has been in a downtrend, indicated by the descending channel on the chart. The lower boundary of the channel acted as resistance, halting the price decline in August.
→ The W-shaped formation that has developed over the past month is a type of bullish double-bottom pattern, which is reinforced by the psychological level of $20.
→ Yesterday’s trading opened with a bullish gap, and during the session, the price rose above the highs set after 2 August.
Thus, the price action suggests that market participants are hopeful that Intel will overcome its challenges. It is possible that, in light of the news related to the comprehensive plan to improve the company’s efficiency, the price could reach the $25 level.
According to the average estimates of analysts surveyed by TipRanks, the target price for INTC is $27.32 over the next 12 months. Only 1 out of 32 analysts recommends buying INTC shares.
Trade global index CFDs with zero commission and tight spreads. Open your FXOpen account now or learn more about trading index CFDs with FXOpen.
CFDs are complex instruments and come with a high risk of losing your money.
This article represents the opinion of the Companies operating under the FXOpen brand only. It is not to be construed as an offer, solicitation, or recommendation with respect to products and services provided by the Companies operating under the FXOpen brand, nor is it to be considered financial advice.
The Price of Intel (INTC) Shares Rose By 9.5% in a Day
The reason for the optimism is a report from Reuters that CEO Pat Gelsinger is planning to present a comprehensive plan to the board of directors in mid-September:
→ Special attention will be given to reducing capital expenditures, which is part of a broader effort to revitalise the chipmaker, whose shares have experienced a dramatic decline. It’s worth noting that on 2 August, the price of Intel (INTC) shares dropped by 26% in a single day following the release of disappointing quarterly results and projections, which greatly disheartened investors.
→ The plan also considers the sale of businesses, including the Altera division. Reportedly, Intel has enlisted Morgan Stanley and Goldman Sachs to advise on the sale of these assets.
→ Additionally, Intel aims to reduce its workforce by more than 15%, with the majority of the cuts expected to be completed by the end of 2024.
Investors were encouraged by the news that the management is ready to take decisive action. As Gelsinger recently stated, "We respect the scepticism we’ve received from the market. We believe we’re ready to meet the challenge."
Technical analysis of the INTC stock chart indicates that:
→ Since 2021, the price has been in a downtrend, indicated by the descending channel on the chart. The lower boundary of the channel acted as resistance, halting the price decline in August.
→ The W-shaped formation that has developed over the past month is a type of bullish double-bottom pattern, which is reinforced by the psychological level of $20.
→ Yesterday’s trading opened with a bullish gap, and during the session, the price rose above the highs set after 2 August.
Thus, the price action suggests that market participants are hopeful that Intel will overcome its challenges. It is possible that, in light of the news related to the comprehensive plan to improve the company’s efficiency, the price could reach the $25 level.
According to the average estimates of analysts surveyed by TipRanks, the target price for INTC is $27.32 over the next 12 months. Only 1 out of 32 analysts recommends buying INTC shares.
Trade global index CFDs with zero commission and tight spreads. Open your FXOpen account now or learn more about trading index CFDs with FXOpen.
CFDs are complex instruments and come with a high risk of losing your money.
This article represents the opinion of the Companies operating under the FXOpen brand only. It is not to be construed as an offer, solicitation, or recommendation with respect to products and services provided by the Companies operating under the FXOpen brand, nor is it to be considered financial advice.
👍2
#silver #marketanalysis #MarketNews #XAGUSD
XAG/USD Analysis: Bulls May Target $30 Again
As the XAG/USD chart indicates today, the price of silver has dropped by over 5% in the past week. Bearish signs are also evident in the price of gold. According to Reuters, market participants are focusing on a series of economic data set to be released this week, which could influence expectations regarding a potential rate cut at the Federal Reserve’s September meeting.
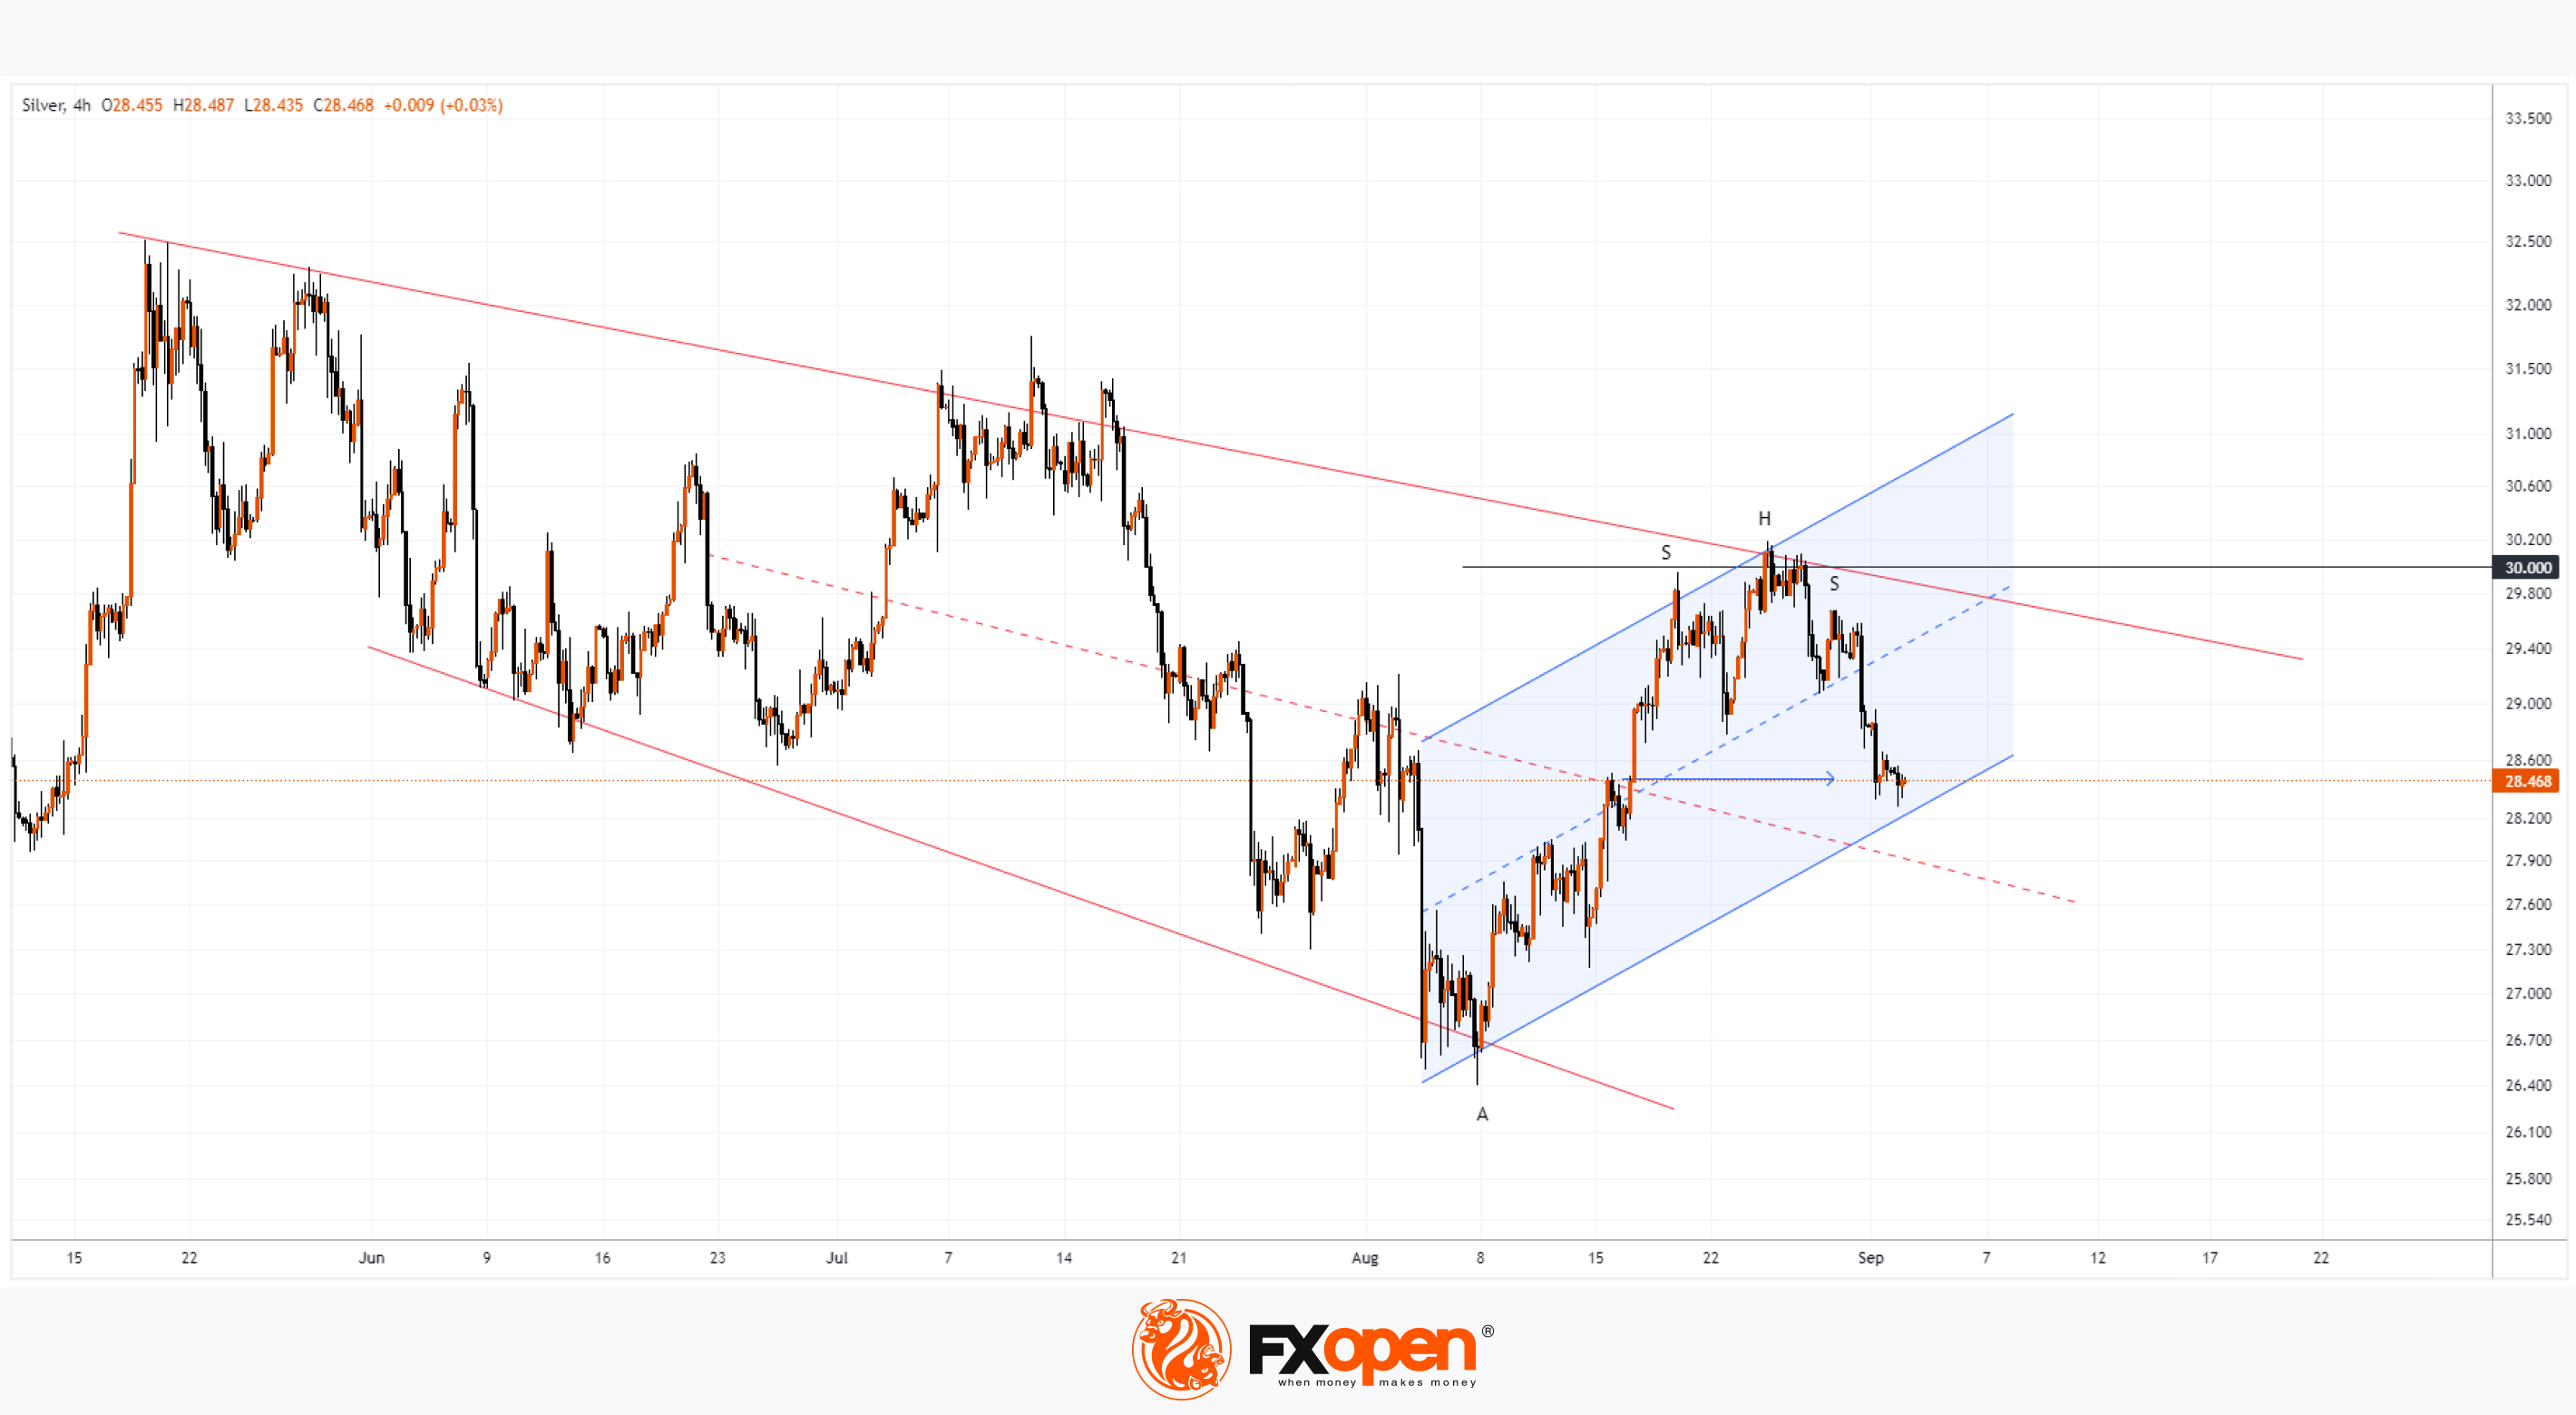
Could the price of silver continue to decline? Technical analysis of the XAG/USD chart shows that since late May, the price of silver has been forming a structure resembling a fan of three expanding lines, marked in red.
Bullish Arguments:
→ The price has broken through the red median line and moved into the upper half of the fan.
→ The price is near the bullish breakout level of the median line, which may provide support.
→ On 2-3 September, the bearish momentum slowed down, indicating potential support, which could be strengthened by the lower boundary of the rising blue channel.
→ The price is at the 50% level of the bullish A→H impulse.
Bearish Arguments:
→ Near the psychological level of $30 per ounce, a bearish head and shoulders (H&S) pattern has formed on the chart, although the potential from the neckline break has almost been exhausted.
Therefore, it is possible that the bulls may try to regain control and make a new attempt to push the price towards the $30 level. Whether this scenario plays out will largely depend on the fundamental backdrop. On Friday, 6 September, at 15:30 GMT+3, US labour market data will be released – this event could have a significant impact on the price of silver.
Start trading commodities with tight spreads. Open your trading account now or learn more about trading commodity CFDs with FXOpen.
CFDs are complex instruments and come with a high risk of losing your money.
This article represents the opinion of the Companies operating under the FXOpen brand only. It is not to be construed as an offer, solicitation, or recommendation with respect to products and services provided by the Companies operating under the FXOpen brand, nor is it to be considered financial advice.
XAG/USD Analysis: Bulls May Target $30 Again
As the XAG/USD chart indicates today, the price of silver has dropped by over 5% in the past week. Bearish signs are also evident in the price of gold. According to Reuters, market participants are focusing on a series of economic data set to be released this week, which could influence expectations regarding a potential rate cut at the Federal Reserve’s September meeting.
Could the price of silver continue to decline? Technical analysis of the XAG/USD chart shows that since late May, the price of silver has been forming a structure resembling a fan of three expanding lines, marked in red.
Bullish Arguments:
→ The price has broken through the red median line and moved into the upper half of the fan.
→ The price is near the bullish breakout level of the median line, which may provide support.
→ On 2-3 September, the bearish momentum slowed down, indicating potential support, which could be strengthened by the lower boundary of the rising blue channel.
→ The price is at the 50% level of the bullish A→H impulse.
Bearish Arguments:
→ Near the psychological level of $30 per ounce, a bearish head and shoulders (H&S) pattern has formed on the chart, although the potential from the neckline break has almost been exhausted.
Therefore, it is possible that the bulls may try to regain control and make a new attempt to push the price towards the $30 level. Whether this scenario plays out will largely depend on the fundamental backdrop. On Friday, 6 September, at 15:30 GMT+3, US labour market data will be released – this event could have a significant impact on the price of silver.
Start trading commodities with tight spreads. Open your trading account now or learn more about trading commodity CFDs with FXOpen.
CFDs are complex instruments and come with a high risk of losing your money.
This article represents the opinion of the Companies operating under the FXOpen brand only. It is not to be construed as an offer, solicitation, or recommendation with respect to products and services provided by the Companies operating under the FXOpen brand, nor is it to be considered financial advice.
👍2
#marketanalysis #MarketNews #NVDA
Nvidia (NVDA) Shares Among the Biggest Losers
On July 31, US labour market data was released, which proved disappointing and contributed to a decline in the Nasdaq 100 index (US Tech 100 mini on FXOpen) by over 10% between August 1 and 5.
This heightens the importance of the upcoming labour market data release, scheduled for tomorrow (15:15-15:30 GMT+3). It seems that concerns are growing among market participants that the news could reveal further negative trends.
This could explain the sell-off that gripped the US stock market yesterday. The Nasdaq 100 index (US Tech 100 mini on FXOpen) dropped by more than 3%, with Nvidia (NVDA) shares losing over 9% of their value.
In the first half of 2024, NVDA was a growth leader, but now it is among the biggest decliners—a bearish signal that suggests the price decline could continue. If so, how significant could it be?
Technical analysis of Nvidia (NVDA) chart shows:
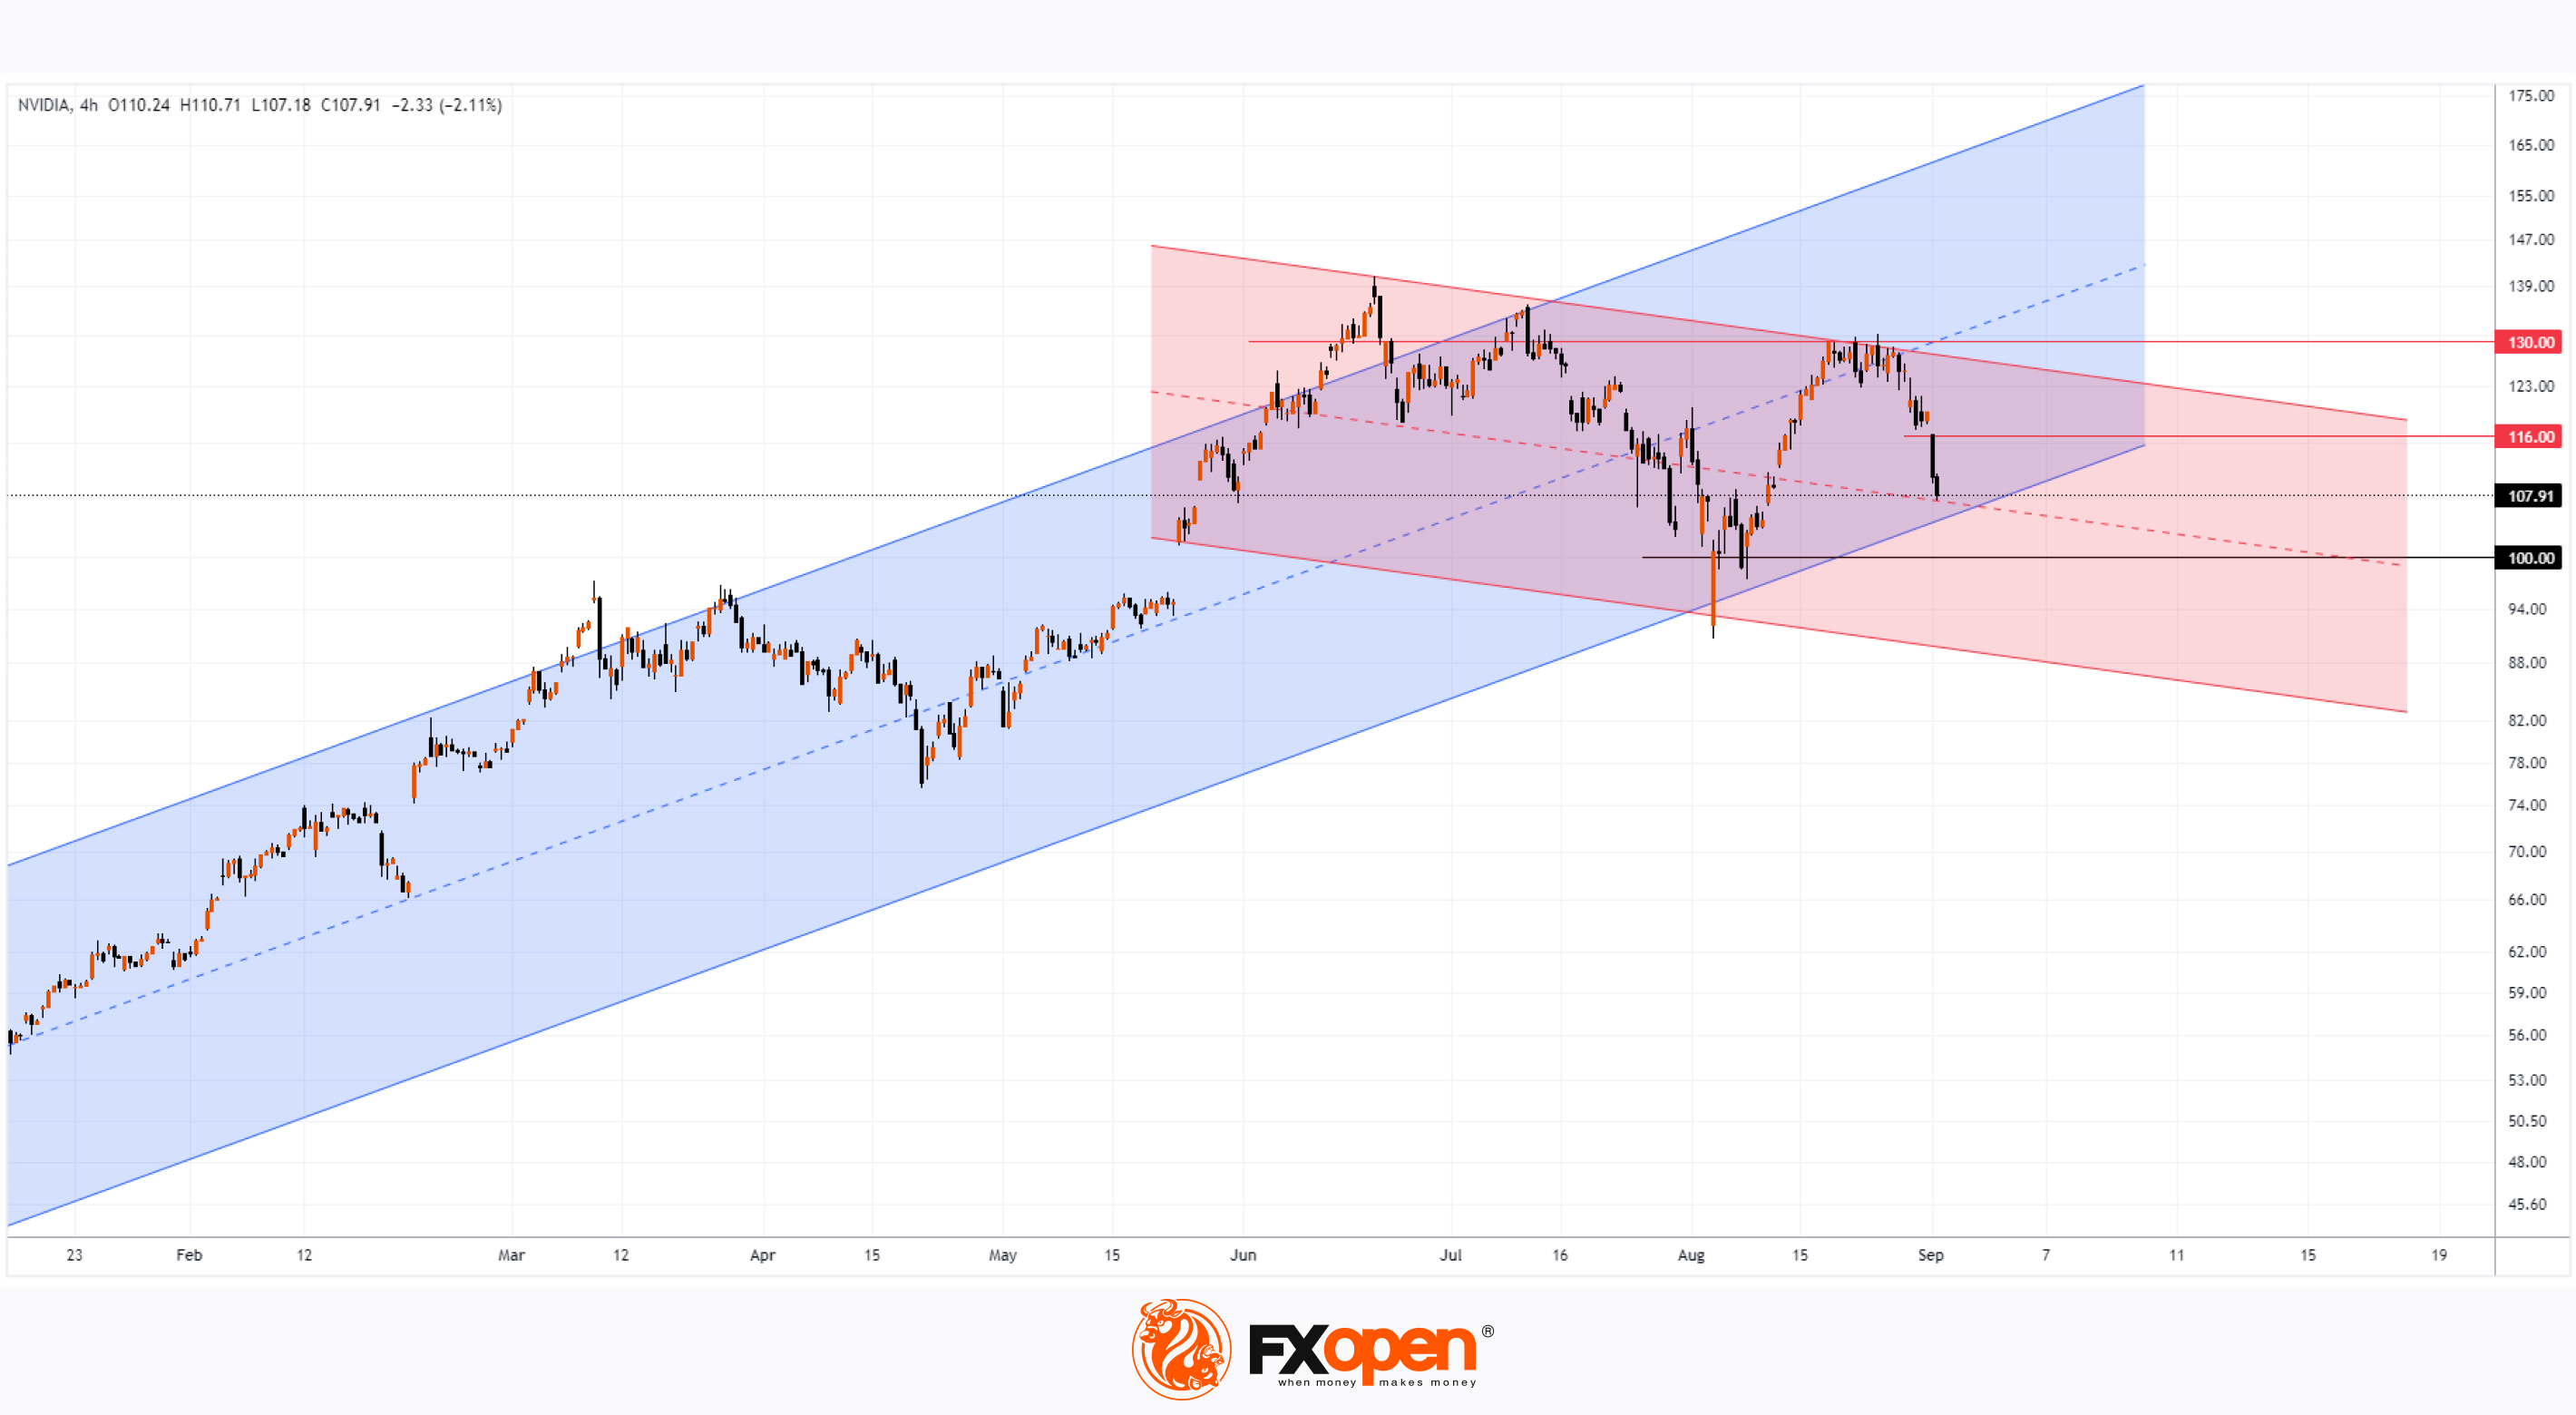
→ The price is forming an ascending channel (shown in blue) but has dropped to its lower boundary after the median line showed signs of resistance.
→ The bearish gap area around the $116 level could act as a resistance zone after the bears confirmed their control over the psychological $100 mark.
→ Alternatively, the outlines of a possible descending channel are shown in red. Today, NVDA's price is near its median line.
This suggests that the price might consolidate around the intersection of the blue channel's lower boundary and the red channel's median line.
Following this, it’s important to consider the least favorable scenario, where the descending channel takes precedence, implying a potential decline in NVDA's price below the psychological $100 level towards the lower boundary of the red channel.
Despite this, forecasts remain positive. Based on a Tipranks survey of 43 analysts, 39 recommend buying NVDA stock. Although the average price target for NVDA is $151.79 over the next 12 months, it's possible that these estimates may be revised down if the stock continues to underperform the market.
Trade global index CFDs with zero commission and tight spreads. Open your FXOpen account now or learn more about trading index CFDs with FXOpen.
CFDs are complex instruments and come with a high risk of losing your money.
This article represents the opinion of the Companies operating under the FXOpen brand only. It is not to be construed as an offer, solicitation, or recommendation with respect to products and services provided by the Companies operating under the FXOpen brand, nor is it to be considered financial advice.
Nvidia (NVDA) Shares Among the Biggest Losers
On July 31, US labour market data was released, which proved disappointing and contributed to a decline in the Nasdaq 100 index (US Tech 100 mini on FXOpen) by over 10% between August 1 and 5.
This heightens the importance of the upcoming labour market data release, scheduled for tomorrow (15:15-15:30 GMT+3). It seems that concerns are growing among market participants that the news could reveal further negative trends.
This could explain the sell-off that gripped the US stock market yesterday. The Nasdaq 100 index (US Tech 100 mini on FXOpen) dropped by more than 3%, with Nvidia (NVDA) shares losing over 9% of their value.
In the first half of 2024, NVDA was a growth leader, but now it is among the biggest decliners—a bearish signal that suggests the price decline could continue. If so, how significant could it be?
Technical analysis of Nvidia (NVDA) chart shows:
→ The price is forming an ascending channel (shown in blue) but has dropped to its lower boundary after the median line showed signs of resistance.
→ The bearish gap area around the $116 level could act as a resistance zone after the bears confirmed their control over the psychological $100 mark.
→ Alternatively, the outlines of a possible descending channel are shown in red. Today, NVDA's price is near its median line.
This suggests that the price might consolidate around the intersection of the blue channel's lower boundary and the red channel's median line.
Following this, it’s important to consider the least favorable scenario, where the descending channel takes precedence, implying a potential decline in NVDA's price below the psychological $100 level towards the lower boundary of the red channel.
Despite this, forecasts remain positive. Based on a Tipranks survey of 43 analysts, 39 recommend buying NVDA stock. Although the average price target for NVDA is $151.79 over the next 12 months, it's possible that these estimates may be revised down if the stock continues to underperform the market.
Trade global index CFDs with zero commission and tight spreads. Open your FXOpen account now or learn more about trading index CFDs with FXOpen.
CFDs are complex instruments and come with a high risk of losing your money.
This article represents the opinion of the Companies operating under the FXOpen brand only. It is not to be construed as an offer, solicitation, or recommendation with respect to products and services provided by the Companies operating under the FXOpen brand, nor is it to be considered financial advice.
👍2
#oilprices #brentoil #marketanalysis #MarketNews
Brent Crude Oil Price Hits Yearly Low
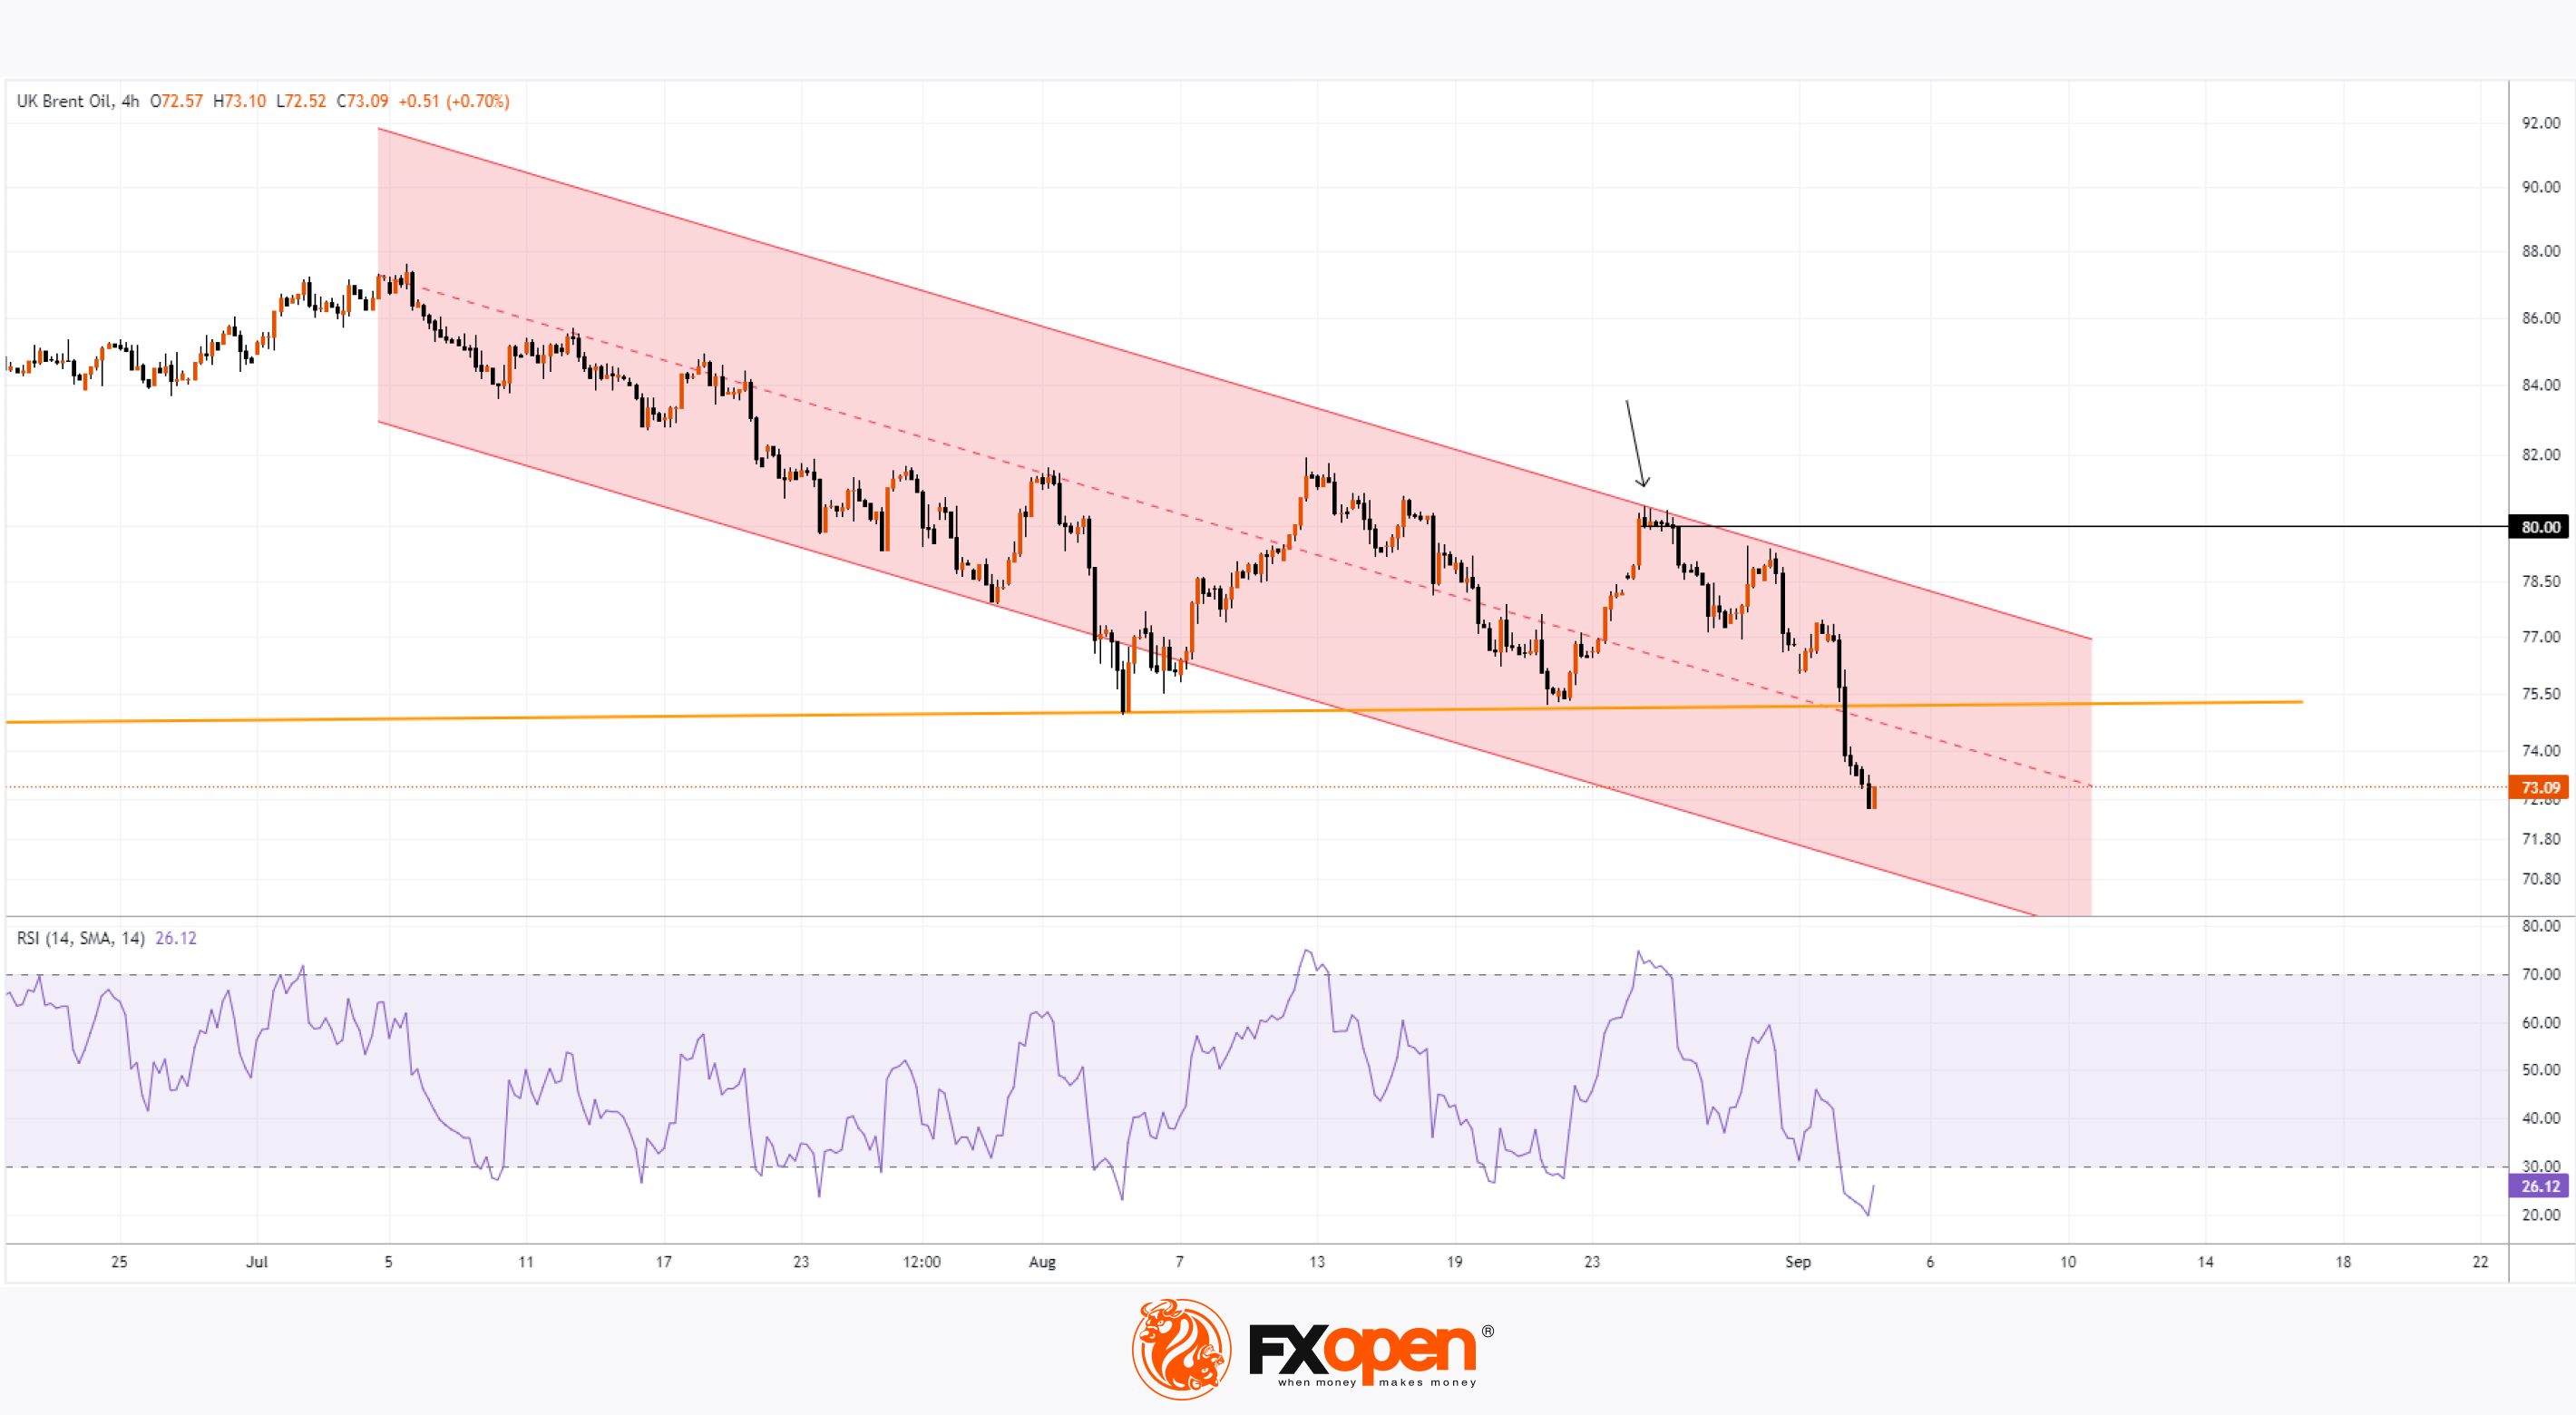
Analyzing the oil market on the XBR/USD chart from August 26, when Brent crude was trading around $79 per barrel, we observed the following:
→ The price was forming a descending channel (shown in red) and approaching its upper boundary, which could act as resistance.
→ We identified a key support level (shown in yellow).
→ We suggested that the bulls would need to prove their determination when facing a block of resistance around the $80 level.
Since then, Brent crude oil has:
→ Reversed downward, failing to hold above the $80 level, and continued to decline within the red channel.
→ Accelerated its decline, breaking through the key support around the $75 level.
Bearish sentiment was fueled by OPEC+ plans to increase oil production, signaling a shift away from production cuts aimed at maintaining higher prices.
Could Brent Crude Oil Continue to Decline?
From a technical analysis perspective, the XBR/USD chart today indicates that supply forces are asserting their dominance, as the price has fallen into the lower half of the red channel, with the RSI indicator entering oversold territory.
After a roughly 10% decline in Brent crude oil prices since last Monday, the prospect of an interim upward correction seems plausible.
However, given the above, a significant resistance block appears to be around the $74.50 area, where:
→ The median line of the red channel is located.
→ The yellow line, which served as support for several months, is likely to act as resistance after being breached.
In the worst-case scenario, Brent crude oil could drop to the lower boundary of the channel, approaching the psychological level of $70.
Start trading commodities with tight spreads. Open your trading account now or learn more about trading commodity CFDs with FXOpen.
CFDs are complex instruments and come with a high risk of losing your money.
This article represents the opinion of the Companies operating under the FXOpen brand only. It is not to be construed as an offer, solicitation, or recommendation with respect to products and services provided by the Companies operating under the FXOpen brand, nor is it to be considered financial advice.
Brent Crude Oil Price Hits Yearly Low
Analyzing the oil market on the XBR/USD chart from August 26, when Brent crude was trading around $79 per barrel, we observed the following:
→ The price was forming a descending channel (shown in red) and approaching its upper boundary, which could act as resistance.
→ We identified a key support level (shown in yellow).
→ We suggested that the bulls would need to prove their determination when facing a block of resistance around the $80 level.
Since then, Brent crude oil has:
→ Reversed downward, failing to hold above the $80 level, and continued to decline within the red channel.
→ Accelerated its decline, breaking through the key support around the $75 level.
Bearish sentiment was fueled by OPEC+ plans to increase oil production, signaling a shift away from production cuts aimed at maintaining higher prices.
Could Brent Crude Oil Continue to Decline?
From a technical analysis perspective, the XBR/USD chart today indicates that supply forces are asserting their dominance, as the price has fallen into the lower half of the red channel, with the RSI indicator entering oversold territory.
After a roughly 10% decline in Brent crude oil prices since last Monday, the prospect of an interim upward correction seems plausible.
However, given the above, a significant resistance block appears to be around the $74.50 area, where:
→ The median line of the red channel is located.
→ The yellow line, which served as support for several months, is likely to act as resistance after being breached.
In the worst-case scenario, Brent crude oil could drop to the lower boundary of the channel, approaching the psychological level of $70.
Start trading commodities with tight spreads. Open your trading account now or learn more about trading commodity CFDs with FXOpen.
CFDs are complex instruments and come with a high risk of losing your money.
This article represents the opinion of the Companies operating under the FXOpen brand only. It is not to be construed as an offer, solicitation, or recommendation with respect to products and services provided by the Companies operating under the FXOpen brand, nor is it to be considered financial advice.
👍2
#stockmarket #stocktrading #marketanalysis #MarketNews
Canopy Growth Corporation (CGC) Shares Drop Below $5
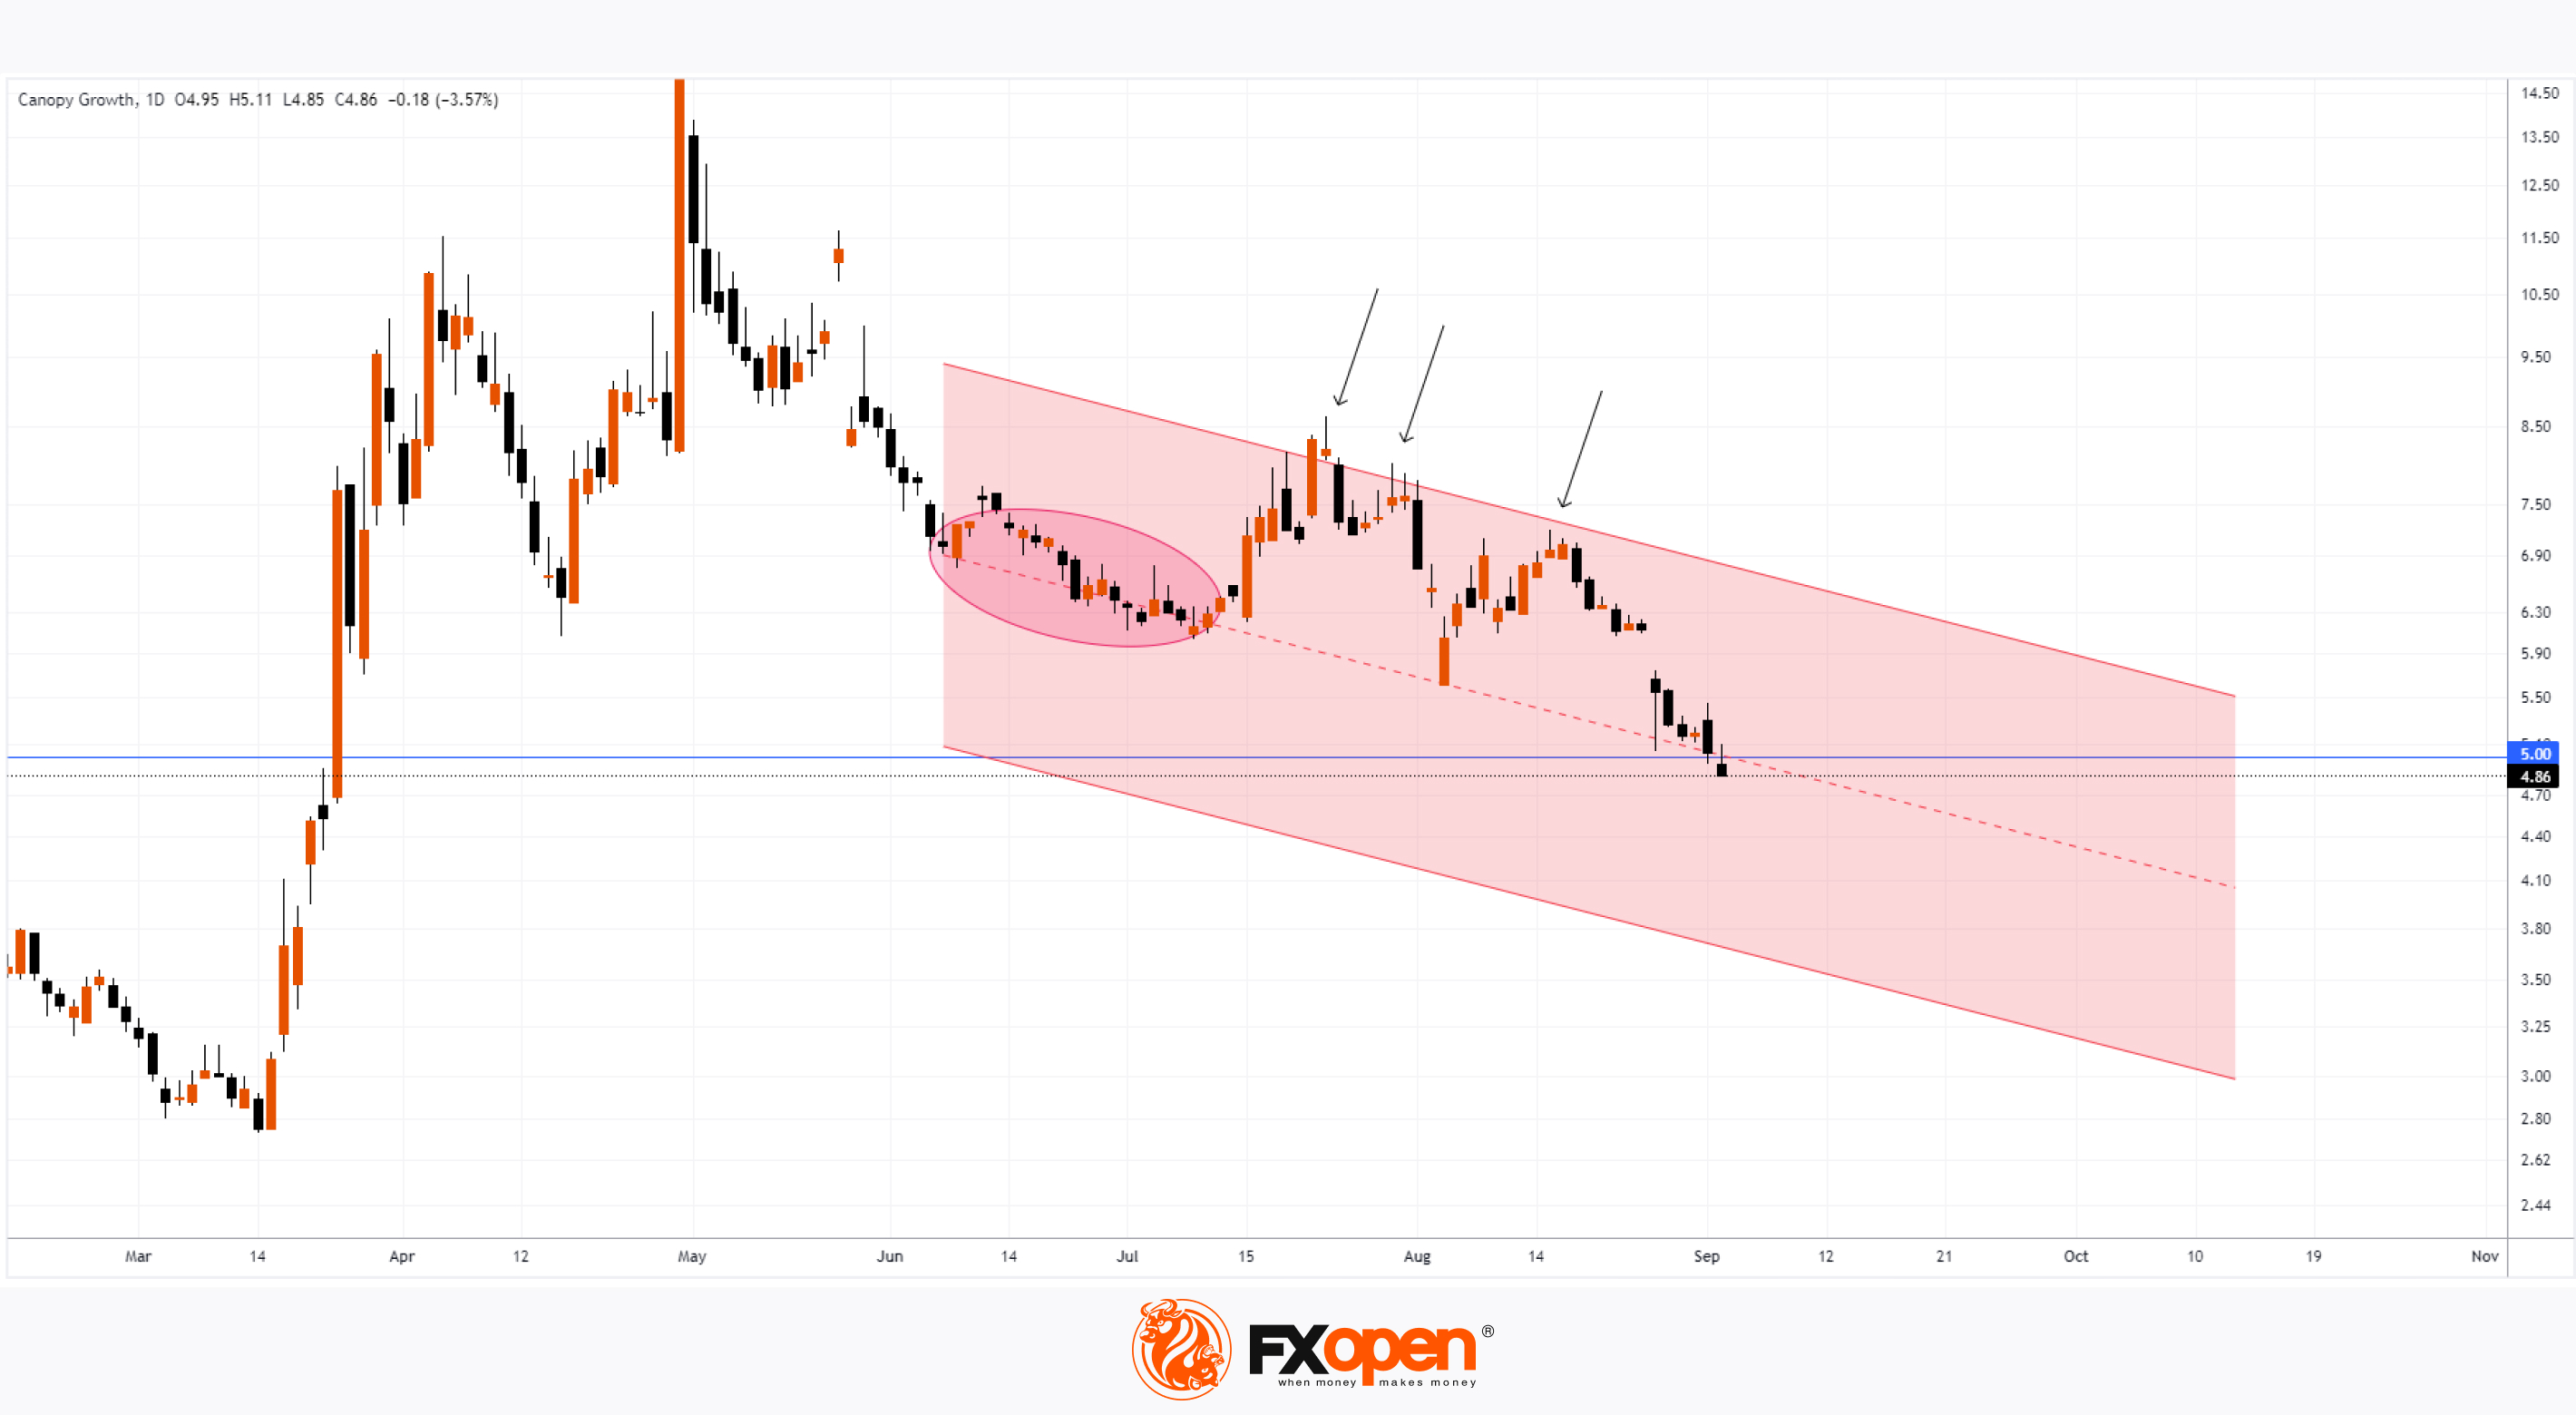
As the chart indicates, Canopy Growth Corporation (CGC) shares closed below $5 yesterday for the first time since late March 2024.
In the spring, the stock price of the cannabis production and distribution company surged amid expectations that the US Drug Enforcement Administration (DEA) might downgrade marijuana from a Schedule I to a Schedule III substance.
The decision was indeed made on 30 April, which saw CGC’s share price peak above $14, as investors anticipated that the move would:
→ accelerate the legalisation of marijuana for both medical and recreational use;
→ reduce penalties for illegal marijuana trade;
→ boost profits for companies like Canopy Growth Corporation.
However, the reality was different. The Q2 earnings report released on 9 August showed that Canopy Growth Corporation's (CGC) actual performance fell short of analysts' expectations. For instance, gross revenue was $48.3 million (compared to the forecast of $51.2 million and Q1 revenue of $53.7 million).
Despite favourable conditions, including a rising stock market in 2024, Canopy Growth Corporation's (CGC) shares have disappointed.
A technical analysis of the daily chart for Canopy Growth Corporation (CGC) shows that the stock is trading within a downward channel (marked in red), with the following observations:
→ Low volatility over the summer (highlighted by an oval) can be interpreted as buyers and sellers agreeing on the stock's fair value, which is typically seen near the median line.
→ Attempts at growth (indicated by arrows) encountered resistance from the upper boundary (marked with arrows) and were unsuccessful. It's possible that the next contact with the channel's boundary will occur on the lower side.
According to TipRanks, none of the analysts recommend buying CGC stock, although their average price target for CGC is $5.93 over the next 12 months – over 20% higher than current levels.
Trade global index CFDs with zero commission and tight spreads. Open your FXOpen account now or learn more about trading index CFDs with FXOpen.
CFDs are complex instruments and come with a high risk of losing your money.
This article represents the opinion of the Companies operating under the FXOpen brand only. It is not to be construed as an offer, solicitation, or recommendation with respect to products and services provided by the Companies operating under the FXOpen brand, nor is it to be considered financial advice.
Canopy Growth Corporation (CGC) Shares Drop Below $5
As the chart indicates, Canopy Growth Corporation (CGC) shares closed below $5 yesterday for the first time since late March 2024.
In the spring, the stock price of the cannabis production and distribution company surged amid expectations that the US Drug Enforcement Administration (DEA) might downgrade marijuana from a Schedule I to a Schedule III substance.
The decision was indeed made on 30 April, which saw CGC’s share price peak above $14, as investors anticipated that the move would:
→ accelerate the legalisation of marijuana for both medical and recreational use;
→ reduce penalties for illegal marijuana trade;
→ boost profits for companies like Canopy Growth Corporation.
However, the reality was different. The Q2 earnings report released on 9 August showed that Canopy Growth Corporation's (CGC) actual performance fell short of analysts' expectations. For instance, gross revenue was $48.3 million (compared to the forecast of $51.2 million and Q1 revenue of $53.7 million).
Despite favourable conditions, including a rising stock market in 2024, Canopy Growth Corporation's (CGC) shares have disappointed.
A technical analysis of the daily chart for Canopy Growth Corporation (CGC) shows that the stock is trading within a downward channel (marked in red), with the following observations:
→ Low volatility over the summer (highlighted by an oval) can be interpreted as buyers and sellers agreeing on the stock's fair value, which is typically seen near the median line.
→ Attempts at growth (indicated by arrows) encountered resistance from the upper boundary (marked with arrows) and were unsuccessful. It's possible that the next contact with the channel's boundary will occur on the lower side.
According to TipRanks, none of the analysts recommend buying CGC stock, although their average price target for CGC is $5.93 over the next 12 months – over 20% higher than current levels.
Trade global index CFDs with zero commission and tight spreads. Open your FXOpen account now or learn more about trading index CFDs with FXOpen.
CFDs are complex instruments and come with a high risk of losing your money.
This article represents the opinion of the Companies operating under the FXOpen brand only. It is not to be construed as an offer, solicitation, or recommendation with respect to products and services provided by the Companies operating under the FXOpen brand, nor is it to be considered financial advice.
👍2
#usdcad #marketanalysis #MarketNews
Analysis of USD/CAD: Bank of Canada Cuts Interest Rate
Yesterday, the Bank of Canada reduced its key interest rate by 25 basis points to 4.25%. Its governor, Tiff Macklem, cited weak economic growth and suggested that a more substantial rate cut could be considered in the future.
While the rate cut was widely expected, the currency market reacted with a surge in volatility. For instance, on the USD/CAD chart:
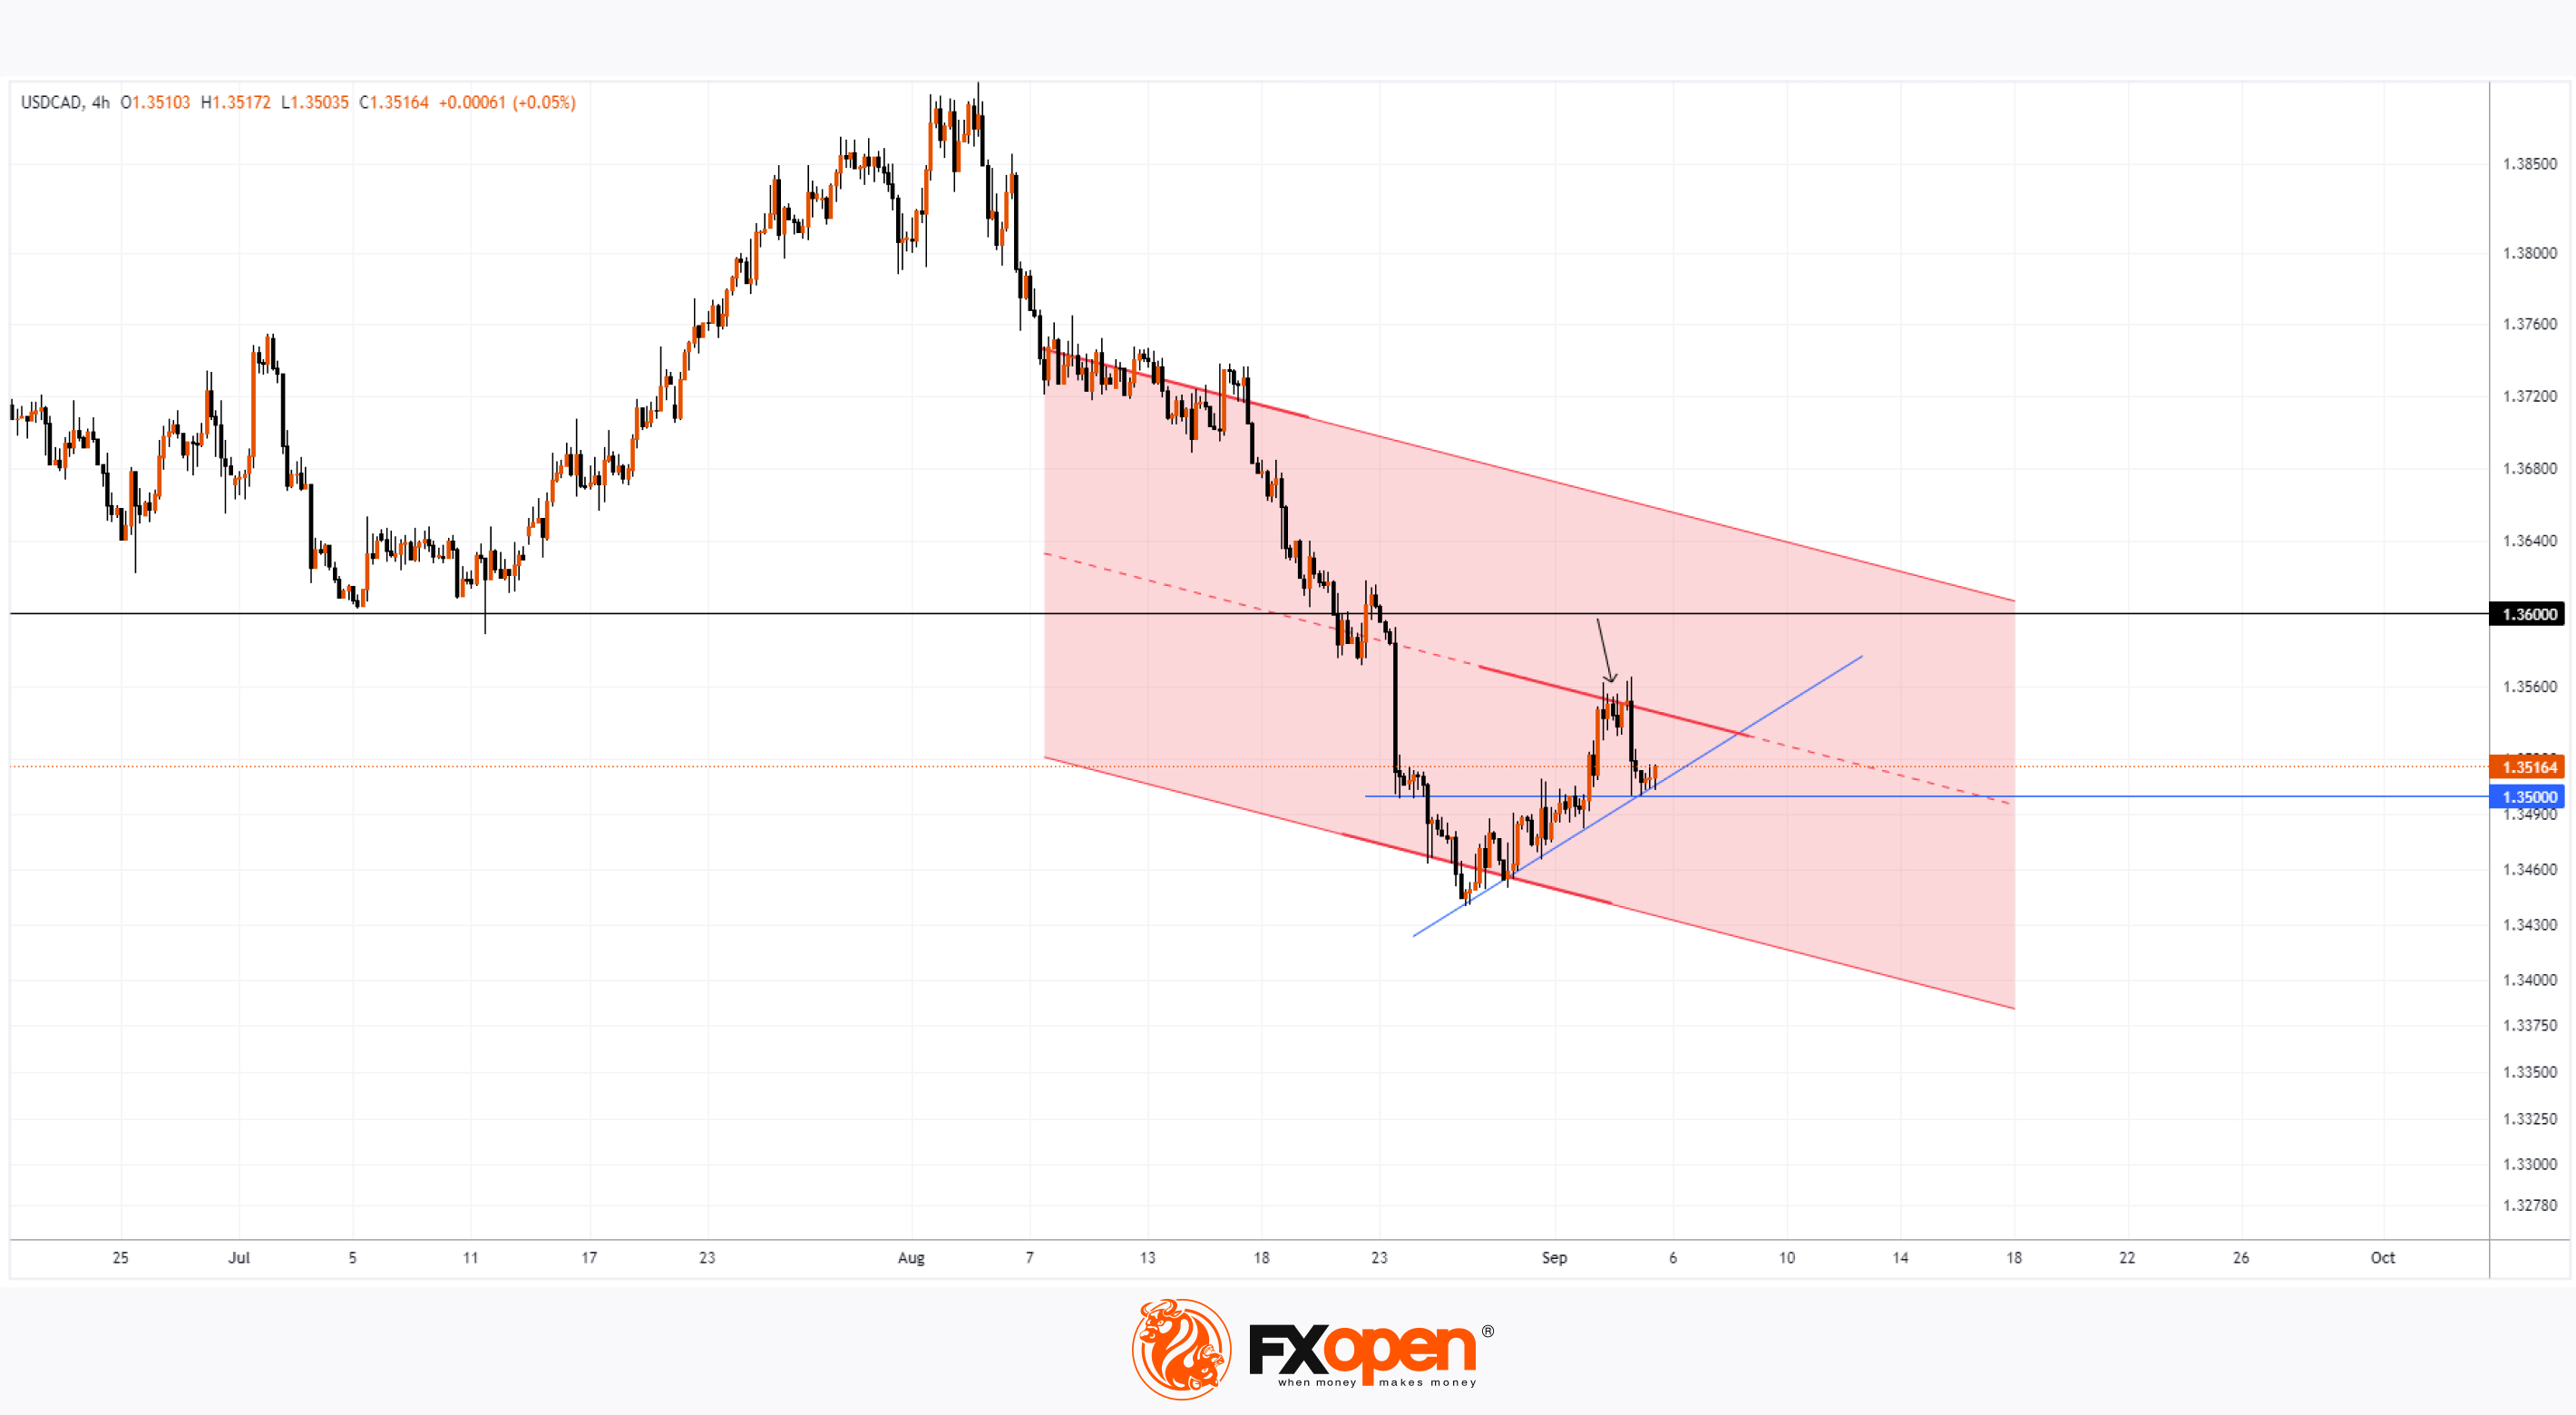
→ On 3 September, ahead of the decision, the USD/CAD rate was climbing;
→ On 4 September, immediately after the announcement, the rate dropped sharply.
What could be the outlook for the exchange rate, which has fallen by approximately 3% from early August to the end of the month, breaking key resistance at 1.3600?
A technical analysis of the USD/CAD chart shows that the rate is best described by a downward red channel. The median line of this channel acted as resistance (shown by an arrow) earlier this week, pushing the rate towards the trendline (in blue), which had supported the rise from the lower boundary of the red channel. This support is further reinforced by the 1.3500 level.
It is therefore reasonable to assume that the market is reaching a temporary balance between buyers and sellers, leading to fluctuations in the USD/CAD rate between the red median line and the 1.3500 level. However, traders should remain cautious of a potential resurgence in bearish pressure, which dominated throughout August, as the 1.3500 level could again act as resistance.
Trade over 50 forex markets 24 hours a day with FXOpen. Take advantage of low commissions, deep liquidity, and spreads from 0.0 pips. Open your FXOpen account now or learn more about trading forex with FXOpen.
CFDs are complex instruments and come with a high risk of losing your money.
This article represents the opinion of the Companies operating under the FXOpen brand only. It is not to be construed as an offer, solicitation, or recommendation with respect to products and services provided by the Companies operating under the FXOpen brand, nor is it to be considered financial advice.
Analysis of USD/CAD: Bank of Canada Cuts Interest Rate
Yesterday, the Bank of Canada reduced its key interest rate by 25 basis points to 4.25%. Its governor, Tiff Macklem, cited weak economic growth and suggested that a more substantial rate cut could be considered in the future.
While the rate cut was widely expected, the currency market reacted with a surge in volatility. For instance, on the USD/CAD chart:
→ On 3 September, ahead of the decision, the USD/CAD rate was climbing;
→ On 4 September, immediately after the announcement, the rate dropped sharply.
What could be the outlook for the exchange rate, which has fallen by approximately 3% from early August to the end of the month, breaking key resistance at 1.3600?
A technical analysis of the USD/CAD chart shows that the rate is best described by a downward red channel. The median line of this channel acted as resistance (shown by an arrow) earlier this week, pushing the rate towards the trendline (in blue), which had supported the rise from the lower boundary of the red channel. This support is further reinforced by the 1.3500 level.
It is therefore reasonable to assume that the market is reaching a temporary balance between buyers and sellers, leading to fluctuations in the USD/CAD rate between the red median line and the 1.3500 level. However, traders should remain cautious of a potential resurgence in bearish pressure, which dominated throughout August, as the 1.3500 level could again act as resistance.
Trade over 50 forex markets 24 hours a day with FXOpen. Take advantage of low commissions, deep liquidity, and spreads from 0.0 pips. Open your FXOpen account now or learn more about trading forex with FXOpen.
CFDs are complex instruments and come with a high risk of losing your money.
This article represents the opinion of the Companies operating under the FXOpen brand only. It is not to be construed as an offer, solicitation, or recommendation with respect to products and services provided by the Companies operating under the FXOpen brand, nor is it to be considered financial advice.
👍2
#marketanalysis #MarketNews #goldprice #XAUUSD
Analysis of XAU/USD: Gold Price Holds Near Key Resistance
As shown on the XAU/USD chart today, the price of gold is:
→ above the psychological level of $2,500 per ounce;
→ near a key resistance marked by a red line labelled Support 2. This line has been preventing further price growth several times since 20 August, when the all-time high was reached.
If the bulls manage to break through this line, it could turn into a support level, as happened with Support 1 (as indicated by arrows). This would set the stage for a potential rally within the upward channel, marked in blue. From a technical analysis perspective, a break above the “bull flag” pattern could signal a resumption of the uptrend.
On the other hand, we can't rule out the possibility of a price reversal at Support 2. In this case, the chart could start to form a bearish “triple top” pattern from a technical standpoint.
Which scenario – bullish or bearish – will play out? Much depends on the fundamentals. Today at 15:30 GMT+3, US labour market data will be released, which is likely to have a strong impact on financial markets due to the upcoming Federal Reserve meeting, where a rate cut is expected.
Disappointing data on unemployment and job creation could indicate issues in the US economy and lead to a rise in gold prices, as gold is seen as a safe-haven asset during times of geopolitical tension and economic uncertainty.
Start trading commodities with tight spreads. Open your trading account now or learn more about trading commodity CFDs with FXOpen.
CFDs are complex instruments and come with a high risk of losing your money.
This article represents the opinion of the Companies operating under the FXOpen brand only. It is not to be construed as an offer, solicitation, or recommendation with respect to products and services provided by the Companies operating under the FXOpen brand, nor is it to be considered financial advice.
Analysis of XAU/USD: Gold Price Holds Near Key Resistance
As shown on the XAU/USD chart today, the price of gold is:
→ above the psychological level of $2,500 per ounce;
→ near a key resistance marked by a red line labelled Support 2. This line has been preventing further price growth several times since 20 August, when the all-time high was reached.
If the bulls manage to break through this line, it could turn into a support level, as happened with Support 1 (as indicated by arrows). This would set the stage for a potential rally within the upward channel, marked in blue. From a technical analysis perspective, a break above the “bull flag” pattern could signal a resumption of the uptrend.
On the other hand, we can't rule out the possibility of a price reversal at Support 2. In this case, the chart could start to form a bearish “triple top” pattern from a technical standpoint.
Which scenario – bullish or bearish – will play out? Much depends on the fundamentals. Today at 15:30 GMT+3, US labour market data will be released, which is likely to have a strong impact on financial markets due to the upcoming Federal Reserve meeting, where a rate cut is expected.
Disappointing data on unemployment and job creation could indicate issues in the US economy and lead to a rise in gold prices, as gold is seen as a safe-haven asset during times of geopolitical tension and economic uncertainty.
Start trading commodities with tight spreads. Open your trading account now or learn more about trading commodity CFDs with FXOpen.
CFDs are complex instruments and come with a high risk of losing your money.
This article represents the opinion of the Companies operating under the FXOpen brand only. It is not to be construed as an offer, solicitation, or recommendation with respect to products and services provided by the Companies operating under the FXOpen brand, nor is it to be considered financial advice.

👍2
#stockmarket #marketanalysis #MarketNews #stocktrading
NIO Stock Price Surges by 14%
On 23 August, while analysing the chart of Chinese automaker NIO, we noted that:
→ For months, the price has been forming a downward channel (shown in red), driven by the company’s inability to turn a profit, with the $4.25 level acting as resistance.
→ Investors may hold out for positive shifts in the fundamentals, as for the first time in the company's history, monthly vehicle deliveries have remained above 20,000.
Indeed, the company’s second-quarter report released yesterday brought pleasant surprises, including reduced losses, a 98.9% year-on-year revenue increase, and improved gross profit margins.
Experts are revising their forecasts, with Deutsche Bank analysts raising their target price for NIO shares, anticipating that the company will sell over 60,000 vehicles in the third quarter.
The market reacted with a sharp price increase – NIO stock surged by 14%.
From a technical analysis perspective of the NIO stock chart:
→ The $3.70 level prevented the price from falling to new year-to-date lows;
→ The upper line of the downward channel was broken – now the bulls need to consolidate above this channel to render it irrelevant;
→ On the back of the positive report, the price broke through the $4.25 resistance level, which is now expected to act as support.
It’s possible that NIO’s stock price could follow a bullish trajectory, making the upward channel (shown in blue) increasingly relevant.
Trade global index CFDs with zero commission and tight spreads. Open your FXOpen account now or learn more about trading index CFDs with FXOpen.
CFDs are complex instruments and come with a high risk of losing your money.
This article represents the opinion of the Companies operating under the FXOpen brand only. It is not to be construed as an offer, solicitation, or recommendation with respect to products and services provided by the Companies operating under the FXOpen brand, nor is it to be considered financial advice.
NIO Stock Price Surges by 14%
On 23 August, while analysing the chart of Chinese automaker NIO, we noted that:
→ For months, the price has been forming a downward channel (shown in red), driven by the company’s inability to turn a profit, with the $4.25 level acting as resistance.
→ Investors may hold out for positive shifts in the fundamentals, as for the first time in the company's history, monthly vehicle deliveries have remained above 20,000.
Indeed, the company’s second-quarter report released yesterday brought pleasant surprises, including reduced losses, a 98.9% year-on-year revenue increase, and improved gross profit margins.
Experts are revising their forecasts, with Deutsche Bank analysts raising their target price for NIO shares, anticipating that the company will sell over 60,000 vehicles in the third quarter.
The market reacted with a sharp price increase – NIO stock surged by 14%.
From a technical analysis perspective of the NIO stock chart:
→ The $3.70 level prevented the price from falling to new year-to-date lows;
→ The upper line of the downward channel was broken – now the bulls need to consolidate above this channel to render it irrelevant;
→ On the back of the positive report, the price broke through the $4.25 resistance level, which is now expected to act as support.
It’s possible that NIO’s stock price could follow a bullish trajectory, making the upward channel (shown in blue) increasingly relevant.
Trade global index CFDs with zero commission and tight spreads. Open your FXOpen account now or learn more about trading index CFDs with FXOpen.
CFDs are complex instruments and come with a high risk of losing your money.
This article represents the opinion of the Companies operating under the FXOpen brand only. It is not to be construed as an offer, solicitation, or recommendation with respect to products and services provided by the Companies operating under the FXOpen brand, nor is it to be considered financial advice.

👍2
#EURUSD #marketanalysis #MarketNews
EUR/USD Falls After US Labour Market Data
On Friday, key employment data from the US was released, which proved somewhat mixed.
On the one hand, the increase in jobs fell short of expectations. According to ForexFactory, the Non-Farm Employment Change figures were:
→ actual = 142K;
→ expected = 164K;
→ previous month = 89K.
On the other hand, the unemployment rate dropped from 4.3% to 4.2%.
Thus, the economic data showed that the US labour market is slowing down, but not at a rate that would raise significant concerns about US economic growth prospects (as it did after last month's reports).
Friday’s release of US labour market news sparked volatility, and its impact is likely to be felt today, including on the EUR/USD rate.
On 29 August, we wrote that:
→ a bearish head and shoulders (H&S) pattern had formed on the chart;
→ the price broke through the rising trendline (shown in yellow);
→ the target for the decline could be the 1.10415 level.
Since then, the price reached the target (shown by the arrow) before reversing upwards. However, on Monday morning, the US dollar is strengthening against other currencies, with the EUR/USD rate dropping below Friday’s low and signalling the possibility of another test of the 1.10415 level.
Technical analysis of the EUR/USD chart shows that the H&S pattern acted as a resistance zone on Friday, indicating that the bears are gaining confidence. It is possible that further strengthening of the US dollar could lead to the rate reaching the median line of the blue ascending channel.
Trade over 50 forex markets 24 hours a day with FXOpen. Take advantage of low commissions, deep liquidity, and spreads from 0.0 pips. Open your FXOpen account now or learn more about trading forex with FXOpen.
CFDs are complex instruments and come with a high risk of losing your money.
This article represents the opinion of the Companies operating under the FXOpen brand only. It is not to be construed as an offer, solicitation, or recommendation with respect to products and services provided by the Companies operating under the FXOpen brand, nor is it to be considered financial advice.
EUR/USD Falls After US Labour Market Data
On Friday, key employment data from the US was released, which proved somewhat mixed.
On the one hand, the increase in jobs fell short of expectations. According to ForexFactory, the Non-Farm Employment Change figures were:
→ actual = 142K;
→ expected = 164K;
→ previous month = 89K.
On the other hand, the unemployment rate dropped from 4.3% to 4.2%.
Thus, the economic data showed that the US labour market is slowing down, but not at a rate that would raise significant concerns about US economic growth prospects (as it did after last month's reports).
Friday’s release of US labour market news sparked volatility, and its impact is likely to be felt today, including on the EUR/USD rate.
On 29 August, we wrote that:
→ a bearish head and shoulders (H&S) pattern had formed on the chart;
→ the price broke through the rising trendline (shown in yellow);
→ the target for the decline could be the 1.10415 level.
Since then, the price reached the target (shown by the arrow) before reversing upwards. However, on Monday morning, the US dollar is strengthening against other currencies, with the EUR/USD rate dropping below Friday’s low and signalling the possibility of another test of the 1.10415 level.
Technical analysis of the EUR/USD chart shows that the H&S pattern acted as a resistance zone on Friday, indicating that the bears are gaining confidence. It is possible that further strengthening of the US dollar could lead to the rate reaching the median line of the blue ascending channel.
Trade over 50 forex markets 24 hours a day with FXOpen. Take advantage of low commissions, deep liquidity, and spreads from 0.0 pips. Open your FXOpen account now or learn more about trading forex with FXOpen.
CFDs are complex instruments and come with a high risk of losing your money.
This article represents the opinion of the Companies operating under the FXOpen brand only. It is not to be construed as an offer, solicitation, or recommendation with respect to products and services provided by the Companies operating under the FXOpen brand, nor is it to be considered financial advice.
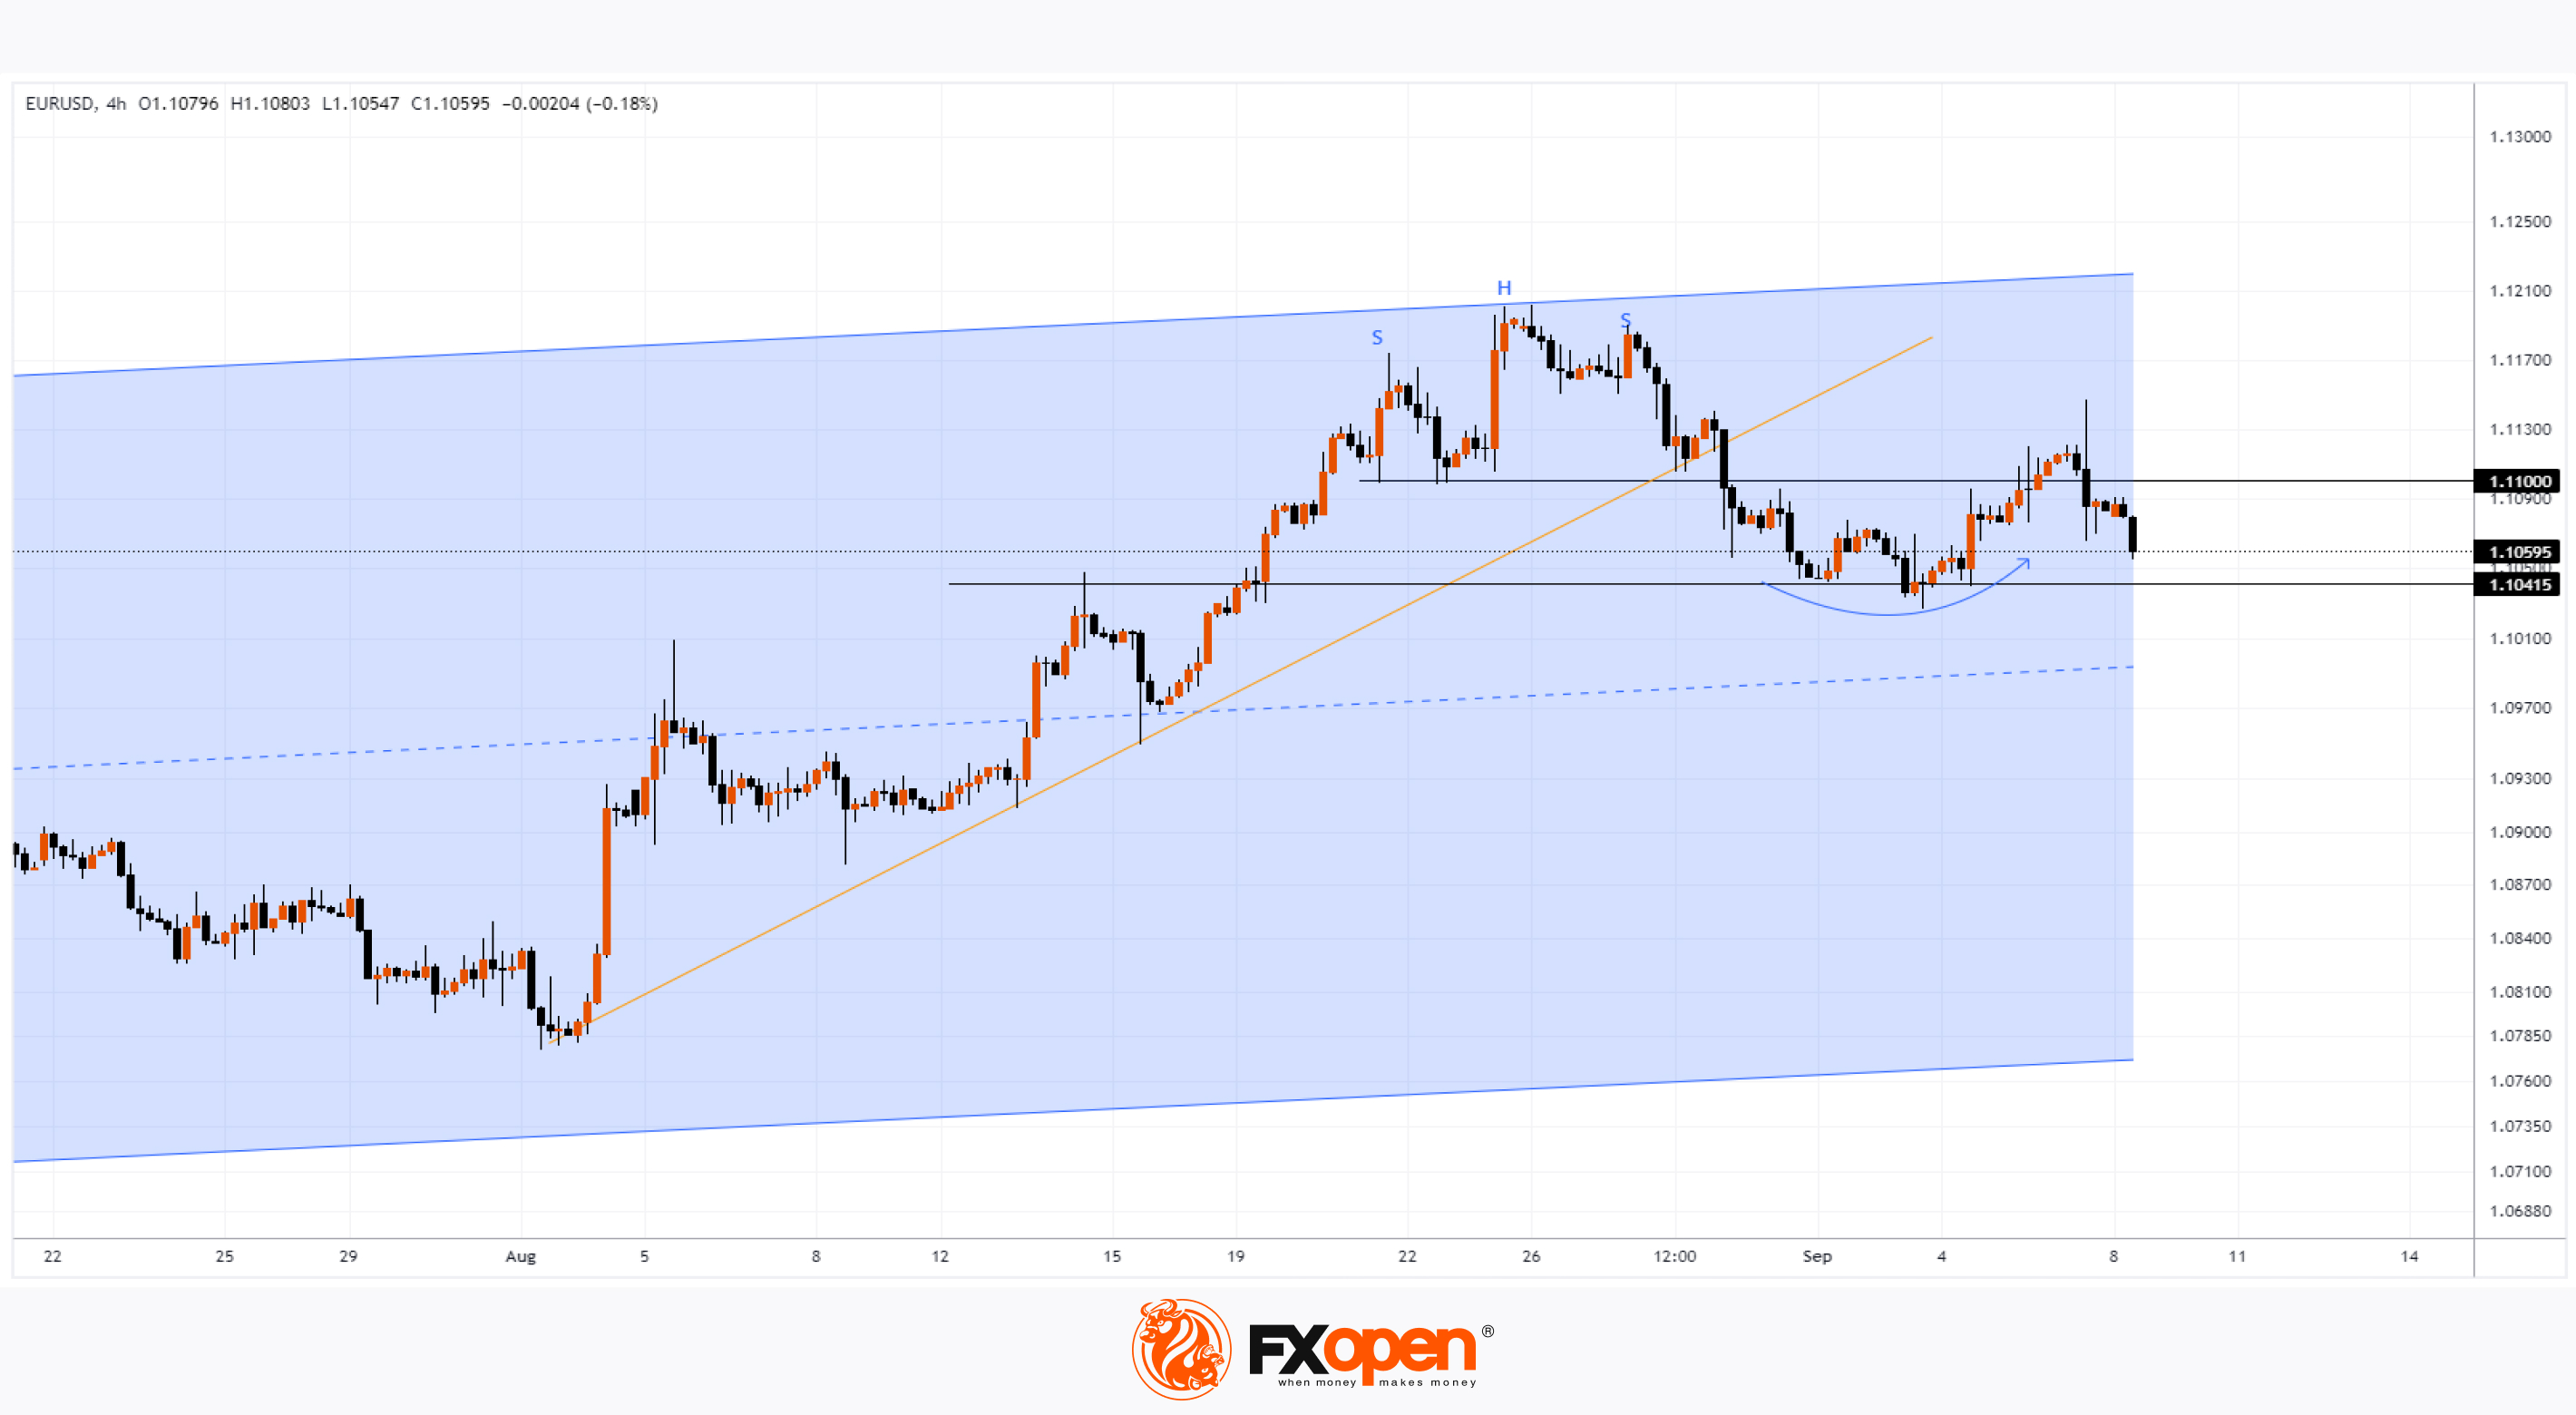
👍2
#GBPUSD #marketanalysis #MarketNews #forextrading
Analysis of GBP/USD Today: Bulls Face Challenges
UK labour market data was released today.
According to Dow Jones Newswires:
→ Employment growth exceeded expectations, and unemployment benefit claims came in lower than forecast. ING analysts believe this supports the view that the Bank of England will cut interest rates more cautiously compared to the Federal Reserve.
→ Capital Economics analysts also suggest that the Bank of England is unlikely to lower rates for a second consecutive month at next week’s policy meeting.
The initial reaction to the positive UK labour market news was a bullish impulse for the pound, with GBP/USD rising from around 1.3080 to break above 1.3100 shortly after the release.
However, the pair then retraced towards its “initial levels,” indicating that bulls are struggling to capitalise on the strong data. This could also signal the dominance of bears.
Technical analysis of GBP/USD today points to further bearish signals:
→ The price failed to stay above the previous high around 1.314.
→ A bearish engulfing pattern at the market’s peak (as shown by the first red arrow).
→ A long upper wick on the 6 September candlestick (as indicated by the second red arrow).
Bulls may find support (shown by the blue arrow) from the median of the linear regression channel (in blue). But is this enough to prevent GBP/USD from continuing the downward trend seen since late August and falling towards the channel’s lower boundary?
Much will depend on tomorrow's US inflation data. The Consumer Price Index (CPI) figures will be released at 15:30 GMT+3.
Trade over 50 forex markets 24 hours a day with FXOpen. Take advantage of low commissions, deep liquidity, and spreads from 0.0 pips. Open your FXOpen account now or learn more about trading forex with FXOpen.
CFDs are complex instruments and come with a high risk of losing your money.
This article represents the opinion of the Companies operating under the FXOpen brand only. It is not to be construed as an offer, solicitation, or recommendation with respect to products and services provided by the Companies operating under the FXOpen brand, nor is it to be considered financial advice.
Analysis of GBP/USD Today: Bulls Face Challenges
UK labour market data was released today.
According to Dow Jones Newswires:
→ Employment growth exceeded expectations, and unemployment benefit claims came in lower than forecast. ING analysts believe this supports the view that the Bank of England will cut interest rates more cautiously compared to the Federal Reserve.
→ Capital Economics analysts also suggest that the Bank of England is unlikely to lower rates for a second consecutive month at next week’s policy meeting.
The initial reaction to the positive UK labour market news was a bullish impulse for the pound, with GBP/USD rising from around 1.3080 to break above 1.3100 shortly after the release.
However, the pair then retraced towards its “initial levels,” indicating that bulls are struggling to capitalise on the strong data. This could also signal the dominance of bears.
Technical analysis of GBP/USD today points to further bearish signals:
→ The price failed to stay above the previous high around 1.314.
→ A bearish engulfing pattern at the market’s peak (as shown by the first red arrow).
→ A long upper wick on the 6 September candlestick (as indicated by the second red arrow).
Bulls may find support (shown by the blue arrow) from the median of the linear regression channel (in blue). But is this enough to prevent GBP/USD from continuing the downward trend seen since late August and falling towards the channel’s lower boundary?
Much will depend on tomorrow's US inflation data. The Consumer Price Index (CPI) figures will be released at 15:30 GMT+3.
Trade over 50 forex markets 24 hours a day with FXOpen. Take advantage of low commissions, deep liquidity, and spreads from 0.0 pips. Open your FXOpen account now or learn more about trading forex with FXOpen.
CFDs are complex instruments and come with a high risk of losing your money.
This article represents the opinion of the Companies operating under the FXOpen brand only. It is not to be construed as an offer, solicitation, or recommendation with respect to products and services provided by the Companies operating under the FXOpen brand, nor is it to be considered financial advice.
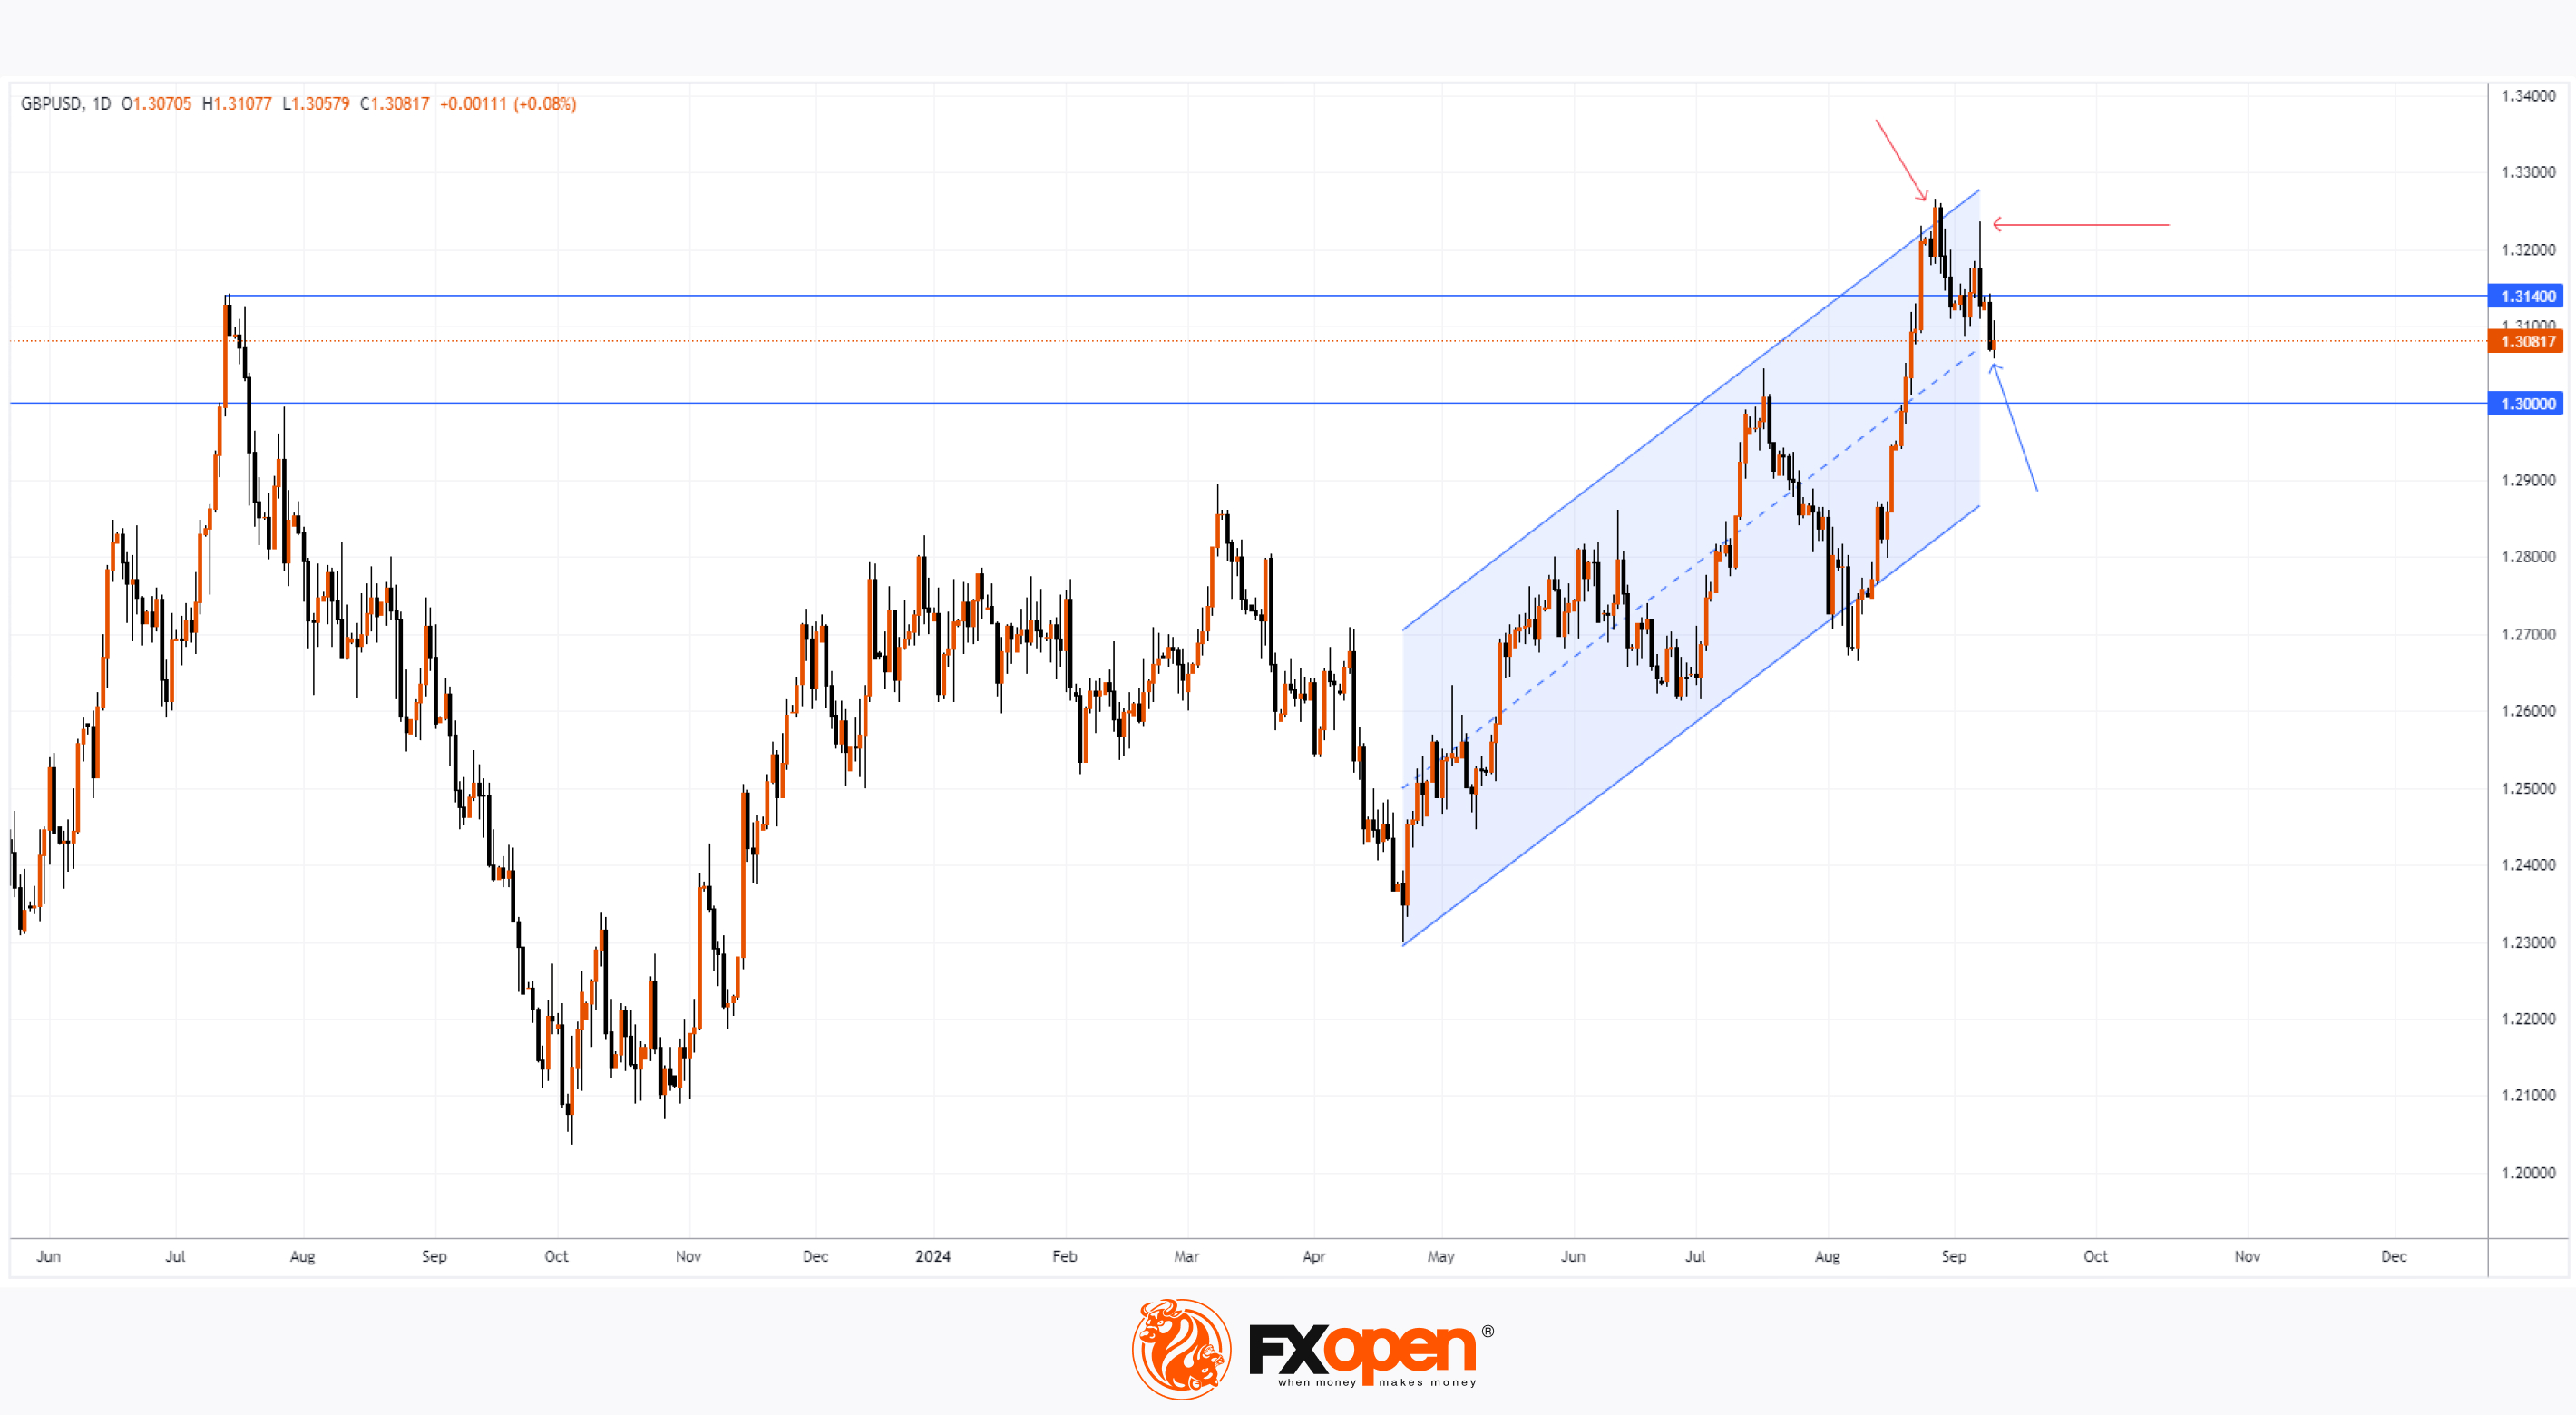
👍2
#marketanalysis #stockmarket #stocktrading #MarketNews
Alphabet Inc. (GOOGL) Shares Drop to Almost Six-Month Low
Alphabet Inc. (GOOGL) shares closed below $150 yesterday, a level last seen in late March this year.
According to Barron’s, the stock is under pressure due to ongoing litigation with the US Department of Justice (DOJ), which:
→ claims Google holds a monopoly over software used for buying and selling digital ads, alleging the company uses its size to stifle competition.
→ argues that Google employed unlawful methods to block rival ad technologies, forcing advertisers and publishers to use its systems.
The DOJ suggests that Google should divest a product called Ad Manager.
Google, however, maintains that the digital advertising market is more competitive than ever, and the government's arguments don’t reflect the current state of affairs. The company asserts that its case involves website ads, while most of the advertising industry has shifted to apps, social media, and Smart TVs.
As the case proceeds, it may act as a bearish factor for Alphabet’s stock price. Technical analysis of GOOGL shares today shows:
→ Since May last year, long-term price movement has formed an upward linear regression channel (blue), with the current price dropping below the channel’s lower boundary and the RSI indicator entering the oversold zone for the second time this year.
→ Short-term price movement since late April 2024 forms a downward linear regression channel (red), with the median line acting as resistance (indicated by the red arrow) – a bearish signal.
Potential support levels for GOOGL shares include:
→ The psychological $150 level.
→ A bullish gap zone around $146.
→ The lower boundary of the red channel.
Given this, it’s reasonable to expect GOOGL’s stock price may recover in the coming days from these support levels, especially if there are signs the trial could conclude in Alphabet Inc.'s favour.
Trade global index CFDs with zero commission and tight spreads. Open your FXOpen account now or learn more about trading index CFDs with FXOpen.
CFDs are complex instruments and come with a high risk of losing your money.
This article represents the opinion of the Companies operating under the FXOpen brand only. It is not to be construed as an offer, solicitation, or recommendation with respect to products and services provided by the Companies operating under the FXOpen brand, nor is it to be considered financial advice.
Alphabet Inc. (GOOGL) Shares Drop to Almost Six-Month Low
Alphabet Inc. (GOOGL) shares closed below $150 yesterday, a level last seen in late March this year.
According to Barron’s, the stock is under pressure due to ongoing litigation with the US Department of Justice (DOJ), which:
→ claims Google holds a monopoly over software used for buying and selling digital ads, alleging the company uses its size to stifle competition.
→ argues that Google employed unlawful methods to block rival ad technologies, forcing advertisers and publishers to use its systems.
The DOJ suggests that Google should divest a product called Ad Manager.
Google, however, maintains that the digital advertising market is more competitive than ever, and the government's arguments don’t reflect the current state of affairs. The company asserts that its case involves website ads, while most of the advertising industry has shifted to apps, social media, and Smart TVs.
As the case proceeds, it may act as a bearish factor for Alphabet’s stock price. Technical analysis of GOOGL shares today shows:
→ Since May last year, long-term price movement has formed an upward linear regression channel (blue), with the current price dropping below the channel’s lower boundary and the RSI indicator entering the oversold zone for the second time this year.
→ Short-term price movement since late April 2024 forms a downward linear regression channel (red), with the median line acting as resistance (indicated by the red arrow) – a bearish signal.
Potential support levels for GOOGL shares include:
→ The psychological $150 level.
→ A bullish gap zone around $146.
→ The lower boundary of the red channel.
Given this, it’s reasonable to expect GOOGL’s stock price may recover in the coming days from these support levels, especially if there are signs the trial could conclude in Alphabet Inc.'s favour.
Trade global index CFDs with zero commission and tight spreads. Open your FXOpen account now or learn more about trading index CFDs with FXOpen.
CFDs are complex instruments and come with a high risk of losing your money.
This article represents the opinion of the Companies operating under the FXOpen brand only. It is not to be construed as an offer, solicitation, or recommendation with respect to products and services provided by the Companies operating under the FXOpen brand, nor is it to be considered financial advice.
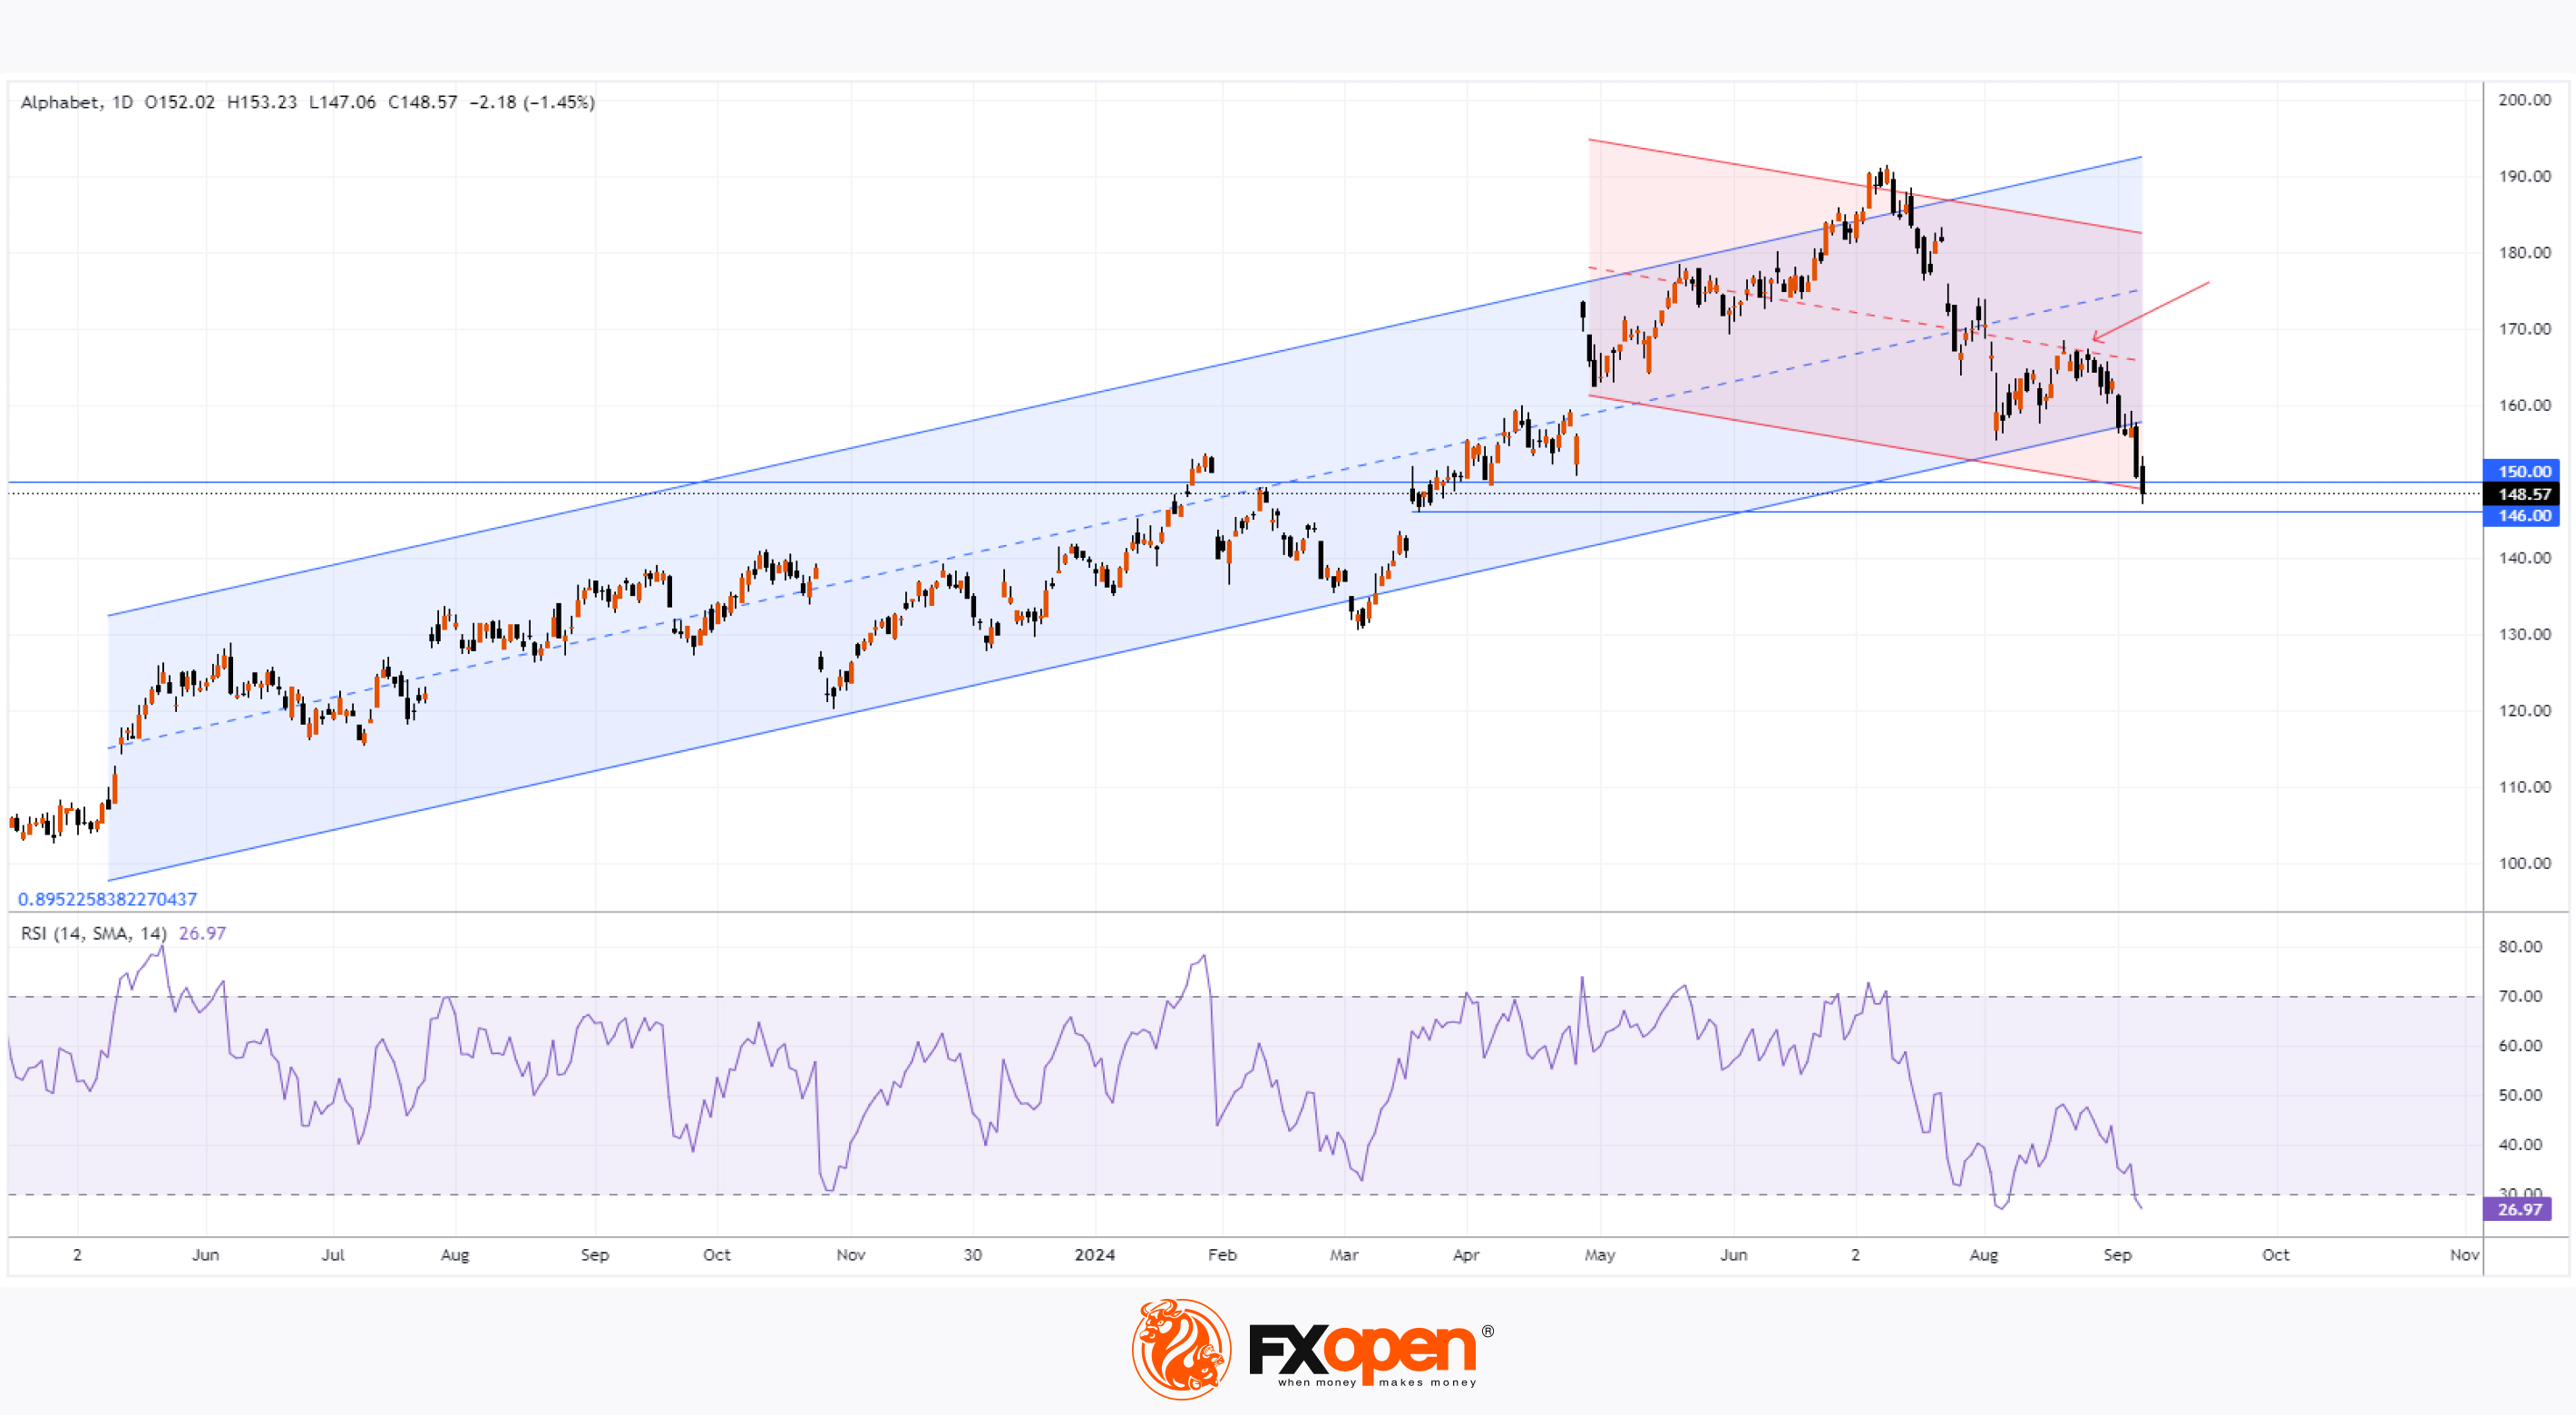
👍2