
#marketanalysis #MarketNews #forextrading
Analysis of NZD/USD: Exchange Rate Hits Yearly High Today
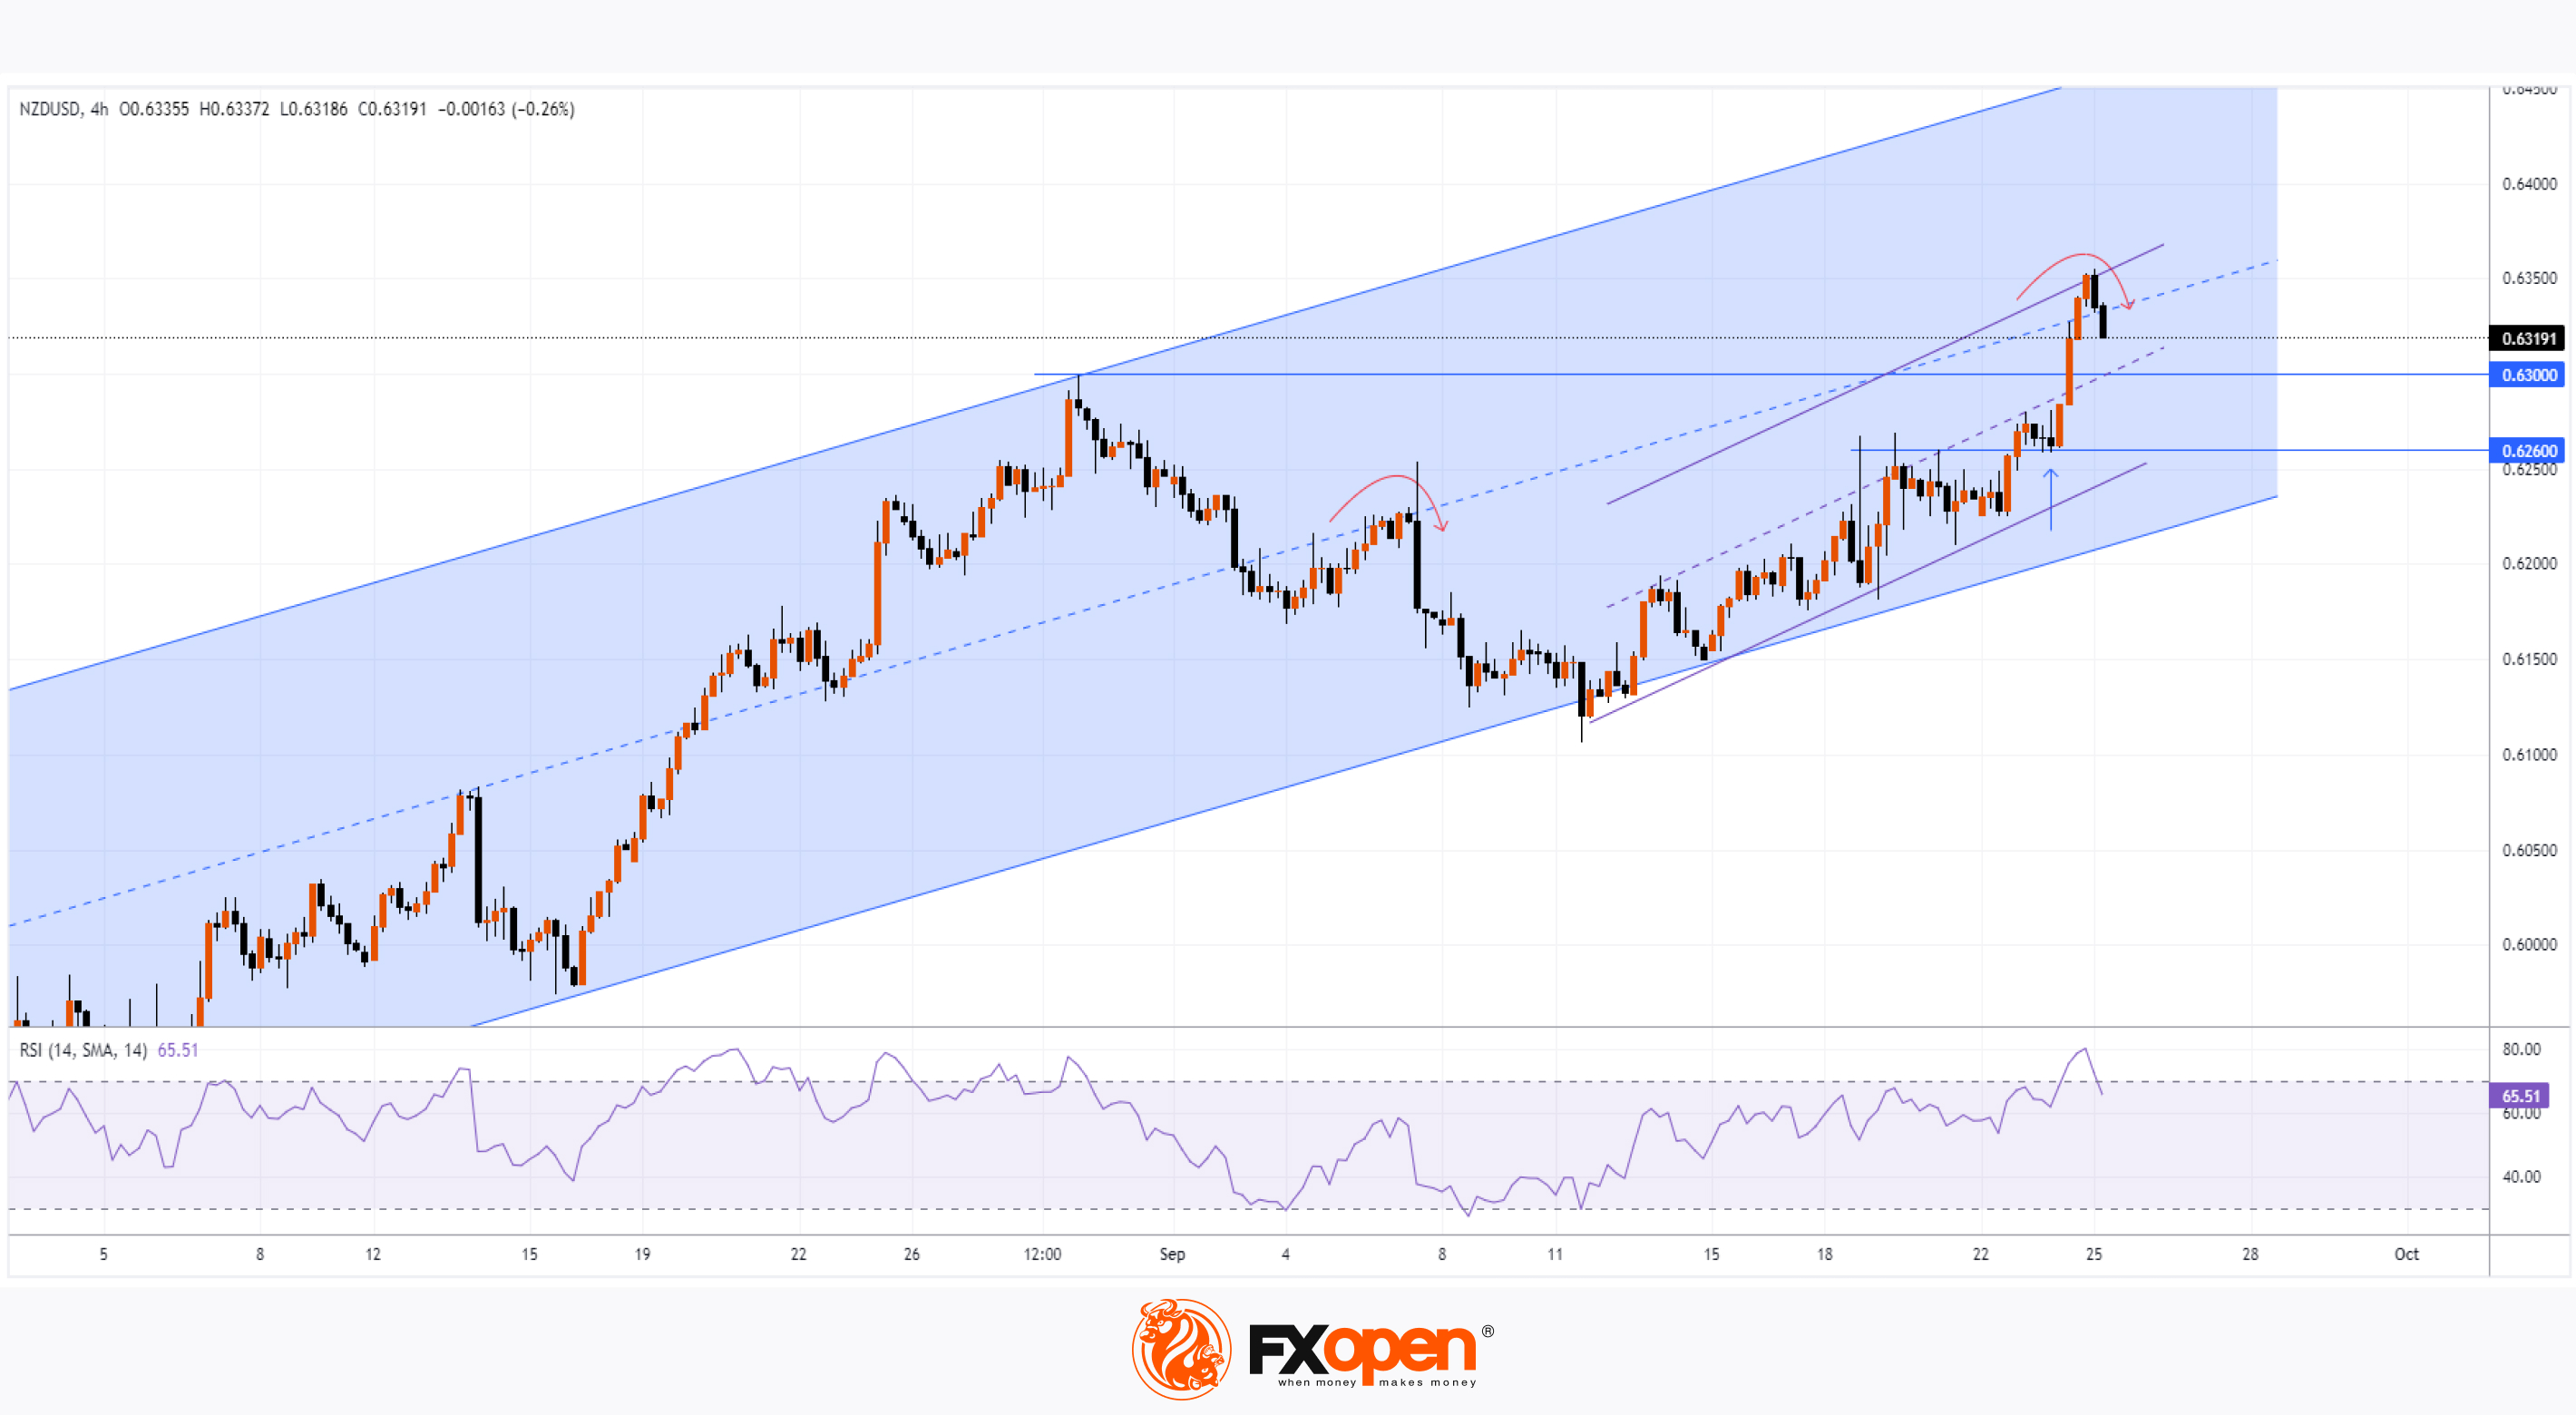
According to the NZD/USD chart, the exchange rate has reached 0.635 New Zealand dollars per US dollar today, its highest level since December 2023.
As reported by Trading Economics:
→ On one hand, the "kiwi" strengthened due to China's announcement of an economic stimulus package, as China is New Zealand's largest trading partner.
→ On the other hand, weaker-than-expected US consumer confidence data (CB Consumer Confidence) released yesterday also supported the pair: actual = 98.7, forecast = 103.9, previous = 105.6.
Today's technical analysis of the NZD/USD chart shows that since late July, the price has formed an upward channel (marked in blue), with the following developments:
→ Bulls managed to break the 0.630 level;
→ The 0.626 level shifted from resistance to support (indicated by an arrow);
→ Since mid-September, the price rise has been most clearly reflected by a steeper upward channel (shown by purple lines);
→ The RSI indicator on the 4-hour timeframe entered the overbought zone and has turned downwards.
It's worth noting that today’s NZD/USD chart indicates the median line is showing signs of resistance, as seen earlier in September.
Given this, the market appears vulnerable to a pullback, and we may witness a retest of the 0.630 level, reinforced by support from the purple lines.
Trade over 50 forex markets 24 hours a day with FXOpen. Take advantage of low commissions, deep liquidity, and spreads from 0.0 pips. Open your FXOpen account now or learn more about trading forex with FXOpen.
CFDs are complex instruments and come with a high risk of losing your money.
This article represents the opinion of the Companies operating under the FXOpen brand only. It is not to be construed as an offer, solicitation, or recommendation with respect to products and services provided by the Companies operating under the FXOpen brand, nor is it to be considered financial advice.
Analysis of NZD/USD: Exchange Rate Hits Yearly High Today
According to the NZD/USD chart, the exchange rate has reached 0.635 New Zealand dollars per US dollar today, its highest level since December 2023.
As reported by Trading Economics:
→ On one hand, the "kiwi" strengthened due to China's announcement of an economic stimulus package, as China is New Zealand's largest trading partner.
→ On the other hand, weaker-than-expected US consumer confidence data (CB Consumer Confidence) released yesterday also supported the pair: actual = 98.7, forecast = 103.9, previous = 105.6.
Today's technical analysis of the NZD/USD chart shows that since late July, the price has formed an upward channel (marked in blue), with the following developments:
→ Bulls managed to break the 0.630 level;
→ The 0.626 level shifted from resistance to support (indicated by an arrow);
→ Since mid-September, the price rise has been most clearly reflected by a steeper upward channel (shown by purple lines);
→ The RSI indicator on the 4-hour timeframe entered the overbought zone and has turned downwards.
It's worth noting that today’s NZD/USD chart indicates the median line is showing signs of resistance, as seen earlier in September.
Given this, the market appears vulnerable to a pullback, and we may witness a retest of the 0.630 level, reinforced by support from the purple lines.
Trade over 50 forex markets 24 hours a day with FXOpen. Take advantage of low commissions, deep liquidity, and spreads from 0.0 pips. Open your FXOpen account now or learn more about trading forex with FXOpen.
CFDs are complex instruments and come with a high risk of losing your money.
This article represents the opinion of the Companies operating under the FXOpen brand only. It is not to be construed as an offer, solicitation, or recommendation with respect to products and services provided by the Companies operating under the FXOpen brand, nor is it to be considered financial advice.
👍2
#stockmarket #stocktrading #MarketNews
Meta Platforms (META) Stock Price Holds Near All-Time High
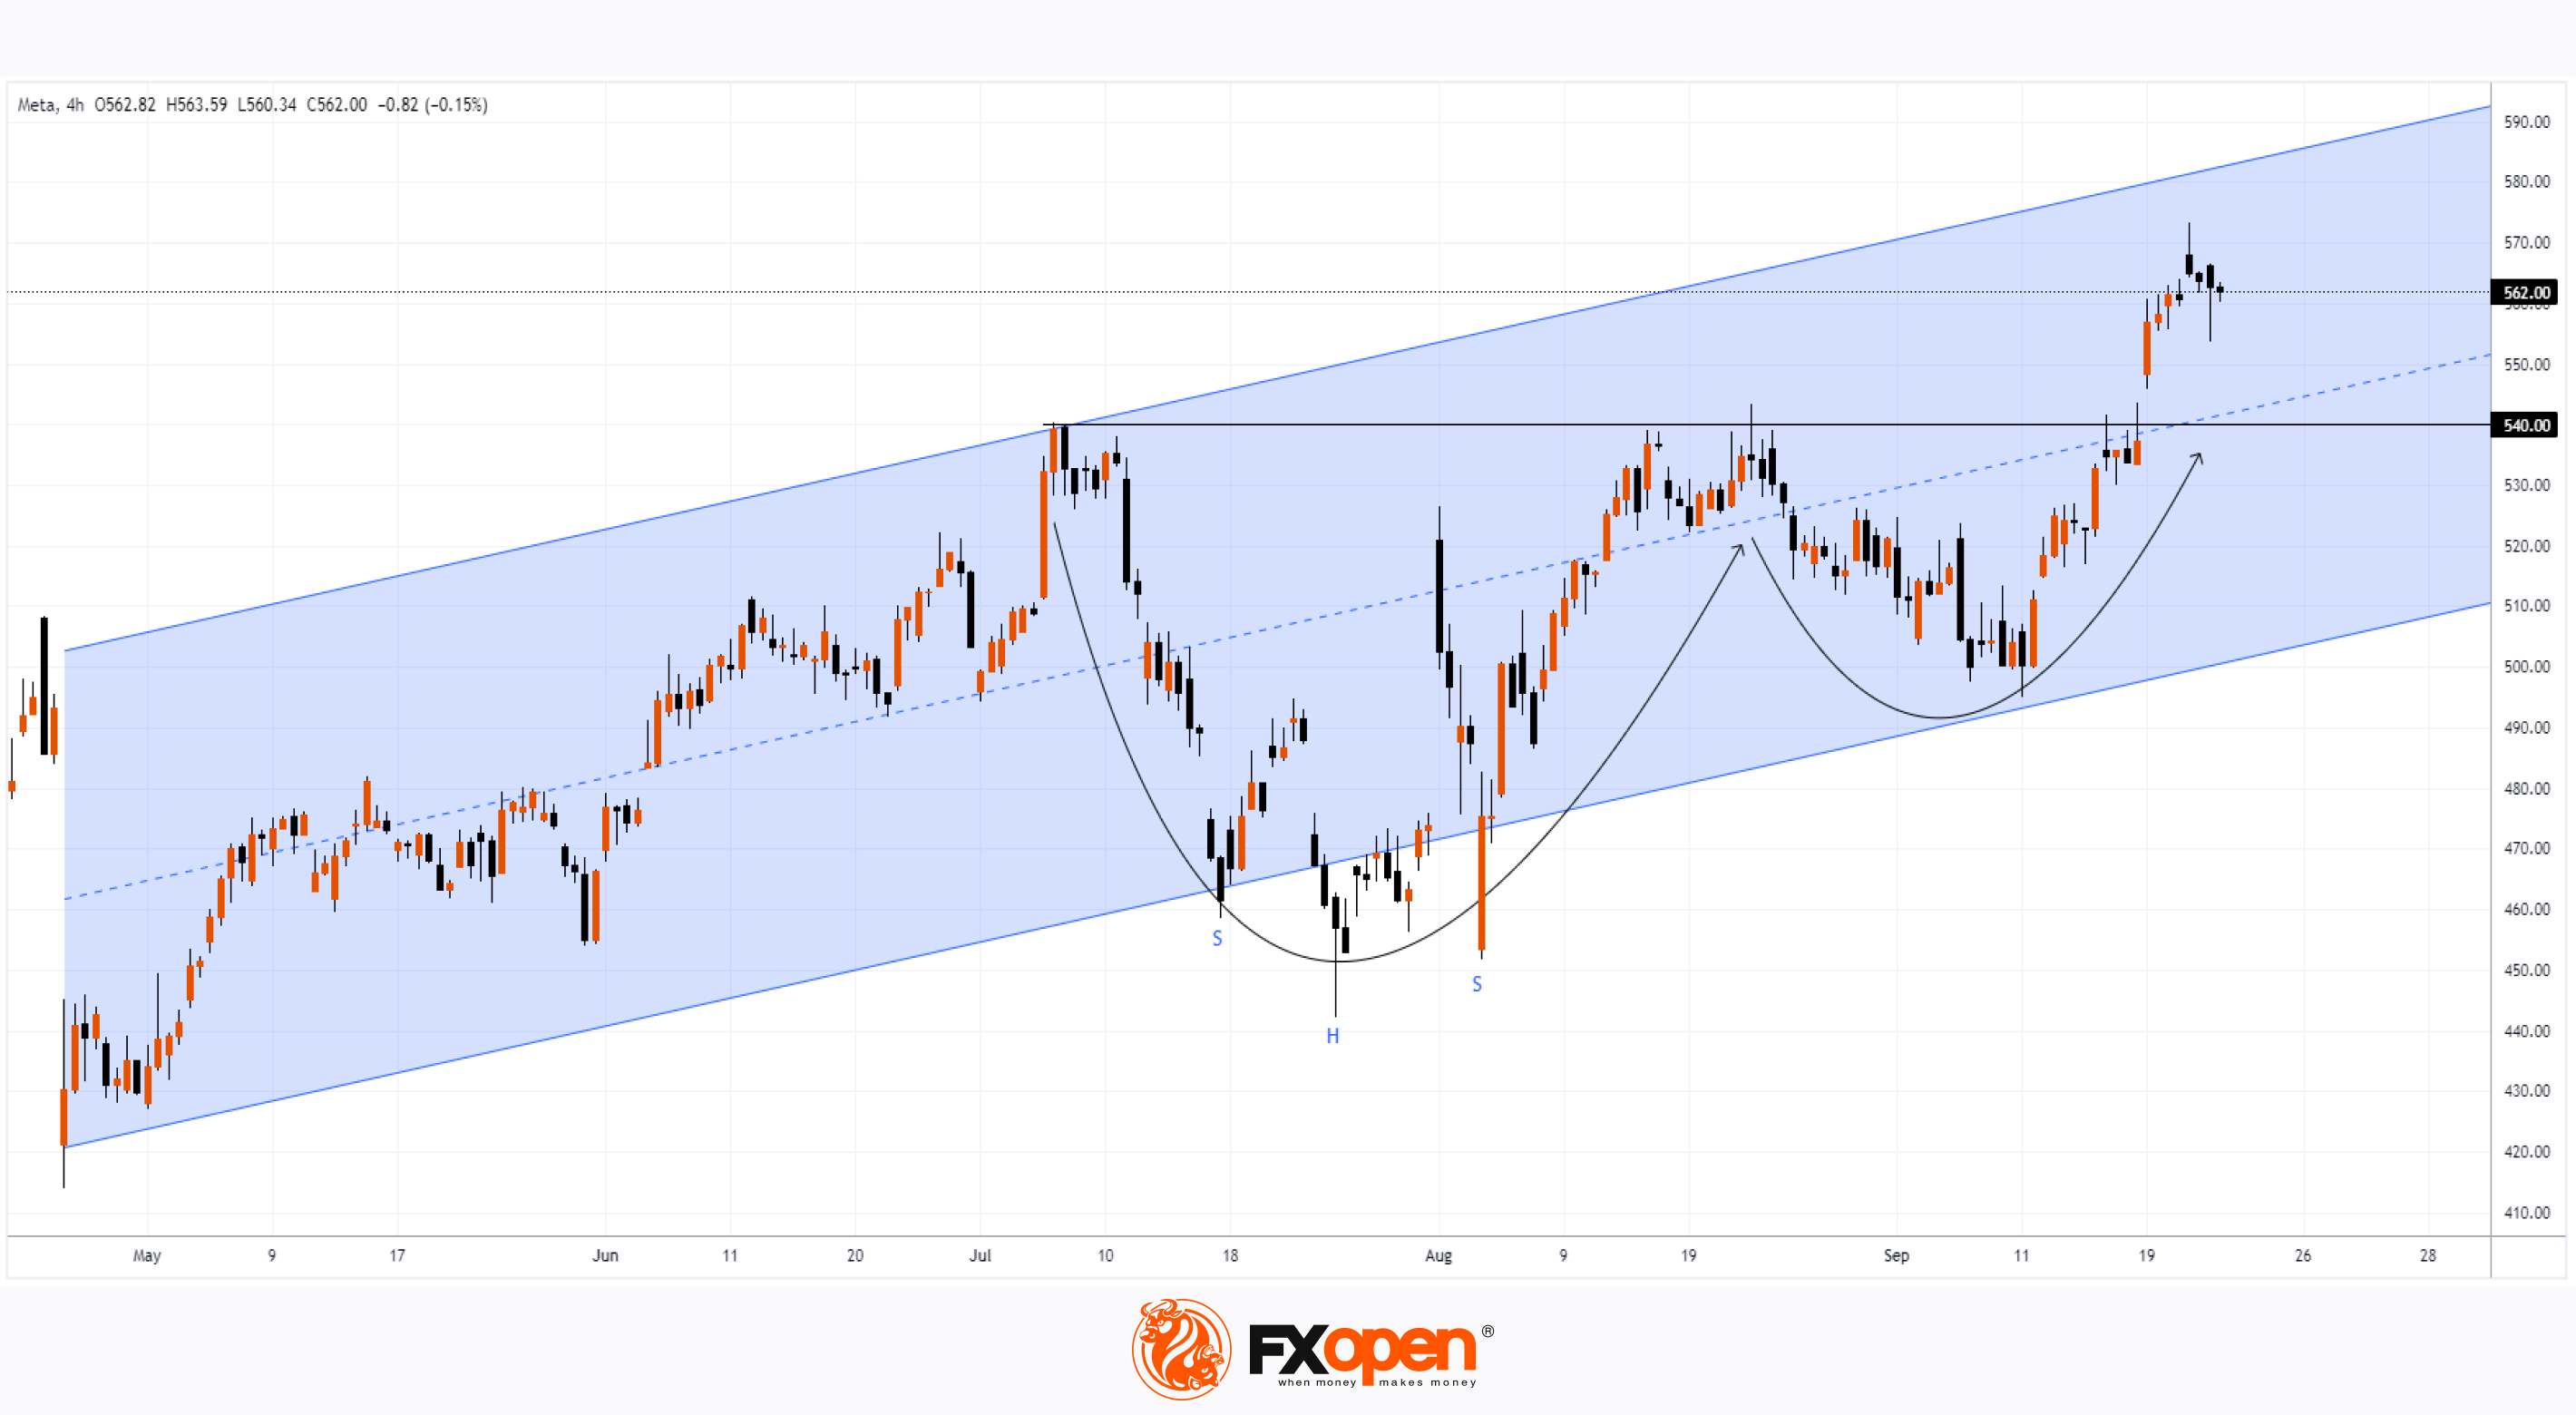
As shown on the Meta Platforms (META) stock chart, the price remains around the $560 level, less than 2% away from the all-time high of over $570, reached on 23 September.
A significant gain of approximately 3.80% in one day was achieved on 19 September, driven by increased demand for shares following the Federal Reserve’s decision to ease monetary policy.
Technical analysis of the META stock chart indicates that:
→ The price is forming an upward channel (constructed using the linear regression method, marked in blue), currently sitting in the upper half of this channel.
→ Prior to breaking through key resistance at $540, the price trajectory formed a bullish "inverse cup with handle" pattern, which aligns with another bullish pattern – an "inverse head and shoulders."
→ The bullish gap that appeared on 19 September could act as a key support zone, helping the price stay above the former resistance at $540.
Will the bullish trend in Meta Platforms (META) stock continue? Much will depend on the Meta Connect conference taking place today.
As Barron’s reports:
→ CEO Mark Zuckerberg will deliver the keynote address, where he is expected to outline the company’s vision for artificial intelligence and announce Meta’s latest product developments.
→ The Verge predicts that Meta may unveil new versions of the Quest 3 virtual reality headset and Ray-Ban Meta smart glasses.
If the announcements prove groundbreaking, it’s possible the META stock price could reach the upper boundary of the blue channel. On the other hand, investor disappointment could put pressure on the key $540 level.
Trade global index CFDs with zero commission and tight spreads. Open your FXOpen account now or learn more about trading index CFDs with FXOpen.
CFDs are complex instruments and come with a high risk of losing your money.
This article represents the opinion of the Companies operating under the FXOpen brand only. It is not to be construed as an offer, solicitation, or recommendation with respect to products and services provided by the Companies operating under the FXOpen brand, nor is it to be considered financial advice.
Meta Platforms (META) Stock Price Holds Near All-Time High
As shown on the Meta Platforms (META) stock chart, the price remains around the $560 level, less than 2% away from the all-time high of over $570, reached on 23 September.
A significant gain of approximately 3.80% in one day was achieved on 19 September, driven by increased demand for shares following the Federal Reserve’s decision to ease monetary policy.
Technical analysis of the META stock chart indicates that:
→ The price is forming an upward channel (constructed using the linear regression method, marked in blue), currently sitting in the upper half of this channel.
→ Prior to breaking through key resistance at $540, the price trajectory formed a bullish "inverse cup with handle" pattern, which aligns with another bullish pattern – an "inverse head and shoulders."
→ The bullish gap that appeared on 19 September could act as a key support zone, helping the price stay above the former resistance at $540.
Will the bullish trend in Meta Platforms (META) stock continue? Much will depend on the Meta Connect conference taking place today.
As Barron’s reports:
→ CEO Mark Zuckerberg will deliver the keynote address, where he is expected to outline the company’s vision for artificial intelligence and announce Meta’s latest product developments.
→ The Verge predicts that Meta may unveil new versions of the Quest 3 virtual reality headset and Ray-Ban Meta smart glasses.
If the announcements prove groundbreaking, it’s possible the META stock price could reach the upper boundary of the blue channel. On the other hand, investor disappointment could put pressure on the key $540 level.
Trade global index CFDs with zero commission and tight spreads. Open your FXOpen account now or learn more about trading index CFDs with FXOpen.
CFDs are complex instruments and come with a high risk of losing your money.
This article represents the opinion of the Companies operating under the FXOpen brand only. It is not to be construed as an offer, solicitation, or recommendation with respect to products and services provided by the Companies operating under the FXOpen brand, nor is it to be considered financial advice.
👍2
#stockmarket #stocktrading #MarketUpdates
Shares of Chinese Companies Surge
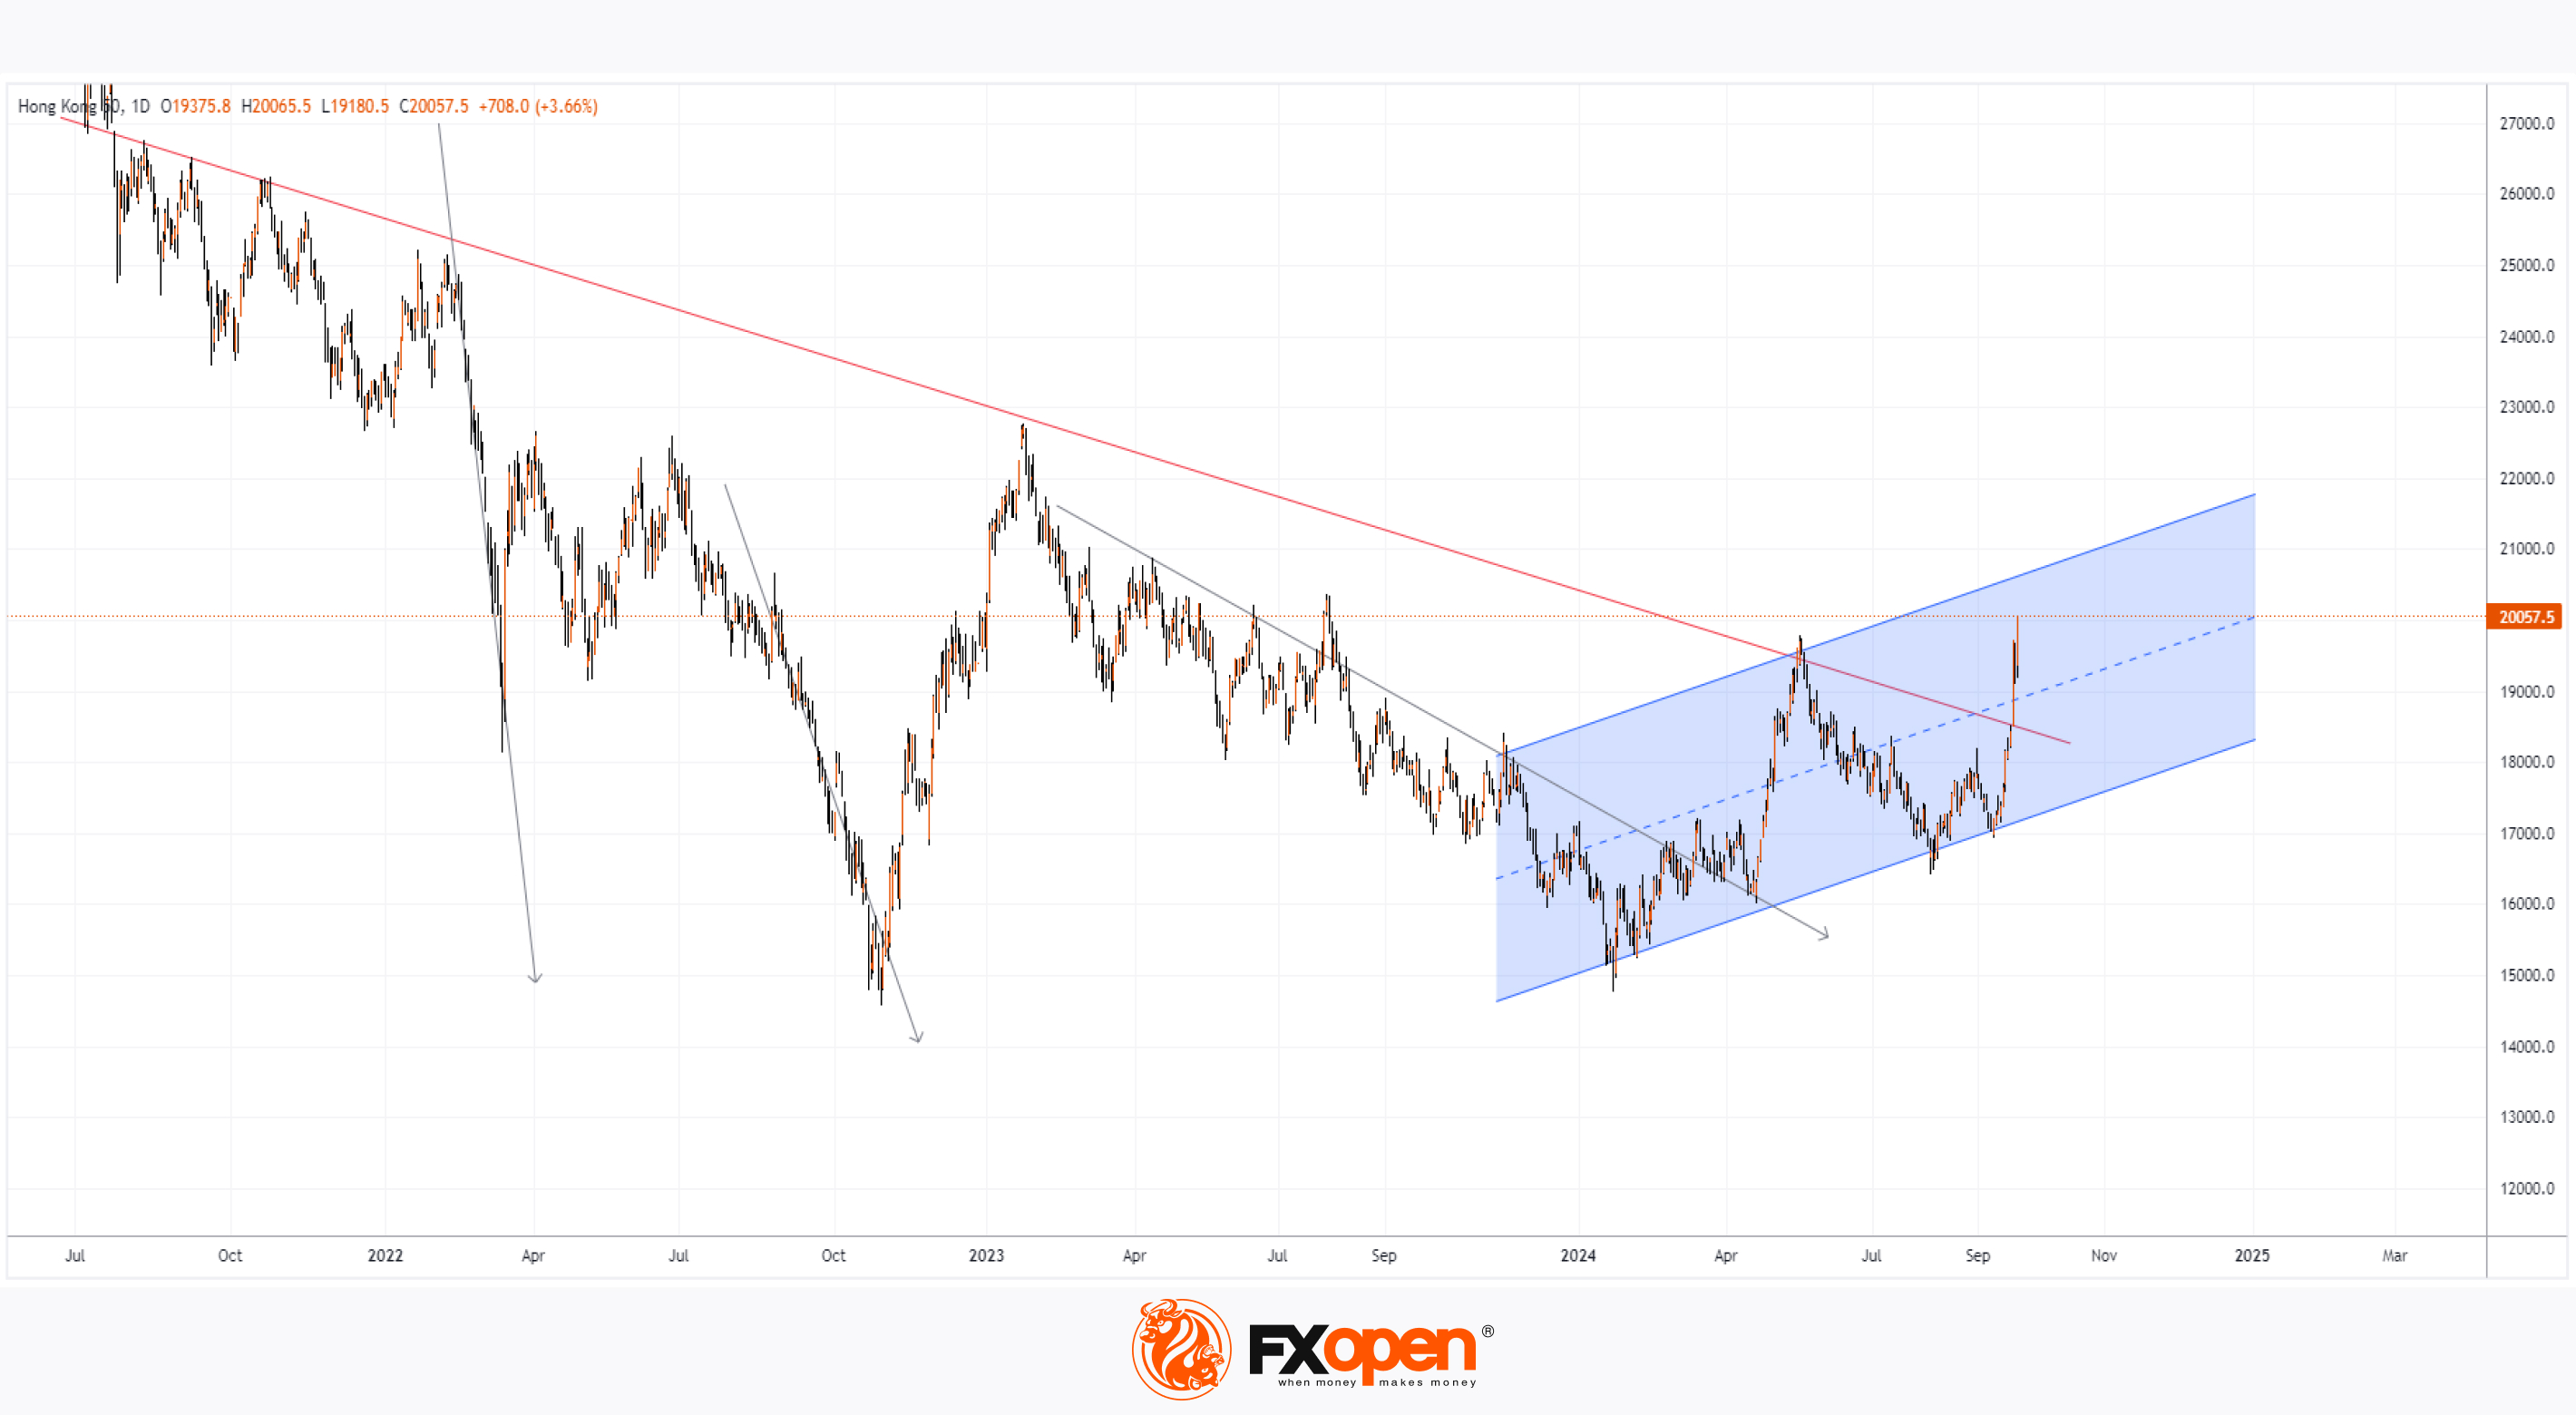
As evidenced by today’s Hang Seng chart (Hong Kong 50 on FXOpen), this stock index has risen to a yearly high.
Bullish sentiment in the market is bolstered by promises from China's top leadership, including President Xi Jinping, to achieve the growth target for 2024 and to halt the decline in the real estate market.
Bloomberg News reported that China is considering injecting up to 1 trillion yuan of capital into its largest state lenders to enhance their capacity to support the recovery of the Chinese economy. This proposal is part of broader stimulus measures launched by the People’s Bank of China earlier this week.
Technical analysis of the Hang Seng index chart (Hong Kong 50 on FXOpen) indicates that the price is making a significant upward reversal:
→ This month, the price broke above the trendline (marked in red), which dates back to 2021.
→ Evaluating the angles of decline (indicated by grey arrows), it is evident that the rate of downward impulses has been consistently slowing over time, indicating exhaustion of selling pressure.
→ Price action in 2024 provides grounds to construct an upward channel (shown in blue). It’s possible that the upper boundary could be reached by the end of the year.
Let’s remember that we established a long-term upward channel in January of this year, and today’s price action on the Hang Seng (Hong Kong 50 on FXOpen) confirms its relevance.
Trade global index CFDs with zero commission and tight spreads. Open your FXOpen account now or learn more about trading index CFDs with FXOpen.
CFDs are complex instruments and come with a high risk of losing your money.
This article represents the opinion of the Companies operating under the FXOpen brand only. It is not to be construed as an offer, solicitation, or recommendation with respect to products and services provided by the Companies operating under the FXOpen brand, nor is it to be considered financial advice.
Shares of Chinese Companies Surge
As evidenced by today’s Hang Seng chart (Hong Kong 50 on FXOpen), this stock index has risen to a yearly high.
Bullish sentiment in the market is bolstered by promises from China's top leadership, including President Xi Jinping, to achieve the growth target for 2024 and to halt the decline in the real estate market.
Bloomberg News reported that China is considering injecting up to 1 trillion yuan of capital into its largest state lenders to enhance their capacity to support the recovery of the Chinese economy. This proposal is part of broader stimulus measures launched by the People’s Bank of China earlier this week.
Technical analysis of the Hang Seng index chart (Hong Kong 50 on FXOpen) indicates that the price is making a significant upward reversal:
→ This month, the price broke above the trendline (marked in red), which dates back to 2021.
→ Evaluating the angles of decline (indicated by grey arrows), it is evident that the rate of downward impulses has been consistently slowing over time, indicating exhaustion of selling pressure.
→ Price action in 2024 provides grounds to construct an upward channel (shown in blue). It’s possible that the upper boundary could be reached by the end of the year.
Let’s remember that we established a long-term upward channel in January of this year, and today’s price action on the Hang Seng (Hong Kong 50 on FXOpen) confirms its relevance.
Trade global index CFDs with zero commission and tight spreads. Open your FXOpen account now or learn more about trading index CFDs with FXOpen.
CFDs are complex instruments and come with a high risk of losing your money.
This article represents the opinion of the Companies operating under the FXOpen brand only. It is not to be construed as an offer, solicitation, or recommendation with respect to products and services provided by the Companies operating under the FXOpen brand, nor is it to be considered financial advice.
👍2
#gasprices #MarketNews #MarketUpdates
Natural Gas Price Hits 3-Month High
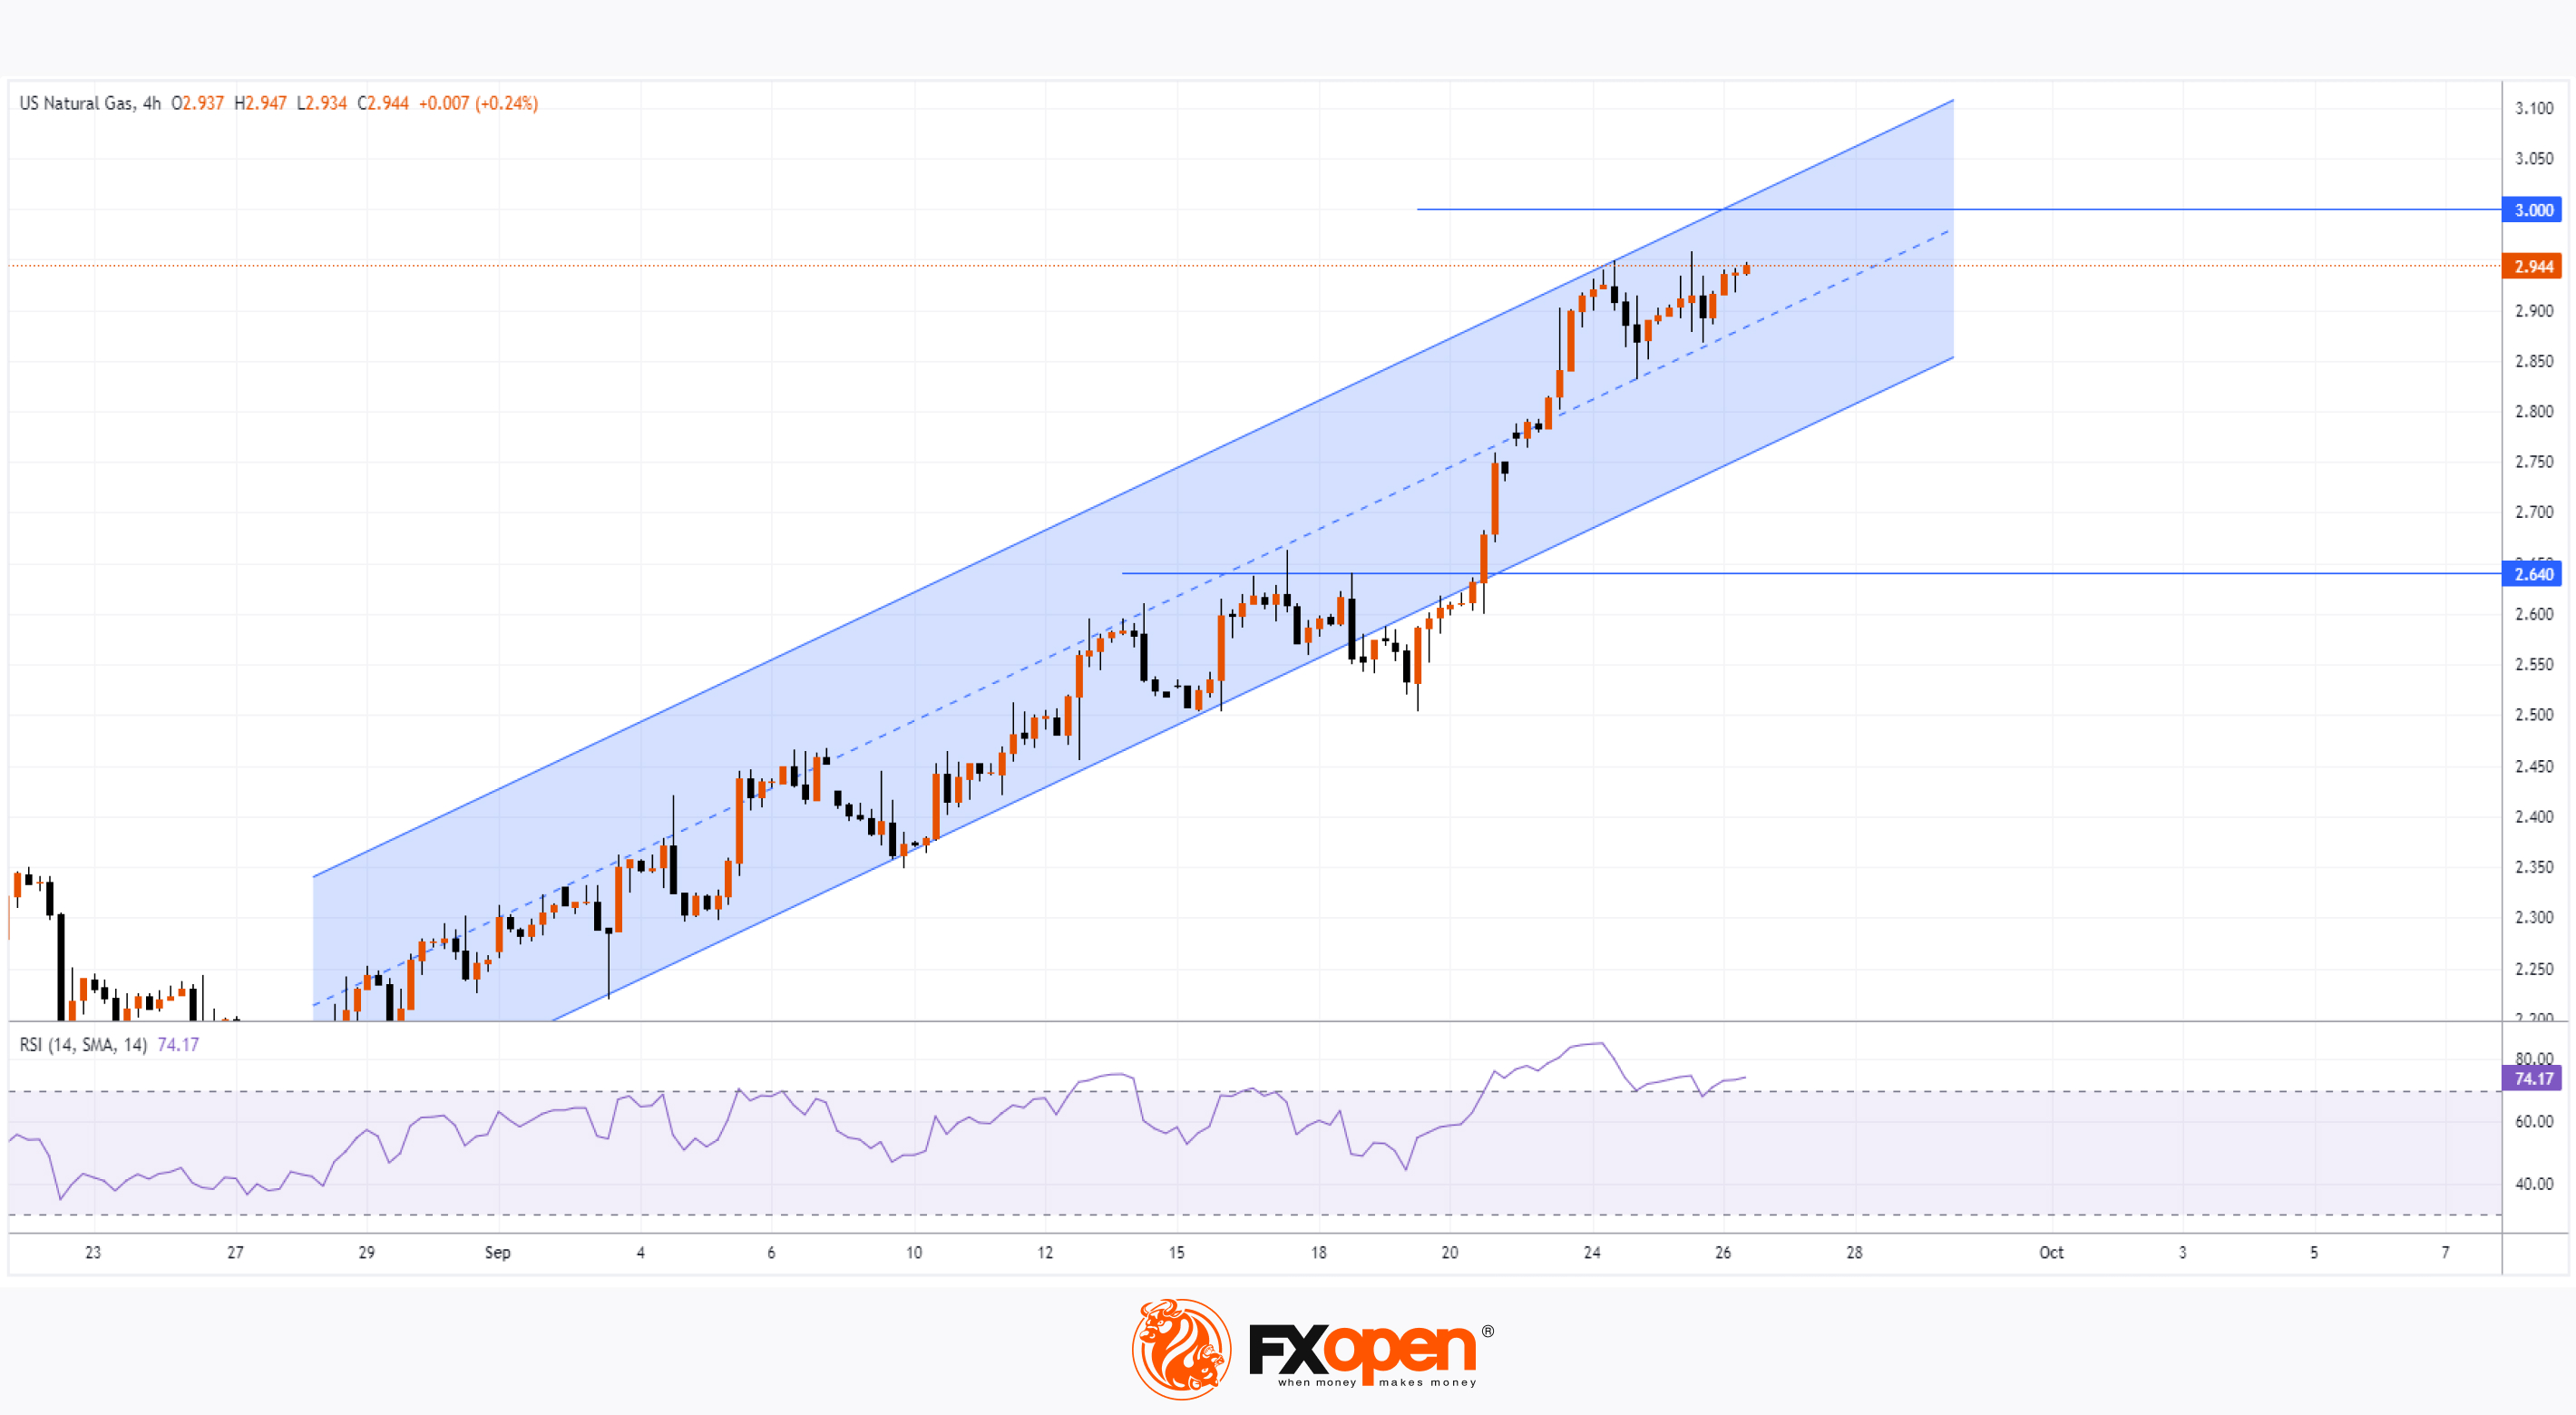
According to today's XNG/USD chart, the price of natural gas:
→ has risen by approximately 30% since the beginning of September;
→ is currently around the 2.95 level – the last time the price was at this level was at the end of June this year.
Bullish sentiment is supported by:
→ forecasts of a warmer autumn, which is increasing demand for natural gas to power air conditioning systems;
→ concerns related to Hurricane Helen in the US Gulf of Mexico. According to the EIA, 5% of total US dry natural gas production comes from the Gulf of Mexico, and 51% of the total capacity of US natural gas processing plants is located along the US Gulf Coast.
Technical analysis of the XNG/USD chart shows that in September, the price has been moving within an ascending channel (marked in blue).
It is noticeable that from the 20th onwards, demand forces have intensified, leading to the following:
→ the price broke through the 2.64 resistance level;
→ the price moved to the upper half of the ascending channel, after which its median line began to show signs of support;
→ the RSI indicator reached overbought territory.
Currently, there are no signs on the XNG/USD chart of bears attempting to seize control, while the bulls may be "gathering strength" for a possible attempt to break through the psychological level of 3.00. If this happens and is successful, it could pave the way towards the yearly high in the 3.20 region
Start trading commodities with tight spreads. Open your trading account now or learn more about trading commodity CFDs with FXOpen.
CFDs are complex instruments and come with a high risk of losing your money.
This article represents the opinion of the Companies operating under the FXOpen brand only. It is not to be construed as an offer, solicitation, or recommendation with respect to products and services provided by the Companies operating under the FXOpen brand, nor is it to be considered financial advice.
Natural Gas Price Hits 3-Month High
According to today's XNG/USD chart, the price of natural gas:
→ has risen by approximately 30% since the beginning of September;
→ is currently around the 2.95 level – the last time the price was at this level was at the end of June this year.
Bullish sentiment is supported by:
→ forecasts of a warmer autumn, which is increasing demand for natural gas to power air conditioning systems;
→ concerns related to Hurricane Helen in the US Gulf of Mexico. According to the EIA, 5% of total US dry natural gas production comes from the Gulf of Mexico, and 51% of the total capacity of US natural gas processing plants is located along the US Gulf Coast.
Technical analysis of the XNG/USD chart shows that in September, the price has been moving within an ascending channel (marked in blue).
It is noticeable that from the 20th onwards, demand forces have intensified, leading to the following:
→ the price broke through the 2.64 resistance level;
→ the price moved to the upper half of the ascending channel, after which its median line began to show signs of support;
→ the RSI indicator reached overbought territory.
Currently, there are no signs on the XNG/USD chart of bears attempting to seize control, while the bulls may be "gathering strength" for a possible attempt to break through the psychological level of 3.00. If this happens and is successful, it could pave the way towards the yearly high in the 3.20 region
Start trading commodities with tight spreads. Open your trading account now or learn more about trading commodity CFDs with FXOpen.
CFDs are complex instruments and come with a high risk of losing your money.
This article represents the opinion of the Companies operating under the FXOpen brand only. It is not to be construed as an offer, solicitation, or recommendation with respect to products and services provided by the Companies operating under the FXOpen brand, nor is it to be considered financial advice.
👍2
#marketanalysis #MarketNews #oilprices #oilindustry
Brent Crude Oil Price Drops to Yearly Low
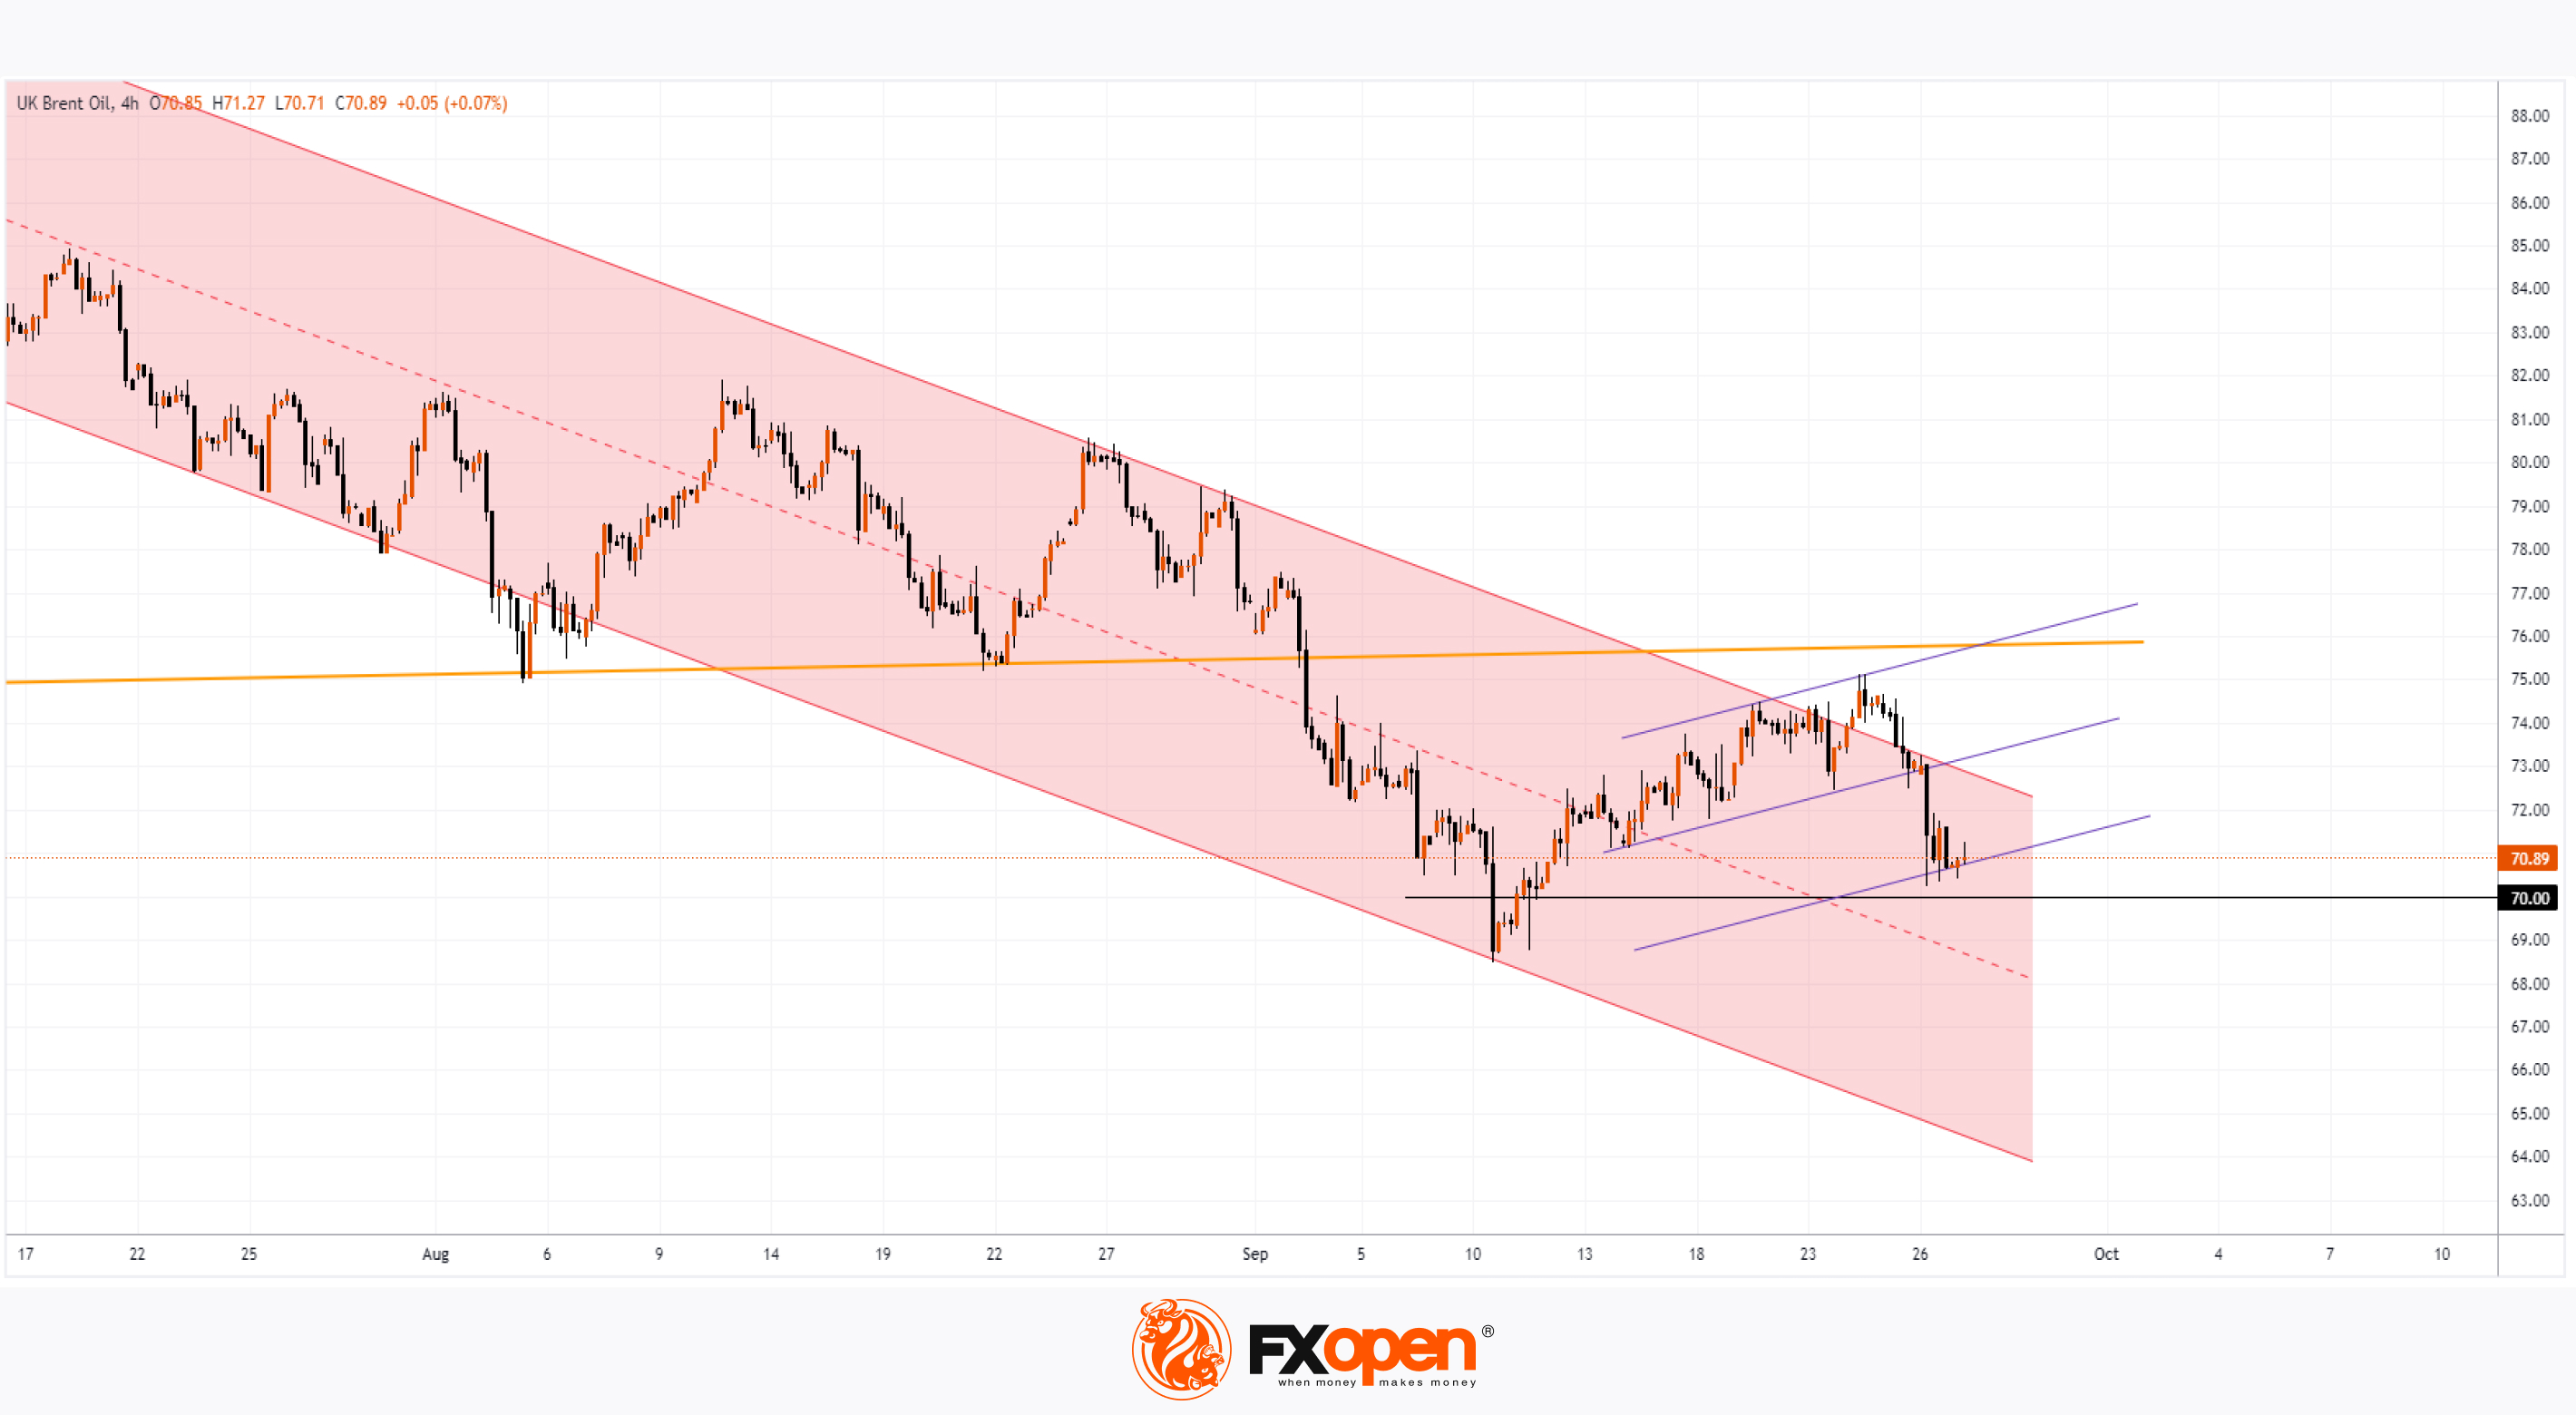
When analysing the oil market on the XBR/USD chart on 4th September, with Brent crude trading near its yearly low, we:
→ noted the formation of a descending channel (marked in red);
→ highlighted key support (marked in yellow), which has now been broken;
→ suggested the likelihood of an interim upward correction, potentially rising to $74.50.
Since then, Brent crude oil:
→ climbed to $75;
→ tested the yellow line from below;
→ then reversed downwards, reaffirming the relevance of the red descending channel (as the bullish breakout attempt failed).
Bearish sentiment was fuelled by reports of a potential increase in global oil supply, particularly due to higher production in Libya and Saudi Arabia.
Could Brent crude prices continue to fall?
From a technical analysis perspective of the XBR/USD chart today:
→ The price is in the upper half of the descending channel, indicating that while bears may control the market, it may not be enough to expect a sustained downward trend.
→ Bulls appear to be active as the price nears the psychological level of $70. This was evident with yesterday’s halt in the price decline around $70.60.
→ Price dynamics are revealing clearer signs of an upward channel (shown by the purple lines).
Considering the above, we cannot rule out the possibility of Brent crude making another attempt to break through the upper boundary of the red channel in the near future.
Start trading commodities with tight spreads. Open your trading account now or learn more about trading commodity CFDs with FXOpen.
CFDs are complex instruments and come with a high risk of losing your money.
This article represents the opinion of the Companies operating under the FXOpen brand only. It is not to be construed as an offer, solicitation, or recommendation with respect to products and services provided by the Companies operating under the FXOpen brand, nor is it to be considered financial advice.
Brent Crude Oil Price Drops to Yearly Low
When analysing the oil market on the XBR/USD chart on 4th September, with Brent crude trading near its yearly low, we:
→ noted the formation of a descending channel (marked in red);
→ highlighted key support (marked in yellow), which has now been broken;
→ suggested the likelihood of an interim upward correction, potentially rising to $74.50.
Since then, Brent crude oil:
→ climbed to $75;
→ tested the yellow line from below;
→ then reversed downwards, reaffirming the relevance of the red descending channel (as the bullish breakout attempt failed).
Bearish sentiment was fuelled by reports of a potential increase in global oil supply, particularly due to higher production in Libya and Saudi Arabia.
Could Brent crude prices continue to fall?
From a technical analysis perspective of the XBR/USD chart today:
→ The price is in the upper half of the descending channel, indicating that while bears may control the market, it may not be enough to expect a sustained downward trend.
→ Bulls appear to be active as the price nears the psychological level of $70. This was evident with yesterday’s halt in the price decline around $70.60.
→ Price dynamics are revealing clearer signs of an upward channel (shown by the purple lines).
Considering the above, we cannot rule out the possibility of Brent crude making another attempt to break through the upper boundary of the red channel in the near future.
Start trading commodities with tight spreads. Open your trading account now or learn more about trading commodity CFDs with FXOpen.
CFDs are complex instruments and come with a high risk of losing your money.
This article represents the opinion of the Companies operating under the FXOpen brand only. It is not to be construed as an offer, solicitation, or recommendation with respect to products and services provided by the Companies operating under the FXOpen brand, nor is it to be considered financial advice.
👍4
#stockmarket #stocktrading #MarketNews #marketanalysis
Micron Technology (MU) Shares Surge by Approximately 15%
The US stock market is experiencing positive momentum following the much-anticipated decision by the Federal Reserve to cut interest rates this month. The S&P 500 (US SPX 500 mini on FXOpen) closed at a new all-time high, driven by yesterday's news of:
→ Steady US GDP growth at 3% annually
→ Low unemployment, with 218K jobless claims filed last week (forecast = 224K, previous = 222K).
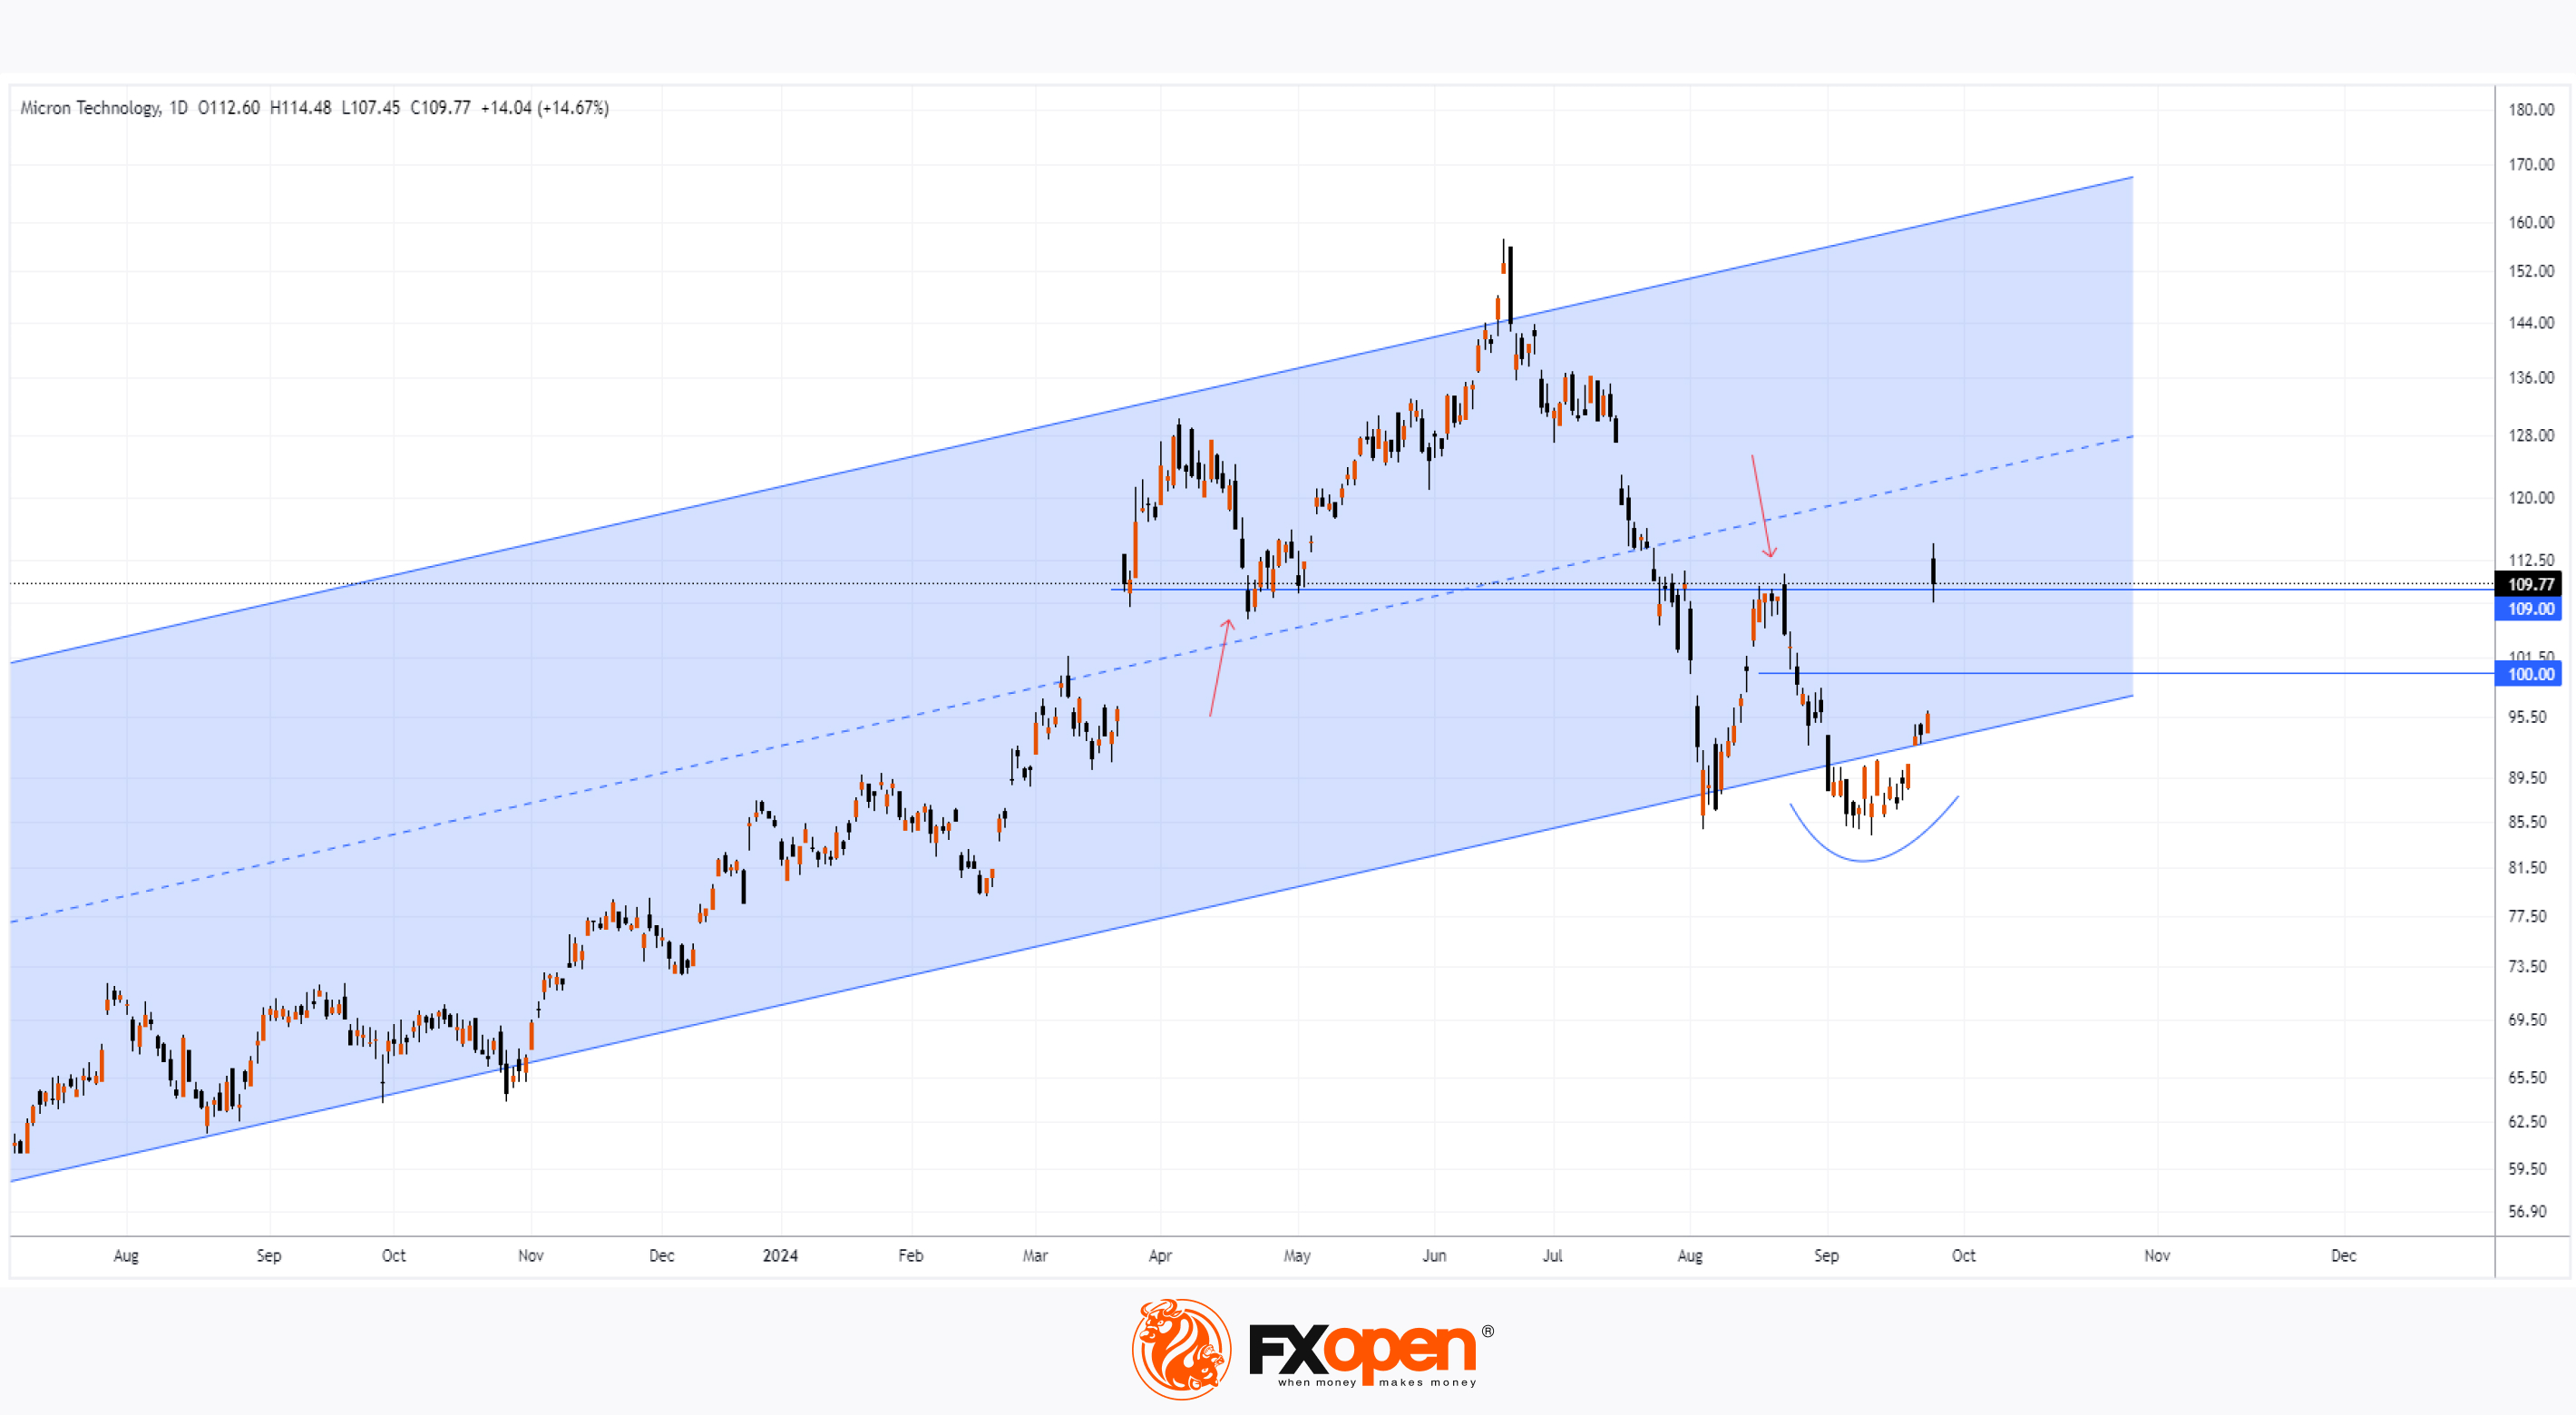
One of the top performers on the stock market yesterday was memory chip maker Micron Technology (MU). As seen on the MU stock chart, yesterday's candle closed around the $110 level, up from below $95 at the start of the week.
The strong bullish momentum was driven by Micron Technology's quarterly earnings report. According to Barron’s:
→ Earnings per share reached $1.18 for the fourth fiscal quarter, beating analysts’ forecasts of $1.11;
→ Revenue grew by 93% year-on-year to $7.75 billion;
→ Micron Technologies expects revenue next quarter to be $8.7 billion, surpassing forecasts of $8.3 billion and significantly more than $4.73 billion for the same period last year;
→ Micron Technologies' CEO Sanjay Mehrotra stated that demand for AI "drove a strong ramp of our data-center DRAM products and our industry-leading high-bandwidth memory."
Technical analysis of the MU stock chart shows that the price is moving within an upward channel (marked in blue). Key points include:
→ In early September, a Rounding Bottom pattern formed near the lower boundary of the channel – a bullish sign;
→ In yesterday's broad bullish gap, the price exceeded the key $109 level, which previously acted as both support and resistance (indicated by arrows).
Bearish Outlook for MU Shares: Supply forces may emerge around the $109 level, forming a false bullish breakout, with the possibility of testing the psychological level of $100.
Bullish Outlook for MU Shares: Strong company fundamentals and a bullish stock market could drive MU shares towards the median of the upward channel.
According to TipRanks, Wall Street analysts forecast an average target price for MU shares of around $150 over the next 12 months.
Trade global index CFDs with zero commission and tight spreads. Open your FXOpen account now or learn more about trading index CFDs with FXOpen.
CFDs are complex instruments and come with a high risk of losing your money.
This article represents the opinion of the Companies operating under the FXOpen brand only. It is not to be construed as an offer, solicitation, or recommendation with respect to products and services provided by the Companies operating under the FXOpen brand, nor is it to be considered financial advice.
Micron Technology (MU) Shares Surge by Approximately 15%
The US stock market is experiencing positive momentum following the much-anticipated decision by the Federal Reserve to cut interest rates this month. The S&P 500 (US SPX 500 mini on FXOpen) closed at a new all-time high, driven by yesterday's news of:
→ Steady US GDP growth at 3% annually
→ Low unemployment, with 218K jobless claims filed last week (forecast = 224K, previous = 222K).
One of the top performers on the stock market yesterday was memory chip maker Micron Technology (MU). As seen on the MU stock chart, yesterday's candle closed around the $110 level, up from below $95 at the start of the week.
The strong bullish momentum was driven by Micron Technology's quarterly earnings report. According to Barron’s:
→ Earnings per share reached $1.18 for the fourth fiscal quarter, beating analysts’ forecasts of $1.11;
→ Revenue grew by 93% year-on-year to $7.75 billion;
→ Micron Technologies expects revenue next quarter to be $8.7 billion, surpassing forecasts of $8.3 billion and significantly more than $4.73 billion for the same period last year;
→ Micron Technologies' CEO Sanjay Mehrotra stated that demand for AI "drove a strong ramp of our data-center DRAM products and our industry-leading high-bandwidth memory."
Technical analysis of the MU stock chart shows that the price is moving within an upward channel (marked in blue). Key points include:
→ In early September, a Rounding Bottom pattern formed near the lower boundary of the channel – a bullish sign;
→ In yesterday's broad bullish gap, the price exceeded the key $109 level, which previously acted as both support and resistance (indicated by arrows).
Bearish Outlook for MU Shares: Supply forces may emerge around the $109 level, forming a false bullish breakout, with the possibility of testing the psychological level of $100.
Bullish Outlook for MU Shares: Strong company fundamentals and a bullish stock market could drive MU shares towards the median of the upward channel.
According to TipRanks, Wall Street analysts forecast an average target price for MU shares of around $150 over the next 12 months.
Trade global index CFDs with zero commission and tight spreads. Open your FXOpen account now or learn more about trading index CFDs with FXOpen.
CFDs are complex instruments and come with a high risk of losing your money.
This article represents the opinion of the Companies operating under the FXOpen brand only. It is not to be construed as an offer, solicitation, or recommendation with respect to products and services provided by the Companies operating under the FXOpen brand, nor is it to be considered financial advice.
👍2
#ForexTrading #tradingstrategy #technicalanalysis #riskmanagement #CFD
What is a Divergence in Trading? 3 Trading Strategies Explained
Divergence trading is a cornerstone concept in the realm of technical analysis 📊. By comparing the direction of asset prices with the direction of momentum indicators, traders can notice subtle changes in market dynamics.
In this video, we'll dive into the concept of divergence in trading, explaining how it can help identify potential trend reversals or continuations. We'll cover the most popular indicators that form divergences with the price, offering a detailed breakdown of each type.
By the end, you'll understand how to spot divergences and incorporate them into your trading strategy! 📈
https://cutt.ly/1eUMaYBV
To take advantage of price fluctuations in the foreign exchange markets, consider enlisting the services of a reliable broker like FXOpen.
⚠️
This forecast represents FXOpen Companies opinion only, it should not be construed as an offer, invitation or recommendation in respect to FXOpen Companies products and services or as financial advice.
What is a Divergence in Trading? 3 Trading Strategies Explained
Divergence trading is a cornerstone concept in the realm of technical analysis 📊. By comparing the direction of asset prices with the direction of momentum indicators, traders can notice subtle changes in market dynamics.
In this video, we'll dive into the concept of divergence in trading, explaining how it can help identify potential trend reversals or continuations. We'll cover the most popular indicators that form divergences with the price, offering a detailed breakdown of each type.
By the end, you'll understand how to spot divergences and incorporate them into your trading strategy! 📈
https://cutt.ly/1eUMaYBV
To take advantage of price fluctuations in the foreign exchange markets, consider enlisting the services of a reliable broker like FXOpen.
⚠️
This forecast represents FXOpen Companies opinion only, it should not be construed as an offer, invitation or recommendation in respect to FXOpen Companies products and services or as financial advice.
YouTube
What is a Divergence in Trading? 3 Trading Strategies Explained #divergencetrading #tradingstrategy
Divergence trading is a cornerstone concept in the realm of technical analysis. By comparing the direction of asset prices with the direction of momentum indicators, traders can notice subtle changes in market dynamics.
In this video, we'll dive into the…
In this video, we'll dive into the…
👍2
#USDJPY #forextrading #marketanalysis #tradingtips
USD/JPY Analysis: The Yen Strengthens by Over 2.8% in One Day
According to Reuters, it was announced on Friday that Shigeru Ishiba, known for his tough stance on interest rates, will become Japan's next Prime Minister.
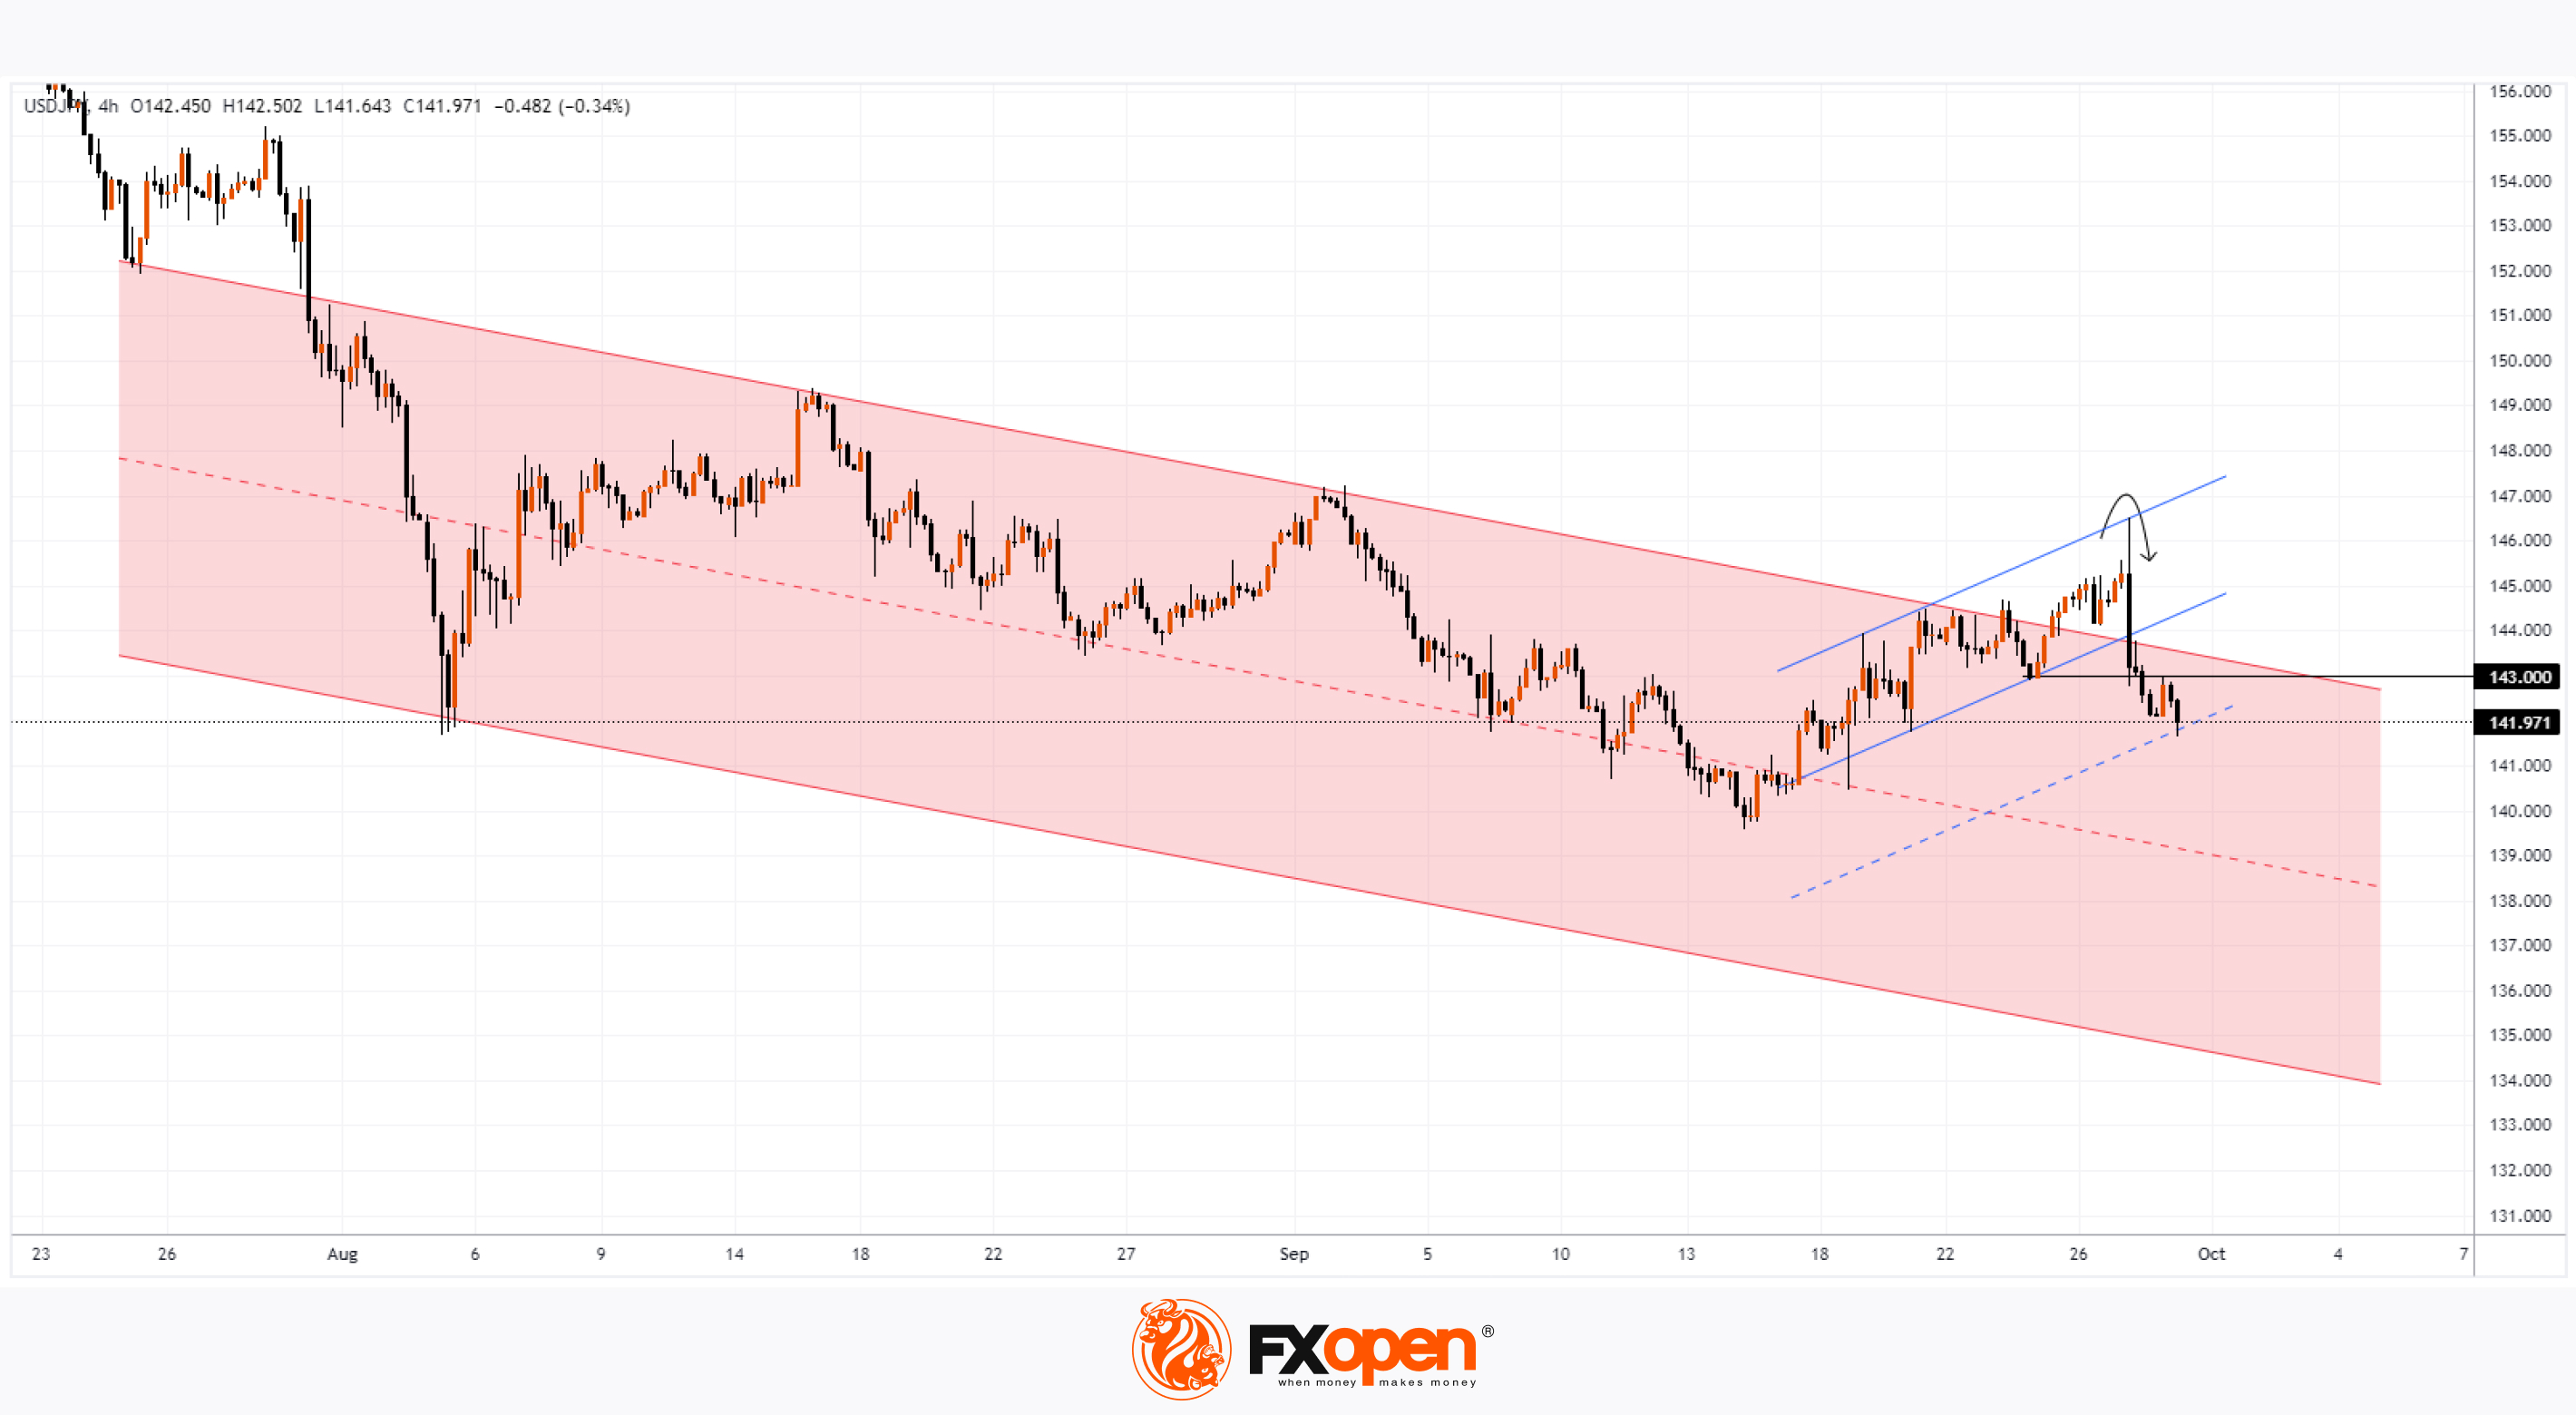
This news caused a sharp intraday reversal in the USD/JPY exchange rate on Friday: while the price initially rose in the morning (as shown by the arrow), it was followed by a sharp downward impulse later in the day.
Technical analysis of the USD/JPY chart shows:
→ The price made a false bullish breakout of the upper boundary of the descending channel before retreating back inside it;
→ The price broke the upward trend (marked by blue lines);
→ The ¥143 level shifted from support to resistance;
→ The current support comes from a line drawn below the blue channel (shown by the dotted line).
This suggests that the bears may have taken control, and if their pressure intensifies, the USD/JPY pair could head lower towards the median line of the red channel.
Note: Around 21:00 GMT+3 today, Federal Reserve Chair Jerome Powell is scheduled to speak in Nashville at the annual meeting of the National Association for Business Economics. His remarks could trigger increased volatility in the USD/JPY exchange rate.
Trade over 50 forex markets 24 hours a day with FXOpen. Take advantage of low commissions, deep liquidity, and spreads from 0.0 pips. Open your FXOpen account now or learn more about trading forex with FXOpen.
CFDs are complex instruments and come with a high risk of losing your money.
This article represents the opinion of the Companies operating under the FXOpen brand only. It is not to be construed as an offer, solicitation, or recommendation with respect to products and services provided by the Companies operating under the FXOpen brand, nor is it to be considered financial advice.
USD/JPY Analysis: The Yen Strengthens by Over 2.8% in One Day
According to Reuters, it was announced on Friday that Shigeru Ishiba, known for his tough stance on interest rates, will become Japan's next Prime Minister.
This news caused a sharp intraday reversal in the USD/JPY exchange rate on Friday: while the price initially rose in the morning (as shown by the arrow), it was followed by a sharp downward impulse later in the day.
Technical analysis of the USD/JPY chart shows:
→ The price made a false bullish breakout of the upper boundary of the descending channel before retreating back inside it;
→ The price broke the upward trend (marked by blue lines);
→ The ¥143 level shifted from support to resistance;
→ The current support comes from a line drawn below the blue channel (shown by the dotted line).
This suggests that the bears may have taken control, and if their pressure intensifies, the USD/JPY pair could head lower towards the median line of the red channel.
Note: Around 21:00 GMT+3 today, Federal Reserve Chair Jerome Powell is scheduled to speak in Nashville at the annual meeting of the National Association for Business Economics. His remarks could trigger increased volatility in the USD/JPY exchange rate.
Trade over 50 forex markets 24 hours a day with FXOpen. Take advantage of low commissions, deep liquidity, and spreads from 0.0 pips. Open your FXOpen account now or learn more about trading forex with FXOpen.
CFDs are complex instruments and come with a high risk of losing your money.
This article represents the opinion of the Companies operating under the FXOpen brand only. It is not to be construed as an offer, solicitation, or recommendation with respect to products and services provided by the Companies operating under the FXOpen brand, nor is it to be considered financial advice.
👍2
#stockmarket #stocktrading #forextrading #marketanalysis
Alibaba Group (BABA) Share Price Rises Over 30% Since Early September
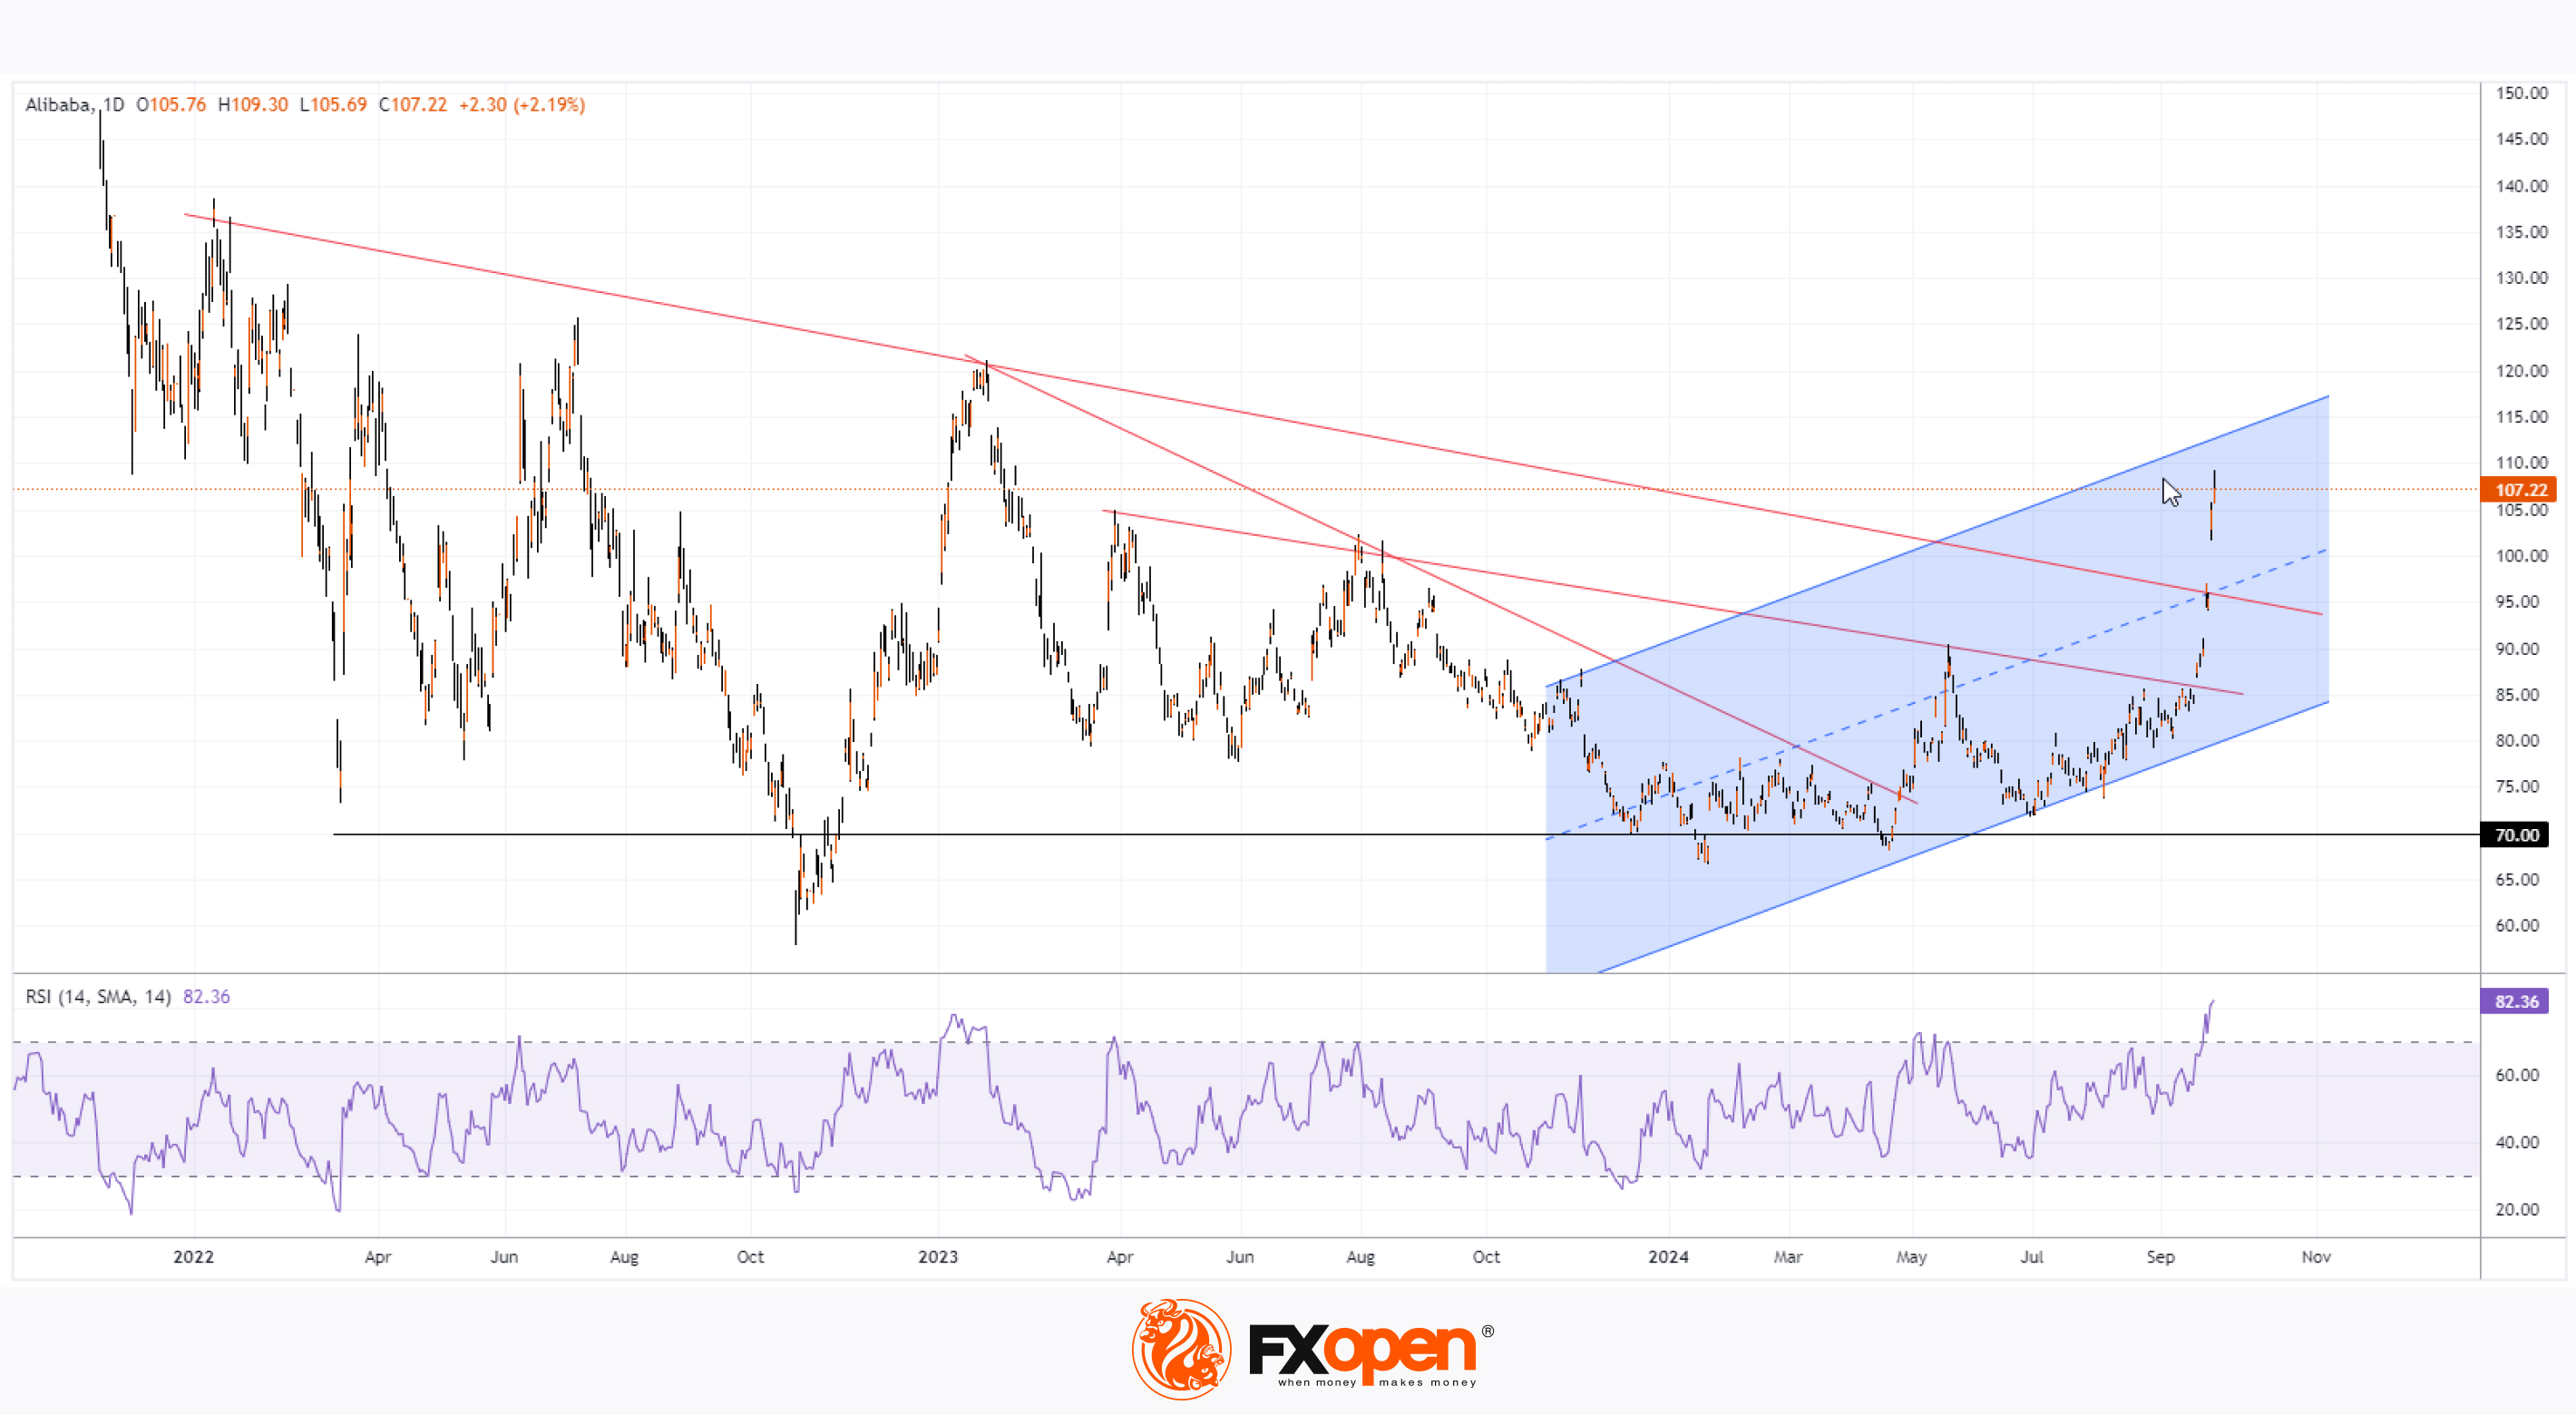
As shown on the Alibaba Group (BABA) stock chart, the price surpassed $107 on the NYSE on Friday, after trading below $85 at the start of the month.
Bullish sentiment surrounding Chinese stocks is driven by the authorities' plans to stimulate the country's economy:
→ According to Benzinga, China’s Central Bank shared plans last week to lower the banks’ required reserve ratio (RRR);
→ The Central Bank also outlined further support measures for the struggling real estate market.
It appears that market participants expect these economic stimulus measures to benefit Alibaba Group (BABA).
Technical analysis of the Alibaba Group (BABA) stock chart reveals:
→ The historical high above $300 was reached in October 2020, after which bears dominated the market. Signs of bullish activity emerged between 2022 and 2024 as the stock fell to $70.
→ In 2024, the price broke through three descending trendlines (marked in red) drawn through key highs, and the price movements suggest a new upward channel is forming (marked in blue).
→ The RSI indicator is at a multi-month high, signalling strong overbought conditions, while Friday’s candle closed with a long upper wick (a sign of increased bearish activity).
Although the current bullish momentum may still have room to lift Alibaba Group (BABA) shares to the upper boundary of the blue channel, given the information above, there is a significant likelihood of a correction forming in early October.
Trade global index CFDs with zero commission and tight spreads. Open your FXOpen account now or learn more about trading index CFDs with FXOpen.
CFDs are complex instruments and come with a high risk of losing your money.
This article represents the opinion of the Companies operating under the FXOpen brand only. It is not to be construed as an offer, solicitation, or recommendation with respect to products and services provided by the Companies operating under the FXOpen brand, nor is it to be considered financial advice.
Alibaba Group (BABA) Share Price Rises Over 30% Since Early September
As shown on the Alibaba Group (BABA) stock chart, the price surpassed $107 on the NYSE on Friday, after trading below $85 at the start of the month.
Bullish sentiment surrounding Chinese stocks is driven by the authorities' plans to stimulate the country's economy:
→ According to Benzinga, China’s Central Bank shared plans last week to lower the banks’ required reserve ratio (RRR);
→ The Central Bank also outlined further support measures for the struggling real estate market.
It appears that market participants expect these economic stimulus measures to benefit Alibaba Group (BABA).
Technical analysis of the Alibaba Group (BABA) stock chart reveals:
→ The historical high above $300 was reached in October 2020, after which bears dominated the market. Signs of bullish activity emerged between 2022 and 2024 as the stock fell to $70.
→ In 2024, the price broke through three descending trendlines (marked in red) drawn through key highs, and the price movements suggest a new upward channel is forming (marked in blue).
→ The RSI indicator is at a multi-month high, signalling strong overbought conditions, while Friday’s candle closed with a long upper wick (a sign of increased bearish activity).
Although the current bullish momentum may still have room to lift Alibaba Group (BABA) shares to the upper boundary of the blue channel, given the information above, there is a significant likelihood of a correction forming in early October.
Trade global index CFDs with zero commission and tight spreads. Open your FXOpen account now or learn more about trading index CFDs with FXOpen.
CFDs are complex instruments and come with a high risk of losing your money.
This article represents the opinion of the Companies operating under the FXOpen brand only. It is not to be construed as an offer, solicitation, or recommendation with respect to products and services provided by the Companies operating under the FXOpen brand, nor is it to be considered financial advice.
👍2
#silver #MarketNews #marketanalysis #XAGUSD
XAG/USD Analysis: Silver Price Fails to Hold at 11-Year High
As shown on the XAG/USD chart, during the trading session on 26th September, the price of silver surpassed the previous 2024 high (set in July), reaching levels last seen in December 2012.
Key drivers of silver’s price include news related to the Federal Reserve’s policy:
→ Last month, when the Federal Reserve cut interest rates, it led to a rise in both gold and silver prices.
→ However, precious metal prices dipped slightly yesterday after Fed Chair Jerome Powell adjusted expectations regarding further rate cuts this year, stating that the Fed would not rush into making more reductions.
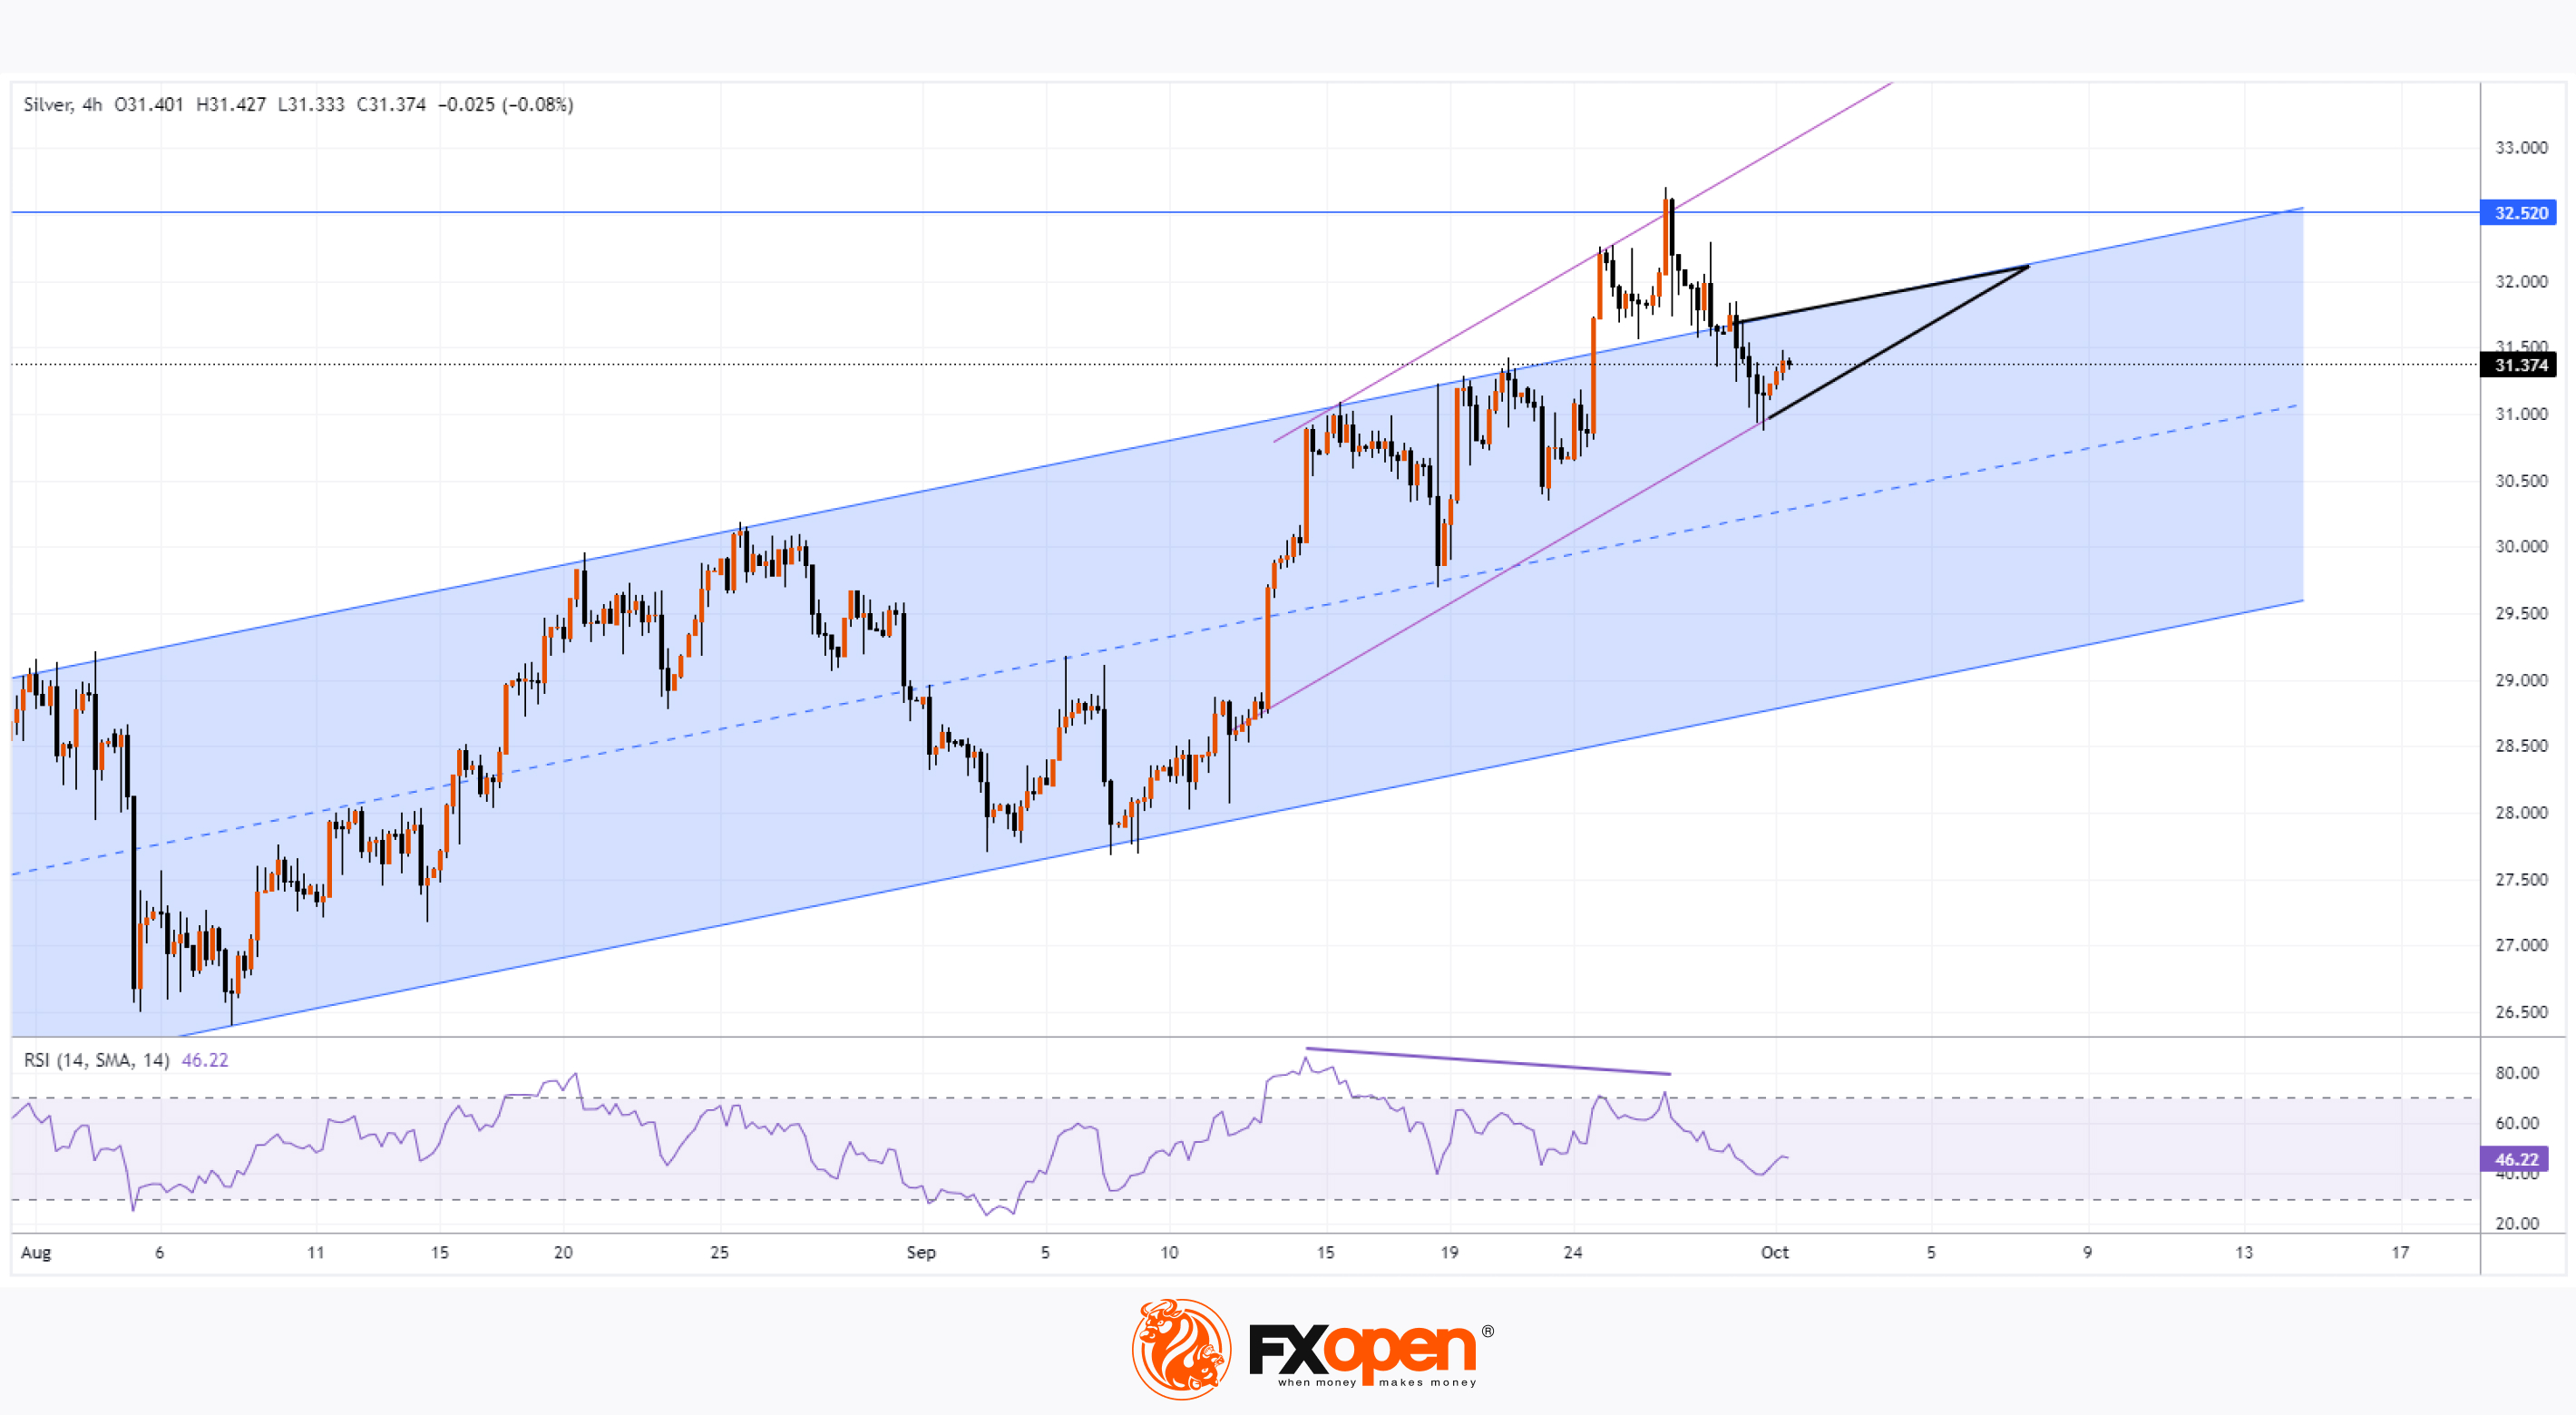
Technical analysis of the XAG/USD chart reveals:
→ Since August, the price of silver has formed an ascending channel (shown in blue). In September, bullish sentiment strengthened, establishing points for a steeper upward channel (marked by purple lines).
→ The price surge at the end of September caused the RSI indicator to form a bearish divergence, making silver vulnerable to a correction after hitting a historic high – which is what followed.
What comes next?
It largely depends on upcoming fundamental news. Currently, silver’s price appears to be in consolidation, confined by the triangle formed by the boundaries of the two channels (shown by black lines). A breakout from this triangle could potentially lead to a significant trend forming.
Start trading commodities with tight spreads. Open your trading account now or learn more about trading commodity CFDs with FXOpen.
CFDs are complex instruments and come with a high risk of losing your money.
This article represents the opinion of the Companies operating under the FXOpen brand only. It is not to be construed as an offer, solicitation, or recommendation with respect to products and services provided by the Companies operating under the FXOpen brand, nor is it to be considered financial advice.
XAG/USD Analysis: Silver Price Fails to Hold at 11-Year High
As shown on the XAG/USD chart, during the trading session on 26th September, the price of silver surpassed the previous 2024 high (set in July), reaching levels last seen in December 2012.
Key drivers of silver’s price include news related to the Federal Reserve’s policy:
→ Last month, when the Federal Reserve cut interest rates, it led to a rise in both gold and silver prices.
→ However, precious metal prices dipped slightly yesterday after Fed Chair Jerome Powell adjusted expectations regarding further rate cuts this year, stating that the Fed would not rush into making more reductions.
Technical analysis of the XAG/USD chart reveals:
→ Since August, the price of silver has formed an ascending channel (shown in blue). In September, bullish sentiment strengthened, establishing points for a steeper upward channel (marked by purple lines).
→ The price surge at the end of September caused the RSI indicator to form a bearish divergence, making silver vulnerable to a correction after hitting a historic high – which is what followed.
What comes next?
It largely depends on upcoming fundamental news. Currently, silver’s price appears to be in consolidation, confined by the triangle formed by the boundaries of the two channels (shown by black lines). A breakout from this triangle could potentially lead to a significant trend forming.
Start trading commodities with tight spreads. Open your trading account now or learn more about trading commodity CFDs with FXOpen.
CFDs are complex instruments and come with a high risk of losing your money.
This article represents the opinion of the Companies operating under the FXOpen brand only. It is not to be construed as an offer, solicitation, or recommendation with respect to products and services provided by the Companies operating under the FXOpen brand, nor is it to be considered financial advice.
👍3
#EURUSD #marketanalysis #MarketNews
EUR/USD Rate Accelerates Decline Following European Inflation News
According to the Eurostat data released today:
→ Core CPI Flash Estimate (YoY): actual = 2.7%, expected = 2.7%, previous = 2.8%;
→ CPI Flash Estimate (YoY): actual = 1.8%, expected = 1.8%, previous = 2.2%.
This news, coupled with yesterday’s statements from the Fed Chair, led to the EUR/USD rate dropping by over 1% from yesterday’s high.
Could the downward trend continue?
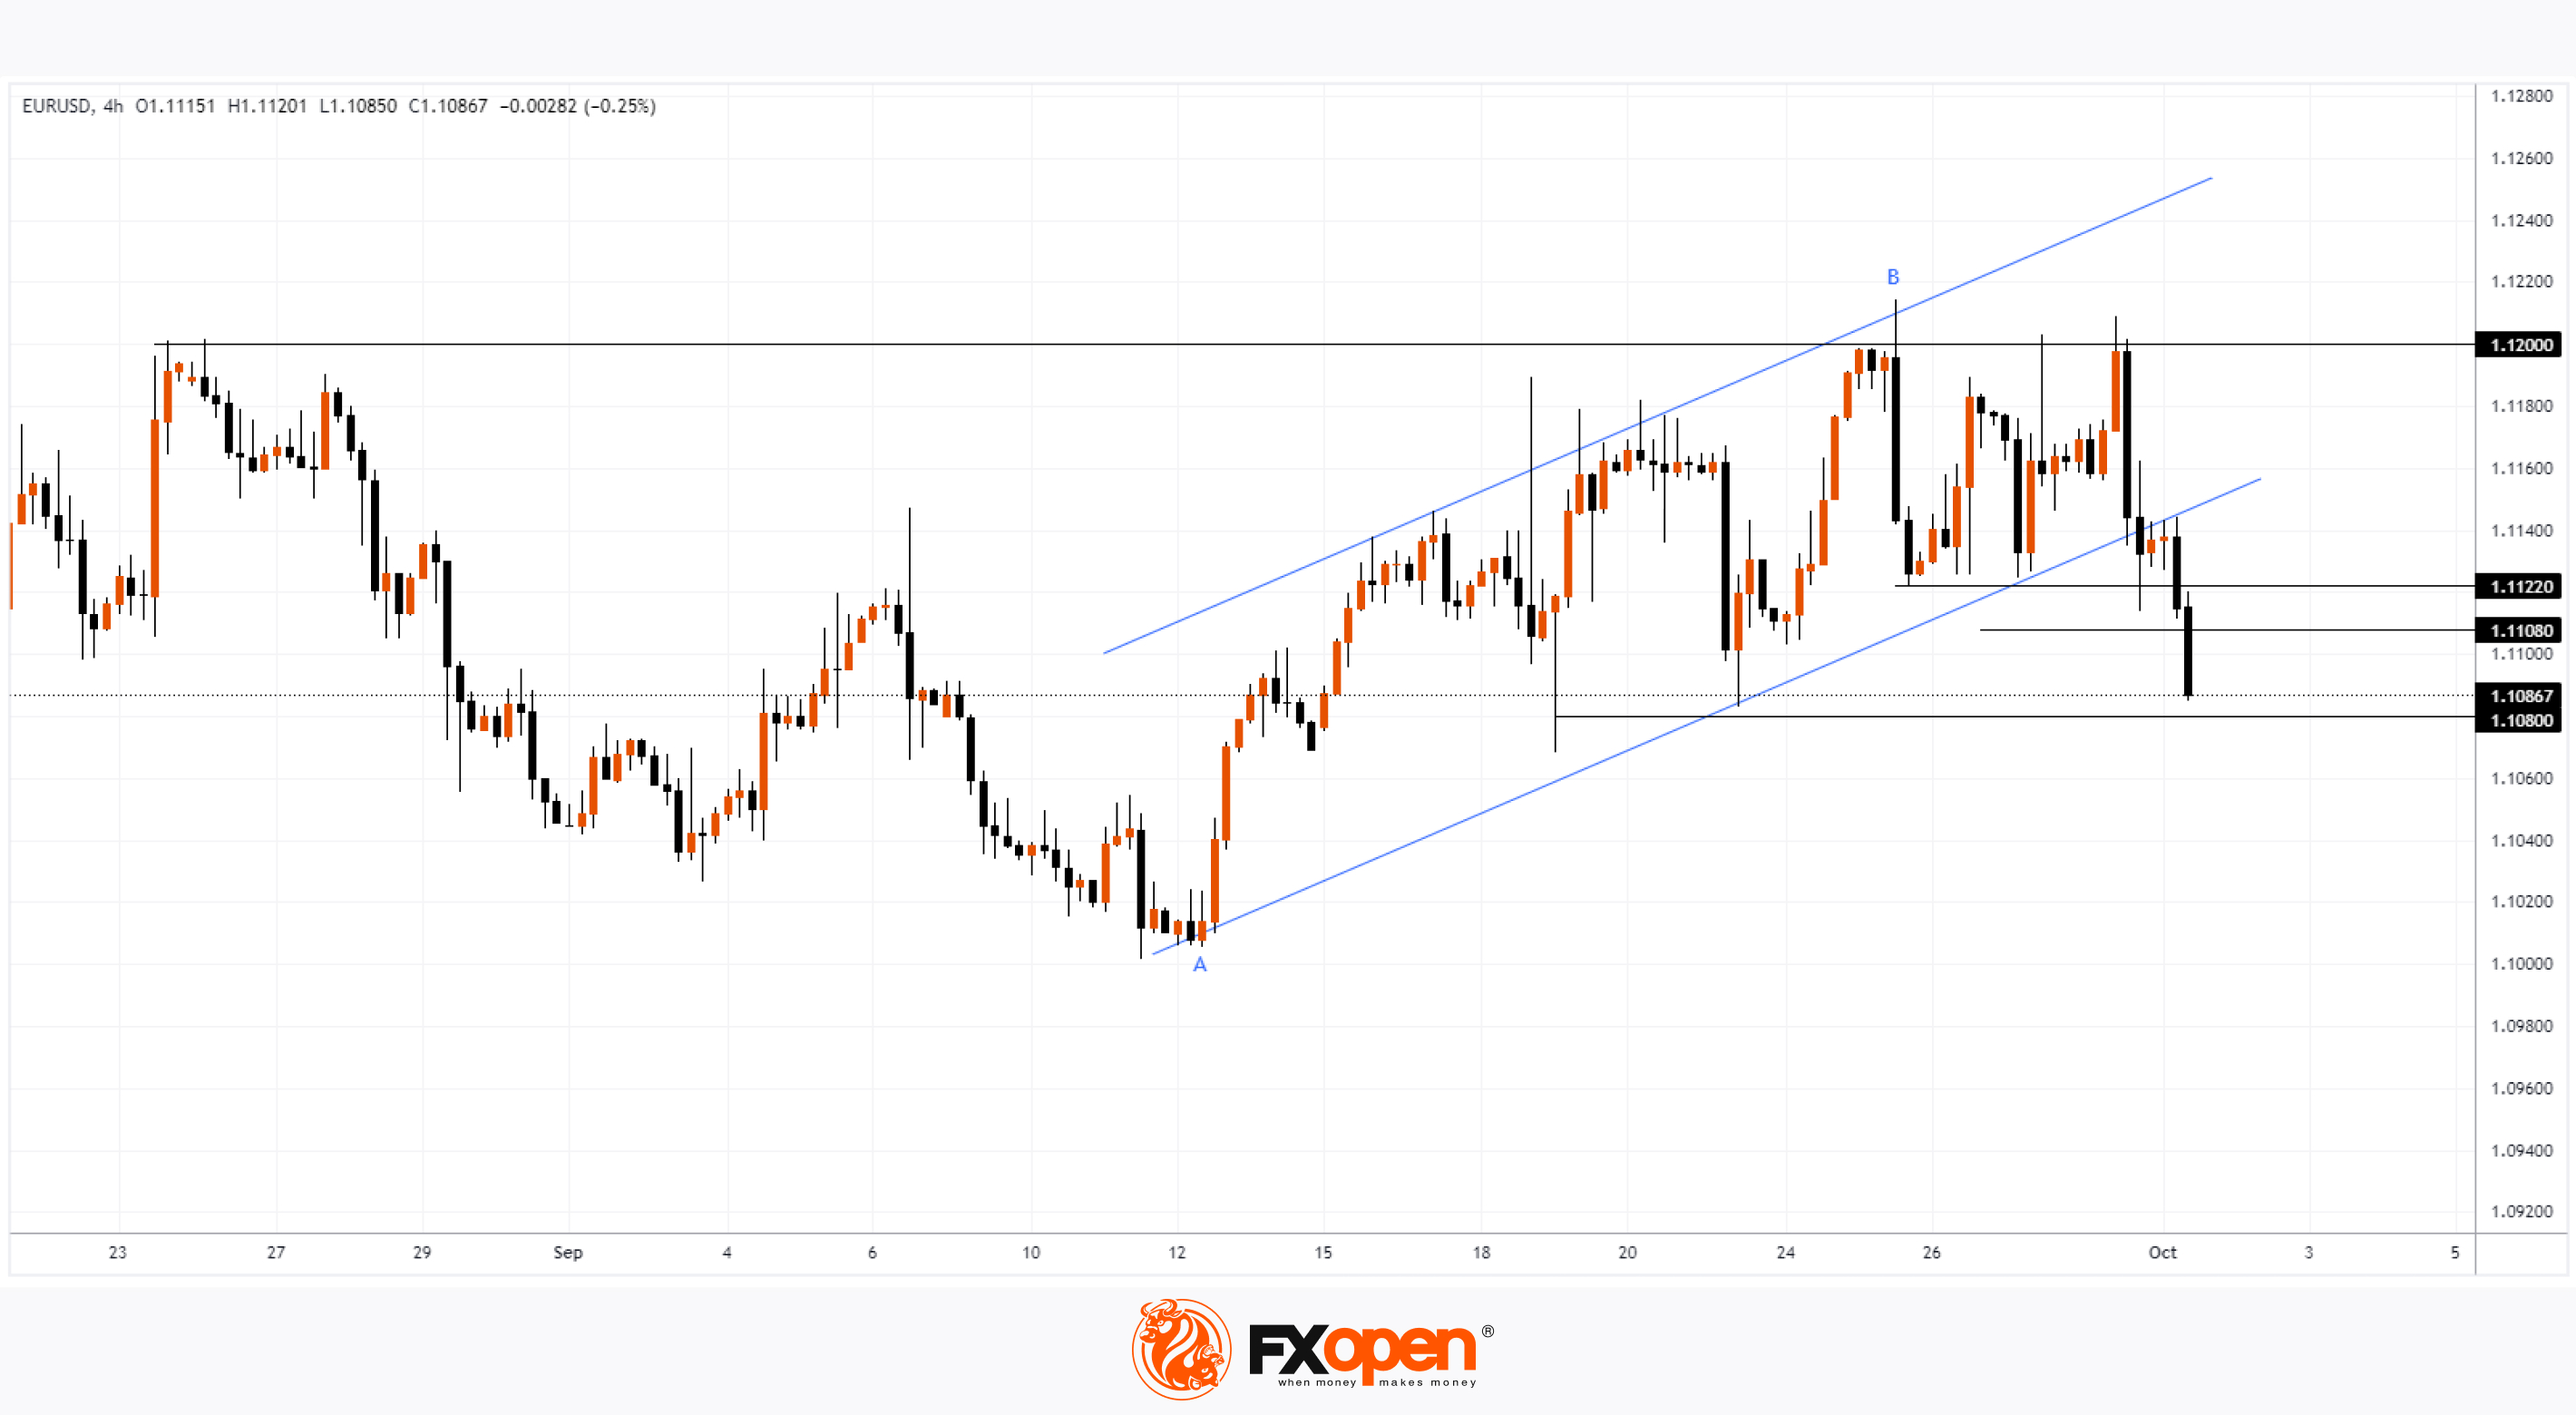
Technical analysis of the EUR/USD chart shows that:
→ In the second half of September, bullish sentiment dominated, resulting in the formation of an ascending channel (shown in blue). However, near the key resistance at 1.1200 (drawn from the August peak), the bullish momentum faded, and the price entered a range between 1.1200 and 1.1122.
→ The bearish momentum that started from yesterday’s peak (B) is developing strongly. The price has broken both the lower boundary of the 1.1122 range and the lower boundary of the blue channel. Moreover, it has dropped below 1.1108, approximately the 50% retracement of the A→B rise.
This suggests that the first day of October could see bulls losing much of the gains from the previous month. A glimmer of hope for them may lie in the psychological support at 1.1080.
Trade over 50 forex markets 24 hours a day with FXOpen. Take advantage of low commissions, deep liquidity, and spreads from 0.0 pips. Open your FXOpen account now or learn more about trading forex with FXOpen.
CFDs are complex instruments and come with a high risk of losing your money.
This article represents the opinion of the Companies operating under the FXOpen brand only. It is not to be construed as an offer, solicitation, or recommendation with respect to products and services provided by the Companies operating under the FXOpen brand, nor is it to be considered financial advice.
EUR/USD Rate Accelerates Decline Following European Inflation News
According to the Eurostat data released today:
→ Core CPI Flash Estimate (YoY): actual = 2.7%, expected = 2.7%, previous = 2.8%;
→ CPI Flash Estimate (YoY): actual = 1.8%, expected = 1.8%, previous = 2.2%.
This news, coupled with yesterday’s statements from the Fed Chair, led to the EUR/USD rate dropping by over 1% from yesterday’s high.
Could the downward trend continue?
Technical analysis of the EUR/USD chart shows that:
→ In the second half of September, bullish sentiment dominated, resulting in the formation of an ascending channel (shown in blue). However, near the key resistance at 1.1200 (drawn from the August peak), the bullish momentum faded, and the price entered a range between 1.1200 and 1.1122.
→ The bearish momentum that started from yesterday’s peak (B) is developing strongly. The price has broken both the lower boundary of the 1.1122 range and the lower boundary of the blue channel. Moreover, it has dropped below 1.1108, approximately the 50% retracement of the A→B rise.
This suggests that the first day of October could see bulls losing much of the gains from the previous month. A glimmer of hope for them may lie in the psychological support at 1.1080.
Trade over 50 forex markets 24 hours a day with FXOpen. Take advantage of low commissions, deep liquidity, and spreads from 0.0 pips. Open your FXOpen account now or learn more about trading forex with FXOpen.
CFDs are complex instruments and come with a high risk of losing your money.
This article represents the opinion of the Companies operating under the FXOpen brand only. It is not to be construed as an offer, solicitation, or recommendation with respect to products and services provided by the Companies operating under the FXOpen brand, nor is it to be considered financial advice.
👍3
#brentoil #marketanalysis #MarketNews #oilprices
XBR/USD Analysis: Brent Oil Price Soars After Attack on Israel
Following Israel's military operation in Lebanon, Iran launched a missile strike on Israel on October 1. Financial markets reacted sharply as soon as the first reports of the attack emerged:
→ U.S. stock indices dropped significantly, and Bitcoin also fell, with BTC/USD nearing the psychological $60,000 mark at yesterday's low.
→ Gold surged to $2670, though supply forces have since curbed the panic buying, and XAU/USD has dropped back below $2650.
Oil prices also spiked. Unlike other financial assets, there has been no correction on the XBR/USD chart today, despite the end of the missile strike on Israel. This highlights oil's heightened sensitivity to Middle Eastern tensions.
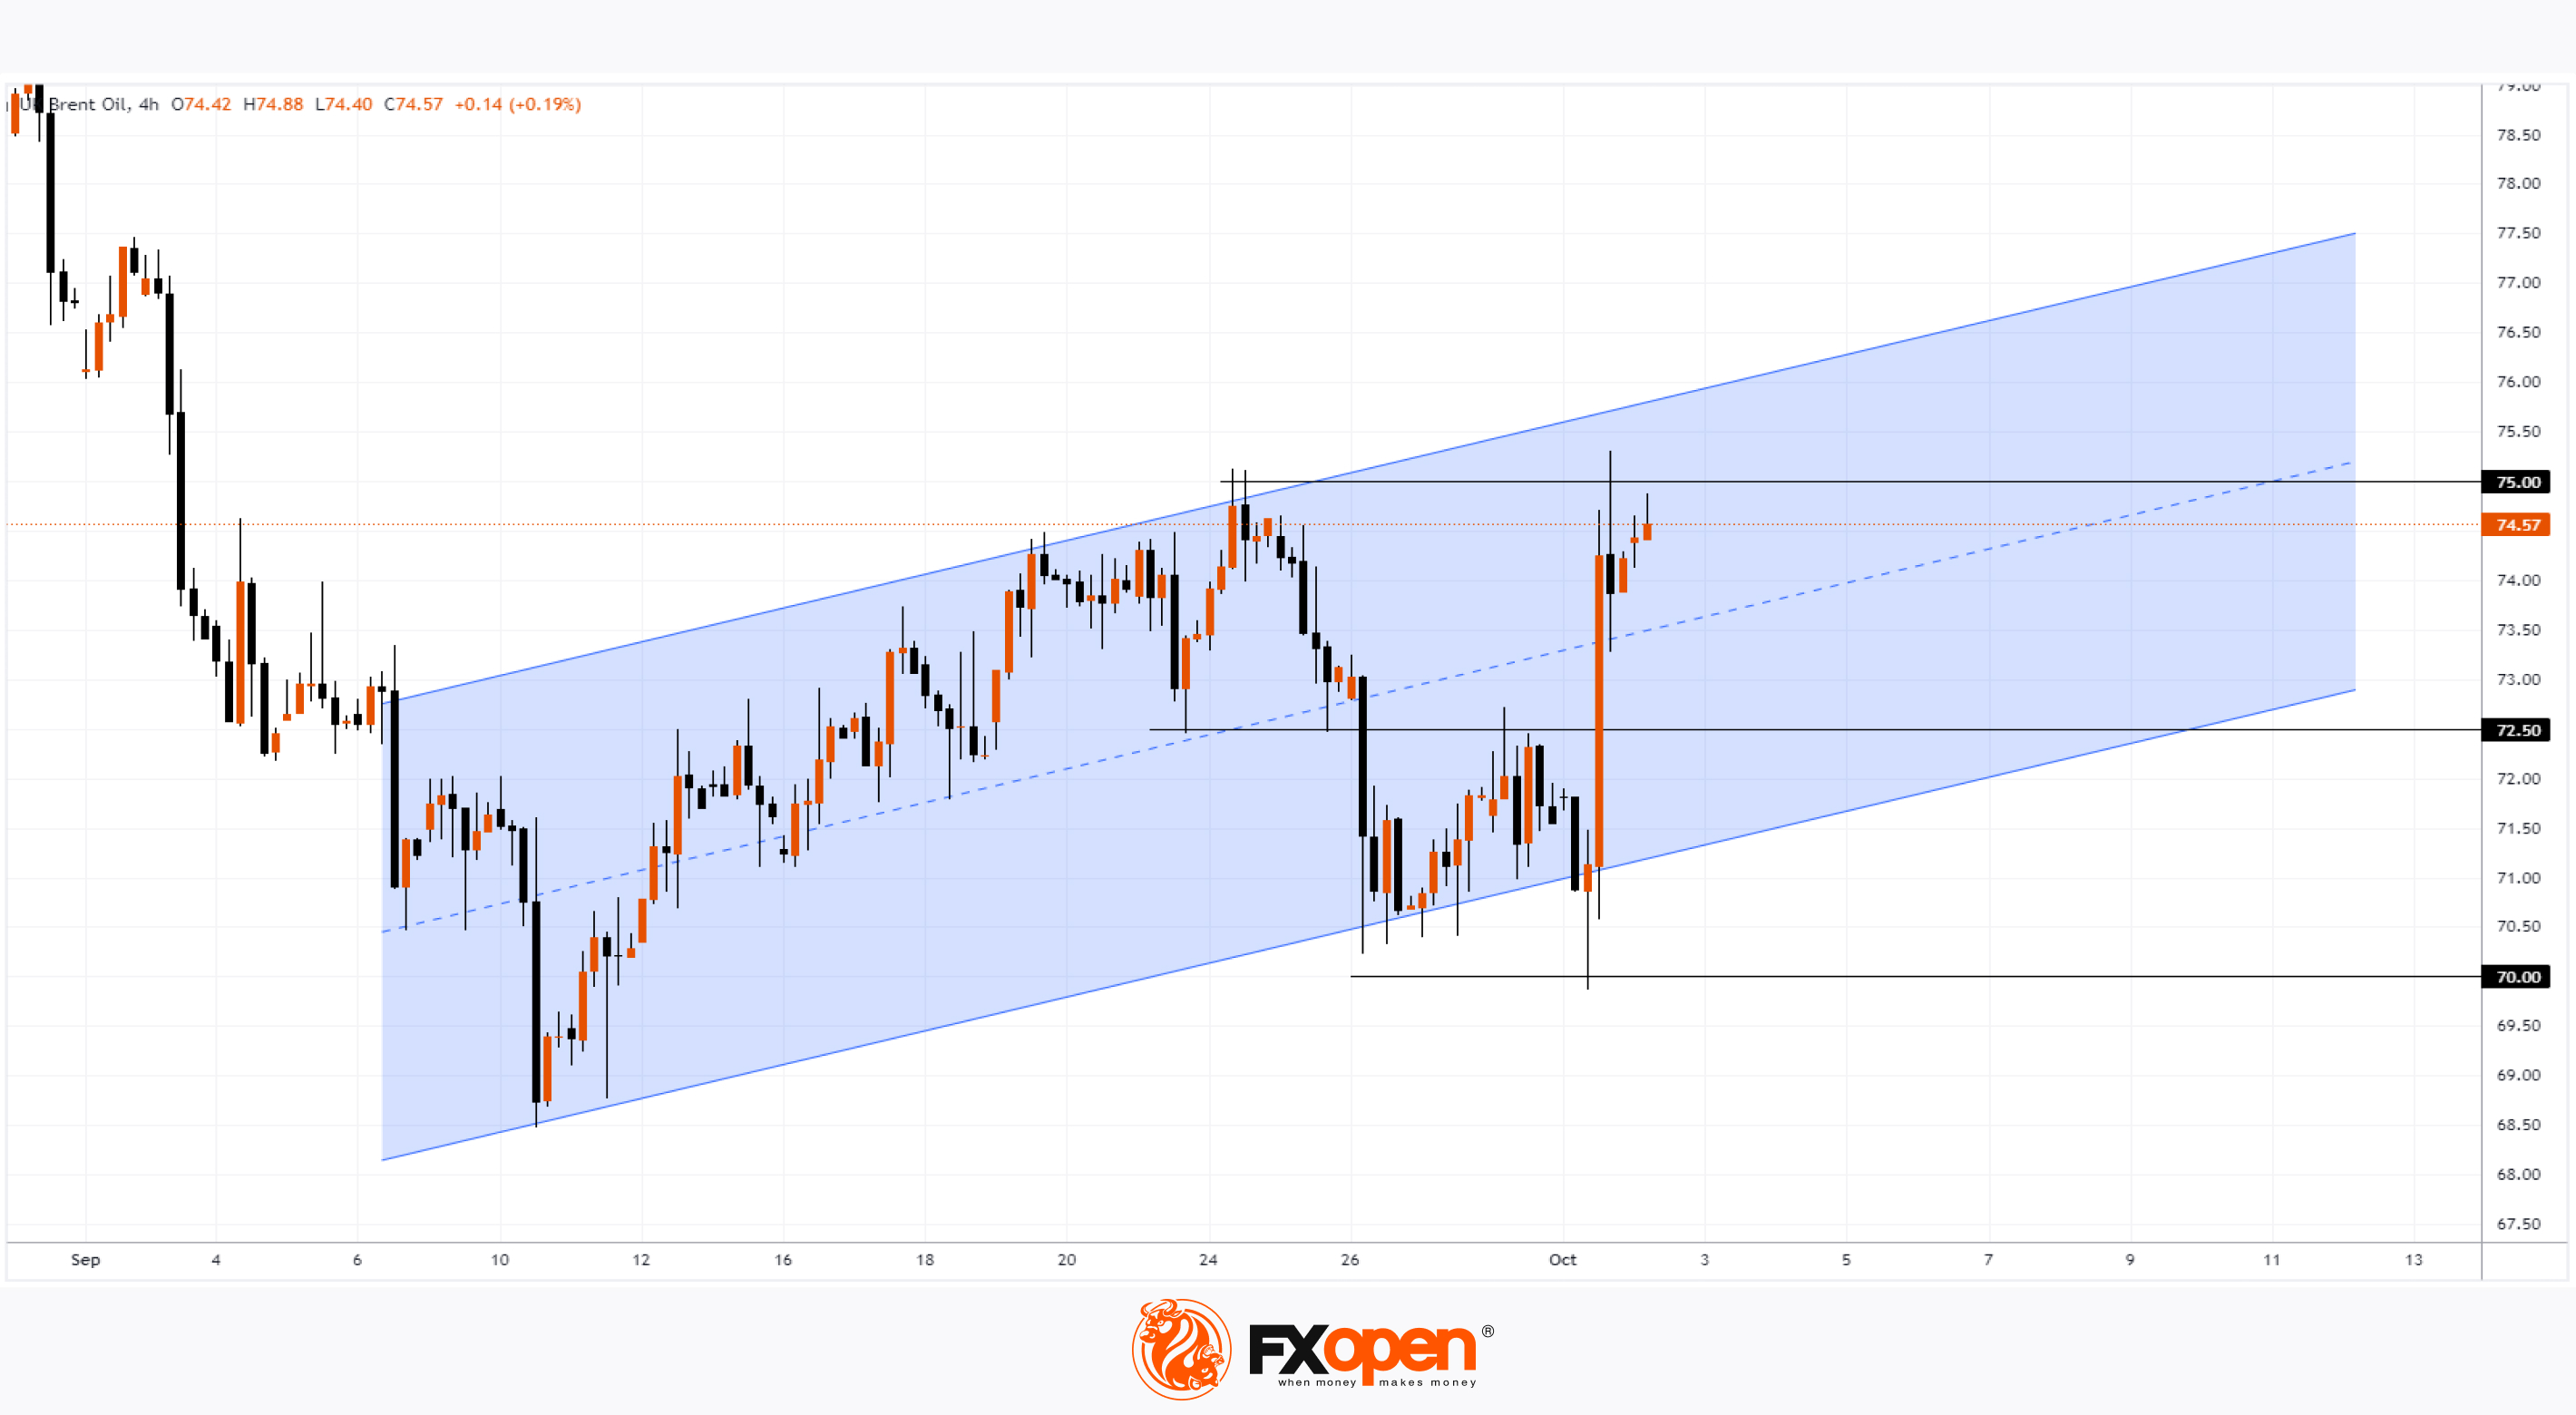
According to today’s technical analysis of XBR/USD:
→ Brent oil price movements have formed an upward channel (shown in blue), beginning in early September. Following the news of the missile attack, the price has climbed into the upper half of the channel.
→ Interestingly, just before this surge, the price had hit a multi-week low with a false bearish breakout below the psychological $70 per barrel level.
Given Israel’s vow to retaliate for Iran's strike, it’s reasonable to assume that oil demand may remain high, potentially pushing XBR/USD towards the upper boundary of the channel, surpassing the current resistance at $75.
Brent oil could find support at the median line of the blue channel and the $72.50 level.
Start trading commodities with tight spreads. Open your trading account now or learn more about trading commodity CFDs with FXOpen.
CFDs are complex instruments and come with a high risk of losing your money.
This article represents the opinion of the Companies operating under the FXOpen brand only. It is not to be construed as an offer, solicitation, or recommendation with respect to products and services provided by the Companies operating under the FXOpen brand, nor is it to be considered financial advice.
XBR/USD Analysis: Brent Oil Price Soars After Attack on Israel
Following Israel's military operation in Lebanon, Iran launched a missile strike on Israel on October 1. Financial markets reacted sharply as soon as the first reports of the attack emerged:
→ U.S. stock indices dropped significantly, and Bitcoin also fell, with BTC/USD nearing the psychological $60,000 mark at yesterday's low.
→ Gold surged to $2670, though supply forces have since curbed the panic buying, and XAU/USD has dropped back below $2650.
Oil prices also spiked. Unlike other financial assets, there has been no correction on the XBR/USD chart today, despite the end of the missile strike on Israel. This highlights oil's heightened sensitivity to Middle Eastern tensions.
According to today’s technical analysis of XBR/USD:
→ Brent oil price movements have formed an upward channel (shown in blue), beginning in early September. Following the news of the missile attack, the price has climbed into the upper half of the channel.
→ Interestingly, just before this surge, the price had hit a multi-week low with a false bearish breakout below the psychological $70 per barrel level.
Given Israel’s vow to retaliate for Iran's strike, it’s reasonable to assume that oil demand may remain high, potentially pushing XBR/USD towards the upper boundary of the channel, surpassing the current resistance at $75.
Brent oil could find support at the median line of the blue channel and the $72.50 level.
Start trading commodities with tight spreads. Open your trading account now or learn more about trading commodity CFDs with FXOpen.
CFDs are complex instruments and come with a high risk of losing your money.
This article represents the opinion of the Companies operating under the FXOpen brand only. It is not to be construed as an offer, solicitation, or recommendation with respect to products and services provided by the Companies operating under the FXOpen brand, nor is it to be considered financial advice.
👍4
#GBPCAD #forextrading #tradingtips #marketanalysis
Analysis of GBP/CAD: Price Falls Below 1.800 Level
In the first nine months of 2024, the GBP/CAD exchange rate rose by over 7%, surpassing the significant 1.800 level.
The last time GBP/CAD remained consistently above this level was back in 2016, but it later dropped below. Since then, bulls have made two attempts to push the price above 1.800: in 2018 and again in 2020 (during the coronavirus panic) – both of which failed.
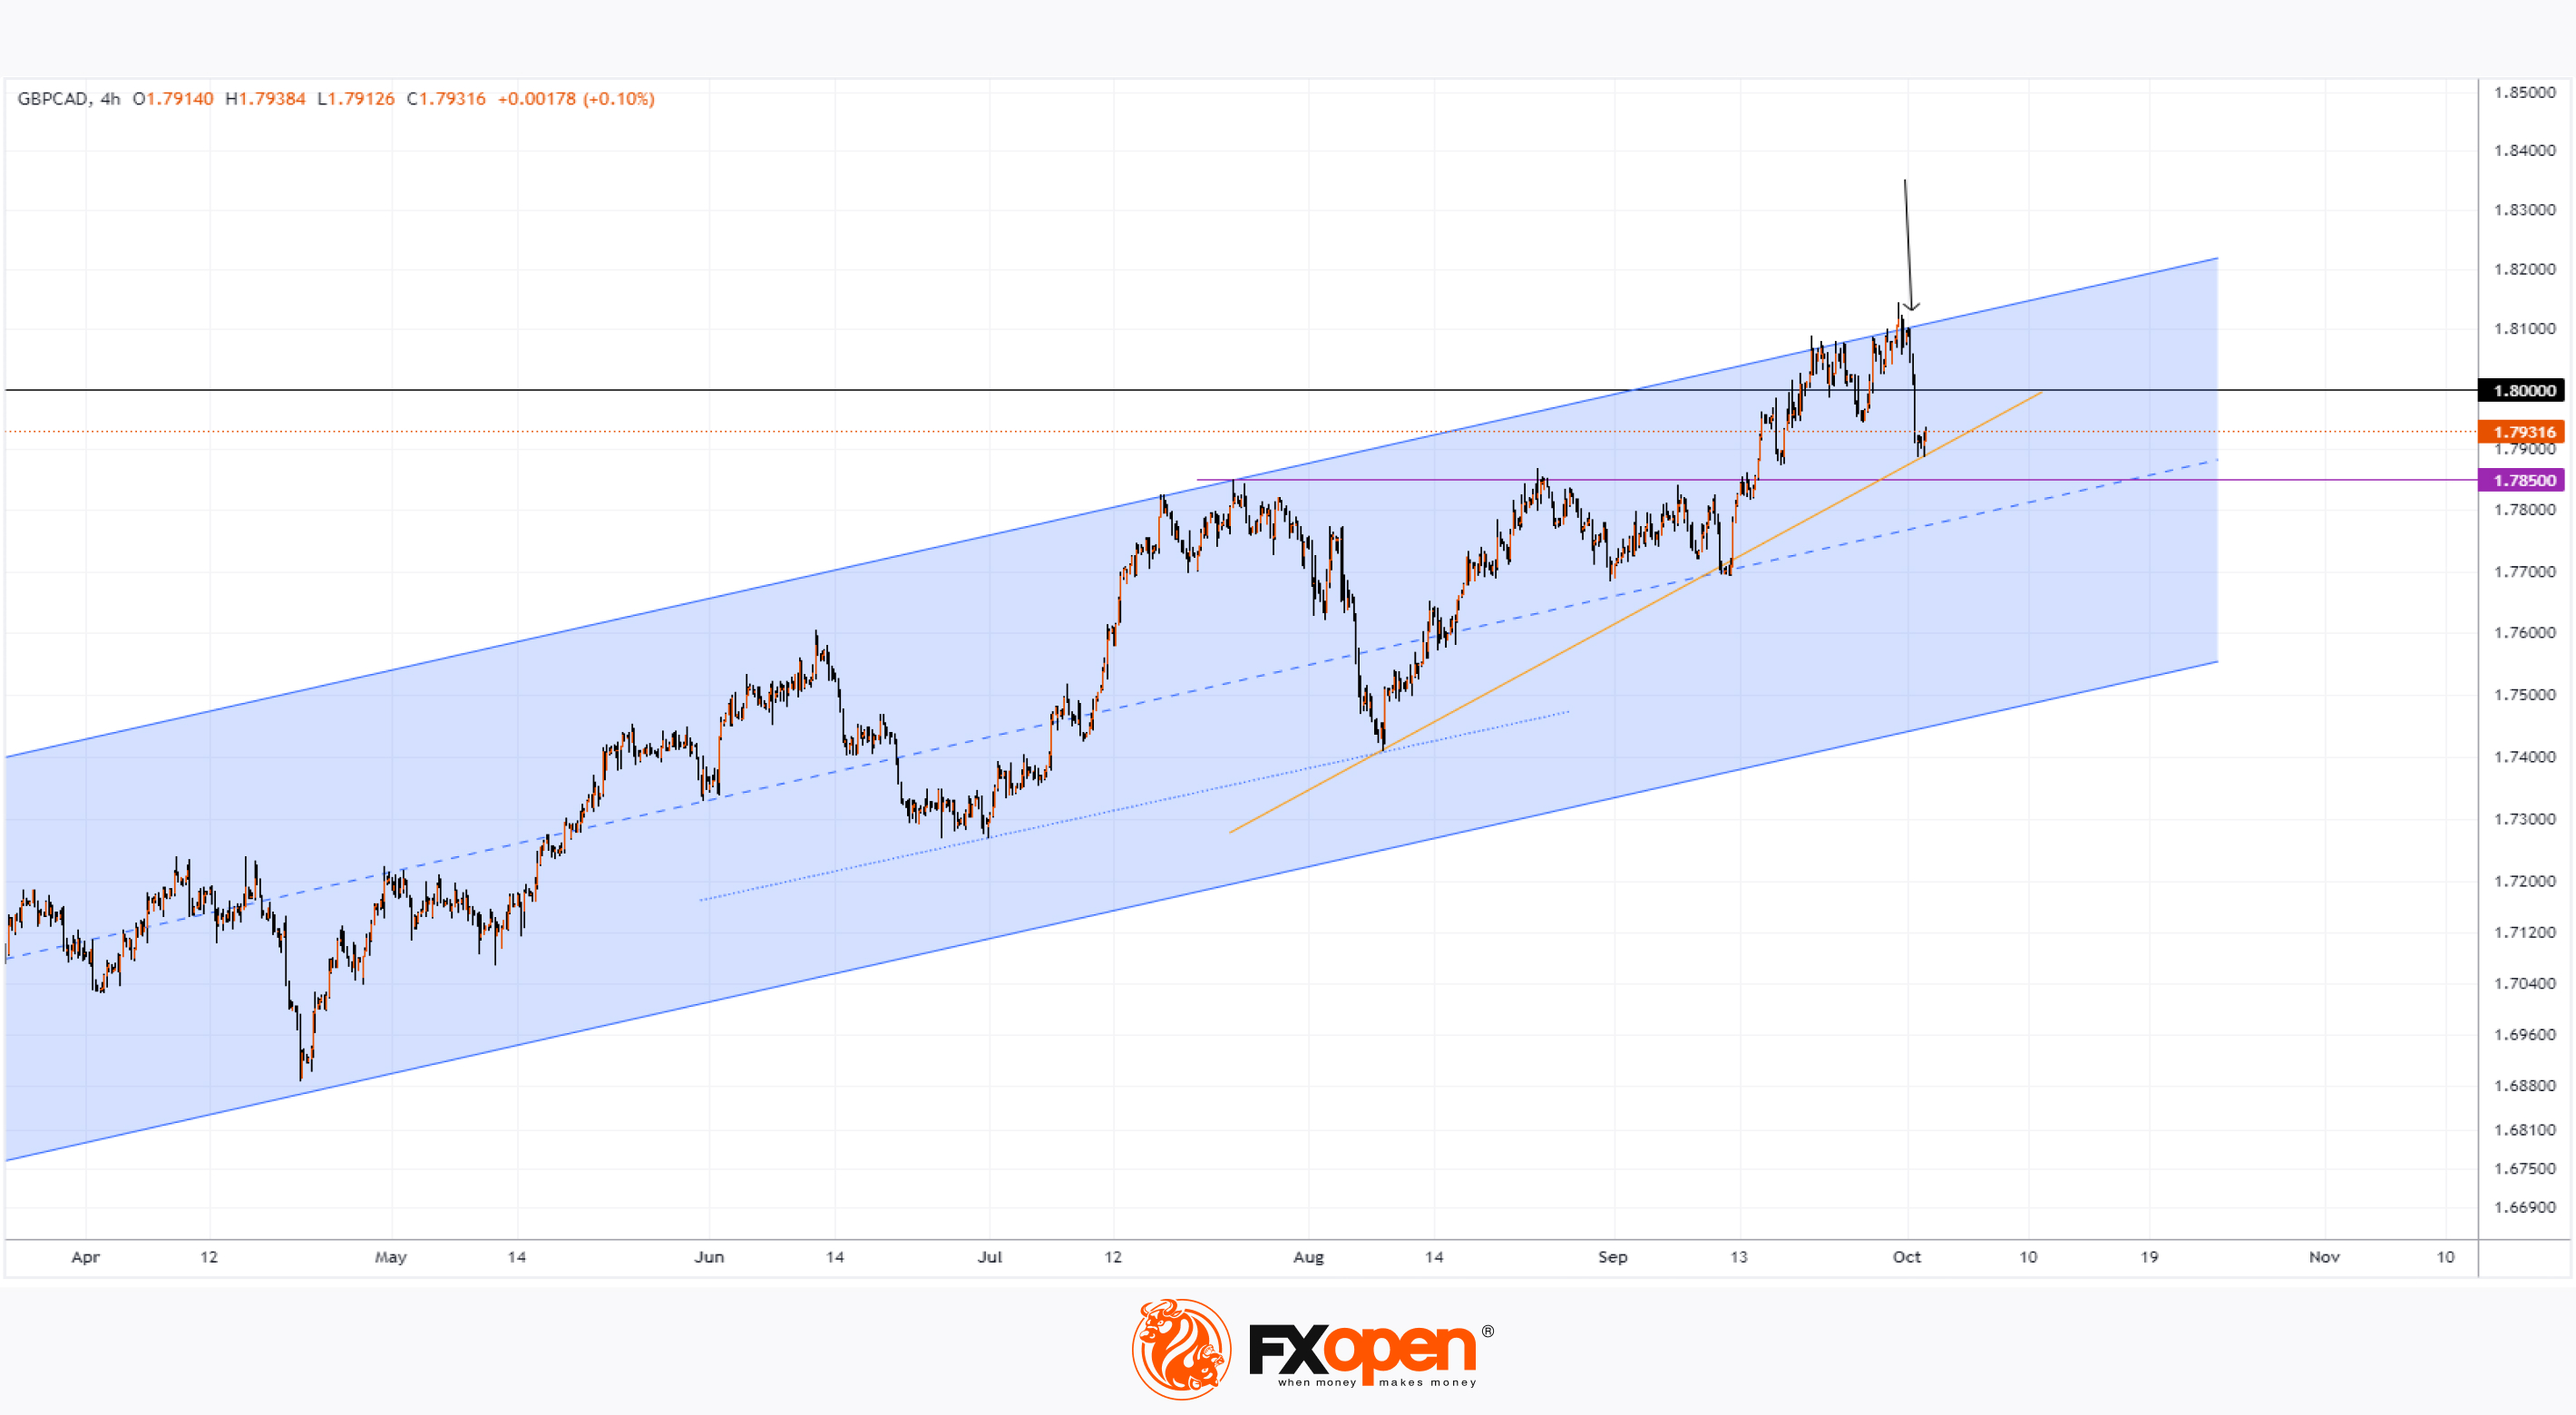
A third attempt occurred when GBP/CAD climbed above 1.800 in September 2024, but yesterday’s large bearish candles (marked with an arrow) suggest that this attempt to stay above 1.800 may also fail.
Yesterday’s decline in GBP/CAD was driven by a combination of factors, including:
→ A rise in oil prices, which strengthens the Canadian dollar as Canada is a major exporter of oil;
→ A slowdown in manufacturing activity in the UK during September, as reported by Reuters.
Technical analysis of the GBP/CAD chart shows the price is moving within an ascending channel (marked in blue), which has remained relevant since the start of 2024.
Support levels for the price could be
→ The 1.78500 level (which acted as resistance from mid-July before being broken in September);
→ The median line of the ascending channel;
→ The orange trendline.
However, it is possible that these support levels may not be strong enough to ensure that GBP/CAD can consistently hold above the 1.800 level, which has historically acted as key resistance.
Trade over 50 forex markets 24 hours a day with FXOpen. Take advantage of low commissions, deep liquidity, and spreads from 0.0 pips. Open your FXOpen account now or learn more about trading forex with FXOpen.
CFDs are complex instruments and come with a high risk of losing your money.
This article represents the opinion of the Companies operating under the FXOpen brand only. It is not to be construed as an offer, solicitation, or recommendation with respect to products and services provided by the Companies operating under the FXOpen brand, nor is it to be considered financial advice.
Analysis of GBP/CAD: Price Falls Below 1.800 Level
In the first nine months of 2024, the GBP/CAD exchange rate rose by over 7%, surpassing the significant 1.800 level.
The last time GBP/CAD remained consistently above this level was back in 2016, but it later dropped below. Since then, bulls have made two attempts to push the price above 1.800: in 2018 and again in 2020 (during the coronavirus panic) – both of which failed.
A third attempt occurred when GBP/CAD climbed above 1.800 in September 2024, but yesterday’s large bearish candles (marked with an arrow) suggest that this attempt to stay above 1.800 may also fail.
Yesterday’s decline in GBP/CAD was driven by a combination of factors, including:
→ A rise in oil prices, which strengthens the Canadian dollar as Canada is a major exporter of oil;
→ A slowdown in manufacturing activity in the UK during September, as reported by Reuters.
Technical analysis of the GBP/CAD chart shows the price is moving within an ascending channel (marked in blue), which has remained relevant since the start of 2024.
Support levels for the price could be
→ The 1.78500 level (which acted as resistance from mid-July before being broken in September);
→ The median line of the ascending channel;
→ The orange trendline.
However, it is possible that these support levels may not be strong enough to ensure that GBP/CAD can consistently hold above the 1.800 level, which has historically acted as key resistance.
Trade over 50 forex markets 24 hours a day with FXOpen. Take advantage of low commissions, deep liquidity, and spreads from 0.0 pips. Open your FXOpen account now or learn more about trading forex with FXOpen.
CFDs are complex instruments and come with a high risk of losing your money.
This article represents the opinion of the Companies operating under the FXOpen brand only. It is not to be construed as an offer, solicitation, or recommendation with respect to products and services provided by the Companies operating under the FXOpen brand, nor is it to be considered financial advice.
👍3
#marketanalysis #MarketNews #stockmarket
Lockheed Martin (LMT) Stock Price Surpasses $600 for the First Time
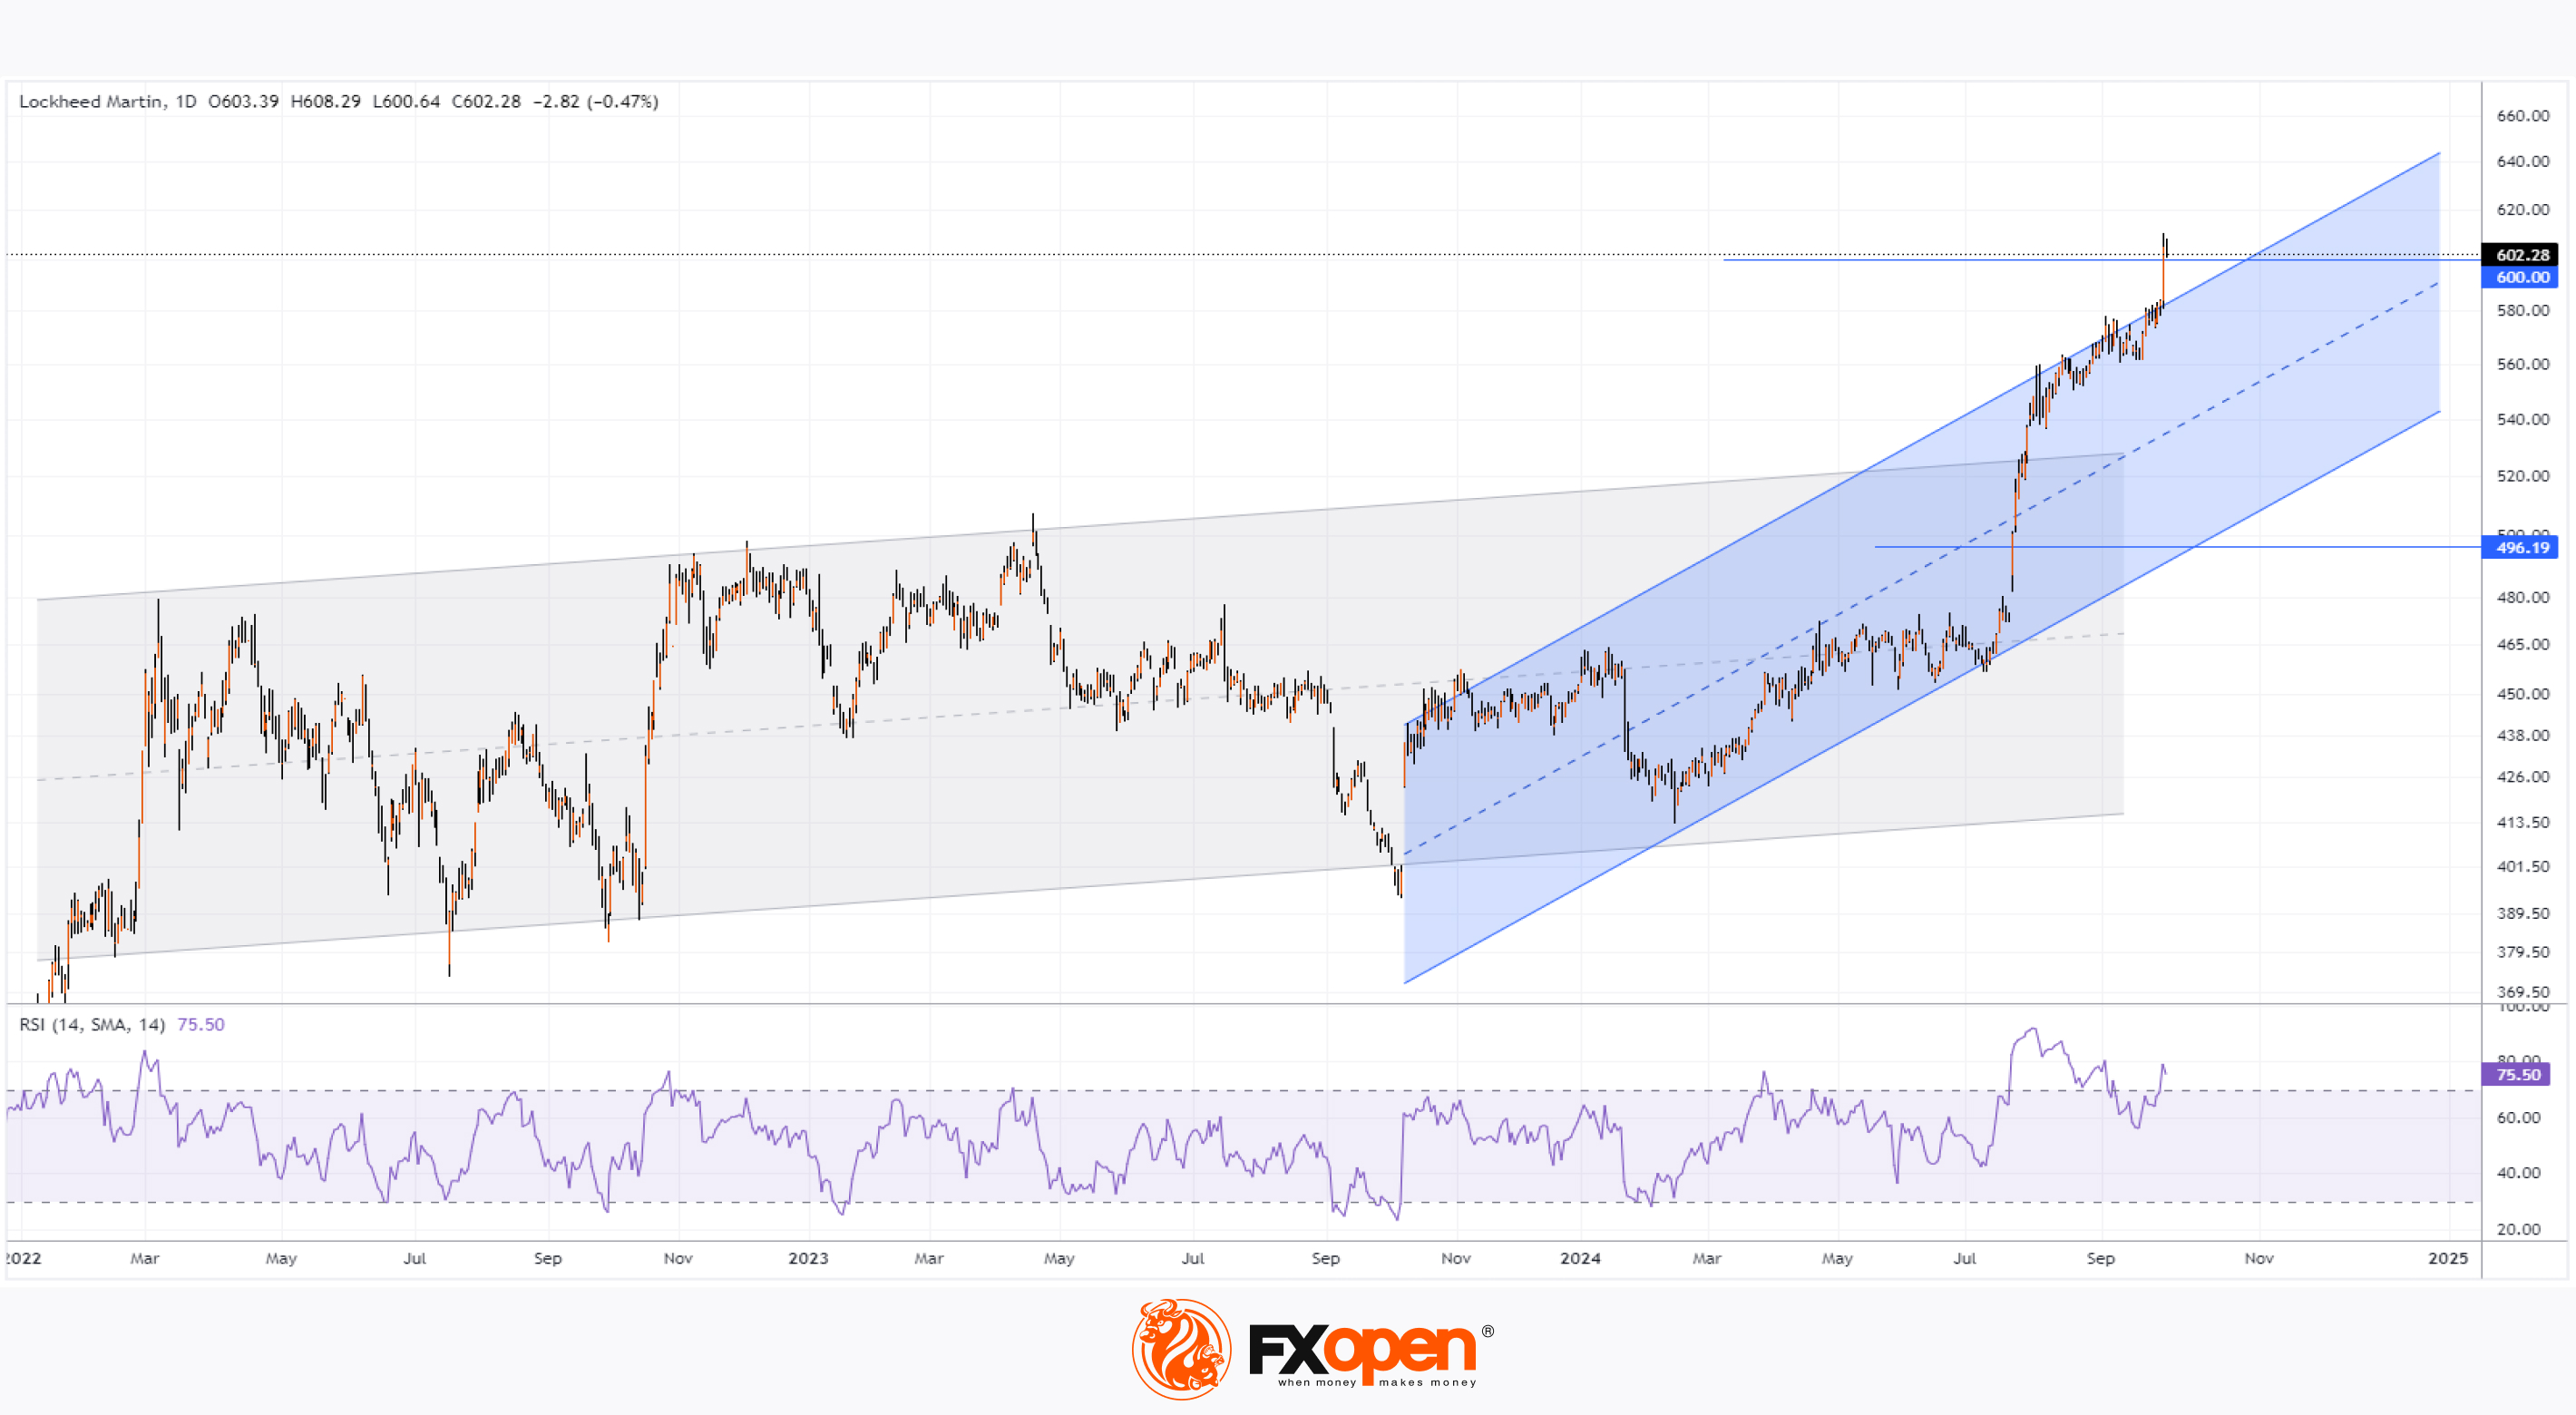
As indicated by the Lockheed Martin (LMT) stock chart, after breaking through the psychological barrier of $600, the price has reached an all-time high. Remarkably, it took less than 2.5 months for the stock to climb from $500 to $600.
Demand for Lockheed Martin (LMT) shares is being driven by consistent news of government contracts awarded to the company amid rising geopolitical tensions. These contracts include deals for F-35 Joint Strike Fighter aircraft, Trident II D5 missile production, and supplies for the U.S. missile defence system.
The surge in orders has enabled Lockheed Martin’s board of directors (NYSE: LMT) to announce an increase in dividends for Q4 2024 by $0.15, bringing them to $3.30 per share. It is worth noting that the company has raised its dividends for 22 consecutive years.
Technical analysis of the Lockheed Martin (LMT) chart today reveals a strongly bullish outlook:
→ Since February 2022, the price has moved within an upward channel (shown in grey);
→ From July 2024 onwards, the price action has required a steeper upward channel to capture its dynamics;
→ The RSI indicator is showing bearish divergences, yet the price continues to hit record highs.
It’s possible that the psychological $600 level could trigger profit-taking among investors, which may lead to a correction following the impressive rally – in this scenario, LMT shares could retrace to the median line of the blue channel.
According to TipRanks, the average 12-month price target for LMT is $579.14, which highlights the potential overvaluation of the stock at its current level.
Trade global index CFDs with zero commission and tight spreads. Open your FXOpen account now or learn more about trading index CFDs with FXOpen.
CFDs are complex instruments and come with a high risk of losing your money.
This article represents the opinion of the Companies operating under the FXOpen brand only. It is not to be construed as an offer, solicitation, or recommendation with respect to products and services provided by the Companies operating under the FXOpen brand, nor is it to be considered financial advice.
Lockheed Martin (LMT) Stock Price Surpasses $600 for the First Time
As indicated by the Lockheed Martin (LMT) stock chart, after breaking through the psychological barrier of $600, the price has reached an all-time high. Remarkably, it took less than 2.5 months for the stock to climb from $500 to $600.
Demand for Lockheed Martin (LMT) shares is being driven by consistent news of government contracts awarded to the company amid rising geopolitical tensions. These contracts include deals for F-35 Joint Strike Fighter aircraft, Trident II D5 missile production, and supplies for the U.S. missile defence system.
The surge in orders has enabled Lockheed Martin’s board of directors (NYSE: LMT) to announce an increase in dividends for Q4 2024 by $0.15, bringing them to $3.30 per share. It is worth noting that the company has raised its dividends for 22 consecutive years.
Technical analysis of the Lockheed Martin (LMT) chart today reveals a strongly bullish outlook:
→ Since February 2022, the price has moved within an upward channel (shown in grey);
→ From July 2024 onwards, the price action has required a steeper upward channel to capture its dynamics;
→ The RSI indicator is showing bearish divergences, yet the price continues to hit record highs.
It’s possible that the psychological $600 level could trigger profit-taking among investors, which may lead to a correction following the impressive rally – in this scenario, LMT shares could retrace to the median line of the blue channel.
According to TipRanks, the average 12-month price target for LMT is $579.14, which highlights the potential overvaluation of the stock at its current level.
Trade global index CFDs with zero commission and tight spreads. Open your FXOpen account now or learn more about trading index CFDs with FXOpen.
CFDs are complex instruments and come with a high risk of losing your money.
This article represents the opinion of the Companies operating under the FXOpen brand only. It is not to be construed as an offer, solicitation, or recommendation with respect to products and services provided by the Companies operating under the FXOpen brand, nor is it to be considered financial advice.
👍4
#stockmarket #stocktrading #MarketNews #marketanalysis
Boeing (BA) Shares Hover Near Two-Year Low
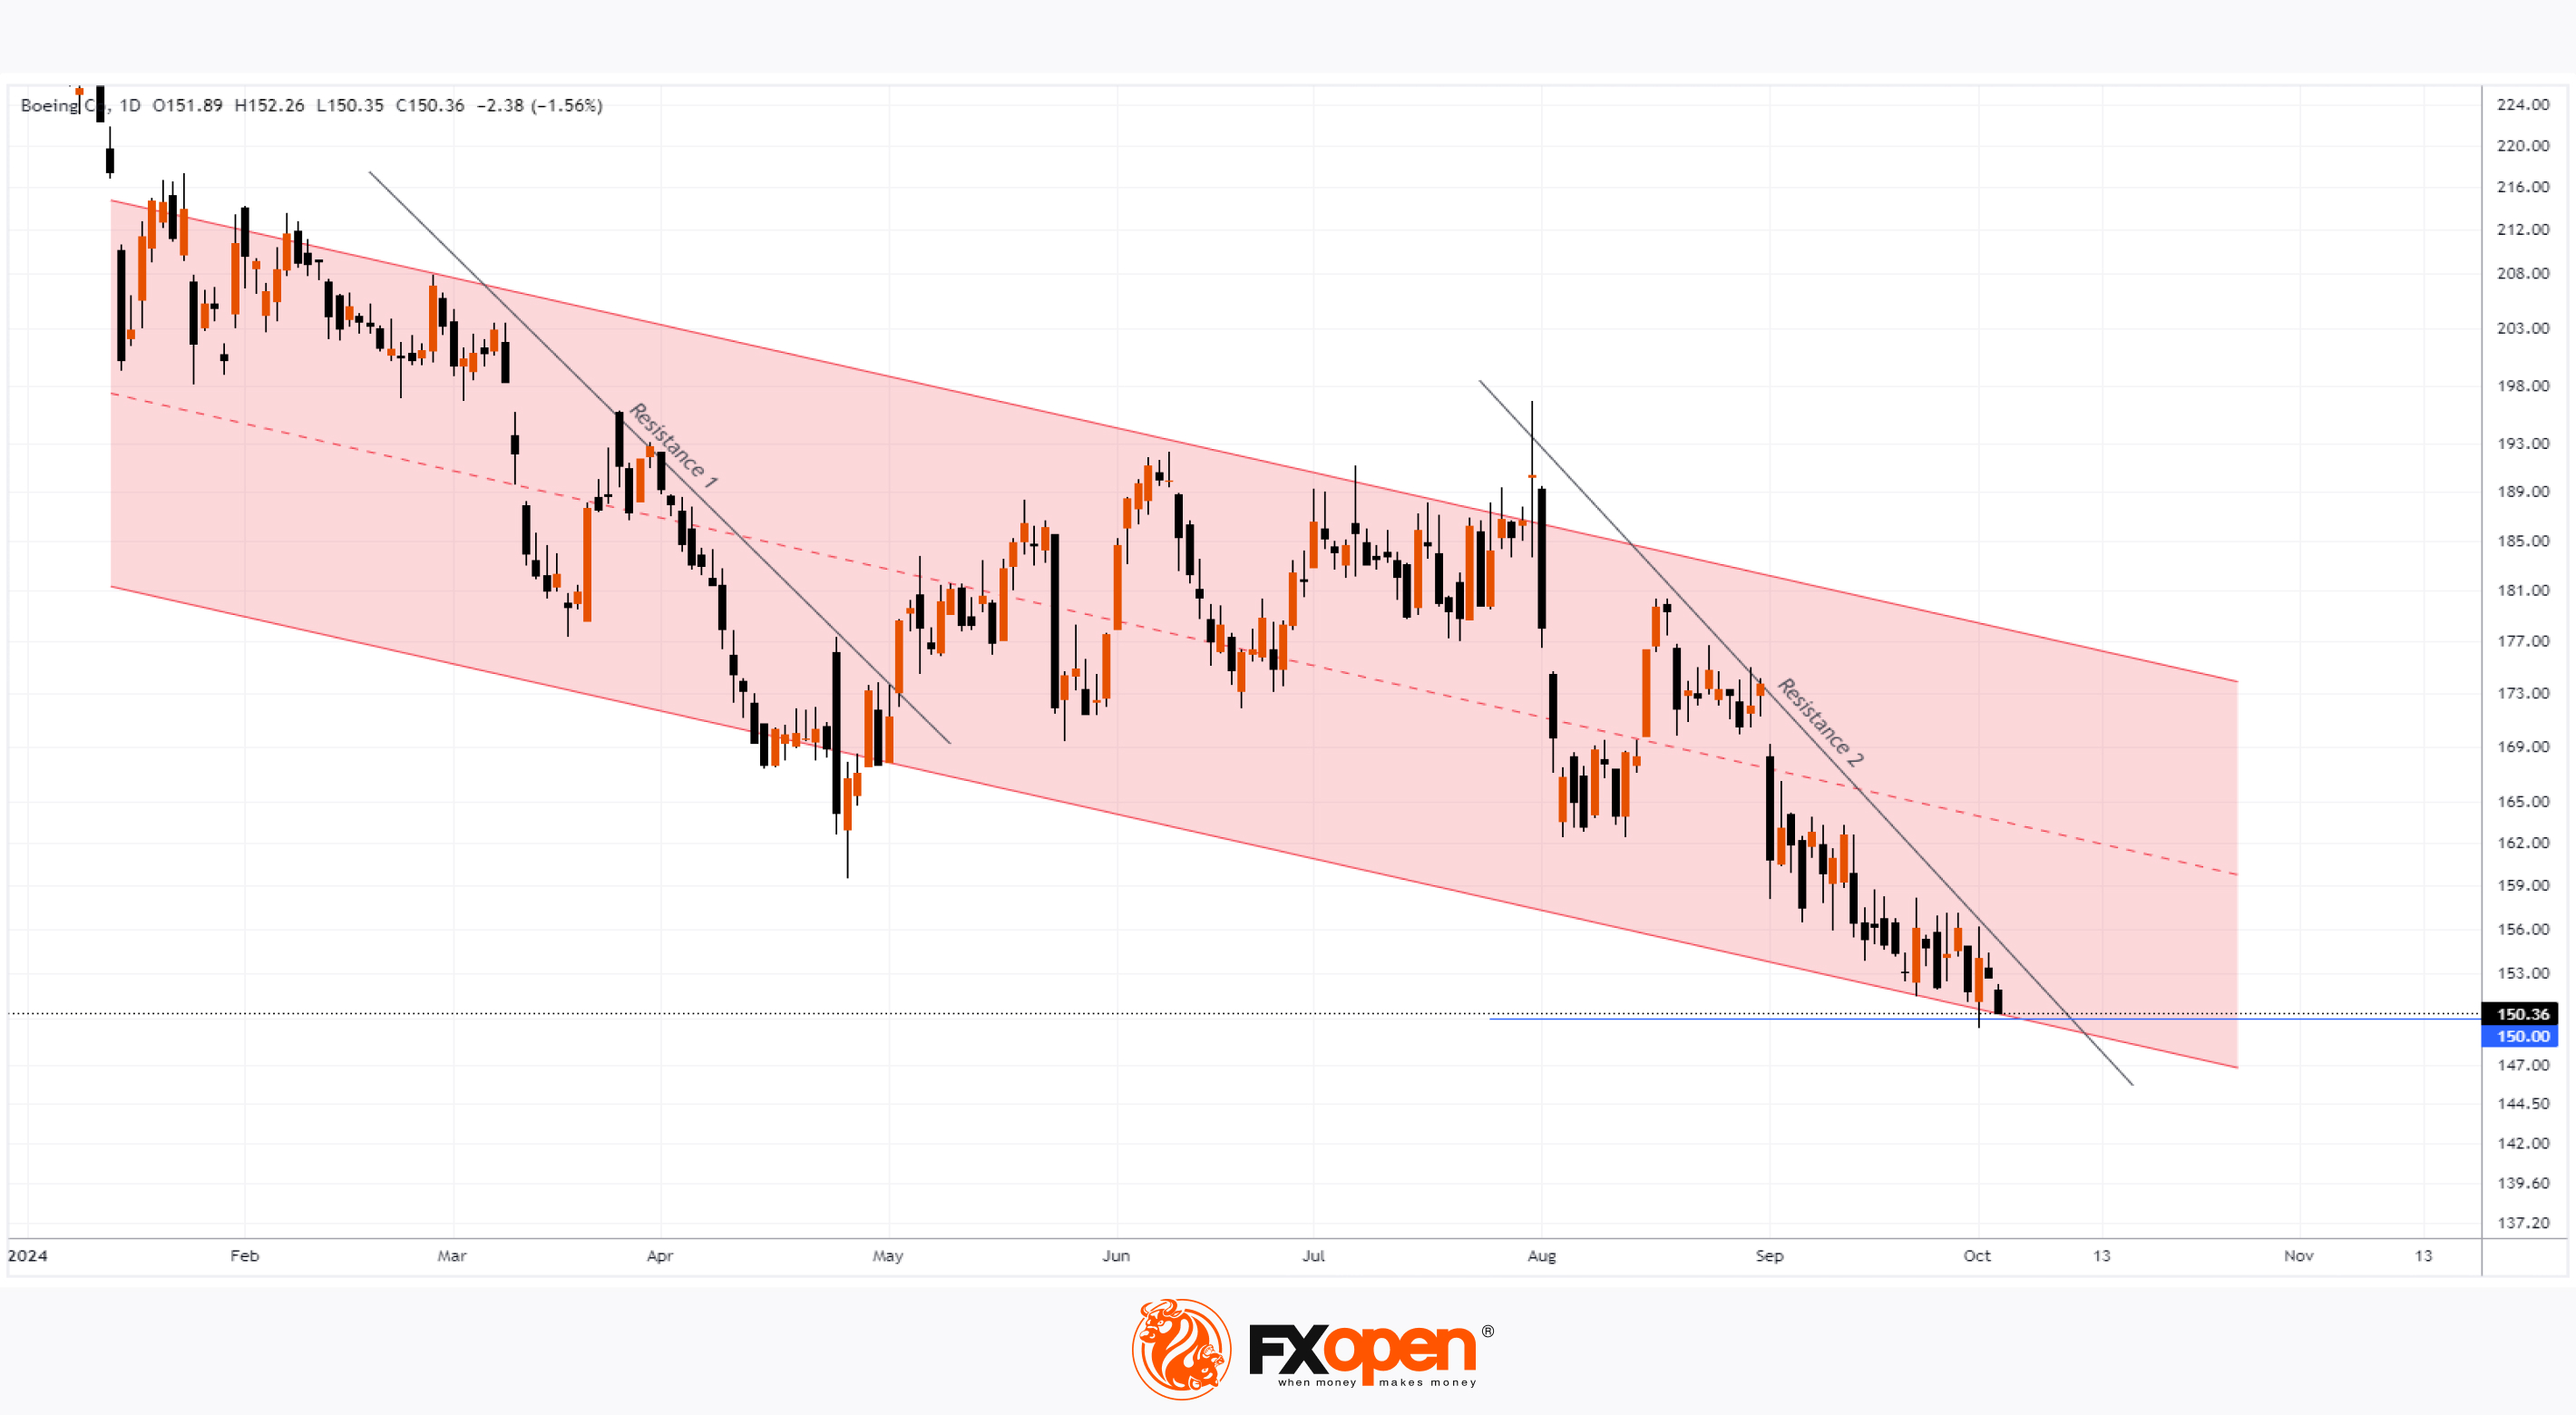
Despite the S&P 500 index (US SPX 500 mini on FXOpen) rising roughly 20% since the start of 2024, Boeing (BA) shares are currently around the psychological level of $150 – a low last seen in autumn 2022.
Several factors have driven bearish sentiment for Boeing in 2024:
→ Reputational setbacks due to technical issues, including helium leaks and engine malfunctions on the Starliner spacecraft intended for astronaut transport to the ISS.
→ Boeing has struggled to meet its aircraft delivery targets, and it reported significant financial losses in Q2 2024, with earnings per share nearly halving forecasted estimates, further impacting investor confidence.
→ Fines from the U.S. Department of Justice, worker strikes, and other operational challenges have compounded issues.
Technical analysis of Boeing’s (BA) chart reveals:
→ In 2024, the share price has formed a downward channel (marked in red), with the Resistance 2 trendline suggesting that bearish sentiment could intensify.
→ The price hovers near the channel’s lower boundary, potentially supported by the $150 level.
This positioning might prompt bulls to attempt a breakout above Resistance 2, possibly replicating the pattern seen after the Resistance 1 break in May 2024.
Otherwise, a drop below $150 would indicate intensified bearish pressure and underline Boeing's fundamental challenges.
What’s Next?
Analysts remain optimistic about Boeing’s (BA) prospects. According to TipRanks, the average forecast for Boeing’s share price is over $200 within the next 12 months.
Trade global index CFDs with zero commission and tight spreads. Open your FXOpen account now or learn more about trading index CFDs with FXOpen.
CFDs are complex instruments and come with a high risk of losing your money.
This article represents the opinion of the Companies operating under the FXOpen brand only. It is not to be construed as an offer, solicitation, or recommendation with respect to products and services provided by the Companies operating under the FXOpen brand, nor is it to be considered financial advice.
Boeing (BA) Shares Hover Near Two-Year Low
Despite the S&P 500 index (US SPX 500 mini on FXOpen) rising roughly 20% since the start of 2024, Boeing (BA) shares are currently around the psychological level of $150 – a low last seen in autumn 2022.
Several factors have driven bearish sentiment for Boeing in 2024:
→ Reputational setbacks due to technical issues, including helium leaks and engine malfunctions on the Starliner spacecraft intended for astronaut transport to the ISS.
→ Boeing has struggled to meet its aircraft delivery targets, and it reported significant financial losses in Q2 2024, with earnings per share nearly halving forecasted estimates, further impacting investor confidence.
→ Fines from the U.S. Department of Justice, worker strikes, and other operational challenges have compounded issues.
Technical analysis of Boeing’s (BA) chart reveals:
→ In 2024, the share price has formed a downward channel (marked in red), with the Resistance 2 trendline suggesting that bearish sentiment could intensify.
→ The price hovers near the channel’s lower boundary, potentially supported by the $150 level.
This positioning might prompt bulls to attempt a breakout above Resistance 2, possibly replicating the pattern seen after the Resistance 1 break in May 2024.
Otherwise, a drop below $150 would indicate intensified bearish pressure and underline Boeing's fundamental challenges.
What’s Next?
Analysts remain optimistic about Boeing’s (BA) prospects. According to TipRanks, the average forecast for Boeing’s share price is over $200 within the next 12 months.
Trade global index CFDs with zero commission and tight spreads. Open your FXOpen account now or learn more about trading index CFDs with FXOpen.
CFDs are complex instruments and come with a high risk of losing your money.
This article represents the opinion of the Companies operating under the FXOpen brand only. It is not to be construed as an offer, solicitation, or recommendation with respect to products and services provided by the Companies operating under the FXOpen brand, nor is it to be considered financial advice.
👍2
#marketanalysis #MarketNews #USDJPY #tradingtips
USD/JPY Analysis: Price Retreats from One-Month High
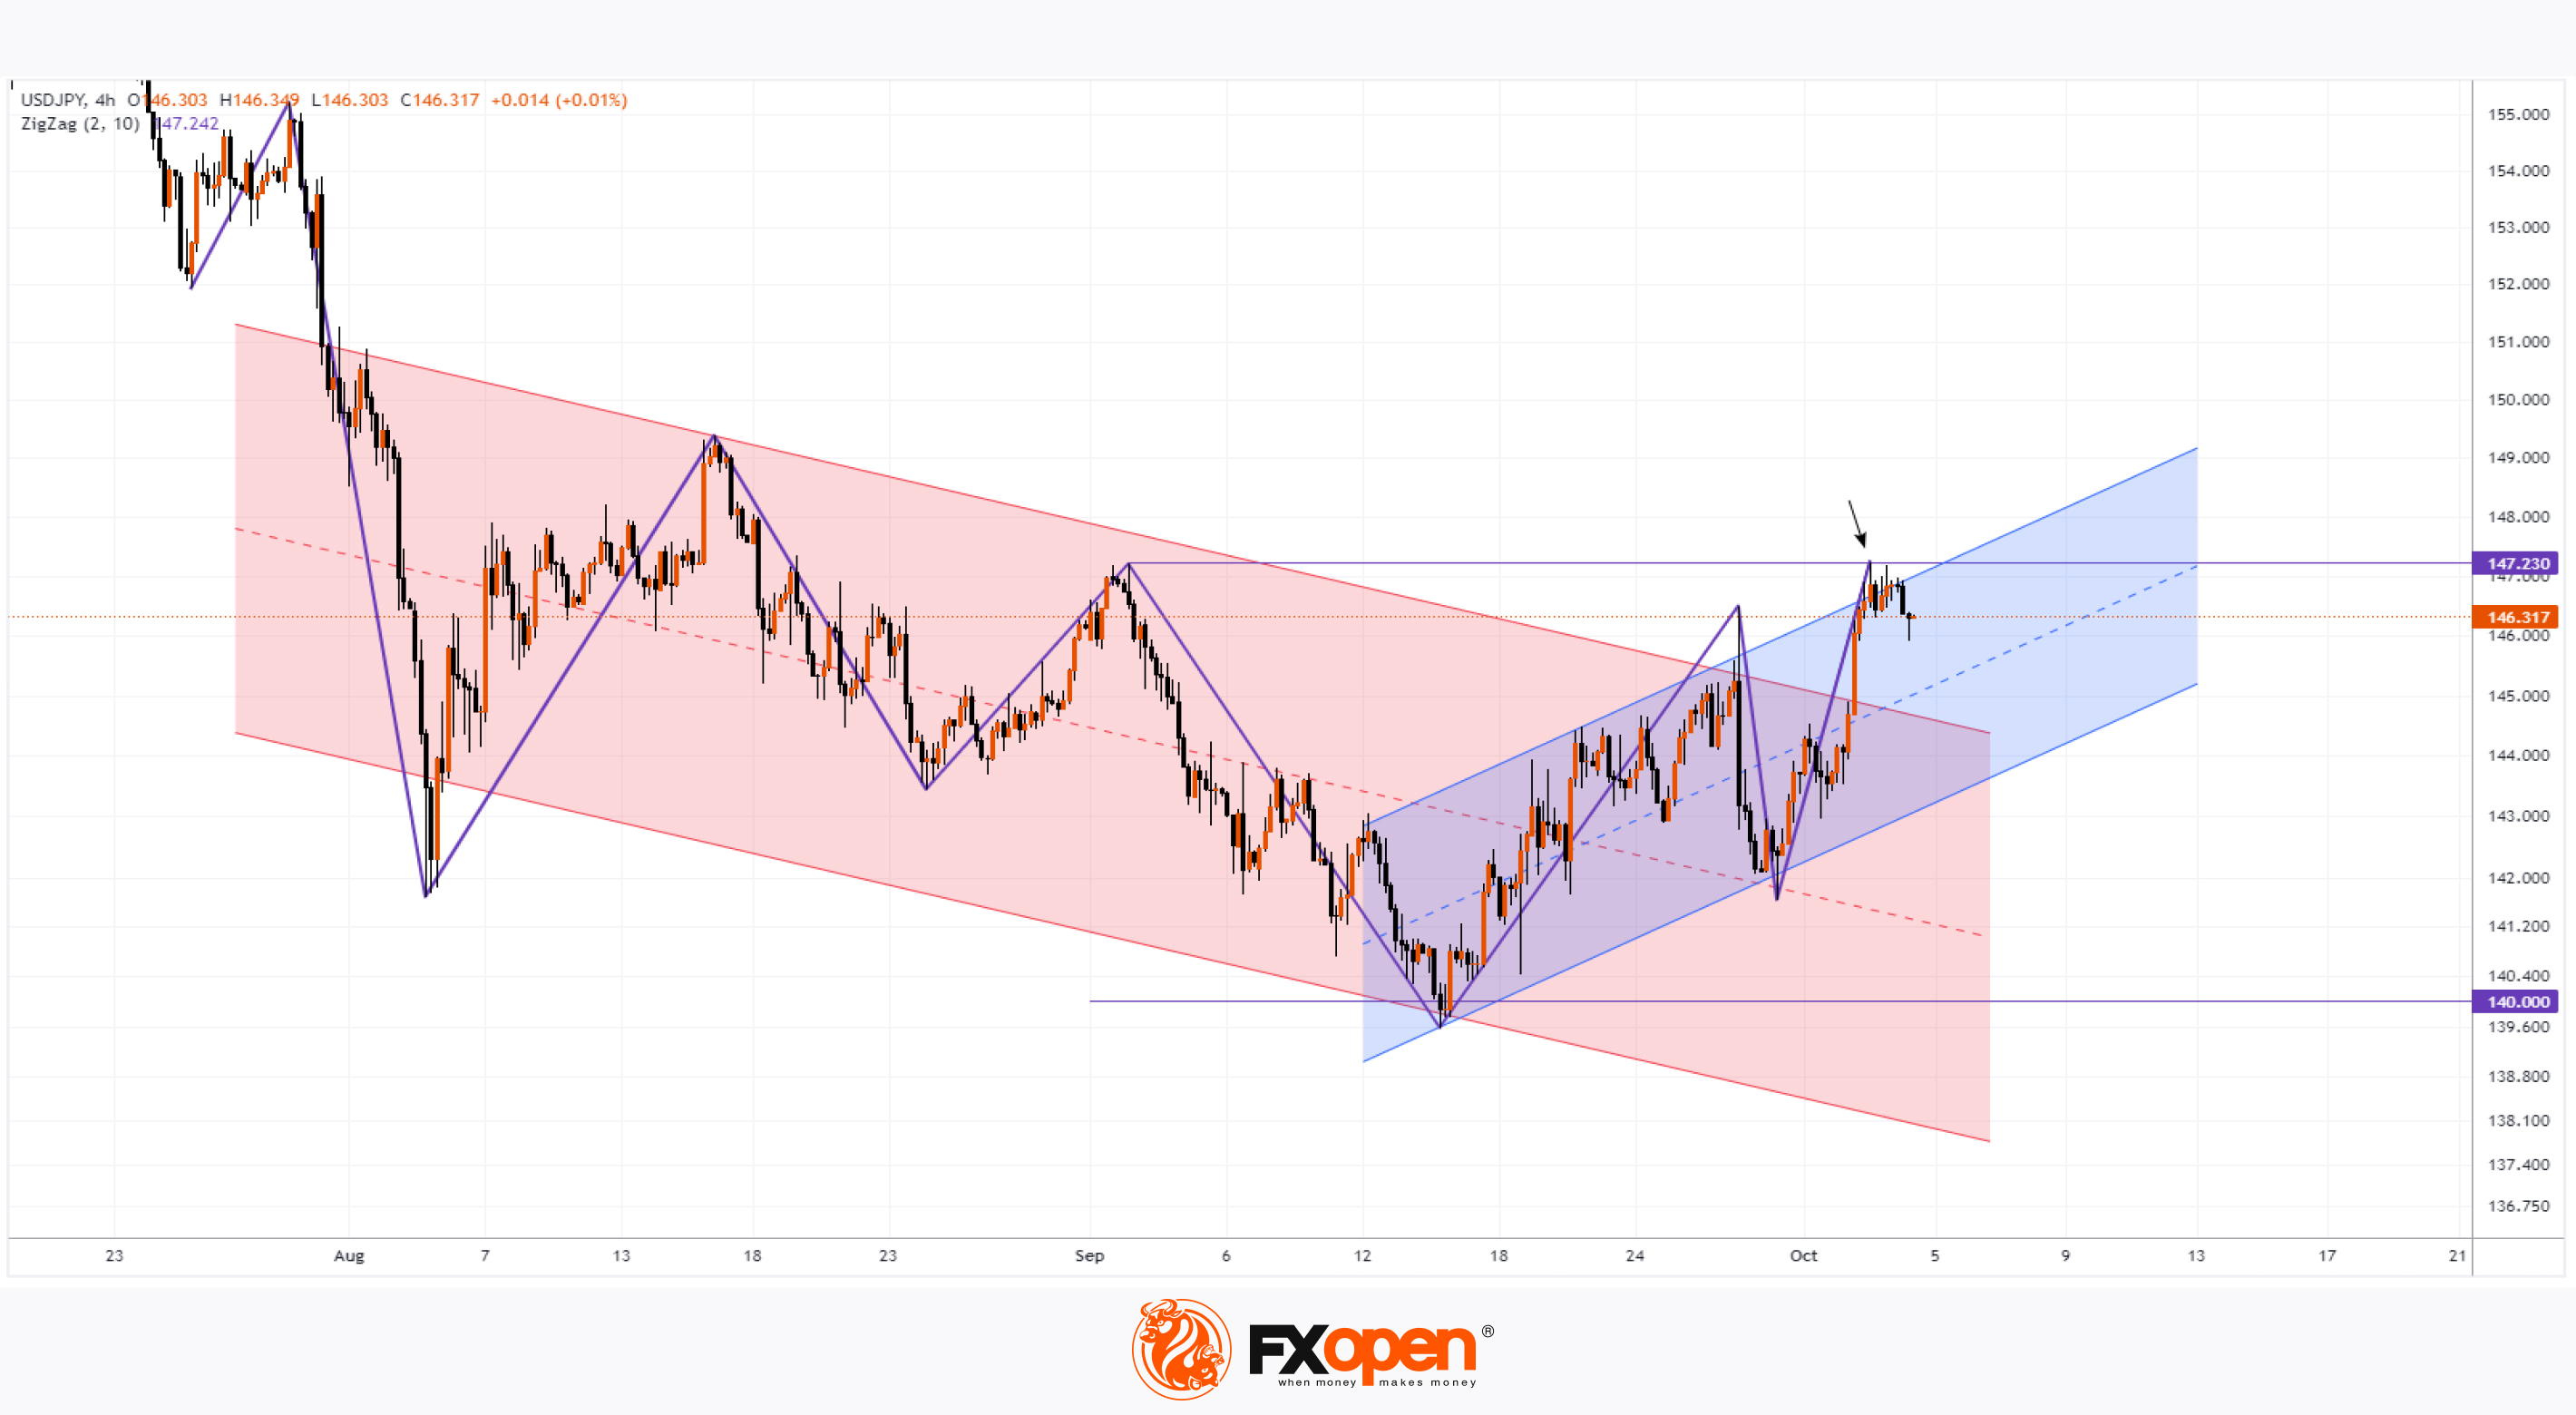
The USD/JPY chart shows that yesterday (3 October), the price slightly surpassed the 147.230 level, marking the highest point since 3 September.
This is significant as it indicates a new swing high, identified by the ZigZag indicator (in purple), which hasn’t been seen in months.
Bullish arguments for the USD/JPY chart today:
→ The price is within an ascending channel (shown in blue), illustrating an upward trajectory for the US dollar. This follows a period where the yen gained strength, pushing the exchange rate below the psychological threshold of 140 yen per dollar.
→ After the price broke above the upper boundary of the blue channel (signifying overbought conditions), a correction (such as to the channel's median) appears appropriate.
Bearish argument:
→ The brief breach above the prior swing high (indicated by an arrow) may have created a bull trap and triggered stop-losses for sellers positioned just above the 3 September high. Today’s decline supports the view that the break above 147.230 was a false breakout.
What’s next for USD/JPY?
Much will depend on the fundamentals.
On Friday, traders are closely watching US labour market data (to be released at 15:30 GMT+3), which could influence US interest rate expectations. Meanwhile, the yen's movement is affected by uncertainties surrounding Japan’s upcoming prime ministerial change. According to Reuters, recent comments from Shigeru Ishiba have fuelled expectations that Japan's rate hikes might be delayed.
Additionally, demand for safe-haven assets is impacting USD/JPY as markets assess the effects of rising tensions in the Middle East on the global economy.
Trade over 50 forex markets 24 hours a day with FXOpen. Take advantage of low commissions, deep liquidity, and spreads from 0.0 pips. Open your FXOpen account now or learn more about trading forex with FXOpen.
CFDs are complex instruments and come with a high risk of losing your money.
This article represents the opinion of the Companies operating under the FXOpen brand only. It is not to be construed as an offer, solicitation, or recommendation with respect to products and services provided by the Companies operating under the FXOpen brand, nor is it to be considered financial advice.
USD/JPY Analysis: Price Retreats from One-Month High
The USD/JPY chart shows that yesterday (3 October), the price slightly surpassed the 147.230 level, marking the highest point since 3 September.
This is significant as it indicates a new swing high, identified by the ZigZag indicator (in purple), which hasn’t been seen in months.
Bullish arguments for the USD/JPY chart today:
→ The price is within an ascending channel (shown in blue), illustrating an upward trajectory for the US dollar. This follows a period where the yen gained strength, pushing the exchange rate below the psychological threshold of 140 yen per dollar.
→ After the price broke above the upper boundary of the blue channel (signifying overbought conditions), a correction (such as to the channel's median) appears appropriate.
Bearish argument:
→ The brief breach above the prior swing high (indicated by an arrow) may have created a bull trap and triggered stop-losses for sellers positioned just above the 3 September high. Today’s decline supports the view that the break above 147.230 was a false breakout.
What’s next for USD/JPY?
Much will depend on the fundamentals.
On Friday, traders are closely watching US labour market data (to be released at 15:30 GMT+3), which could influence US interest rate expectations. Meanwhile, the yen's movement is affected by uncertainties surrounding Japan’s upcoming prime ministerial change. According to Reuters, recent comments from Shigeru Ishiba have fuelled expectations that Japan's rate hikes might be delayed.
Additionally, demand for safe-haven assets is impacting USD/JPY as markets assess the effects of rising tensions in the Middle East on the global economy.
Trade over 50 forex markets 24 hours a day with FXOpen. Take advantage of low commissions, deep liquidity, and spreads from 0.0 pips. Open your FXOpen account now or learn more about trading forex with FXOpen.
CFDs are complex instruments and come with a high risk of losing your money.
This article represents the opinion of the Companies operating under the FXOpen brand only. It is not to be construed as an offer, solicitation, or recommendation with respect to products and services provided by the Companies operating under the FXOpen brand, nor is it to be considered financial advice.
👍3
#ForexAnalysis #OilPrices #GlobalMarkets #XBRUSD #GBPCAD #StockMarket
Weekly Market Wrap With Gary Thomson: Brent Crude Oil, GBP/CAD, US Dollar, Lockheed Martin (LMT) Stock
Get the latest scoop on the week's hottest headlines, all in one convenient video. Join Gary Thomson, the COO of FXOpen UK, as he breaks down the most significant news reports and shares his expert insights.
🔸 XBR/USD Analysis: Brent Oil Price Soars After Attack on Israel
🔸 Analysis of GBP/CAD: Price Falls Below 1.800 Level
🔸 Dollar Strengthens Ahead of Employment Data Release
🔸 Lockheed Martin (LMT) Stock Price Surpasses $600 for the First Time
Stay in the know and empower yourself with our short, yet power-packed video. Watch it now and stay updated with FXOpen. Don't miss out on this invaluable opportunity to sharpen your trading skills and make informed decisions.
https://cutt.ly/keOKvT0o
To take advantage of price fluctuations in the foreign exchange markets, consider enlisting the services of a reliable broker like FXOpen.
⚠️
This forecast represents FXOpen Companies opinion only, it should not be construed as an offer, invitation or recommendation in respect to FXOpen Companies products and services or as financial advice.
Weekly Market Wrap With Gary Thomson: Brent Crude Oil, GBP/CAD, US Dollar, Lockheed Martin (LMT) Stock
Get the latest scoop on the week's hottest headlines, all in one convenient video. Join Gary Thomson, the COO of FXOpen UK, as he breaks down the most significant news reports and shares his expert insights.
🔸 XBR/USD Analysis: Brent Oil Price Soars After Attack on Israel
🔸 Analysis of GBP/CAD: Price Falls Below 1.800 Level
🔸 Dollar Strengthens Ahead of Employment Data Release
🔸 Lockheed Martin (LMT) Stock Price Surpasses $600 for the First Time
Stay in the know and empower yourself with our short, yet power-packed video. Watch it now and stay updated with FXOpen. Don't miss out on this invaluable opportunity to sharpen your trading skills and make informed decisions.
https://cutt.ly/keOKvT0o
To take advantage of price fluctuations in the foreign exchange markets, consider enlisting the services of a reliable broker like FXOpen.
⚠️
This forecast represents FXOpen Companies opinion only, it should not be construed as an offer, invitation or recommendation in respect to FXOpen Companies products and services or as financial advice.
YouTube
Weekly Market Wrap With Gary Thomson: Brent Crude Oil, GBP/CAD, US Dollar, Lockheed Martin Stock
Welcome to the 100th edition of our Weekly Market Wrap video series!
Get the latest scoop on the week's hottest headlines, all in one convenient video. Join Gary Thomson, the COO of FXOpen UK, as he breaks down the most significant news reports and shares…
Get the latest scoop on the week's hottest headlines, all in one convenient video. Join Gary Thomson, the COO of FXOpen UK, as he breaks down the most significant news reports and shares…
👍3
#EURUSD #marketanalysis #MarketNews
EUR/USD Analysis: The Exchange Rate Falls Below 1.100
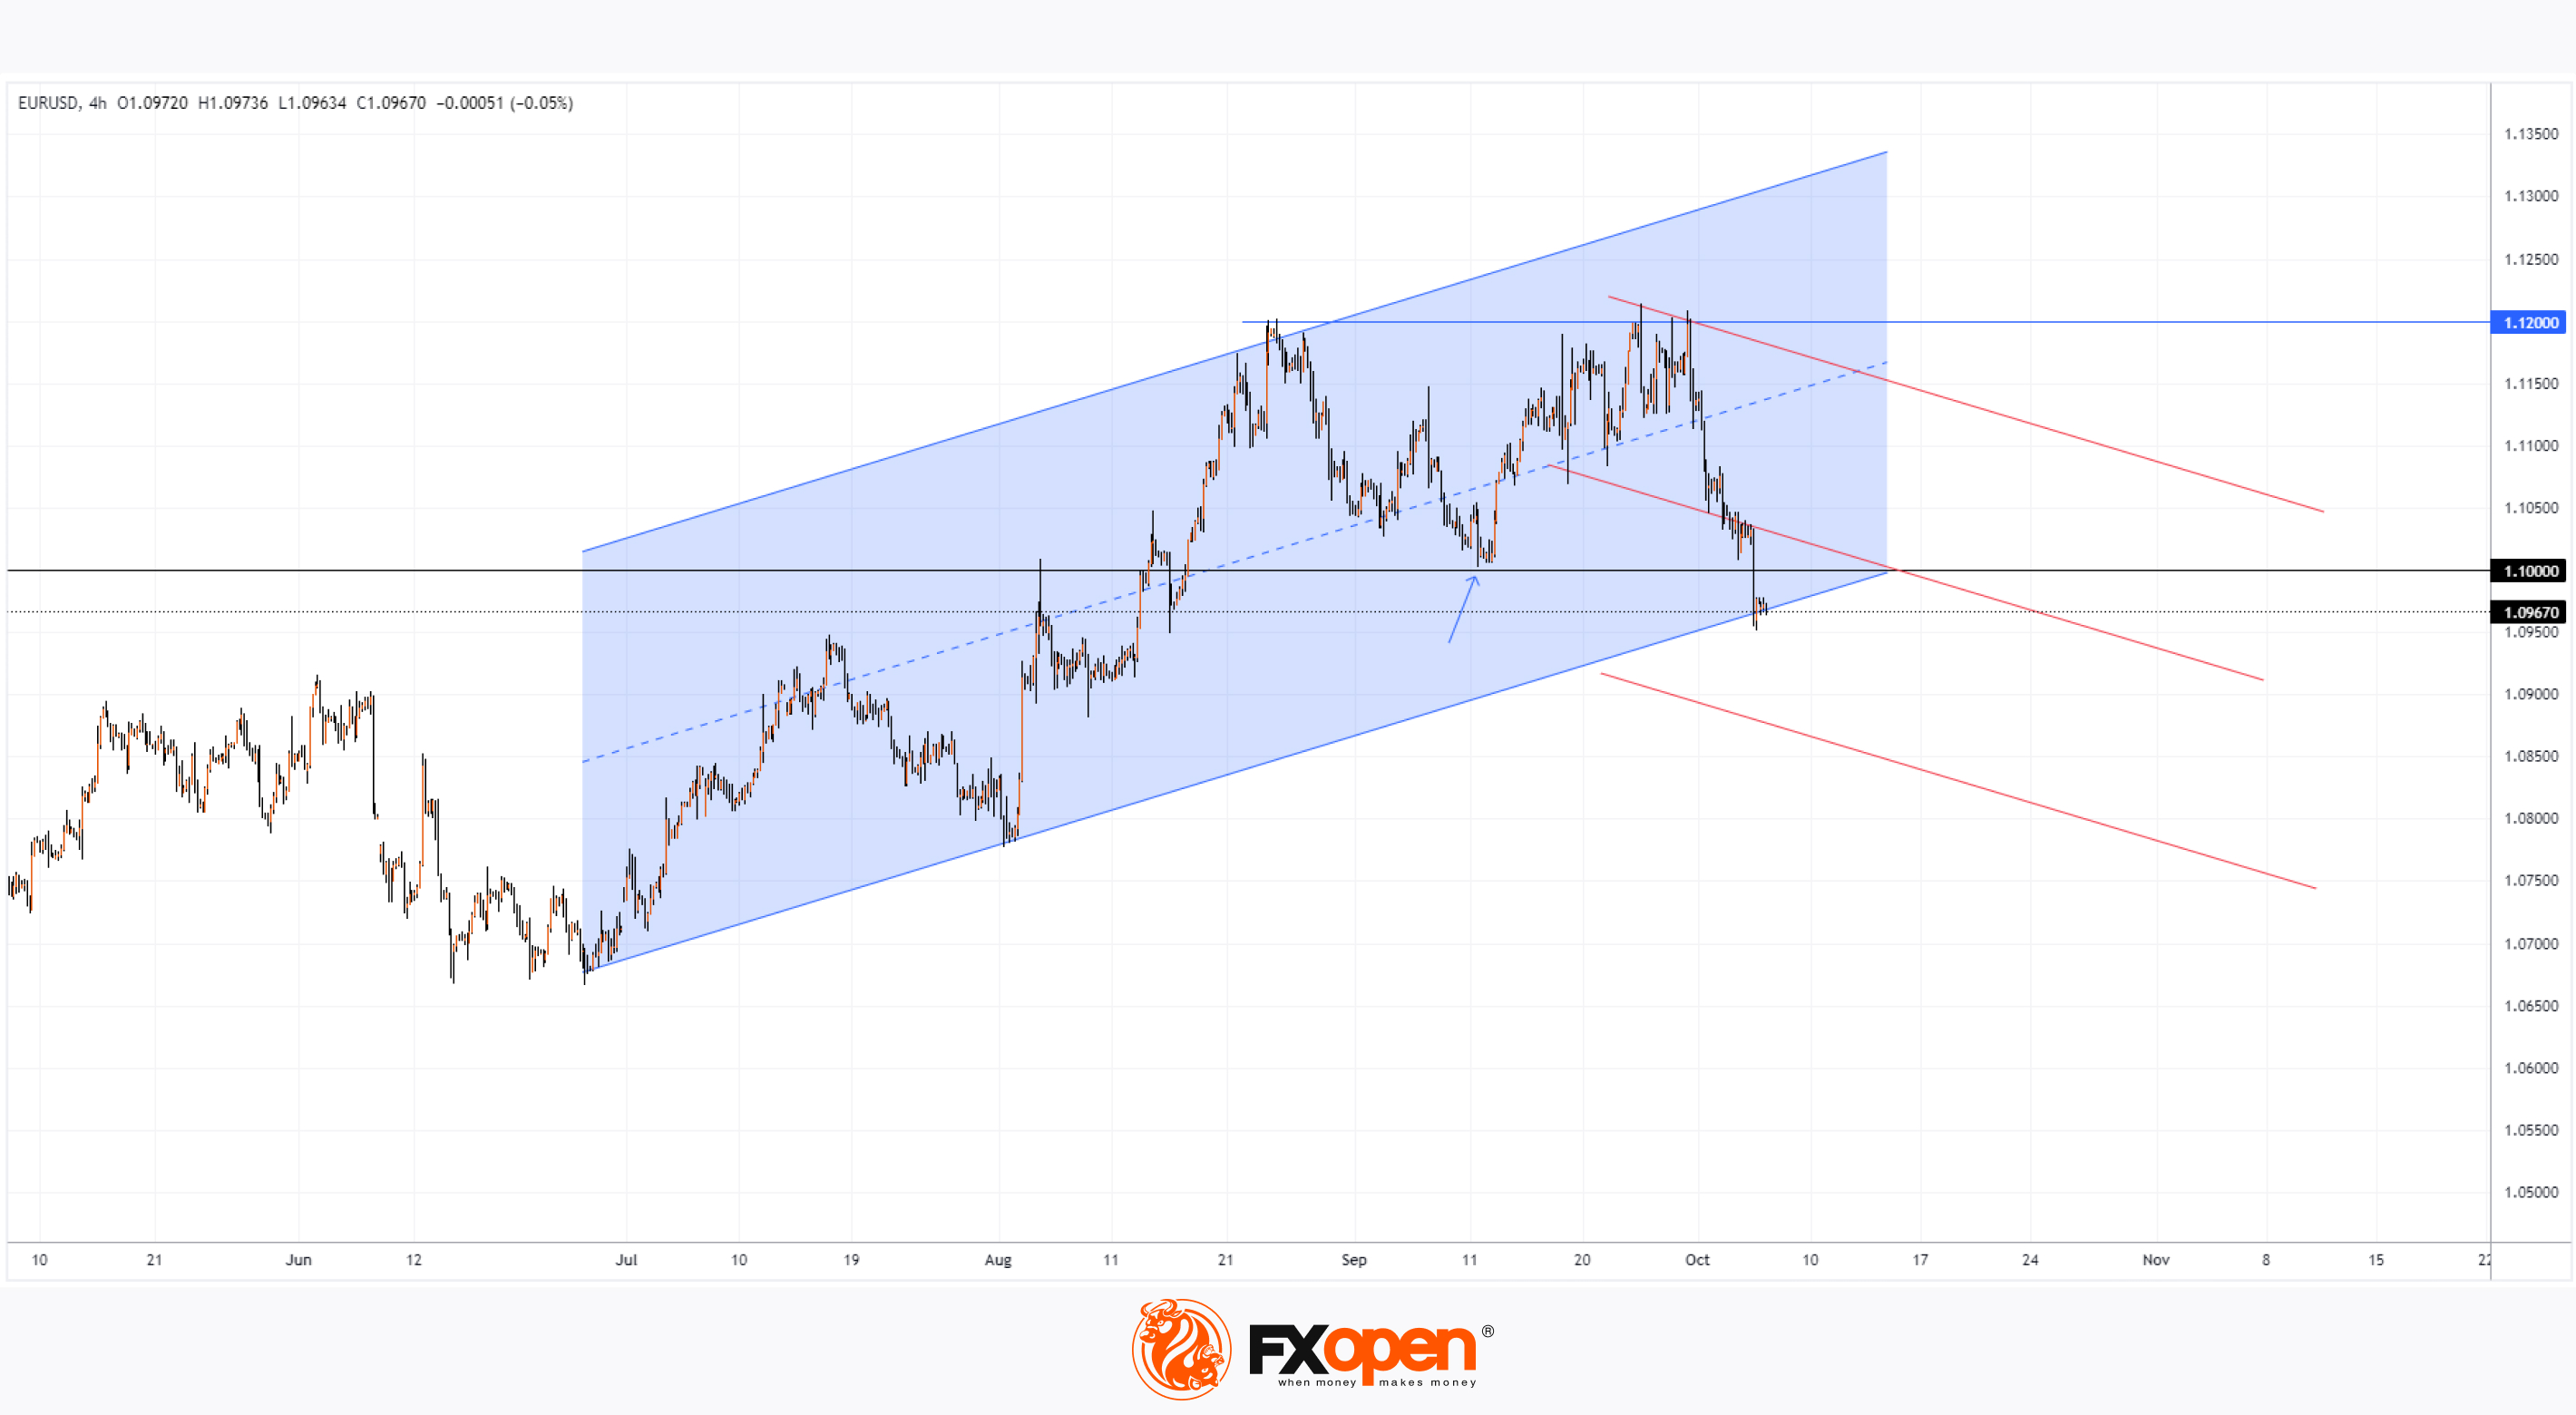
As shown in today's EUR/USD chart, the euro has dropped below the 1.100 level against the US dollar. This decline is partly due to Friday's strong US jobs report, which revealed:
→ the largest job growth in six months,
→ a decrease in the unemployment rate,
→ solid wage growth.
These factors suggest a resilient US economy and increase the likelihood of a "soft landing" following the inflation surge.
Technical analysis of the EUR/USD chart:
→ Since July, price movements have formed an ascending channel (shown in blue), but it now faces the immediate threat of a bearish breakout after sellers prevented the price from rising above 1.12.
→ The psychological level of 1.10 could shift from support (indicated by an arrow) to resistance.
Note that Friday's decline was rapid, and it’s possible that the downward momentum could continue into this week.
On the other hand, bulls still have a chance to regain control at the lower boundary of the channel (which could trigger a rebound). If they fail to do so, traders should be prepared for the emergence of a potential downward channel on the EUR/USD chart (its possible outline is shown by red lines).
Trade over 50 forex markets 24 hours a day with FXOpen. Take advantage of low commissions, deep liquidity, and spreads from 0.0 pips. Open your FXOpen account now or learn more about trading forex with FXOpen.
CFDs are complex instruments and come with a high risk of losing your money.
This article represents the opinion of the Companies operating under the FXOpen brand only. It is not to be construed as an offer, solicitation, or recommendation with respect to products and services provided by the Companies operating under the FXOpen brand, nor is it to be considered financial advice.
EUR/USD Analysis: The Exchange Rate Falls Below 1.100
As shown in today's EUR/USD chart, the euro has dropped below the 1.100 level against the US dollar. This decline is partly due to Friday's strong US jobs report, which revealed:
→ the largest job growth in six months,
→ a decrease in the unemployment rate,
→ solid wage growth.
These factors suggest a resilient US economy and increase the likelihood of a "soft landing" following the inflation surge.
Technical analysis of the EUR/USD chart:
→ Since July, price movements have formed an ascending channel (shown in blue), but it now faces the immediate threat of a bearish breakout after sellers prevented the price from rising above 1.12.
→ The psychological level of 1.10 could shift from support (indicated by an arrow) to resistance.
Note that Friday's decline was rapid, and it’s possible that the downward momentum could continue into this week.
On the other hand, bulls still have a chance to regain control at the lower boundary of the channel (which could trigger a rebound). If they fail to do so, traders should be prepared for the emergence of a potential downward channel on the EUR/USD chart (its possible outline is shown by red lines).
Trade over 50 forex markets 24 hours a day with FXOpen. Take advantage of low commissions, deep liquidity, and spreads from 0.0 pips. Open your FXOpen account now or learn more about trading forex with FXOpen.
CFDs are complex instruments and come with a high risk of losing your money.
This article represents the opinion of the Companies operating under the FXOpen brand only. It is not to be construed as an offer, solicitation, or recommendation with respect to products and services provided by the Companies operating under the FXOpen brand, nor is it to be considered financial advice.
👍2
#marketanalysis #MarketNews #brentoil #oilprices
XBR/USD Analysis: Brent Crude Price Fails to Hold Above $80
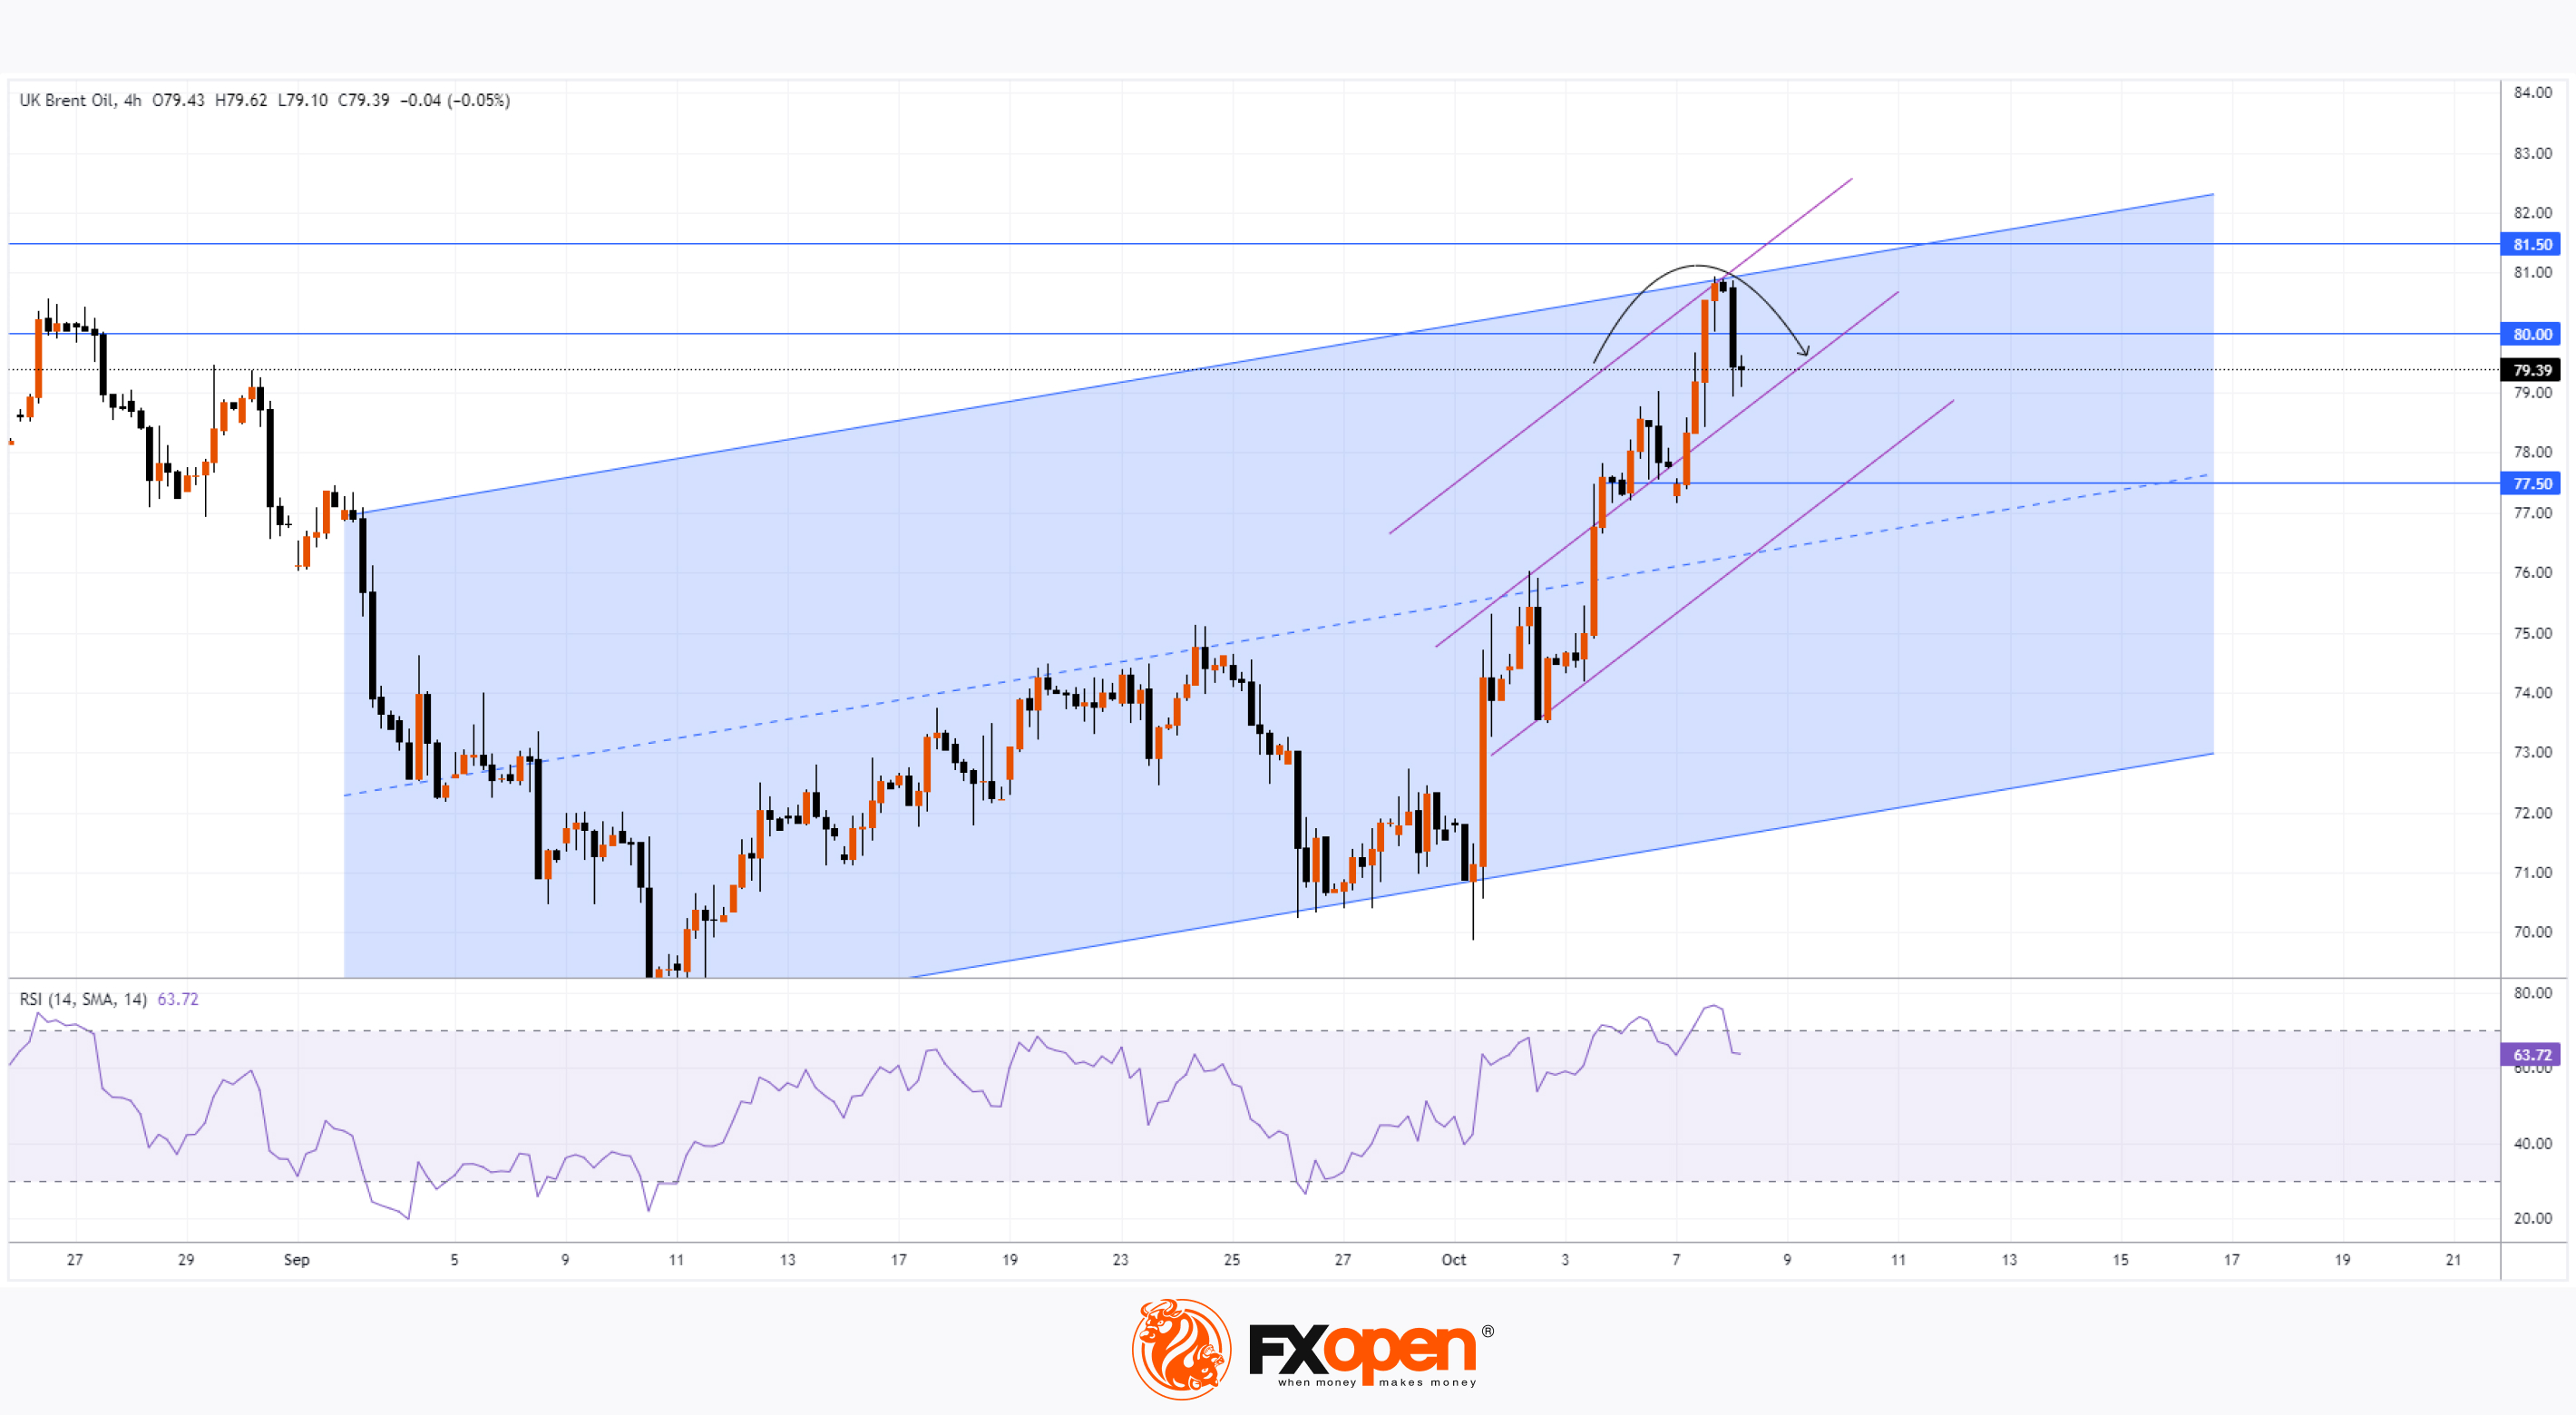
As shown on the XBR/USD chart, Brent crude oil prices surged by over 8.5% last week — marking the largest increase in 2024, driven by escalating tensions in the Middle East.
Although oil prices continued to climb earlier this week, a pullback occurred on Tuesday, causing Brent crude to drop below the $80 level. It appears that market participants expect U.S. authorities to prevent the conflict from worsening ahead of the presidential elections, prompting them to lock in profits from previous long positions based on the technical outlook.
XBR/USD Technical Analysis
Today's analysis of the XBR/USD chart shows that Brent crude is moving within an upward channel (shown in blue) that began in the first half of September. The recent downturn (indicated by an arrow) comes as:
→ The price has entered a resistance zone, marked by the psychological $80 level and the August highs around $81.5.
→ The RSI indicator has risen above 85.
→ The price has touched the upper boundary of the channel.
If tensions in the Middle East ease, we could see a pullback on the XBR/USD chart following the impressive rally.
Brent crude prices may find support at the median line of the blue channel, the $77.50 level, and the purple lines marking last week’s strong price growth.
Start trading commodities with tight spreads. Open your trading account now or learn more about trading commodity CFDs with FXOpen.
CFDs are complex instruments and come with a high risk of losing your money.
This article represents the opinion of the Companies operating under the FXOpen brand only. It is not to be construed as an offer, solicitation, or recommendation with respect to products and services provided by the Companies operating under the FXOpen brand, nor is it to be considered financial advice.
XBR/USD Analysis: Brent Crude Price Fails to Hold Above $80
As shown on the XBR/USD chart, Brent crude oil prices surged by over 8.5% last week — marking the largest increase in 2024, driven by escalating tensions in the Middle East.
Although oil prices continued to climb earlier this week, a pullback occurred on Tuesday, causing Brent crude to drop below the $80 level. It appears that market participants expect U.S. authorities to prevent the conflict from worsening ahead of the presidential elections, prompting them to lock in profits from previous long positions based on the technical outlook.
XBR/USD Technical Analysis
Today's analysis of the XBR/USD chart shows that Brent crude is moving within an upward channel (shown in blue) that began in the first half of September. The recent downturn (indicated by an arrow) comes as:
→ The price has entered a resistance zone, marked by the psychological $80 level and the August highs around $81.5.
→ The RSI indicator has risen above 85.
→ The price has touched the upper boundary of the channel.
If tensions in the Middle East ease, we could see a pullback on the XBR/USD chart following the impressive rally.
Brent crude prices may find support at the median line of the blue channel, the $77.50 level, and the purple lines marking last week’s strong price growth.
Start trading commodities with tight spreads. Open your trading account now or learn more about trading commodity CFDs with FXOpen.
CFDs are complex instruments and come with a high risk of losing your money.
This article represents the opinion of the Companies operating under the FXOpen brand only. It is not to be construed as an offer, solicitation, or recommendation with respect to products and services provided by the Companies operating under the FXOpen brand, nor is it to be considered financial advice.
👍3
#marketanalysis #MarketNews #stockmarket
Hang Seng Index (HSI) Drops Nearly 10% Today
As shown on the Hang Seng Index chart (Hong Kong 50 on FXOpen), prices have fallen by almost 10% since trading began today, and the session is not over yet.
According to Reuters, bearish sentiment was driven by uncertain statements from Chinese officials regarding economic stimulus measures. This has raised doubts in the stock market about Beijing's ability to steer the world’s second-largest economy out of its most severe downturn since the global pandemic, aiming to achieve 5% growth.
Additionally, the decline may have been accelerated by a cascade of long position closures, which were opened in mid-September when the Hang Seng Index (Hong Kong 50 on FXOpen) was in an upward trend.
Hang Seng Index Technical Analysis (Hong Kong 50 on FXOpen):
→ The upward trend (marked in blue) is still intact, although the price is now near the lower boundary, posing a real risk of a break.
→ The price failed to hold above the 22,700 level, which could act as future resistance.
→ Support may come from the psychological level of 20,000 points and the September 30 low near 20,630.
It’s possible that the lower boundary of the blue channel and the support area between 20,000 and 20,630 could help bulls offset some of today's significant decline. However, for a sustainable continuation of the upward trend on the Hang Seng Index chart (Hong Kong 50 on FXOpen), the market will need clear evidence of economic stimulus from Chinese authorities.
Trade global index CFDs with zero commission and tight spreads. Open your FXOpen account now or learn more about trading index CFDs with FXOpen.
CFDs are complex instruments and come with a high risk of losing your money.
This article represents the opinion of the Companies operating under the FXOpen brand only. It is not to be construed as an offer, solicitation, or recommendation with respect to products and services provided by the Companies operating under the FXOpen brand, nor is it to be considered financial advice.
Hang Seng Index (HSI) Drops Nearly 10% Today
As shown on the Hang Seng Index chart (Hong Kong 50 on FXOpen), prices have fallen by almost 10% since trading began today, and the session is not over yet.
According to Reuters, bearish sentiment was driven by uncertain statements from Chinese officials regarding economic stimulus measures. This has raised doubts in the stock market about Beijing's ability to steer the world’s second-largest economy out of its most severe downturn since the global pandemic, aiming to achieve 5% growth.
Additionally, the decline may have been accelerated by a cascade of long position closures, which were opened in mid-September when the Hang Seng Index (Hong Kong 50 on FXOpen) was in an upward trend.
Hang Seng Index Technical Analysis (Hong Kong 50 on FXOpen):
→ The upward trend (marked in blue) is still intact, although the price is now near the lower boundary, posing a real risk of a break.
→ The price failed to hold above the 22,700 level, which could act as future resistance.
→ Support may come from the psychological level of 20,000 points and the September 30 low near 20,630.
It’s possible that the lower boundary of the blue channel and the support area between 20,000 and 20,630 could help bulls offset some of today's significant decline. However, for a sustainable continuation of the upward trend on the Hang Seng Index chart (Hong Kong 50 on FXOpen), the market will need clear evidence of economic stimulus from Chinese authorities.
Trade global index CFDs with zero commission and tight spreads. Open your FXOpen account now or learn more about trading index CFDs with FXOpen.
CFDs are complex instruments and come with a high risk of losing your money.
This article represents the opinion of the Companies operating under the FXOpen brand only. It is not to be construed as an offer, solicitation, or recommendation with respect to products and services provided by the Companies operating under the FXOpen brand, nor is it to be considered financial advice.
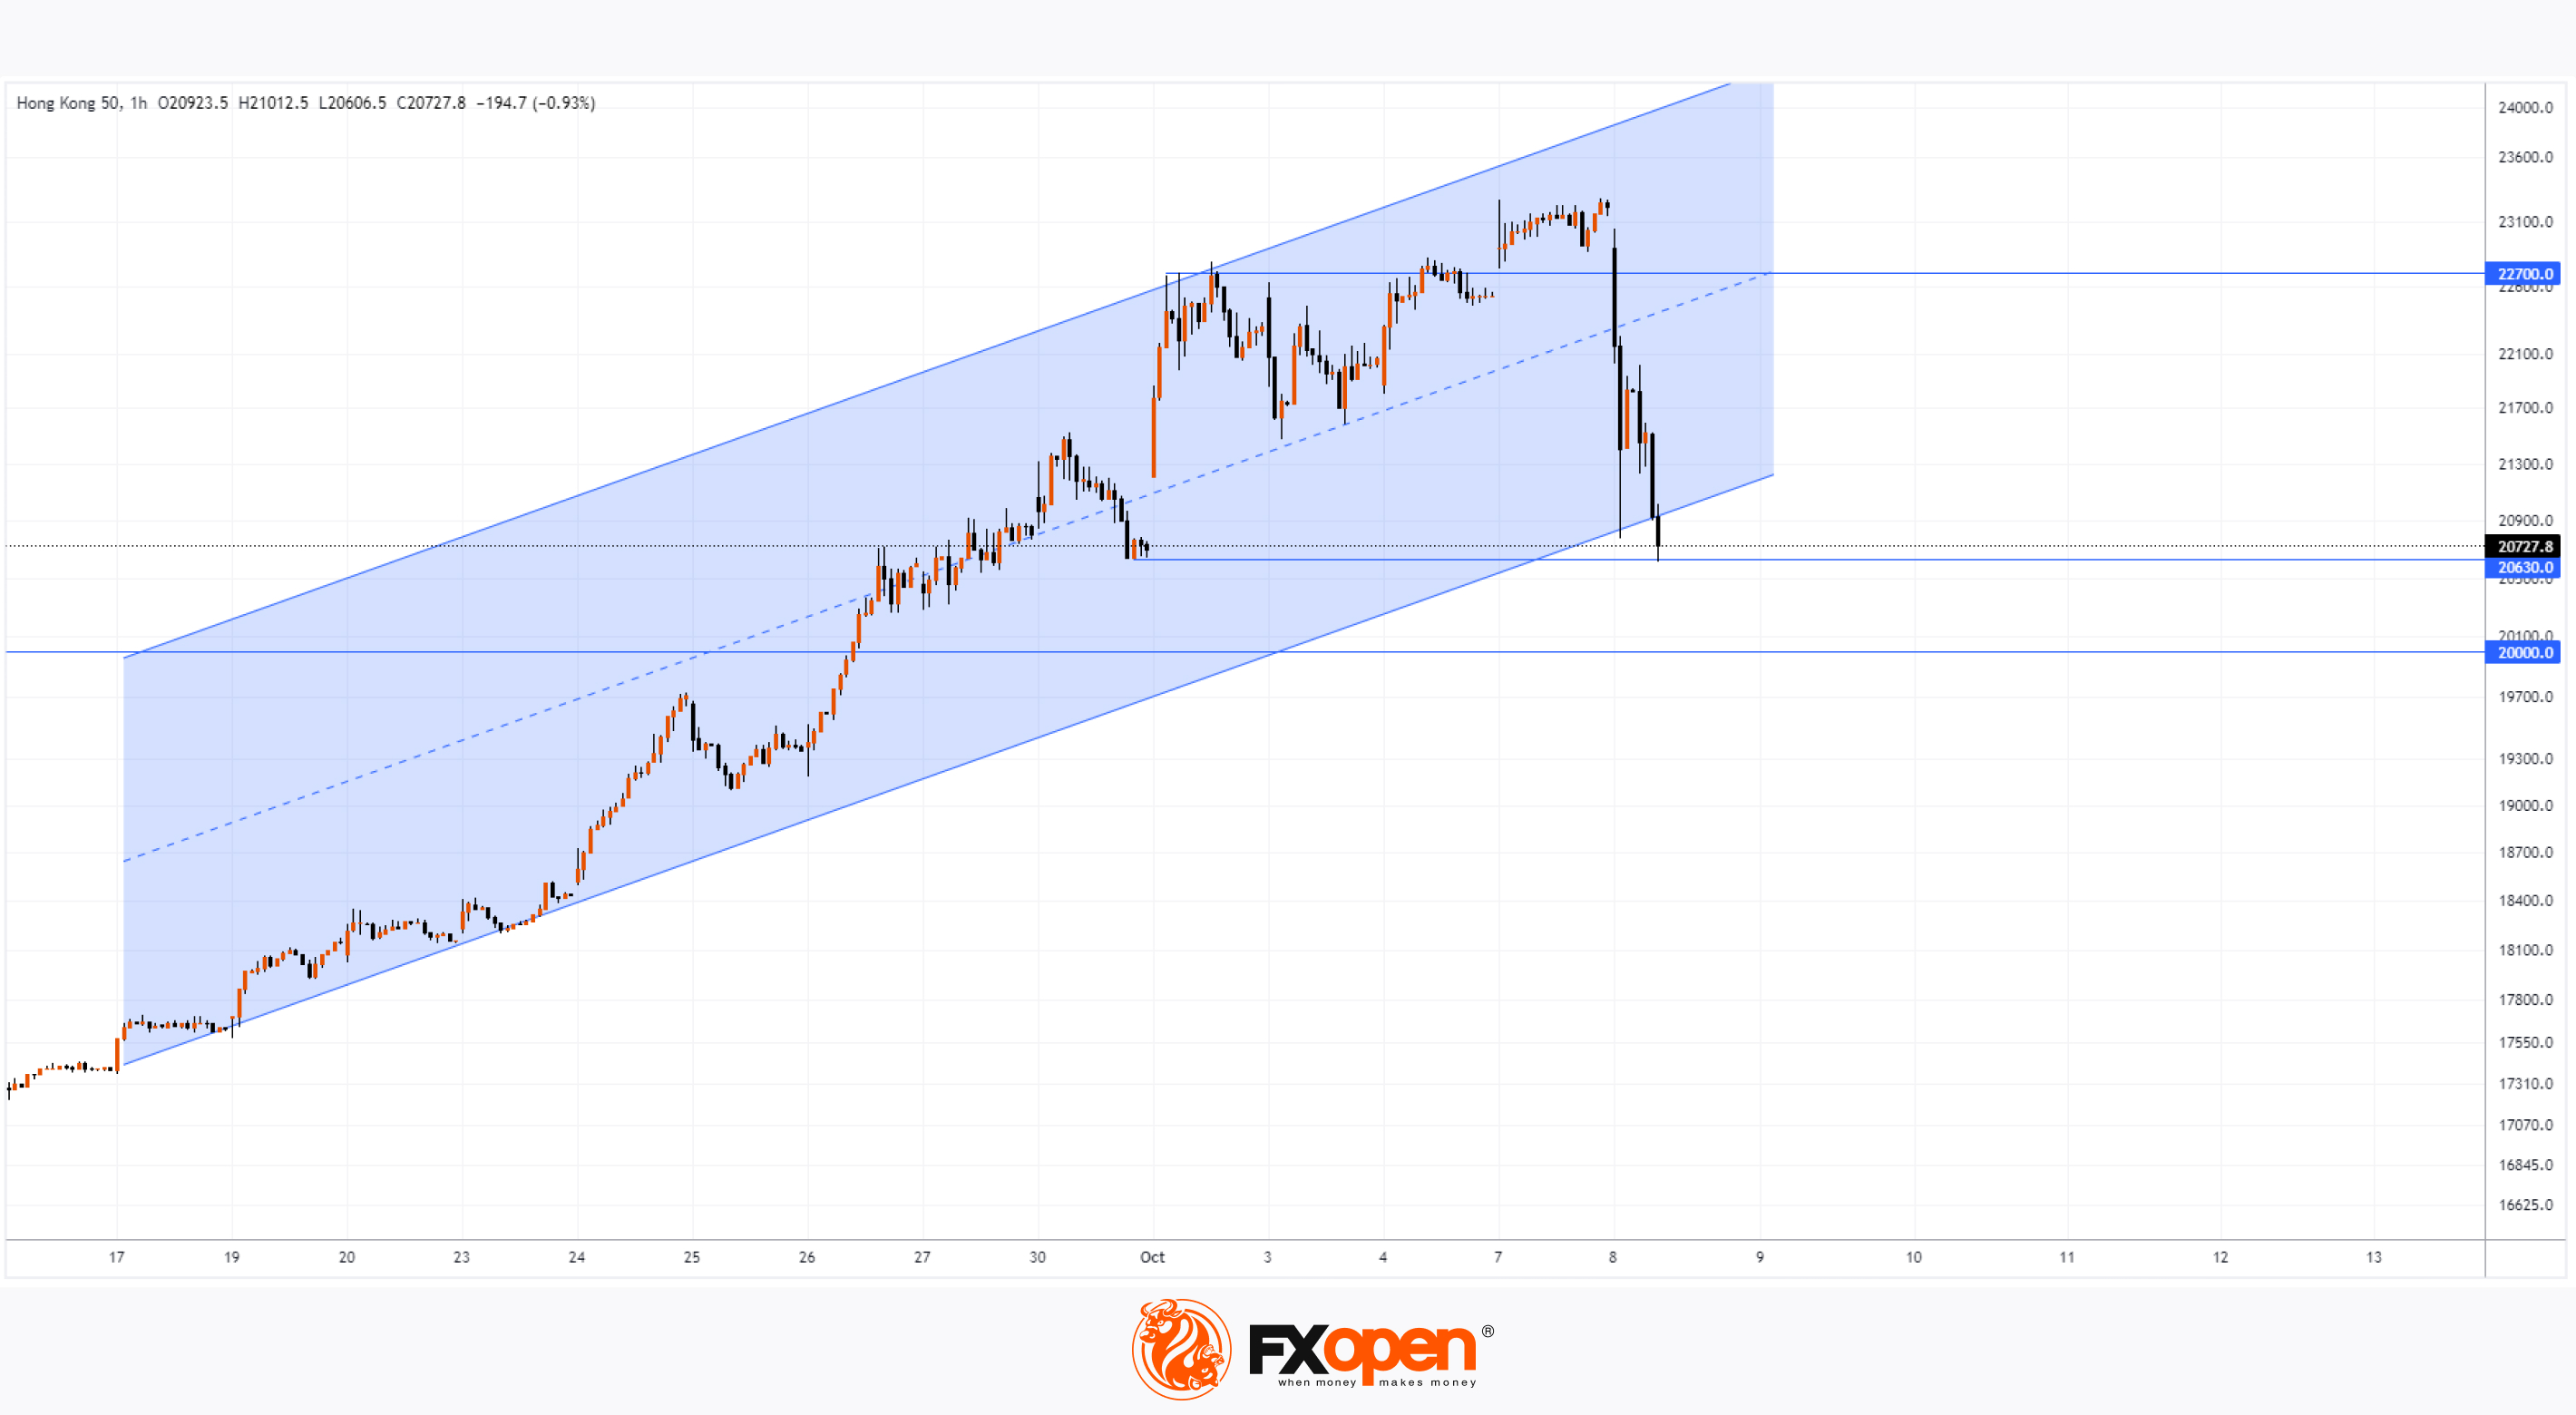
👍2