
#ForexStrategies
📊We have prepared a great article about moving averages in technical analysis!
A Moving Average or MA — one of the oldest and most powerful technical indicators. MAs exist for a long time, and they are among the first indicators ever created to analyze financial markets.
When traders started to use technical analysis to forecast future prices, the first thing to do was to interpret open and closing levels of the previous trading day. Next, they went back in time to collect more data so to better forecast future levels.
Everything was done manually. Nowadays, computers and modern trading platforms allow traders to compute complex technical indicators with a simple mouse click.
#TradeSmart #Forex #Trading #TechnicalAnalysis #ForexSchool
#TechnicalAnalysis #GBPUSD
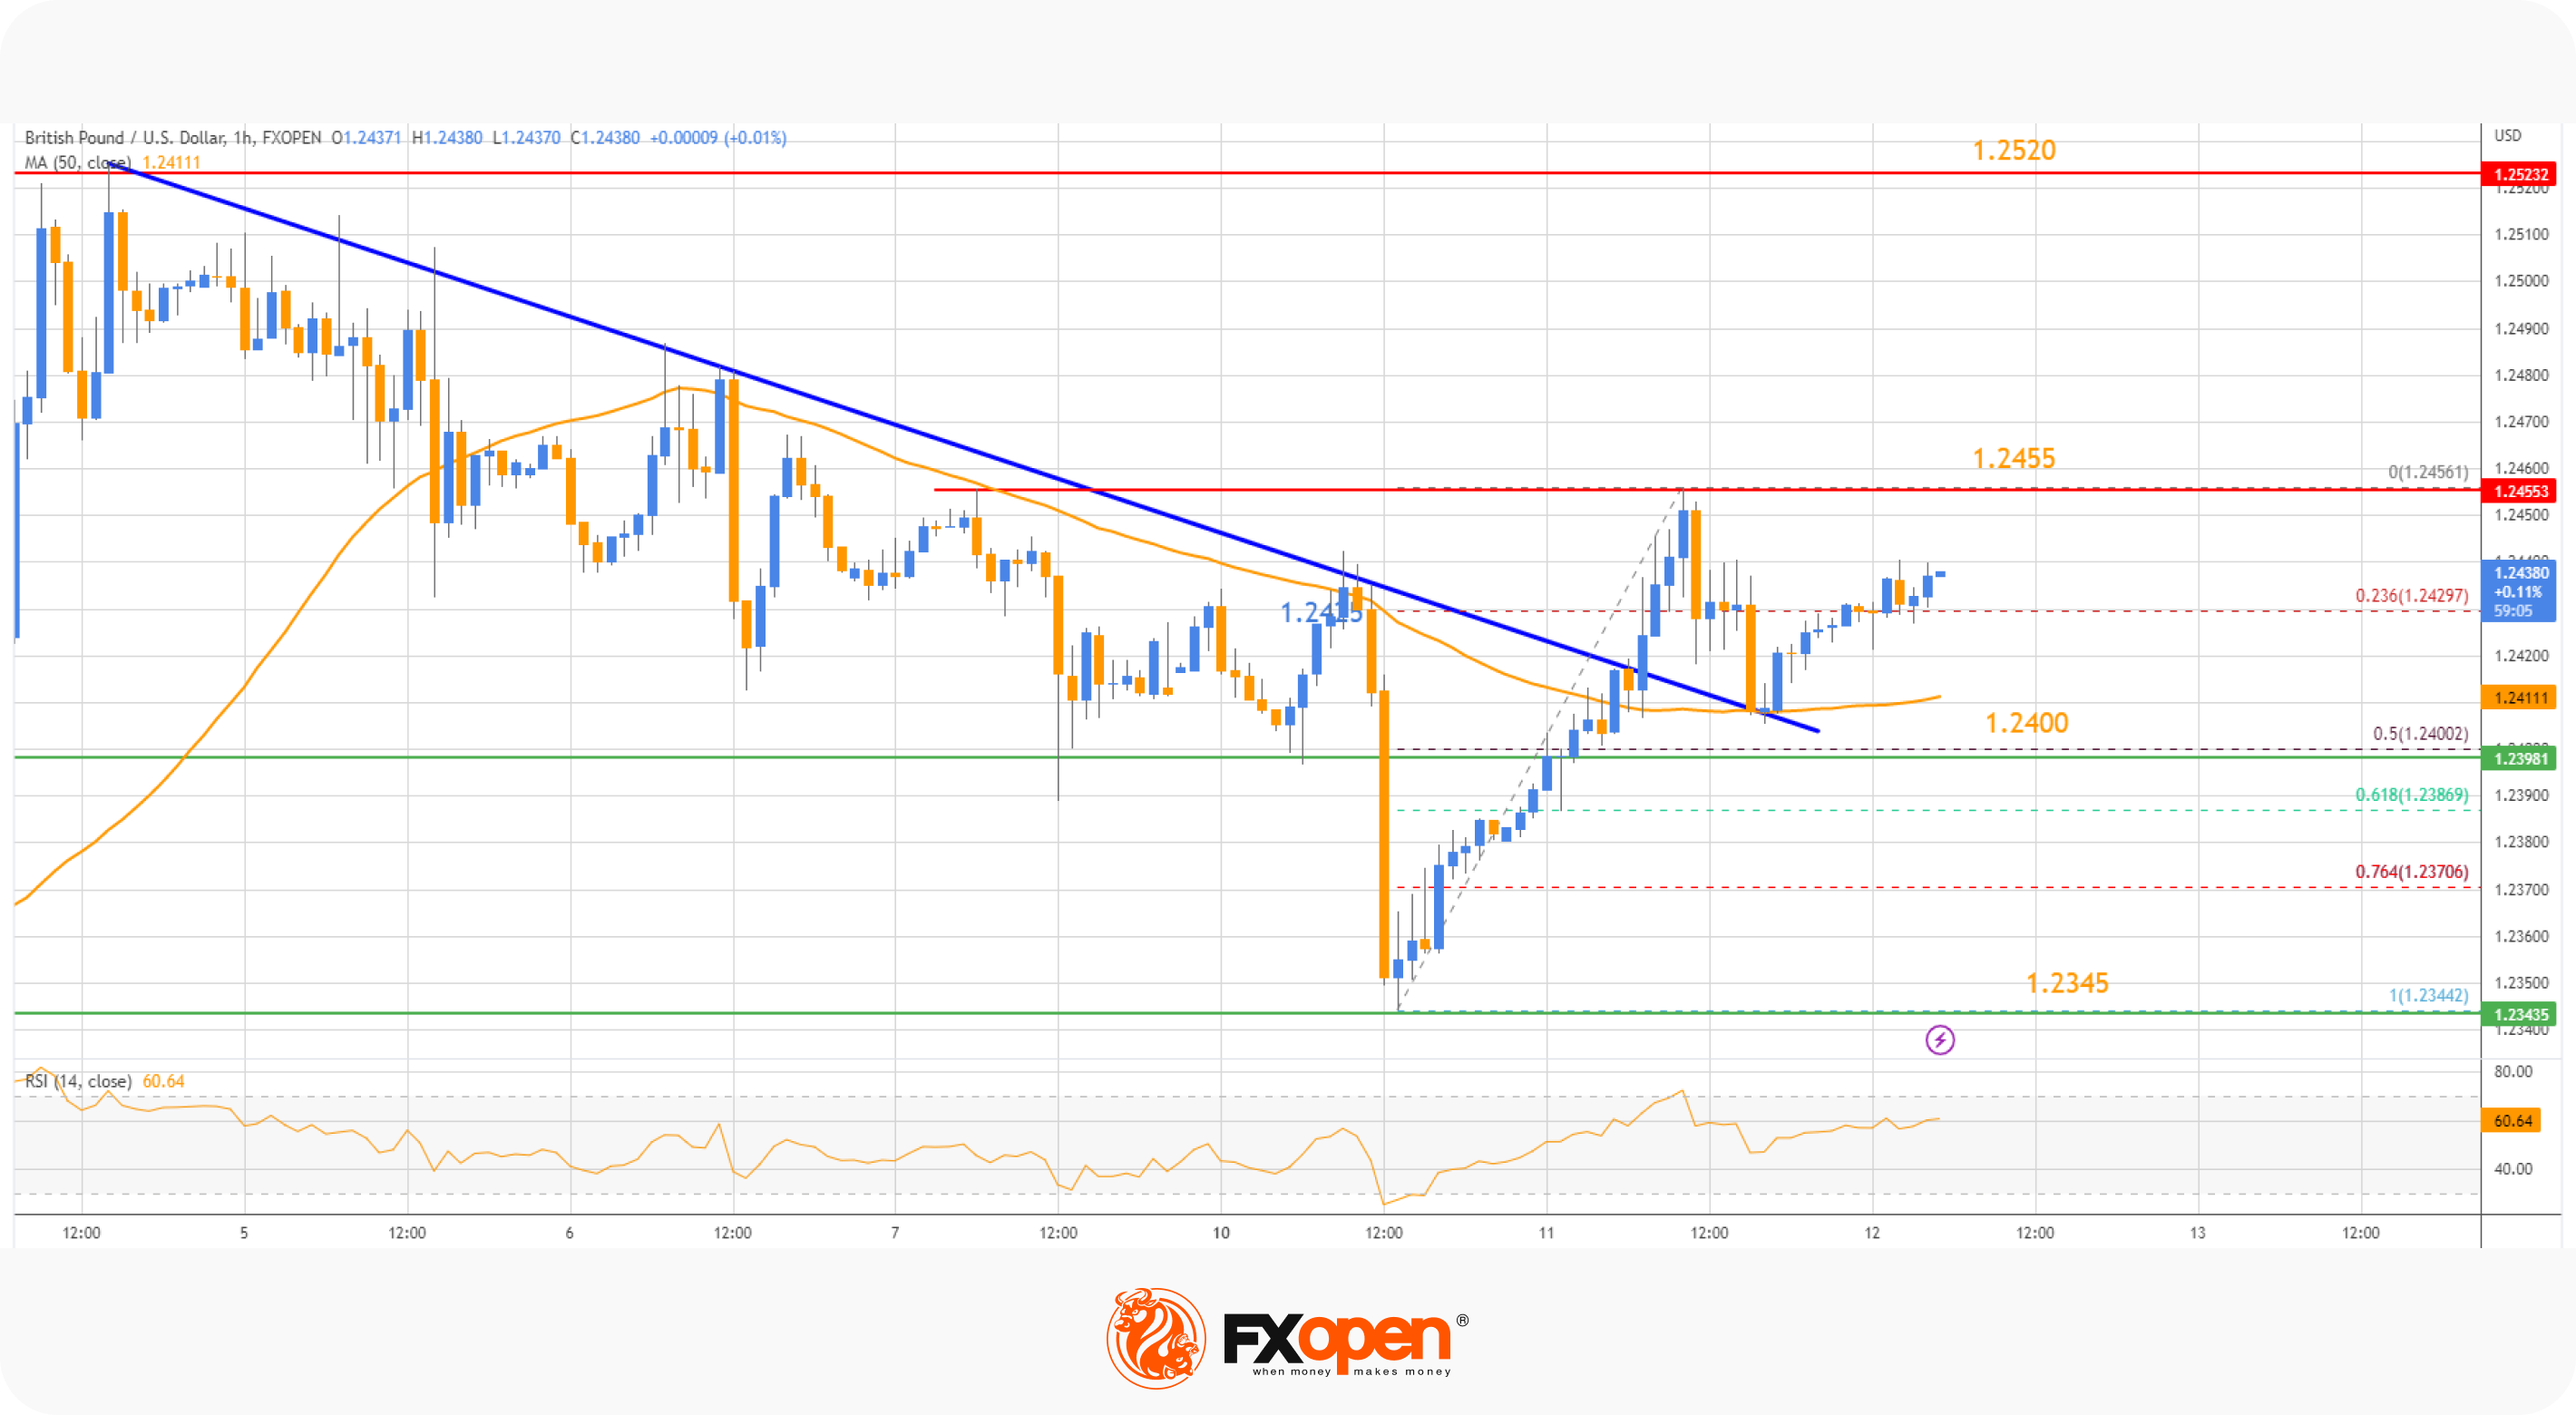
In the hourly chart at FXOpen, GBPUSD formed a low near 1.2344 and started a new increase. There was a clear move above the 1.2400 resistance zone. More importantly, there was a break above a key bearish trendline with resistance near 1.2410, and the pair remained well-bid above the 50% Fib retracement level at 1.2400.
⬇️If there is a downside break below the 1.2400 support, GBP/USD may revisit the 1.2355 support. Any more losses could lead the pair toward 1.2300.
⬆️On the upside, resistance is near the 1.2355 level, above which the pair might resume its increase (considering the RSI is above 50). The next major resistance levels are 1.2520 and 1.2600.
⚠️
CFDs are complex instruments and come with a high risk of losing your money.
This forecast represents FXOpen Companies’ opinion only, it should not be construed as an offer, invitation, or recommendation with respect to FXOpen Companies’ products and services or as financial advice.
#TechnicalAnalysis #EURGBP
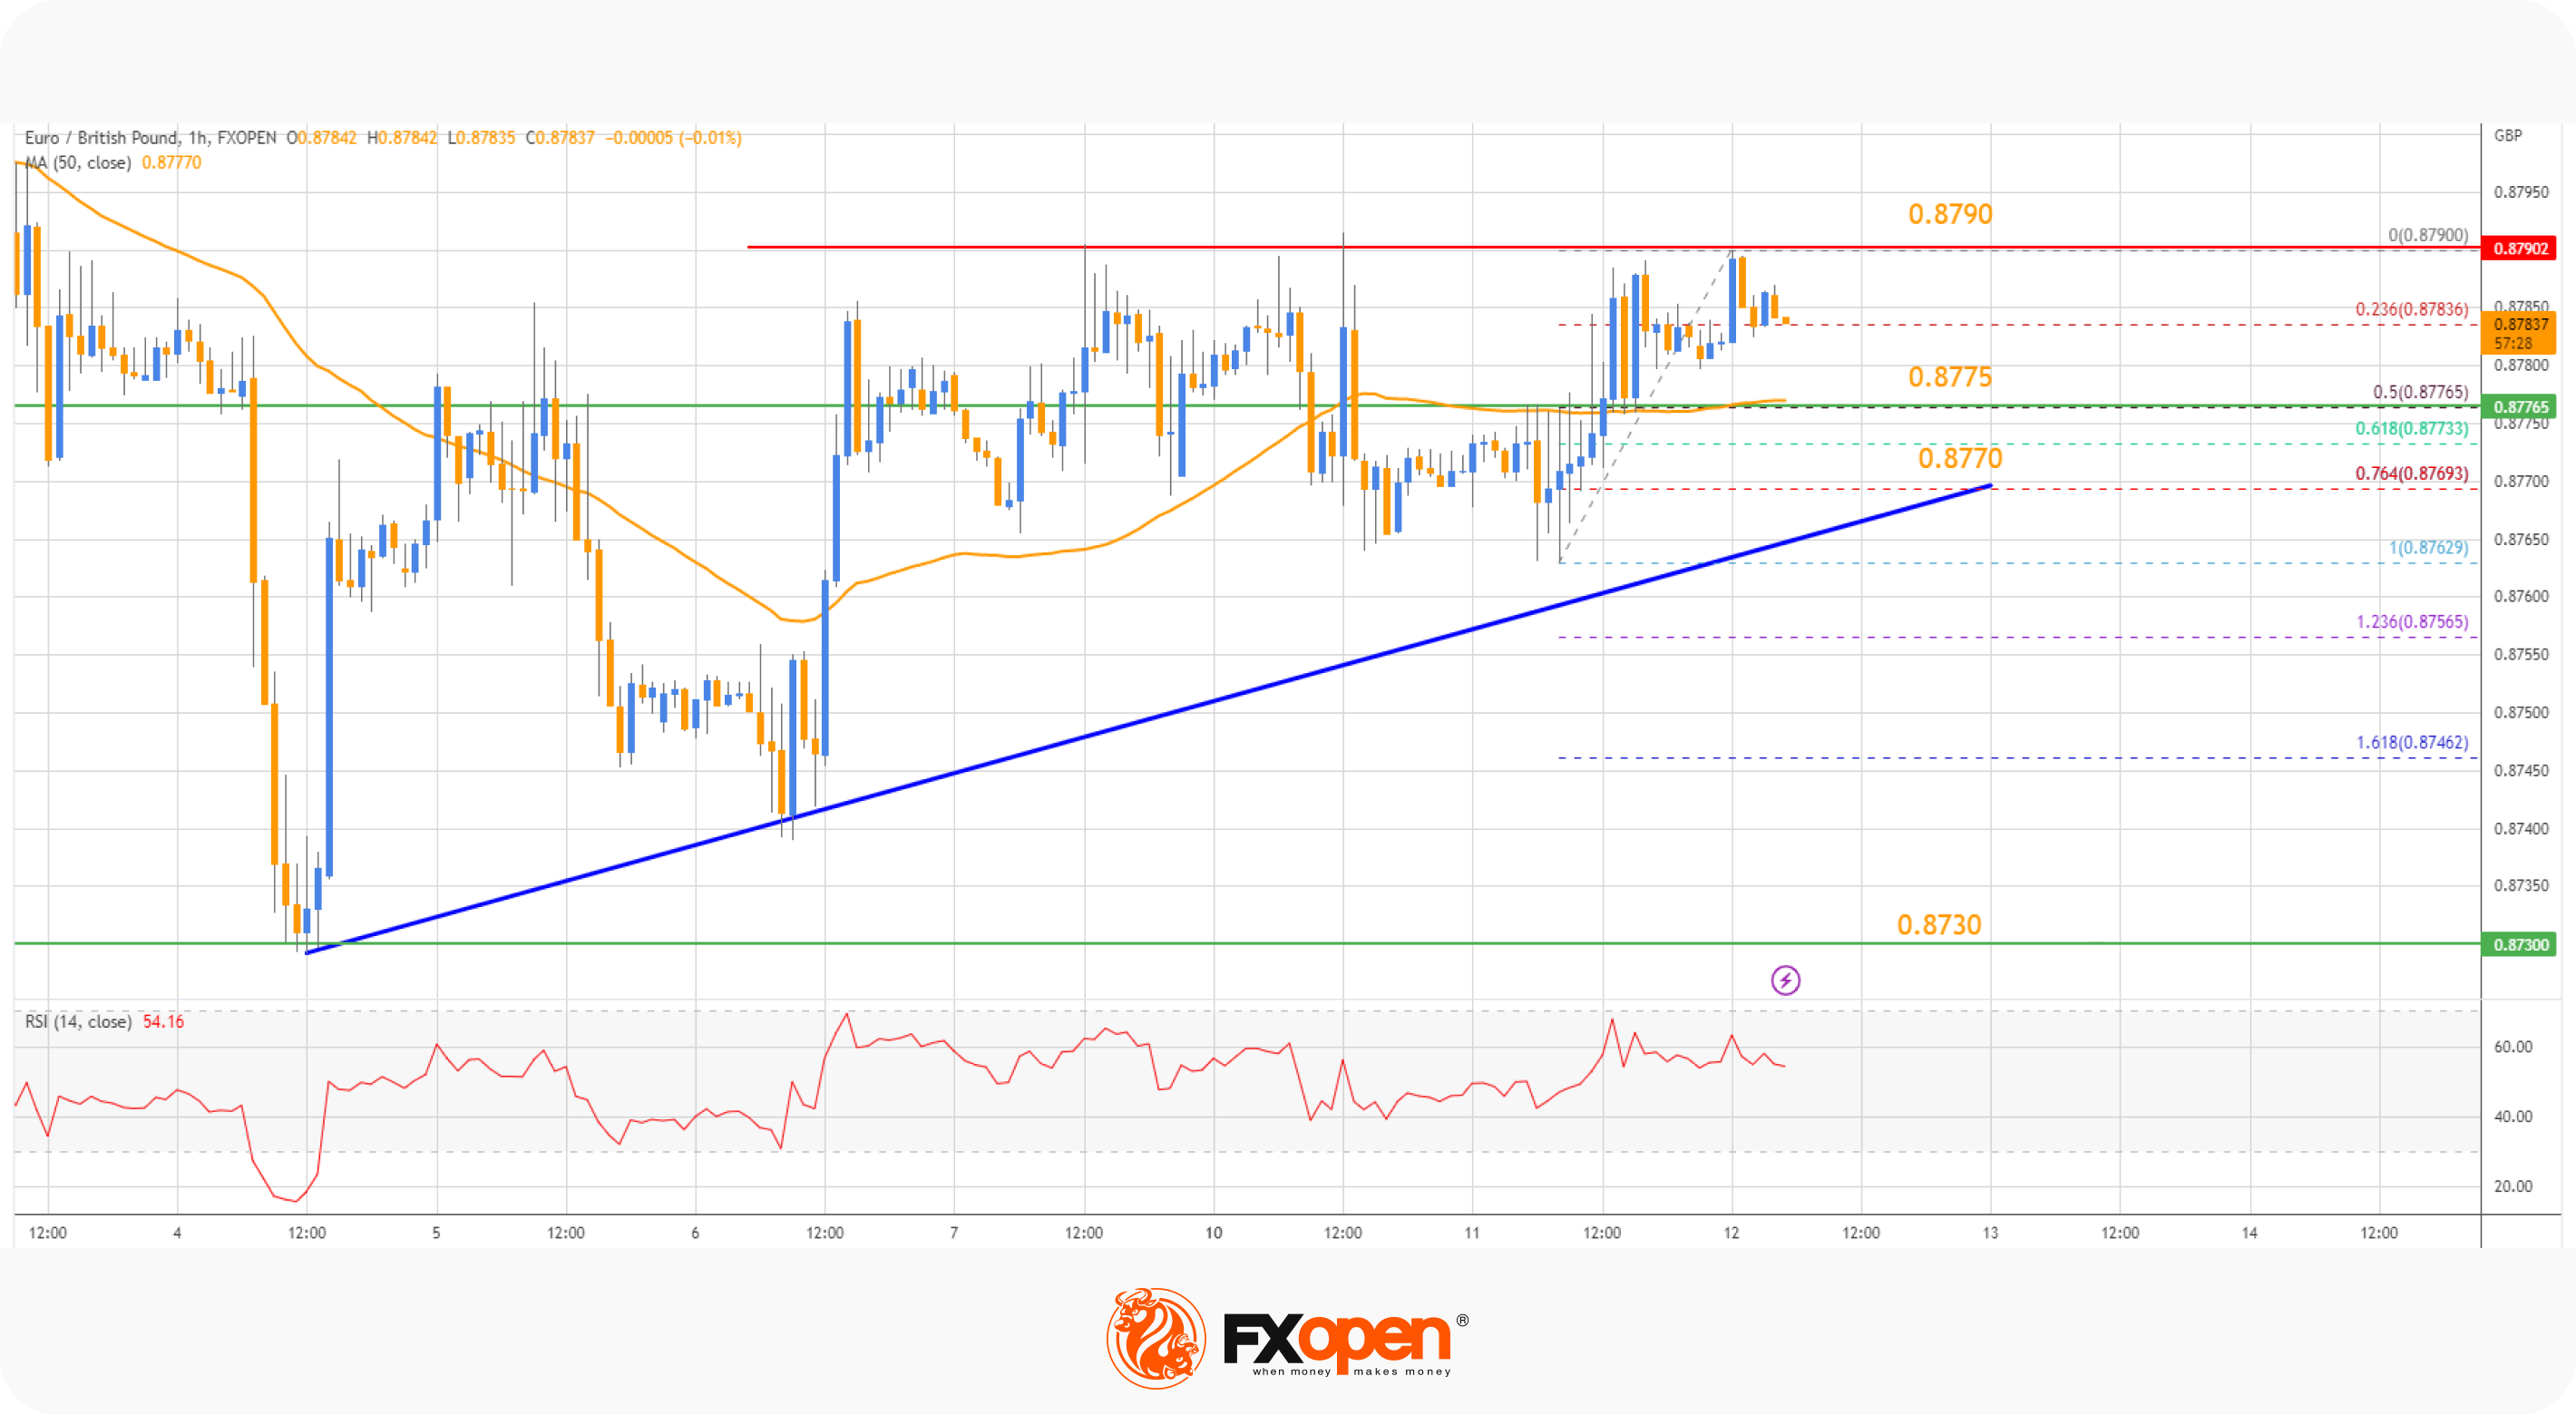
On the hourly chart at FXOpen, the Euro traded in a small range below the 0.8790 resistance zone against the British Pound. The EUR/GBP pair made a couple of attempts to break the 0.8790 resistance but failed.
⬇️The recent high was formed near 0.8790, and the pair is now consolidating. If there is a bearish reaction and RSI falls below 50, it may find bids near the 50-hour simple moving average at 0.8755. The stated support coincides with the 50% Fib retracement level of the upward move from the 0.8762 swing low to the 0.8790 high.
The next major support is near a bullish trendline at 0.8770. A downside break below it may lead to more downward moves. In the stated case, the pair could decline toward the 0.8730 support level in the near term.
⬆️Conversely, bulls may break above the 0.8790 resistance. The next major barrier is near 0.8825, above which EUR/GBP could accelerate higher. In the stated case, the bulls may aim for a test of 0.8880. Any more gains may send the pair toward 0.8900.
⚠️
CFDs are complex instruments and come with a high risk of losing your money.
This forecast represents FXOpen Companies’ opinion only, it should not be construed as an offer, invitation, or recommendation with respect to FXOpen Companies’ products and services or as financial advice.
#ForexTrading #tradingstrategy #technicalanalysis #riskmanagement #CFD
What is a Divergence in Trading? 3 Trading Strategies Explained
Divergence trading is a cornerstone concept in the realm of technical analysis 📊. By comparing the direction of asset prices with the direction of momentum indicators, traders can notice subtle changes in market dynamics.
In this video, we'll dive into the concept of divergence in trading, explaining how it can help identify potential trend reversals or continuations. We'll cover the most popular indicators that form divergences with the price, offering a detailed breakdown of each type.
By the end, you'll understand how to spot divergences and incorporate them into your trading strategy! 📈
https://cutt.ly/1eUMaYBV
To take advantage of price fluctuations in the foreign exchange markets, consider enlisting the services of a reliable broker like FXOpen.
⚠️
This forecast represents FXOpen Companies opinion only, it should not be construed as an offer, invitation or recommendation in respect to FXOpen Companies products and services or as financial advice.
YouTube
What is a Divergence in Trading? 3 Trading Strategies Explained #divergencetrading #tradingstrategy
Divergence trading is a cornerstone concept in the realm of technical analysis. By comparing the direction of asset prices with the direction of momentum indicators, traders can notice subtle changes in market dynamics.
In this video, we'll dive into the…
In this video, we'll dive into the…
👍2
#TechnicalAnalysis #ChartPatterns #SwingTrading #BreakoutTrading #TrendReversal #DiamondPattern #TradingStrategy #ForexCharts #TraderEducation
Diamond Chart Pattern Explained | Are Diamond Patterns the Hidden Signal Behind Major Reversals?
Learn how to trade the diamond chart pattern, a unique signal for potential trend reversals. Discover how bullish and bearish diamond patterns form, and explore practical strategies like breakout trading and retracement trading.
We cover:
🔸 What is the Diamond Chart Pattern? Bullish and Bearish Diamond Patterns
🔸 Applying the Diamond Pattern in Trading
🔸 Breakout Trading
🔸 Retracement Trading
🔸 Limitations of the Diamond Pattern
While the diamond pattern may help identify market reversals, traders often combine it with other technical tools for stronger confirmation.
If you’d like to put the diamond pattern into practice, you may consider opening an FXOpen account and gain access to tight spreads from 0.0 pips and low commissions.
CFDs are complex instruments and come with a high risk of losing your money.
https://cutt.ly/Or5kNBUf
YouTube
Diamond Chart Pattern Explained | Are Diamond Patterns the Hidden Signal Behind Major Reversals?
Learn how to trade the diamond chart pattern, a unique signal for potential trend reversals. Discover how bullish and bearish diamond patterns form, and explore practical strategies like breakout trading and retracement trading.
We cover:
00:16 — What is…
We cover:
00:16 — What is…
👍2
Learn how the Volume Profile Visible Range (VPVR) indicator works and how traders use it to analyze market volume and price activity in forex, stocks, indices, and commodities.
Volume is one of the cornerstones of technical analysis. It measures how many assets or contracts are traded within a specific period, giving traders a sense of the strength behind price movements. However, to gain deeper insight, traders need to go beyond the total number — and that’s where the Volume Profile comes in.
📊 In this video, we explore one of the key tools in volume analysis: the Volume Profile Visible Range (VPVR) indicator. Also known simply as VPVR, this tool provides a detailed view of volume distribution across different price levels, helping traders make more informed decisions.
This video covers:
🔸What Is the Volume Profile Visible Range (VPVR) Indicator?
🔸Components of the VPVR: Price Ranges, Volume Bars, Point of Control, and Value Area
🔸Key VPVR Settings: Row Size, Ticks per Row, Value Area Percentage, and Volume Type
🔸Using the VPVR Indicator
🔸Limitations of the VPVR
Have you tried using VPVR in your trading strategy?
https://cutt.ly/etvvFKT5
CFDs are complex instruments and come with a high risk of losing money rapidly due to leverage. You should consider whether you understand how CFDs work, and whether you can afford to take the high risk of losing your money. You can find the full disclaimer here: www.fxopen.com.
#volumeprofile #vpvr #volumeanalysis #tradingeducation #technicalanalysis #chartingtools #tradinglearning #financialeducation #stockmarketeducation #indicatortrading
YouTube
Learn VPVR: Understanding Volume Profile Visible Range Indicator
Learn how the Volume Profile Visible Range (VPVR) indicator works and how traders use it to analyse market volume and price activity in forex, stocks, indices, and commodities.
Volume is one of the cornerstones of technical analysis. It measures how many…
Volume is one of the cornerstones of technical analysis. It measures how many…
👍3
#Scalping #DayTrading #ForexTrading #TradingStrategy #TechnicalAnalysis
4 Popular 1-Minute Scalping Strategies (VWAP, MACD, RSI, ALMA & More)
📊 In this video, we break down 4 popular 1-minute scalping strategies designed for fast-paced trading conditions and short-term momentum trades.
If you trade the 1-minute timeframe, you already know that price action is often driven by rapid movements, volatility spikes, and quick reversals. That’s why professional traders prefer a structured approach using proven trading indicators.
We cover four widely used scalping strategies:
🔸 VWAP + MACD Trend Strategy
Learn how to combine VWAP (Volume-Weighted Average Price) with MACD (Moving Average Convergence Divergence) to identify trend direction, momentum shifts, and potential breakout entries on the 1-minute chart.
🔸 Keltner Channels + RSI Breakout Strategy
Discover how traders use Keltner Channels and RSI (Relative Strength Index) to capture continuation moves during volatility expansion and breakout conditions.
🔸 ALMA + Stochastic Reversal Strategy
This strategy focuses on early trend reversals using ALMA (Arnaud Legoux Moving Average) combined with the Stochastic Oscillator, helping identify potential turning points in fast markets.
🔸 RSI + Bollinger Bands Mean Reversion Strategy
A short-term mean reversion trading strategy using Bollinger Bands and a fast RSI setting to spot overextended moves and potential reversals.
These strategies are not edges on their own — they are frameworks. The difference comes down to how consistently they are executed when the market speeds up.
https://cutt.ly/UtNis5bG
CFDs are complex instruments and come with a high risk of losing money rapidly due to leverage. You should consider whether you understand how CFDs work, and whether you can afford to take the high risk of losing your money.
YouTube
4 Popular 1-Minute Scalping Strategies (VWAP, MACD, RSI, ALMA & More)
📊 In this video, we break down 4 popular 1-minute scalping strategies designed for fast-paced trading conditions and short-term momentum trades.
If you trade the 1-minute timeframe, you already know that price action is often driven by rapid movements,…
If you trade the 1-minute timeframe, you already know that price action is often driven by rapid movements,…
👍4