
#MarketNews #TradingStrategy #Halloween
THE HALLOWEEN STRATEGY
Halloween dates back to the traditions of the ancient Celts of Ireland and Scotland; a related trading strategy also hails from the British Isles.
In the 16th century, trading in London stocks used to freeze in the summer months, as traders preferred to leave for the provinces. This is where the saying Sell in May and Go Away stems from (we talked about it in early May).
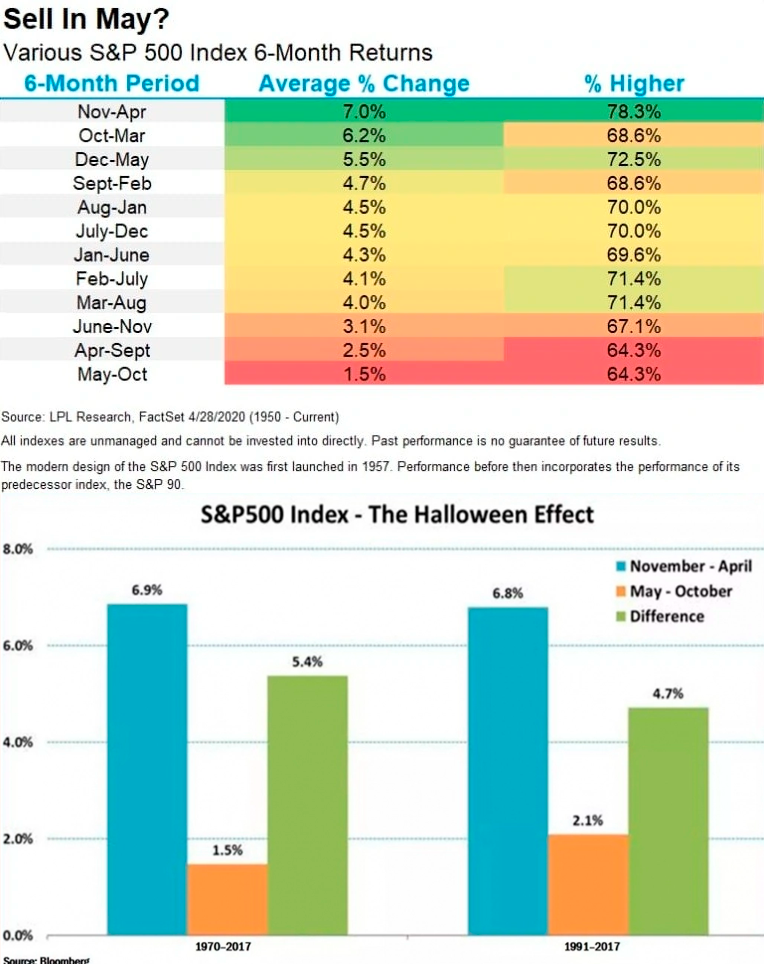
The saying was revived in the 20th century after a series of analogies drawn in publications in The Financial Times in the 1960s, and The Wall Street Journal in the 1980s. Indeed, the stats prove that starting from May, the following 6 months are not so good for stocks growth.
As such, once the 6-month period ends, it is time to invest in stocks… It's Halloween (October 31 - November 1). The Halloween strategy was popularized in 1990 in Michael O'Higgins and John Downes’ book, Beating the Dow.
Related research has confirmed that buying stocks on Nov 1 strategy works. What makes it work? There is no exact answer. Most likely, it’s a combination of factors, such as:
→ increase in trading volumes outside the holiday period;
→ the summer period is not as rich in political events (like elections);
→ Christmas sales increase corporate income and share payments;
→ companies are more likely to announce new products in the winter period;
→ interest rates usually do not change in summer.
Of the latest four BUYS made according to the Halloween strategy, three bring profit. This one time, the BUYS were spoiled by the outbreak of the current pandemic. The statistical odds, however, remain in the buyers' favor.
To invest in stocks, consider enlisting the services of a reliable broker like FXOpen.
🎃
This forecast represents FXOpen Markets Limited opinion only, it should not be construed as an offer, invitation or recommendation in respect to FXOpen Markets Limited products and services or as financial advice.
#trading #tradingtips #tradingstrategy
In this video, we'll discuss the quasimodo formation, also known as the quasimodo pattern, and how to trade it using the quasimodo FXOpen forex broker.
The quasimodo formation is a technical analysis pattern that can be used to identify opportunities in the forex market. By studying this pattern, you can identify conditions when prices are likely to change direction.
This video is aimed at providing you with a basic understanding of the quasimodo formation and how to use the FXOpen forex broker to trade it.
✅Visit: https://rb.gy/fgmmb
To take advantage of price fluctuations in the foreign exchange markets, consider enlisting the services of a reliable broker like FXOpen.
⚠️
This forecast represents FXOpen Companies opinion only, it should not be construed as an offer, invitation or recommendation in respect to FXOpen Companies products and services or as financial advice
YouTube
WHAT IS THE QUASIMODO PATTERN IN FOREX? QUASIMODO FOREX STRATEGY
In this video, we'll discuss the quasimodo formation, also known as the quasimodo pattern, and how to trade it using the quasimodo FXOpen forex broker.
The quasimodo formation is a technical analysis pattern that can be used to identify opportunities in…
The quasimodo formation is a technical analysis pattern that can be used to identify opportunities in…
#ForexTrading #tradingstrategy #technicalanalysis #riskmanagement #CFD
What is a Divergence in Trading? 3 Trading Strategies Explained
Divergence trading is a cornerstone concept in the realm of technical analysis 📊. By comparing the direction of asset prices with the direction of momentum indicators, traders can notice subtle changes in market dynamics.
In this video, we'll dive into the concept of divergence in trading, explaining how it can help identify potential trend reversals or continuations. We'll cover the most popular indicators that form divergences with the price, offering a detailed breakdown of each type.
By the end, you'll understand how to spot divergences and incorporate them into your trading strategy! 📈
https://cutt.ly/1eUMaYBV
To take advantage of price fluctuations in the foreign exchange markets, consider enlisting the services of a reliable broker like FXOpen.
⚠️
This forecast represents FXOpen Companies opinion only, it should not be construed as an offer, invitation or recommendation in respect to FXOpen Companies products and services or as financial advice.
YouTube
What is a Divergence in Trading? 3 Trading Strategies Explained #divergencetrading #tradingstrategy
Divergence trading is a cornerstone concept in the realm of technical analysis. By comparing the direction of asset prices with the direction of momentum indicators, traders can notice subtle changes in market dynamics.
In this video, we'll dive into the…
In this video, we'll dive into the…
👍2
#TechnicalAnalysis #ChartPatterns #SwingTrading #BreakoutTrading #TrendReversal #DiamondPattern #TradingStrategy #ForexCharts #TraderEducation
Diamond Chart Pattern Explained | Are Diamond Patterns the Hidden Signal Behind Major Reversals?
Learn how to trade the diamond chart pattern, a unique signal for potential trend reversals. Discover how bullish and bearish diamond patterns form, and explore practical strategies like breakout trading and retracement trading.
We cover:
🔸 What is the Diamond Chart Pattern? Bullish and Bearish Diamond Patterns
🔸 Applying the Diamond Pattern in Trading
🔸 Breakout Trading
🔸 Retracement Trading
🔸 Limitations of the Diamond Pattern
While the diamond pattern may help identify market reversals, traders often combine it with other technical tools for stronger confirmation.
If you’d like to put the diamond pattern into practice, you may consider opening an FXOpen account and gain access to tight spreads from 0.0 pips and low commissions.
CFDs are complex instruments and come with a high risk of losing your money.
https://cutt.ly/Or5kNBUf
YouTube
Diamond Chart Pattern Explained | Are Diamond Patterns the Hidden Signal Behind Major Reversals?
Learn how to trade the diamond chart pattern, a unique signal for potential trend reversals. Discover how bullish and bearish diamond patterns form, and explore practical strategies like breakout trading and retracement trading.
We cover:
00:16 — What is…
We cover:
00:16 — What is…
👍2
#Scalping #DayTrading #ForexTrading #TradingStrategy #TechnicalAnalysis
4 Popular 1-Minute Scalping Strategies (VWAP, MACD, RSI, ALMA & More)
📊 In this video, we break down 4 popular 1-minute scalping strategies designed for fast-paced trading conditions and short-term momentum trades.
If you trade the 1-minute timeframe, you already know that price action is often driven by rapid movements, volatility spikes, and quick reversals. That’s why professional traders prefer a structured approach using proven trading indicators.
We cover four widely used scalping strategies:
🔸 VWAP + MACD Trend Strategy
Learn how to combine VWAP (Volume-Weighted Average Price) with MACD (Moving Average Convergence Divergence) to identify trend direction, momentum shifts, and potential breakout entries on the 1-minute chart.
🔸 Keltner Channels + RSI Breakout Strategy
Discover how traders use Keltner Channels and RSI (Relative Strength Index) to capture continuation moves during volatility expansion and breakout conditions.
🔸 ALMA + Stochastic Reversal Strategy
This strategy focuses on early trend reversals using ALMA (Arnaud Legoux Moving Average) combined with the Stochastic Oscillator, helping identify potential turning points in fast markets.
🔸 RSI + Bollinger Bands Mean Reversion Strategy
A short-term mean reversion trading strategy using Bollinger Bands and a fast RSI setting to spot overextended moves and potential reversals.
These strategies are not edges on their own — they are frameworks. The difference comes down to how consistently they are executed when the market speeds up.
https://cutt.ly/UtNis5bG
CFDs are complex instruments and come with a high risk of losing money rapidly due to leverage. You should consider whether you understand how CFDs work, and whether you can afford to take the high risk of losing your money.
YouTube
4 Popular 1-Minute Scalping Strategies (VWAP, MACD, RSI, ALMA & More)
📊 In this video, we break down 4 popular 1-minute scalping strategies designed for fast-paced trading conditions and short-term momentum trades.
If you trade the 1-minute timeframe, you already know that price action is often driven by rapid movements,…
If you trade the 1-minute timeframe, you already know that price action is often driven by rapid movements,…
👍4