
#stockmarket #stocktrading #MarketUpdates #MarketNews
Bank of America (BAC) Shares Drop Over 6%
On 18 February, we reported that Warren Buffett was selling bank stocks, including Bank of America (BAC) and Citigroup (C). This proved to be a sharp decision, as yesterday:
→ Bank of America (BAC) shares fell by 6.34%
→ Citigroup (C) shares fell by 6.25%
As a result, BAC stock hit its lowest level of 2025.
Why Did Bank of America (BAC) and Citigroup (C) Shares Decline?
Investor bearish sentiment may have been driven by concerns over:
→ New US tariffs on imports from Mexico and Canada
→ The risk of renewed inflation growth amid an economic slowdown
This led to a broader decline in financial sector stocks yesterday
Technical Analysis of Bank of America (BAC)
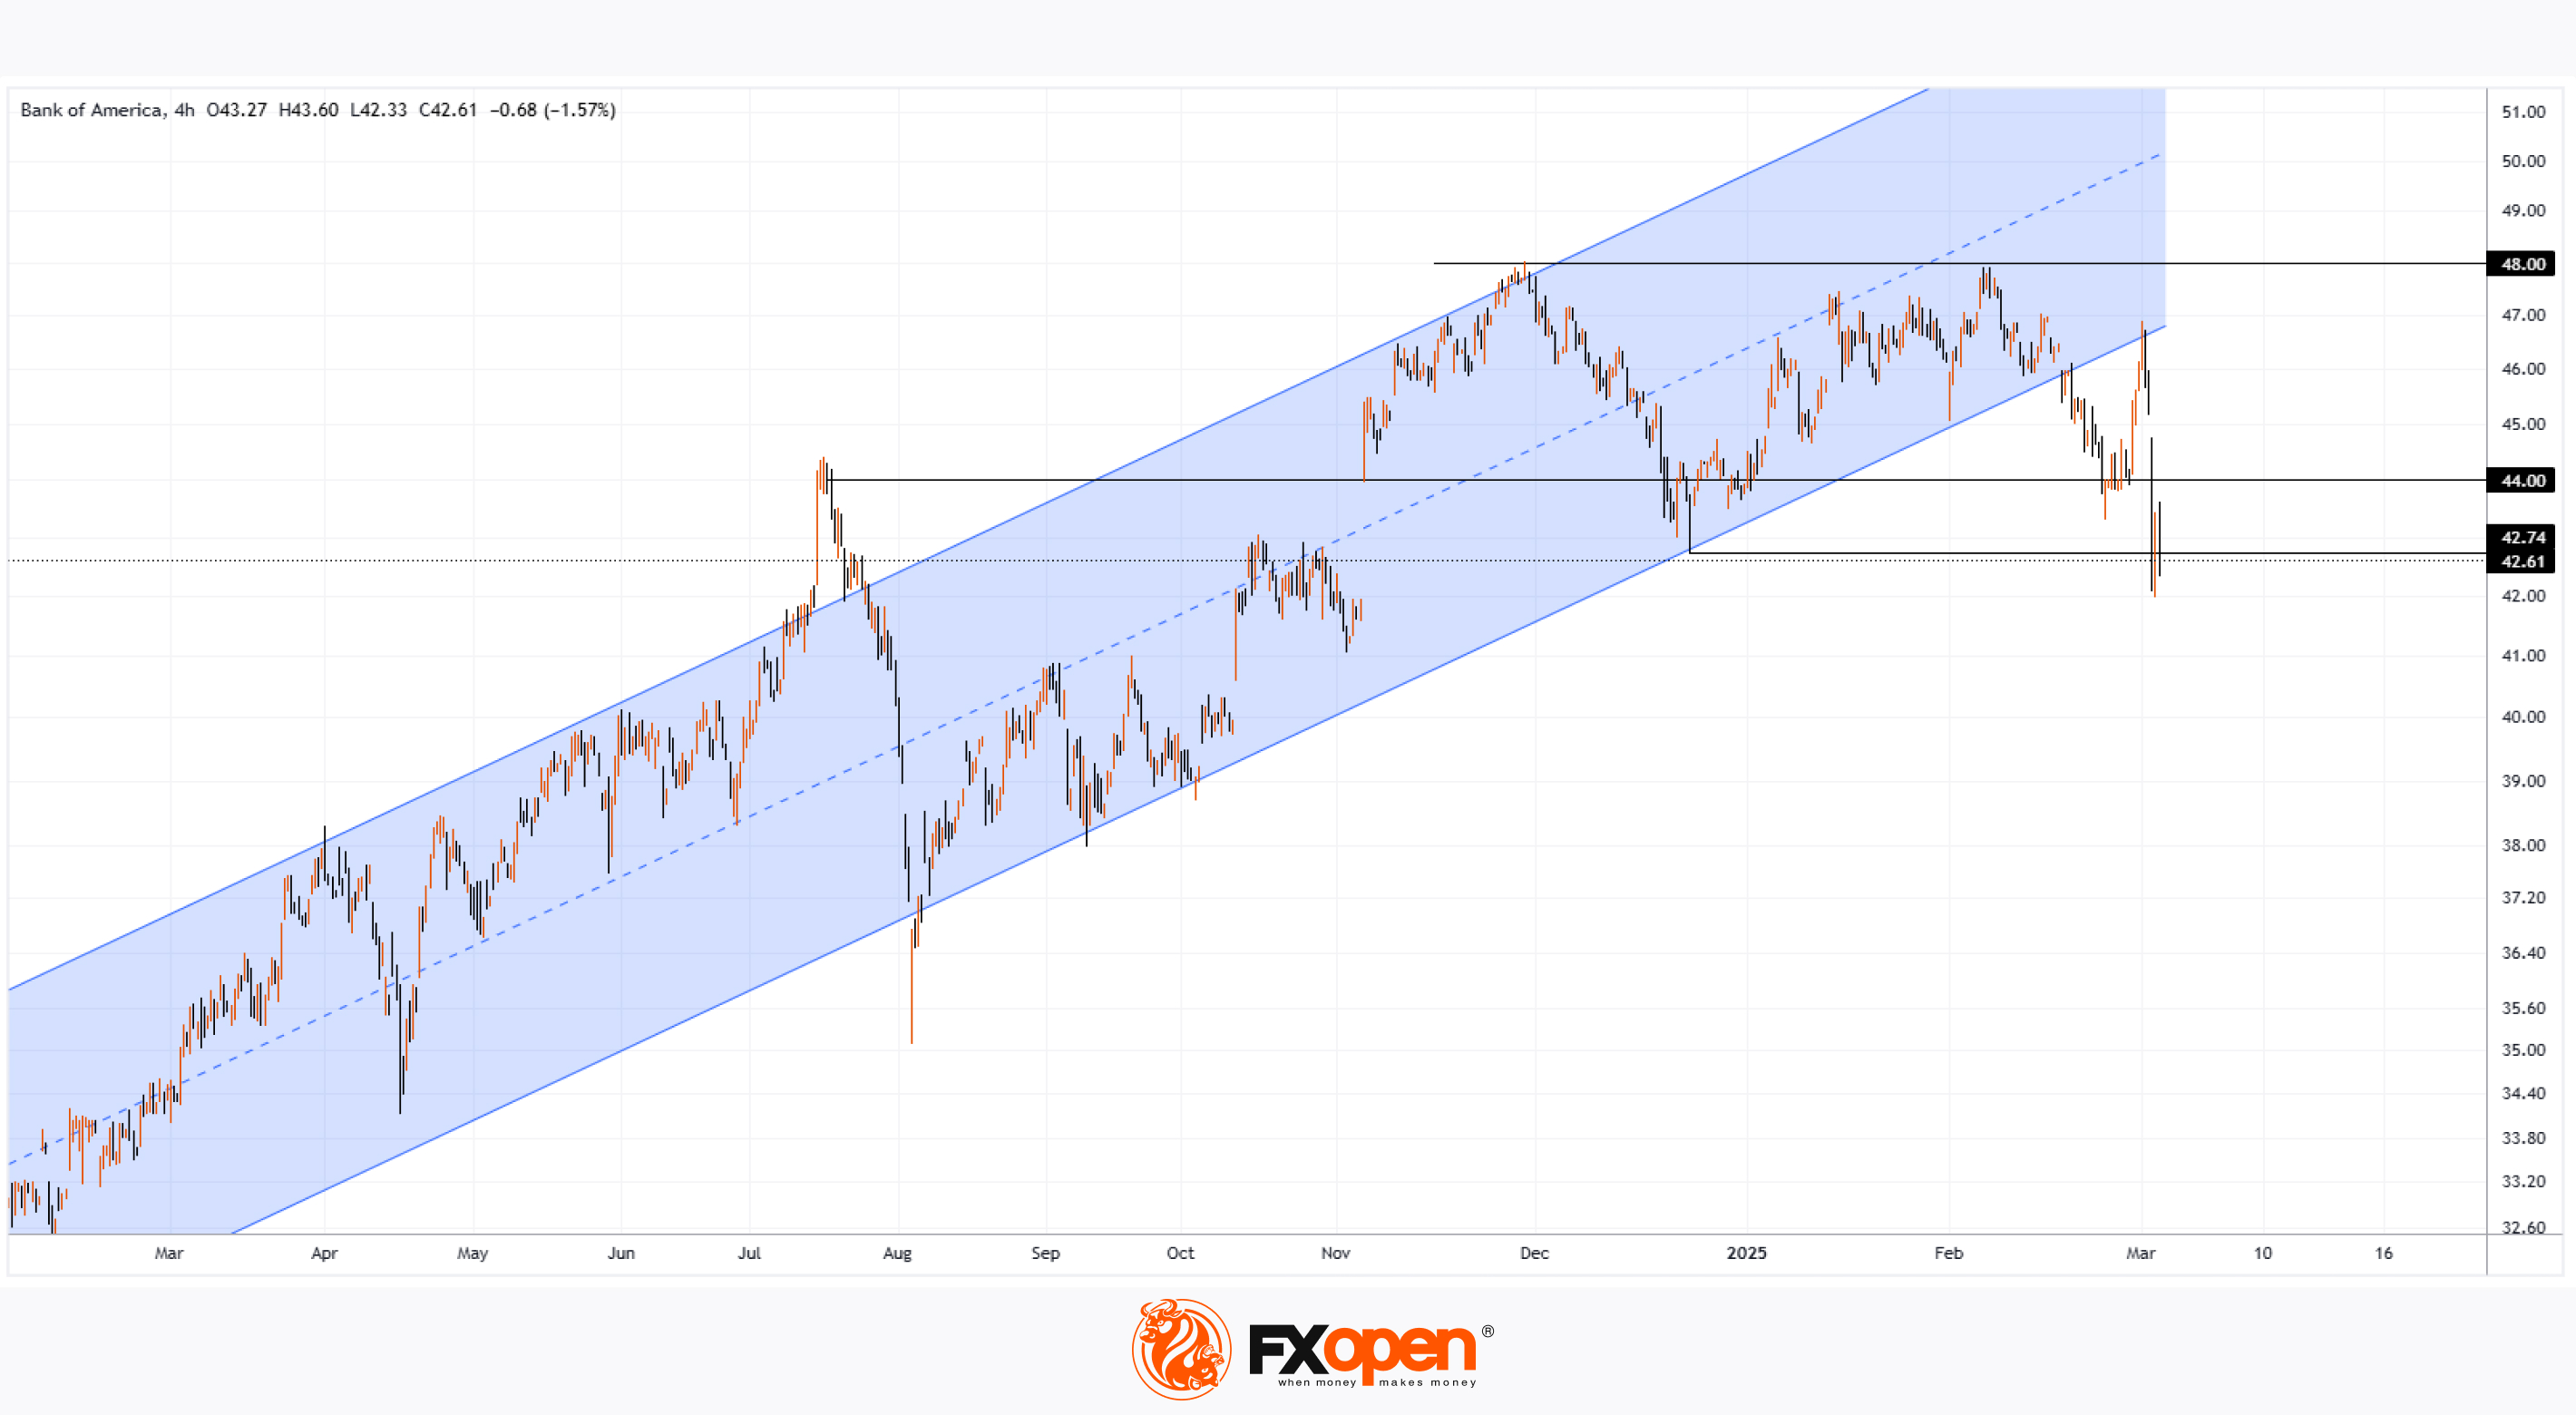
The chart shows that in 2024, the price was in an upward trend (illustrated by the blue channel), but the $48 level proved too strong for bulls to break. Key observations:
→ In mid-February, a bearish breakout occurred below the channel, and in early March, the same level acted as resistance
→ The $44 level has influenced the trend in the past and could now act as resistance again
→ A drop below the late-December low may indicate a Change of Character (ChoCh) pattern, signalling a potential market shift
BAC Stock Price Forecasts
Analysts remain optimistic. According to TipRanks:
→ 17 out of 19 analysts recommend buying BAC stock
→ The average 12-month price target for BAC is $53
Trade global index CFDs with zero commission and tight spreads. Open your FXOpen account now or learn more about trading index CFDs with FXOpen.
CFDs are complex instruments and come with a high risk of losing your money.
This article represents the opinion of the Companies operating under the FXOpen brand only. It is not to be construed as an offer, solicitation, or recommendation with respect to products and services provided by the Companies operating under the FXOpen brand, nor is it to be considered financial advice.
Bank of America (BAC) Shares Drop Over 6%
On 18 February, we reported that Warren Buffett was selling bank stocks, including Bank of America (BAC) and Citigroup (C). This proved to be a sharp decision, as yesterday:
→ Bank of America (BAC) shares fell by 6.34%
→ Citigroup (C) shares fell by 6.25%
As a result, BAC stock hit its lowest level of 2025.
Why Did Bank of America (BAC) and Citigroup (C) Shares Decline?
Investor bearish sentiment may have been driven by concerns over:
→ New US tariffs on imports from Mexico and Canada
→ The risk of renewed inflation growth amid an economic slowdown
This led to a broader decline in financial sector stocks yesterday
Technical Analysis of Bank of America (BAC)
The chart shows that in 2024, the price was in an upward trend (illustrated by the blue channel), but the $48 level proved too strong for bulls to break. Key observations:
→ In mid-February, a bearish breakout occurred below the channel, and in early March, the same level acted as resistance
→ The $44 level has influenced the trend in the past and could now act as resistance again
→ A drop below the late-December low may indicate a Change of Character (ChoCh) pattern, signalling a potential market shift
BAC Stock Price Forecasts
Analysts remain optimistic. According to TipRanks:
→ 17 out of 19 analysts recommend buying BAC stock
→ The average 12-month price target for BAC is $53
Trade global index CFDs with zero commission and tight spreads. Open your FXOpen account now or learn more about trading index CFDs with FXOpen.
CFDs are complex instruments and come with a high risk of losing your money.
This article represents the opinion of the Companies operating under the FXOpen brand only. It is not to be construed as an offer, solicitation, or recommendation with respect to products and services provided by the Companies operating under the FXOpen brand, nor is it to be considered financial advice.
👍2
#stockmarket #stocktrading #MarketUpdates #marketanalysis
Ford (F) Stock Price Rises Following Trump's Decision
The White House announced on Wednesday that automakers will receive a one-month exemption from tariffs on imports from Mexico and Canada for vehicles that comply with the free trade agreement between these two countries and the United States.
White House Press Secretary Karoline Leavitt stated that this move came in response to a request from the heads of Ford Motor, General Motors, and Stellantis. The American Automotive Policy Council expressed gratitude to President Trump in a statement and noted that companies would work with the administration to boost vehicle production in the U.S. and expand exports.
This fundamental backdrop triggered a bullish momentum in the stock market for these automakers. In particular, Ford (F) shares rose by more than 6%, while the S&P 500 (US SPX 500 mini on FXOpen) gained about 1.1%.
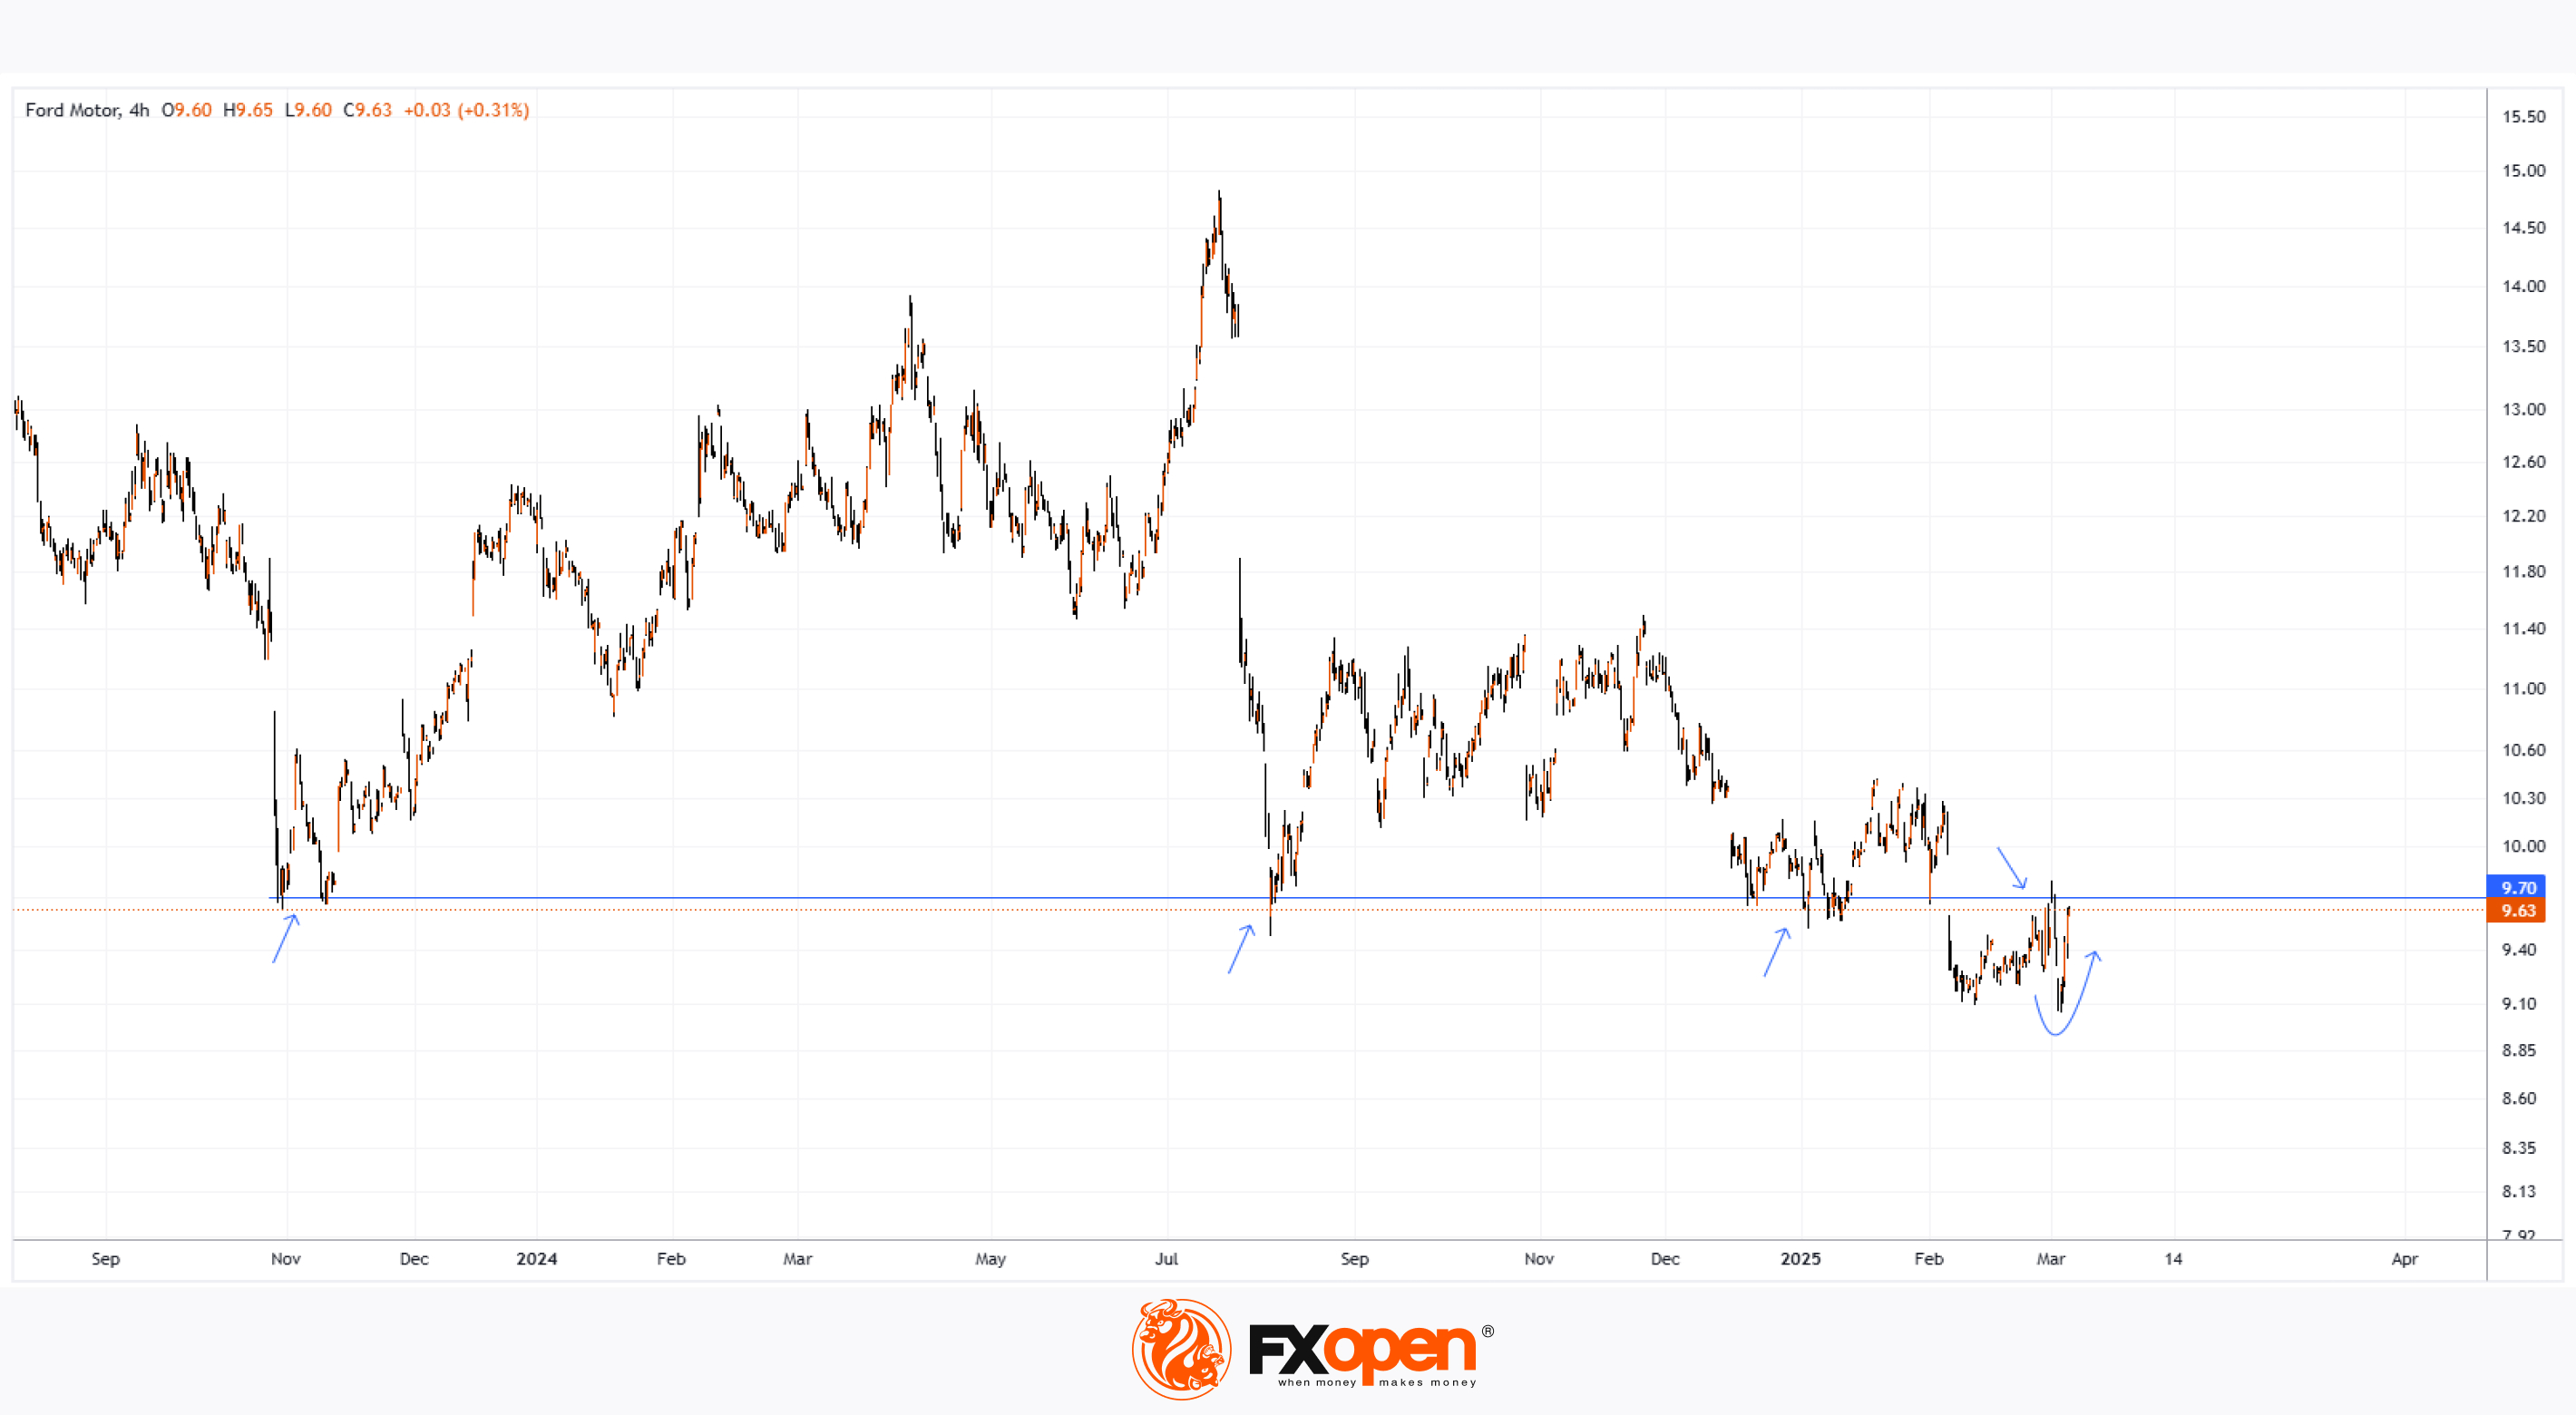
As shown in Ford (F) stock's price chart today, the stock has rebounded from a four-year low.
Technical Analysis of Ford (F) Stock Chart
As we noted in our February 7 analysis of Ford (F) stock, special attention should be paid to the level marked by the blue line. This area, around $9.65–$9.75, acted as support in 2023 and 2024 (indicated by arrows), preventing bears from pushing the price below the psychological threshold of $10 per share.
We also highlighted the "Trump factor" and the fact that the newly inaugurated president could drastically alter the landscape for the iconic American automaker by imposing tariffs on foreign car manufacturers. The impact of this price driver on Ford (F) shares is visible on the chart: a sharp upward reversal (marked by a curved arrow) indicates that the bears’ attempt to push the stock below its previous low has failed.
It is reasonable to assume that bulls now have the initiative. If they manage to push Ford (F) stock above the resistance of the blue line, this level could turn into future support.
Ford (F) Stock Price Forecasts
Analysts remain cautious in their assessments. They may believe that one month is too short a period to significantly alter supply chains and relocate production to the U.S., where, according to Trump's statements, no tariffs would be imposed.
According to TipRanks:
→ Only 4 out of 14 analysts recommend buying Ford (F) stock.
→ The average 12-month price forecast for Ford (F) is $10.76.
Trade global index CFDs with zero commission and tight spreads. Open your FXOpen account now or learn more about trading index CFDs with FXOpen.
CFDs are complex instruments and come with a high risk of losing your money.
This article represents the opinion of the Companies operating under the FXOpen brand only. It is not to be construed as an offer, solicitation, or recommendation with respect to products and services provided by the Companies operating under the FXOpen brand, nor is it to be considered financial advice.
Ford (F) Stock Price Rises Following Trump's Decision
The White House announced on Wednesday that automakers will receive a one-month exemption from tariffs on imports from Mexico and Canada for vehicles that comply with the free trade agreement between these two countries and the United States.
White House Press Secretary Karoline Leavitt stated that this move came in response to a request from the heads of Ford Motor, General Motors, and Stellantis. The American Automotive Policy Council expressed gratitude to President Trump in a statement and noted that companies would work with the administration to boost vehicle production in the U.S. and expand exports.
This fundamental backdrop triggered a bullish momentum in the stock market for these automakers. In particular, Ford (F) shares rose by more than 6%, while the S&P 500 (US SPX 500 mini on FXOpen) gained about 1.1%.
As shown in Ford (F) stock's price chart today, the stock has rebounded from a four-year low.
Technical Analysis of Ford (F) Stock Chart
As we noted in our February 7 analysis of Ford (F) stock, special attention should be paid to the level marked by the blue line. This area, around $9.65–$9.75, acted as support in 2023 and 2024 (indicated by arrows), preventing bears from pushing the price below the psychological threshold of $10 per share.
We also highlighted the "Trump factor" and the fact that the newly inaugurated president could drastically alter the landscape for the iconic American automaker by imposing tariffs on foreign car manufacturers. The impact of this price driver on Ford (F) shares is visible on the chart: a sharp upward reversal (marked by a curved arrow) indicates that the bears’ attempt to push the stock below its previous low has failed.
It is reasonable to assume that bulls now have the initiative. If they manage to push Ford (F) stock above the resistance of the blue line, this level could turn into future support.
Ford (F) Stock Price Forecasts
Analysts remain cautious in their assessments. They may believe that one month is too short a period to significantly alter supply chains and relocate production to the U.S., where, according to Trump's statements, no tariffs would be imposed.
According to TipRanks:
→ Only 4 out of 14 analysts recommend buying Ford (F) stock.
→ The average 12-month price forecast for Ford (F) is $10.76.
Trade global index CFDs with zero commission and tight spreads. Open your FXOpen account now or learn more about trading index CFDs with FXOpen.
CFDs are complex instruments and come with a high risk of losing your money.
This article represents the opinion of the Companies operating under the FXOpen brand only. It is not to be construed as an offer, solicitation, or recommendation with respect to products and services provided by the Companies operating under the FXOpen brand, nor is it to be considered financial advice.
👍2
#NFLX #stockmarket #stocktrading #MarketUpdates
Netflix (NFLX) Shares Among the Biggest Losers in the US Stock Market
According to market charts:
→ Netflix (NFLX) shares fell by approximately 8.5% during yesterday’s trading session, indicating that bulls failed to sustain the price above the psychological $1,000 per share level.
→ The S&P 500 index (US SPX 500 mini on FXOpen) hit a new low for 2025, closing down around 1.3%.
These declines reflect bearish sentiment in the US stock market, which may be driven by:
→ Uncertainty over Trump’s trade tariff policies. Yesterday, the White House postponed the introduction of tariffs on trade with Canada and Mexico for a second time, now pushing the deadline to early April.
→ Anxiety ahead of the Non-Farm Employment Change report release (scheduled for today at 16:30 GMT+3), as recession fears continue to mount.
Selling pressure was particularly strong in Netflix (NFLX) shares, as analysts (according to media reports) issued a cautious outlook on subscriber growth for the streaming giant. This may stem from concerns that the company's low-cost, ad-supported subscription model is losing its initial positive impact.
Technical Analysis of Netflix (NFLX) Stock Chart
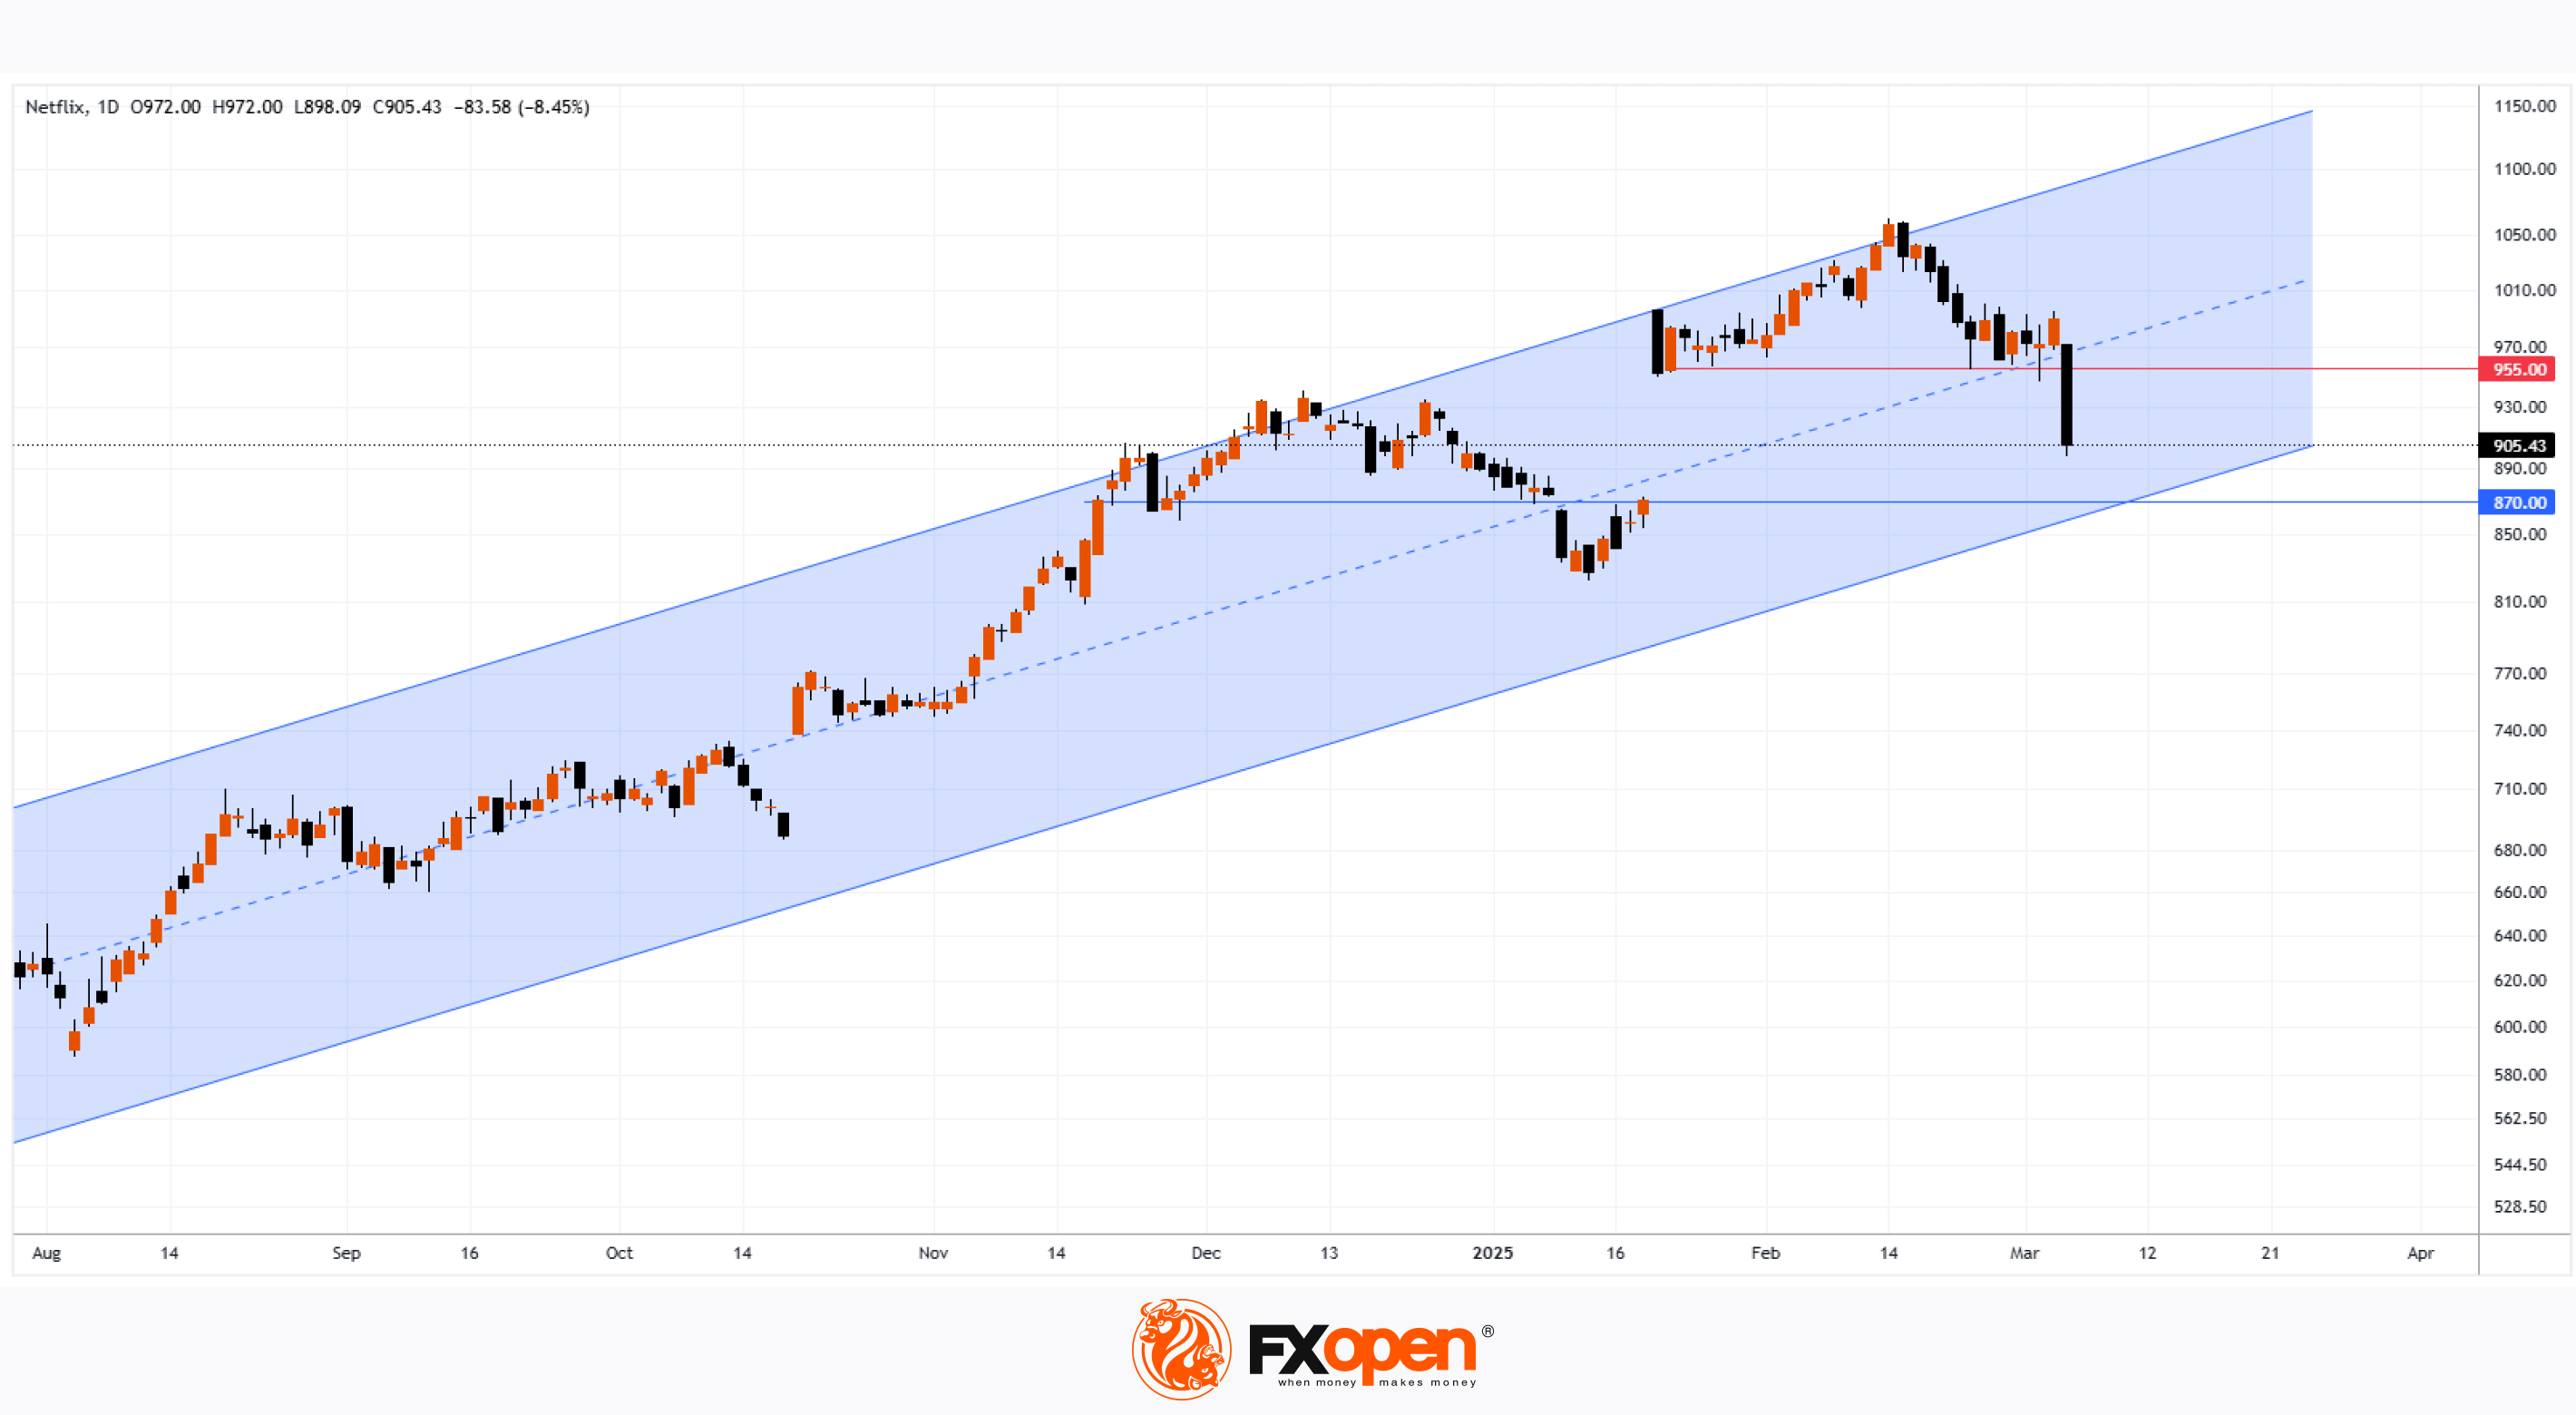
Price movements in 2025 have formed an upward channel (marked in blue), which remains intact for now.
The $955 level, which previously acted as support, may now serve as resistance. If bearish sentiment persists, the price could continue its downward trajectory. However, bulls may find hope in key support areas, including:
→ The lower boundary of the current price channel.
→ The $870 level, which marks the lower limit of a broad bullish gap formed after a strong quarterly earnings report (as we noted on 23 January). This level has also acted as a key reversal point multiple times.
Analysts’ Forecasts for Netflix (NFLX) Stock
Overall, analysts remain optimistic. According to TipRanks:
→ The average 12-month price target for NFLX is $1,100.
→ 29 out of 37 analysts recommend buying NFLX shares.
Trade global index CFDs with zero commission and tight spreads. Open your FXOpen account now or learn more about trading index CFDs with FXOpen.
CFDs are complex instruments and come with a high risk of losing your money.
This article represents the opinion of the Companies operating under the FXOpen brand only. It is not to be construed as an offer, solicitation, or recommendation with respect to products and services provided by the Companies operating under the FXOpen brand, nor is it to be considered financial advice.
Netflix (NFLX) Shares Among the Biggest Losers in the US Stock Market
According to market charts:
→ Netflix (NFLX) shares fell by approximately 8.5% during yesterday’s trading session, indicating that bulls failed to sustain the price above the psychological $1,000 per share level.
→ The S&P 500 index (US SPX 500 mini on FXOpen) hit a new low for 2025, closing down around 1.3%.
These declines reflect bearish sentiment in the US stock market, which may be driven by:
→ Uncertainty over Trump’s trade tariff policies. Yesterday, the White House postponed the introduction of tariffs on trade with Canada and Mexico for a second time, now pushing the deadline to early April.
→ Anxiety ahead of the Non-Farm Employment Change report release (scheduled for today at 16:30 GMT+3), as recession fears continue to mount.
Selling pressure was particularly strong in Netflix (NFLX) shares, as analysts (according to media reports) issued a cautious outlook on subscriber growth for the streaming giant. This may stem from concerns that the company's low-cost, ad-supported subscription model is losing its initial positive impact.
Technical Analysis of Netflix (NFLX) Stock Chart
Price movements in 2025 have formed an upward channel (marked in blue), which remains intact for now.
The $955 level, which previously acted as support, may now serve as resistance. If bearish sentiment persists, the price could continue its downward trajectory. However, bulls may find hope in key support areas, including:
→ The lower boundary of the current price channel.
→ The $870 level, which marks the lower limit of a broad bullish gap formed after a strong quarterly earnings report (as we noted on 23 January). This level has also acted as a key reversal point multiple times.
Analysts’ Forecasts for Netflix (NFLX) Stock
Overall, analysts remain optimistic. According to TipRanks:
→ The average 12-month price target for NFLX is $1,100.
→ 29 out of 37 analysts recommend buying NFLX shares.
Trade global index CFDs with zero commission and tight spreads. Open your FXOpen account now or learn more about trading index CFDs with FXOpen.
CFDs are complex instruments and come with a high risk of losing your money.
This article represents the opinion of the Companies operating under the FXOpen brand only. It is not to be construed as an offer, solicitation, or recommendation with respect to products and services provided by the Companies operating under the FXOpen brand, nor is it to be considered financial advice.
👍3
#MarketNews #MarketNews #gasprices
XNG/USD Analysis: Natural Gas Price Hits Over Two-Year High
On 27 January, while analysing the natural gas chart, we noted that price fluctuations:
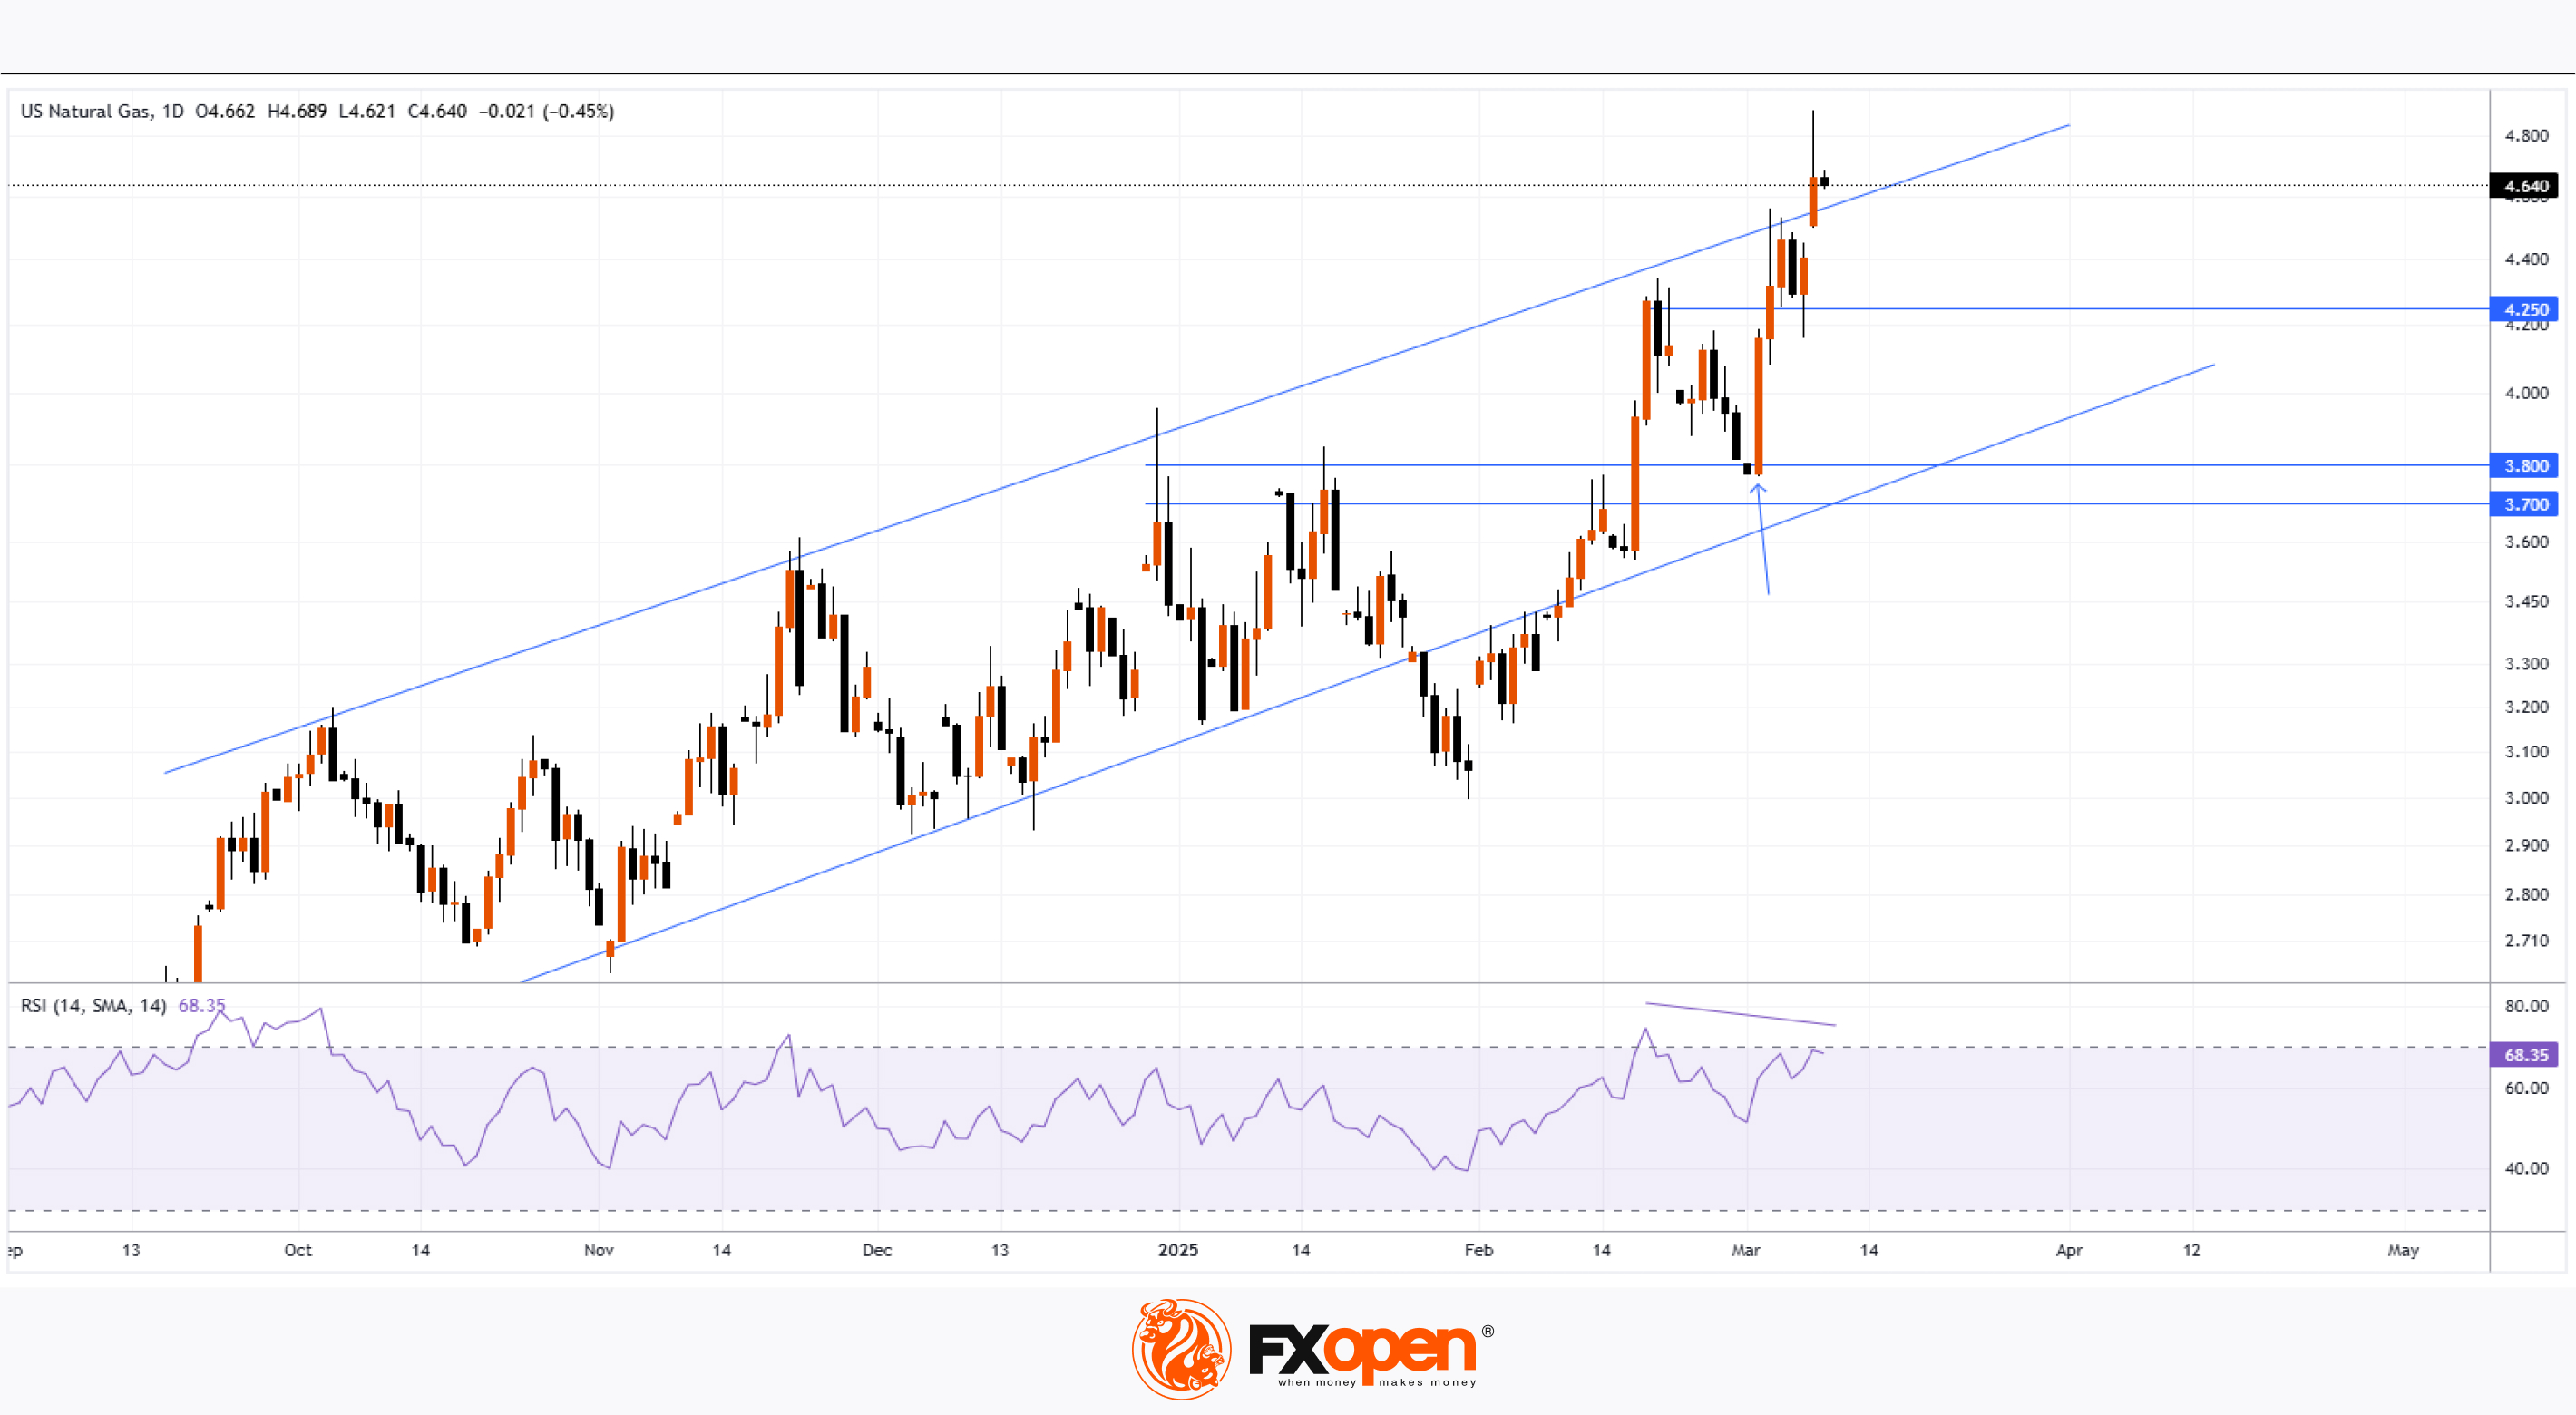
→ Were forming an ascending channel.
→ Identified $3.700 as a key resistance level.
As shown on the XNG/USD chart, bears had control in late January but failed to maintain their grip. Since then:
→ Natural gas prices have continued their upward trajectory.
→ The $3.700 level was breached, becoming part of a resistance zone with an upper boundary at $3.800, which later acted as support (as indicated by the arrow).
As a result, today, natural gas prices have surged to $4.800/MMBtu—the highest level since late December 2022.
Bullish Factors Driving the Market (According to Trading Economics):
→ Weather Conditions – A cold spell in the U.S. has increased demand for heating gas. Meteorologists predict a shift towards milder temperatures across 48 states in March.
→ LNG Exports – U.S. liquefied natural gas (LNG) exports have hit a record high of 15.6 billion cubic feet per day under the new administration. Meanwhile, trade uncertainties, including a potential slowdown in natural gas flows from Canada to the U.S., are raising concerns among market participants.
Technical Outlook for XNG/USD:
→ The market remains in an uptrend (indicated by blue lines), with the price now exceeding its upper boundary.
→ The RSI indicator is approaching overbought levels and may form a bearish divergence.
These observations suggest that the price is in a vulnerable position for a pullback. If this scenario unfolds, a test of the $4.250 area cannot be ruled out.
Start trading commodities with tight spreads. Open your trading account now or learn more about trading commodity CFDs with FXOpen.
CFDs are complex instruments and come with a high risk of losing your money.
This article represents the opinion of the Companies operating under the FXOpen brand only. It is not to be construed as an offer, solicitation, or recommendation with respect to products and services provided by the Companies operating under the FXOpen brand, nor is it to be considered financial advice.
XNG/USD Analysis: Natural Gas Price Hits Over Two-Year High
On 27 January, while analysing the natural gas chart, we noted that price fluctuations:
→ Were forming an ascending channel.
→ Identified $3.700 as a key resistance level.
As shown on the XNG/USD chart, bears had control in late January but failed to maintain their grip. Since then:
→ Natural gas prices have continued their upward trajectory.
→ The $3.700 level was breached, becoming part of a resistance zone with an upper boundary at $3.800, which later acted as support (as indicated by the arrow).
As a result, today, natural gas prices have surged to $4.800/MMBtu—the highest level since late December 2022.
Bullish Factors Driving the Market (According to Trading Economics):
→ Weather Conditions – A cold spell in the U.S. has increased demand for heating gas. Meteorologists predict a shift towards milder temperatures across 48 states in March.
→ LNG Exports – U.S. liquefied natural gas (LNG) exports have hit a record high of 15.6 billion cubic feet per day under the new administration. Meanwhile, trade uncertainties, including a potential slowdown in natural gas flows from Canada to the U.S., are raising concerns among market participants.
Technical Outlook for XNG/USD:
→ The market remains in an uptrend (indicated by blue lines), with the price now exceeding its upper boundary.
→ The RSI indicator is approaching overbought levels and may form a bearish divergence.
These observations suggest that the price is in a vulnerable position for a pullback. If this scenario unfolds, a test of the $4.250 area cannot be ruled out.
Start trading commodities with tight spreads. Open your trading account now or learn more about trading commodity CFDs with FXOpen.
CFDs are complex instruments and come with a high risk of losing your money.
This article represents the opinion of the Companies operating under the FXOpen brand only. It is not to be construed as an offer, solicitation, or recommendation with respect to products and services provided by the Companies operating under the FXOpen brand, nor is it to be considered financial advice.
👍1
#USInflation #InflationReport #DollarStrength #InterestRates #MarketTrends
Market Insights with Gary Thomson: US Inflation Rate and Producer Price Index, BoC Interest Rate
In this video, we’ll explore the key economic events, market trends, and corporate news shaping the financial landscape. Get ready for expert insights into forex, commodities, and stocks to help you navigate the week ahead. Let’s dive in!
In this episode:
🔸US Inflation Rate
The US inflation report on Wednesday could impact markets ahead of the Fed meeting. Will it reinforce dollar strength or bring surprises?
🔸BoC Interest Rate Decision
The Bank of Canada’s rate decision on Wednesday could bring market volatility. Will the press conference hint at further cuts?
🔸US Producer Price Index
The Producer Price Index is out on Thursday—will it confirm easing inflation or bring another upside surprise?
Don’t miss out—gain insights to stay ahead in your trading journey.
https://cutt.ly/hry3McKm
To take advantage of price fluctuations in the foreign exchange markets, consider enlisting the services of a reliable broker like FXOpen.
⚠️
This forecast represents FXOpen Companies opinion only, it should not be construed as an offer, invitation or recommendation in respect to FXOpen Companies products and services or as financial advice.
Market Insights with Gary Thomson: US Inflation Rate and Producer Price Index, BoC Interest Rate
In this video, we’ll explore the key economic events, market trends, and corporate news shaping the financial landscape. Get ready for expert insights into forex, commodities, and stocks to help you navigate the week ahead. Let’s dive in!
In this episode:
🔸US Inflation Rate
The US inflation report on Wednesday could impact markets ahead of the Fed meeting. Will it reinforce dollar strength or bring surprises?
🔸BoC Interest Rate Decision
The Bank of Canada’s rate decision on Wednesday could bring market volatility. Will the press conference hint at further cuts?
🔸US Producer Price Index
The Producer Price Index is out on Thursday—will it confirm easing inflation or bring another upside surprise?
Don’t miss out—gain insights to stay ahead in your trading journey.
https://cutt.ly/hry3McKm
To take advantage of price fluctuations in the foreign exchange markets, consider enlisting the services of a reliable broker like FXOpen.
⚠️
This forecast represents FXOpen Companies opinion only, it should not be construed as an offer, invitation or recommendation in respect to FXOpen Companies products and services or as financial advice.
YouTube
Market Insights with Gary Thomson: US Inflation Rate and Producer Price Index, BoC Interest Rate
In this video, we’ll explore the key economic events, market trends, and corporate news shaping the financial landscape. Get ready for expert insights into forex, commodities, and stocks to help you navigate the week ahead. Let’s dive in!
In this episode…
In this episode…
👍1
#stockmarket #stocktrading #MarketUpdates #MarketNews
Broadcom Inc. (AVGO) Stock Surges Over 8%
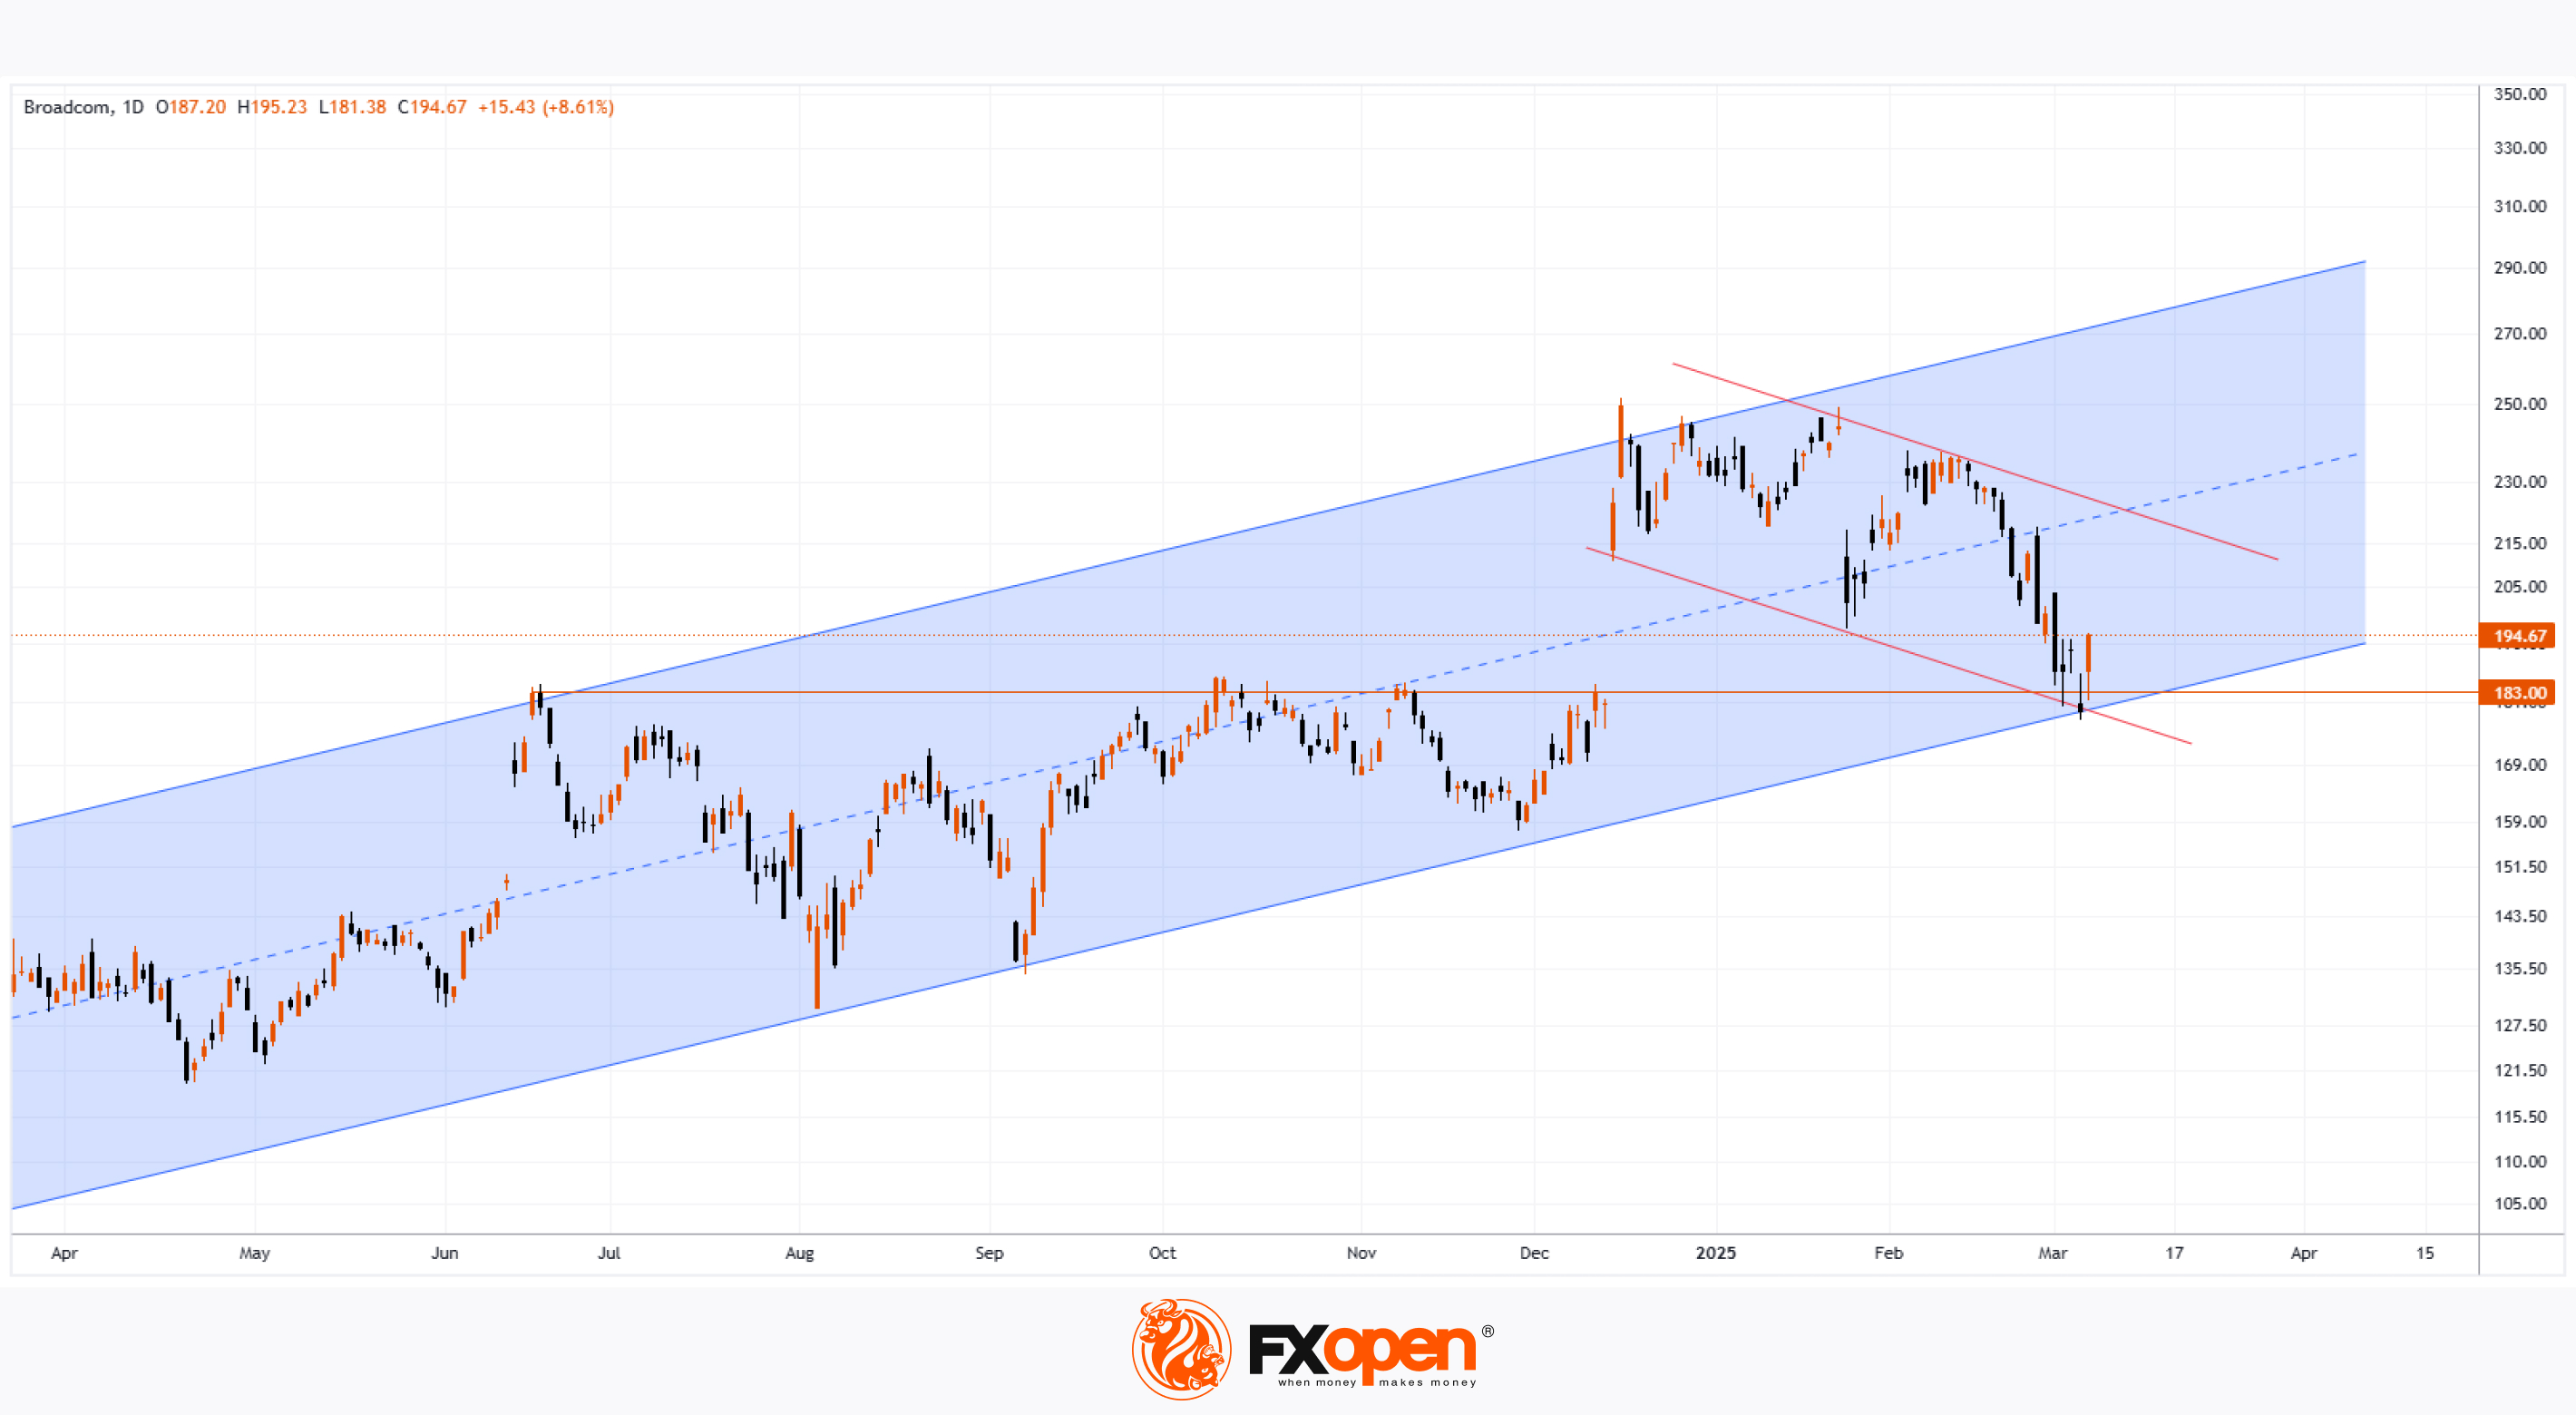
As shown on the chart, Broadcom Inc. (AVGO) shares soared by more than 8% in Friday’s trading session.
The bullish momentum is driven by strong quarterly results released last week and an optimistic outlook highlighting sustained demand in the artificial intelligence sector:
→ Earnings per share: $1.60 (Analyst forecast: $1.49)
→ Revenue: $14.92 billion (Expected: $14.61 billion), reflecting a 25% increase from $11.96 billion a year earlier.
Technical Analysis of AVGO Stock
The chart indicates that the market remains in an uptrend, with signs that the price has found support at:
→ The lower boundary of the channel.
→ The former resistance zone around $183 – which also aligns with the lower boundary of the price gap that formed in December 2024, as we previously noted.
This suggests that after forming a Bullish Flag pattern (marked in red), the upward trend may continue.
Broadcom (AVGO) Stock Price Forecast
Bank of America analyst Vivek Arya called the results from Broadcom a “reassuring update from an AI leader” and a “positive read-across for AI sentiment.”
According to TipRanks:
→ The average price target for AVGO shares is $248.
→ 27 out of 30 analysts recommend buying AVGO stock.
Trade global index CFDs with zero commission and tight spreads. Open your FXOpen account now or learn more about trading index CFDs with FXOpen.
CFDs are complex instruments and come with a high risk of losing your money.
This article represents the opinion of the Companies operating under the FXOpen brand only. It is not to be construed as an offer, solicitation, or recommendation with respect to products and services provided by the Companies operating under the FXOpen brand, nor is it to be considered financial advice.
Broadcom Inc. (AVGO) Stock Surges Over 8%
As shown on the chart, Broadcom Inc. (AVGO) shares soared by more than 8% in Friday’s trading session.
The bullish momentum is driven by strong quarterly results released last week and an optimistic outlook highlighting sustained demand in the artificial intelligence sector:
→ Earnings per share: $1.60 (Analyst forecast: $1.49)
→ Revenue: $14.92 billion (Expected: $14.61 billion), reflecting a 25% increase from $11.96 billion a year earlier.
Technical Analysis of AVGO Stock
The chart indicates that the market remains in an uptrend, with signs that the price has found support at:
→ The lower boundary of the channel.
→ The former resistance zone around $183 – which also aligns with the lower boundary of the price gap that formed in December 2024, as we previously noted.
This suggests that after forming a Bullish Flag pattern (marked in red), the upward trend may continue.
Broadcom (AVGO) Stock Price Forecast
Bank of America analyst Vivek Arya called the results from Broadcom a “reassuring update from an AI leader” and a “positive read-across for AI sentiment.”
According to TipRanks:
→ The average price target for AVGO shares is $248.
→ 27 out of 30 analysts recommend buying AVGO stock.
Trade global index CFDs with zero commission and tight spreads. Open your FXOpen account now or learn more about trading index CFDs with FXOpen.
CFDs are complex instruments and come with a high risk of losing your money.
This article represents the opinion of the Companies operating under the FXOpen brand only. It is not to be construed as an offer, solicitation, or recommendation with respect to products and services provided by the Companies operating under the FXOpen brand, nor is it to be considered financial advice.
👍2
#stockmarket #tsla #tesla #MarketNews #MarketUpdates
Tesla (TSLA) Shares Drop Over 15%
Among the biggest decliners in the technology stock index (we covered the reasons behind the Nasdaq 100’s drop earlier this morning) are Tesla (TSLA) shares, which have plummeted by more than 15% in a single day—their worst performance in five years.
Why Tesla (TSLA) Shares Fell
One of the key bearish drivers behind Tesla’s stock decline appears to be Elon Musk’s political involvement in the Trump administration. For investors, this could signal concerns that:
→ The CEO is not devoting enough attention to the automaker’s operations.
→ Discontent among those who oppose Musk’s political stance could slow Tesla’s sales.
And what about Musk himself? He has:
→ Acknowledged that business is “tough,” particularly following a cyberattack on his social media platform, X, but stated he intends to focus on politics for at least another year.
→ Reassured investors that, in the long run, “everything will be fine.”
Technical Analysis of Tesla (TSLA) Stock Chart
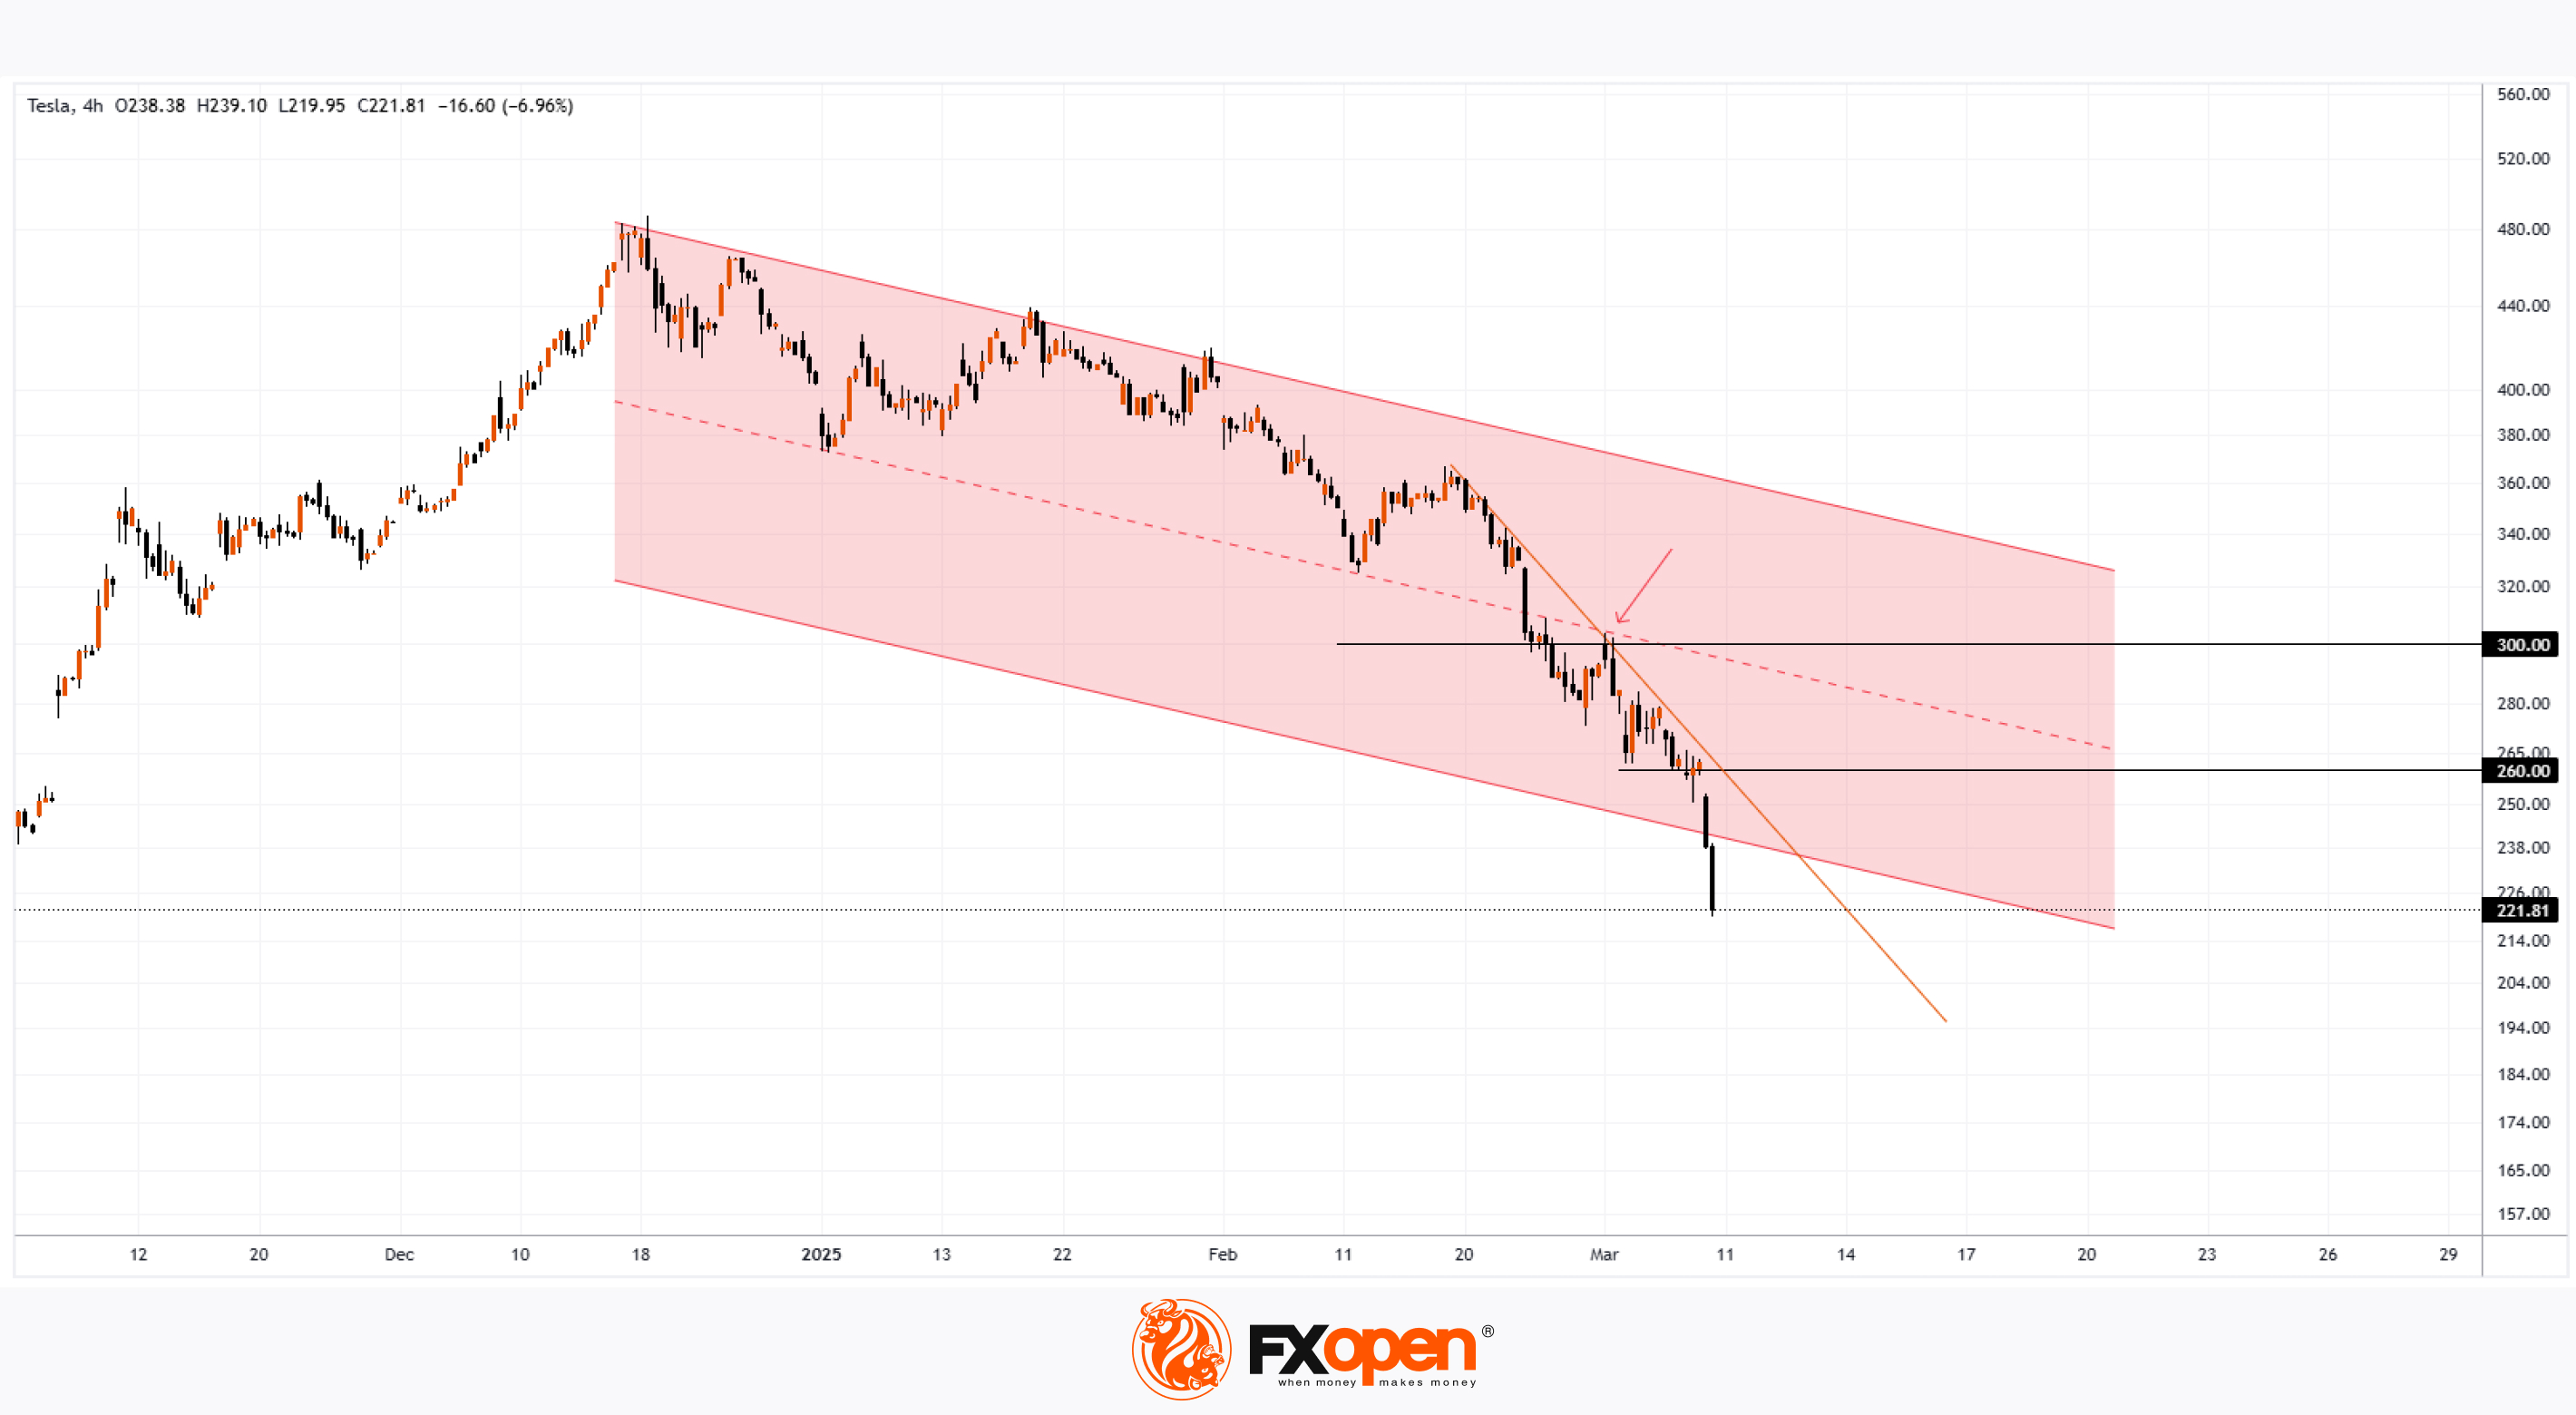
In our previous analysis, we identified a descending channel (marked in red) and suggested that if the psychological support level of $300 per share failed to hold, further declines could follow.
With updated chart data, we can see that:
→ The downward channel remains valid, reinforced by a test of its median line (marked by an arrow).
→ The $260 level (previous support) and $300 may act as resistance going forward, with the orange descending trendline also potentially serving as resistance.
Since the price has now fallen below the lower boundary of the red channel, there is a possibility that bulls may attempt to recover some losses, banking on a long-term rebound.
Tesla (TSLA) Stock Price Forecast
Analysts remain cautiously optimistic, possibly hoping that Musk’s close ties with Trump will accelerate Tesla’s rollout of its robotaxi service. Another potential positive catalyst is Tesla’s market entry into India.
According to TipRanks:
→ 13 out of 36 analysts recommend buying TSLA shares.
→ The average 12-month price target for TSLA is $340.
Trade global index CFDs with zero commission and tight spreads. Open your FXOpen account now or learn more about trading index CFDs with FXOpen.
CFDs are complex instruments and come with a high risk of losing your money.
This article represents the opinion of the Companies operating under the FXOpen brand only. It is not to be construed as an offer, solicitation, or recommendation with respect to products and services provided by the Companies operating under the FXOpen brand, nor is it to be considered financial advice.
Tesla (TSLA) Shares Drop Over 15%
Among the biggest decliners in the technology stock index (we covered the reasons behind the Nasdaq 100’s drop earlier this morning) are Tesla (TSLA) shares, which have plummeted by more than 15% in a single day—their worst performance in five years.
Why Tesla (TSLA) Shares Fell
One of the key bearish drivers behind Tesla’s stock decline appears to be Elon Musk’s political involvement in the Trump administration. For investors, this could signal concerns that:
→ The CEO is not devoting enough attention to the automaker’s operations.
→ Discontent among those who oppose Musk’s political stance could slow Tesla’s sales.
And what about Musk himself? He has:
→ Acknowledged that business is “tough,” particularly following a cyberattack on his social media platform, X, but stated he intends to focus on politics for at least another year.
→ Reassured investors that, in the long run, “everything will be fine.”
Technical Analysis of Tesla (TSLA) Stock Chart
In our previous analysis, we identified a descending channel (marked in red) and suggested that if the psychological support level of $300 per share failed to hold, further declines could follow.
With updated chart data, we can see that:
→ The downward channel remains valid, reinforced by a test of its median line (marked by an arrow).
→ The $260 level (previous support) and $300 may act as resistance going forward, with the orange descending trendline also potentially serving as resistance.
Since the price has now fallen below the lower boundary of the red channel, there is a possibility that bulls may attempt to recover some losses, banking on a long-term rebound.
Tesla (TSLA) Stock Price Forecast
Analysts remain cautiously optimistic, possibly hoping that Musk’s close ties with Trump will accelerate Tesla’s rollout of its robotaxi service. Another potential positive catalyst is Tesla’s market entry into India.
According to TipRanks:
→ 13 out of 36 analysts recommend buying TSLA shares.
→ The average 12-month price target for TSLA is $340.
Trade global index CFDs with zero commission and tight spreads. Open your FXOpen account now or learn more about trading index CFDs with FXOpen.
CFDs are complex instruments and come with a high risk of losing your money.
This article represents the opinion of the Companies operating under the FXOpen brand only. It is not to be construed as an offer, solicitation, or recommendation with respect to products and services provided by the Companies operating under the FXOpen brand, nor is it to be considered financial advice.
👍3
#stockmarket #NASDAQ #MarketUpdates #marketanalysis
Nasdaq 100 Enters Correction
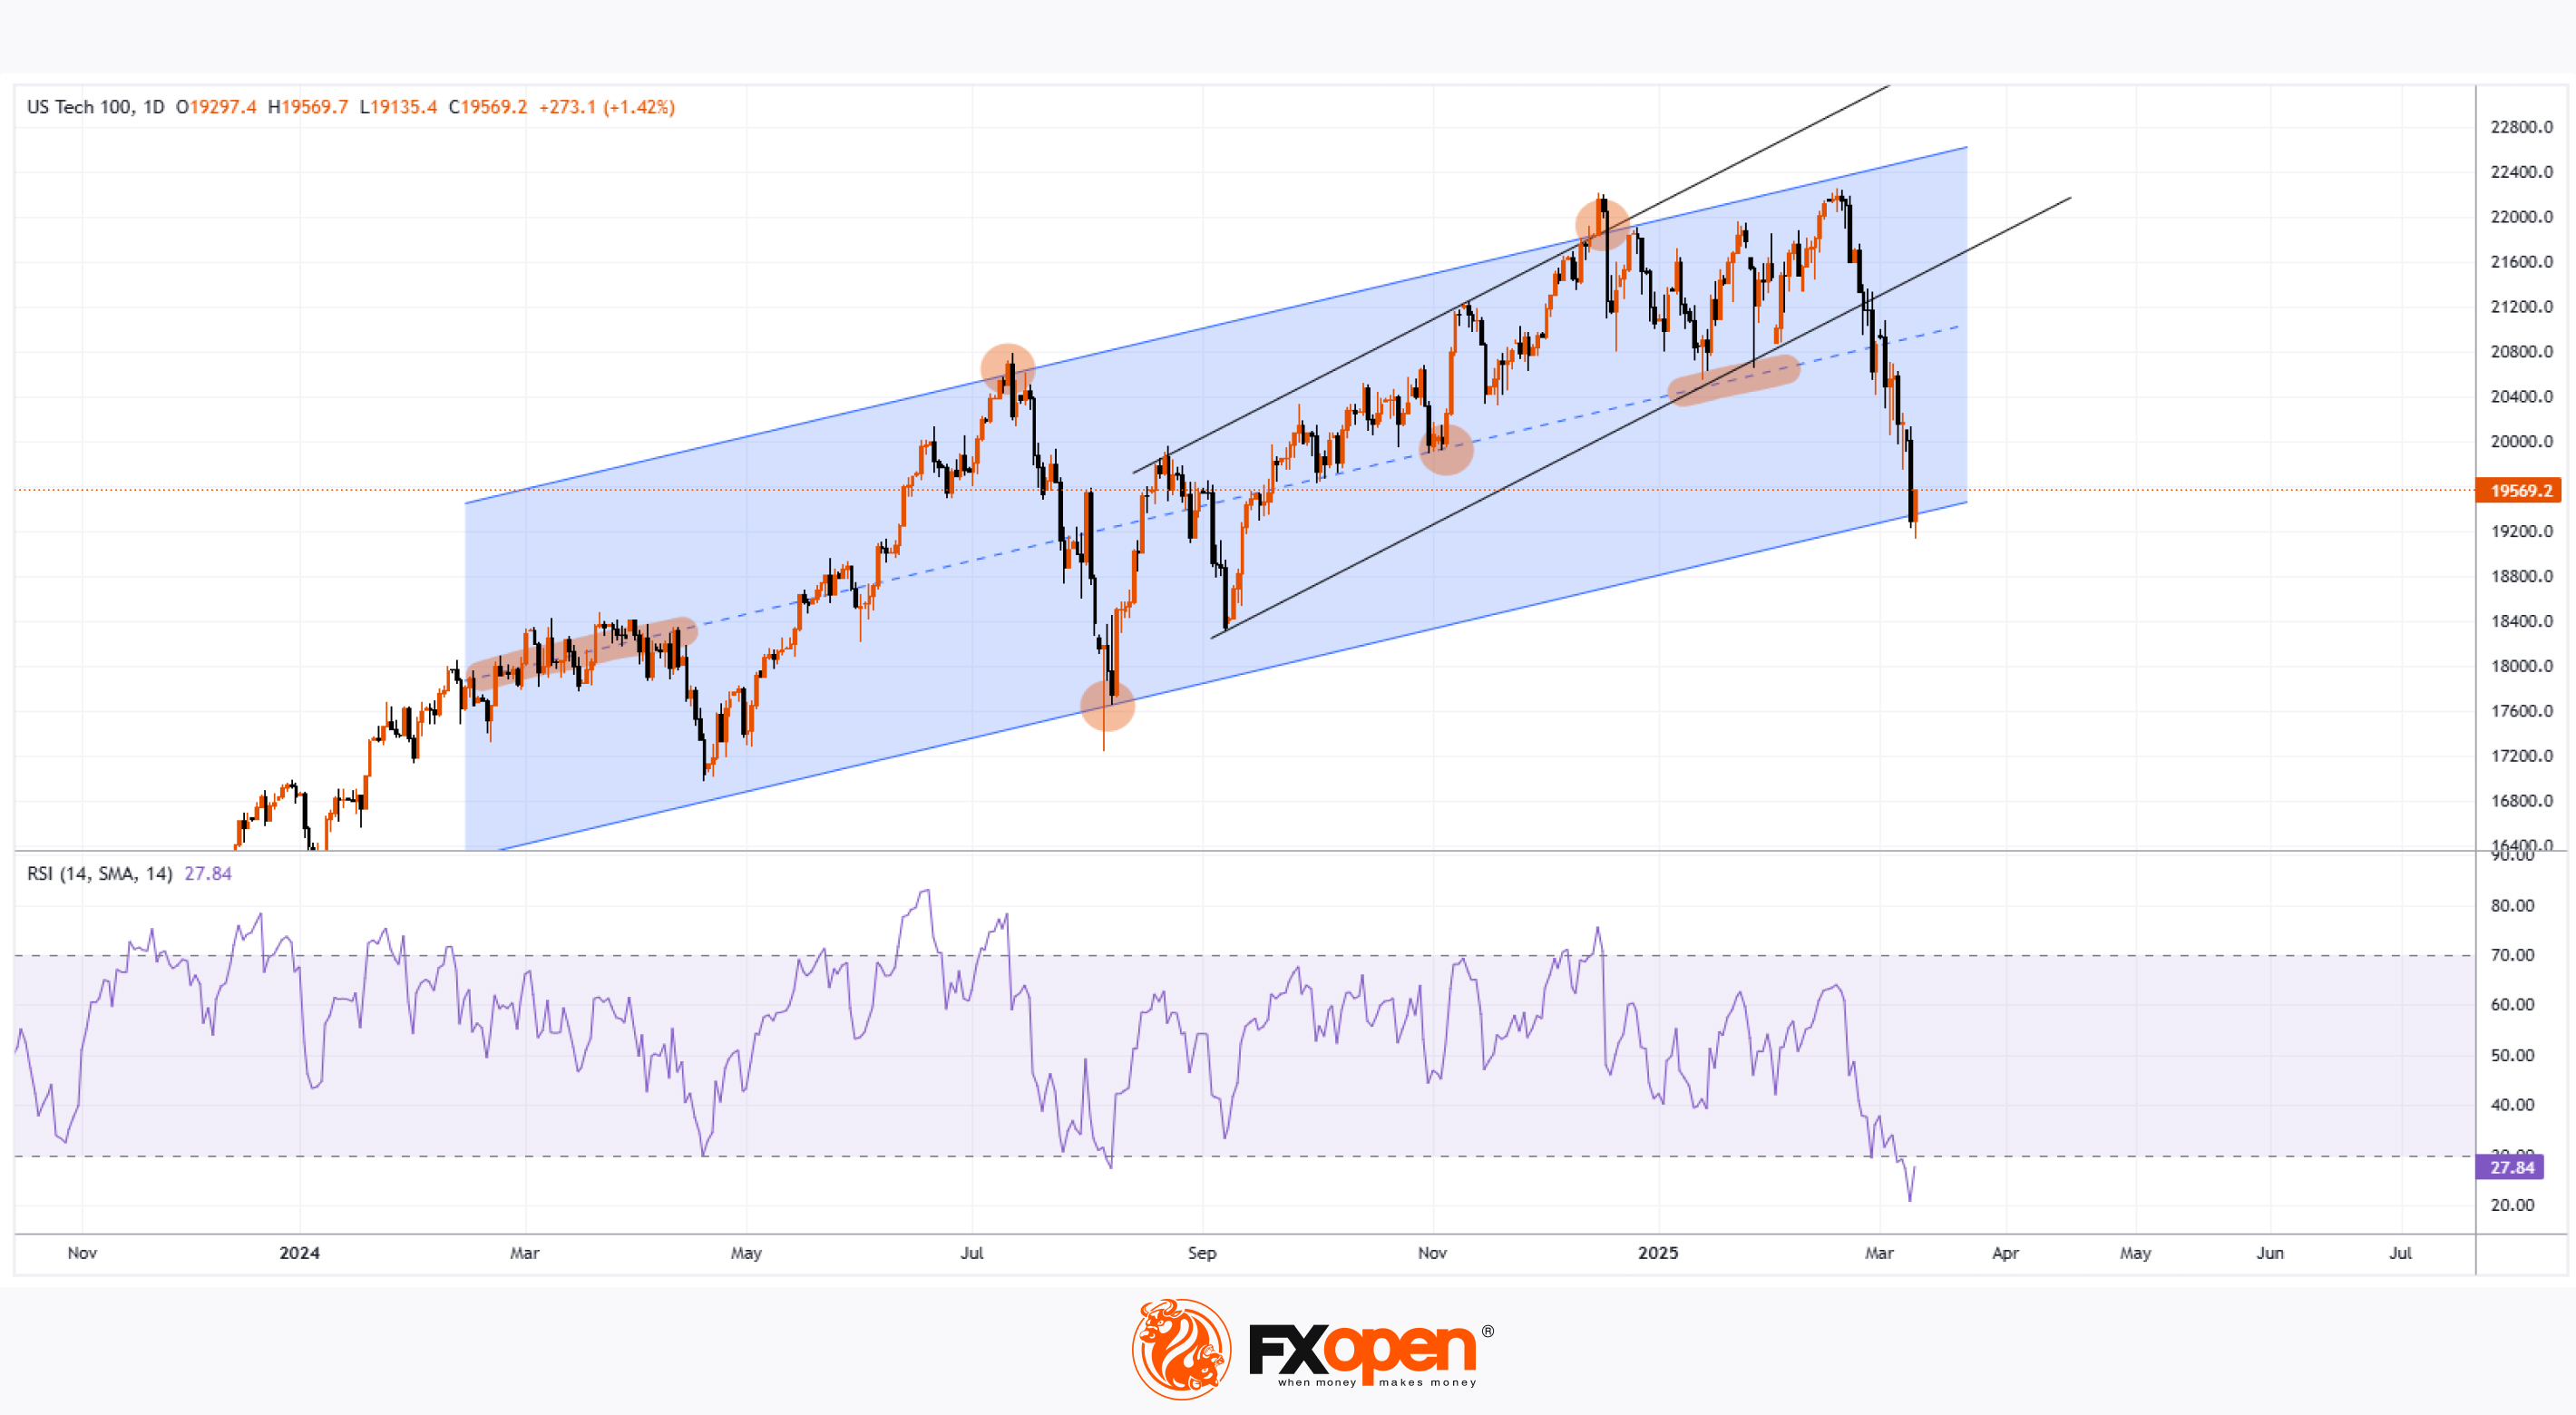
As shown on the Nasdaq 100 (US Tech 100 mini on FXOpen) index chart today:
→ The index has fallen below the psychological 20,000-point level, reaching its lowest in approximately six months.
→ The decline from the December peak now exceeds 10%, officially marking the start of a correction.
Why the Nasdaq 100 Is Falling Today
Bearish sentiment stems from a combination of factors, including (according to Zacks analysts):
→ The Trump administration’s tariff policies and their potential economic impact. Concerns increased after the latest jobs report showed unemployment rising from 4.0% to 4.1%.
→ Worries about AI investment costs and their long-term profitability.
→ Market anticipation of tomorrow’s Consumer Price Index (CPI) release at 15:30 GMT+3.
Technical Analysis of the Nasdaq 100 Chart
Price movements indicate that the steeper growth channel (marked in black), which had been in place since last August, has lost relevance. A broader view of the chart reveals that the index has now approached the lower boundary of a long-term channel (marked in blue), which has been forming since early 2024. Key price formations that helped define this channel are highlighted in orange.
Given that the index is at the lower boundary of the blue channel and the RSI indicator on the daily chart has dropped to multi-year lows, a short-term recovery may be likely. However, the fundamental backdrop will play a decisive role—clear signs of U.S. economic stability could support a rebound, while extreme fear (as reflected in CNN’s Fear & Greed Index) may continue to weigh on sentiment.
Trade global index CFDs with zero commission and tight spreads. Open your FXOpen account now or learn more about trading index CFDs with FXOpen.
CFDs are complex instruments and come with a high risk of losing your money.
This article represents the opinion of the Companies operating under the FXOpen brand only. It is not to be construed as an offer, solicitation, or recommendation with respect to products and services provided by the Companies operating under the FXOpen brand, nor is it to be considered financial advice.
Nasdaq 100 Enters Correction
As shown on the Nasdaq 100 (US Tech 100 mini on FXOpen) index chart today:
→ The index has fallen below the psychological 20,000-point level, reaching its lowest in approximately six months.
→ The decline from the December peak now exceeds 10%, officially marking the start of a correction.
Why the Nasdaq 100 Is Falling Today
Bearish sentiment stems from a combination of factors, including (according to Zacks analysts):
→ The Trump administration’s tariff policies and their potential economic impact. Concerns increased after the latest jobs report showed unemployment rising from 4.0% to 4.1%.
→ Worries about AI investment costs and their long-term profitability.
→ Market anticipation of tomorrow’s Consumer Price Index (CPI) release at 15:30 GMT+3.
Technical Analysis of the Nasdaq 100 Chart
Price movements indicate that the steeper growth channel (marked in black), which had been in place since last August, has lost relevance. A broader view of the chart reveals that the index has now approached the lower boundary of a long-term channel (marked in blue), which has been forming since early 2024. Key price formations that helped define this channel are highlighted in orange.
Given that the index is at the lower boundary of the blue channel and the RSI indicator on the daily chart has dropped to multi-year lows, a short-term recovery may be likely. However, the fundamental backdrop will play a decisive role—clear signs of U.S. economic stability could support a rebound, while extreme fear (as reflected in CNN’s Fear & Greed Index) may continue to weigh on sentiment.
Trade global index CFDs with zero commission and tight spreads. Open your FXOpen account now or learn more about trading index CFDs with FXOpen.
CFDs are complex instruments and come with a high risk of losing your money.
This article represents the opinion of the Companies operating under the FXOpen brand only. It is not to be construed as an offer, solicitation, or recommendation with respect to products and services provided by the Companies operating under the FXOpen brand, nor is it to be considered financial advice.
👍3
#AAPL #stockmarket #stocktrading #MarketUpdates #marketanalysis
Apple (AAPL) Share Price Drops Over 7% in Two Days
As previously reported, AAPL shares had their worst January since 2008, but the challenges for investors have continued.
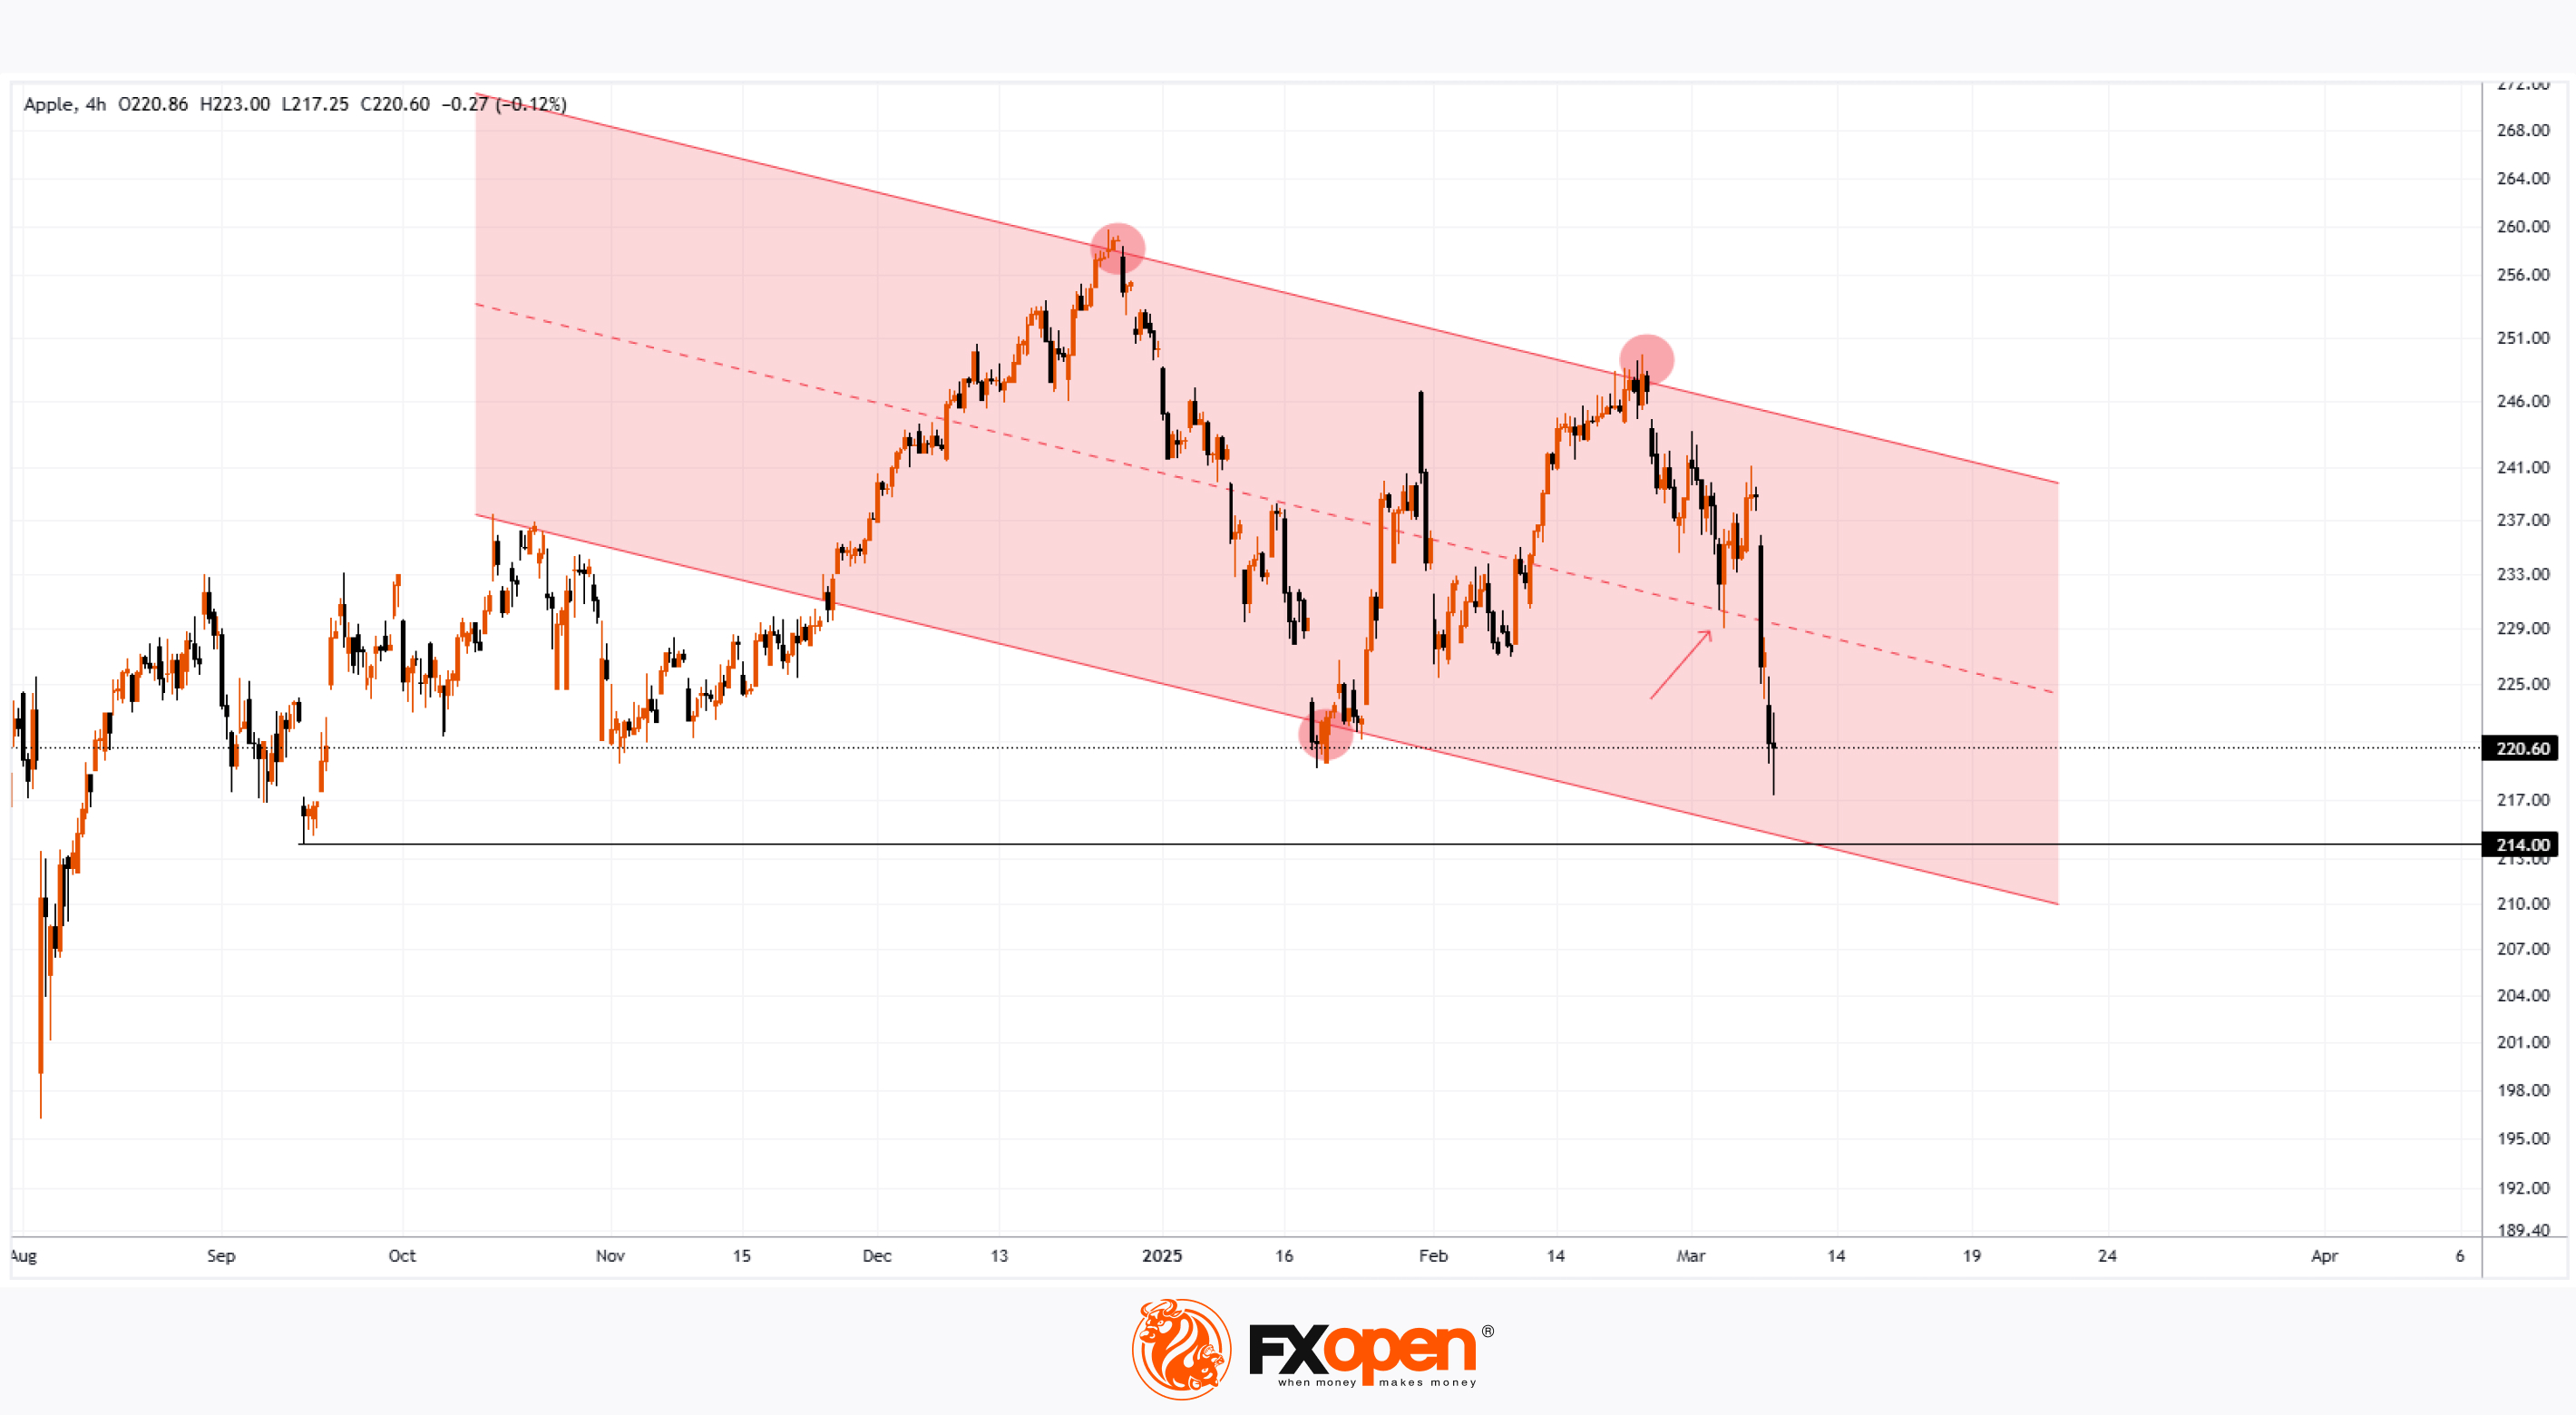
The Apple (AAPL) stock chart shows that yesterday, the price dropped below $218 during trading—the lowest level since September last year. Compared to Friday’s closing price, the decline over the first two days of this week amounted to approximately 7.7%.
Why Has AAPL Stock Fallen?
Bearish sentiment continues to prevail in the stock market, leading the Nasdaq 100 index into correction territory. Market conditions were further dampened by news that Apple had delayed the release of an AI-powered update for its digital assistant, Siri 2.0, increasing selling pressure.
What Could Happen Next?
Technical Analysis of Apple (AAPL) Stock
Key price reversals, marked with red dots, outline a downward channel (shown in red). The median line, which previously acted as support (indicated by an arrow), has now been broken, suggesting that bears may expect it to act as resistance going forward.
From a bullish perspective, the lower boundary of the red channel, reinforced by the September low around $214, could serve as an area where selling pressure might ease—if AAPL continues to decline.
AAPL Share Price Forecast
According to TipRanks:
▪️18 out of 33 surveyed analysts recommend buying AAPL stock.
▪️The average 12-month price target for AAPL is $251.
Trade global index CFDs with zero commission and tight spreads. Open your FXOpen account now or learn more about trading index CFDs with FXOpen.
CFDs are complex instruments and come with a high risk of losing your money.
This article represents the opinion of the Companies operating under the FXOpen brand only. It is not to be construed as an offer, solicitation, or recommendation with respect to products and services provided by the Companies operating under the FXOpen brand, nor is it to be considered financial advice.
Apple (AAPL) Share Price Drops Over 7% in Two Days
As previously reported, AAPL shares had their worst January since 2008, but the challenges for investors have continued.
The Apple (AAPL) stock chart shows that yesterday, the price dropped below $218 during trading—the lowest level since September last year. Compared to Friday’s closing price, the decline over the first two days of this week amounted to approximately 7.7%.
Why Has AAPL Stock Fallen?
Bearish sentiment continues to prevail in the stock market, leading the Nasdaq 100 index into correction territory. Market conditions were further dampened by news that Apple had delayed the release of an AI-powered update for its digital assistant, Siri 2.0, increasing selling pressure.
What Could Happen Next?
Technical Analysis of Apple (AAPL) Stock
Key price reversals, marked with red dots, outline a downward channel (shown in red). The median line, which previously acted as support (indicated by an arrow), has now been broken, suggesting that bears may expect it to act as resistance going forward.
From a bullish perspective, the lower boundary of the red channel, reinforced by the September low around $214, could serve as an area where selling pressure might ease—if AAPL continues to decline.
AAPL Share Price Forecast
According to TipRanks:
▪️18 out of 33 surveyed analysts recommend buying AAPL stock.
▪️The average 12-month price target for AAPL is $251.
Trade global index CFDs with zero commission and tight spreads. Open your FXOpen account now or learn more about trading index CFDs with FXOpen.
CFDs are complex instruments and come with a high risk of losing your money.
This article represents the opinion of the Companies operating under the FXOpen brand only. It is not to be construed as an offer, solicitation, or recommendation with respect to products and services provided by the Companies operating under the FXOpen brand, nor is it to be considered financial advice.
👍3
#stockmarket #stocktrading #MarketUpdates #MarketNews
NIO Share Price Soars by Approximately 17%
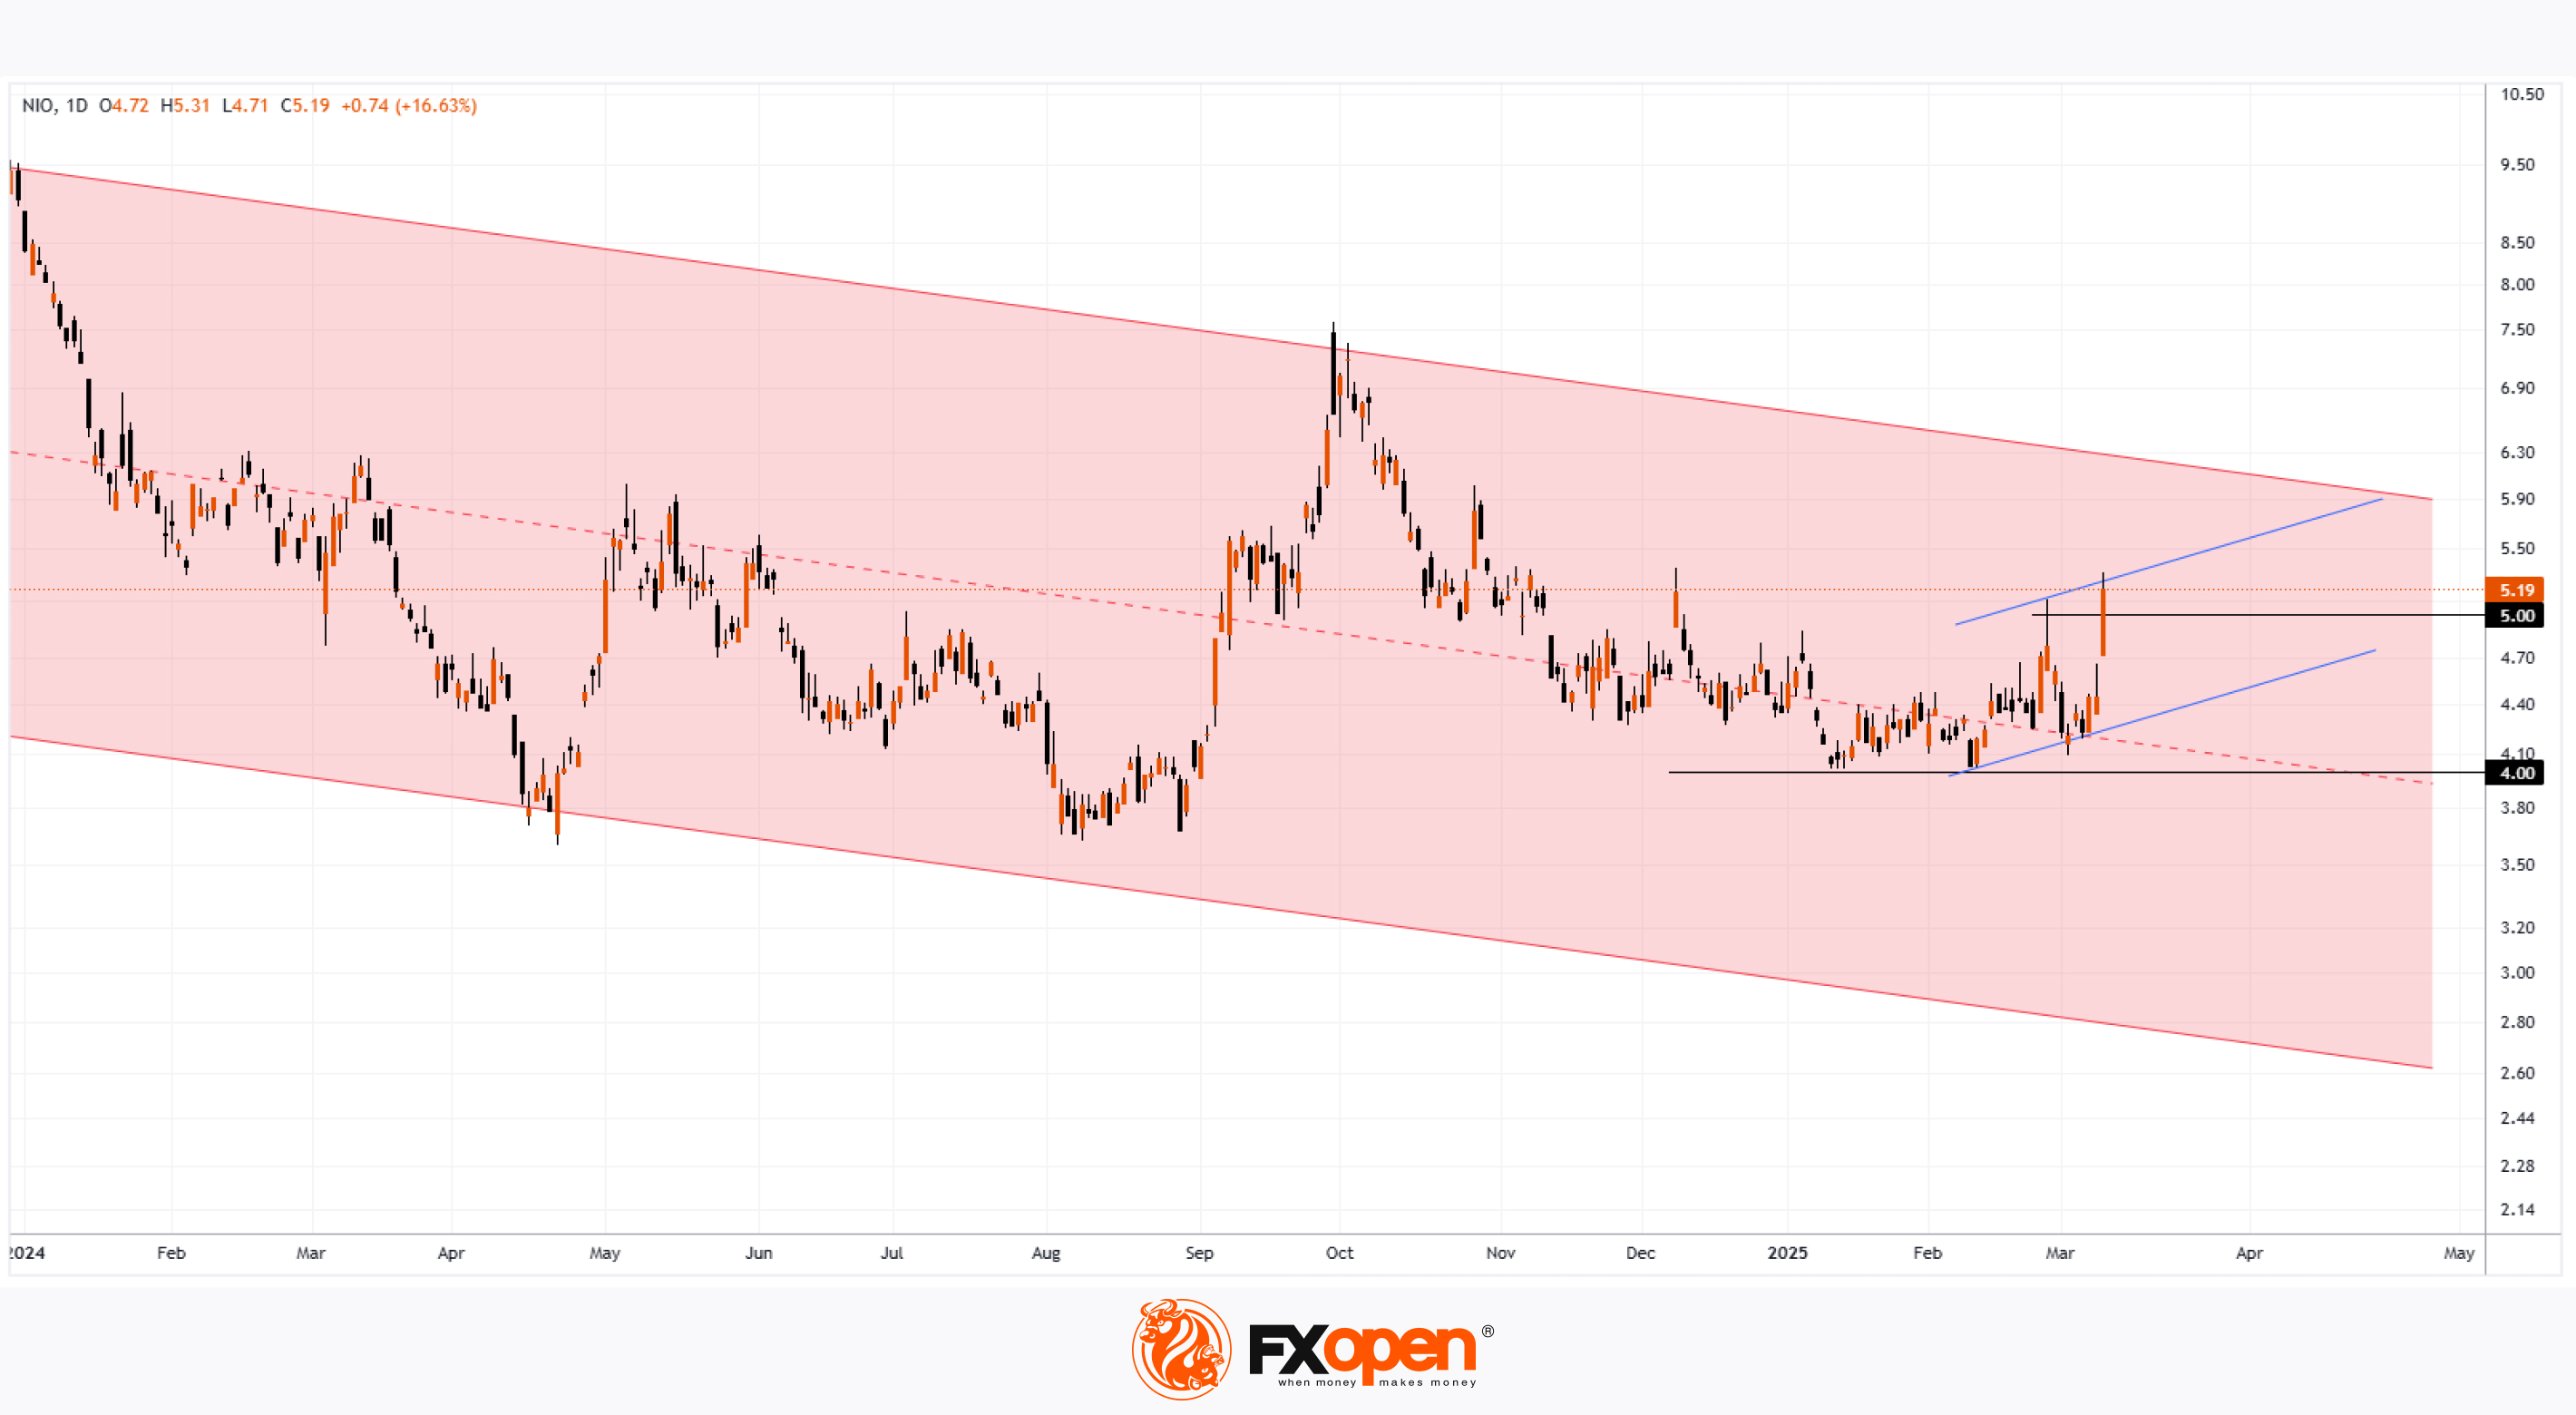
The stock chart of Chinese electric vehicle manufacturer NIO shows that its price has reached a new high for 2025, following a 10% surge yesterday. In the process, the stock formed a wide bullish gap and successfully broke through the psychological $5 per share level.
Why Has NIO’s Share Price Risen?
The bullish sentiment is largely driven by anticipation of the company's upcoming earnings report. Last year, NIO achieved record-breaking monthly EV deliveries, reaching 31,000 units in December.
Investors are now eagerly awaiting further details about NIO’s two new mass-market brands, Onvo and Firefly. Onvo has already launched, while pre-orders for Firefly—a compact and intelligent EV priced at around $20,500—have begun.
Additionally, some investors may be shifting capital from TSLA shares (which have been experiencing a bearish trend, as reported yesterday) into NIO stock.
Technical Analysis of NIO’s Stock Chart
Looking at the bigger picture, NIO’s share price remains within a long-term downward trend (marked by the red descending channel). Since the start of 2025, the stock has fluctuated around the median line without dropping below $4 per share, a level where supply and demand have historically balanced out.
However, yesterday’s strong upward momentum suggests that the balance may have shifted in favour of the bulls. Given the positive fundamental outlook, buyers could maintain the recent gains, potentially pushing the share price towards the upper boundary of the red channel—following the trajectory outlined by the blue lines on the chart.
Trade global index CFDs with zero commission and tight spreads. Open your FXOpen account now or learn more about trading index CFDs with FXOpen.
CFDs are complex instruments and come with a high risk of losing your money.
This article represents the opinion of the Companies operating under the FXOpen brand only. It is not to be construed as an offer, solicitation, or recommendation with respect to products and services provided by the Companies operating under the FXOpen brand, nor is it to be considered financial advice.
NIO Share Price Soars by Approximately 17%
The stock chart of Chinese electric vehicle manufacturer NIO shows that its price has reached a new high for 2025, following a 10% surge yesterday. In the process, the stock formed a wide bullish gap and successfully broke through the psychological $5 per share level.
Why Has NIO’s Share Price Risen?
The bullish sentiment is largely driven by anticipation of the company's upcoming earnings report. Last year, NIO achieved record-breaking monthly EV deliveries, reaching 31,000 units in December.
Investors are now eagerly awaiting further details about NIO’s two new mass-market brands, Onvo and Firefly. Onvo has already launched, while pre-orders for Firefly—a compact and intelligent EV priced at around $20,500—have begun.
Additionally, some investors may be shifting capital from TSLA shares (which have been experiencing a bearish trend, as reported yesterday) into NIO stock.
Technical Analysis of NIO’s Stock Chart
Looking at the bigger picture, NIO’s share price remains within a long-term downward trend (marked by the red descending channel). Since the start of 2025, the stock has fluctuated around the median line without dropping below $4 per share, a level where supply and demand have historically balanced out.
However, yesterday’s strong upward momentum suggests that the balance may have shifted in favour of the bulls. Given the positive fundamental outlook, buyers could maintain the recent gains, potentially pushing the share price towards the upper boundary of the red channel—following the trajectory outlined by the blue lines on the chart.
Trade global index CFDs with zero commission and tight spreads. Open your FXOpen account now or learn more about trading index CFDs with FXOpen.
CFDs are complex instruments and come with a high risk of losing your money.
This article represents the opinion of the Companies operating under the FXOpen brand only. It is not to be construed as an offer, solicitation, or recommendation with respect to products and services provided by the Companies operating under the FXOpen brand, nor is it to be considered financial advice.
👍2
#nvidia #NVDA #stocktrading #stockmarket
Nvidia (NVDA) Share Price Rises Over 6%
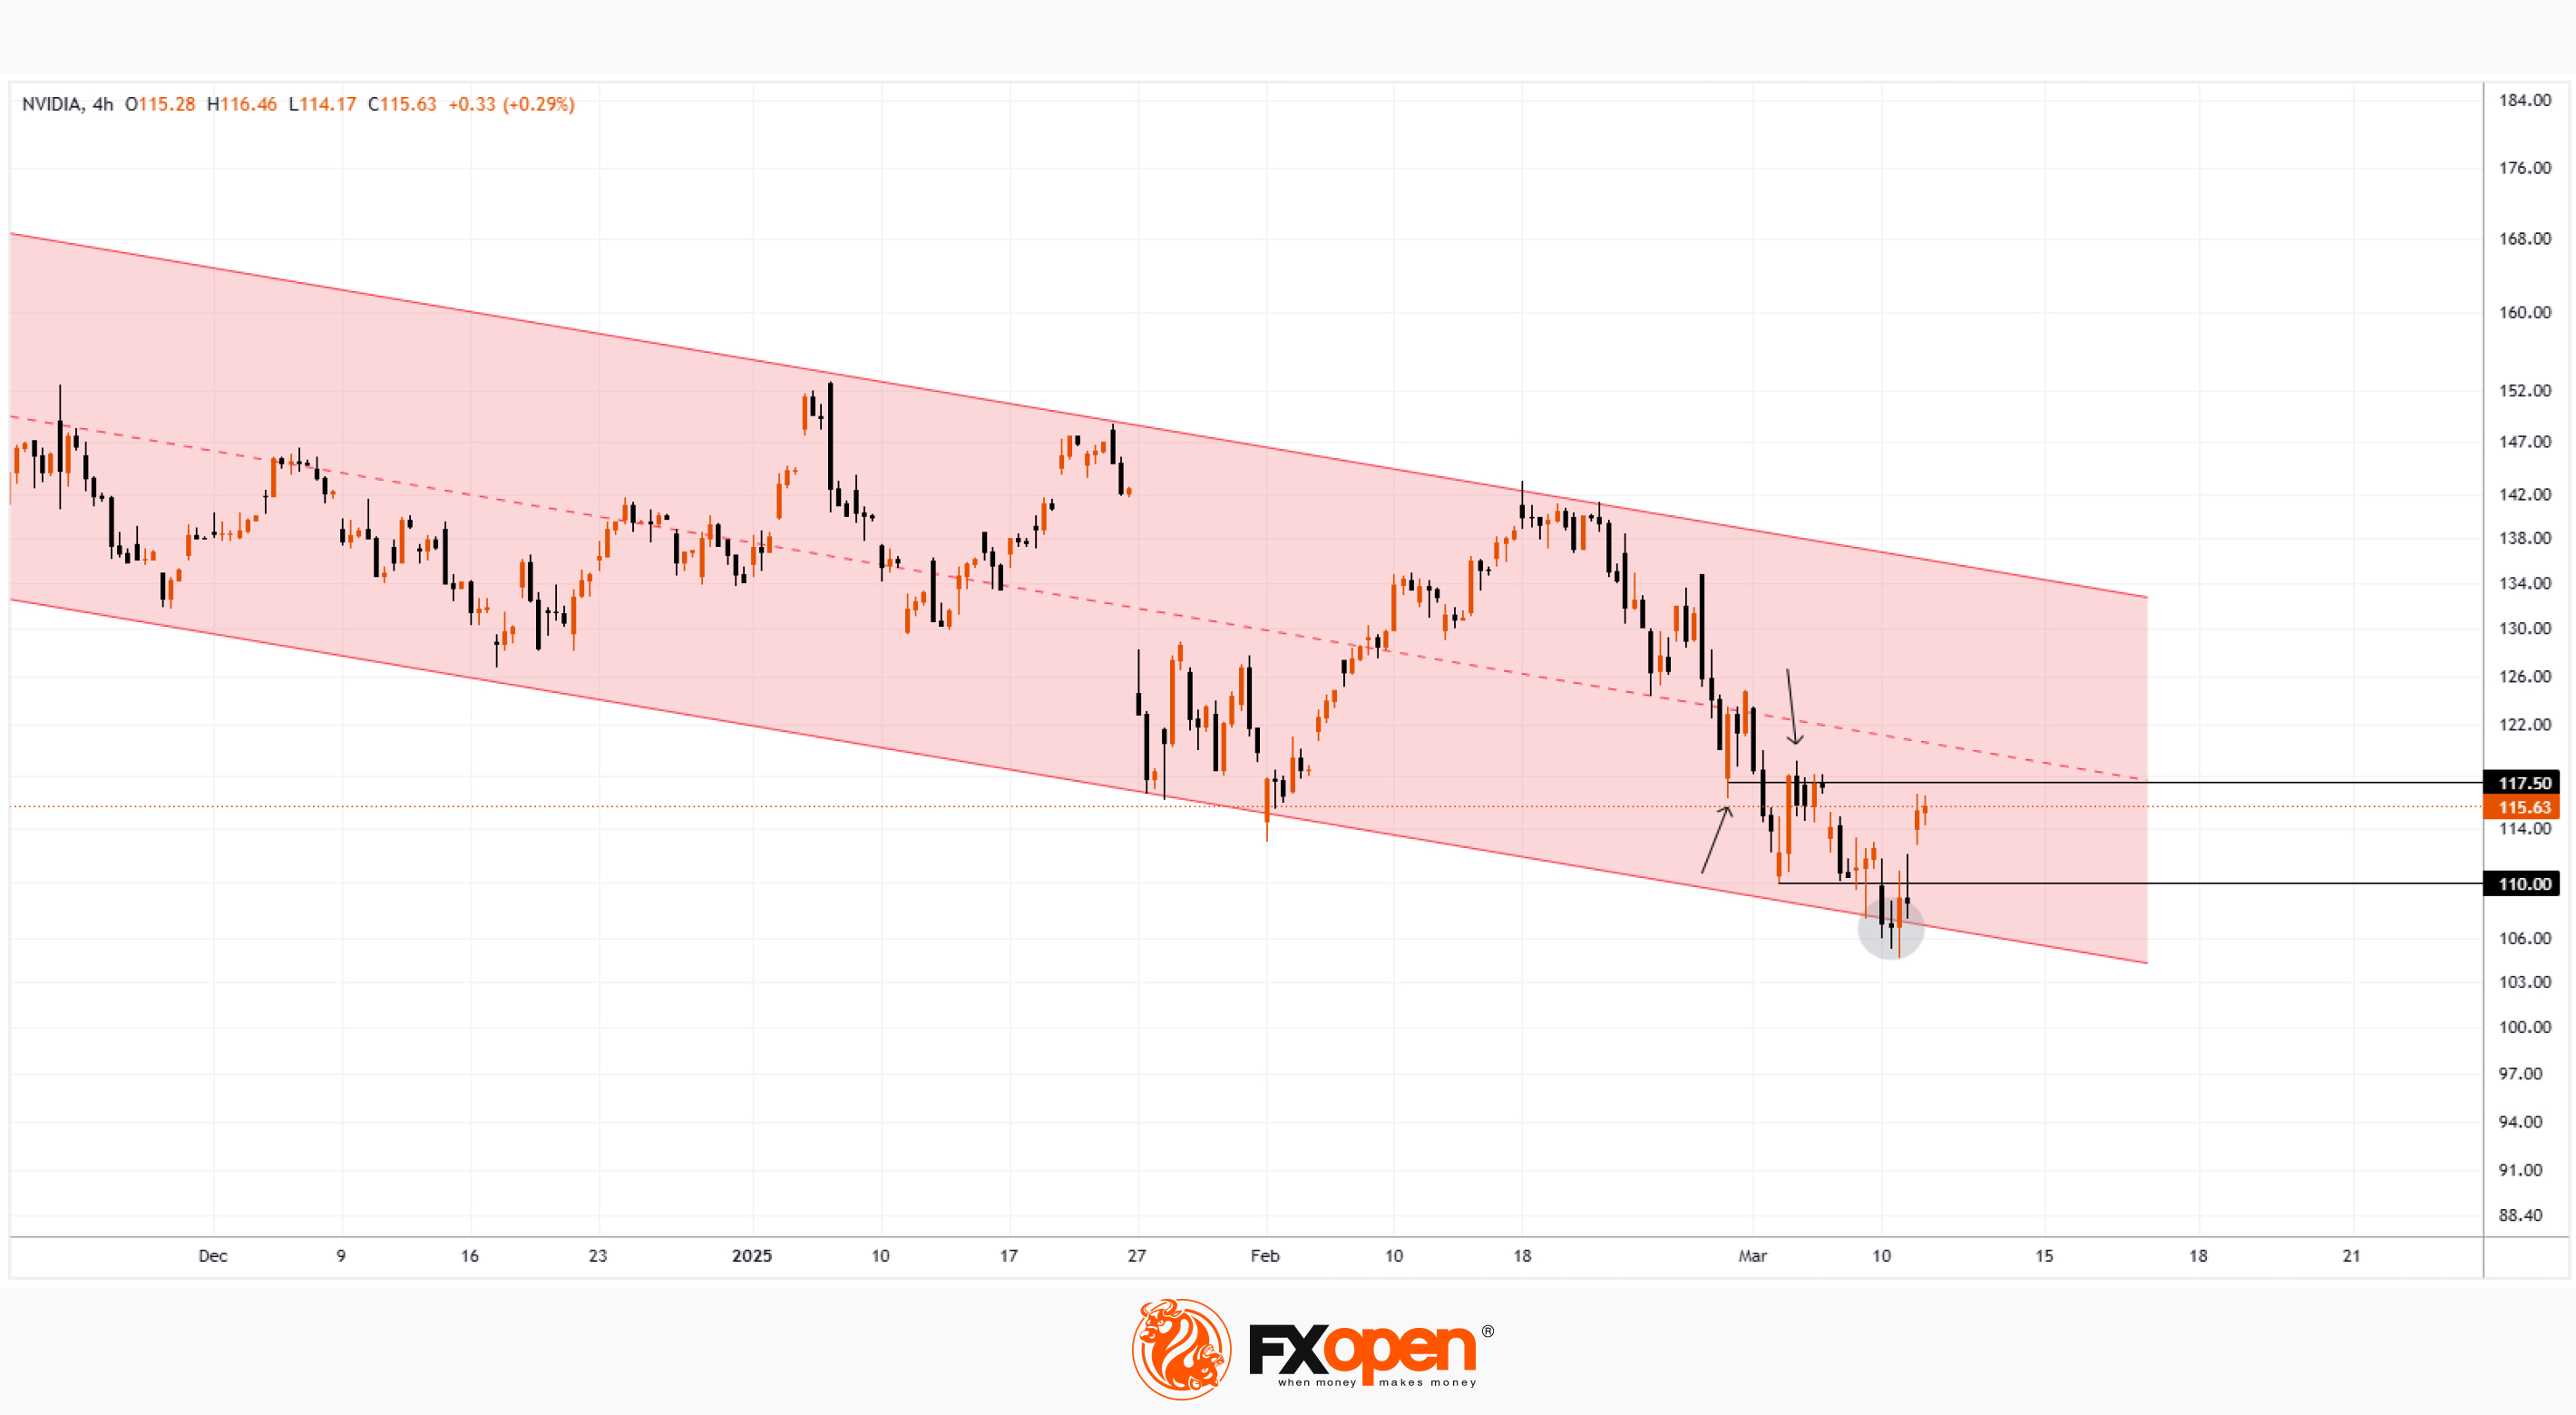
The NVDA stock chart shows that following yesterday’s trading session, the share price climbed over 6%, outperforming the Nasdaq 100 index (US Tech 100 mini on FXOpen), which gained just over 1%.
Despite this recovery from a six-month low, NVDA shares remain down 15% year-to-date.
Why Did Nvidia (NVDA) Shares Rise Yesterday?
Positive sentiment swept through the stock market after U.S. inflation data came in lower than expected. The Consumer Price Index (CPI) for the month stood at 0.2%, below analyst forecasts of 0.3% and the previous reading of 0.4%.
Investors may now be looking for opportunities following the March sell-off, triggered by Trump’s tariff policies and recession fears—and NVDA shares appear attractive in this context.
Barron’s suggests that NVDA stock may currently be undervalued, while MarketWatch cites BofA analyst Vivek Arya, who advises investors to focus on Nvidia’s gross profit margins as a key driver of significant share price growth.
Technical Analysis of NVDA Stock
Earlier this month, we identified a descending channel (marked in red) and suggested that its lower boundary could act as support—which was confirmed (highlighted by the circle).
Bullish perspective:
The stock opened with a bullish gap and gained throughout the session, failing to hold below the psychological $110 level.
Bearish perspective:
The price remains within the descending channel, with the median line potentially acting as resistance.
The $117.50 level, previously a support, has turned into resistance (as indicated by the arrows) and may pose a challenge to further recovery.
NVDA Share Price Forecast
According to TipRanks:
39 out of 42 analysts recommend buying NVDA stock.
The average 12-month price target for NVDA shares is $177.
Trade global index CFDs with zero commission and tight spreads. Open your FXOpen account now or learn more about trading index CFDs with FXOpen.
CFDs are complex instruments and come with a high risk of losing your money.
This article represents the opinion of the Companies operating under the FXOpen brand only. It is not to be construed as an offer, solicitation, or recommendation with respect to products and services provided by the Companies operating under the FXOpen brand, nor is it to be considered financial advice.
Nvidia (NVDA) Share Price Rises Over 6%
The NVDA stock chart shows that following yesterday’s trading session, the share price climbed over 6%, outperforming the Nasdaq 100 index (US Tech 100 mini on FXOpen), which gained just over 1%.
Despite this recovery from a six-month low, NVDA shares remain down 15% year-to-date.
Why Did Nvidia (NVDA) Shares Rise Yesterday?
Positive sentiment swept through the stock market after U.S. inflation data came in lower than expected. The Consumer Price Index (CPI) for the month stood at 0.2%, below analyst forecasts of 0.3% and the previous reading of 0.4%.
Investors may now be looking for opportunities following the March sell-off, triggered by Trump’s tariff policies and recession fears—and NVDA shares appear attractive in this context.
Barron’s suggests that NVDA stock may currently be undervalued, while MarketWatch cites BofA analyst Vivek Arya, who advises investors to focus on Nvidia’s gross profit margins as a key driver of significant share price growth.
Technical Analysis of NVDA Stock
Earlier this month, we identified a descending channel (marked in red) and suggested that its lower boundary could act as support—which was confirmed (highlighted by the circle).
Bullish perspective:
The stock opened with a bullish gap and gained throughout the session, failing to hold below the psychological $110 level.
Bearish perspective:
The price remains within the descending channel, with the median line potentially acting as resistance.
The $117.50 level, previously a support, has turned into resistance (as indicated by the arrows) and may pose a challenge to further recovery.
NVDA Share Price Forecast
According to TipRanks:
39 out of 42 analysts recommend buying NVDA stock.
The average 12-month price target for NVDA shares is $177.
Trade global index CFDs with zero commission and tight spreads. Open your FXOpen account now or learn more about trading index CFDs with FXOpen.
CFDs are complex instruments and come with a high risk of losing your money.
This article represents the opinion of the Companies operating under the FXOpen brand only. It is not to be construed as an offer, solicitation, or recommendation with respect to products and services provided by the Companies operating under the FXOpen brand, nor is it to be considered financial advice.
👍2
#stockmarket #stocktrading #marketanalysis #MarketNews
Intel (INTC) Shares Surge by Approximately 14%
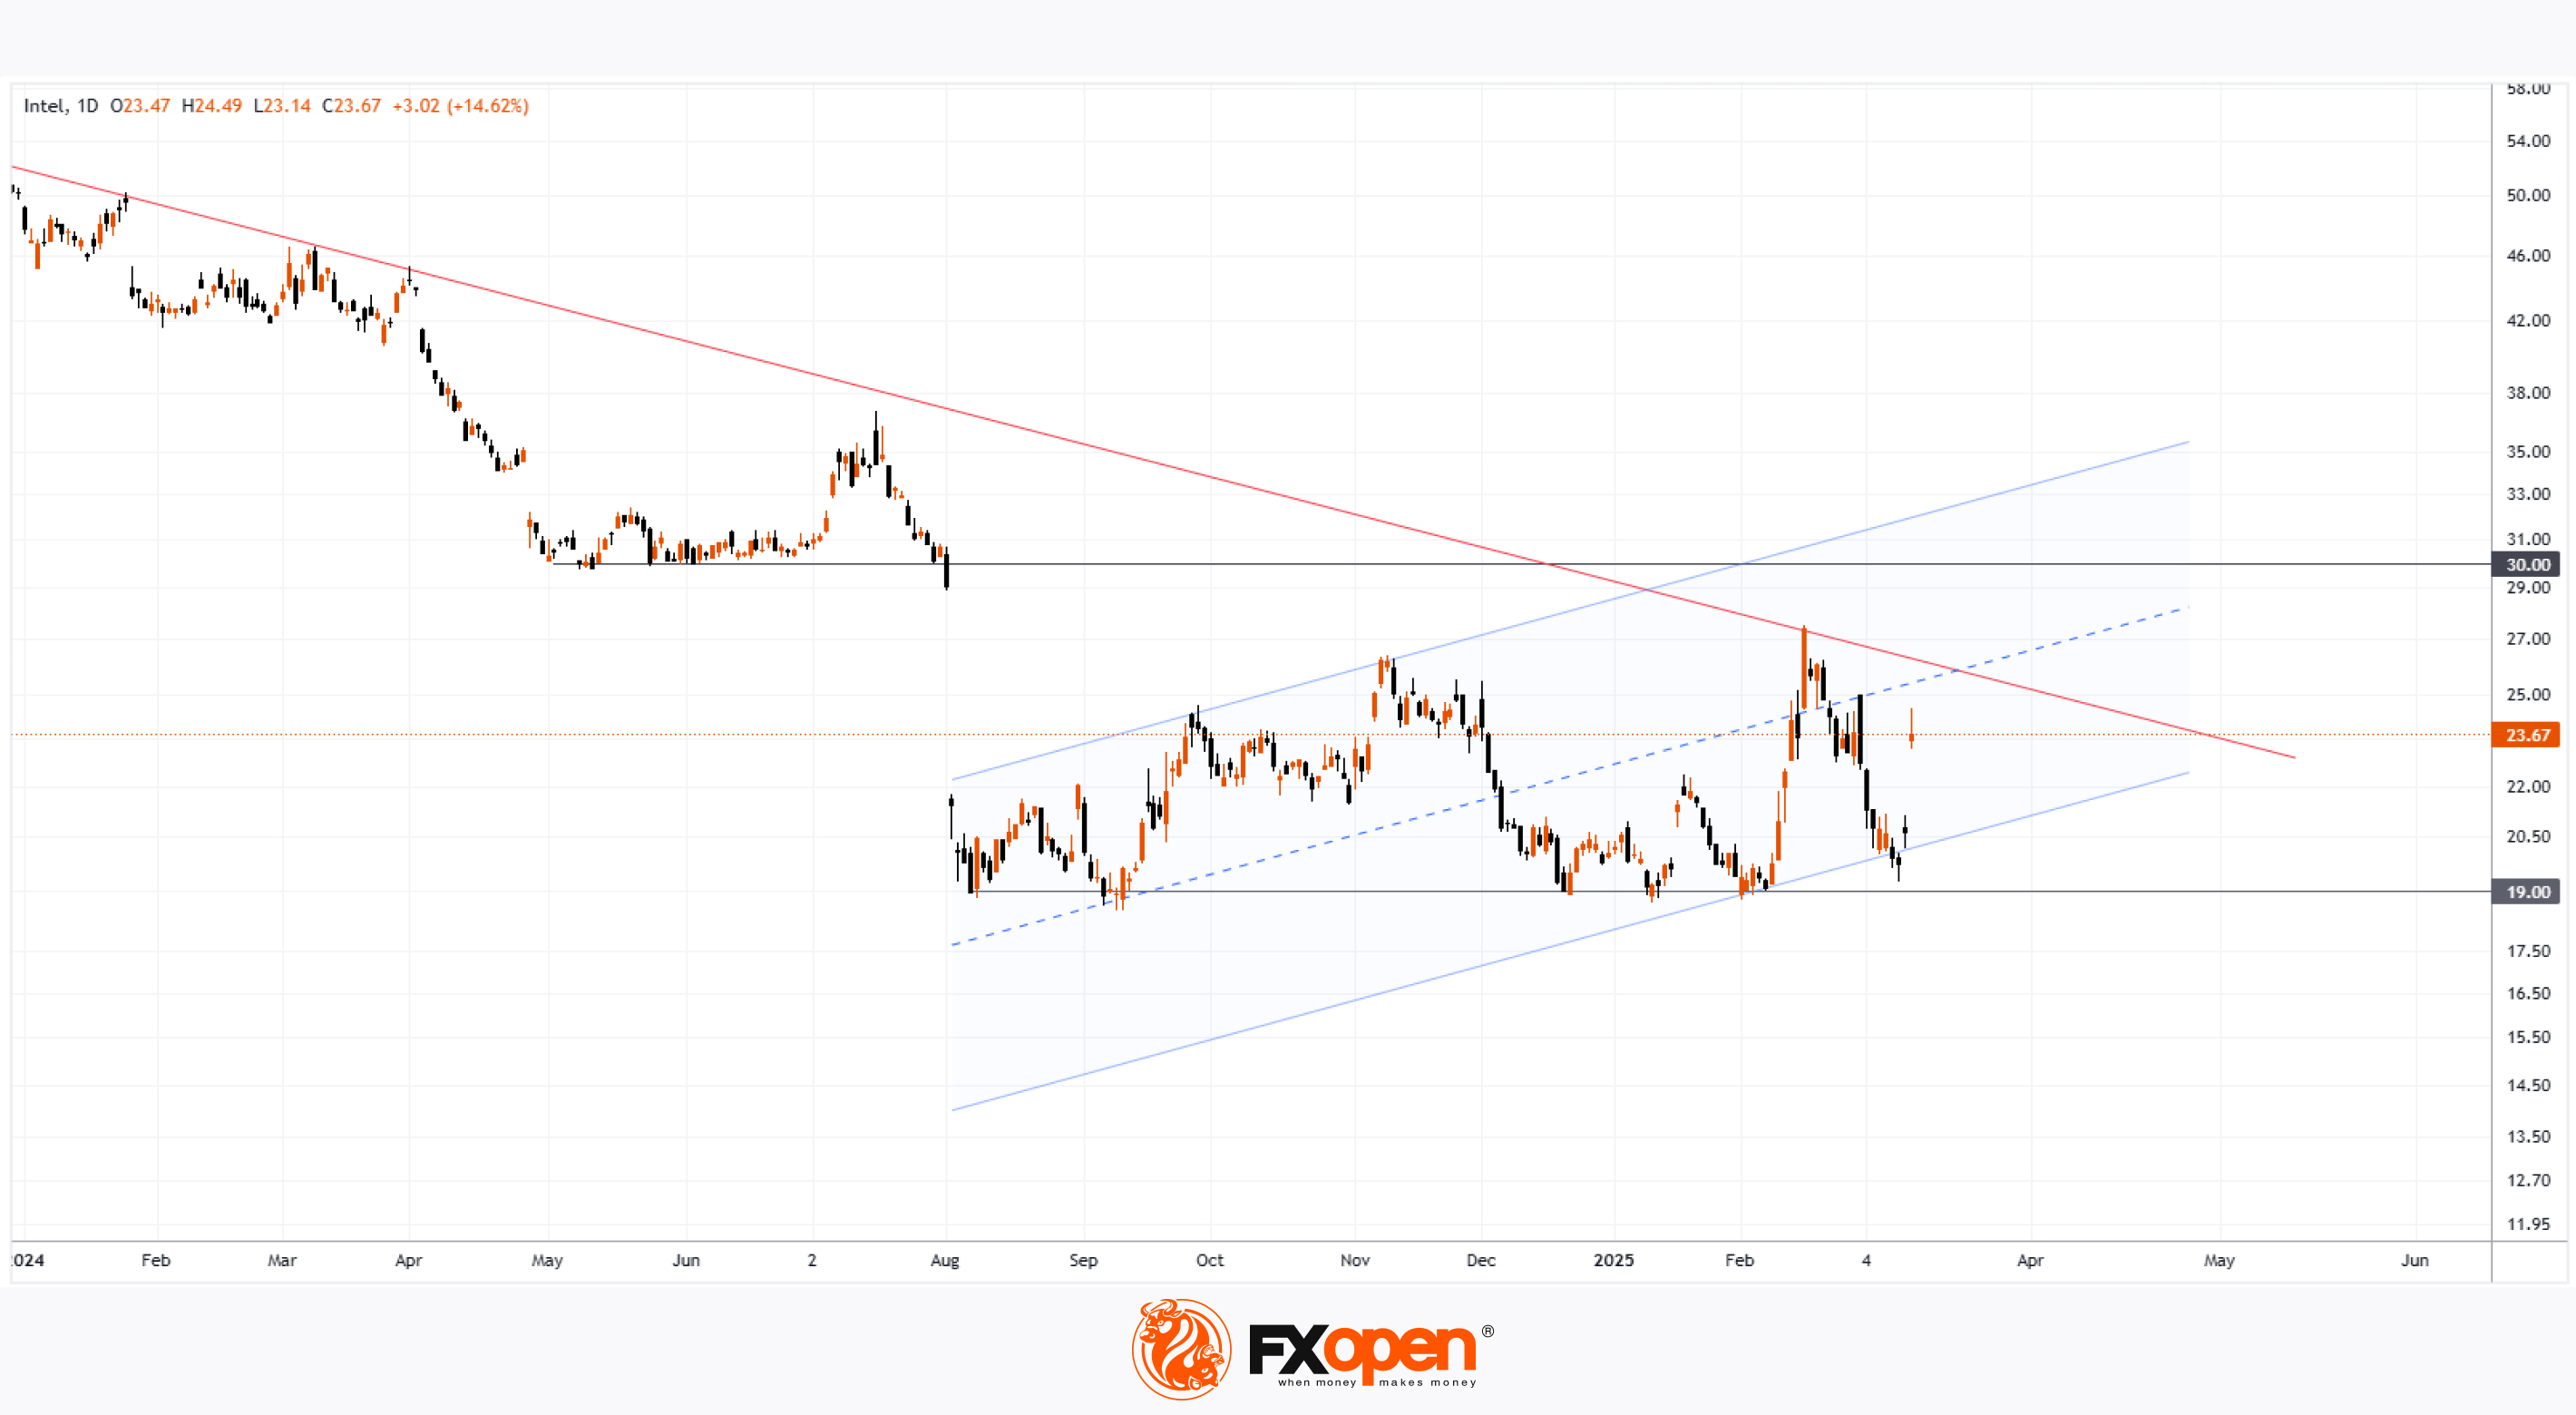
As shown in the Intel (INTC) stock chart:
→ Trading opened yesterday with a strong bullish gap.
→ By the end of the session, shares had risen by approximately 14% compared to the previous day's closing price.
According to Dow Jones Market Data, INTC shares recorded their largest percentage gain since 13 March 2020, making them the top-performing stock in the S&P 500 index (US SPX 500 mini on FXOpen) on Thursday.
Why Did Intel (INTC) Shares Rise?
The surge followed the company's announcement of a new CEO appointment. Lip-Bu Tan, a former board member, has been named the new Chief Executive Officer, set to assume the role on 18 March. Investors reacted positively to the decision, as Tan previously achieved significant success as CEO of Cadence Design Systems.
As the Wall Street Journal put it:
"Lip-Bu Tan is Intel’s best hope for a turnaround—if Intel can be fixed at all."
Technical Analysis of Intel (INTC) Stock
In our previous analysis of INTC price movements, we identified an upward channel (marked in blue), which remains relevant.
The current bullish momentum may lead to a breakout above the long-term downward trendline (marked in red). If this happens, it could pave the way for a move towards the psychological level of $30, which served as support last year.
Intel (INTC) Stock Price Forecasts
"We really like the new CEO appointment," wrote BofA Securities analyst Vivek Arya in a note, upgrading Intel’s rating from "Underperform" to "Neutral" and raising the target price from $19 to $25.
According to TipRanks:
→ Only 1 out of 23 analysts surveyed recommends buying INTC shares.
→ The average 12-month target price for INTC is $23.
Trade global index CFDs with zero commission and tight spreads. Open your FXOpen account now or learn more about trading index CFDs with FXOpen.
CFDs are complex instruments and come with a high risk of losing your money.
This article represents the opinion of the Companies operating under the FXOpen brand only. It is not to be construed as an offer, solicitation, or recommendation with respect to products and services provided by the Companies operating under the FXOpen brand, nor is it to be considered financial advice.
Intel (INTC) Shares Surge by Approximately 14%
As shown in the Intel (INTC) stock chart:
→ Trading opened yesterday with a strong bullish gap.
→ By the end of the session, shares had risen by approximately 14% compared to the previous day's closing price.
According to Dow Jones Market Data, INTC shares recorded their largest percentage gain since 13 March 2020, making them the top-performing stock in the S&P 500 index (US SPX 500 mini on FXOpen) on Thursday.
Why Did Intel (INTC) Shares Rise?
The surge followed the company's announcement of a new CEO appointment. Lip-Bu Tan, a former board member, has been named the new Chief Executive Officer, set to assume the role on 18 March. Investors reacted positively to the decision, as Tan previously achieved significant success as CEO of Cadence Design Systems.
As the Wall Street Journal put it:
"Lip-Bu Tan is Intel’s best hope for a turnaround—if Intel can be fixed at all."
Technical Analysis of Intel (INTC) Stock
In our previous analysis of INTC price movements, we identified an upward channel (marked in blue), which remains relevant.
The current bullish momentum may lead to a breakout above the long-term downward trendline (marked in red). If this happens, it could pave the way for a move towards the psychological level of $30, which served as support last year.
Intel (INTC) Stock Price Forecasts
"We really like the new CEO appointment," wrote BofA Securities analyst Vivek Arya in a note, upgrading Intel’s rating from "Underperform" to "Neutral" and raising the target price from $19 to $25.
According to TipRanks:
→ Only 1 out of 23 analysts surveyed recommends buying INTC shares.
→ The average 12-month target price for INTC is $23.
Trade global index CFDs with zero commission and tight spreads. Open your FXOpen account now or learn more about trading index CFDs with FXOpen.
CFDs are complex instruments and come with a high risk of losing your money.
This article represents the opinion of the Companies operating under the FXOpen brand only. It is not to be construed as an offer, solicitation, or recommendation with respect to products and services provided by the Companies operating under the FXOpen brand, nor is it to be considered financial advice.
👍2
#XAUUSD #goldprice #commodities #MarketNews #marketanalysis
Gold Price Nears $3,000 for the First Time in History
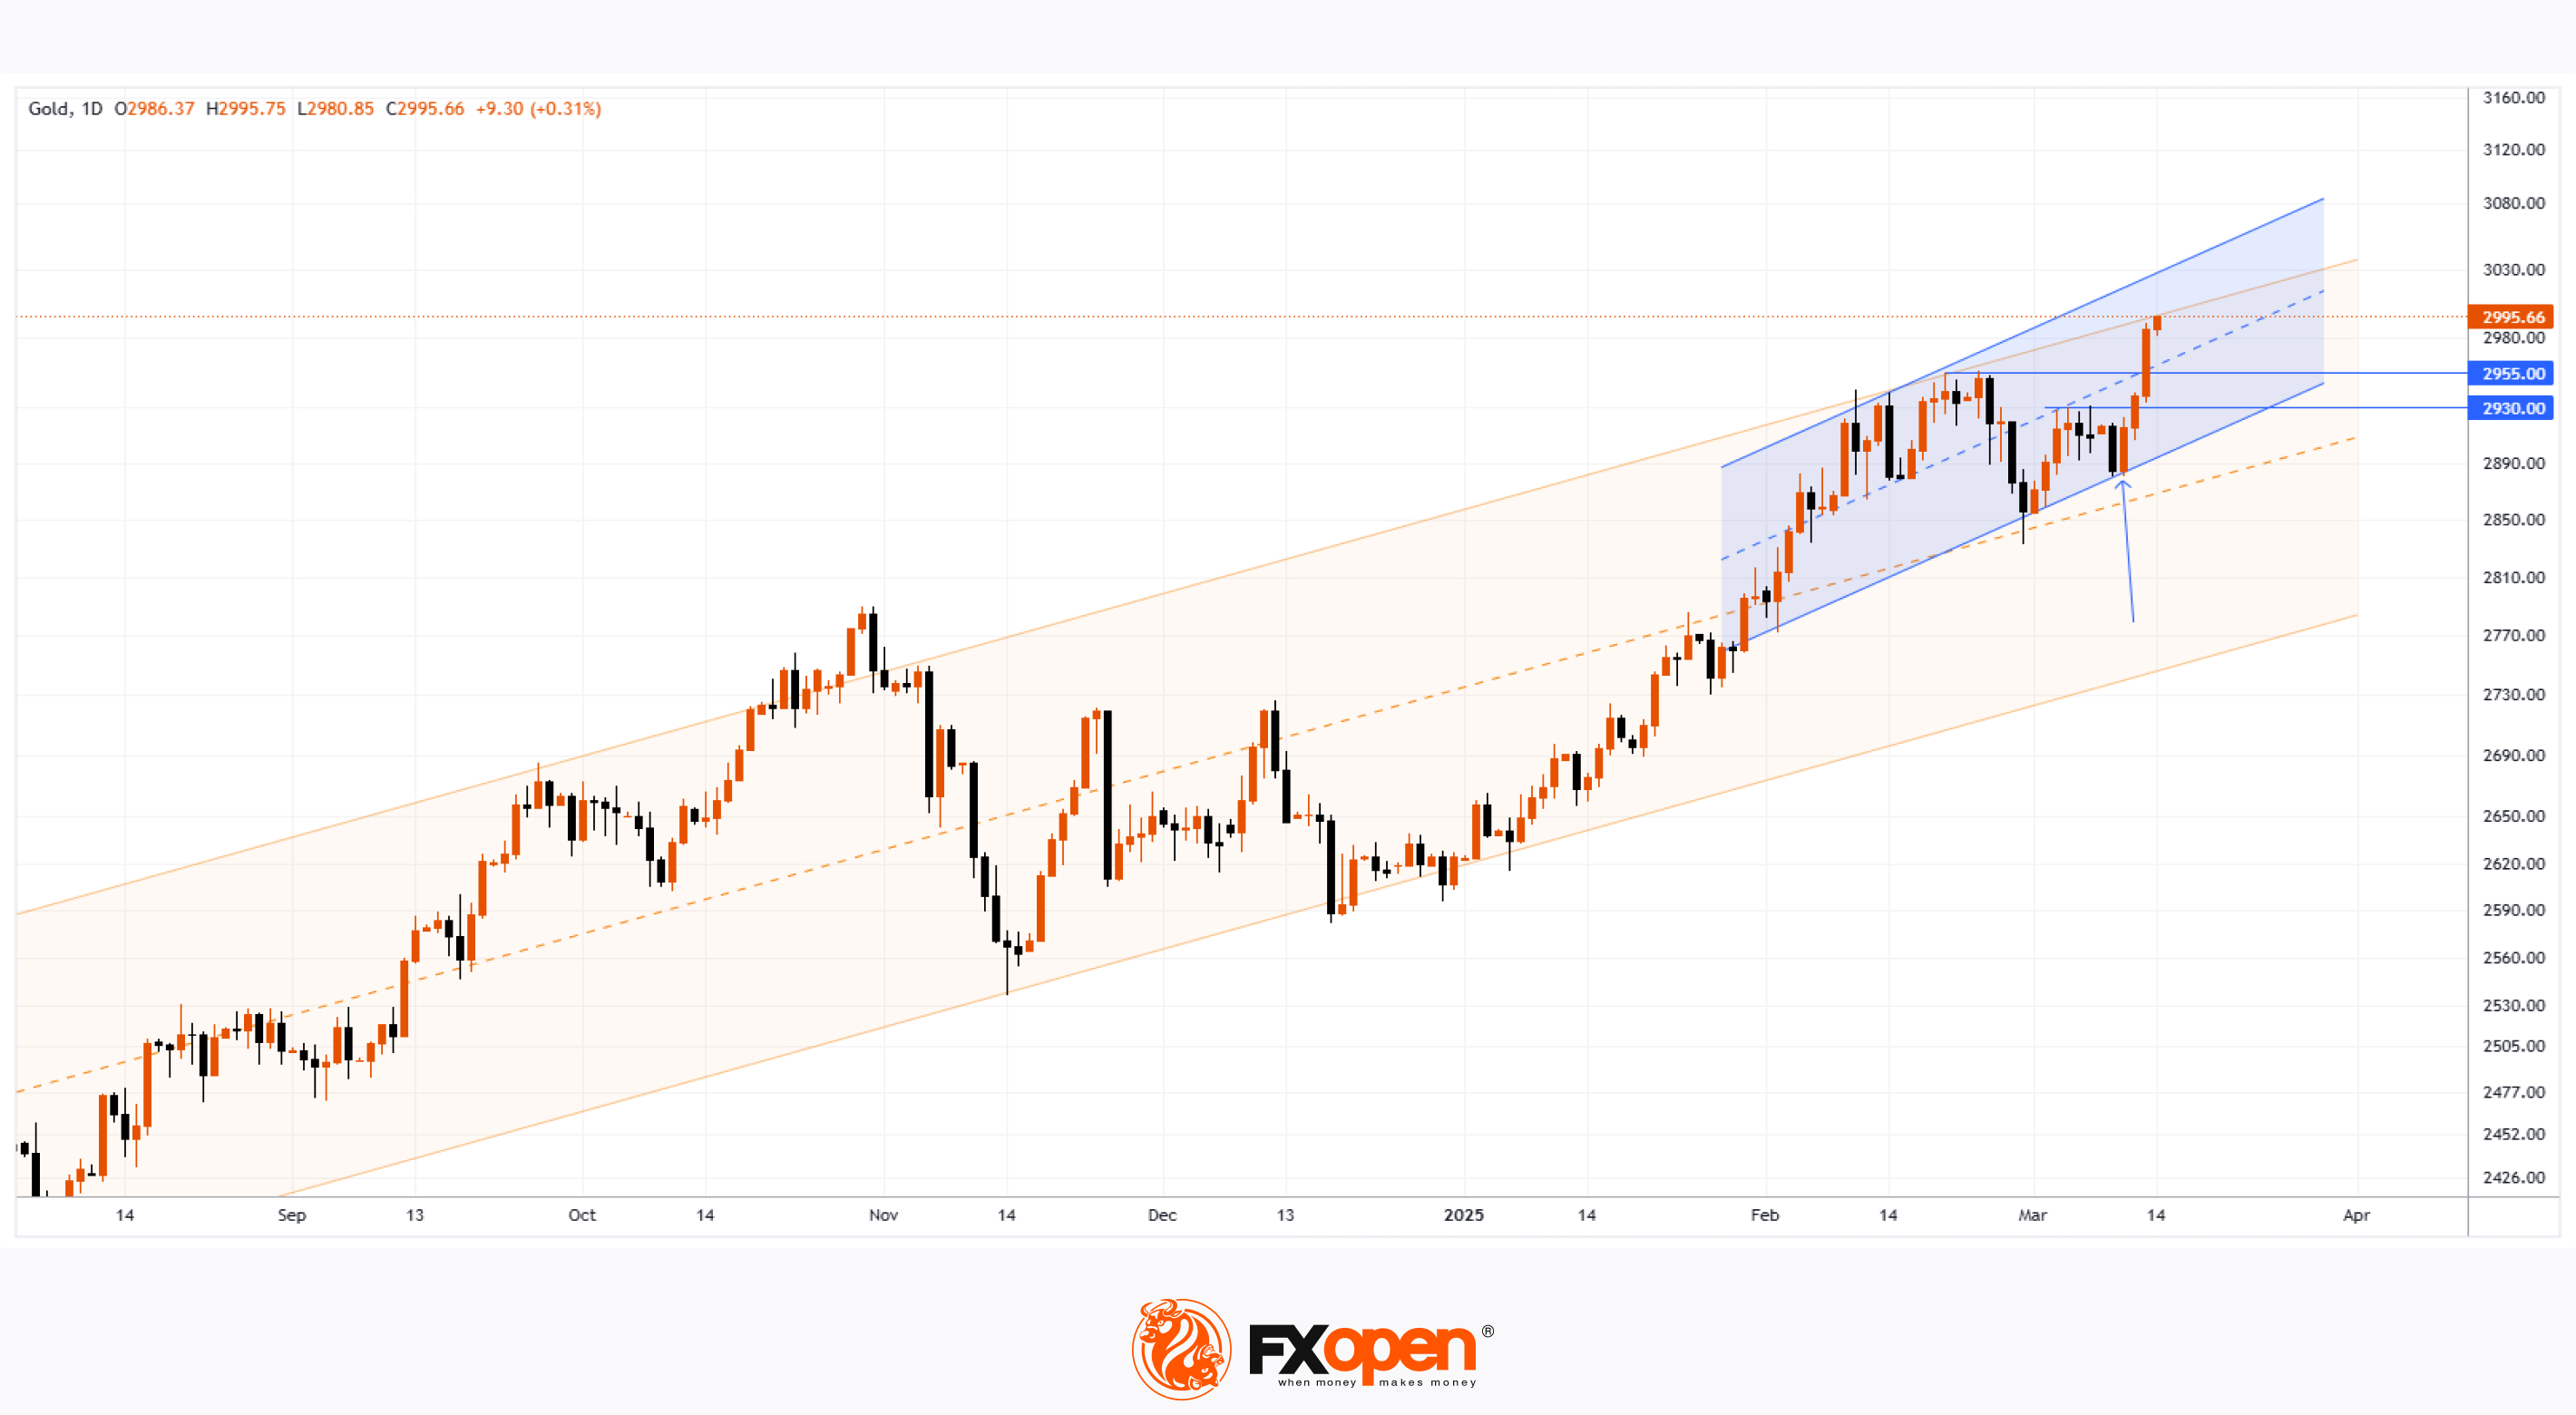
As shown in the XAU/USD chart today, gold is at a record high, just $5 away from the key psychological level of $3,000. Moreover, on the futures market, COMEX data indicates that gold futures have already surpassed this barrier.
Bullish sentiment is driven by:
→ Low US inflation data (released on Wednesday), which boosted gold prices due to growing expectations of a more dovish Federal Reserve policy.
→ Uncertainty surrounding Trump’s tariffs, escalating global trade tensions. According to the latest reports, the US president has warned of a 200% tariff on European wine and other alcoholic beverages after the EU imposed a 50% tariff on American whiskey.
Technical Analysis of XAU/USD
In our previous post on 6 March, we identified an upward channel (marked in blue) and suggested that its lower boundary would act as support, providing bulls with an opportunity to push towards the $3,000 level.
As indicated by the arrow, this scenario played out:
→ 10–11 March: The price rebounded from the lower blue boundary.
→ The price then broke through $2,930.
The large bullish candle formed on 13 March signals strong buyer dominance, suggesting that:
→ $2,930 and $2,950, which previously acted as resistance, could now provide support for bulls.
→ This month, gold may exceed the $3,000 mark for the first time, reaching the upper boundary of the long-term channel (marked in yellow).
Start trading commodities with tight spreads. Open your trading account now or learn more about trading commodity CFDs with FXOpen.
CFDs are complex instruments and come with a high risk of losing your money.
This article represents the opinion of the Companies operating under the FXOpen brand only. It is not to be construed as an offer, solicitation, or recommendation with respect to products and services provided by the Companies operating under the FXOpen brand, nor is it to be considered financial advice.
Gold Price Nears $3,000 for the First Time in History
As shown in the XAU/USD chart today, gold is at a record high, just $5 away from the key psychological level of $3,000. Moreover, on the futures market, COMEX data indicates that gold futures have already surpassed this barrier.
Bullish sentiment is driven by:
→ Low US inflation data (released on Wednesday), which boosted gold prices due to growing expectations of a more dovish Federal Reserve policy.
→ Uncertainty surrounding Trump’s tariffs, escalating global trade tensions. According to the latest reports, the US president has warned of a 200% tariff on European wine and other alcoholic beverages after the EU imposed a 50% tariff on American whiskey.
Technical Analysis of XAU/USD
In our previous post on 6 March, we identified an upward channel (marked in blue) and suggested that its lower boundary would act as support, providing bulls with an opportunity to push towards the $3,000 level.
As indicated by the arrow, this scenario played out:
→ 10–11 March: The price rebounded from the lower blue boundary.
→ The price then broke through $2,930.
The large bullish candle formed on 13 March signals strong buyer dominance, suggesting that:
→ $2,930 and $2,950, which previously acted as resistance, could now provide support for bulls.
→ This month, gold may exceed the $3,000 mark for the first time, reaching the upper boundary of the long-term channel (marked in yellow).
Start trading commodities with tight spreads. Open your trading account now or learn more about trading commodity CFDs with FXOpen.
CFDs are complex instruments and come with a high risk of losing your money.
This article represents the opinion of the Companies operating under the FXOpen brand only. It is not to be construed as an offer, solicitation, or recommendation with respect to products and services provided by the Companies operating under the FXOpen brand, nor is it to be considered financial advice.
👍2
#MarketInsights #InterestRates #TradingStrategies #GlobalMarkets #EconomicOutlook
Market Insights with Gary Thomson: Canada’s Inflation, Fed and BoE Interest Rates, Earnings Reports
In this video, we’ll explore the key economic events, market trends, and corporate news shaping the financial landscape. Get ready for expert insights into forex, commodities, and stocks to help you navigate the week ahead. Let’s dive in!
In this episode, we discuss:
🔸Canada’s Inflation Rate
The Bank of Canada cut rates by 25bps, but inflation uncertainty remains amid U.S. trade tensions. January's inflation rate sparked CAD volatility. Will the market react similarly this time?
🔸Fed Interest Rate Decision
The Fed is expected to hold rates, but Powell’s comments and FOMC projections will be key. Traders seek clues on future cuts—will they come in May, June, or later? How will markets react this time?
🔸BoE Interest Rate Decision
The BoE is expected to hold rates at 4.5%, but MPC votes could hint at future easing. With inflation still above target, will the pound see a boost or face pressure?
🔸Corporate Earnings Reports
Earnings reports this week could drive market volatility. Will results surprise or disappoint? Stay prepared!
Don’t miss out—gain insights to stay ahead in your trading journey.
https://cutt.ly/lriDLwXI
To take advantage of price fluctuations in the foreign exchange markets, consider enlisting the services of a reliable broker like FXOpen.
⚠️
This forecast represents FXOpen Companies opinion only, it should not be construed as an offer, invitation or recommendation in respect to FXOpen Companies products and services or as financial advice.
Market Insights with Gary Thomson: Canada’s Inflation, Fed and BoE Interest Rates, Earnings Reports
In this video, we’ll explore the key economic events, market trends, and corporate news shaping the financial landscape. Get ready for expert insights into forex, commodities, and stocks to help you navigate the week ahead. Let’s dive in!
In this episode, we discuss:
🔸Canada’s Inflation Rate
The Bank of Canada cut rates by 25bps, but inflation uncertainty remains amid U.S. trade tensions. January's inflation rate sparked CAD volatility. Will the market react similarly this time?
🔸Fed Interest Rate Decision
The Fed is expected to hold rates, but Powell’s comments and FOMC projections will be key. Traders seek clues on future cuts—will they come in May, June, or later? How will markets react this time?
🔸BoE Interest Rate Decision
The BoE is expected to hold rates at 4.5%, but MPC votes could hint at future easing. With inflation still above target, will the pound see a boost or face pressure?
🔸Corporate Earnings Reports
Earnings reports this week could drive market volatility. Will results surprise or disappoint? Stay prepared!
Don’t miss out—gain insights to stay ahead in your trading journey.
https://cutt.ly/lriDLwXI
To take advantage of price fluctuations in the foreign exchange markets, consider enlisting the services of a reliable broker like FXOpen.
⚠️
This forecast represents FXOpen Companies opinion only, it should not be construed as an offer, invitation or recommendation in respect to FXOpen Companies products and services or as financial advice.
YouTube
Market Insights with Gary Thomson: Canada’s Inflation, Fed and BoE Interest Rates, Earnings Reports
In this video, we’ll explore the key economic events, market trends, and corporate news shaping the financial landscape. Get ready for expert insights into forex, commodities, and stocks to help you navigate the week ahead. Let’s dive in!
In this episode…
In this episode…
👍2
#stockmarket #stocks #tradingtips #MarketNews
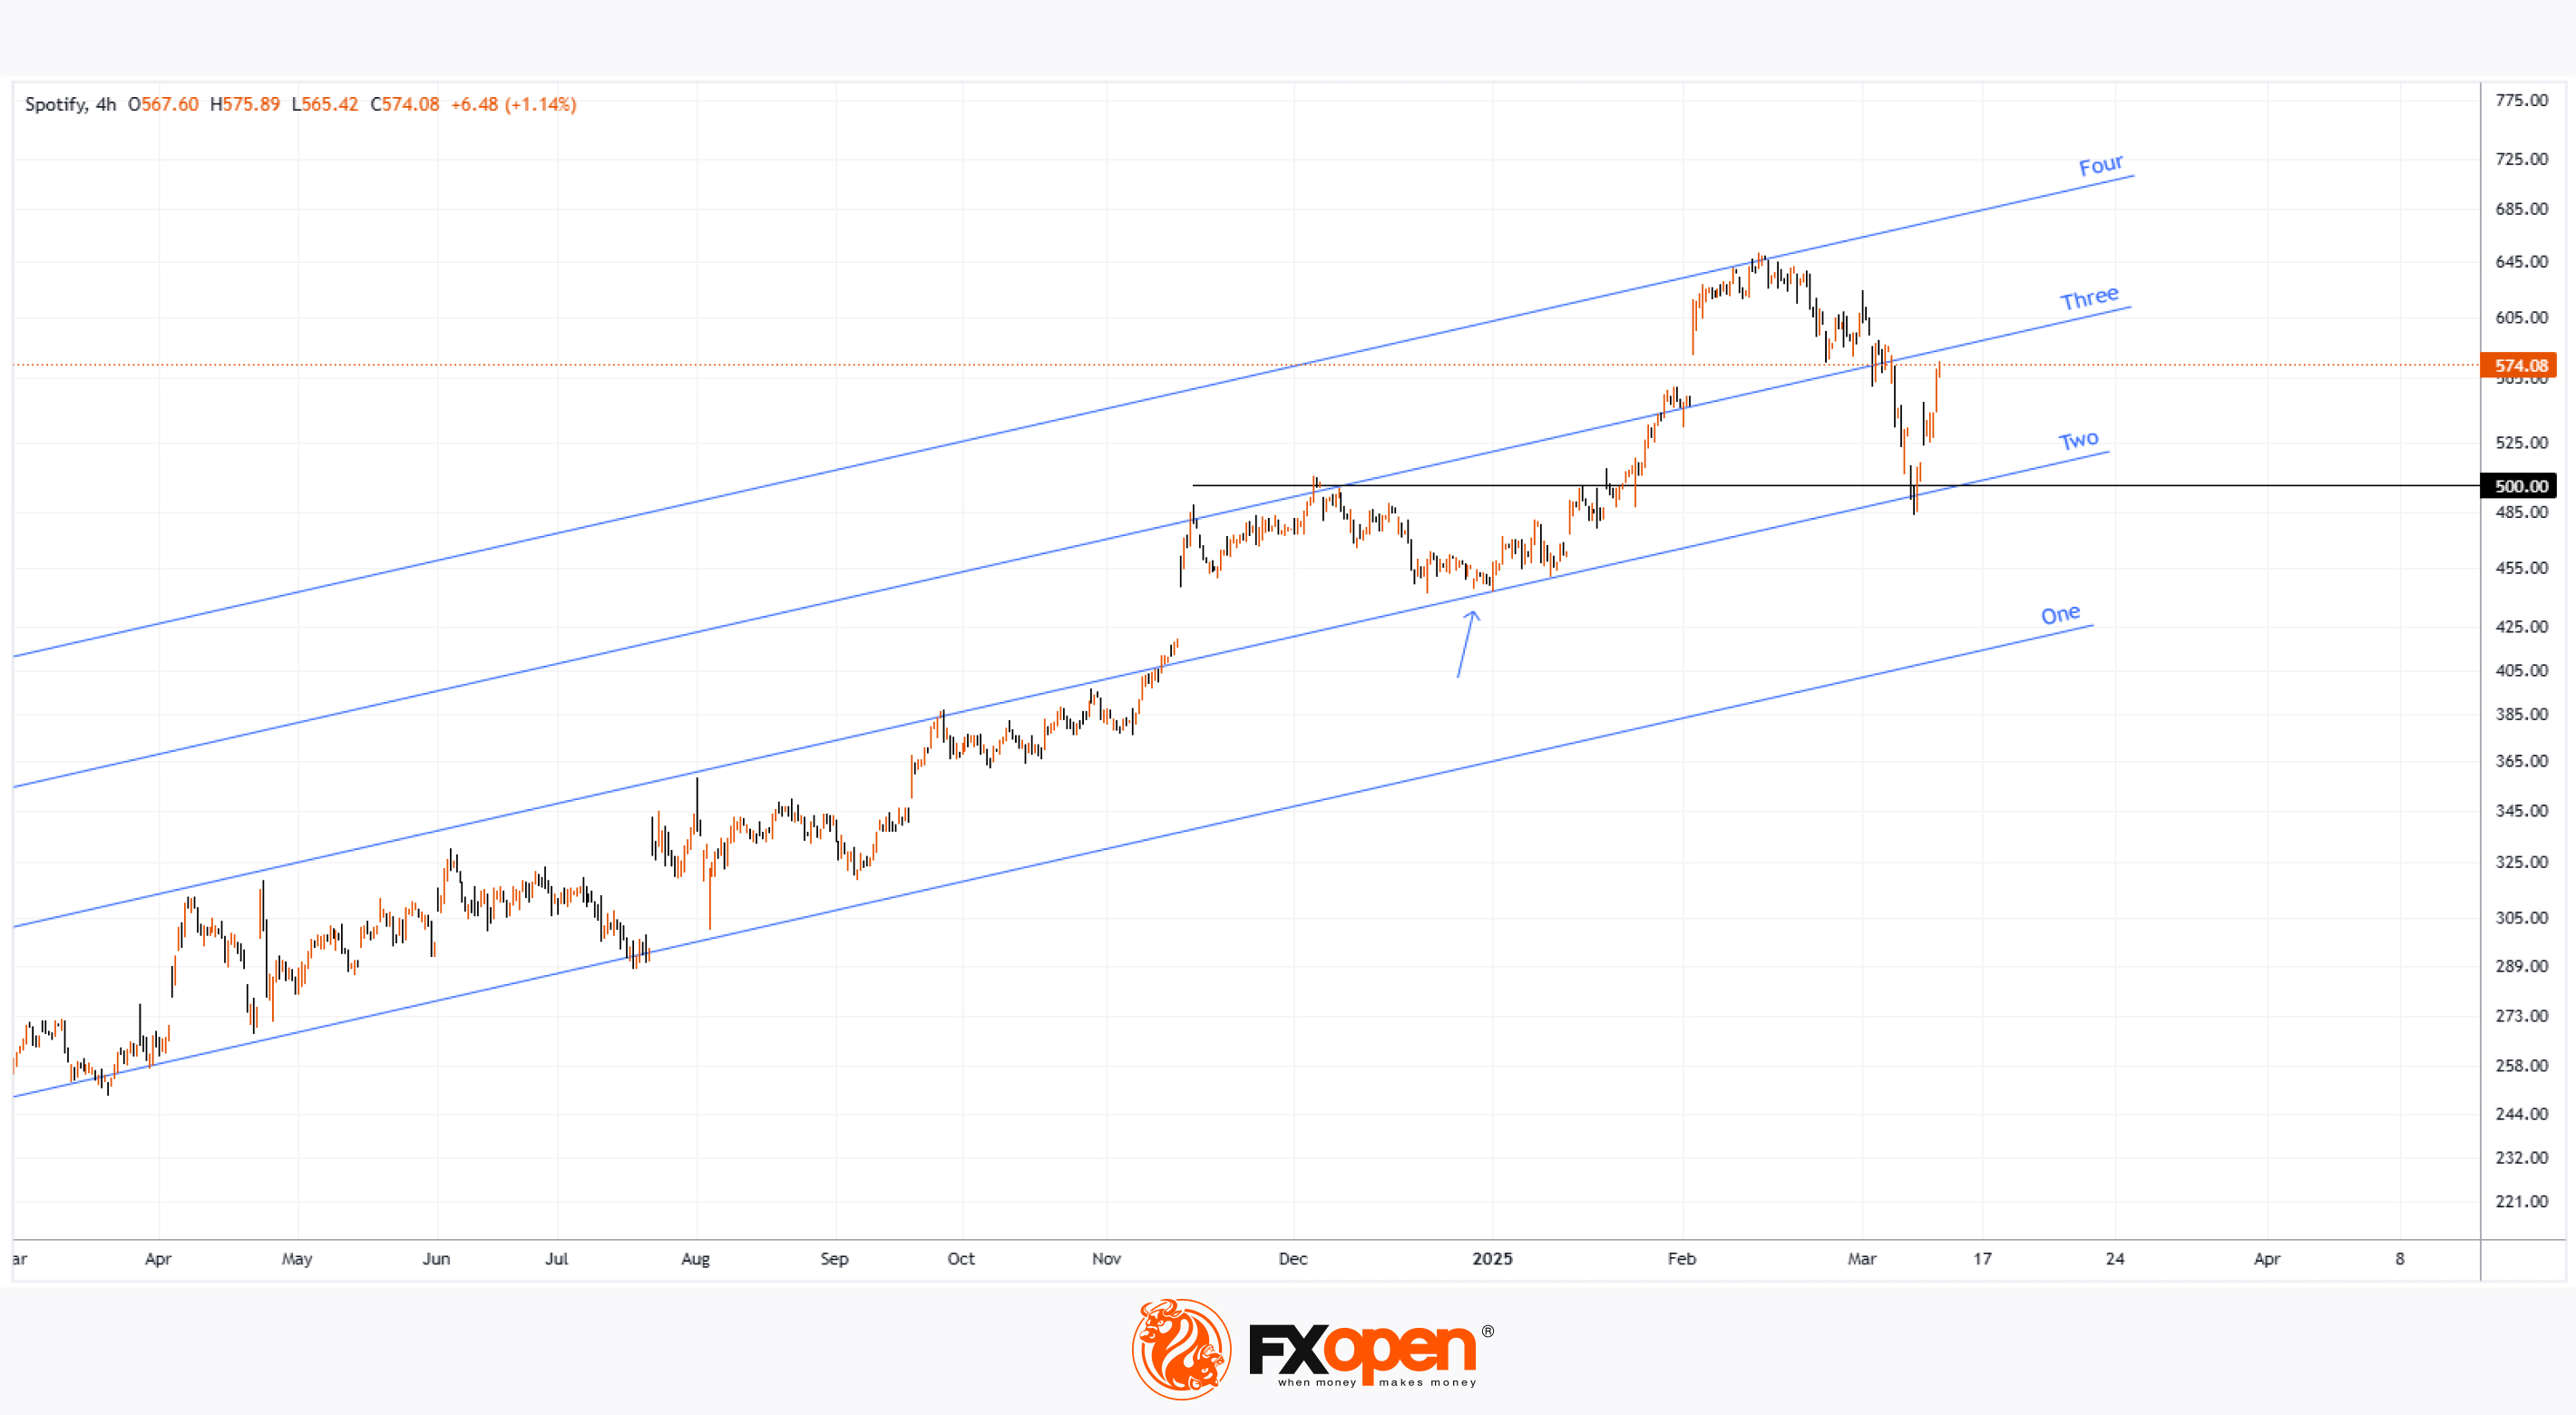
Spotify (SPOT) Shares Rise by Nearly 7%
According to the stock chart of music streaming giant Spotify (SPOT), the share price:
→ Increased by almost 7% by the end of trading on Friday.
→ Has surged approximately 28% since the start of 2025—one of the strongest performances in the stock market.
→ Has nearly doubled over the past 12 months.
Why Is Spotify (SPOT) Stock Rising?
As we noted late last year, investors have responded enthusiastically to the launch of the “Premium” plan, which offers higher-quality, ad-free music streaming and is expected to boost the company’s revenue.
Additionally, on Friday, Spotify announced that it had paid out around $10 billion in royalties to artists during 2024. By comparison, in 2014, this figure was “just” $1 billion.
Technical Analysis of Spotify (SPOT) Stock
Drawing a parallel with musical notes on a staff, the price action appears to be playing a "bullish melody," rising while interacting with a structure of four ascending lines that alternate between support (one of many examples marked with an arrow) and resistance.
In March, the price tested support at Line Two, which was reinforced by the psychological level of $500 per share. If bullish momentum remains strong, buyers may attempt to push the stock back into the range between Lines Three and Four.
Spotify (SPOT) Stock Forecast
According to TipRanks:
→ Analysts have an average 12-month price target of $671 for SPOT shares.
→ 17 out of 26 analysts recommend buying SPOT stock.
Trade global index CFDs with zero commission and tight spreads. Open your FXOpen account now or learn more about trading index CFDs with FXOpen.
CFDs are complex instruments and come with a high risk of losing your money.
This article represents the opinion of the Companies operating under the FXOpen brand only. It is not to be construed as an offer, solicitation, or recommendation with respect to products and services provided by the Companies operating under the FXOpen brand, nor is it to be considered financial advice.
Spotify (SPOT) Shares Rise by Nearly 7%
According to the stock chart of music streaming giant Spotify (SPOT), the share price:
→ Increased by almost 7% by the end of trading on Friday.
→ Has surged approximately 28% since the start of 2025—one of the strongest performances in the stock market.
→ Has nearly doubled over the past 12 months.
Why Is Spotify (SPOT) Stock Rising?
As we noted late last year, investors have responded enthusiastically to the launch of the “Premium” plan, which offers higher-quality, ad-free music streaming and is expected to boost the company’s revenue.
Additionally, on Friday, Spotify announced that it had paid out around $10 billion in royalties to artists during 2024. By comparison, in 2014, this figure was “just” $1 billion.
Technical Analysis of Spotify (SPOT) Stock
Drawing a parallel with musical notes on a staff, the price action appears to be playing a "bullish melody," rising while interacting with a structure of four ascending lines that alternate between support (one of many examples marked with an arrow) and resistance.
In March, the price tested support at Line Two, which was reinforced by the psychological level of $500 per share. If bullish momentum remains strong, buyers may attempt to push the stock back into the range between Lines Three and Four.
Spotify (SPOT) Stock Forecast
According to TipRanks:
→ Analysts have an average 12-month price target of $671 for SPOT shares.
→ 17 out of 26 analysts recommend buying SPOT stock.
Trade global index CFDs with zero commission and tight spreads. Open your FXOpen account now or learn more about trading index CFDs with FXOpen.
CFDs are complex instruments and come with a high risk of losing your money.
This article represents the opinion of the Companies operating under the FXOpen brand only. It is not to be construed as an offer, solicitation, or recommendation with respect to products and services provided by the Companies operating under the FXOpen brand, nor is it to be considered financial advice.
👍2
#stockmarket #sp500 #tradingtips #marketanalysis #MarketUpdates
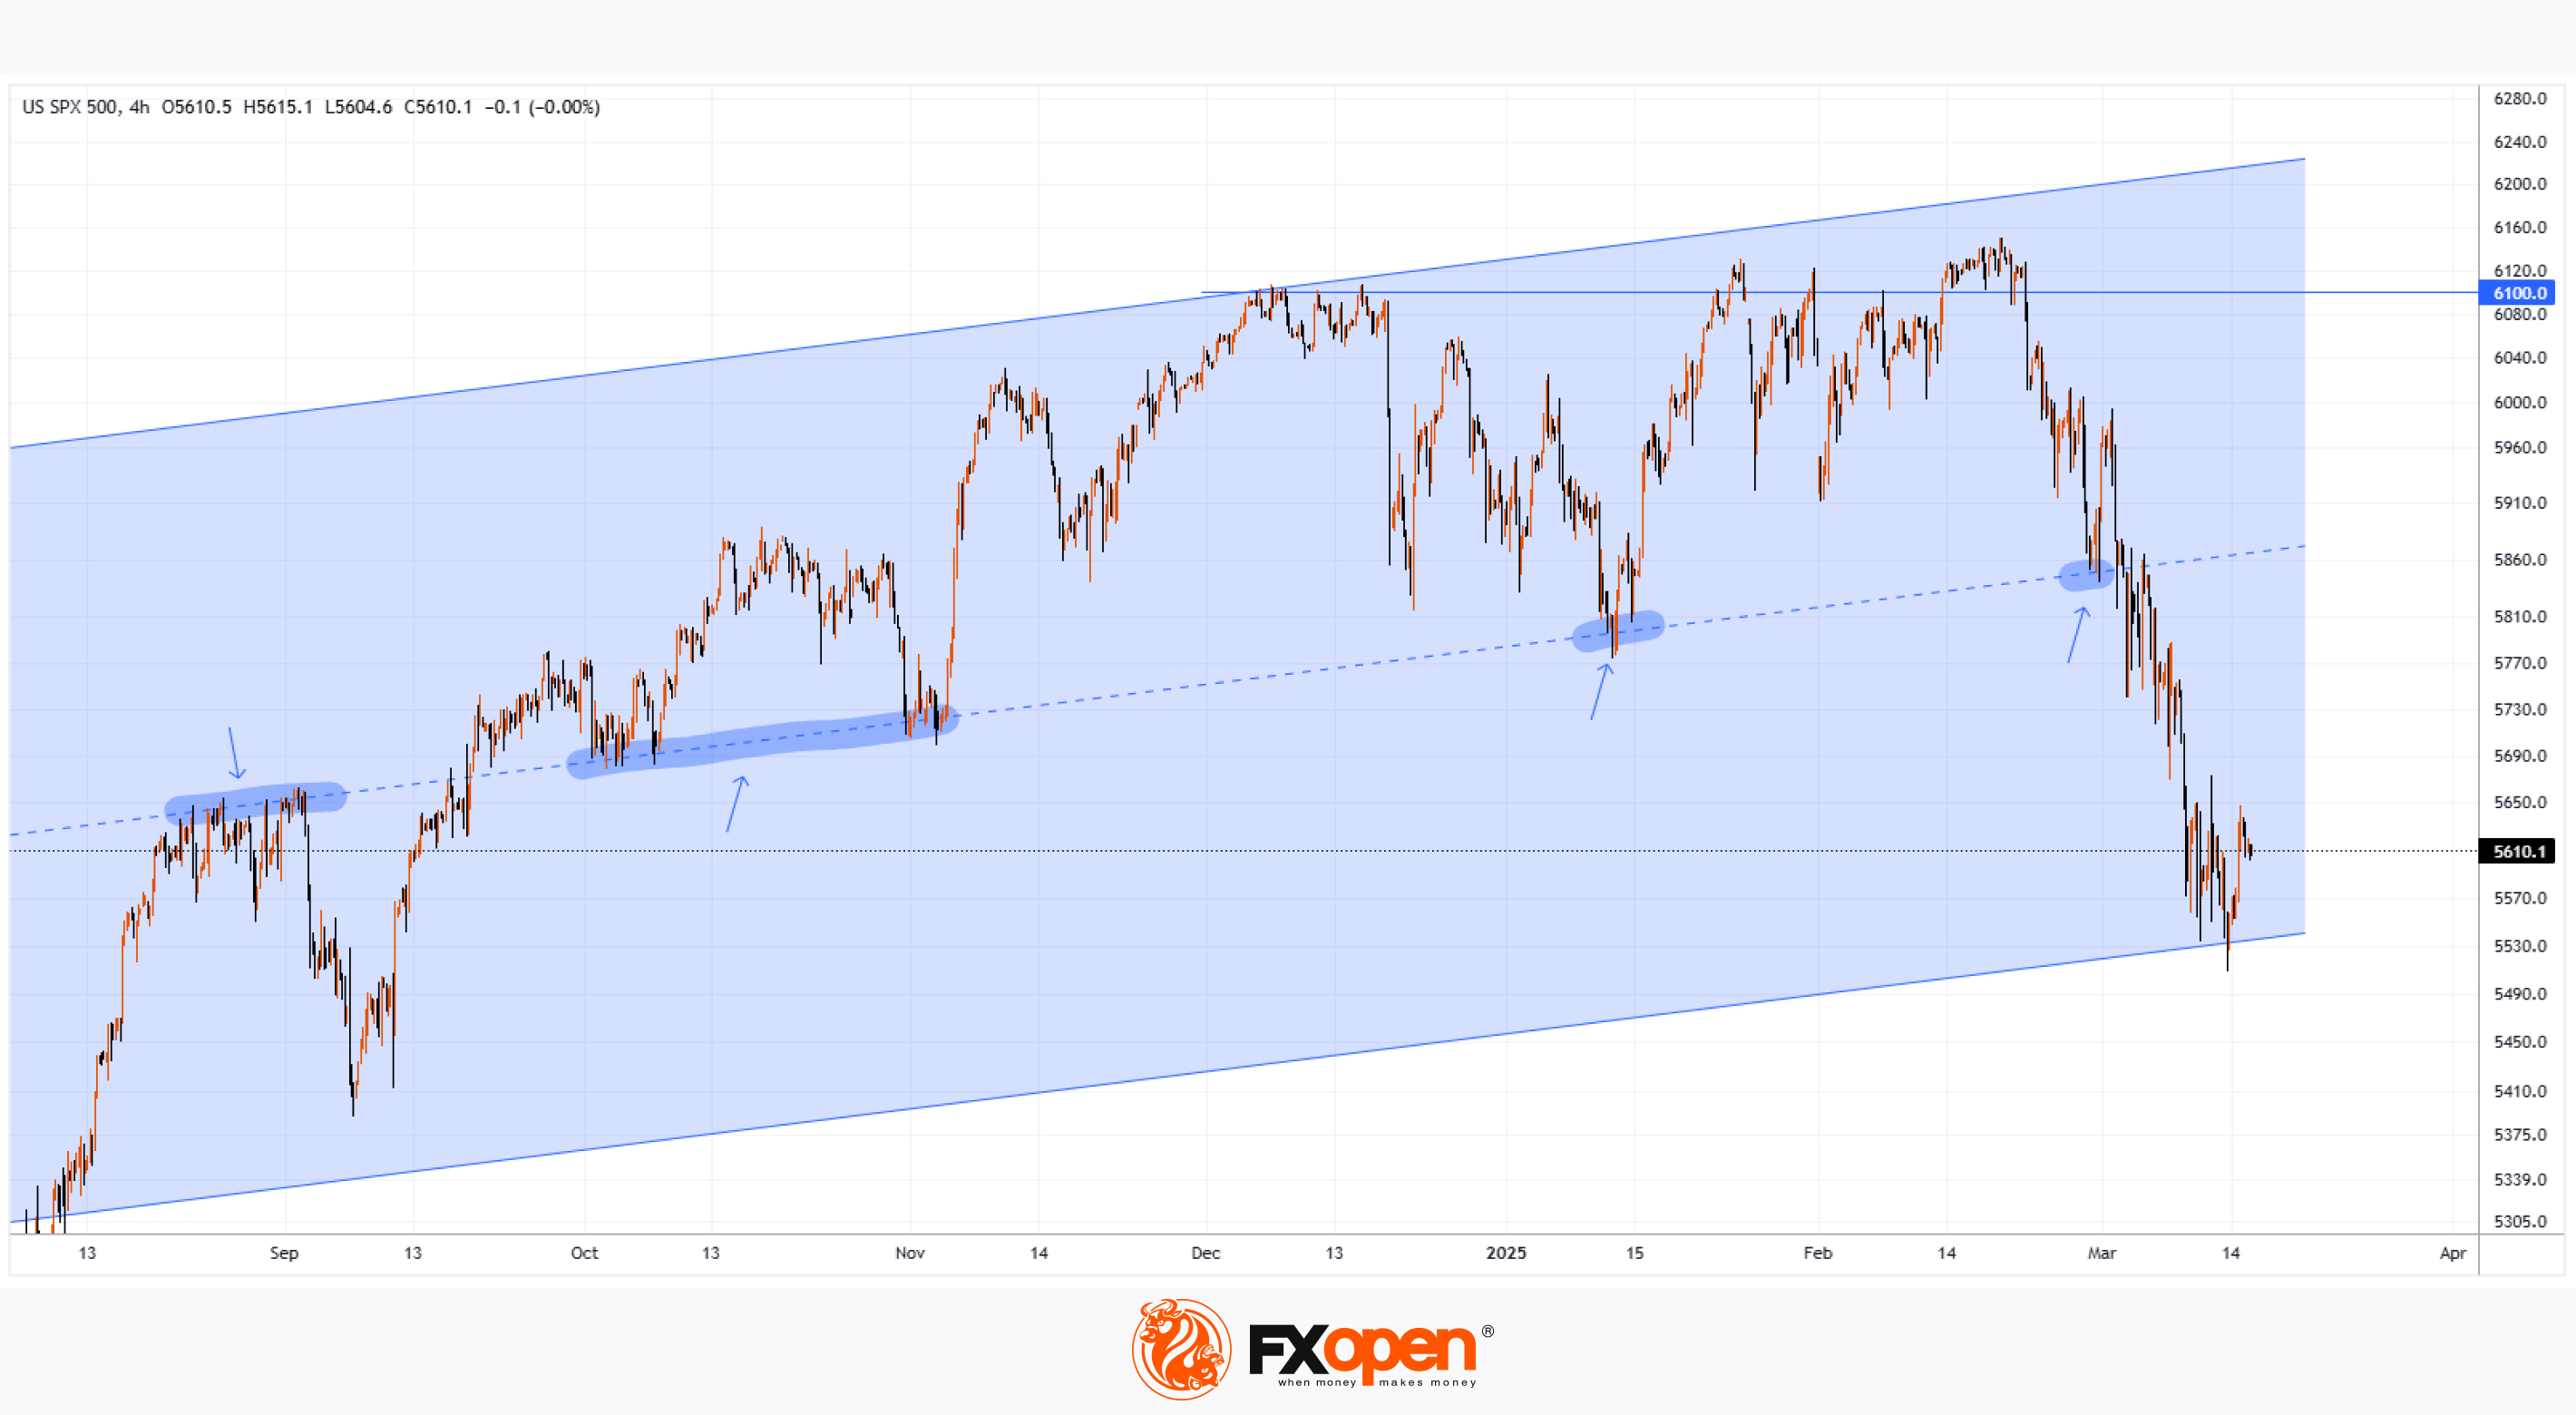
S&P 500 Analysis: How Long Could the Stock Market Correction Last?
Six days ago, we noted that the Nasdaq 100 had entered a correction phase. Now, the S&P 500 (US SPX 500 mini on FXOpen) has followed suit, closing more than 10% below its 19 February peak on Thursday, officially confirming a correction.
Statistically, according to research by Yardeni Research:
→ Market corrections occur quite frequently—since 1929, the S&P 500 has experienced 56 corrections.
→ Only 22 of those corrections turned into bear markets, defined as a drop of 20% or more from recent record highs.
S&P 500 Analysis: How Long Could This Correction Last?
On one hand, Friday’s market rebound suggests that buyers are stepping in.
On the other hand:
→ US Treasury Secretary Scott Bessent stated on Sunday that there are "no guarantees" the world's largest economy will avoid a recession. This came just a week after US President Donald Trump refused to rule out such a scenario.
→ The current correction has lasted 22 days so far, whereas historically, the average correction lasts 115 days and results in a 13.8% decline from the peak.
Technical Analysis of the S&P 500 (US SPX 500 mini on FXOpen)
The price is forming an upward channel around the median line, which alternates between acting as support and resistance (marked in blue).
→ Price action suggests that bulls are struggling to hold above the 6,100 level. In February, they failed to push towards the upper boundary of the channel.
→ Since the price has reached the lower boundary of the channel, there is a possibility that bearish momentum may start to weaken.
However, if the price loses support at the lower boundary of the channel, this would be a bearish signal from a technical perspective, indicating the potential for a deeper correction in the S&P 500 (US SPX 500 mini on FXOpen).
Trade global index CFDs with zero commission and tight spreads. Open your FXOpen account now or learn more about trading index CFDs with FXOpen.
CFDs are complex instruments and come with a high risk of losing your money.
This article represents the opinion of the Companies operating under the FXOpen brand only. It is not to be construed as an offer, solicitation, or recommendation with respect to products and services provided by the Companies operating under the FXOpen brand, nor is it to be considered financial advice.
S&P 500 Analysis: How Long Could the Stock Market Correction Last?
Six days ago, we noted that the Nasdaq 100 had entered a correction phase. Now, the S&P 500 (US SPX 500 mini on FXOpen) has followed suit, closing more than 10% below its 19 February peak on Thursday, officially confirming a correction.
Statistically, according to research by Yardeni Research:
→ Market corrections occur quite frequently—since 1929, the S&P 500 has experienced 56 corrections.
→ Only 22 of those corrections turned into bear markets, defined as a drop of 20% or more from recent record highs.
S&P 500 Analysis: How Long Could This Correction Last?
On one hand, Friday’s market rebound suggests that buyers are stepping in.
On the other hand:
→ US Treasury Secretary Scott Bessent stated on Sunday that there are "no guarantees" the world's largest economy will avoid a recession. This came just a week after US President Donald Trump refused to rule out such a scenario.
→ The current correction has lasted 22 days so far, whereas historically, the average correction lasts 115 days and results in a 13.8% decline from the peak.
Technical Analysis of the S&P 500 (US SPX 500 mini on FXOpen)
The price is forming an upward channel around the median line, which alternates between acting as support and resistance (marked in blue).
→ Price action suggests that bulls are struggling to hold above the 6,100 level. In February, they failed to push towards the upper boundary of the channel.
→ Since the price has reached the lower boundary of the channel, there is a possibility that bearish momentum may start to weaken.
However, if the price loses support at the lower boundary of the channel, this would be a bearish signal from a technical perspective, indicating the potential for a deeper correction in the S&P 500 (US SPX 500 mini on FXOpen).
Trade global index CFDs with zero commission and tight spreads. Open your FXOpen account now or learn more about trading index CFDs with FXOpen.
CFDs are complex instruments and come with a high risk of losing your money.
This article represents the opinion of the Companies operating under the FXOpen brand only. It is not to be construed as an offer, solicitation, or recommendation with respect to products and services provided by the Companies operating under the FXOpen brand, nor is it to be considered financial advice.
👍2
This media is not supported in your browser
VIEW IN TELEGRAM
Daily Market News with FXOpen - 18 March 2025
🔸European Markets Head for Higher Open Ahead of German Debt Reform Vote;
🔸Gold Rises to Record on Middle East Tension, US Economy Concerns;
🔸Dollar Steadies Near 5-Month Low, Struggles to Shake Off Growth Concerns.
CFDs are complex instruments and come with a high risk of losing your money.
#Dollar #Forex #USD #CurrencyMarket #ForexTrading #FinanceNews #StockMarket #Investing #MarketUpdate
🔸European Markets Head for Higher Open Ahead of German Debt Reform Vote;
🔸Gold Rises to Record on Middle East Tension, US Economy Concerns;
🔸Dollar Steadies Near 5-Month Low, Struggles to Shake Off Growth Concerns.
CFDs are complex instruments and come with a high risk of losing your money.
#Dollar #Forex #USD #CurrencyMarket #ForexTrading #FinanceNews #StockMarket #Investing #MarketUpdate
👍2
#stocktrading #stockmarket #MarketNews #marketanalysis
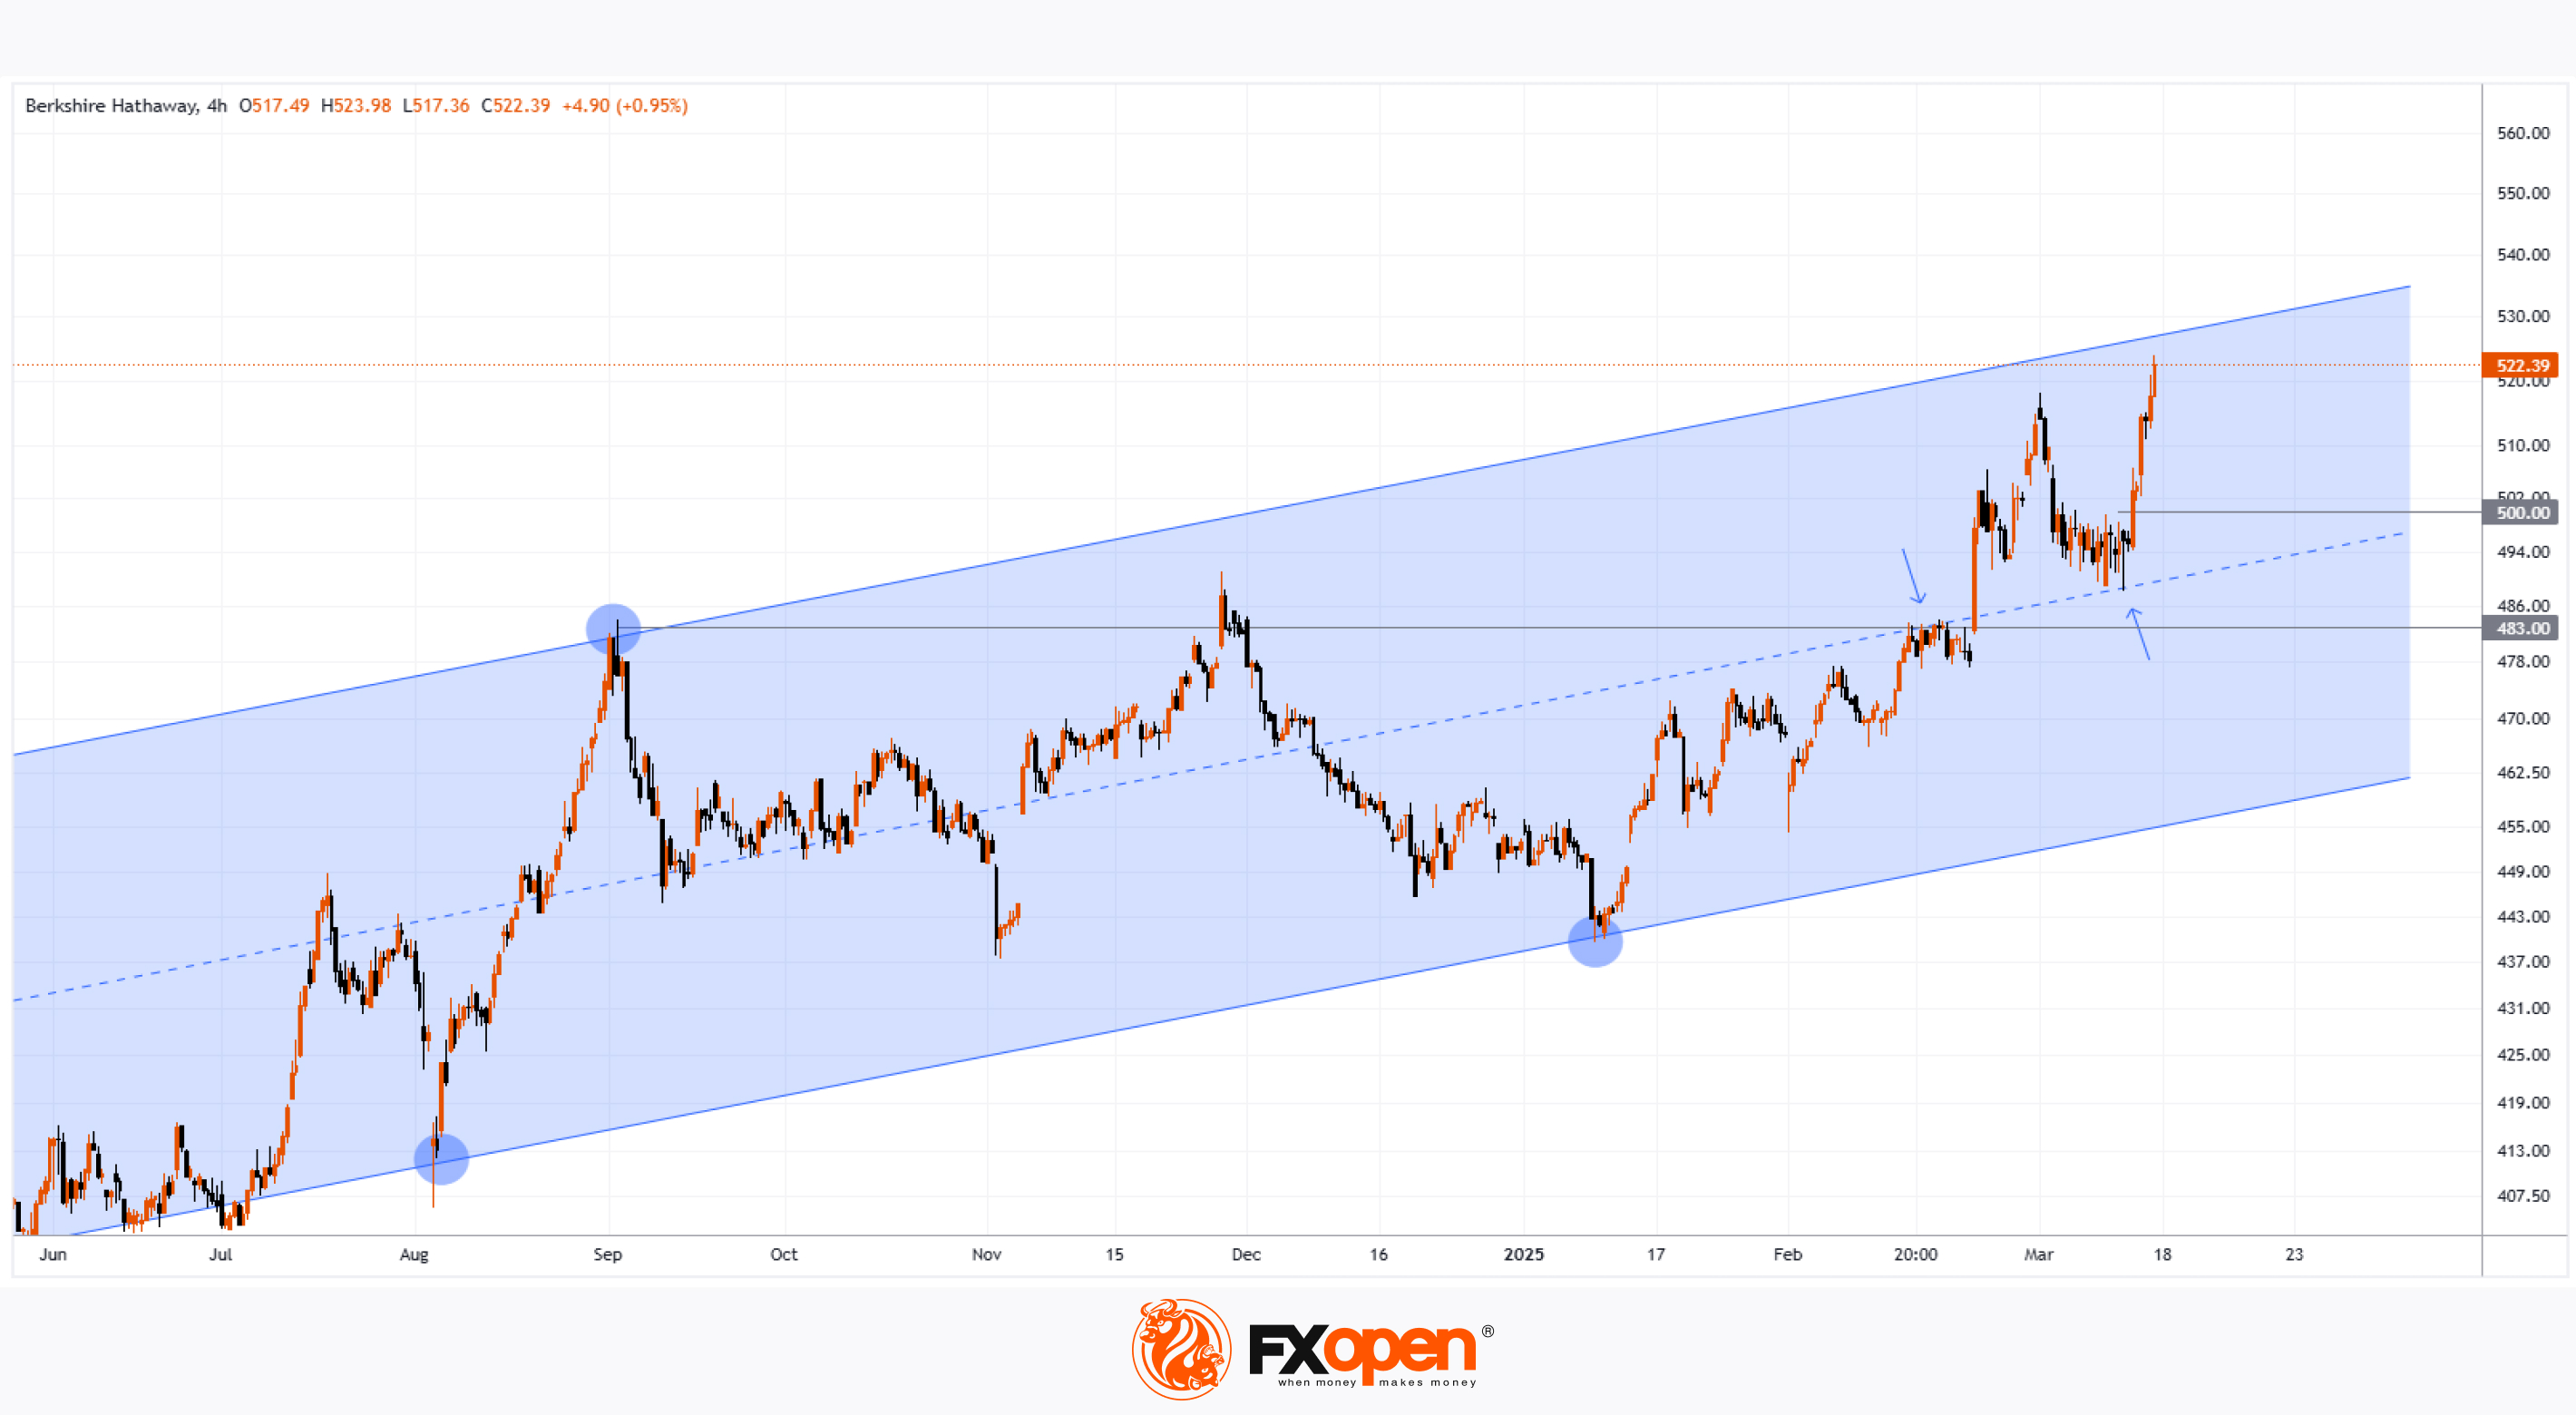
BRK.B Share Price Reaches All-Time High
As shown on the chart, the Class B shares of Berkshire Hathaway (BRK.B) have surpassed $520 for the first time in history. Notably, US stock indices remain below their record highs, further highlighting Warren Buffett’s investment acumen.
In late December, we noted that:
→ Berkshire Hathaway (BRK.B) had significantly reduced its position in Apple (AAPL) and refrained from making new purchases.
→ This suggested that Warren Buffett believed US stocks were overvalued and that a market correction was likely.
Once again, Buffett has been proven right. The Telegraph reports that the legendary investor correctly anticipated that Donald Trump would send Wall Street tumbling.
Additionally, Berkshire Hathaway’s latest earnings report, released yesterday, revealed that the company has been investing in the Japanese stock market—likely contributing to the optimism surrounding BRK.B shares.
Technical Analysis of BRK.B Shares
Key points for constructing the upward price channel are marked in blue, with:
→ The median line shifting from resistance to support (as indicated by arrows).
→ The price approaching the upper boundary of the channel, which could act as resistance.
→ The price action following the breakout above the psychological $500 level displaying strong bullish confidence.
Given these factors, if BRK.B shares enter a correction phase after the sharp rally (potentially reversing from the upper channel boundary), the $500 level is likely to act as support.
Another key support level is $483, which served as resistance in 2024 but has yet to be tested following the bullish breakout.
Trade global index CFDs with zero commission and tight spreads. Open your FXOpen account now or learn more about trading index CFDs with FXOpen.
CFDs are complex instruments and come with a high risk of losing your money.
This article represents the opinion of the Companies operating under the FXOpen brand only. It is not to be construed as an offer, solicitation, or recommendation with respect to products and services provided by the Companies operating under the FXOpen brand, nor is it to be considered financial advice.
BRK.B Share Price Reaches All-Time High
As shown on the chart, the Class B shares of Berkshire Hathaway (BRK.B) have surpassed $520 for the first time in history. Notably, US stock indices remain below their record highs, further highlighting Warren Buffett’s investment acumen.
In late December, we noted that:
→ Berkshire Hathaway (BRK.B) had significantly reduced its position in Apple (AAPL) and refrained from making new purchases.
→ This suggested that Warren Buffett believed US stocks were overvalued and that a market correction was likely.
Once again, Buffett has been proven right. The Telegraph reports that the legendary investor correctly anticipated that Donald Trump would send Wall Street tumbling.
Additionally, Berkshire Hathaway’s latest earnings report, released yesterday, revealed that the company has been investing in the Japanese stock market—likely contributing to the optimism surrounding BRK.B shares.
Technical Analysis of BRK.B Shares
Key points for constructing the upward price channel are marked in blue, with:
→ The median line shifting from resistance to support (as indicated by arrows).
→ The price approaching the upper boundary of the channel, which could act as resistance.
→ The price action following the breakout above the psychological $500 level displaying strong bullish confidence.
Given these factors, if BRK.B shares enter a correction phase after the sharp rally (potentially reversing from the upper channel boundary), the $500 level is likely to act as support.
Another key support level is $483, which served as resistance in 2024 but has yet to be tested following the bullish breakout.
Trade global index CFDs with zero commission and tight spreads. Open your FXOpen account now or learn more about trading index CFDs with FXOpen.
CFDs are complex instruments and come with a high risk of losing your money.
This article represents the opinion of the Companies operating under the FXOpen brand only. It is not to be construed as an offer, solicitation, or recommendation with respect to products and services provided by the Companies operating under the FXOpen brand, nor is it to be considered financial advice.
👍2
#forextrading #tradingtips #MarketUpdates #MarketNews
NZD/USD Analysis: Exchange Rate at 2025 High
As shown on the NZD/USD chart today, the exchange rate is around 0.58250—the highest level for the Kiwi against the US dollar since December 2024.
NZD strength is supported by optimism about China's economy, a key trading partner for New Zealand. The Hang Seng Index (Hong Kong 50 on FXOpen) is near three-year highs, driven by:
→ Optimism surrounding AI development in China, including models from DeepSeek and Alibaba.
→ Government stimulus measures boosting the Chinese economy.
Meanwhile, traders are assessing the USD's outlook in light of the Trump administration's trade tariff policies.
Technical Analysis of NZD/USD
The recent rally accelerated after bulls broke through the downward trendline (shown in orange). However, bears may expect a correction due to three key factors:
→ The price is near the 0.58000 level, which previously acted as support (as indicated by arrows). It may now serve as resistance, limiting further gains.
→ The RSI indicator is in overbought territory, unsurprising given the rally's pace over the past week.
→ The price is near the upper boundary of the ascending channel (in place since early 2025), which could also act as resistance to further upside.
Trade over 50 forex markets 24 hours a day with FXOpen. Take advantage of low commissions, deep liquidity, and spreads from 0.0 pips. Open your FXOpen account now or learn more about trading forex with FXOpen.
CFDs are complex instruments and come with a high risk of losing your money.
This article represents the opinion of the Companies operating under the FXOpen brand only. It is not to be construed as an offer, solicitation, or recommendation with respect to products and services provided by the Companies operating under the FXOpen brand, nor is it to be considered financial advice.
NZD/USD Analysis: Exchange Rate at 2025 High
As shown on the NZD/USD chart today, the exchange rate is around 0.58250—the highest level for the Kiwi against the US dollar since December 2024.
NZD strength is supported by optimism about China's economy, a key trading partner for New Zealand. The Hang Seng Index (Hong Kong 50 on FXOpen) is near three-year highs, driven by:
→ Optimism surrounding AI development in China, including models from DeepSeek and Alibaba.
→ Government stimulus measures boosting the Chinese economy.
Meanwhile, traders are assessing the USD's outlook in light of the Trump administration's trade tariff policies.
Technical Analysis of NZD/USD
The recent rally accelerated after bulls broke through the downward trendline (shown in orange). However, bears may expect a correction due to three key factors:
→ The price is near the 0.58000 level, which previously acted as support (as indicated by arrows). It may now serve as resistance, limiting further gains.
→ The RSI indicator is in overbought territory, unsurprising given the rally's pace over the past week.
→ The price is near the upper boundary of the ascending channel (in place since early 2025), which could also act as resistance to further upside.
Trade over 50 forex markets 24 hours a day with FXOpen. Take advantage of low commissions, deep liquidity, and spreads from 0.0 pips. Open your FXOpen account now or learn more about trading forex with FXOpen.
CFDs are complex instruments and come with a high risk of losing your money.
This article represents the opinion of the Companies operating under the FXOpen brand only. It is not to be construed as an offer, solicitation, or recommendation with respect to products and services provided by the Companies operating under the FXOpen brand, nor is it to be considered financial advice.
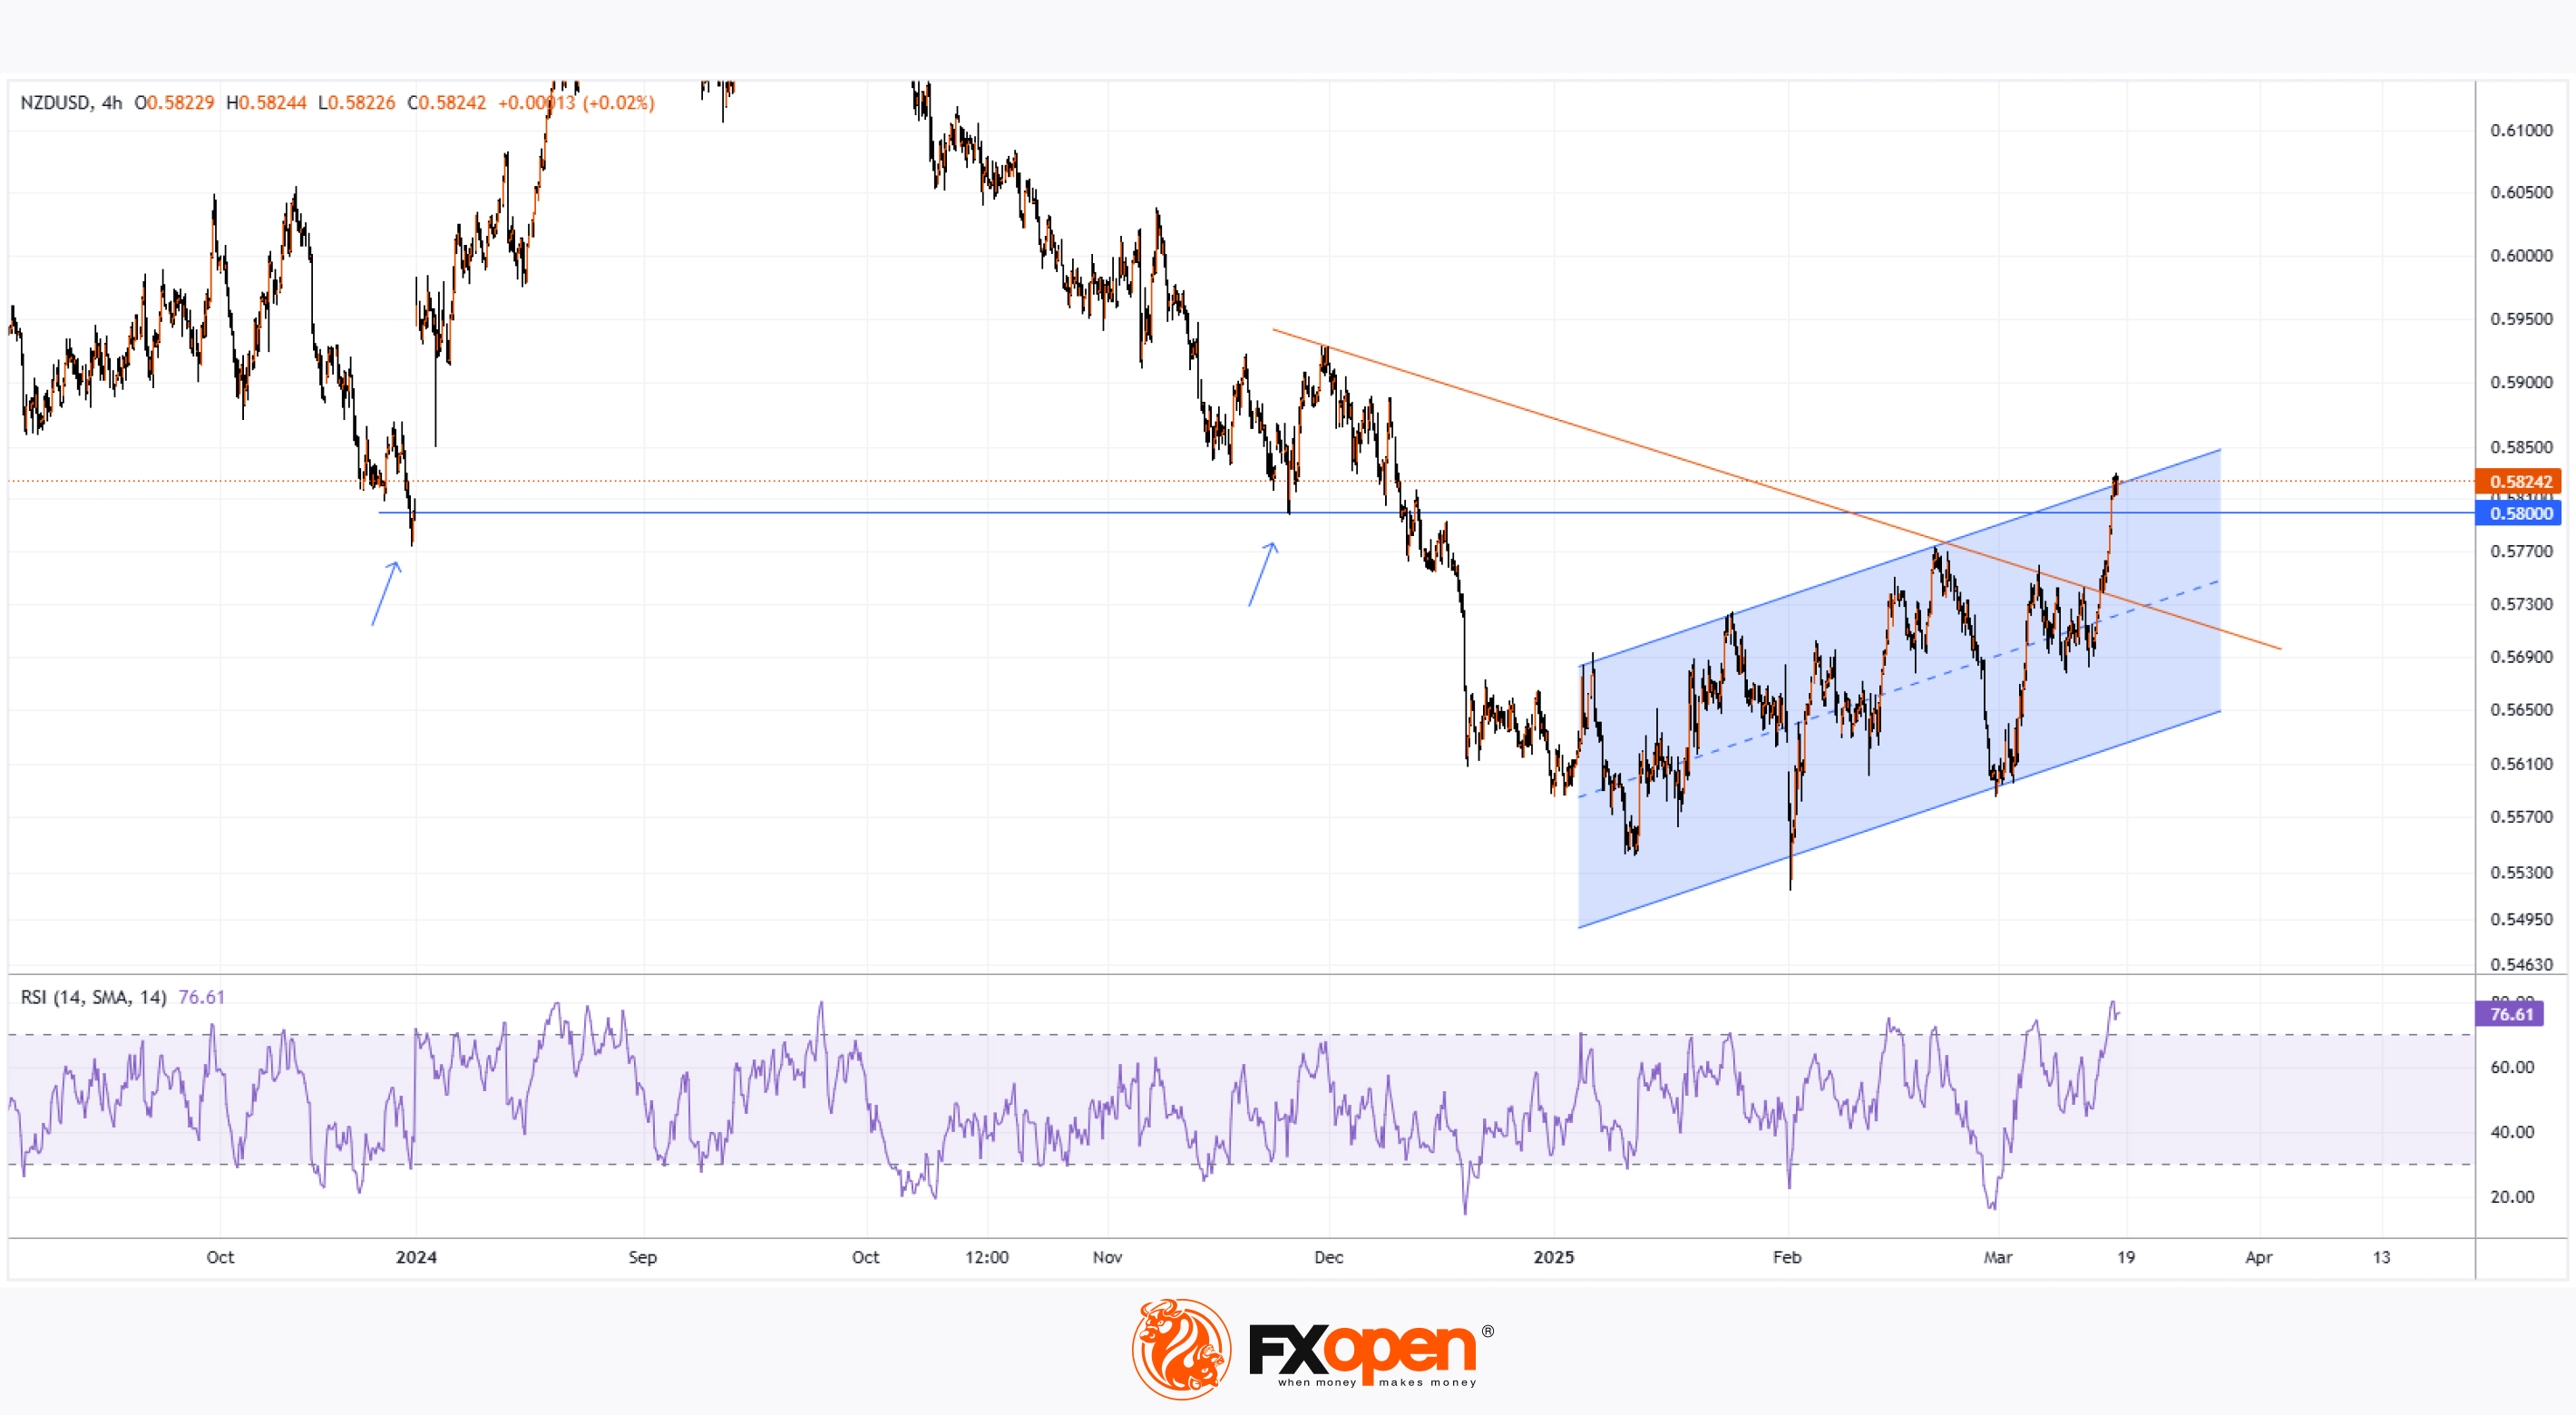
👍3
#GBPUSD #forextrading #tradingtips #marketanalysis
GBP/USD Analysis: Pair Fails to Hold Above Psychological Level
As shown in today’s GBP/USD chart, the pair failed to maintain its position above the psychological level of 1.3000 USD per pound, where it had reached its highest point since early 2025. The decline followed recent central bank decisions and statements, with both the Bank of England and the Federal Reserve keeping interest rates unchanged.
On one side, the Bank of England:
→ Warned of inflation risks, partly driven by external factors such as US trade tariffs.
→ Indicated a potential rate cut in the coming months.
On the other hand, the US dollar strengthened on Thursday after the Federal Reserve signalled reluctance to rush further rate cuts this year, despite uncertainties surrounding US tariffs.
These statements highlighted the challenges market participants face in assessing the risks posed by tariffs on global trade.
Technical Analysis of GBP/USD
In March, the pound followed an upward trend against the US dollar, forming an ascending channel (marked in blue). However, once the price moved above the key 1.3000 level, the upper boundary of the channel appeared out of reach—possibly signalling weakening buying momentum.
As a result, the price broke below the lower boundary of the channel, which has now shown signs of resistance (indicated by an arrow). If bearish pressure persists, the price could fall towards the dotted trendline below the channel, at a distance equal to its height. Additionally, a test of the previous local low around 1.2911 cannot be ruled out.
Trade over 50 forex markets 24 hours a day with FXOpen. Take advantage of low commissions, deep liquidity, and spreads from 0.0 pips. Open your FXOpen account now or learn more about trading forex with FXOpen.
CFDs are complex instruments and come with a high risk of losing your money.
This article represents the opinion of the Companies operating under the FXOpen brand only. It is not to be construed as an offer, solicitation, or recommendation with respect to products and services provided by the Companies operating under the FXOpen brand, nor is it to be considered financial advice.
GBP/USD Analysis: Pair Fails to Hold Above Psychological Level
As shown in today’s GBP/USD chart, the pair failed to maintain its position above the psychological level of 1.3000 USD per pound, where it had reached its highest point since early 2025. The decline followed recent central bank decisions and statements, with both the Bank of England and the Federal Reserve keeping interest rates unchanged.
On one side, the Bank of England:
→ Warned of inflation risks, partly driven by external factors such as US trade tariffs.
→ Indicated a potential rate cut in the coming months.
On the other hand, the US dollar strengthened on Thursday after the Federal Reserve signalled reluctance to rush further rate cuts this year, despite uncertainties surrounding US tariffs.
These statements highlighted the challenges market participants face in assessing the risks posed by tariffs on global trade.
Technical Analysis of GBP/USD
In March, the pound followed an upward trend against the US dollar, forming an ascending channel (marked in blue). However, once the price moved above the key 1.3000 level, the upper boundary of the channel appeared out of reach—possibly signalling weakening buying momentum.
As a result, the price broke below the lower boundary of the channel, which has now shown signs of resistance (indicated by an arrow). If bearish pressure persists, the price could fall towards the dotted trendline below the channel, at a distance equal to its height. Additionally, a test of the previous local low around 1.2911 cannot be ruled out.
Trade over 50 forex markets 24 hours a day with FXOpen. Take advantage of low commissions, deep liquidity, and spreads from 0.0 pips. Open your FXOpen account now or learn more about trading forex with FXOpen.
CFDs are complex instruments and come with a high risk of losing your money.
This article represents the opinion of the Companies operating under the FXOpen brand only. It is not to be construed as an offer, solicitation, or recommendation with respect to products and services provided by the Companies operating under the FXOpen brand, nor is it to be considered financial advice.

👍2