
#marketanalysis #bitcoin #BTCUSD #crypto
BTC/USD Analysis: Bulls Preparing New Assault on 37,500 Level?
The news backdrop for the cryptocurrency market continues to focus on the approval of a Bitcoin ETF, which already seems inevitable. At the same time, some of the funds that filed applications with the SEC have already even shared the amount of commissions that will apply to clients who wish to invest in bitcoin through ETFs. Thus, Ark and 21Shares plan to charge a commission of 0.8% for a spot bitcoin ETF. If the SEC approves all applications at once, the size of the commissions will influence the choice of investors.
That is, the funds are already competing, although the applications have not yet been approved.
Meanwhile, the SEC itself has once again demonstrated its critical attitude towards the cryptocurrency industry, accusing the Kraken exchange of operating as an unregistered securities exchange. But this has a small impact on the sentiment of cryptocurrency market participants, which continues to remain more positive.
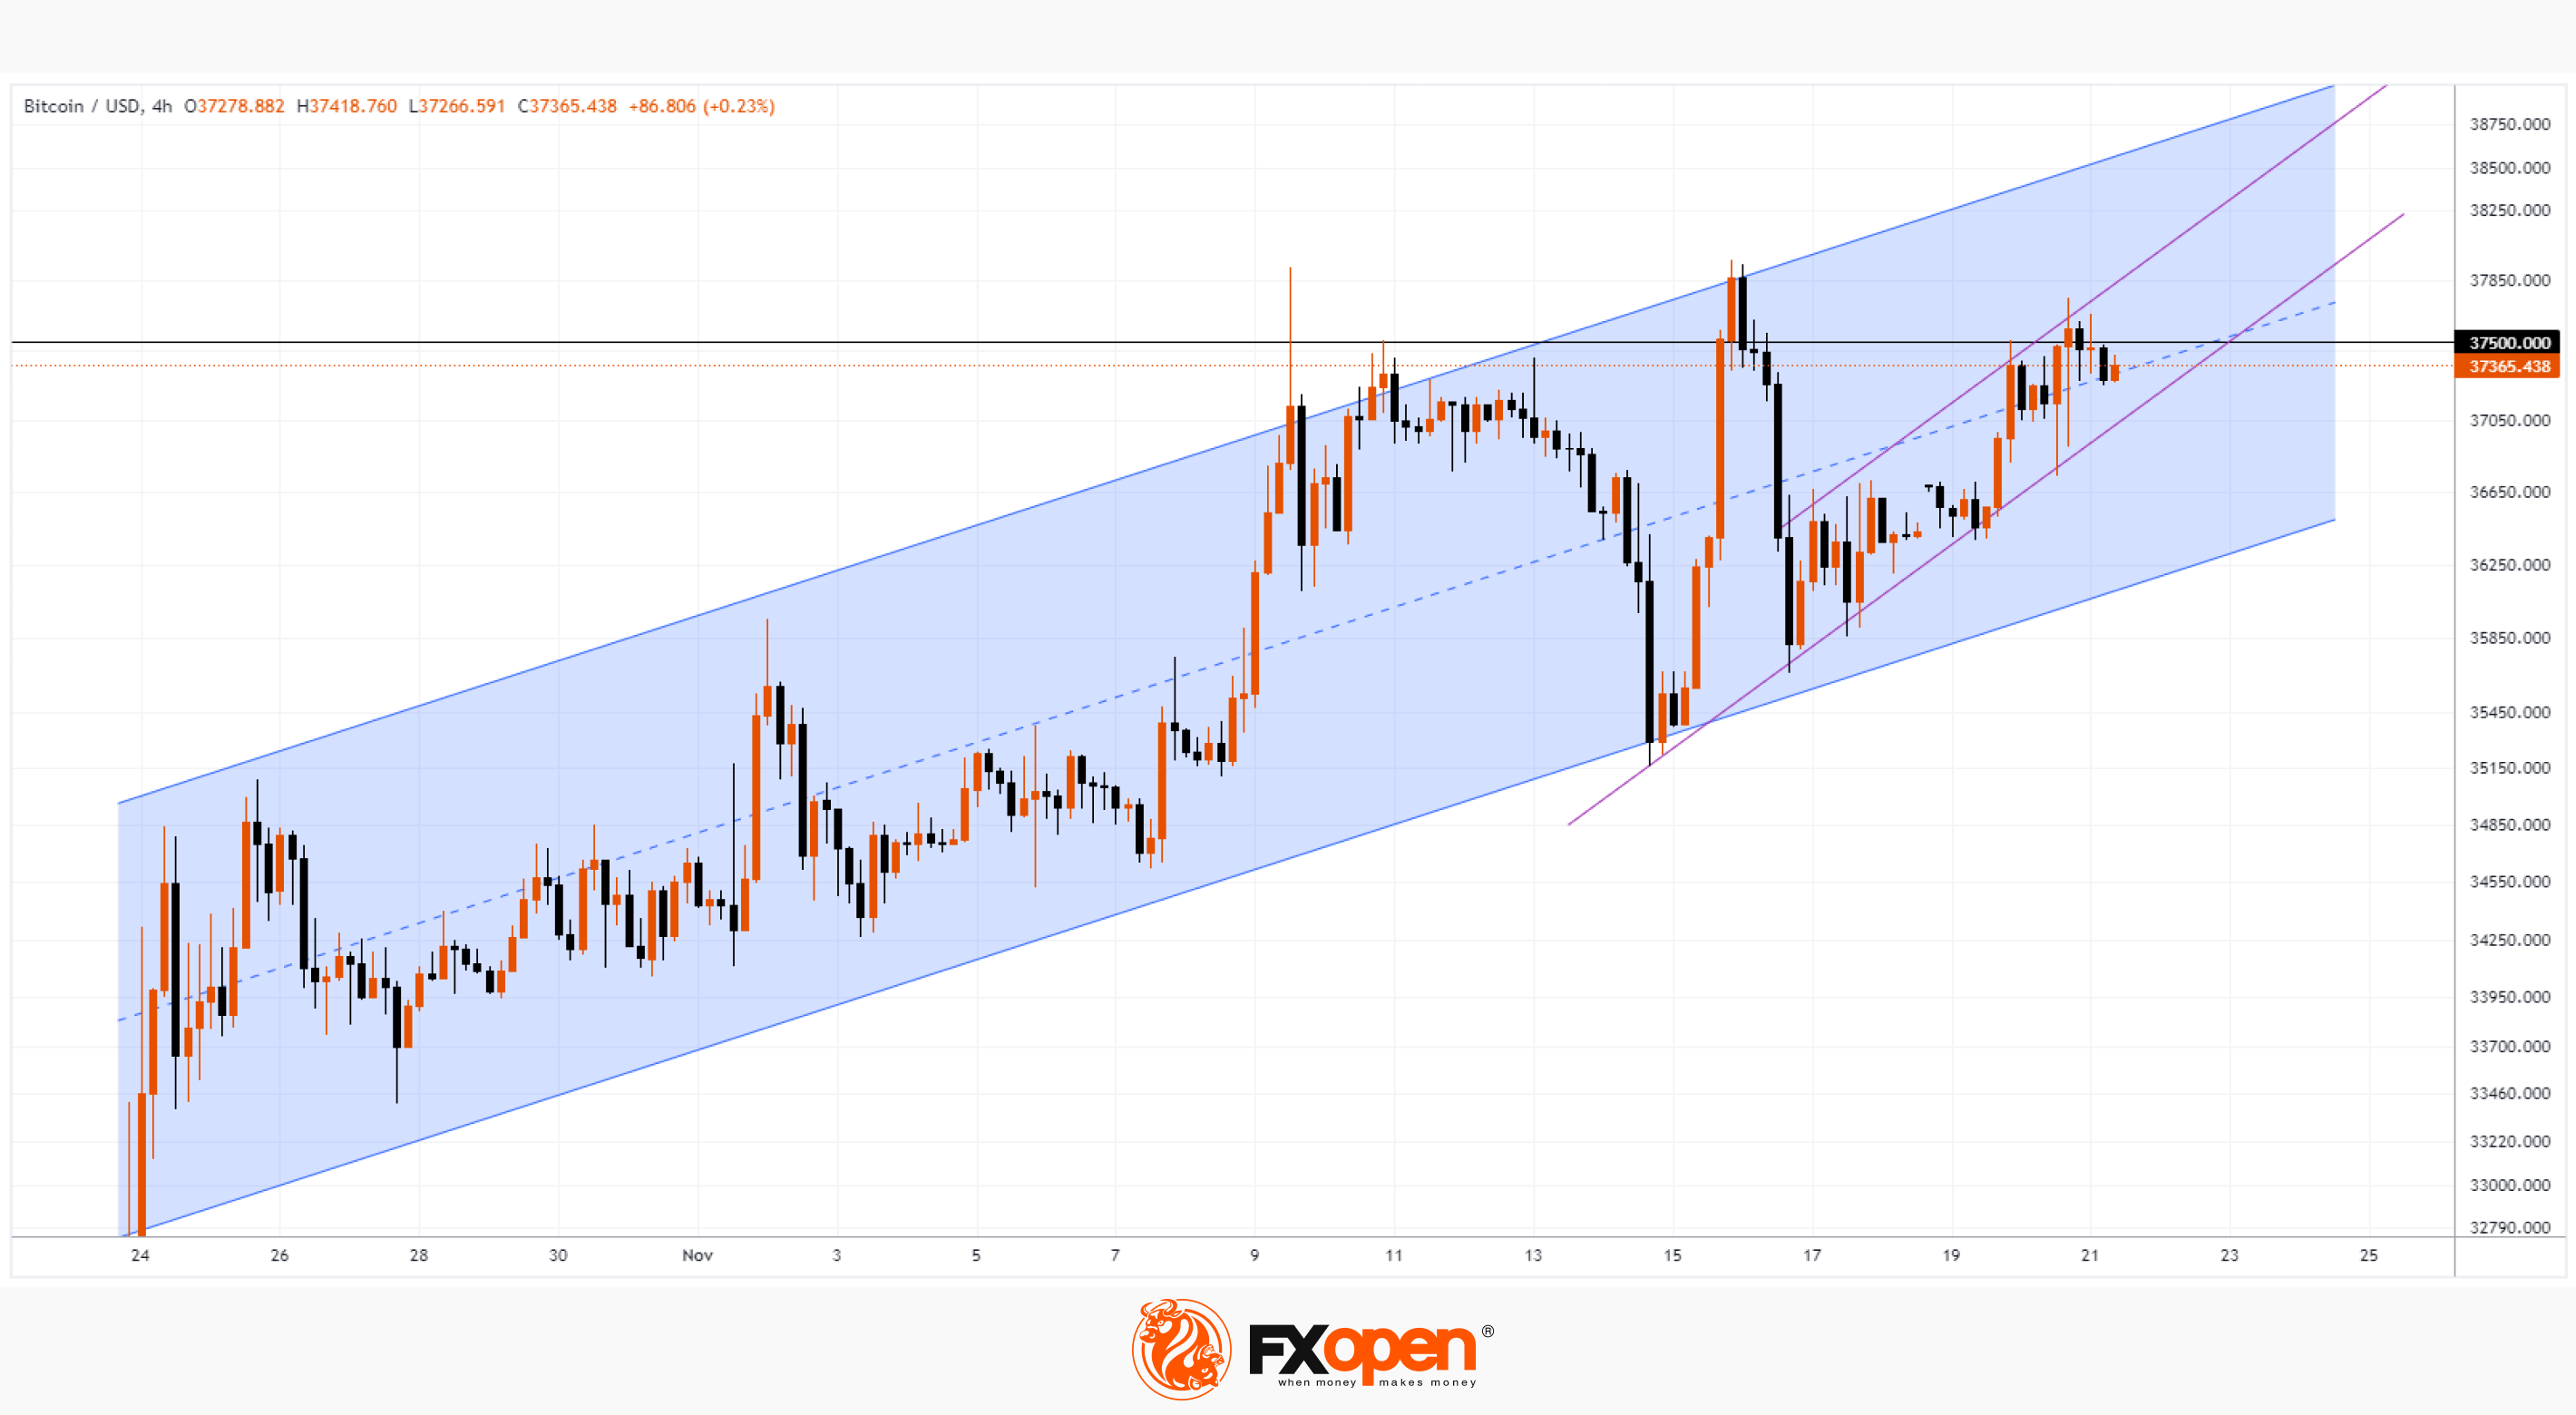
The BTC/USD chart shows that the price of Bitcoin has risen again to the key level of USD 37,500 per coin. We wrote about how bears are aggressively defending this level in the Bitcoin price analysis for November 17th.
As of November 21:
→ Bitcoin price continues to fluctuate in an ascending channel (shown in blue);
→ an increase in the degree of optimism among market participants confirms the rally of recent days (shown by purple lines);
→ this rally encountered resistance (expected) around the level of 37,500.
The bulls are not giving up, if they manage to break through the 37,500 level (for example, against the backdrop of some news confirming the imminent approval of applications for a bitcoin ETF), then it may begin to act as support on the way for the price to the psychological mark of 40k.
To benefit from the rise and fall in value of bitcoin and other cryptocurrencies, consider enlisting the services of a trusted broker like FXOpen.
#marketanalysis #MarketNews #crypto
AVAX Analysis: Market in Vulnerable Position
A chart from the FXOpen Ticktrader platform shows that the AVAX/USD cryptocurrency rate showed strong growth: in the month from October 20 to November 20, the price increased by more than 150%.
This happened against the backdrop of:
→ general positivity in the cryptocurrency market associated with the expectation of approval of Bitcoin ETFs by the SEC regulator;
→ the news about investments in the Avalance ecosystem, the native token of which is AVAX.
However, the chart also shows important signs that the market may be vulnerable to a pullback. Namely:
→ rapid growth stalled in the period from November 16 to 19. Perhaps too many investors wanted to join a pronounced trend, but did so too late: these are prerequisites typical for a correction to occur;
→ the price has exceeded the level of the previous high of the year, but there are long upper shadows on the candles, and the closes are below the high level - these are signs of a false breakout.
On November 22, the price bounced up from the broken line of the descending channel, which can be regarded as a bullish signal. But the described signs of weakness look too convincing, forcing us to consider the return of the AVAX price inside the downward channel as a realistic option.
To benefit from the rise and fall of cryptocurrency prices, consider enlisting the services of a trusted broker like FXOpen.
CFDs are complex instruments and come with a high risk of losing your money.
This article represents the opinion of the Companies operating under the FXOpen brand only. It is not to be construed as an offer, solicitation, or recommendation with respect to products and services provided by the Companies operating under the FXOpen brand, nor is it to be considered financial advice.
At FXOpen UK and FXOpen AU, Cryptocurrency CFDs are only available for trading by those clients categorised as Professional clients under FCA Rules and Professional clients under ASIC Rules, respectively. They are not available for trading by Retail clients.
#bitcoin #crypto #BTCUSD
Sharp Change in BTC/USD Price: Causes and Consequences
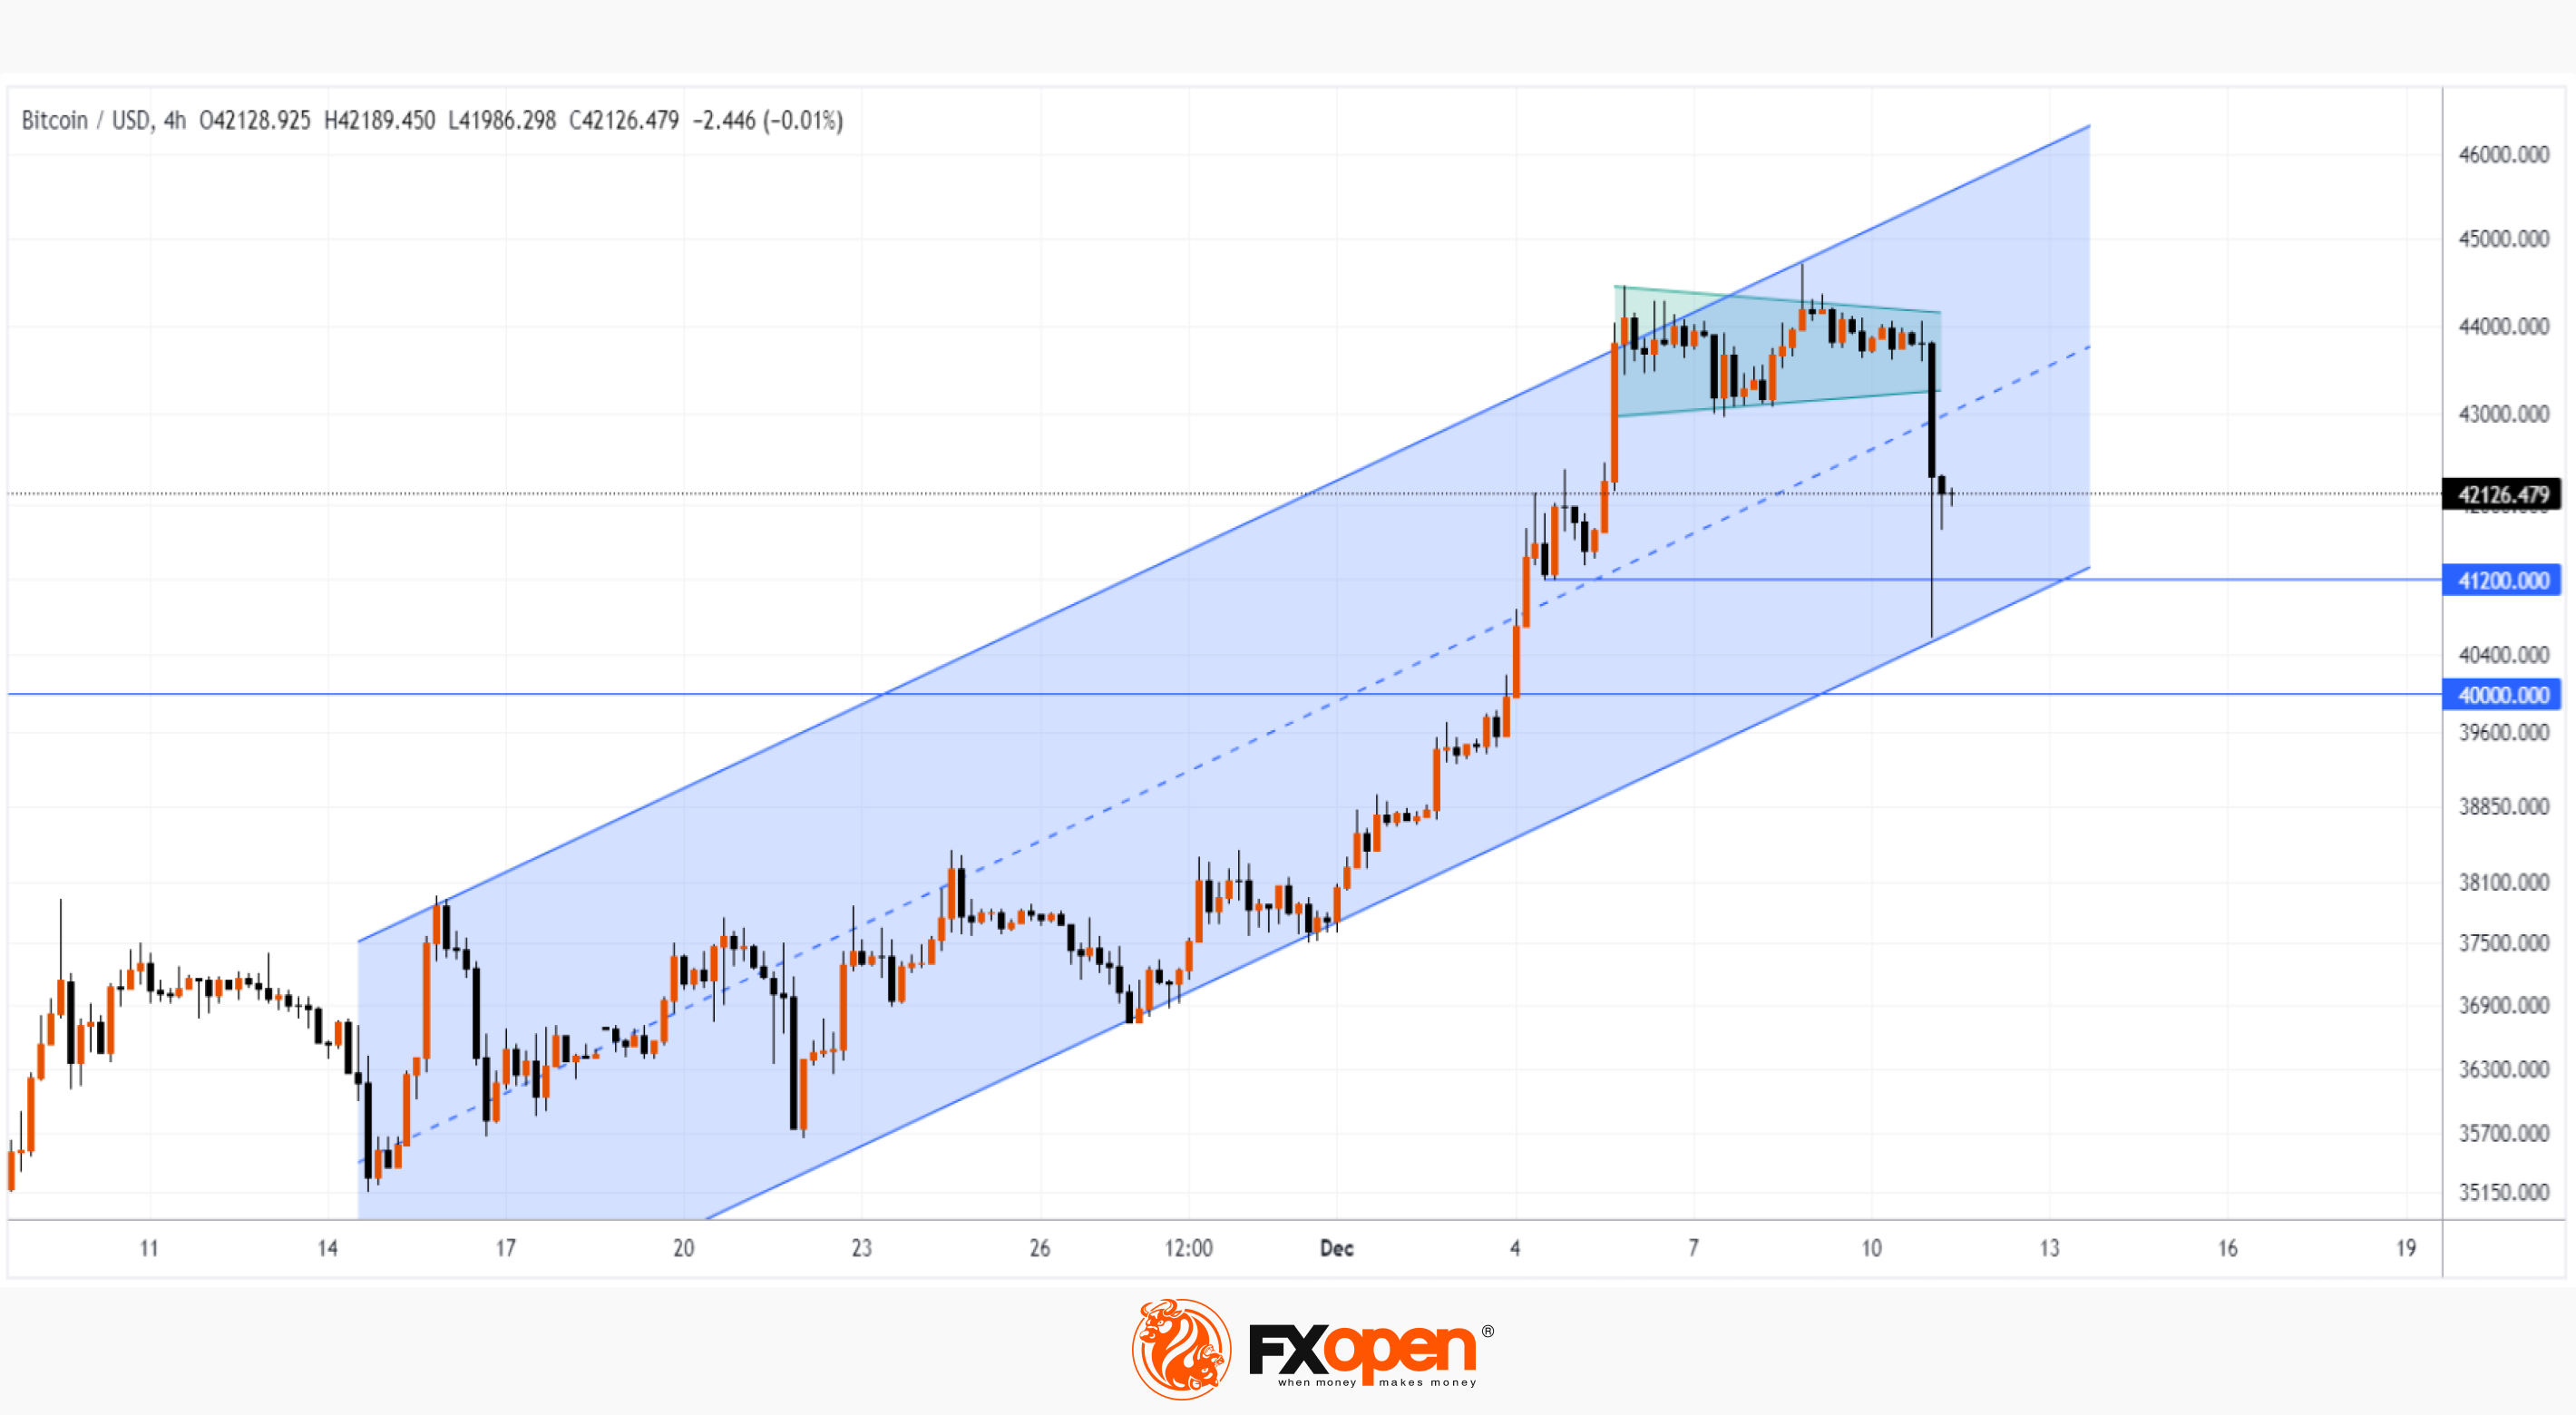
On Monday morning, the price of bitcoin fell sharply. As the chart shows, the BTC/USD rate fell below 42,000 on Monday during the Asian session. According to Coinglass, the decline resulted in about $400 million worth of positions being liquidated by about 100,000 traders on cryptocurrency exchanges. So far, the price has found support around the 41,200 level, where the lower border of the ascending channel lies (shown in blue).
What are the reasons for such a sharp decline? From a fundamental point of view, there are no triggers with the media associated with, for example, statements by officials. What then?
First of all, the idea comes with low liquidity in the financial markets at the beginning of Monday in the Asian session. A recent example is the gold market, when the price of the metal jumped at the opening of trading to $2,130, but then quickly fell to $2,060. By the way, we wrote on Tuesday that the bears may try to push the price of gold below the psychological level of $2,000. The scenario is still coming true.
What will happen to bitcoin? The graph shows that:
→ the price was within consolidation for some time (shown in green);
→ On December 8, the year’s maximum was updated, which in fact turned out to be a trap, a false bullish breakout of the consolidation zone (a bearish sign);
→ this morning, there was a bearish breakdown of the consolidation zone.
After 8 weeks of gains, we can assume that the market is overbought and today's decline is an overdue correction after a rally of more than 70% from the September lows.
But corrections, as a rule, are characterized by smoother declines with decreasing volumes. And if we analyze the nature of the decline on Monday morning, it looks more like an impulse.
Of course, given the high leverage that is applied in the poorly regulated crypto market, it is reasonable to assume that the correction took this form due to the cascading triggering of buyers’ stop losses. On the other hand, what if insiders are actively selling bitcoin, knowing that the coming week will bring a dose of negativity on the fundamental background?
One way or another, if the price of bitcoin reaches a psychological level, then analyzing the patterns on the chart will provide important information. It is possible that the price will break below the $40k level, and it will provoke an upward rebound — the nature of which will provide valuable material for reasoning about whether the current decline is an overdue correction or a bearish reversal.
To benefit from the rise and fall of cryptocurrency prices, consider enlisting the services of a trusted broker like FXOpen.
CFDs are complex instruments and come with a high risk of losing your money.
This article represents the opinion of the Companies operating under the FXOpen brand only. It is not to be construed as an offer, solicitation, or recommendation with respect to products and services provided by the Companies operating under the FXOpen brand, nor is it to be considered financial advice.
At FXOpen UK and FXOpen AU, Cryptocurrency CFDs are only available for trading by those clients categorised as Professional clients under FCA Rules and Professional clients under ASIC Rules, respectively. They are not available for trading by Retail clients.
👍1
#bitcoin #BTCUSD #btcprice #crypto
BTC/USD: News Reports Encourage Bulls to Attack the $44k Level
Optimism associated with the SEC regulator's approval of applications to launch BTC-ETF is the main driver of Bitcoin price growth.
Coindesk reports that representatives from BlackRock, Nasdaq and the Securities and Exchange Commission (SEC) met for the second time in a month to discuss rule changes required for the listing of an exchange-traded BTC-ETF.
And companies like Bitwise and Hashdex have already launched advertising campaigns to attract attention to the BTC-ETF — apparently demonstrating confidence that applications will be approved.
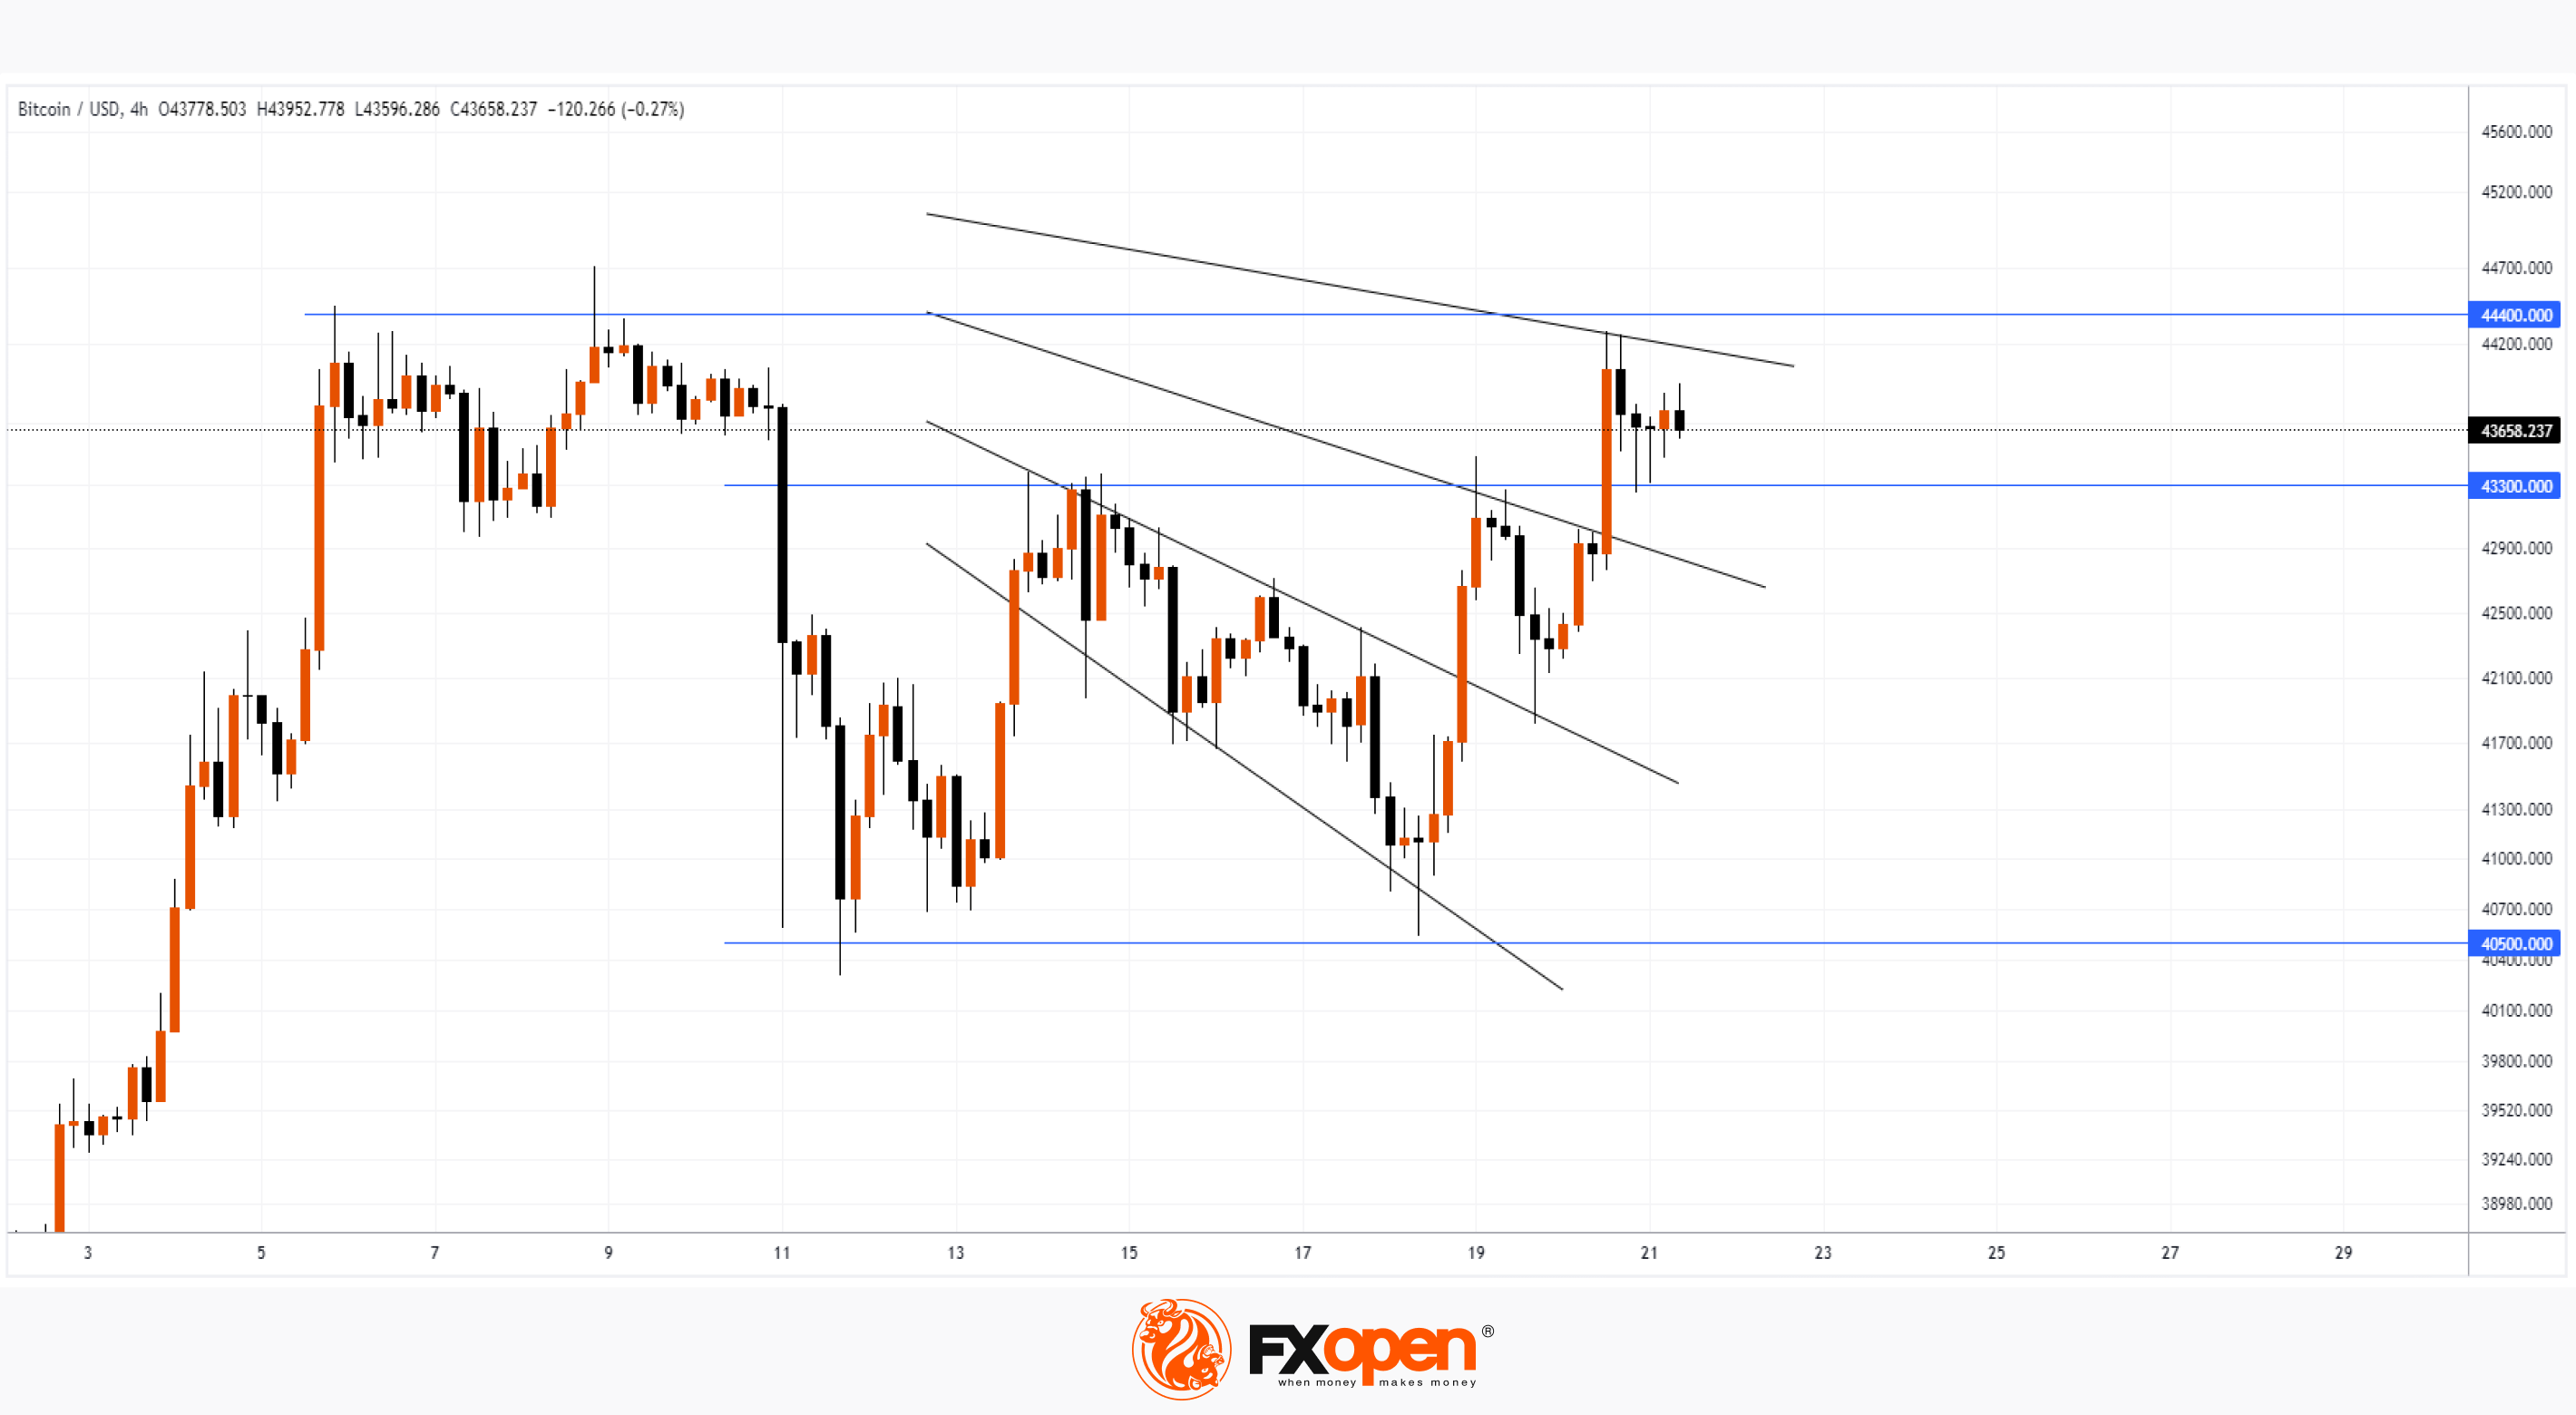
The graph shows that:
→ the price of BTC/USD has recovered after a strong fall on December 11 - this is a sign of the strength of demand in the market. The level of 40,500 served as a reliable support for the recovery, which was tested on November 18th.
→ On December 20, the bulls were able to overcome the level of 43,300, which provided resistance on December 13-14 and 19. This level is now showing signs of support.
→ There is an important obstacle in front of the bulls. It is formed from the $44k level and the upper black line, forming some structure similar to a Gann fan and having a noticeable impact on the price of Bitcoin this month.
The media is increasingly citing January 10 as a possible date by which the SEC's decision, believed to approve the launch of the ETF, will be published. It is possible that as we approach this date, the bulls will be able to overcome the $44k resistance.
To benefit from the rise and fall of cryptocurrency rates, consider enlisting the services of a trusted broker like FXOpen.
CFDs are complex instruments and come with a high risk of losing your money.
This article represents the opinion of the Companies operating under the FXOpen brand only. It is not to be construed as an offer, solicitation, or recommendation with respect to products and services provided by the Companies operating under the FXOpen brand, nor is it to be considered financial advice.
At FXOpen UK and FXOpen AU, Cryptocurrency CFDs are only available for trading by those clients categorised as Professional clients under FCA Rules and Professional clients under ASIC Rules, respectively. They are not available for trading by Retail clients.
#crypto #forextrading #ETH
ETH/USD Analysis: New Record of the Year
Today, the price of Ethereum exceeded the level of 2,440 per token, thereby setting a new high for 2023. It is noteworthy that the price of Bitcoin did not support the bullish sentiment, continuing to fluctuate around the USD 43,000 level for the fifth day.
What is the reason for the growth of ETH/USD from a fundamental point of view? There is no obvious trigger in the media, so we can only make assumptions:
→ market participants considered ETH an undervalued asset against the backdrop of the growth of Bitcoin and Solana;
→ perhaps buyers assume that after the expected approval of applications for the BTC ETF, the ETH ETF story will be next?
→ Santa's rally and the positive sentiment associated with it.
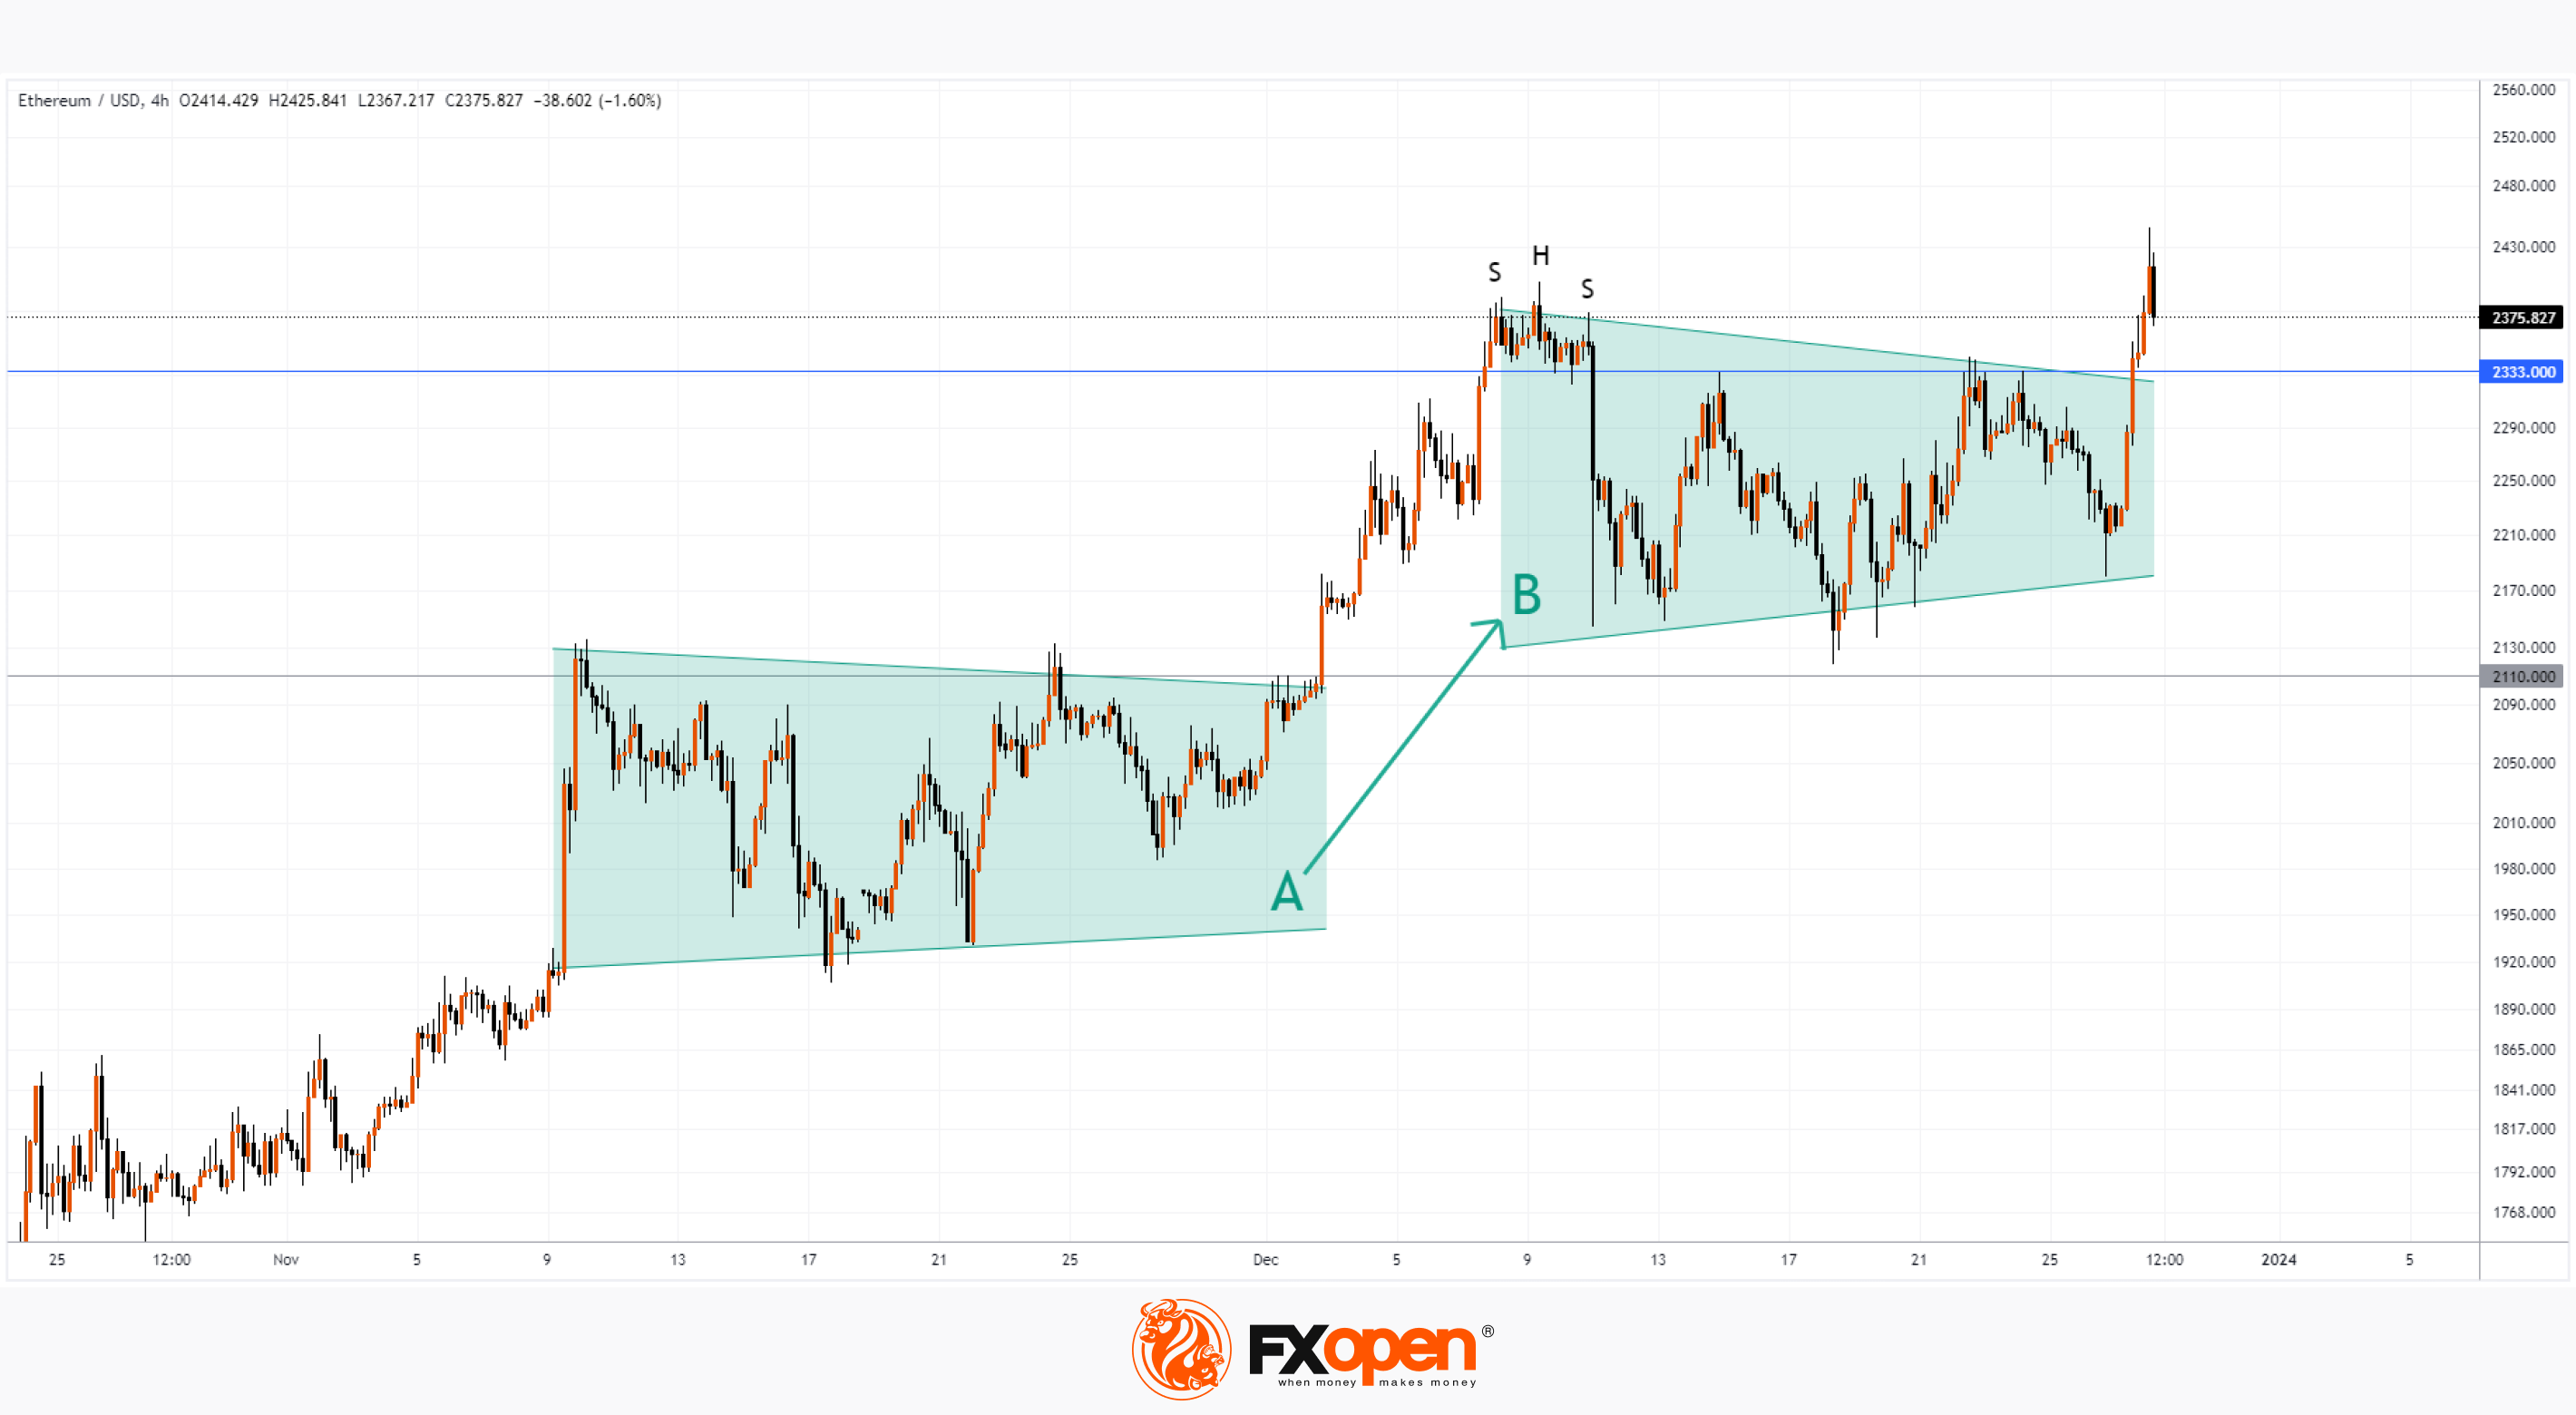
From a technical point of view, the price of ETH/USD moved up beyond the balance period “B”, where the forces of supply and demand were balanced. The bullish momentum was maintained, with upward momentum above the 2,333 level attracting followers and forcing short sellers to take losses. According to on-chain analytical platforms, in just one hour, at the peak of growth, USD 14 million of bearish positions were liquidated on cryptocurrency exchanges—there was a short squeeze in the market to some extent.
What's next? Will the price be able to form a new balance period “C”, which will be above the period “B” (similar to the trend “A” → “B”)?
This morning, on the 4-hour chart, a bearish engulfing pattern is forming, which may result in a false breakout of the previous top on December 9, when the SHS pattern was formed — this is not a very optimistic development of events.
However, as long as the price remains above the level of 2,333, there is reason to believe that the market is on the way to forming a balance “C”, which is above the balance “B” - similar to what happened with the level of 2,110. A bearish breakdown of the level of 2,333 and a return to the zone balance “B” will mean an alarming signal: buyers have lost strength, and therefore the next breakdown of balance “B” may occur in a downward direction.
To benefit from the rise and fall of cryptocurrency prices, consider enlisting the services of a trusted broker like FXOpen.
CFDs are complex instruments and come with a high risk of losing your money.
At FXOpen UK and FXOpen AU, Cryptocurrency CFDs are only available for trading by those clients categorised as Professional clients under FCA Rules and Professional clients under ASIC Rules, respectively. They are not available for trading by Retail clients.
This article represents the opinion of the Companies operating under the FXOpen brand only. It is not to be construed as an offer, solicitation, or recommendation with respect to products and services provided by the Companies operating under the FXOpen brand, nor is it to be considered financial advice.
#marketanalysis #bitcoin #crypto #BTCUSD
Bitcoin Price Starts the Year with Bullish Sentiment
The first Bitcoin block, also known as the genesis block, was mined on January 3, 2009 at 18:15:05 UTC. 15 years have passed and the value of Bitcoin is in the tens of thousands of US dollars.
In the first days of 2023, bitcoin was worth about $16,600 — and, as it turned out, this was the minimum. After all, then the BTC/USD rate went up and by the end of 2023 reached $44,000. The change was more than +150%!
On January 3, 2024, the price was already above $45,000, giving hope to the bulls that 2024 will be no less successful. If in the coming 2024 BTC/USD repeats the progress of last year, this will mean exceeding the psychological mark of USD 100,000 per coin!
What will influence the price of Bitcoin in the first half of the year?
→ Expected approval of applications for BTC ETF by the SEC regulator. On the one hand, approval will allow a wide range of people to simply invest in Bitcoin, which should increase demand. On the other hand, waiting for approval takes too long. And if it happens, it is possible that a price reduction may occur according to the “buy rumours, sell facts” principle.
→ Approximately, halving will occur in April. This will happen after the 210,000th block is mined. After the halving, miners' block rewards will be reduced from 6.25 BTC to 3.125 BTC. It is believed that this should reduce the supply of coins on the market — accordingly, the price of BTC/USD may rise (and history suggests this).
→ Fed rate cut. Easing monetary policy can serve as a driver for the growth of investment in risky assets, which is Bitcoin.
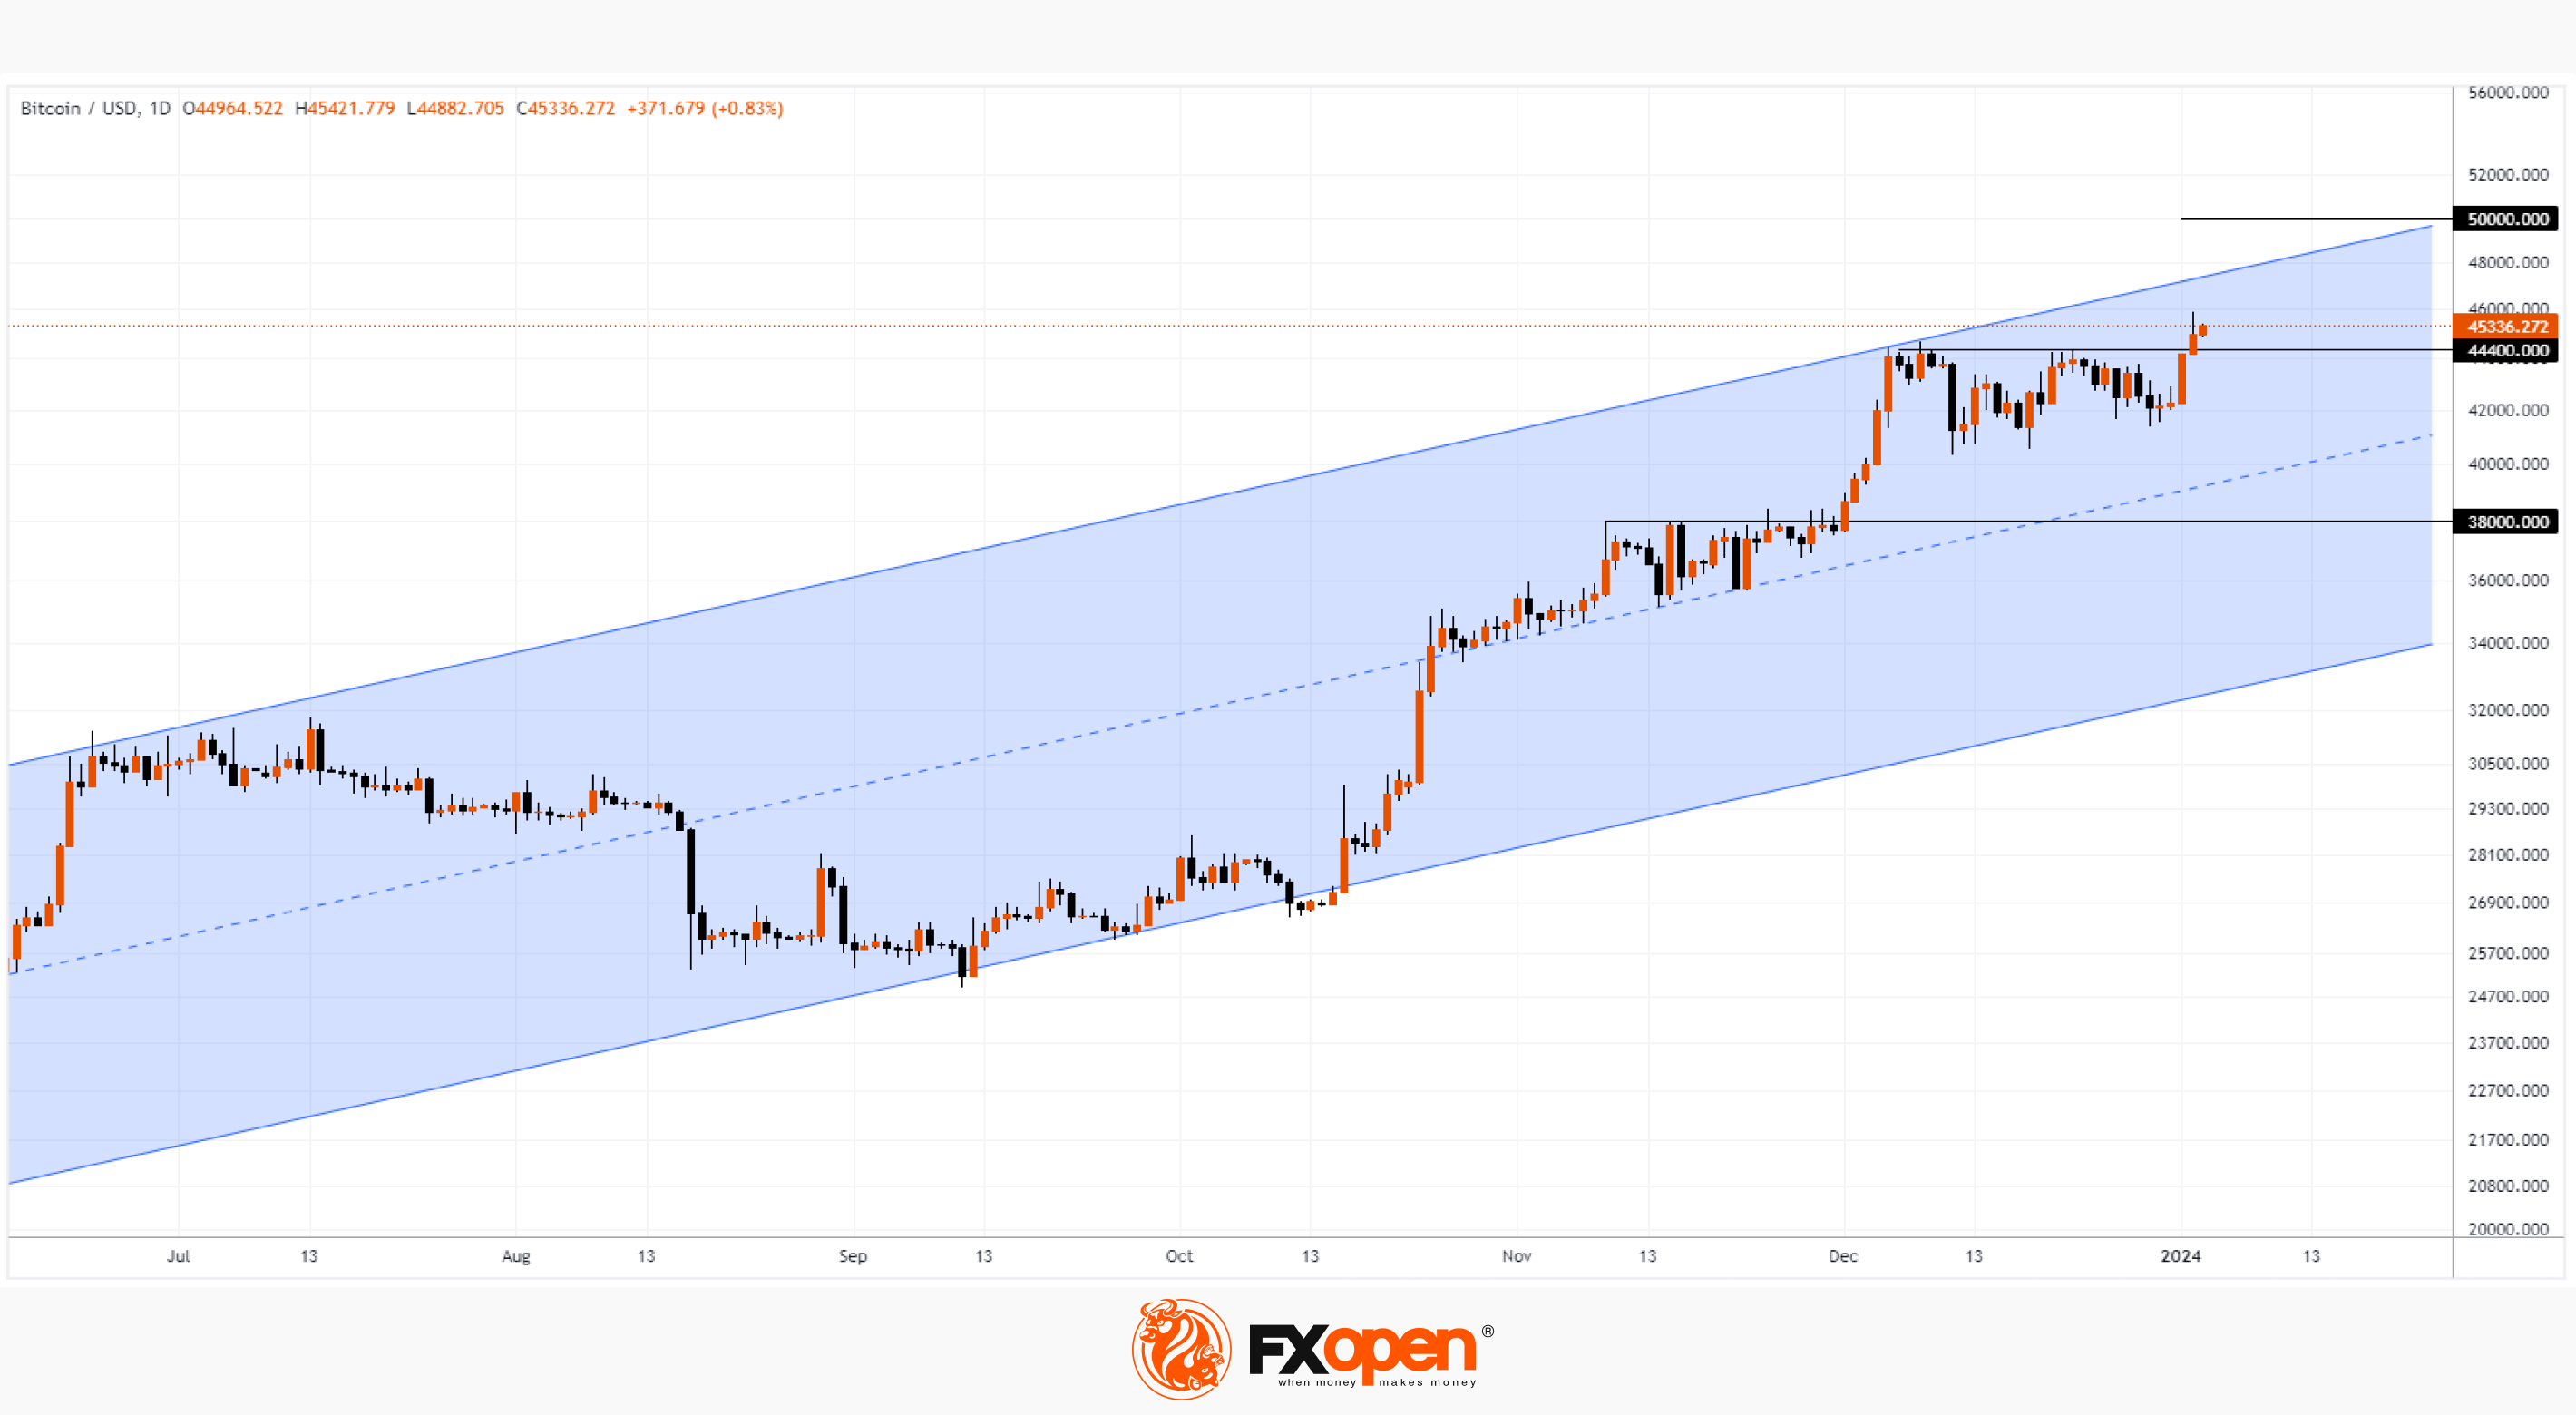
The BTC/USD daily chart shows that:
→ the price of Bitcoin is within the ascending channel;
→ the price broke through the resistance level of $44,400 per coin.
In this case, a comparison with the recent breakdown of the level of 38,000 is appropriate. If the price acts in the same bullish manner, it may consolidate above 44,400, without even testing this former resistance level.
If the demand for Bitcoin does not exhaust itself, the price may reach the upper boundary of the channel and drift towards the psychological mark of $50k. A return below the $44,000 level will mean a big setback for the bulls and will give reason to consider bearish scenarios, up to a breakdown of the current channel.
To benefit from the rise and fall of crypto prices, consider enlisting the services of a trusted broker like FXOpen.
CFDs are complex instruments and come with a high risk of losing your money.
This article represents the opinion of the Companies operating under the FXOpen brand only. It is not to be construed as an offer, solicitation, or recommendation with respect to products and services provided by the Companies operating under the FXOpen brand, nor is it to be considered financial advice.
At FXOpen UK and FXOpen AU, Cryptocurrency CFDs are only available for trading by those clients categorised as Professional clients under FCA Rules and Professional clients under ASIC Rules, respectively. They are not available for trading by Retail clients.
#MarketNews #bitcoin #crypto #cryptonews
Finally! The SEC Approves all 11 Applications for Bitcoin ETFs
The following ETFs can start operating today:
- Blackrock's iShares Bitcoin Trust (IBIT)
- ARK 21Shares Bitcoin ETF (ARKB)
- WisdomTree Bitcoin Fund (BTCW)
- Invesco Galaxy Bitcoin ETF (BTCO)
- Bitwise Bitcoin ETF (BITB)
- VanEck Bitcoin Trust (HODL)
- Franklin Bitcoin ETF (EZBC)
- Fidelity Wise Origin Bitcoin Trust (FBTC)
- Valkyrie Bitcoin Fund (BRRR)
- Grayscale Bitcoin Trust (GBTC)
- Hashdex Bitcoin ETF (DEFI)
Despite the regulatory approval of the first spot Bitcoin ETFs in US history, the head of the US Securities and Exchange Commission (SEC) Gary Gensler has not changed his critical attitude towards cryptocurrencies. Thus, the regulator sees signs of illegally issued securities in many cryptocurrencies that operate on the Proof-of-Stake (PoS) algorithm.
According to Gensler, the regulator was forced to approve the applications due to “changed circumstances.” This is likely a reference to the recent litigation where Grayscale filed a request with the Commission to transform its Bitcoin fund into a spot ETF. The judge then concluded that the regulator had wrongfully rejected the company's application.
Gensler also warned investors about the numerous risks associated with Bitcoin.
Meanwhile:
→ Funds whose applications have been approved are reducing fees one after another, trying to win the competition for investors.
→ Bank of England (BOE) Governor Andrew Bailey, speaking before the Treasury Committee of the United Kingdom Parliament, called Bitcoin ineffective.
→ Cryptocurrency exchange apps have become unavailable in India due to the introduction of stricter legislation governing cryptocurrencies.
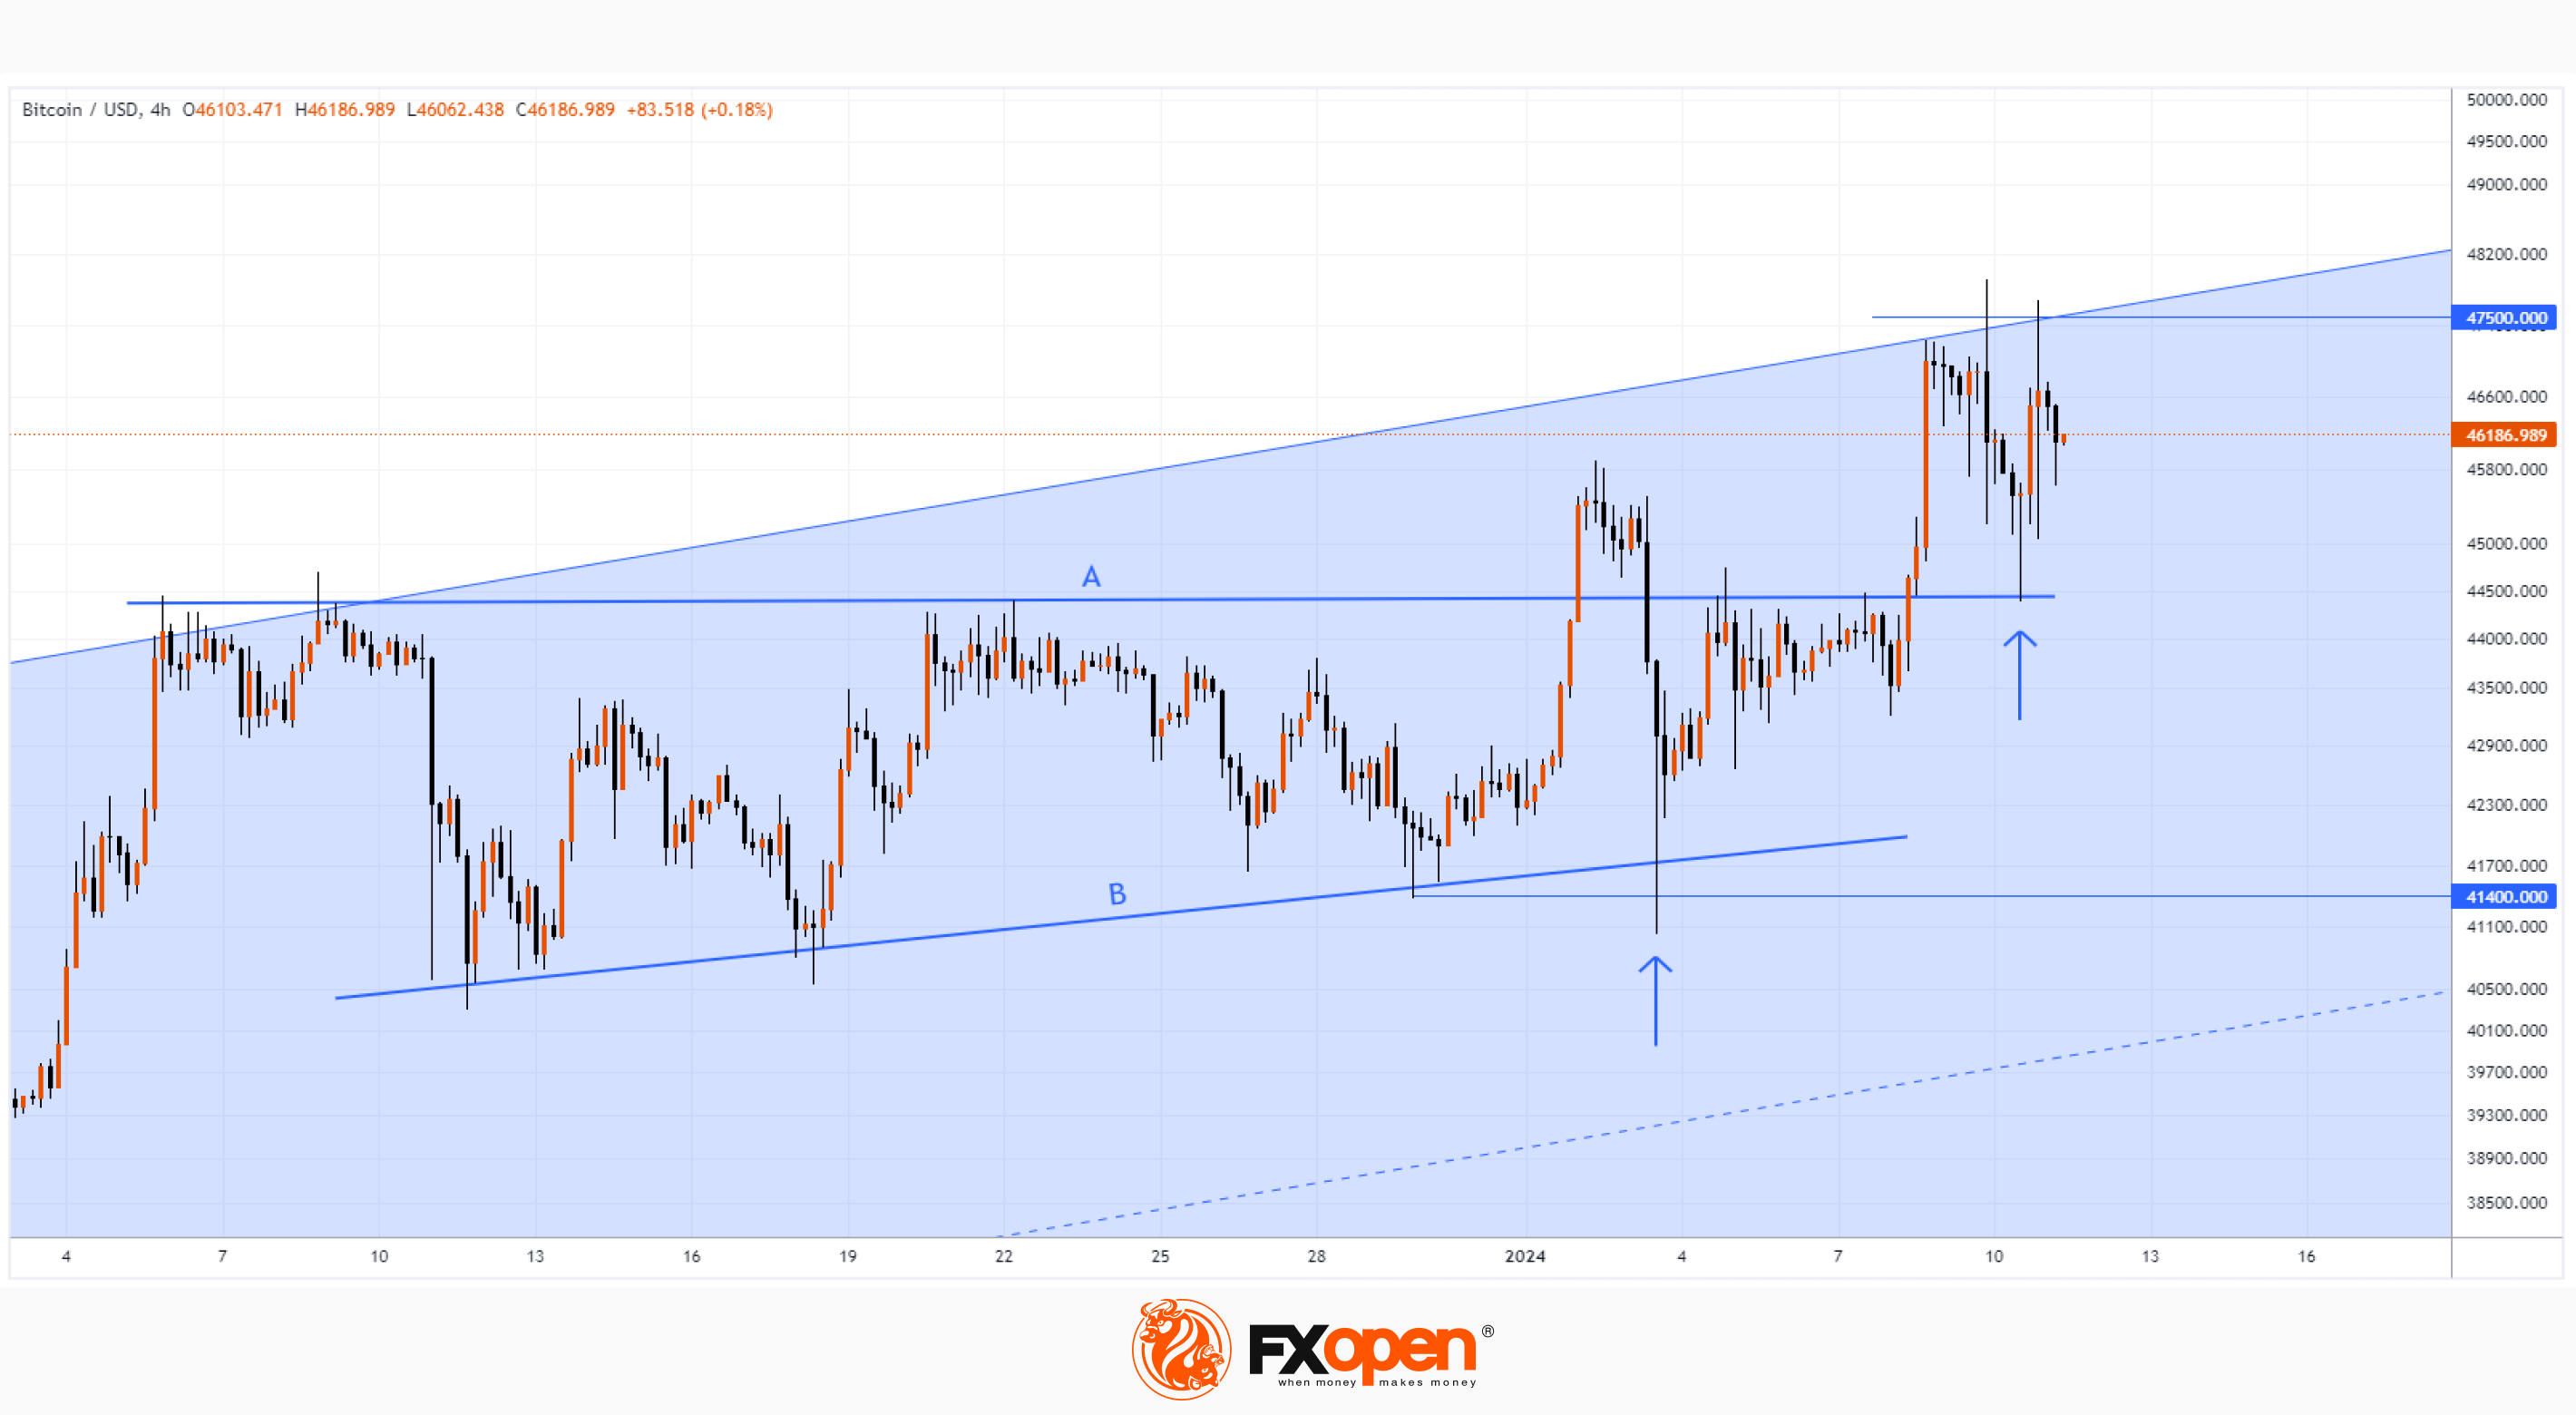
The chart shows that the price of BTC/USD did not change much after the official SEC decision. This highlights that the price of Bitcoin on exchanges has already taken into account the high probability of ETF approval.
We wrote earlier that Bitcoin is starting the year with bullish sentiment.
Note that:
→ The price of Bitcoin has reached the upper limit of the long-term channel (shown in blue, it is shown more fully in the post at the link above). Technically, resistance to growth should be expected from the upper border, which is, in principle, observed on the chart.
→ On January 2, the bulls tried to break through the A-B consolidation zone, but failed.
→ On January 3, there was an attempt at a bearish breakout (shown by an arrow), and it also turned out to be unsuccessful.
→ Recent price action shows that line A (44,400) is now acting as support.
Fundamentally, the price could be pushed higher by news that demand for new ETFs is exceeding expectations. But even if the price continues to rise on the new impulse, it will face the psychological mark of 50k per coin — it is possible that a false bullish breakout of the round figure will occur.
To benefit from the rise and fall of Bitcoin, consider enlisting the services of a trusted broker like FXOpen.
CFDs are complex instruments and come with a high risk of losing your money.
This article represents the opinion of the Companies operating under the FXOpen brand only. It is not to be construed as an offer, solicitation, or recommendation with respect to products and services provided by the Companies operating under the FXOpen brand, nor is it to be considered financial advice.
At FXOpen UK and FXOpen AU, Cryptocurrency CFDs are only available for trading by those clients categorised as Professional clients under FCA Rules and Professional clients under ASIC Rules, respectively. They are not available for trading by Retail clients.
#marketanalysis #bitcoin #crypto
BTC/USD price and the “Three Black Crows” pattern
On January 11, the highly publicized Bitcoin ETF began trading after it was officially approved by the SEC. On this day, the price of Bitcoin exceeded USD 48,800, as shown by the chart. Bloomberg writes that new US spot funds achieved net inflows of USD 819 million in the first two days of trading.
However, from the high on January 11, a dizzying fall began, and already at the low on January 12, Bitcoin was worth less than USD 41,800. This dynamic may illustrate the “buy the rumors, sell the facts” strategy, which we wrote about on January 3 when predicting the price of Bitcoin in 2024.
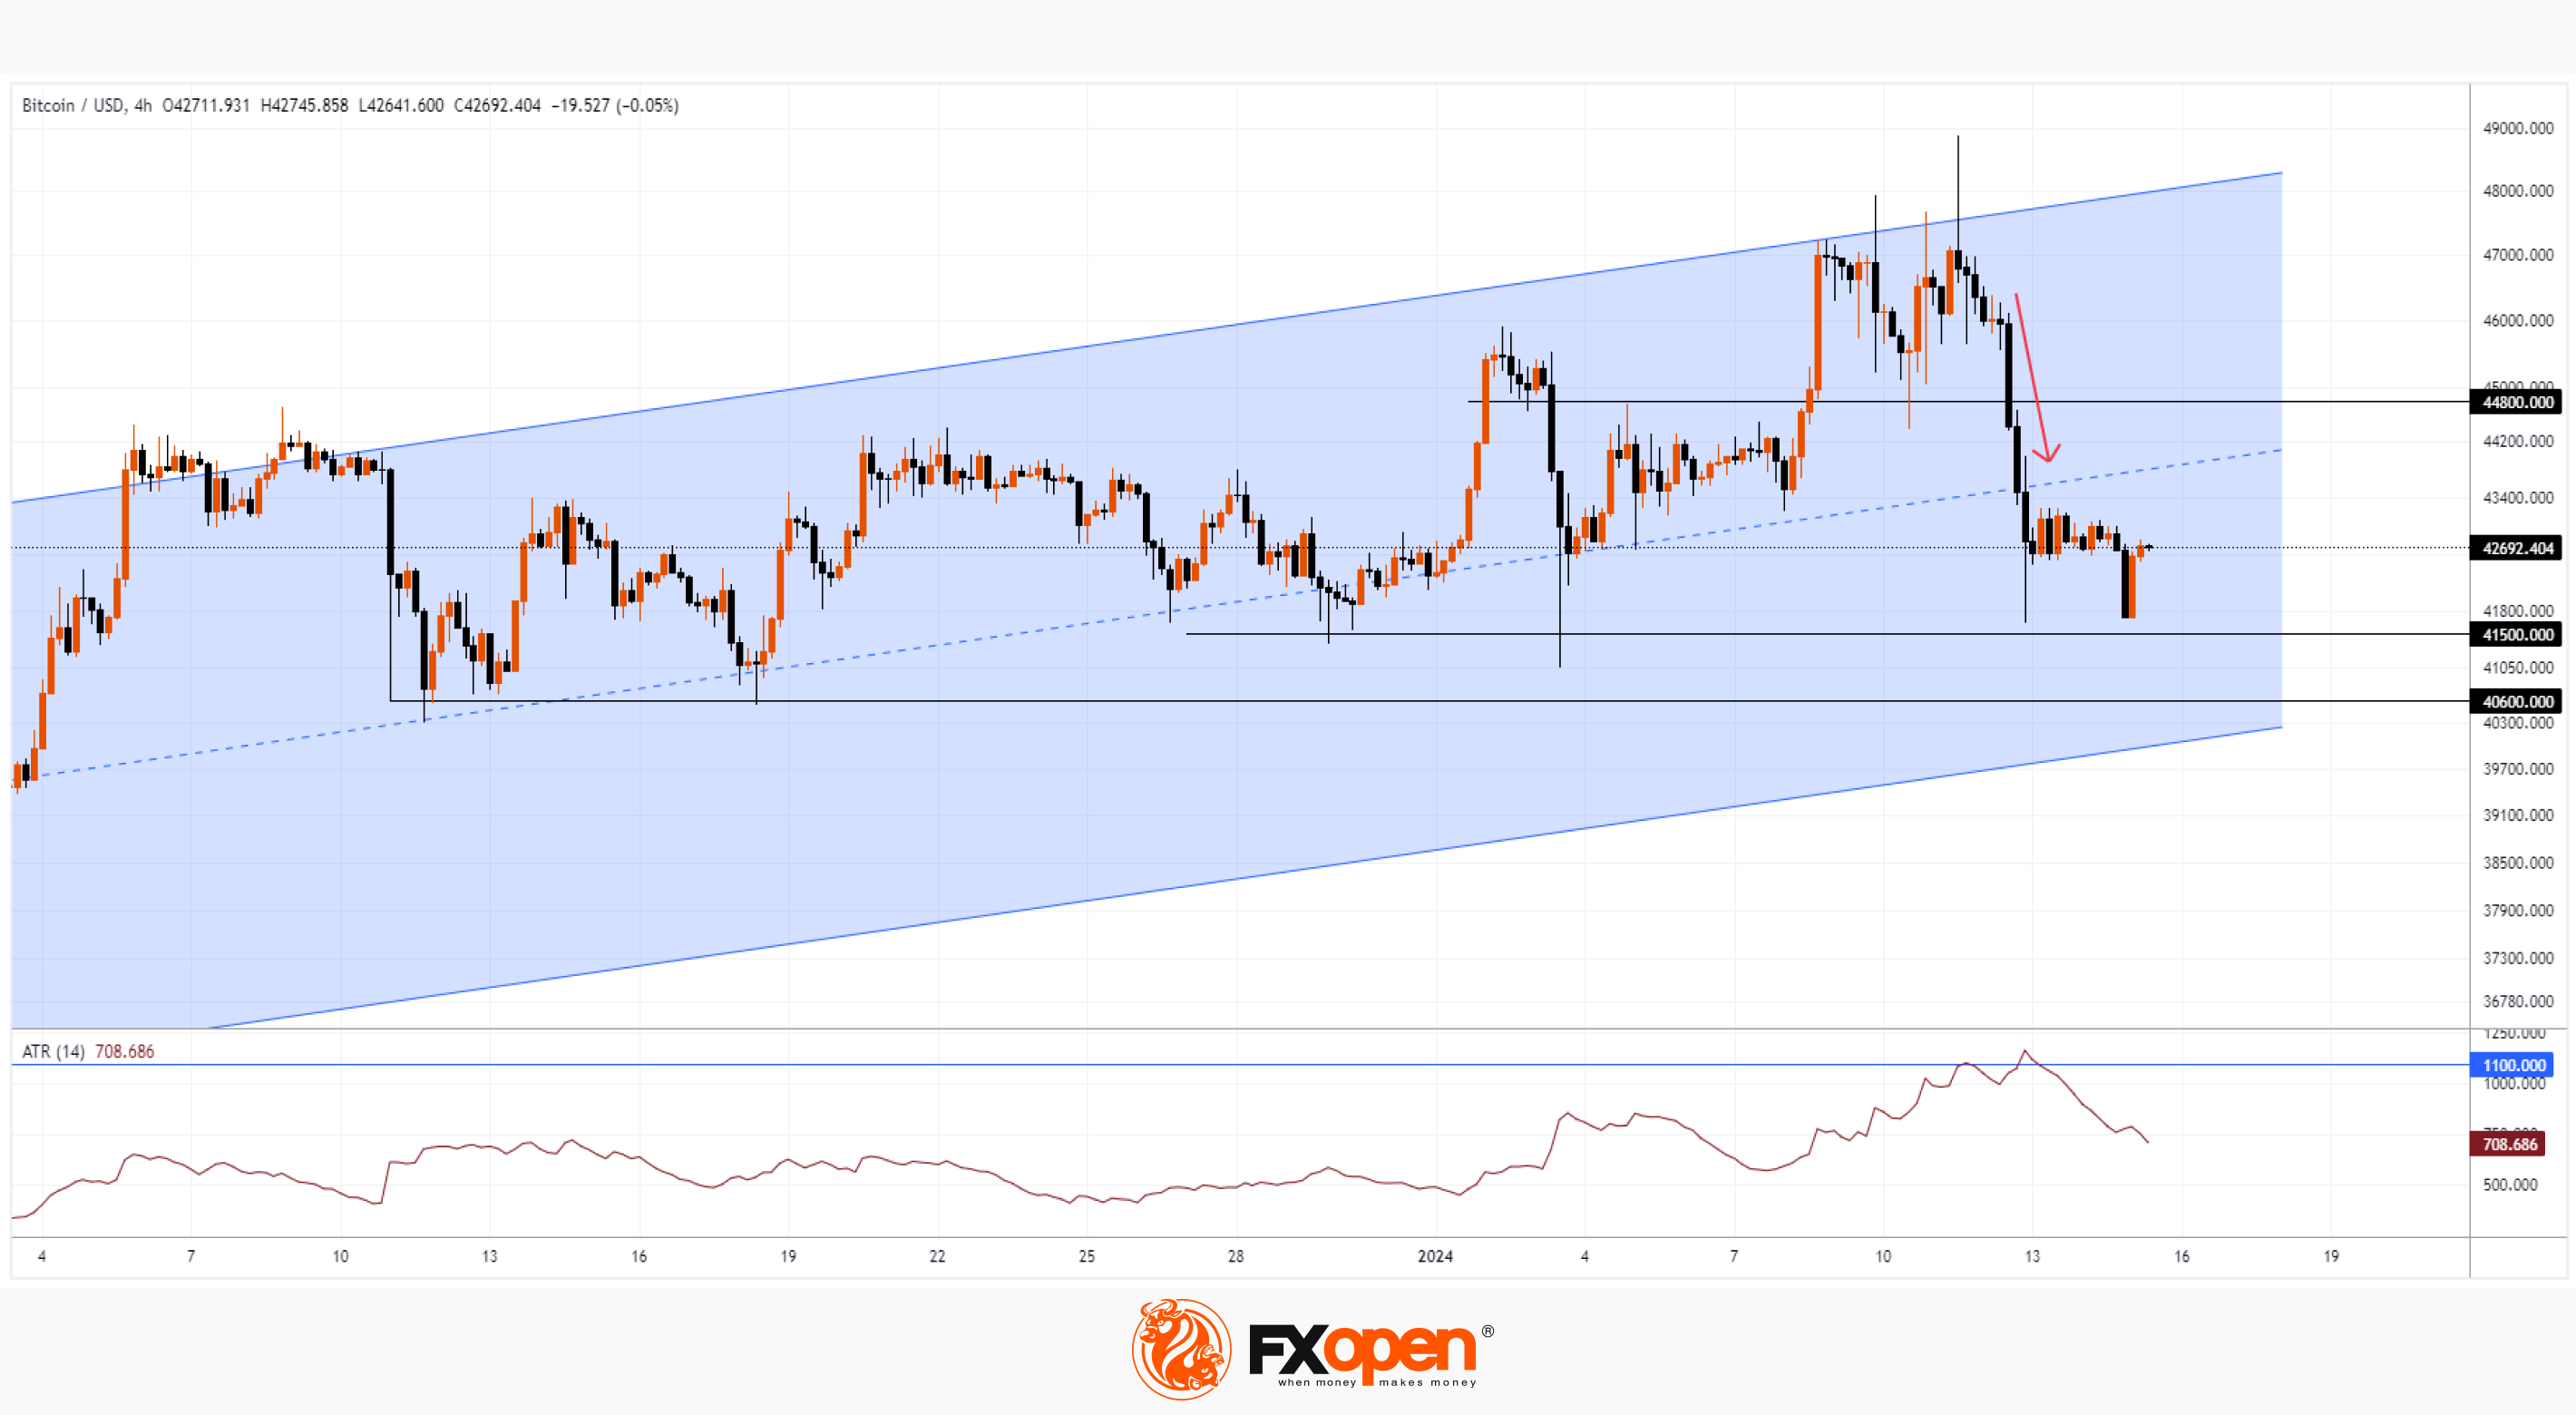
News of the ETF's approval sent the ATR above 1,100 on the 4-hour chart, the last time it did so was in mid-June 2022. The market was overly active, and what is important is that three bearish candles (marked with an arrow) summed up this activity. They can be interpreted as the three black crows pattern.
According to statistics from Tim Bulkowski, this pattern works in 78% of cases and means a trend change from bullish to bearish. According to CandleScanner statistics for 20 years, collected on the S&P 500 index market, the pattern turned out to be false only in 18.6% of cases out of 543 occurrences.
Does this mean that the statistics will work on the Bitcoin price chart?
So far, the price is still within the bullish trend (shown as a channel).
The nearest support levels: 41,500, 40,600, the lower border of the channel.
The nearest resistance levels: 44,800, the median line of the channel.
Let’s assume that the beginning of the week will show a continued influx of capital into the Bitcoin ETF. At the same time, it is possible that the price will form a rebound from one of the support lines. But what if these investors also fall into the trap that those who bought Bitcoin on January 11-12 are now in? Then we may witness a breakdown of the lower border of the blue channel, which will confirm the importance of the three black crows pattern.
To benefit from the rise and fall of prices in the cryptocurrency markets, consider enlisting the services of a trusted broker like FXOpen.
CFDs are complex instruments and come with a high risk of losing your money.
This article represents the opinion of the Companies operating under the FXOpen brand only. It is not to be construed as an offer, solicitation, or recommendation with respect to products and services provided by the Companies operating under the FXOpen brand, nor is it to be considered financial advice.
At FXOpen UK and FXOpen AU, Cryptocurrency CFDs are only available for trading by those clients categorised as Professional clients under FCA Rules and Professional clients under ASIC Rules, respectively. They are not available for trading by Retail clients.
#marketanalysis #MarketNews #crypto
Ethereum Price Exceeds $2,800
The last time the ETH/USD price was at this level was in May 2022, which was the start of a massive drop of more than 65% in 1.5 months.
However, now the ETH/USD market is dominated by bullish sentiment, for the following reasons:
→ deployment of the Dencun update on the Ethereum network this month, which will open up new opportunities for users and developers;
→ expectations that this year, following the approval of Bitcoin ETFs, applications for the launch of ETFs on Ethereum will be approved;
→ waiting for a traditional bull market after halving in the Bitcoin network.
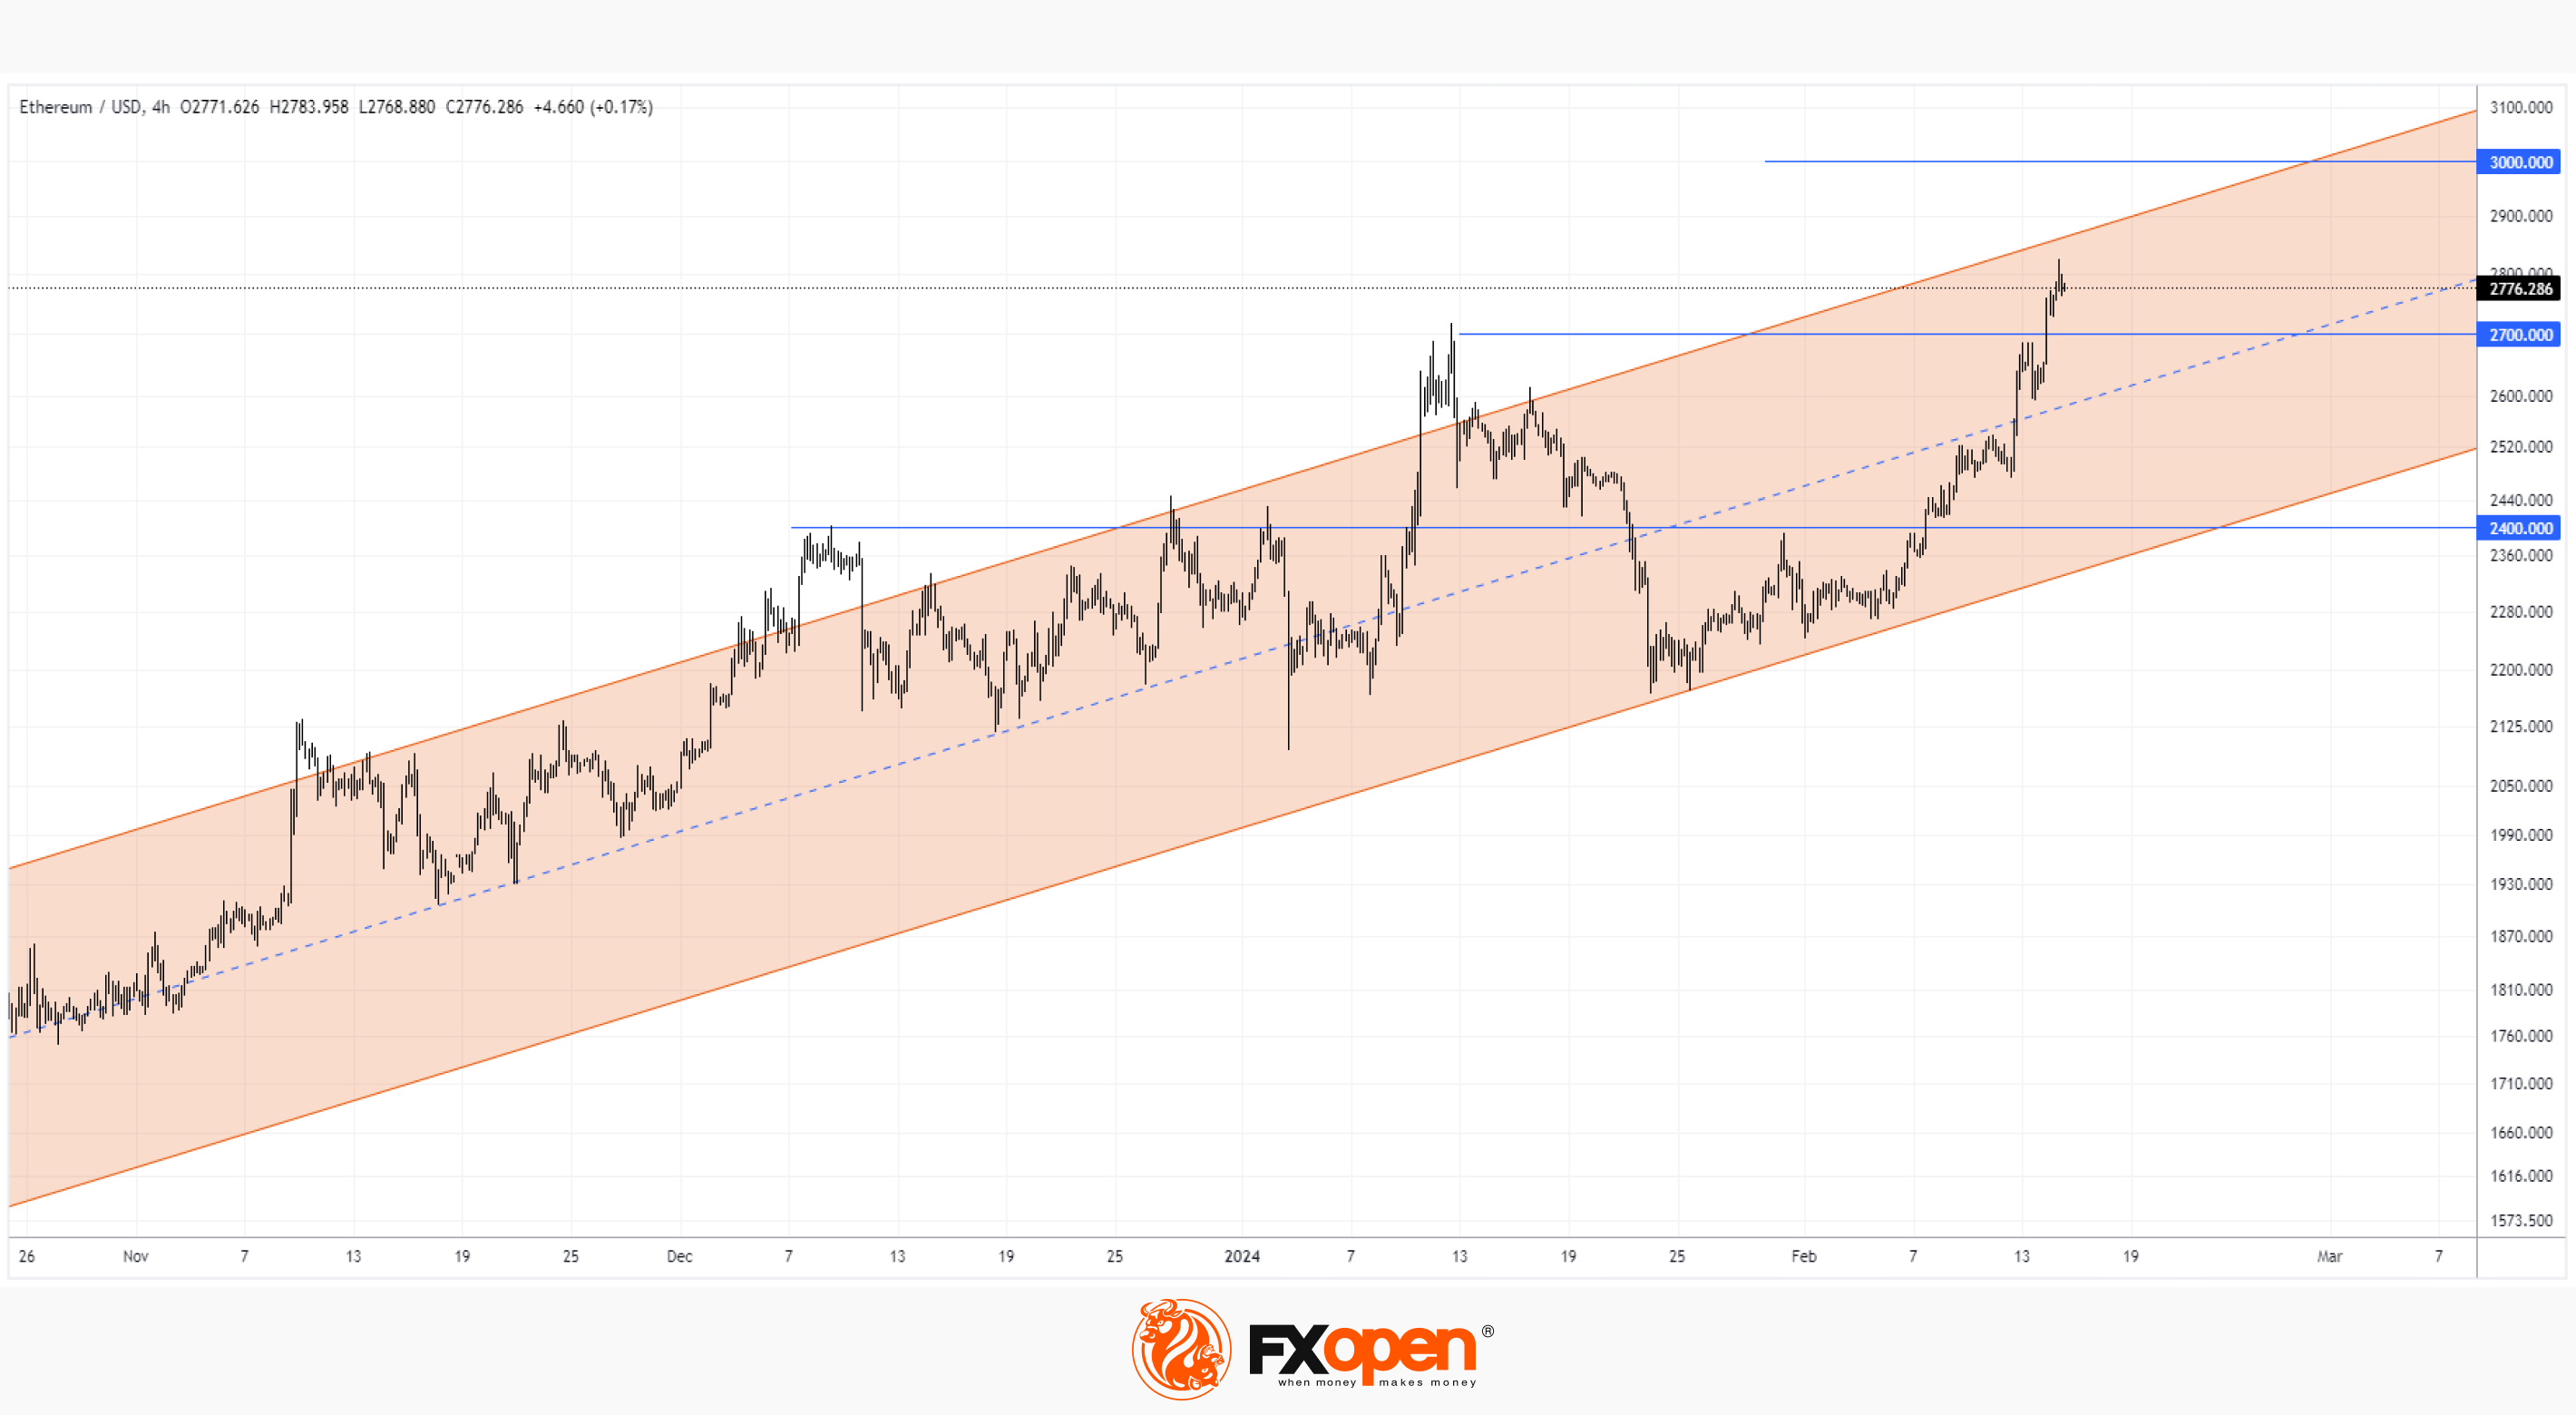
So far, the ETH/USD chart shows that the price of Ethereum is moving within an ascending channel that begins in 2023. Moreover, the price is in its upper half — an indication of the strength of demand. If the trend continues, the price of Ethereum could reach $3,000 within a month.
At the same time, the price of Ethereum is approaching the upper border of the channel, which may provide resistance. It is possible that the indicators will indicate that the market is overbought, creating the preconditions for the formation of a correction.
Probable support levels can help the bulls in a scenario where a correction develops:
→ 2,400: this level influenced the price of ETH starting in December 2023;
→ 2,700: former 2024 high, which was broken on a wide bullish candle (a sign of strong demand);
→ median line and lower boundary of the current channel.
FXOpen offers the world's most popular cryptocurrency CFDs*, including Bitcoin and Ethereum. Floating spreads, 1:2 leverage — at your service. Open your trading account now or learn more about crypto CFD trading with FXOpen.
*At FXOpen UK and FXOpen AU, Cryptocurrency CFDs are only available for trading by those clients categorised as Professional clients under FCA Rules and Professional clients under ASIC Rules respectively. They are not available for trading by Retail clients.
CFDs are complex instruments and come with a high risk of losing your money.
This article represents the opinion of the Companies operating under the FXOpen brand only. It is not to be construed as an offer, solicitation, or recommendation with respect to products and services provided by the Companies operating under the FXOpen brand, nor is it to be considered financial advice.
👍2
#crypto #ETH #MarketNews
Ethereum Price Falls after Exceeding $3,000
We previously wrote about the reasons for the positive sentiment in the ETH/USD market.
Optimism was added by a post on X (Twitter) by Vitalik Buterin about the so-called Werkle trees. This technology, which should (according to the information in the roadmap) be introduced in the future, it includes the advantages of:
→ reduced requirements for validators;
→ faster network synchronization, and others.
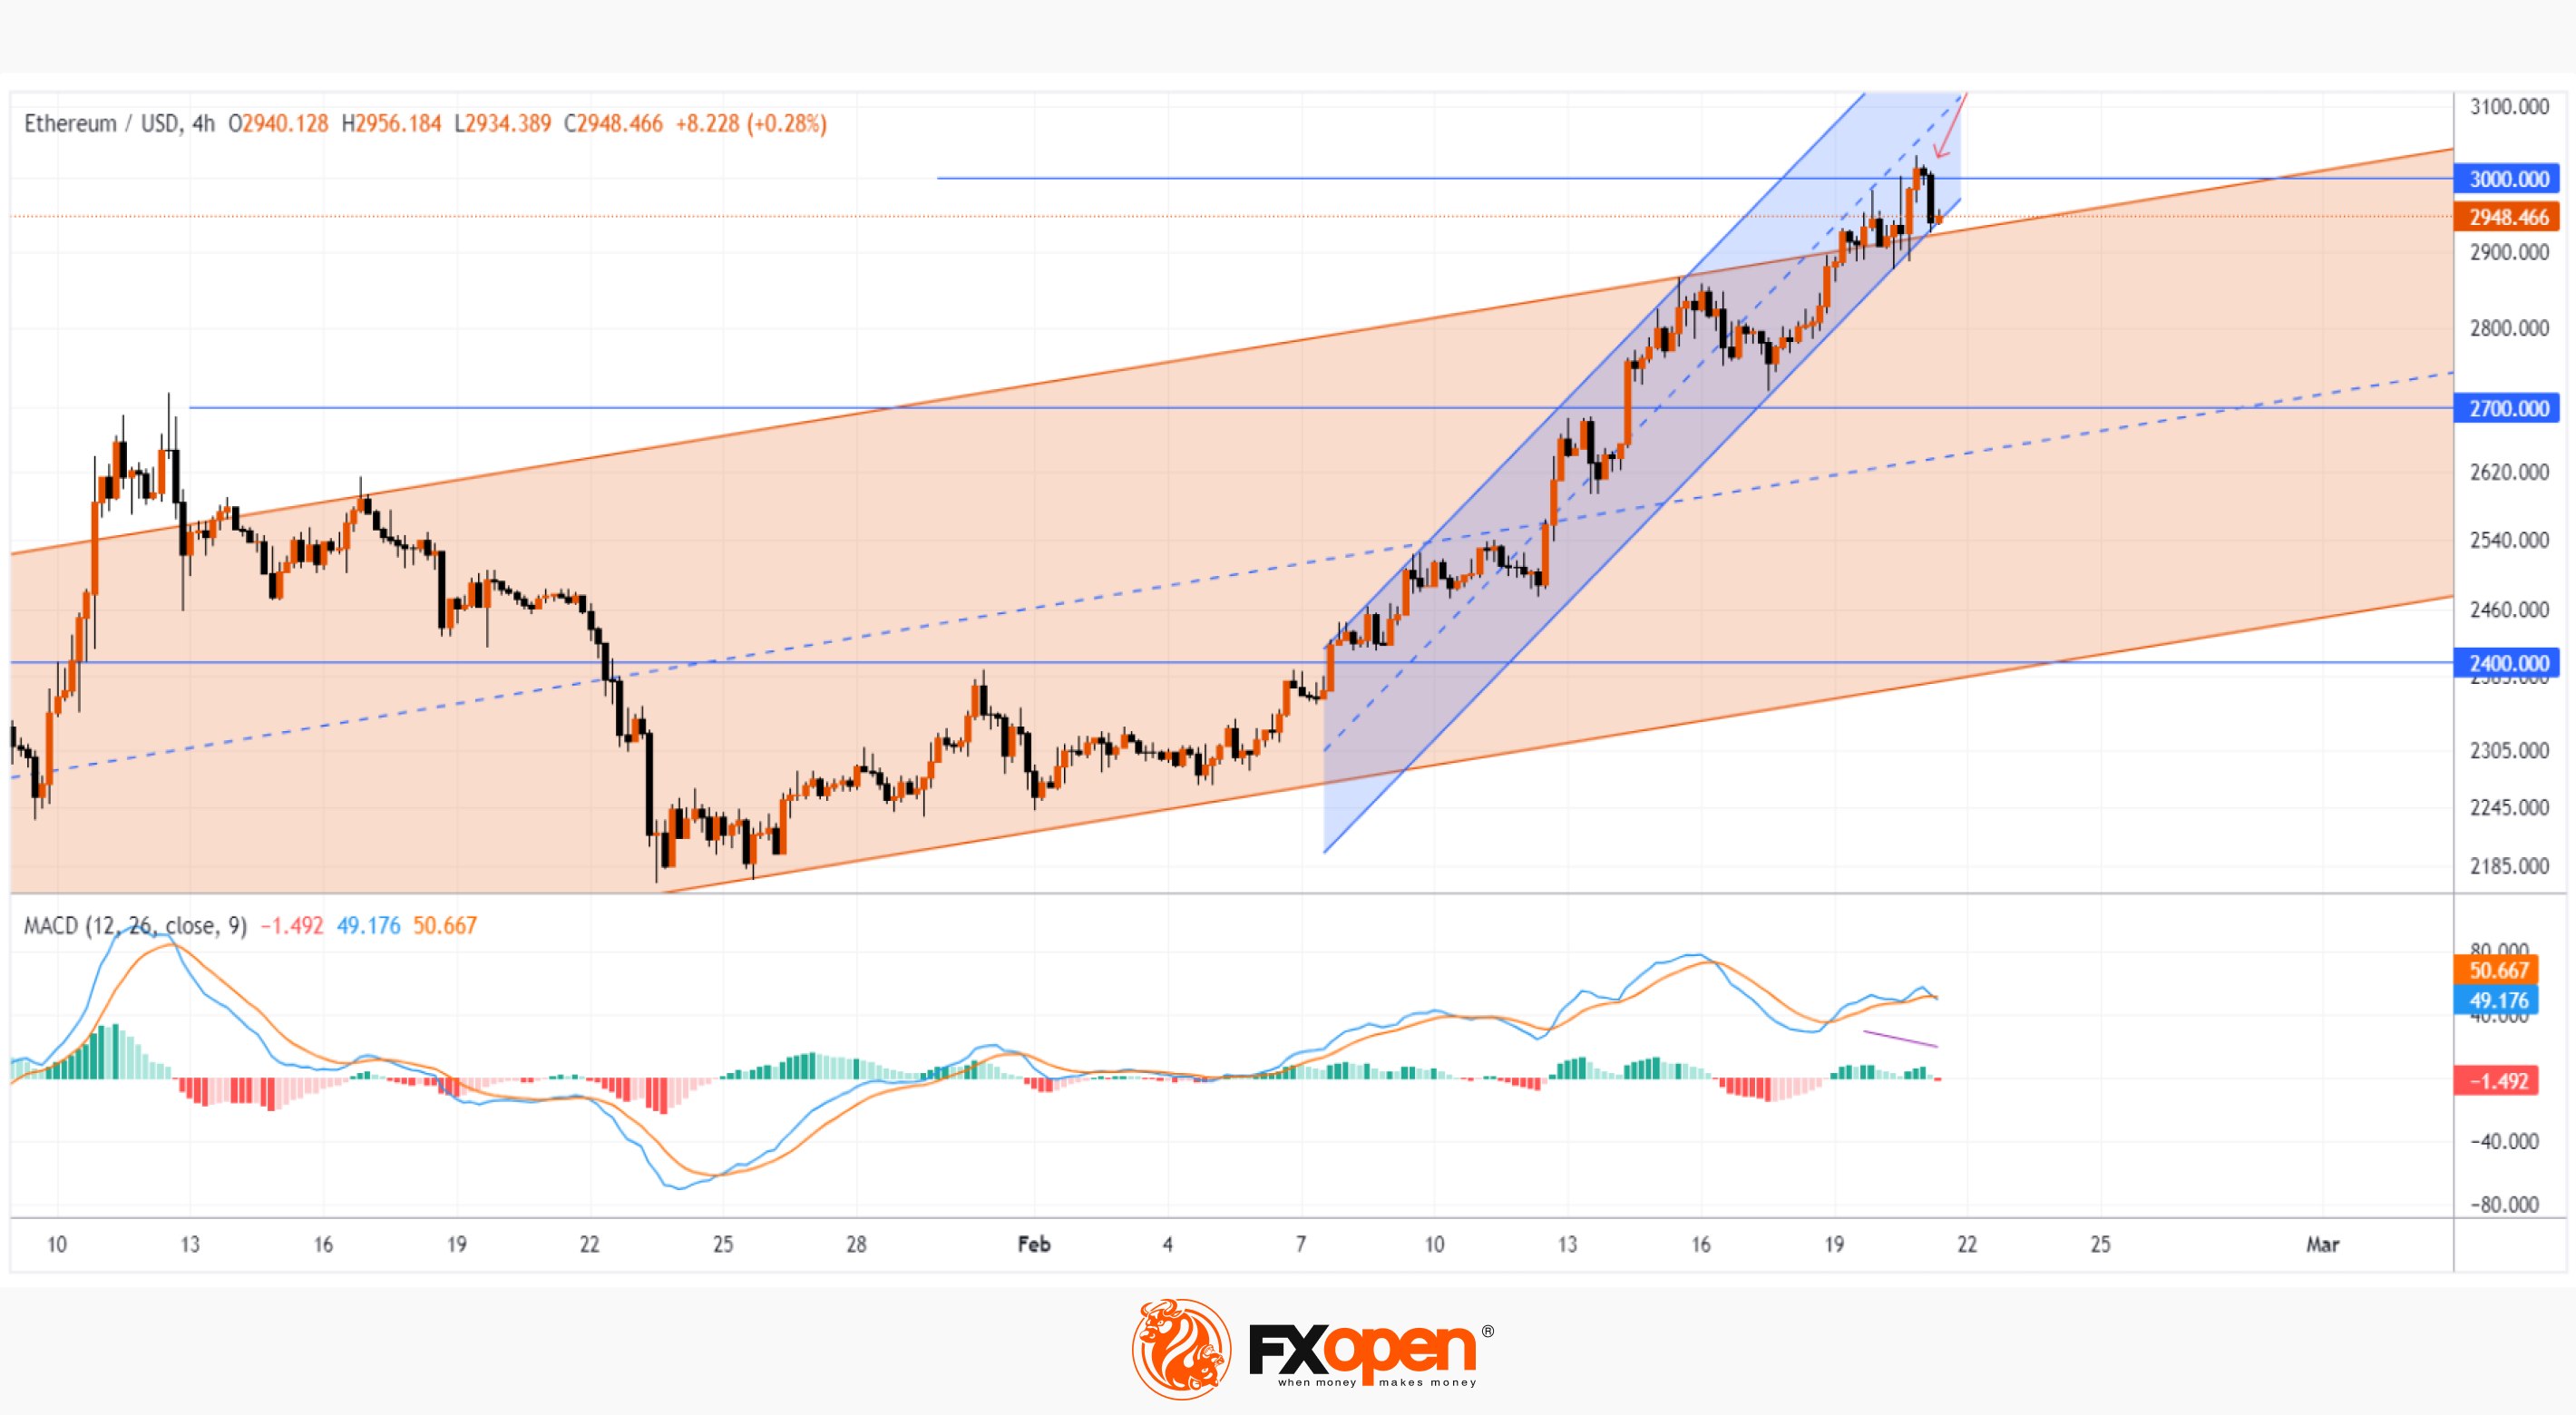
The ETH/USD chart shows that:
→ ETH price is within a larger uptrend (shown in orange);
→ the price is within the February bullish trend (shown by blue lines);
→ the market is in an overbought state, judging by the bearish divergence on the MACD indicator.
These arguments suggest that the market is vulnerable to a pullback.
Notice the wide bearish candle (shown by the red arrow) that is pushing the ETH price down from above the psychological USD 3,000 level. It may indicate a change in mood.
Since the beginning of February, the price of ETH has increased by approximately 30%. Therefore, some market participants could take profits from long positions at the psychological level. If a pullback occurs and is about 50% of the February rise, the price of Ethereum may fall to the median line of the orange channel to the support area of 2,700.
FXOpen offers the world's most popular cryptocurrency CFDs*, including Bitcoin and Ethereum. Floating spreads, 1:2 leverage — at your service. Open your trading account now or learn more about crypto CFD trading with FXOpen.
*At FXOpen UK and FXOpen AU, Cryptocurrency CFDs are only available for trading by those clients categorised as Professional clients under FCA Rules and Professional clients under ASIC Rules respectively. They are not available for trading by Retail clients.
CFDs are complex instruments and come with a high risk of losing your money.
This article represents the opinion of the Companies operating under the FXOpen brand only. It is not to be construed as an offer, solicitation, or recommendation with respect to products and services provided by the Companies operating under the FXOpen brand, nor is it to be considered financial advice.
👍3
#bitcoin #crypto #cryptonews #marketanalysis
Bitcoin Price Risks Not Staying above $50k
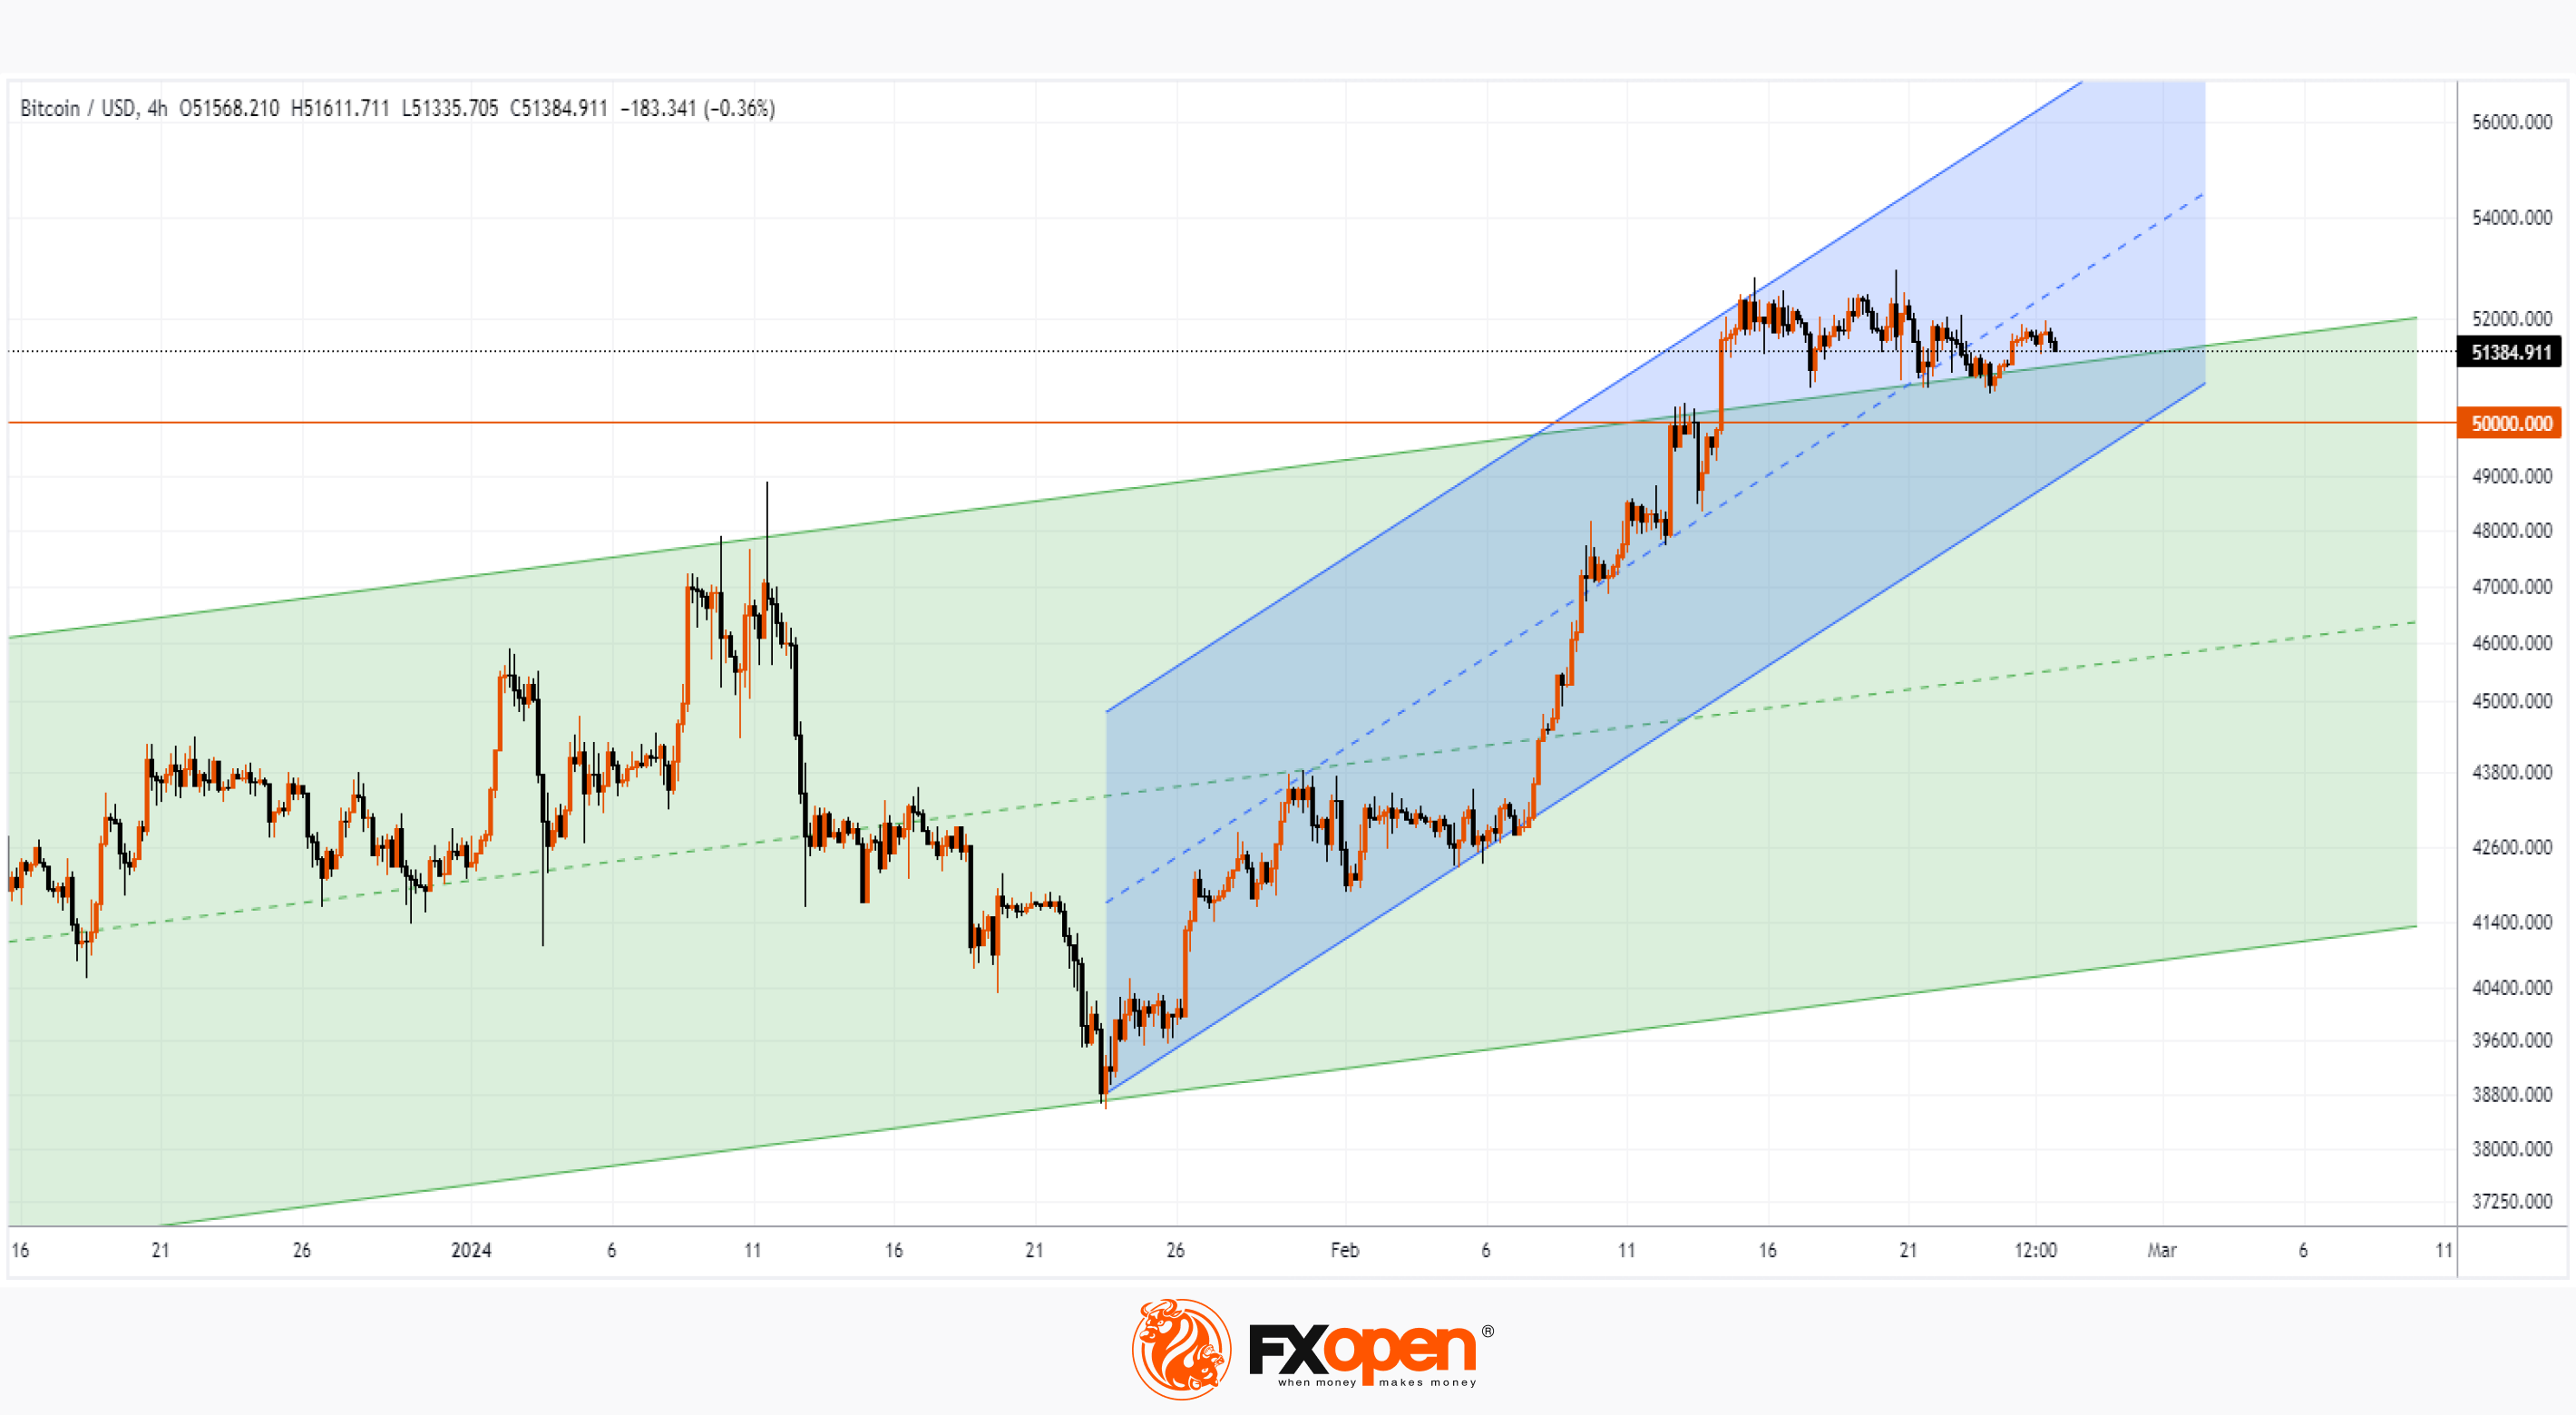
On February 14, a strong bullish impulse was recorded in the BTC/USD market, which pushed the price of bitcoin to the area above USD 50k.
The main driver of growth was the effect of the launch of a bitcoin ETF. More than a month has passed since this event, and according to media reports, the ETF has seen an influx of more than USD 7 billion. For example, BlackRock has about 125k bitcoins on its balance sheet to support its ETF fund.
Also adding to the positive mood among market participants is news about the benefits received by companies that invested in bitcoin: MicroStrategy, Block and others. Among the latest news is Reddit's decision to invest in bitcoin.
However, technical analysis of the BTC/USD chart shows alarming signs:
→ bitcoin price has slightly exceeded the upper limit of the larger ascending channel (shown in green), but how does it behave in tests? The upper border has changed its role from resistance to support (according to the classic technical analysis pattern), but rebounds from this support line quickly lose momentum. The price does not seem to have the energy (force of demand) to rise from the existing support level.
→ Bitcoin price dropped to the lower border of a smaller ascending channel (shown in blue) - a sign that the February positive is running out.
Given the signs of weakening demand, it is possible that we will see an attempt by the bears to take the initiative and return the price of bitcoin below the psychological level of 50k per coin.
FXOpen offers the world's most popular cryptocurrency CFDs*, including Bitcoin and Ethereum. Floating spreads, 1:2 leverage — at your service. Open your trading account now or learn more about crypto CFD trading with FXOpen.
*At FXOpen UK and FXOpen AU, Cryptocurrency CFDs are only available for trading by those clients categorised as Professional clients under FCA Rules and Professional clients under ASIC Rules respectively. They are not available for trading by Retail clients.
CFDs are complex instruments and come with a high risk of losing your money.
This article represents the opinion of the Companies operating under the FXOpen brand only. It is not to be construed as an offer, solicitation, or recommendation with respect to products and services provided by the Companies operating under the FXOpen brand, nor is it to be considered financial advice.
👍2
#bitcoin #BTCUSD #crypto #cryptonews
After Updating the Historical High, the Price of Bitcoin Collapsed by 14%
Bitcoin's previous all-time high price, recorded on November 10, 2021, was around USD 68,900 per coin (depending on exchanges).
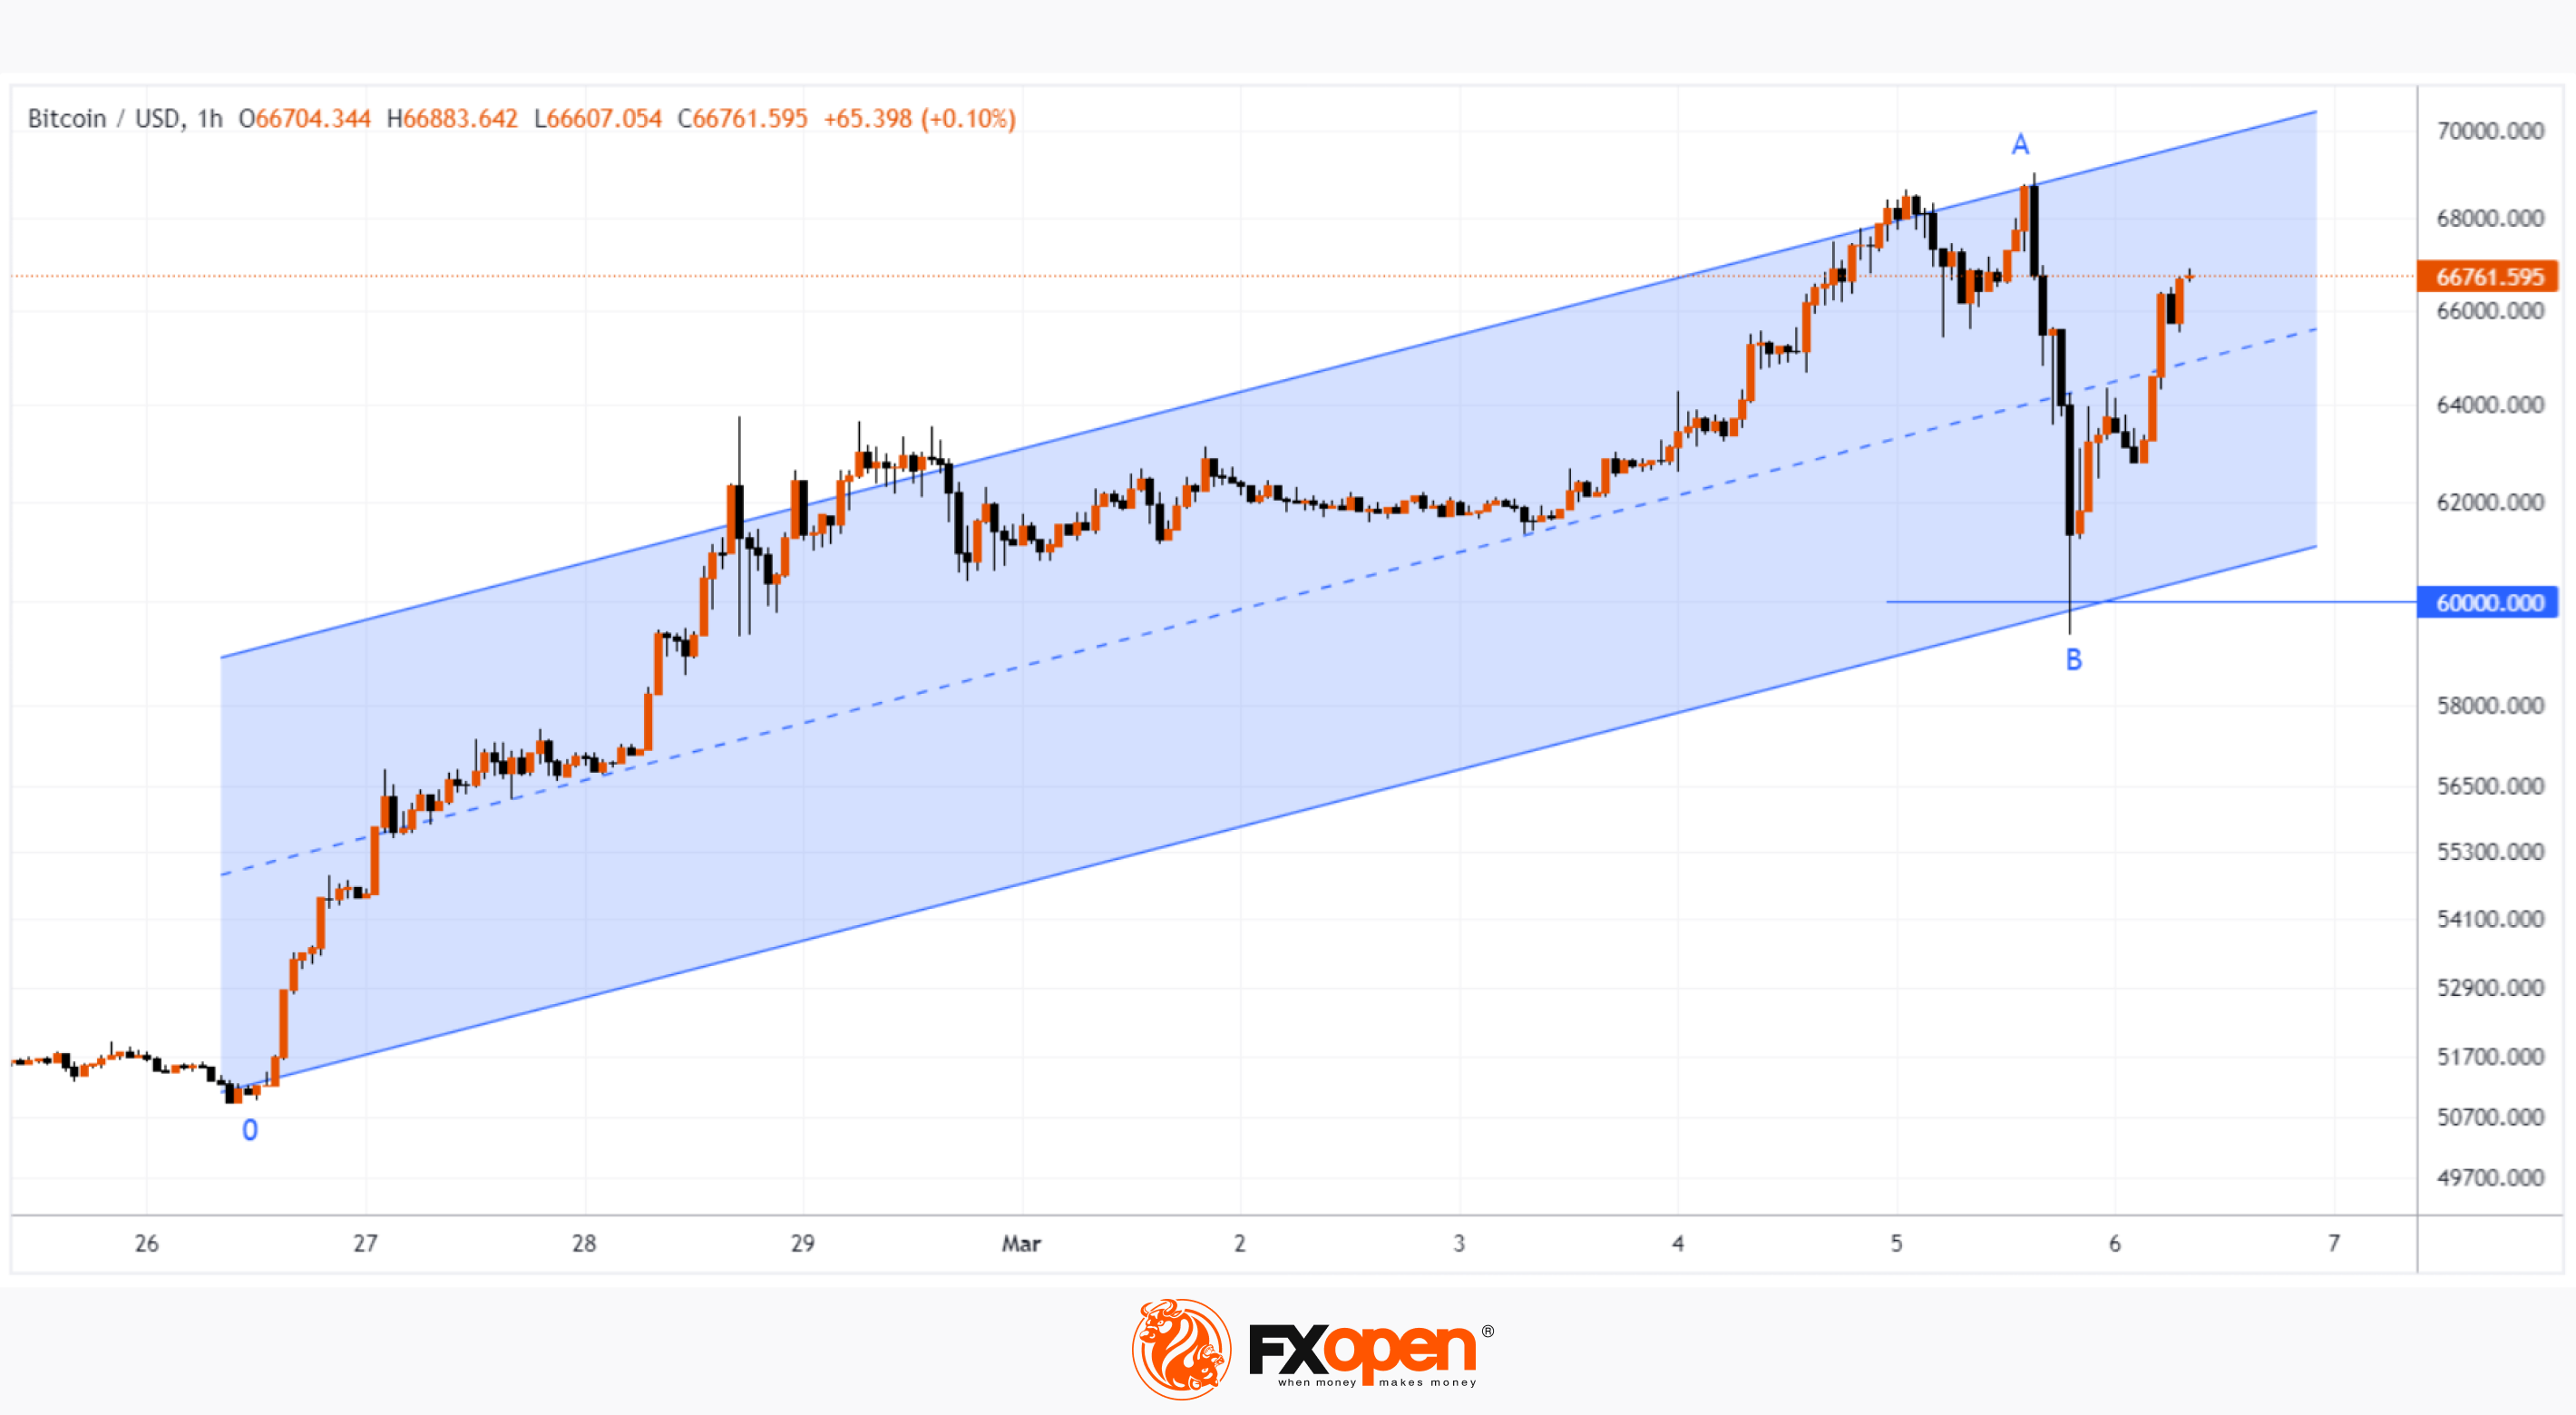
But yesterday, the price of Bitcoin exceeded 69k! However, the jubilation from the new historical peak quickly gave way to fear — as the BTC/USD rate began to fall rapidly. From peak A to low B – the price traveled a path of more than -14% in just 5 hours.
These events highlight 2 characteristic features of the cryptocurrency market:
→ Excessive volatility, which is not typical for the stock and foreign exchange markets. For comparison: on October 19, 1987 — Black Monday — the S&P 500 index fell by about 20.5%. After this incident, there were no days when the drop exceeded 14%.
→ Emotionality of the market and the importance of psychological levels. At these levels, the price of Bitcoin often makes false punctures. Yesterday, there were 2 such punctures: a false bullish puncture of the 2021 top, and a false bearish puncture of the round level of 60k dollars for Bitcoin.
It is also worth noting that yesterday’s low was strengthened by support lines:
→ Fibo level 50% of the rally 0→A.
→ The lower border of the ascending channel (shown in blue).
Technical analysis of the Bitcoin chart shows that the price continues to move in an ascending channel, moreover, the price has returned to its upper half. It is possible that yesterday's sharp decline, which saw over USD 400 million in long positions liquidated across 8 major crypto exchanges, is an extremely aggressive form of correction that occurred as part of the current uptrend. If so, then in March we may witness new hikes in the price of Bitcoin to historical peaks.
FXOpen offers the world's most popular cryptocurrency CFDs*, including Bitcoin and Ethereum. Floating spreads, 1:2 leverage — at your service. Open your trading account now or learn more about crypto CFD trading with FXOpen.
*At FXOpen UK and FXOpen AU, Cryptocurrency CFDs are only available for trading by those clients categorised as Professional clients under FCA Rules and Professional clients under ASIC Rules respectively. They are not available for trading by Retail clients.
CFDs are complex instruments and come with a high risk of losing your money.
This article represents the opinion of the Companies operating under the FXOpen brand only. It is not to be construed as an offer, solicitation, or recommendation with respect to products and services provided by the Companies operating under the FXOpen brand, nor is it to be considered financial advice.
👍3
#ETH #crypto #cryptonews #marketanalysis
Today Is an Ethereum Update. ETH/USD > $4,000
An update is scheduled for the Ethereum network today, approximately at 16:55 GMT+3.
The update is called Dencun and is the biggest code change since April 2023, when the Shapella update was implemented.
Dencun aims to reduce fees on the growing array of ancillary networks running on top of Ethereum, called layer 2 (L2) “aggregates.” The changes involve “proto-dunksharding” technology, which is intended to improve the blockchain’s ability to process data from L2 networks.
It is believed that the implementation of the update will give impetus to the development of projects built on auxiliary networks. On the other hand, there is a risk of failures. Although it is worth noting that Dencun was deployed three times on test networks, and each time there were no problems.
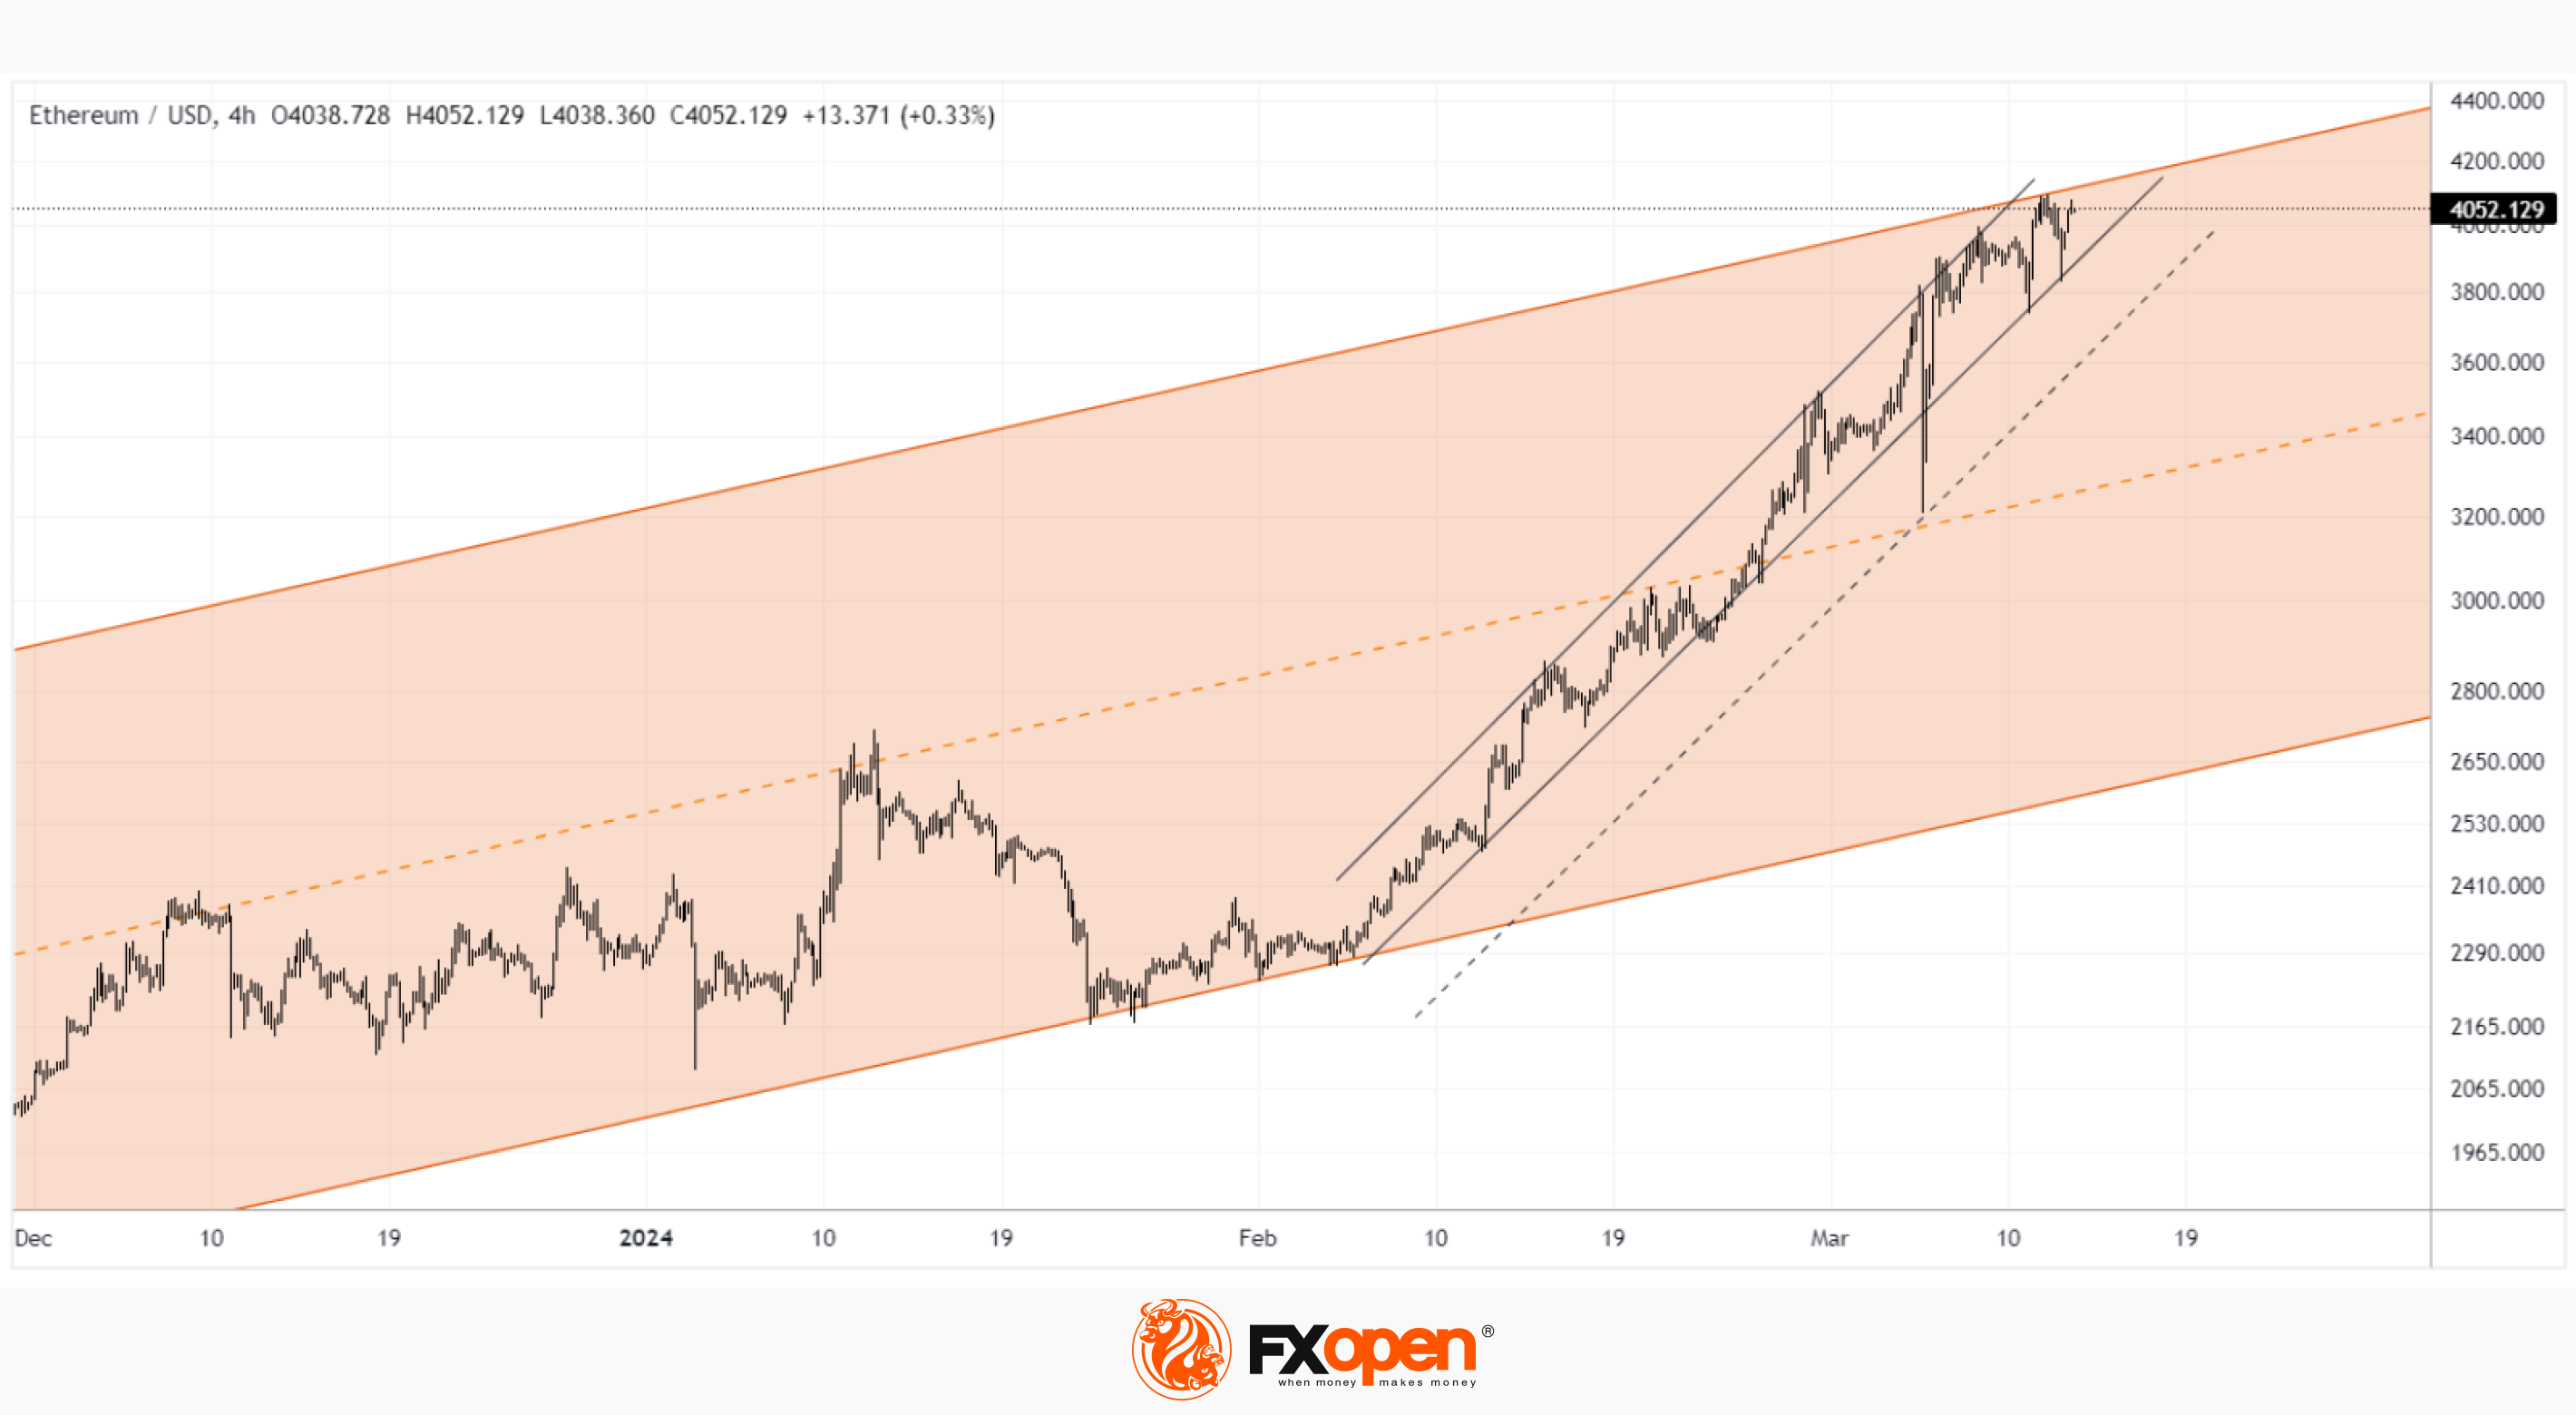
The ETH/USD chart shows that the price of Ethereum today, on the day of the update, is showing bullish behavior:
→ the price moves within the long-term ascending channel (shown in orange). Having pushed off from its lower limit in early February, the price of ETH has already reached its upper limit, which is +76% in about a month!
→ during the growth, the price formed an ascending channel (shown by black lines);
→ the price is trying to consolidate above the psychological level of USD 4,000 for Ethereum.
→ long lower shadows on the candles on March 11-12 give reason to believe that there is strong demand in the market amid news related to an important update for the development of Ethereum.
Reaching the upper boundary of the channel is an argument in favor of a consolidation scenario after a significant rally. But it is possible that using the hype, the bulls will try to storm the upper border of the channel. If successful, the area around USD 4,000 could act as an important support for ETH/USD in the future.
FXOpen offers the world's most popular cryptocurrency CFDs*, including Bitcoin and Ethereum. Floating spreads, 1:2 leverage — at your service. Open your trading account now or learn more about crypto CFD trading with FXOpen.
*At FXOpen UK and FXOpen AU, Cryptocurrency CFDs are only available for trading by those clients categorised as Professional clients under FCA Rules and Professional clients under ASIC Rules respectively. They are not available for trading by Retail clients.
CFDs are complex instruments and come with a high risk of losing your money.
This article represents the opinion of the Companies operating under the FXOpen brand only. It is not to be construed as an offer, solicitation, or recommendation with respect to products and services provided by the Companies operating under the FXOpen brand, nor is it to be considered financial advice.
👍5
#bitcoin #marketanalysis #cryptonews #crypto
Bitcoin Price Recovered over the Weekend, But Market Anxiety Remains
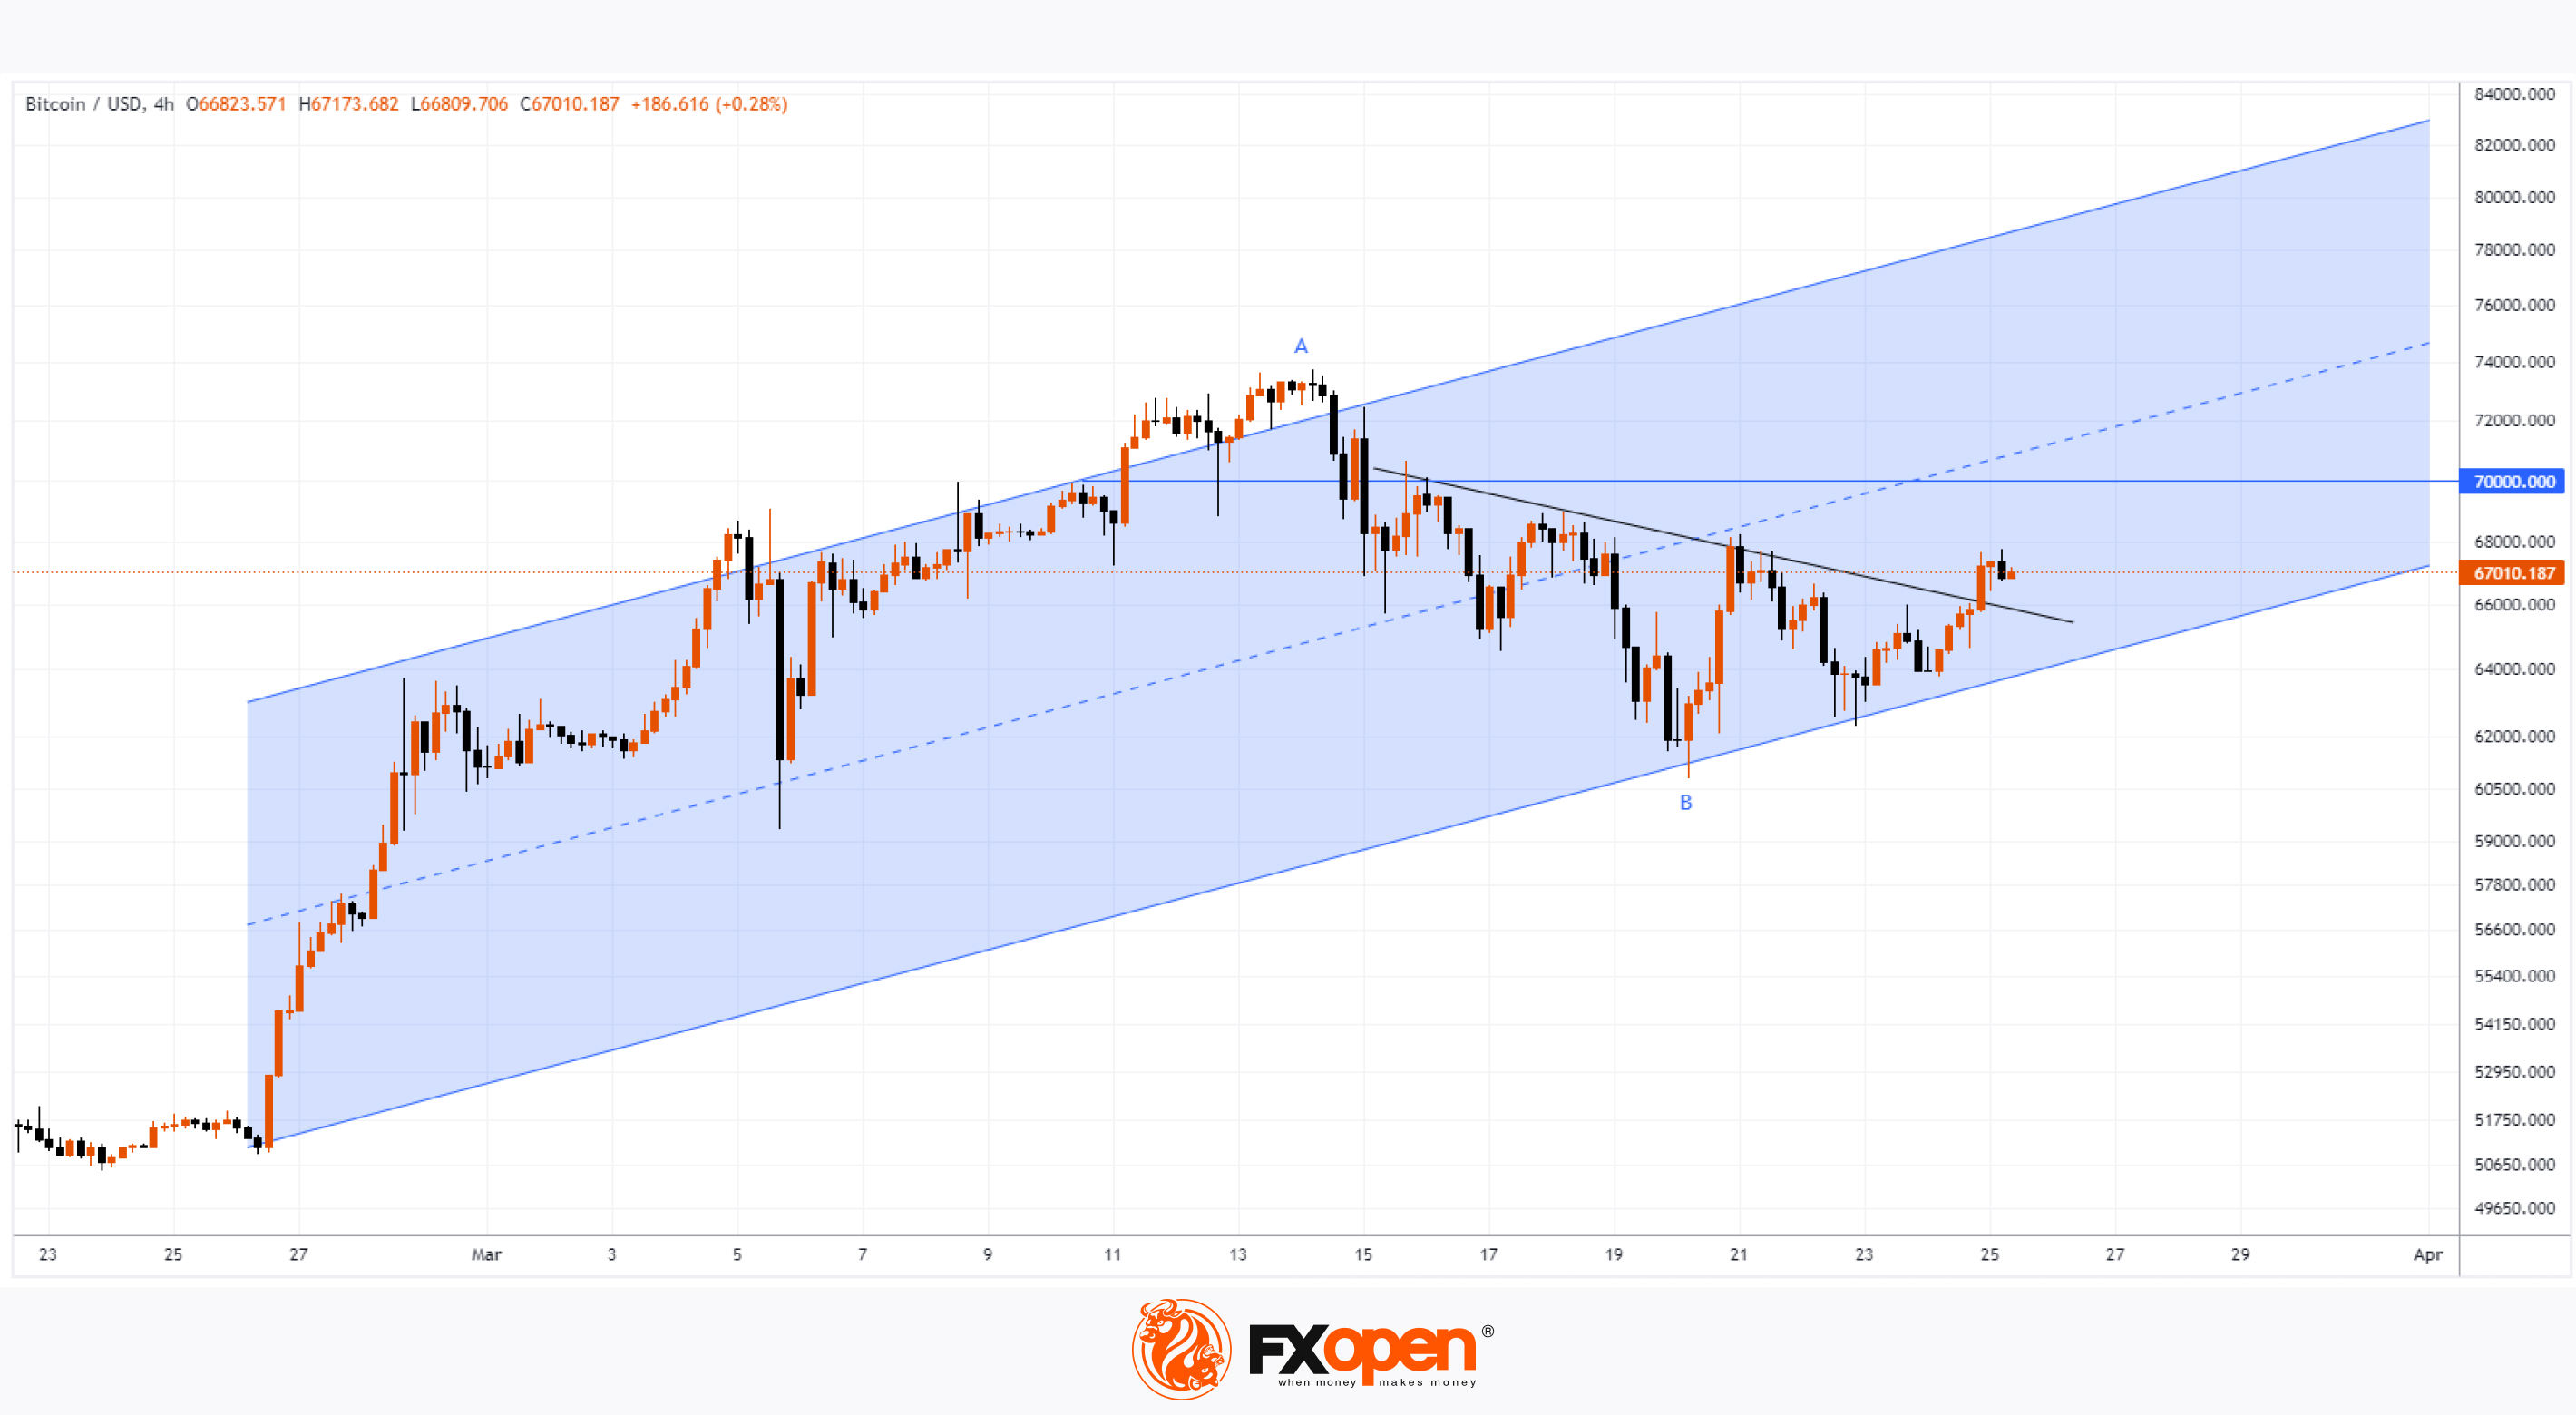
From the point of view of technical analysis of BTC/USD, on Friday evening the price of Bitcoin was near the lower boundary of the ascending channel (shown in blue). This was alarming as it indicated that the market action could result in a weekly bearish candle forming with the price of BTC down by around 5% — something that hasn't happened since August of last year.
However, this did not happen, as the price recovered over the weekend, forming rebounds from the lower border of the channel. The lower shadows of the candles are a sign of demand forces. Moreover, the bulls have broken through the downward trend line (shown in black). Will the bulls be able to return the price of Bitcoin to an upward trajectory within the specified trend?
Doubts remain.
→ Bitcoin “still looks overbought,” JPMorgan strategists warned, predicting a decline to USD 42k.
→ Bloomberg writes about record capital outflows from Bitcoin ETFs last week.
→ The level of 70k looks like an important psychological resistance. Above it, the Bitcoin price formed a double top pattern with an all-time high at point A, after which the bears clearly became more active. They successfully pushed the price to minimum B, breaking the support of the channel median line.
The price of Bitcoin starts the new week around the 50% retracement from the decline A→B (about -16%). This gives reason to assume the development of consolidation.
But if the price again falls to the lower border of the channel, then this will more clearly indicate the inability of the bulls to resume the upward trend — and therefore put the lower border of the channel at risk of a bearish breakout.
FXOpen offers the world's most popular cryptocurrency CFDs*, including Bitcoin and Ethereum. Floating spreads, 1:2 leverage — at your service. Open your trading account now or learn more about crypto CFD trading with FXOpen.
*At FXOpen UK and FXOpen AU, Cryptocurrency CFDs are only available for trading by those clients categorised as Professional clients under FCA Rules and Professional clients under AFSL 412871 – ABN 61 143 678 719 respectively. They are not available for trading by Retail clients.
CFDs are complex instruments and come with a high risk of losing your money.
This article represents the opinion of the Companies operating under the FXOpen brand only. It is not to be construed as an offer, solicitation, or recommendation with respect to products and services provided by the Companies operating under the FXOpen brand, nor is it to be considered financial advice.
👍3
#cryptonews #crypto #MarketNews
DOGE Price Increases by 170% in Less Than 2 Months
On February 1, 2024, the DOGE/USD rate was = 0.0783. On the last Friday of March, it rose to 0.2150. The rising price means Dogecoin is now the eighth-largest cryptocurrency in the world by market capitalization, overtaking Cardano (ADA) and Avalanche (AVAX) in recent days.
The reason for the positive sentiment is the support of the token from Elon Musk.
As the Independent writes:
→ Rumors have intensified that Elon will integrate DOGE into his social network X (Twitter), which he planned to make “an app for everything.” Musk's other companies, SpaceX and Tesla, already support payments in Dogecoin.
→ According to Elon, Dogecoin has the potential to become the main online currency due to its ease of use and efficiency.
→ The billionaire also said that DOGE could become the official currency on Mars if SpaceX can establish a permanent human colony there.
→ The price of DOGE/USD is also supported by the general bullish trend in the cryptocurrency market.
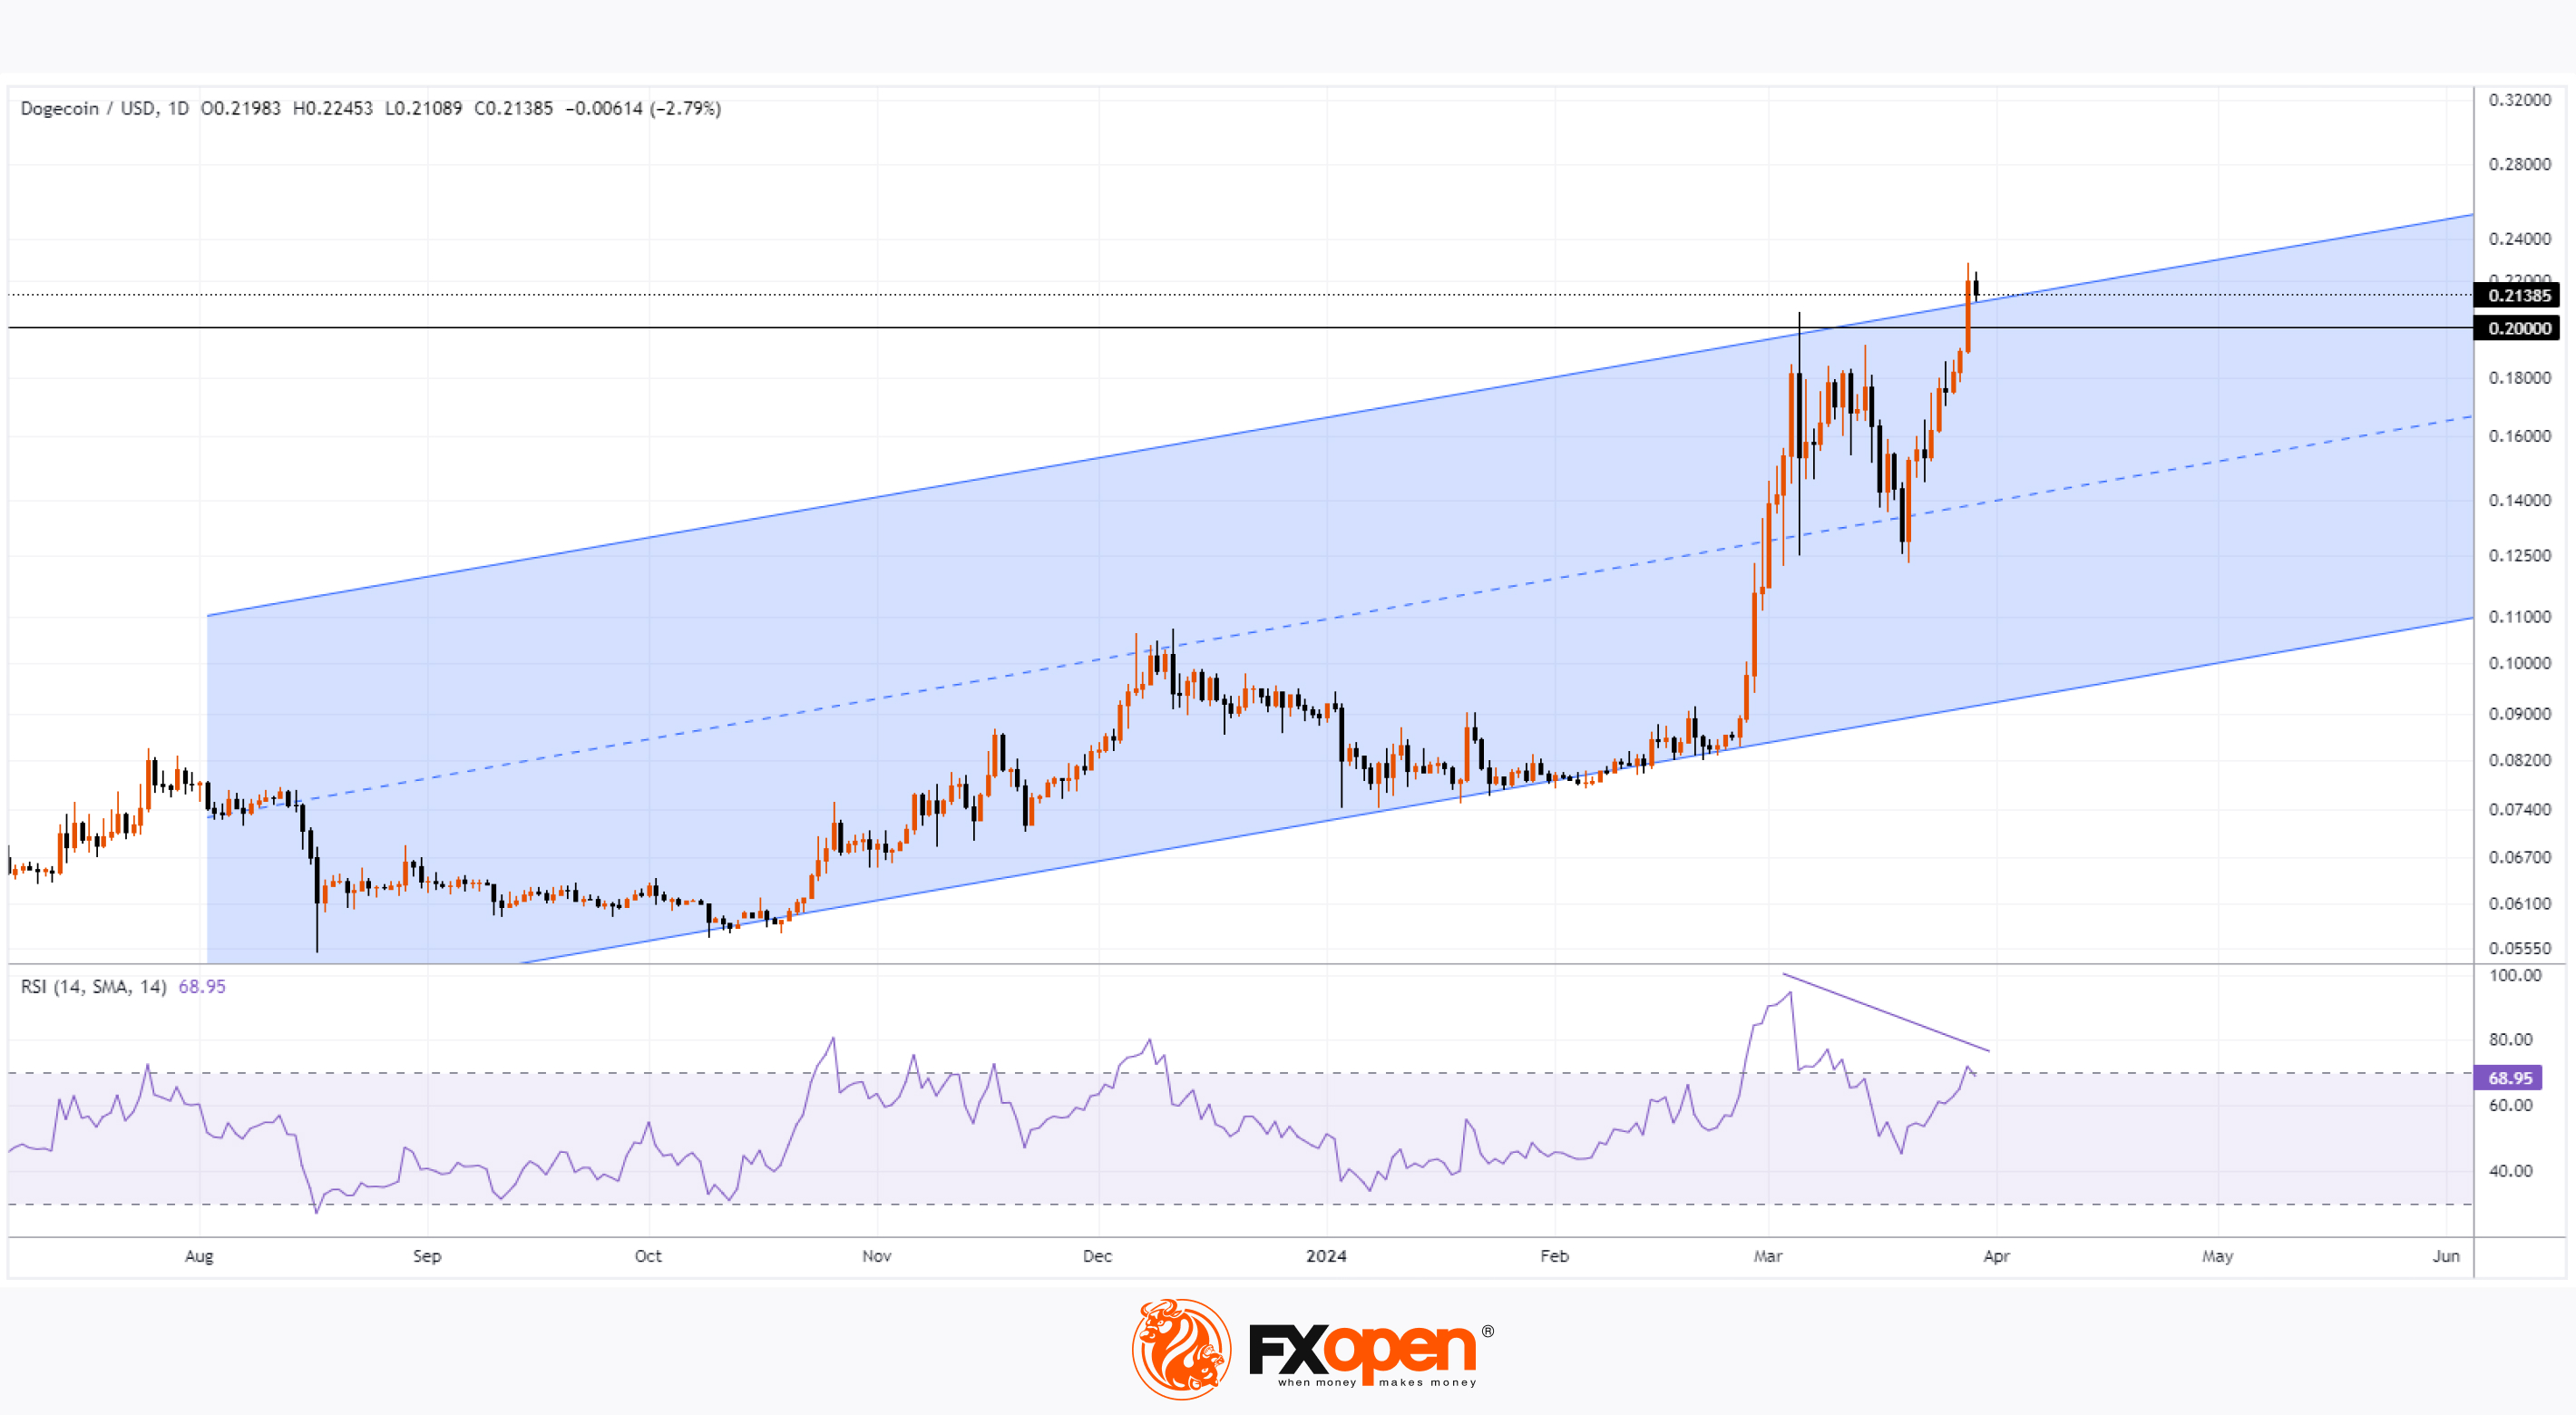
The DOGE/USD chart shows that:
→ the price moves within an uptrend (shown in blue);
→ the price of Dogecoin has overcome the psychological level of $0.2 per coin;
→ the price is near the upper border of the channel - the price action on March 28-29 can be interpreted as an attempt to break through this resistance.
But will this attempt be successful? The RSI indicator may form a bearish divergence - a warning about a possible correction. It is possible that long holders will want to take profits after the impressive growth, which will put pressure on the Dogecoin price, returning it closer to the channel median line.
FXOpen offers the world's most popular cryptocurrency CFDs*, including Bitcoin and Ethereum. Floating spreads, 1:2 leverage — at your service. Open your trading account now or learn more about crypto CFD trading with FXOpen.
*At FXOpen UK and FXOpen AU, Cryptocurrency CFDs are only available for trading by those clients categorised as Professional clients under FCA Rules and Professional clients under AFSL 412871 – ABN 61 143 678 719 respectively. They are not available for trading by Retail clients.
CFDs are complex instruments and come with a high risk of losing your money.
This article represents the opinion of the Companies operating under the FXOpen brand only. It is not to be construed as an offer, solicitation, or recommendation with respect to products and services provided by the Companies operating under the FXOpen brand, nor is it to be considered financial advice.
👍4
#BTCUSD #bitcoin #cryptonews #crypto
BTC/USD Analysis: Bearish Arguments Become More Convincing
On March 18, we wrote about the activation of bears near the USD 70,000 level and the likelihood of consolidation forming near this psychological mark.
On March 25, we wrote that anxiety remains in the Bitcoin market.
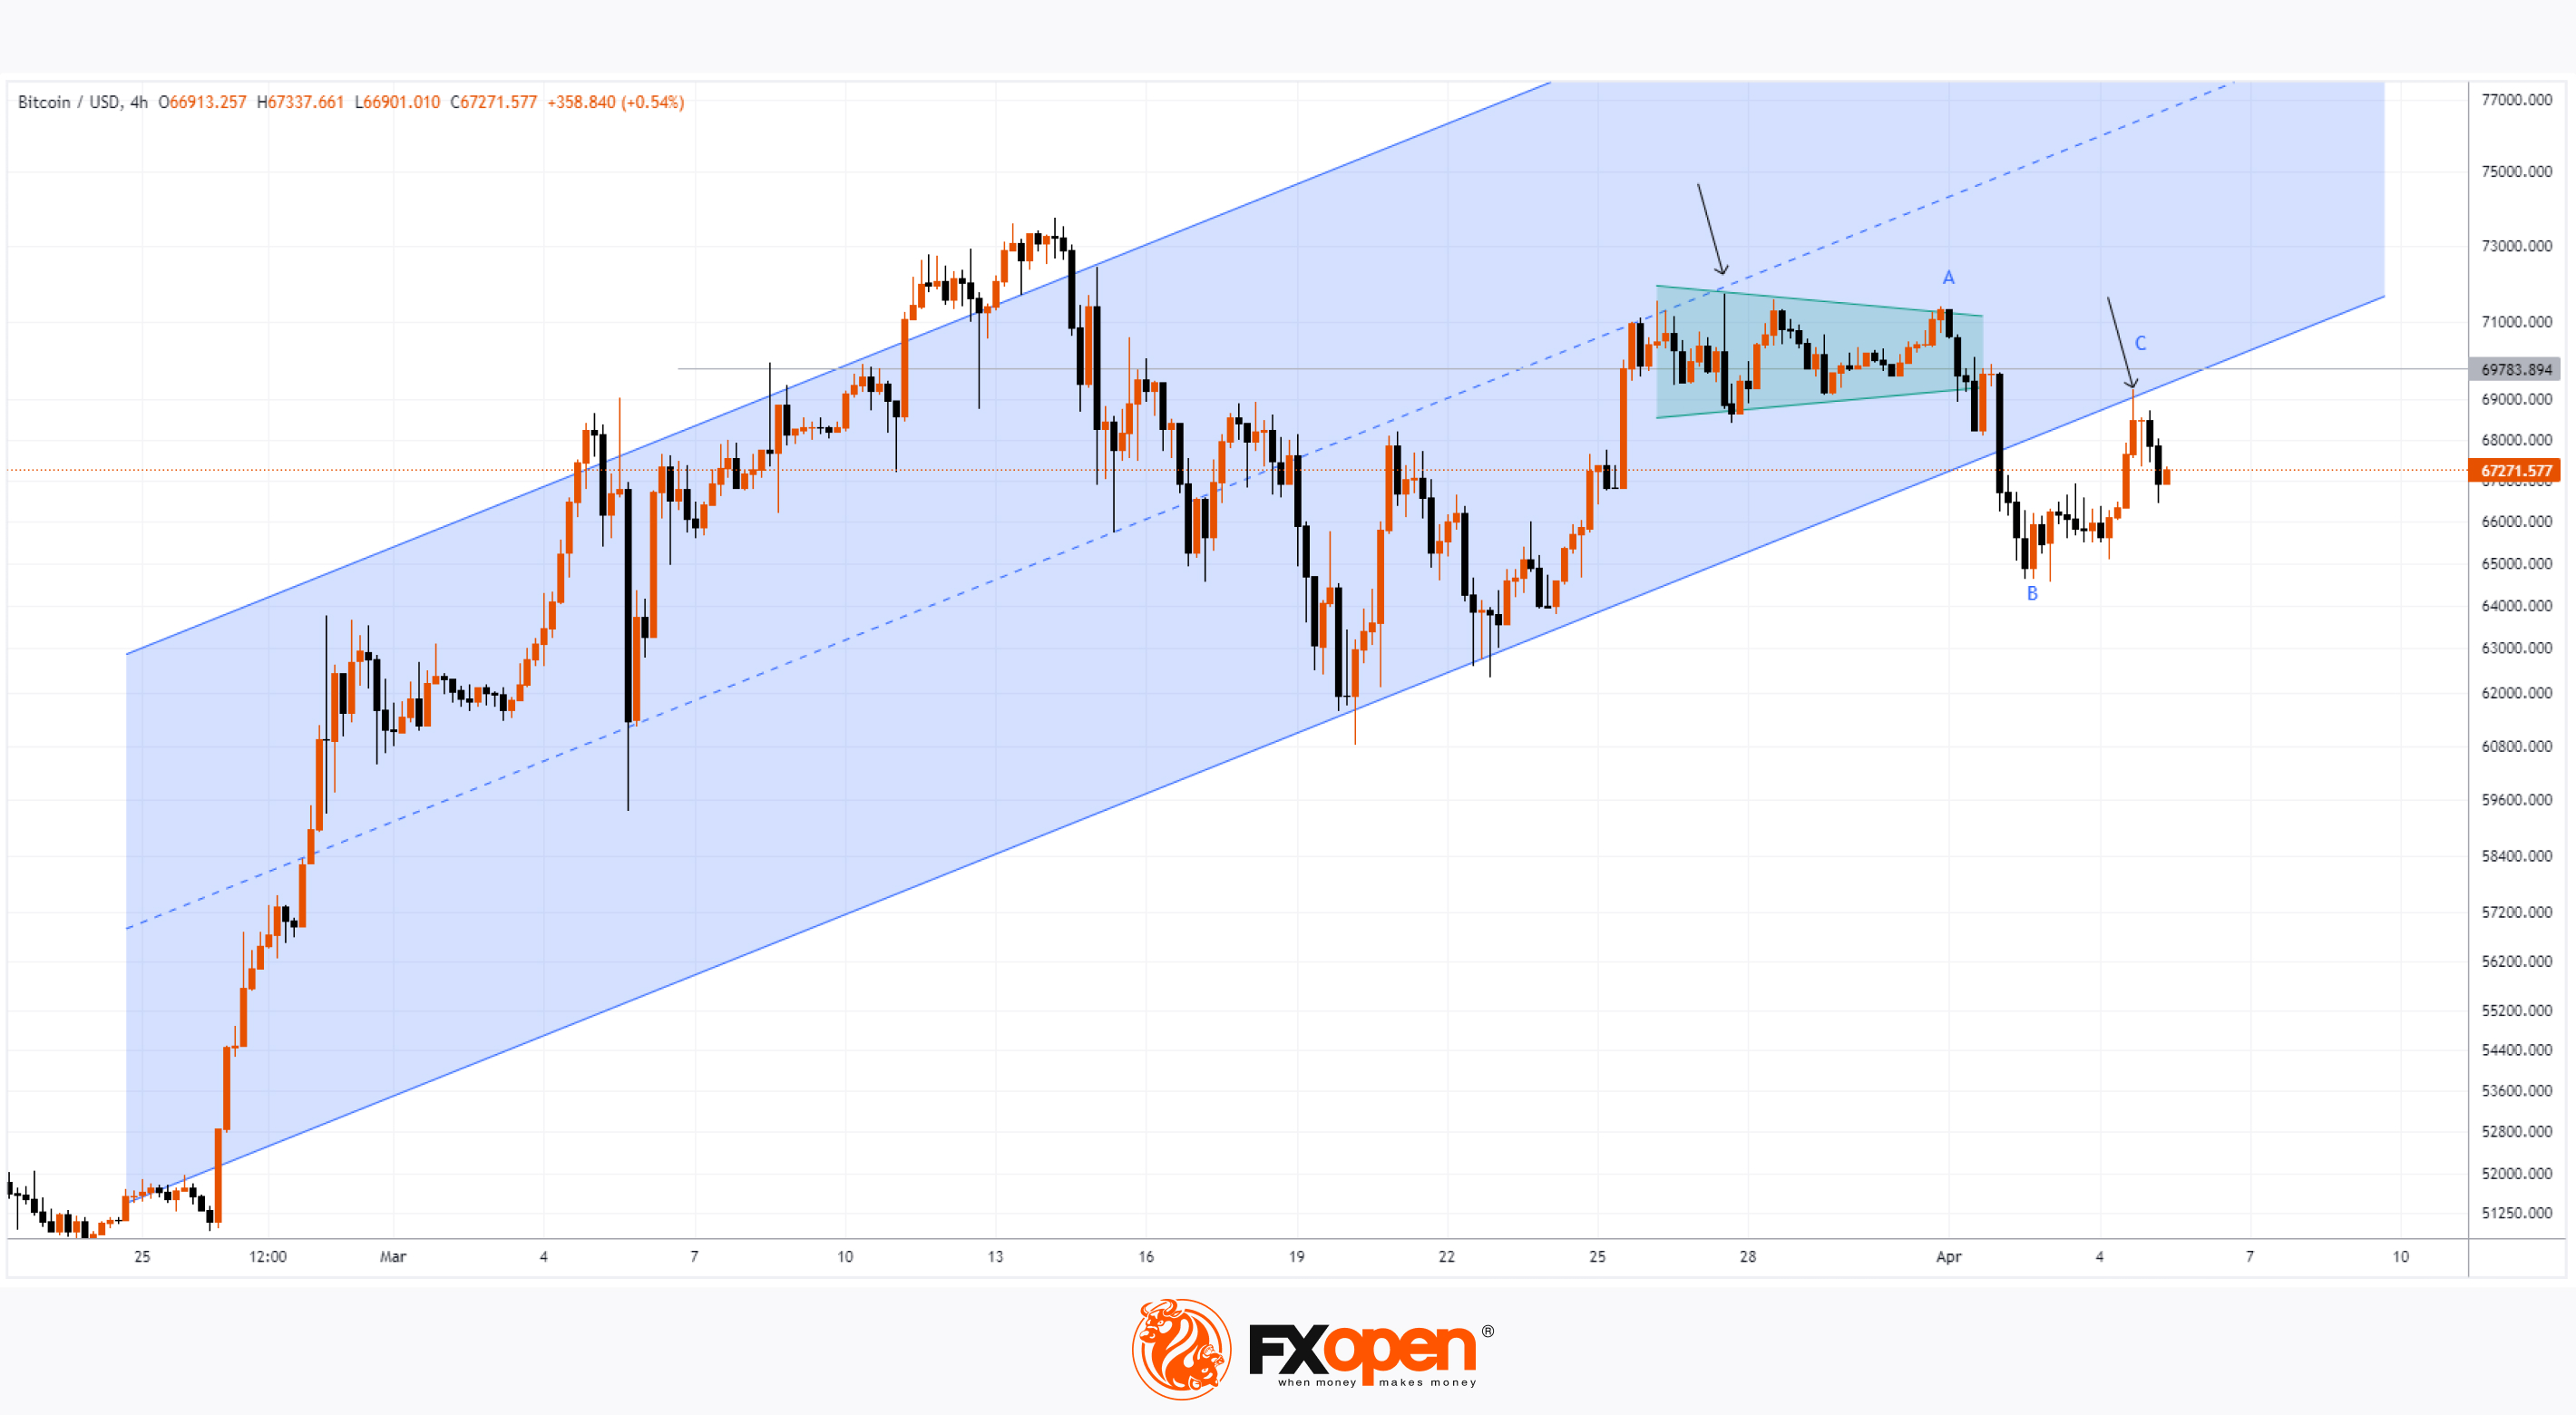
Technical analysis of the BTC/USD chart with new data on the behavior of Bitcoin prices today relative to the previously designated levels and lines shows that bearish arguments are becoming more convincing:
→ the median line of the ascending channel acted as resistance (shown by the first arrow);
→ the price has formed a consolidation zone (shown in green) with a subsequent bearish exit from it;
→ after a bearish breakdown of the lower border of the ascending channel, it showed signs of resistance (shown by the second arrow);
→ the increase in B→C is about 50% of the decrease in A→B, which corresponds to the proportion of the normal intermediate recovery within the dominant bearish trend.
Attempts to reach the level of USD 70k for Bitcoin in April were unsuccessful. The inability of the cryptocurrency price to demonstrate bullish dynamics is alarming due to the approaching halving, which is considered a positive factor influencing the price of Bitcoin.
It is possible that further developments will provide more turning points for building a downward channel.
FXOpen offers the world's most popular cryptocurrency CFDs*, including Bitcoin and Ethereum. Floating spreads, 1:2 leverage — at your service. Open your trading account now or learn more about crypto CFD trading with FXOpen.
*At FXOpen UK and FXOpen AU, Cryptocurrency CFDs are only available for trading by those clients categorised as Professional clients under FCA Rules and Professional clients under AFSL 412871 – ABN 61 143 678 719 respectively. They are not available for trading by Retail clients.
CFDs are complex instruments and come with a high risk of losing your money.
This article represents the opinion of the Companies operating under the FXOpen brand only. It is not to be construed as an offer, solicitation, or recommendation with respect to products and services provided by the Companies operating under the FXOpen brand, nor is it to be considered financial advice.
👍3
#BTCUSD #bitcoin #cryptonews #crypto #MarketNews
BTC/USD Analysis: Bitcoin Price Rises Ahead of Halving
The halving (reduction of block mining rewards) is expected to occur on April 19-20.
Theoretically, Bitcoin mining will become less profitable, leading to a reduction in coin supply. Given unchanged demand, this should drive up the BTC/USD price. Ripple CEO Brad Garlinghouse has forecasted that the cryptocurrency market cap will double by the end of 2024, reaching $5 trillion, with Bitcoin's halving contributing to this growth.
In practice, Bitcoin price is influenced by too many factors to conclusively prove the bullish impact of halving. For instance, looking at history, the last halving occurred on May 11, 2020, and the price increased by approximately 12% in the following week. On the other hand, today's Bitcoin price might already reflect the imminent halving.
Nevertheless, the market currently shows predominantly positive sentiment, as over the weekend, BTC/USD price rose by around 2.5%.
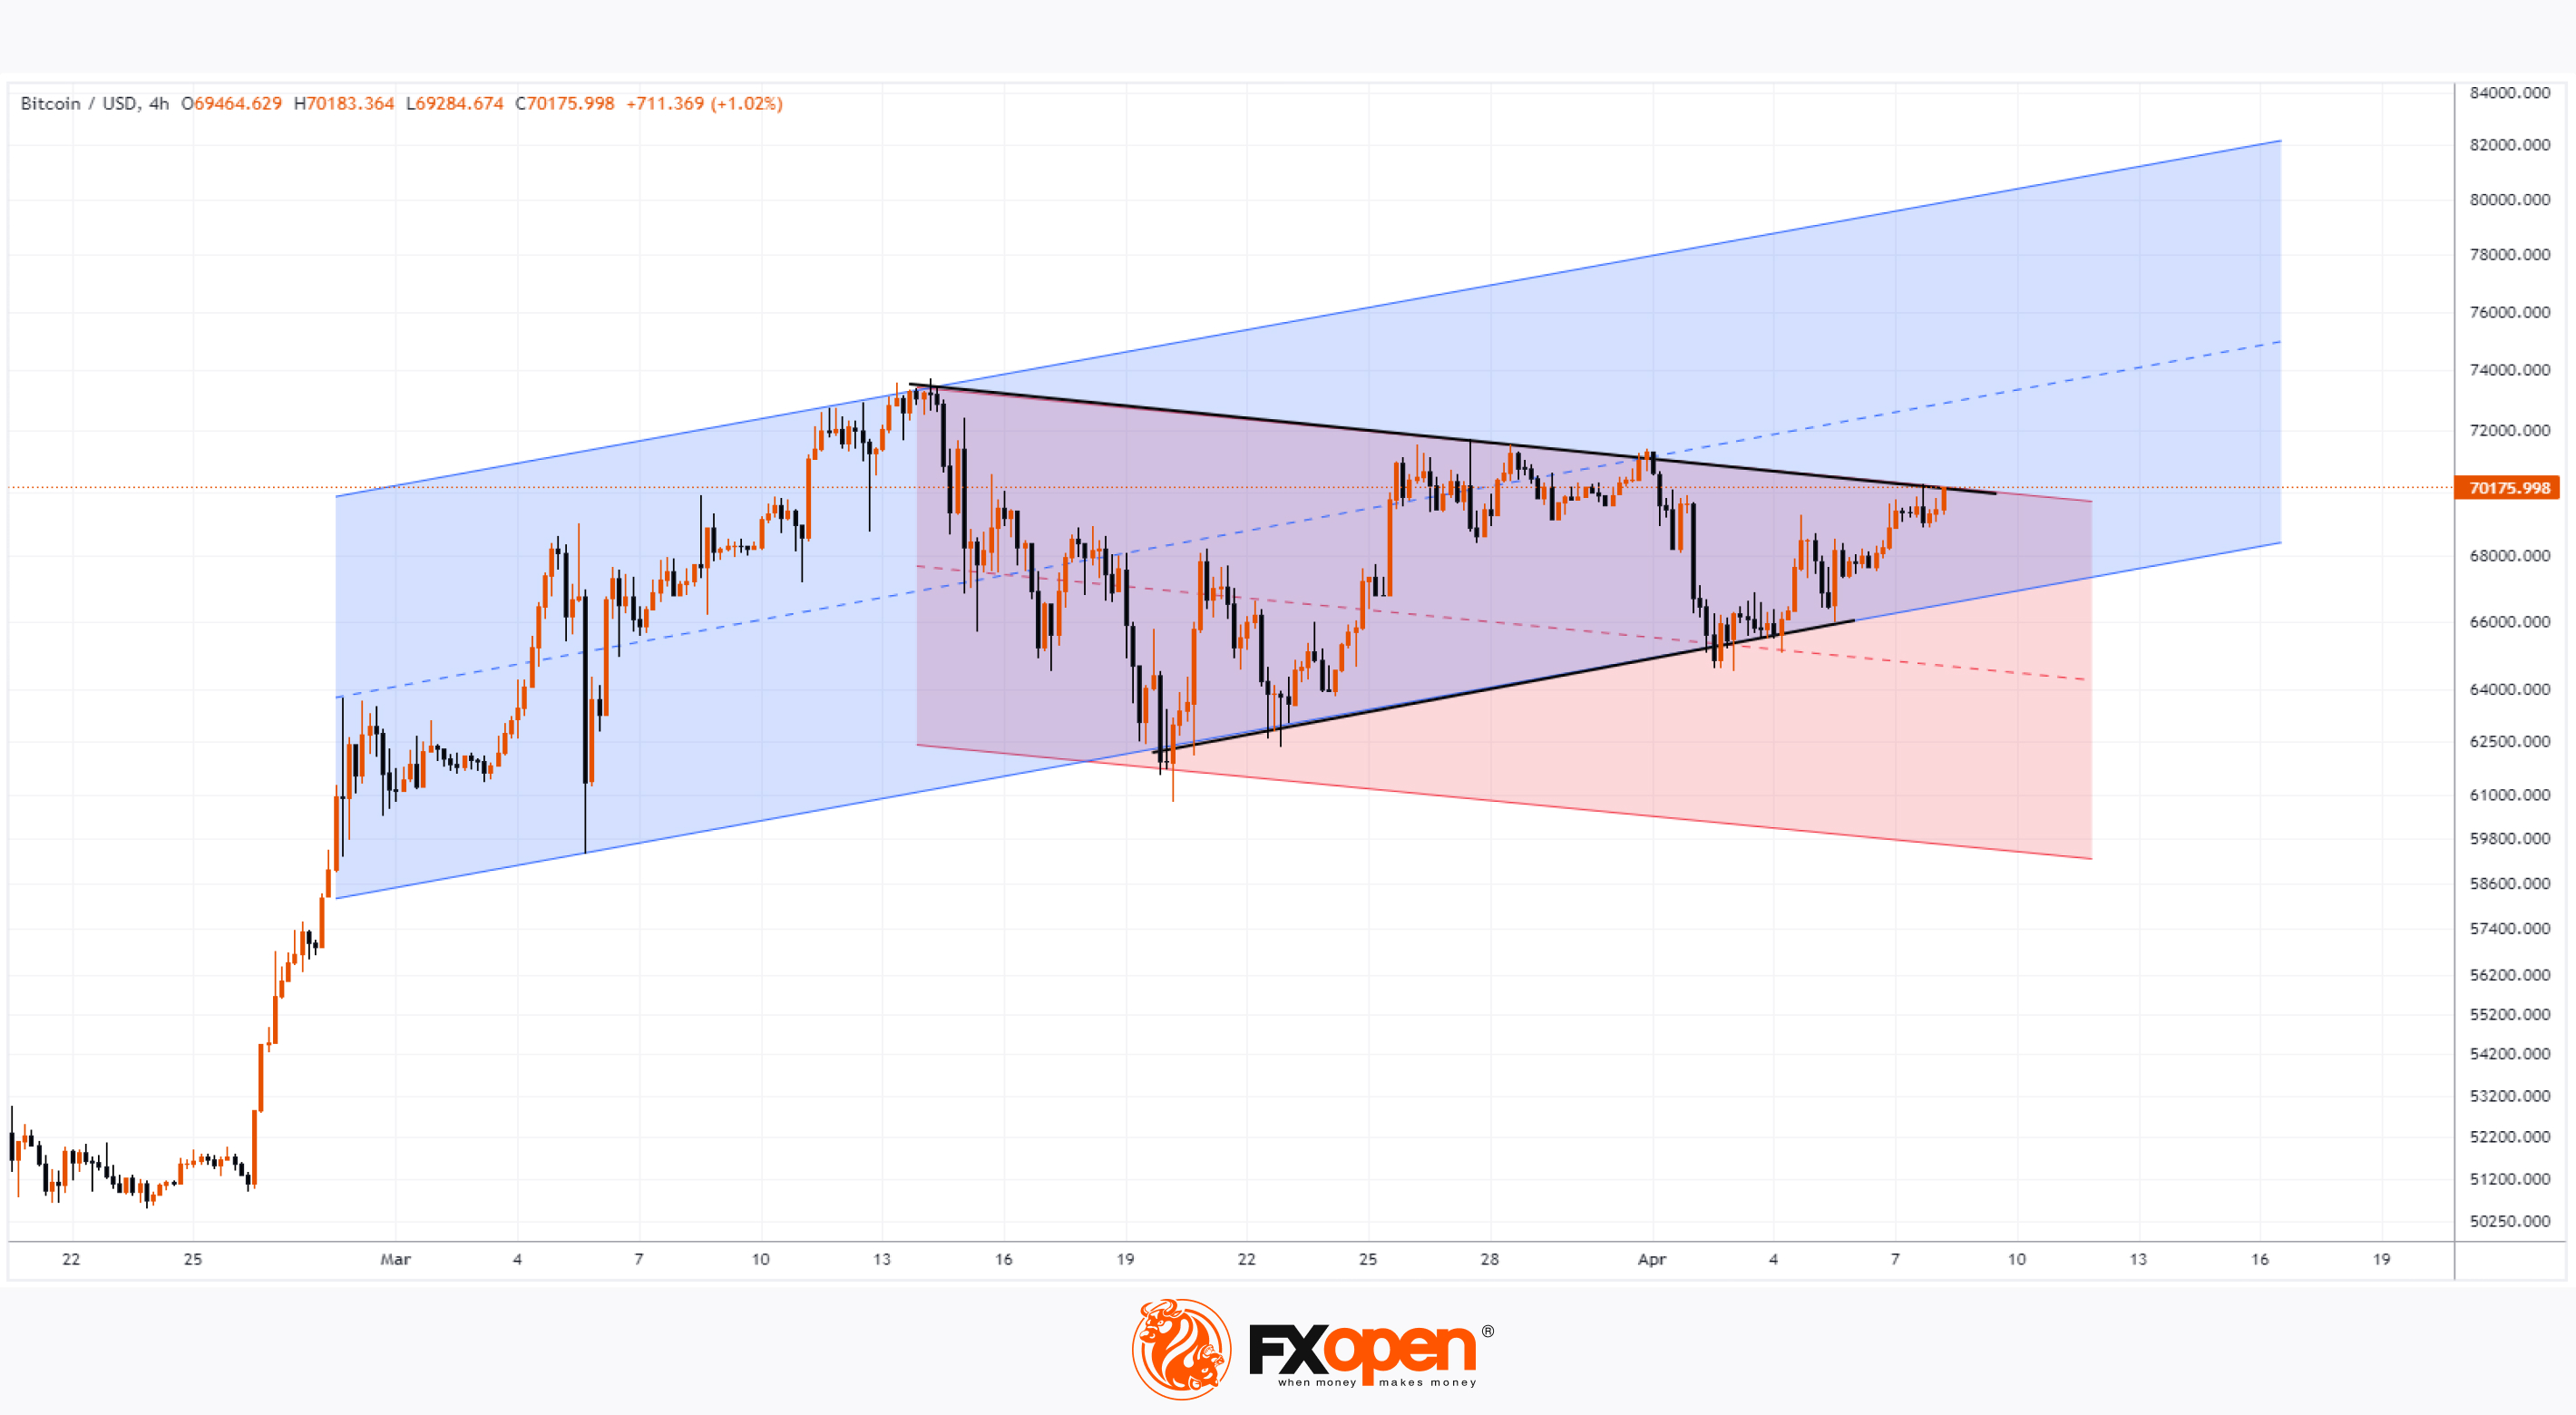
According to the technical analysis of the BTC/USD chart today:
→ From April 2-4, there was no downward pressure on the market to push the price below the lower boundary of the ascending channel (shown in blue), which remains relevant.
→ Conversely, a series of higher lows forming since April 2 indicates bullish intentions to break above the descending channel (shown in red).
Therefore, the approaching halving and associated positive expectations could lead to:
→ Breaking above the consolidating zone (shown with black lines).
→ Overcoming a significant resistance level near the psychological mark of $70,000 per coin.
In this scenario, the nearest target for bulls could be the median line of the blue ascending channel.
FXOpen offers the world's most popular cryptocurrency CFDs*, including Bitcoin and Ethereum. Floating spreads, 1:2 leverage — at your service. Open your trading account now or learn more about crypto CFD trading with FXOpen.
*At FXOpen UK and FXOpen AU, Cryptocurrency CFDs are only available for trading by those clients categorised as Professional clients under FCA Rules and Professional clients under AFSL 412871 – ABN 61 143 678 719 respectively. They are not available for trading by Retail clients.
CFDs are complex instruments and come with a high risk of losing your money.
This article represents the opinion of the Companies operating under the FXOpen brand only. It is not to be construed as an offer, solicitation, or recommendation with respect to products and services provided by the Companies operating under the FXOpen brand, nor is it to be considered financial advice.
👍3
#marketanalysis #cryptonews #crypto
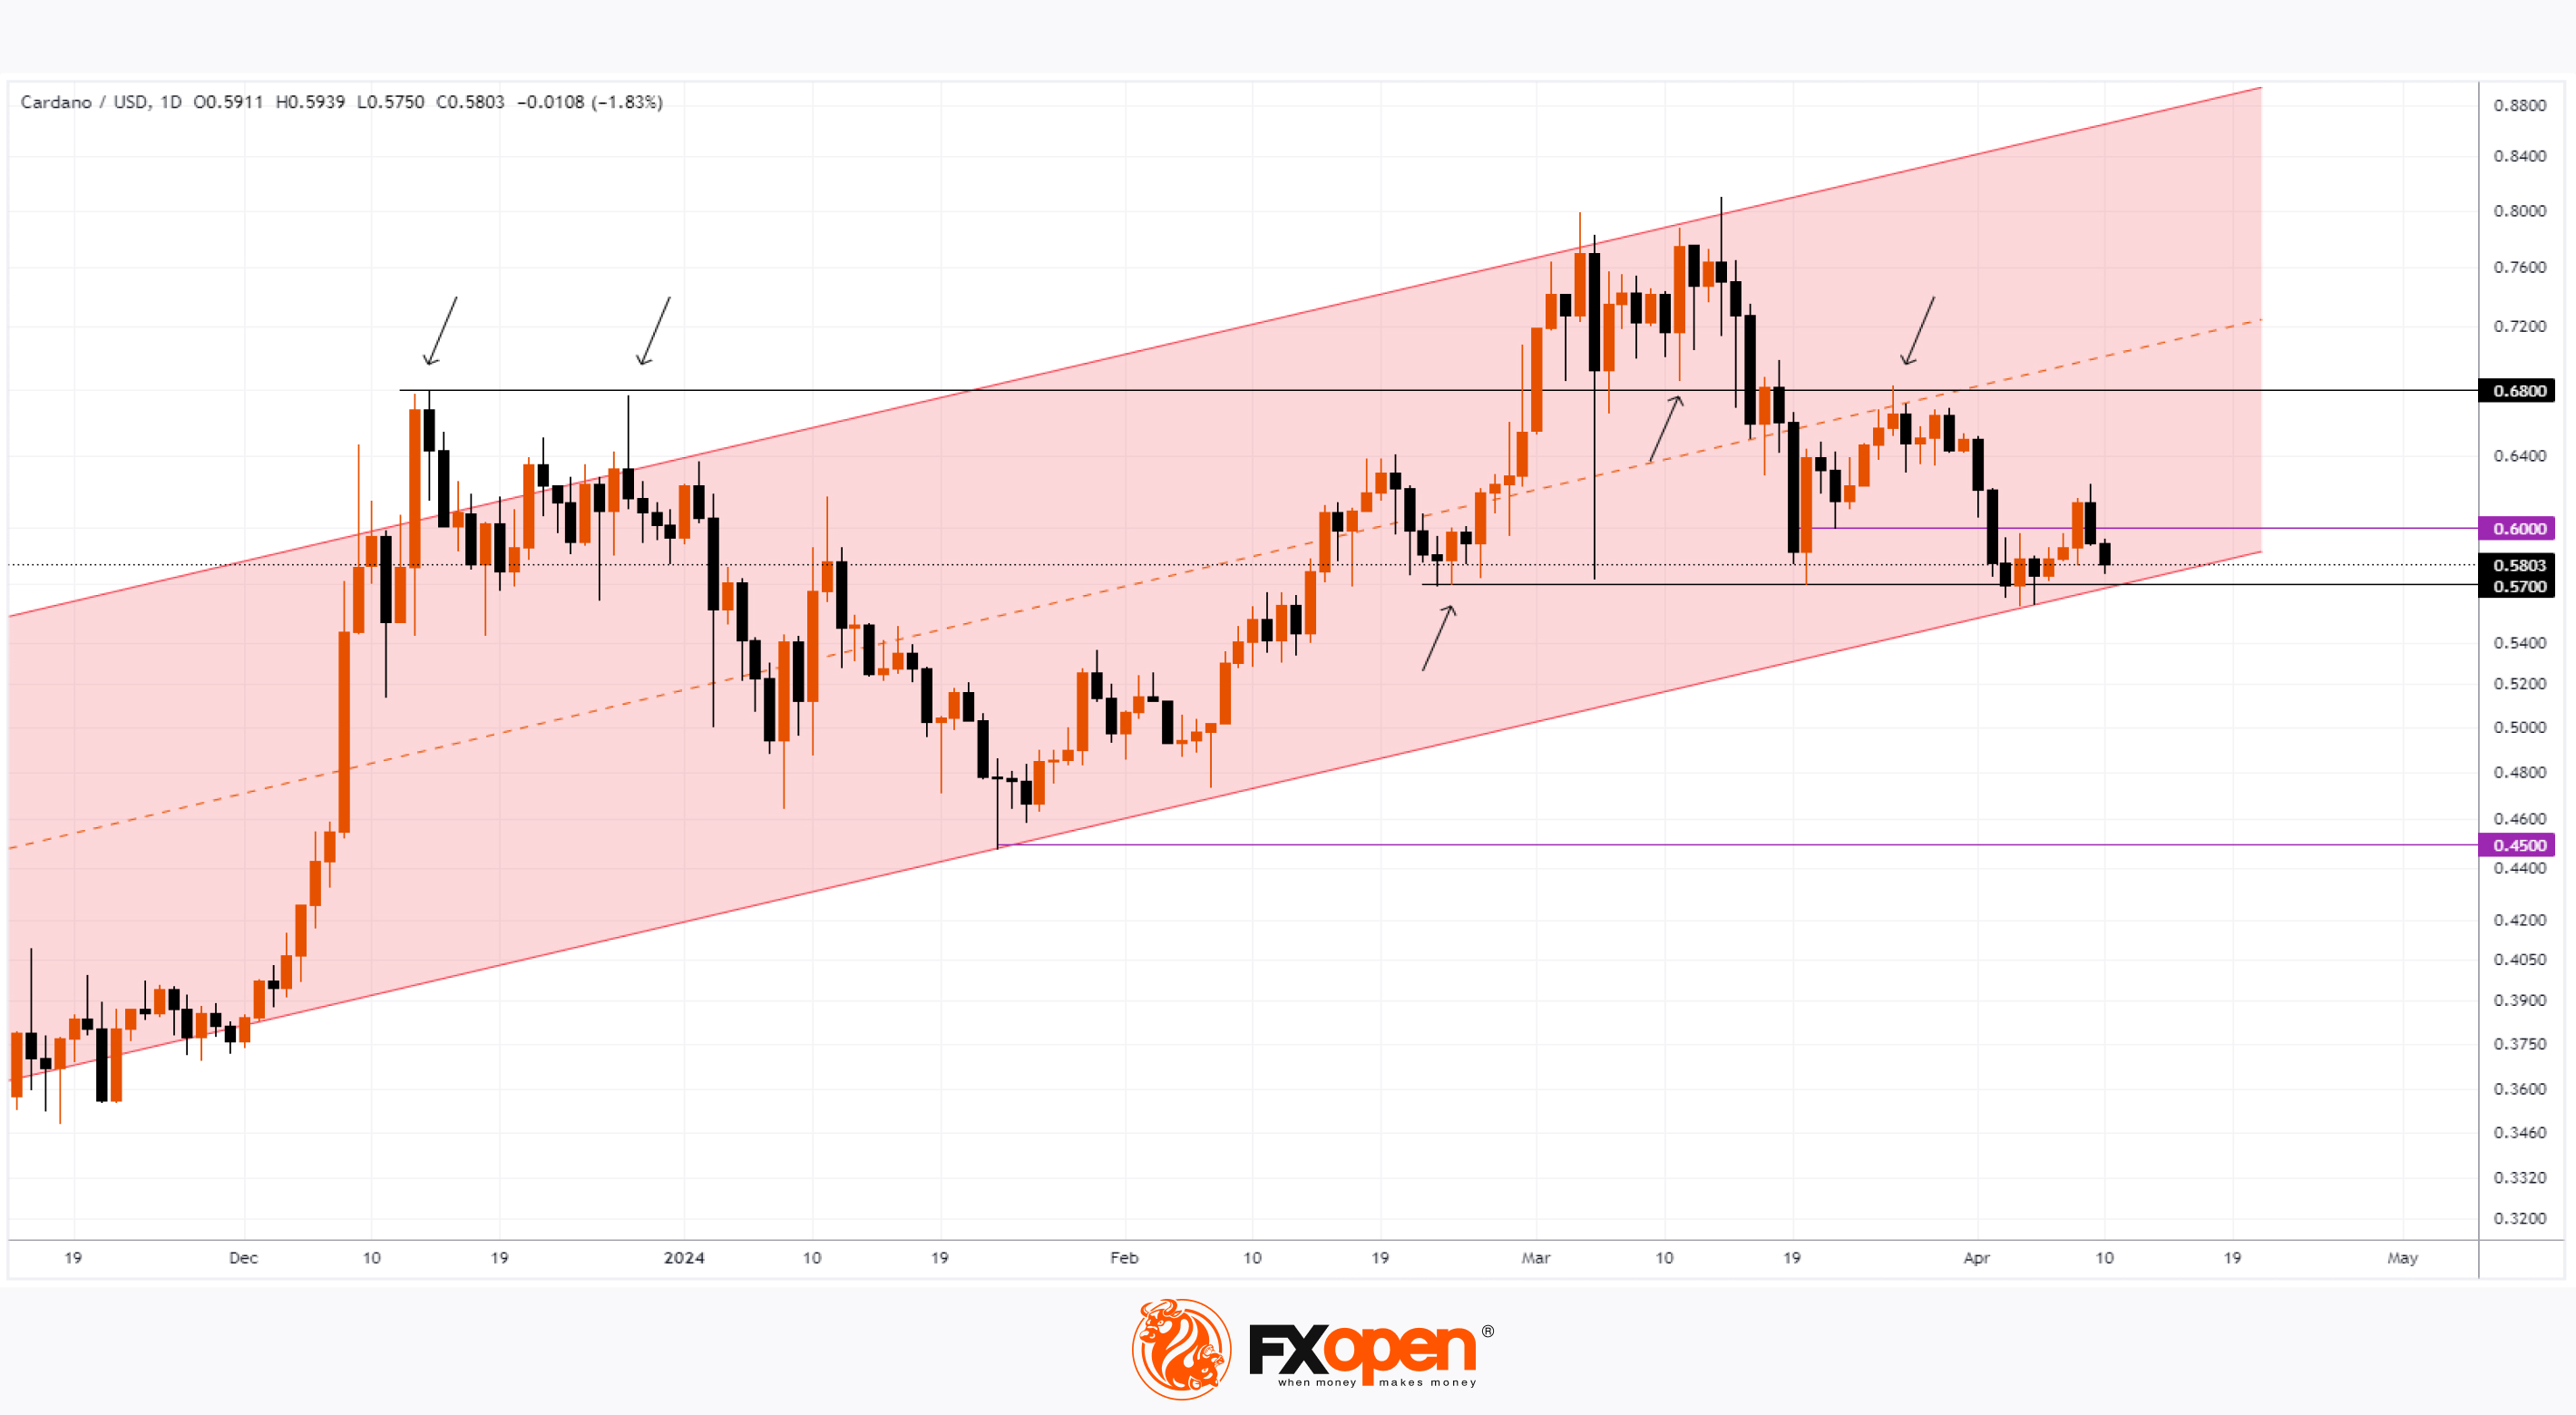
ADA Drops to Last Place in the Top 10 Cryptocurrencies
ADA, the native blockchain token of the Cardano network, has dropped to 10th place among the cryptocurrencies with the largest capitalization. Today, according to CoinMarketCap, the capitalization of Cardano (ADA) is USD 20.7 billion.
On the one hand, this happened due to the success of such competitors as:
→ Dogecoin (DOGE) with a capitalization of USD 27.1 billion, approximately +108% since the beginning of the year;
→ Toncoin (TON) with a capitalization of USD 23.7 billion, approximately +193% since the beginning of the year.
On the other hand, the ADA/USD rate behaves weaker than other cryptocurrencies. Year to date, it has dropped by several percent since January 1, 2024. And this is against the background of a bull market, which should greatly confuse investors.
Will Cardano (ADA) be able to strengthen its position in the top 10 cryptocurrencies?
Bulls' hopes may be tied to the approaching Chang update (expected in the second quarter of 2024), which will implement the concept of a self-governing community on the blockchain by introducing delegate representatives (DReps) and community voting to approve the first draft of the Cardano Constitution.
Technical analysis of the ADA/USD chart today shows more bearish signals:
→ the price of ADA/USD moves within the ascending channel;
→ the important level USD 0.6800 again acts as resistance (as shown by the arrows);
→ the price tried to push off from the lower border of the channel, but was unable to gain a foothold above the psychological level of USD 0.6000.
The level of USD 0.5700, reinforced by the lower border of the channel, acts as the most important support in such a situation - its breakdown will open the way to the psychological level of 0.5000 and the minimum of the year in the area of 0.4500.
Given the failure of the ADA/USD price to follow trends in the cryptocurrency bull market in early 2024, such a scenario looks likely.
FXOpen offers the world's most popular cryptocurrency CFDs*, including Bitcoin and Ethereum. Floating spreads, 1:2 leverage — at your service. Open your trading account now or learn more about crypto CFD trading with FXOpen.
*At FXOpen UK and FXOpen AU, Cryptocurrency CFDs are only available for trading by those clients categorised as Professional clients under FCA Rules and Professional clients under AFSL 412871 – ABN 61 143 678 719 respectively. They are not available for trading by Retail clients.
CFDs are complex instruments and come with a high risk of losing your money.
This article represents the opinion of the Companies operating under the FXOpen brand only. It is not to be construed as an offer, solicitation, or recommendation with respect to products and services provided by the Companies operating under the FXOpen brand, nor is it to be considered financial advice.
👍2
#marketanalysis #stockmarket #crypto
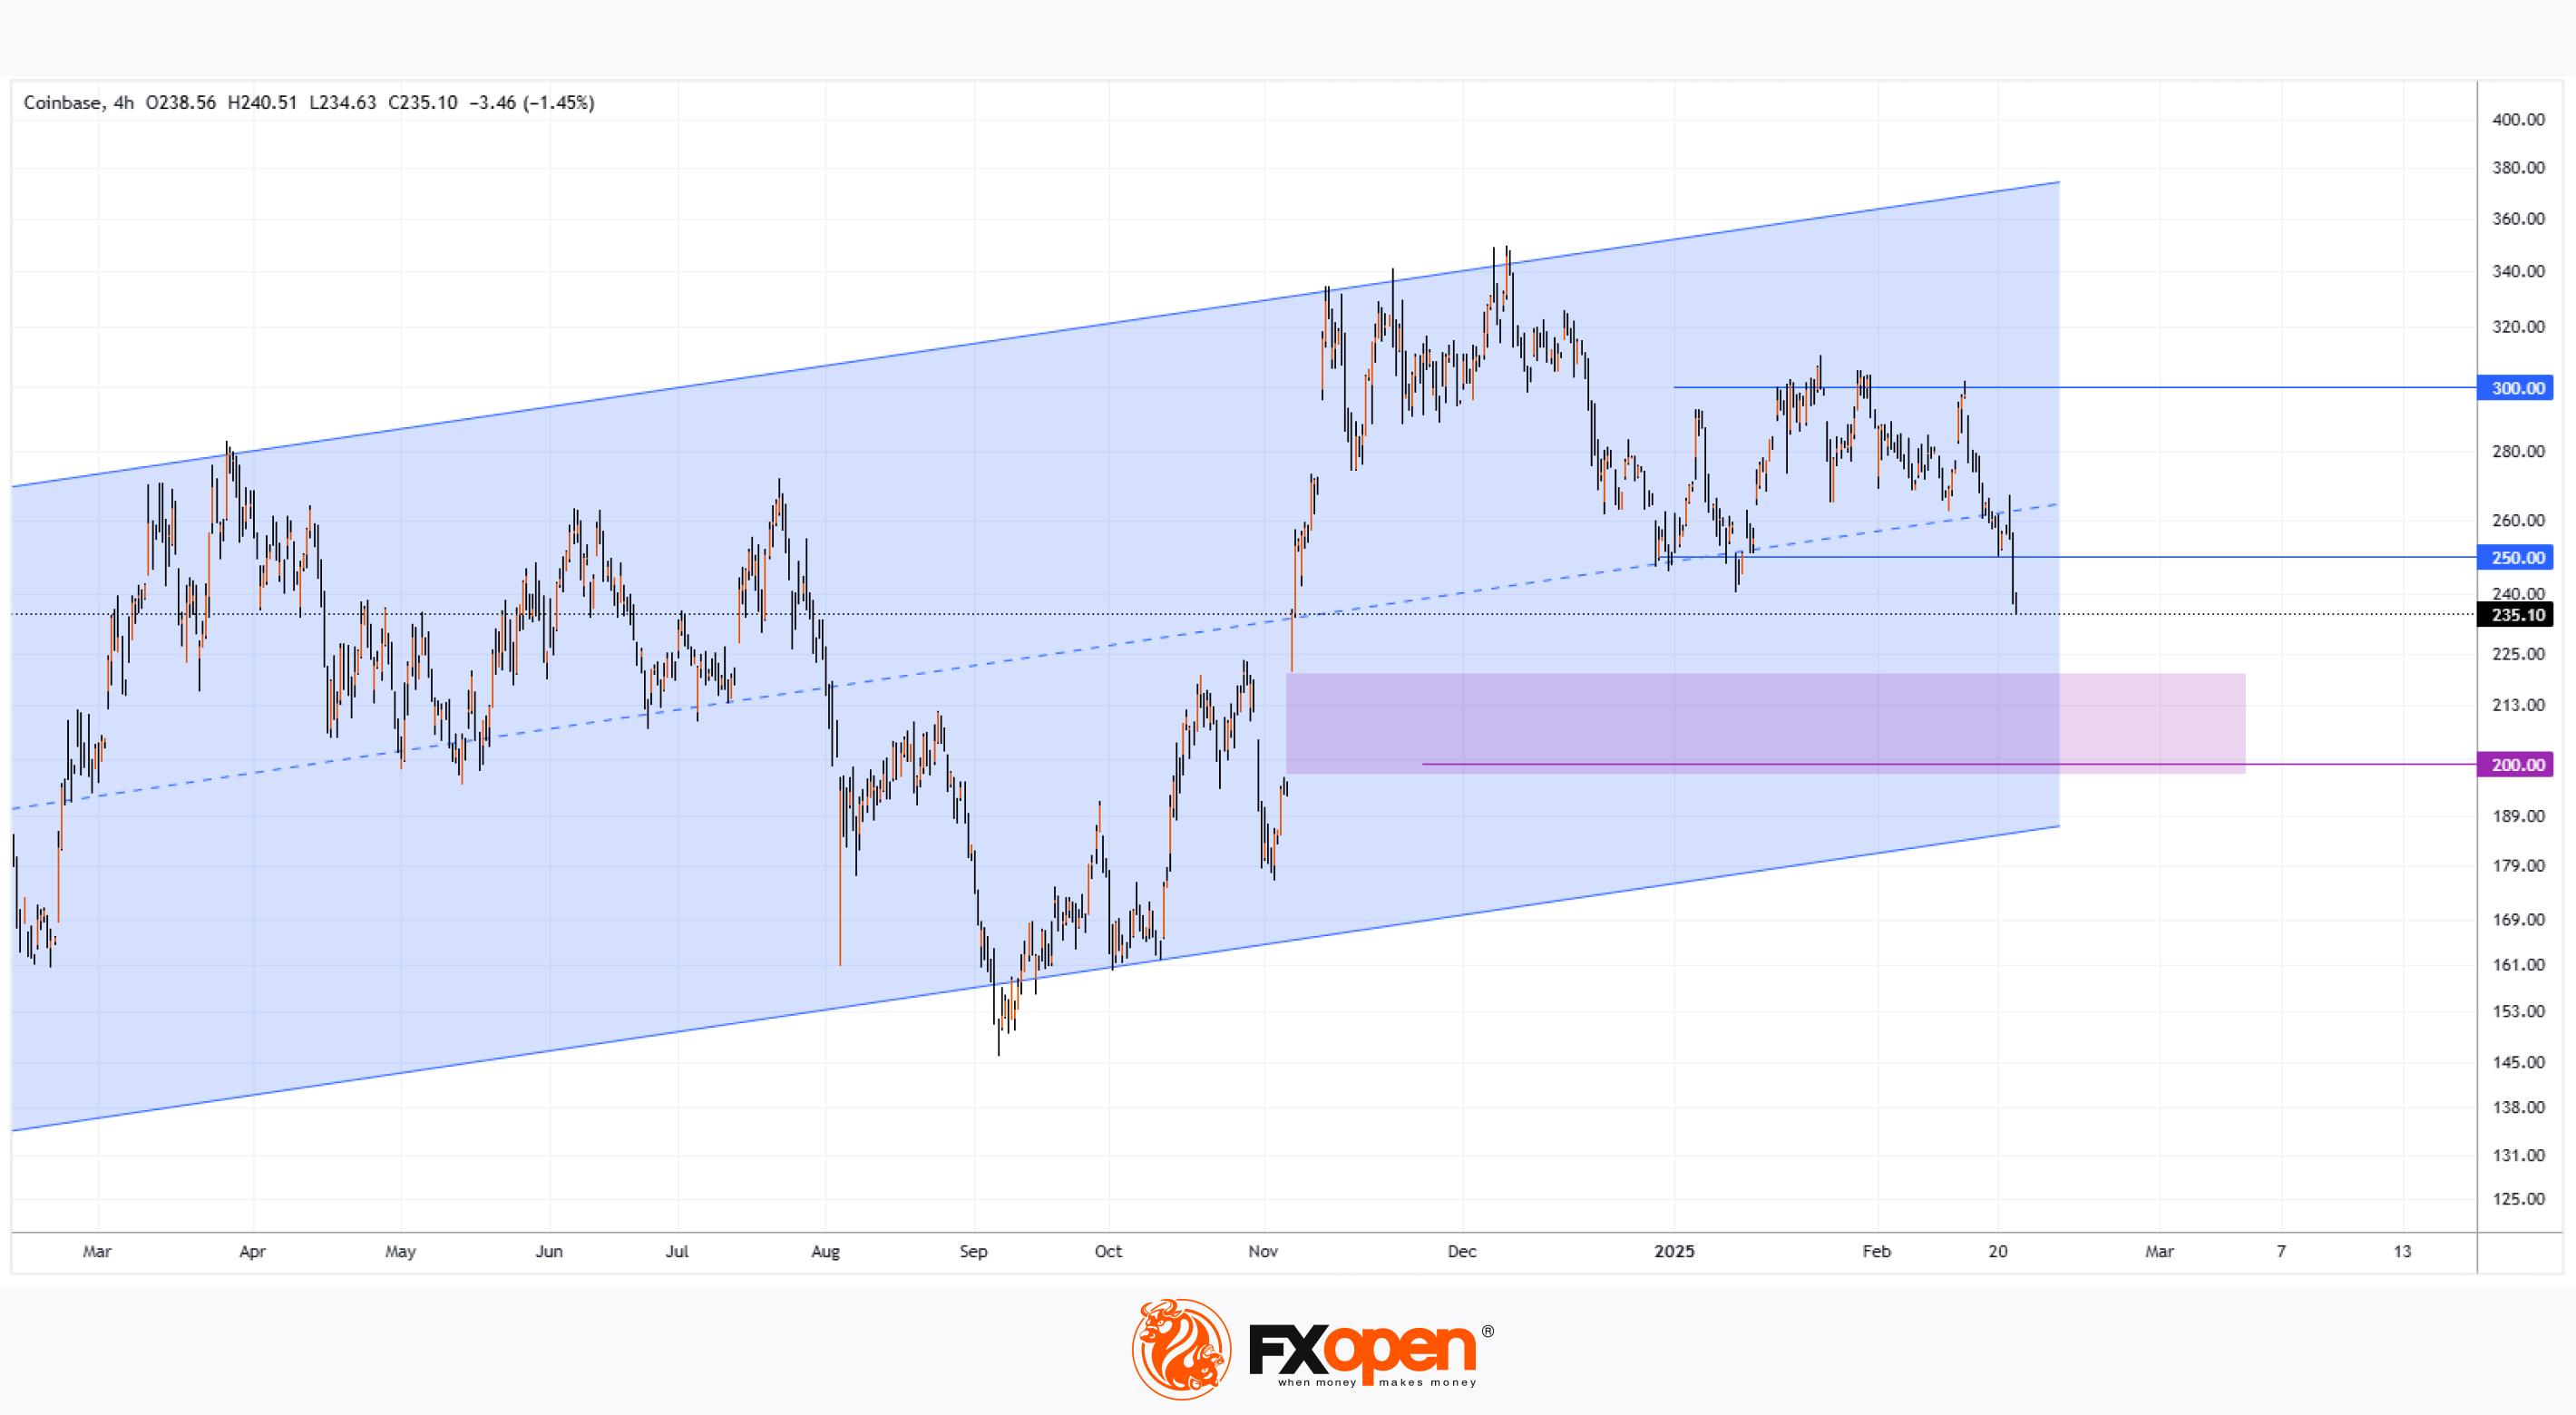
Coinbase (COIN) Shares Drop to Three-Month Low
The Coinbase (COIN) chart shows that, for the first time in 2025, the share price has fallen below the psychological $250 level.
Bearish factors impacting COIN:
One key factor driving negative sentiment is the confirmed hack of the ByBit cryptocurrency exchange, raising concerns about deposit security in the industry. According to media reports:
→ The attack may have been carried out by North Korean hacker group Lazarus.
→ Hackers allegedly drained Ethereum tokens worth between $1 billion and $5 billion from ByBit’s wallet.
→ This is the largest crypto hack in history.
Another factor is growing concerns about the US economy, which have negatively impacted stock markets. As reported by Reuters:
→ The S&P 500 index (US SPX 500 mini on FXOpen) fell by 1.66% on Friday, marking its worst performance of the year.
→ The decline followed a drop in Walmart’s share price and weak consumer sentiment data.
→ Friday’s Purchasing Managers’ Index (PMI) figures were below previous levels. Investors are now focusing on this week’s release of the Personal Consumption Expenditures (PCE) price index—the Federal Reserve’s preferred inflation gauge.
Technical Analysis of Coinbase (COIN) Chart
COIN price movements form an upward channel (marked in blue), but several bearish signals are emerging:
→ The price has dropped into the lower half of the channel.
→ The psychological resistance level has shifted from $300 to potentially $250.
If bearish sentiment persists, COIN’s share price could fall further towards a support zone consisting of:
→ A bullish gap (marked in purple).
→ The lower boundary of the blue channel.
→ The psychological $200 level.
Coinbase (COIN) Price Forecast
Wall Street analysts remain cautiously optimistic following Coinbase’s quarterly earnings report on 13 February, which exceeded expectations.
According to TipRanks:
→ 10 out of 21 analysts recommend buying COIN.
→ The average 12-month price target for COIN is $350.
Trade global index CFDs with zero commission and tight spreads. Open your FXOpen account now or learn more about trading index CFDs with FXOpen.
CFDs are complex instruments and come with a high risk of losing your money.
This article represents the opinion of the Companies operating under the FXOpen brand only. It is not to be construed as an offer, solicitation, or recommendation with respect to products and services provided by the Companies operating under the FXOpen brand, nor is it to be considered financial advice.
👍2
Media is too big
VIEW IN TELEGRAM
Daily Market News with FXOpen - 23 February 2026
🔸 European stocks to start the week lower as markets react to new Trump tariffs;
🔸 Bitcoin falls below $65,000 in latest bout of tariff uncertainty;
🔸 Dollar dips as court ruling upends US tariff wall.
CFDs are complex instruments and come with a high risk of losing money rapidly due to leverage. You should consider whether you understand how CFDs work, and whether you can afford to take the high risk of losing your money. You can find the full disclaimer here: www.fxopen.com.
Cryptocurrency CFDs are not available to Retail clients at FXOpen UK.
#StockMarket #EuropeStocks #TradeNews #Tariffs #Bitcoin #Crypto #Dollar #Forex #Markets
👍5