
#interestrate #audusd #usdcad #gbpusd #ukinflation #preciousmetals #goldprice #xauusd #silverprice #xagusd #earningsreports #stockmarket #marketinsights
Market Insights with Gary Thomson: RBA Rates, UK and Canada’s Inflation, Metals, Earnings Reports
In this video, we’ll explore the key economic events, market trends, and corporate news shaping the financial landscape. Get ready for expert insights into forex, commodities, and stocks to help you navigate the week ahead. Let’s dive in!
In this episode:
🔸RBA Interest Rate Decision
The official cash rate has been at 4.35% for over a year. Will the Reserve Bank of Australia cut interest rates? Discover the potential impacts on the AUD/USD pair.
🔸Canada’s Inflation Rate
With Canada's inflation data ahead, will low inflation calm the market, or could tariff concerns drive prices higher? Watch for CAD reaction.
🔸UK Inflation Rate
With UK inflation data ahead, will it support further rate cuts? Market reactions could be key for GBP movement.
🔸Precious Metals Price Fluctuations
Gold hits new highs amid uncertainty—will the rally continue or correct? Silver also gains, but will tariffs drive further price moves?
🔸Corporate Earnings Statements
Walmart and Alibaba are releasing their quarterly results. Check their expected performance and market implications.
https://cutt.ly/8rwtEhTq
To take advantage of price fluctuations in the foreign exchange markets, consider enlisting the services of a reliable broker like FXOpen.
⚠️
This forecast represents FXOpen Companies opinion only, it should not be construed as an offer, invitation or recommendation in respect to FXOpen Companies products and services or as financial advice.
Market Insights with Gary Thomson: RBA Rates, UK and Canada’s Inflation, Metals, Earnings Reports
In this video, we’ll explore the key economic events, market trends, and corporate news shaping the financial landscape. Get ready for expert insights into forex, commodities, and stocks to help you navigate the week ahead. Let’s dive in!
In this episode:
🔸RBA Interest Rate Decision
The official cash rate has been at 4.35% for over a year. Will the Reserve Bank of Australia cut interest rates? Discover the potential impacts on the AUD/USD pair.
🔸Canada’s Inflation Rate
With Canada's inflation data ahead, will low inflation calm the market, or could tariff concerns drive prices higher? Watch for CAD reaction.
🔸UK Inflation Rate
With UK inflation data ahead, will it support further rate cuts? Market reactions could be key for GBP movement.
🔸Precious Metals Price Fluctuations
Gold hits new highs amid uncertainty—will the rally continue or correct? Silver also gains, but will tariffs drive further price moves?
🔸Corporate Earnings Statements
Walmart and Alibaba are releasing their quarterly results. Check their expected performance and market implications.
https://cutt.ly/8rwtEhTq
To take advantage of price fluctuations in the foreign exchange markets, consider enlisting the services of a reliable broker like FXOpen.
⚠️
This forecast represents FXOpen Companies opinion only, it should not be construed as an offer, invitation or recommendation in respect to FXOpen Companies products and services or as financial advice.
YouTube
Market Insights with Gary Thomson: RBA Rates, UK and Canada’s Inflation, Metals, Earnings Reports
In this video, we’ll explore the key economic events, market trends, and corporate news shaping the financial landscape. Get ready for expert insights into forex, commodities, and stocks to help you navigate the week ahead. Let’s dive in!
In this episode:…
In this episode:…
👍3
#forextrading #tradingtips #MarketUpdates #marketanalysis
AUD/USD Trades Near Year’s High After RBA Decision
Today, the Reserve Bank of Australia (RBA) eased monetary policy, cutting the interest rate from 4.35% to 4.10%, according to Forex Factory.
As reported by Reuters:
→ This marks the first easing since the 2020 pandemic;
→ RBA Governor Michele Bullock stated that market expectations for two more cuts this year are “ambitious”;
→ The bank’s leadership remains cautious about further easing prospects.
While analysts had accurately predicted the February rate cut, AUD/USD saw volatility without a significant move, possibly because market participants are more focused on Trump’s tariff plans, which could impact global trade and Forex markets.
Technical Analysis of AUD/USD Today
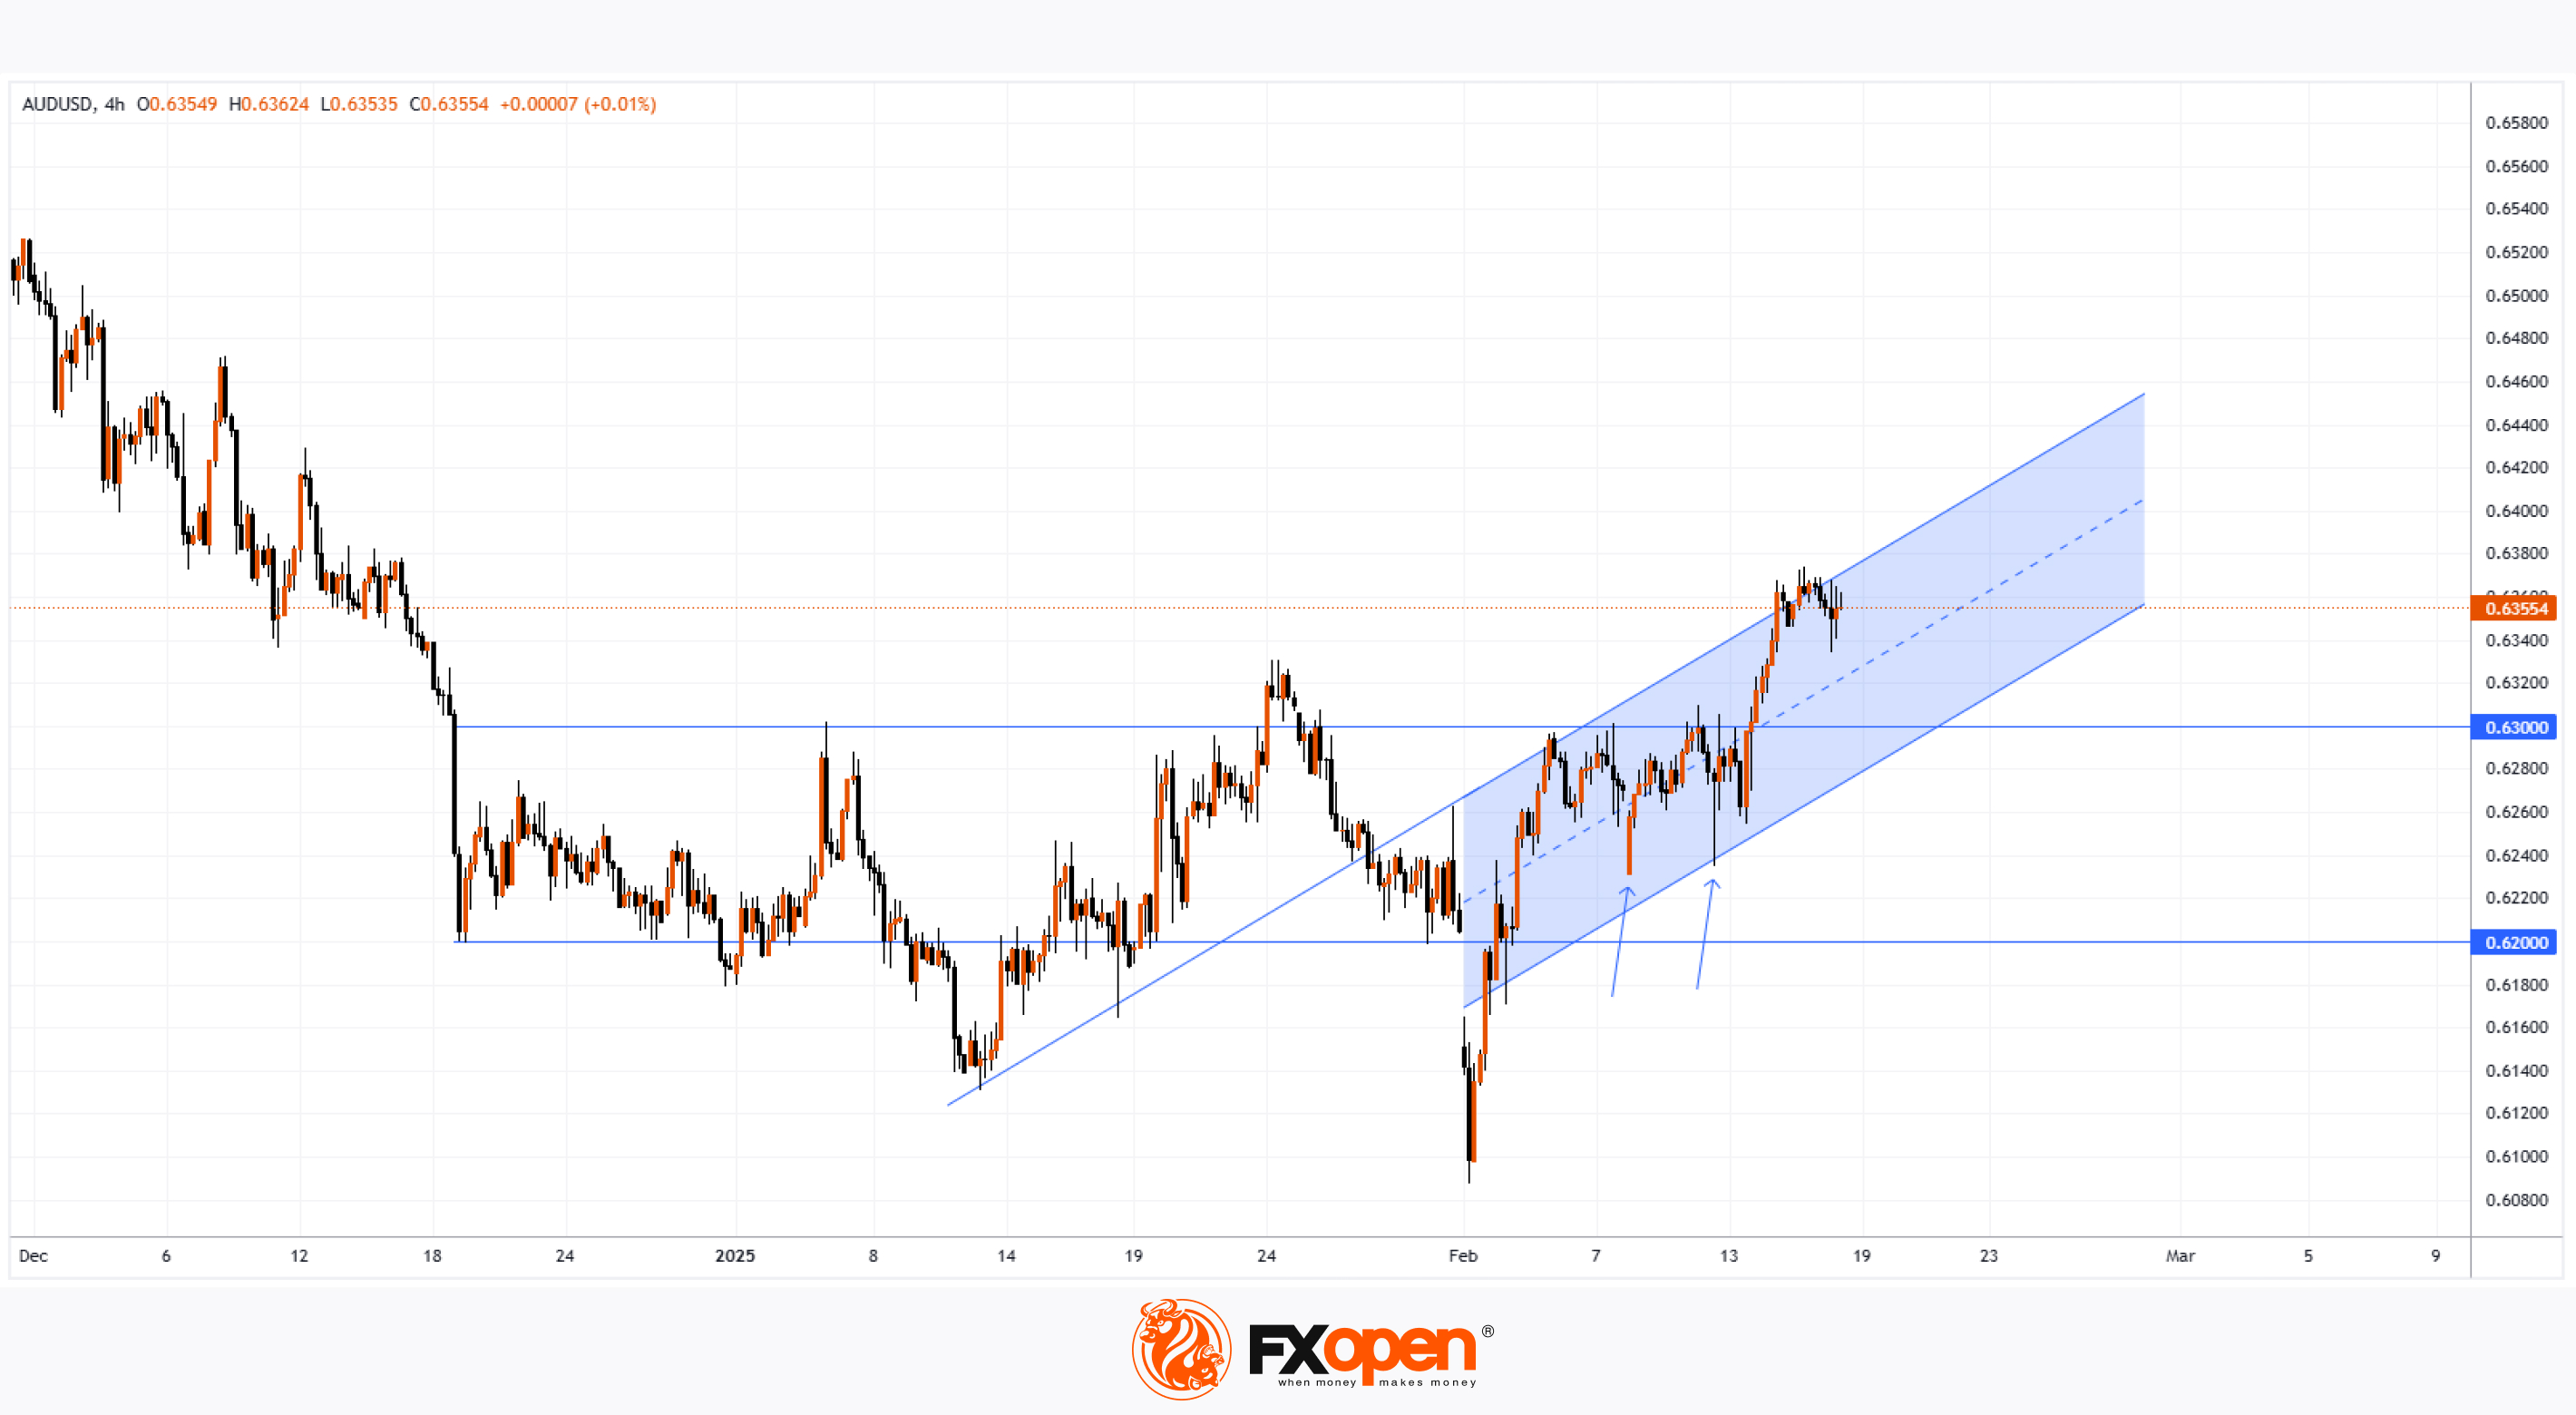
Since mid-December, the AUD/USD pair has mostly traded within the 0.6200–0.6300 range, except for early February’s sharp drop when Trump’s tariff policies shook currency markets.
However, demand appears resilient:
→ After plunging to around 0.6100, the price quickly rebounded into the range;
→ Arrows highlight rapid recoveries after short-term dips;
→ A blue ascending trend channel is forming on the chart.
These factors suggest growing appeal for the Australian dollar, with the 0.6300 level potentially acting as support going forward.
Trade over 50 forex markets 24 hours a day with FXOpen. Take advantage of low commissions, deep liquidity, and spreads from 0.0 pips. Open your FXOpen account now or learn more about trading forex with FXOpen.
CFDs are complex instruments and come with a high risk of losing your money.
This article represents the opinion of the Companies operating under the FXOpen brand only. It is not to be construed as an offer, solicitation, or recommendation with respect to products and services provided by the Companies operating under the FXOpen brand, nor is it to be considered financial advice.
AUD/USD Trades Near Year’s High After RBA Decision
Today, the Reserve Bank of Australia (RBA) eased monetary policy, cutting the interest rate from 4.35% to 4.10%, according to Forex Factory.
As reported by Reuters:
→ This marks the first easing since the 2020 pandemic;
→ RBA Governor Michele Bullock stated that market expectations for two more cuts this year are “ambitious”;
→ The bank’s leadership remains cautious about further easing prospects.
While analysts had accurately predicted the February rate cut, AUD/USD saw volatility without a significant move, possibly because market participants are more focused on Trump’s tariff plans, which could impact global trade and Forex markets.
Technical Analysis of AUD/USD Today
Since mid-December, the AUD/USD pair has mostly traded within the 0.6200–0.6300 range, except for early February’s sharp drop when Trump’s tariff policies shook currency markets.
However, demand appears resilient:
→ After plunging to around 0.6100, the price quickly rebounded into the range;
→ Arrows highlight rapid recoveries after short-term dips;
→ A blue ascending trend channel is forming on the chart.
These factors suggest growing appeal for the Australian dollar, with the 0.6300 level potentially acting as support going forward.
Trade over 50 forex markets 24 hours a day with FXOpen. Take advantage of low commissions, deep liquidity, and spreads from 0.0 pips. Open your FXOpen account now or learn more about trading forex with FXOpen.
CFDs are complex instruments and come with a high risk of losing your money.
This article represents the opinion of the Companies operating under the FXOpen brand only. It is not to be construed as an offer, solicitation, or recommendation with respect to products and services provided by the Companies operating under the FXOpen brand, nor is it to be considered financial advice.
👍2
#stockmarket #MarketNews #MarketUpdates #stocks
Warren Buffett Sells Bank Shares
On Friday, Berkshire Hathaway’s 13F filing (a quarterly report required by the U.S. Securities and Exchange Commission from institutional investment managers overseeing more than $100 million in assets) revealed that Warren Buffett’s company:
→ Maintained its Apple (AAPL) position at 300 million shares;
→ Continued selling Bank of America (BAC), reducing its stake by 15%;
→ Cut its holding in Citigroup (C) by 75%.
The legendary investor may believe Trump’s policies will challenge U.S. banks, potentially triggering a short-term bearish impulse for these bank stocks when trading resumes on Tuesday after the Presidents' Day holiday.
Technical Analysis of BRK.B Shares
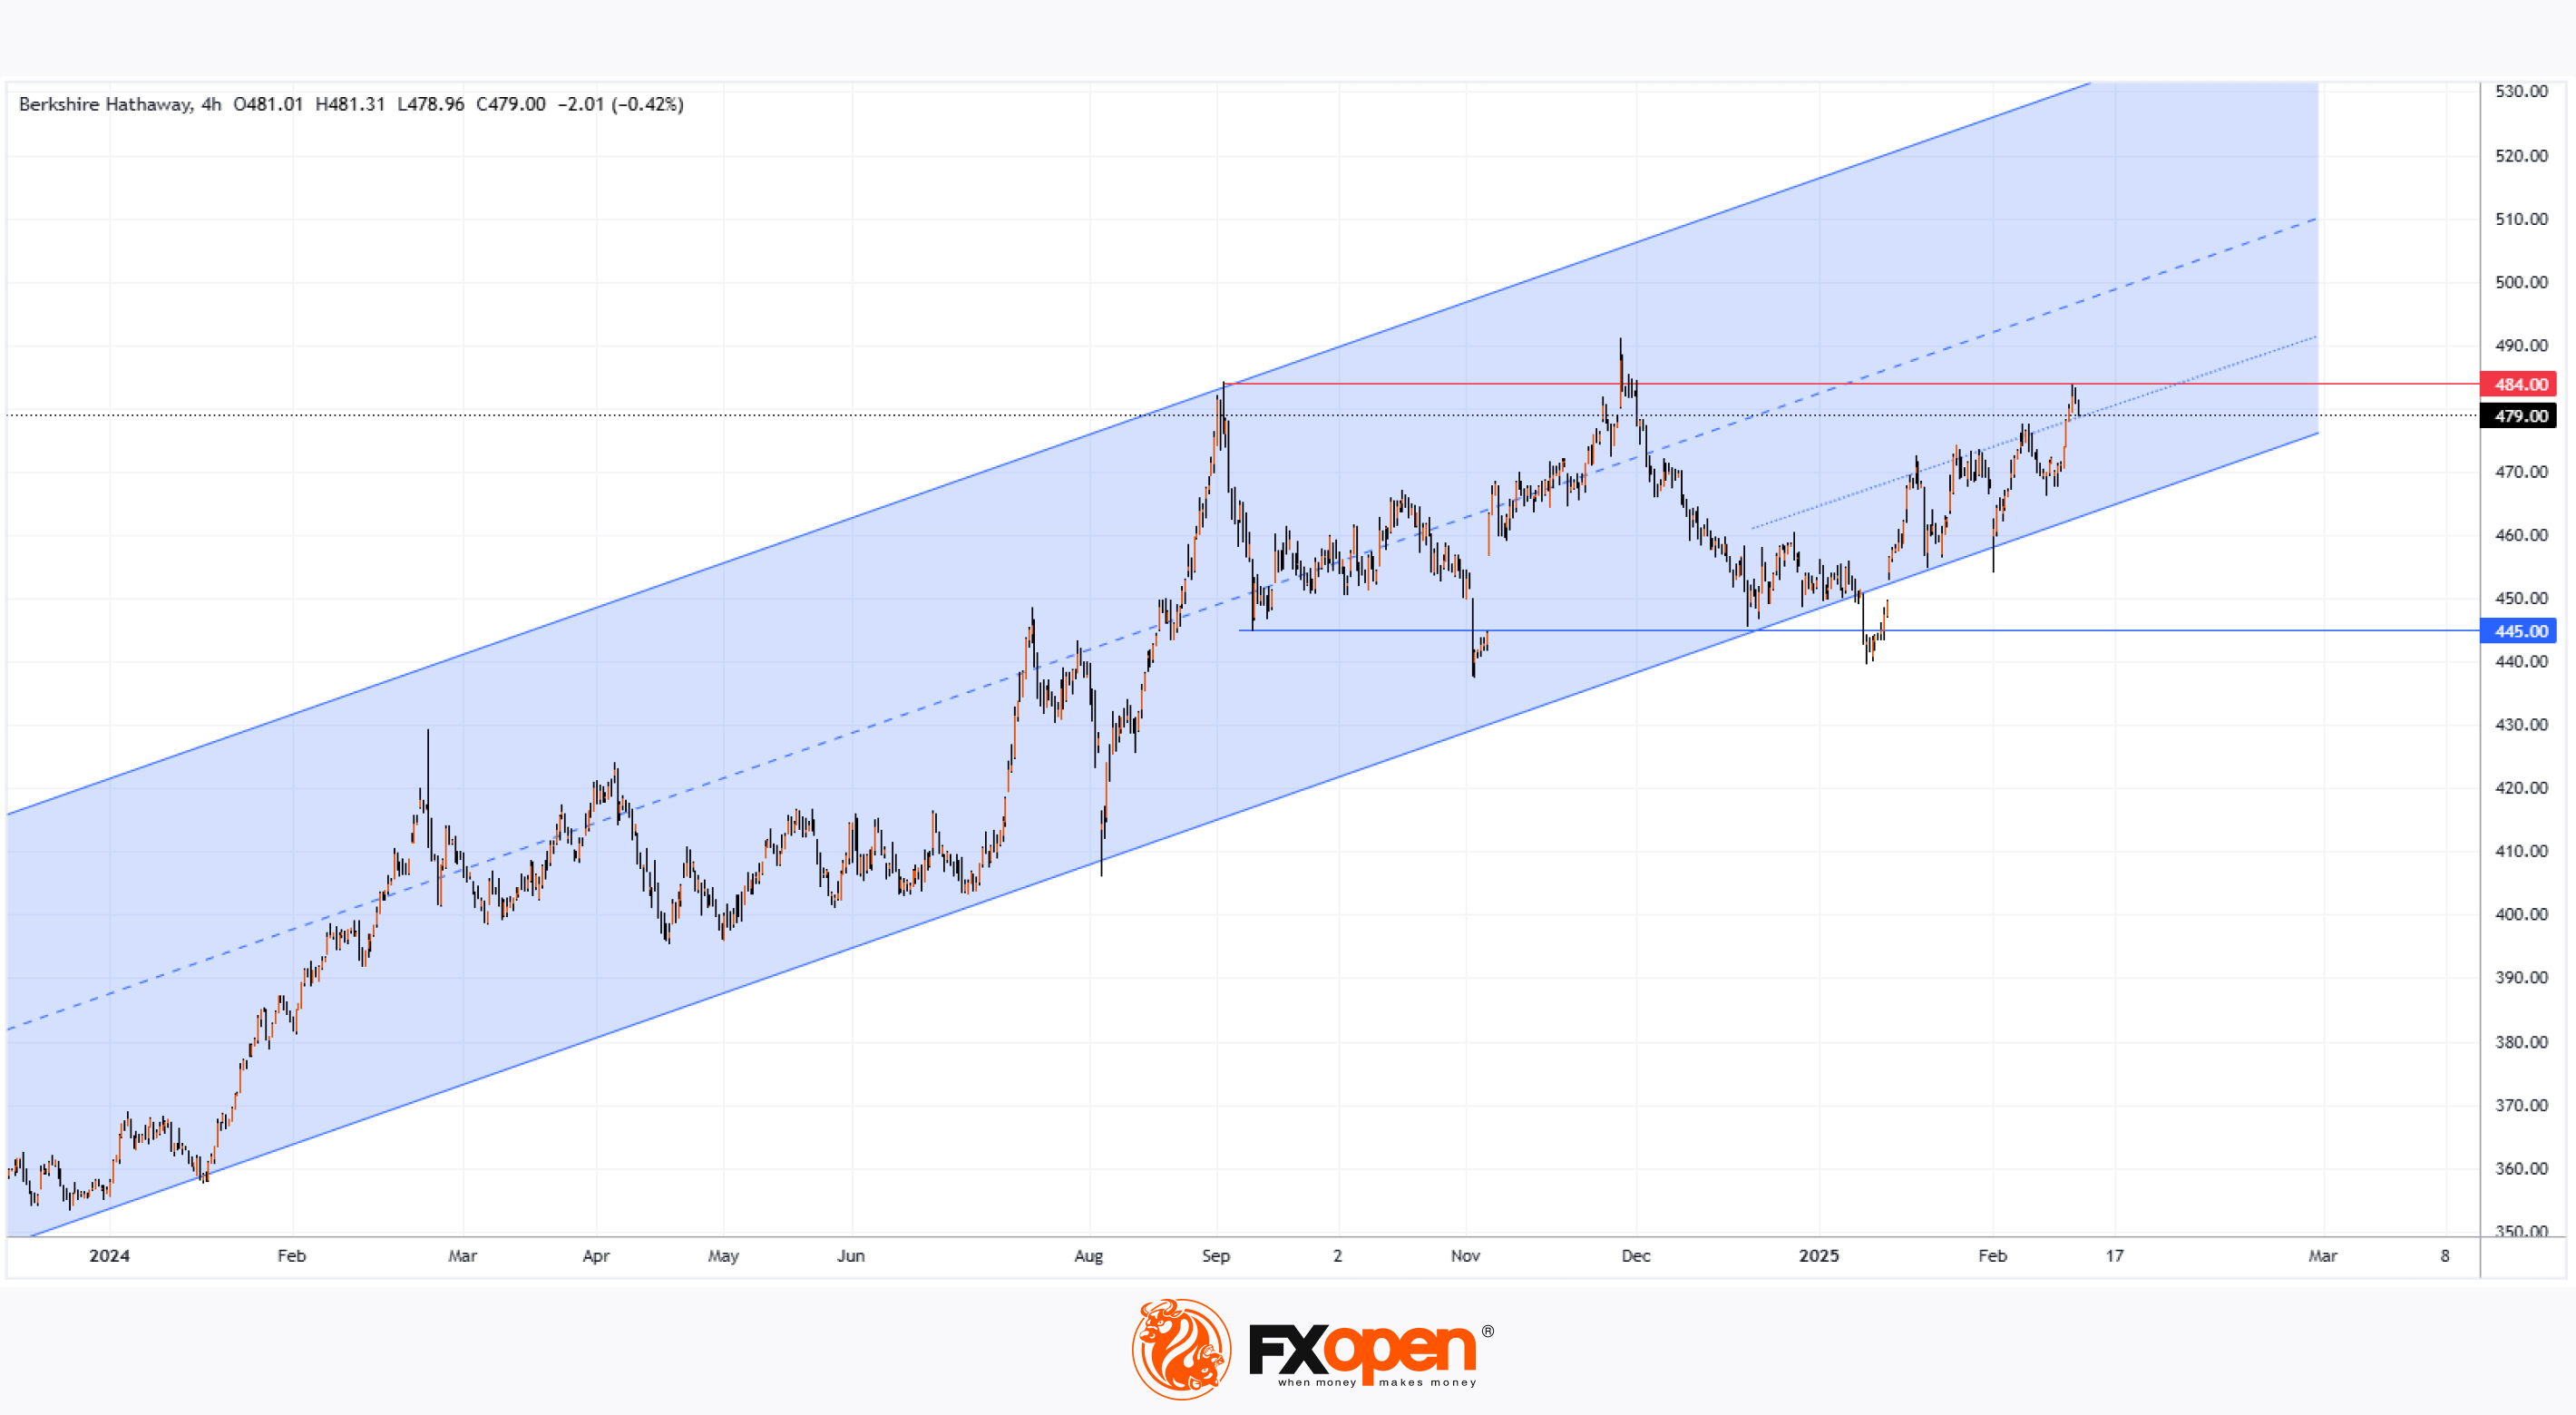
Berkshire Hathaway’s own shares (BRK.B) also face growth challenges, with resistance around the $484 level hindering upward movement within the blue-marked ascending trend channel:
→ The price reversed twice from this level (in September and November 2024);
→ BRK.B is currently near this resistance, forming a Bearish Engulfing pattern that could signal a larger Triple Top bearish pattern.
Given this outlook, bearish pressure may lead to a pullback, potentially towards the lower boundary of the trend channel, where key support sits at $455.
Trade global index CFDs with zero commission and tight spreads. Open your FXOpen account now or learn more about trading index CFDs with FXOpen.
CFDs are complex instruments and come with a high risk of losing your money.
This article represents the opinion of the Companies operating under the FXOpen brand only. It is not to be construed as an offer, solicitation, or recommendation with respect to products and services provided by the Companies operating under the FXOpen brand, nor is it to be considered financial advice.
Warren Buffett Sells Bank Shares
On Friday, Berkshire Hathaway’s 13F filing (a quarterly report required by the U.S. Securities and Exchange Commission from institutional investment managers overseeing more than $100 million in assets) revealed that Warren Buffett’s company:
→ Maintained its Apple (AAPL) position at 300 million shares;
→ Continued selling Bank of America (BAC), reducing its stake by 15%;
→ Cut its holding in Citigroup (C) by 75%.
The legendary investor may believe Trump’s policies will challenge U.S. banks, potentially triggering a short-term bearish impulse for these bank stocks when trading resumes on Tuesday after the Presidents' Day holiday.
Technical Analysis of BRK.B Shares
Berkshire Hathaway’s own shares (BRK.B) also face growth challenges, with resistance around the $484 level hindering upward movement within the blue-marked ascending trend channel:
→ The price reversed twice from this level (in September and November 2024);
→ BRK.B is currently near this resistance, forming a Bearish Engulfing pattern that could signal a larger Triple Top bearish pattern.
Given this outlook, bearish pressure may lead to a pullback, potentially towards the lower boundary of the trend channel, where key support sits at $455.
Trade global index CFDs with zero commission and tight spreads. Open your FXOpen account now or learn more about trading index CFDs with FXOpen.
CFDs are complex instruments and come with a high risk of losing your money.
This article represents the opinion of the Companies operating under the FXOpen brand only. It is not to be construed as an offer, solicitation, or recommendation with respect to products and services provided by the Companies operating under the FXOpen brand, nor is it to be considered financial advice.
👍3
#alibaba #stockmarket #stocktrading #MarketUpdates
Alibaba Shares (BABA) Hit 12-Month High Ahead of Earnings Report
Chinese e-commerce giant Alibaba is set to release its quarterly earnings report on 20 February. The Wall Street Journal cites optimistic analyst estimates, projecting gross revenue of 279.03 billion yuan (approximately $38 billion), up from 260.35 billion yuan a year ago and 236.50 billion yuan in the previous quarter.
Investor sentiment has been buoyed by Alibaba co-founder Jack Ma’s presence at an event with Chinese President Xi Jinping. According to Barron’s, this signals government efforts to restore confidence in the private sector, particularly in technology. At present, such factors may be having a greater impact on the stock market than geopolitical headlines or Trump’s tariff policies.
These and other drivers—including a recent partnership between Alibaba and Apple to integrate AI features into the iPhone 16 series—have fuelled bullish momentum. As a result, Alibaba shares (BABA) have surged nearly 20% in February, reaching their highest level since February last year.
Technical Analysis of Alibaba Shares (BABA)
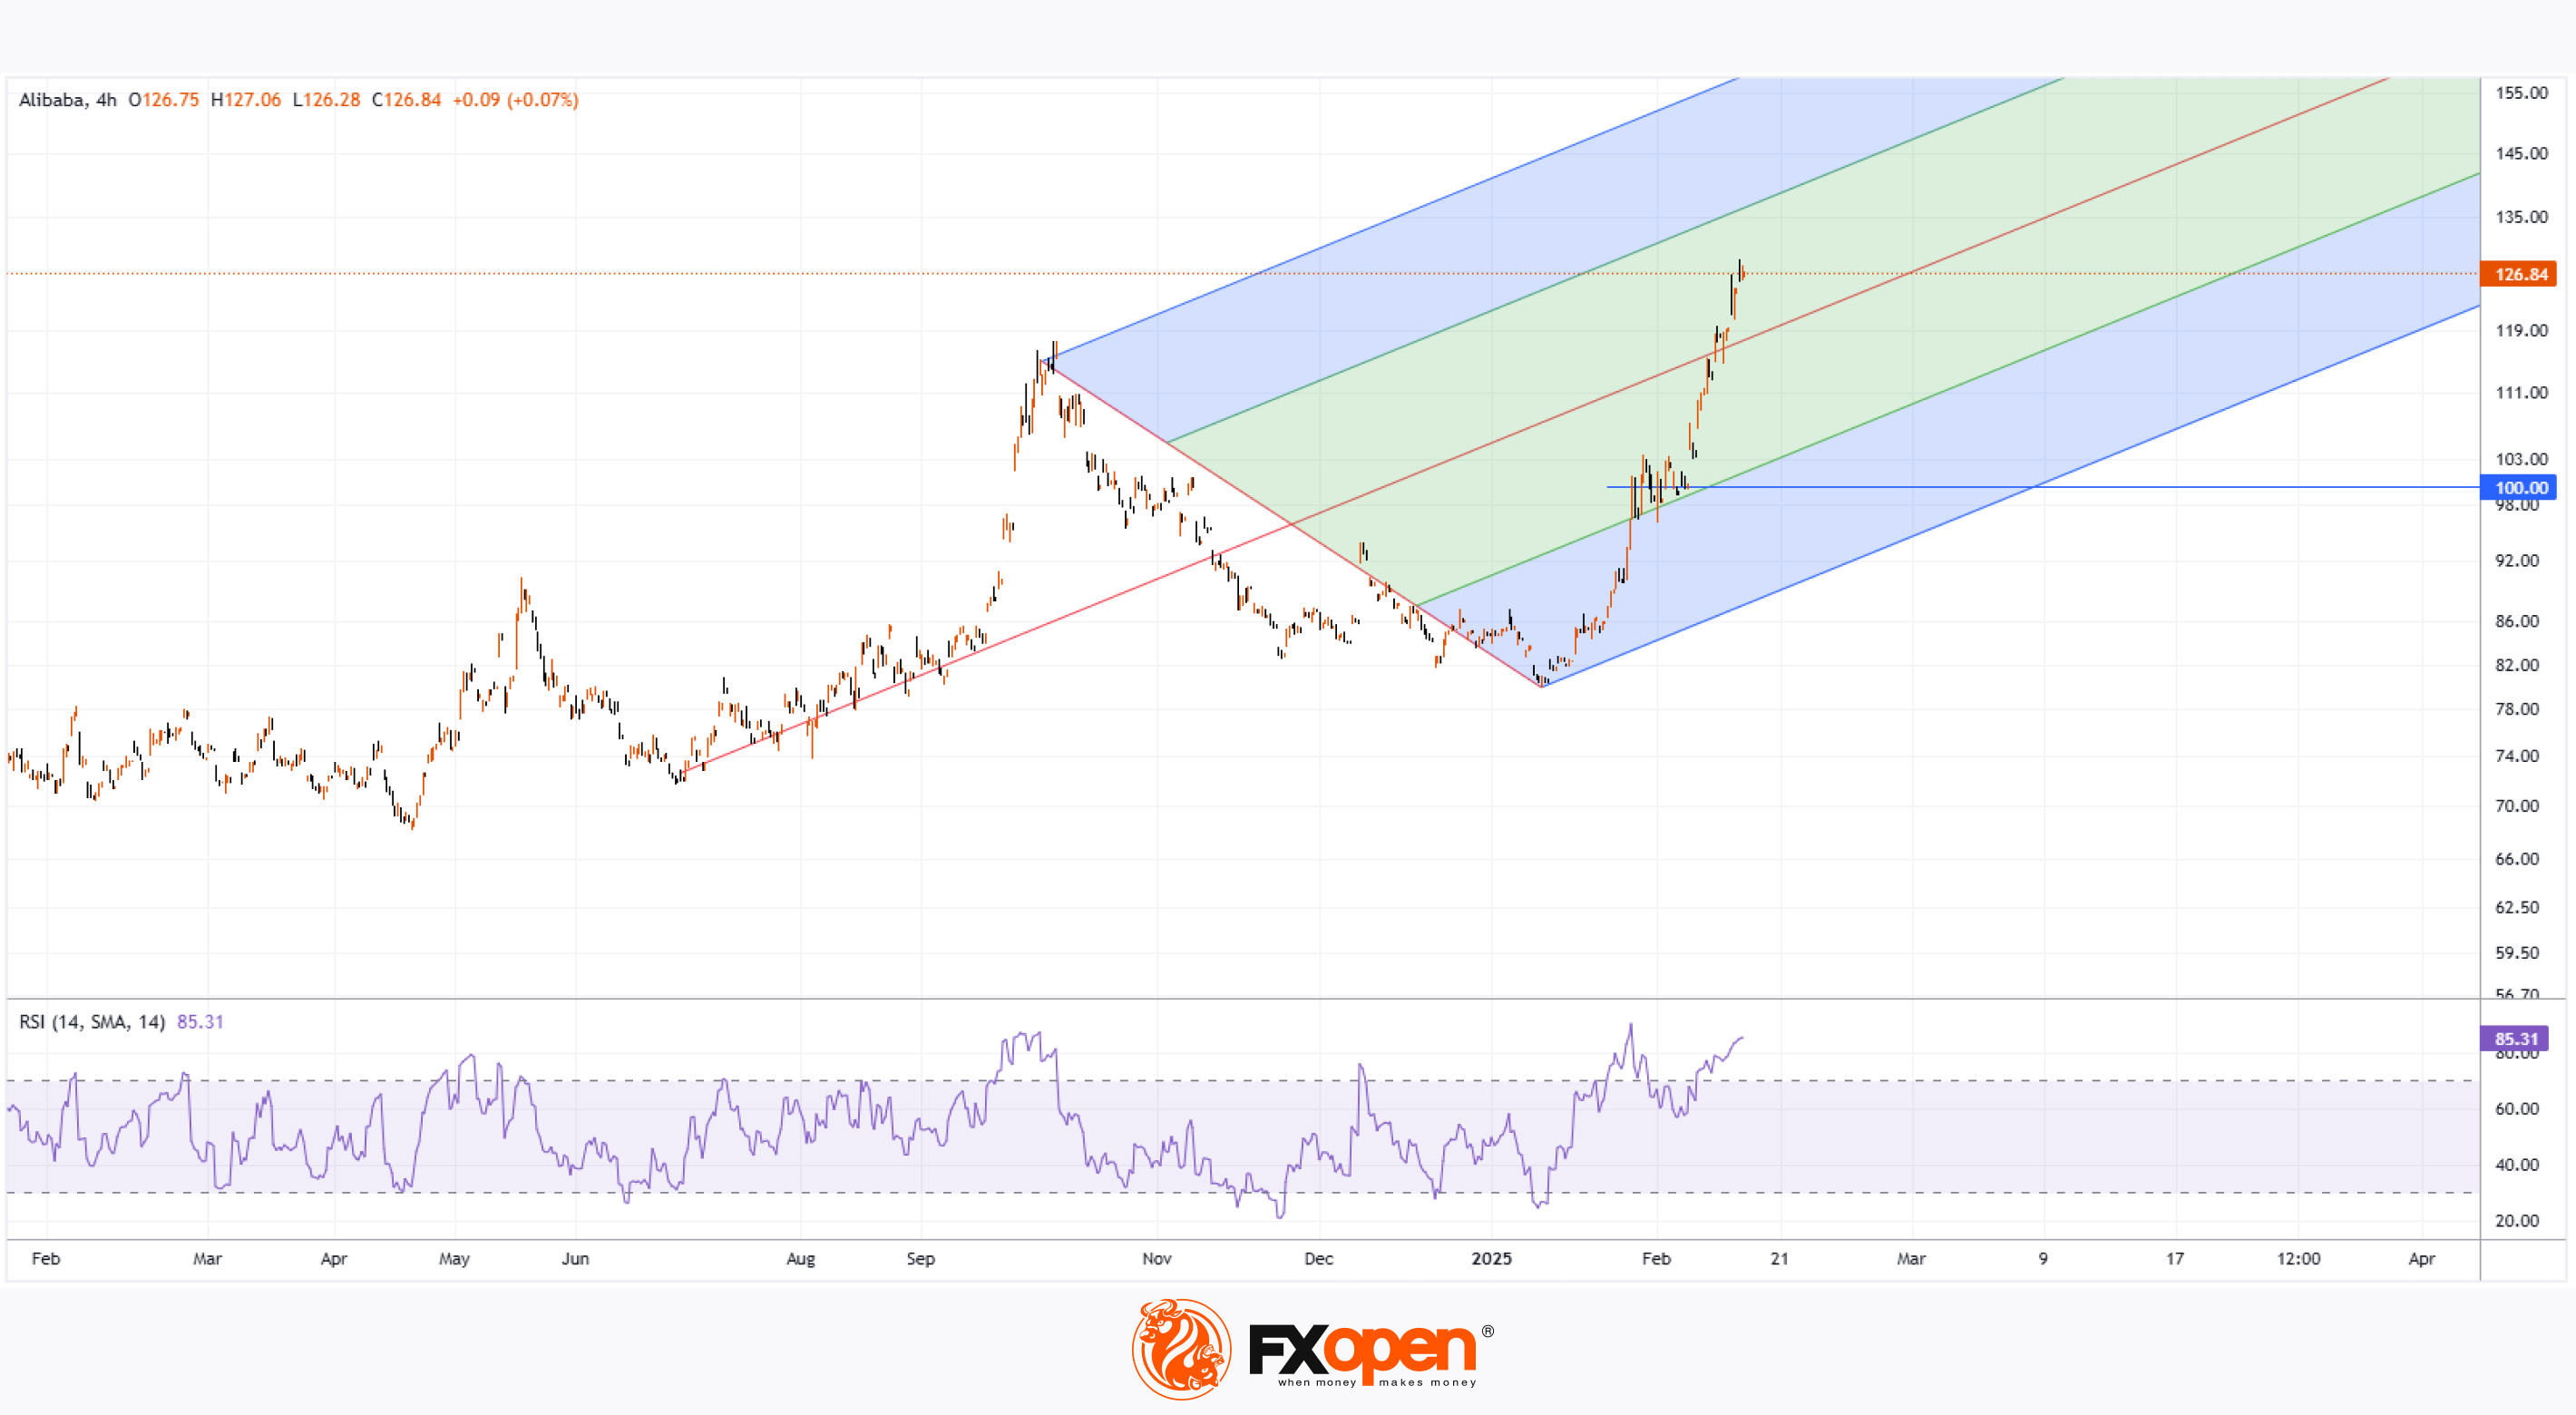
In our previous analysis on 29 January, we noted that BABA’s price movements were forming key levels for an Andrews' Pitchfork pattern, indicating a bullish outlook.
Currently, the price has:
→ Surpassed the October high near $118.
→ Gained bullish momentum after consolidating around the psychological $100 level.
The RSI indicator signals overbought conditions, suggesting a potential correction. However, given the strong news flow, any pullback may be shallow.
Alibaba (BABA) Stock Forecasts
According to BarChart, after years of underperformance, many investors are looking at China with renewed optimism for 2025. Hedge fund Appaloosa Management’s founder and president, David Tepper—whose net worth stands at $21.5 billion—recently acquired Alibaba shares, as per the latest 13F filings.
He may believe that the Chinese stock market is significantly undervalued, based on the “Warren Buffett Indicator,” which compares a country's total market capitalisation to its GDP. A ratio below 100 suggests undervaluation, while a higher figure indicates overvaluation. Currently, China’s market cap-to-GDP ratio stands below 70%, compared to over 200% for the US.
Tepper is not alone in his bullish stance. According to TipRanks:
→ 7 out of 8 analysts surveyed recommend buying BABA shares.
→ The average 12-month price target for BABA is $129.13.
Trade global index CFDs with zero commission and tight spreads. Open your FXOpen account now or learn more about trading index CFDs with FXOpen.
CFDs are complex instruments and come with a high risk of losing your money.
This article represents the opinion of the Companies operating under the FXOpen brand only. It is not to be construed as an offer, solicitation, or recommendation with respect to products and services provided by the Companies operating under the FXOpen brand, nor is it to be considered financial advice.
Alibaba Shares (BABA) Hit 12-Month High Ahead of Earnings Report
Chinese e-commerce giant Alibaba is set to release its quarterly earnings report on 20 February. The Wall Street Journal cites optimistic analyst estimates, projecting gross revenue of 279.03 billion yuan (approximately $38 billion), up from 260.35 billion yuan a year ago and 236.50 billion yuan in the previous quarter.
Investor sentiment has been buoyed by Alibaba co-founder Jack Ma’s presence at an event with Chinese President Xi Jinping. According to Barron’s, this signals government efforts to restore confidence in the private sector, particularly in technology. At present, such factors may be having a greater impact on the stock market than geopolitical headlines or Trump’s tariff policies.
These and other drivers—including a recent partnership between Alibaba and Apple to integrate AI features into the iPhone 16 series—have fuelled bullish momentum. As a result, Alibaba shares (BABA) have surged nearly 20% in February, reaching their highest level since February last year.
Technical Analysis of Alibaba Shares (BABA)
In our previous analysis on 29 January, we noted that BABA’s price movements were forming key levels for an Andrews' Pitchfork pattern, indicating a bullish outlook.
Currently, the price has:
→ Surpassed the October high near $118.
→ Gained bullish momentum after consolidating around the psychological $100 level.
The RSI indicator signals overbought conditions, suggesting a potential correction. However, given the strong news flow, any pullback may be shallow.
Alibaba (BABA) Stock Forecasts
According to BarChart, after years of underperformance, many investors are looking at China with renewed optimism for 2025. Hedge fund Appaloosa Management’s founder and president, David Tepper—whose net worth stands at $21.5 billion—recently acquired Alibaba shares, as per the latest 13F filings.
He may believe that the Chinese stock market is significantly undervalued, based on the “Warren Buffett Indicator,” which compares a country's total market capitalisation to its GDP. A ratio below 100 suggests undervaluation, while a higher figure indicates overvaluation. Currently, China’s market cap-to-GDP ratio stands below 70%, compared to over 200% for the US.
Tepper is not alone in his bullish stance. According to TipRanks:
→ 7 out of 8 analysts surveyed recommend buying BABA shares.
→ The average 12-month price target for BABA is $129.13.
Trade global index CFDs with zero commission and tight spreads. Open your FXOpen account now or learn more about trading index CFDs with FXOpen.
CFDs are complex instruments and come with a high risk of losing your money.
This article represents the opinion of the Companies operating under the FXOpen brand only. It is not to be construed as an offer, solicitation, or recommendation with respect to products and services provided by the Companies operating under the FXOpen brand, nor is it to be considered financial advice.
👍2
#gasprices #MarketUpdates #marketanalysis
Natural Gas Price Hits Highest Level Since January 2023
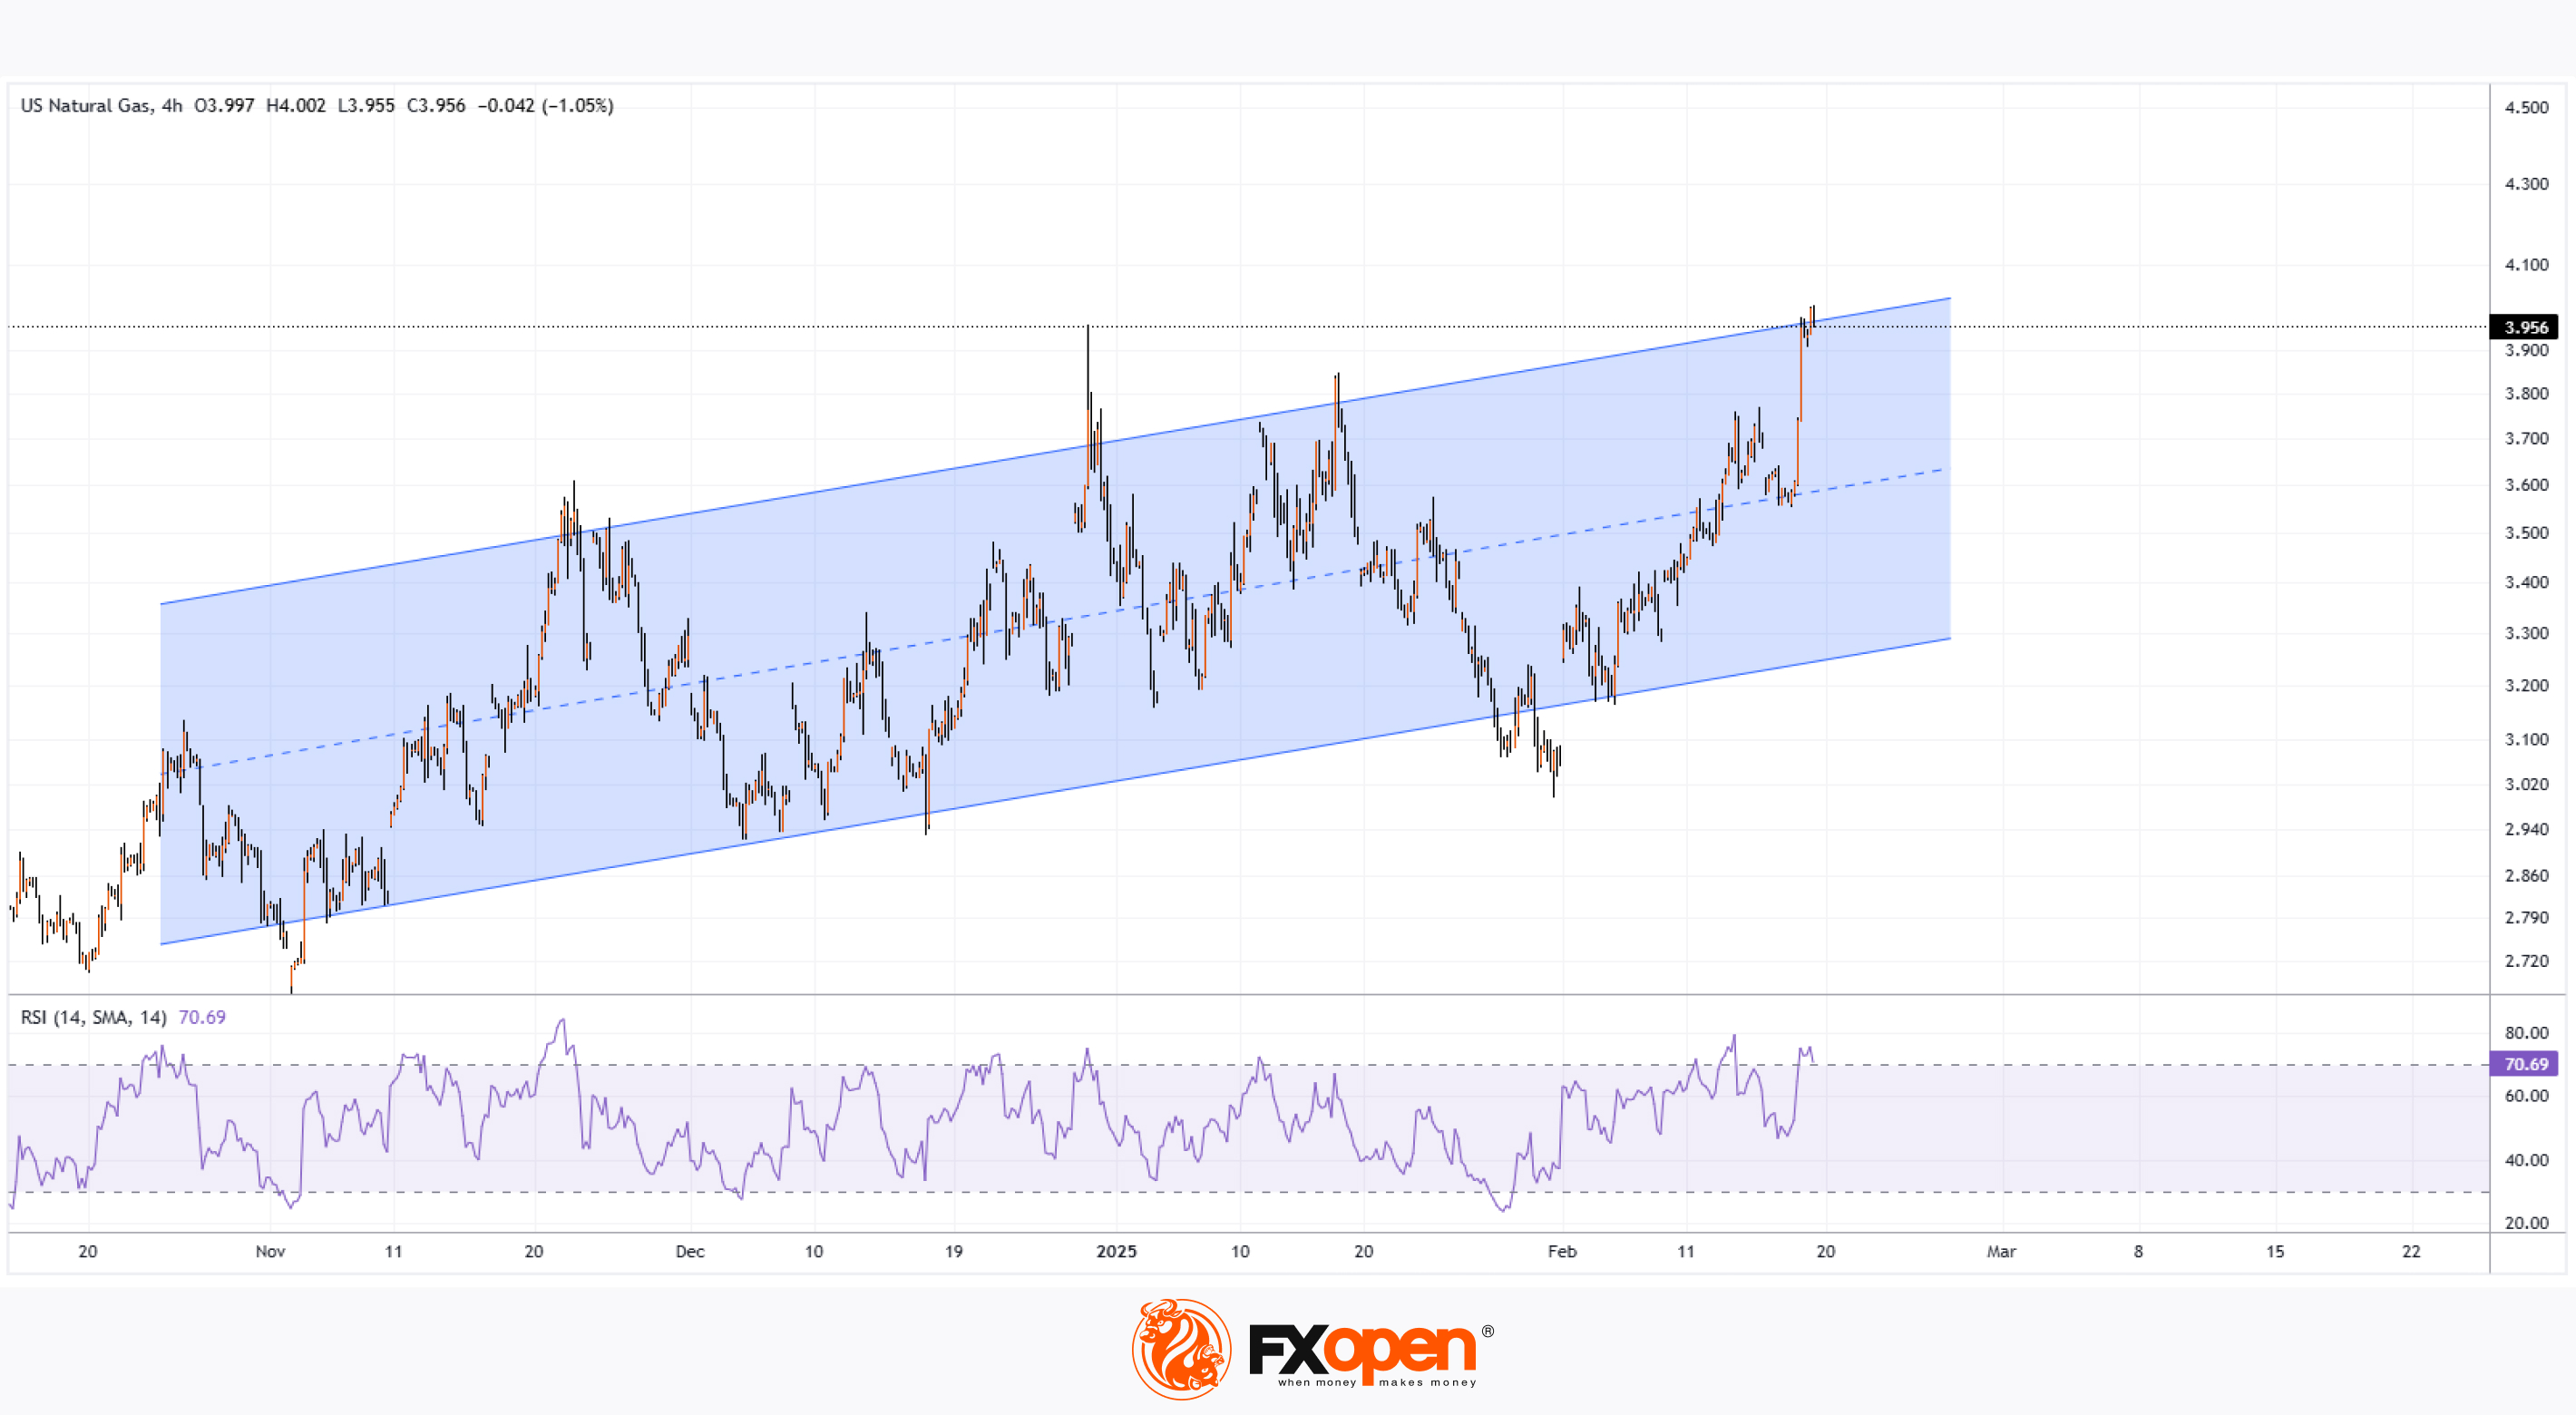
The XNG/USD chart today shows that natural gas prices have surpassed the December 2024 peak, breaking through the key psychological level of $4.000/MMBtu. Since early February, prices have surged by over 20%.
Why Is Natural Gas Price Rising?
According to The Wall Street Journal, the bullish sentiment is driven by:
→ Weather models confirming forecasts of a significant cold spell.
→ LNG exports remaining at record highs.
Additionally, US gas exports may increase further after President Trump lifted the pause imposed by the Biden administration on new LNG export projects. Bloomberg reports that Trump’s administration is close to approving its first LNG export project.
Technical Analysis of XNG/USD
The price movements are forming an upward channel (marked in blue) on the chart:
→ Prices are currently near the upper boundary of this channel.
→ The RSI indicator is in the overbought zone.
→ The price briefly exceeded the $4.000/MMBtu psychological level.
→ Buyers may look to secure profits after the recent sharp gains.
Given these factors, traders may anticipate a potential pullback, which—if it occurs—could bring natural gas prices back towards the channel’s median level.
Start trading commodities with tight spreads. Open your trading account now or learn more about trading commodity CFDs with FXOpen.
CFDs are complex instruments and come with a high risk of losing your money.
This article represents the opinion of the Companies operating under the FXOpen brand only. It is not to be construed as an offer, solicitation, or recommendation with respect to products and services provided by the Companies operating under the FXOpen brand, nor is it to be considered financial advice.
Natural Gas Price Hits Highest Level Since January 2023
The XNG/USD chart today shows that natural gas prices have surpassed the December 2024 peak, breaking through the key psychological level of $4.000/MMBtu. Since early February, prices have surged by over 20%.
Why Is Natural Gas Price Rising?
According to The Wall Street Journal, the bullish sentiment is driven by:
→ Weather models confirming forecasts of a significant cold spell.
→ LNG exports remaining at record highs.
Additionally, US gas exports may increase further after President Trump lifted the pause imposed by the Biden administration on new LNG export projects. Bloomberg reports that Trump’s administration is close to approving its first LNG export project.
Technical Analysis of XNG/USD
The price movements are forming an upward channel (marked in blue) on the chart:
→ Prices are currently near the upper boundary of this channel.
→ The RSI indicator is in the overbought zone.
→ The price briefly exceeded the $4.000/MMBtu psychological level.
→ Buyers may look to secure profits after the recent sharp gains.
Given these factors, traders may anticipate a potential pullback, which—if it occurs—could bring natural gas prices back towards the channel’s median level.
Start trading commodities with tight spreads. Open your trading account now or learn more about trading commodity CFDs with FXOpen.
CFDs are complex instruments and come with a high risk of losing your money.
This article represents the opinion of the Companies operating under the FXOpen brand only. It is not to be construed as an offer, solicitation, or recommendation with respect to products and services provided by the Companies operating under the FXOpen brand, nor is it to be considered financial advice.
👍3
#stockmarket #stocktrading #MarketUpdates #MarketNews
Walmart (WMT) Stock Drops Over 6%
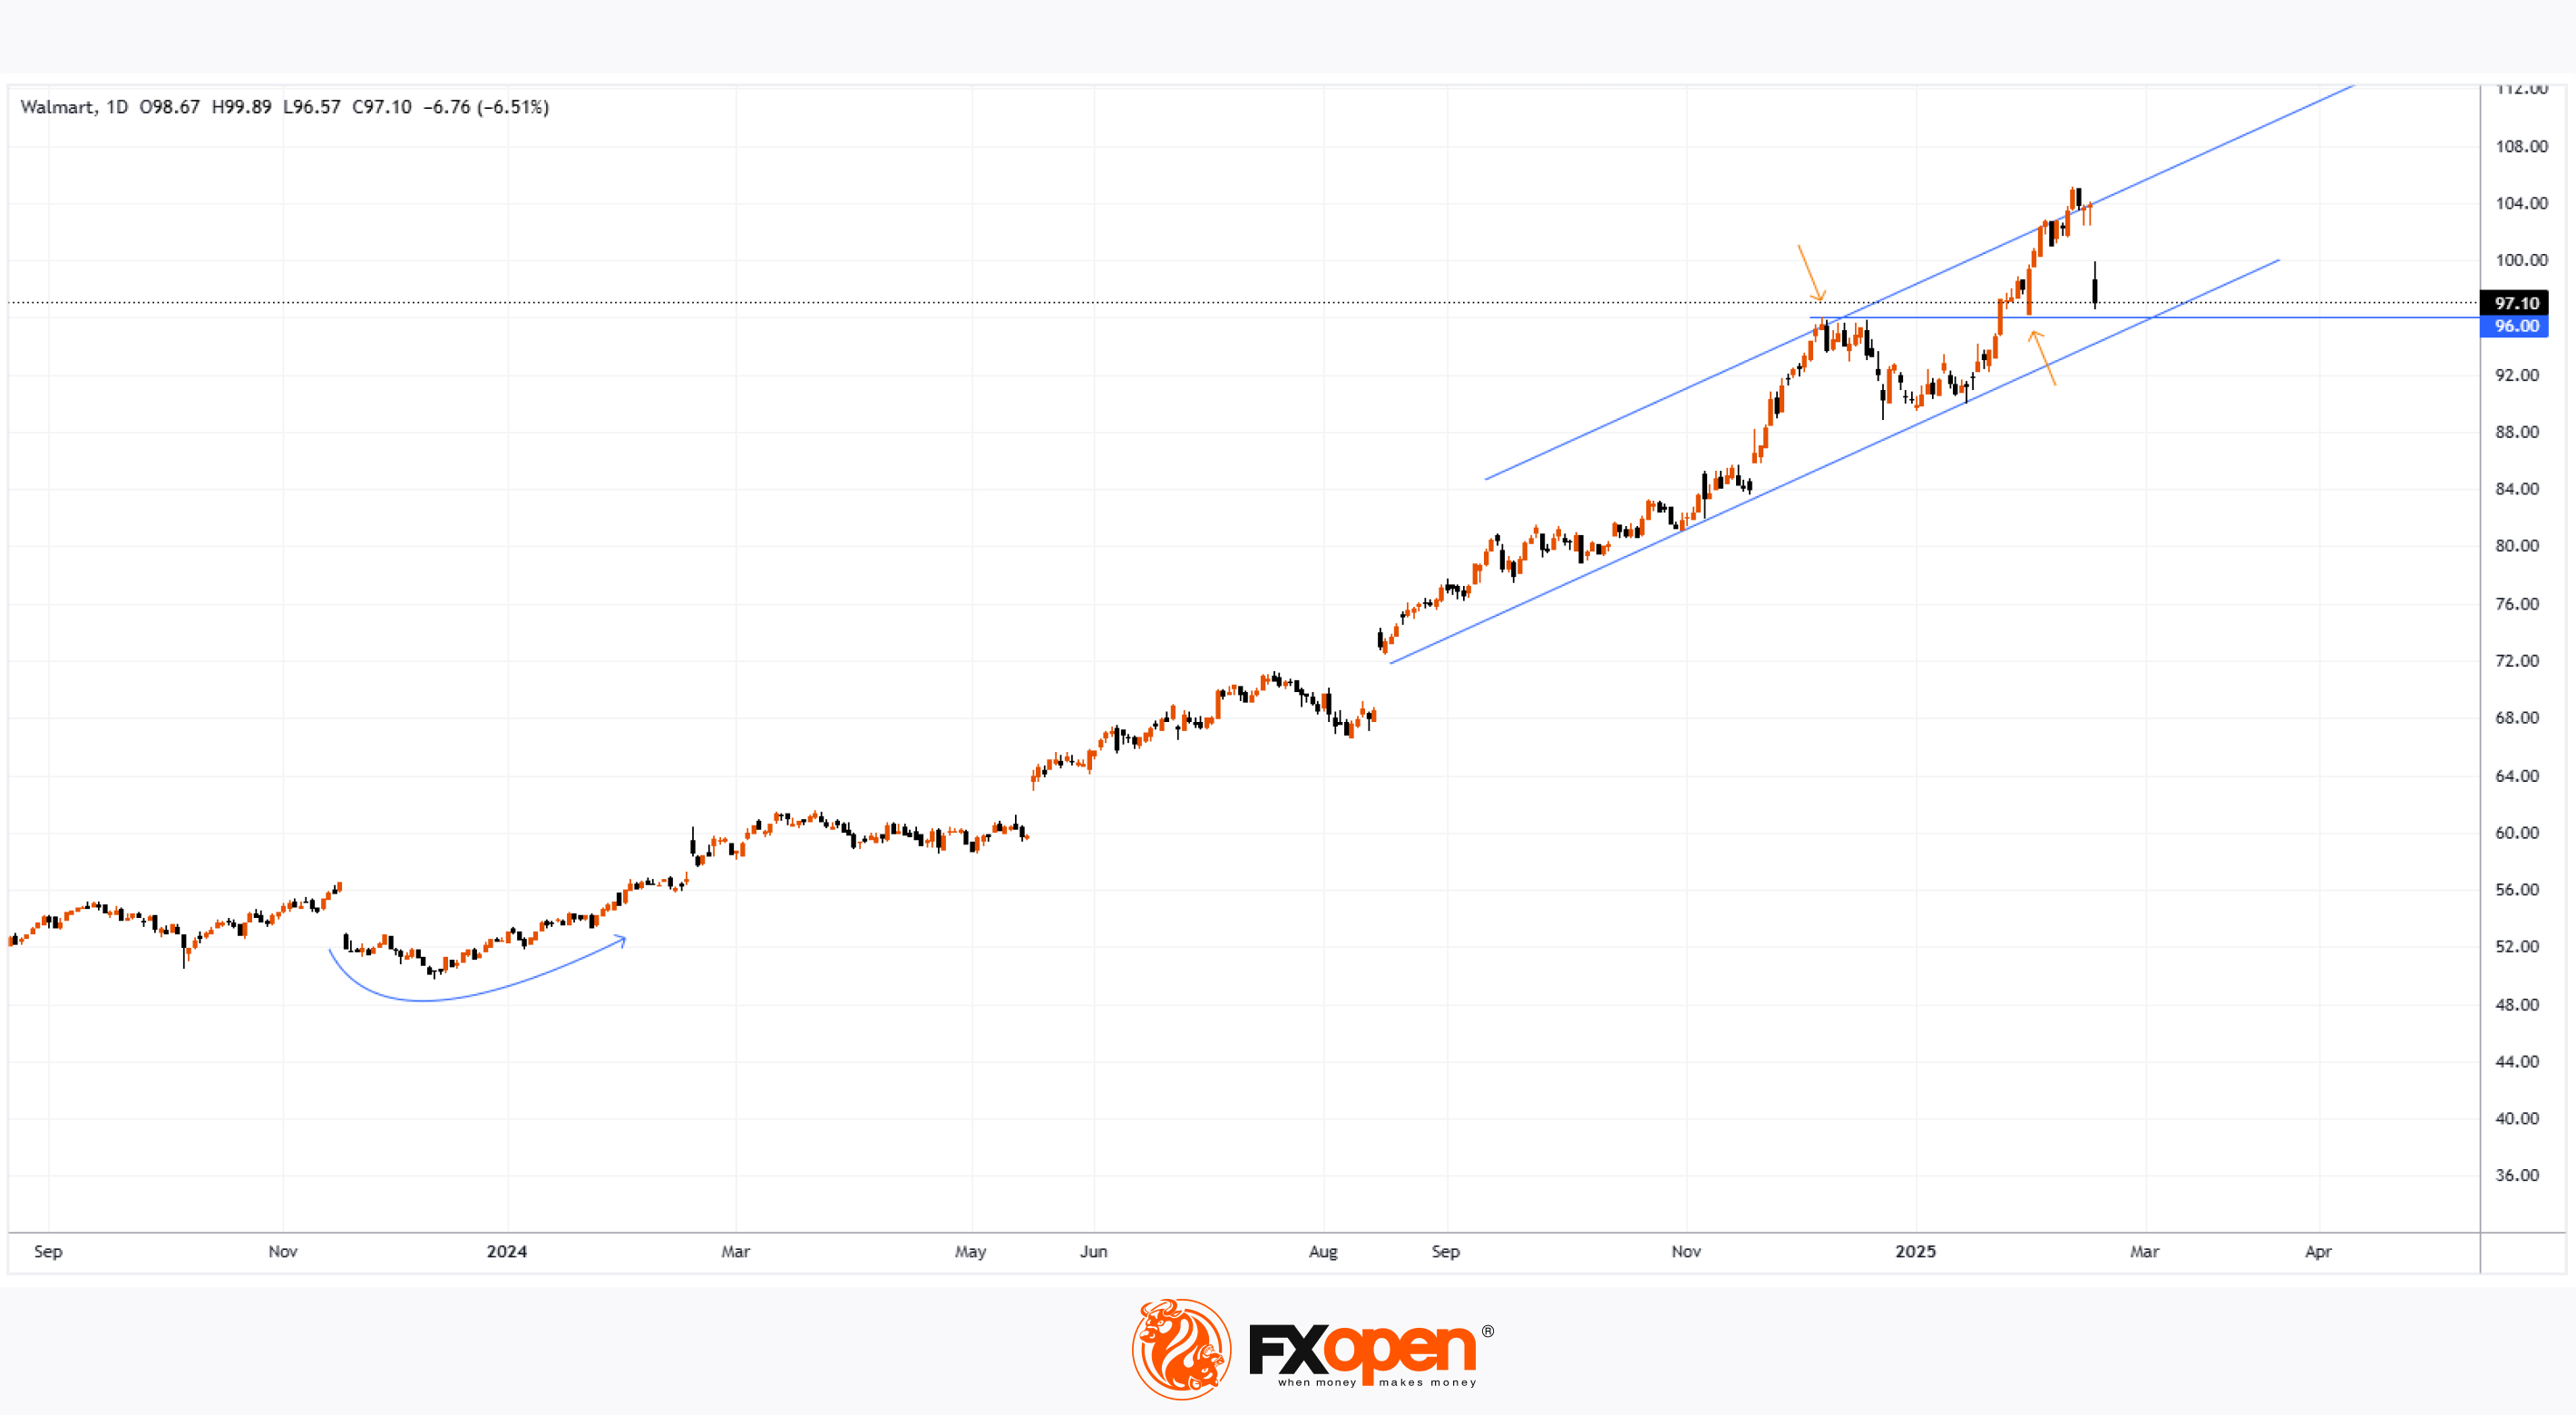
As shown in the Walmart (WMT) stock chart, trading on 20th February closed at $97.26, whereas the previous day, the stock was trading around $103. The decline of over 6% marks the largest drop in Walmart (WMT) stock price in 15 months.
Why Did Walmart (WMT) Stock Drop?
The bearish momentum emerged after Walmart’s earnings report, which was actually quite strong, as:
→ Sales growth reached 5.2%;
→ The company exceeded analysts' expectations (earnings per share were 2% higher than forecasts);
→ Walmart announced a 13% dividend increase.
However, WMT stock fell because the retail giant released a profit forecast for 2025 that came in below market expectations. This was attributed to uncertain consumer behaviour and geopolitical conditions. Additionally, investors may have been dissatisfied with increased executive compensation.
Walmart (WMT) Stock Technical Analysis
The chart shows that after the decline, the price is consolidating near support levels formed by:
→ The lower boundary of the ascending channel;
→ Former resistance around $96.
The situation resembles November 2023, when the market also reacted negatively to an earnings report. However, WMT stock later recovered, and a similar scenario could unfold in 2025.
Analytical Walmart (WMT) Stock Price Forecasts
Analysts remain optimistic. According to Yahoo Finance:
→ The average 12-month price target for WMT is $107.25;
→ Of the 42 analysts surveyed, 38 recommend buying WMT stock.
Trade global index CFDs with zero commission and tight spreads. Open your FXOpen account now or learn more about trading index CFDs with FXOpen.
CFDs are complex instruments and come with a high risk of losing your money.
This article represents the opinion of the Companies operating under the FXOpen brand only. It is not to be construed as an offer, solicitation, or recommendation with respect to products and services provided by the Companies operating under the FXOpen brand, nor is it to be considered financial advice.
Walmart (WMT) Stock Drops Over 6%
As shown in the Walmart (WMT) stock chart, trading on 20th February closed at $97.26, whereas the previous day, the stock was trading around $103. The decline of over 6% marks the largest drop in Walmart (WMT) stock price in 15 months.
Why Did Walmart (WMT) Stock Drop?
The bearish momentum emerged after Walmart’s earnings report, which was actually quite strong, as:
→ Sales growth reached 5.2%;
→ The company exceeded analysts' expectations (earnings per share were 2% higher than forecasts);
→ Walmart announced a 13% dividend increase.
However, WMT stock fell because the retail giant released a profit forecast for 2025 that came in below market expectations. This was attributed to uncertain consumer behaviour and geopolitical conditions. Additionally, investors may have been dissatisfied with increased executive compensation.
Walmart (WMT) Stock Technical Analysis
The chart shows that after the decline, the price is consolidating near support levels formed by:
→ The lower boundary of the ascending channel;
→ Former resistance around $96.
The situation resembles November 2023, when the market also reacted negatively to an earnings report. However, WMT stock later recovered, and a similar scenario could unfold in 2025.
Analytical Walmart (WMT) Stock Price Forecasts
Analysts remain optimistic. According to Yahoo Finance:
→ The average 12-month price target for WMT is $107.25;
→ Of the 42 analysts surveyed, 38 recommend buying WMT stock.
Trade global index CFDs with zero commission and tight spreads. Open your FXOpen account now or learn more about trading index CFDs with FXOpen.
CFDs are complex instruments and come with a high risk of losing your money.
This article represents the opinion of the Companies operating under the FXOpen brand only. It is not to be construed as an offer, solicitation, or recommendation with respect to products and services provided by the Companies operating under the FXOpen brand, nor is it to be considered financial advice.
👍3
#stockmarket #stocktrading #USDJPY #forextrading
USD/JPY Recovers After Dropping Below 150 Yen per Dollar
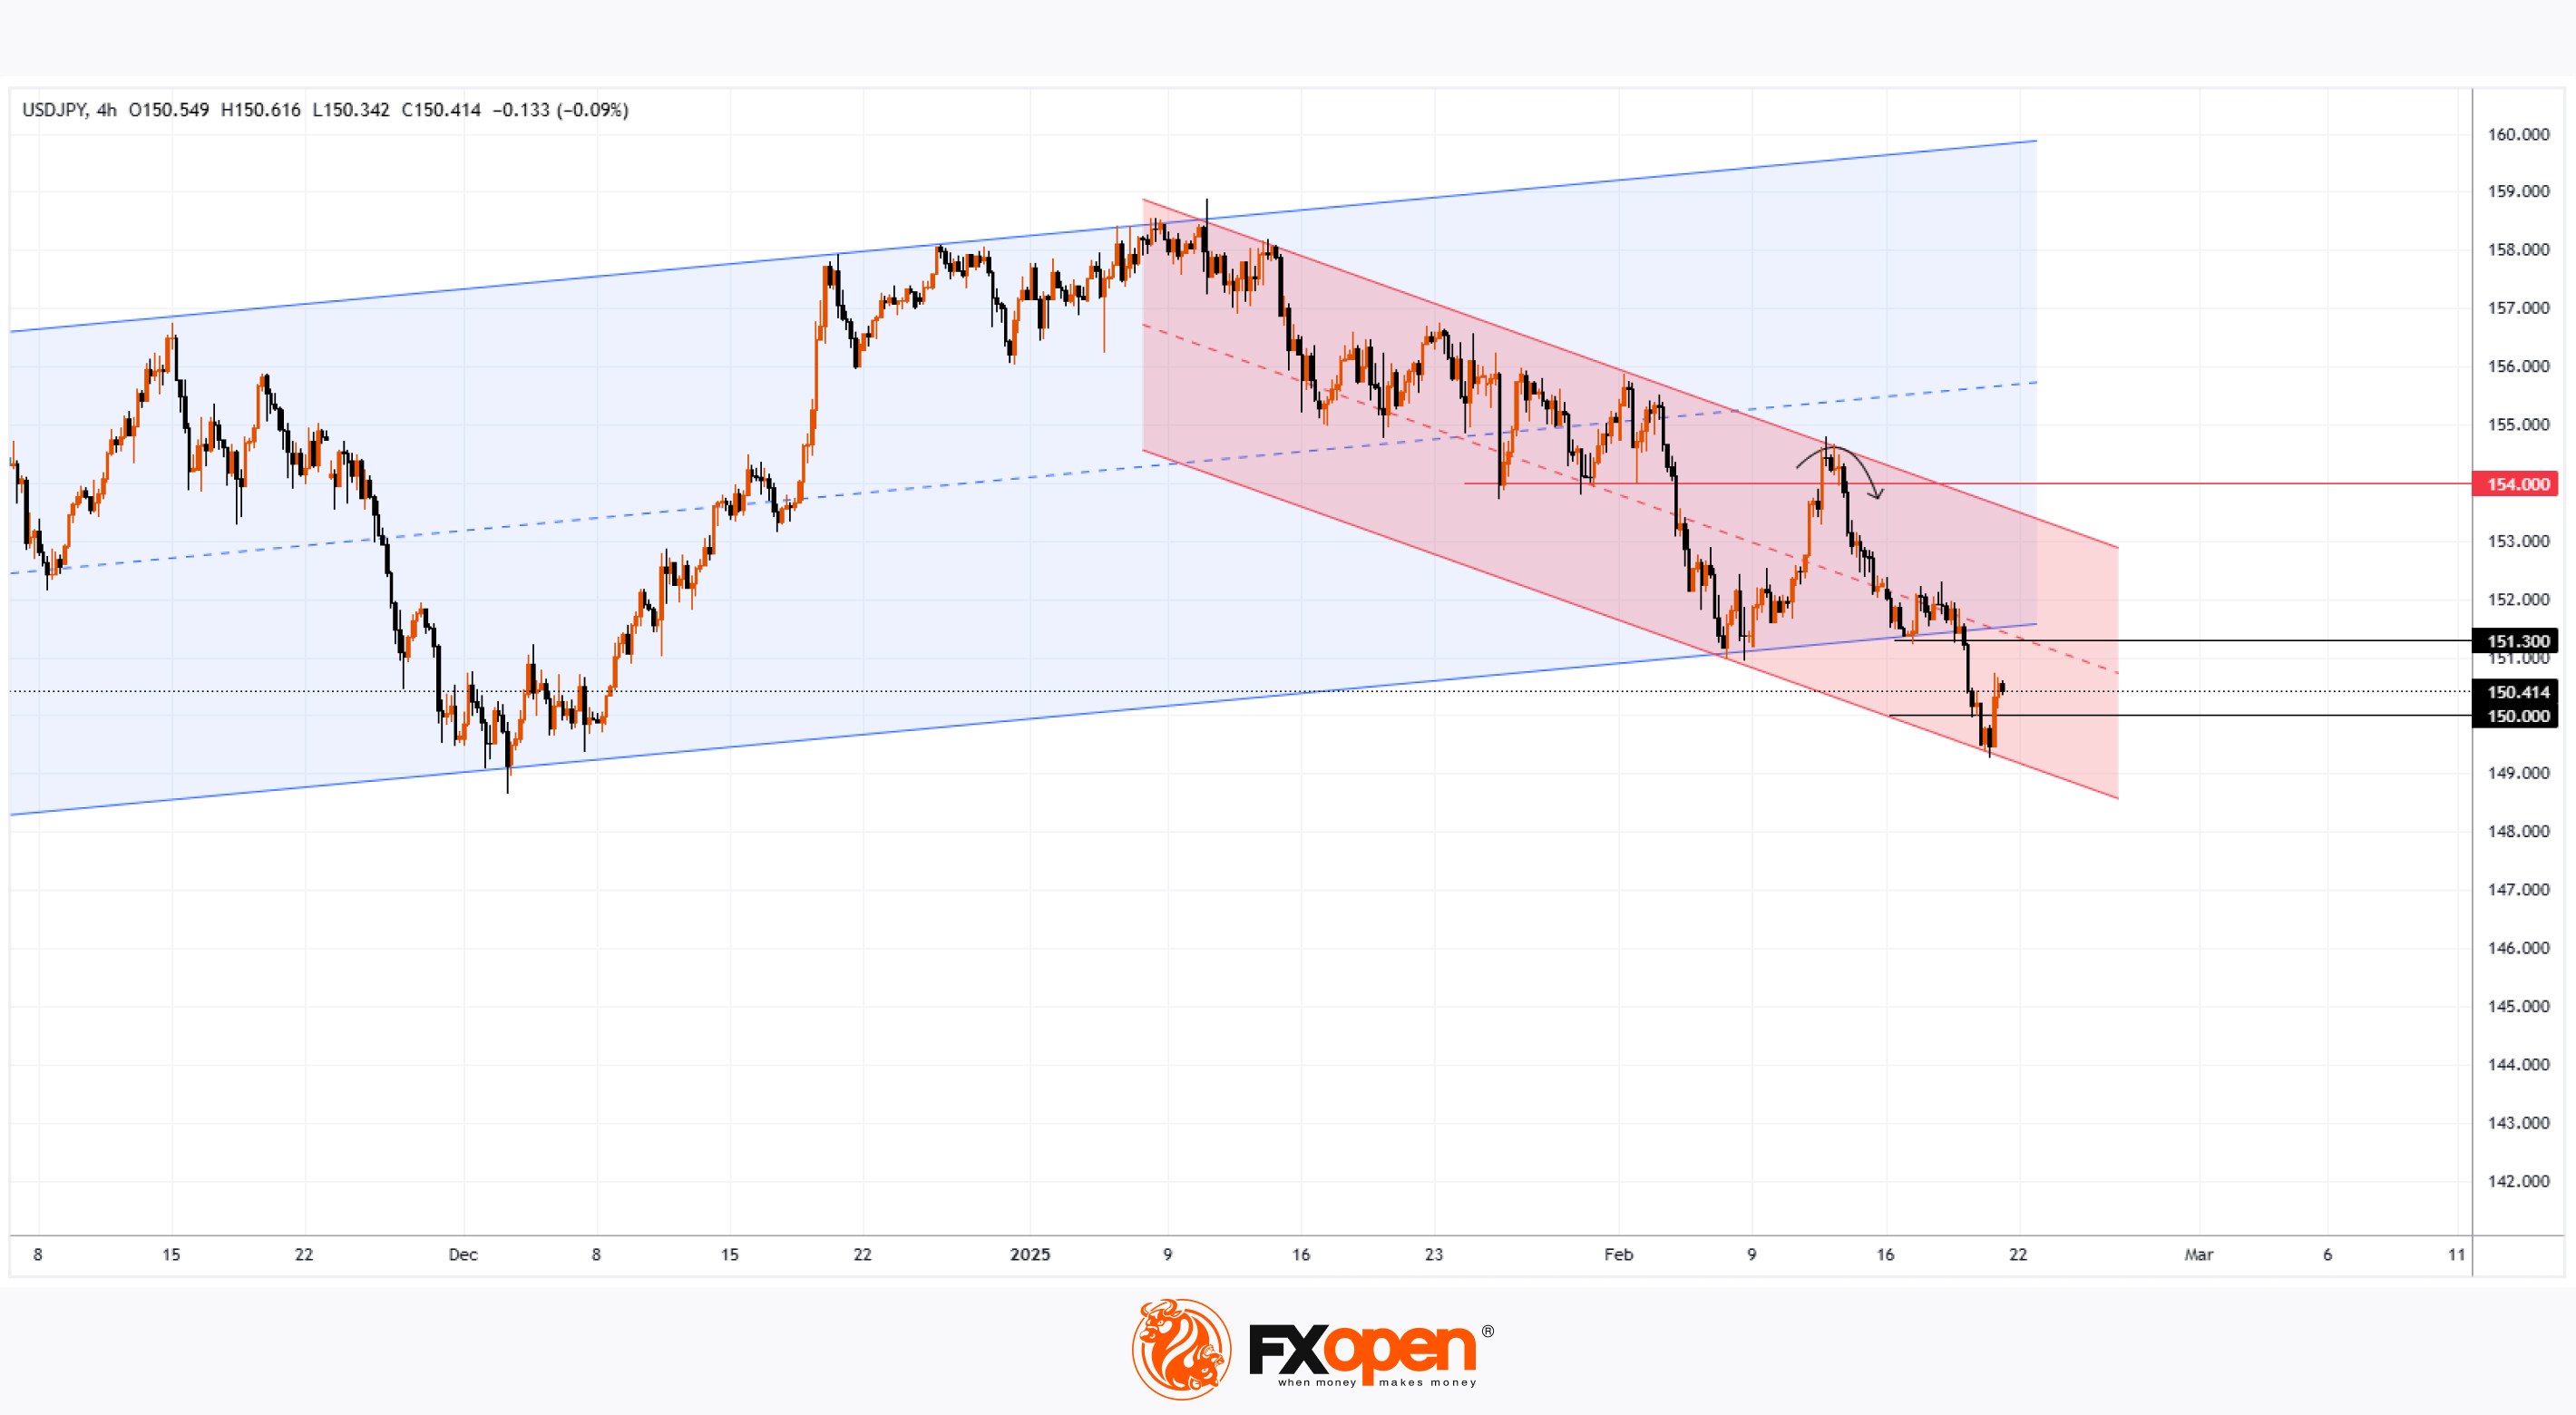
As the USD/JPY chart shows:
→ Yesterday, the pair fell below the psychological level of 150 yen per dollar.
→ However, today it staged a strong recovery, rising back above this level.
The yen weakened following the release of Japan's inflation data. According to Forex Factory, the National Core CPI increased by 3.2% year-over-year (forecast: 3.1%, previous: 3.0%).
According to Reuters:
→ The 19-month high in CPI strengthens expectations of further interest rate hikes in Japan.
→ The yen is weakening as Bank of Japan Governor Kazuo Ueda stated that the central bank may step up government bond purchases if long-term interest rates rise.
Can USD/JPY Continue to Rise?
USD/JPY Technical Analysis
On 12th February, we noted that key highs and lows over the past three months formed an ascending channel, with the 154 yen per dollar level acting as a resistance barrier.
Indeed, since then, bulls have failed to sustain levels above 154 yen per dollar (as indicated by the arrow), leading to a decline below the lower boundary of the blue channel after a brief rebound on 18th February.
As a result, the former support at the lower boundary of the blue channel may now act as resistance around 151.3 yen per dollar, reinforcing the relevance of the descending channel (marked in red).
The trajectory of USD/JPY today could be significantly influenced by the release of the US Flash Manufacturing PMI and Flash Services PMI indices at 16:45 GMT+2.
Trade over 50 forex markets 24 hours a day with FXOpen. Take advantage of low commissions, deep liquidity, and spreads from 0.0 pips. Open your FXOpen account now or learn more about trading forex with FXOpen.
CFDs are complex instruments and come with a high risk of losing your money.
This article represents the opinion of the Companies operating under the FXOpen brand only. It is not to be construed as an offer, solicitation, or recommendation with respect to products and services provided by the Companies operating under the FXOpen brand, nor is it to be considered financial advice.
USD/JPY Recovers After Dropping Below 150 Yen per Dollar
As the USD/JPY chart shows:
→ Yesterday, the pair fell below the psychological level of 150 yen per dollar.
→ However, today it staged a strong recovery, rising back above this level.
The yen weakened following the release of Japan's inflation data. According to Forex Factory, the National Core CPI increased by 3.2% year-over-year (forecast: 3.1%, previous: 3.0%).
According to Reuters:
→ The 19-month high in CPI strengthens expectations of further interest rate hikes in Japan.
→ The yen is weakening as Bank of Japan Governor Kazuo Ueda stated that the central bank may step up government bond purchases if long-term interest rates rise.
Can USD/JPY Continue to Rise?
USD/JPY Technical Analysis
On 12th February, we noted that key highs and lows over the past three months formed an ascending channel, with the 154 yen per dollar level acting as a resistance barrier.
Indeed, since then, bulls have failed to sustain levels above 154 yen per dollar (as indicated by the arrow), leading to a decline below the lower boundary of the blue channel after a brief rebound on 18th February.
As a result, the former support at the lower boundary of the blue channel may now act as resistance around 151.3 yen per dollar, reinforcing the relevance of the descending channel (marked in red).
The trajectory of USD/JPY today could be significantly influenced by the release of the US Flash Manufacturing PMI and Flash Services PMI indices at 16:45 GMT+2.
Trade over 50 forex markets 24 hours a day with FXOpen. Take advantage of low commissions, deep liquidity, and spreads from 0.0 pips. Open your FXOpen account now or learn more about trading forex with FXOpen.
CFDs are complex instruments and come with a high risk of losing your money.
This article represents the opinion of the Companies operating under the FXOpen brand only. It is not to be construed as an offer, solicitation, or recommendation with respect to products and services provided by the Companies operating under the FXOpen brand, nor is it to be considered financial advice.
👍3
#marketanalysis #EURUSD #forextrading #tradingtips
EUR/USD Chart Analysis: Exchange Rate Hits Highest Level Since Early February
The EUR/USD chart shows the euro rising above its previous February peak of 1.05155, set on the 14th.
On one hand, the euro's strength is driven by Germany’s national elections over the weekend, where the opposition conservatives, led by Friedrich Merz, secured victory as expected. Investors are now focused on how quickly Merz’s party can form a coalition government to implement much-needed economic reforms.
On the other hand, the US dollar index has fallen to its lowest level since mid-December.
According to Reuters, the dollar’s weakness is influenced by:
→ Shifting market perceptions of its value amid Trump’s tariff policies in global trade.
→ Declining US Treasury yields due to expectations of further Fed rate cuts in 2025.
Technical Analysis of EUR/USD Chart
Price movements form an upward channel (marked in blue), but the red arrow highlights bearish activity near resistance levels at:
→ The yearly high around 1.05333.
→ The median line of the channel.
Given the lower liquidity at the start of trading, the initial breakout above the psychological 1.05000 level may have been false. Potential bearish pressure could push EUR/USD towards a support zone, including:
→ The 1.0400 level.
→ The lower boundary of a broader channel (marked in orange).
If bulls intend to maintain their February momentum, signs of buying activity may emerge near the lower boundary of the blue channel.
Trade over 50 forex markets 24 hours a day with FXOpen. Take advantage of low commissions, deep liquidity, and spreads from 0.0 pips. Open your FXOpen account now or learn more about trading forex with FXOpen.
CFDs are complex instruments and come with a high risk of losing your money.
This article represents the opinion of the Companies operating under the FXOpen brand only. It is not to be construed as an offer, solicitation, or recommendation with respect to products and services provided by the Companies operating under the FXOpen brand, nor is it to be considered financial advice.
EUR/USD Chart Analysis: Exchange Rate Hits Highest Level Since Early February
The EUR/USD chart shows the euro rising above its previous February peak of 1.05155, set on the 14th.
On one hand, the euro's strength is driven by Germany’s national elections over the weekend, where the opposition conservatives, led by Friedrich Merz, secured victory as expected. Investors are now focused on how quickly Merz’s party can form a coalition government to implement much-needed economic reforms.
On the other hand, the US dollar index has fallen to its lowest level since mid-December.
According to Reuters, the dollar’s weakness is influenced by:
→ Shifting market perceptions of its value amid Trump’s tariff policies in global trade.
→ Declining US Treasury yields due to expectations of further Fed rate cuts in 2025.
Technical Analysis of EUR/USD Chart
Price movements form an upward channel (marked in blue), but the red arrow highlights bearish activity near resistance levels at:
→ The yearly high around 1.05333.
→ The median line of the channel.
Given the lower liquidity at the start of trading, the initial breakout above the psychological 1.05000 level may have been false. Potential bearish pressure could push EUR/USD towards a support zone, including:
→ The 1.0400 level.
→ The lower boundary of a broader channel (marked in orange).
If bulls intend to maintain their February momentum, signs of buying activity may emerge near the lower boundary of the blue channel.
Trade over 50 forex markets 24 hours a day with FXOpen. Take advantage of low commissions, deep liquidity, and spreads from 0.0 pips. Open your FXOpen account now or learn more about trading forex with FXOpen.
CFDs are complex instruments and come with a high risk of losing your money.
This article represents the opinion of the Companies operating under the FXOpen brand only. It is not to be construed as an offer, solicitation, or recommendation with respect to products and services provided by the Companies operating under the FXOpen brand, nor is it to be considered financial advice.

👍2
#Economy #GDP #Inflation #FederalReserve #ForexTrading #Gold #StockMarket #Investing
Market Insights with Gary Thomson: Canada’s GDP Growth, US PCE Price Index, Gold, Earnings Reports
In this video, we’ll explore the key economic events, market trends, and corporate news shaping the financial landscape. Get ready for expert insights into forex, commodities, and stocks to help you navigate the week ahead. Let’s dive in!
In this episode:
🔸 Canada’s GDP Growth
Canada’s Q4 GDP data is coming—will it show resilience or weakness amid trade tensions? A slowdown could pressure the CAD, making this a key report for traders.
🔸 US PCE Price Index
With U.S. PCE data ahead, will inflation surprise on the upside and fuel stagflation fears? A hot report could impact Fed policy and market sentiment.
🔸 Gold
Gold hits new highs as investors seek safety. With tariffs, policy uncertainty, and geopolitical tensions rising, will gold continue its rally or face a pullback?
🔸 Corporate Earnings Statements
The US stock market rallied on strong earnings, but will NVIDIA’s report keep the momentum going? With expectations high, a surprise could trigger big market moves.
https://cutt.ly/UreV0zOd
To take advantage of price fluctuations in the foreign exchange markets, consider enlisting the services of a reliable broker like FXOpen.
⚠️
This forecast represents FXOpen Companies opinion only, it should not be construed as an offer, invitation or recommendation in respect to FXOpen Companies products and services or as financial advice.
Market Insights with Gary Thomson: Canada’s GDP Growth, US PCE Price Index, Gold, Earnings Reports
In this video, we’ll explore the key economic events, market trends, and corporate news shaping the financial landscape. Get ready for expert insights into forex, commodities, and stocks to help you navigate the week ahead. Let’s dive in!
In this episode:
🔸 Canada’s GDP Growth
Canada’s Q4 GDP data is coming—will it show resilience or weakness amid trade tensions? A slowdown could pressure the CAD, making this a key report for traders.
🔸 US PCE Price Index
With U.S. PCE data ahead, will inflation surprise on the upside and fuel stagflation fears? A hot report could impact Fed policy and market sentiment.
🔸 Gold
Gold hits new highs as investors seek safety. With tariffs, policy uncertainty, and geopolitical tensions rising, will gold continue its rally or face a pullback?
🔸 Corporate Earnings Statements
The US stock market rallied on strong earnings, but will NVIDIA’s report keep the momentum going? With expectations high, a surprise could trigger big market moves.
https://cutt.ly/UreV0zOd
To take advantage of price fluctuations in the foreign exchange markets, consider enlisting the services of a reliable broker like FXOpen.
⚠️
This forecast represents FXOpen Companies opinion only, it should not be construed as an offer, invitation or recommendation in respect to FXOpen Companies products and services or as financial advice.
YouTube
Market Insights with Gary Thomson: Canada’s GDP Growth, US PCE Price Index, Gold, Earnings Reports
In this video, we’ll explore the key economic events, market trends, and corporate news shaping the financial landscape. Get ready for expert insights into forex, commodities, and stocks to help you navigate the week ahead. Let’s dive in!
In this episode:…
In this episode:…
👍2
#marketanalysis #stockmarket #crypto
Coinbase (COIN) Shares Drop to Three-Month Low
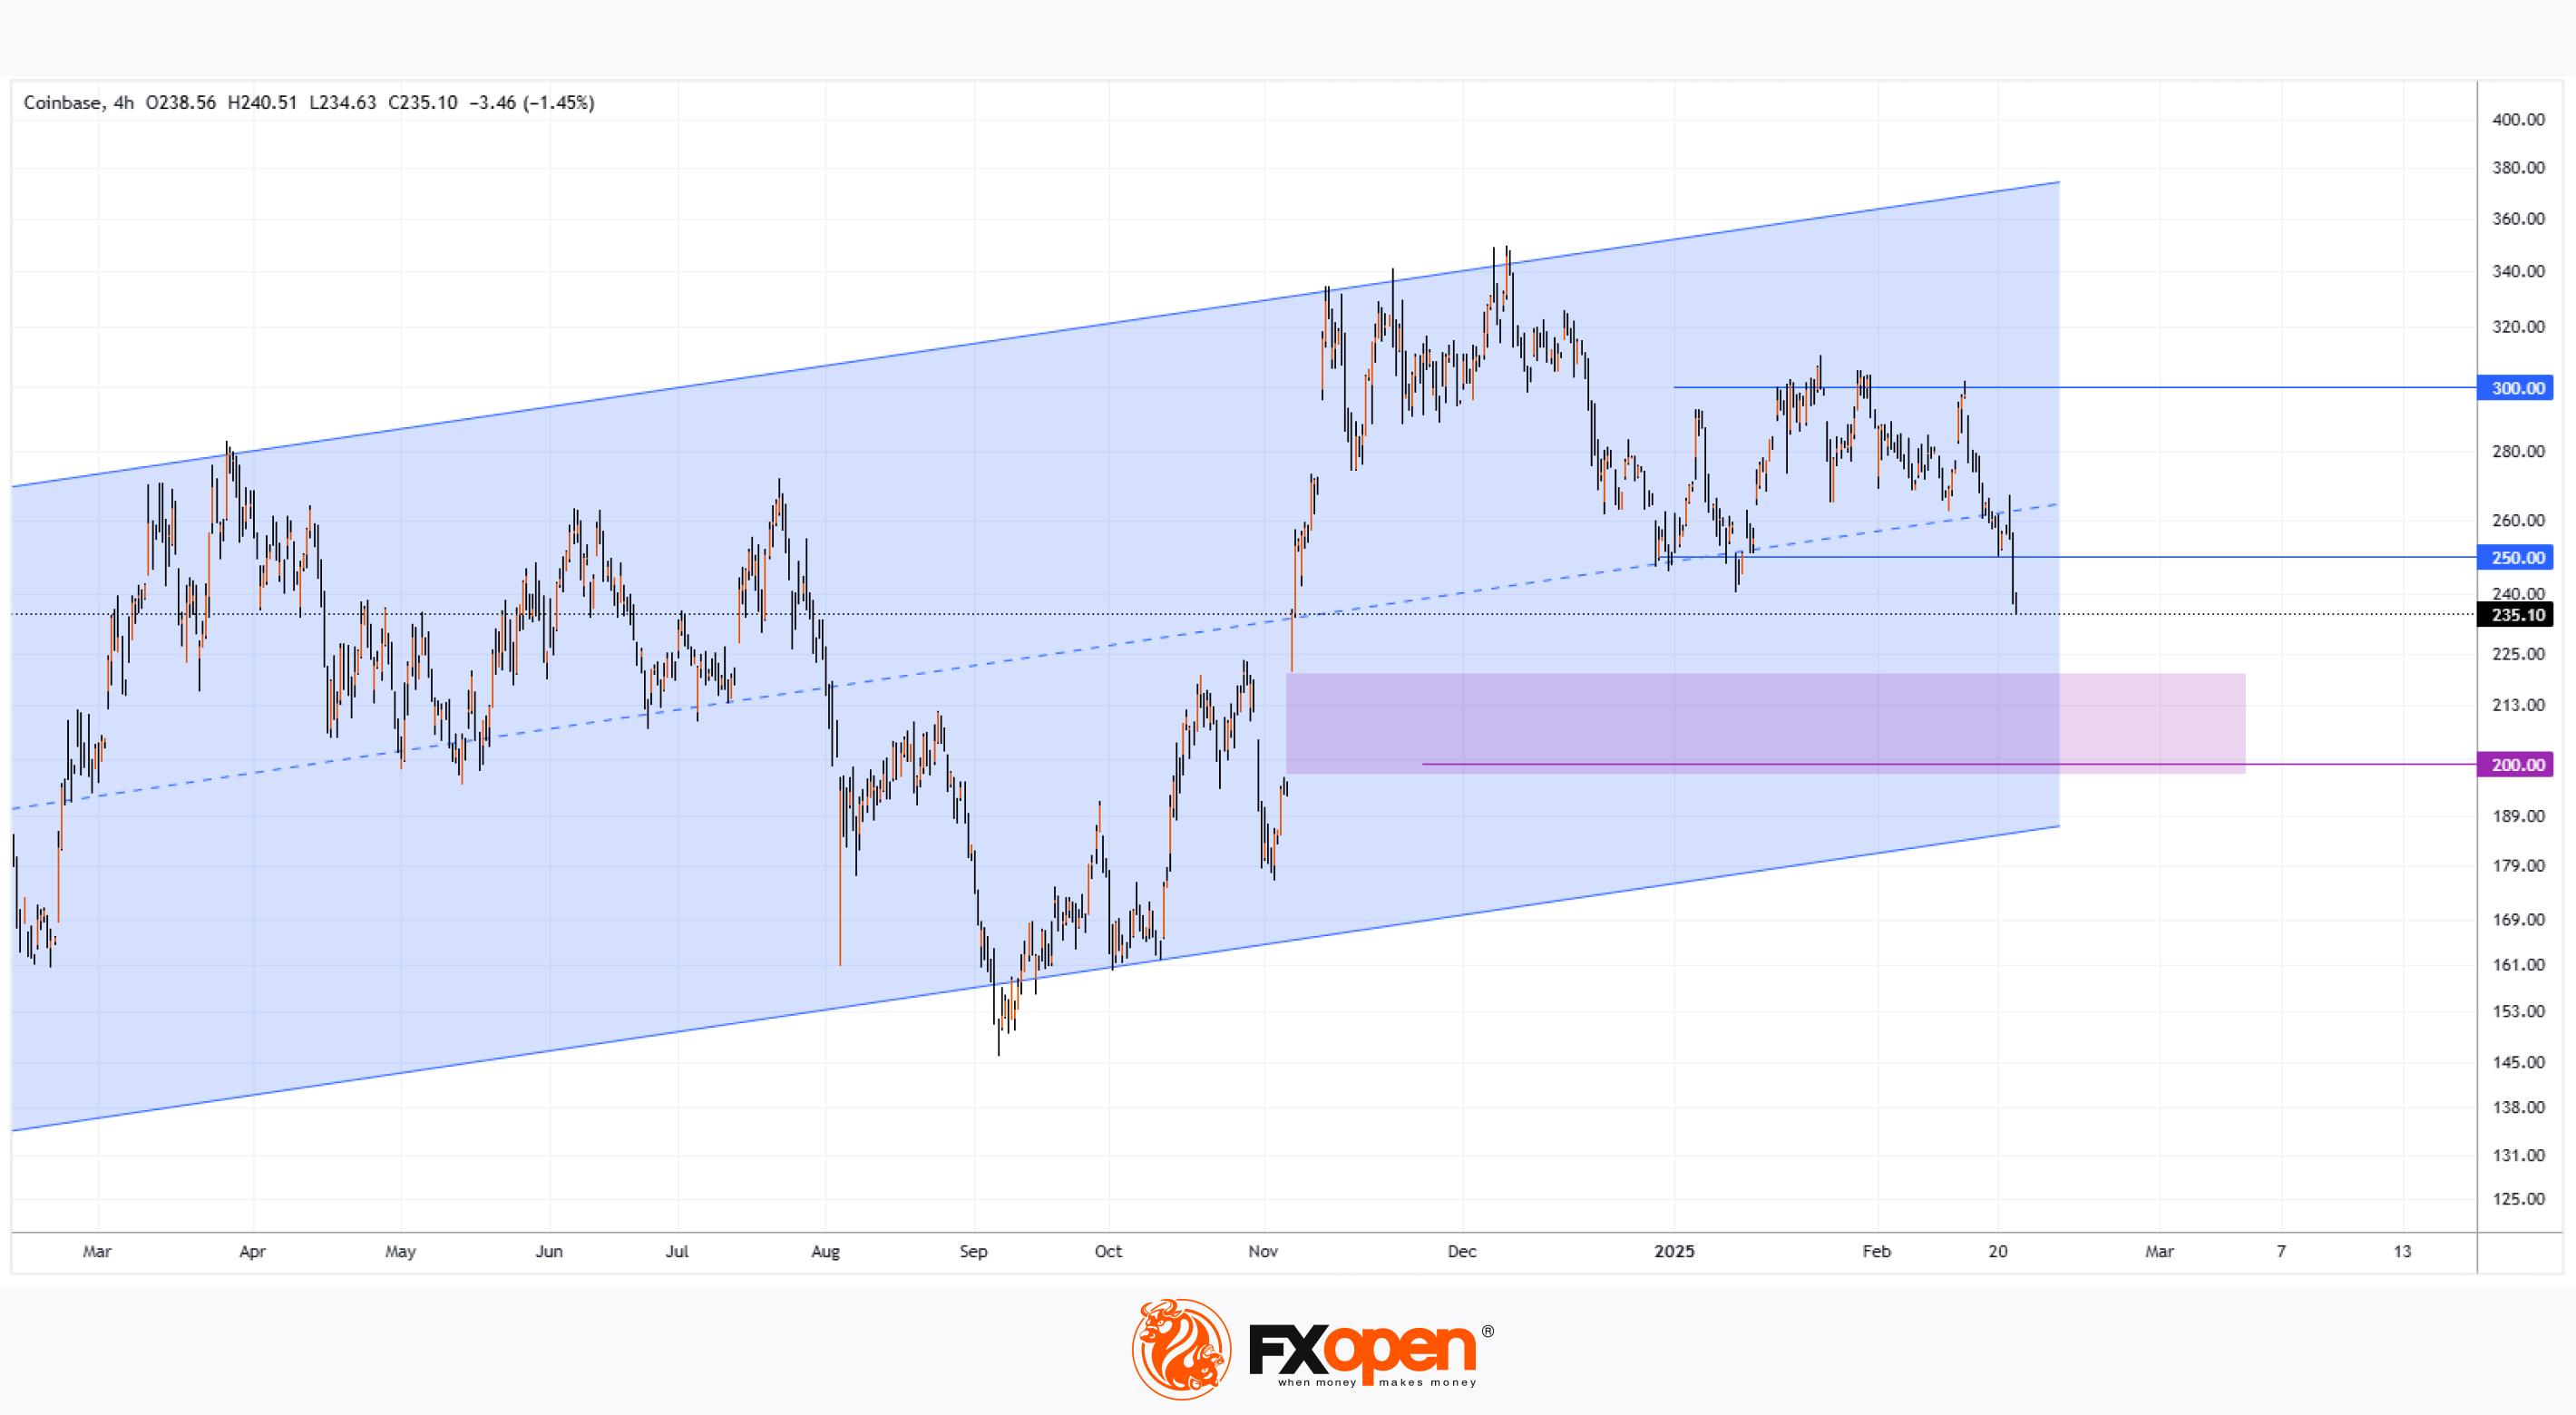
The Coinbase (COIN) chart shows that, for the first time in 2025, the share price has fallen below the psychological $250 level.
Bearish factors impacting COIN:
One key factor driving negative sentiment is the confirmed hack of the ByBit cryptocurrency exchange, raising concerns about deposit security in the industry. According to media reports:
→ The attack may have been carried out by North Korean hacker group Lazarus.
→ Hackers allegedly drained Ethereum tokens worth between $1 billion and $5 billion from ByBit’s wallet.
→ This is the largest crypto hack in history.
Another factor is growing concerns about the US economy, which have negatively impacted stock markets. As reported by Reuters:
→ The S&P 500 index (US SPX 500 mini on FXOpen) fell by 1.66% on Friday, marking its worst performance of the year.
→ The decline followed a drop in Walmart’s share price and weak consumer sentiment data.
→ Friday’s Purchasing Managers’ Index (PMI) figures were below previous levels. Investors are now focusing on this week’s release of the Personal Consumption Expenditures (PCE) price index—the Federal Reserve’s preferred inflation gauge.
Technical Analysis of Coinbase (COIN) Chart
COIN price movements form an upward channel (marked in blue), but several bearish signals are emerging:
→ The price has dropped into the lower half of the channel.
→ The psychological resistance level has shifted from $300 to potentially $250.
If bearish sentiment persists, COIN’s share price could fall further towards a support zone consisting of:
→ A bullish gap (marked in purple).
→ The lower boundary of the blue channel.
→ The psychological $200 level.
Coinbase (COIN) Price Forecast
Wall Street analysts remain cautiously optimistic following Coinbase’s quarterly earnings report on 13 February, which exceeded expectations.
According to TipRanks:
→ 10 out of 21 analysts recommend buying COIN.
→ The average 12-month price target for COIN is $350.
Trade global index CFDs with zero commission and tight spreads. Open your FXOpen account now or learn more about trading index CFDs with FXOpen.
CFDs are complex instruments and come with a high risk of losing your money.
This article represents the opinion of the Companies operating under the FXOpen brand only. It is not to be construed as an offer, solicitation, or recommendation with respect to products and services provided by the Companies operating under the FXOpen brand, nor is it to be considered financial advice.
Coinbase (COIN) Shares Drop to Three-Month Low
The Coinbase (COIN) chart shows that, for the first time in 2025, the share price has fallen below the psychological $250 level.
Bearish factors impacting COIN:
One key factor driving negative sentiment is the confirmed hack of the ByBit cryptocurrency exchange, raising concerns about deposit security in the industry. According to media reports:
→ The attack may have been carried out by North Korean hacker group Lazarus.
→ Hackers allegedly drained Ethereum tokens worth between $1 billion and $5 billion from ByBit’s wallet.
→ This is the largest crypto hack in history.
Another factor is growing concerns about the US economy, which have negatively impacted stock markets. As reported by Reuters:
→ The S&P 500 index (US SPX 500 mini on FXOpen) fell by 1.66% on Friday, marking its worst performance of the year.
→ The decline followed a drop in Walmart’s share price and weak consumer sentiment data.
→ Friday’s Purchasing Managers’ Index (PMI) figures were below previous levels. Investors are now focusing on this week’s release of the Personal Consumption Expenditures (PCE) price index—the Federal Reserve’s preferred inflation gauge.
Technical Analysis of Coinbase (COIN) Chart
COIN price movements form an upward channel (marked in blue), but several bearish signals are emerging:
→ The price has dropped into the lower half of the channel.
→ The psychological resistance level has shifted from $300 to potentially $250.
If bearish sentiment persists, COIN’s share price could fall further towards a support zone consisting of:
→ A bullish gap (marked in purple).
→ The lower boundary of the blue channel.
→ The psychological $200 level.
Coinbase (COIN) Price Forecast
Wall Street analysts remain cautiously optimistic following Coinbase’s quarterly earnings report on 13 February, which exceeded expectations.
According to TipRanks:
→ 10 out of 21 analysts recommend buying COIN.
→ The average 12-month price target for COIN is $350.
Trade global index CFDs with zero commission and tight spreads. Open your FXOpen account now or learn more about trading index CFDs with FXOpen.
CFDs are complex instruments and come with a high risk of losing your money.
This article represents the opinion of the Companies operating under the FXOpen brand only. It is not to be construed as an offer, solicitation, or recommendation with respect to products and services provided by the Companies operating under the FXOpen brand, nor is it to be considered financial advice.
👍2
#usdchf #forextrading #tradingtips #marketanalysis
USD/CHF Rebounds from Yearly Low
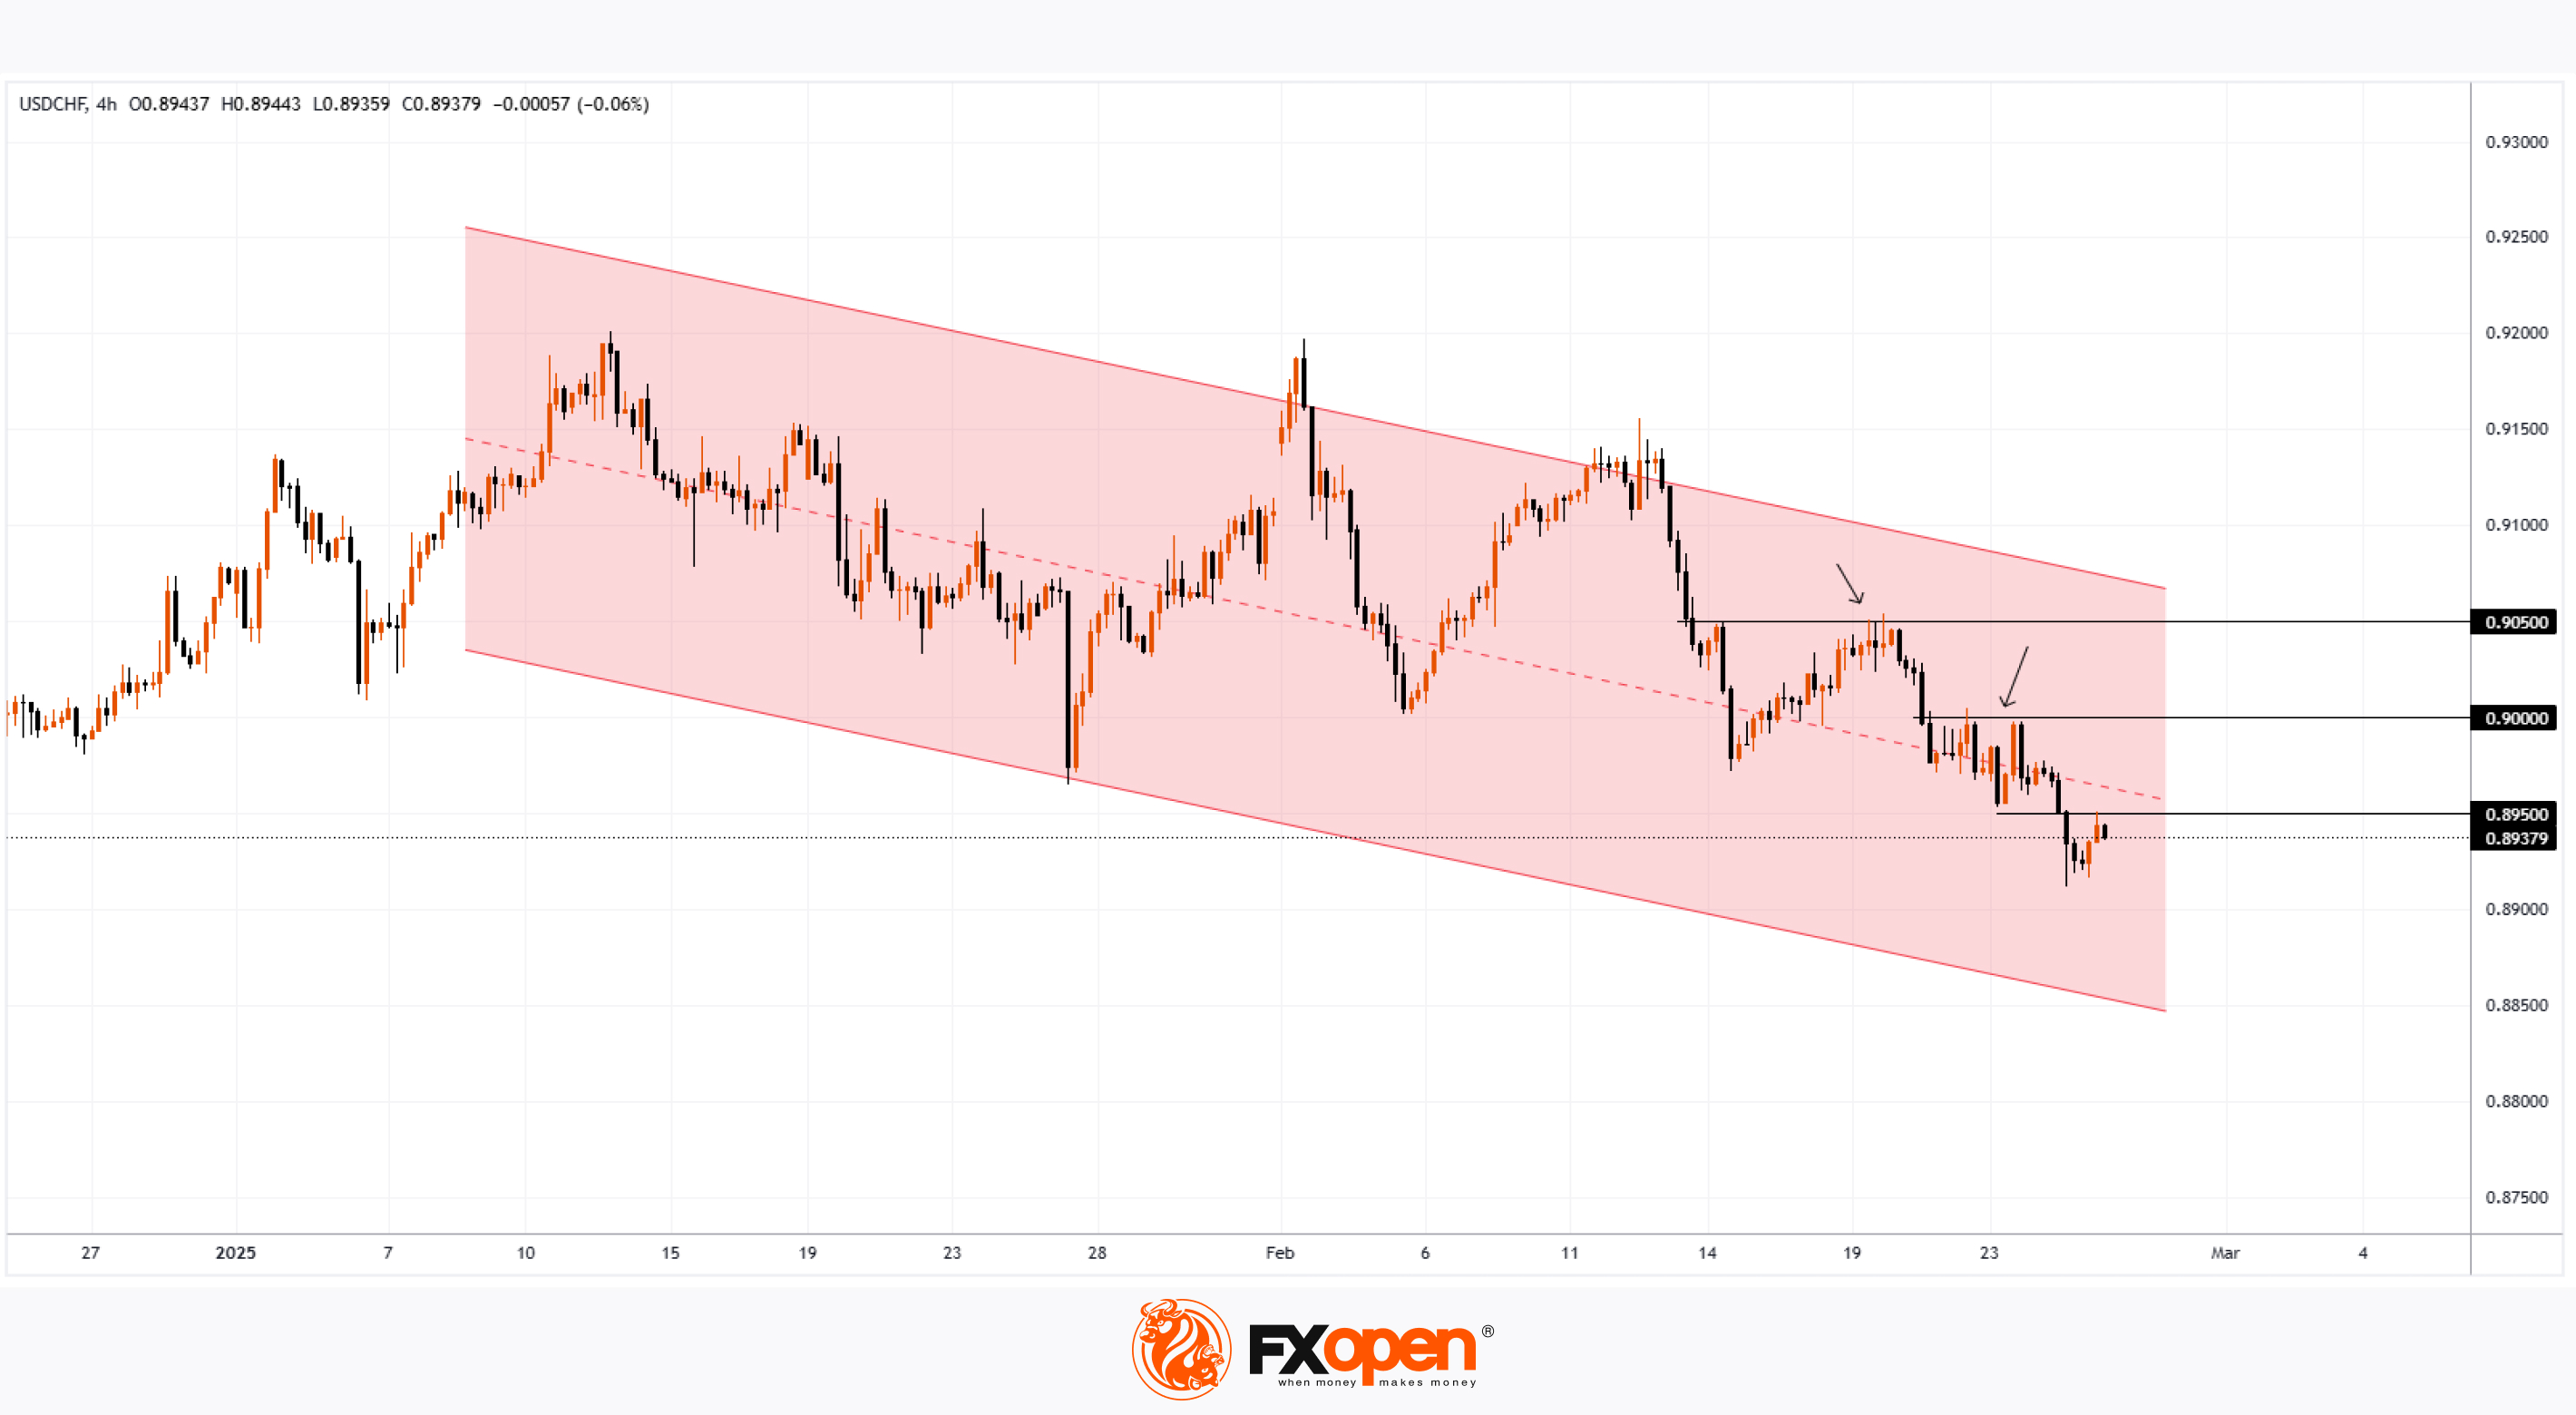
As shown in the USD/CHF chart, the exchange rate dipped below 0.89250 Swiss francs per US dollar yesterday—the lowest level since December 2024. The Swiss franc, often seen as a safe-haven currency, may gain appeal due to:
→ heightened geopolitical tensions;
→ uncertainty surrounding Trump's plans to impose trade tariffs on 4 March.
Technical Analysis of USD/CHF
Fluctuations in 2025 have formed a downward channel (marked in red), with bearish sentiment prevailing in February as key psychological levels continue to be breached (as indicated by arrows):
→ in mid-February, bears pushed the price down from 0.905;
→ later, 0.900 acted as resistance.
If bearish momentum persists, further resistance may emerge around 0.895 and the median of the downward channel.
The upcoming market direction will likely be influenced by key economic data releases:
→ Swiss GDP (11:00 GMT+3) and US GDP (16:30 GMT+3) tomorrow;
→ US Core PCE Price Index (16:30 GMT+3) on Friday—an important inflation gauge.
Trade over 50 forex markets 24 hours a day with FXOpen. Take advantage of low commissions, deep liquidity, and spreads from 0.0 pips. Open your FXOpen account now or learn more about trading forex with FXOpen.
CFDs are complex instruments and come with a high risk of losing your money.
This article represents the opinion of the Companies operating under the FXOpen brand only. It is not to be construed as an offer, solicitation, or recommendation with respect to products and services provided by the Companies operating under the FXOpen brand, nor is it to be considered financial advice.
USD/CHF Rebounds from Yearly Low
As shown in the USD/CHF chart, the exchange rate dipped below 0.89250 Swiss francs per US dollar yesterday—the lowest level since December 2024. The Swiss franc, often seen as a safe-haven currency, may gain appeal due to:
→ heightened geopolitical tensions;
→ uncertainty surrounding Trump's plans to impose trade tariffs on 4 March.
Technical Analysis of USD/CHF
Fluctuations in 2025 have formed a downward channel (marked in red), with bearish sentiment prevailing in February as key psychological levels continue to be breached (as indicated by arrows):
→ in mid-February, bears pushed the price down from 0.905;
→ later, 0.900 acted as resistance.
If bearish momentum persists, further resistance may emerge around 0.895 and the median of the downward channel.
The upcoming market direction will likely be influenced by key economic data releases:
→ Swiss GDP (11:00 GMT+3) and US GDP (16:30 GMT+3) tomorrow;
→ US Core PCE Price Index (16:30 GMT+3) on Friday—an important inflation gauge.
Trade over 50 forex markets 24 hours a day with FXOpen. Take advantage of low commissions, deep liquidity, and spreads from 0.0 pips. Open your FXOpen account now or learn more about trading forex with FXOpen.
CFDs are complex instruments and come with a high risk of losing your money.
This article represents the opinion of the Companies operating under the FXOpen brand only. It is not to be construed as an offer, solicitation, or recommendation with respect to products and services provided by the Companies operating under the FXOpen brand, nor is it to be considered financial advice.
👍2
#tsla #stockmarket #stocktrading #MarketNews
Tesla (TSLA) Share Price Drops by Over 8%
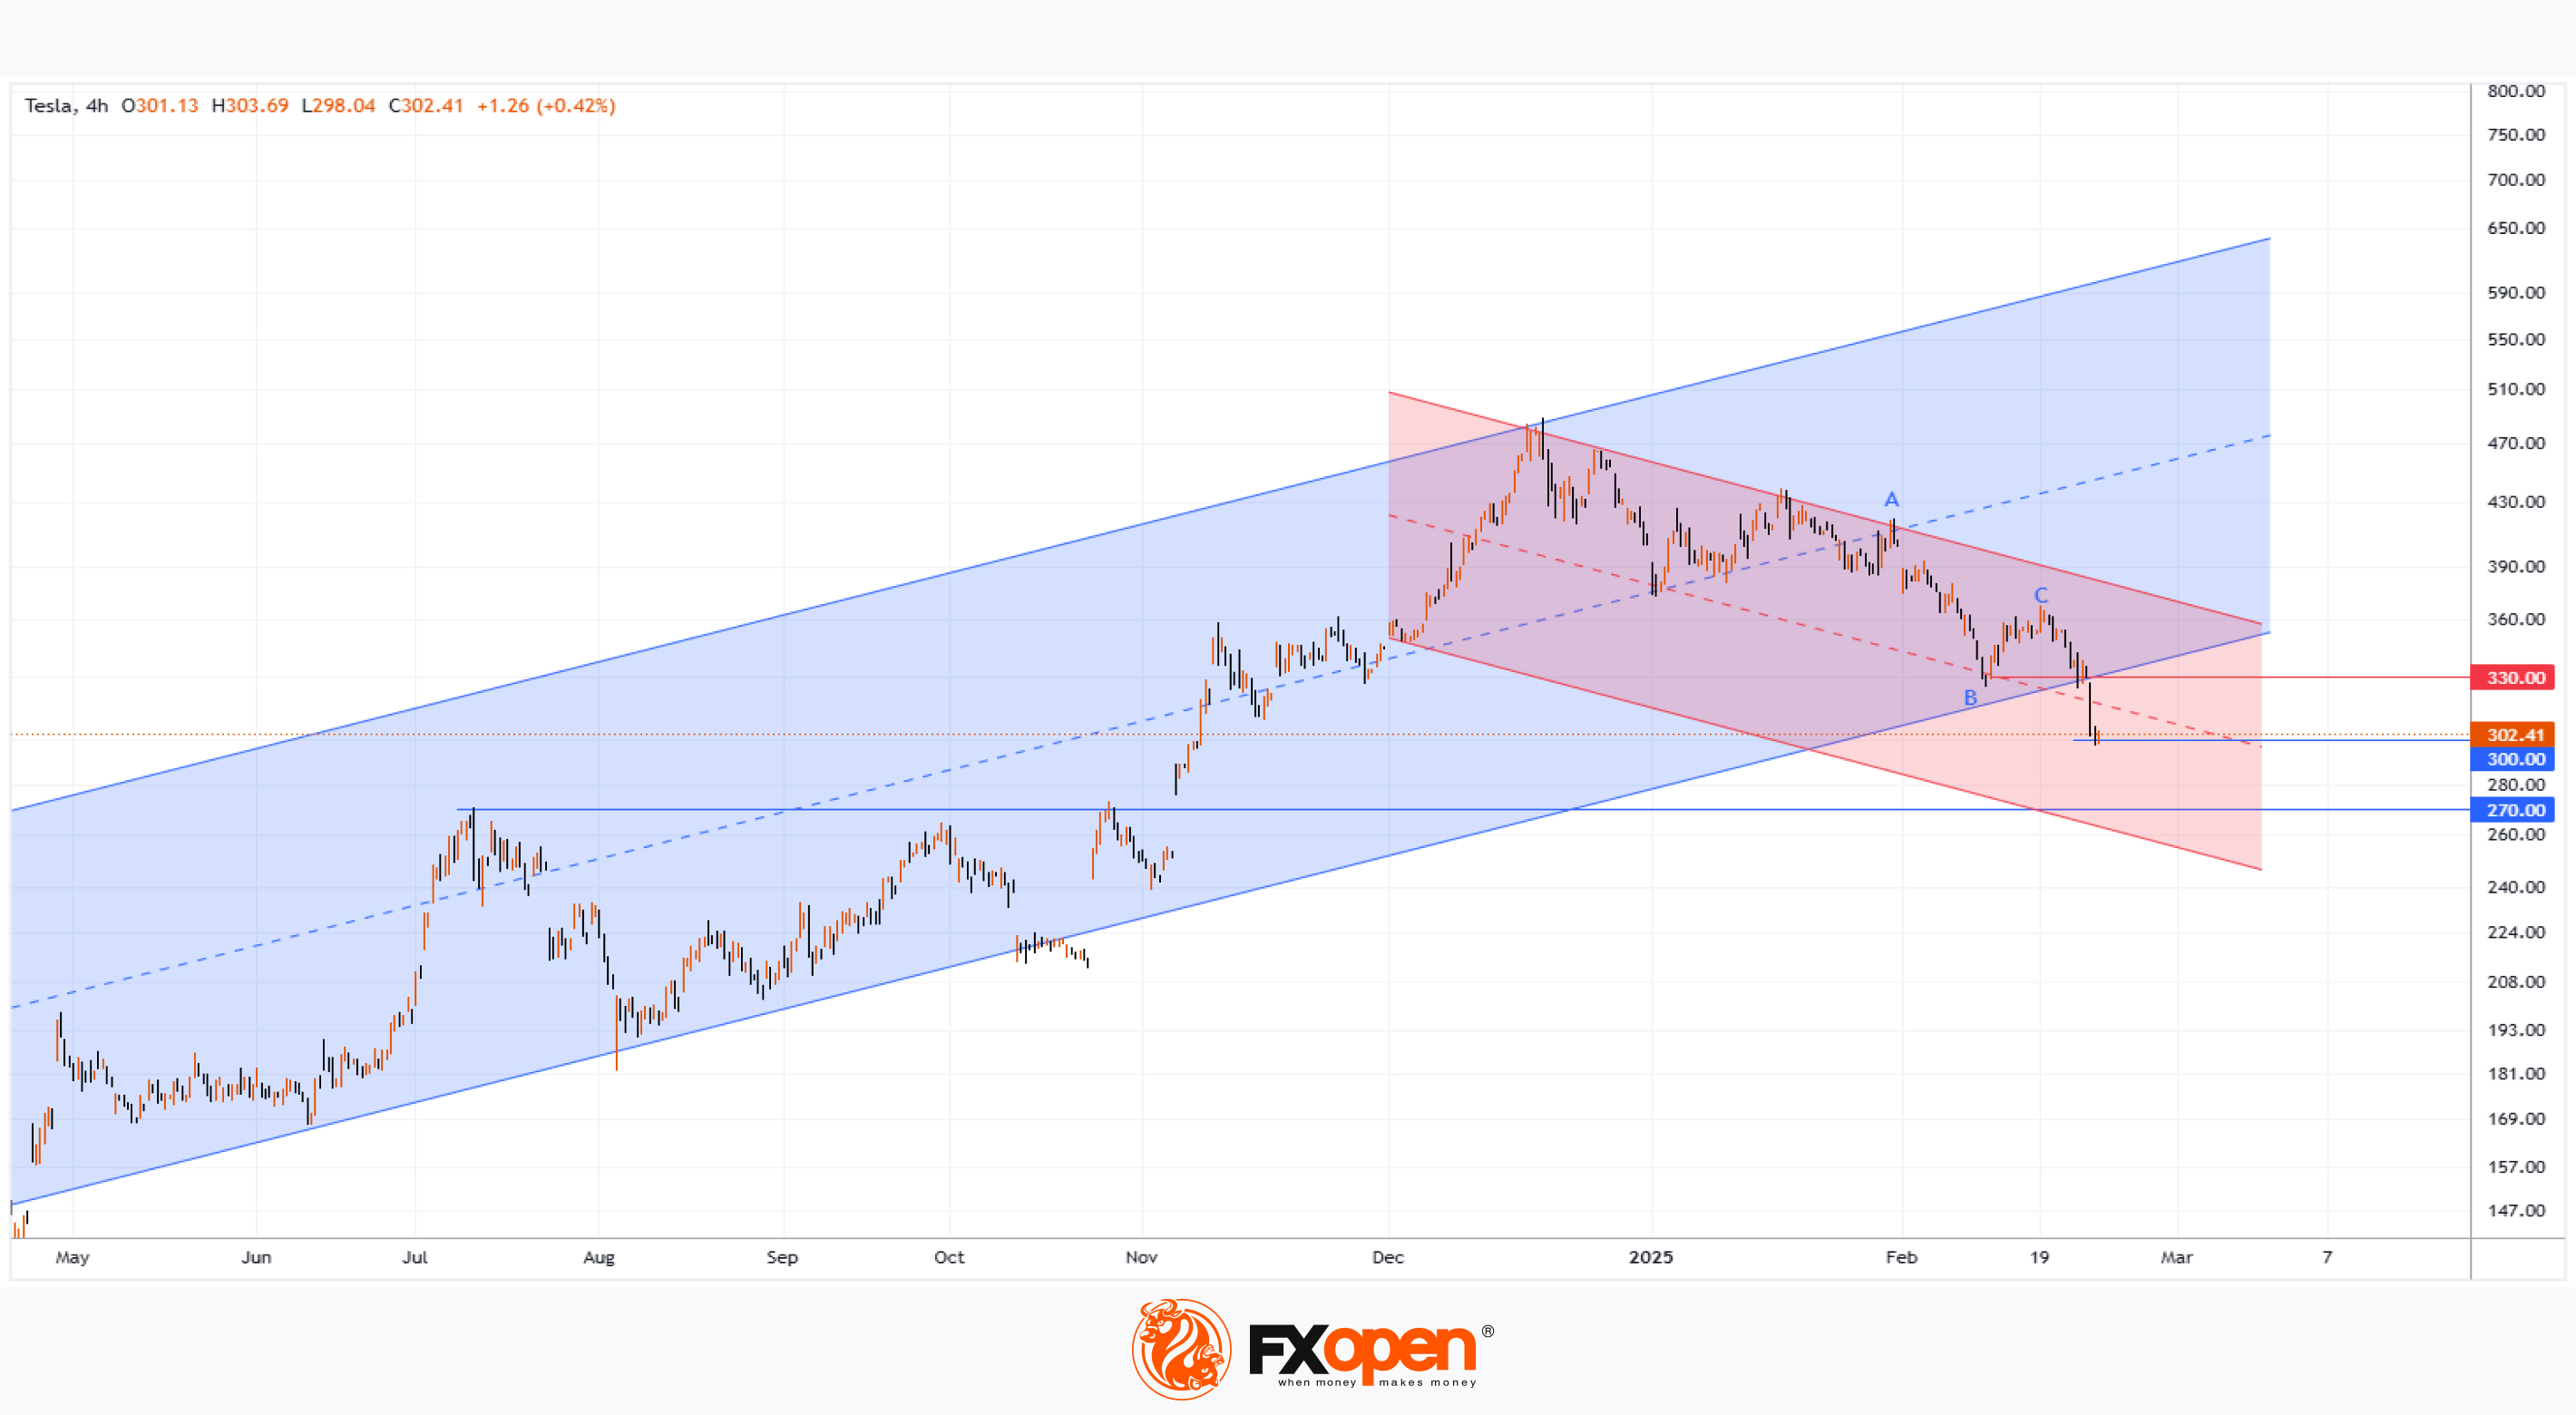
The Tesla stock chart today paints a grim picture for investors, as TSLA's price during trading on 25 February:
→ fell by more than 8% in a single day;
→ dropped below the psychologically significant $300 per share mark for the first time since early November 2024 (despite nearing $500 in late December 2024).
Why Tesla (TSLA) Shares Have Fallen
Tesla’s sales in Europe fell by 45% in January compared to the same period last year, even as overall EV sales in Europe grew by 37%.
This sharp drop in European sales has heightened concerns that CEO Elon Musk’s political activities are negatively affecting the company’s business.
Technical Analysis of Tesla (TSLA) Stock Chart
Price movements in 2024 formed a key upward trend channel (marked by blue lines), but yesterday’s decline led to a bearish break below the lower boundary of this trend. Specifically:
→ The $330 level, where the lower blue boundary was breached, now appears to be a significant resistance level.
→ The B→C retracement is approximately 50% of the A→B decline – a bearish signal.
→ Price movements in 2025 outline a descending trend channel (marked in red), which is becoming increasingly relevant.
If the psychological support level of $300 per TSLA share fails to hold, the price may continue to decline towards the key $270 level. This level acted as resistance to growth in the second half of 2024 but was broken after news of Trump’s victory.
Tesla (TSLA) Share Price Forecast
Analysts remain cautiously optimistic, possibly hoping that Musk’s close ties with Trump will help accelerate the launch of Tesla’s robotaxi service.
Another potential positive driver could be Tesla’s entry into the Indian market.
According to TipRanks:
→ 13 out of 35 surveyed analysts recommend buying TSLA shares;
→ The average 12-month price target for TSLA is $357.
Trade global index CFDs with zero commission and tight spreads. Open your FXOpen account now or learn more about trading index CFDs with FXOpen.
CFDs are complex instruments and come with a high risk of losing your money.
This article represents the opinion of the Companies operating under the FXOpen brand only. It is not to be construed as an offer, solicitation, or recommendation with respect to products and services provided by the Companies operating under the FXOpen brand, nor is it to be considered financial advice.
Tesla (TSLA) Share Price Drops by Over 8%
The Tesla stock chart today paints a grim picture for investors, as TSLA's price during trading on 25 February:
→ fell by more than 8% in a single day;
→ dropped below the psychologically significant $300 per share mark for the first time since early November 2024 (despite nearing $500 in late December 2024).
Why Tesla (TSLA) Shares Have Fallen
Tesla’s sales in Europe fell by 45% in January compared to the same period last year, even as overall EV sales in Europe grew by 37%.
This sharp drop in European sales has heightened concerns that CEO Elon Musk’s political activities are negatively affecting the company’s business.
Technical Analysis of Tesla (TSLA) Stock Chart
Price movements in 2024 formed a key upward trend channel (marked by blue lines), but yesterday’s decline led to a bearish break below the lower boundary of this trend. Specifically:
→ The $330 level, where the lower blue boundary was breached, now appears to be a significant resistance level.
→ The B→C retracement is approximately 50% of the A→B decline – a bearish signal.
→ Price movements in 2025 outline a descending trend channel (marked in red), which is becoming increasingly relevant.
If the psychological support level of $300 per TSLA share fails to hold, the price may continue to decline towards the key $270 level. This level acted as resistance to growth in the second half of 2024 but was broken after news of Trump’s victory.
Tesla (TSLA) Share Price Forecast
Analysts remain cautiously optimistic, possibly hoping that Musk’s close ties with Trump will help accelerate the launch of Tesla’s robotaxi service.
Another potential positive driver could be Tesla’s entry into the Indian market.
According to TipRanks:
→ 13 out of 35 surveyed analysts recommend buying TSLA shares;
→ The average 12-month price target for TSLA is $357.
Trade global index CFDs with zero commission and tight spreads. Open your FXOpen account now or learn more about trading index CFDs with FXOpen.
CFDs are complex instruments and come with a high risk of losing your money.
This article represents the opinion of the Companies operating under the FXOpen brand only. It is not to be construed as an offer, solicitation, or recommendation with respect to products and services provided by the Companies operating under the FXOpen brand, nor is it to be considered financial advice.
👍2😱1
#nvidia #NVDA #stockmarket #stocktrading #MarketUpdates
Nvidia (NVDA) Share Price Dips Slightly After Earnings Report
Following the close of the main trading session yesterday, Nvidia released its quarterly earnings report, exceeding analysts' expectations:
→ Earnings per share: Actual = $0.89, Expected = $0.84
→ Revenue: Actual = $39.3 billion, Expected = $38.1 billion (a 78% increase year-on-year)
It was also revealed that Nvidia’s latest AI chip family, Blackwell, generated $11 billion in sales for the quarter. This eased concerns that transitioning to the Blackwell chip series could lead to a decline in revenue.
How Nvidia (NVDA) Shares Reacted to the Earnings Report
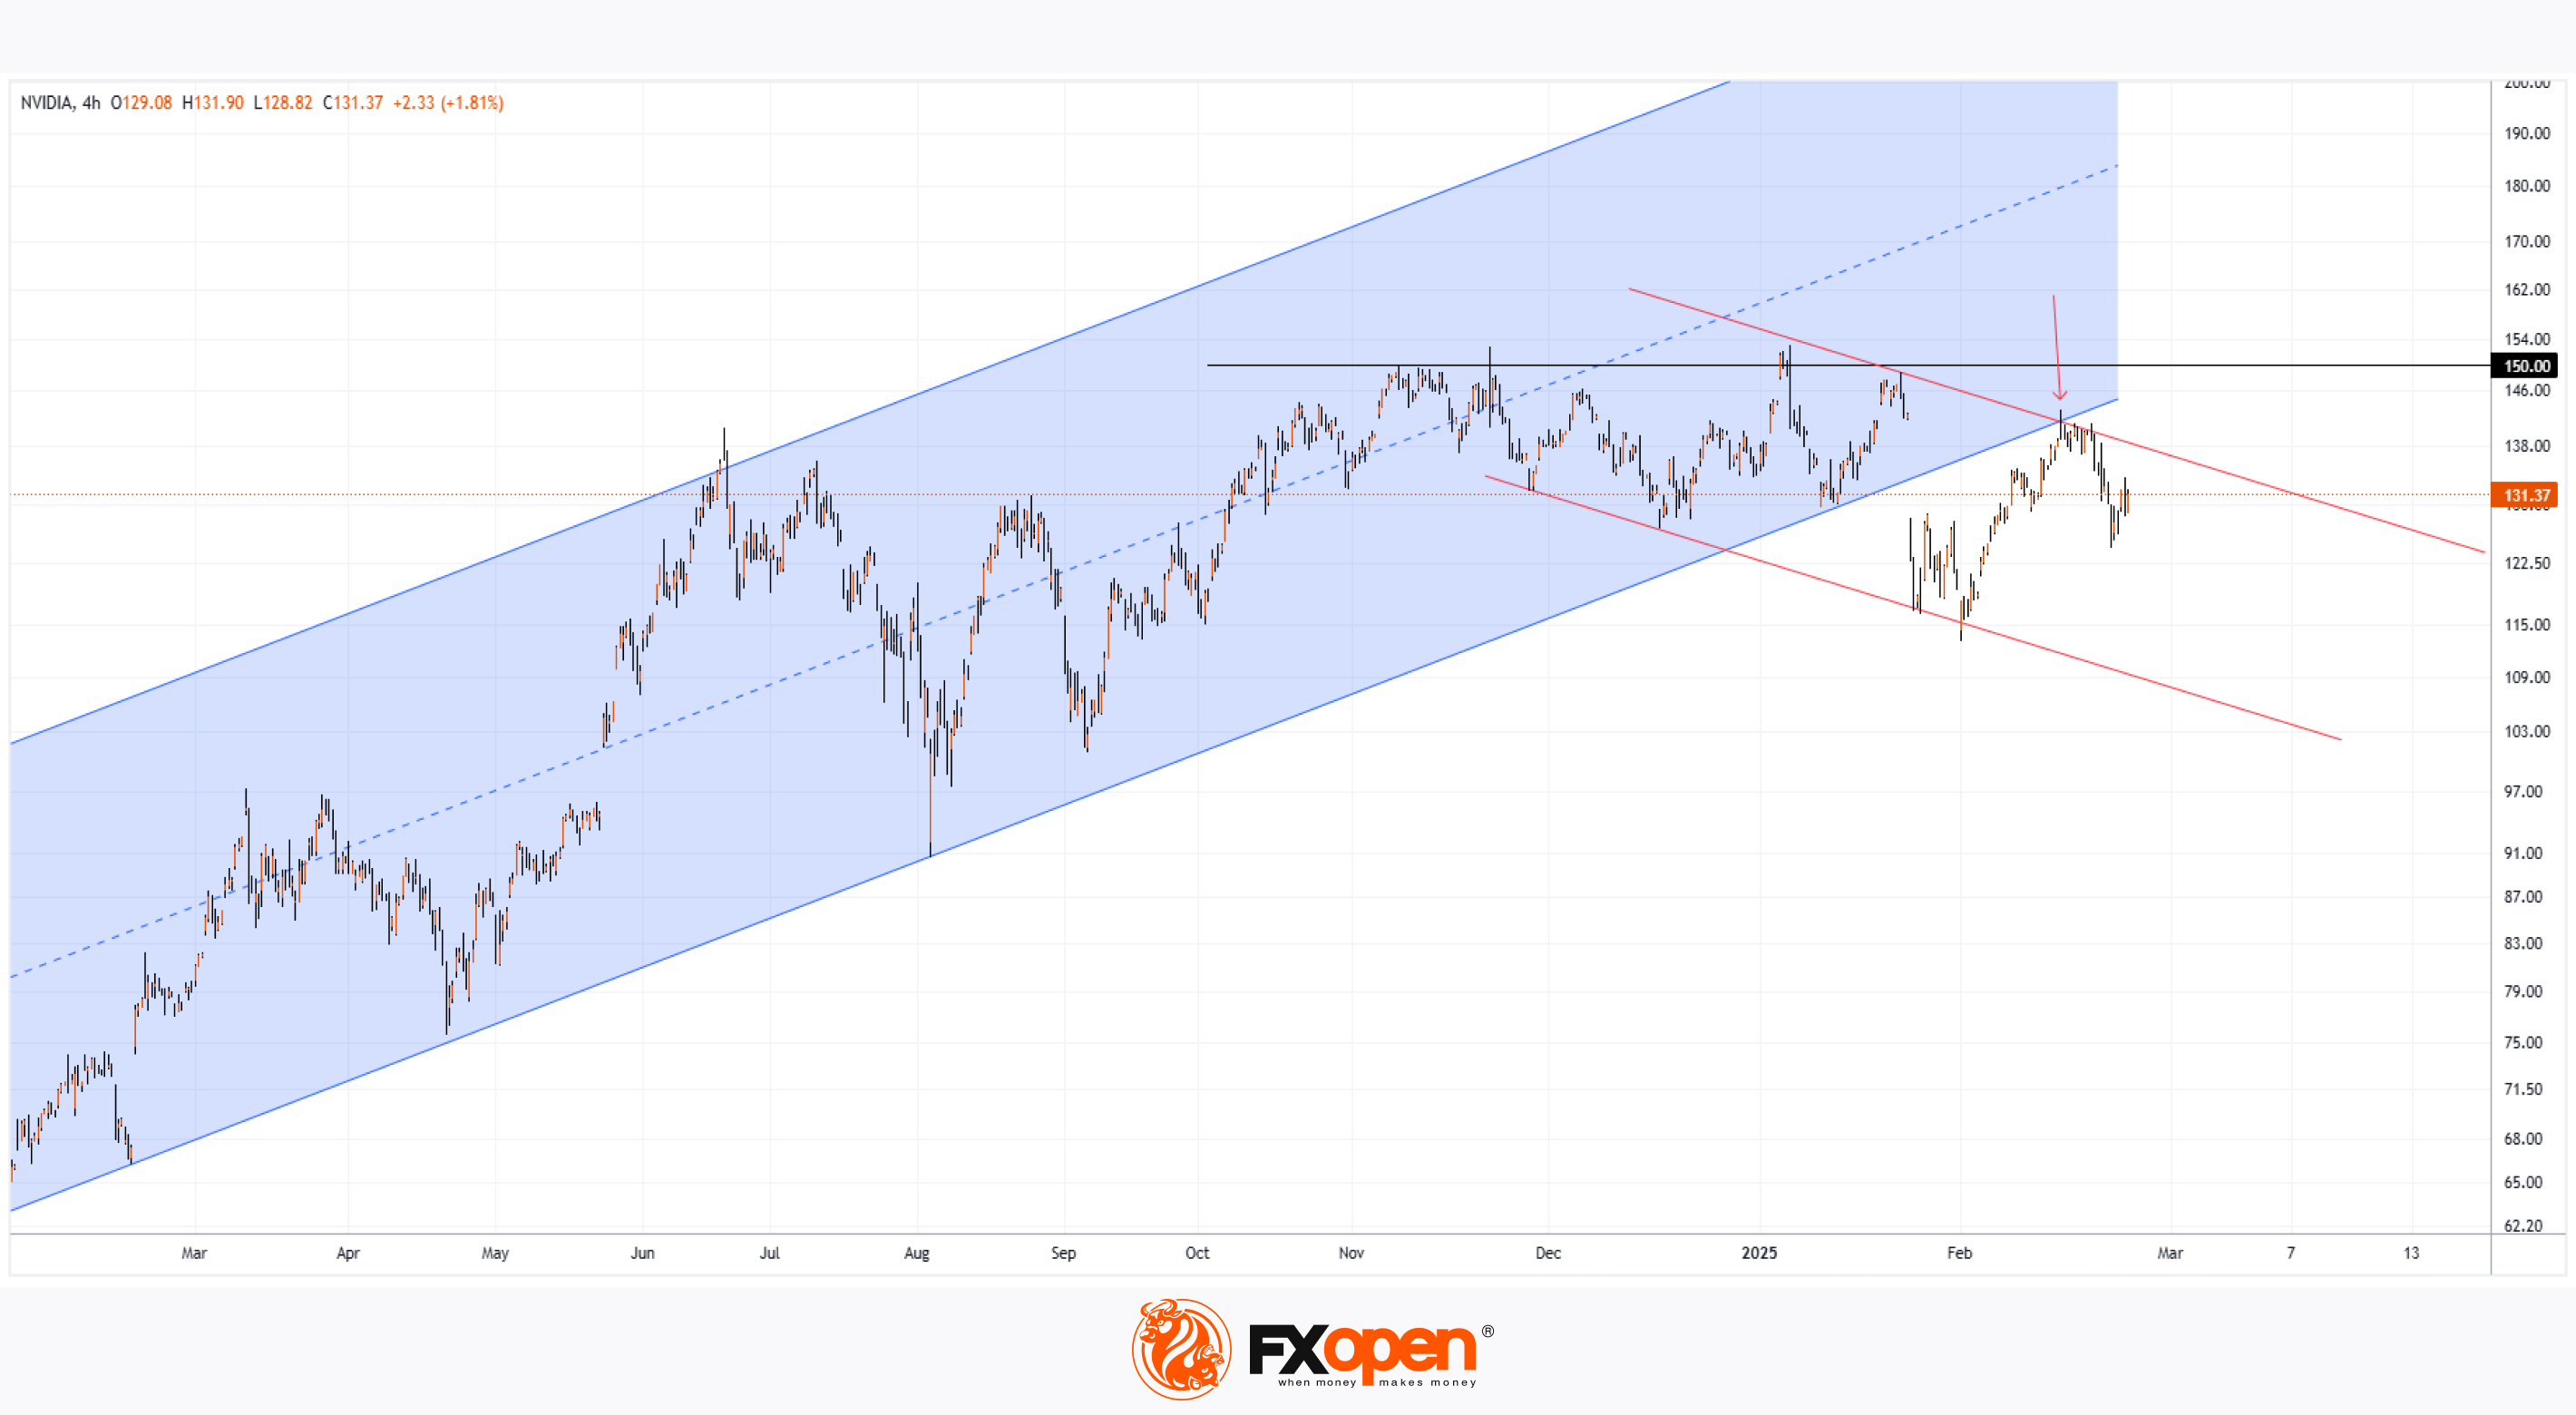
Despite the strong earnings, Nvidia’s share price did not benefit significantly. Post-market trading saw heightened volatility, with NVDA shares fluctuating between $126 and $136 in the first few minutes after the report’s release.
As volatility subsided, NVDA stabilised around $129, slightly below Wednesday’s closing price of $131.37, reflecting a decline of approximately 1.7%.
Technical Analysis of NVDA Stock Chart
In February, NVDA’s share price continued to hold below the lower boundary of its previous upward trend channel after failing to break the psychological barrier at $150. Specifically:
→ The lower channel boundary has now acted as resistance (indicated by the arrow).
→ A downward trend channel (marked in red) is becoming increasingly apparent.
As a result, NVDA shares have not shown the ability to recover from the panic sell-off on 27 January, when Nvidia and other leading AI companies saw their stocks plummet following the success of Chinese startup DeepSeek.
NVDA Share Price Forecast
Analysts remain optimistic, possibly due to the expected increase in AI-related capital expenditure by major tech firms in 2025. Additionally, the upcoming GTC conference could serve as a bullish catalyst, likely featuring new product announcements within the Blackwell family.
According to TipRanks:
→ 33 out of 36 analysts recommend buying NVDA shares.
→ The 12-month average price target for NVDA is $177.
Trade global index CFDs with zero commission and tight spreads. Open your FXOpen account now or learn more about trading index CFDs with FXOpen.
CFDs are complex instruments and come with a high risk of losing your money.
This article represents the opinion of the Companies operating under the FXOpen brand only. It is not to be construed as an offer, solicitation, or recommendation with respect to products and services provided by the Companies operating under the FXOpen brand, nor is it to be considered financial advice.
Nvidia (NVDA) Share Price Dips Slightly After Earnings Report
Following the close of the main trading session yesterday, Nvidia released its quarterly earnings report, exceeding analysts' expectations:
→ Earnings per share: Actual = $0.89, Expected = $0.84
→ Revenue: Actual = $39.3 billion, Expected = $38.1 billion (a 78% increase year-on-year)
It was also revealed that Nvidia’s latest AI chip family, Blackwell, generated $11 billion in sales for the quarter. This eased concerns that transitioning to the Blackwell chip series could lead to a decline in revenue.
How Nvidia (NVDA) Shares Reacted to the Earnings Report
Despite the strong earnings, Nvidia’s share price did not benefit significantly. Post-market trading saw heightened volatility, with NVDA shares fluctuating between $126 and $136 in the first few minutes after the report’s release.
As volatility subsided, NVDA stabilised around $129, slightly below Wednesday’s closing price of $131.37, reflecting a decline of approximately 1.7%.
Technical Analysis of NVDA Stock Chart
In February, NVDA’s share price continued to hold below the lower boundary of its previous upward trend channel after failing to break the psychological barrier at $150. Specifically:
→ The lower channel boundary has now acted as resistance (indicated by the arrow).
→ A downward trend channel (marked in red) is becoming increasingly apparent.
As a result, NVDA shares have not shown the ability to recover from the panic sell-off on 27 January, when Nvidia and other leading AI companies saw their stocks plummet following the success of Chinese startup DeepSeek.
NVDA Share Price Forecast
Analysts remain optimistic, possibly due to the expected increase in AI-related capital expenditure by major tech firms in 2025. Additionally, the upcoming GTC conference could serve as a bullish catalyst, likely featuring new product announcements within the Blackwell family.
According to TipRanks:
→ 33 out of 36 analysts recommend buying NVDA shares.
→ The 12-month average price target for NVDA is $177.
Trade global index CFDs with zero commission and tight spreads. Open your FXOpen account now or learn more about trading index CFDs with FXOpen.
CFDs are complex instruments and come with a high risk of losing your money.
This article represents the opinion of the Companies operating under the FXOpen brand only. It is not to be construed as an offer, solicitation, or recommendation with respect to products and services provided by the Companies operating under the FXOpen brand, nor is it to be considered financial advice.
👍3
#stockmarket #stocktrading #NASDAQ #MarketUpdates
Nasdaq 100 Hits Yearly Low, Led by NVDA Decline
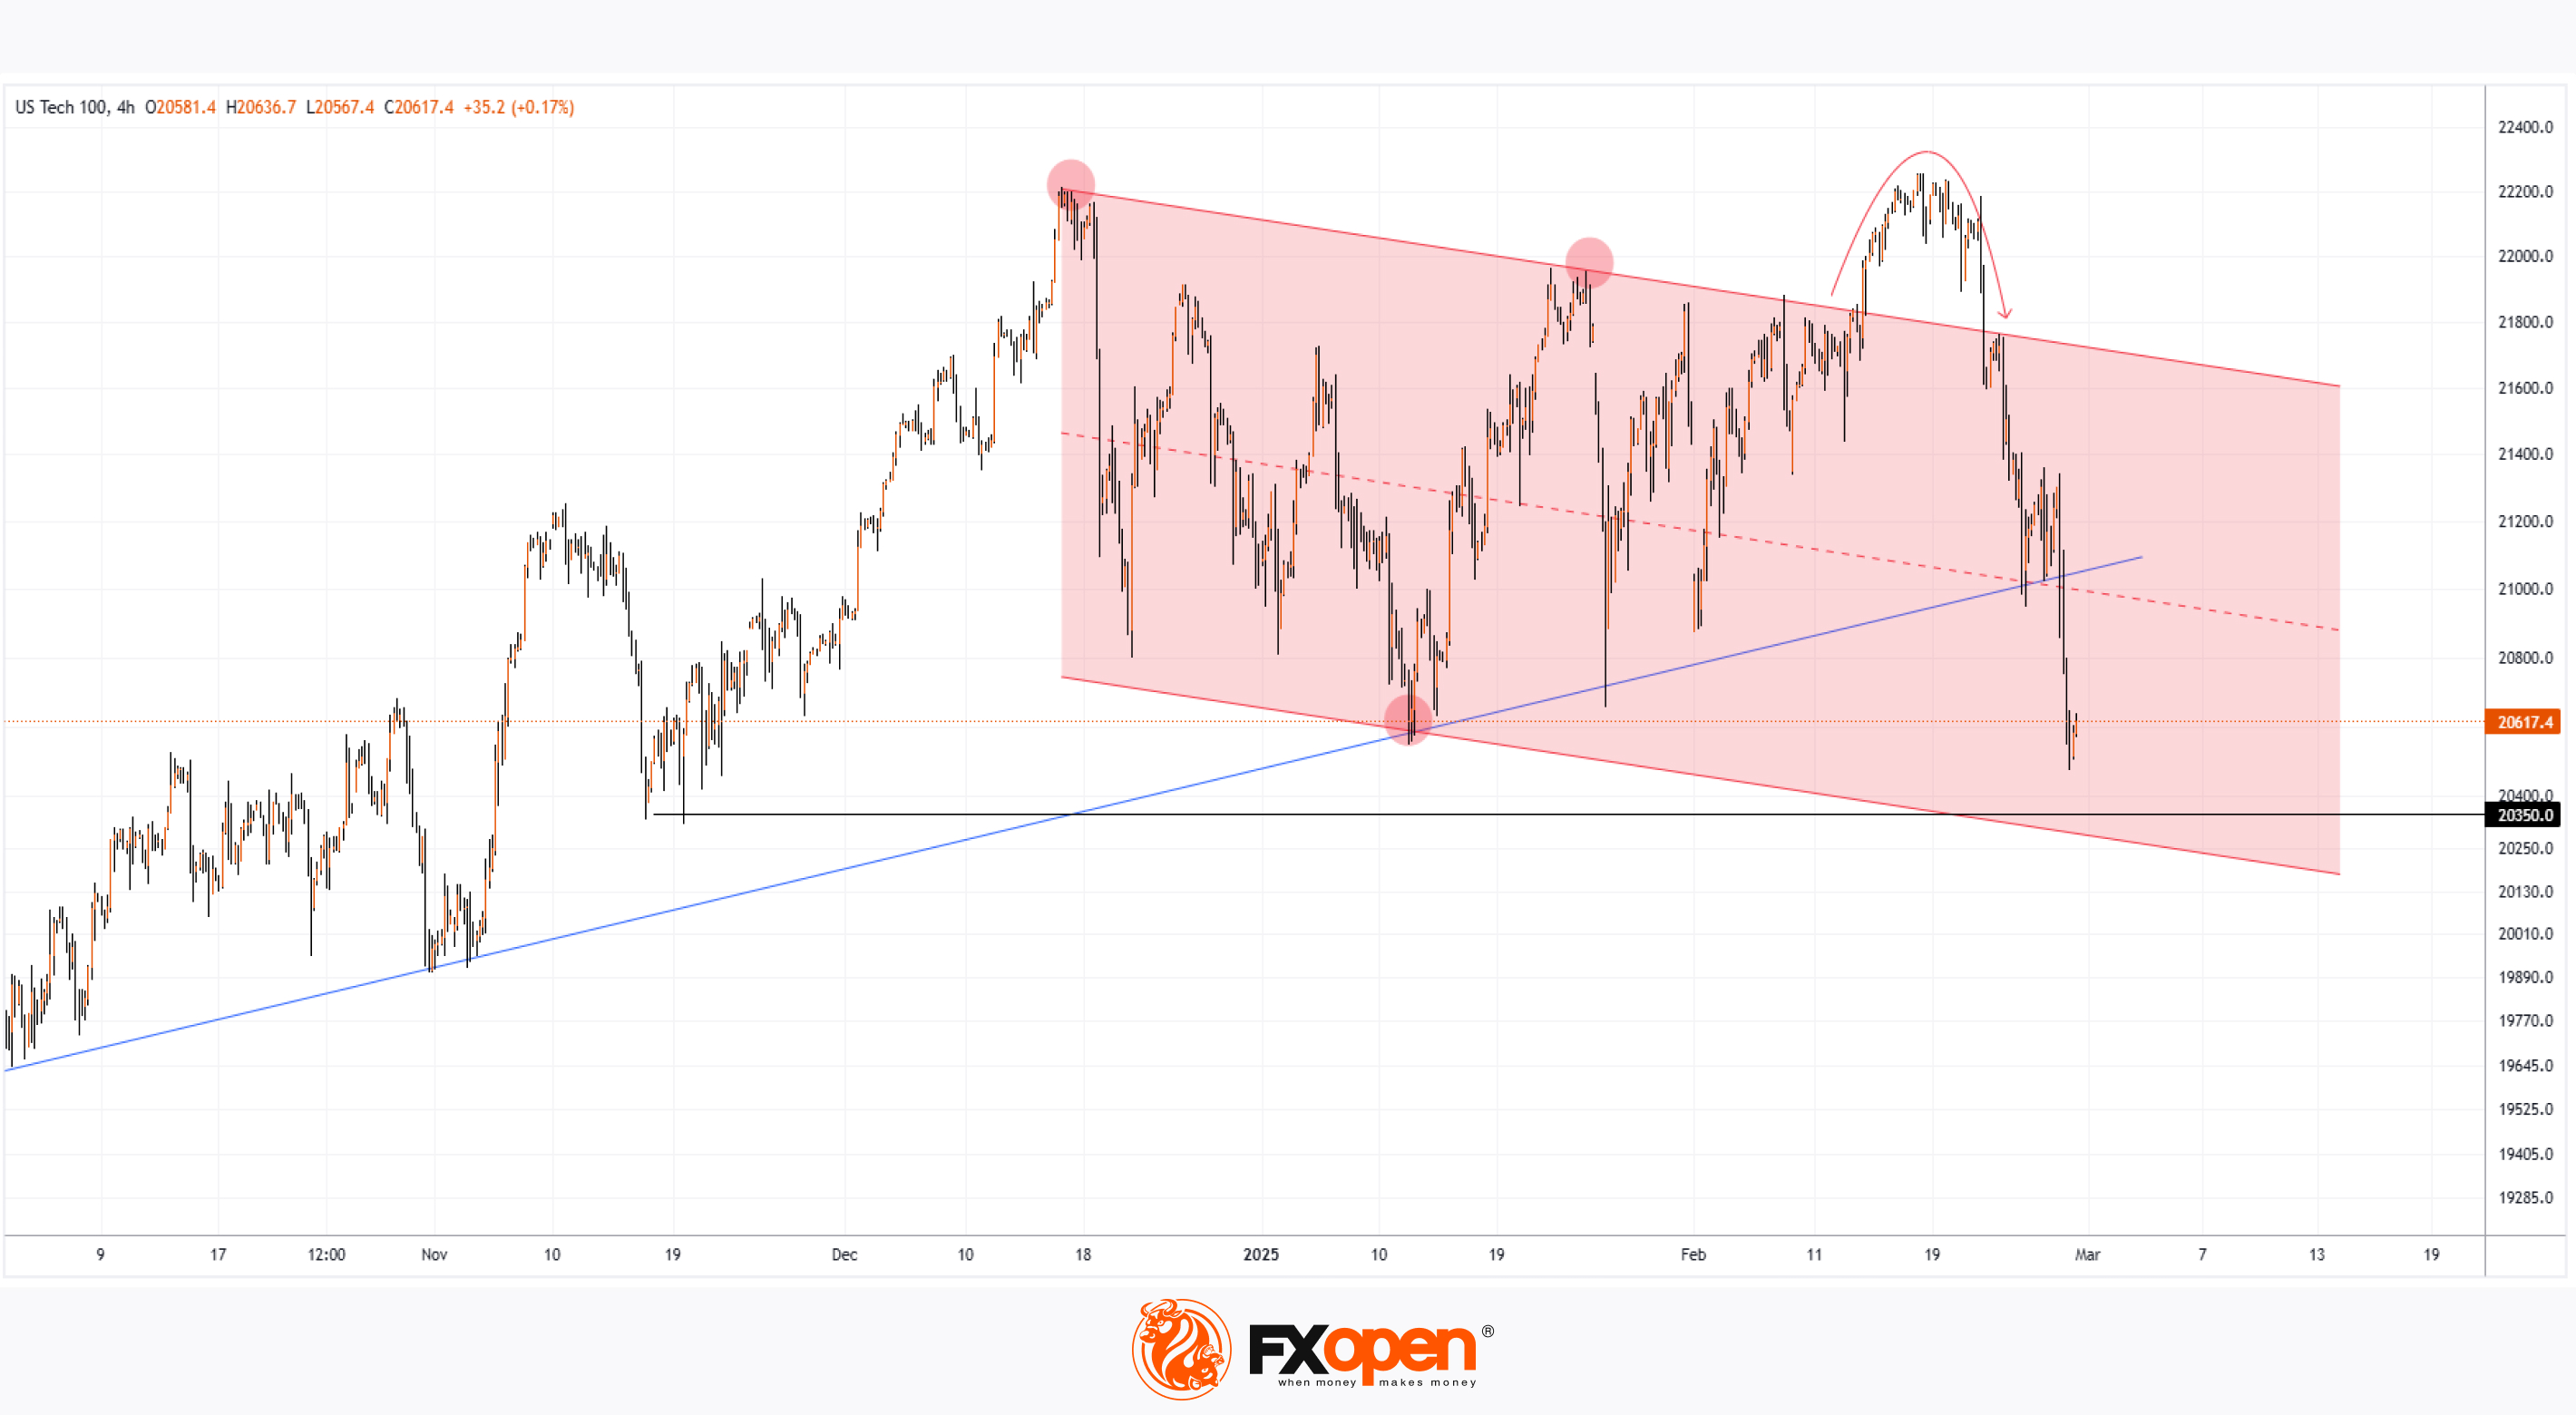
The Nasdaq 100 (US Tech 100 mini on FXOpen) has fallen below 20,500 for the first time since November 2024.
Bearish sentiment driven by:
→ The latest US jobless claims report, which showed the highest figures of 2025.
→ Concerns over the destabilising and economically damaging potential of Donald Trump’s trade policies.
Nvidia (NVDA) Among the Biggest Losers
While the Nasdaq 100 lost over 2.5% in yesterday’s session, Nvidia (NVDA) shares plunged nearly 8% despite a stronger-than-expected quarterly report, as we noted yesterday.
Technical Analysis of the Nasdaq 100 (US Tech 100 mini on FXOpen)
The ongoing decline has resulted in a bearish breakout of the trendline (marked in blue) that originated in 2024. Based on key reversals (highlighted with red circles), the chart now outlines a descending channel. An attempted breakout (indicated by an arrow) failed, forming a bearish Rounding Top pattern.
If bearish sentiment prevails—especially with focus on inflation data, as the Core PCE Price Index is set to be released today at 16:30 GMT+3—Nasdaq 100 (US Tech 100 mini on FXOpen) may drop further towards the lower boundary of the descending channel.
Trade global index CFDs with zero commission and tight spreads. Open your FXOpen account now or learn more about trading index CFDs with FXOpen.
CFDs are complex instruments and come with a high risk of losing your money.
This article represents the opinion of the Companies operating under the FXOpen brand only. It is not to be construed as an offer, solicitation, or recommendation with respect to products and services provided by the Companies operating under the FXOpen brand, nor is it to be considered financial advice.
Nasdaq 100 Hits Yearly Low, Led by NVDA Decline
The Nasdaq 100 (US Tech 100 mini on FXOpen) has fallen below 20,500 for the first time since November 2024.
Bearish sentiment driven by:
→ The latest US jobless claims report, which showed the highest figures of 2025.
→ Concerns over the destabilising and economically damaging potential of Donald Trump’s trade policies.
Nvidia (NVDA) Among the Biggest Losers
While the Nasdaq 100 lost over 2.5% in yesterday’s session, Nvidia (NVDA) shares plunged nearly 8% despite a stronger-than-expected quarterly report, as we noted yesterday.
Technical Analysis of the Nasdaq 100 (US Tech 100 mini on FXOpen)
The ongoing decline has resulted in a bearish breakout of the trendline (marked in blue) that originated in 2024. Based on key reversals (highlighted with red circles), the chart now outlines a descending channel. An attempted breakout (indicated by an arrow) failed, forming a bearish Rounding Top pattern.
If bearish sentiment prevails—especially with focus on inflation data, as the Core PCE Price Index is set to be released today at 16:30 GMT+3—Nasdaq 100 (US Tech 100 mini on FXOpen) may drop further towards the lower boundary of the descending channel.
Trade global index CFDs with zero commission and tight spreads. Open your FXOpen account now or learn more about trading index CFDs with FXOpen.
CFDs are complex instruments and come with a high risk of losing your money.
This article represents the opinion of the Companies operating under the FXOpen brand only. It is not to be construed as an offer, solicitation, or recommendation with respect to products and services provided by the Companies operating under the FXOpen brand, nor is it to be considered financial advice.
👍3
#usdcad #forextrading #marketanalysis #tradingtips
Trump’s Tariff Threat: USD/CAD Hits Three-Week High
As we reported on 3 February, Trump’s tariffs pushed USD/CAD to a 22-year high.
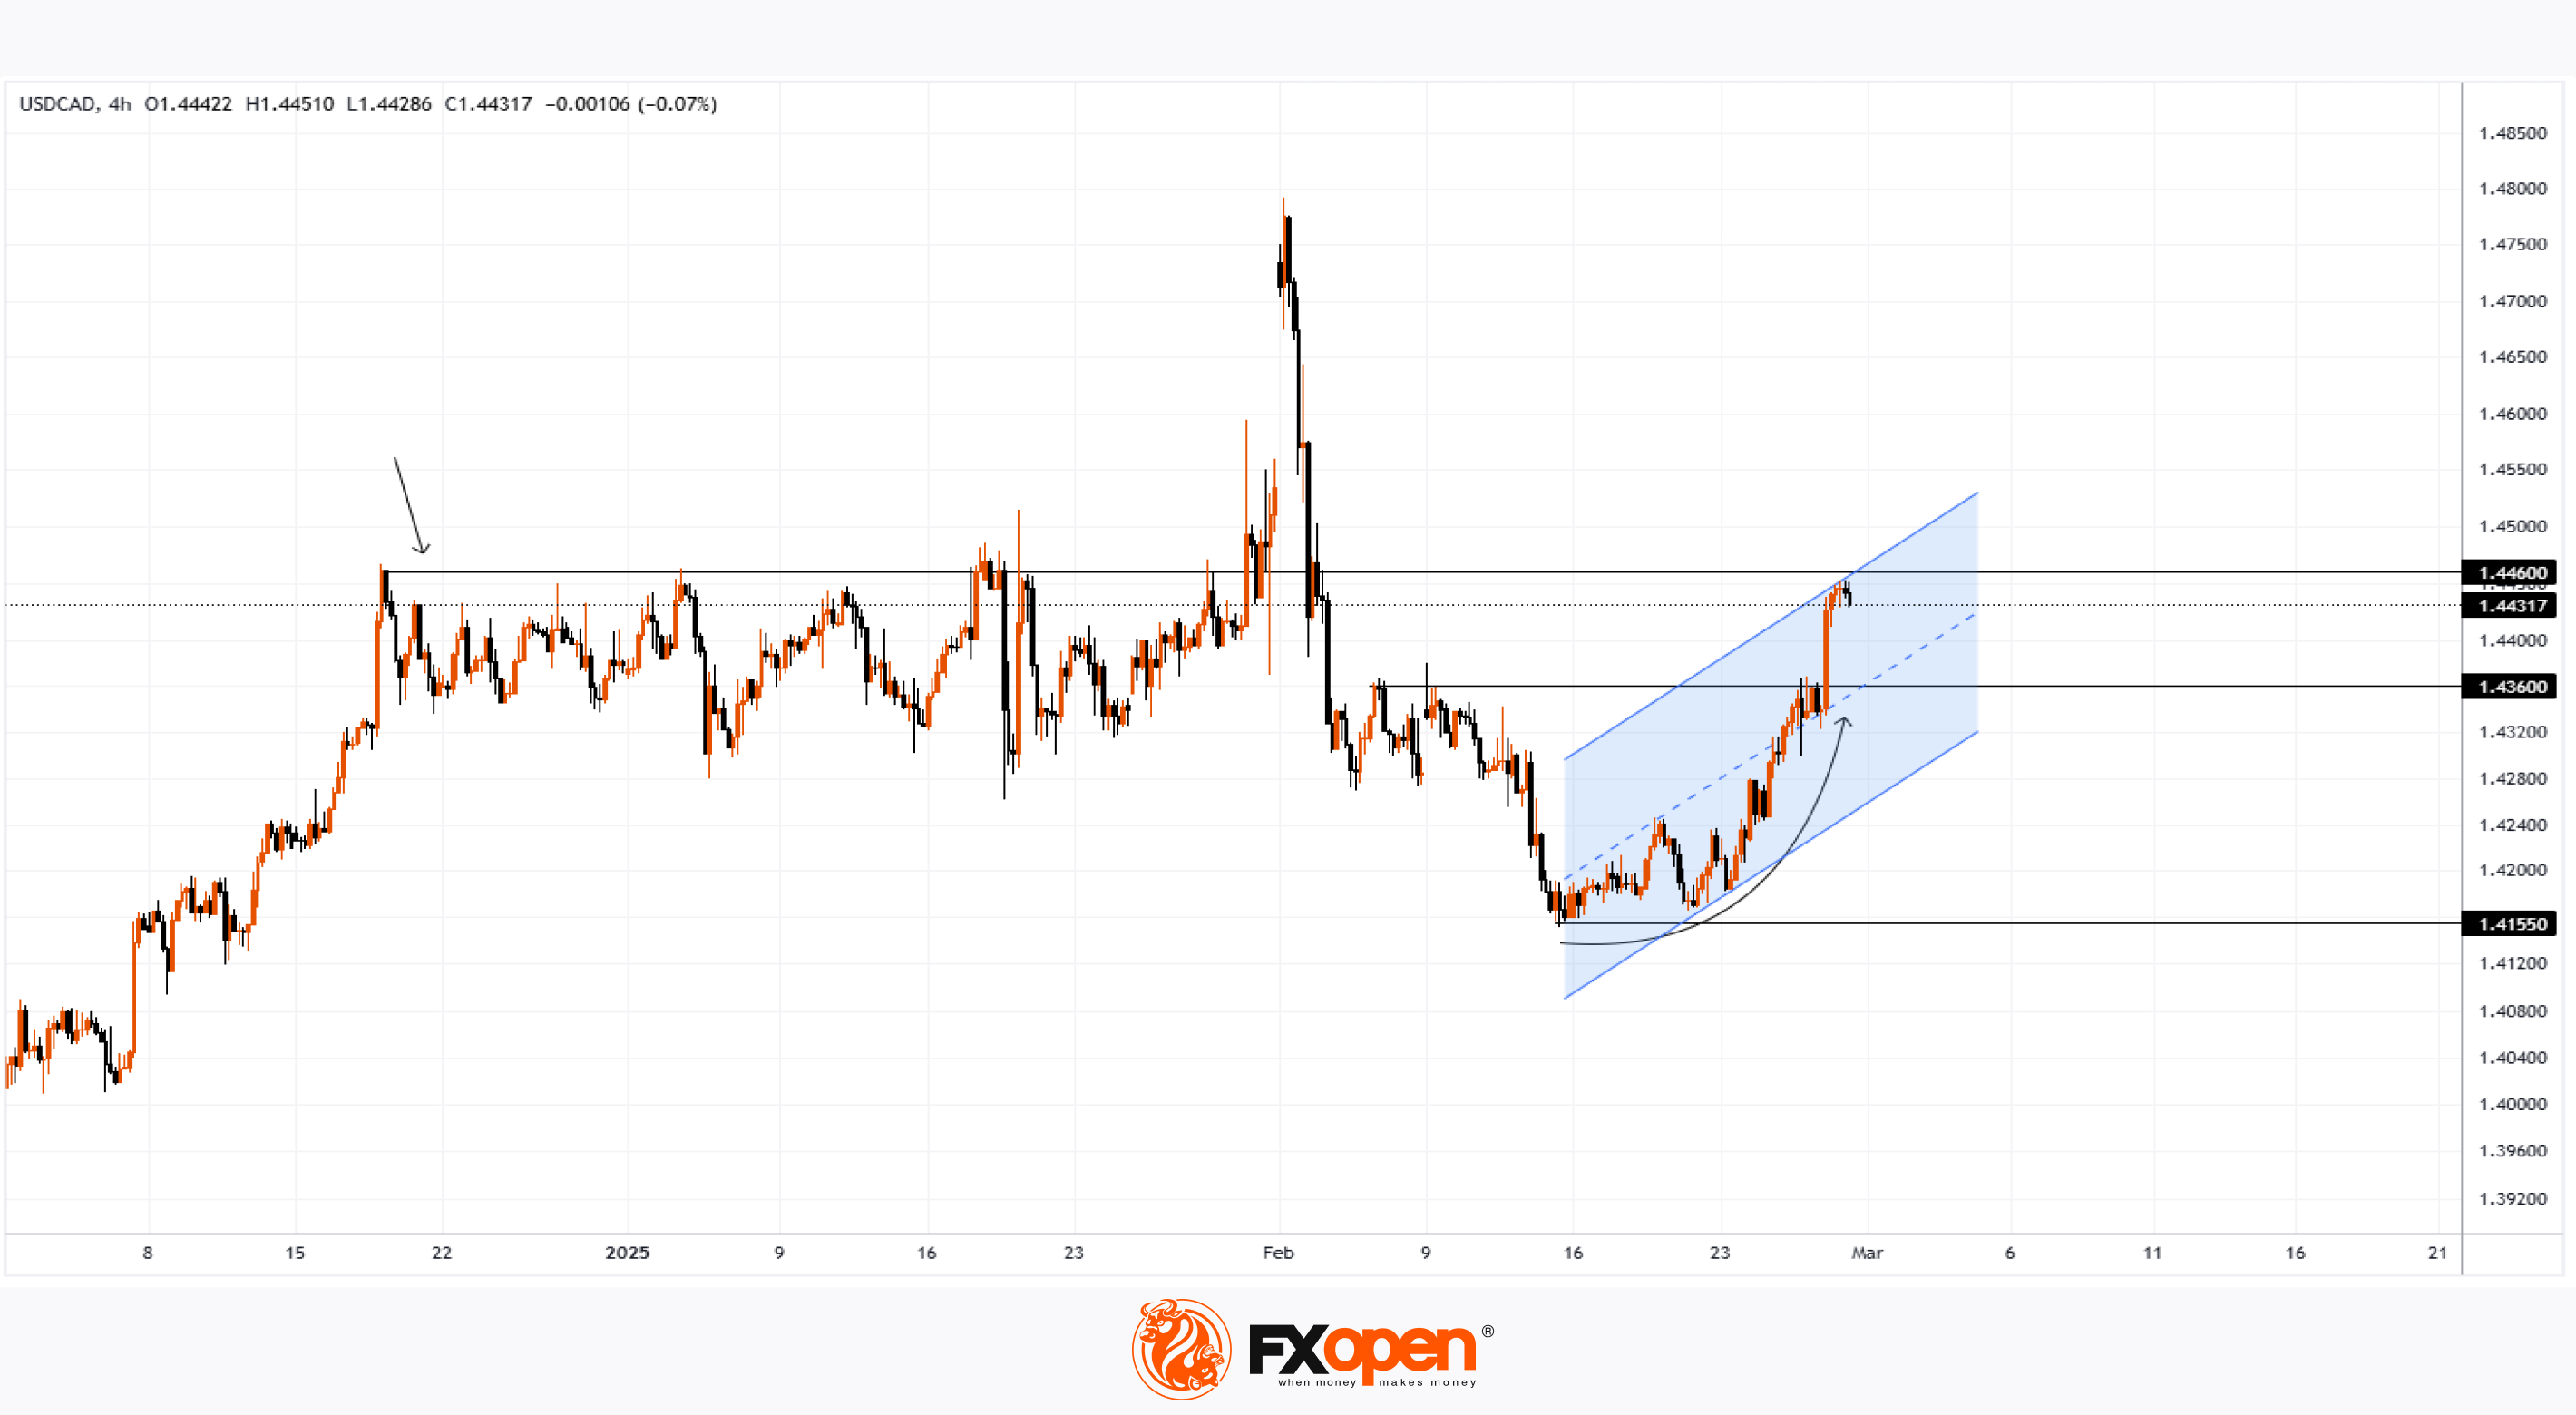
However, a one-month tariff delay led to a sharp drop, sending USD/CAD to its 2025 low near 1.41550. As the end of the delay approaches, the pair has been climbing again since mid-February (as shown by the arrow).
Yesterday, President Trump confirmed that his proposed 25% tariffs on Mexican and Canadian goods will take effect on 4 March. This dashed hopes for another delay and triggered a breakout above the 1.43600 resistance level.
Technical Analysis of USD/CAD
Above current levels, key resistance lies at 1.44600, which has held firm since mid-December. However, drastic measures from Trump’s administration could drive further price movement within the blue-marked channel.
Expect volatility spikes ahead of Canada’s GDP release, scheduled for today at 16:30 GMT+3.
Trade over 50 forex markets 24 hours a day with FXOpen. Take advantage of low commissions, deep liquidity, and spreads from 0.0 pips. Open your FXOpen account now or learn more about trading forex with FXOpen.
CFDs are complex instruments and come with a high risk of losing your money.
This article represents the opinion of the Companies operating under the FXOpen brand only. It is not to be construed as an offer, solicitation, or recommendation with respect to products and services provided by the Companies operating under the FXOpen brand, nor is it to be considered financial advice.
Trump’s Tariff Threat: USD/CAD Hits Three-Week High
As we reported on 3 February, Trump’s tariffs pushed USD/CAD to a 22-year high.
However, a one-month tariff delay led to a sharp drop, sending USD/CAD to its 2025 low near 1.41550. As the end of the delay approaches, the pair has been climbing again since mid-February (as shown by the arrow).
Yesterday, President Trump confirmed that his proposed 25% tariffs on Mexican and Canadian goods will take effect on 4 March. This dashed hopes for another delay and triggered a breakout above the 1.43600 resistance level.
Technical Analysis of USD/CAD
Above current levels, key resistance lies at 1.44600, which has held firm since mid-December. However, drastic measures from Trump’s administration could drive further price movement within the blue-marked channel.
Expect volatility spikes ahead of Canada’s GDP release, scheduled for today at 16:30 GMT+3.
Trade over 50 forex markets 24 hours a day with FXOpen. Take advantage of low commissions, deep liquidity, and spreads from 0.0 pips. Open your FXOpen account now or learn more about trading forex with FXOpen.
CFDs are complex instruments and come with a high risk of losing your money.
This article represents the opinion of the Companies operating under the FXOpen brand only. It is not to be construed as an offer, solicitation, or recommendation with respect to products and services provided by the Companies operating under the FXOpen brand, nor is it to be considered financial advice.
👍3
#Finance #Markets #Investing #ECB #InterestRates #USJobs #Unemployment #Earnings #AIStocks
Market Insights with Gary Thomson: ECB Rates, US NFP, Canada’s Unemployment Rate, Earnings Reports
In this video, we’ll explore the key economic events, market trends, and corporate news shaping the financial landscape. Get ready for expert insights into forex, commodities, and stocks to help you navigate the week ahead. Let’s dive in!
In this episode:
🔸 ECB Interest Rate Decision
The ECB is set to cut rates Thursday, but what’s next? Policymakers are split—some push for more cuts, others urge caution as inflation rises.
🔸 US Nonfarm Payrolls and Unemployment Rate
Friday’s U.S. jobs data may shake markets before the Fed’s 19 March meeting. January’s mixed report briefly weakened the dollar—will this month’s data surprise again?
🔸 Unemployment Rate in Canada
Canada’s February job data on Friday could impact the BoC’s 12 March rate decision. With shifting rate cut expectations, will strong employment numbers shake up CAD markets again?
🔸Corporate Earnings Statements
Broadcom’s earnings report on Thursday could bring market volatility, especially with its key role in AI. Will strong growth in EPS and revenue meet expectations and boost investor confidence?
Don’t miss out—gain insights to stay ahead in your trading journey.
https://cutt.ly/yrtRNGEZ
To take advantage of price fluctuations in the foreign exchange markets, consider enlisting the services of a reliable broker like FXOpen.
⚠️
This forecast represents FXOpen Companies opinion only, it should not be construed as an offer, invitation or recommendation in respect to FXOpen Companies products and services or as financial advice.
Market Insights with Gary Thomson: ECB Rates, US NFP, Canada’s Unemployment Rate, Earnings Reports
In this video, we’ll explore the key economic events, market trends, and corporate news shaping the financial landscape. Get ready for expert insights into forex, commodities, and stocks to help you navigate the week ahead. Let’s dive in!
In this episode:
🔸 ECB Interest Rate Decision
The ECB is set to cut rates Thursday, but what’s next? Policymakers are split—some push for more cuts, others urge caution as inflation rises.
🔸 US Nonfarm Payrolls and Unemployment Rate
Friday’s U.S. jobs data may shake markets before the Fed’s 19 March meeting. January’s mixed report briefly weakened the dollar—will this month’s data surprise again?
🔸 Unemployment Rate in Canada
Canada’s February job data on Friday could impact the BoC’s 12 March rate decision. With shifting rate cut expectations, will strong employment numbers shake up CAD markets again?
🔸Corporate Earnings Statements
Broadcom’s earnings report on Thursday could bring market volatility, especially with its key role in AI. Will strong growth in EPS and revenue meet expectations and boost investor confidence?
Don’t miss out—gain insights to stay ahead in your trading journey.
https://cutt.ly/yrtRNGEZ
To take advantage of price fluctuations in the foreign exchange markets, consider enlisting the services of a reliable broker like FXOpen.
⚠️
This forecast represents FXOpen Companies opinion only, it should not be construed as an offer, invitation or recommendation in respect to FXOpen Companies products and services or as financial advice.
YouTube
Market Insights with Gary Thomson: ECB Rates, US NFP, Canada’s Unemployment Rate, Earnings Reports
In this video, we’ll explore the key economic events, market trends, and corporate news shaping the financial landscape. Get ready for expert insights into forex, commodities, and stocks to help you navigate the week ahead. Let’s dive in!
In this episode…
In this episode…
👍2
#NASDAQ #stockmarket #stocktrading #MarketNews #marketanalysis
Nasdaq 100 Analysis: February Pushes Index Below January’s Opening Price
The Nasdaq 100 (US Tech 100 mini on FXOpen) chart shows:
→ January’s opening price was around 21,085.
→ February’s closing price was around 20,867.
This marks a 1% decline since the start of the year.
A report from Goldman Sachs, published on Friday, reinforces bearish sentiment, stating that global hedge funds sold more stocks than they bought at the end of February—the largest net selling in a year, according to Reuters.
Possible reasons for market pessimism:
→ AI-related stocks may be highly overbought. For instance, the "Magnificent Seven" tech stocks have underperformed the broader market in 2025.
→ Trump’s tariff policies on global trade could have negative economic consequences.
Technical Analysis of Nasdaq 100 (US Tech 100 mini on FXOpen)
Bullish perspective: Breaking January’s low did not trigger a strong downward trend.
Bearish perspective: The price has fallen below the support line (lower blue line), which had held since autumn last year.
The market’s next move could depend on how Nasdaq 100 (US Tech 100 mini on FXOpen) behaves around the 21,030 level. Previous rebounds from this support line were weak, and bears managed to break through with effort. This suggests they may still control this zone.
Trade global index CFDs with zero commission and tight spreads. Open your FXOpen account now or learn more about trading index CFDs with FXOpen.
CFDs are complex instruments and come with a high risk of losing your money.
This article represents the opinion of the Companies operating under the FXOpen brand only. It is not to be construed as an offer, solicitation, or recommendation with respect to products and services provided by the Companies operating under the FXOpen brand, nor is it to be considered financial advice.
Nasdaq 100 Analysis: February Pushes Index Below January’s Opening Price
The Nasdaq 100 (US Tech 100 mini on FXOpen) chart shows:
→ January’s opening price was around 21,085.
→ February’s closing price was around 20,867.
This marks a 1% decline since the start of the year.
A report from Goldman Sachs, published on Friday, reinforces bearish sentiment, stating that global hedge funds sold more stocks than they bought at the end of February—the largest net selling in a year, according to Reuters.
Possible reasons for market pessimism:
→ AI-related stocks may be highly overbought. For instance, the "Magnificent Seven" tech stocks have underperformed the broader market in 2025.
→ Trump’s tariff policies on global trade could have negative economic consequences.
Technical Analysis of Nasdaq 100 (US Tech 100 mini on FXOpen)
Bullish perspective: Breaking January’s low did not trigger a strong downward trend.
Bearish perspective: The price has fallen below the support line (lower blue line), which had held since autumn last year.
The market’s next move could depend on how Nasdaq 100 (US Tech 100 mini on FXOpen) behaves around the 21,030 level. Previous rebounds from this support line were weak, and bears managed to break through with effort. This suggests they may still control this zone.
Trade global index CFDs with zero commission and tight spreads. Open your FXOpen account now or learn more about trading index CFDs with FXOpen.
CFDs are complex instruments and come with a high risk of losing your money.
This article represents the opinion of the Companies operating under the FXOpen brand only. It is not to be construed as an offer, solicitation, or recommendation with respect to products and services provided by the Companies operating under the FXOpen brand, nor is it to be considered financial advice.

👍1
#nvidia #NVDA #stockmarket #stocktrading #MarketNews
Nvidia (NVDA) Stock Hits New Yearly Low
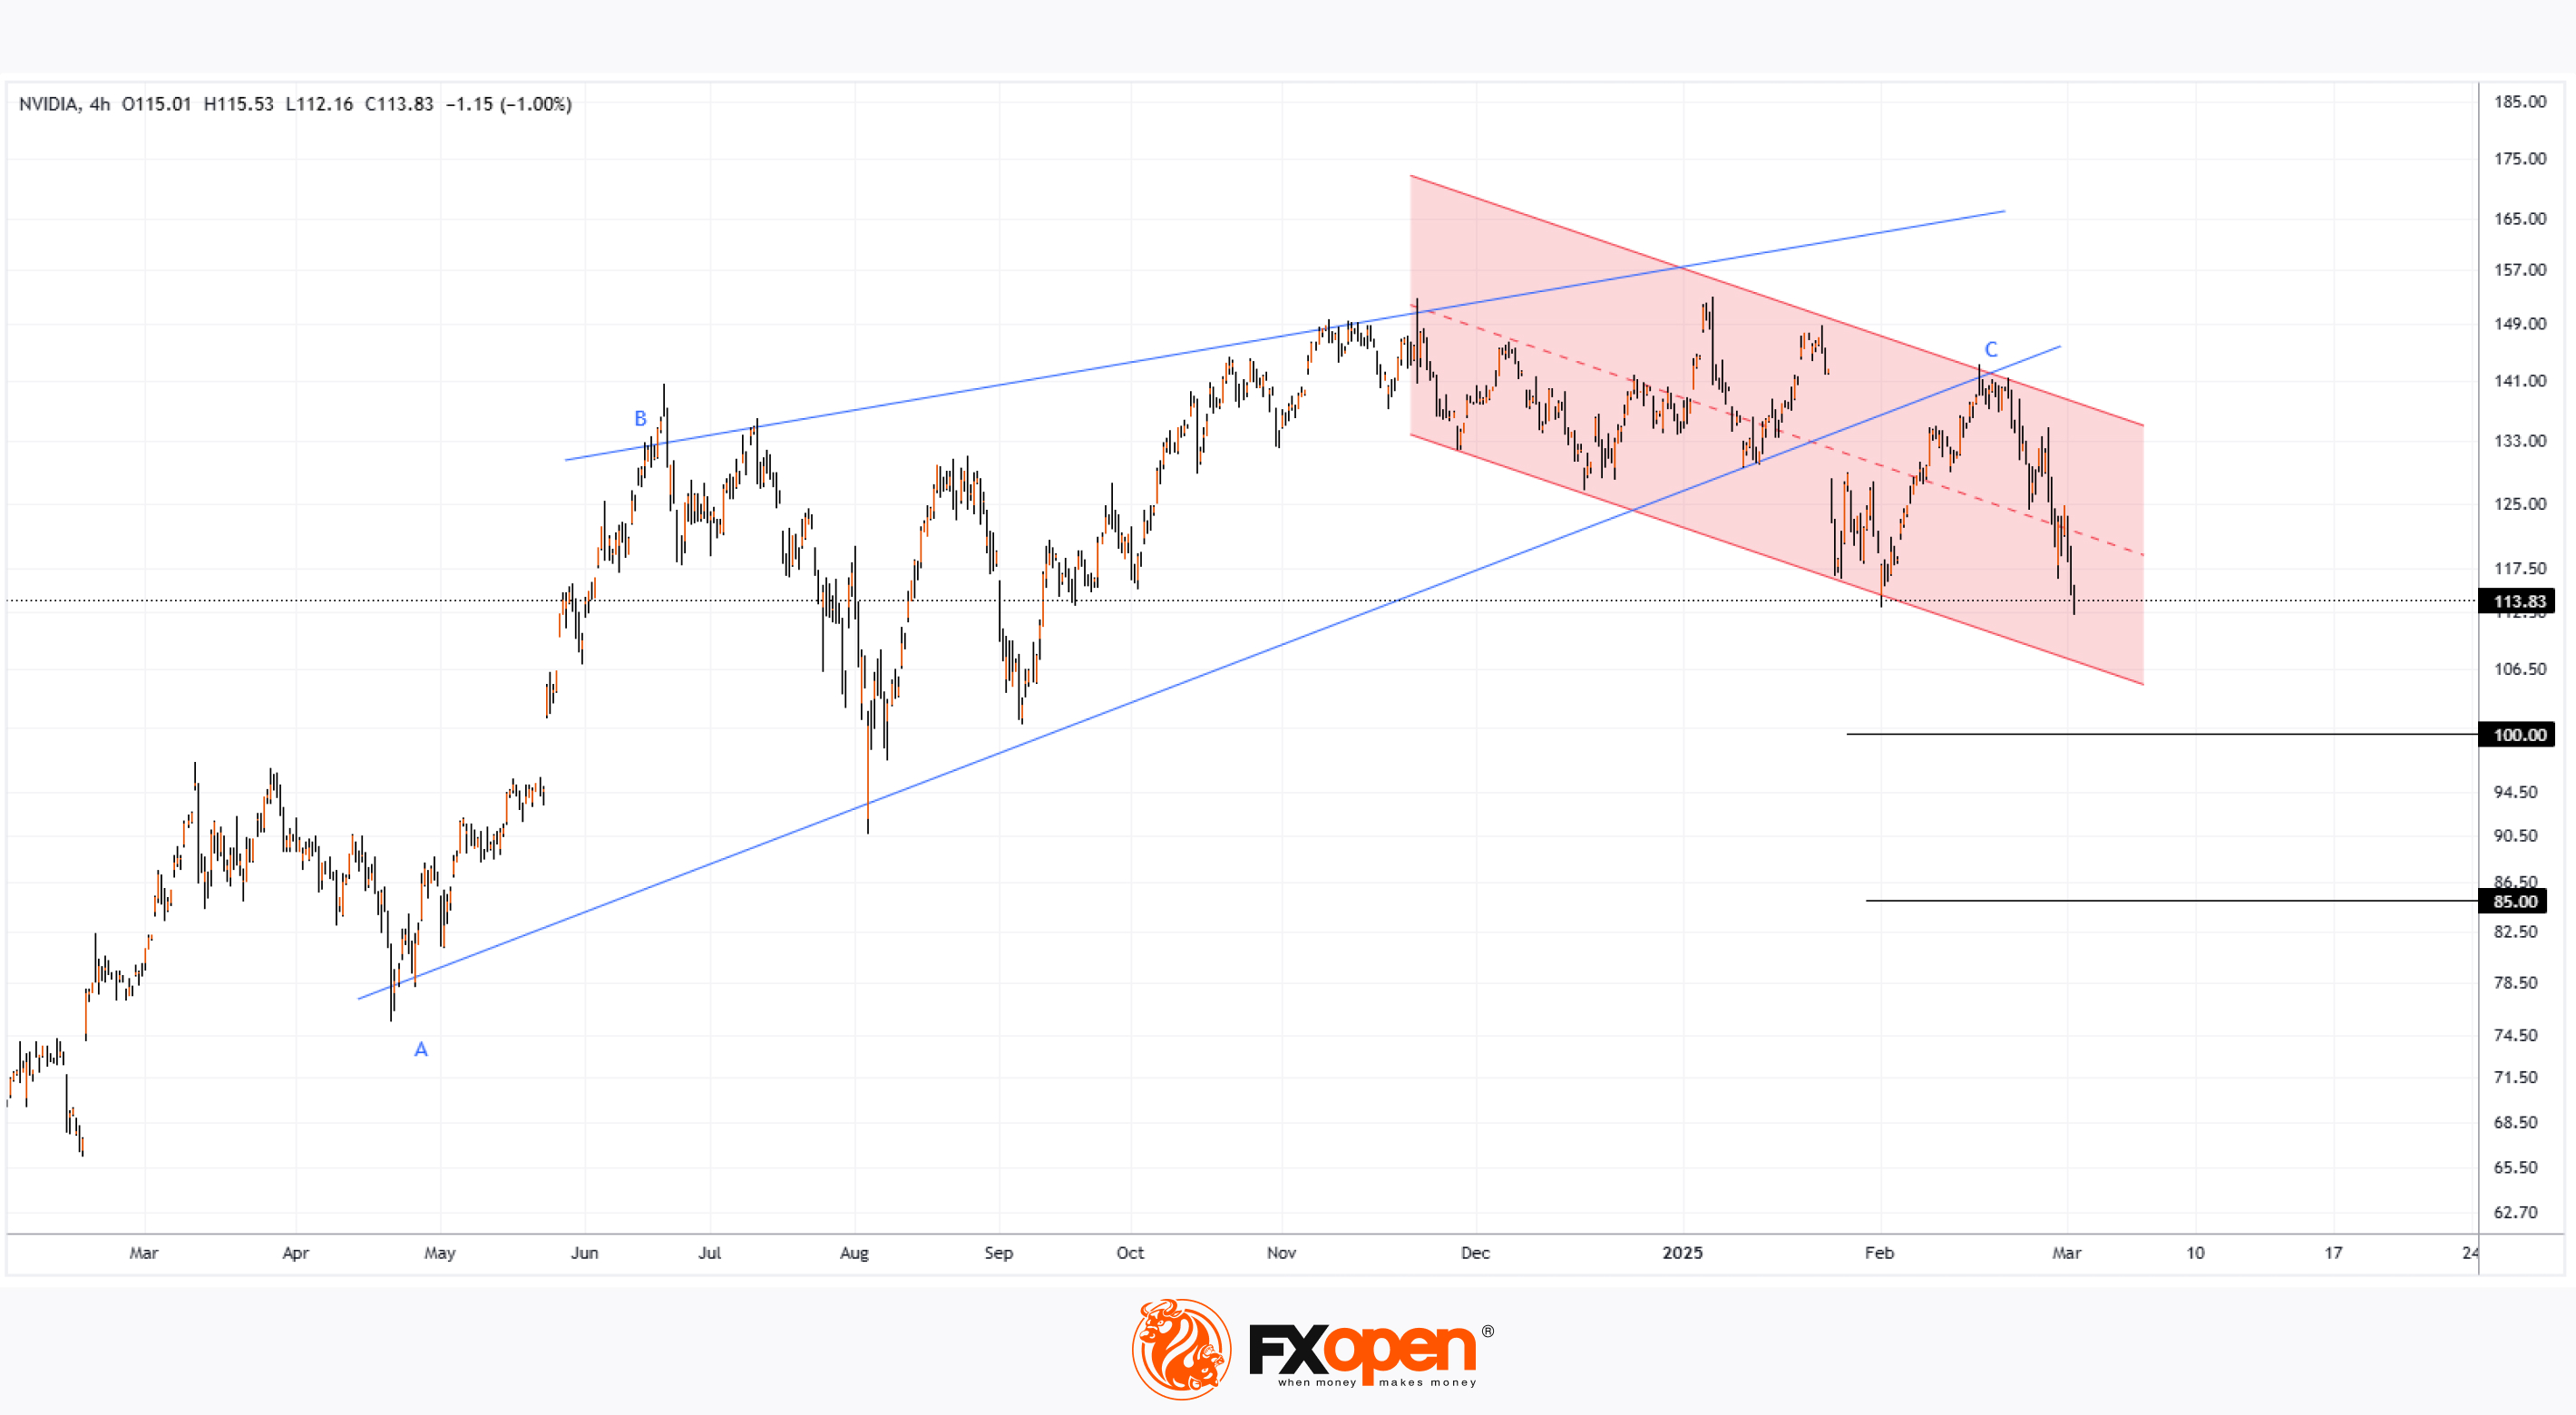
The NVDA stock chart shows that during yesterday’s trading session, the price dropped to $112.16, marking:
→ A new low for 2025, surpassing the previous bottom set on 3 February.
→ The lowest price in nearly five months.
Why Is Nvidia (NVDA) Stock Falling?
Bearish sentiment may be driven by:
→ A Wall Street Journal report stating that Chinese companies can still access Nvidia’s latest Blackwell chip despite Biden-era restrictions. Investors may fear tighter regulations, as the U.S. aims to limit technological advancements for geopolitical rivals.
→ The impact of Trump’s trade tariffs, which continue to disrupt global markets.
Technical Analysis of NVDA Stock
As noted in our report five days ago, NVDA’s price is forming a more defined downward channel (red) while moving further away from the Rising Wedge pattern (blue).
How Low Could Nvidia (NVDA) Stock Drop?
Despite NVDA’s weak performance relative to the broader market, investors may seek long positions in this former 2024 market leader.
Potential support levels:
→ The lower boundary of the red channel.
→ The psychological $100 mark.
If the Rising Wedge plays out, bears may target $85, based on the A-B range projected from point C.
A high-risk bullish argument could suggest that yesterday’s drop target is $178.
Trade global index CFDs with zero commission and tight spreads. Open your FXOpen account now or learn more about trading index CFDs with FXOpen.
CFDs are complex instruments and come with a high risk of losing your money.
This article represents the opinion of the Companies operating under the FXOpen brand only. It is not to be construed as an offer, solicitation, or recommendation with respect to products and services provided by the Companies operating under the FXOpen brand, nor is it to be considered financial advice.
Nvidia (NVDA) Stock Hits New Yearly Low
The NVDA stock chart shows that during yesterday’s trading session, the price dropped to $112.16, marking:
→ A new low for 2025, surpassing the previous bottom set on 3 February.
→ The lowest price in nearly five months.
Why Is Nvidia (NVDA) Stock Falling?
Bearish sentiment may be driven by:
→ A Wall Street Journal report stating that Chinese companies can still access Nvidia’s latest Blackwell chip despite Biden-era restrictions. Investors may fear tighter regulations, as the U.S. aims to limit technological advancements for geopolitical rivals.
→ The impact of Trump’s trade tariffs, which continue to disrupt global markets.
Technical Analysis of NVDA Stock
As noted in our report five days ago, NVDA’s price is forming a more defined downward channel (red) while moving further away from the Rising Wedge pattern (blue).
How Low Could Nvidia (NVDA) Stock Drop?
Despite NVDA’s weak performance relative to the broader market, investors may seek long positions in this former 2024 market leader.
Potential support levels:
→ The lower boundary of the red channel.
→ The psychological $100 mark.
If the Rising Wedge plays out, bears may target $85, based on the A-B range projected from point C.
A high-risk bullish argument could suggest that yesterday’s drop target is $178.
Trade global index CFDs with zero commission and tight spreads. Open your FXOpen account now or learn more about trading index CFDs with FXOpen.
CFDs are complex instruments and come with a high risk of losing your money.
This article represents the opinion of the Companies operating under the FXOpen brand only. It is not to be construed as an offer, solicitation, or recommendation with respect to products and services provided by the Companies operating under the FXOpen brand, nor is it to be considered financial advice.
👍1
#oilprices #commodities #MarketUpdates #MarketTrends
Brent Crude Price Breaks Key Support Level
Today, Brent crude is sliding towards the psychological $70 per barrel mark, with the XBR/USD chart showing a break below a key support level (marked in blue) that had been holding since autumn last year.
Why Is Brent Crude Falling?
The bearish sentiment in the market is driven by OPEC+’s decision to increase oil production, contrary to analysts’ expectations that existing output cuts—designed to support prices—would remain in place.
According to the Wall Street Journal, analysts now predict:
→ Oil production will rise by 137,000 barrels per day from April 2025 to September 2026.
→ Brent crude may drop below $70 per barrel.
Technical Analysis of XBR/USD
From a long-term perspective, Brent crude is forming a descending channel (marked in red), connecting the April and July 2024 peaks. The break below this support level could signal a renewed downtrend following a prolonged period of consolidation.
If XBR/USD sees a short-term recovery from its yearly lows, key resistance levels to watch include:
→ The midline of the descending channel.
→ The former support level (marked in blue).
Start trading commodities with tight spreads. Open your trading account now or learn more about trading commodity CFDs with FXOpen.
CFDs are complex instruments and come with a high risk of losing your money.
This article represents the opinion of the Companies operating under the FXOpen brand only. It is not to be construed as an offer, solicitation, or recommendation with respect to products and services provided by the Companies operating under the FXOpen brand, nor is it to be considered financial advice.
Brent Crude Price Breaks Key Support Level
Today, Brent crude is sliding towards the psychological $70 per barrel mark, with the XBR/USD chart showing a break below a key support level (marked in blue) that had been holding since autumn last year.
Why Is Brent Crude Falling?
The bearish sentiment in the market is driven by OPEC+’s decision to increase oil production, contrary to analysts’ expectations that existing output cuts—designed to support prices—would remain in place.
According to the Wall Street Journal, analysts now predict:
→ Oil production will rise by 137,000 barrels per day from April 2025 to September 2026.
→ Brent crude may drop below $70 per barrel.
Technical Analysis of XBR/USD
From a long-term perspective, Brent crude is forming a descending channel (marked in red), connecting the April and July 2024 peaks. The break below this support level could signal a renewed downtrend following a prolonged period of consolidation.
If XBR/USD sees a short-term recovery from its yearly lows, key resistance levels to watch include:
→ The midline of the descending channel.
→ The former support level (marked in blue).
Start trading commodities with tight spreads. Open your trading account now or learn more about trading commodity CFDs with FXOpen.
CFDs are complex instruments and come with a high risk of losing your money.
This article represents the opinion of the Companies operating under the FXOpen brand only. It is not to be construed as an offer, solicitation, or recommendation with respect to products and services provided by the Companies operating under the FXOpen brand, nor is it to be considered financial advice.
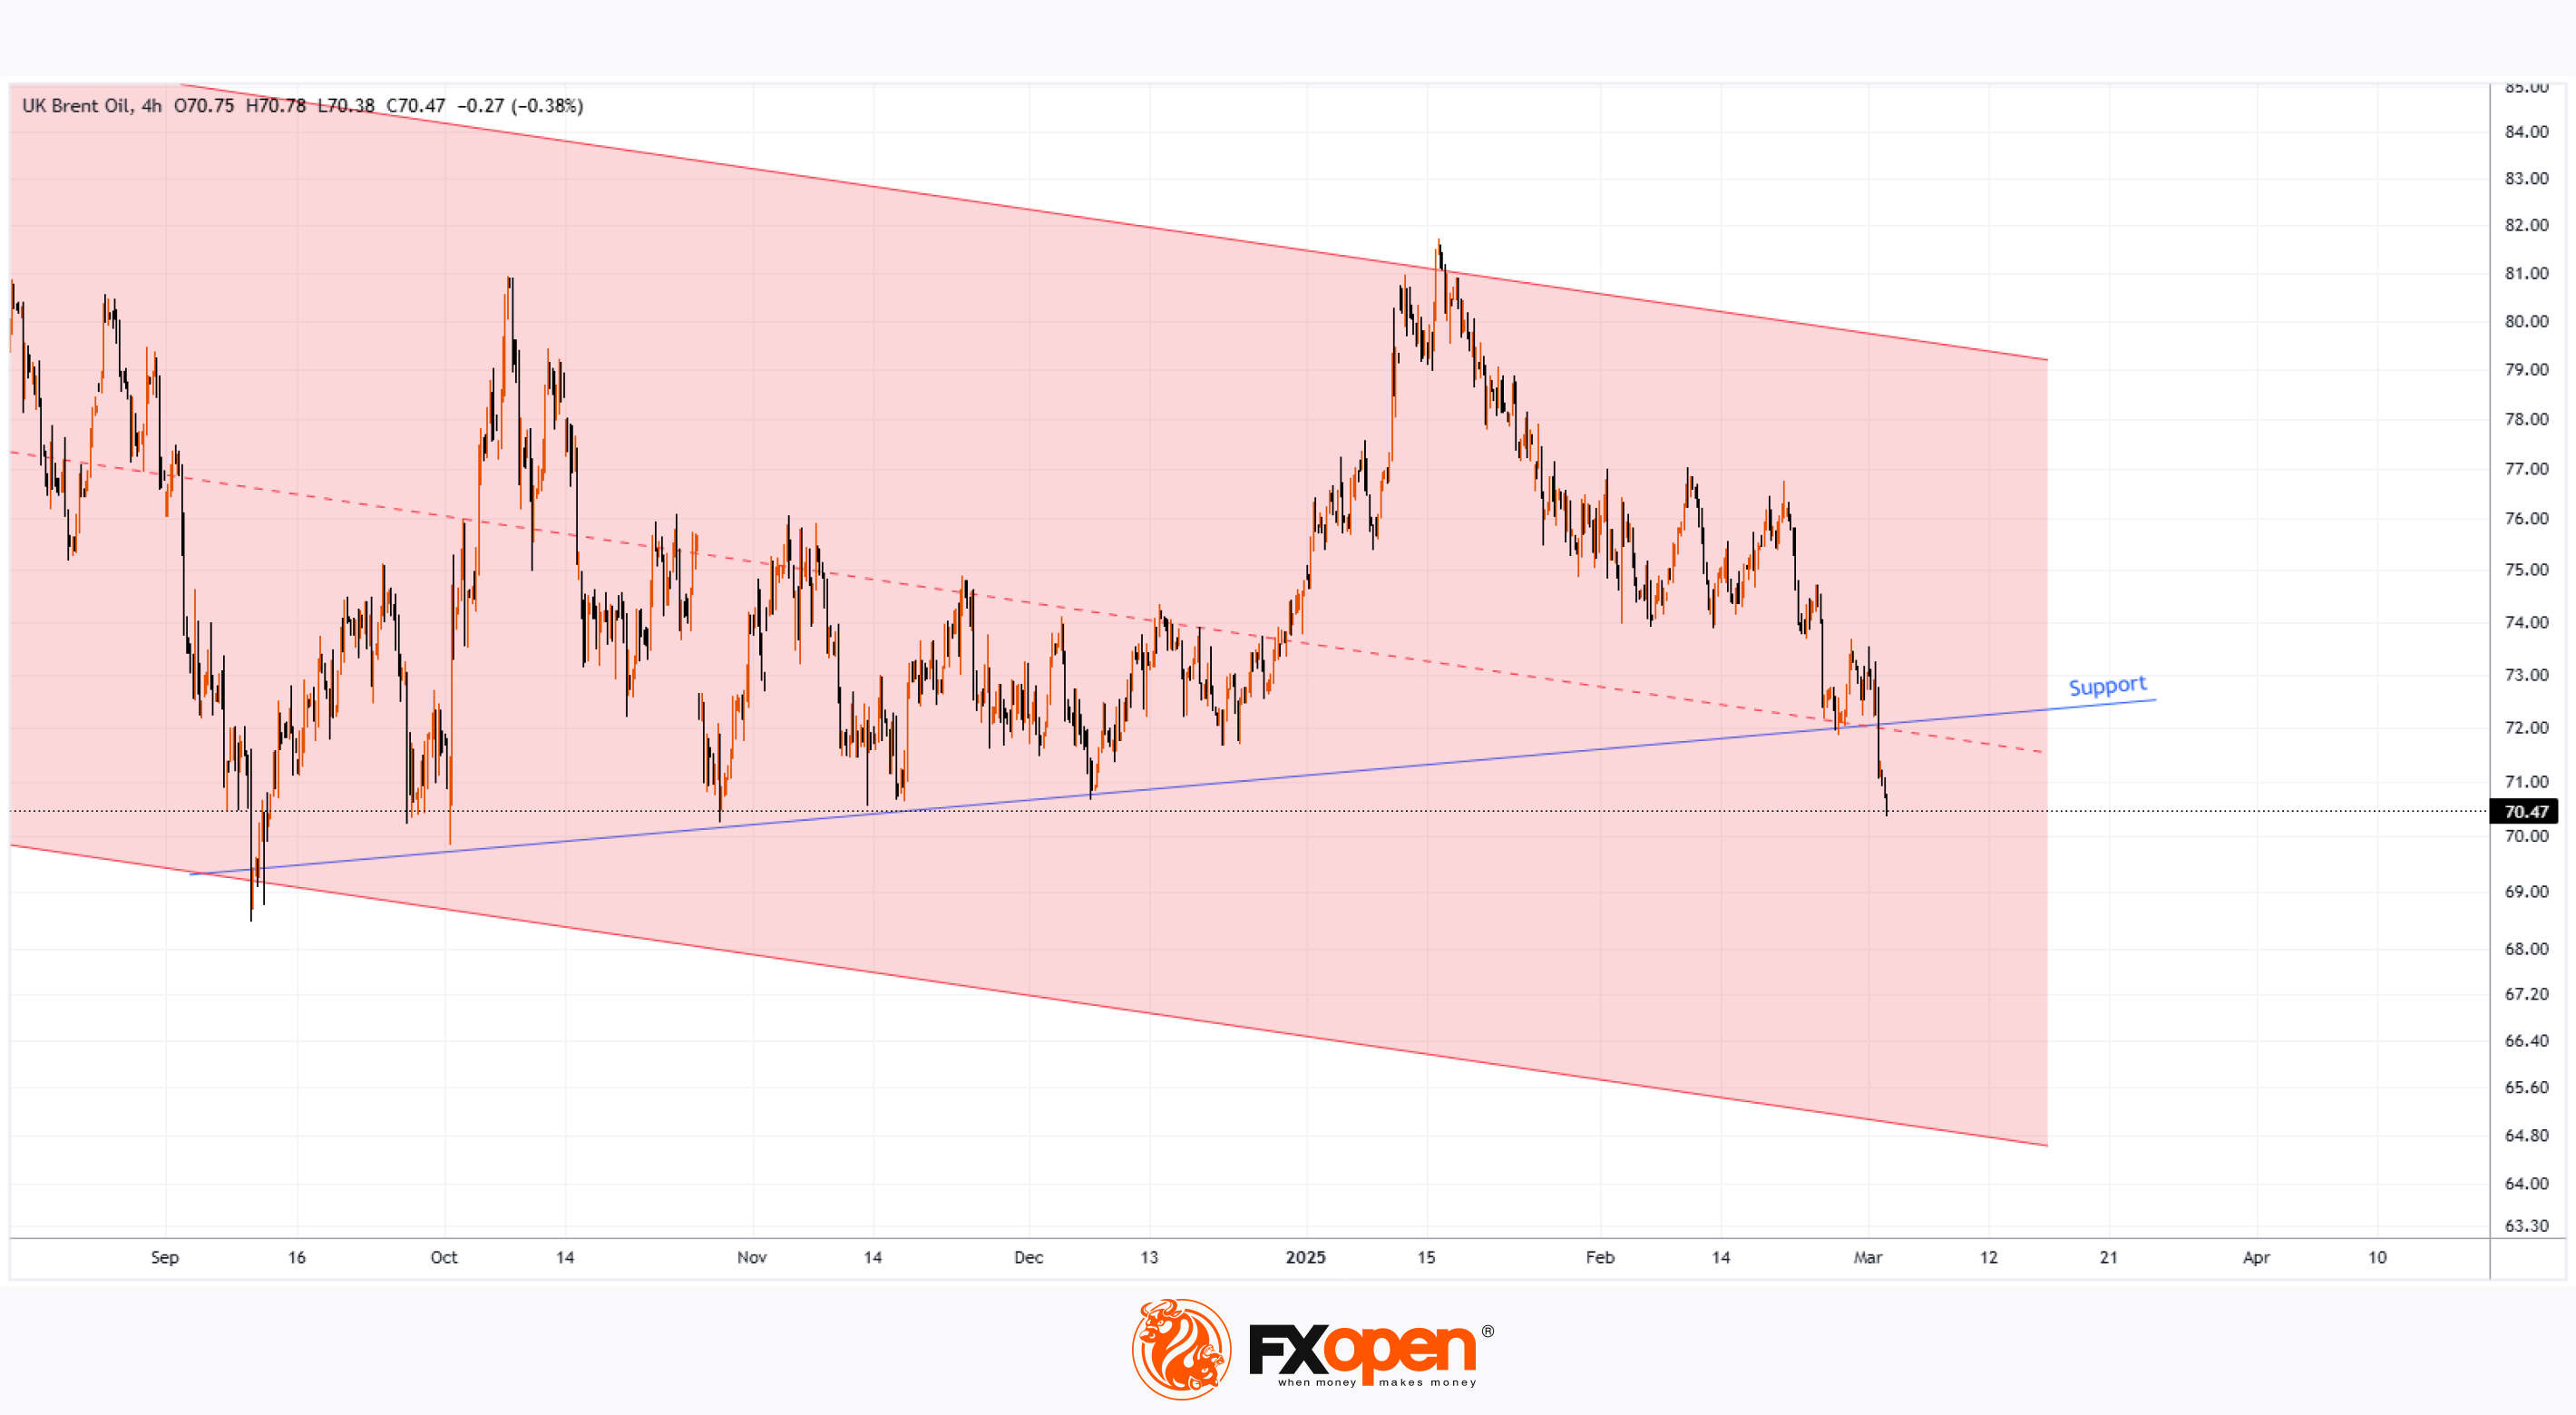
👍1
#usdcad #tradingtips #forexmarket #marketanalysis
Trump’s Tariffs on Canada: USD/CAD Remains Volatile
We are witnessing a surge in market volatility (as reflected by the upward trend of the ATR indicator), influenced by the following factors, according to Reuters:
→ Trump’s Tariffs. On Tuesday, new 25% import duties on Mexico and Canada came into effect, while tariffs on Chinese goods were doubled to 20%.
→ Donald Trump’s first speech in Congress since taking office. In it, the US president made significant statements, including the announcement of new tariffs.
The US Dollar Index initially rose during Trump’s speech but later weakened to a three-month low. In theory, higher tariffs are positive for the US dollar. However, investors are looking beyond short-term safe-haven flows and are concerned about slowing US economic growth and the risk of stagflation.
Why Is Trump Imposing Tariffs?
Officially, US President Donald Trump is introducing tariffs on Canada to combat the "extraordinary threat" to US national security posed by uncontrolled drug trafficking.
However, according to Canadian Prime Minister Justin Trudeau, Trump’s tariffs are aimed at weakening Canada’s economy—or even pushing it towards collapse—so that the US could more easily annex Canadian territory.
Technical Analysis of USD/CAD
In our previous USD/CAD analysis, we highlighted key levels:
→ Resistance at 1.44600
→ Support at 1.43600
New chart data shows that bulls attempted to break through the 1.44600 resistance level, but the price failed to hold above the psychological barrier of 1.45000. Support at 1.43600 remains relevant for now.
Bulls may attempt another push upwards if the price retraces to the lower blue trendline. However, whether this scenario plays out will largely depend on the broader fundamentals related to Trump’s tariffs on Canada, Mexico, and China.
Trade over 50 forex markets 24 hours a day with FXOpen. Take advantage of low commissions, deep liquidity, and spreads from 0.0 pips. Open your FXOpen account now or learn more about trading forex with FXOpen.
CFDs are complex instruments and come with a high risk of losing your money.
This article represents the opinion of the Companies operating under the FXOpen brand only. It is not to be construed as an offer, solicitation, or recommendation with respect to products and services provided by the Companies operating under the FXOpen brand, nor is it to be considered financial advice.
Trump’s Tariffs on Canada: USD/CAD Remains Volatile
We are witnessing a surge in market volatility (as reflected by the upward trend of the ATR indicator), influenced by the following factors, according to Reuters:
→ Trump’s Tariffs. On Tuesday, new 25% import duties on Mexico and Canada came into effect, while tariffs on Chinese goods were doubled to 20%.
→ Donald Trump’s first speech in Congress since taking office. In it, the US president made significant statements, including the announcement of new tariffs.
The US Dollar Index initially rose during Trump’s speech but later weakened to a three-month low. In theory, higher tariffs are positive for the US dollar. However, investors are looking beyond short-term safe-haven flows and are concerned about slowing US economic growth and the risk of stagflation.
Why Is Trump Imposing Tariffs?
Officially, US President Donald Trump is introducing tariffs on Canada to combat the "extraordinary threat" to US national security posed by uncontrolled drug trafficking.
However, according to Canadian Prime Minister Justin Trudeau, Trump’s tariffs are aimed at weakening Canada’s economy—or even pushing it towards collapse—so that the US could more easily annex Canadian territory.
Technical Analysis of USD/CAD
In our previous USD/CAD analysis, we highlighted key levels:
→ Resistance at 1.44600
→ Support at 1.43600
New chart data shows that bulls attempted to break through the 1.44600 resistance level, but the price failed to hold above the psychological barrier of 1.45000. Support at 1.43600 remains relevant for now.
Bulls may attempt another push upwards if the price retraces to the lower blue trendline. However, whether this scenario plays out will largely depend on the broader fundamentals related to Trump’s tariffs on Canada, Mexico, and China.
Trade over 50 forex markets 24 hours a day with FXOpen. Take advantage of low commissions, deep liquidity, and spreads from 0.0 pips. Open your FXOpen account now or learn more about trading forex with FXOpen.
CFDs are complex instruments and come with a high risk of losing your money.
This article represents the opinion of the Companies operating under the FXOpen brand only. It is not to be construed as an offer, solicitation, or recommendation with respect to products and services provided by the Companies operating under the FXOpen brand, nor is it to be considered financial advice.
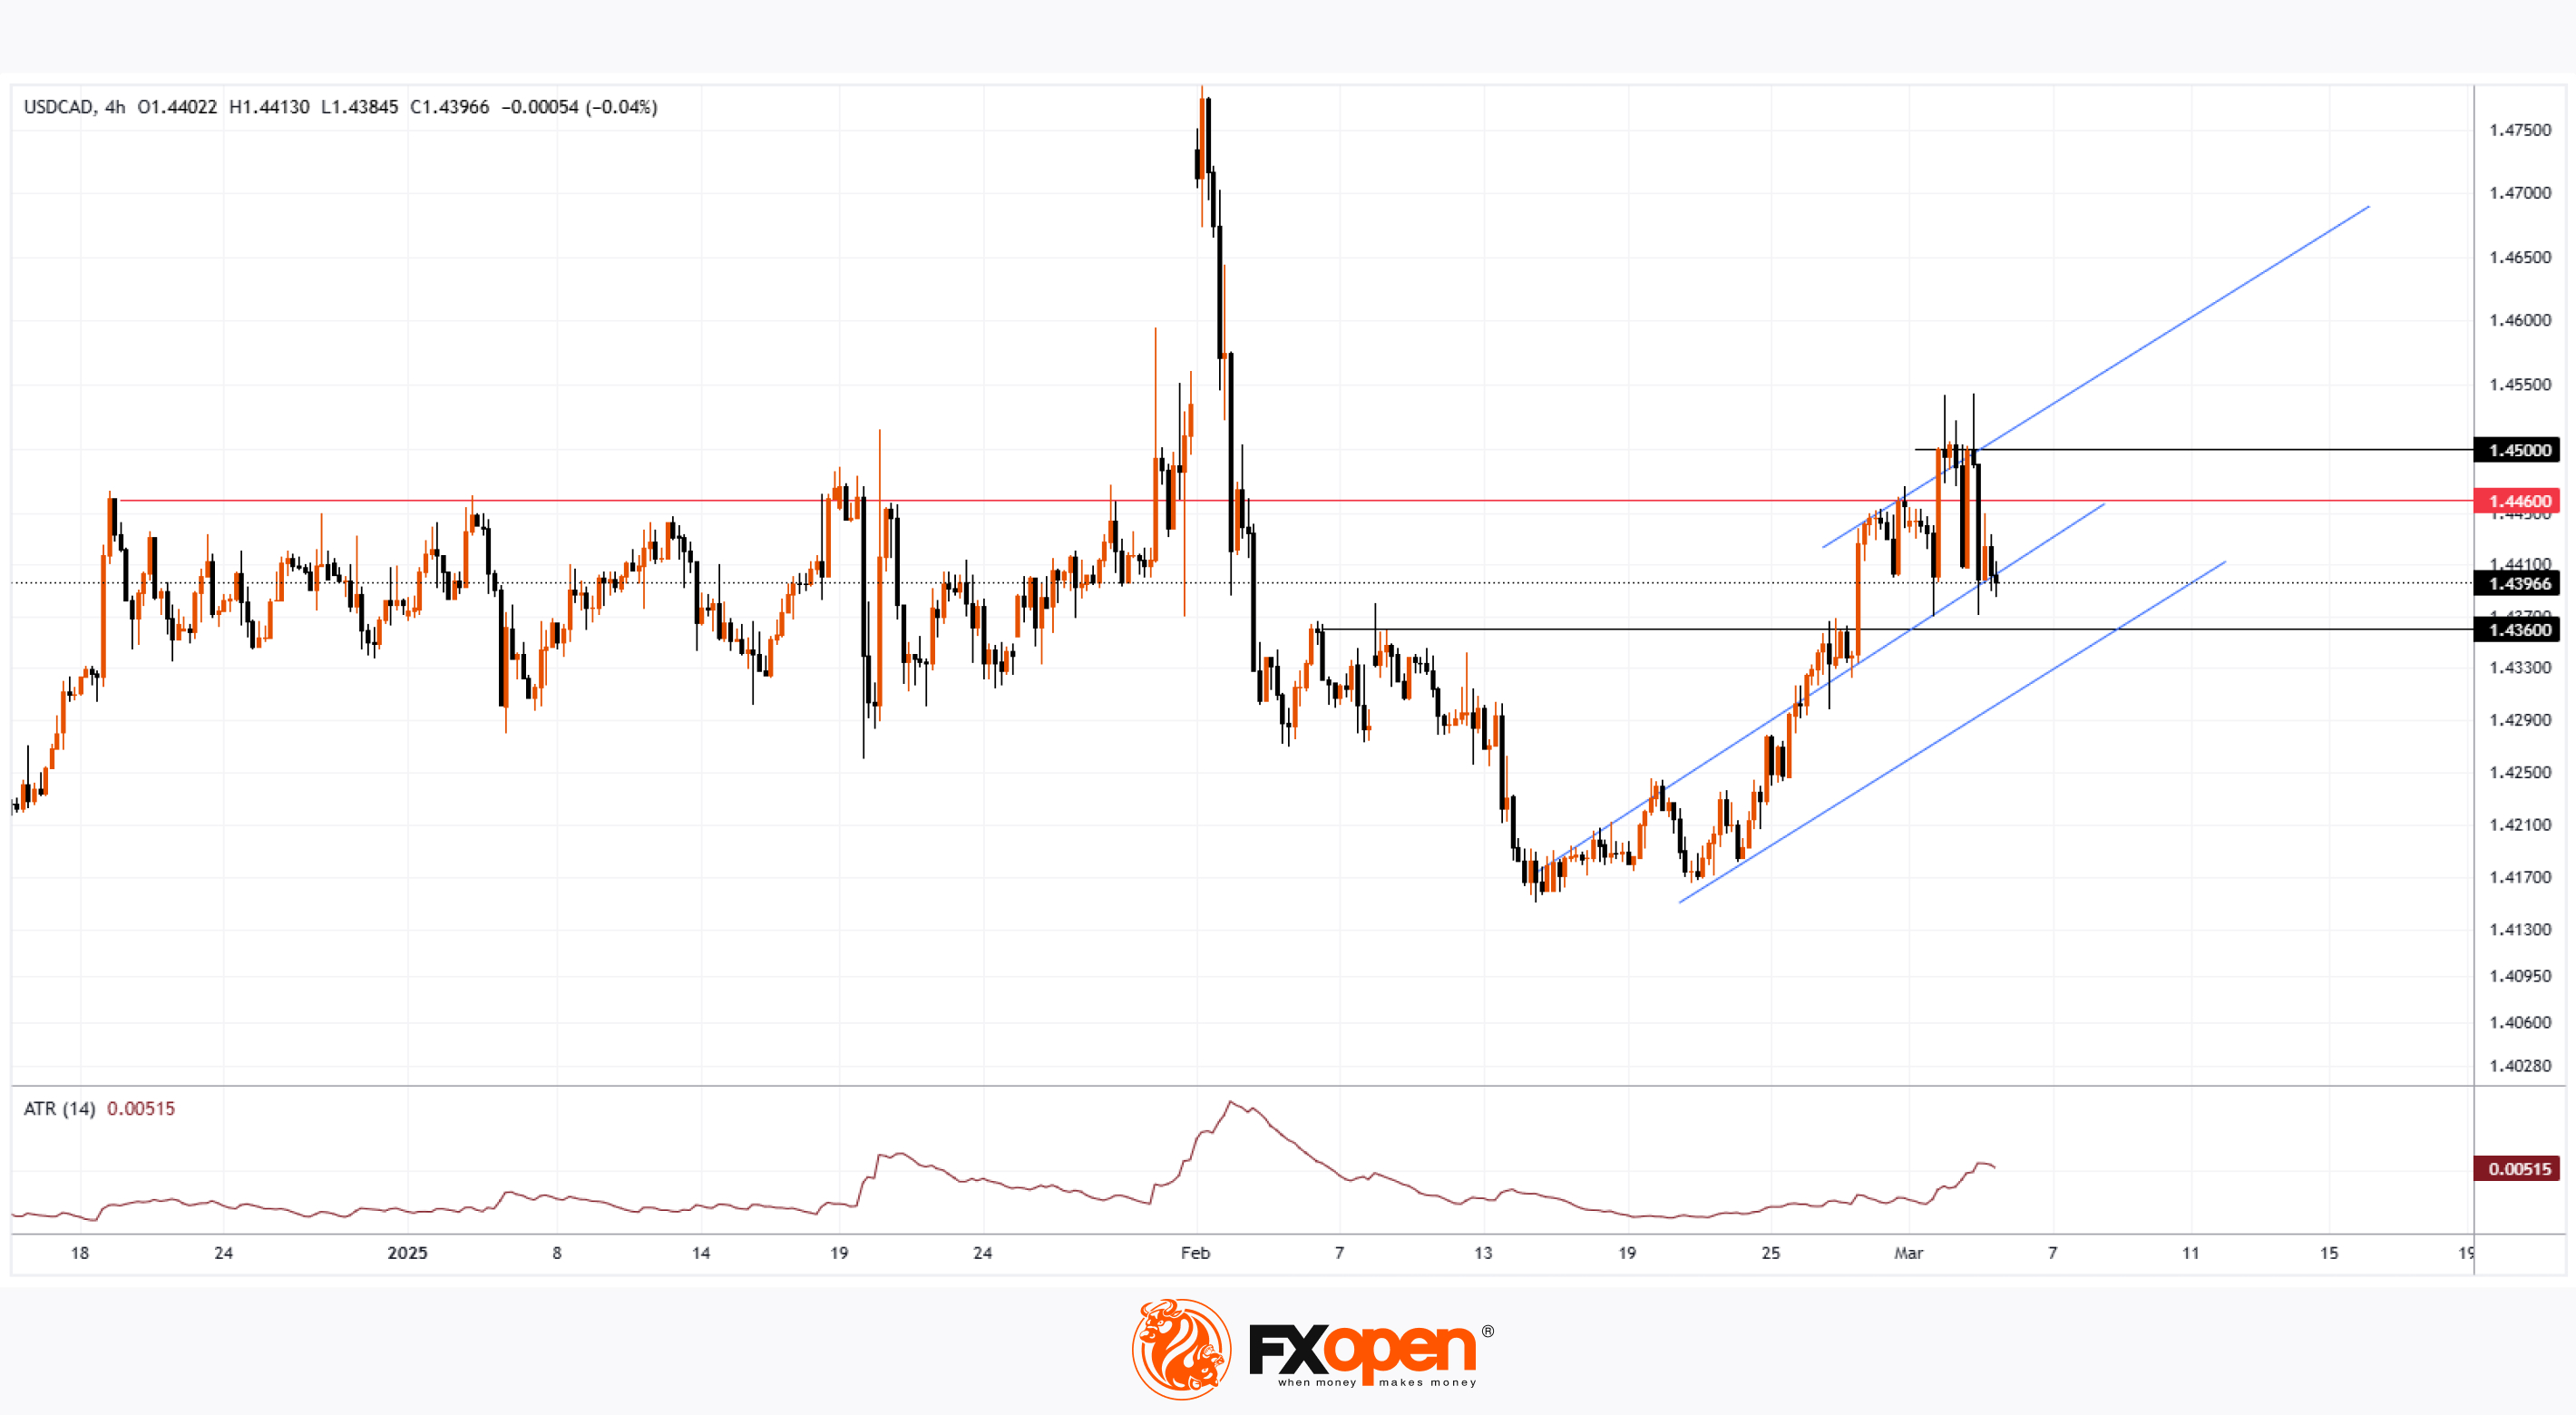
👍1