
#usdcad #forextrading #MarketUpdates #marketanalysis
USD/CAD Chart Analysis Following Bank of Canada’s Rate Cut
Unlike the Federal Reserve, which opted to leave its monetary policy unchanged, the Bank of Canada cut its interest rate yesterday. According to Forex Factory, as expected by analysts, the Overnight Rate was lowered by 25 basis points from 3.25% to 3.00%.
According to Reuters:
→ The Bank of Canada reduced interest rates to support the economy ahead of anticipated US trade tariffs.
→ This weakened the Canadian dollar, as the gap between Canadian and US bond yields widened.
→ Market participants estimate a 41% probability that the Bank of Canada will cut rates again in March.
→ The depreciation of the Canadian dollar is also influenced by oil prices (one of Canada’s key export commodities), which have fallen by over 8% since their mid-January peak.
Technical analysis of the USD/CAD chart indicates that the Canadian dollar’s exchange rate against the US dollar is forming a “Megaphone” pattern, with price action demonstrating the presence of selling pressure. On 21 January, sellers sharply pushed the price down from the psychological level of 1.4500, and yesterday, the price made a bearish reversal from 1.4450.
There is a possibility that seller activity could drive USD/CAD lower towards a key trendline (marked in grey) that has been forming since the second half of 2024.
Trade over 50 forex markets 24 hours a day with FXOpen. Take advantage of low commissions, deep liquidity, and spreads from 0.0 pips. Open your FXOpen account now or learn more about trading forex with FXOpen.
CFDs are complex instruments and come with a high risk of losing your money.
This article represents the opinion of the Companies operating under the FXOpen brand only. It is not to be construed as an offer, solicitation, or recommendation with respect to products and services provided by the Companies operating under the FXOpen brand, nor is it to be considered financial advice.
USD/CAD Chart Analysis Following Bank of Canada’s Rate Cut
Unlike the Federal Reserve, which opted to leave its monetary policy unchanged, the Bank of Canada cut its interest rate yesterday. According to Forex Factory, as expected by analysts, the Overnight Rate was lowered by 25 basis points from 3.25% to 3.00%.
According to Reuters:
→ The Bank of Canada reduced interest rates to support the economy ahead of anticipated US trade tariffs.
→ This weakened the Canadian dollar, as the gap between Canadian and US bond yields widened.
→ Market participants estimate a 41% probability that the Bank of Canada will cut rates again in March.
→ The depreciation of the Canadian dollar is also influenced by oil prices (one of Canada’s key export commodities), which have fallen by over 8% since their mid-January peak.
Technical analysis of the USD/CAD chart indicates that the Canadian dollar’s exchange rate against the US dollar is forming a “Megaphone” pattern, with price action demonstrating the presence of selling pressure. On 21 January, sellers sharply pushed the price down from the psychological level of 1.4500, and yesterday, the price made a bearish reversal from 1.4450.
There is a possibility that seller activity could drive USD/CAD lower towards a key trendline (marked in grey) that has been forming since the second half of 2024.
Trade over 50 forex markets 24 hours a day with FXOpen. Take advantage of low commissions, deep liquidity, and spreads from 0.0 pips. Open your FXOpen account now or learn more about trading forex with FXOpen.
CFDs are complex instruments and come with a high risk of losing your money.
This article represents the opinion of the Companies operating under the FXOpen brand only. It is not to be construed as an offer, solicitation, or recommendation with respect to products and services provided by the Companies operating under the FXOpen brand, nor is it to be considered financial advice.

👍3
#MSFT #stockmarket #MarketUpdates #marketanalysis
Microsoft (MSFT) Shares Drop Over 6% After Earnings Report
According to the Microsoft (MSFT) stock chart:
→ The candle on 29 January closed around $441 before the company released its Q4 2024 earnings report.
→ As a result, the 30 January session opened with a significant bearish gap and closed lower at around $415, marking a total decline of over 6%, despite the company exceeding analysts' expectations.
Media reports indicate:
→ Earnings per share (EPS) stood at $3.23, surpassing the forecast of $3.11.
→ Total revenue reached $69.63 billion, beating the projected $68.78 billion.
However, investor concerns arose due to slowing growth in Microsoft's Azure cloud segment and rising AI development costs. Business Insider reports that Microsoft plans to spend $80 billion on AI infrastructure this financial year. While this substantial investment aims to strengthen its AI position, doubts remain about its long-term profitability.
The technical analysis of the Microsoft (MSFT) stock chart presents a concerning picture, as the price has dropped to a key support level—the lower boundary of the upward channel (shown in blue). This channel was formed by a strong bullish impulse in early 2024 (indicated by an arrow), driven by AI enthusiasm. However, sentiment has shifted, with AI now acting as a selling trigger, increasing the risk of MSFT breaking below this key support.
If this happens, MSFT may test the psychological level of $400 per share once again. Notably, in 2024, the price has not stayed below this level for long.
Despite the recent decline, analysts remain optimistic about MSFT stock. According to a TipRanks survey:
→ 27 out of 30 analysts recommend buying MSFT.
→ The average 12-month price target for MSFT is $508.
Trade global index CFDs with zero commission and tight spreads. Open your FXOpen account now or learn more about trading index CFDs with FXOpen.
CFDs are complex instruments and come with a high risk of losing your money.
This article represents the opinion of the Companies operating under the FXOpen brand only. It is not to be construed as an offer, solicitation, or recommendation with respect to products and services provided by the Companies operating under the FXOpen brand, nor is it to be considered financial advice.
Microsoft (MSFT) Shares Drop Over 6% After Earnings Report
According to the Microsoft (MSFT) stock chart:
→ The candle on 29 January closed around $441 before the company released its Q4 2024 earnings report.
→ As a result, the 30 January session opened with a significant bearish gap and closed lower at around $415, marking a total decline of over 6%, despite the company exceeding analysts' expectations.
Media reports indicate:
→ Earnings per share (EPS) stood at $3.23, surpassing the forecast of $3.11.
→ Total revenue reached $69.63 billion, beating the projected $68.78 billion.
However, investor concerns arose due to slowing growth in Microsoft's Azure cloud segment and rising AI development costs. Business Insider reports that Microsoft plans to spend $80 billion on AI infrastructure this financial year. While this substantial investment aims to strengthen its AI position, doubts remain about its long-term profitability.
The technical analysis of the Microsoft (MSFT) stock chart presents a concerning picture, as the price has dropped to a key support level—the lower boundary of the upward channel (shown in blue). This channel was formed by a strong bullish impulse in early 2024 (indicated by an arrow), driven by AI enthusiasm. However, sentiment has shifted, with AI now acting as a selling trigger, increasing the risk of MSFT breaking below this key support.
If this happens, MSFT may test the psychological level of $400 per share once again. Notably, in 2024, the price has not stayed below this level for long.
Despite the recent decline, analysts remain optimistic about MSFT stock. According to a TipRanks survey:
→ 27 out of 30 analysts recommend buying MSFT.
→ The average 12-month price target for MSFT is $508.
Trade global index CFDs with zero commission and tight spreads. Open your FXOpen account now or learn more about trading index CFDs with FXOpen.
CFDs are complex instruments and come with a high risk of losing your money.
This article represents the opinion of the Companies operating under the FXOpen brand only. It is not to be construed as an offer, solicitation, or recommendation with respect to products and services provided by the Companies operating under the FXOpen brand, nor is it to be considered financial advice.

👍3
#usdcad #forextrading #tradingtips #MarketUpdates
Trump’s Tariffs Push USD/CAD to a 22-Year High
As promised during his election campaign, US President Donald Trump introduced tariffs just two weeks after his inauguration:
→ 25% on goods from Canada and Mexico, prompting both countries to vow retaliatory measures.
→ 10% on Chinese goods, with China announcing plans to challenge the decision at the World Trade Organization.
The tariffs will take effect on 4 February. Trump acknowledged potential economic pain but justified the measures as necessary to combat illegal immigration and drug trafficking, arguing that the long-term benefits would outweigh the costs.
Trump’s decision:
→ Led to a decline in US stock indices, as analysts fear a potential trade war and global stagflation (sluggish economic growth amid high inflation). Further tariffs on Europe may follow.
→ Strengthened the US dollar, which gained around 1% against major currencies.
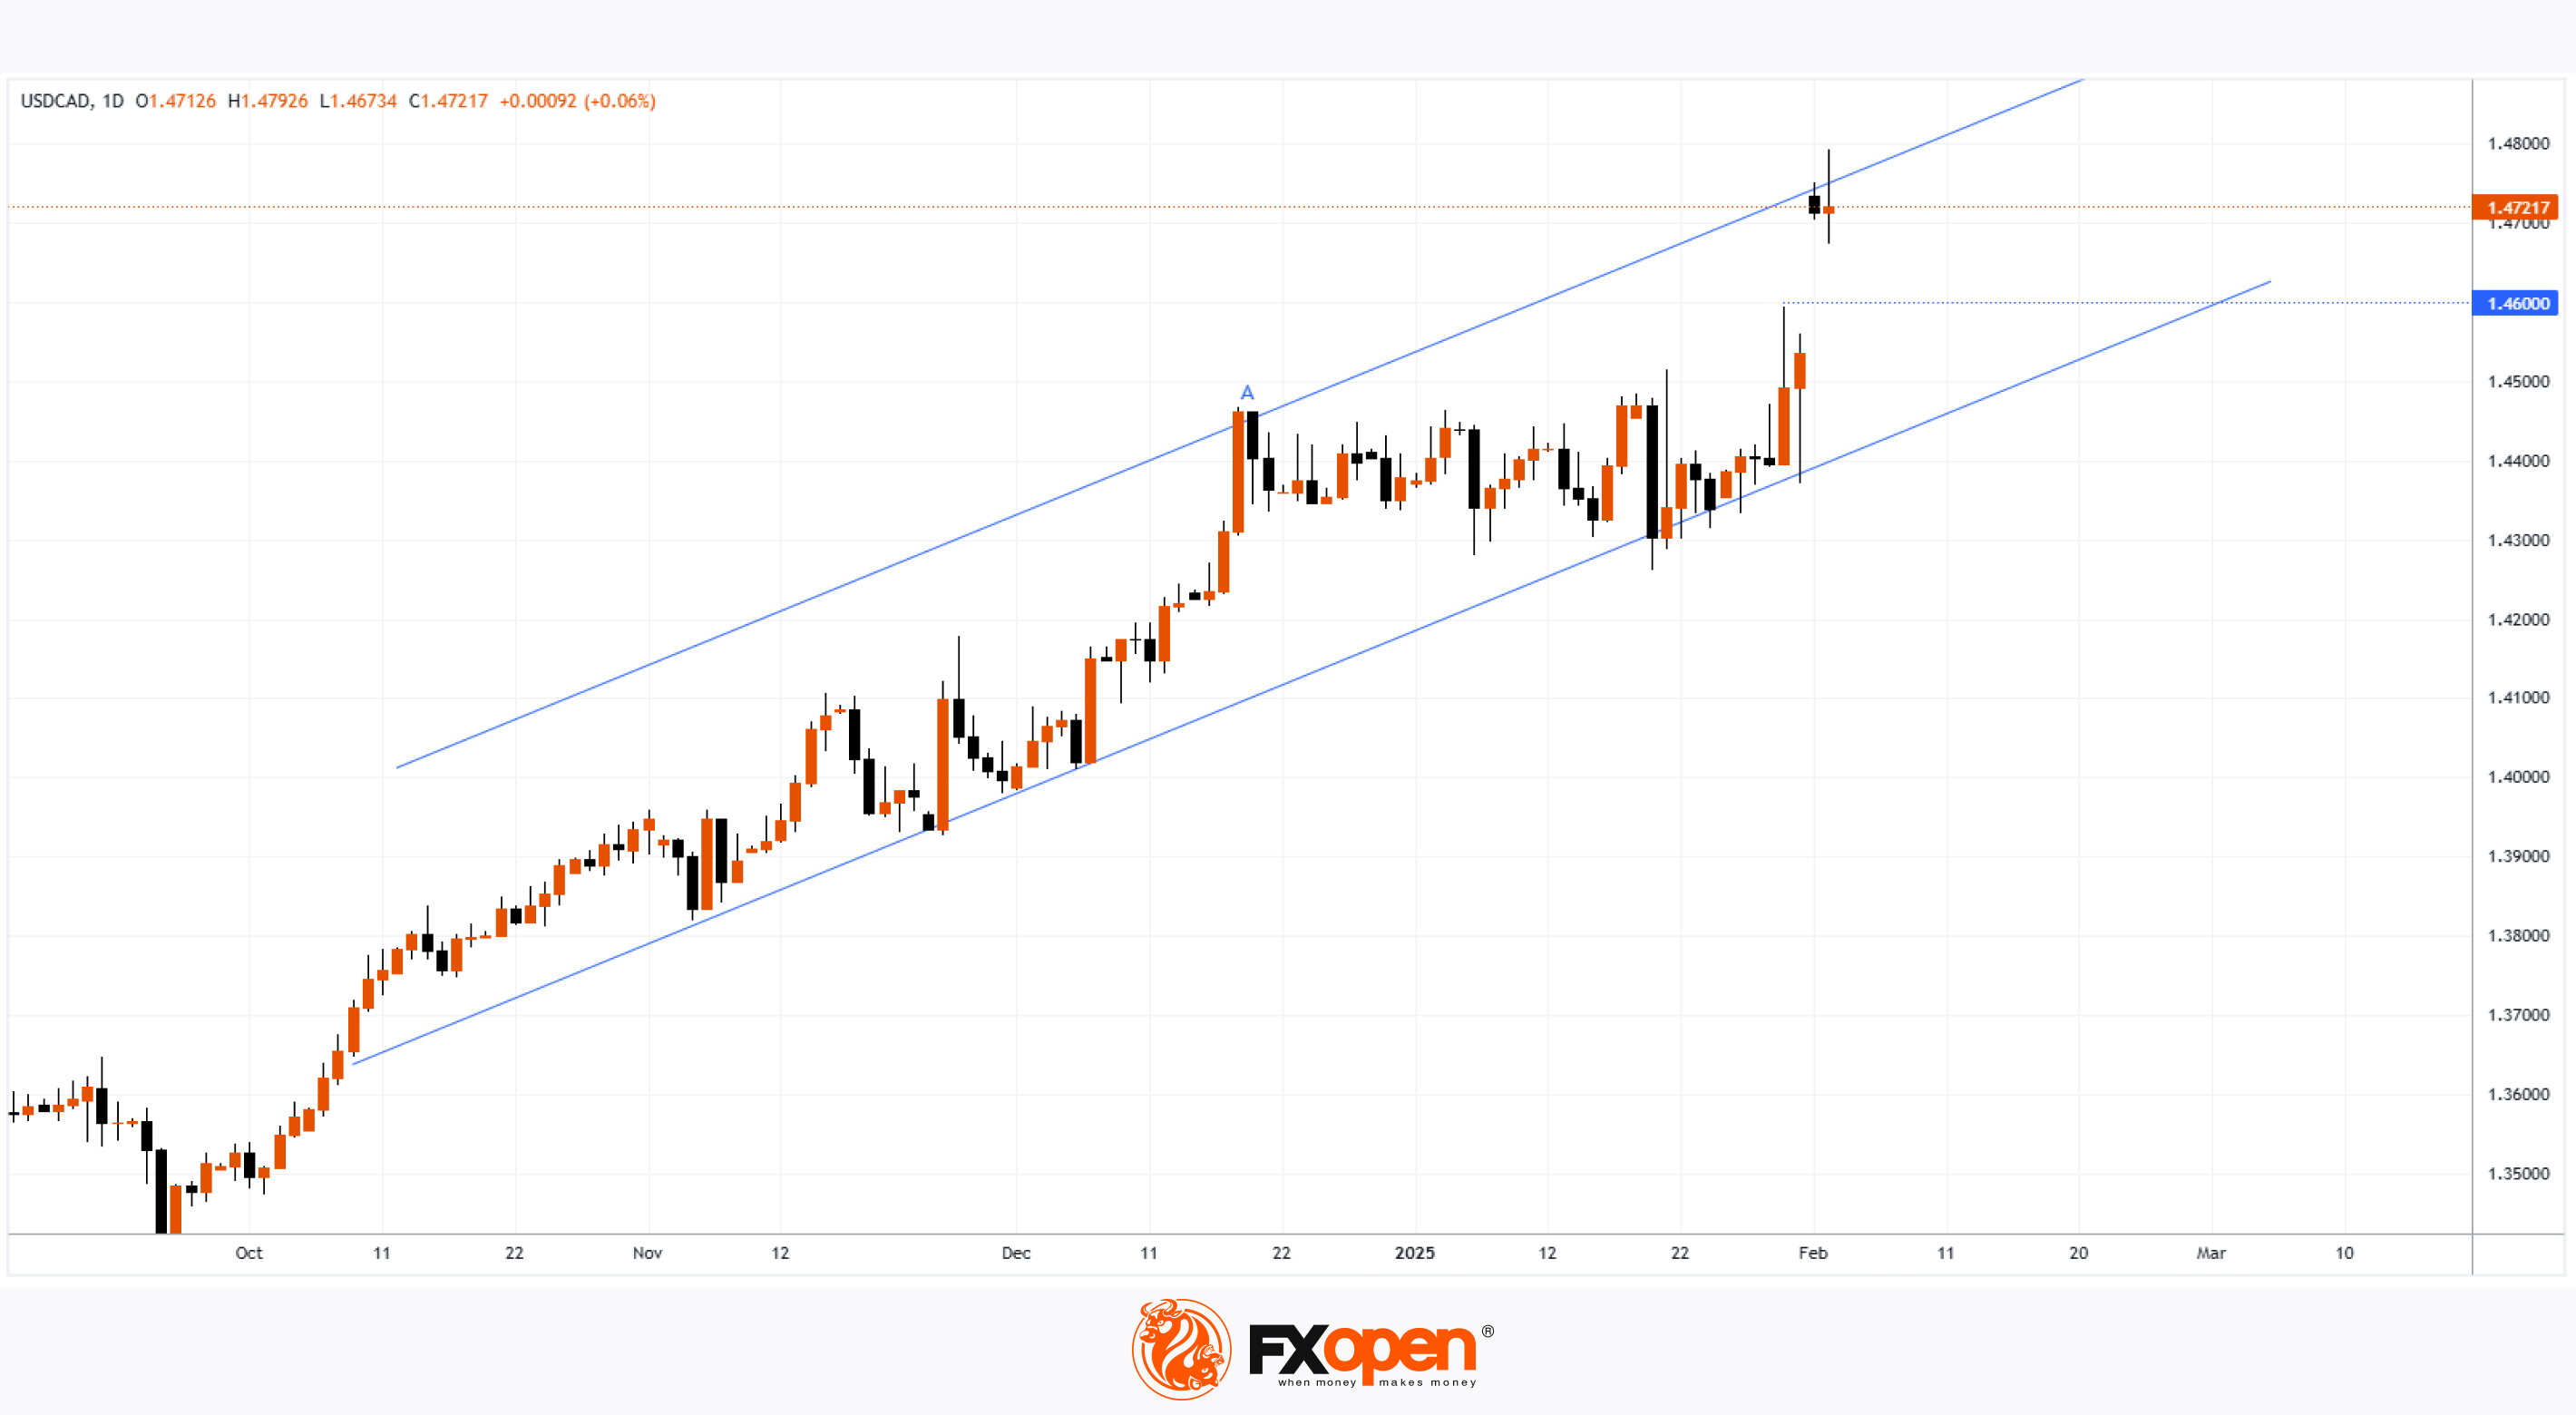
According to the USD/CAD chart, the Canadian dollar is trading around 1.4700 against the US dollar—a level last seen in early 2003.
On 30 January, our USD/CAD technical analysis highlighted the significance of a key trendline supporting the uptrend since last autumn. Now, by drawing a parallel line through December’s peak (A), we can identify a resistance level where the pair is currently stabilising.
A large bullish gap has also formed on the chart. The lower boundary around 1.4600 may act as technical support in the short term, though broader price movements will likely be driven by fundamental factors.
Trade over 50 forex markets 24 hours a day with FXOpen. Take advantage of low commissions, deep liquidity, and spreads from 0.0 pips. Open your FXOpen account now or learn more about trading forex with FXOpen.
CFDs are complex instruments and come with a high risk of losing your money.
This article represents the opinion of the Companies operating under the FXOpen brand only. It is not to be construed as an offer, solicitation, or recommendation with respect to products and services provided by the Companies operating under the FXOpen brand, nor is it to be considered financial advice.
Trump’s Tariffs Push USD/CAD to a 22-Year High
As promised during his election campaign, US President Donald Trump introduced tariffs just two weeks after his inauguration:
→ 25% on goods from Canada and Mexico, prompting both countries to vow retaliatory measures.
→ 10% on Chinese goods, with China announcing plans to challenge the decision at the World Trade Organization.
The tariffs will take effect on 4 February. Trump acknowledged potential economic pain but justified the measures as necessary to combat illegal immigration and drug trafficking, arguing that the long-term benefits would outweigh the costs.
Trump’s decision:
→ Led to a decline in US stock indices, as analysts fear a potential trade war and global stagflation (sluggish economic growth amid high inflation). Further tariffs on Europe may follow.
→ Strengthened the US dollar, which gained around 1% against major currencies.
According to the USD/CAD chart, the Canadian dollar is trading around 1.4700 against the US dollar—a level last seen in early 2003.
On 30 January, our USD/CAD technical analysis highlighted the significance of a key trendline supporting the uptrend since last autumn. Now, by drawing a parallel line through December’s peak (A), we can identify a resistance level where the pair is currently stabilising.
A large bullish gap has also formed on the chart. The lower boundary around 1.4600 may act as technical support in the short term, though broader price movements will likely be driven by fundamental factors.
Trade over 50 forex markets 24 hours a day with FXOpen. Take advantage of low commissions, deep liquidity, and spreads from 0.0 pips. Open your FXOpen account now or learn more about trading forex with FXOpen.
CFDs are complex instruments and come with a high risk of losing your money.
This article represents the opinion of the Companies operating under the FXOpen brand only. It is not to be construed as an offer, solicitation, or recommendation with respect to products and services provided by the Companies operating under the FXOpen brand, nor is it to be considered financial advice.
👍2😱1
#goldprice #XAUUSD #MarketUpdates #marketanalysis
Trump’s Tariffs Push Gold Price Down from Record High
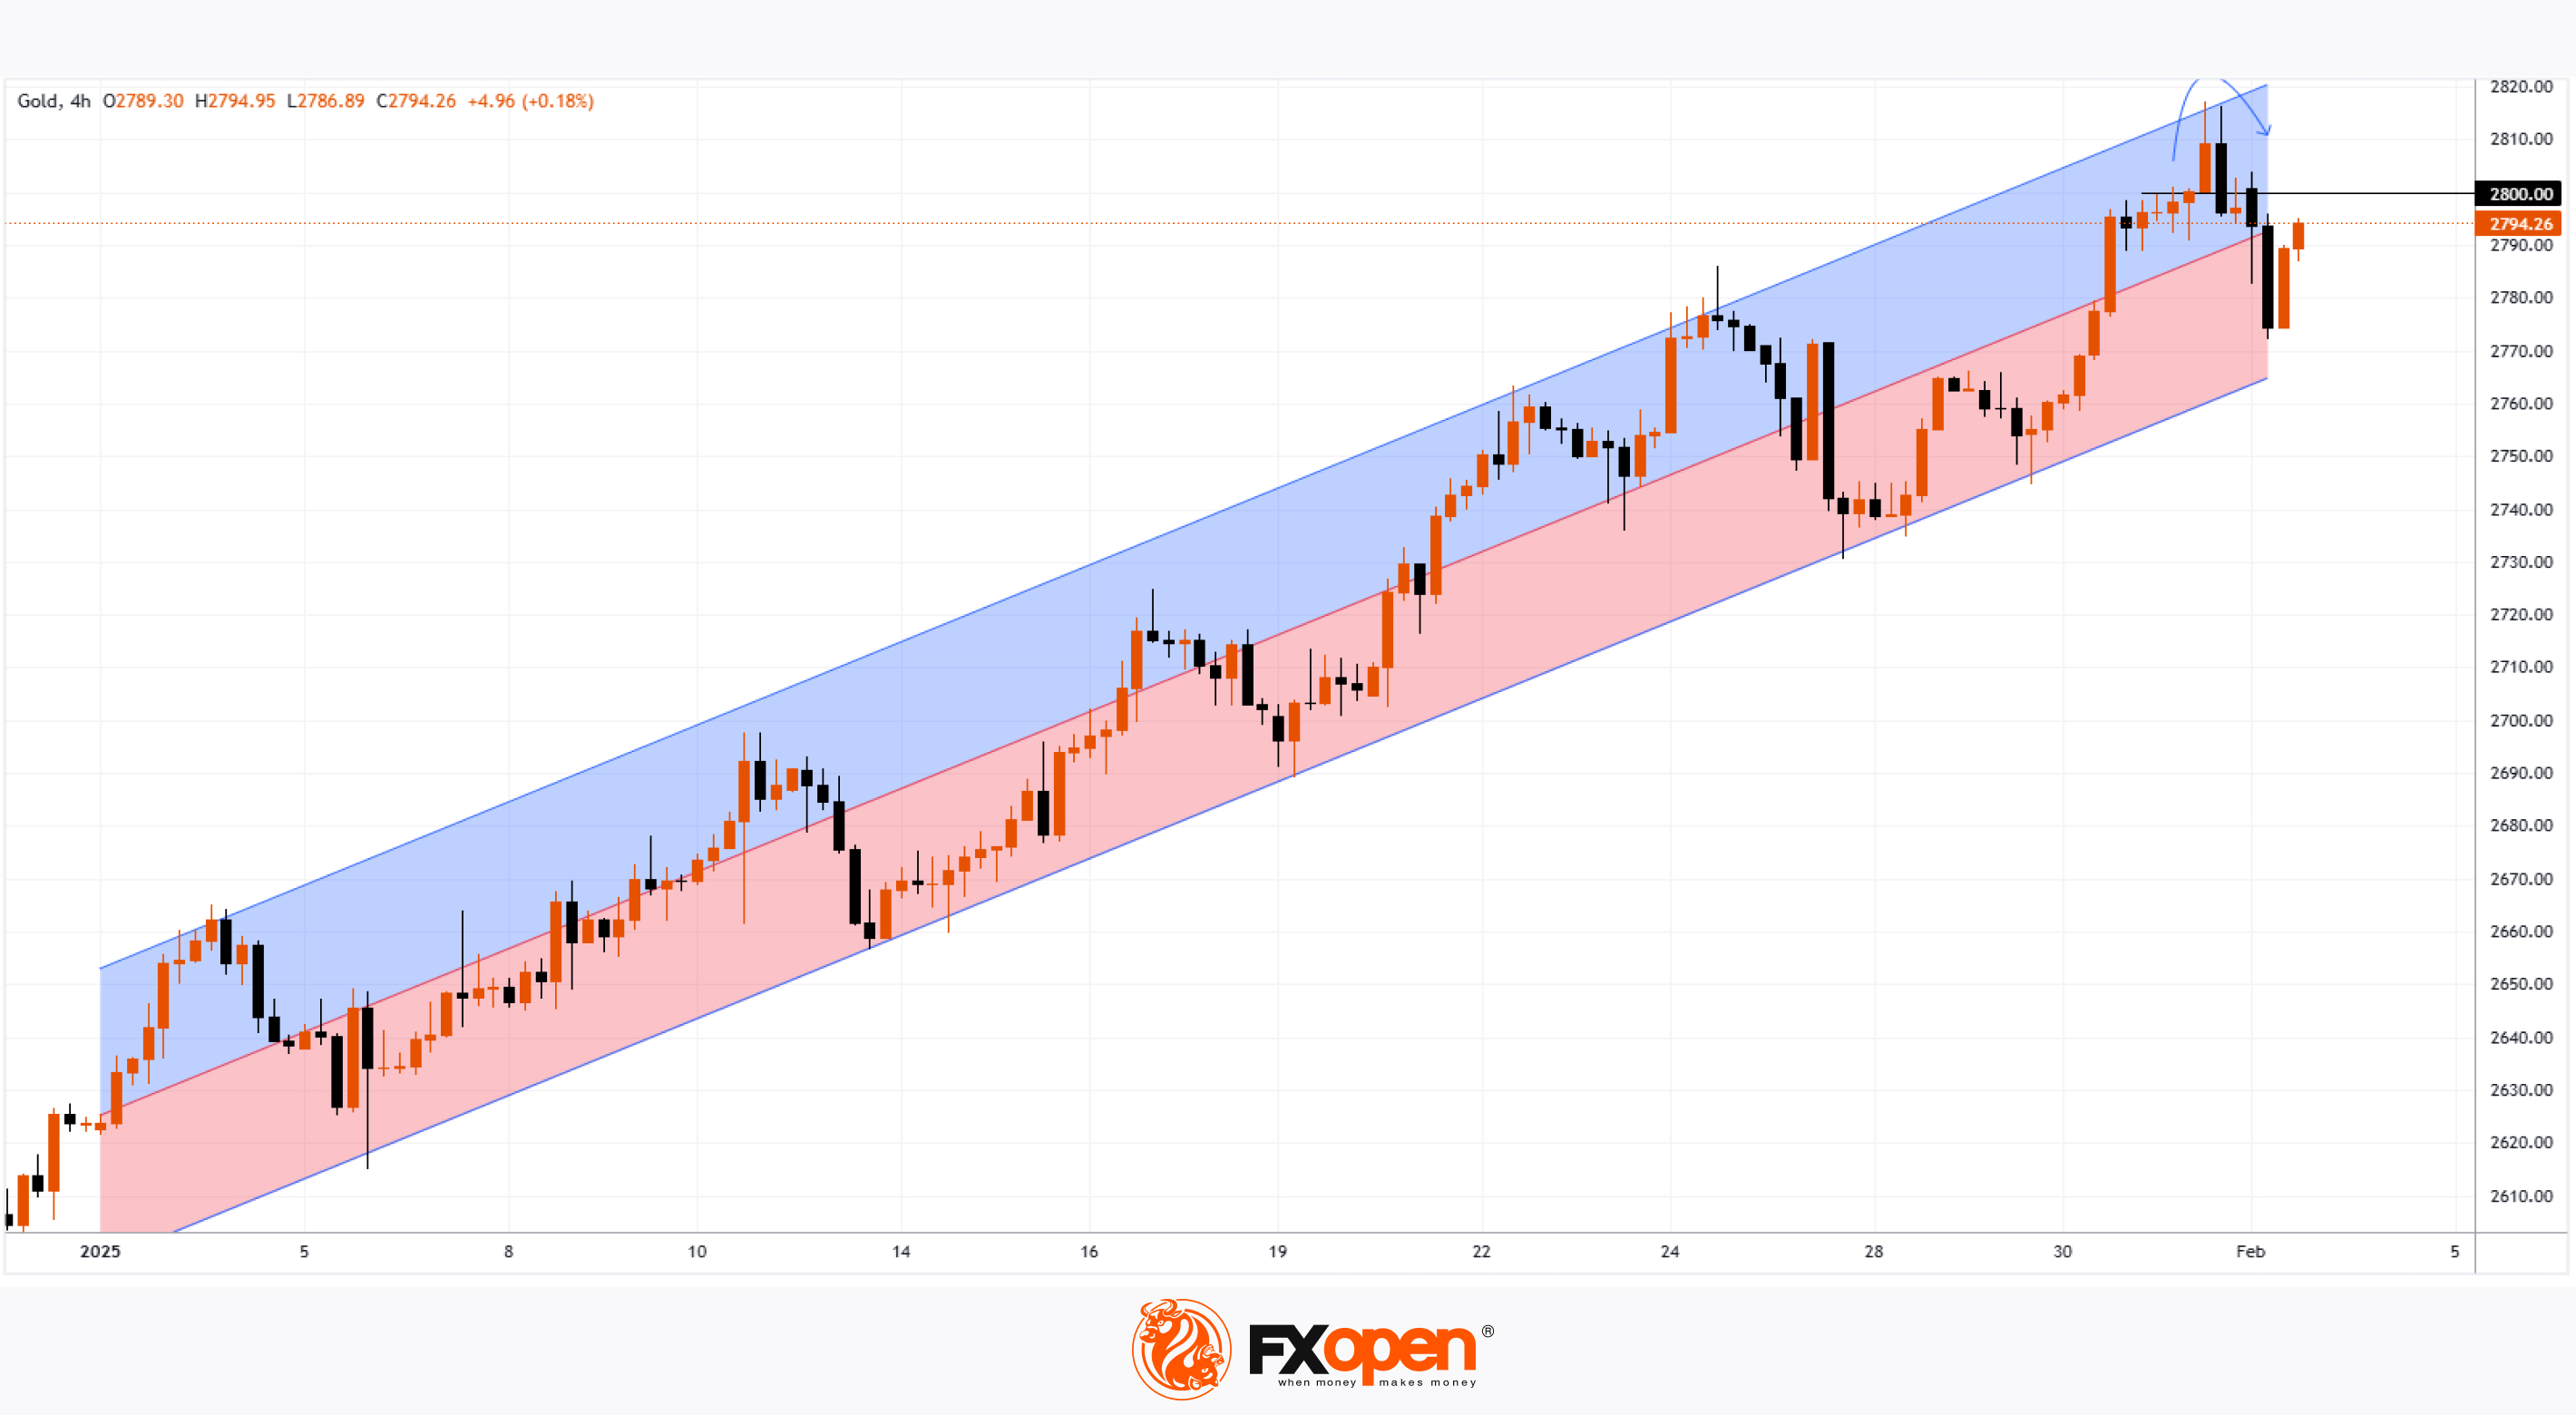
As shown on the XAU/USD chart, gold prices surpassed $2,800 per ounce for the first time in history on 31 January. However, by 3 February, we have seen a pullback from this record high.
Today’s bearish sentiment in gold is driven by the strengthening US dollar, a reaction from currency markets to the tariffs announced by Donald Trump.
This creates a mixed outlook:
→ On one hand, trade war concerns support gold as a safe-haven asset.
→ On the other, a stronger dollar pressures XAU/USD.
According to Reuters, Citi analysts suggest that further tariffs could drive gold prices up to $3,000 per ounce.
The technical analysis of the 4-hour XAU/USD chart shows that:
→ The price is moving within an upward trend, following a linear regression channel drawn from the first candles of 2025.
→ A bullish attempt to break above $2,800 triggered selling pressure, forming a bearish engulfing pattern and pushing the price towards the lower boundary of the channel. If fundamentals continue to support gold’s rise, the $2,800 level could become a significant resistance for the current trend throughout February.
Start trading commodities with tight spreads. Open your trading account now or learn more about trading commodity CFDs with FXOpen.
CFDs are complex instruments and come with a high risk of losing your money.
This article represents the opinion of the Companies operating under the FXOpen brand only. It is not to be construed as an offer, solicitation, or recommendation with respect to products and services provided by the Companies operating under the FXOpen brand, nor is it to be considered financial advice.
Trump’s Tariffs Push Gold Price Down from Record High
As shown on the XAU/USD chart, gold prices surpassed $2,800 per ounce for the first time in history on 31 January. However, by 3 February, we have seen a pullback from this record high.
Today’s bearish sentiment in gold is driven by the strengthening US dollar, a reaction from currency markets to the tariffs announced by Donald Trump.
This creates a mixed outlook:
→ On one hand, trade war concerns support gold as a safe-haven asset.
→ On the other, a stronger dollar pressures XAU/USD.
According to Reuters, Citi analysts suggest that further tariffs could drive gold prices up to $3,000 per ounce.
The technical analysis of the 4-hour XAU/USD chart shows that:
→ The price is moving within an upward trend, following a linear regression channel drawn from the first candles of 2025.
→ A bullish attempt to break above $2,800 triggered selling pressure, forming a bearish engulfing pattern and pushing the price towards the lower boundary of the channel. If fundamentals continue to support gold’s rise, the $2,800 level could become a significant resistance for the current trend throughout February.
Start trading commodities with tight spreads. Open your trading account now or learn more about trading commodity CFDs with FXOpen.
CFDs are complex instruments and come with a high risk of losing your money.
This article represents the opinion of the Companies operating under the FXOpen brand only. It is not to be construed as an offer, solicitation, or recommendation with respect to products and services provided by the Companies operating under the FXOpen brand, nor is it to be considered financial advice.
👍3
#StockMarket #Investing #FinanceNews #FederalReserve #InterestRates #Inflation #Amazon #Trading
Market Insights with Gary Thomson: BoE Interest Rates, US & Canada Job Data, Corporate Earnings
In this video, we’ll explore the key economic events, market trends, and corporate news
shaping the financial landscape. Get ready for expert insights into forex, commodities, and stocks to help you navigate the week ahead. Let’s dive in!
In this episode:
🔸 BoE Interest Rate Decision
Will the BoE cut rates by 0.25%? Find out how the central bank will balance inflation risks with slowing economic growth.
🔸 US Nonfarm Payrolls & Unemployment Rate
Will January’s job data shake Fed rate expectations? See how NFP and unemployment figures may drive market moves.
🔸 Canada Unemployment Rate
Could Canada’s job data support further BoC cuts? Watch for market reactions to the latest employment figures.
🔸Corporate Earnings Statements
Alphabet and Amazon report this week—how will their results impact the market? Check out their expected performance.
Don’t miss out—gain insights to stay ahead in your trading journey.
https://cutt.ly/ke72TynR
To take advantage of price fluctuations in the foreign exchange markets, consider enlisting the services of a reliable broker like FXOpen.
⚠️
This forecast represents FXOpen Companies opinion only, it should not be construed as an offer, invitation or recommendation in respect to FXOpen Companies products and services or as financial advice.
Market Insights with Gary Thomson: BoE Interest Rates, US & Canada Job Data, Corporate Earnings
In this video, we’ll explore the key economic events, market trends, and corporate news
shaping the financial landscape. Get ready for expert insights into forex, commodities, and stocks to help you navigate the week ahead. Let’s dive in!
In this episode:
🔸 BoE Interest Rate Decision
Will the BoE cut rates by 0.25%? Find out how the central bank will balance inflation risks with slowing economic growth.
🔸 US Nonfarm Payrolls & Unemployment Rate
Will January’s job data shake Fed rate expectations? See how NFP and unemployment figures may drive market moves.
🔸 Canada Unemployment Rate
Could Canada’s job data support further BoC cuts? Watch for market reactions to the latest employment figures.
🔸Corporate Earnings Statements
Alphabet and Amazon report this week—how will their results impact the market? Check out their expected performance.
Don’t miss out—gain insights to stay ahead in your trading journey.
https://cutt.ly/ke72TynR
To take advantage of price fluctuations in the foreign exchange markets, consider enlisting the services of a reliable broker like FXOpen.
⚠️
This forecast represents FXOpen Companies opinion only, it should not be construed as an offer, invitation or recommendation in respect to FXOpen Companies products and services or as financial advice.
YouTube
Market Insights with Gary Thomson: BoE Interest Rates, US & Canada Job Data, Corporate Earnings
In this video, we’ll explore the key economic events, market trends, and corporate news shaping the financial landscape. Get ready for expert insights into forex, commodities, and stocks to help you navigate the week ahead. Let’s dive in!
In this episode:…
In this episode:…
👍2
#forextrading #tradingtips #usdollar #MarketUpdates
USD/CNH Chart Sees Spike in Volatility Due to Tariffs
In response to the Trump administration's 10% tariff on Chinese goods, Beijing vowed to challenge the decision at the World Trade Organization.
Moreover, Chinese authorities have:
→ imposed retaliatory tariffs of 15% on US coal and liquefied gas, and 10% tariffs on oil and agricultural machinery;
→ launched an investigation into Google for potential anti-competitive practices.
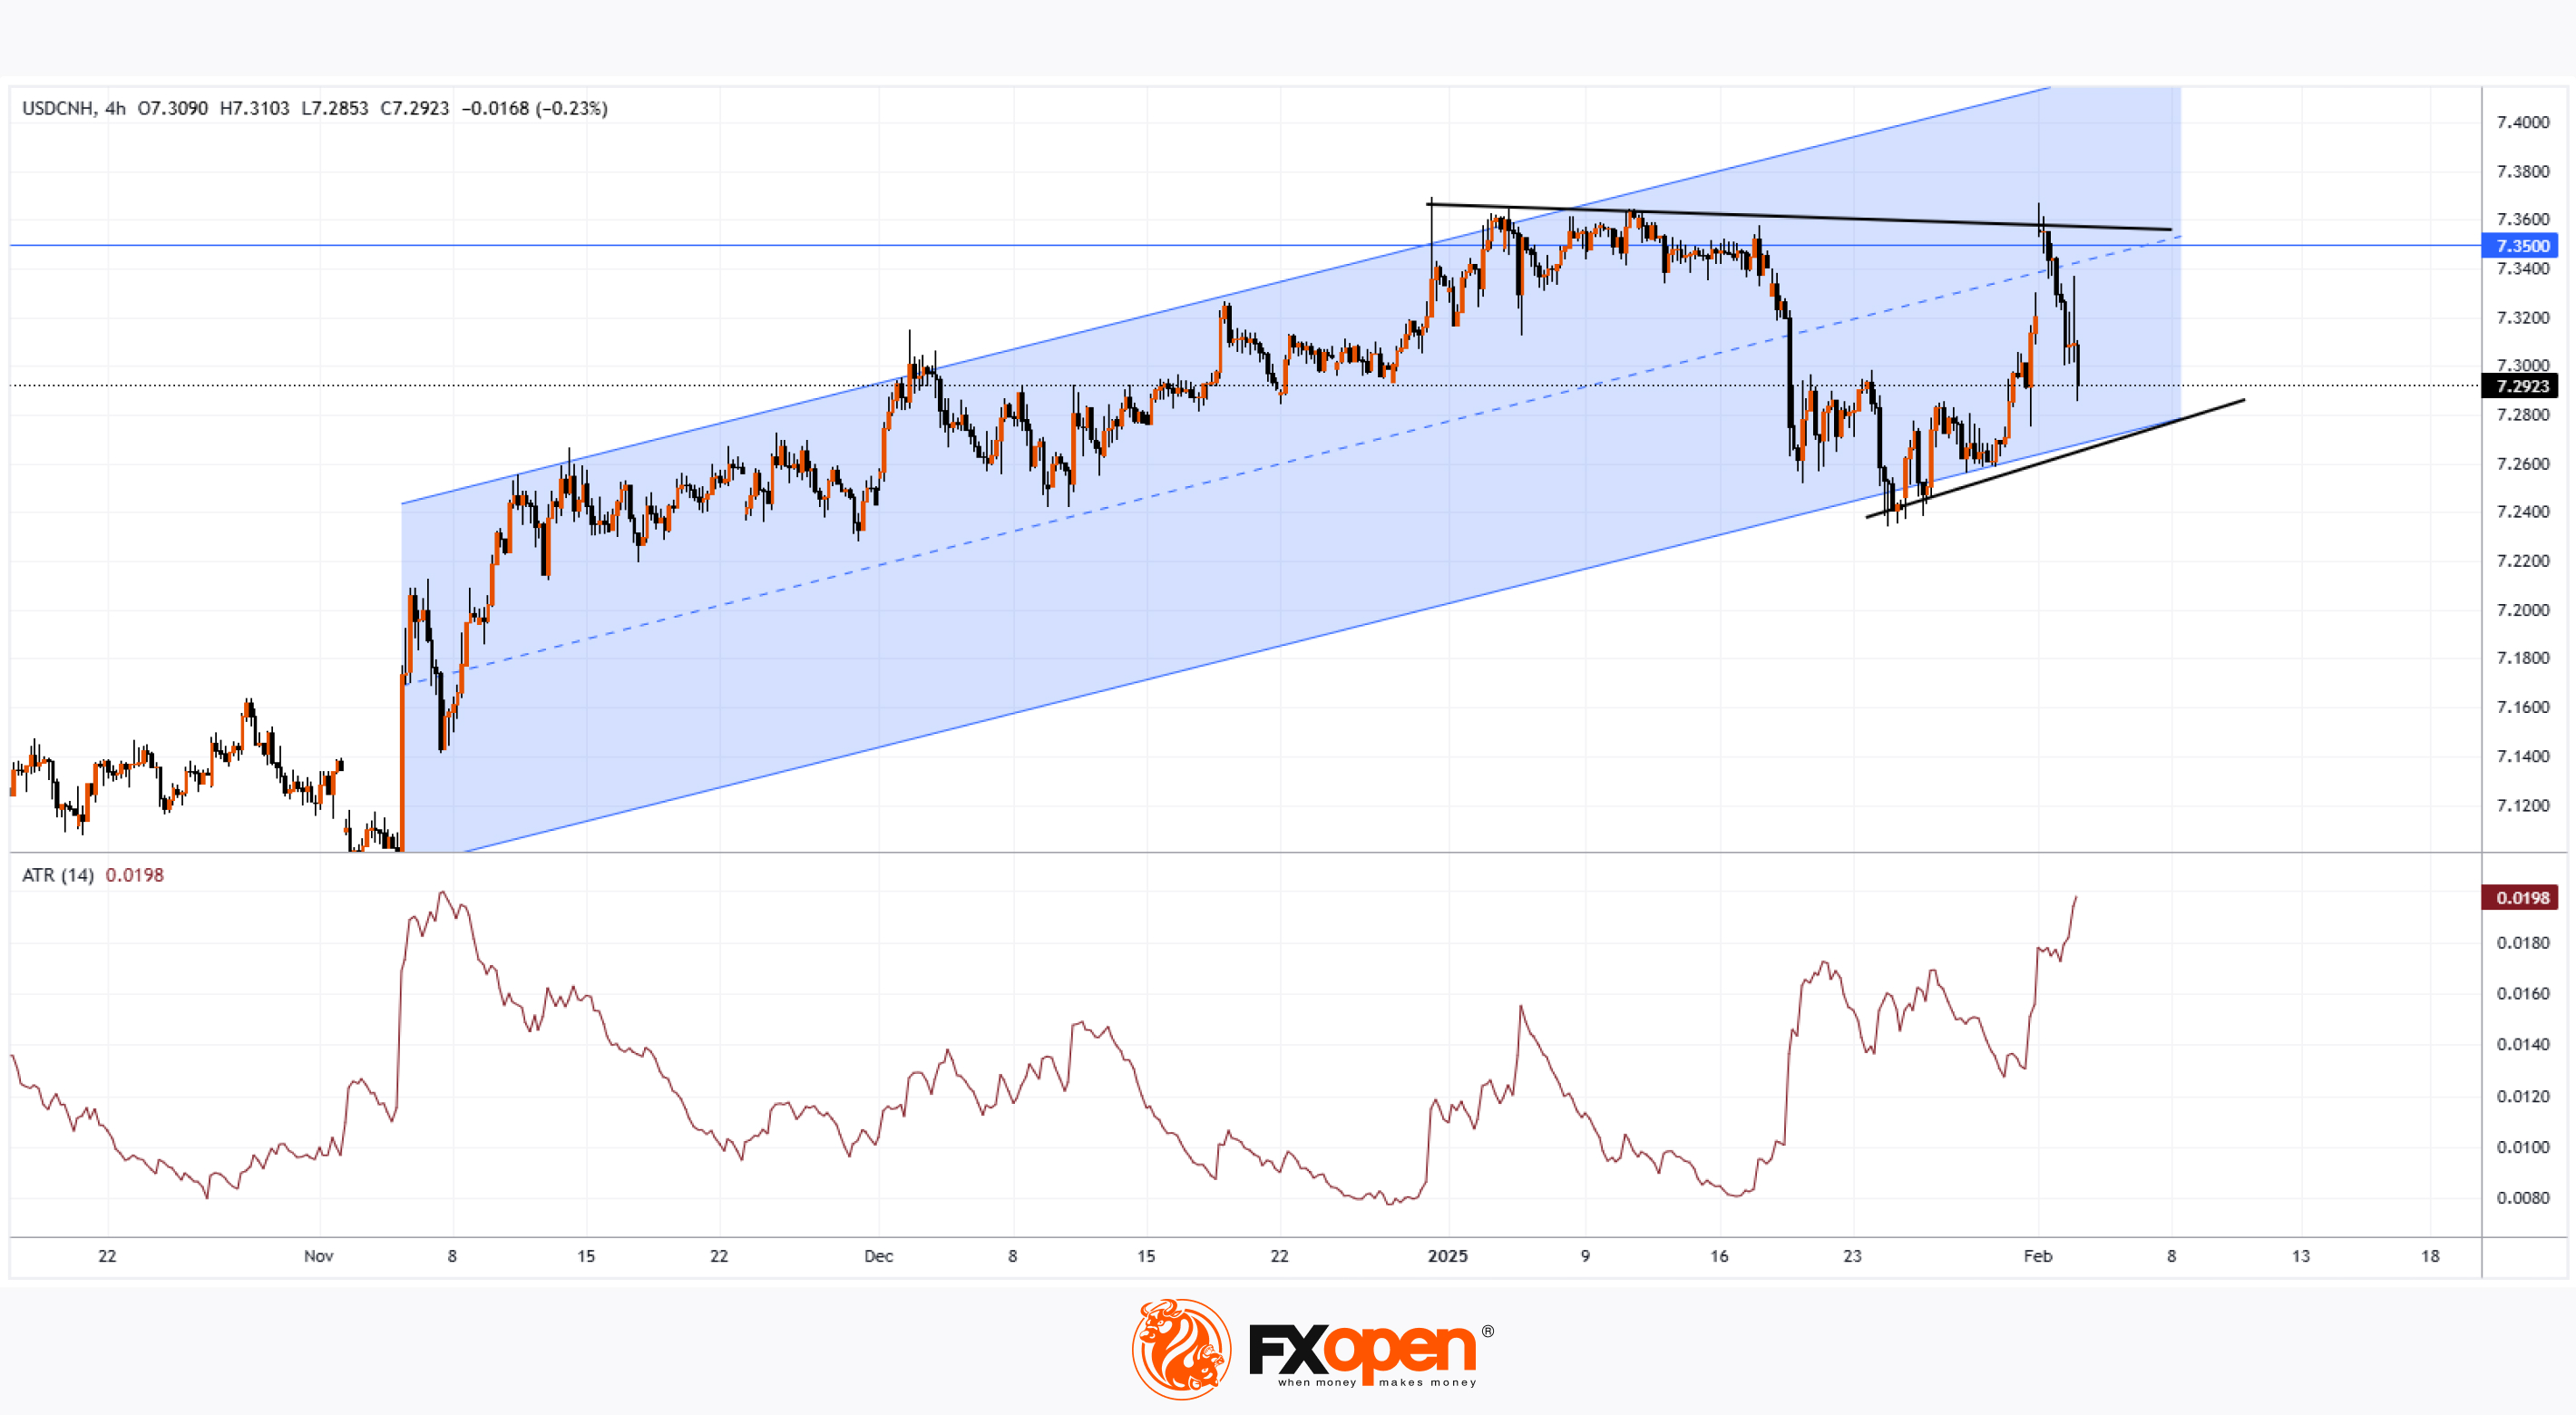
These recent developments have triggered a spike in volatility for the Chinese yuan against the US dollar. As the USD/CNH chart shows today, the ATR indicator is at its highest level since early November, when Trump celebrated his election victory.
On 9 January, in our analysis of the USD/CNH exchange rate, we noted:
→ the importance of the 7.35 level, which had acted as resistance for several months;
→ according to Wang Tao, chief economist at UBS China, the yuan may weaken to 7.6 per dollar by the end of 2025 if the Trump administration imposes higher tariffs.
Today's technical analysis of the USD/CNH chart shows:
→ the rate is supported by the lower boundary of an expanded ascending channel (shown in blue);
→ the 7.35 level continues to act as resistance (as indicated by the red arrow).
Thus, at the beginning of February 2025, we may witness the formation of a narrowing triangle (shown by the black lines), and a breakout could lead to a significant trend movement. How realistic this assumption is largely depends on how the ongoing tariff conflict between the US and China develops.
Trade over 50 forex markets 24 hours a day with FXOpen. Take advantage of low commissions, deep liquidity, and spreads from 0.0 pips. Open your FXOpen account now or learn more about trading forex with FXOpen.
CFDs are complex instruments and come with a high risk of losing your money.
This article represents the opinion of the Companies operating under the FXOpen brand only. It is not to be construed as an offer, solicitation, or recommendation with respect to products and services provided by the Companies operating under the FXOpen brand, nor is it to be considered financial advice.
USD/CNH Chart Sees Spike in Volatility Due to Tariffs
In response to the Trump administration's 10% tariff on Chinese goods, Beijing vowed to challenge the decision at the World Trade Organization.
Moreover, Chinese authorities have:
→ imposed retaliatory tariffs of 15% on US coal and liquefied gas, and 10% tariffs on oil and agricultural machinery;
→ launched an investigation into Google for potential anti-competitive practices.
These recent developments have triggered a spike in volatility for the Chinese yuan against the US dollar. As the USD/CNH chart shows today, the ATR indicator is at its highest level since early November, when Trump celebrated his election victory.
On 9 January, in our analysis of the USD/CNH exchange rate, we noted:
→ the importance of the 7.35 level, which had acted as resistance for several months;
→ according to Wang Tao, chief economist at UBS China, the yuan may weaken to 7.6 per dollar by the end of 2025 if the Trump administration imposes higher tariffs.
Today's technical analysis of the USD/CNH chart shows:
→ the rate is supported by the lower boundary of an expanded ascending channel (shown in blue);
→ the 7.35 level continues to act as resistance (as indicated by the red arrow).
Thus, at the beginning of February 2025, we may witness the formation of a narrowing triangle (shown by the black lines), and a breakout could lead to a significant trend movement. How realistic this assumption is largely depends on how the ongoing tariff conflict between the US and China develops.
Trade over 50 forex markets 24 hours a day with FXOpen. Take advantage of low commissions, deep liquidity, and spreads from 0.0 pips. Open your FXOpen account now or learn more about trading forex with FXOpen.
CFDs are complex instruments and come with a high risk of losing your money.
This article represents the opinion of the Companies operating under the FXOpen brand only. It is not to be construed as an offer, solicitation, or recommendation with respect to products and services provided by the Companies operating under the FXOpen brand, nor is it to be considered financial advice.
👍2
#AAPL #stockmarket #marketanalysis #MarketUpdates
AAPL Shares Drop Amid Trump’s Tariffs Despite Strong Earnings
Last week, Apple (AAPL) reported quarterly earnings that exceeded analyst expectations:
→ Earnings per share: $2.40 (expected: $2.35)
→ Revenue: $124.3 billion (expected: $124.2 billion)
Zacks analysts called the results “favourable,” yet Apple’s stock movement tells a different story:
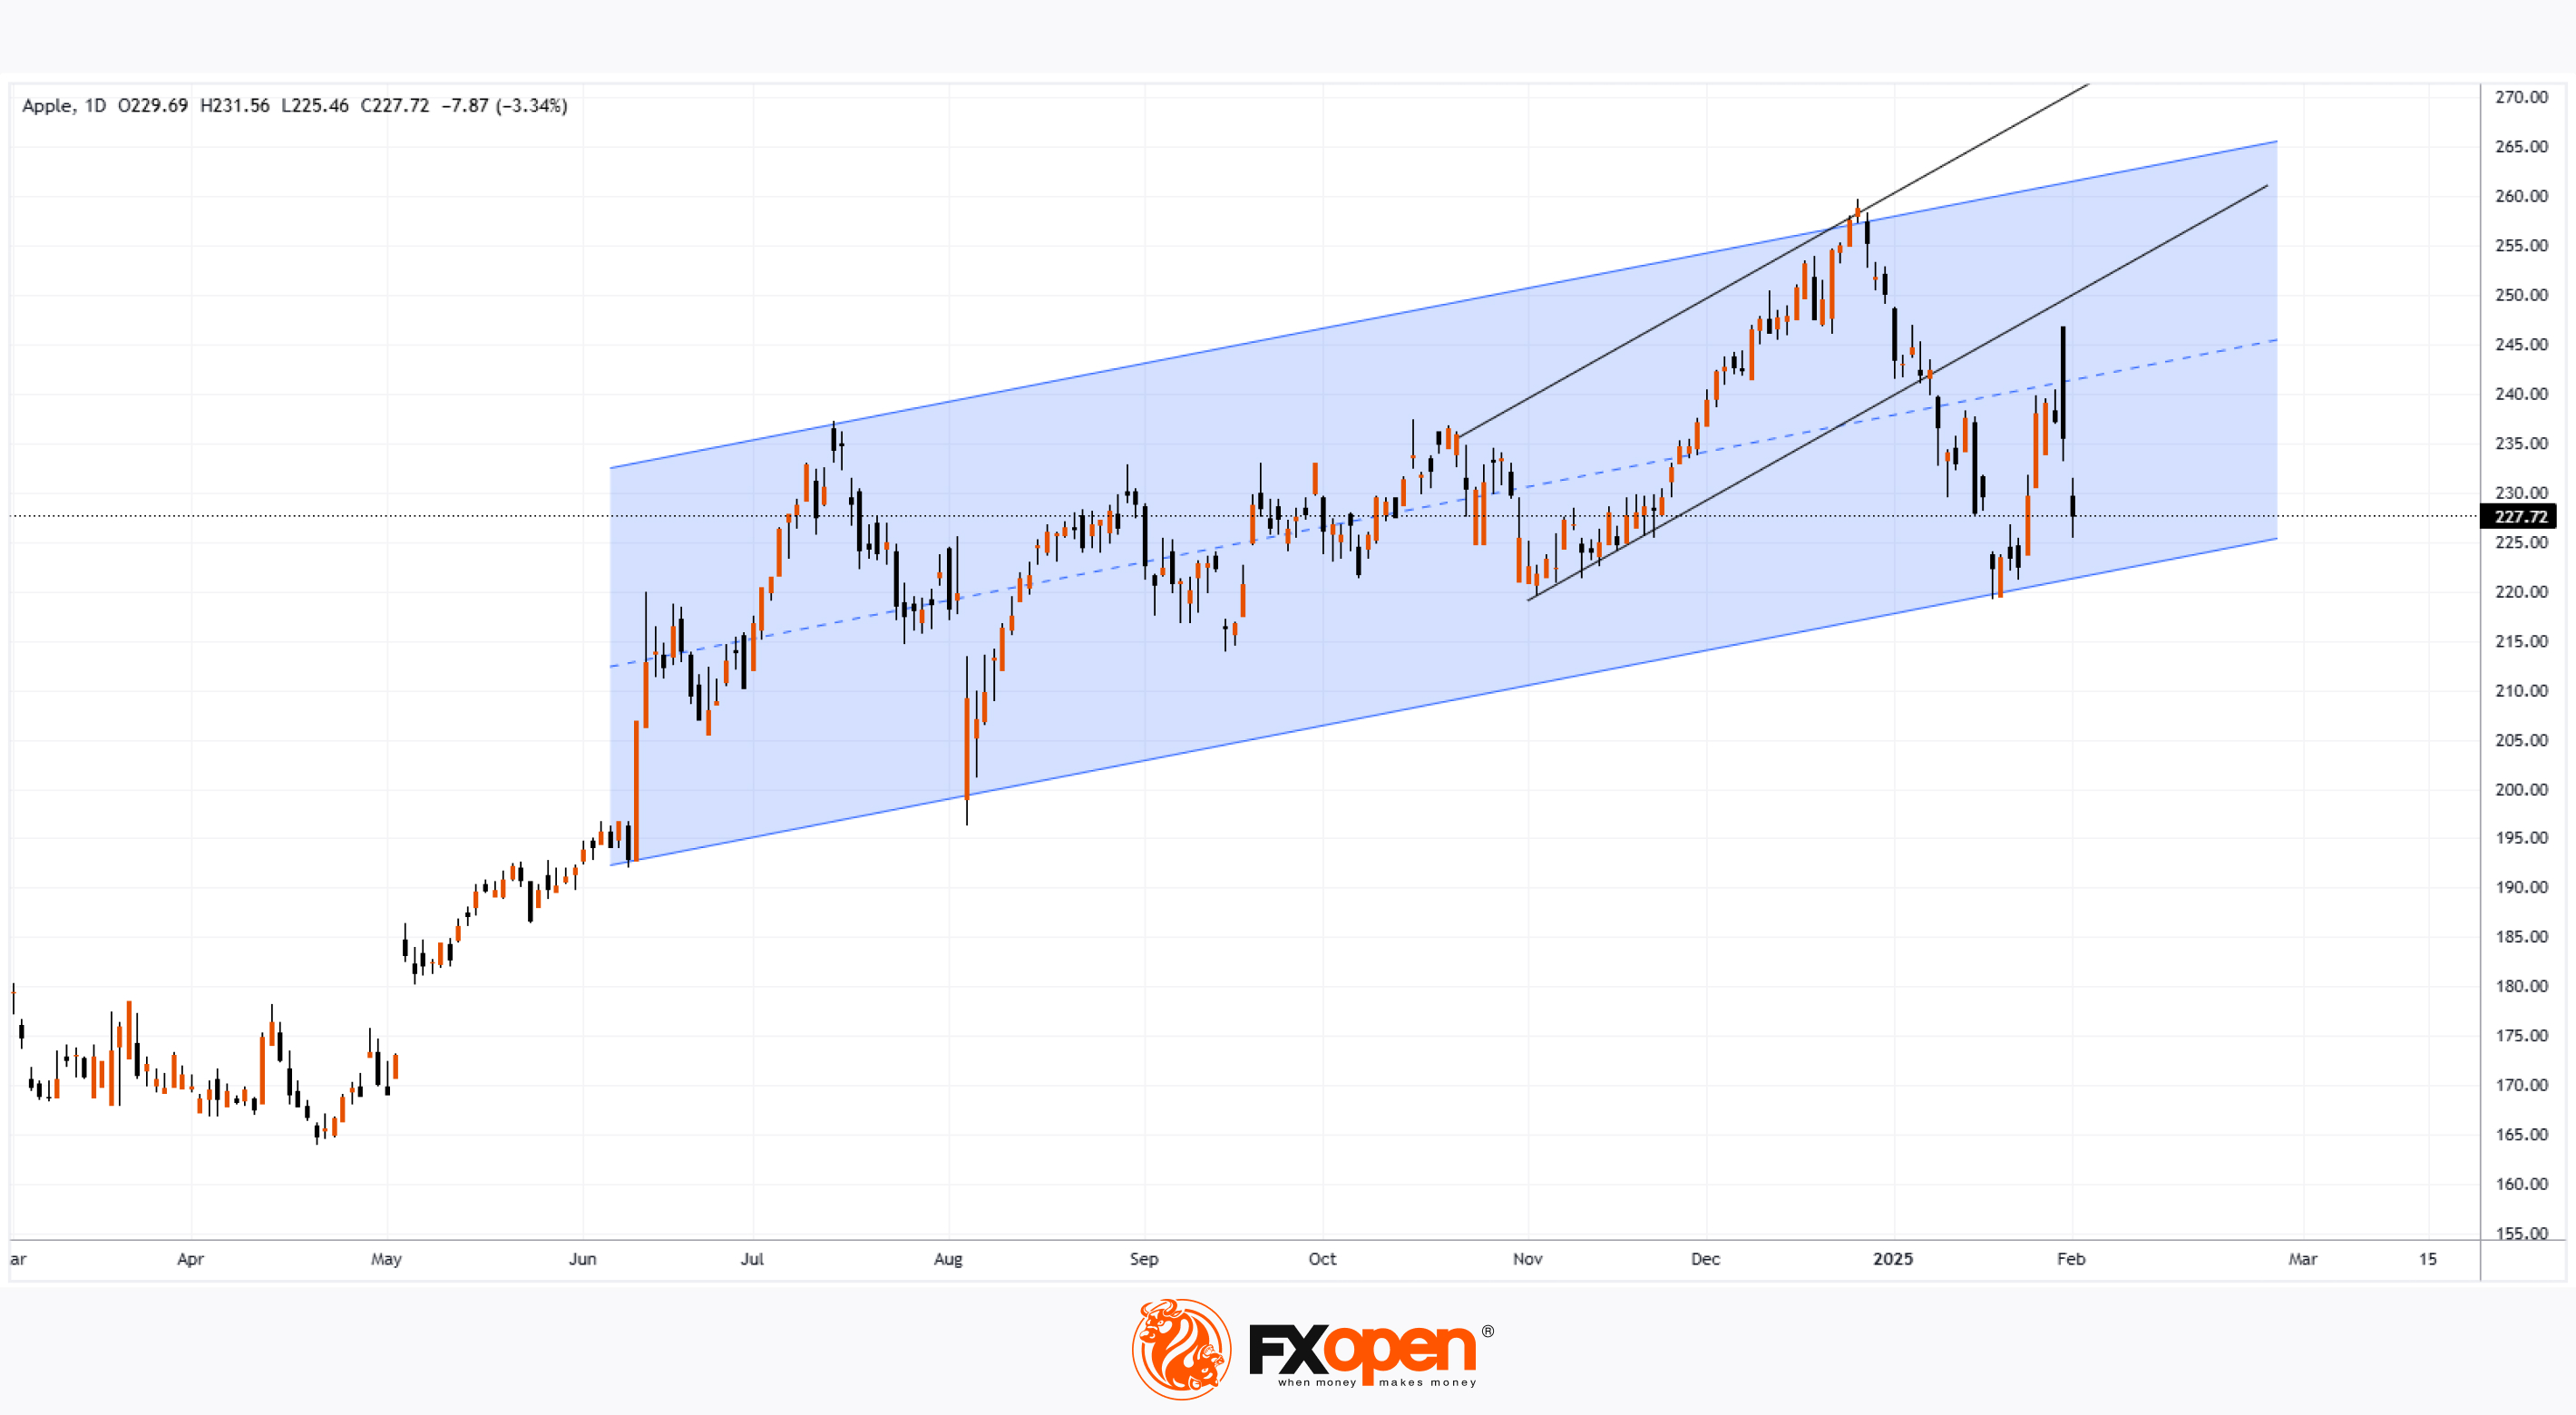
→ On 31 January, shares opened with a bullish gap around $247, briefly improving AAPL’s weak start to the year.
→ By 3 February, the stock closed near $227, marking a 7.4% decline over just two sessions.
The downward pressure on AAPL may be due to:
→ Shifting sentiment around U.S. tech leadership in AI, following the success of Chinese startup DeepSeek’s free chatbot.
→ Trump’s tariffs, particularly the new 10% levy on Chinese imports, which could impact Apple’s future performance.
According to BofA Securities analysts:
→ The impact on profits should be “limited,” as around 80% of Apple devices can be manufactured outside China.
→ AAPL remains attractive, with a “buy” rating and a $265 price target, supported by stable cash flow, strong earnings, and AI-driven opportunities.
Technical analysis of Apple (AAPL) stock shows that the price has been forming a long-term upward channel (marked in blue) since summer 2024, with the following key observations:
→ Bearish perspective: The price has sharply dropped from the upper half of the blue channel (as shown by the arrow), testing a potential bearish breakout of the previous uptrend (marked in black) from late 2024.
→ Bullish perspective: The lower boundary of the channel, around $222, may serve as a key support level, potentially preventing further declines.
Trade global index CFDs with zero commission and tight spreads. Open your FXOpen account now or learn more about trading index CFDs with FXOpen.
CFDs are complex instruments and come with a high risk of losing your money.
This article represents the opinion of the Companies operating under the FXOpen brand only. It is not to be construed as an offer, solicitation, or recommendation with respect to products and services provided by the Companies operating under the FXOpen brand, nor is it to be considered financial advice.
AAPL Shares Drop Amid Trump’s Tariffs Despite Strong Earnings
Last week, Apple (AAPL) reported quarterly earnings that exceeded analyst expectations:
→ Earnings per share: $2.40 (expected: $2.35)
→ Revenue: $124.3 billion (expected: $124.2 billion)
Zacks analysts called the results “favourable,” yet Apple’s stock movement tells a different story:
→ On 31 January, shares opened with a bullish gap around $247, briefly improving AAPL’s weak start to the year.
→ By 3 February, the stock closed near $227, marking a 7.4% decline over just two sessions.
The downward pressure on AAPL may be due to:
→ Shifting sentiment around U.S. tech leadership in AI, following the success of Chinese startup DeepSeek’s free chatbot.
→ Trump’s tariffs, particularly the new 10% levy on Chinese imports, which could impact Apple’s future performance.
According to BofA Securities analysts:
→ The impact on profits should be “limited,” as around 80% of Apple devices can be manufactured outside China.
→ AAPL remains attractive, with a “buy” rating and a $265 price target, supported by stable cash flow, strong earnings, and AI-driven opportunities.
Technical analysis of Apple (AAPL) stock shows that the price has been forming a long-term upward channel (marked in blue) since summer 2024, with the following key observations:
→ Bearish perspective: The price has sharply dropped from the upper half of the blue channel (as shown by the arrow), testing a potential bearish breakout of the previous uptrend (marked in black) from late 2024.
→ Bullish perspective: The lower boundary of the channel, around $222, may serve as a key support level, potentially preventing further declines.
Trade global index CFDs with zero commission and tight spreads. Open your FXOpen account now or learn more about trading index CFDs with FXOpen.
CFDs are complex instruments and come with a high risk of losing your money.
This article represents the opinion of the Companies operating under the FXOpen brand only. It is not to be construed as an offer, solicitation, or recommendation with respect to products and services provided by the Companies operating under the FXOpen brand, nor is it to be considered financial advice.
👍2
#nzd #forextrading #tradingforex #marketanalysis
NZD/USD Analysis: Recovery from 27-Month Low
This morning, New Zealand’s labour market data was released, showing unfavourable results. The unemployment rate rose to 5.1% in Q4, the highest since Q3 2020, signalling economic slowdown and reinforcing expectations of a rate cut by the Reserve Bank of New Zealand at its meeting in late February.
However, the weak labour market figures were widely anticipated and already priced in. A greater source of uncertainty is the ongoing trade war between the US and China, a key trading partner for both Australia and New Zealand.
Donald Trump stated that he is "in no rush" to speak with Xi Jinping after China retaliated against the 10% US tariffs on Chinese imports.
Technical analysis of the NZD/USD chart shows that:
→ The pair remains in a downward trend (marked in red), driven by a strengthening US dollar. The price is currently near the upper boundary of this trend.
→ The 0.555 level acted as support twice in 2025, as indicated by arrows. Notably, the price also reversed upwards from this area in 2022.
It is possible that buyers will gain confidence and attempt to break the upper boundary of the channel. The future trajectory of NZD/USD will largely depend on news related not only to central bank interest rate decisions but also to government actions on tariffs.
Trade over 50 forex markets 24 hours a day with FXOpen. Take advantage of low commissions, deep liquidity, and spreads from 0.0 pips. Open your FXOpen account now or learn more about trading forex with FXOpen.
CFDs are complex instruments and come with a high risk of losing your money.
This article represents the opinion of the Companies operating under the FXOpen brand only. It is not to be construed as an offer, solicitation, or recommendation with respect to products and services provided by the Companies operating under the FXOpen brand, nor is it to be considered financial advice.
NZD/USD Analysis: Recovery from 27-Month Low
This morning, New Zealand’s labour market data was released, showing unfavourable results. The unemployment rate rose to 5.1% in Q4, the highest since Q3 2020, signalling economic slowdown and reinforcing expectations of a rate cut by the Reserve Bank of New Zealand at its meeting in late February.
However, the weak labour market figures were widely anticipated and already priced in. A greater source of uncertainty is the ongoing trade war between the US and China, a key trading partner for both Australia and New Zealand.
Donald Trump stated that he is "in no rush" to speak with Xi Jinping after China retaliated against the 10% US tariffs on Chinese imports.
Technical analysis of the NZD/USD chart shows that:
→ The pair remains in a downward trend (marked in red), driven by a strengthening US dollar. The price is currently near the upper boundary of this trend.
→ The 0.555 level acted as support twice in 2025, as indicated by arrows. Notably, the price also reversed upwards from this area in 2022.
It is possible that buyers will gain confidence and attempt to break the upper boundary of the channel. The future trajectory of NZD/USD will largely depend on news related not only to central bank interest rate decisions but also to government actions on tariffs.
Trade over 50 forex markets 24 hours a day with FXOpen. Take advantage of low commissions, deep liquidity, and spreads from 0.0 pips. Open your FXOpen account now or learn more about trading forex with FXOpen.
CFDs are complex instruments and come with a high risk of losing your money.
This article represents the opinion of the Companies operating under the FXOpen brand only. It is not to be construed as an offer, solicitation, or recommendation with respect to products and services provided by the Companies operating under the FXOpen brand, nor is it to be considered financial advice.

👍2
#usdcad #forextrading #marketanalysis #MarketUpdates
USD/CAD Exchange Rate Stabilises
As we reported on 3 February, the decision by the US president to impose 25% tariffs on goods imported from Canada sent the USD/CAD rate soaring to a 22-year high.
However, after a round of negotiations between Donald Trump and Justin Trudeau, the tariff implementation was postponed by a month, which was reflected in the USD/CAD exchange rate chart.
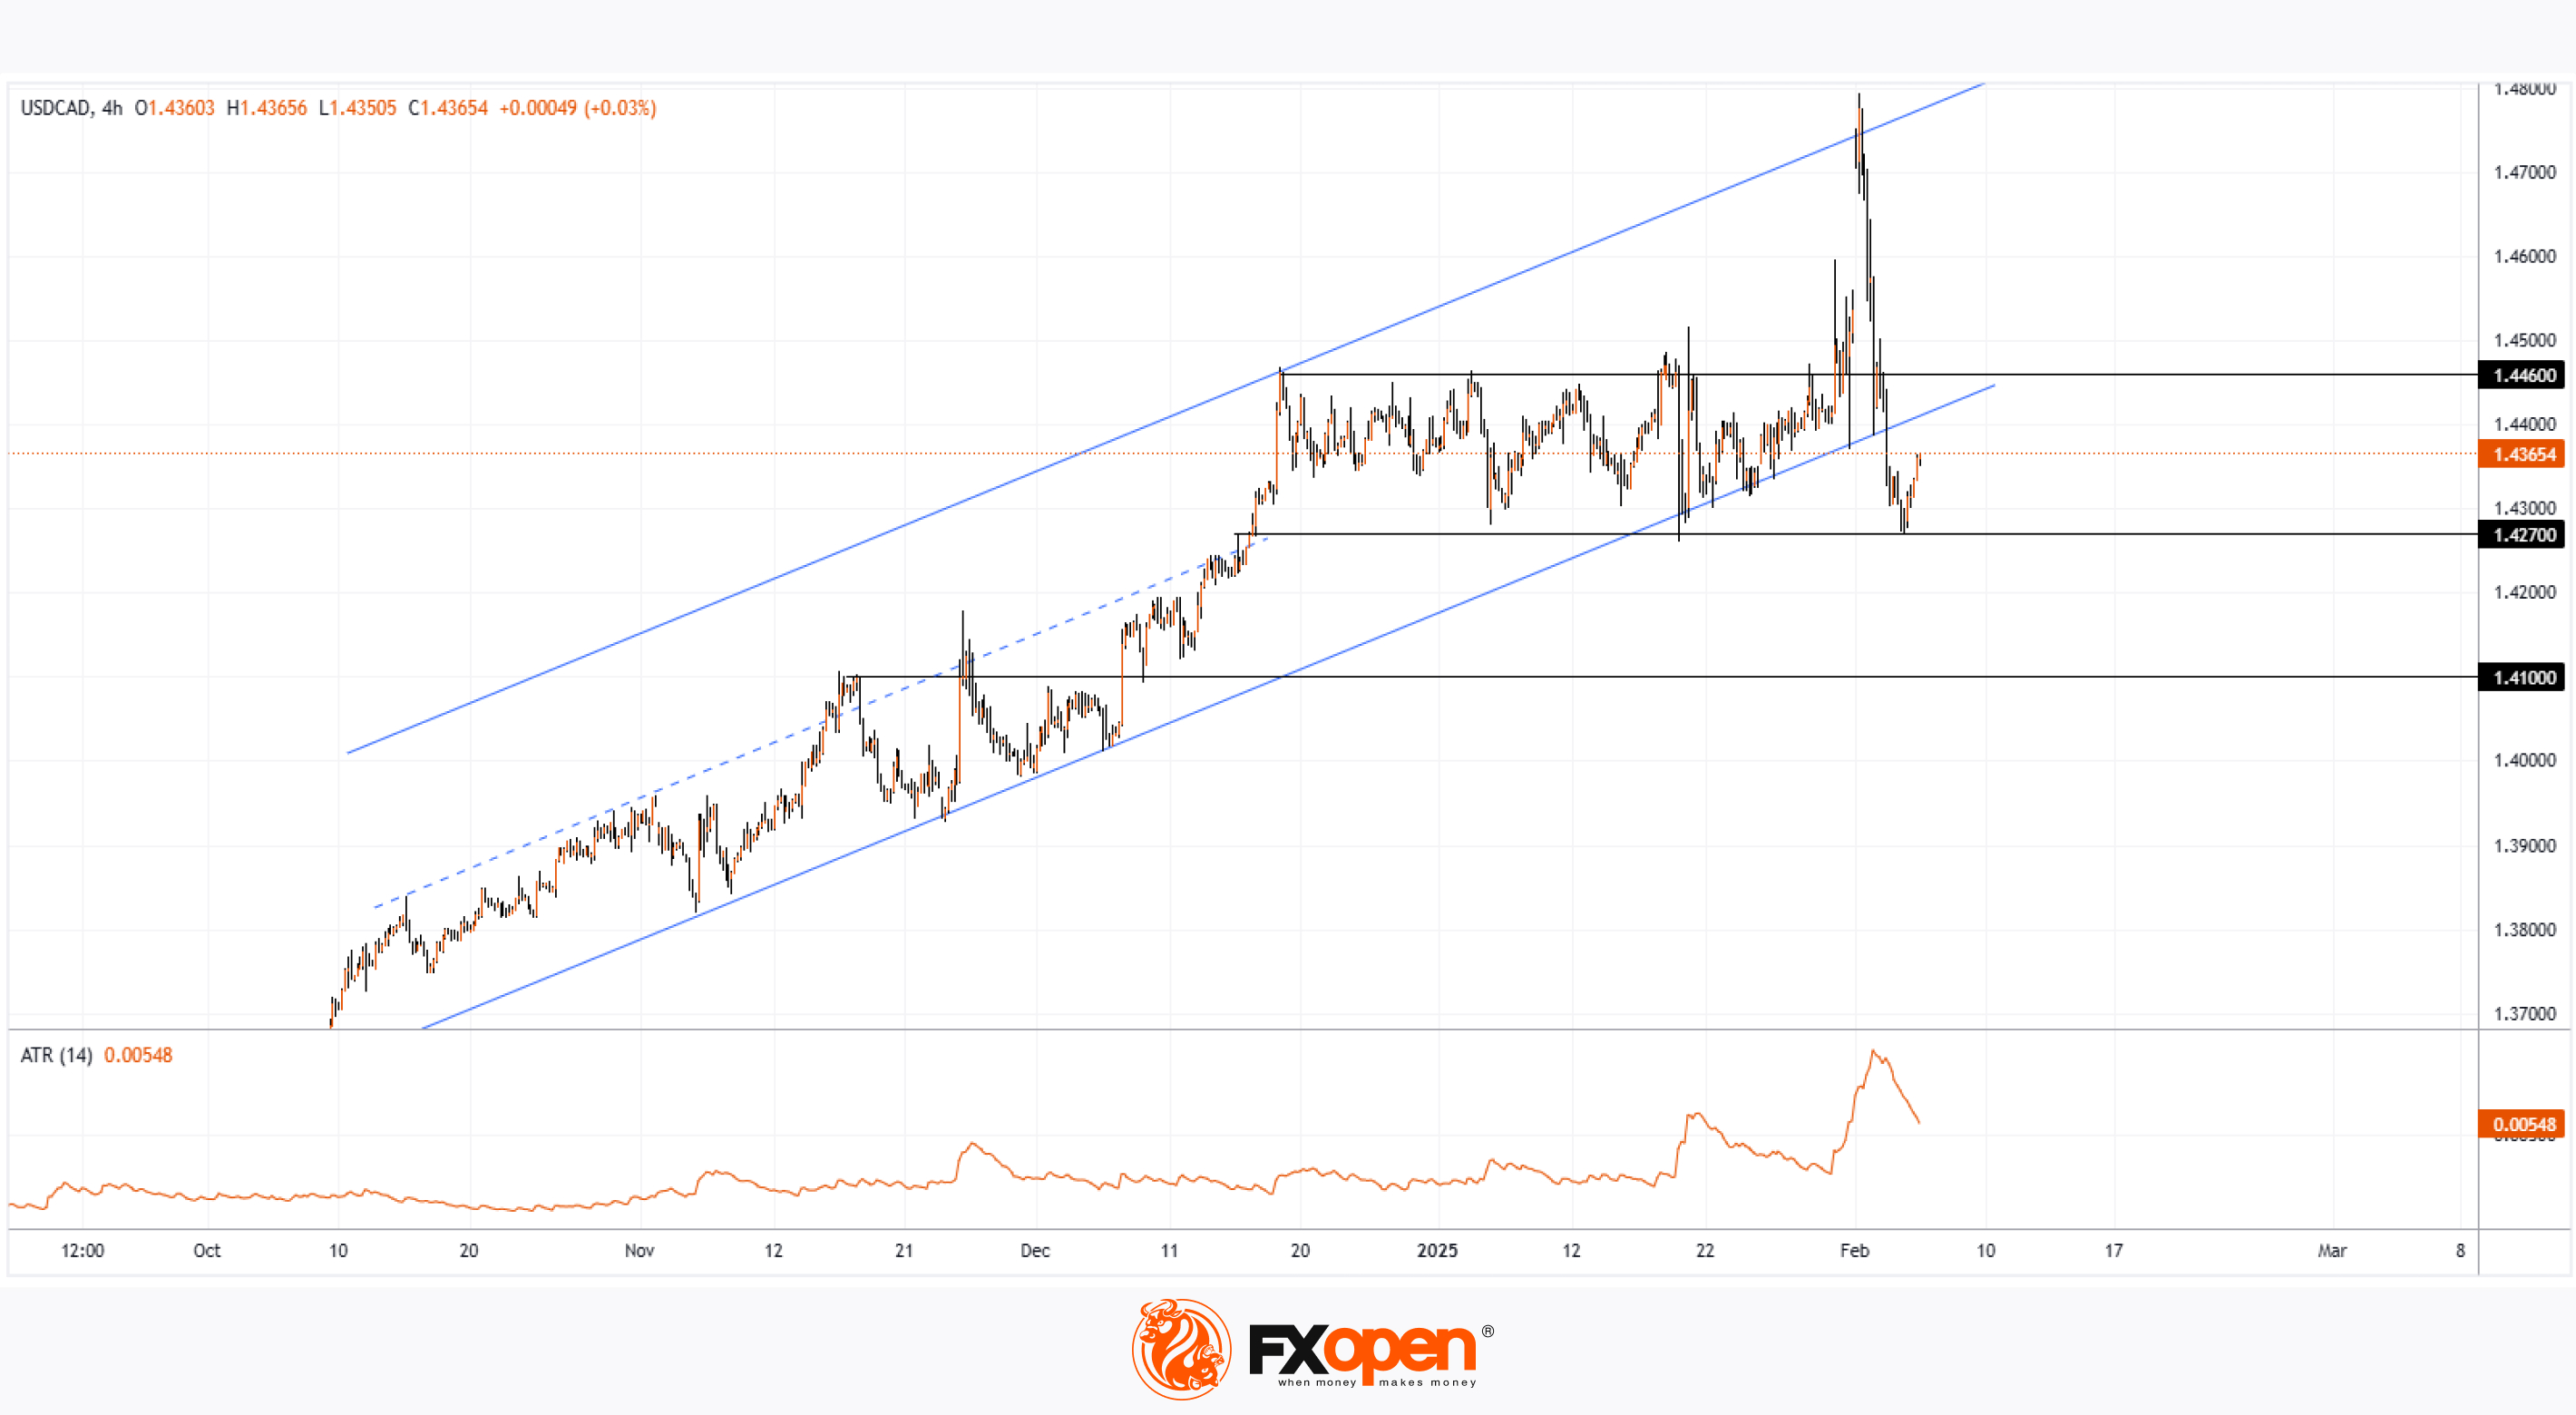
Current USD/CAD Chart Analysis:
→ The price has retreated from the upper boundary of the ascending channel identified three days ago and has now dropped below its lower boundary.
→ The price has returned to and remains within the broad 1.4270 – 1.4460 range.
→ The ATR indicator has reversed from its peak and is trending downward.
Given these factors, it is reasonable to say that USD/CAD is stabilising after recent volatility. But what lies ahead?
The exchange rate may fluctuate within the 1.4270 – 1.4460 range, reacting sensitively to any news on Trump’s tariff policies and his startling suggestion of making Canada the 51st US state.
Trade over 50 forex markets 24 hours a day with FXOpen. Take advantage of low commissions, deep liquidity, and spreads from 0.0 pips. Open your FXOpen account now or learn more about trading forex with FXOpen.
CFDs are complex instruments and come with a high risk of losing your money.
This article represents the opinion of the Companies operating under the FXOpen brand only. It is not to be construed as an offer, solicitation, or recommendation with respect to products and services provided by the Companies operating under the FXOpen brand, nor is it to be considered financial advice.
USD/CAD Exchange Rate Stabilises
As we reported on 3 February, the decision by the US president to impose 25% tariffs on goods imported from Canada sent the USD/CAD rate soaring to a 22-year high.
However, after a round of negotiations between Donald Trump and Justin Trudeau, the tariff implementation was postponed by a month, which was reflected in the USD/CAD exchange rate chart.
Current USD/CAD Chart Analysis:
→ The price has retreated from the upper boundary of the ascending channel identified three days ago and has now dropped below its lower boundary.
→ The price has returned to and remains within the broad 1.4270 – 1.4460 range.
→ The ATR indicator has reversed from its peak and is trending downward.
Given these factors, it is reasonable to say that USD/CAD is stabilising after recent volatility. But what lies ahead?
The exchange rate may fluctuate within the 1.4270 – 1.4460 range, reacting sensitively to any news on Trump’s tariff policies and his startling suggestion of making Canada the 51st US state.
Trade over 50 forex markets 24 hours a day with FXOpen. Take advantage of low commissions, deep liquidity, and spreads from 0.0 pips. Open your FXOpen account now or learn more about trading forex with FXOpen.
CFDs are complex instruments and come with a high risk of losing your money.
This article represents the opinion of the Companies operating under the FXOpen brand only. It is not to be construed as an offer, solicitation, or recommendation with respect to products and services provided by the Companies operating under the FXOpen brand, nor is it to be considered financial advice.
👍2
#stockmarket #stocktrading #investing #MarketUpdates
UPS Share Price Plunges to a 4.5-Year Low
Last week, United Parcel Service (UPS)—one of the world's largest parcel delivery, supply chain management, and courier service companies—released its quarterly report.
→ Earnings per share: Actual = $2.75, Expected = $2.53
→ Total revenue: Actual = $25.4 billion, Expected = $25.3 billion
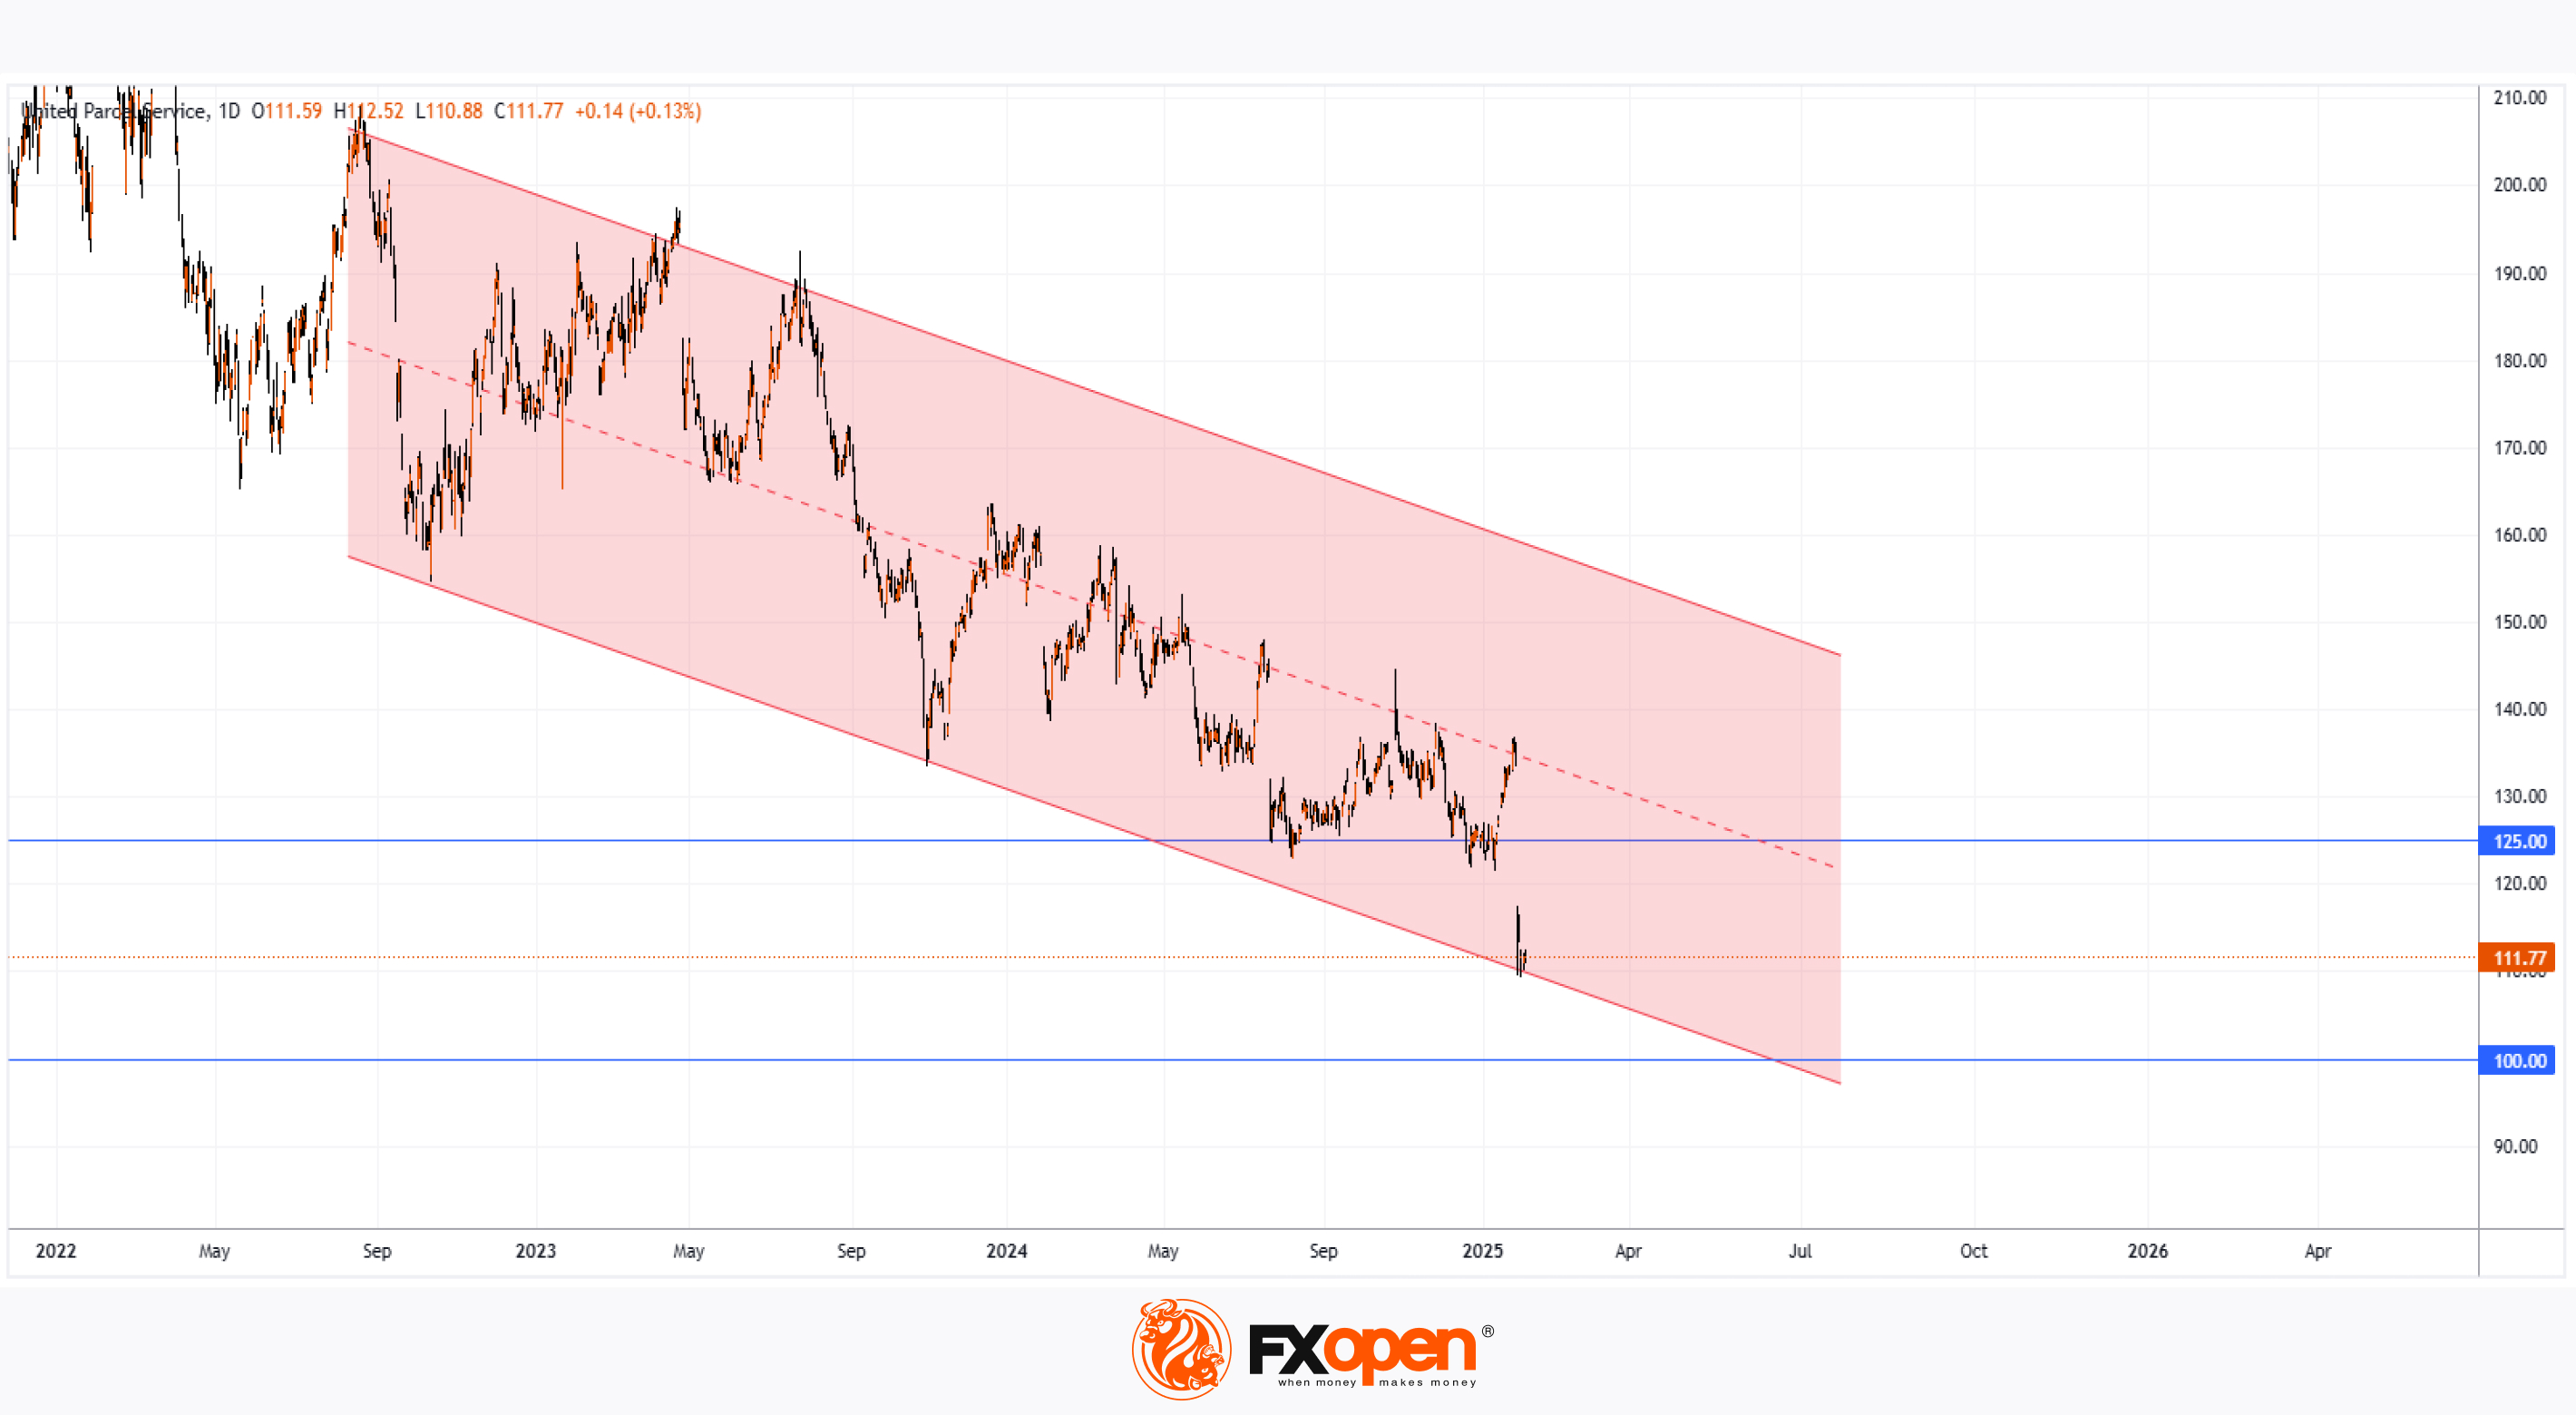
Despite EPS exceeding forecasts by over 8%, UPS shares plunged to $110, a level last seen in mid-2020 when the US economy was recovering from the pandemic.
Investor Disappointment Over Amazon Cutbacks
The stock decline was driven by UPS’s decision to further reduce its business with Amazon. The company stated that its 2025 revenue would be around $6 billion below analysts’ expectations due to halving the volume of Amazon parcels it processes—despite Amazon being its largest customer.
UPS CEO Carol Tomé explained that the company wants to move away from Amazon as profit margins in this segment are too low, negatively impacting overall profitability.
According to The Wall Street Journal (WSJ), UPS management is under pressure from dissatisfied investors, a significant portion of whom are long-serving company employees. Due to UPS's unique shareholder structure, veteran employees—who control 63% of voting rights—have suffered billions in collective losses due to the stock's decline.
Shortly after releasing the report, UPS announced a quarterly dividend increase from $1.63 to $1.64 per share, though this is unlikely to offset the stock’s 40% decline over the past three years.
Technical Analysis of UPS Stock
UPS shares remain in a downward trend (as indicated by the red channel).
Following the latest drop:
→ The price fell below $124, a key resistance level in 2018–2019.
→ The stock reached the lower boundary of the channel, which may act as a support level, preventing a further decline toward the psychological $100 mark.
Is Now the Time to Buy UPS Shares?
Analysts have lowered their UPS price targets:
→ Stephens revised its target from $140 to $127.
→ DA Davidson downgraded UPS from "Buy/Add" to "Neutral", cutting the target from $154 to $116.
→ Redburn Atlantic reduced its target from $159 to $137.
→ Loop Capital revised its target from $120 to $115.
→ Oppenheimer lowered its target from $146 to $126.
From a technical perspective, reversing the multi-month downtrend seems challenging. However, if UPS reconsiders its Amazon strategy under investor pressure, this could provide an opportunity for buyers.
Trade global index CFDs with zero commission and tight spreads. Open your FXOpen account now or learn more about trading index CFDs with FXOpen.
CFDs are complex instruments and come with a high risk of losing your money.
This article represents the opinion of the Companies operating under the FXOpen brand only. It is not to be construed as an offer, solicitation, or recommendation with respect to products and services provided by the Companies operating under the FXOpen brand, nor is it to be considered financial advice.
UPS Share Price Plunges to a 4.5-Year Low
Last week, United Parcel Service (UPS)—one of the world's largest parcel delivery, supply chain management, and courier service companies—released its quarterly report.
→ Earnings per share: Actual = $2.75, Expected = $2.53
→ Total revenue: Actual = $25.4 billion, Expected = $25.3 billion
Despite EPS exceeding forecasts by over 8%, UPS shares plunged to $110, a level last seen in mid-2020 when the US economy was recovering from the pandemic.
Investor Disappointment Over Amazon Cutbacks
The stock decline was driven by UPS’s decision to further reduce its business with Amazon. The company stated that its 2025 revenue would be around $6 billion below analysts’ expectations due to halving the volume of Amazon parcels it processes—despite Amazon being its largest customer.
UPS CEO Carol Tomé explained that the company wants to move away from Amazon as profit margins in this segment are too low, negatively impacting overall profitability.
According to The Wall Street Journal (WSJ), UPS management is under pressure from dissatisfied investors, a significant portion of whom are long-serving company employees. Due to UPS's unique shareholder structure, veteran employees—who control 63% of voting rights—have suffered billions in collective losses due to the stock's decline.
Shortly after releasing the report, UPS announced a quarterly dividend increase from $1.63 to $1.64 per share, though this is unlikely to offset the stock’s 40% decline over the past three years.
Technical Analysis of UPS Stock
UPS shares remain in a downward trend (as indicated by the red channel).
Following the latest drop:
→ The price fell below $124, a key resistance level in 2018–2019.
→ The stock reached the lower boundary of the channel, which may act as a support level, preventing a further decline toward the psychological $100 mark.
Is Now the Time to Buy UPS Shares?
Analysts have lowered their UPS price targets:
→ Stephens revised its target from $140 to $127.
→ DA Davidson downgraded UPS from "Buy/Add" to "Neutral", cutting the target from $154 to $116.
→ Redburn Atlantic reduced its target from $159 to $137.
→ Loop Capital revised its target from $120 to $115.
→ Oppenheimer lowered its target from $146 to $126.
From a technical perspective, reversing the multi-month downtrend seems challenging. However, if UPS reconsiders its Amazon strategy under investor pressure, this could provide an opportunity for buyers.
Trade global index CFDs with zero commission and tight spreads. Open your FXOpen account now or learn more about trading index CFDs with FXOpen.
CFDs are complex instruments and come with a high risk of losing your money.
This article represents the opinion of the Companies operating under the FXOpen brand only. It is not to be construed as an offer, solicitation, or recommendation with respect to products and services provided by the Companies operating under the FXOpen brand, nor is it to be considered financial advice.
👍2
#oilprices #brentoil #MarketUpdates #MarketNews
Crude Oil Price Hits New 2025 Low
As shown on the XBR/USD chart, the price of Brent crude oil dropped to $73.92 yesterday:
→ this marks a new low for 2025;
→ the decline since 15 January exceeds 9%.
Bearish sentiment is being driven by Trump's policies. According to Reuters, the Brent crude price is falling due to:
→ US President Donald Trump’s renewed trade war with China;
→ threats of tariff hikes for other countries;
→ high oil inventory levels in the US;
→ Trump’s promise yesterday to increase US oil production.
Additionally, the US Treasury Department announced yesterday that it was imposing new sanctions on several individuals and tankers involved in delivering millions of barrels of Iranian crude oil to China each year, adding to the volatility of Brent crude prices.
Could the Brent crude price continue to fall?
From a technical analysis perspective of the XBR/USD chart, we can see that the price has dropped to a key support level around $75 per barrel. At this level, bulls had the upper hand, managing to break a major resistance line at the end of 2024. It is possible that bulls remain strong in this price range, and the long lower wick on the candlestick—marked with a blue arrow—supports this idea.
On the other hand, bears appear to be gradually gaining control at increasingly lower levels (as indicated by the red arrows):
→ the $77 level acted as resistance when Brent crude prices moved in February;
→ the $75 level has now shifted from support to resistance.
Given these factors, it is reasonable to assume that supply and demand forces may balance each other out at current levels, leading to signs of consolidation in the Brent crude price chart.
Start trading commodities with tight spreads. Open your trading account now or learn more about trading commodity CFDs with FXOpen.
CFDs are complex instruments and come with a high risk of losing your money.
This article represents the opinion of the Companies operating under the FXOpen brand only. It is not to be construed as an offer, solicitation, or recommendation with respect to products and services provided by the Companies operating under the FXOpen brand, nor is it to be considered financial advice.
Crude Oil Price Hits New 2025 Low
As shown on the XBR/USD chart, the price of Brent crude oil dropped to $73.92 yesterday:
→ this marks a new low for 2025;
→ the decline since 15 January exceeds 9%.
Bearish sentiment is being driven by Trump's policies. According to Reuters, the Brent crude price is falling due to:
→ US President Donald Trump’s renewed trade war with China;
→ threats of tariff hikes for other countries;
→ high oil inventory levels in the US;
→ Trump’s promise yesterday to increase US oil production.
Additionally, the US Treasury Department announced yesterday that it was imposing new sanctions on several individuals and tankers involved in delivering millions of barrels of Iranian crude oil to China each year, adding to the volatility of Brent crude prices.
Could the Brent crude price continue to fall?
From a technical analysis perspective of the XBR/USD chart, we can see that the price has dropped to a key support level around $75 per barrel. At this level, bulls had the upper hand, managing to break a major resistance line at the end of 2024. It is possible that bulls remain strong in this price range, and the long lower wick on the candlestick—marked with a blue arrow—supports this idea.
On the other hand, bears appear to be gradually gaining control at increasingly lower levels (as indicated by the red arrows):
→ the $77 level acted as resistance when Brent crude prices moved in February;
→ the $75 level has now shifted from support to resistance.
Given these factors, it is reasonable to assume that supply and demand forces may balance each other out at current levels, leading to signs of consolidation in the Brent crude price chart.
Start trading commodities with tight spreads. Open your trading account now or learn more about trading commodity CFDs with FXOpen.
CFDs are complex instruments and come with a high risk of losing your money.
This article represents the opinion of the Companies operating under the FXOpen brand only. It is not to be construed as an offer, solicitation, or recommendation with respect to products and services provided by the Companies operating under the FXOpen brand, nor is it to be considered financial advice.

👍3
#stockmarket #stocktrading #MarketUpdates #marketanalysis
Ford (F) Share Price Drops to a 4-Year Low
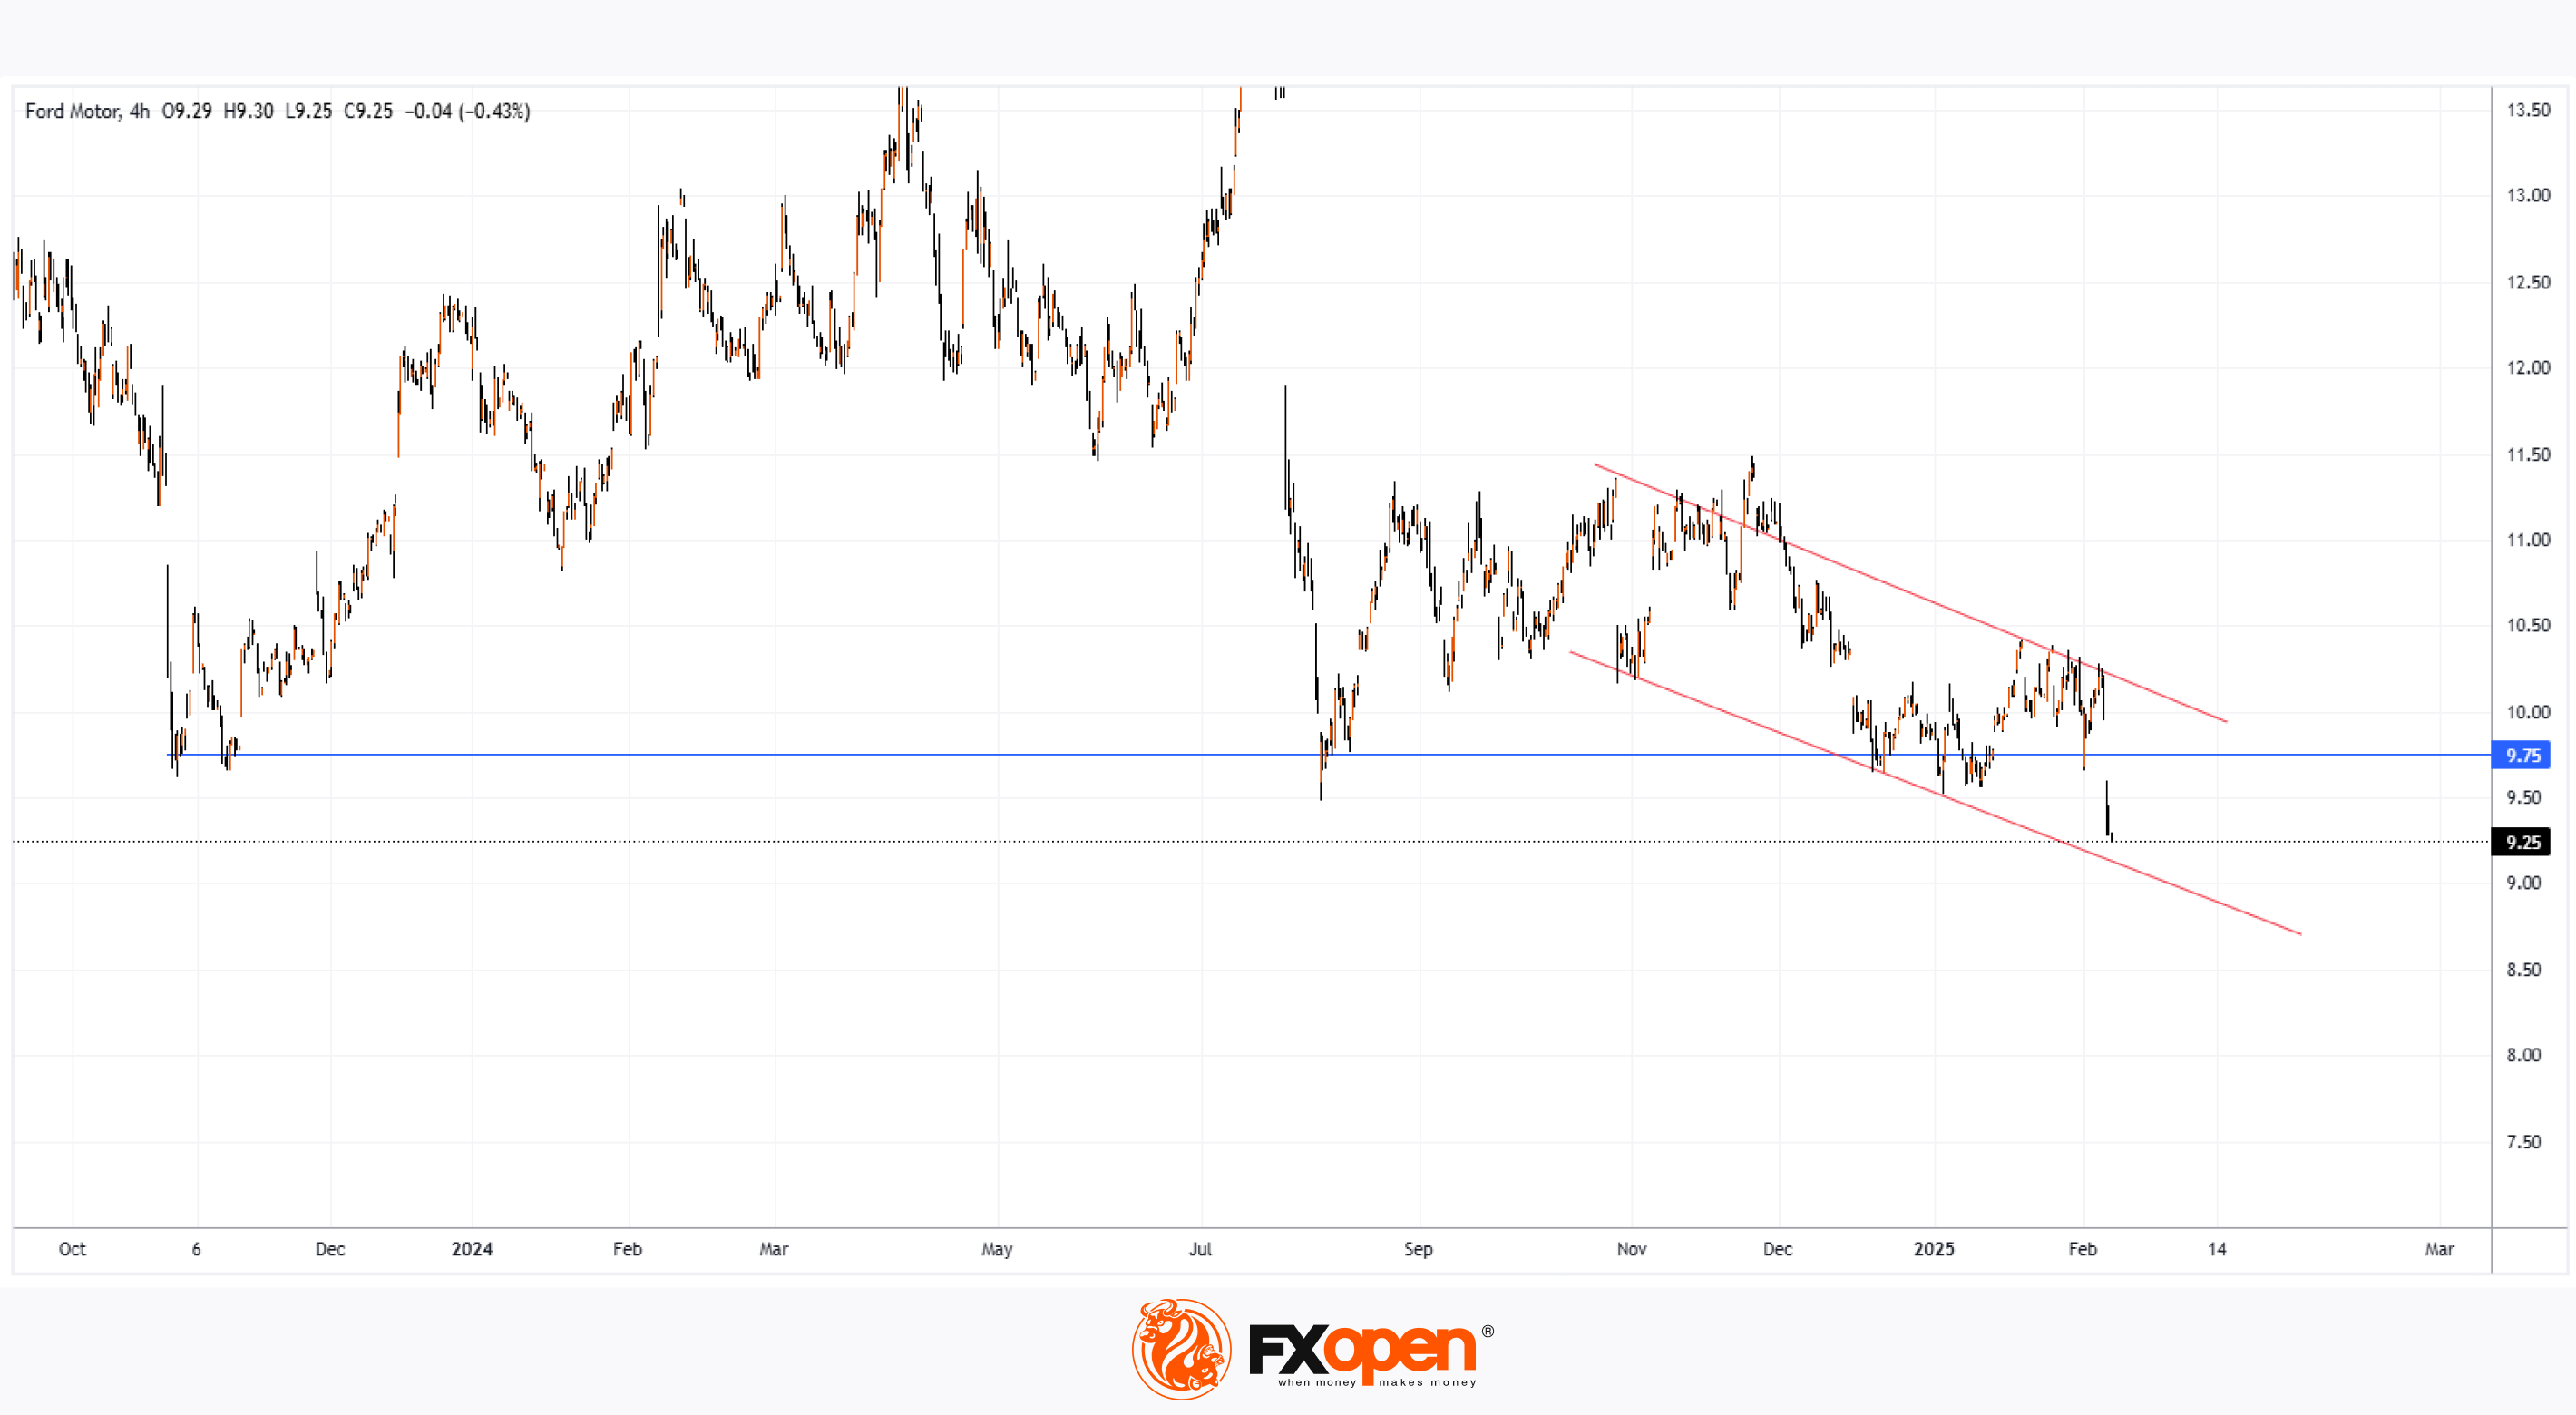
As shown by the Ford (F) share price chart today, the price has fallen to $9.25 – its lowest level since early 2021.
This drop occurred following the publication of the quarterly earnings report on 5 February:
→ Earnings per share: Actual = $0.39, Expected = $0.34;
→ Gross revenue: Actual = $48.2bn, Expected = $47.4bn.
Despite the report exceeding expectations, investors were disappointed by the company’s weak forecasts for 2025.
The decline in Ford’s share price was further exacerbated when on 6 February, S&P Global Ratings announced that, according to their analysts:
→ Progress on cost reduction is slower than expected;
→ Price pressures are rising, and labour costs remain high;
→ Ford Motor Co.’s margin growth will be limited until 2026.
As a result, S&P revised its outlook for Ford’s debt rating from stable to negative, citing "weaker-than-expected profitability prospects."
Technical Analysis of Ford (F) Share Price Chart
A key focus is the $9.75 level, which acted as support in 2023 and 2024, preventing the bears from pushing the price below the psychological $10 per share mark.
However, the recent price drop with a large bearish gap seems to have changed the situation, and now the $9.75 level may switch from support to resistance.
This suggests that the Ford (F) share price could continue to develop within the emerging (as shown by the red lines) descending channel.
Should You Buy Ford (F) Shares?
Analysts are cautious in their assessments. According to TipRanks:
→ Only 2 out of 12 analysts recommend buying Ford (F) shares;
→ The average 12-month price target for Ford (F) shares is $10.52.
However, the “Trump factor” should not be overlooked. The newly elected president could significantly alter the situation for the iconic US automaker, potentially by imposing tariffs on imports from other countries. The implementation of the economic support measures promised by Trump during his campaign may prove effective and support Ford’s share price in the coming years.
Trade global index CFDs with zero commission and tight spreads. Open your FXOpen account now or learn more about trading index CFDs with FXOpen.
CFDs are complex instruments and come with a high risk of losing your money.
This article represents the opinion of the Companies operating under the FXOpen brand only. It is not to be construed as an offer, solicitation, or recommendation with respect to products and services provided by the Companies operating under the FXOpen brand, nor is it to be considered financial advice.
Ford (F) Share Price Drops to a 4-Year Low
As shown by the Ford (F) share price chart today, the price has fallen to $9.25 – its lowest level since early 2021.
This drop occurred following the publication of the quarterly earnings report on 5 February:
→ Earnings per share: Actual = $0.39, Expected = $0.34;
→ Gross revenue: Actual = $48.2bn, Expected = $47.4bn.
Despite the report exceeding expectations, investors were disappointed by the company’s weak forecasts for 2025.
The decline in Ford’s share price was further exacerbated when on 6 February, S&P Global Ratings announced that, according to their analysts:
→ Progress on cost reduction is slower than expected;
→ Price pressures are rising, and labour costs remain high;
→ Ford Motor Co.’s margin growth will be limited until 2026.
As a result, S&P revised its outlook for Ford’s debt rating from stable to negative, citing "weaker-than-expected profitability prospects."
Technical Analysis of Ford (F) Share Price Chart
A key focus is the $9.75 level, which acted as support in 2023 and 2024, preventing the bears from pushing the price below the psychological $10 per share mark.
However, the recent price drop with a large bearish gap seems to have changed the situation, and now the $9.75 level may switch from support to resistance.
This suggests that the Ford (F) share price could continue to develop within the emerging (as shown by the red lines) descending channel.
Should You Buy Ford (F) Shares?
Analysts are cautious in their assessments. According to TipRanks:
→ Only 2 out of 12 analysts recommend buying Ford (F) shares;
→ The average 12-month price target for Ford (F) shares is $10.52.
However, the “Trump factor” should not be overlooked. The newly elected president could significantly alter the situation for the iconic US automaker, potentially by imposing tariffs on imports from other countries. The implementation of the economic support measures promised by Trump during his campaign may prove effective and support Ford’s share price in the coming years.
Trade global index CFDs with zero commission and tight spreads. Open your FXOpen account now or learn more about trading index CFDs with FXOpen.
CFDs are complex instruments and come with a high risk of losing your money.
This article represents the opinion of the Companies operating under the FXOpen brand only. It is not to be construed as an offer, solicitation, or recommendation with respect to products and services provided by the Companies operating under the FXOpen brand, nor is it to be considered financial advice.
👍3
#stockmarket #stocktrading #MarketUpdates #marketanalysis
Hang Seng Index Hits Four-Month High Amid DeepSeek’s Success
As shown in the Hang Seng (Hong Kong 50 on FXOpen) chart today, the index has risen above the 21,500 mark for the first time since October 2024.
According to Reuters, bullish sentiment is fuelled by optimism surrounding the success of the DeepSeek startup. Leading gainers include tech stocks:
→ Chipmaker Cambricon Technologies surged 6.2%;
→ AI firm CloudWalk Technology hit the 20% upper limit;
→ Major telecom operators China Mobile, China Unicom, and China Telecom also saw gains after announcing their collaboration with DeepSeek’s open-source model to "promote the inclusive adoption of cutting-edge AI technologies."
Analysts at China Securities believe the uptrend could persist until the second half of March.
Technical Analysis of the Hang Seng Chart
Applying Fibonacci retracement levels using the August low (A) and the October 2024 high (B), we can see how these levels acted as temporary support (marked with arrows) as the price retraced to the January low (C).
In the most optimistic scenario:
→ The rally over the past three weeks may signal the resumption of the A→B uptrend;
→ Based on Fibonacci proportions, bulls may target the 1.618 extension of the initial move, implying a potential price level 61.8% higher than the previous peak.
This suggests a possible target around 25,520, though this appears somewhat ambitious for the Hang Seng (Hong Kong 50 on FXOpen) given:
→ Rising inflation in China—today’s data shows the annual CPI climbed from 0.1% (previous reading) to 0.5%;
→ The prospect of escalating tariff tensions with the US after China retaliated against Trump’s 10% tariffs on Chinese imports.
Trade global index CFDs with zero commission and tight spreads. Open your FXOpen account now or learn more about trading index CFDs with FXOpen.
CFDs are complex instruments and come with a high risk of losing your money.
This article represents the opinion of the Companies operating under the FXOpen brand only. It is not to be construed as an offer, solicitation, or recommendation with respect to products and services provided by the Companies operating under the FXOpen brand, nor is it to be considered financial advice.
Hang Seng Index Hits Four-Month High Amid DeepSeek’s Success
As shown in the Hang Seng (Hong Kong 50 on FXOpen) chart today, the index has risen above the 21,500 mark for the first time since October 2024.
According to Reuters, bullish sentiment is fuelled by optimism surrounding the success of the DeepSeek startup. Leading gainers include tech stocks:
→ Chipmaker Cambricon Technologies surged 6.2%;
→ AI firm CloudWalk Technology hit the 20% upper limit;
→ Major telecom operators China Mobile, China Unicom, and China Telecom also saw gains after announcing their collaboration with DeepSeek’s open-source model to "promote the inclusive adoption of cutting-edge AI technologies."
Analysts at China Securities believe the uptrend could persist until the second half of March.
Technical Analysis of the Hang Seng Chart
Applying Fibonacci retracement levels using the August low (A) and the October 2024 high (B), we can see how these levels acted as temporary support (marked with arrows) as the price retraced to the January low (C).
In the most optimistic scenario:
→ The rally over the past three weeks may signal the resumption of the A→B uptrend;
→ Based on Fibonacci proportions, bulls may target the 1.618 extension of the initial move, implying a potential price level 61.8% higher than the previous peak.
This suggests a possible target around 25,520, though this appears somewhat ambitious for the Hang Seng (Hong Kong 50 on FXOpen) given:
→ Rising inflation in China—today’s data shows the annual CPI climbed from 0.1% (previous reading) to 0.5%;
→ The prospect of escalating tariff tensions with the US after China retaliated against Trump’s 10% tariffs on Chinese imports.
Trade global index CFDs with zero commission and tight spreads. Open your FXOpen account now or learn more about trading index CFDs with FXOpen.
CFDs are complex instruments and come with a high risk of losing your money.
This article represents the opinion of the Companies operating under the FXOpen brand only. It is not to be construed as an offer, solicitation, or recommendation with respect to products and services provided by the Companies operating under the FXOpen brand, nor is it to be considered financial advice.

👍3
#AMZN #stockmarket #stocktrading #MarketUpdates
Amazon (AMZN) Shares Retreat from All-Time High After Earnings Report
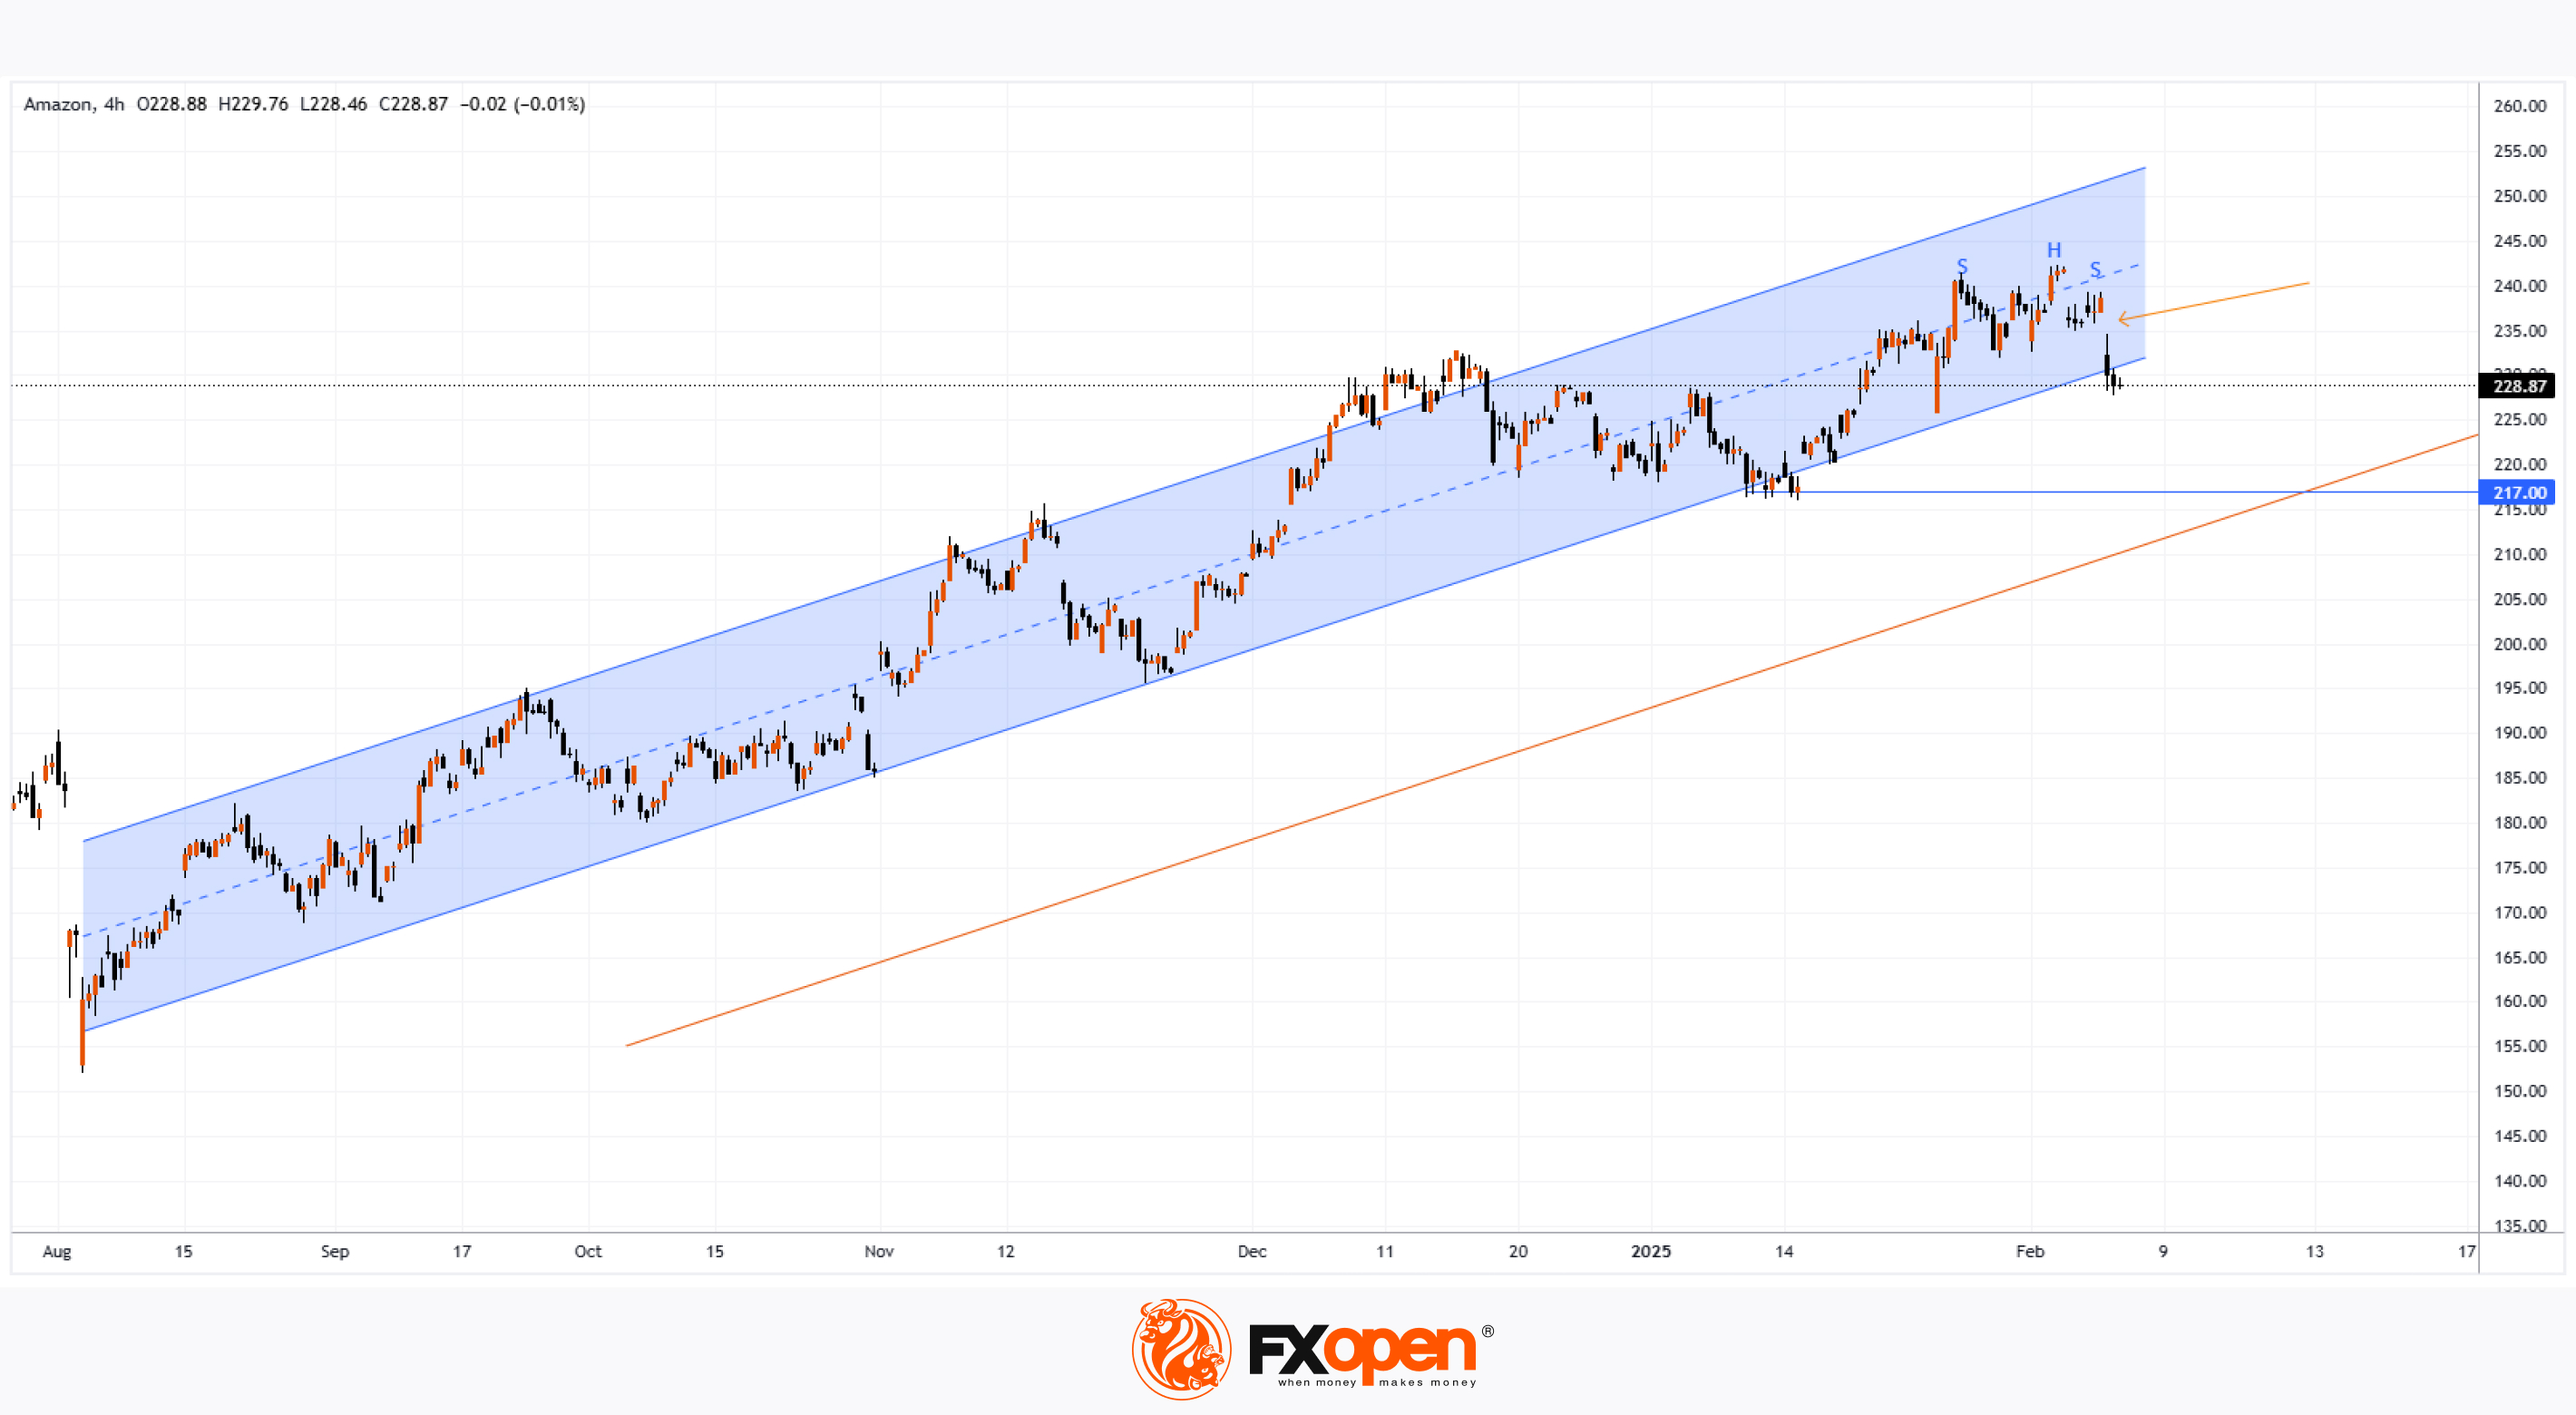
As shown in the Amazon (AMZN) stock chart, the price reached an all-time high of around $242 per share on 4 February. However, following the earnings report on 6 December, AMZN shares declined despite the company exceeding analysts' expectations:
→ Earnings per share: Actual = $1.86, Forecast = $1.48
→ Revenue: Actual = $187.8bn, Forecast = $187.3bn
Investor disappointment may have stemmed from:
→ Signs of slowing cloud business growth. Amazon, a pioneer in public cloud services with Amazon Web Services (AWS), now reports annual cloud revenue growth of around 20%, down from over 50% five years ago.
→ Soaring capital expenditure on AI data centres with uncertain profitability prospects. Amazon has projected approximately $105bn in capital spending for 2025, up 27% from 2024 and 57% from 2023.
Technical Analysis of Amazon (AMZN) Stock
AMZN remains within an upward trend, indicated by the blue channel on the chart. However, bullish momentum appears vulnerable as:
→ The price struggles to reach the upper boundary of the channel.
→ A bearish "head and shoulders" (SHS) pattern is visible on the chart.
→ A bearish gap (marked with an arrow) has formed post-earnings, suggesting a potential resistance area ahead.
This points to a possible pullback. If it occurs, AMZN stock could correct, potentially towards the parallel orange line, drawn based on the blue channel’s width. A test of the $217 support level is also possible.
Should You Buy AMZN Shares Now?
Following the earnings report, AMZN has underperformed the S&P 500 (US SPX 500 mini on FXOpen). However, analysts remain optimistic. According to TipRanks:
→ 45 out of 46 analysts recommend buying AMZN stock.
→ The average 12-month price target for AMZN is $267.
Trade global index CFDs with zero commission and tight spreads. Open your FXOpen account now or learn more about trading index CFDs with FXOpen.
CFDs are complex instruments and come with a high risk of losing your money.
This article represents the opinion of the Companies operating under the FXOpen brand only. It is not to be construed as an offer, solicitation, or recommendation with respect to products and services provided by the Companies operating under the FXOpen brand, nor is it to be considered financial advice.
Amazon (AMZN) Shares Retreat from All-Time High After Earnings Report
As shown in the Amazon (AMZN) stock chart, the price reached an all-time high of around $242 per share on 4 February. However, following the earnings report on 6 December, AMZN shares declined despite the company exceeding analysts' expectations:
→ Earnings per share: Actual = $1.86, Forecast = $1.48
→ Revenue: Actual = $187.8bn, Forecast = $187.3bn
Investor disappointment may have stemmed from:
→ Signs of slowing cloud business growth. Amazon, a pioneer in public cloud services with Amazon Web Services (AWS), now reports annual cloud revenue growth of around 20%, down from over 50% five years ago.
→ Soaring capital expenditure on AI data centres with uncertain profitability prospects. Amazon has projected approximately $105bn in capital spending for 2025, up 27% from 2024 and 57% from 2023.
Technical Analysis of Amazon (AMZN) Stock
AMZN remains within an upward trend, indicated by the blue channel on the chart. However, bullish momentum appears vulnerable as:
→ The price struggles to reach the upper boundary of the channel.
→ A bearish "head and shoulders" (SHS) pattern is visible on the chart.
→ A bearish gap (marked with an arrow) has formed post-earnings, suggesting a potential resistance area ahead.
This points to a possible pullback. If it occurs, AMZN stock could correct, potentially towards the parallel orange line, drawn based on the blue channel’s width. A test of the $217 support level is also possible.
Should You Buy AMZN Shares Now?
Following the earnings report, AMZN has underperformed the S&P 500 (US SPX 500 mini on FXOpen). However, analysts remain optimistic. According to TipRanks:
→ 45 out of 46 analysts recommend buying AMZN stock.
→ The average 12-month price target for AMZN is $267.
Trade global index CFDs with zero commission and tight spreads. Open your FXOpen account now or learn more about trading index CFDs with FXOpen.
CFDs are complex instruments and come with a high risk of losing your money.
This article represents the opinion of the Companies operating under the FXOpen brand only. It is not to be construed as an offer, solicitation, or recommendation with respect to products and services provided by the Companies operating under the FXOpen brand, nor is it to be considered financial advice.
👍3
#stockmarket #stocktrading #GOOGL #MarketUpdates
Should You Buy Alphabet (GOOGL) Stock After a 10% Drop?
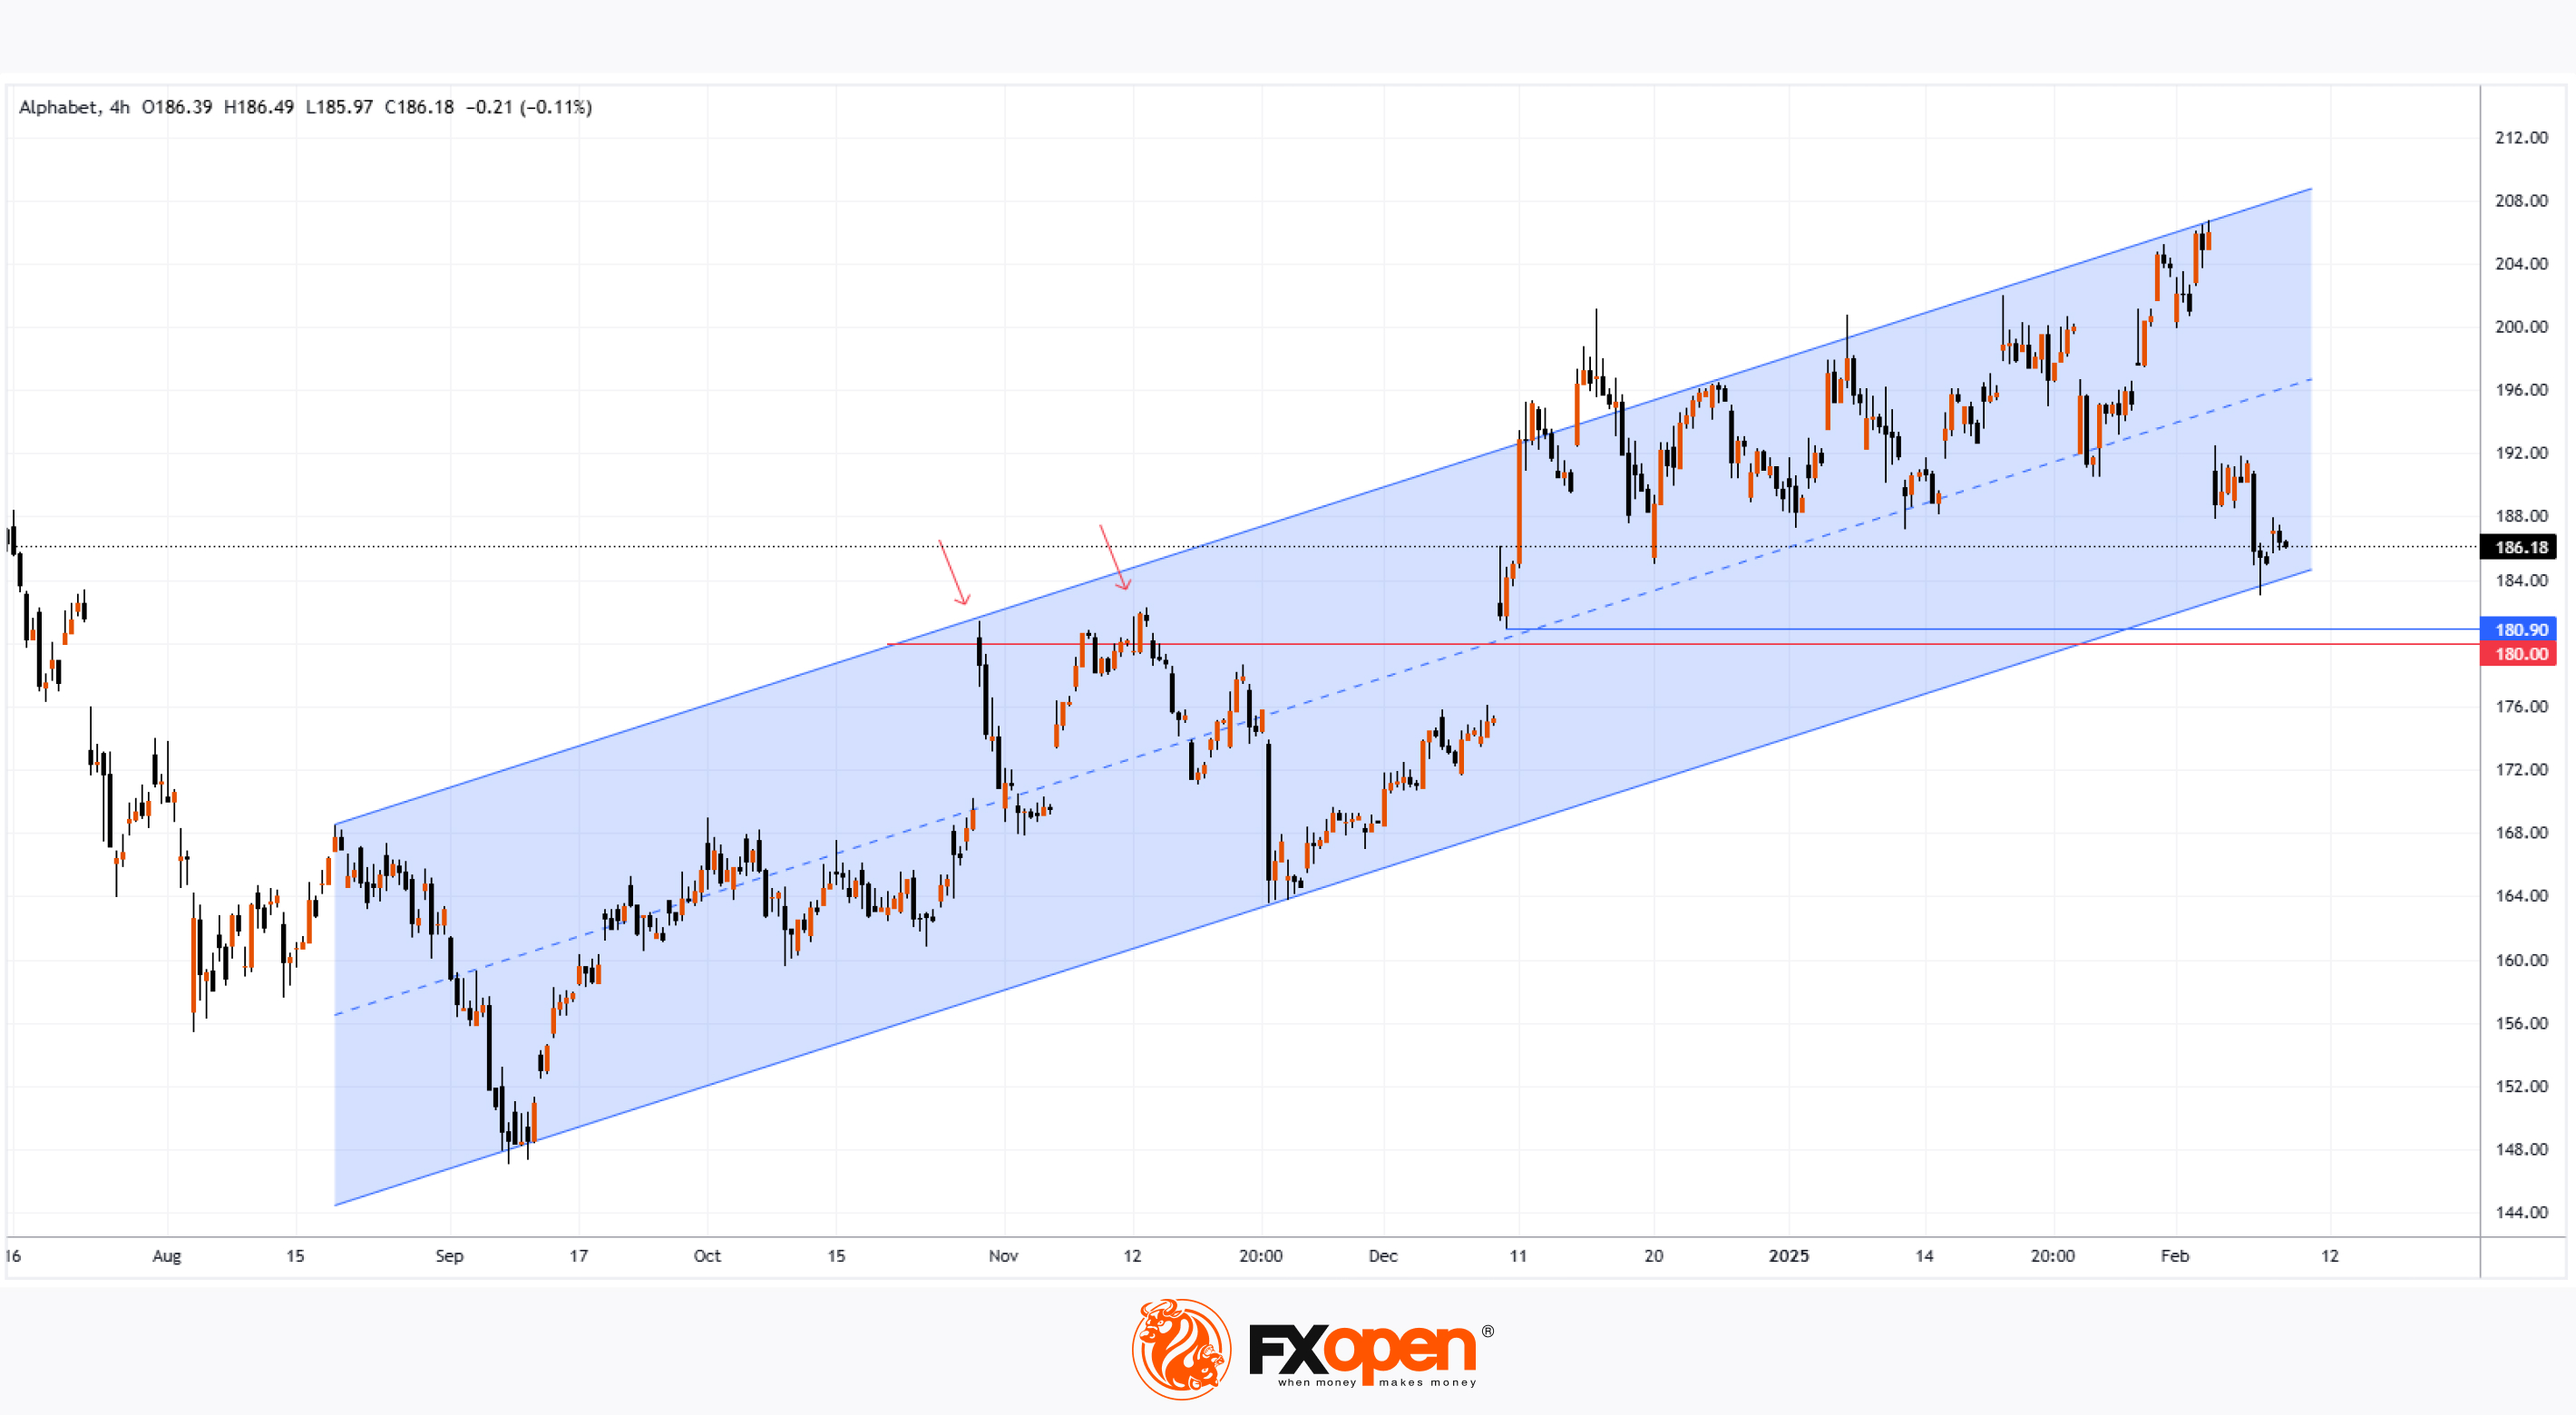
As the stock chart for Alphabet (GOOGL) shows, on 4 February, the share price reached a historic high above $205. However, despite surpassing analysts’ expectations, GOOGL shares dropped sharply after the earnings report was released:
→ Earnings per share: actual = $2.15, forecast = $2.12
→ Gross revenue: actual = $187.8 billion, forecast = $187.3 billion
As a result, GOOGL's current price is approximately 10% below its all-time high. Market sentiment may have turned negative due to several factors:
→ Cloud revenue fell short of expectations, raising concerns about Alphabet’s ability to compete in the rapidly evolving AI sector.
→ Weaker-than-expected advertising revenue from Google, Alphabet’s core business. While advertising revenue grew by 10.6% to $72.46 billion in Q4 2024, analysts had anticipated a 12% increase.
→ Alphabet announced plans to significantly increase capital expenditures next year to around $75 billion, prompting questions about the impact on depreciation and profitability.
Additionally, news that China has launched an antitrust investigation into Alphabet—potentially in response to tariffs imposed on Chinese goods by the Trump administration—may have weighed on the stock price.
Technical Analysis of Alphabet (GOOGL)
GOOGL remains within an upward trend channel (marked in blue on the chart), with the price having pulled back to key support levels, including:
→ The lower boundary of this trend channel
→ The $180.90 level, marking the top of the bullish gap from 10 December
→ The psychological level of $180, which acted as resistance in late 2024 (indicated by arrows)
This suggests that the downward momentum caused by the earnings report could slow down or even reverse, meaning the current price action may be a pullback within the prevailing uptrend.
Should You Buy GOOGL Stock Now?
According to a report from The Smart Investor via Yahoo, investors should not be overly concerned, as:
→ Alphabet's strong cash flow will allow it to fund its planned $75 billion in capital investments without issue.
→ The company’s leadership stated that demand for its AI-driven products currently exceeds supply.
Meanwhile, analysts surveyed by TipRanks believe Alphabet can overcome its challenges:
→ 27 out of 37 analysts recommend buying GOOGL, with none advising to sell.
→ The 12-month average price target for GOOGL is $215.85.
Overall, while short-term volatility remains, long-term prospects for Alphabet appear solid. Investors with a longer time horizon may see this dip as a buying opportunity.
Trade global index CFDs with zero commission and tight spreads. Open your FXOpen account now or learn more about trading index CFDs with FXOpen.
CFDs are complex instruments and come with a high risk of losing your money.
This article represents the opinion of the Companies operating under the FXOpen brand only. It is not to be construed as an offer, solicitation, or recommendation with respect to products and services provided by the Companies operating under the FXOpen brand, nor is it to be considered financial advice.
Should You Buy Alphabet (GOOGL) Stock After a 10% Drop?
As the stock chart for Alphabet (GOOGL) shows, on 4 February, the share price reached a historic high above $205. However, despite surpassing analysts’ expectations, GOOGL shares dropped sharply after the earnings report was released:
→ Earnings per share: actual = $2.15, forecast = $2.12
→ Gross revenue: actual = $187.8 billion, forecast = $187.3 billion
As a result, GOOGL's current price is approximately 10% below its all-time high. Market sentiment may have turned negative due to several factors:
→ Cloud revenue fell short of expectations, raising concerns about Alphabet’s ability to compete in the rapidly evolving AI sector.
→ Weaker-than-expected advertising revenue from Google, Alphabet’s core business. While advertising revenue grew by 10.6% to $72.46 billion in Q4 2024, analysts had anticipated a 12% increase.
→ Alphabet announced plans to significantly increase capital expenditures next year to around $75 billion, prompting questions about the impact on depreciation and profitability.
Additionally, news that China has launched an antitrust investigation into Alphabet—potentially in response to tariffs imposed on Chinese goods by the Trump administration—may have weighed on the stock price.
Technical Analysis of Alphabet (GOOGL)
GOOGL remains within an upward trend channel (marked in blue on the chart), with the price having pulled back to key support levels, including:
→ The lower boundary of this trend channel
→ The $180.90 level, marking the top of the bullish gap from 10 December
→ The psychological level of $180, which acted as resistance in late 2024 (indicated by arrows)
This suggests that the downward momentum caused by the earnings report could slow down or even reverse, meaning the current price action may be a pullback within the prevailing uptrend.
Should You Buy GOOGL Stock Now?
According to a report from The Smart Investor via Yahoo, investors should not be overly concerned, as:
→ Alphabet's strong cash flow will allow it to fund its planned $75 billion in capital investments without issue.
→ The company’s leadership stated that demand for its AI-driven products currently exceeds supply.
Meanwhile, analysts surveyed by TipRanks believe Alphabet can overcome its challenges:
→ 27 out of 37 analysts recommend buying GOOGL, with none advising to sell.
→ The 12-month average price target for GOOGL is $215.85.
Overall, while short-term volatility remains, long-term prospects for Alphabet appear solid. Investors with a longer time horizon may see this dip as a buying opportunity.
Trade global index CFDs with zero commission and tight spreads. Open your FXOpen account now or learn more about trading index CFDs with FXOpen.
CFDs are complex instruments and come with a high risk of losing your money.
This article represents the opinion of the Companies operating under the FXOpen brand only. It is not to be construed as an offer, solicitation, or recommendation with respect to products and services provided by the Companies operating under the FXOpen brand, nor is it to be considered financial advice.
👍4
#stockmarket #stocktrading #marketanalysis #MarketUpdates
Coca-Cola (KO) Stock Surges Nearly 5% in a Day
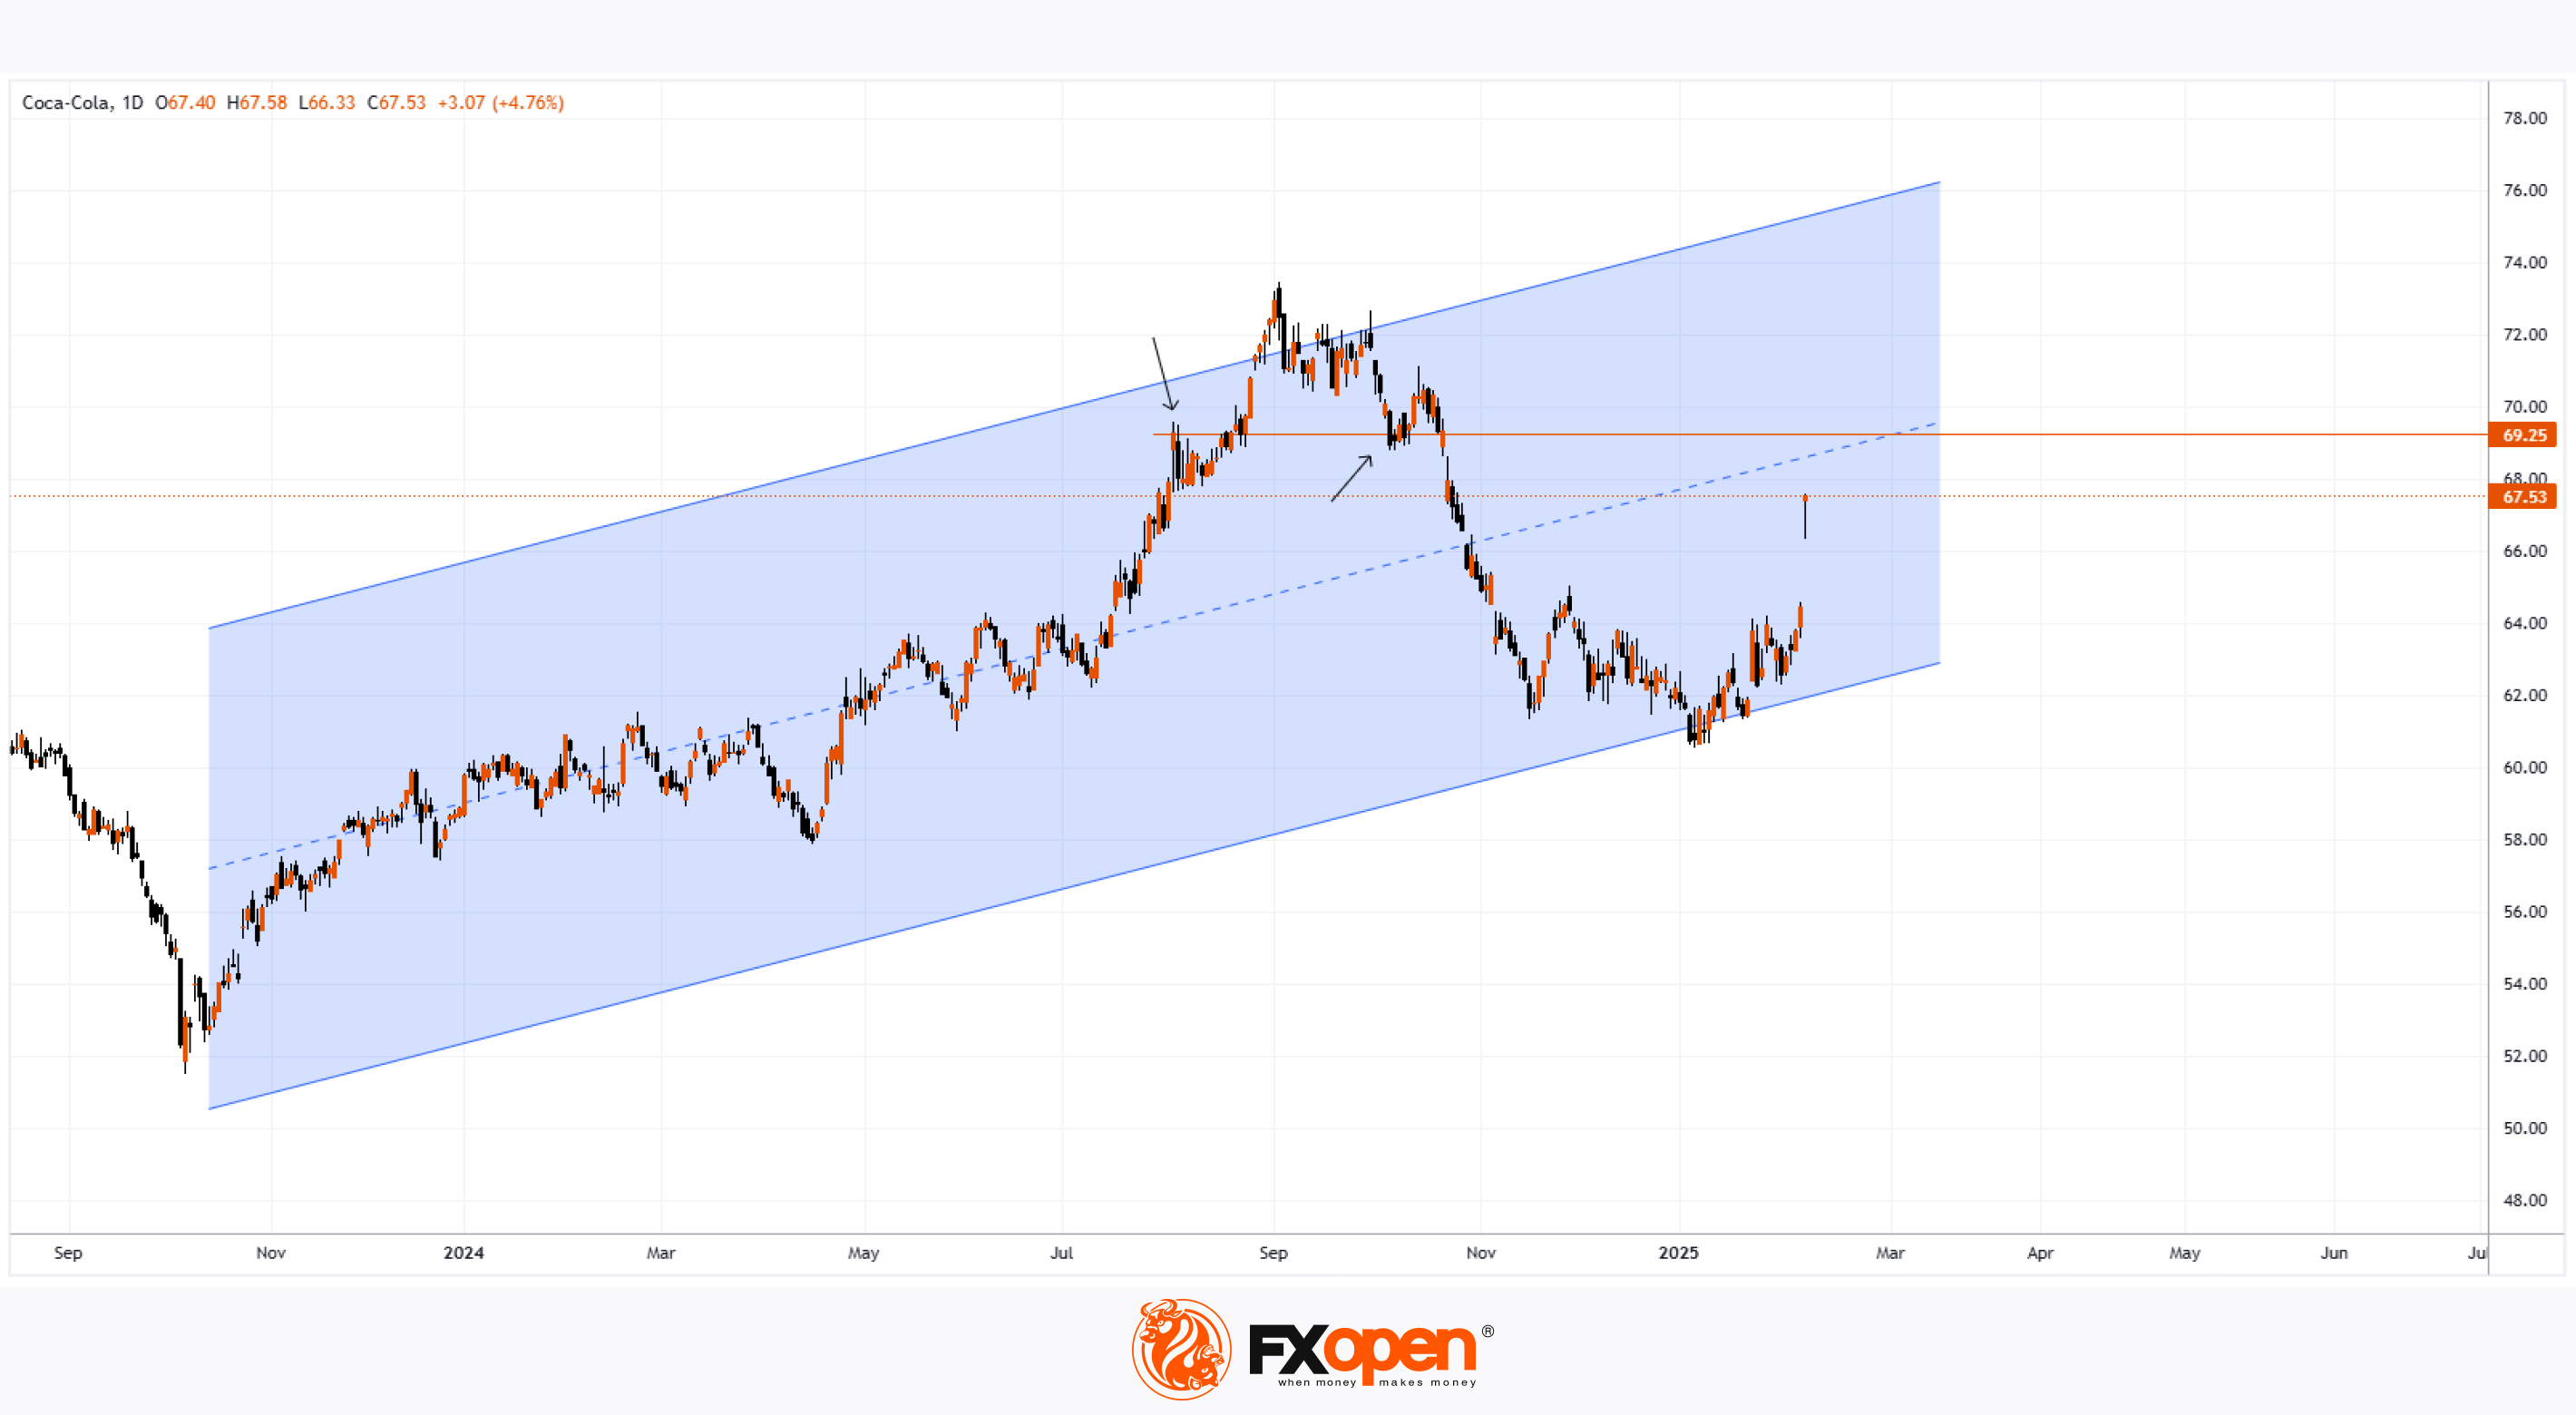
Yesterday, shares of The Coca-Cola Company (KO) saw a significant rally, climbing nearly 5% and reaching a yearly high above $67. The last time KO stock traded at this level was in late October 2024. Investor optimism was fueled by the release of the company’s Q4 financial report, which exceeded expectations:
→ Reported earnings per share: $0.55 vs. expected $0.52
→ Gross revenue: $11.5 billion vs. forecasted $10.7 billion
Additionally, Coca-Cola announced:
→ A substantial market share increase in the non-alcoholic beverage sector and $10.8 billion in free cash flow.
→ Projections for 5–6% organic revenue growth in 2025, highlighting the company’s resilience amid economic uncertainty.
Technical Analysis of Coca-Cola (KO) Stock
At yesterday’s market open, KO formed a large bullish gap, which may act as future support. Meanwhile, price extremes outline an ascending channel pattern.
If optimism persists:
→ The price may move towards the channel median, where supply and demand tend to balance (similar to early 2025).
→ Bears might become active around $69.25, a level that has previously influenced price movements (indicated by arrows).
Analysts' Price Forecast for Coca-Cola (KO) Stock
Following the earnings report, analysts from leading investment firms have acknowledged Coca-Cola’s strong performance, either reaffirming or raising their price targets for KO stock:
→ Citi maintained a "Buy" rating with a $85 price target.
→ Jefferies reiterated its "Buy" rating with a target of $75.
→ UBS kept its "Buy" rating, setting a $72 target.
According to TipRanks:
→ 12 out of 13 surveyed analysts recommend buying KO stock.
→ The 12-month average price target for KO is $72.4.
Trade global index CFDs with zero commission and tight spreads. Open your FXOpen account now or learn more about trading index CFDs with FXOpen.
CFDs are complex instruments and come with a high risk of losing your money.
This article represents the opinion of the Companies operating under the FXOpen brand only. It is not to be construed as an offer, solicitation, or recommendation with respect to products and services provided by the Companies operating under the FXOpen brand, nor is it to be considered financial advice.
Coca-Cola (KO) Stock Surges Nearly 5% in a Day
Yesterday, shares of The Coca-Cola Company (KO) saw a significant rally, climbing nearly 5% and reaching a yearly high above $67. The last time KO stock traded at this level was in late October 2024. Investor optimism was fueled by the release of the company’s Q4 financial report, which exceeded expectations:
→ Reported earnings per share: $0.55 vs. expected $0.52
→ Gross revenue: $11.5 billion vs. forecasted $10.7 billion
Additionally, Coca-Cola announced:
→ A substantial market share increase in the non-alcoholic beverage sector and $10.8 billion in free cash flow.
→ Projections for 5–6% organic revenue growth in 2025, highlighting the company’s resilience amid economic uncertainty.
Technical Analysis of Coca-Cola (KO) Stock
At yesterday’s market open, KO formed a large bullish gap, which may act as future support. Meanwhile, price extremes outline an ascending channel pattern.
If optimism persists:
→ The price may move towards the channel median, where supply and demand tend to balance (similar to early 2025).
→ Bears might become active around $69.25, a level that has previously influenced price movements (indicated by arrows).
Analysts' Price Forecast for Coca-Cola (KO) Stock
Following the earnings report, analysts from leading investment firms have acknowledged Coca-Cola’s strong performance, either reaffirming or raising their price targets for KO stock:
→ Citi maintained a "Buy" rating with a $85 price target.
→ Jefferies reiterated its "Buy" rating with a target of $75.
→ UBS kept its "Buy" rating, setting a $72 target.
According to TipRanks:
→ 12 out of 13 surveyed analysts recommend buying KO stock.
→ The 12-month average price target for KO is $72.4.
Trade global index CFDs with zero commission and tight spreads. Open your FXOpen account now or learn more about trading index CFDs with FXOpen.
CFDs are complex instruments and come with a high risk of losing your money.
This article represents the opinion of the Companies operating under the FXOpen brand only. It is not to be construed as an offer, solicitation, or recommendation with respect to products and services provided by the Companies operating under the FXOpen brand, nor is it to be considered financial advice.
👍3
#USDJPY #forextrading #tradingtips #MarketUpdates
USD/JPY Exchange Rate Recovers from Yearly Low
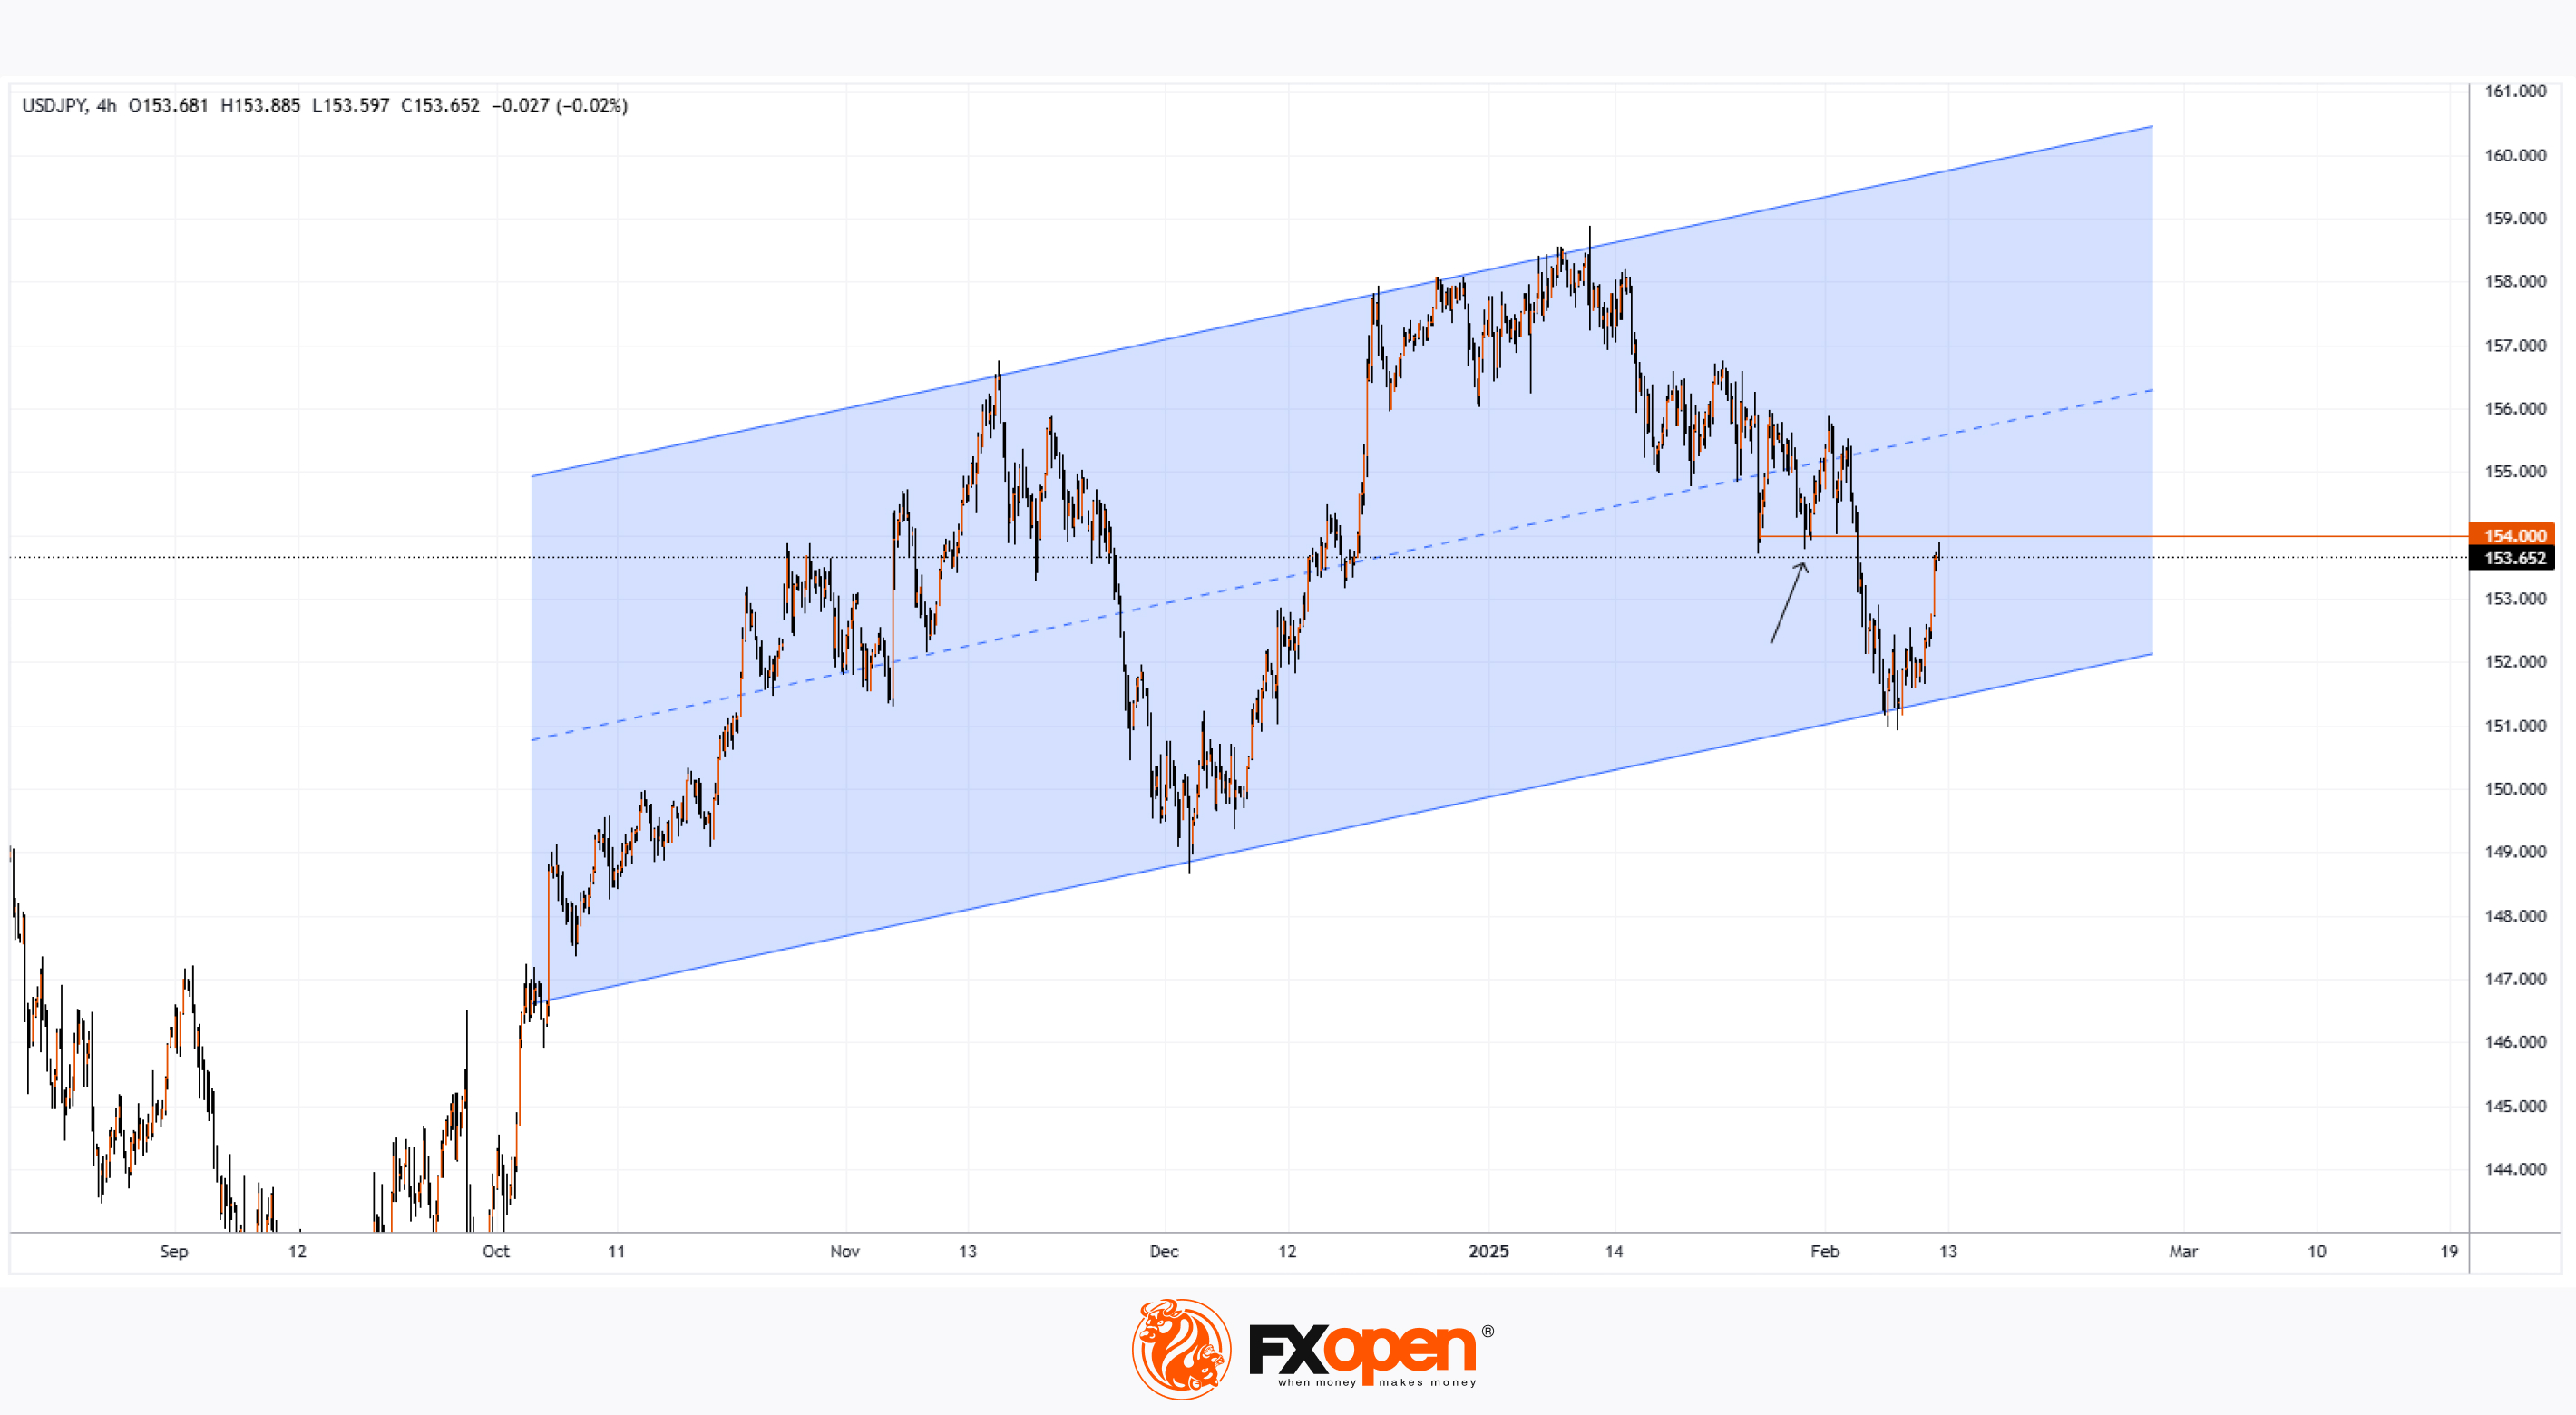
As shown on the USD/JPY chart, today the exchange rate aggressively surged above the 153 yen per US dollar level. This marks a strong recovery from the yearly low of around 151 yen per dollar, set last week.
Today's bullish momentum developed following a statement from Japan's Minister of Industry, Yoji Muto, who mentioned that the government had asked the United States to exempt Japan from the tariffs imposed by the Trump administration.
Can the USD/JPY rise continue?
Technical analysis of the USD/JPY chart reveals that key extremes over the last three months form the contours of an upward channel, with:
→ From a bullish perspective: The exchange rate is rising towards the median, which tends to "attract" the price as demand and supply balance in this region.
→ From a bearish perspective: The 154 yen per dollar level, which acted as support in February (shown by arrows), may hinder further growth.
The future direction of the USD/JPY pair largely depends on a key upcoming news release, which could have a significant impact on the US dollar’s value against other currencies. At 16:30 GMT+3 today, the CPI report will be published, shedding light on the current inflation situation. Be prepared for potential volatility spikes.
Trade over 50 forex markets 24 hours a day with FXOpen. Take advantage of low commissions, deep liquidity, and spreads from 0.0 pips. Open your FXOpen account now or learn more about trading forex with FXOpen.
CFDs are complex instruments and come with a high risk of losing your money.
This article represents the opinion of the Companies operating under the FXOpen brand only. It is not to be construed as an offer, solicitation, or recommendation with respect to products and services provided by the Companies operating under the FXOpen brand, nor is it to be considered financial advice.
USD/JPY Exchange Rate Recovers from Yearly Low
As shown on the USD/JPY chart, today the exchange rate aggressively surged above the 153 yen per US dollar level. This marks a strong recovery from the yearly low of around 151 yen per dollar, set last week.
Today's bullish momentum developed following a statement from Japan's Minister of Industry, Yoji Muto, who mentioned that the government had asked the United States to exempt Japan from the tariffs imposed by the Trump administration.
Can the USD/JPY rise continue?
Technical analysis of the USD/JPY chart reveals that key extremes over the last three months form the contours of an upward channel, with:
→ From a bullish perspective: The exchange rate is rising towards the median, which tends to "attract" the price as demand and supply balance in this region.
→ From a bearish perspective: The 154 yen per dollar level, which acted as support in February (shown by arrows), may hinder further growth.
The future direction of the USD/JPY pair largely depends on a key upcoming news release, which could have a significant impact on the US dollar’s value against other currencies. At 16:30 GMT+3 today, the CPI report will be published, shedding light on the current inflation situation. Be prepared for potential volatility spikes.
Trade over 50 forex markets 24 hours a day with FXOpen. Take advantage of low commissions, deep liquidity, and spreads from 0.0 pips. Open your FXOpen account now or learn more about trading forex with FXOpen.
CFDs are complex instruments and come with a high risk of losing your money.
This article represents the opinion of the Companies operating under the FXOpen brand only. It is not to be construed as an offer, solicitation, or recommendation with respect to products and services provided by the Companies operating under the FXOpen brand, nor is it to be considered financial advice.
👍3
#brentoil #oilprices #MarketUpdates #MarketNews
Brent Crude Price Drops After Trump’s Call with Putin
According to the XBR/USD chart, the price of Brent crude oil fell by more than 2% in a single day. This decline followed an announcement by US President Trump that he had spoken with Russian President Putin, discussing various global issues, including the war in Ukraine.
As reported by Reuters, this has raised expectations that a potential peace agreement between Ukraine and Russia could involve lifting sanctions, which have disrupted global oil supply flows.
Technical Analysis of XBR/USD
On 7 February, we highlighted key support at $74. Since then, the price has risen (as indicated by the arrow) to $77, which has confirmed its role as resistance.
Brent crude price movements outline a descending channel (marked in blue), with:
→ Bullish perspective: The $74 level may still act as support.
→ Bearish perspective: The $75.50–$75.80 zone, where sellers have shown dominance, could challenge bulls attempting to push prices into the upper half of the channel.
Rising US oil inventories, the prospect of increased production under President Trump, and expectations of sanctions on Russia being lifted could all contribute to Brent crude revisiting its 2025 lows.
Start trading commodities with tight spreads. Open your trading account now or learn more about trading commodity CFDs with FXOpen.
CFDs are complex instruments and come with a high risk of losing your money.
This article represents the opinion of the Companies operating under the FXOpen brand only. It is not to be construed as an offer, solicitation, or recommendation with respect to products and services provided by the Companies operating under the FXOpen brand, nor is it to be considered financial advice.
Brent Crude Price Drops After Trump’s Call with Putin
According to the XBR/USD chart, the price of Brent crude oil fell by more than 2% in a single day. This decline followed an announcement by US President Trump that he had spoken with Russian President Putin, discussing various global issues, including the war in Ukraine.
As reported by Reuters, this has raised expectations that a potential peace agreement between Ukraine and Russia could involve lifting sanctions, which have disrupted global oil supply flows.
Technical Analysis of XBR/USD
On 7 February, we highlighted key support at $74. Since then, the price has risen (as indicated by the arrow) to $77, which has confirmed its role as resistance.
Brent crude price movements outline a descending channel (marked in blue), with:
→ Bullish perspective: The $74 level may still act as support.
→ Bearish perspective: The $75.50–$75.80 zone, where sellers have shown dominance, could challenge bulls attempting to push prices into the upper half of the channel.
Rising US oil inventories, the prospect of increased production under President Trump, and expectations of sanctions on Russia being lifted could all contribute to Brent crude revisiting its 2025 lows.
Start trading commodities with tight spreads. Open your trading account now or learn more about trading commodity CFDs with FXOpen.
CFDs are complex instruments and come with a high risk of losing your money.
This article represents the opinion of the Companies operating under the FXOpen brand only. It is not to be construed as an offer, solicitation, or recommendation with respect to products and services provided by the Companies operating under the FXOpen brand, nor is it to be considered financial advice.

👍3
#forextrading #MarketUpdates #marketanalysis #stockmarket
European Stocks Rise for Sixth Consecutive Week
According to the Eurostoxx 50 index (Europe 50 on FXOpen) chart:
→ The index has gained over 6% since early February.
→ It is now trading at an all-time high.
Factors driving market optimism:
→ Expectations of a ceasefire in Ukraine.
→ Trump’s decision to delay tariff implementation until April, signalling room for trade negotiations.
Technical Analysis of the Eurostoxx 50 Index (Europe 50 on FXOpen)
Price movements outline an ascending channel (blue), with key observations:
→ The index remains in the upper half of the channel, reflecting strong demand.
→ February’s sharp rally has formed a steeper rising channel (purple).
→ After breaking above resistance at 5,370, a retest (indicated by an arrow) confirmed this level as support.
With the RSI indicator in overbought territory, a potential pullback is plausible—perhaps as investors look to secure profits before the weekend amid a busy news cycle.
In this scenario, the 5,444 level, where the lower purple trendline intersects the blue channel’s median, could act as a support zone.
Trade global index CFDs with zero commission and tight spreads. Open your FXOpen account now or learn more about trading index CFDs with FXOpen.
CFDs are complex instruments and come with a high risk of losing your money.
This article represents the opinion of the Companies operating under the FXOpen brand only. It is not to be construed as an offer, solicitation, or recommendation with respect to products and services provided by the Companies operating under the FXOpen brand, nor is it to be considered financial advice.
European Stocks Rise for Sixth Consecutive Week
According to the Eurostoxx 50 index (Europe 50 on FXOpen) chart:
→ The index has gained over 6% since early February.
→ It is now trading at an all-time high.
Factors driving market optimism:
→ Expectations of a ceasefire in Ukraine.
→ Trump’s decision to delay tariff implementation until April, signalling room for trade negotiations.
Technical Analysis of the Eurostoxx 50 Index (Europe 50 on FXOpen)
Price movements outline an ascending channel (blue), with key observations:
→ The index remains in the upper half of the channel, reflecting strong demand.
→ February’s sharp rally has formed a steeper rising channel (purple).
→ After breaking above resistance at 5,370, a retest (indicated by an arrow) confirmed this level as support.
With the RSI indicator in overbought territory, a potential pullback is plausible—perhaps as investors look to secure profits before the weekend amid a busy news cycle.
In this scenario, the 5,444 level, where the lower purple trendline intersects the blue channel’s median, could act as a support zone.
Trade global index CFDs with zero commission and tight spreads. Open your FXOpen account now or learn more about trading index CFDs with FXOpen.
CFDs are complex instruments and come with a high risk of losing your money.
This article represents the opinion of the Companies operating under the FXOpen brand only. It is not to be construed as an offer, solicitation, or recommendation with respect to products and services provided by the Companies operating under the FXOpen brand, nor is it to be considered financial advice.
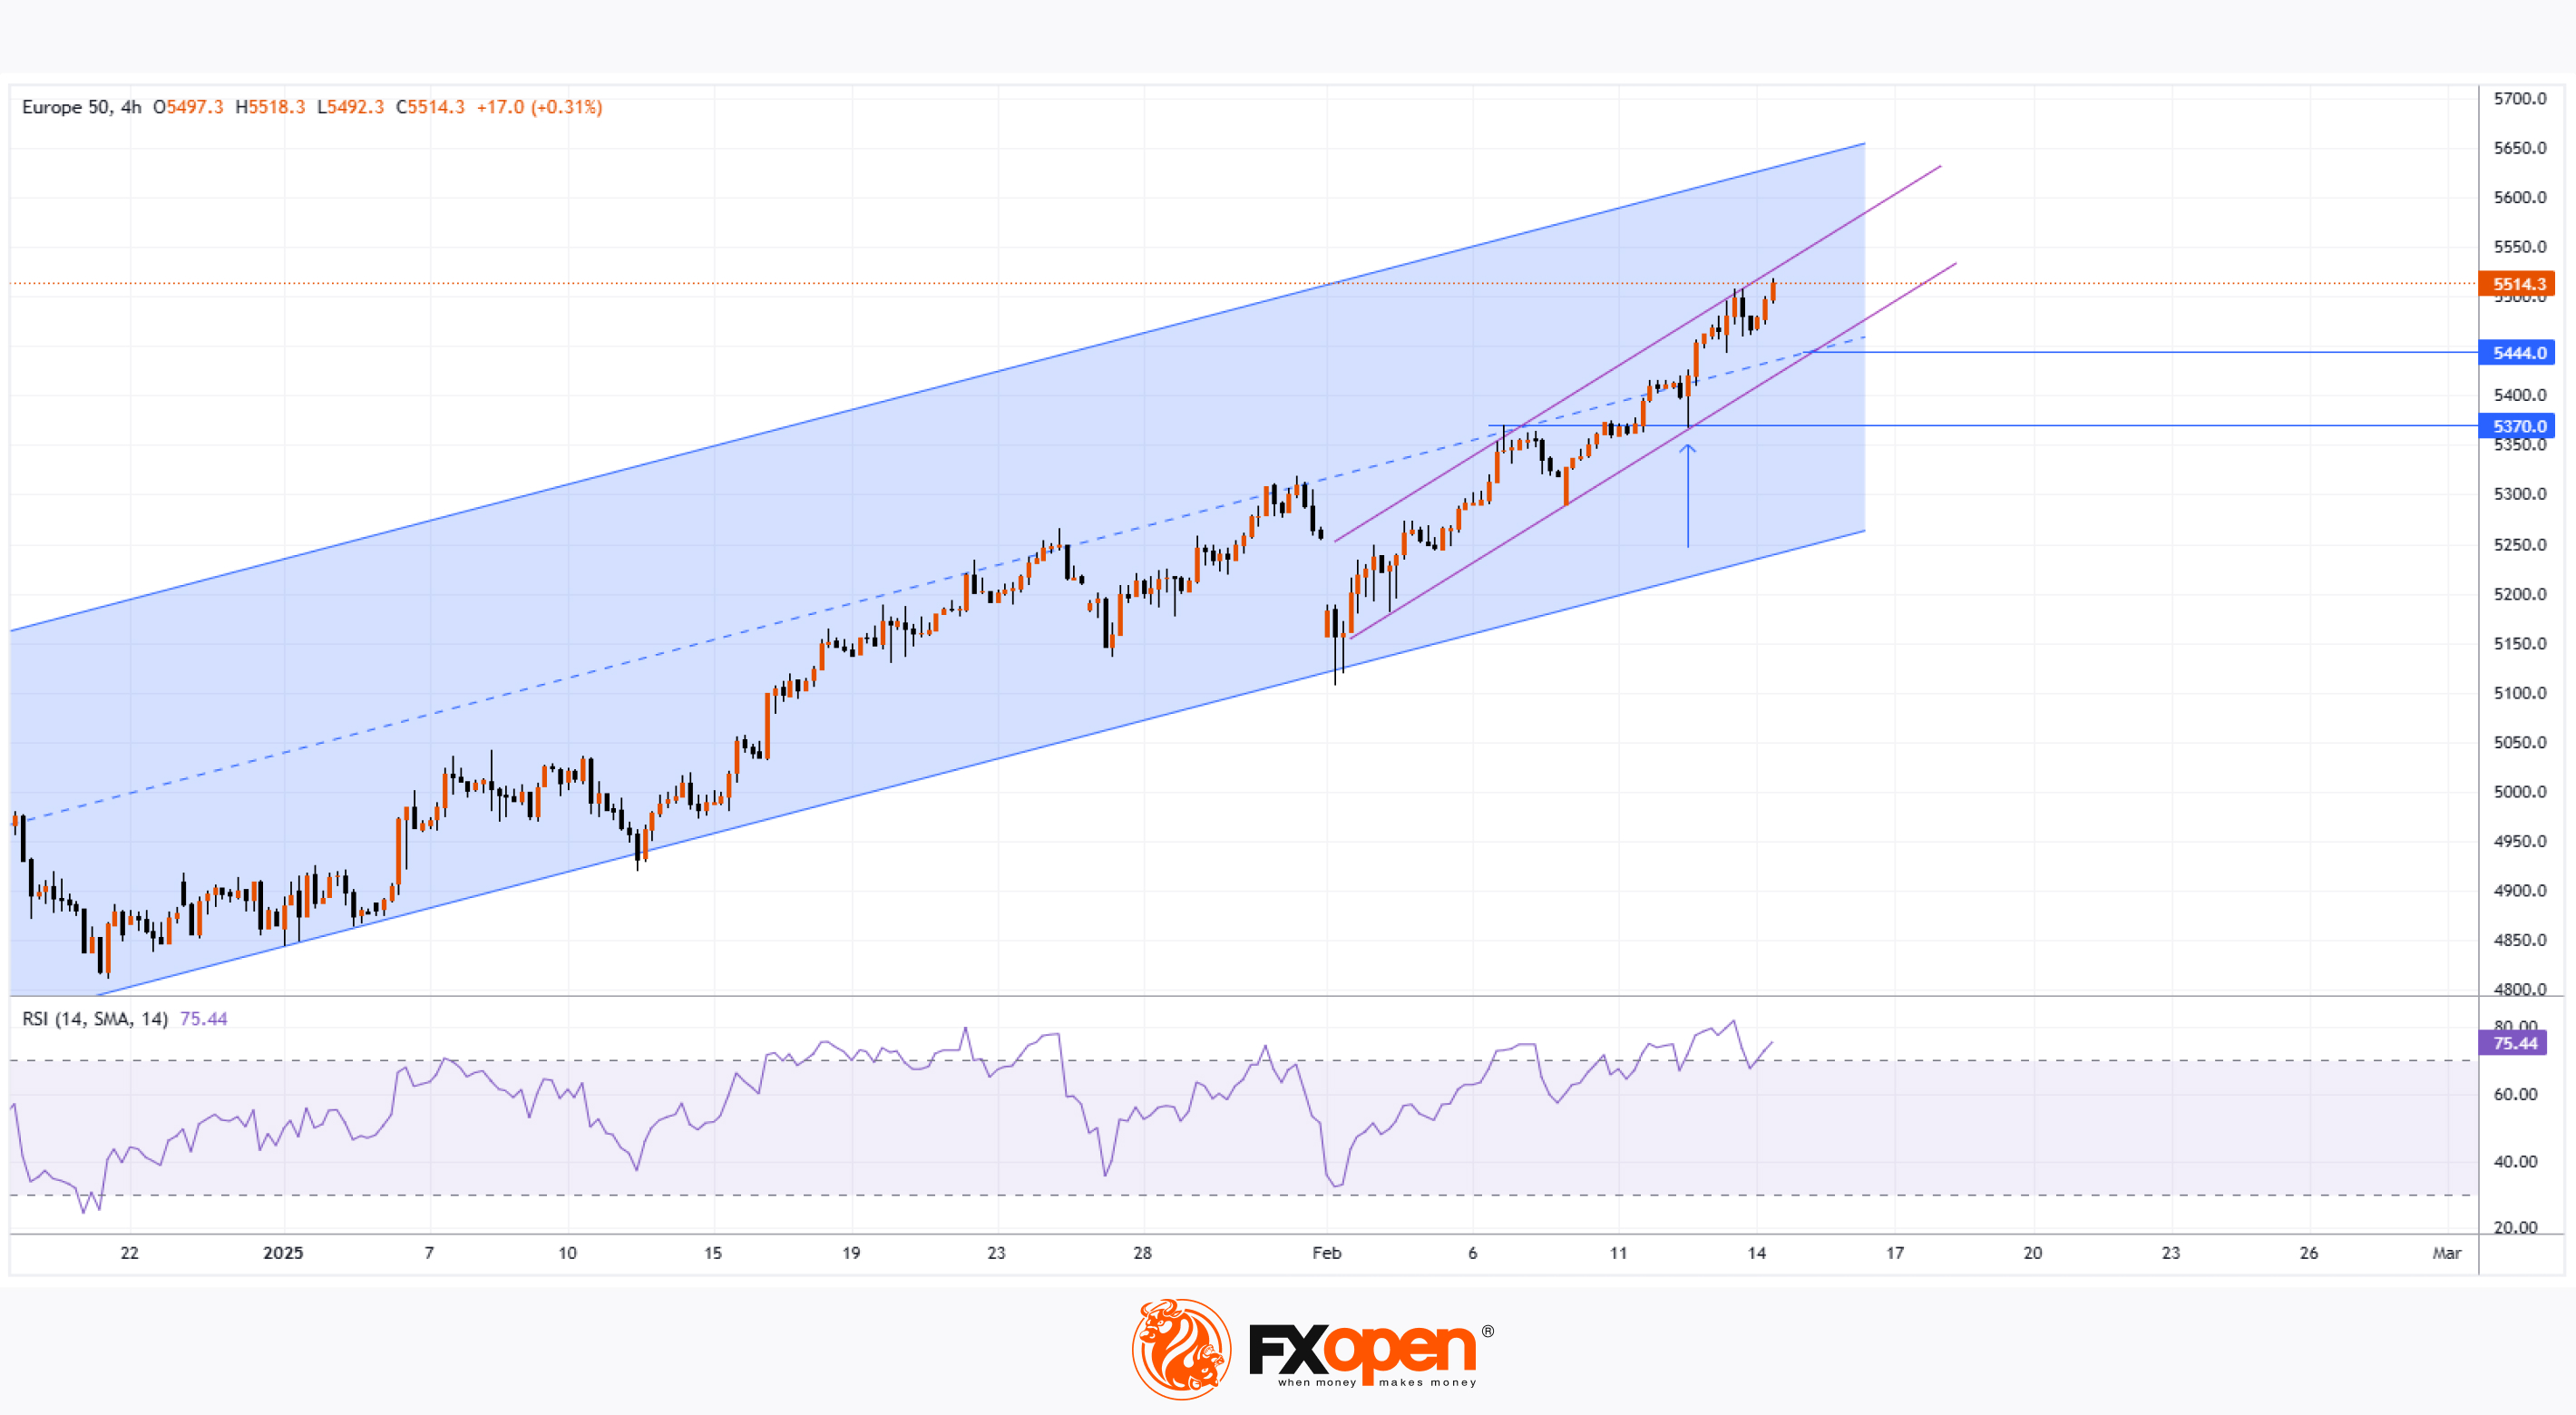
👍3
#stockmarket #stocktrading #META #MarketUpdates
META Stock Rises for 19 Consecutive Sessions
According to the Meta Platforms (META) stock chart:
→ Based on closing prices, the stock has posted 19 consecutive daily gains since 17 January.
→ META has reached an all-time high, solidifying above the key $700 per share level.
Bullish sentiment was driven by a strong Q4 earnings report that exceeded analyst expectations:
→ Earnings per share: reported $8.01 vs. expected $6.75.
→ Revenue: reported $48.38 billion vs. expected $46.99 billion.
Additionally, media reports highlighted:
→ Meta Platforms announced a 5% dividend increase.
→ Over 3.3 billion people interact with its apps daily.
→ Mark Zuckerberg stated that 2025 will be a turning point for AI at Meta.
→ Strong ties between the company’s CEO and President Trump.
Technical Analysis of Meta Platforms (META) Stock
Price movements have formed an ascending trend channel (blue) since 2024, with its lower boundary acting as stable support. However, the daily RSI indicator has entered extreme overbought territory, signalling potential vulnerability to a pullback.
If a correction occurs, the $700 psychological level may be tested, similar to how $680 was previously.
Former resistance at $636, reinforced by the channel's lower boundary, appears to be a strong support level.
Analyst Forecasts for Meta Platforms (META) Stock
According to Yahoo Finance:
→ In the past week, 23 analysts raised their earnings per share estimates for META in 2025.
→ 56 out of 65 analysts rate META stock as a "strong buy" or "buy."
TipRanks data indicates an average 12-month price target of $764.61 for META stock.
Trade global index CFDs with zero commission and tight spreads. Open your FXOpen account now or learn more about trading index CFDs with FXOpen.
CFDs are complex instruments and come with a high risk of losing your money.
This article represents the opinion of the Companies operating under the FXOpen brand only. It is not to be construed as an offer, solicitation, or recommendation with respect to products and services provided by the Companies operating under the FXOpen brand, nor is it to be considered financial advice.
META Stock Rises for 19 Consecutive Sessions
According to the Meta Platforms (META) stock chart:
→ Based on closing prices, the stock has posted 19 consecutive daily gains since 17 January.
→ META has reached an all-time high, solidifying above the key $700 per share level.
Bullish sentiment was driven by a strong Q4 earnings report that exceeded analyst expectations:
→ Earnings per share: reported $8.01 vs. expected $6.75.
→ Revenue: reported $48.38 billion vs. expected $46.99 billion.
Additionally, media reports highlighted:
→ Meta Platforms announced a 5% dividend increase.
→ Over 3.3 billion people interact with its apps daily.
→ Mark Zuckerberg stated that 2025 will be a turning point for AI at Meta.
→ Strong ties between the company’s CEO and President Trump.
Technical Analysis of Meta Platforms (META) Stock
Price movements have formed an ascending trend channel (blue) since 2024, with its lower boundary acting as stable support. However, the daily RSI indicator has entered extreme overbought territory, signalling potential vulnerability to a pullback.
If a correction occurs, the $700 psychological level may be tested, similar to how $680 was previously.
Former resistance at $636, reinforced by the channel's lower boundary, appears to be a strong support level.
Analyst Forecasts for Meta Platforms (META) Stock
According to Yahoo Finance:
→ In the past week, 23 analysts raised their earnings per share estimates for META in 2025.
→ 56 out of 65 analysts rate META stock as a "strong buy" or "buy."
TipRanks data indicates an average 12-month price target of $764.61 for META stock.
Trade global index CFDs with zero commission and tight spreads. Open your FXOpen account now or learn more about trading index CFDs with FXOpen.
CFDs are complex instruments and come with a high risk of losing your money.
This article represents the opinion of the Companies operating under the FXOpen brand only. It is not to be construed as an offer, solicitation, or recommendation with respect to products and services provided by the Companies operating under the FXOpen brand, nor is it to be considered financial advice.
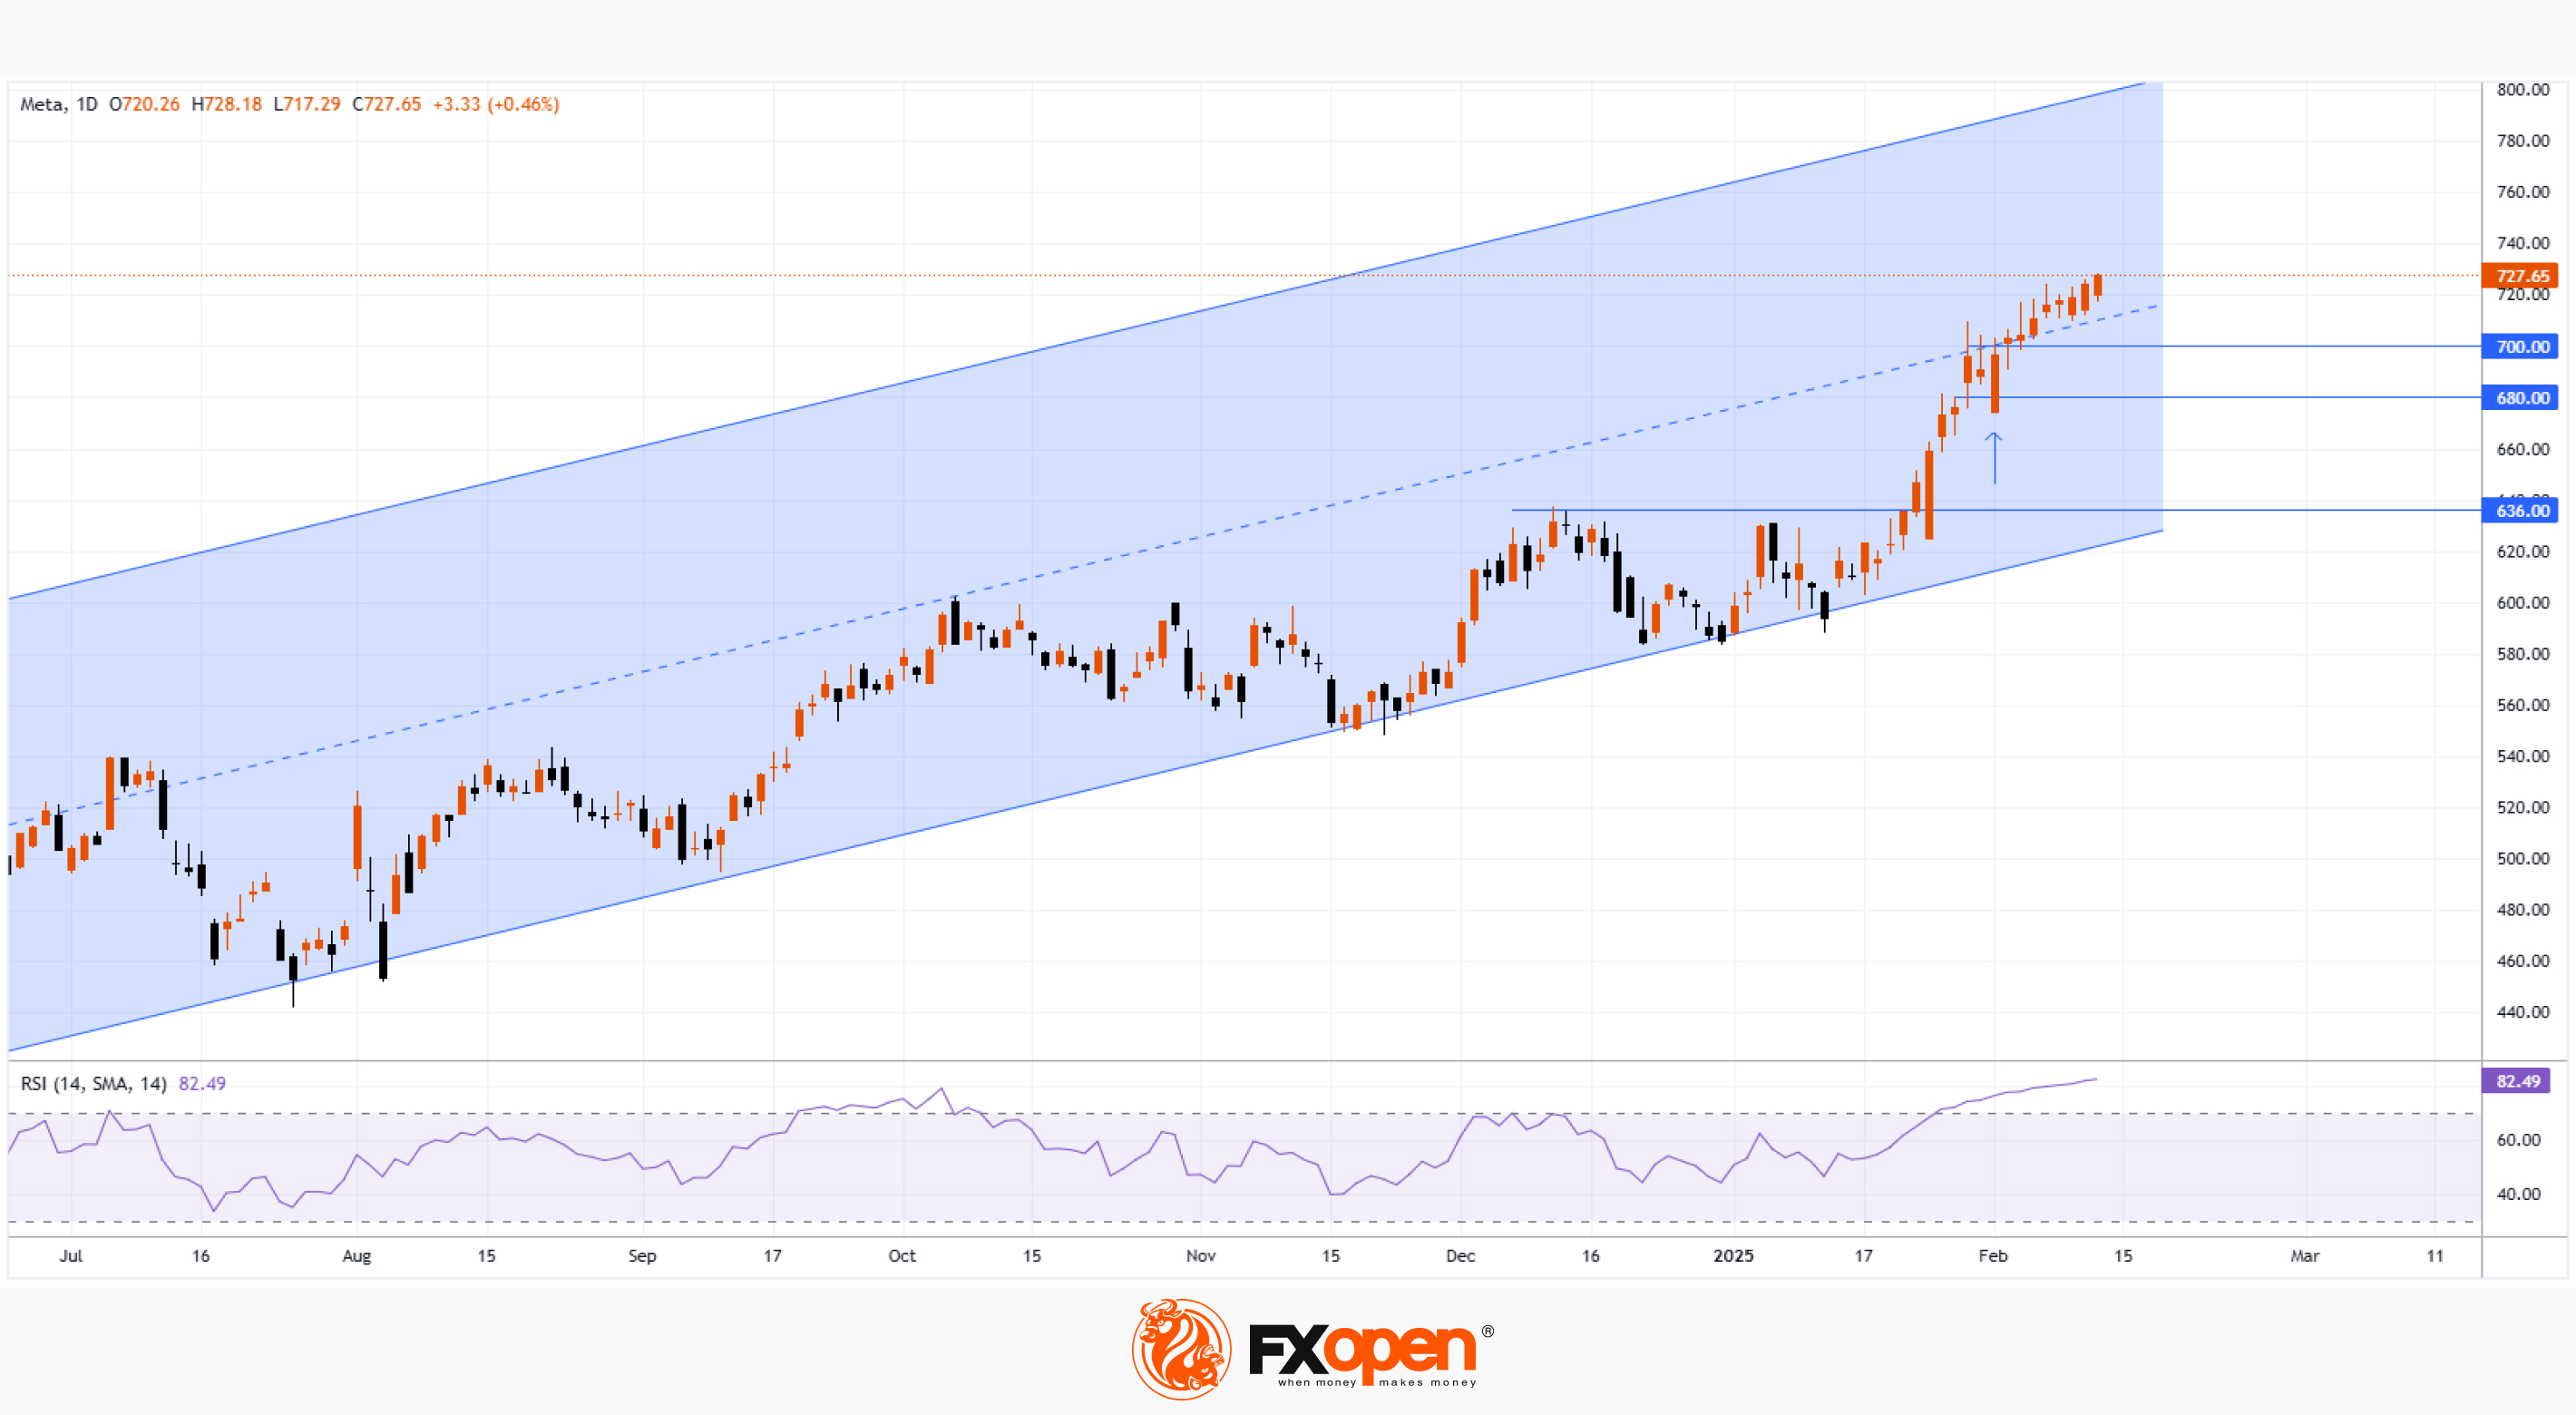
👍3