
#USDJPY #forextrading #tradingtips #MarketUpdates
USD/JPY Hits One-Month Low
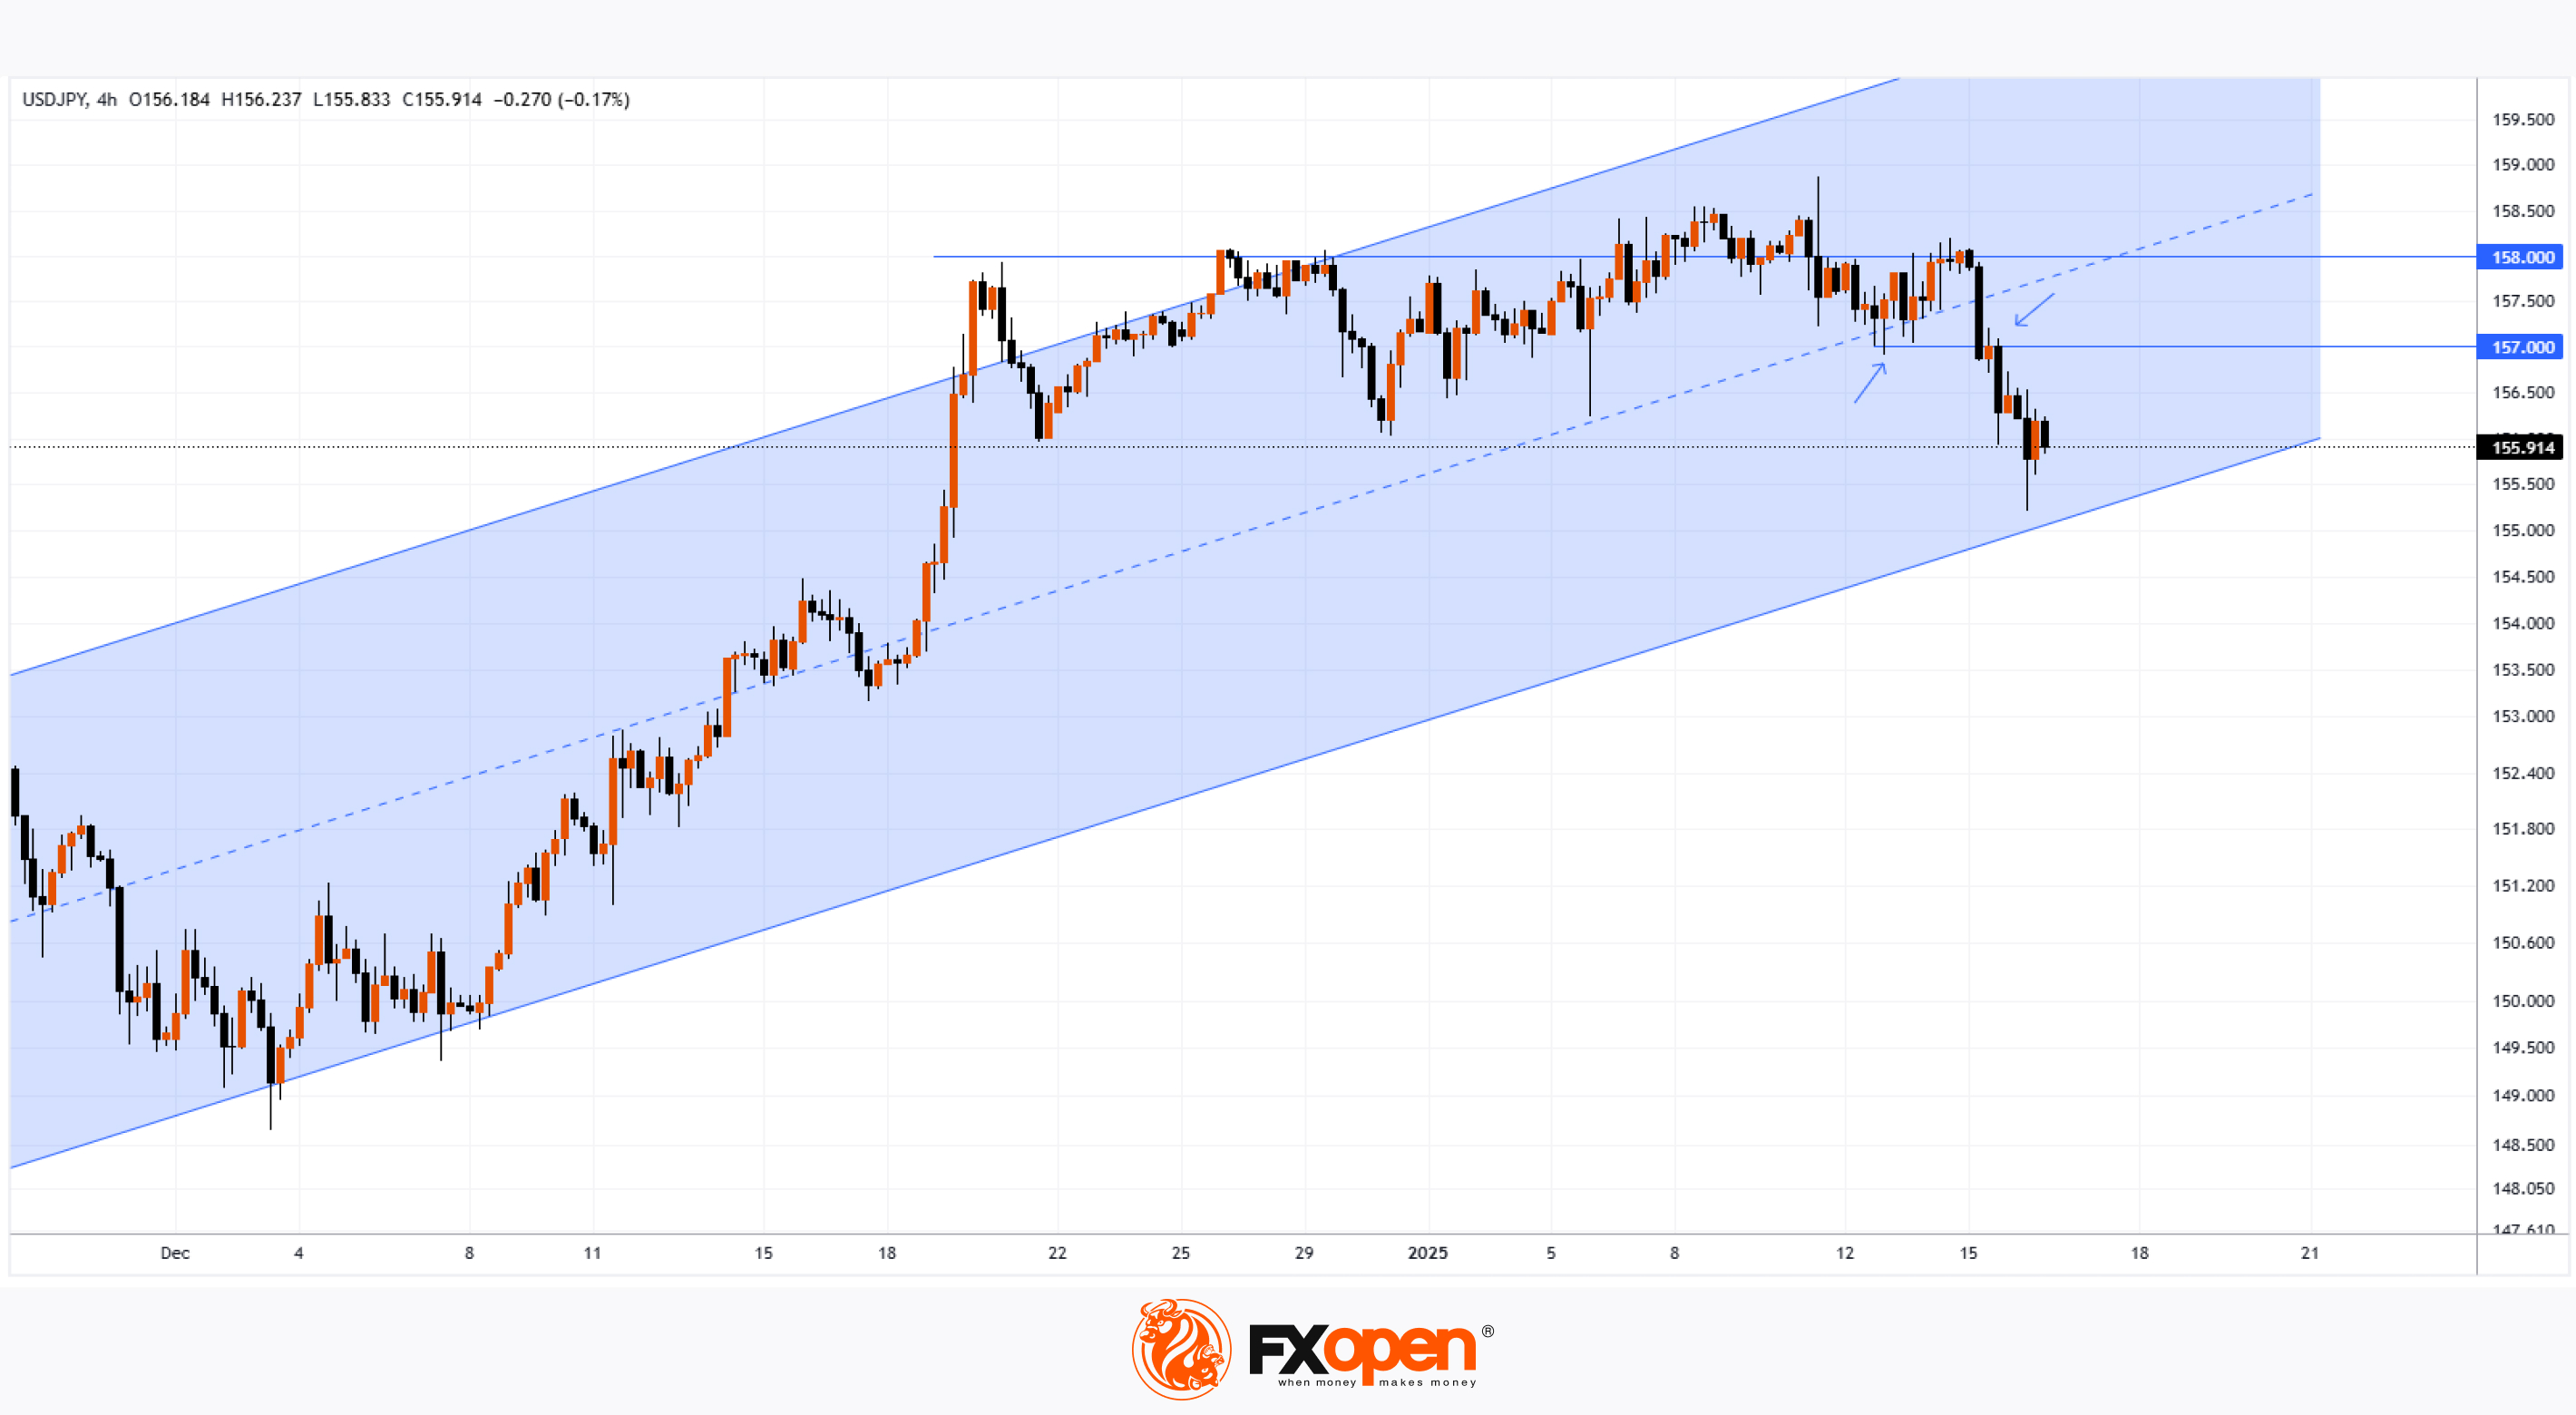
The USD/JPY pair fell to its lowest level in a month during today’s Asian session, dropping below 155.5 yen per US dollar for the first time since 19th December.
As Reuters reports:
→ The yen’s strengthening was driven by hawkish comments from Bank of Japan (BOJ) Governor Kazuo Ueda, which prompted markets to bet on a potential interest rate hike next week.
→ A significant majority of surveyed economists anticipate the BOJ will raise rates at one of its two meetings this quarter, with most favouring a January hike.
The BOJ’s decision on rates may depend on market stability following Donald Trump’s return to the White House next Monday. His inauguration speech will be closely watched by policymakers worldwide to gauge his likely political direction.
Technical analysis of the USD/JPY chart shows:
→ The price has struggled to hold above the 158 yen-per-dollar level, which can be considered a critical barrier where bulls are unwilling to take on the risk associated with potential rate hikes.
→ The 157 level has been broken, transitioning from support to resistance (as indicated by the arrows).
Bulls might find support at the lower boundary of the ascending channel (marked in blue), which has been in place since November last year. However, given strong fundamental factors, such as the US presidential inauguration and BOJ rate decisions, USD/JPY is likely to experience spikes in volatility that could significantly shift the supply-demand balance—not just in the short term.
Trade over 50 forex markets 24 hours a day with FXOpen. Take advantage of low commissions, deep liquidity, and spreads from 0.0 pips. Open your FXOpen account now or learn more about trading forex with FXOpen.
CFDs are complex instruments and come with a high risk of losing your money.
This article represents the opinion of the Companies operating under the FXOpen brand only. It is not to be construed as an offer, solicitation, or recommendation with respect to products and services provided by the Companies operating under the FXOpen brand, nor is it to be considered financial advice.
USD/JPY Hits One-Month Low
The USD/JPY pair fell to its lowest level in a month during today’s Asian session, dropping below 155.5 yen per US dollar for the first time since 19th December.
As Reuters reports:
→ The yen’s strengthening was driven by hawkish comments from Bank of Japan (BOJ) Governor Kazuo Ueda, which prompted markets to bet on a potential interest rate hike next week.
→ A significant majority of surveyed economists anticipate the BOJ will raise rates at one of its two meetings this quarter, with most favouring a January hike.
The BOJ’s decision on rates may depend on market stability following Donald Trump’s return to the White House next Monday. His inauguration speech will be closely watched by policymakers worldwide to gauge his likely political direction.
Technical analysis of the USD/JPY chart shows:
→ The price has struggled to hold above the 158 yen-per-dollar level, which can be considered a critical barrier where bulls are unwilling to take on the risk associated with potential rate hikes.
→ The 157 level has been broken, transitioning from support to resistance (as indicated by the arrows).
Bulls might find support at the lower boundary of the ascending channel (marked in blue), which has been in place since November last year. However, given strong fundamental factors, such as the US presidential inauguration and BOJ rate decisions, USD/JPY is likely to experience spikes in volatility that could significantly shift the supply-demand balance—not just in the short term.
Trade over 50 forex markets 24 hours a day with FXOpen. Take advantage of low commissions, deep liquidity, and spreads from 0.0 pips. Open your FXOpen account now or learn more about trading forex with FXOpen.
CFDs are complex instruments and come with a high risk of losing your money.
This article represents the opinion of the Companies operating under the FXOpen brand only. It is not to be construed as an offer, solicitation, or recommendation with respect to products and services provided by the Companies operating under the FXOpen brand, nor is it to be considered financial advice.
👍2
#stockmarket #FTSE #MarketUpdates #MarketNews
FTSE 100 Index May Reach 8500
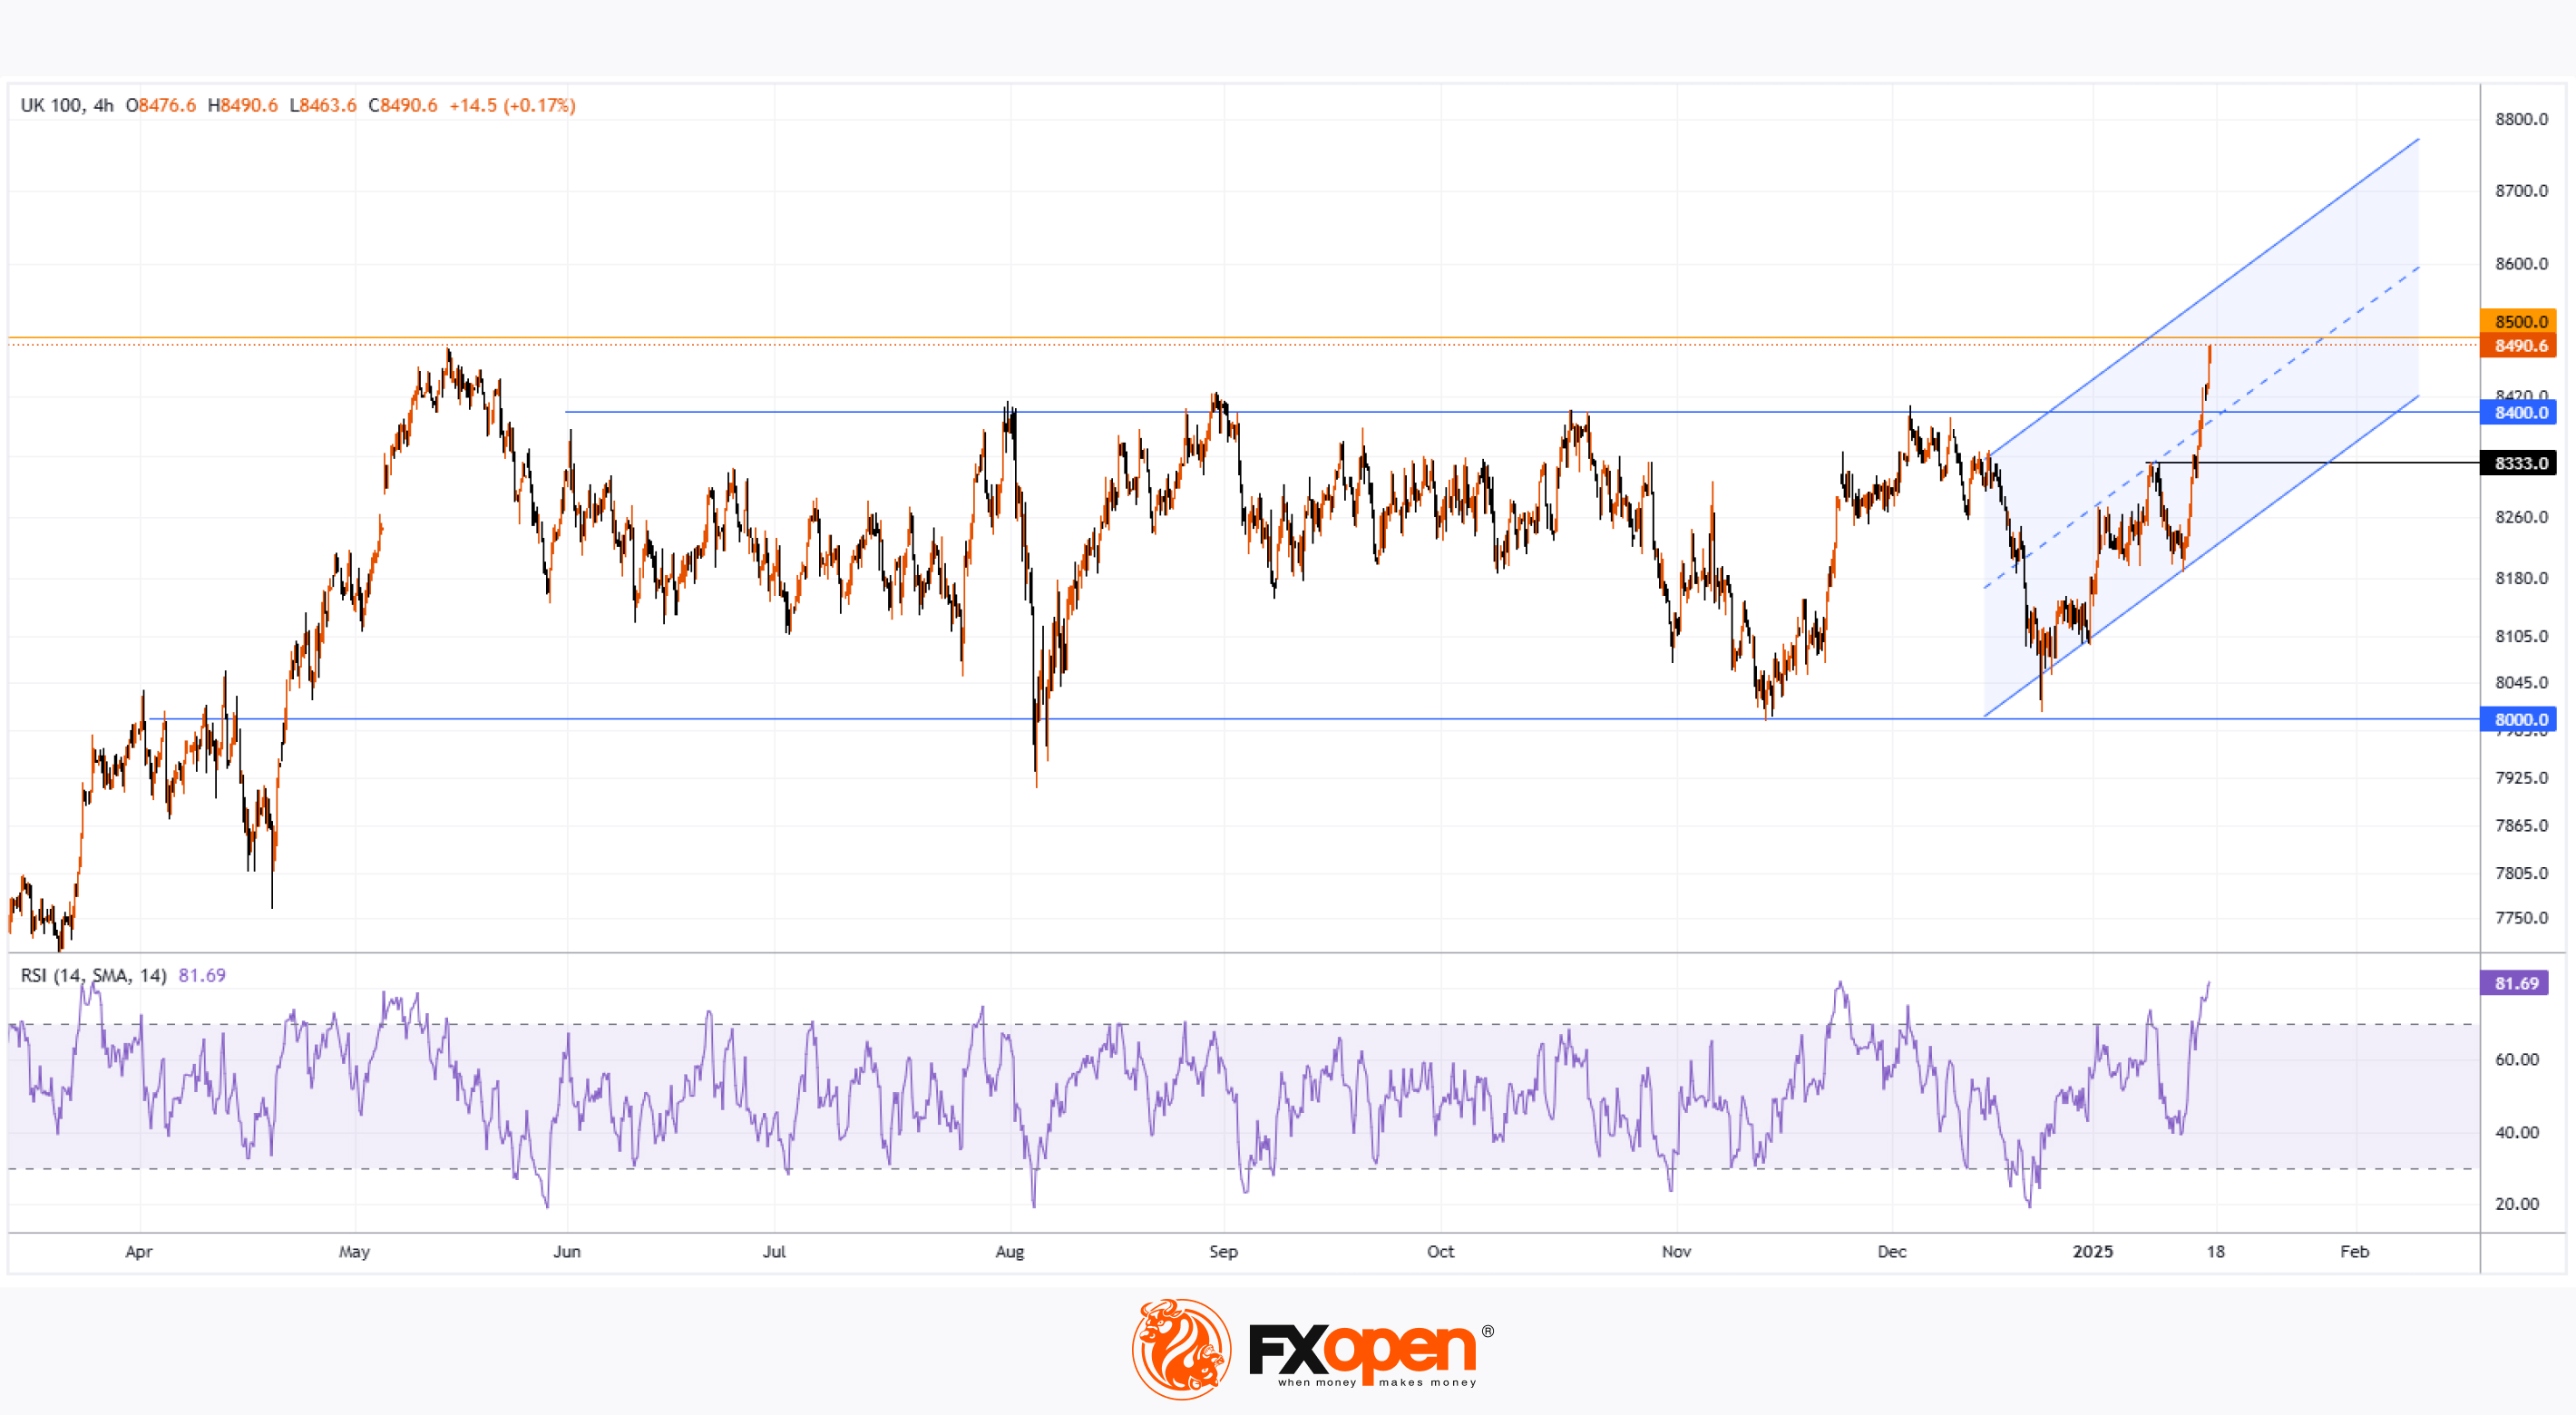
As shown on the chart of the UK stock index FTSE 100 (UK 100 on FXOpen):
→ It has risen by over 3% in three days;
→ It is near the record high set in May last year and may reach the psychological level of 8500 points.
Bullish sentiment has been supported by yesterday's news of GDP recovery – according to media reports, the economy grew by 0.1% in November 2024 (compared to a previous decline of 0.1%), primarily driven by the dominant services sector.
Technical analysis of the FTSE 100 (UK 100 on FXOpen) chart shows that since mid-2024, the index has predominantly fluctuated within the 8000–8400 range, only briefly moving beyond it, which was accompanied by spikes in the RSI indicator.
The current RSI level indicates strong overbought conditions, making the FTSE 100 (UK 100 on FXOpen) vulnerable to a pullback. Should this occur, it will provide important insights into the strength of demand. This could be assessed by the index’s ability to remain above the 8333 support level and the lower boundary of the ascending channel (marked in blue).
Potential challenges for bulls are highlighted by MT Newswires, which report that analysts forecast higher inflation and weaker growth in 2025, amid expectations of a significant rise in labour costs.
Trade global index CFDs with zero commission and tight spreads. Open your FXOpen account now or learn more about trading index CFDs with FXOpen.
CFDs are complex instruments and come with a high risk of losing your money.
This article represents the opinion of the Companies operating under the FXOpen brand only. It is not to be construed as an offer, solicitation, or recommendation with respect to products and services provided by the Companies operating under the FXOpen brand, nor is it to be considered financial advice.
FTSE 100 Index May Reach 8500
As shown on the chart of the UK stock index FTSE 100 (UK 100 on FXOpen):
→ It has risen by over 3% in three days;
→ It is near the record high set in May last year and may reach the psychological level of 8500 points.
Bullish sentiment has been supported by yesterday's news of GDP recovery – according to media reports, the economy grew by 0.1% in November 2024 (compared to a previous decline of 0.1%), primarily driven by the dominant services sector.
Technical analysis of the FTSE 100 (UK 100 on FXOpen) chart shows that since mid-2024, the index has predominantly fluctuated within the 8000–8400 range, only briefly moving beyond it, which was accompanied by spikes in the RSI indicator.
The current RSI level indicates strong overbought conditions, making the FTSE 100 (UK 100 on FXOpen) vulnerable to a pullback. Should this occur, it will provide important insights into the strength of demand. This could be assessed by the index’s ability to remain above the 8333 support level and the lower boundary of the ascending channel (marked in blue).
Potential challenges for bulls are highlighted by MT Newswires, which report that analysts forecast higher inflation and weaker growth in 2025, amid expectations of a significant rise in labour costs.
Trade global index CFDs with zero commission and tight spreads. Open your FXOpen account now or learn more about trading index CFDs with FXOpen.
CFDs are complex instruments and come with a high risk of losing your money.
This article represents the opinion of the Companies operating under the FXOpen brand only. It is not to be construed as an offer, solicitation, or recommendation with respect to products and services provided by the Companies operating under the FXOpen brand, nor is it to be considered financial advice.
👍3
#SilverTrading #PreciousMetals #MarketVolatility #Traders #XAGUSD
Key Factors That Influence Silver Value 📈
Silver trading is shaped by economic, industrial, and geopolitical factors. Understanding these is crucial for traders and investors.
🔸 Supply and Demand: Industrial uses and mining affect supply and demand, driving price fluctuations.
🔸 Economic Indicators: Inflation rates, interest rates, and overall economic health influence silver’s appeal as an investment.
🔸 Geopolitical Events: Global uncertainties, such as political tensions or conflicts, can increase its appeal as a so-called safe-haven asset, leading to price surges.
🔸 Currency Strength: Since silver is priced in US dollars, its value often moves inversely to the dollar.
🔸 Market Speculation: Investor sentiment and speculative trading can lead to rapid price changes.
Risks of Trading Silver 📊
Silver trading online carries unique risks tied to its role as both a precious metal and an industrial commodity.
🔸 Volatility Risks: Silver’s price swings can be more pronounced than gold, leading to potential losses if not carefully managed.
🔸 Geopolitical and Economic Uncertainty: Unexpected global events or a strong US dollar can cause price drops, catching traders off guard.
🔸 Market Sentiment: Speculation and emotional trading can drive rapid, irrational price changes.
🔸 Market Liquidity: Reduced liquidity in certain conditions can lead to slippage.
🔸 Regulatory Changes: Shifts in regulations can disrupt silver markets.
Silver’s unique combination of industrial and investment demand, along with its market volatility, makes it an exciting asset for traders. If you’re ready to explore silver CFD trading, open an FXOpen account today to access competitive spreads, advanced tools, and a reliable platform for your trading needs.
CFDs are complex instruments and come with a high risk of losing your money.
Key Factors That Influence Silver Value 📈
Silver trading is shaped by economic, industrial, and geopolitical factors. Understanding these is crucial for traders and investors.
🔸 Supply and Demand: Industrial uses and mining affect supply and demand, driving price fluctuations.
🔸 Economic Indicators: Inflation rates, interest rates, and overall economic health influence silver’s appeal as an investment.
🔸 Geopolitical Events: Global uncertainties, such as political tensions or conflicts, can increase its appeal as a so-called safe-haven asset, leading to price surges.
🔸 Currency Strength: Since silver is priced in US dollars, its value often moves inversely to the dollar.
🔸 Market Speculation: Investor sentiment and speculative trading can lead to rapid price changes.
Risks of Trading Silver 📊
Silver trading online carries unique risks tied to its role as both a precious metal and an industrial commodity.
🔸 Volatility Risks: Silver’s price swings can be more pronounced than gold, leading to potential losses if not carefully managed.
🔸 Geopolitical and Economic Uncertainty: Unexpected global events or a strong US dollar can cause price drops, catching traders off guard.
🔸 Market Sentiment: Speculation and emotional trading can drive rapid, irrational price changes.
🔸 Market Liquidity: Reduced liquidity in certain conditions can lead to slippage.
🔸 Regulatory Changes: Shifts in regulations can disrupt silver markets.
Silver’s unique combination of industrial and investment demand, along with its market volatility, makes it an exciting asset for traders. If you’re ready to explore silver CFD trading, open an FXOpen account today to access competitive spreads, advanced tools, and a reliable platform for your trading needs.
CFDs are complex instruments and come with a high risk of losing your money.

👍2
#XAUUSD #goldprice #MarketTrends #MarketUpdates
XAU/USD Analysis: Gold Prices Poised for a New Trend
Although today is a public holiday in the US (Martin Luther King Jr. Day), financial markets are unlikely to remain calm, as traders and investors will be closely watching the inaugural speech of Donald Trump, the 47th President-elect, scheduled for 20:00 GMT+3.
Trump's speech could impact gold prices in USD, particularly if it addresses:
→ Monetary policy: With current Federal Reserve rates trending lower, non-yielding assets like gold may become more attractive.
→ International trade: If Trump’s remarks on tariffs are particularly bold, gold’s status as a “safe haven” asset could boost its appeal.
→ The dollar's value: Policies aimed at strengthening the USD and reducing national debt may influence gold prices inversely.
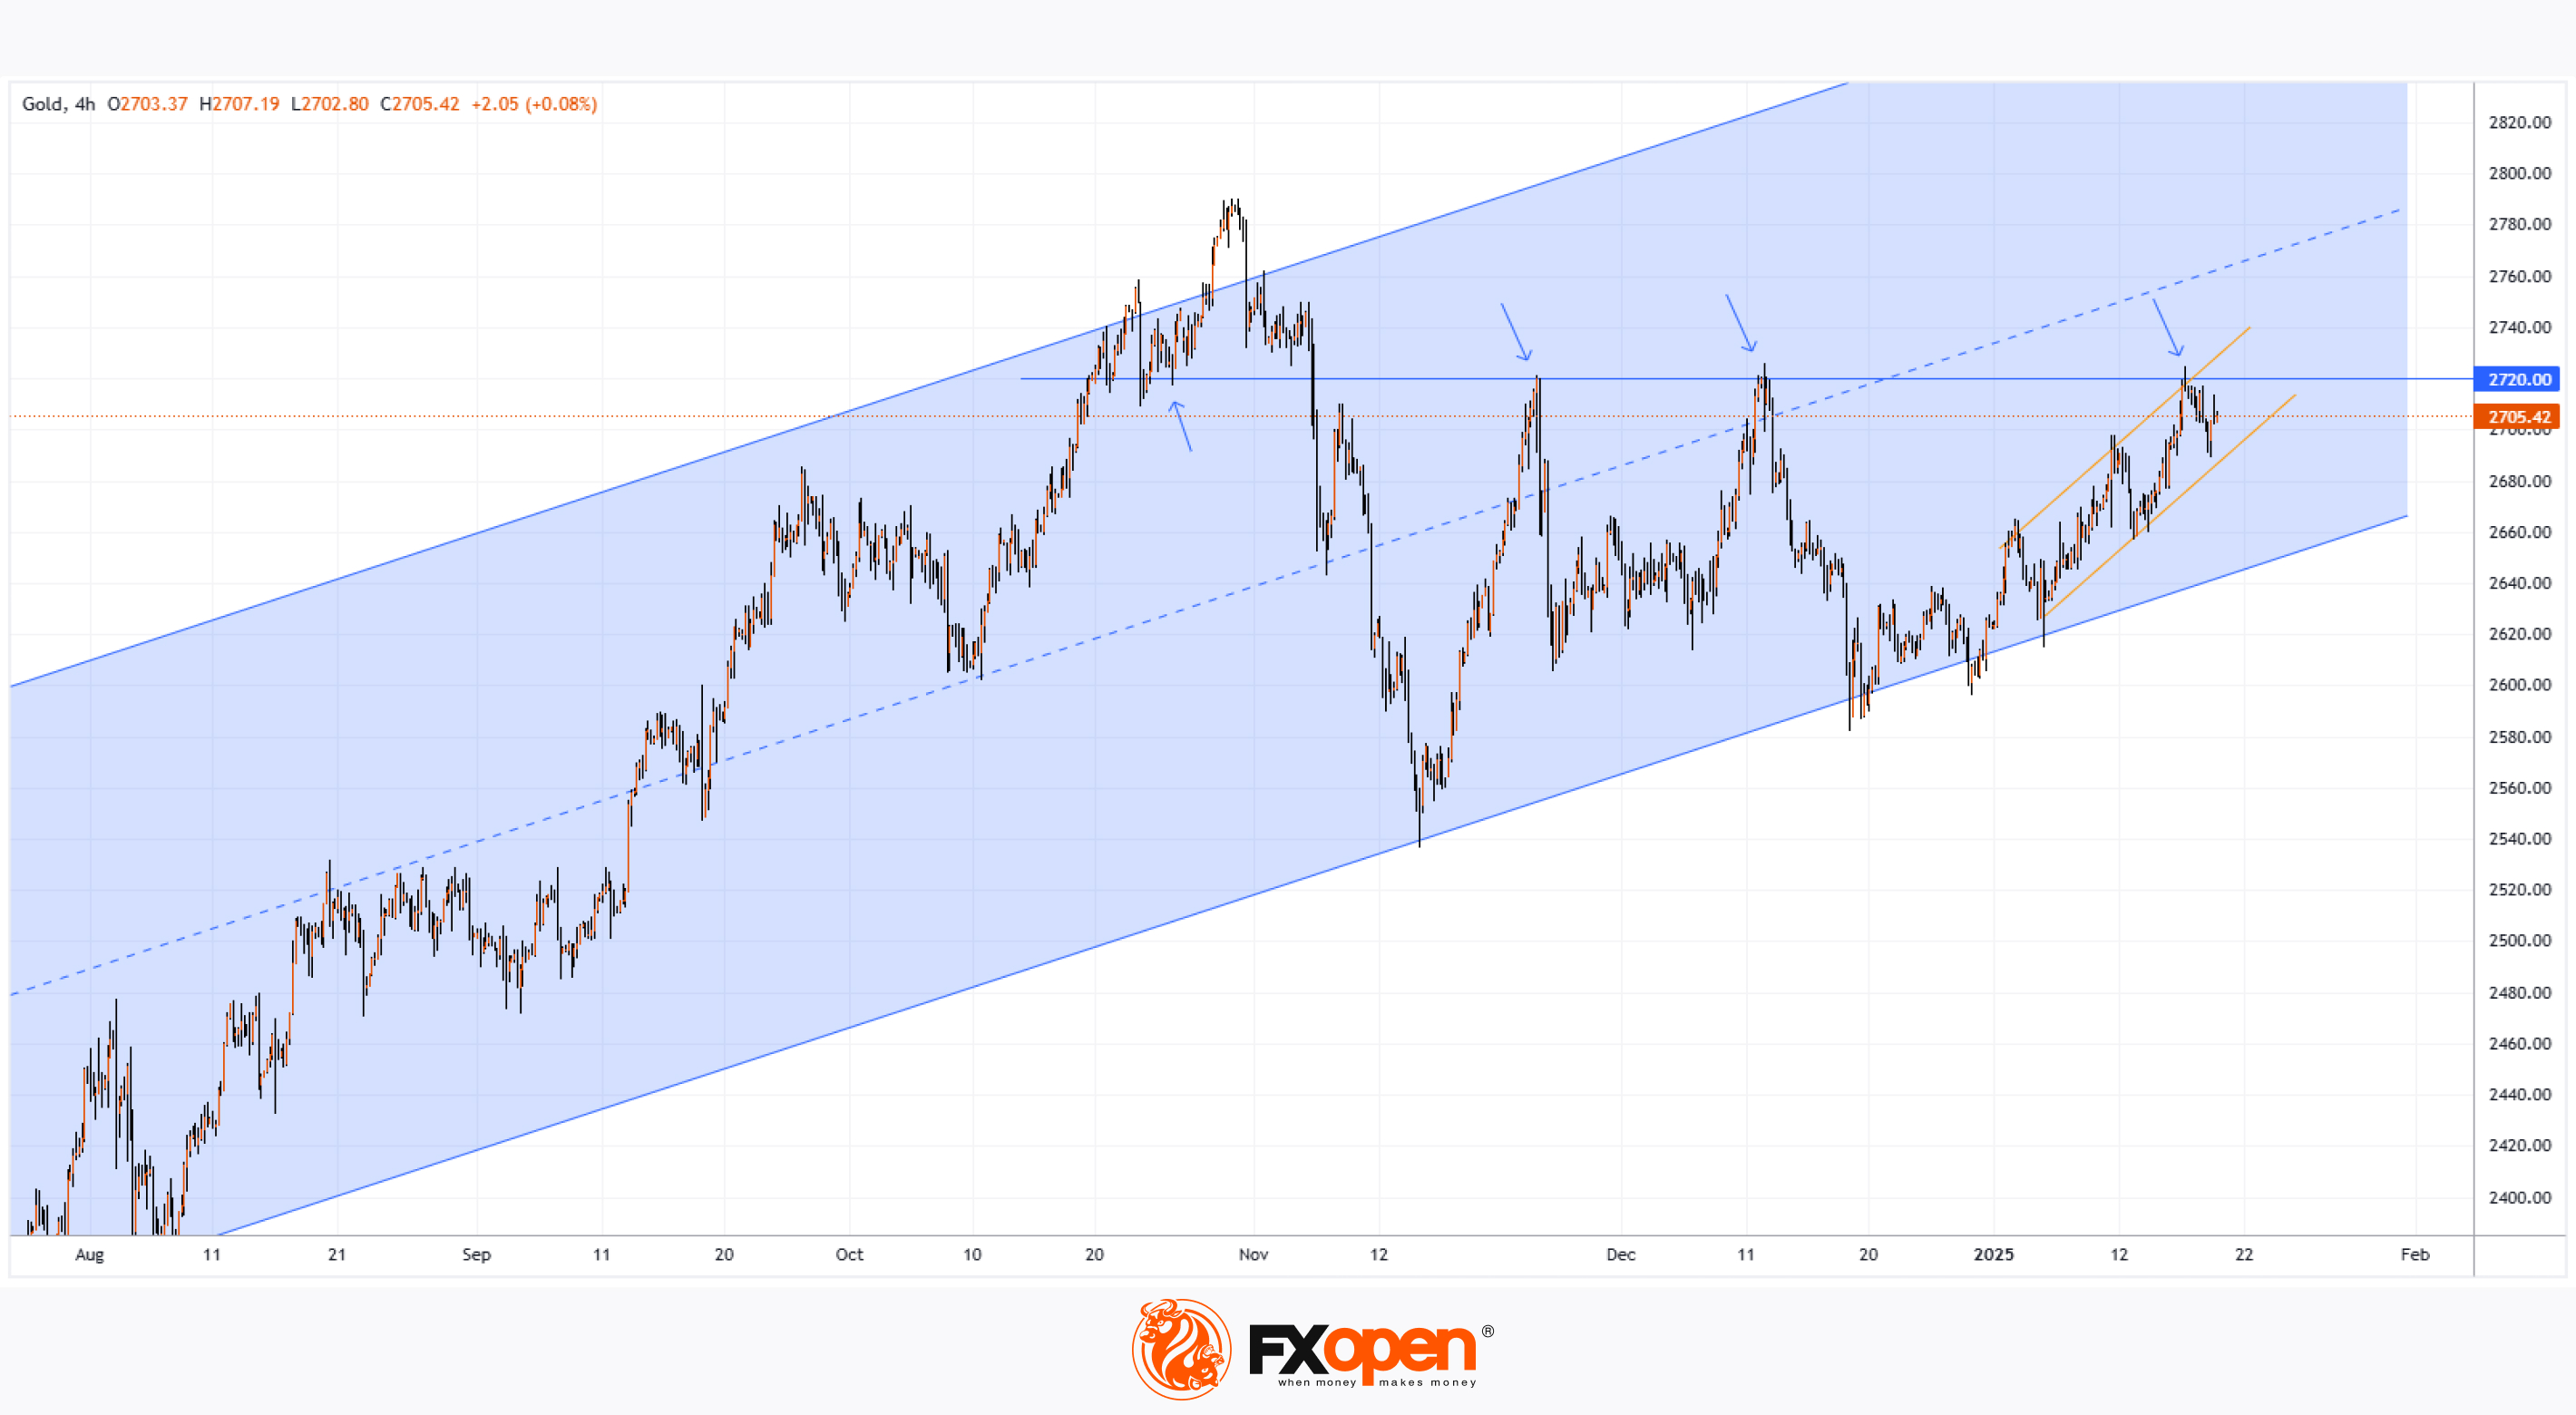
Technical analysis of the XAU/USD chart shows that gold prices are trading within a narrowing triangle:
→ The lower boundary is supported by the ascending channel that began in March 2024.
→ Resistance sits at $2,720 per ounce. Although this level served as support in October, bulls have struggled to break it since December (as indicated by the arrow).
While bullish sentiment dominates the gold market (evident from the orange trend lines relevant for January), Trump’s speech could trigger volatility spikes. These fluctuations may shift the current sentiment balance and spark the formation of a new trend for XAU/USD.
Start trading commodities with tight spreads. Open your trading account now or learn more about trading commodity CFDs with FXOpen.
CFDs are complex instruments and come with a high risk of losing your money.
This article represents the opinion of the Companies operating under the FXOpen brand only. It is not to be construed as an offer, solicitation, or recommendation with respect to products and services provided by the Companies operating under the FXOpen brand, nor is it to be considered financial advice.
XAU/USD Analysis: Gold Prices Poised for a New Trend
Although today is a public holiday in the US (Martin Luther King Jr. Day), financial markets are unlikely to remain calm, as traders and investors will be closely watching the inaugural speech of Donald Trump, the 47th President-elect, scheduled for 20:00 GMT+3.
Trump's speech could impact gold prices in USD, particularly if it addresses:
→ Monetary policy: With current Federal Reserve rates trending lower, non-yielding assets like gold may become more attractive.
→ International trade: If Trump’s remarks on tariffs are particularly bold, gold’s status as a “safe haven” asset could boost its appeal.
→ The dollar's value: Policies aimed at strengthening the USD and reducing national debt may influence gold prices inversely.
Technical analysis of the XAU/USD chart shows that gold prices are trading within a narrowing triangle:
→ The lower boundary is supported by the ascending channel that began in March 2024.
→ Resistance sits at $2,720 per ounce. Although this level served as support in October, bulls have struggled to break it since December (as indicated by the arrow).
While bullish sentiment dominates the gold market (evident from the orange trend lines relevant for January), Trump’s speech could trigger volatility spikes. These fluctuations may shift the current sentiment balance and spark the formation of a new trend for XAU/USD.
Start trading commodities with tight spreads. Open your trading account now or learn more about trading commodity CFDs with FXOpen.
CFDs are complex instruments and come with a high risk of losing your money.
This article represents the opinion of the Companies operating under the FXOpen brand only. It is not to be construed as an offer, solicitation, or recommendation with respect to products and services provided by the Companies operating under the FXOpen brand, nor is it to be considered financial advice.
👍3
#ForexTrading #BankofEngland #InterestRates #USDCAD #USDJPY #GoldPrices #MarketAnalysis #StockMarket
Market Insights with Gary Thomson: CAD, GBP, and JPY Markets, Gold, and Corporate Earnings
In this video, we’ll explore the key economic events, market trends, and corporate news shaping the financial landscape. Get ready for expert insights into forex, commodities, and stocks to help you navigate the week ahead. Let’s dive in!
In this episode:
🔸 What does the latest employment data mean for the British pound and the Bank of England’s policy direction?
🔸 Will December’s inflation data influence the Bank of Canada’s upcoming interest rate decision? Find out how this could impact the USD/CAD pair.
🔸 Will the BOJ raise rates again? Discover the potential impacts on the USD/JPY pair.
🔸Geopolitical tensions and economic uncertainty are driving gold prices. Learn what to watch for in XAU/USD trading.
🔸Big names like Netflix, 3M, Procter & Gamble, and Johnson & Johnson are releasing their quarterly results. Check their expected performance and market implications.
Don’t miss out—gain insights to stay ahead in your trading journey.
https://cutt.ly/Te3G4Ok6
To take advantage of price fluctuations in the foreign exchange markets, consider enlisting the services of a reliable broker like FXOpen.
⚠️
This forecast represents FXOpen Companies opinion only, it should not be construed as an offer, invitation or recommendation in respect to FXOpen Companies products and services or as financial advice.
Market Insights with Gary Thomson: CAD, GBP, and JPY Markets, Gold, and Corporate Earnings
In this video, we’ll explore the key economic events, market trends, and corporate news shaping the financial landscape. Get ready for expert insights into forex, commodities, and stocks to help you navigate the week ahead. Let’s dive in!
In this episode:
🔸 What does the latest employment data mean for the British pound and the Bank of England’s policy direction?
🔸 Will December’s inflation data influence the Bank of Canada’s upcoming interest rate decision? Find out how this could impact the USD/CAD pair.
🔸 Will the BOJ raise rates again? Discover the potential impacts on the USD/JPY pair.
🔸Geopolitical tensions and economic uncertainty are driving gold prices. Learn what to watch for in XAU/USD trading.
🔸Big names like Netflix, 3M, Procter & Gamble, and Johnson & Johnson are releasing their quarterly results. Check their expected performance and market implications.
Don’t miss out—gain insights to stay ahead in your trading journey.
https://cutt.ly/Te3G4Ok6
To take advantage of price fluctuations in the foreign exchange markets, consider enlisting the services of a reliable broker like FXOpen.
⚠️
This forecast represents FXOpen Companies opinion only, it should not be construed as an offer, invitation or recommendation in respect to FXOpen Companies products and services or as financial advice.
YouTube
Market Insights with Gary Thomson: CAD, GBP, and JPY Markets, Gold, and Corporate Earnings
In this video, we’ll explore the key economic events, market trends, and corporate news shaping the financial landscape. Get ready for expert insights into forex, commodities, and stocks to help you navigate the week ahead. Let’s dive in!
In this episode:…
In this episode:…
👍3
#oilprices #MarketUpdates #marketanalysis #commodities
Brent Oil Price Drops from 2025 High
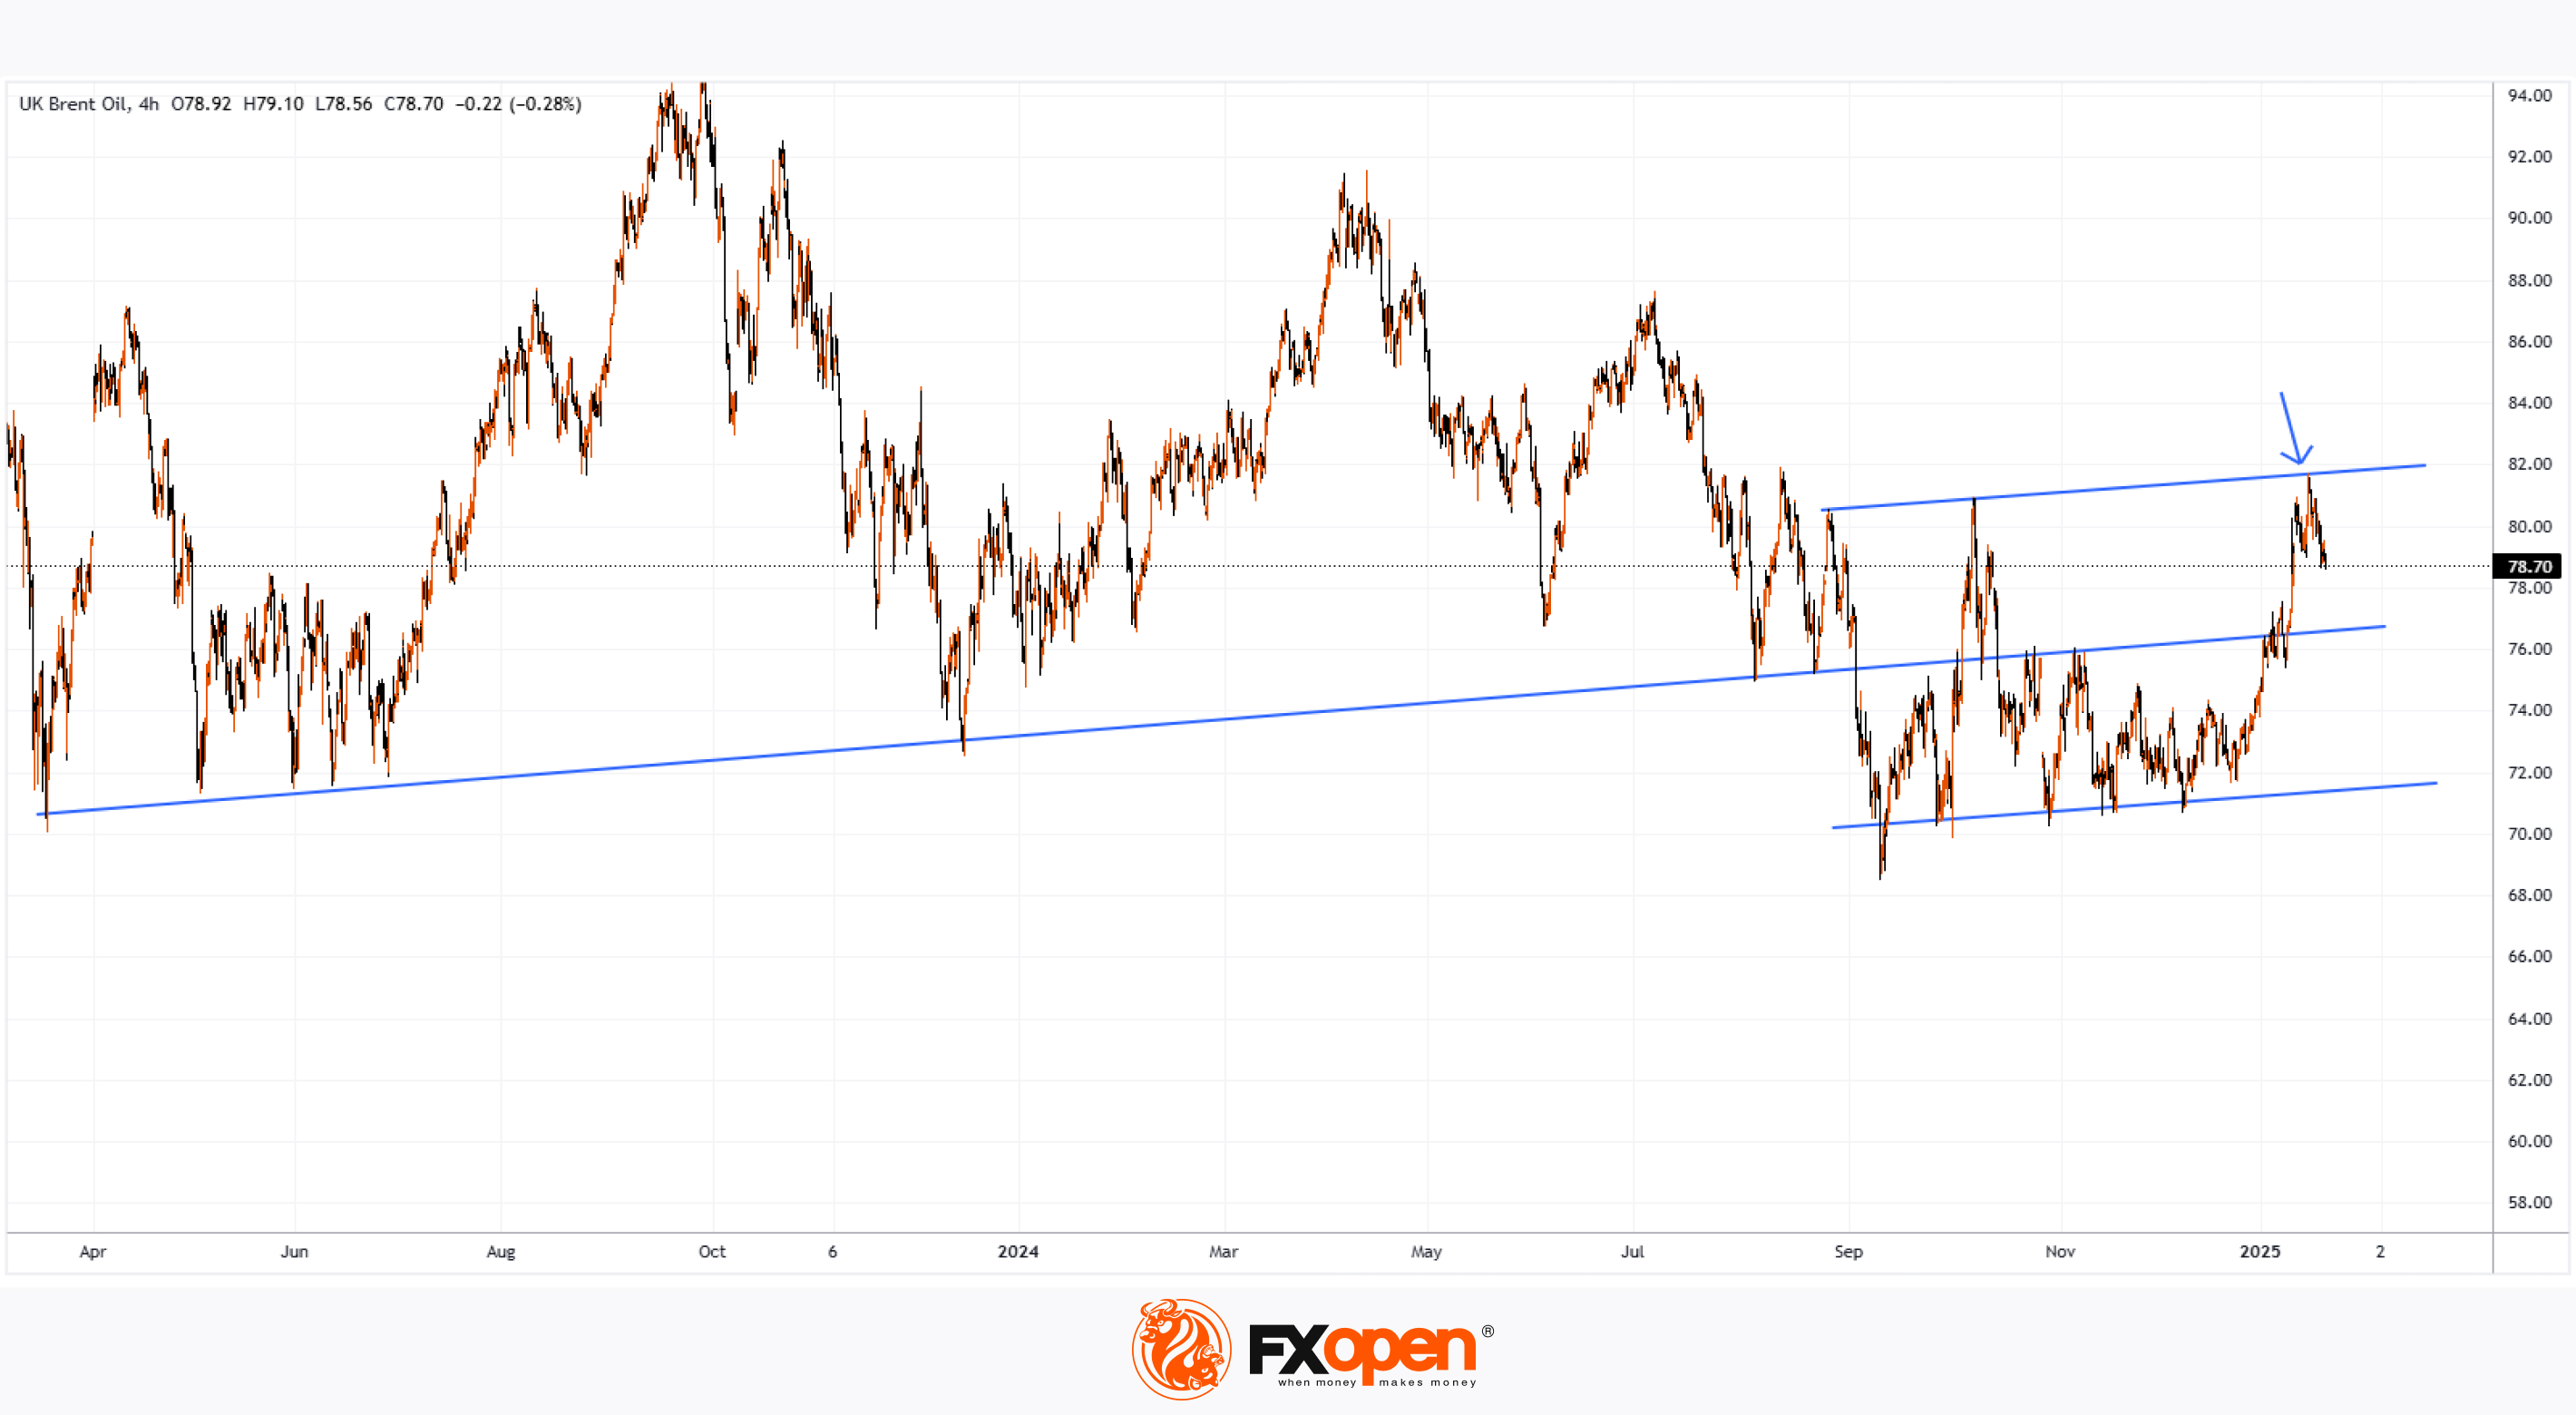
If you follow FXOpen’s publications, you may recall how in 2024, we repeatedly analysed the XBR/USD chart and drew several key parallel lines. For example, in our publication at the end of November.
This is significant because the uppermost of the three lines drawn last year acted as resistance, where the current peak of 2025 was formed, as shown by the arrow.
Price fluctuations in the context of these three lines can be interpreted as follows:
→ The middle line suggests the zone where the fair value of a barrel is likely to be. This is supported by the fact that at the beginning of 2025, the price consolidated near the middle line around the $76 mark;
→ The rise to the upper line indicated an overbought market condition.
Subsequently, like a pendulum, the price of Brent oil began to move in the opposite direction – down towards the middle line, where the fair value is presumably located. The current dominance of sellers is supported by:
→ Trump’s intentions to develop new oil fields, increase exports, and move away from the “green transition”;
→ A reduction in geopolitical tensions – notably, the ceasefire and prisoner exchanges between Israel and Hamas.
It is possible that the sellers’ momentum will continue, as the revival of the US economy through cheap oil may be part of the strategic plans of the new team in the White House, which would drive the trend towards the middle line on the XBR/USD chart.
Start trading commodities with tight spreads. Open your trading account now or learn more about trading commodity CFDs with FXOpen.
CFDs are complex instruments and come with a high risk of losing your money.
This article represents the opinion of the Companies operating under the FXOpen brand only. It is not to be construed as an offer, solicitation, or recommendation with respect to products and services provided by the Companies operating under the FXOpen brand, nor is it to be considered financial advice.
Brent Oil Price Drops from 2025 High
If you follow FXOpen’s publications, you may recall how in 2024, we repeatedly analysed the XBR/USD chart and drew several key parallel lines. For example, in our publication at the end of November.
This is significant because the uppermost of the three lines drawn last year acted as resistance, where the current peak of 2025 was formed, as shown by the arrow.
Price fluctuations in the context of these three lines can be interpreted as follows:
→ The middle line suggests the zone where the fair value of a barrel is likely to be. This is supported by the fact that at the beginning of 2025, the price consolidated near the middle line around the $76 mark;
→ The rise to the upper line indicated an overbought market condition.
Subsequently, like a pendulum, the price of Brent oil began to move in the opposite direction – down towards the middle line, where the fair value is presumably located. The current dominance of sellers is supported by:
→ Trump’s intentions to develop new oil fields, increase exports, and move away from the “green transition”;
→ A reduction in geopolitical tensions – notably, the ceasefire and prisoner exchanges between Israel and Hamas.
It is possible that the sellers’ momentum will continue, as the revival of the US economy through cheap oil may be part of the strategic plans of the new team in the White House, which would drive the trend towards the middle line on the XBR/USD chart.
Start trading commodities with tight spreads. Open your trading account now or learn more about trading commodity CFDs with FXOpen.
CFDs are complex instruments and come with a high risk of losing your money.
This article represents the opinion of the Companies operating under the FXOpen brand only. It is not to be construed as an offer, solicitation, or recommendation with respect to products and services provided by the Companies operating under the FXOpen brand, nor is it to be considered financial advice.
👍3
#StockMarket #MarketUpdates #marketanalysis #NASDAQ
Nasdaq 100: Bearish Signals Amid Increased Volatility
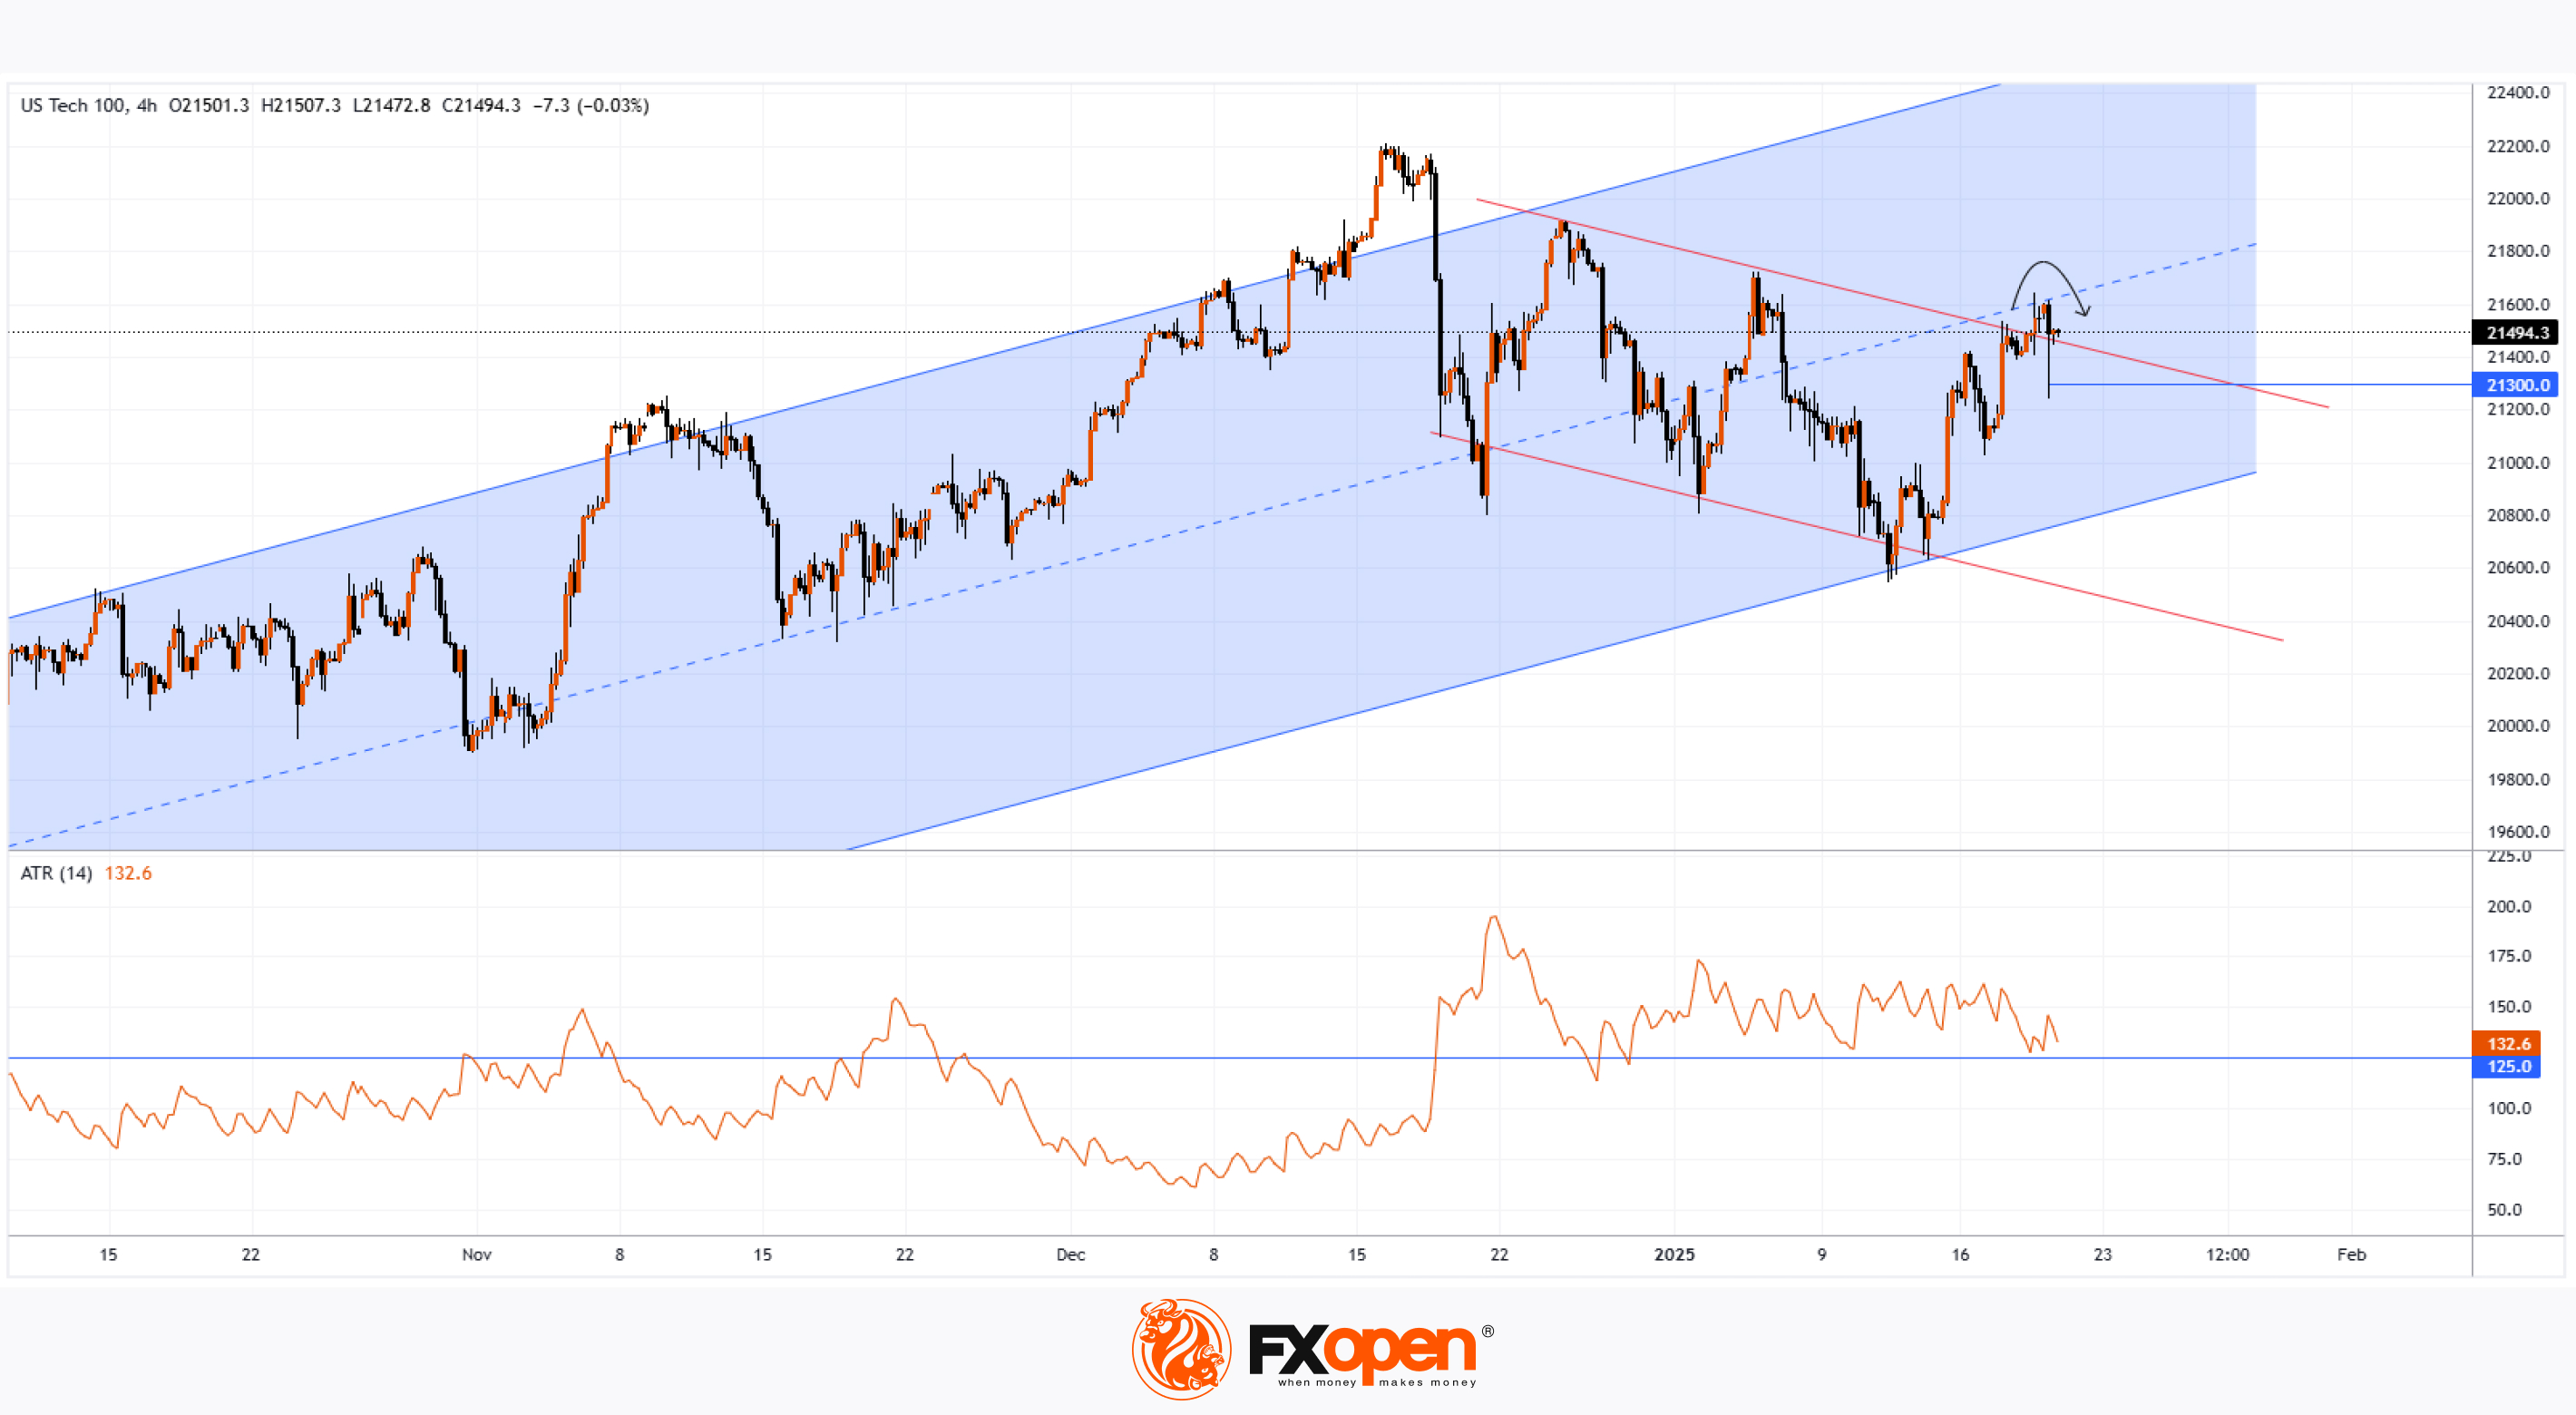
As revealed by the technical analysis of the 4-hour Nasdaq 100 chart (US Tech 100 mini on FXOpen), the ATR indicator has been above 125 since the start of 2025, in contrast to late 2024 when it was mostly below this level. This reflects heightened volatility in the US stock market due to:
→ Trump’s inauguration: The president has already signed an executive order withdrawing the US from the World Health Organization. Market participants anticipate further decisions in the near future that could significantly impact the nation’s economy.
→ Earnings season: Companies are releasing reports, prompting analysts to revise forecasts. For instance, a Jefferies analyst downgraded Apple’s (AAPL) stock rating and lowered the price target from $211 to $200, citing potentially weak revenue figures. Apple’s quarterly report is due on 30 January.
On the Nasdaq 100 chart (US Tech 100 mini on FXOpen), a bearish move (indicated by the arrow) is notable for:
→ Indicating that the median line of the ascending channel has turned into resistance;
→ Suggesting that the apparent bullish breakout above the upper red line now seems to be a false breakout.
The long lower wick on the far-right bearish candle points to strong demand around the 21,300 level. However, will buyers remain active if Trump’s actions and corporate earnings reports increase risks for them?
Trade global index CFDs with zero commission and tight spreads. Open your FXOpen account now or learn more about trading index CFDs with FXOpen.
CFDs are complex instruments and come with a high risk of losing your money.
This article represents the opinion of the Companies operating under the FXOpen brand only. It is not to be construed as an offer, solicitation, or recommendation with respect to products and services provided by the Companies operating under the FXOpen brand, nor is it to be considered financial advice.
Nasdaq 100: Bearish Signals Amid Increased Volatility
As revealed by the technical analysis of the 4-hour Nasdaq 100 chart (US Tech 100 mini on FXOpen), the ATR indicator has been above 125 since the start of 2025, in contrast to late 2024 when it was mostly below this level. This reflects heightened volatility in the US stock market due to:
→ Trump’s inauguration: The president has already signed an executive order withdrawing the US from the World Health Organization. Market participants anticipate further decisions in the near future that could significantly impact the nation’s economy.
→ Earnings season: Companies are releasing reports, prompting analysts to revise forecasts. For instance, a Jefferies analyst downgraded Apple’s (AAPL) stock rating and lowered the price target from $211 to $200, citing potentially weak revenue figures. Apple’s quarterly report is due on 30 January.
On the Nasdaq 100 chart (US Tech 100 mini on FXOpen), a bearish move (indicated by the arrow) is notable for:
→ Indicating that the median line of the ascending channel has turned into resistance;
→ Suggesting that the apparent bullish breakout above the upper red line now seems to be a false breakout.
The long lower wick on the far-right bearish candle points to strong demand around the 21,300 level. However, will buyers remain active if Trump’s actions and corporate earnings reports increase risks for them?
Trade global index CFDs with zero commission and tight spreads. Open your FXOpen account now or learn more about trading index CFDs with FXOpen.
CFDs are complex instruments and come with a high risk of losing your money.
This article represents the opinion of the Companies operating under the FXOpen brand only. It is not to be construed as an offer, solicitation, or recommendation with respect to products and services provided by the Companies operating under the FXOpen brand, nor is it to be considered financial advice.
👍4
#stockmarket #MarketUpdates #MarketNews
Chinese Stocks Decline Amid Tariff Threats
According to Bloomberg, President Donald Trump raised the possibility of imposing tariffs on China during his second day in office.
“We’re considering a 10% tariff on China,” Trump announced during a White House event on Tuesday, indicating February 1 as a potential start date.
During his election campaign, Trump had mentioned tariffs as high as 60%, and the prospect of transitioning from campaign rhetoric to real action is driving bearish sentiment.
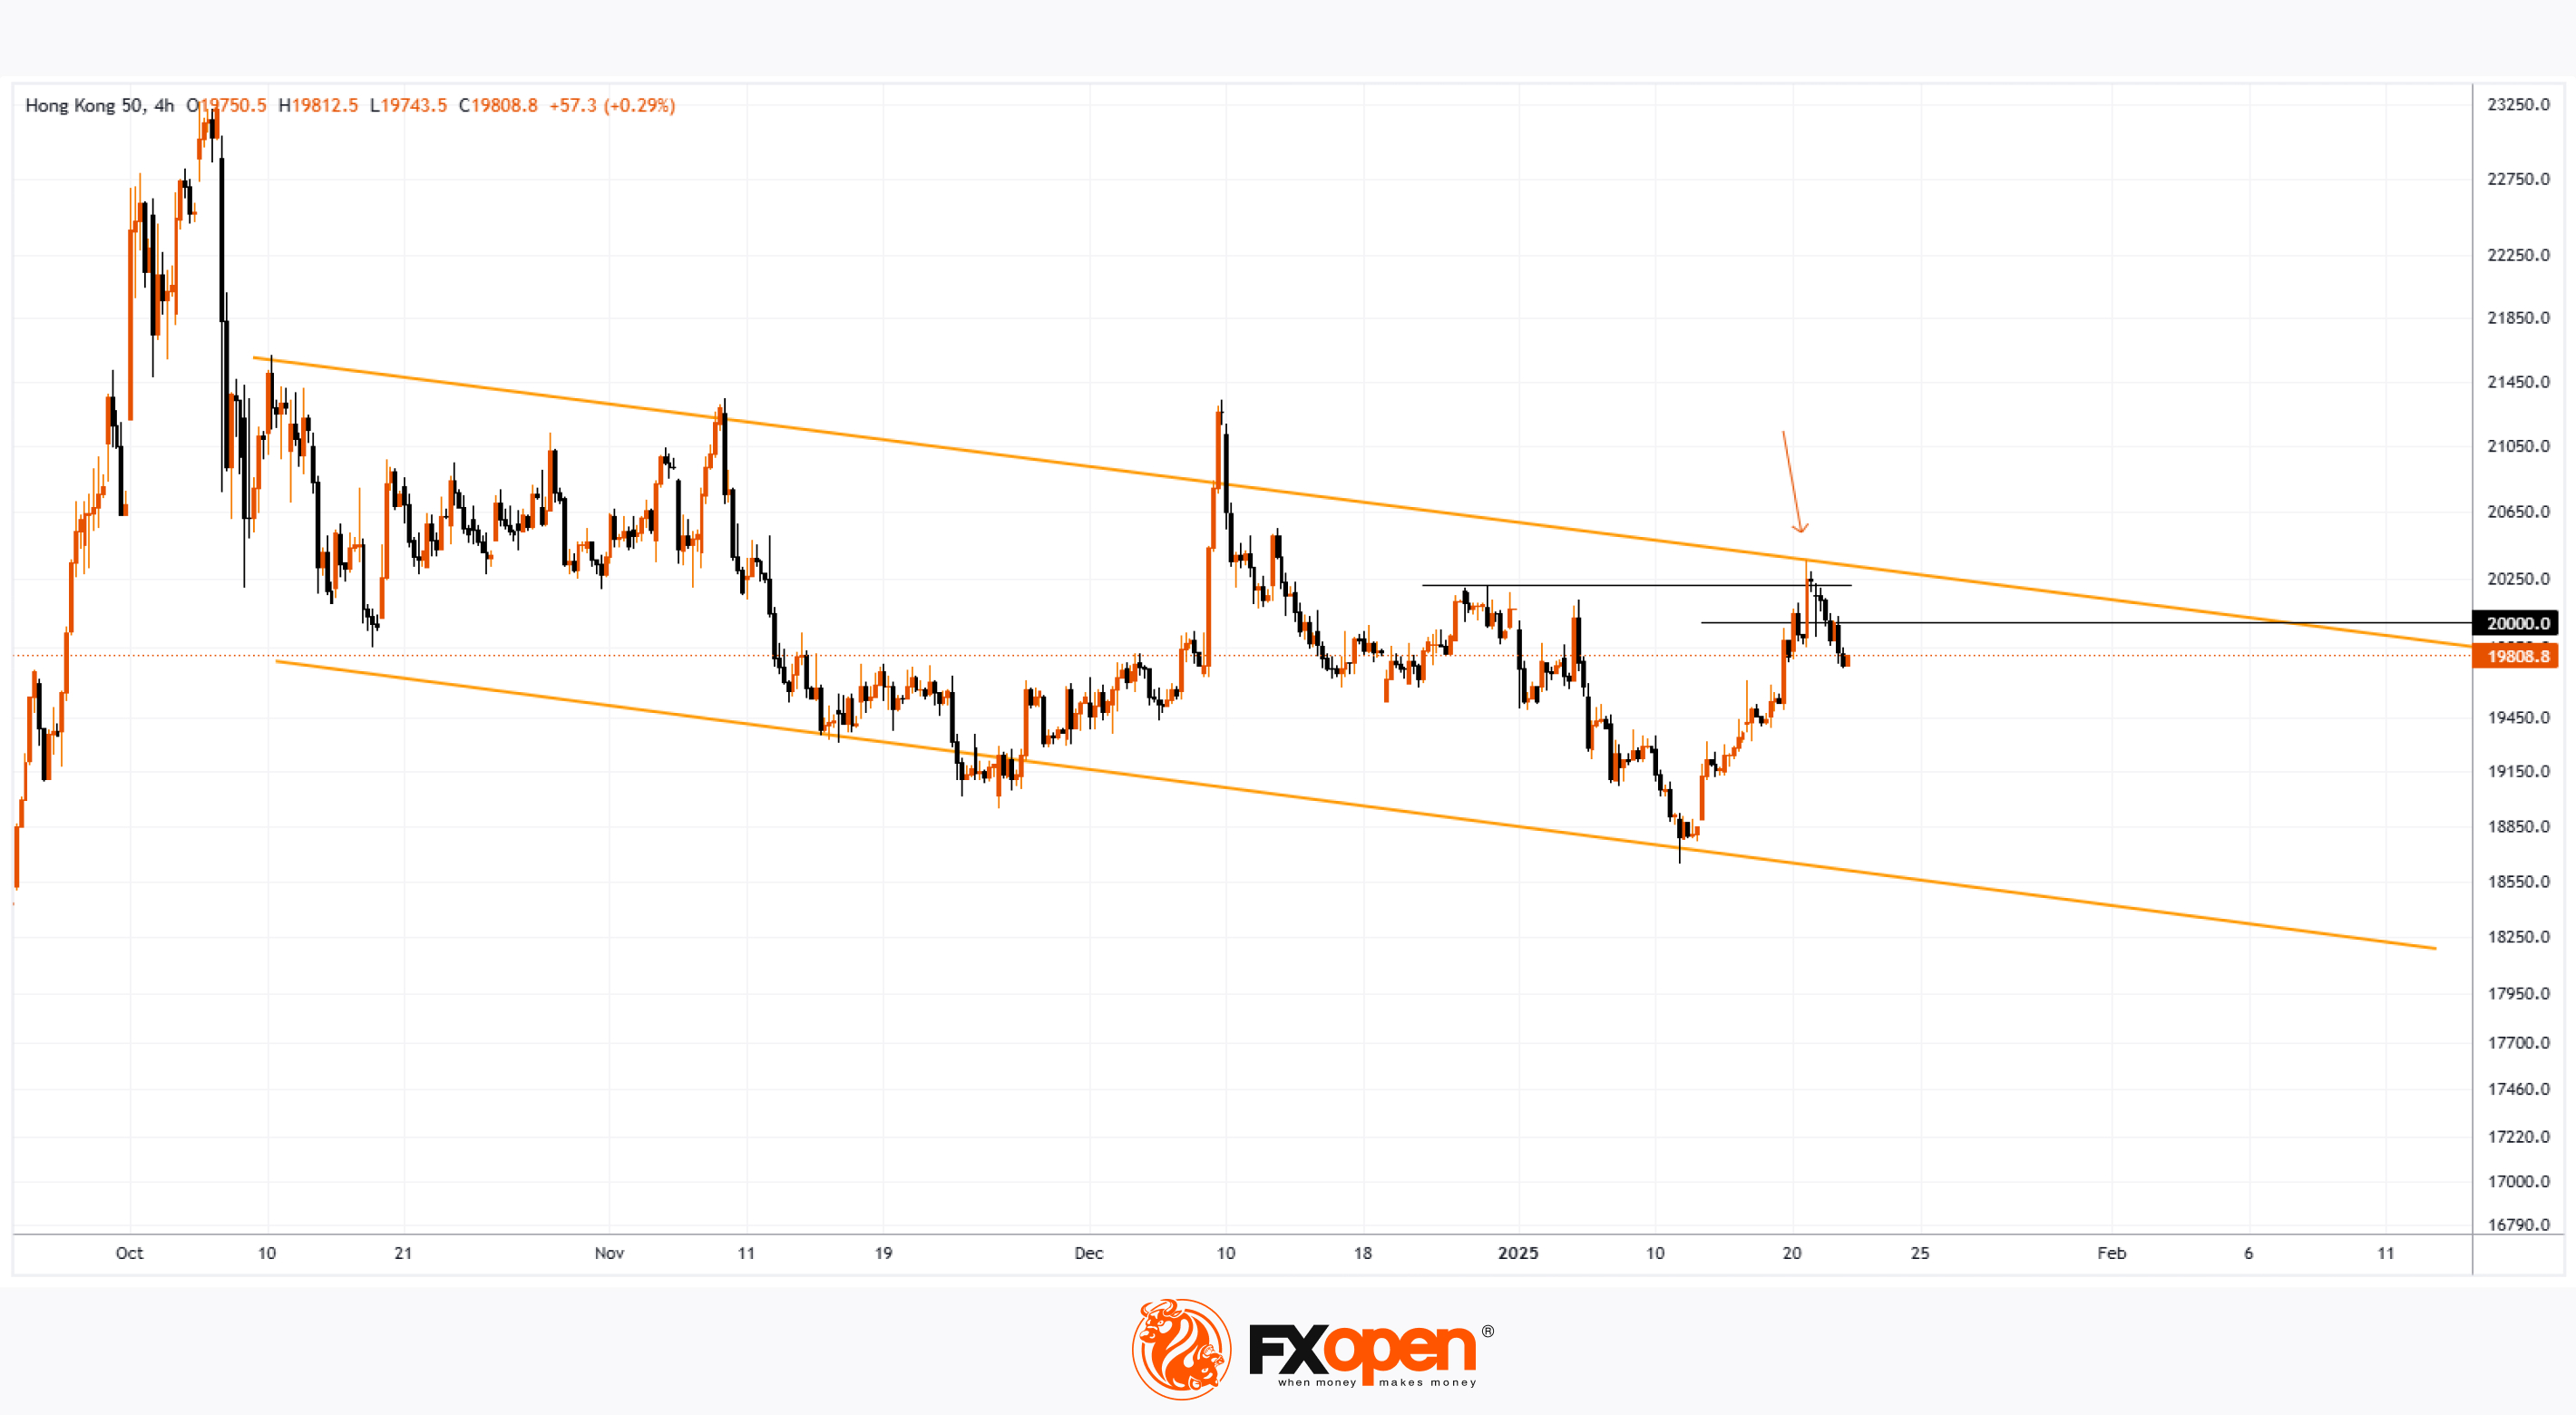
According to the technical analysis of the Hang Seng Index (Hong Kong 50 on FXOpen), price fluctuations have been forming a downward trend since October. The formation of the 2025 peak (indicated with an arrow) signals bearish tendencies, as the price failed to hold above:
→ The previous high from December, near 20,210, indicating a false breakout.
→ The psychological level of 20,000.
If Trump follows through on his promises, it is reasonable to anticipate that bears may take control of lower levels in the coming sessions.
Trade global index CFDs with zero commission and tight spreads. Open your FXOpen account now or learn more about trading index CFDs with FXOpen.
CFDs are complex instruments and come with a high risk of losing your money.
This article represents the opinion of the Companies operating under the FXOpen brand only. It is not to be construed as an offer, solicitation, or recommendation with respect to products and services provided by the Companies operating under the FXOpen brand, nor is it to be considered financial advice.
Chinese Stocks Decline Amid Tariff Threats
According to Bloomberg, President Donald Trump raised the possibility of imposing tariffs on China during his second day in office.
“We’re considering a 10% tariff on China,” Trump announced during a White House event on Tuesday, indicating February 1 as a potential start date.
During his election campaign, Trump had mentioned tariffs as high as 60%, and the prospect of transitioning from campaign rhetoric to real action is driving bearish sentiment.
According to the technical analysis of the Hang Seng Index (Hong Kong 50 on FXOpen), price fluctuations have been forming a downward trend since October. The formation of the 2025 peak (indicated with an arrow) signals bearish tendencies, as the price failed to hold above:
→ The previous high from December, near 20,210, indicating a false breakout.
→ The psychological level of 20,000.
If Trump follows through on his promises, it is reasonable to anticipate that bears may take control of lower levels in the coming sessions.
Trade global index CFDs with zero commission and tight spreads. Open your FXOpen account now or learn more about trading index CFDs with FXOpen.
CFDs are complex instruments and come with a high risk of losing your money.
This article represents the opinion of the Companies operating under the FXOpen brand only. It is not to be construed as an offer, solicitation, or recommendation with respect to products and services provided by the Companies operating under the FXOpen brand, nor is it to be considered financial advice.
👍2
#stockmarket #stocktrading #NFLX #Netflix
Netflix (NFLX) Shares Surge After Earnings Report
After the close of the main trading session on the stock market on Tuesday, Netflix released its Q4 2024 results. The report was exceptionally strong:
→ Analysts expected the company to add 9.18 million paid subscribers during the quarter, but the actual figure reached 18.91 million, which is 15.9% more than in the same quarter last year.
→ Total subscribers reached 300 million.
→ Earnings per share amounted to $4.27 (expected: $4.20).
→ Gross revenue: actual = $10.25 billion, expected = $10.11 billion.
The company’s success was supported by products such as Squid Game, Bridgerton, and Nobody Wants This. During the quarter, 55% of customers chose ad-supported plans, and subscriptions to this plan grew by 30%. Netflix executive Gregory Peters believes that advertising revenue could double between 2024 and 2025.
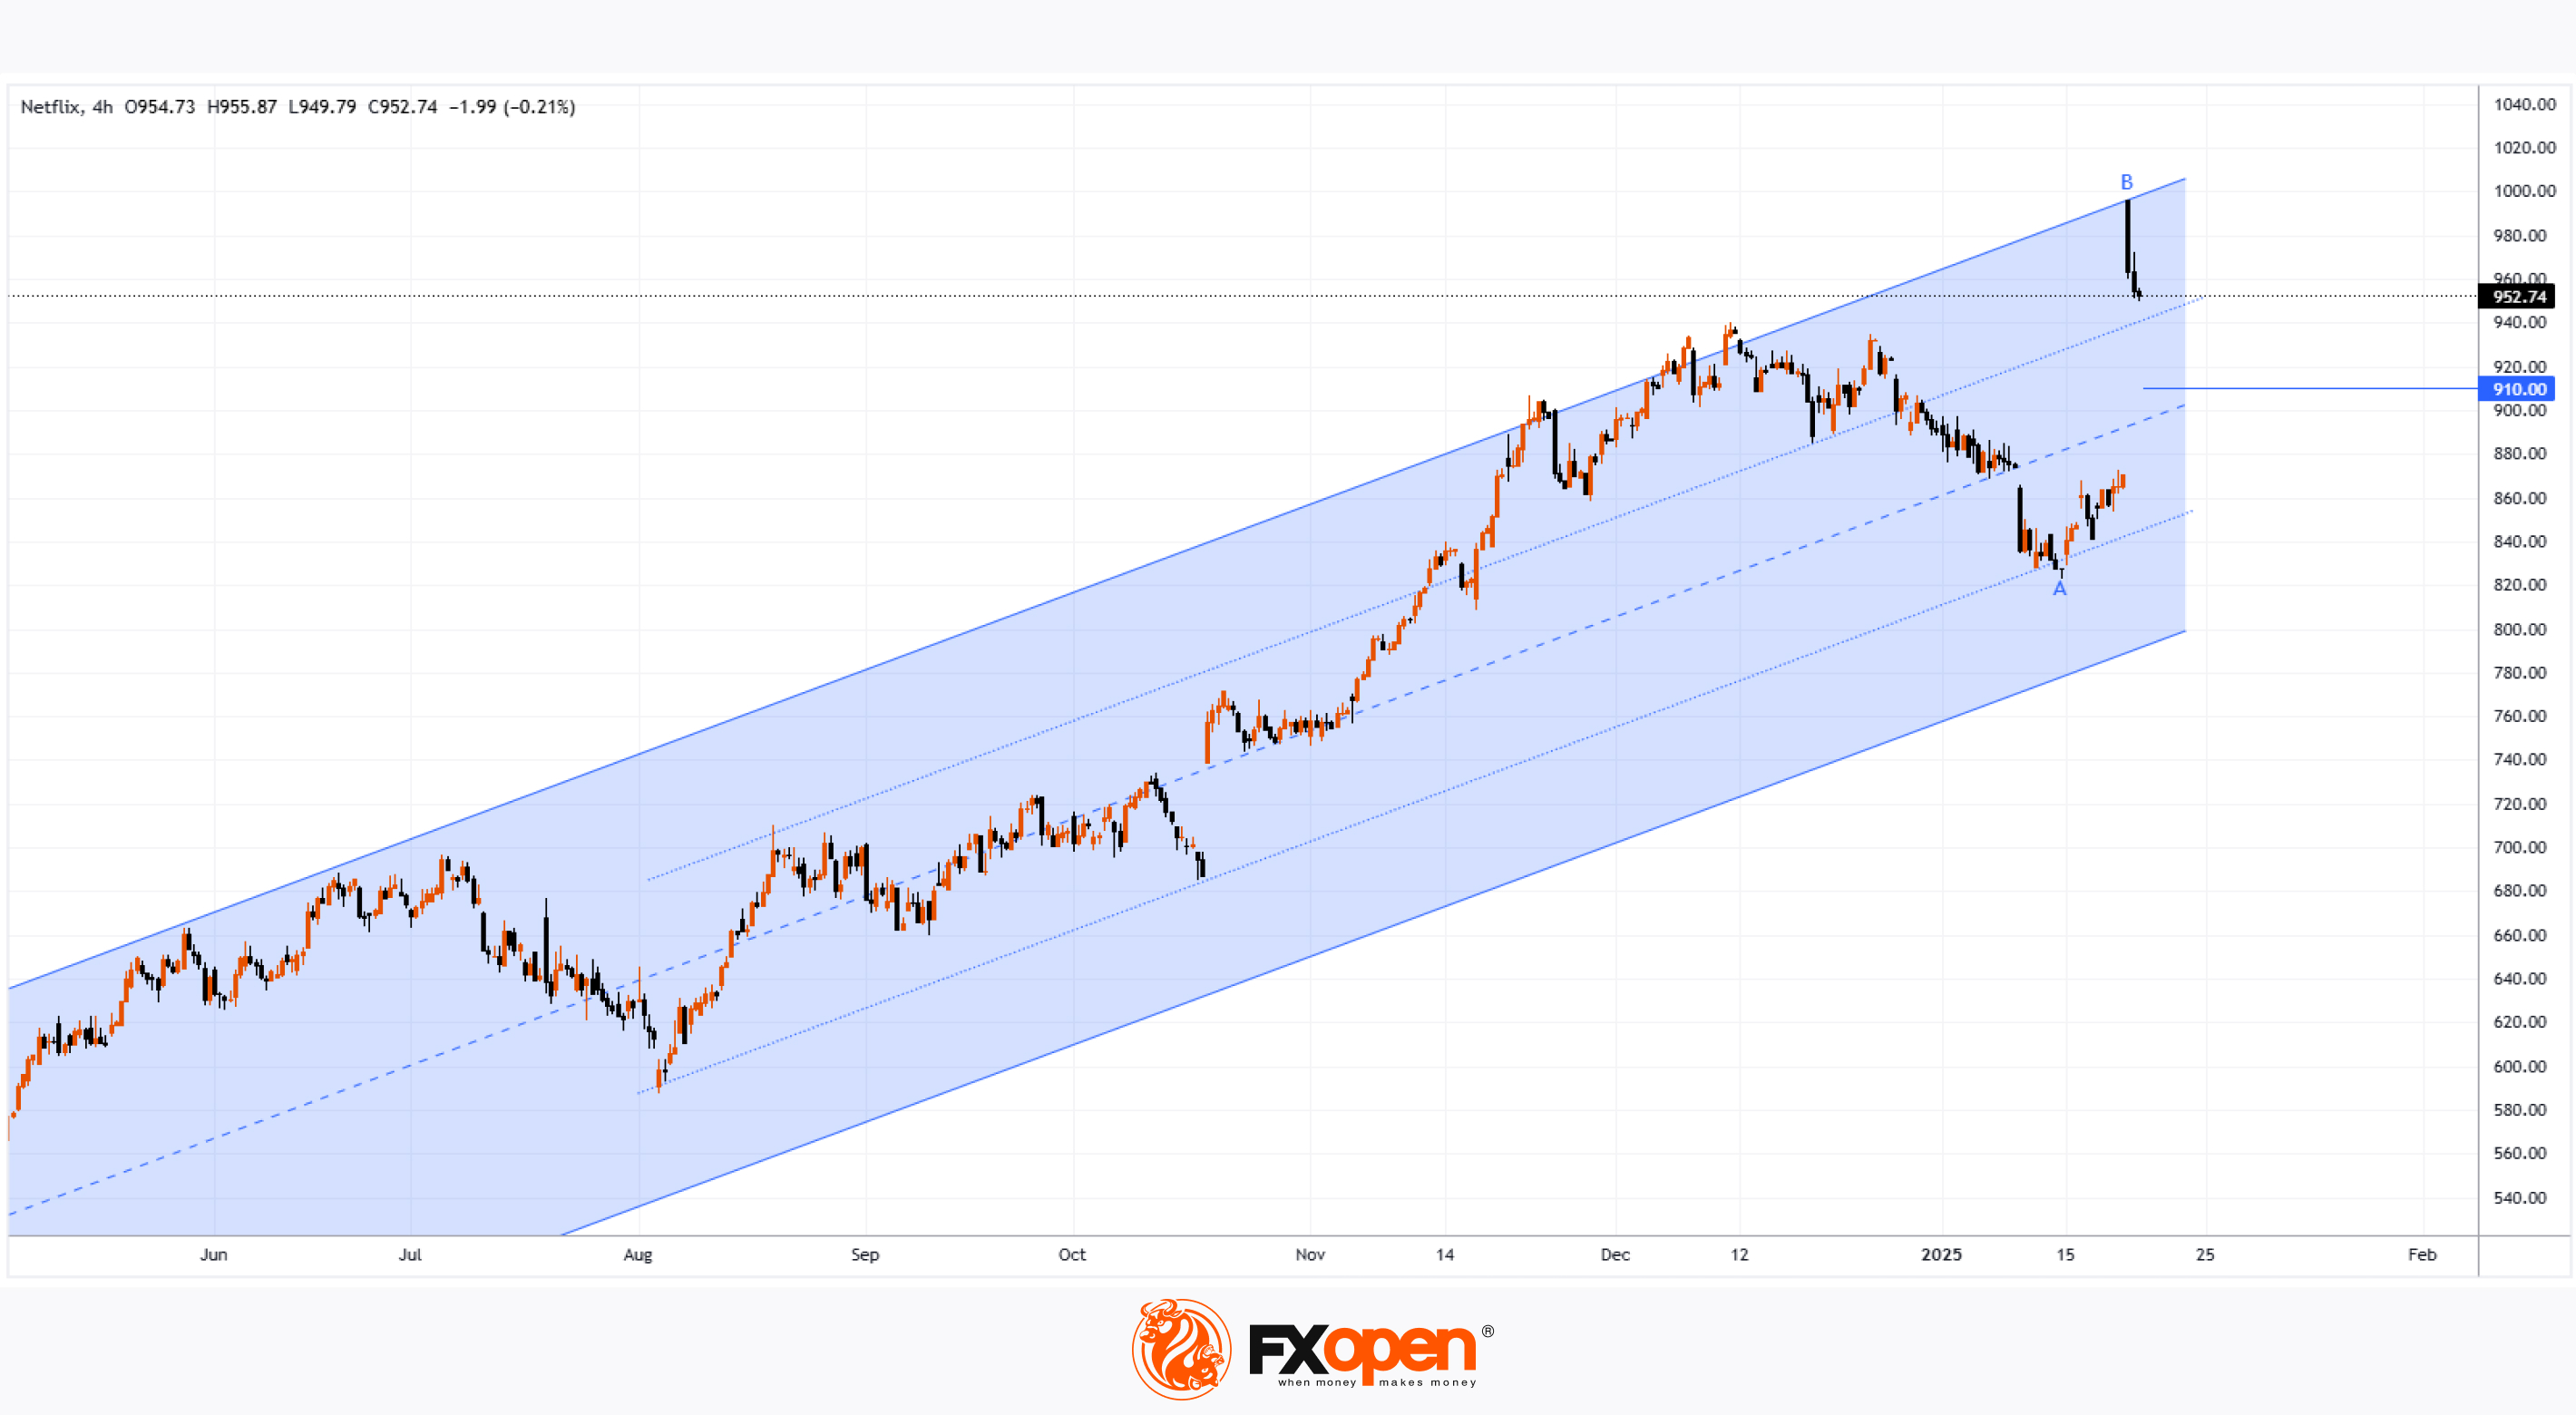
As shown by the Netflix (NFLX) stock chart, the market has experienced increased volatility following the release of the report. On 22 January:
→ Trading opened with a wide bullish gap – approximately 14% higher than the closing price on 21 January.
→ However, during yesterday’s trading session, shares fell by approximately 4%, indicating that the initial reaction to the positive news might have been overly optimistic.
According to technical analysis of the NFLX chart, it is reasonable to assume that after a rise towards the psychological level of $1,000, the market is vulnerable to a correction. After touching the upper boundary of the ascending channel, the price could retreat to its median around the $910 level, which also corresponds to a 50% retracement of the A→B impulse.
According to TipRanks:
→ The average price target for NFLX shares in 12 months is $986.
→ 20 out of 29 analysts recommend buying NFLX shares.
Trade global index CFDs with zero commission and tight spreads. Open your FXOpen account now or learn more about trading index CFDs with FXOpen.
CFDs are complex instruments and come with a high risk of losing your money.
This article represents the opinion of the Companies operating under the FXOpen brand only. It is not to be construed as an offer, solicitation, or recommendation with respect to products and services provided by the Companies operating under the FXOpen brand, nor is it to be considered financial advice.
Netflix (NFLX) Shares Surge After Earnings Report
After the close of the main trading session on the stock market on Tuesday, Netflix released its Q4 2024 results. The report was exceptionally strong:
→ Analysts expected the company to add 9.18 million paid subscribers during the quarter, but the actual figure reached 18.91 million, which is 15.9% more than in the same quarter last year.
→ Total subscribers reached 300 million.
→ Earnings per share amounted to $4.27 (expected: $4.20).
→ Gross revenue: actual = $10.25 billion, expected = $10.11 billion.
The company’s success was supported by products such as Squid Game, Bridgerton, and Nobody Wants This. During the quarter, 55% of customers chose ad-supported plans, and subscriptions to this plan grew by 30%. Netflix executive Gregory Peters believes that advertising revenue could double between 2024 and 2025.
As shown by the Netflix (NFLX) stock chart, the market has experienced increased volatility following the release of the report. On 22 January:
→ Trading opened with a wide bullish gap – approximately 14% higher than the closing price on 21 January.
→ However, during yesterday’s trading session, shares fell by approximately 4%, indicating that the initial reaction to the positive news might have been overly optimistic.
According to technical analysis of the NFLX chart, it is reasonable to assume that after a rise towards the psychological level of $1,000, the market is vulnerable to a correction. After touching the upper boundary of the ascending channel, the price could retreat to its median around the $910 level, which also corresponds to a 50% retracement of the A→B impulse.
According to TipRanks:
→ The average price target for NFLX shares in 12 months is $986.
→ 20 out of 29 analysts recommend buying NFLX shares.
Trade global index CFDs with zero commission and tight spreads. Open your FXOpen account now or learn more about trading index CFDs with FXOpen.
CFDs are complex instruments and come with a high risk of losing your money.
This article represents the opinion of the Companies operating under the FXOpen brand only. It is not to be construed as an offer, solicitation, or recommendation with respect to products and services provided by the Companies operating under the FXOpen brand, nor is it to be considered financial advice.
👍2
#stockmarket #stocktrading #DAX40 #MarketUpdates
Germany’s DAX 40 Stock Index Hits Record High
The country’s Finance Minister, Jörg Kukies, stated in an interview with CNBC that it is crucial for Germany to enter a period of economic growth, adding that structural deficiencies need to be addressed.
“We have just received another downward revision of growth forecasts from the IMF,” he said at the World Economic Forum in Davos. The International Monetary Fund (IMF) now projects Germany’s GDP growth at 0.3% in 2025 and 1.1% in 2026, according to the January update of its World Economic Outlook. This marks a sharp decline from the October forecast of 0.8% growth in 2025.
Germany’s annual gross domestic product contracted in both 2023 and 2024. Quarterly GDP figures were also modest, although the economy has so far avoided a technical recession.
Kukies also remarked that domestic German companies are “under stress” but continue to perform “very well” on the global market, seemingly referencing the rise of the DAX 40 stock index (Germany 40 mini on FXOpen). Indeed, yesterday the index surpassed the 21,300-point level for the first time in history.
Technical analysis of the DAX 40 stock index chart (Germany 40 mini on FXOpen) indicates that the price is forming two ascending channels. While rising within the steeper purple channel, the price has exceeded the upper boundary of the blue channel.
However, given that the price has not yet reached the upper boundary of the purple channel (as indicated by the arrow), it is reasonable to suggest that bullish momentum may be waning. If so, a possible scenario could involve a correction with a bearish breakout of the lower purple line, leading the price back into the blue channel. It is also possible that there will be one more attempt to set a new record, accompanied by the formation of bearish divergence on the RSI indicator.
Trade global index CFDs with zero commission and tight spreads. Open your FXOpen account now or learn more about trading index CFDs with FXOpen.
CFDs are complex instruments and come with a high risk of losing your money.
This article represents the opinion of the Companies operating under the FXOpen brand only. It is not to be construed as an offer, solicitation, or recommendation with respect to products and services provided by the Companies operating under the FXOpen brand, nor is it to be considered financial advice.
Germany’s DAX 40 Stock Index Hits Record High
The country’s Finance Minister, Jörg Kukies, stated in an interview with CNBC that it is crucial for Germany to enter a period of economic growth, adding that structural deficiencies need to be addressed.
“We have just received another downward revision of growth forecasts from the IMF,” he said at the World Economic Forum in Davos. The International Monetary Fund (IMF) now projects Germany’s GDP growth at 0.3% in 2025 and 1.1% in 2026, according to the January update of its World Economic Outlook. This marks a sharp decline from the October forecast of 0.8% growth in 2025.
Germany’s annual gross domestic product contracted in both 2023 and 2024. Quarterly GDP figures were also modest, although the economy has so far avoided a technical recession.
Kukies also remarked that domestic German companies are “under stress” but continue to perform “very well” on the global market, seemingly referencing the rise of the DAX 40 stock index (Germany 40 mini on FXOpen). Indeed, yesterday the index surpassed the 21,300-point level for the first time in history.
Technical analysis of the DAX 40 stock index chart (Germany 40 mini on FXOpen) indicates that the price is forming two ascending channels. While rising within the steeper purple channel, the price has exceeded the upper boundary of the blue channel.
However, given that the price has not yet reached the upper boundary of the purple channel (as indicated by the arrow), it is reasonable to suggest that bullish momentum may be waning. If so, a possible scenario could involve a correction with a bearish breakout of the lower purple line, leading the price back into the blue channel. It is also possible that there will be one more attempt to set a new record, accompanied by the formation of bearish divergence on the RSI indicator.
Trade global index CFDs with zero commission and tight spreads. Open your FXOpen account now or learn more about trading index CFDs with FXOpen.
CFDs are complex instruments and come with a high risk of losing your money.
This article represents the opinion of the Companies operating under the FXOpen brand only. It is not to be construed as an offer, solicitation, or recommendation with respect to products and services provided by the Companies operating under the FXOpen brand, nor is it to be considered financial advice.

👍2
#forextrading #USDJPY #marketanalysis #MarketNews
Bank of Japan Raises Rates, Yen Strengthens
The Bank of Japan (BOJ) has raised short-term interest rates to 0.5%, the highest level in 17 years. While this move was anticipated, the currency market responded with a significant strengthening of the yen, with USD/JPY falling by approximately 0.6%.
At a press conference, BOJ Governor Ueda stated that there is no predetermined course for future rate adjustments. Meanwhile, media reports cite analysts’ opinions suggesting that the rate could be raised again before the end of 2025.
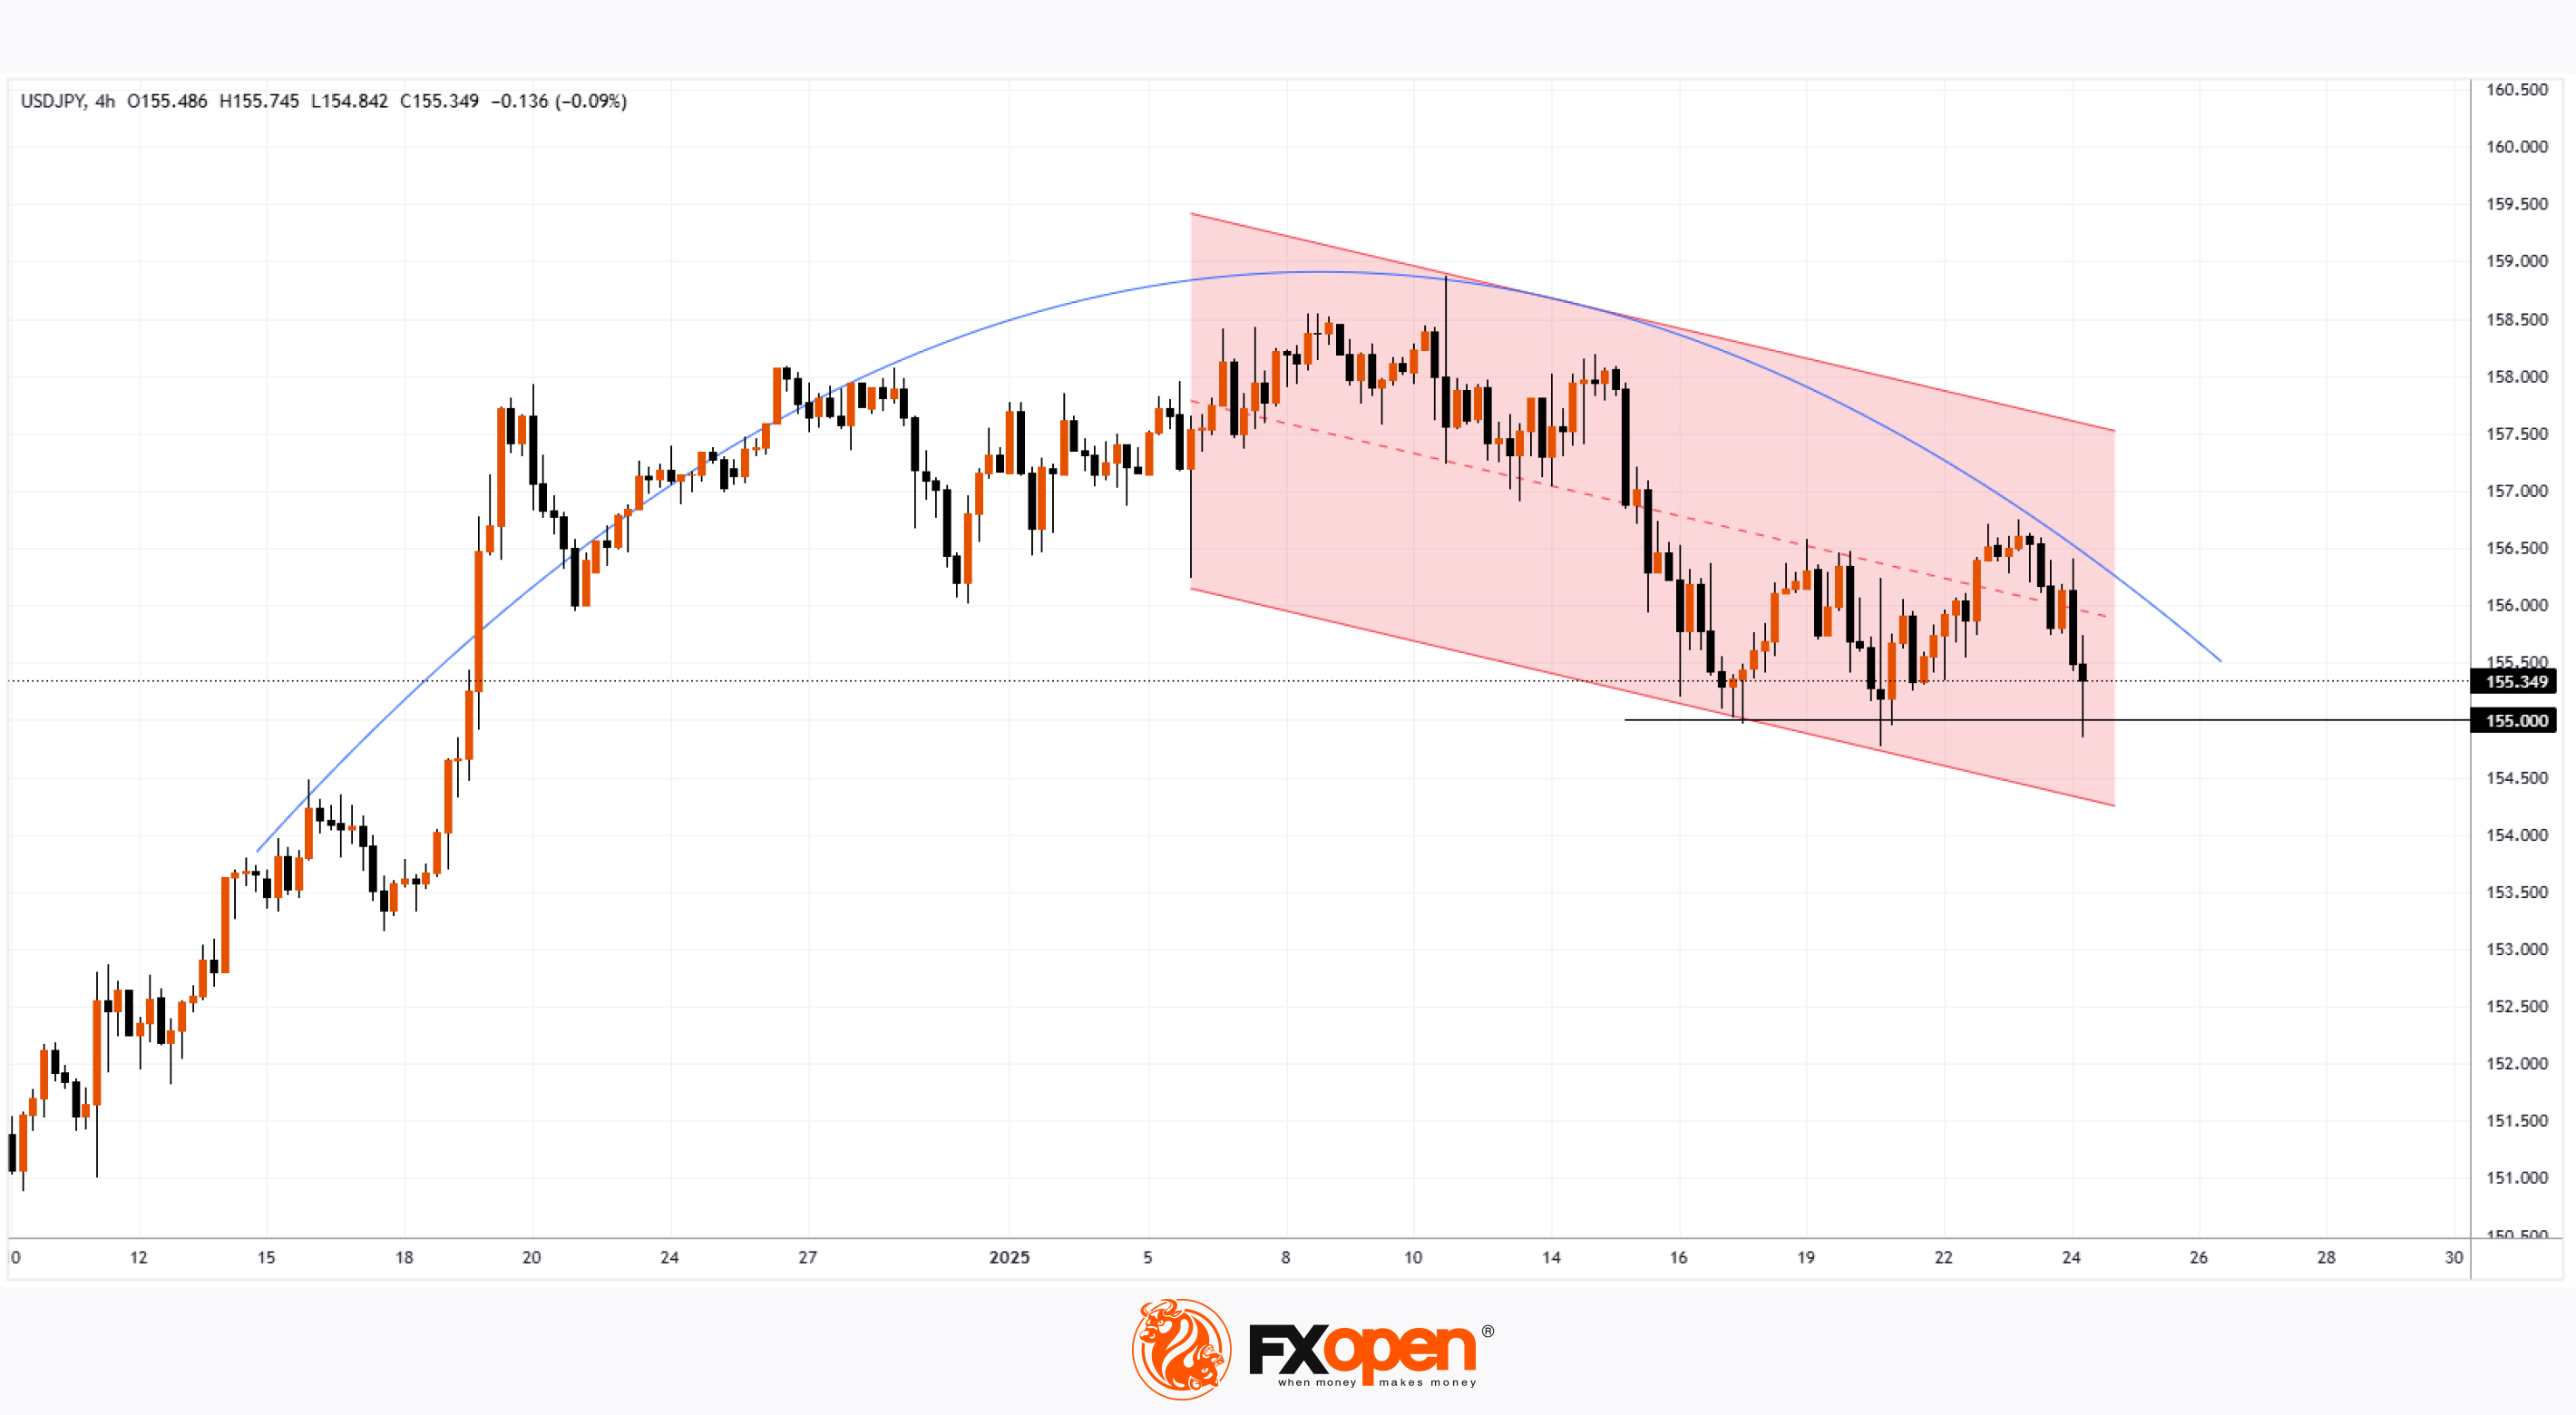
Technical analysis of the USD/JPY chart shows the formation of a descending channel (highlighted in red) at the start of 2025. The news of the rate hike enabled bears to launch another attack on the psychological level of 155 yen per dollar—a level that had previously served as support earlier this month. As of the morning of 24 January, bulls are managing to defend this level, but how long can they hold out if bearish pressure persists?
Key points to note:
→ The USD/JPY trend resembles a rounding-top pattern.
→ The yen's strength is also supported by the dollar’s weakness, influenced by some uncertainty surrounding the introduction of international trade tariffs promised by US President Trump.
Today, at 17:45 GMT+3, the Purchasing Managers' Index (PMI) figures will be released, potentially triggering heightened volatility in financial markets.
Trade over 50 forex markets 24 hours a day with FXOpen. Take advantage of low commissions, deep liquidity, and spreads from 0.0 pips. Open your FXOpen account now or learn more about trading forex with FXOpen.
CFDs are complex instruments and come with a high risk of losing your money.
This article represents the opinion of the Companies operating under the FXOpen brand only. It is not to be construed as an offer, solicitation, or recommendation with respect to products and services provided by the Companies operating under the FXOpen brand, nor is it to be considered financial advice.
Bank of Japan Raises Rates, Yen Strengthens
The Bank of Japan (BOJ) has raised short-term interest rates to 0.5%, the highest level in 17 years. While this move was anticipated, the currency market responded with a significant strengthening of the yen, with USD/JPY falling by approximately 0.6%.
At a press conference, BOJ Governor Ueda stated that there is no predetermined course for future rate adjustments. Meanwhile, media reports cite analysts’ opinions suggesting that the rate could be raised again before the end of 2025.
Technical analysis of the USD/JPY chart shows the formation of a descending channel (highlighted in red) at the start of 2025. The news of the rate hike enabled bears to launch another attack on the psychological level of 155 yen per dollar—a level that had previously served as support earlier this month. As of the morning of 24 January, bulls are managing to defend this level, but how long can they hold out if bearish pressure persists?
Key points to note:
→ The USD/JPY trend resembles a rounding-top pattern.
→ The yen's strength is also supported by the dollar’s weakness, influenced by some uncertainty surrounding the introduction of international trade tariffs promised by US President Trump.
Today, at 17:45 GMT+3, the Purchasing Managers' Index (PMI) figures will be released, potentially triggering heightened volatility in financial markets.
Trade over 50 forex markets 24 hours a day with FXOpen. Take advantage of low commissions, deep liquidity, and spreads from 0.0 pips. Open your FXOpen account now or learn more about trading forex with FXOpen.
CFDs are complex instruments and come with a high risk of losing your money.
This article represents the opinion of the Companies operating under the FXOpen brand only. It is not to be construed as an offer, solicitation, or recommendation with respect to products and services provided by the Companies operating under the FXOpen brand, nor is it to be considered financial advice.
👍3
#sp500 #stockmarket #stocktrading #MarketUpdates
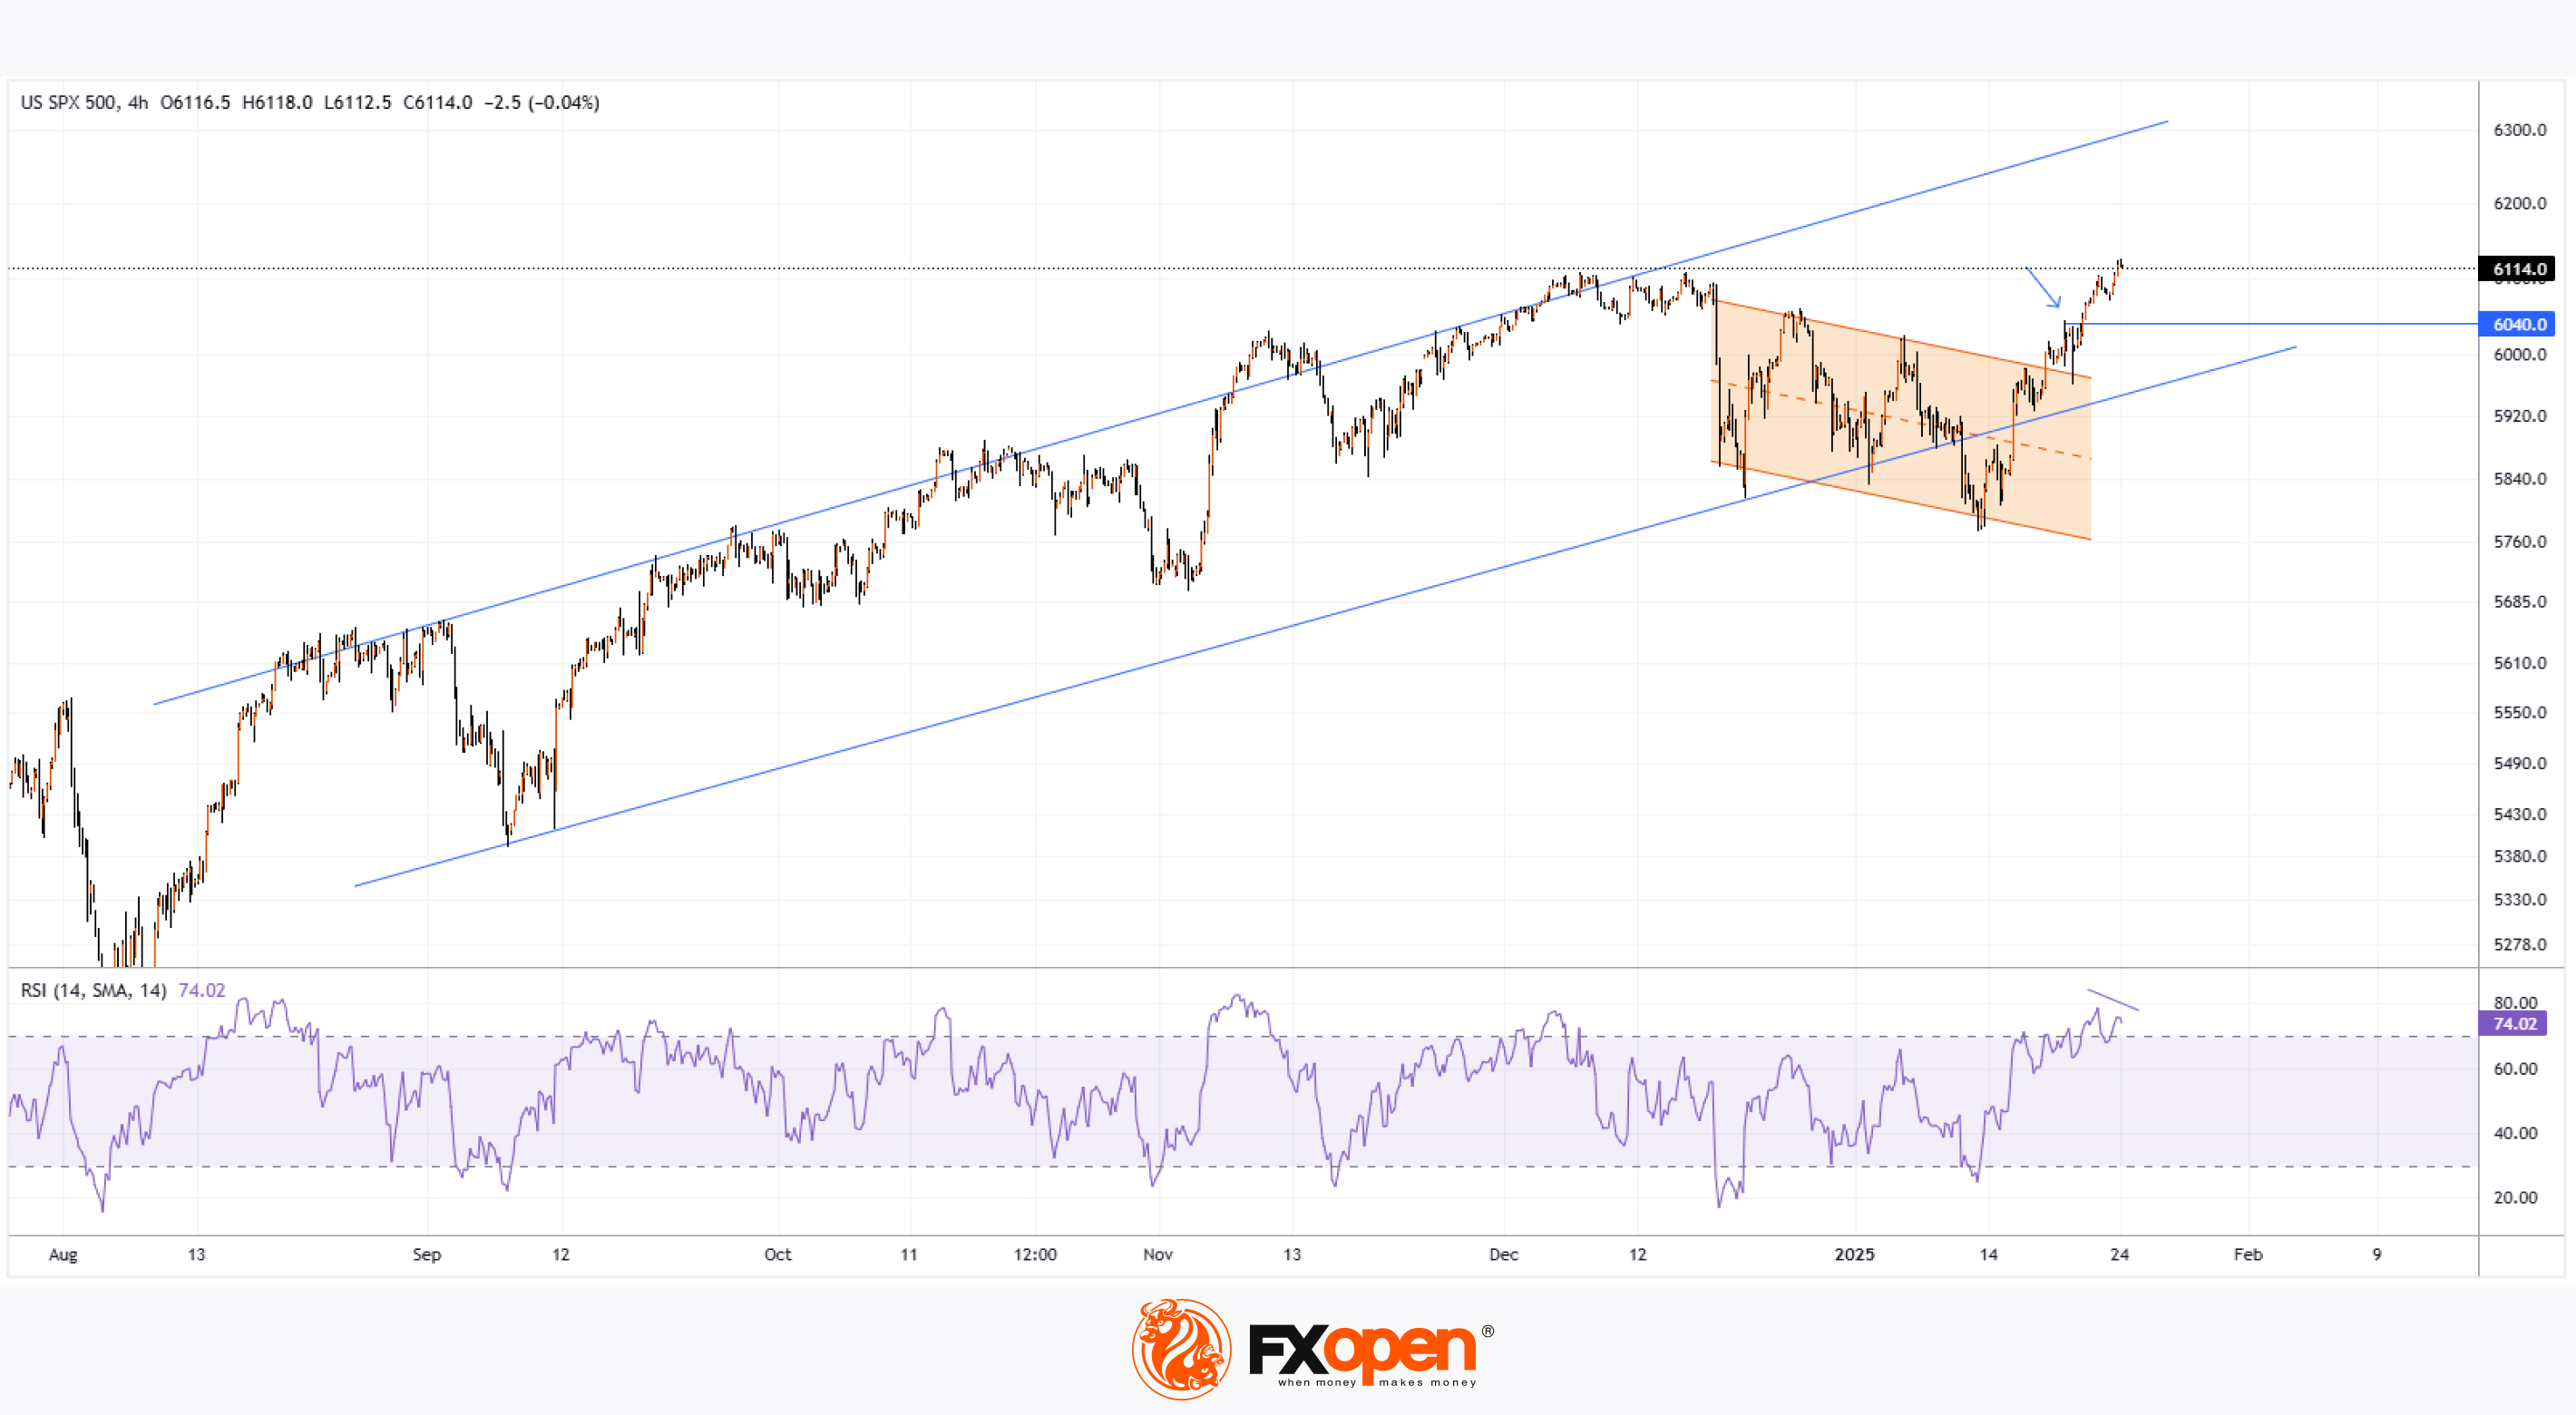
S&P 500 Index Sets Record High
As shown by the S&P 500 chart (US SPX 500 mini on FXOpen), the stock index:
→ has increased by approximately 3.5% since the start of the year;
→ surpassed its previous all-time highs set in December.
Market participants’ optimism was driven by:
→ a strong start to earnings season and expectations of robust reports from major tech companies;
→ statements made by Donald Trump at the Davos forum, where the US president urged Saudi Arabia to lower oil prices and expressed the view that interest rates should be reduced. Overall, such measures are expected to foster economic growth.
Reuters quoted Lindsay Bell, Chief Strategist at 248 Ventures: buyers "like the idea of interest rates coming down, of oil prices coming down. All in all, the market is optimistic the more they hear about Trump policies. We're just seeing a reflection of that optimism."
Technical analysis of the S&P 500 chart (US SPX 500 mini on FXOpen) reveals:
→ At the end of 2024, price fluctuations formed an ascending channel (marked by blue lines).
→ The December dip appears to be a correction within the prevailing uptrend. Bears managed to push the price below the lower blue line, but only for about a week.
→ After breaking the correction channel (shaded in orange), bulls faced brief resistance (indicated by the arrow) at the 6040 level.
→ The RSI indicator is in the overbought zone and signals divergence. This suggests a minor pullback could occur, potentially testing the aforementioned 6040 level.
Trade global index CFDs with zero commission and tight spreads. Open your FXOpen account now or learn more about trading index CFDs with FXOpen.
CFDs are complex instruments and come with a high risk of losing your money.
This article represents the opinion of the Companies operating under the FXOpen brand only. It is not to be construed as an offer, solicitation, or recommendation with respect to products and services provided by the Companies operating under the FXOpen brand, nor is it to be considered financial advice.
S&P 500 Index Sets Record High
As shown by the S&P 500 chart (US SPX 500 mini on FXOpen), the stock index:
→ has increased by approximately 3.5% since the start of the year;
→ surpassed its previous all-time highs set in December.
Market participants’ optimism was driven by:
→ a strong start to earnings season and expectations of robust reports from major tech companies;
→ statements made by Donald Trump at the Davos forum, where the US president urged Saudi Arabia to lower oil prices and expressed the view that interest rates should be reduced. Overall, such measures are expected to foster economic growth.
Reuters quoted Lindsay Bell, Chief Strategist at 248 Ventures: buyers "like the idea of interest rates coming down, of oil prices coming down. All in all, the market is optimistic the more they hear about Trump policies. We're just seeing a reflection of that optimism."
Technical analysis of the S&P 500 chart (US SPX 500 mini on FXOpen) reveals:
→ At the end of 2024, price fluctuations formed an ascending channel (marked by blue lines).
→ The December dip appears to be a correction within the prevailing uptrend. Bears managed to push the price below the lower blue line, but only for about a week.
→ After breaking the correction channel (shaded in orange), bulls faced brief resistance (indicated by the arrow) at the 6040 level.
→ The RSI indicator is in the overbought zone and signals divergence. This suggests a minor pullback could occur, potentially testing the aforementioned 6040 level.
Trade global index CFDs with zero commission and tight spreads. Open your FXOpen account now or learn more about trading index CFDs with FXOpen.
CFDs are complex instruments and come with a high risk of losing your money.
This article represents the opinion of the Companies operating under the FXOpen brand only. It is not to be construed as an offer, solicitation, or recommendation with respect to products and services provided by the Companies operating under the FXOpen brand, nor is it to be considered financial advice.
👍3
Media is too big
VIEW IN TELEGRAM
#globalcurrencies #forextrading #currency
⚡️ Interesting Facts about Currencies from Around the World ⚡️
🌍Discover fascinating facts about currencies from around the world in this video!
💵Learn about the history, unique features, and surprising stories behind the money we use every day. From rare currencies to interesting design choices and symbols, explore how different nations represent their economies.
Watch now to uncover the secrets and fun facts about global currencies!📊
CFDs are complex instruments and come with a high risk of losing your money.
⚡️ Interesting Facts about Currencies from Around the World ⚡️
🌍Discover fascinating facts about currencies from around the world in this video!
💵Learn about the history, unique features, and surprising stories behind the money we use every day. From rare currencies to interesting design choices and symbols, explore how different nations represent their economies.
Watch now to uncover the secrets and fun facts about global currencies!📊
CFDs are complex instruments and come with a high risk of losing your money.
👍2
#gasprices #MarketUpdates #marketanalysis
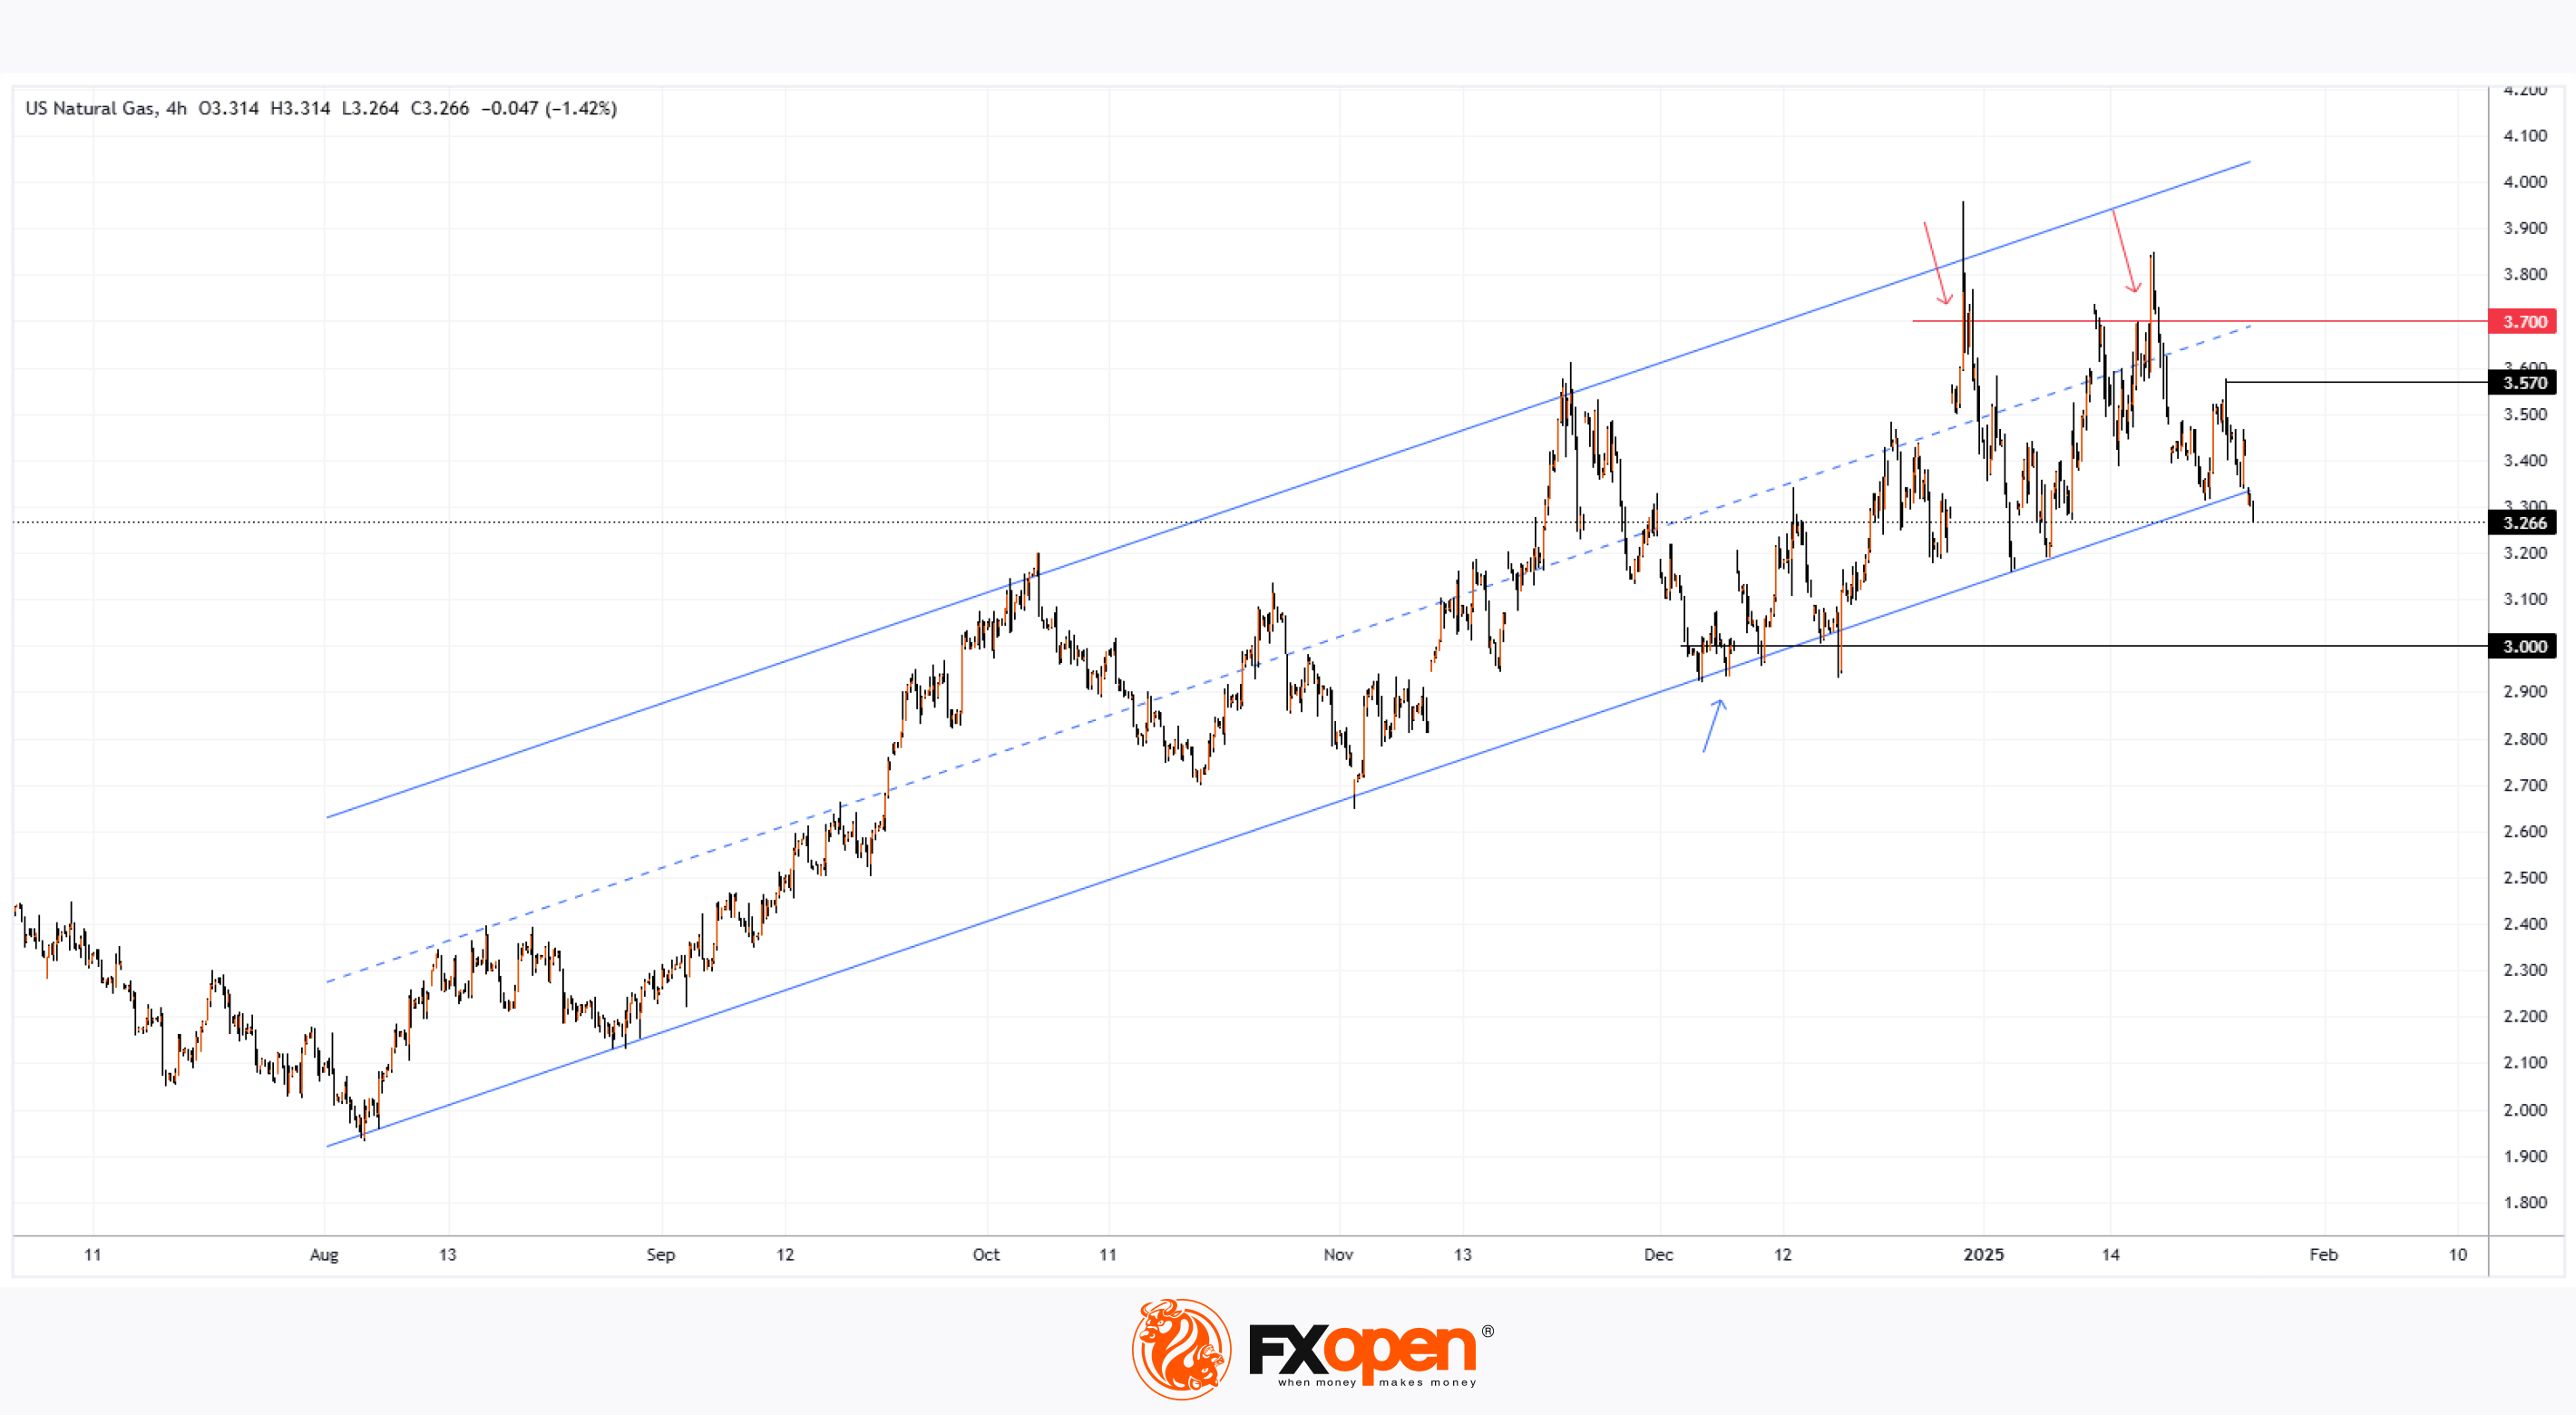
XNG/USD Analysis: Bears Pressure Key Support
On 5 December, while analysing the natural gas chart, we noted that price movements:
→ were forming an ascending channel (shown in blue);
→ support from the lower boundary of the channel (reinforced by the psychological level of 3.000) was already evident in a nascent price reversal (indicated by an arrow).
As the XNG/USD chart illustrates, since that time (marked by a blue arrow), the price indeed rose, using the support from the lower boundary of the channel to reach its upper boundary on 30 December.
However, we now see supply forces displaying aggression – whenever the natural gas price climbs above 3.700, bears quickly intervene (marked by red arrows), pushing the price back down.
What could happen next?
From a technical analysis perspective of the XNG/USD chart:
→ The price is hovering near the key support, formed by the lower boundary of the ascending channel (which has been in place since last summer).
→ Bearish aggression, as mentioned above, sets the stage for a potential bearish breakout of this critical support, evidenced by the bearish gap at Monday’s market open.
From a fundamental analysis standpoint:
→ Meteorological reports of colder weather drove the price up to 3.570, but this appears to be a temporary rebound.
→ Bearish sentiment in the natural gas market may be amplified by statements from the Trump administration expressing a determination to lower oil prices.
Start trading commodities with tight spreads. Open your trading account now or learn more about trading commodity CFDs with FXOpen.
CFDs are complex instruments and come with a high risk of losing your money.
This article represents the opinion of the Companies operating under the FXOpen brand only. It is not to be construed as an offer, solicitation, or recommendation with respect to products and services provided by the Companies operating under the FXOpen brand, nor is it to be considered financial advice.
XNG/USD Analysis: Bears Pressure Key Support
On 5 December, while analysing the natural gas chart, we noted that price movements:
→ were forming an ascending channel (shown in blue);
→ support from the lower boundary of the channel (reinforced by the psychological level of 3.000) was already evident in a nascent price reversal (indicated by an arrow).
As the XNG/USD chart illustrates, since that time (marked by a blue arrow), the price indeed rose, using the support from the lower boundary of the channel to reach its upper boundary on 30 December.
However, we now see supply forces displaying aggression – whenever the natural gas price climbs above 3.700, bears quickly intervene (marked by red arrows), pushing the price back down.
What could happen next?
From a technical analysis perspective of the XNG/USD chart:
→ The price is hovering near the key support, formed by the lower boundary of the ascending channel (which has been in place since last summer).
→ Bearish aggression, as mentioned above, sets the stage for a potential bearish breakout of this critical support, evidenced by the bearish gap at Monday’s market open.
From a fundamental analysis standpoint:
→ Meteorological reports of colder weather drove the price up to 3.570, but this appears to be a temporary rebound.
→ Bearish sentiment in the natural gas market may be amplified by statements from the Trump administration expressing a determination to lower oil prices.
Start trading commodities with tight spreads. Open your trading account now or learn more about trading commodity CFDs with FXOpen.
CFDs are complex instruments and come with a high risk of losing your money.
This article represents the opinion of the Companies operating under the FXOpen brand only. It is not to be construed as an offer, solicitation, or recommendation with respect to products and services provided by the Companies operating under the FXOpen brand, nor is it to be considered financial advice.
👍2
#stockmarket #AAPL #MSFT #interestrates #marketanalysis #MarketNews
Market Insights with Gary Thomson: BoC, Fed & ECB Interest Rates, PCE Price Index, Earnings Reports
In this video, we’ll explore the key economic events, market trends, and corporate news shaping the financial landscape. Get ready for expert insights into forex, commodities, and stocks to help you navigate the week ahead. Let’s dive in!
In this episode:
🔸BoC Interest Rate Decision
Will the BoC cut rates? Discover the potential impacts on the USD/CAD pair
🔸 Fed Interest Rate Decision
In December, US stock markets dropped after the Fed signaled fewer rate cuts than expected. Will history repeat itself?
🔸 ECB Interest Rate Decision
After 4 reductions in 2024, will the ECB plan further cuts? Find out how this could impact the EUR/USD pair.
🔸 US PCE Price Index
In November 2024, annual PCE inflation rose for the second consecutive month. Will this trend continue, and how might the index impact the US dollar?
🔸 Corporate Earnings Statements
Big names like Meta, Tesla, Microsoft, and Apple are releasing their quarterly results. Check their expected performance and market implications.
Don’t miss out—gain insights to stay ahead in your trading journey.
https://cutt.ly/Be4lPhMh
To take advantage of price fluctuations in the foreign exchange markets, consider enlisting the services of a reliable broker like FXOpen.
⚠️
This forecast represents FXOpen Companies opinion only, it should not be construed as an offer, invitation or recommendation in respect to FXOpen Companies products and services or as financial advice.
Market Insights with Gary Thomson: BoC, Fed & ECB Interest Rates, PCE Price Index, Earnings Reports
In this video, we’ll explore the key economic events, market trends, and corporate news shaping the financial landscape. Get ready for expert insights into forex, commodities, and stocks to help you navigate the week ahead. Let’s dive in!
In this episode:
🔸BoC Interest Rate Decision
Will the BoC cut rates? Discover the potential impacts on the USD/CAD pair
🔸 Fed Interest Rate Decision
In December, US stock markets dropped after the Fed signaled fewer rate cuts than expected. Will history repeat itself?
🔸 ECB Interest Rate Decision
After 4 reductions in 2024, will the ECB plan further cuts? Find out how this could impact the EUR/USD pair.
🔸 US PCE Price Index
In November 2024, annual PCE inflation rose for the second consecutive month. Will this trend continue, and how might the index impact the US dollar?
🔸 Corporate Earnings Statements
Big names like Meta, Tesla, Microsoft, and Apple are releasing their quarterly results. Check their expected performance and market implications.
Don’t miss out—gain insights to stay ahead in your trading journey.
https://cutt.ly/Be4lPhMh
To take advantage of price fluctuations in the foreign exchange markets, consider enlisting the services of a reliable broker like FXOpen.
⚠️
This forecast represents FXOpen Companies opinion only, it should not be construed as an offer, invitation or recommendation in respect to FXOpen Companies products and services or as financial advice.
YouTube
Market Insights with Gary Thomson: BoC, Fed & ECB Interest Rates, PCE Price Index, Earnings Reports
In this video, we’ll explore the key economic events, market trends, and corporate news shaping the financial landscape. Get ready for expert insights into forex, commodities, and stocks to help you navigate the week ahead. Let’s dive in!
In this episode:…
In this episode:…
👍3
#AAPL #stockmarket #stocktrading #MarketUpdates
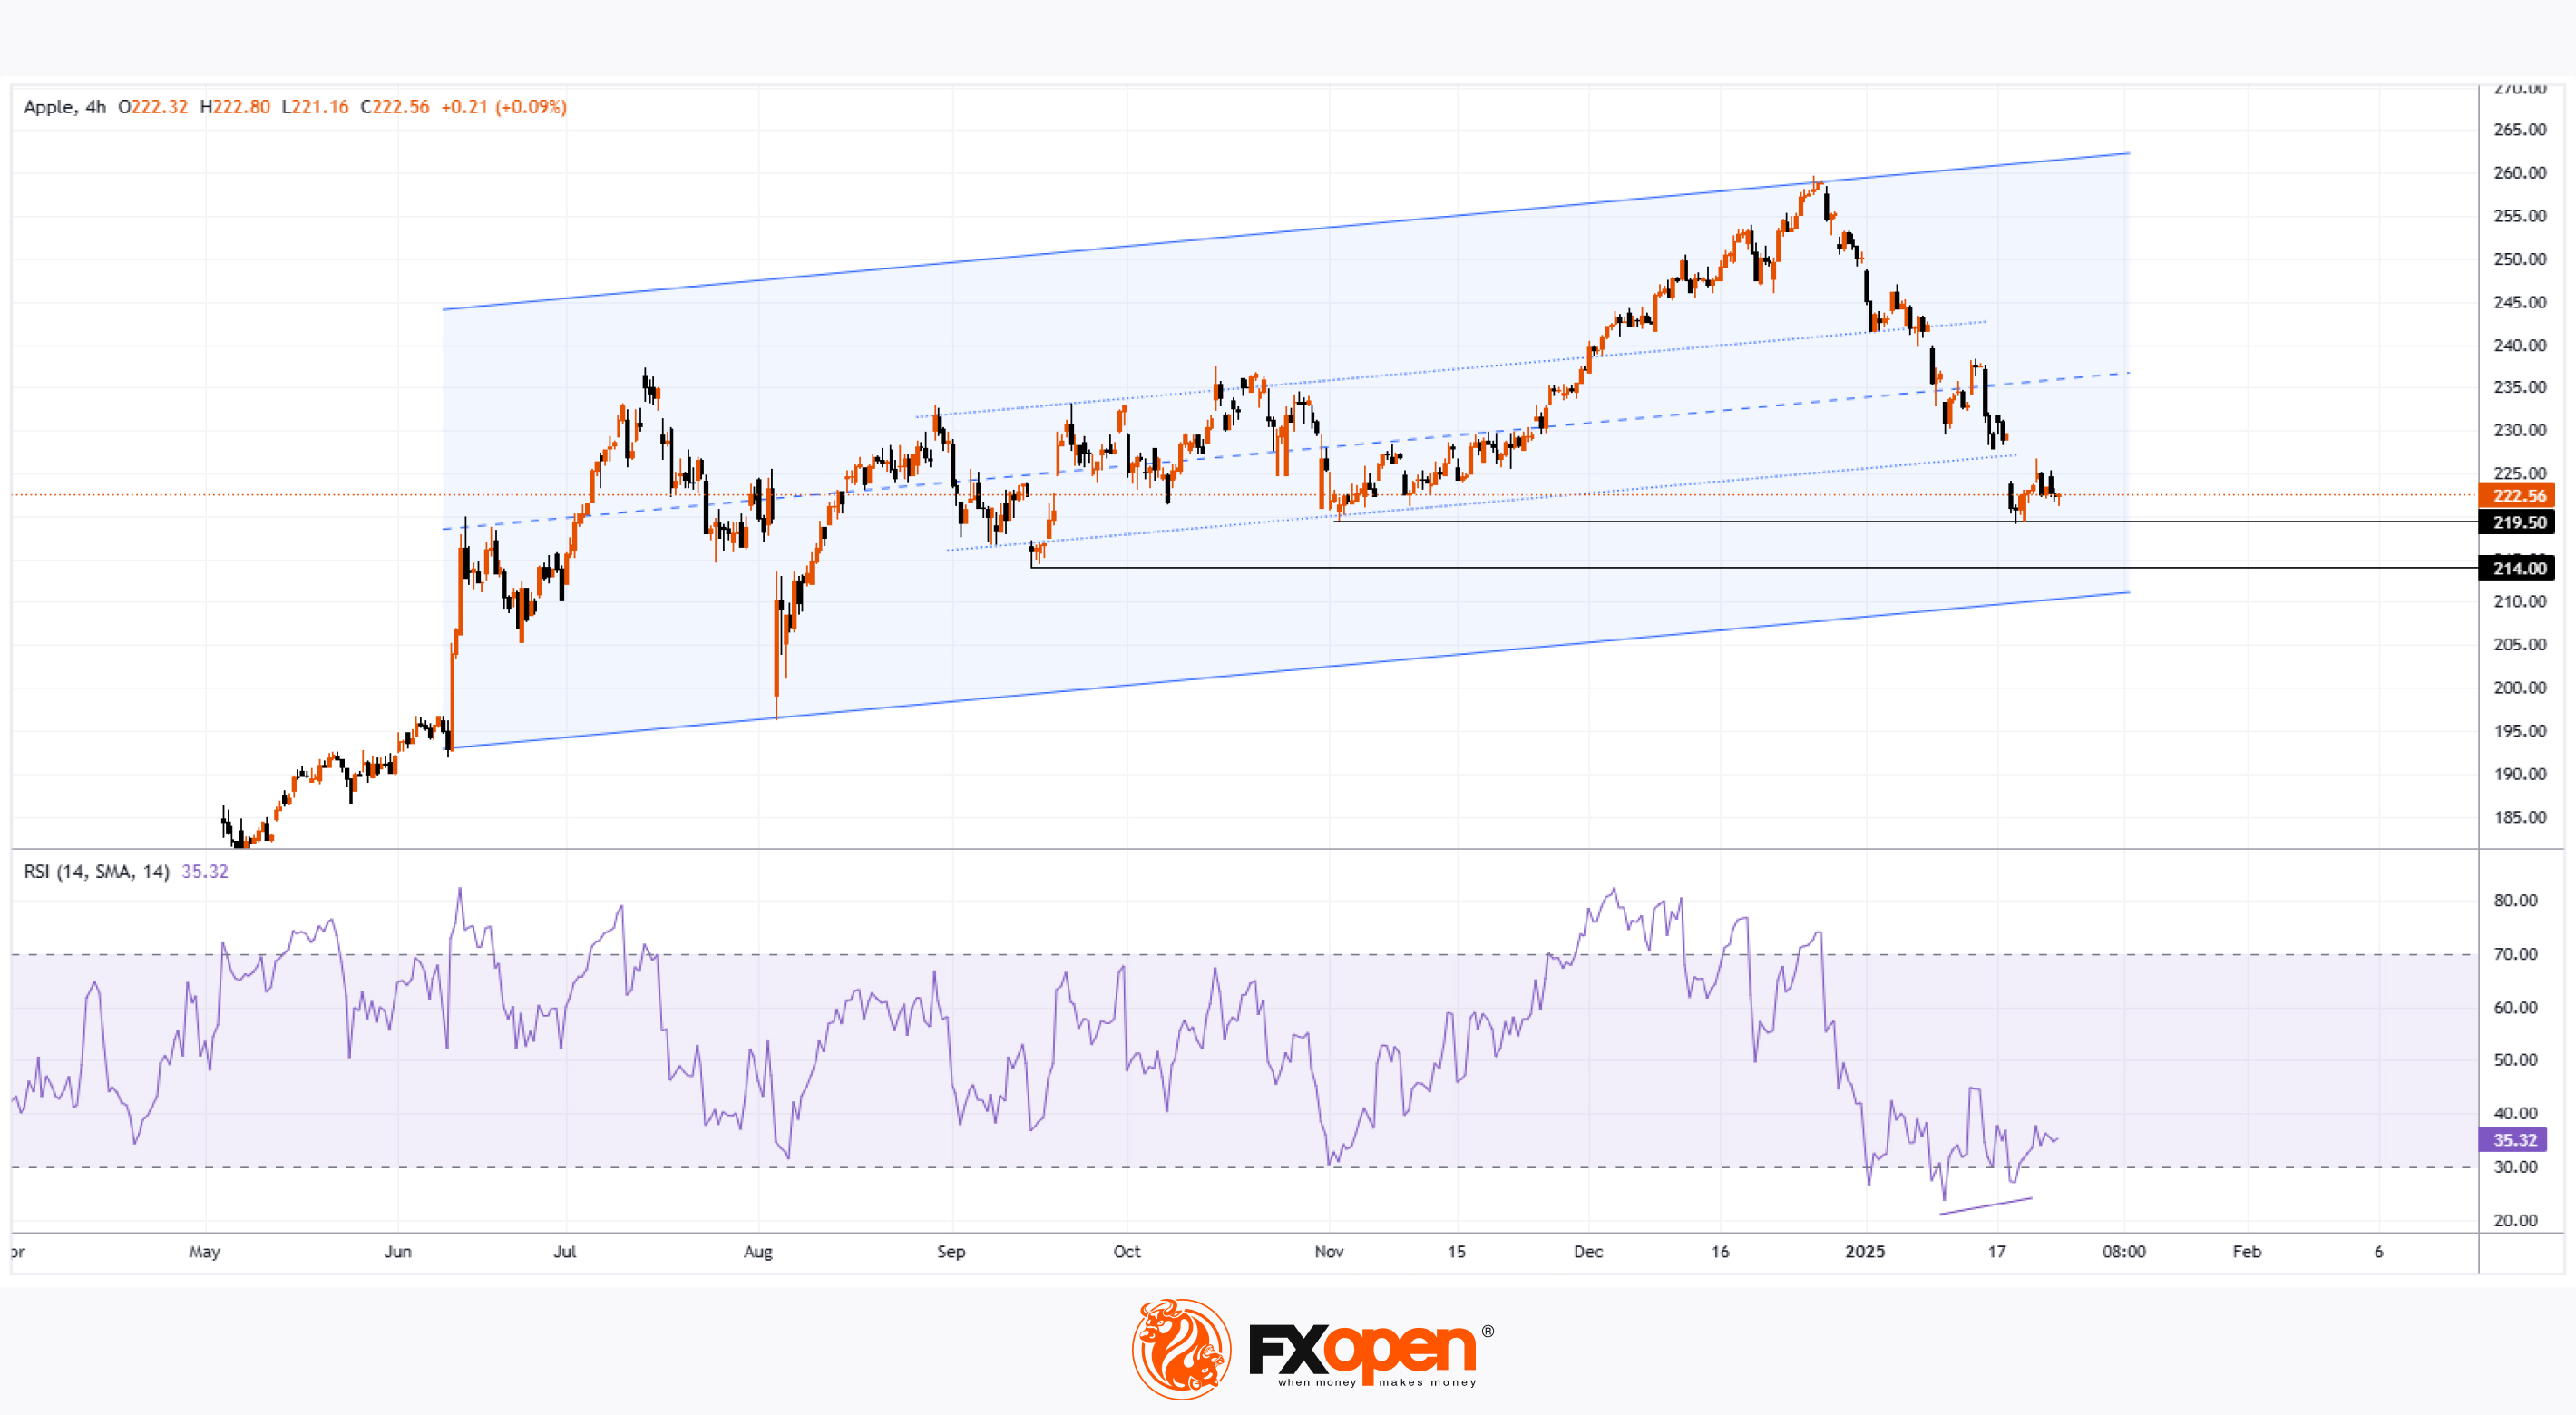
Apple (AAPL) Stock Price Analysis: Worst Start to the Year Since 2008
On 27 December, while analysing Apple (AAPL) stock, we noted: "Traders should consider the possibility of a pullback below the key psychological level of $250, with the price potentially retreating to the lower purple boundary."
A month later, Bloomberg reports:
→ By the close of trading on Friday, 24 January, the company's shares had fallen 11% since the start of 2025, marking the worst performance among the "Big Seven" companies.
→ This represents the worst start for AAPL shares since 2008, when the global financial crisis was in full swing.
→ Apple has also significantly underperformed the S&P 500, which has risen approximately 3.7% this year and hit a new record high earlier this week.
Can the bulls reverse this disappointing trend?
Technical Analysis of the AAPL chart shows:
→ The price remains within a broad ascending channel (which began in June when the company unveiled its Apple Intelligence tools), but it has now fallen into the lower half of the channel.
→ After briefly dipping below the November low at $219.50, the price recovered – a bullish sign of a Liquidity Grab, suggesting that Smart Money may be turning bullish.
Given this, it is reasonable to expect the downward trend to weaken, with market participants likely adopting a wait-and-see approach ahead of the company’s quarterly earnings report, scheduled for 30 January.
Wall Street analysts are optimistic, forecasting earnings of $2.35 per share and gross revenue of $124.2 billion (compared to $0.97 per share and $94.93 billion in the previous quarter).
Trade global index CFDs with zero commission and tight spreads. Open your FXOpen account now or learn more about trading index CFDs with FXOpen.
CFDs are complex instruments and come with a high risk of losing your money.
This article represents the opinion of the Companies operating under the FXOpen brand only. It is not to be construed as an offer, solicitation, or recommendation with respect to products and services provided by the Companies operating under the FXOpen brand, nor is it to be considered financial advice.
Apple (AAPL) Stock Price Analysis: Worst Start to the Year Since 2008
On 27 December, while analysing Apple (AAPL) stock, we noted: "Traders should consider the possibility of a pullback below the key psychological level of $250, with the price potentially retreating to the lower purple boundary."
A month later, Bloomberg reports:
→ By the close of trading on Friday, 24 January, the company's shares had fallen 11% since the start of 2025, marking the worst performance among the "Big Seven" companies.
→ This represents the worst start for AAPL shares since 2008, when the global financial crisis was in full swing.
→ Apple has also significantly underperformed the S&P 500, which has risen approximately 3.7% this year and hit a new record high earlier this week.
Can the bulls reverse this disappointing trend?
Technical Analysis of the AAPL chart shows:
→ The price remains within a broad ascending channel (which began in June when the company unveiled its Apple Intelligence tools), but it has now fallen into the lower half of the channel.
→ After briefly dipping below the November low at $219.50, the price recovered – a bullish sign of a Liquidity Grab, suggesting that Smart Money may be turning bullish.
Given this, it is reasonable to expect the downward trend to weaken, with market participants likely adopting a wait-and-see approach ahead of the company’s quarterly earnings report, scheduled for 30 January.
Wall Street analysts are optimistic, forecasting earnings of $2.35 per share and gross revenue of $124.2 billion (compared to $0.97 per share and $94.93 billion in the previous quarter).
Trade global index CFDs with zero commission and tight spreads. Open your FXOpen account now or learn more about trading index CFDs with FXOpen.
CFDs are complex instruments and come with a high risk of losing your money.
This article represents the opinion of the Companies operating under the FXOpen brand only. It is not to be construed as an offer, solicitation, or recommendation with respect to products and services provided by the Companies operating under the FXOpen brand, nor is it to be considered financial advice.
👍3
#NVDA #nvidia #stockmarket #stocks #MarketUpdates
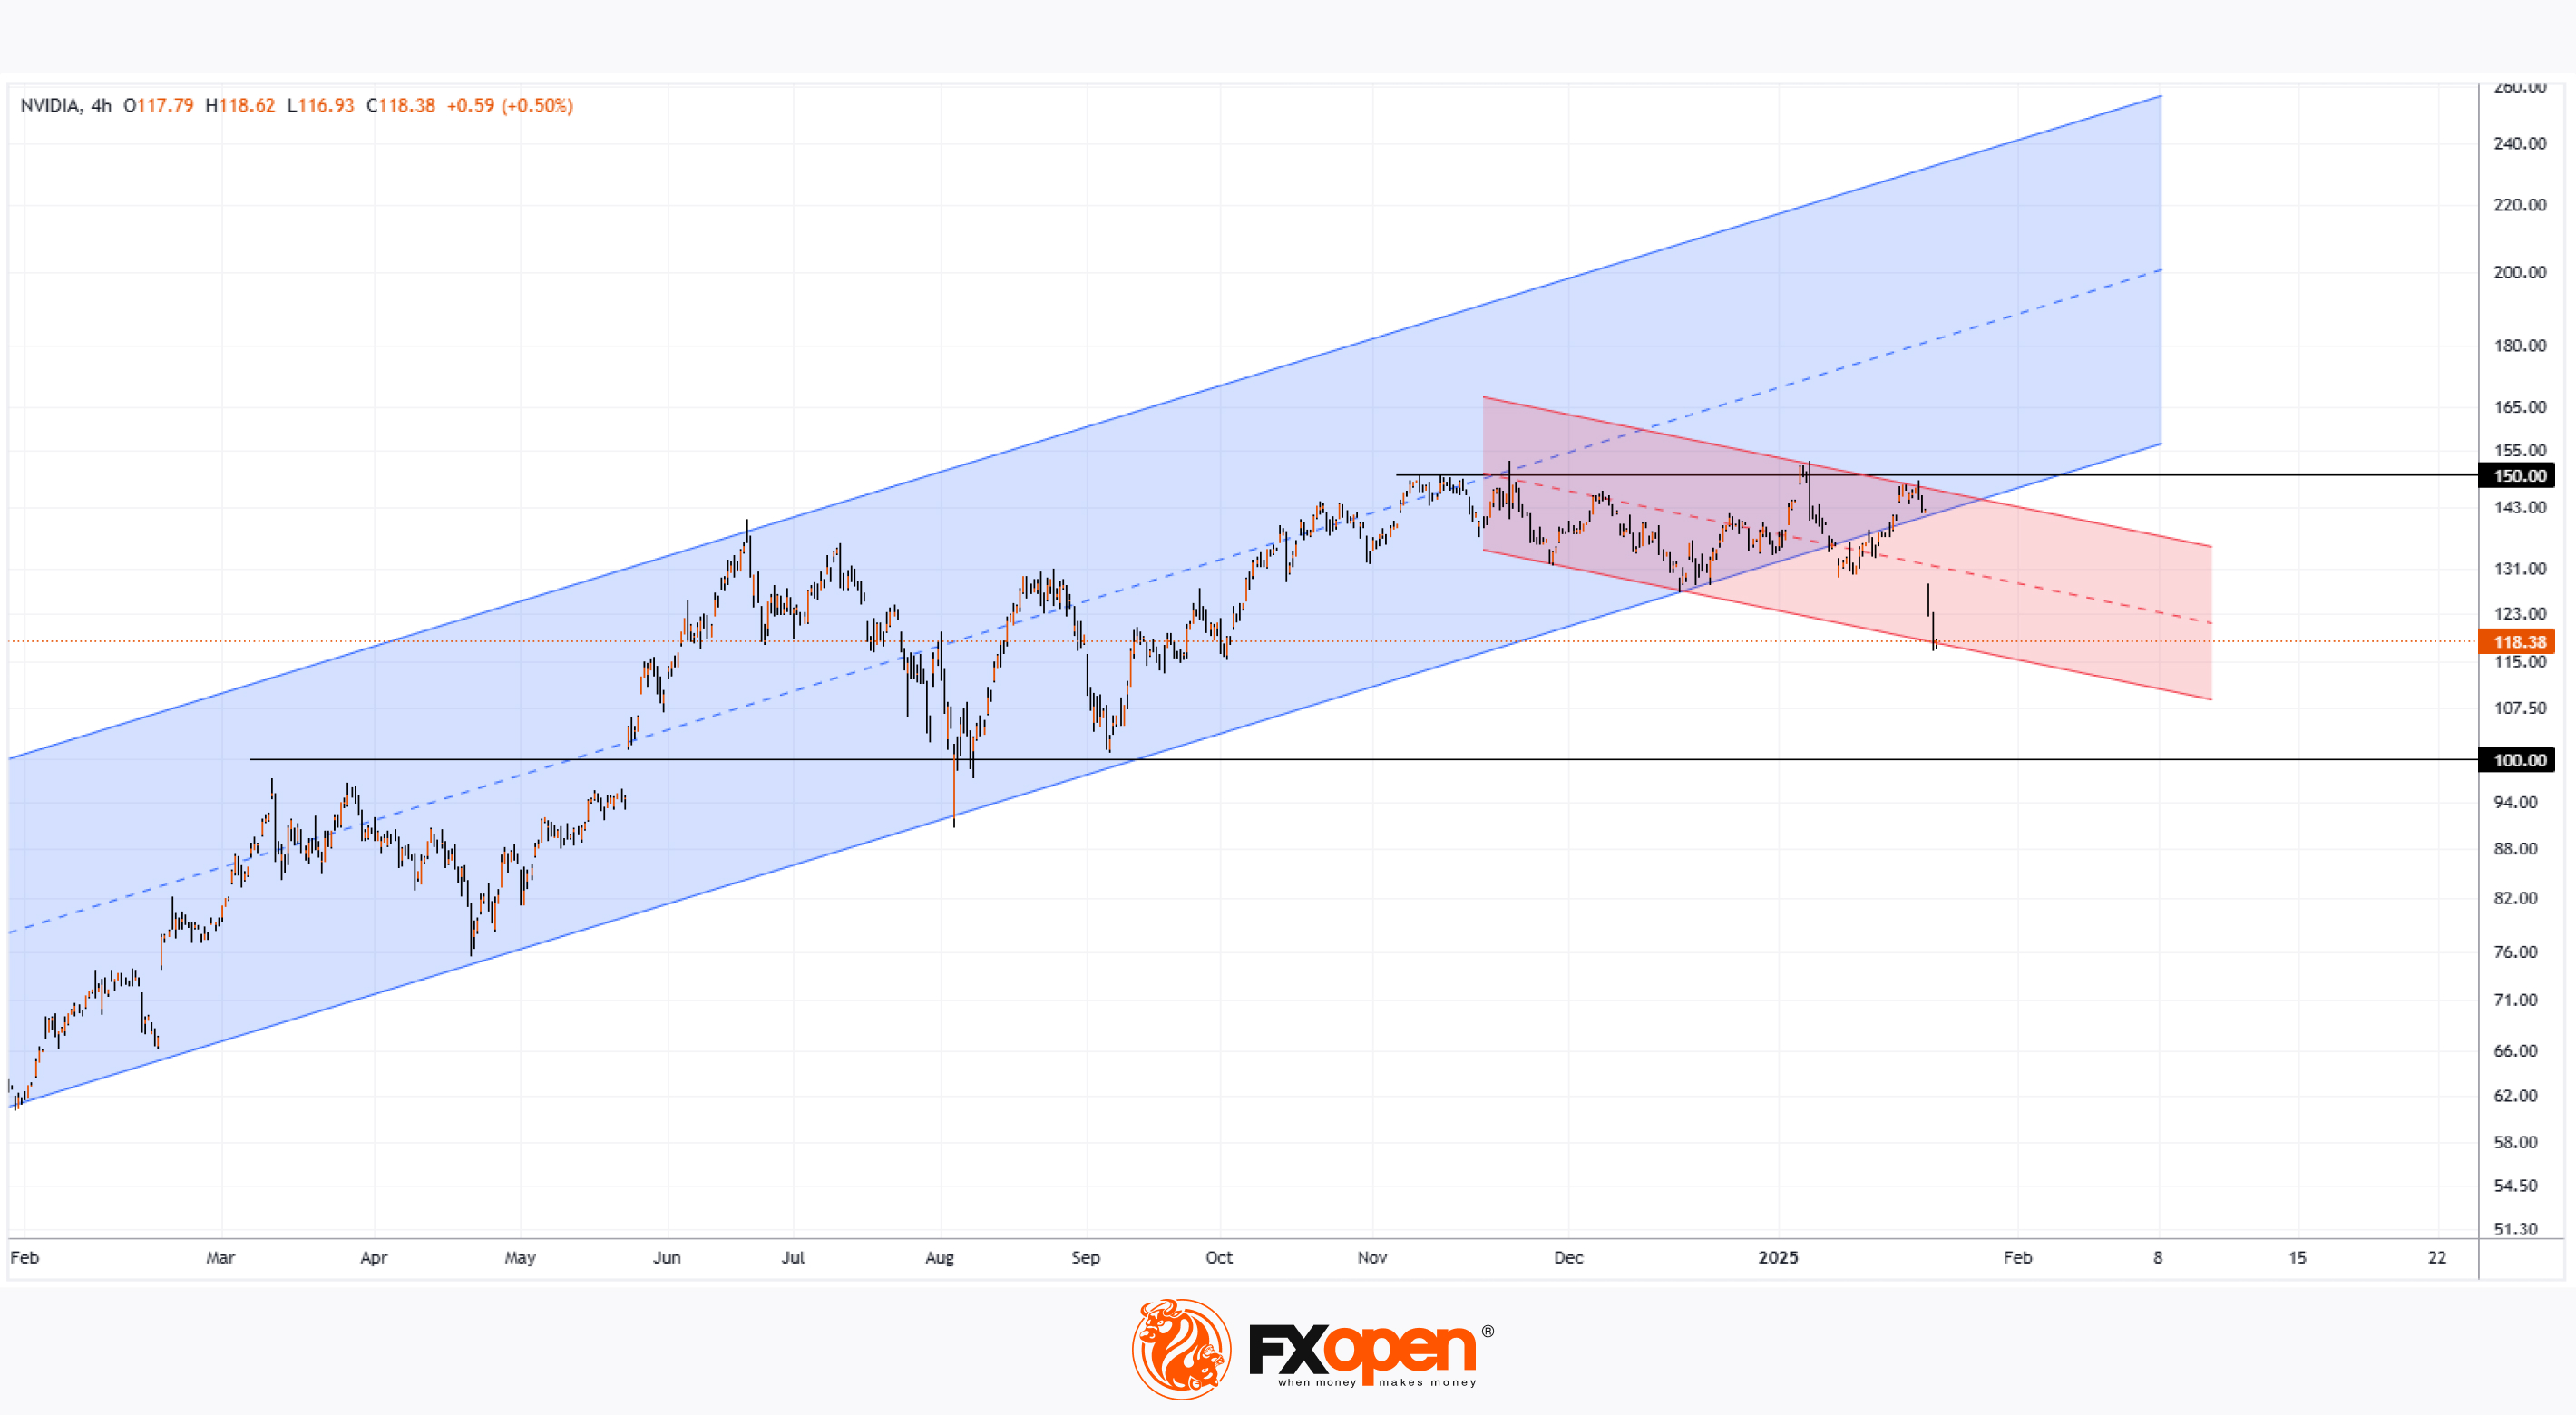
Nvidia (NVDA) Stock Price Drops by Approximately 17%
The start of 2025 appeared favourable for Nvidia (NVDA) shares from a fundamental perspective:
→ On 6 January, Nvidia CEO Jensen Huang delivered a keynote at the Consumer Electronics Show (CES).
→ On 22 January, the company's stock prices rose following President Trump's Stargate project announcement.
However, news from China triggered a sharp decline, with Nvidia's stock price plunging approximately 17% yesterday, as shown on the Nvidia (NVDA) chart.
According to Reuters, last week the Chinese startup DeepSeek launched a free AI assistant requiring minimal resources. By Monday, the assistant had surpassed its American rival, ChatGPT, in downloads from Apple’s App Store.
CNN reports that the R1 model is both powerful and significantly cheaper than AI technologies from OpenAI, Google, or Meta. DeepSeek claimed to have spent just $5.6 million on its base model, compared to the hundreds of millions or billions invested by American companies in their AI technologies.
This may have led market participants to conclude that the AI industry requires fewer Nvidia chips than previously thought, prompting a sell-off of Nvidia shares. This decline also impacted other companies in the sector, with sharp drops in Oracle (ORCL), Broadcom (AVGO), and others.
As a result, Nvidia lost its title as "the world's most valuable company" to Apple, and its CEO saw his fortune decrease by 20%.
Technical analysis of Nvidia (NVDA) stock chart indicates that:
→ The upward channel (marked in blue), formed by price fluctuations throughout 2024, has been broken, as the price fell well below its lower boundary.
→ The psychological resistance level of $150, previously highlighted in our analyses (most recently on 6 January), held firm despite numerous challenges.
→ The sharp drop, accompanied by a bearish gap between $142 and $128, can be interpreted as a market structure shift (MSS).
This development may lead to reduced investor interest in the AI sector, with NVDA stock likely to continue its decline within a downward channel.
Trade global index CFDs with zero commission and tight spreads. Open your FXOpen account now or learn more about trading index CFDs with FXOpen.
CFDs are complex instruments and come with a high risk of losing your money.
This article represents the opinion of the Companies operating under the FXOpen brand only. It is not to be construed as an offer, solicitation, or recommendation with respect to products and services provided by the Companies operating under the FXOpen brand, nor is it to be considered financial advice.
Nvidia (NVDA) Stock Price Drops by Approximately 17%
The start of 2025 appeared favourable for Nvidia (NVDA) shares from a fundamental perspective:
→ On 6 January, Nvidia CEO Jensen Huang delivered a keynote at the Consumer Electronics Show (CES).
→ On 22 January, the company's stock prices rose following President Trump's Stargate project announcement.
However, news from China triggered a sharp decline, with Nvidia's stock price plunging approximately 17% yesterday, as shown on the Nvidia (NVDA) chart.
According to Reuters, last week the Chinese startup DeepSeek launched a free AI assistant requiring minimal resources. By Monday, the assistant had surpassed its American rival, ChatGPT, in downloads from Apple’s App Store.
CNN reports that the R1 model is both powerful and significantly cheaper than AI technologies from OpenAI, Google, or Meta. DeepSeek claimed to have spent just $5.6 million on its base model, compared to the hundreds of millions or billions invested by American companies in their AI technologies.
This may have led market participants to conclude that the AI industry requires fewer Nvidia chips than previously thought, prompting a sell-off of Nvidia shares. This decline also impacted other companies in the sector, with sharp drops in Oracle (ORCL), Broadcom (AVGO), and others.
As a result, Nvidia lost its title as "the world's most valuable company" to Apple, and its CEO saw his fortune decrease by 20%.
Technical analysis of Nvidia (NVDA) stock chart indicates that:
→ The upward channel (marked in blue), formed by price fluctuations throughout 2024, has been broken, as the price fell well below its lower boundary.
→ The psychological resistance level of $150, previously highlighted in our analyses (most recently on 6 January), held firm despite numerous challenges.
→ The sharp drop, accompanied by a bearish gap between $142 and $128, can be interpreted as a market structure shift (MSS).
This development may lead to reduced investor interest in the AI sector, with NVDA stock likely to continue its decline within a downward channel.
Trade global index CFDs with zero commission and tight spreads. Open your FXOpen account now or learn more about trading index CFDs with FXOpen.
CFDs are complex instruments and come with a high risk of losing your money.
This article represents the opinion of the Companies operating under the FXOpen brand only. It is not to be construed as an offer, solicitation, or recommendation with respect to products and services provided by the Companies operating under the FXOpen brand, nor is it to be considered financial advice.
👍3
#sp500 #stockmarket #stocktrading #MarketUpdates
S&P 500 Rebounds After Monday’s Drop
The S&P 500 index (US SPX 500 mini on FXOpen) has recovered following Monday’s sharp decline, which was triggered by the success of Chinese startup DeepSeek and its AI model. As of this morning, the index is trading above the week’s early high.
This resilience suggests that the stock market has stabilised ahead of the Federal Reserve’s decision, scheduled for today at 22:00 GMT+3. Interest rates are expected to remain unchanged, but the key question is what stance Fed Chair Jerome Powell will take now that Donald Trump has officially assumed the U.S. presidency. Trump has already stated at the Davos forum that interest rates should be lowered. Powell’s press conference is set for 22:30 GMT+3.
Technical analysis of the S&P 500 index (US SPX 500 mini on FXOpen) shows that the price is approaching the 6,100 level for the third time. The first two attempts to break above this level (marked with red arrows) were unsuccessful.
From a bullish perspective:
→ The long-term trend remains upward, as indicated by the moving average.
→ A successful breakout above 6,100 could turn this level into strong support, similar to how 5,660 acted previously.
However, it is also possible that:
→ Powell’s remarks today will be more hawkish than expected.
→ The market may react negatively.
→ The price could make a bearish move, reinforcing the relevance of the downward channel (marked in red).
Prepare for heightened market volatility this evening.
Trade global index CFDs with zero commission and tight spreads. Open your FXOpen account now or learn more about trading index CFDs with FXOpen.
CFDs are complex instruments and come with a high risk of losing your money.
This article represents the opinion of the Companies operating under the FXOpen brand only. It is not to be construed as an offer, solicitation, or recommendation with respect to products and services provided by the Companies operating under the FXOpen brand, nor is it to be considered financial advice.
S&P 500 Rebounds After Monday’s Drop
The S&P 500 index (US SPX 500 mini on FXOpen) has recovered following Monday’s sharp decline, which was triggered by the success of Chinese startup DeepSeek and its AI model. As of this morning, the index is trading above the week’s early high.
This resilience suggests that the stock market has stabilised ahead of the Federal Reserve’s decision, scheduled for today at 22:00 GMT+3. Interest rates are expected to remain unchanged, but the key question is what stance Fed Chair Jerome Powell will take now that Donald Trump has officially assumed the U.S. presidency. Trump has already stated at the Davos forum that interest rates should be lowered. Powell’s press conference is set for 22:30 GMT+3.
Technical analysis of the S&P 500 index (US SPX 500 mini on FXOpen) shows that the price is approaching the 6,100 level for the third time. The first two attempts to break above this level (marked with red arrows) were unsuccessful.
From a bullish perspective:
→ The long-term trend remains upward, as indicated by the moving average.
→ A successful breakout above 6,100 could turn this level into strong support, similar to how 5,660 acted previously.
However, it is also possible that:
→ Powell’s remarks today will be more hawkish than expected.
→ The market may react negatively.
→ The price could make a bearish move, reinforcing the relevance of the downward channel (marked in red).
Prepare for heightened market volatility this evening.
Trade global index CFDs with zero commission and tight spreads. Open your FXOpen account now or learn more about trading index CFDs with FXOpen.
CFDs are complex instruments and come with a high risk of losing your money.
This article represents the opinion of the Companies operating under the FXOpen brand only. It is not to be construed as an offer, solicitation, or recommendation with respect to products and services provided by the Companies operating under the FXOpen brand, nor is it to be considered financial advice.

👍3
#stocktrading #stockmarket #alibaba #marketanalysis
Alibaba (BABA) Shares Surge Following AI Model Launch
Chinese e-commerce giant Alibaba has unveiled an upgraded version of its artificial intelligence model, Qwen2.5 Max. According to the company, the model:
→ Outperforms DeepSeek, the AI model that made headlines this week, in several key areas.
→ Achieves "competitive performance compared to top-tier models," referencing OpenAI and Meta, based on benchmark tests.
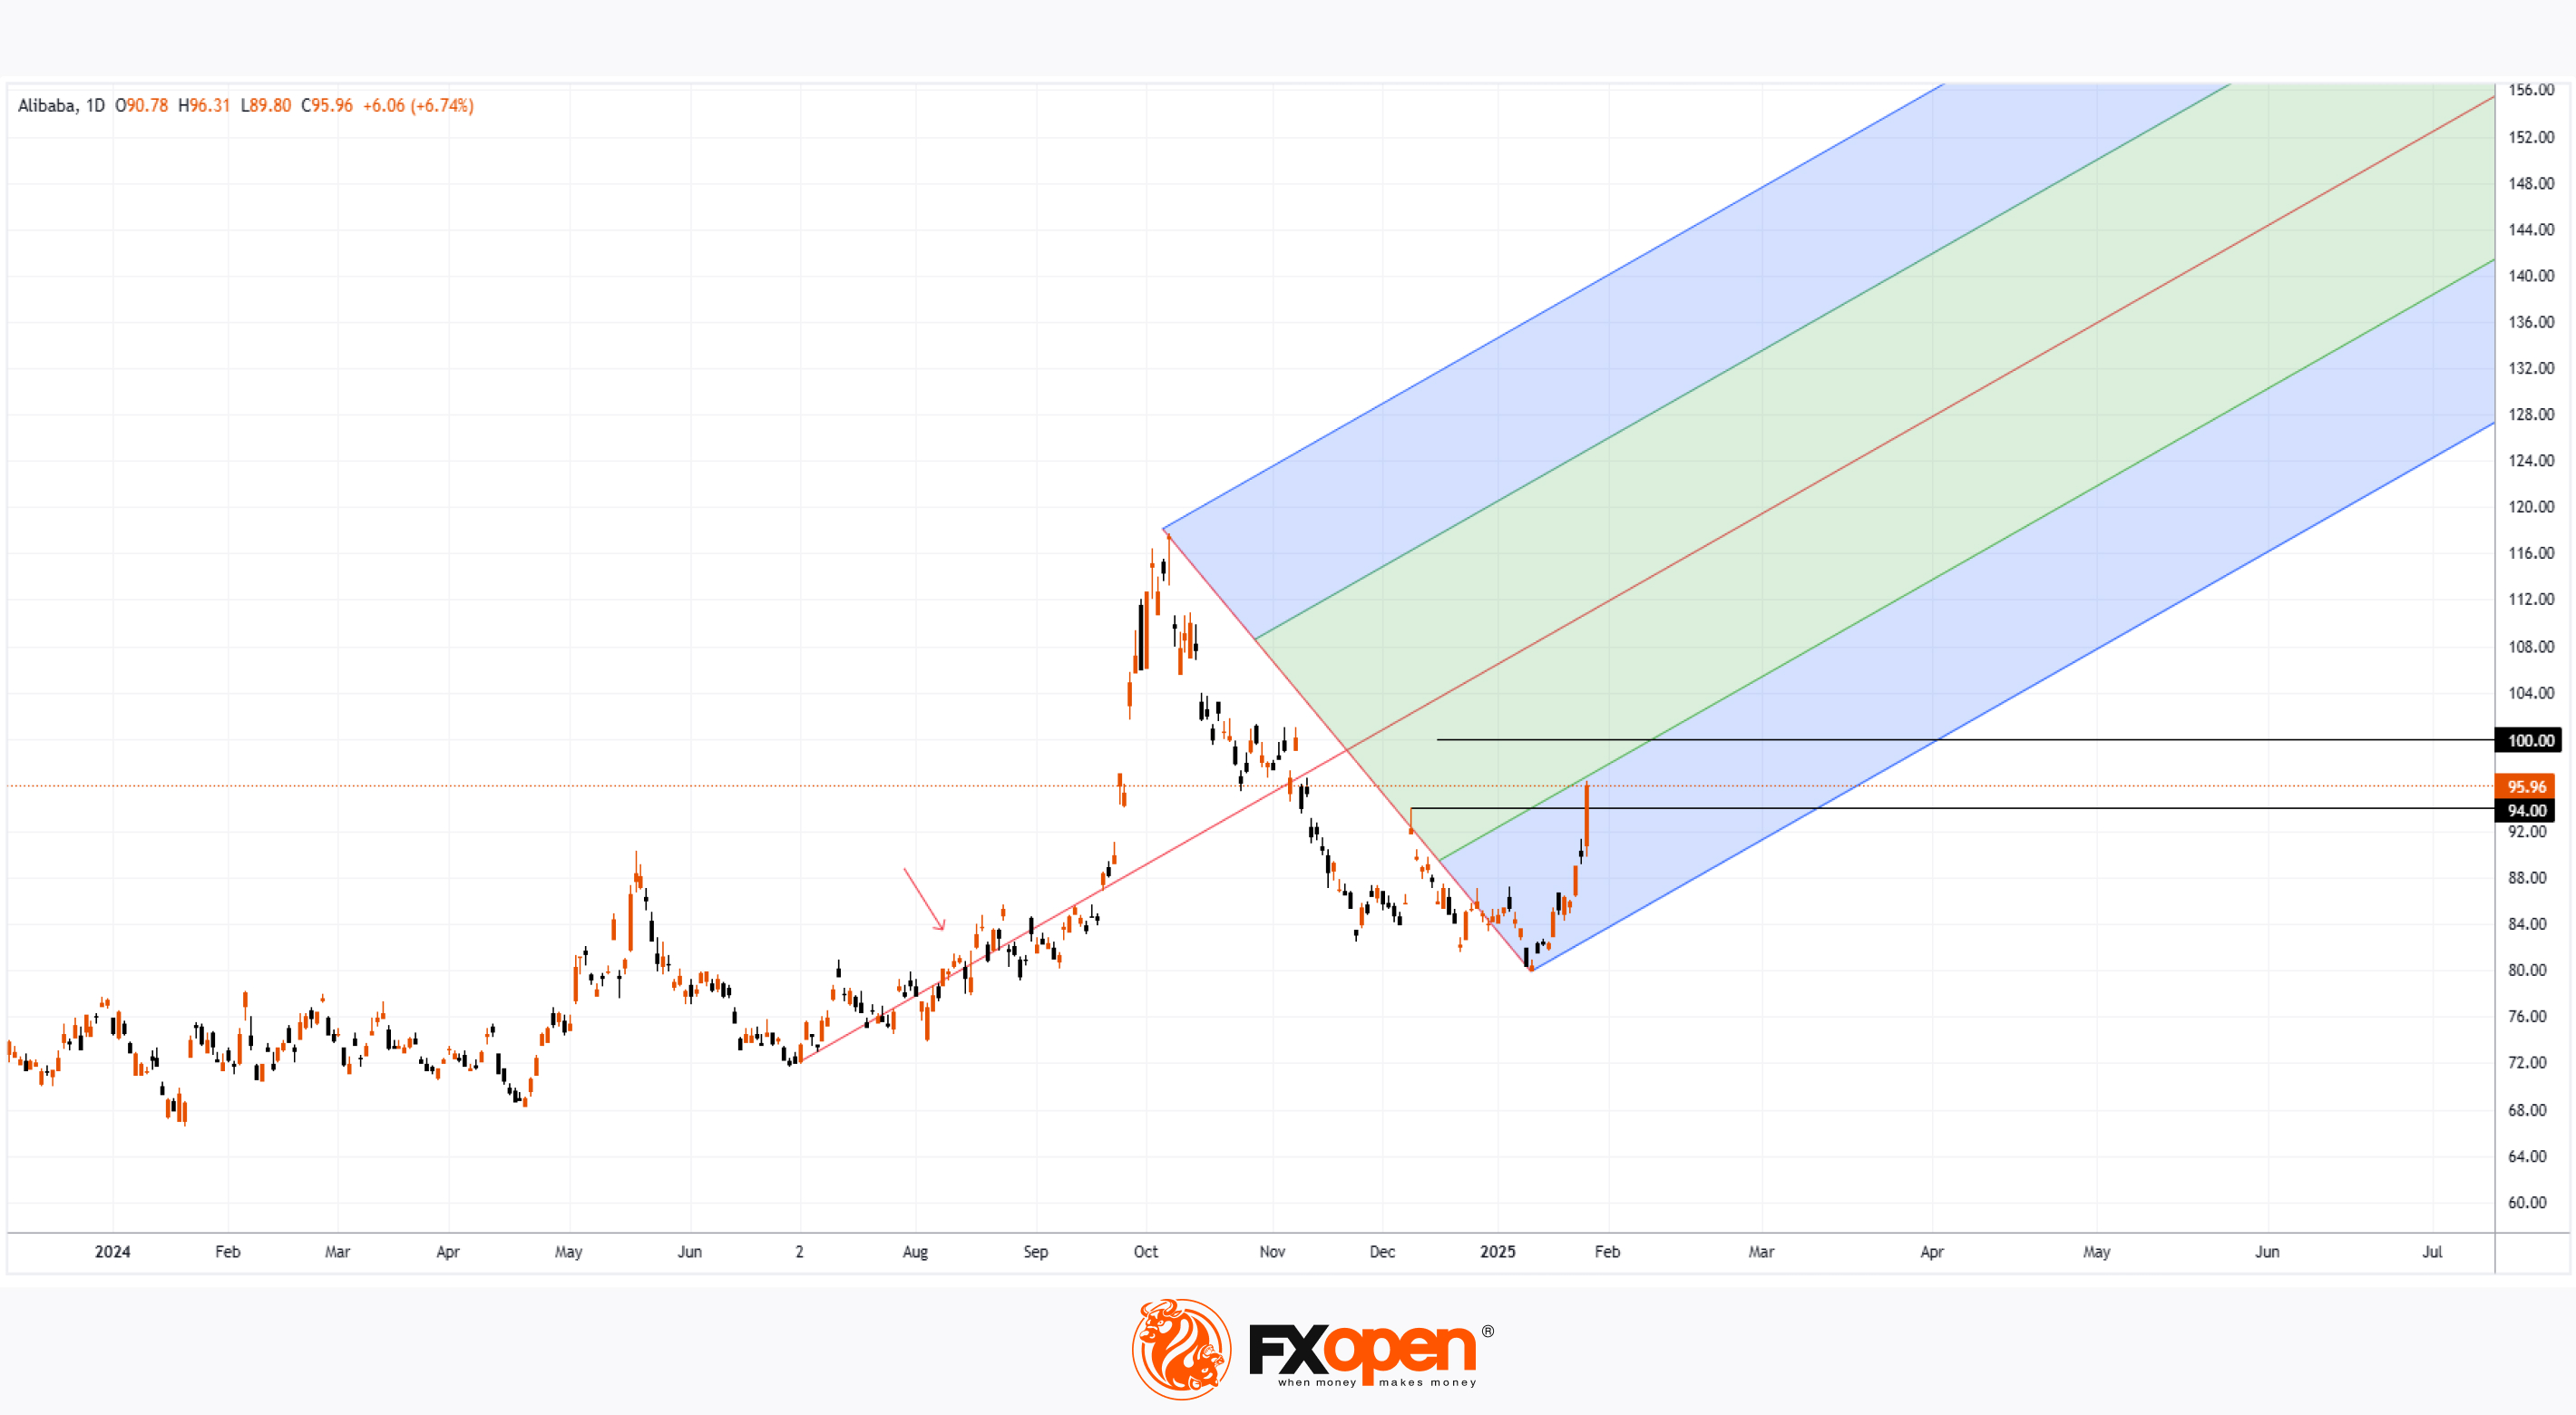
The news was met with enthusiasm, driving Alibaba's (BABA) stock price up by more than 6% in a single day, pushing BABA shares to their highest level of the year.
The technical analysis of the BABA stock chart shows that stock fluctuations form reference points for constructing the Andrew’s Pitchfork pattern, while price movements along the central line (indicated by an arrow) confirm the validity of the pattern's construction.
Currently, the price:
→ Has broken above December’s high at around $94.
→ Is approaching the psychological resistance level of $100.
Whether bulls can sustain or extend these gains will largely depend on Alibaba’s Q4 earnings report, set to be released today, 29 January.
According to TipRanks:
→ 11 out of 12 analysts recommend buying BABA stock.
→ The 12-month average price target stands at $121.33.
Trade global index CFDs with zero commission and tight spreads. Open your FXOpen account now or learn more about trading index CFDs with FXOpen.
CFDs are complex instruments and come with a high risk of losing your money.
This article represents the opinion of the Companies operating under the FXOpen brand only. It is not to be construed as an offer, solicitation, or recommendation with respect to products and services provided by the Companies operating under the FXOpen brand, nor is it to be considered financial advice.
Alibaba (BABA) Shares Surge Following AI Model Launch
Chinese e-commerce giant Alibaba has unveiled an upgraded version of its artificial intelligence model, Qwen2.5 Max. According to the company, the model:
→ Outperforms DeepSeek, the AI model that made headlines this week, in several key areas.
→ Achieves "competitive performance compared to top-tier models," referencing OpenAI and Meta, based on benchmark tests.
The news was met with enthusiasm, driving Alibaba's (BABA) stock price up by more than 6% in a single day, pushing BABA shares to their highest level of the year.
The technical analysis of the BABA stock chart shows that stock fluctuations form reference points for constructing the Andrew’s Pitchfork pattern, while price movements along the central line (indicated by an arrow) confirm the validity of the pattern's construction.
Currently, the price:
→ Has broken above December’s high at around $94.
→ Is approaching the psychological resistance level of $100.
Whether bulls can sustain or extend these gains will largely depend on Alibaba’s Q4 earnings report, set to be released today, 29 January.
According to TipRanks:
→ 11 out of 12 analysts recommend buying BABA stock.
→ The 12-month average price target stands at $121.33.
Trade global index CFDs with zero commission and tight spreads. Open your FXOpen account now or learn more about trading index CFDs with FXOpen.
CFDs are complex instruments and come with a high risk of losing your money.
This article represents the opinion of the Companies operating under the FXOpen brand only. It is not to be construed as an offer, solicitation, or recommendation with respect to products and services provided by the Companies operating under the FXOpen brand, nor is it to be considered financial advice.
👍3
#stockmarket #stocktrading #NASDAQ #MarketUpdates
Nasdaq 100 Hovering Near Weekly Highs in a Volatile Week
As shown on the 4-hour chart of the Nasdaq 100 (US Tech 100 mini on FXOpen), the index stood around the 21,600 level this morning, near the weekly high that formed at Monday’s open.
This suggests that the tech-stock index has almost fully recovered from the decline triggered by the launch of AI from the Chinese startup DeepSeek. According to media reports:
→ Experts have pointed to signs that the Chinese startup used a technique known as “distillation” – in simple terms, this means that DeepSeek’s model extracted knowledge from more advanced models such as ChatGPT. In other words, this is not about innovation but rather an unfair practice.
→ Nassim Taleb believes that the sharp drop in NVDA shares is only the beginning of a potential market downturn inflated by AI-driven expectations. Further declines could be more significant than what we witnessed on Monday.
Apart from news surrounding DeepSeek, traders were also focused on earnings reports from major corporations (which we will cover in detail in separate articles):
→ Tesla (TSLA) is holding above $400 in pre-market trading today, despite earnings per share falling short of expectations. Meanwhile, company executives believe that Trump’s policies could negatively impact Tesla’s operations.
→ Microsoft (MSFT) shares fell by more than 4%, Meta Platforms (META) surpassed $700 per share in post-market trading for the first time, and IBM surged by approximately 9%.
Additionally, the fundamental backdrop became even more eventful following yesterday’s Fed updates, which, however, contained no surprises:
→ As expected, interest rates remained unchanged.
→ According to The Wall Street Journal, the Fed has entered a “Wait-and-See” phase, showing less confidence that inflation will continue to decline.
The Nasdaq 100 (US Tech 100 mini on FXOpen) chart reveals that the price:
→ Tested a key support line (marked in blue) at the weekly low.
→ Remains within the red descending channel.
From a bullish perspective, the red channel can be seen as a large-scale correction within the broader uptrend on higher timeframes.
From a bearish perspective, the bearish gap that formed at Monday’s open may act as resistance. Whether bulls will be able to overcome this barrier in the near term will depend, among other factors, on the next batch of earnings reports from major tech companies.
Trade global index CFDs with zero commission and tight spreads. Open your FXOpen account now or learn more about trading index CFDs with FXOpen.
CFDs are complex instruments and come with a high risk of losing your money.
This article represents the opinion of the Companies operating under the FXOpen brand only. It is not to be construed as an offer, solicitation, or recommendation with respect to products and services provided by the Companies operating under the FXOpen brand, nor is it to be considered financial advice.
Nasdaq 100 Hovering Near Weekly Highs in a Volatile Week
As shown on the 4-hour chart of the Nasdaq 100 (US Tech 100 mini on FXOpen), the index stood around the 21,600 level this morning, near the weekly high that formed at Monday’s open.
This suggests that the tech-stock index has almost fully recovered from the decline triggered by the launch of AI from the Chinese startup DeepSeek. According to media reports:
→ Experts have pointed to signs that the Chinese startup used a technique known as “distillation” – in simple terms, this means that DeepSeek’s model extracted knowledge from more advanced models such as ChatGPT. In other words, this is not about innovation but rather an unfair practice.
→ Nassim Taleb believes that the sharp drop in NVDA shares is only the beginning of a potential market downturn inflated by AI-driven expectations. Further declines could be more significant than what we witnessed on Monday.
Apart from news surrounding DeepSeek, traders were also focused on earnings reports from major corporations (which we will cover in detail in separate articles):
→ Tesla (TSLA) is holding above $400 in pre-market trading today, despite earnings per share falling short of expectations. Meanwhile, company executives believe that Trump’s policies could negatively impact Tesla’s operations.
→ Microsoft (MSFT) shares fell by more than 4%, Meta Platforms (META) surpassed $700 per share in post-market trading for the first time, and IBM surged by approximately 9%.
Additionally, the fundamental backdrop became even more eventful following yesterday’s Fed updates, which, however, contained no surprises:
→ As expected, interest rates remained unchanged.
→ According to The Wall Street Journal, the Fed has entered a “Wait-and-See” phase, showing less confidence that inflation will continue to decline.
The Nasdaq 100 (US Tech 100 mini on FXOpen) chart reveals that the price:
→ Tested a key support line (marked in blue) at the weekly low.
→ Remains within the red descending channel.
From a bullish perspective, the red channel can be seen as a large-scale correction within the broader uptrend on higher timeframes.
From a bearish perspective, the bearish gap that formed at Monday’s open may act as resistance. Whether bulls will be able to overcome this barrier in the near term will depend, among other factors, on the next batch of earnings reports from major tech companies.
Trade global index CFDs with zero commission and tight spreads. Open your FXOpen account now or learn more about trading index CFDs with FXOpen.
CFDs are complex instruments and come with a high risk of losing your money.
This article represents the opinion of the Companies operating under the FXOpen brand only. It is not to be construed as an offer, solicitation, or recommendation with respect to products and services provided by the Companies operating under the FXOpen brand, nor is it to be considered financial advice.
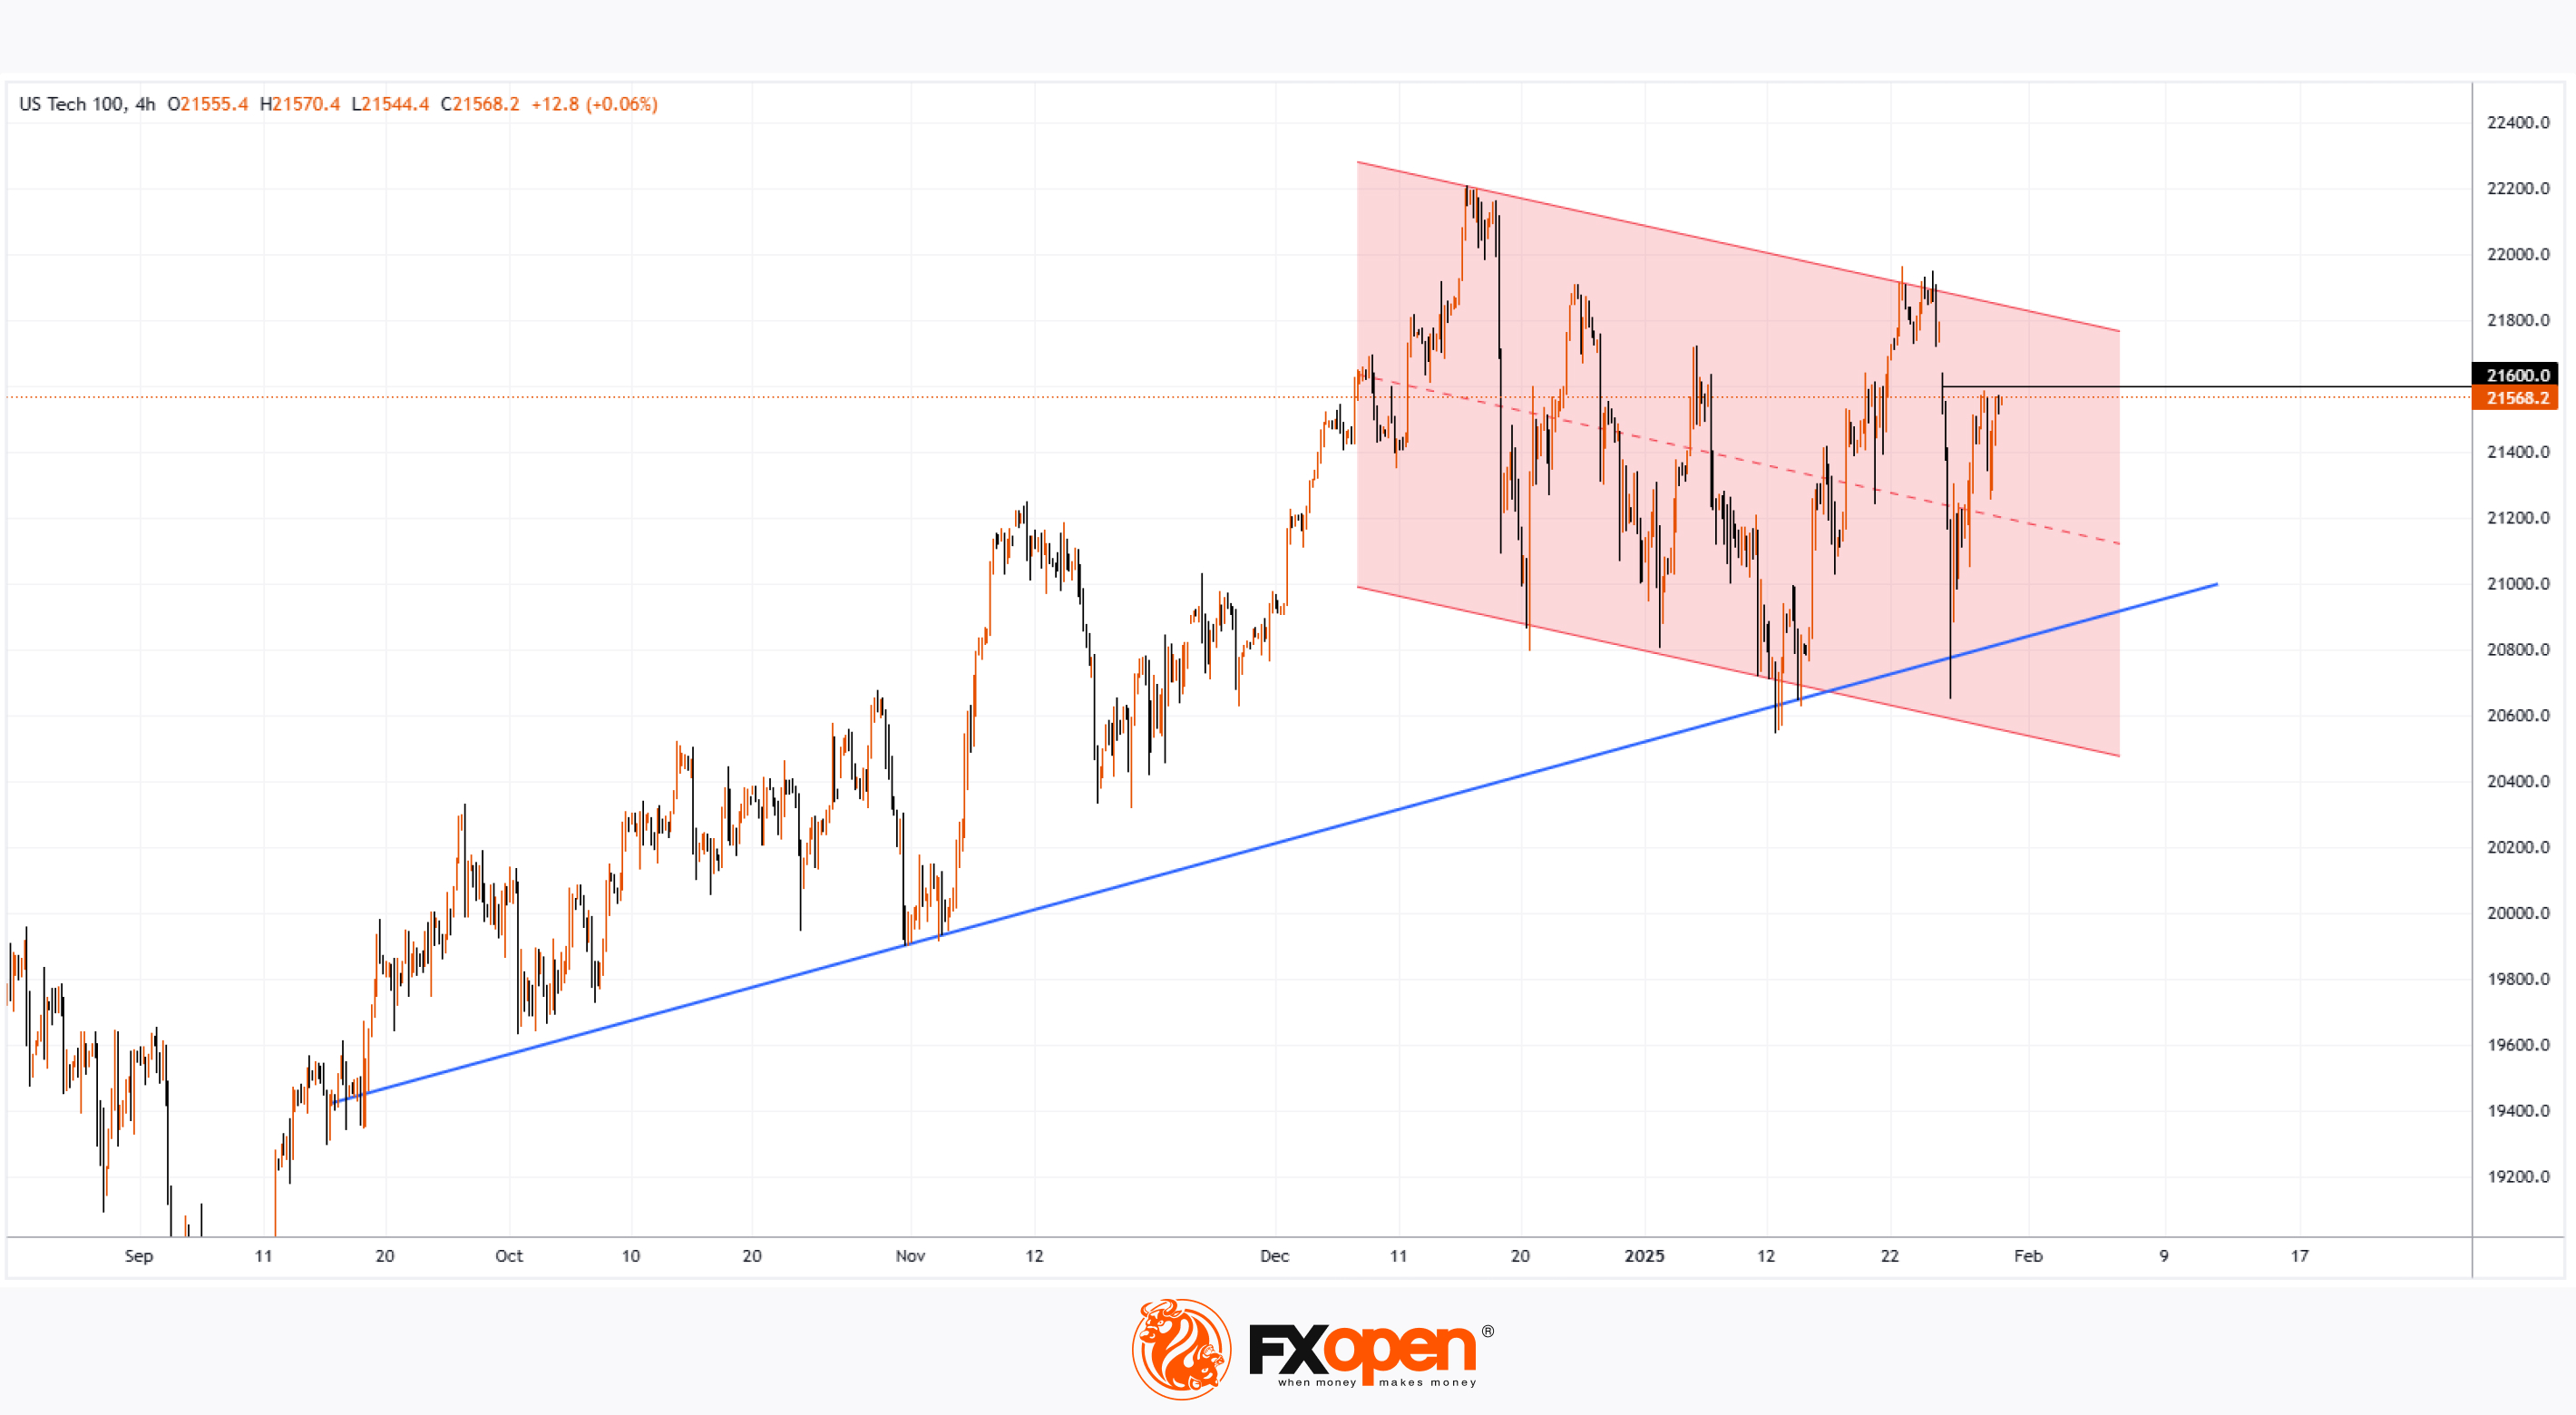
👍3