
#EURUSD #forextrading #tradingtips #MarketUpdates
EUR/USD Started 2025 at Its Lowest Point in 25 Months
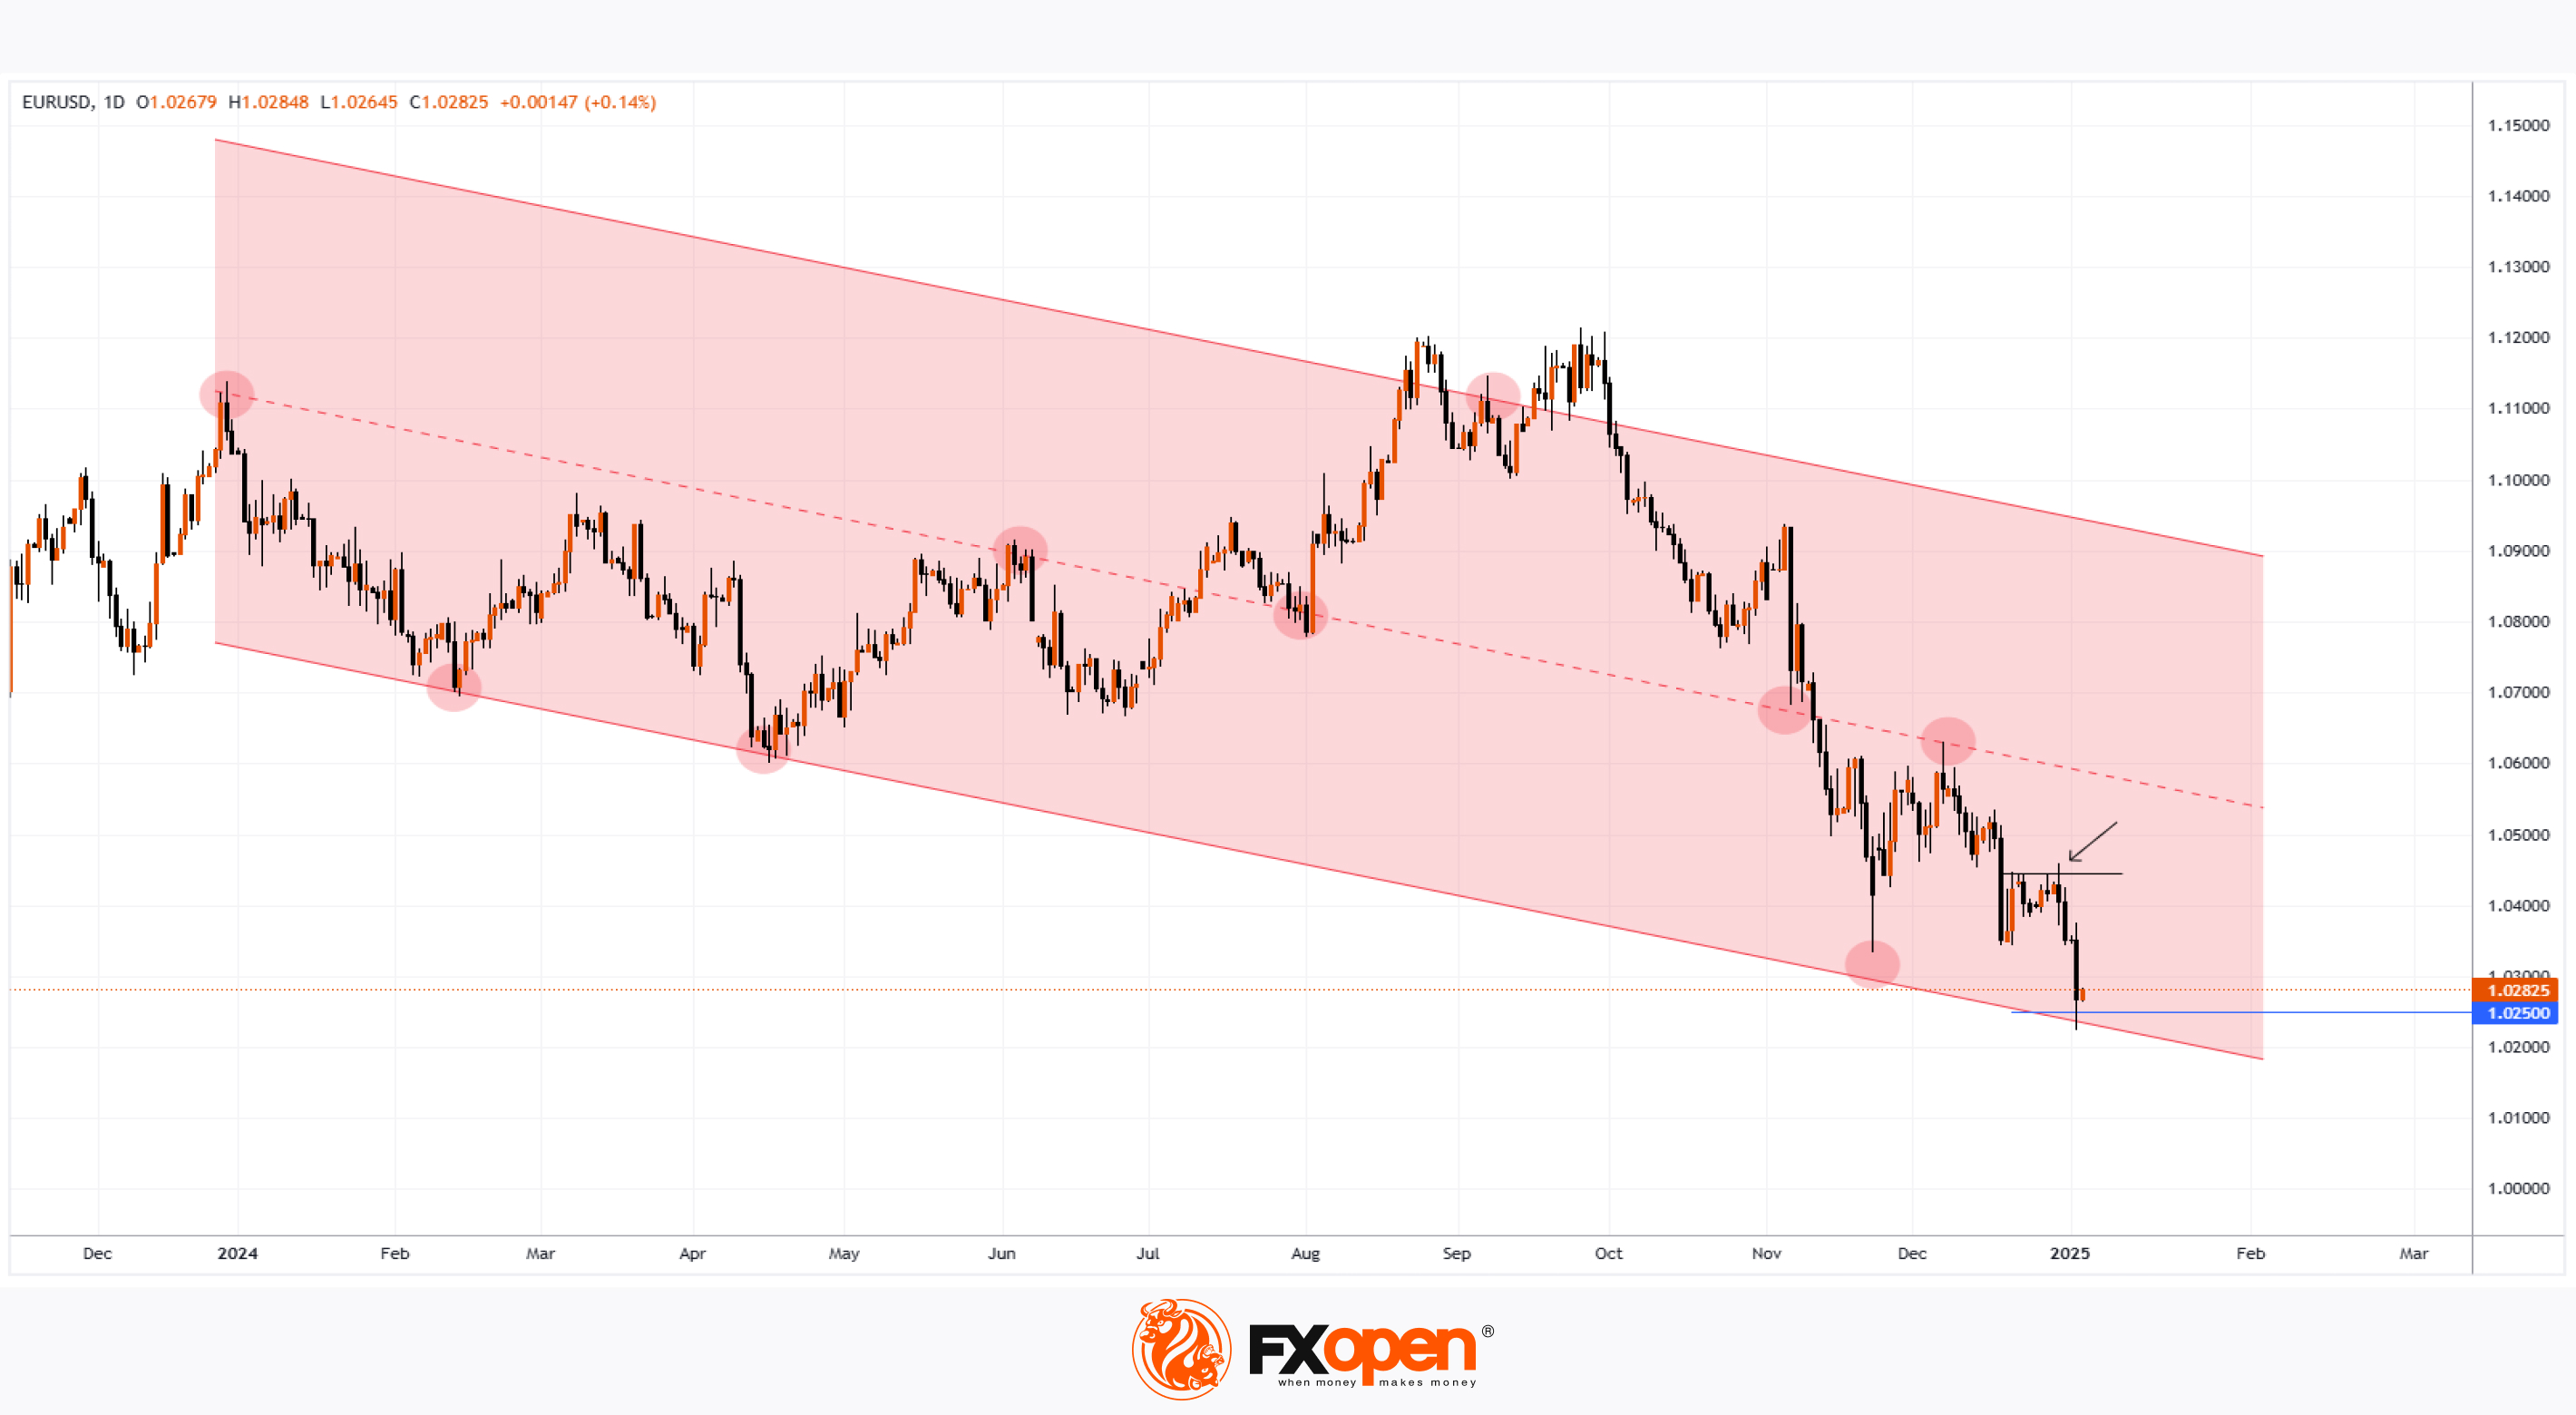
According to the EUR/USD chart, on 2nd January, the first trading day of the year, the EUR/USD pair fell below the psychological level of 1.025, the lowest mark since November 2022.
There are few news events, and the EUR/USD rate decline may be attributed to:
→ The holiday period still affecting financial markets, reducing liquidity and creating vulnerabilities for volatility spikes;
→ Market participants potentially rebalancing their portfolios for the new calendar year;
→ Reassessing the strength of the dollar amid uncertainty about the actual steps of President-elect Trump, whose inauguration is scheduled for this month.
Meanwhile, technical analysis of the EUR/USD chart reveals that:
→ In 2024, price fluctuations formed a downward channel, with key pivot points marked by red circles. Notably, the previous holiday period led to the formation of the first of these points.
→ The bullish "Cup and Handle" pattern, which we discussed on 30th December, resulted in a false bullish breakout (indicated by an arrow). Seizing the bulls' failure, the bears pushed the price to the lower boundary of the mentioned channel.
The area where the lower boundary of the channel intersects the psychological level of 1.025 could serve as strong support. The recovery observed on the morning of 3rd January may confirm this.
The holiday period may lead to the formation of a new key pivot point on the EUR/USD chart, as has happened before.
Trade over 50 forex markets 24 hours a day with FXOpen. Take advantage of low commissions, deep liquidity, and spreads from 0.0 pips. Open your FXOpen account now or learn more about trading forex with FXOpen.
CFDs are complex instruments and come with a high risk of losing your money.
This article represents the opinion of the Companies operating under the FXOpen brand only. It is not to be construed as an offer, solicitation, or recommendation with respect to products and services provided by the Companies operating under the FXOpen brand, nor is it to be considered financial advice.
EUR/USD Started 2025 at Its Lowest Point in 25 Months
According to the EUR/USD chart, on 2nd January, the first trading day of the year, the EUR/USD pair fell below the psychological level of 1.025, the lowest mark since November 2022.
There are few news events, and the EUR/USD rate decline may be attributed to:
→ The holiday period still affecting financial markets, reducing liquidity and creating vulnerabilities for volatility spikes;
→ Market participants potentially rebalancing their portfolios for the new calendar year;
→ Reassessing the strength of the dollar amid uncertainty about the actual steps of President-elect Trump, whose inauguration is scheduled for this month.
Meanwhile, technical analysis of the EUR/USD chart reveals that:
→ In 2024, price fluctuations formed a downward channel, with key pivot points marked by red circles. Notably, the previous holiday period led to the formation of the first of these points.
→ The bullish "Cup and Handle" pattern, which we discussed on 30th December, resulted in a false bullish breakout (indicated by an arrow). Seizing the bulls' failure, the bears pushed the price to the lower boundary of the mentioned channel.
The area where the lower boundary of the channel intersects the psychological level of 1.025 could serve as strong support. The recovery observed on the morning of 3rd January may confirm this.
The holiday period may lead to the formation of a new key pivot point on the EUR/USD chart, as has happened before.
Trade over 50 forex markets 24 hours a day with FXOpen. Take advantage of low commissions, deep liquidity, and spreads from 0.0 pips. Open your FXOpen account now or learn more about trading forex with FXOpen.
CFDs are complex instruments and come with a high risk of losing your money.
This article represents the opinion of the Companies operating under the FXOpen brand only. It is not to be construed as an offer, solicitation, or recommendation with respect to products and services provided by the Companies operating under the FXOpen brand, nor is it to be considered financial advice.
👍2
#nvidia #NVDA #stockmarket #stocktrading #MarketUpdates
Nvidia Stock (NVDA): A Strong Start to 2025
As shown by Nvidia's (NVDA) chart:
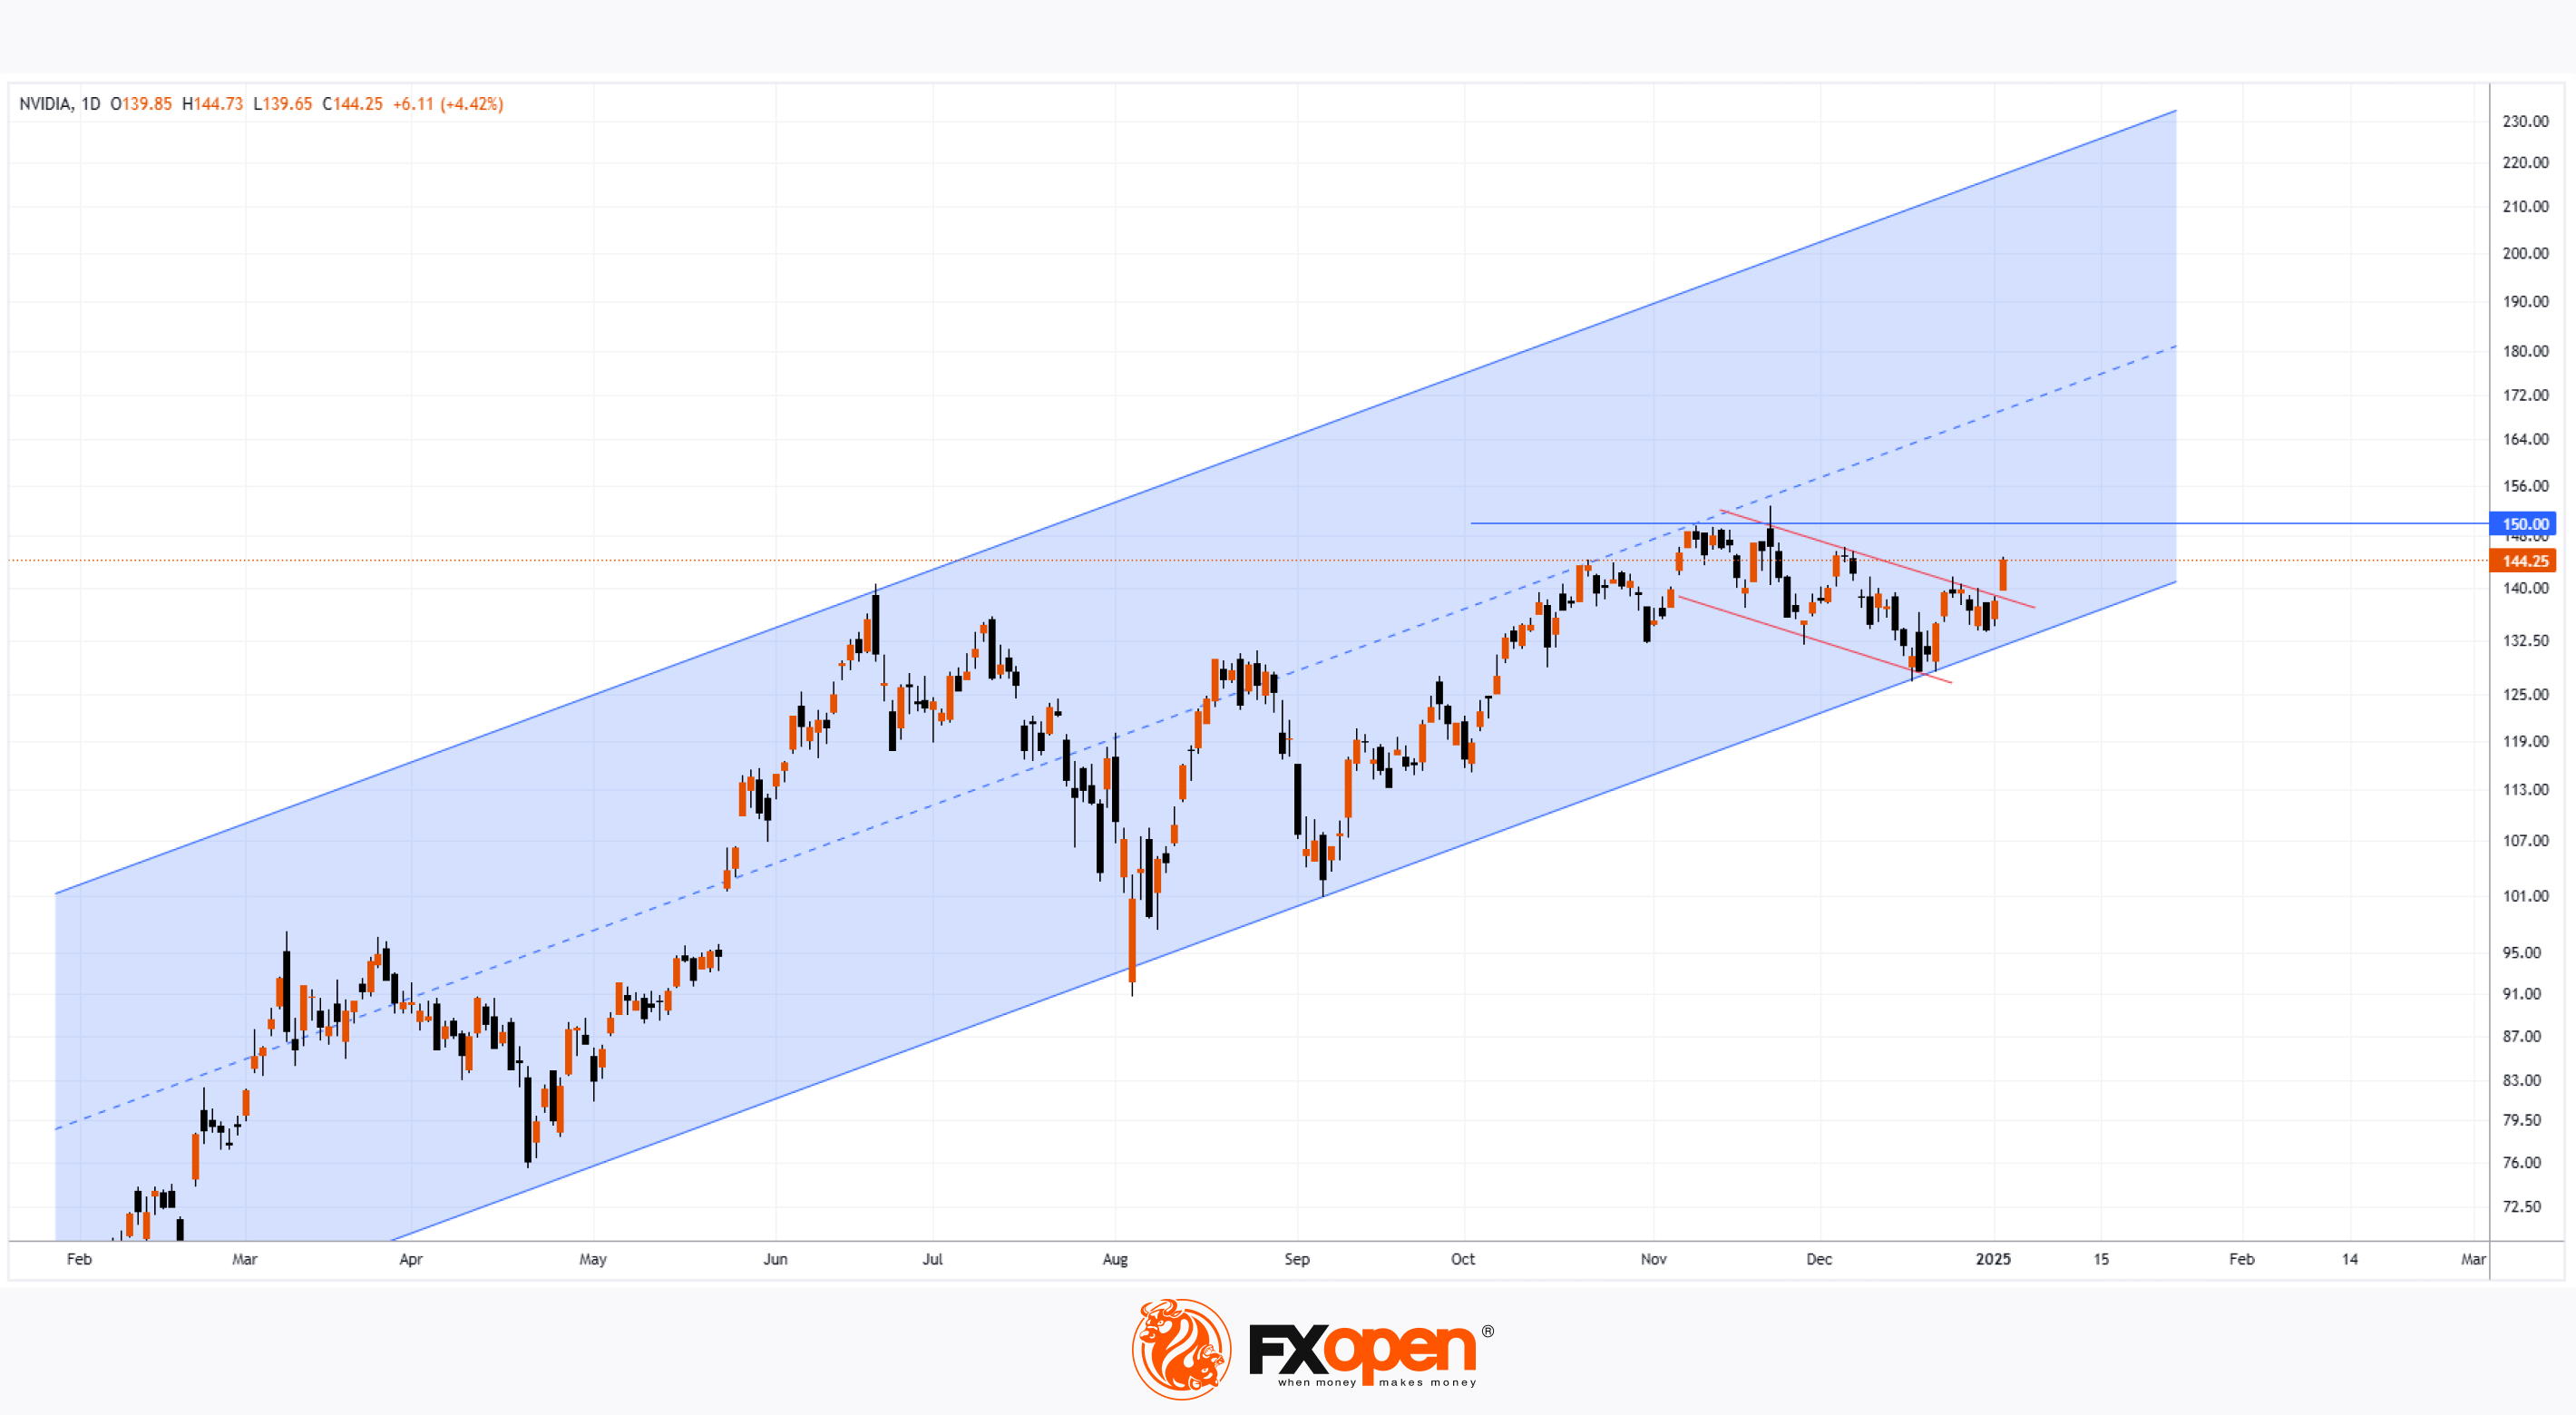
→ In 2024, the stock price rose by approximately 180%—one of the best performances among S&P 500 constituents. Notably, NVDA contributed the largest share—around $1.23 trillion—to the growth of the US stock market capitalisation.
→ 2025 began on an optimistic note: on 3rd January, the candle opened with a bullish gap, and the price climbed confidently during the trading session, closing near the highs. This signals strong demand after the holiday period.
Today, Nvidia CEO Jensen Huang is scheduled to speak at the Consumer Electronics Show (CES). Insights from his speech could potentially provide an additional bullish catalyst.
According to a technical analysis of Nvidia's (NVDA) stock chart:
→ Price movements have formed an ascending channel (highlighted in blue), but the psychological level of $150 serves as strong resistance within this channel.
→ The decline observed in December (marked by red lines) may have been a correction within the prevailing uptrend, with the candle formed on 3rd January signalling an attempt to resume growth.
In January, we may see another bullish attempt to breach the $150 level. The outcome of which will provide valuable insights into the current market sentiment.
According to TipRanks, analysts have a positive outlook for the stock in 2025:
→ 37 out of 40 analysts recommend buying NVDA shares.
→ The average price target for NVDA over the next 12 months is $177.08.
Trade global index CFDs with zero commission and tight spreads. Open your FXOpen account now or learn more about trading index CFDs with FXOpen.
CFDs are complex instruments and come with a high risk of losing your money.
This article represents the opinion of the Companies operating under the FXOpen brand only. It is not to be construed as an offer, solicitation, or recommendation with respect to products and services provided by the Companies operating under the FXOpen brand, nor is it to be considered financial advice.
Nvidia Stock (NVDA): A Strong Start to 2025
As shown by Nvidia's (NVDA) chart:
→ In 2024, the stock price rose by approximately 180%—one of the best performances among S&P 500 constituents. Notably, NVDA contributed the largest share—around $1.23 trillion—to the growth of the US stock market capitalisation.
→ 2025 began on an optimistic note: on 3rd January, the candle opened with a bullish gap, and the price climbed confidently during the trading session, closing near the highs. This signals strong demand after the holiday period.
Today, Nvidia CEO Jensen Huang is scheduled to speak at the Consumer Electronics Show (CES). Insights from his speech could potentially provide an additional bullish catalyst.
According to a technical analysis of Nvidia's (NVDA) stock chart:
→ Price movements have formed an ascending channel (highlighted in blue), but the psychological level of $150 serves as strong resistance within this channel.
→ The decline observed in December (marked by red lines) may have been a correction within the prevailing uptrend, with the candle formed on 3rd January signalling an attempt to resume growth.
In January, we may see another bullish attempt to breach the $150 level. The outcome of which will provide valuable insights into the current market sentiment.
According to TipRanks, analysts have a positive outlook for the stock in 2025:
→ 37 out of 40 analysts recommend buying NVDA shares.
→ The average price target for NVDA over the next 12 months is $177.08.
Trade global index CFDs with zero commission and tight spreads. Open your FXOpen account now or learn more about trading index CFDs with FXOpen.
CFDs are complex instruments and come with a high risk of losing your money.
This article represents the opinion of the Companies operating under the FXOpen brand only. It is not to be construed as an offer, solicitation, or recommendation with respect to products and services provided by the Companies operating under the FXOpen brand, nor is it to be considered financial advice.
👍2
#oilprices #brentoil #MarketNews #marketanalysis
Brent Crude Oil Hits 2.5-Month High in Early 2025
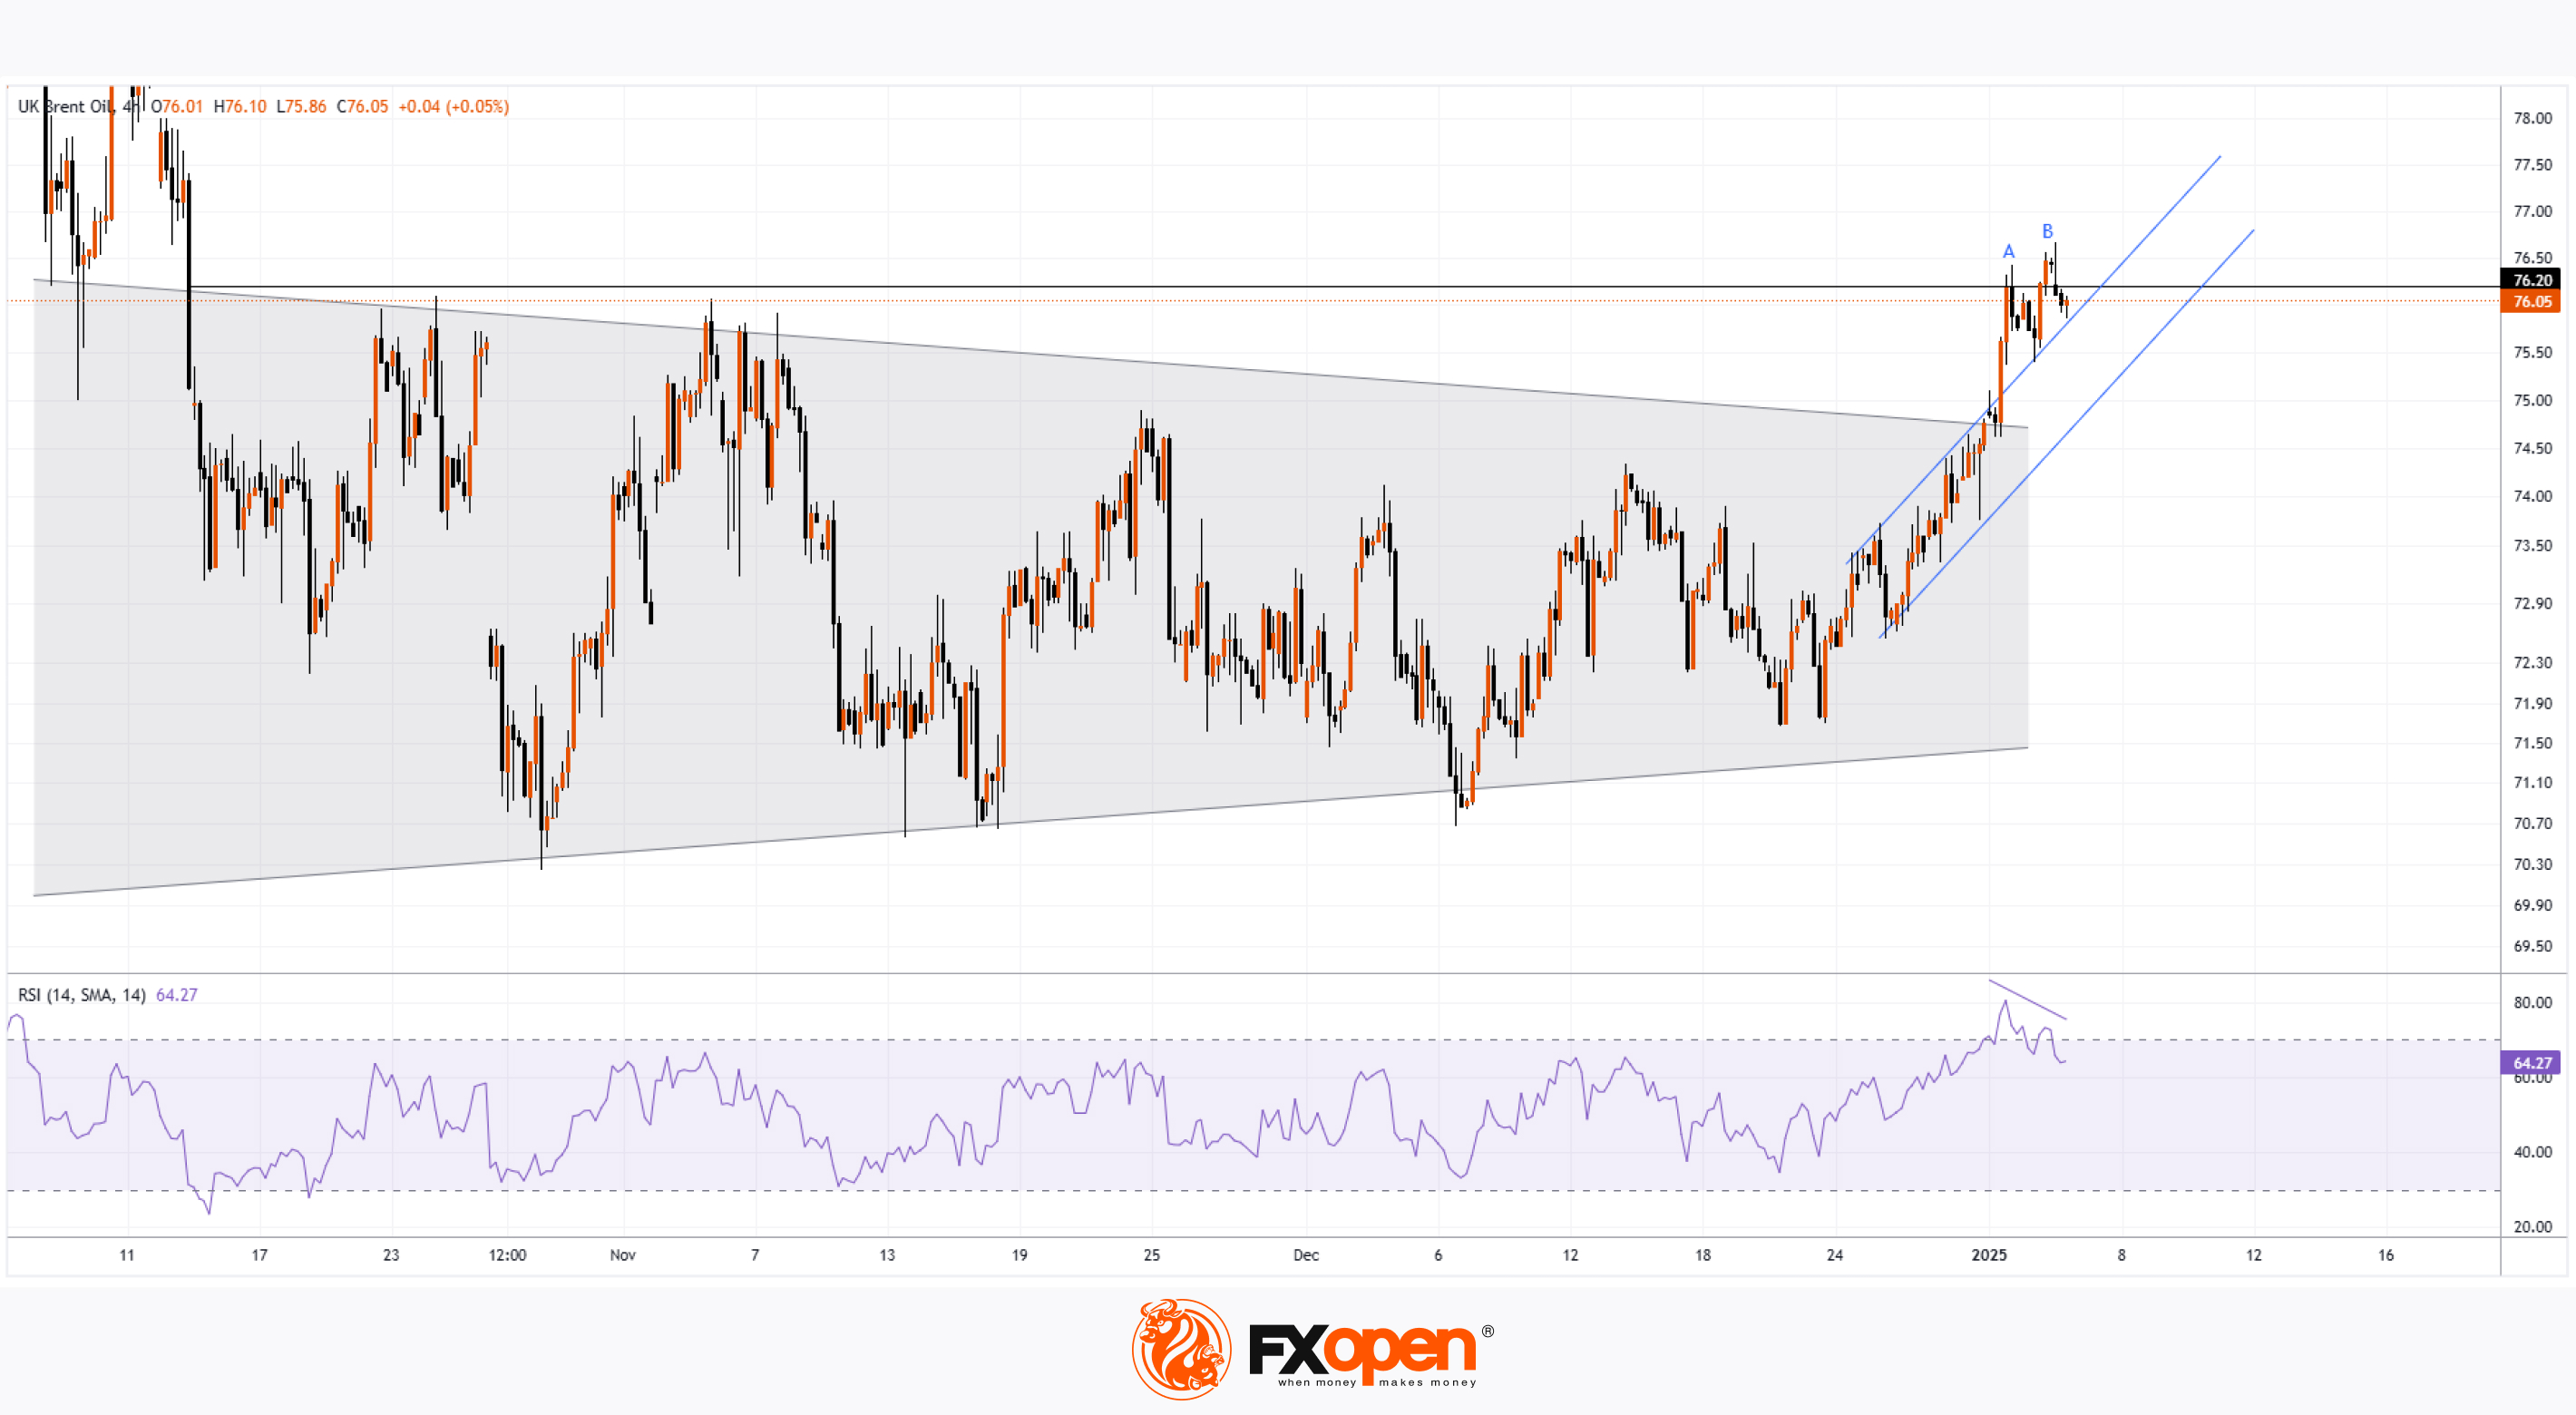
The XBR/USD chart shows a strong rally in Brent crude oil prices on January 2–3, breaking above $76.20 for the first time since mid-October.
According to Reuters, this surge was driven by:
- Economic stimulus measures in China, including wage increases for public servants and a significant boost in funding through treasury bonds.
- Forecasts of a colder winter in the US and Europe, potentially increasing demand for oil products.
According to technical analysis of the XBR/USD chart, the price broke out of a consolidation pattern (highlighted in blue) that had confined it in late 2024.
However, signs of waning bullish momentum are emerging:
- At point B, the price only slightly surpassed the previous high at point A before reversing downward, indicating buyer weakness.
- A bearish divergence is forming between the RSI indicator and points A and B.
These signals suggest that Brent crude oil prices could be vulnerable to a correction, potentially targeting the lower blue trendline as a support level.
Start trading commodities with tight spreads. Open your trading account now or learn more about trading commodity CFDs with FXOpen.
CFDs are complex instruments and come with a high risk of losing your money.
This article represents the opinion of the Companies operating under the FXOpen brand only. It is not to be construed as an offer, solicitation, or recommendation with respect to products and services provided by the Companies operating under the FXOpen brand, nor is it to be considered financial advice.
Brent Crude Oil Hits 2.5-Month High in Early 2025
The XBR/USD chart shows a strong rally in Brent crude oil prices on January 2–3, breaking above $76.20 for the first time since mid-October.
According to Reuters, this surge was driven by:
- Economic stimulus measures in China, including wage increases for public servants and a significant boost in funding through treasury bonds.
- Forecasts of a colder winter in the US and Europe, potentially increasing demand for oil products.
According to technical analysis of the XBR/USD chart, the price broke out of a consolidation pattern (highlighted in blue) that had confined it in late 2024.
However, signs of waning bullish momentum are emerging:
- At point B, the price only slightly surpassed the previous high at point A before reversing downward, indicating buyer weakness.
- A bearish divergence is forming between the RSI indicator and points A and B.
These signals suggest that Brent crude oil prices could be vulnerable to a correction, potentially targeting the lower blue trendline as a support level.
Start trading commodities with tight spreads. Open your trading account now or learn more about trading commodity CFDs with FXOpen.
CFDs are complex instruments and come with a high risk of losing your money.
This article represents the opinion of the Companies operating under the FXOpen brand only. It is not to be construed as an offer, solicitation, or recommendation with respect to products and services provided by the Companies operating under the FXOpen brand, nor is it to be considered financial advice.
👍3
#stockmarket #stocktrading #MarketUpdates #moderna
The Share Price of Moderna (MRNA) Surged Over 10% in a Day
As shown by the chart of pharmaceutical company Moderna (MRNA):
→ 2024 was an extremely difficult year, with the price falling by approximately 60%;
→ however, in early 2025, we can see signs of renewed strength.
During yesterday’s session, Moderna’s (MRNA) share price rose by more than 10%, following news of the first death in the US from H5N1 bird flu. According to Barron’s, Moderna is one of the few pharmaceutical companies currently developing a vaccine for H5N1 bird flu, which is spreading rapidly across North America.
This brings back memories of 2020, when MRNA’s share price surged with a significant bullish gap on news of the COVID-19 vaccine trials.
Interestingly, the 2024 low is near the lower boundary of the 2020 gap, around the $37 level. From a technical analysis perspective, this “gap closure” could be viewed as a bullish sign, supported by yesterday’s price action.
Additionally:
→ there has been a breakout above the descending trend channel that dominated the end of 2024;
→ it is possible that price movements may form a new ascending channel (shown in blue);
→ further growth may be hindered by the psychological resistance level of $50.
According to TipRanks, analysts remain cautious about Moderna’s prospects:
→ only 4 out of 19 analysts recommend buying MRNA shares;
→ the average 12-month price target for MRNA is $62.
Trade global index CFDs with zero commission and tight spreads. Open your FXOpen account now or learn more about trading index CFDs with FXOpen.
CFDs are complex instruments and come with a high risk of losing your money.
This article represents the opinion of the Companies operating under the FXOpen brand only. It is not to be construed as an offer, solicitation, or recommendation with respect to products and services provided by the Companies operating under the FXOpen brand, nor is it to be considered financial advice.
The Share Price of Moderna (MRNA) Surged Over 10% in a Day
As shown by the chart of pharmaceutical company Moderna (MRNA):
→ 2024 was an extremely difficult year, with the price falling by approximately 60%;
→ however, in early 2025, we can see signs of renewed strength.
During yesterday’s session, Moderna’s (MRNA) share price rose by more than 10%, following news of the first death in the US from H5N1 bird flu. According to Barron’s, Moderna is one of the few pharmaceutical companies currently developing a vaccine for H5N1 bird flu, which is spreading rapidly across North America.
This brings back memories of 2020, when MRNA’s share price surged with a significant bullish gap on news of the COVID-19 vaccine trials.
Interestingly, the 2024 low is near the lower boundary of the 2020 gap, around the $37 level. From a technical analysis perspective, this “gap closure” could be viewed as a bullish sign, supported by yesterday’s price action.
Additionally:
→ there has been a breakout above the descending trend channel that dominated the end of 2024;
→ it is possible that price movements may form a new ascending channel (shown in blue);
→ further growth may be hindered by the psychological resistance level of $50.
According to TipRanks, analysts remain cautious about Moderna’s prospects:
→ only 4 out of 19 analysts recommend buying MRNA shares;
→ the average 12-month price target for MRNA is $62.
Trade global index CFDs with zero commission and tight spreads. Open your FXOpen account now or learn more about trading index CFDs with FXOpen.
CFDs are complex instruments and come with a high risk of losing your money.
This article represents the opinion of the Companies operating under the FXOpen brand only. It is not to be construed as an offer, solicitation, or recommendation with respect to products and services provided by the Companies operating under the FXOpen brand, nor is it to be considered financial advice.

👍2
#stockmarket #stocks #MarketUpdates #marketanalysis
Eurostoxx 50 Index Rises Above 5000
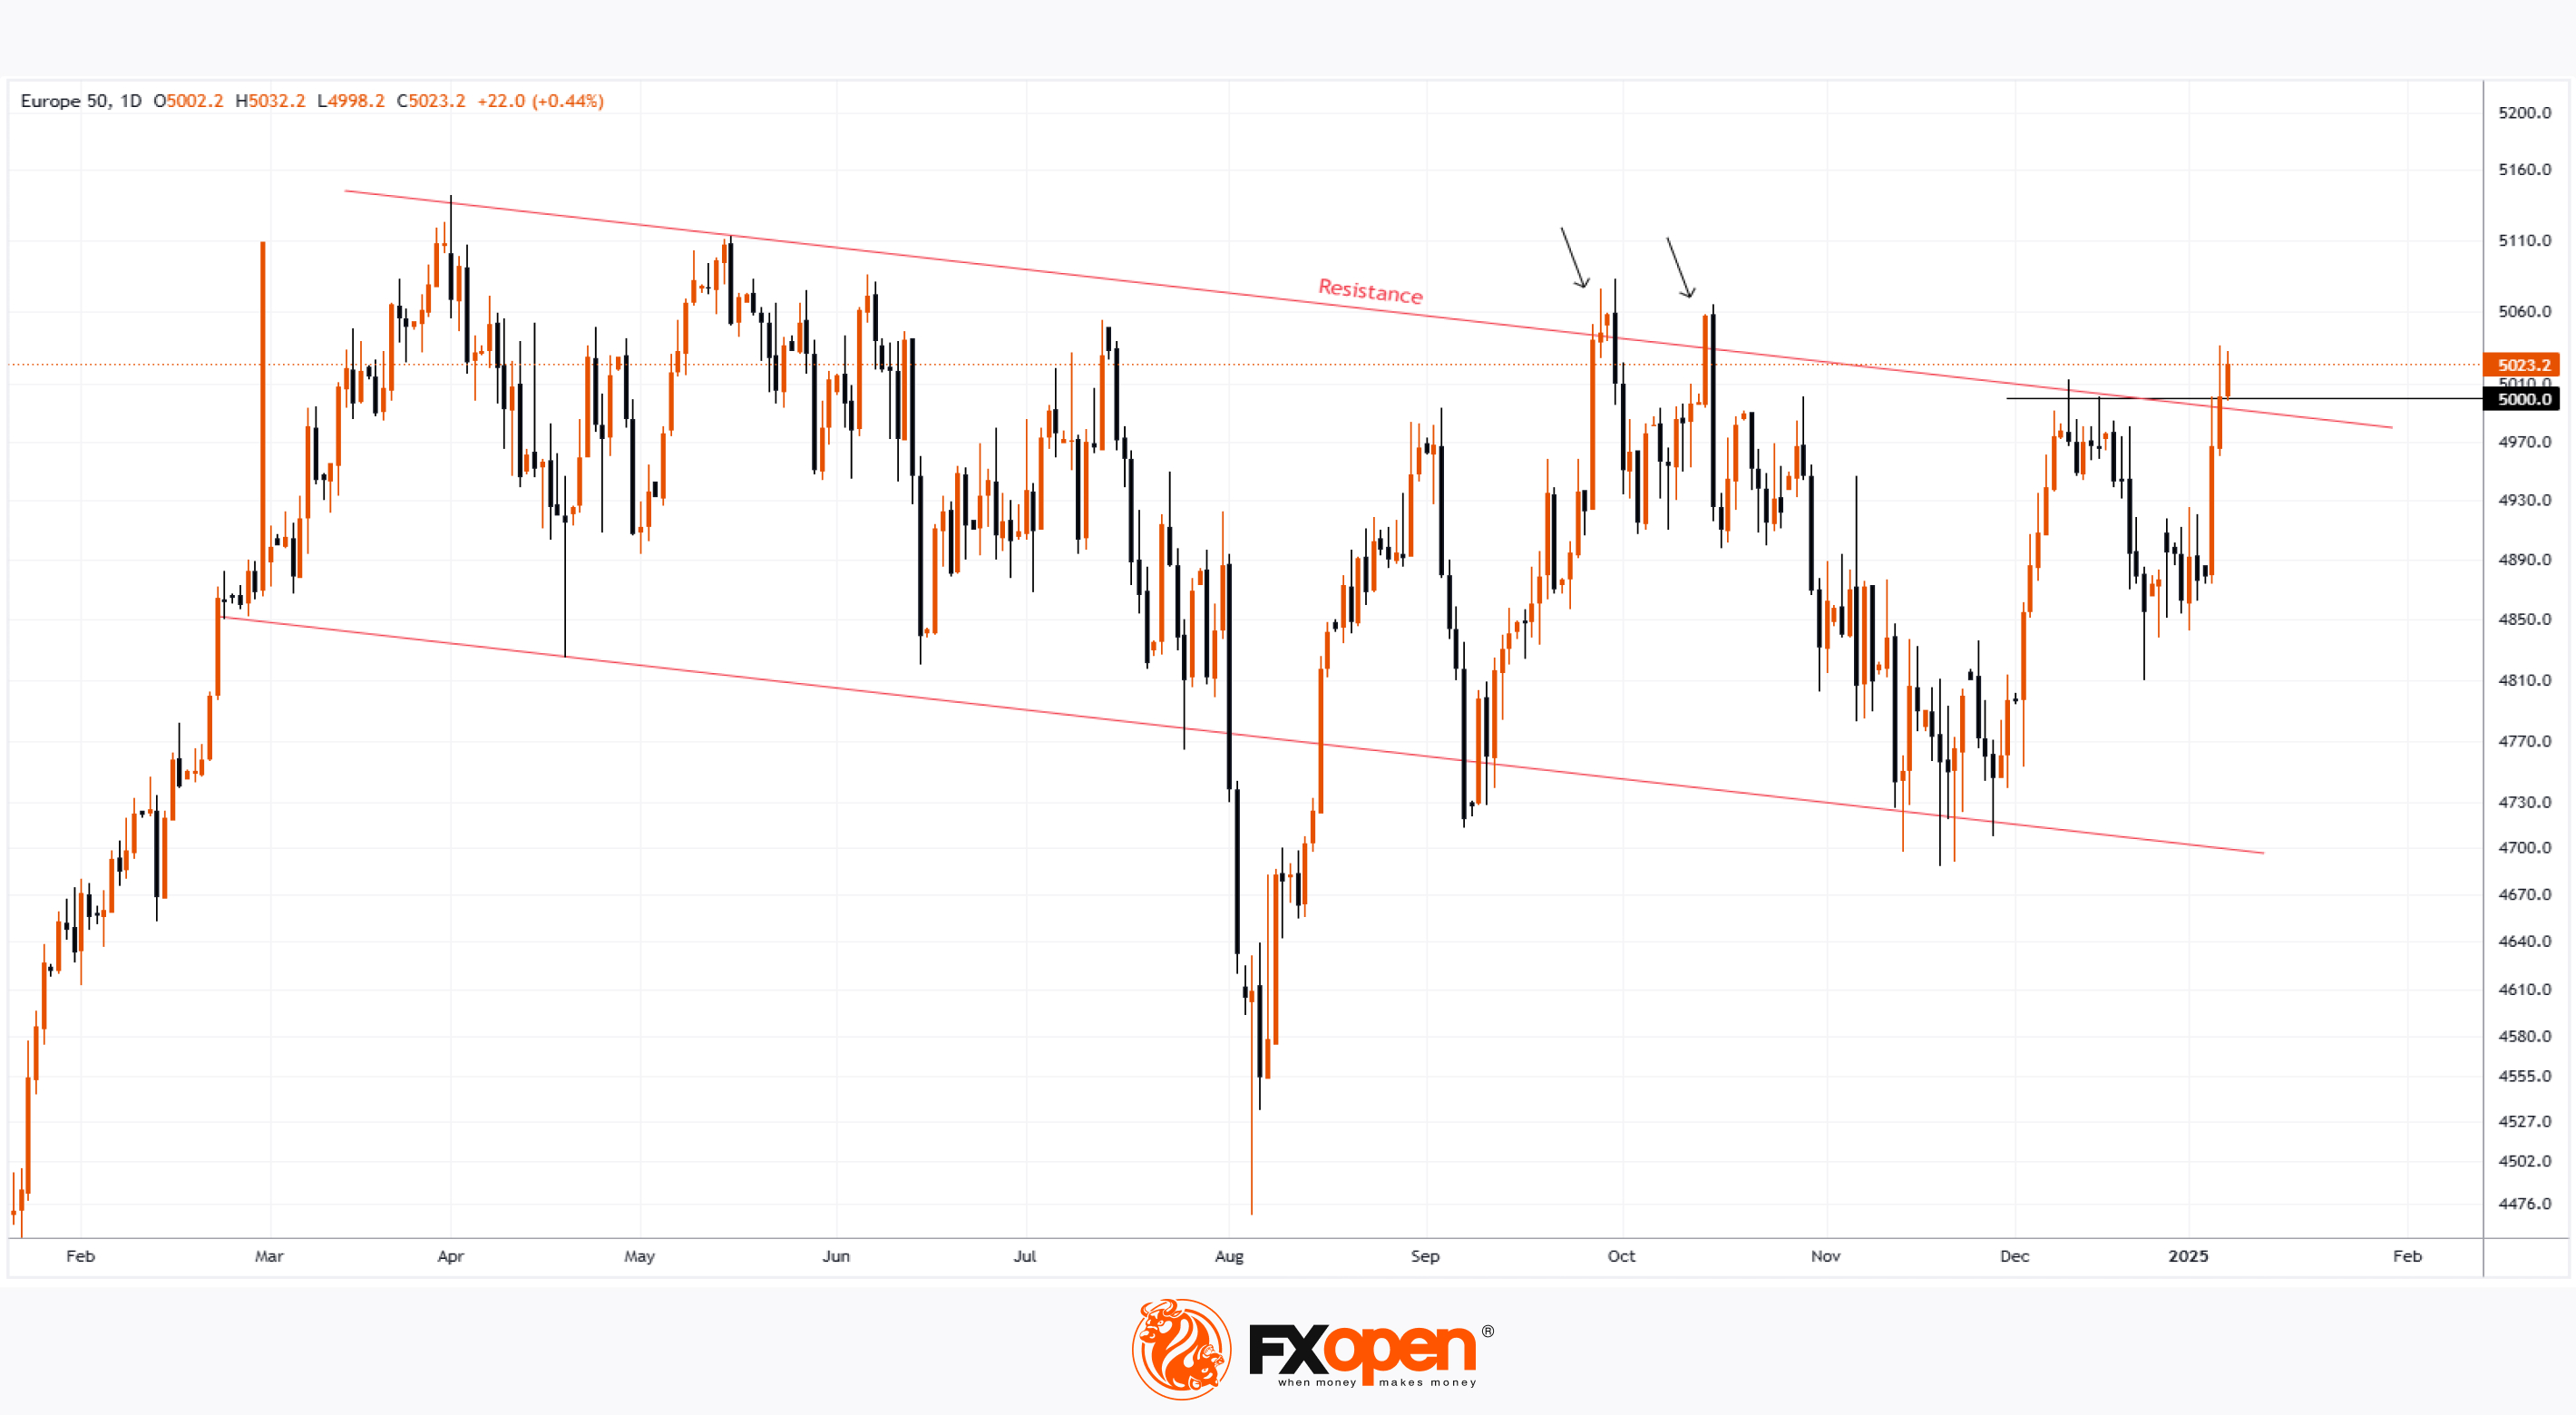
As indicated by the chart of the Eurostoxx 50 index (Europe 50 on FXOpen), its value climbed above the psychological level of 5000 points in early 2025.
The strength of demand may be driven by portfolio rebalancing or long-term investor expectations, as today’s news for the European stock market was negative. According to ForexFactory:
→ industrial orders in Germany dropped by 5.1% month-on-month (expected: -0.3%);
→ retail sales in Germany fell by 0.6% month-on-month (expected: +0.5%);
→ France reported a worsening government budget balance.
A technical analysis of the Eurostoxx 50 index (Europe 50 on FXOpen) chart shows that:
→ the current value is above a resistance line (shown in red), which dates back to spring 2024;
→ since then, bulls have made two attempts to break above this line (marked with arrows) but failed to sustain the gains.
It is possible that further negative economic news from Europe could trigger bearish activity—if so, we may witness a third unsuccessful attempt to hold above the red resistance line, potentially resulting in the formation of a false breakout pattern.
Trade global index CFDs with zero commission and tight spreads. Open your FXOpen account now or learn more about trading index CFDs with FXOpen.
CFDs are complex instruments and come with a high risk of losing your money.
This article represents the opinion of the Companies operating under the FXOpen brand only. It is not to be construed as an offer, solicitation, or recommendation with respect to products and services provided by the Companies operating under the FXOpen brand, nor is it to be considered financial advice.
Eurostoxx 50 Index Rises Above 5000
As indicated by the chart of the Eurostoxx 50 index (Europe 50 on FXOpen), its value climbed above the psychological level of 5000 points in early 2025.
The strength of demand may be driven by portfolio rebalancing or long-term investor expectations, as today’s news for the European stock market was negative. According to ForexFactory:
→ industrial orders in Germany dropped by 5.1% month-on-month (expected: -0.3%);
→ retail sales in Germany fell by 0.6% month-on-month (expected: +0.5%);
→ France reported a worsening government budget balance.
A technical analysis of the Eurostoxx 50 index (Europe 50 on FXOpen) chart shows that:
→ the current value is above a resistance line (shown in red), which dates back to spring 2024;
→ since then, bulls have made two attempts to break above this line (marked with arrows) but failed to sustain the gains.
It is possible that further negative economic news from Europe could trigger bearish activity—if so, we may witness a third unsuccessful attempt to hold above the red resistance line, potentially resulting in the formation of a false breakout pattern.
Trade global index CFDs with zero commission and tight spreads. Open your FXOpen account now or learn more about trading index CFDs with FXOpen.
CFDs are complex instruments and come with a high risk of losing your money.
This article represents the opinion of the Companies operating under the FXOpen brand only. It is not to be construed as an offer, solicitation, or recommendation with respect to products and services provided by the Companies operating under the FXOpen brand, nor is it to be considered financial advice.
👍2
#stockmarket #ebay #stocktrading #MarketUpdates
EBAY Share Price Jumps Over 9% in a Day
Yesterday, traders focused on:
→ labour market news, which showed a slight decrease in new unemployment claims;
→ comments from the Federal Reserve: Christopher Waller stated that inflation is expected to fall to the target rate of 2% in the medium term, and further monetary easing would be "appropriate".
However, these factors did not lead to significant changes in stock indices. The S&P 500 index (US SPX 500 mini on FXOpen) fell by 0.12% yesterday.
The major highlight was the surge in eBay Inc. (EBAY) shares, which rose by more than 9%. This was driven by Meta Platforms (META) announcing a test launch of a new feature that would allow users in the US, France, and Germany to browse eBay products on Facebook Marketplace and complete transactions on eBay.
If the test proves successful, this feature could potentially drive a significant increase in eBay’s revenue due to a new influx of buyers.
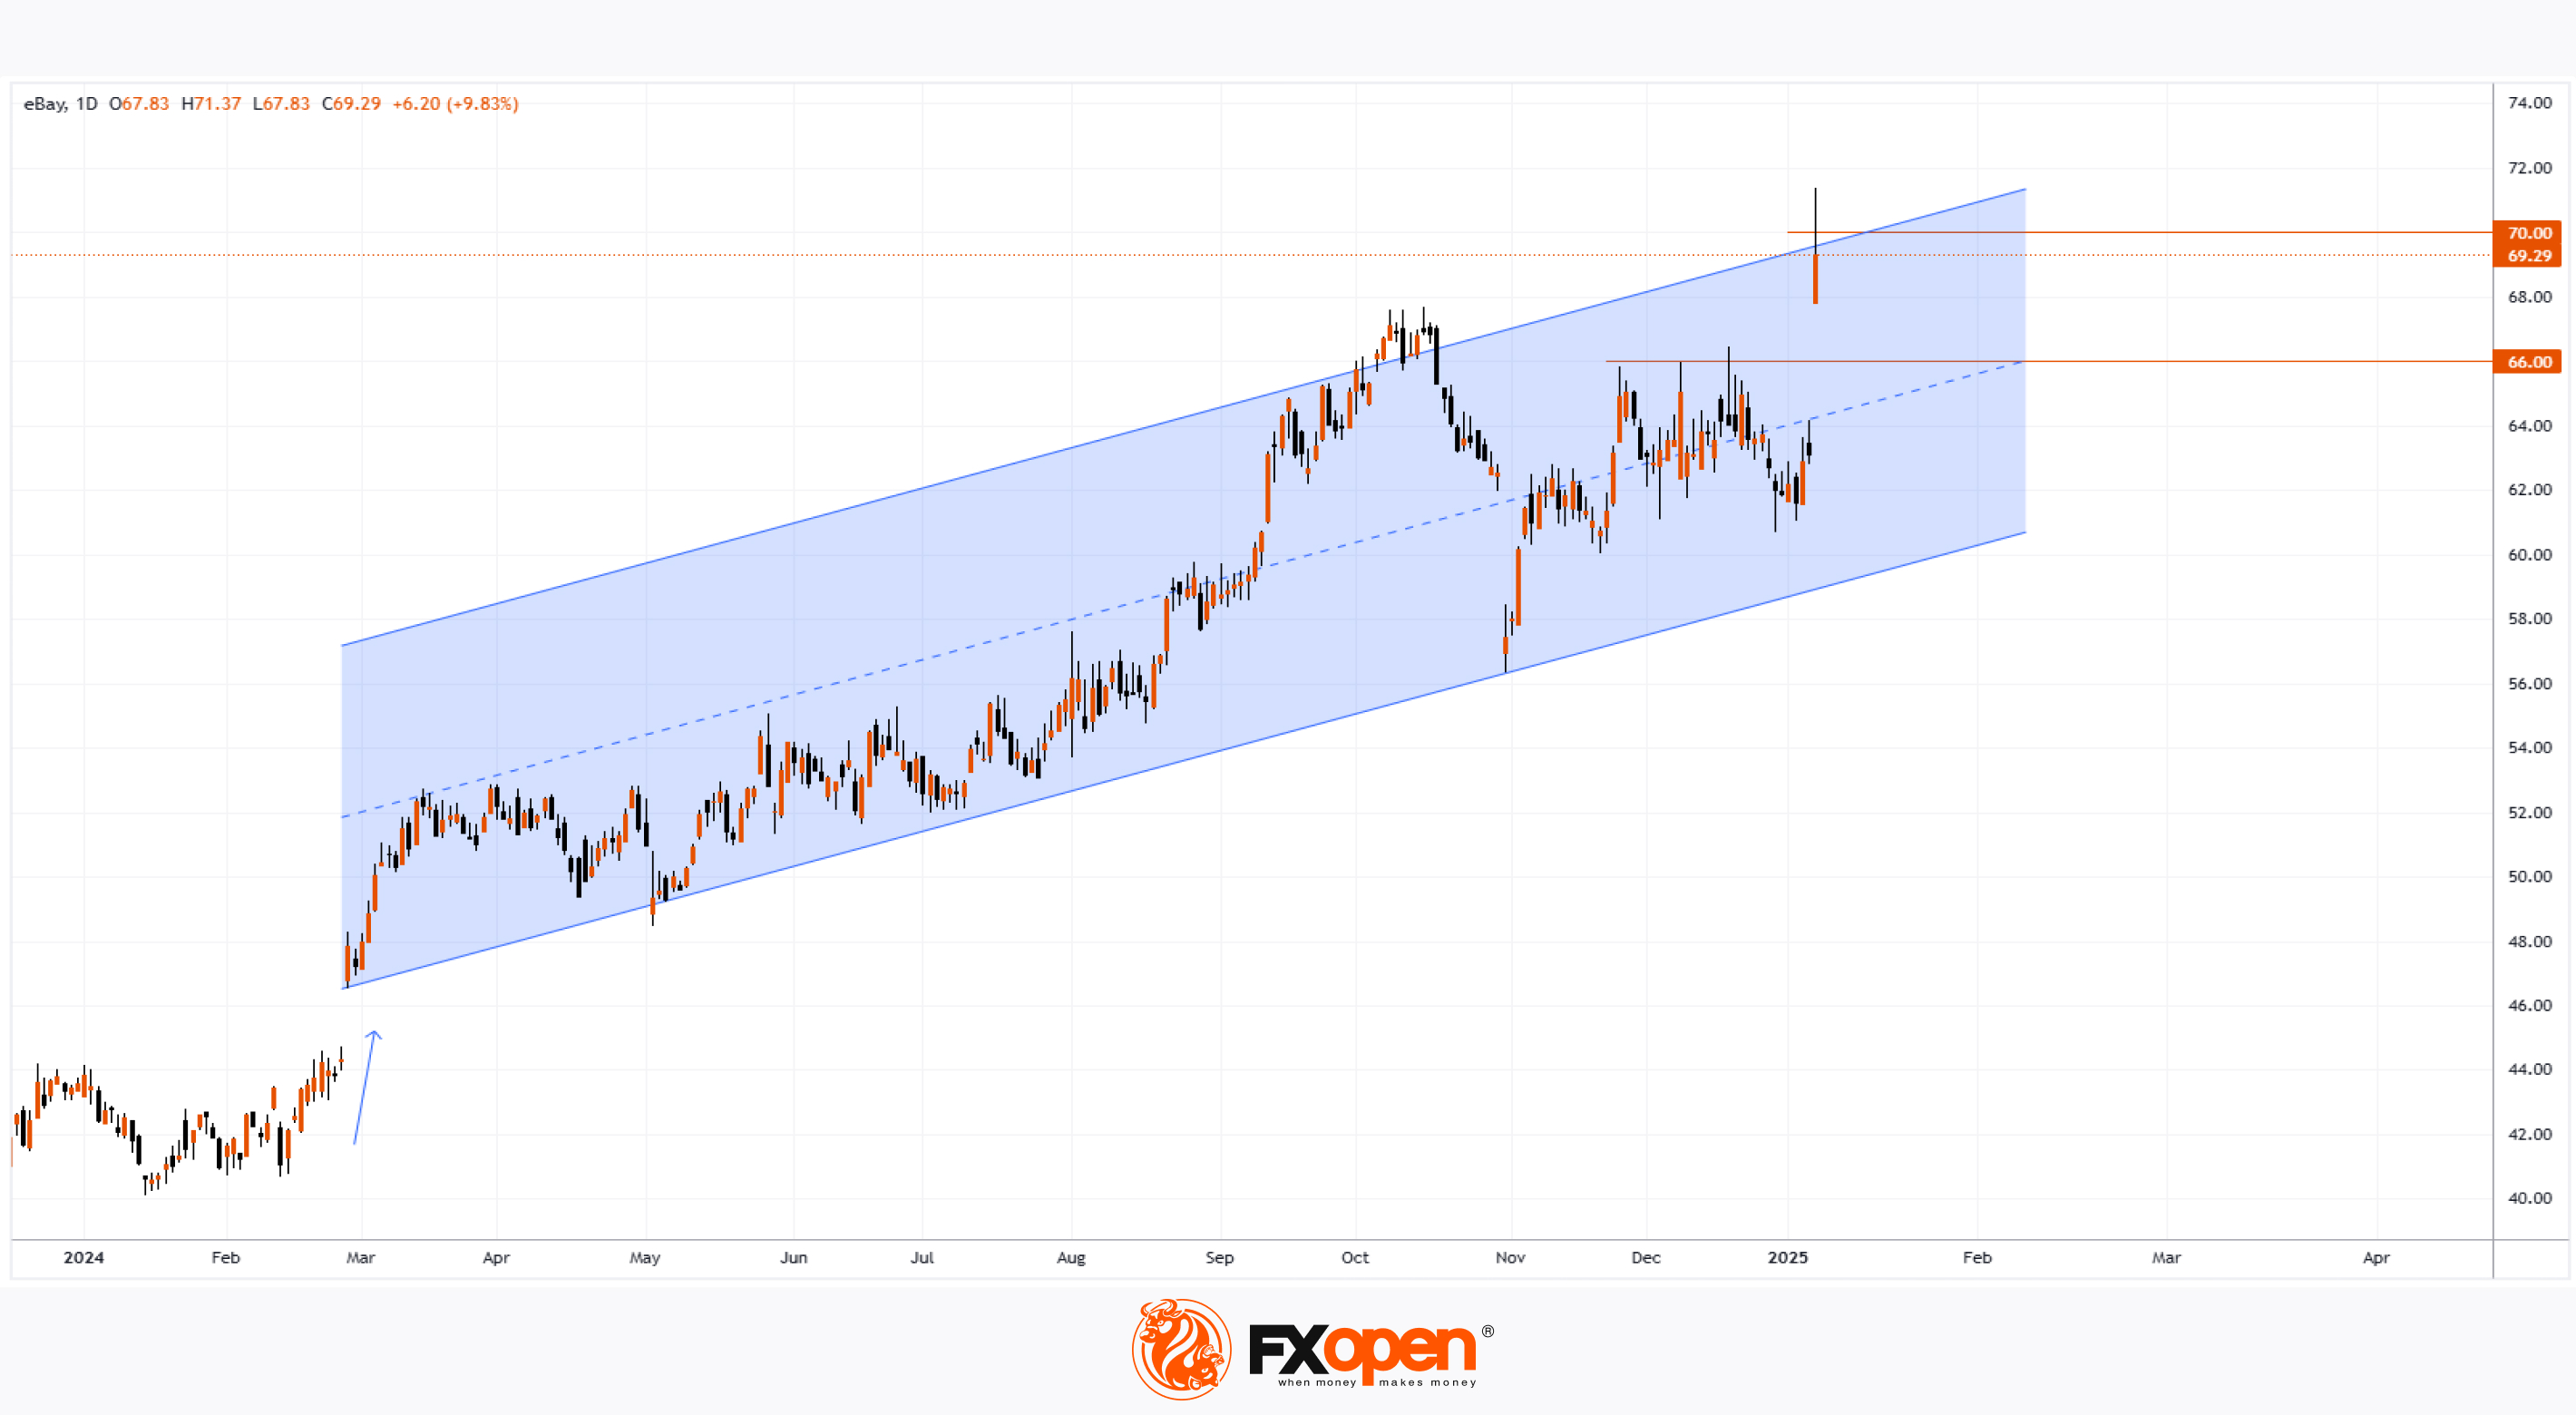
Technical analysis of eBay’s (EBAY) share price chart shows that:
→ in early February 2024, following the release of a strong Q4 2023 report (marked by an arrow), the price began forming a stable upward channel (highlighted in blue);
→ on October 31, the price tested the lower boundary of the channel and rebounded sharply, indicating strong demand;
→ the $66 level acted as key resistance at the end of 2024, consolidating the share price around the median line;
→ following yesterday’s significant news, the price jumped to the upper boundary of the channel, briefly surpassing the psychological $70 mark.
It is possible that eBay's share price could face downward pressure near the upper boundary of the channel and the $70 level, as indicated by the long upper shadow on yesterday's candlestick. However, given the sustained upward trend and strong fundamentals, the outlook for 2025 remains optimistic.
According to TipRanks:
→ 10 out of 24 analysts recommend buying eBay shares;
→ the average 12-month price target for eBay shares is $64.36.
Trade global index CFDs with zero commission and tight spreads. Open your FXOpen account now or learn more about trading index CFDs with FXOpen.
CFDs are complex instruments and come with a high risk of losing your money.
This article represents the opinion of the Companies operating under the FXOpen brand only. It is not to be construed as an offer, solicitation, or recommendation with respect to products and services provided by the Companies operating under the FXOpen brand, nor is it to be considered financial advice.
EBAY Share Price Jumps Over 9% in a Day
Yesterday, traders focused on:
→ labour market news, which showed a slight decrease in new unemployment claims;
→ comments from the Federal Reserve: Christopher Waller stated that inflation is expected to fall to the target rate of 2% in the medium term, and further monetary easing would be "appropriate".
However, these factors did not lead to significant changes in stock indices. The S&P 500 index (US SPX 500 mini on FXOpen) fell by 0.12% yesterday.
The major highlight was the surge in eBay Inc. (EBAY) shares, which rose by more than 9%. This was driven by Meta Platforms (META) announcing a test launch of a new feature that would allow users in the US, France, and Germany to browse eBay products on Facebook Marketplace and complete transactions on eBay.
If the test proves successful, this feature could potentially drive a significant increase in eBay’s revenue due to a new influx of buyers.
Technical analysis of eBay’s (EBAY) share price chart shows that:
→ in early February 2024, following the release of a strong Q4 2023 report (marked by an arrow), the price began forming a stable upward channel (highlighted in blue);
→ on October 31, the price tested the lower boundary of the channel and rebounded sharply, indicating strong demand;
→ the $66 level acted as key resistance at the end of 2024, consolidating the share price around the median line;
→ following yesterday’s significant news, the price jumped to the upper boundary of the channel, briefly surpassing the psychological $70 mark.
It is possible that eBay's share price could face downward pressure near the upper boundary of the channel and the $70 level, as indicated by the long upper shadow on yesterday's candlestick. However, given the sustained upward trend and strong fundamentals, the outlook for 2025 remains optimistic.
According to TipRanks:
→ 10 out of 24 analysts recommend buying eBay shares;
→ the average 12-month price target for eBay shares is $64.36.
Trade global index CFDs with zero commission and tight spreads. Open your FXOpen account now or learn more about trading index CFDs with FXOpen.
CFDs are complex instruments and come with a high risk of losing your money.
This article represents the opinion of the Companies operating under the FXOpen brand only. It is not to be construed as an offer, solicitation, or recommendation with respect to products and services provided by the Companies operating under the FXOpen brand, nor is it to be considered financial advice.
👍2
#forex #marketanalysis #MarketUpdates
USD/CNH Near Key Resistance: 2025 Outlook
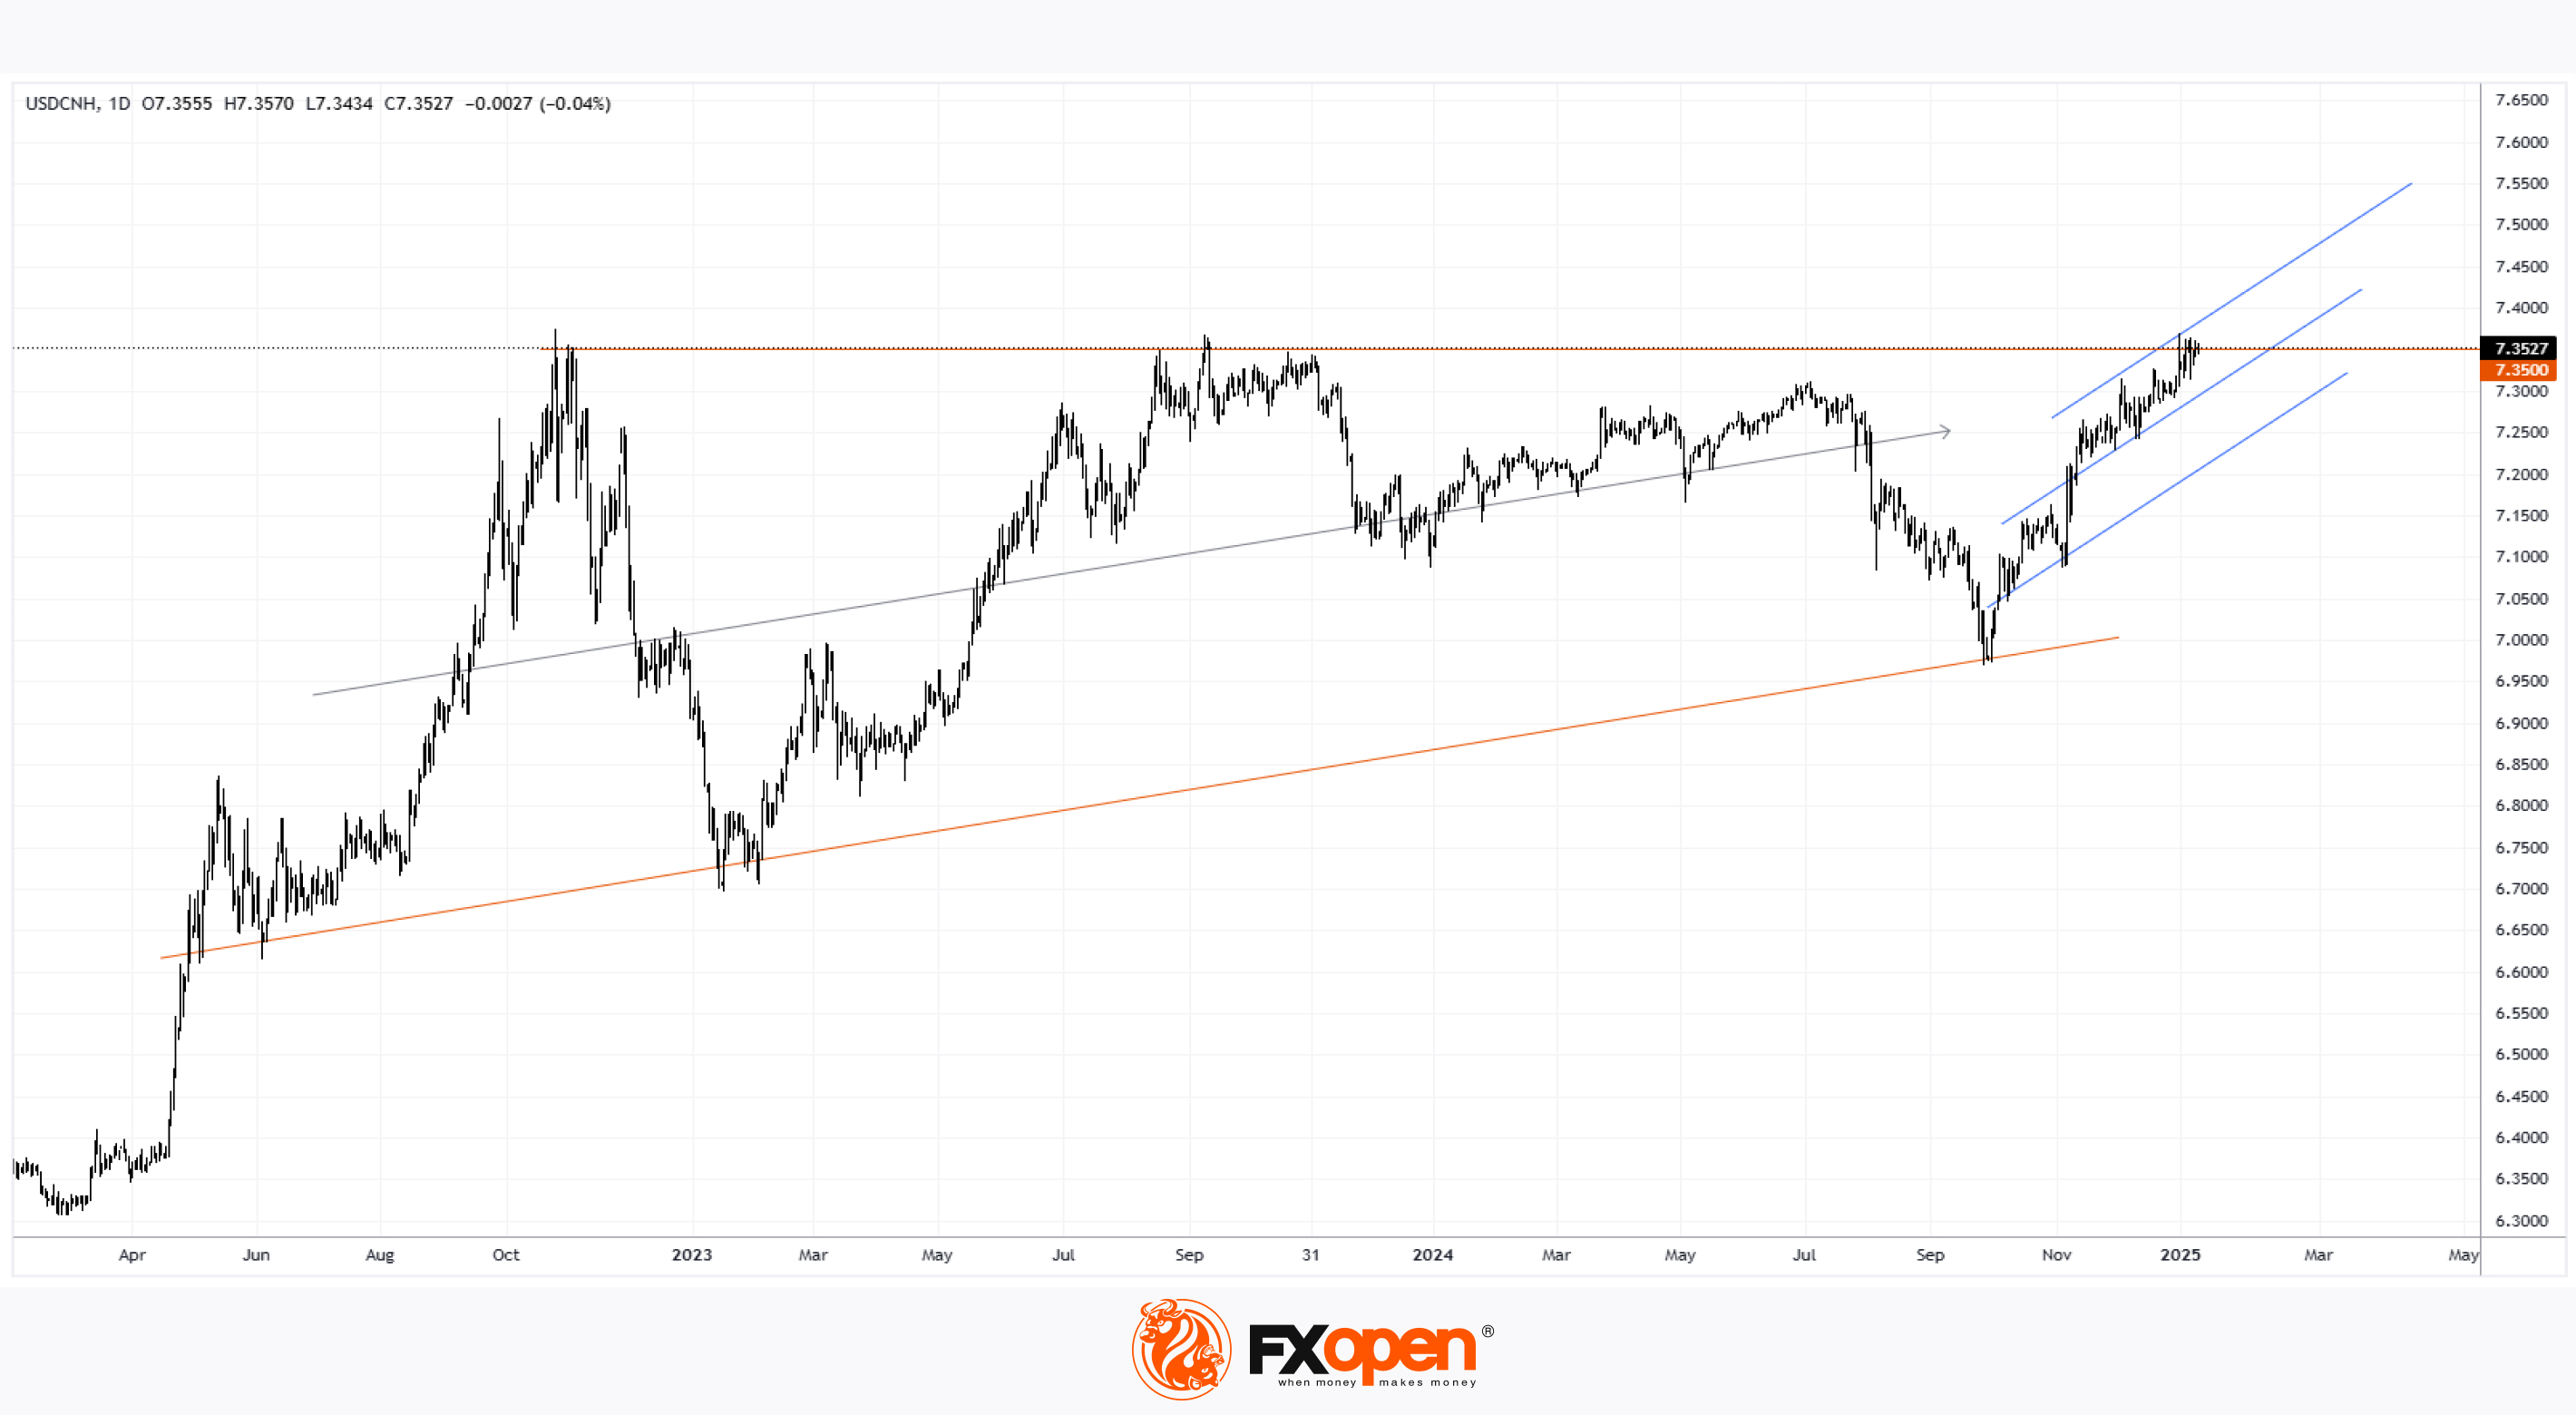
As shown by today’s USD/CNH chart:
→ the pair is trading around 7.35 yuan per US dollar;
→ historically, this level has acted as resistance, pushing the exchange rate lower in autumn 2022 and autumn 2023, as bulls briefly broke above but failed to sustain gains.
The current approach to this resistance level is partly driven by expectations of US President-elect Donald Trump’s policies, which in 2025 may include imposing trade tariffs and adopting measures likely to strengthen the USD further.
According to Reuters:
→ China holds approximately $3 trillion in foreign exchange reserves, giving it ample power to defend the yuan;
→ Wang Tao, Chief Economist at UBS for China, expects the USD/CNH rate to remain controlled near 7.4 yuan per dollar during the first half of 2025. However, if high tariffs are introduced by Trump’s administration, the yuan could weaken to 7.6 per dollar by the end of 2025.
Technical analysis of the USD/CNH chart reveals:
→ price fluctuations are forming a large contracting triangle, with higher lows in 2023 and 2024 indicating stronger demand;
→ an upward trend structure, highlighted in blue, emerged in late 2024;
→ a grey arrow points to the trend direction calculated using linear regression.
Thus, in early 2025, another attempt at a bullish breakout above 7.35 may occur, though resistance from bears could cause short-term pullbacks towards the lower blue trend line. Given Wang’s bullish outlook and supporting technical signals, it is reasonable to expect bulls to gain control of the 7.35 level during 2025.
Trade over 50 forex markets 24 hours a day with FXOpen. Take advantage of low commissions, deep liquidity, and spreads from 0.0 pips. Open your FXOpen account now or learn more about trading forex with FXOpen.
CFDs are complex instruments and come with a high risk of losing your money.
This article represents the opinion of the Companies operating under the FXOpen brand only. It is not to be construed as an offer, solicitation, or recommendation with respect to products and services provided by the Companies operating under the FXOpen brand, nor is it to be considered financial advice.
USD/CNH Near Key Resistance: 2025 Outlook
As shown by today’s USD/CNH chart:
→ the pair is trading around 7.35 yuan per US dollar;
→ historically, this level has acted as resistance, pushing the exchange rate lower in autumn 2022 and autumn 2023, as bulls briefly broke above but failed to sustain gains.
The current approach to this resistance level is partly driven by expectations of US President-elect Donald Trump’s policies, which in 2025 may include imposing trade tariffs and adopting measures likely to strengthen the USD further.
According to Reuters:
→ China holds approximately $3 trillion in foreign exchange reserves, giving it ample power to defend the yuan;
→ Wang Tao, Chief Economist at UBS for China, expects the USD/CNH rate to remain controlled near 7.4 yuan per dollar during the first half of 2025. However, if high tariffs are introduced by Trump’s administration, the yuan could weaken to 7.6 per dollar by the end of 2025.
Technical analysis of the USD/CNH chart reveals:
→ price fluctuations are forming a large contracting triangle, with higher lows in 2023 and 2024 indicating stronger demand;
→ an upward trend structure, highlighted in blue, emerged in late 2024;
→ a grey arrow points to the trend direction calculated using linear regression.
Thus, in early 2025, another attempt at a bullish breakout above 7.35 may occur, though resistance from bears could cause short-term pullbacks towards the lower blue trend line. Given Wang’s bullish outlook and supporting technical signals, it is reasonable to expect bulls to gain control of the 7.35 level during 2025.
Trade over 50 forex markets 24 hours a day with FXOpen. Take advantage of low commissions, deep liquidity, and spreads from 0.0 pips. Open your FXOpen account now or learn more about trading forex with FXOpen.
CFDs are complex instruments and come with a high risk of losing your money.
This article represents the opinion of the Companies operating under the FXOpen brand only. It is not to be construed as an offer, solicitation, or recommendation with respect to products and services provided by the Companies operating under the FXOpen brand, nor is it to be considered financial advice.
👍2
#AUDUSD #forextrading #forex #MarketUpdates
AUD/USD Analysis: Exchange Rate Holds at a 56-Month Low
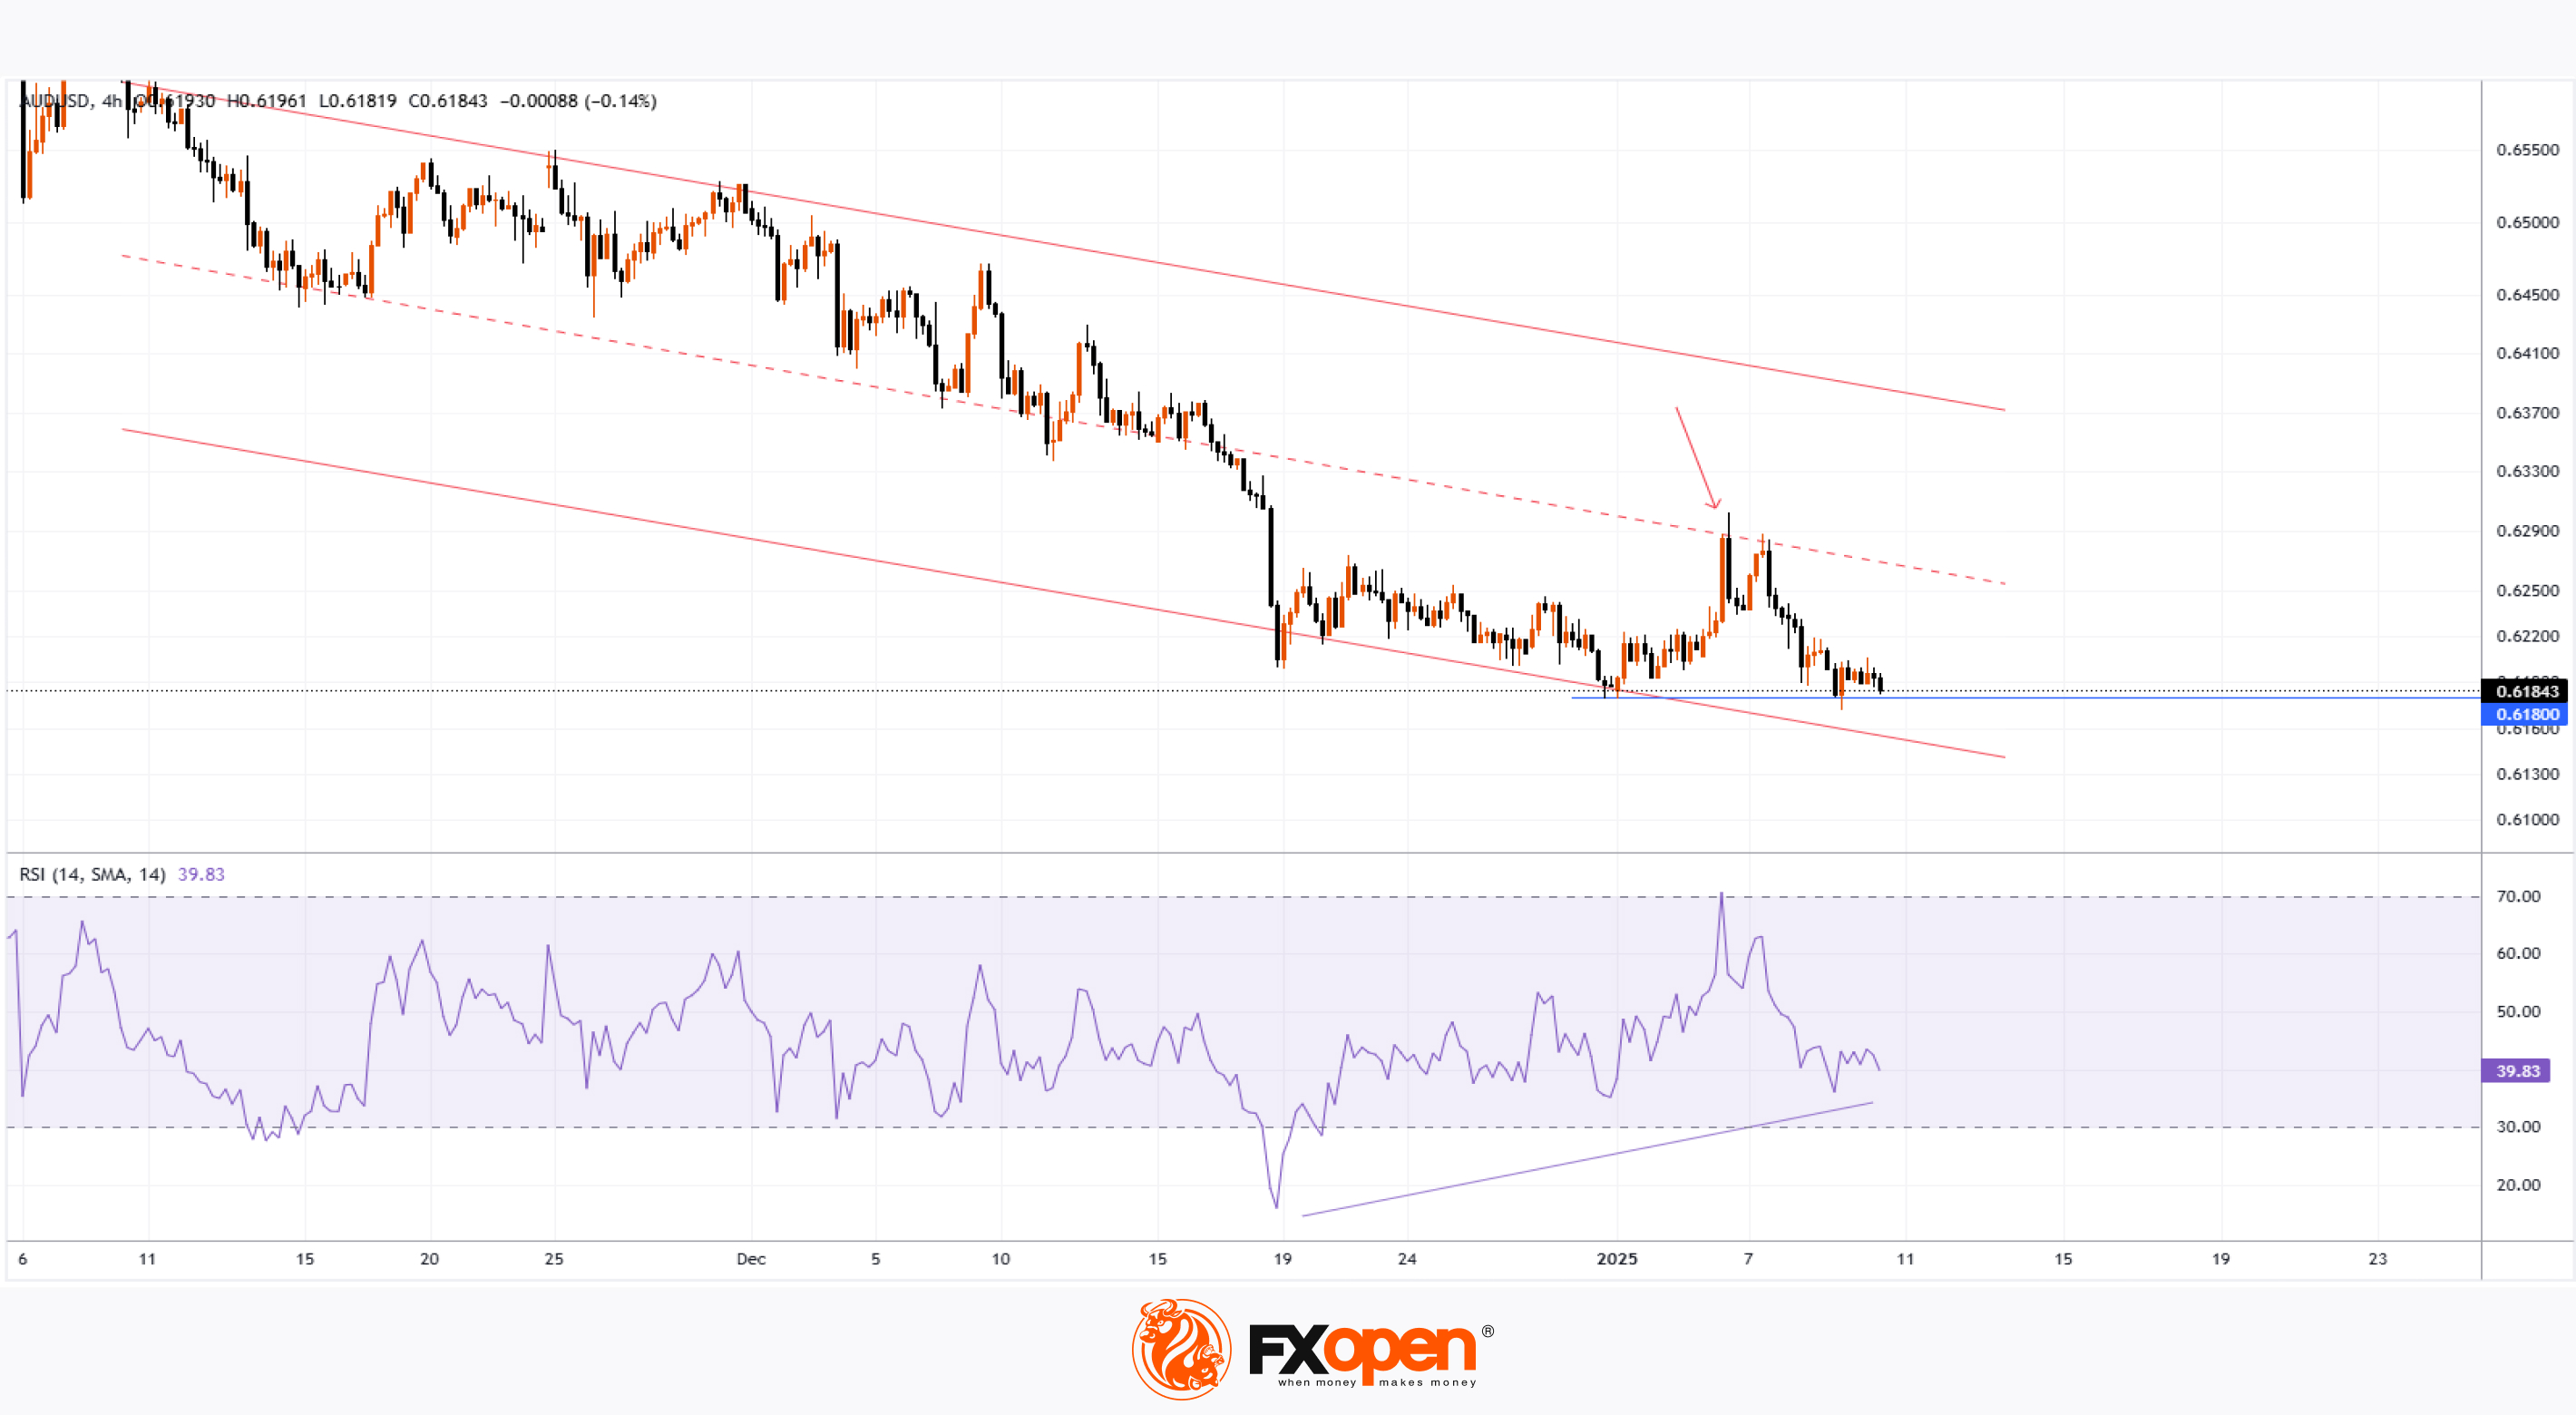
As seen on the AUD/USD chart, yesterday the exchange rate fell below the level of 0.618 Australian dollars per 1 US dollar. The last time the Australian dollar was this weak was in April 2020, during the global spread of the coronavirus.
The decline followed the release of inflation data from Australia earlier this week. According to Bloomberg:
→ Overall annual inflation accelerated to 2.3%, up from 2.1% previously.
→ The trimmed mean core inflation (which smooths volatile items and is closely monitored by the Reserve Bank) slowed to 3.2%, down from 3.5%.
→ Traders are pricing in a 70% chance of a 25 basis point rate cut in February from the current 4.35% (a 13-year high).
Technical analysis of the AUD/USD chart shows that, despite the exchange rate being within the current downtrend (shown in red on the chart), there are grounds for bulls to remain hopeful, as:
→ The RSI indicator points to a divergence, which can be interpreted as weakening selling pressure.
→ Although the median line of the channel has acted as resistance (marked by a red arrow), the sharp rise in the first days of 2025 suggests that demand forces are gaining momentum.
Thus, it’s possible that if the AUD/USD exchange rate falls back to the lower boundary of the red channel, this could attract buyers of the weakened Australian dollar.
Trade over 50 forex markets 24 hours a day with FXOpen. Take advantage of low commissions, deep liquidity, and spreads from 0.0 pips. Open your FXOpen account now or learn more about trading forex with FXOpen.
CFDs are complex instruments and come with a high risk of losing your money.
This article represents the opinion of the Companies operating under the FXOpen brand only. It is not to be construed as an offer, solicitation, or recommendation with respect to products and services provided by the Companies operating under the FXOpen brand, nor is it to be considered financial advice.
AUD/USD Analysis: Exchange Rate Holds at a 56-Month Low
As seen on the AUD/USD chart, yesterday the exchange rate fell below the level of 0.618 Australian dollars per 1 US dollar. The last time the Australian dollar was this weak was in April 2020, during the global spread of the coronavirus.
The decline followed the release of inflation data from Australia earlier this week. According to Bloomberg:
→ Overall annual inflation accelerated to 2.3%, up from 2.1% previously.
→ The trimmed mean core inflation (which smooths volatile items and is closely monitored by the Reserve Bank) slowed to 3.2%, down from 3.5%.
→ Traders are pricing in a 70% chance of a 25 basis point rate cut in February from the current 4.35% (a 13-year high).
Technical analysis of the AUD/USD chart shows that, despite the exchange rate being within the current downtrend (shown in red on the chart), there are grounds for bulls to remain hopeful, as:
→ The RSI indicator points to a divergence, which can be interpreted as weakening selling pressure.
→ Although the median line of the channel has acted as resistance (marked by a red arrow), the sharp rise in the first days of 2025 suggests that demand forces are gaining momentum.
Thus, it’s possible that if the AUD/USD exchange rate falls back to the lower boundary of the red channel, this could attract buyers of the weakened Australian dollar.
Trade over 50 forex markets 24 hours a day with FXOpen. Take advantage of low commissions, deep liquidity, and spreads from 0.0 pips. Open your FXOpen account now or learn more about trading forex with FXOpen.
CFDs are complex instruments and come with a high risk of losing your money.
This article represents the opinion of the Companies operating under the FXOpen brand only. It is not to be construed as an offer, solicitation, or recommendation with respect to products and services provided by the Companies operating under the FXOpen brand, nor is it to be considered financial advice.
👍2
#AUDUSD #NZDUSD #forextrading #marketanalysis #tradingtips
Market Analysis: AUD/USD and NZD/USD Under Fire, Deeper Losses Ahead?
🔸 The Aussie Dollar started a fresh decline from well above the 0.6300 level against the US Dollar.
🔸 There is a connecting bearish trend line forming with resistance at 0.6175 on the hourly chart of AUD/USD at FXOpen.
🔸 NZD/USD declined steadily from the 0.5690 resistance zone.
🔸 There is a short-term bearish trend line forming with resistance at 0.5580 on the hourly chart of NZD/USD at FXOpen.
🔗 Read the full article: https://cutt.ly/ee26fLUj
Trade over 50 forex markets 24 hours a day with FXOpen. Take advantage of low commissions, deep liquidity, and spreads from 0.0 pips. Open your FXOpen account now or learn more about trading forex with FXOpen.
CFDs are complex instruments and come with a high risk of losing your money.
This article represents the opinion of the Companies operating under the FXOpen brand only. It is not to be construed as an offer, solicitation, or recommendation with respect to products and services provided by the Companies operating under the FXOpen brand, nor is it to be considered financial advice.
Market Analysis: AUD/USD and NZD/USD Under Fire, Deeper Losses Ahead?
🔸 The Aussie Dollar started a fresh decline from well above the 0.6300 level against the US Dollar.
🔸 There is a connecting bearish trend line forming with resistance at 0.6175 on the hourly chart of AUD/USD at FXOpen.
🔸 NZD/USD declined steadily from the 0.5690 resistance zone.
🔸 There is a short-term bearish trend line forming with resistance at 0.5580 on the hourly chart of NZD/USD at FXOpen.
🔗 Read the full article: https://cutt.ly/ee26fLUj
Trade over 50 forex markets 24 hours a day with FXOpen. Take advantage of low commissions, deep liquidity, and spreads from 0.0 pips. Open your FXOpen account now or learn more about trading forex with FXOpen.
CFDs are complex instruments and come with a high risk of losing your money.
This article represents the opinion of the Companies operating under the FXOpen brand only. It is not to be construed as an offer, solicitation, or recommendation with respect to products and services provided by the Companies operating under the FXOpen brand, nor is it to be considered financial advice.
Market Pulse
Market Analysis: AUD/USD and NZD/USD Under Fire, Deeper Losses Ahead?
AUD/USD declined below the 0.6350 and 0.6250 support levels. NZD/USD is also moving lower and might extend losses below 0.5540.
👍2
#stockmarket #stocktrading #MarketUpdates #marketanalysis
S&P 500 Index Drops to 2-Month Low
On Friday, the US unemployment data was released, as reported by ForexFactory:
→ The unemployment rate dropped from 4.2% to 4.1%;
→ The number of new jobs (Non-Farm Employment Change) increased by 256,000 over the month, although analysts had forecast an increase of 164,000 (previous value = 212,000).
According to Reuters, the strong labour market data strengthened the market participants' view that the Federal Reserve will be cautious in cutting interest rates in 2025.
Based on CME Group’s FedWatch tool, traders expect the Fed to reduce borrowing costs for the first time in June and then keep it at that level for the remainder of the year.
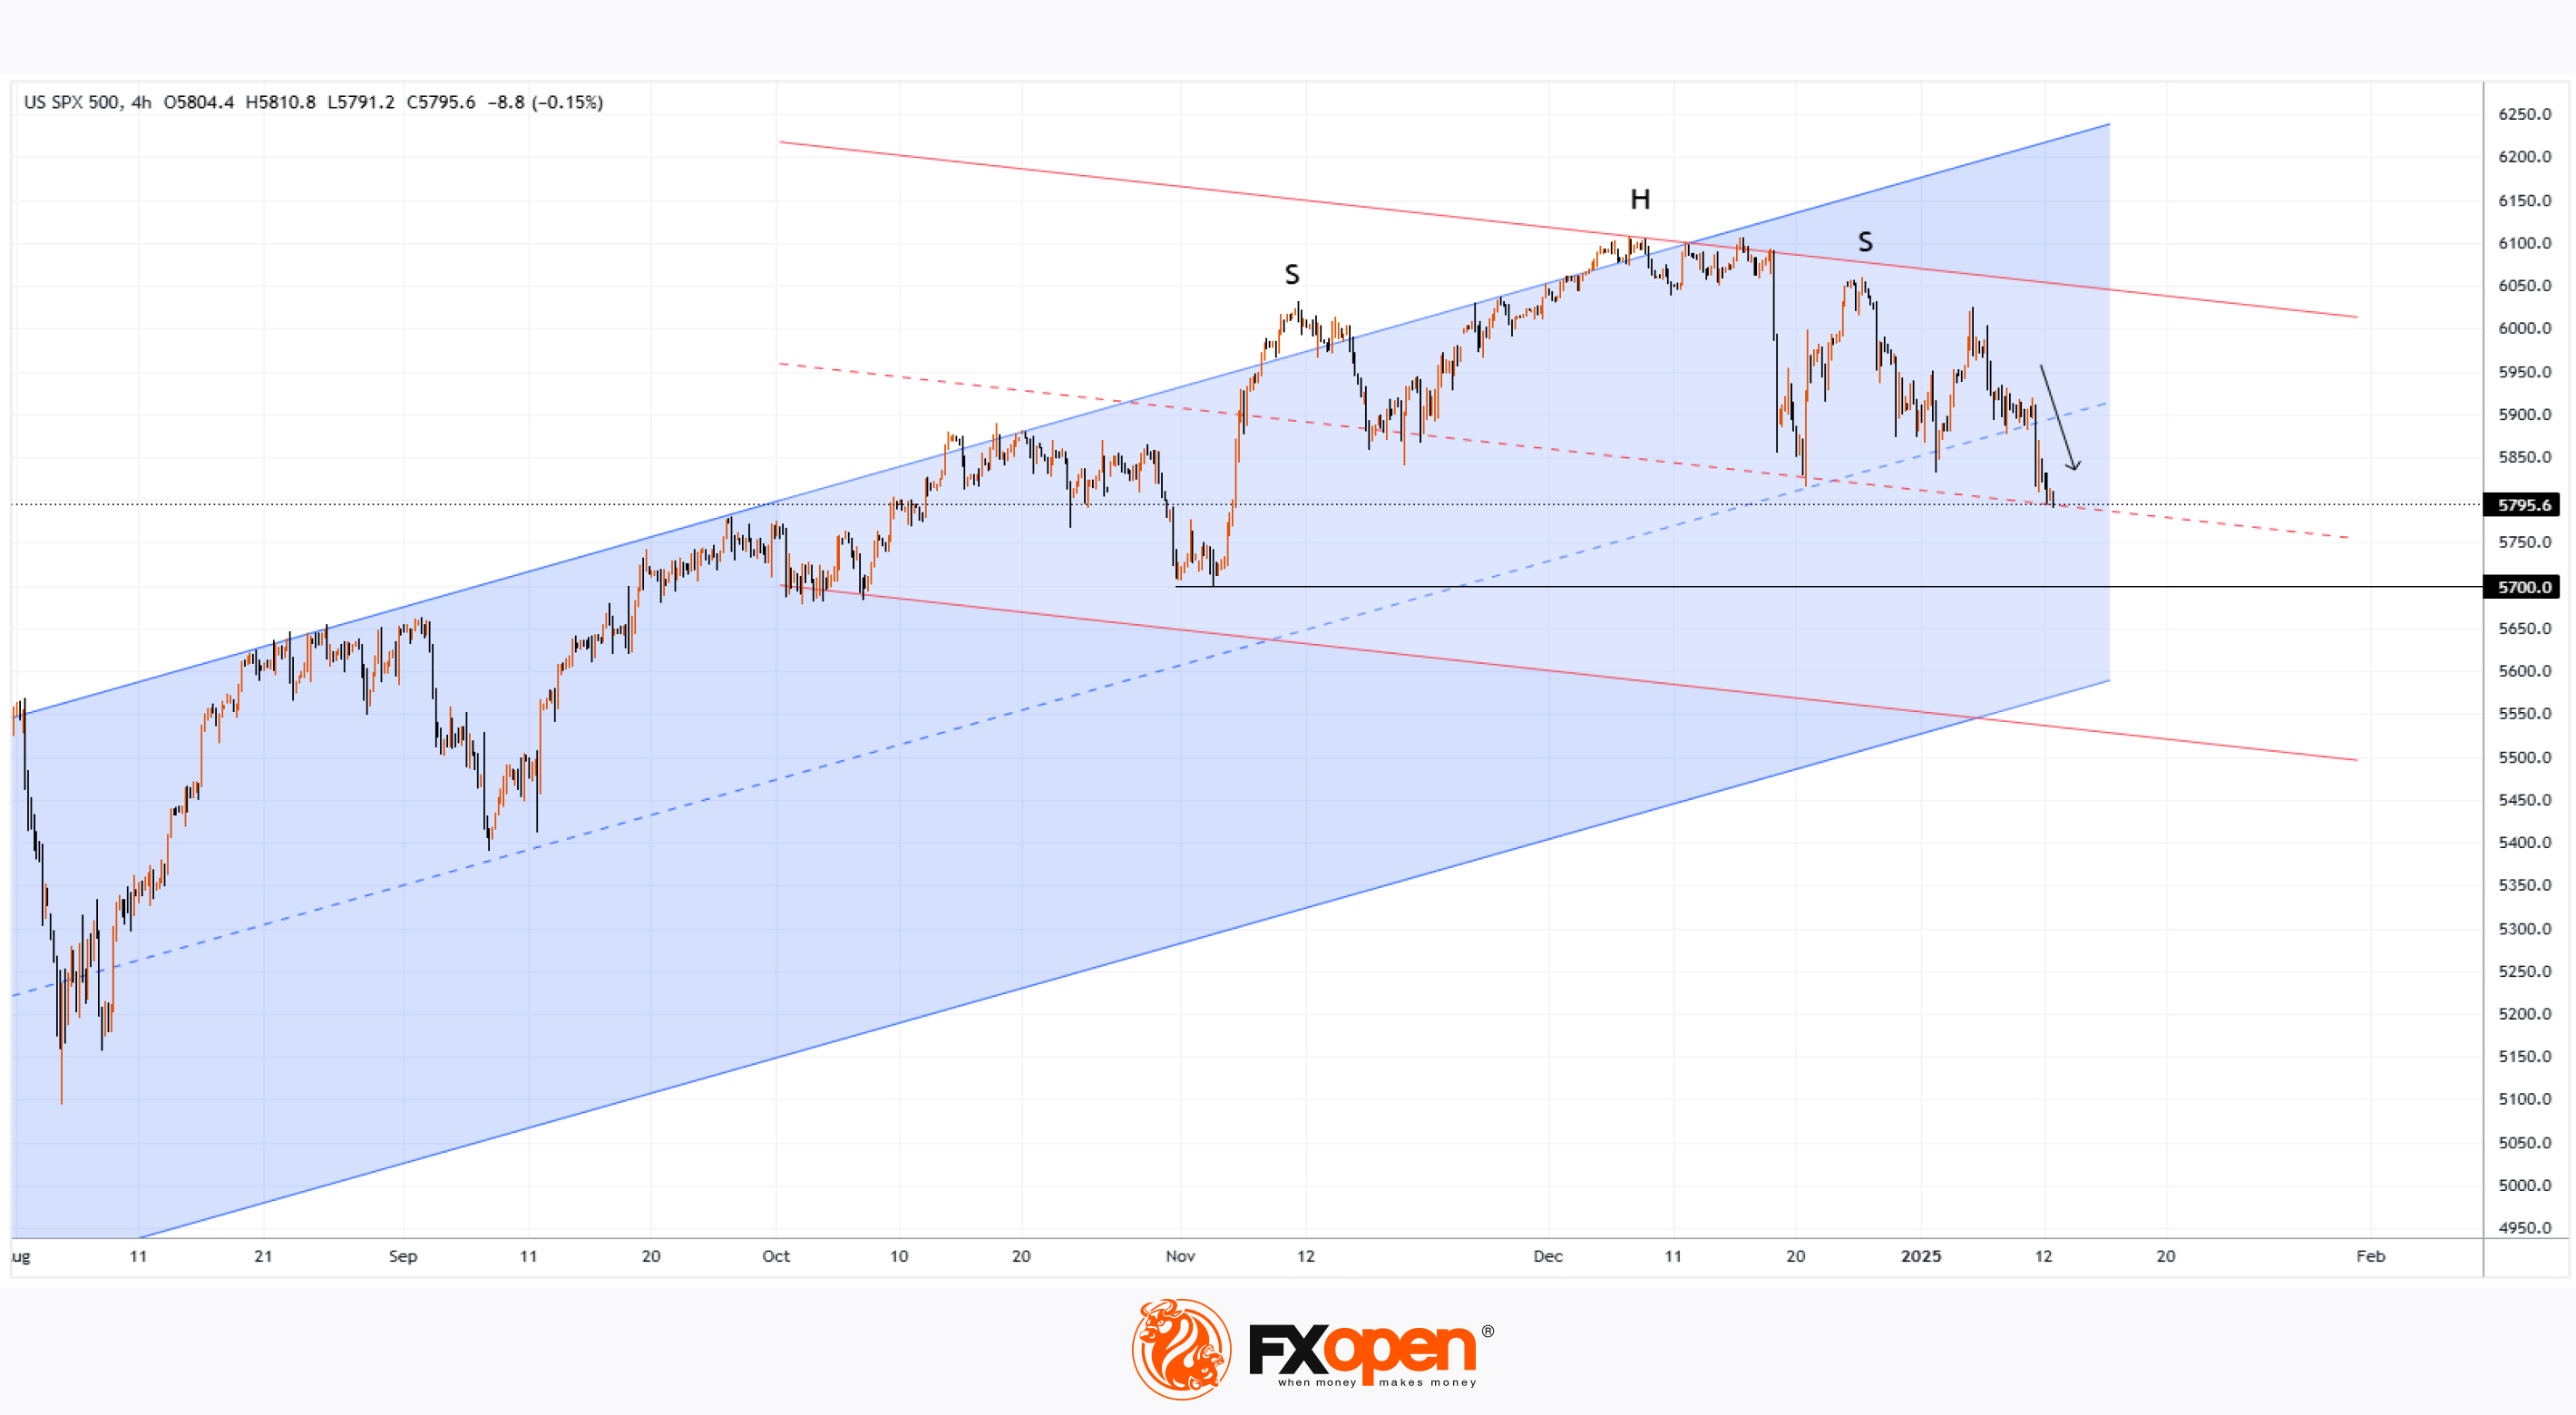
Expectations that tight monetary policy will persist longer than usual have led to bearish sentiment. As a result, the S&P 500 index (US SPX 500 mini on FXOpen) dropped below the 5,800 mark this morning, its lowest point since early November.
Technical analysis of the S&P 500 index (US SPX 500 mini on FXOpen) shows:
→ A bearish Head and Shoulders (SHS) pattern is visible on the chart;
→ The price has broken below the median of the ascending channel (marked in blue).
The strengthening bearish sentiment may lead to:
→ The price fluctuating within the descending channel, the boundaries of which are already visible (marked in red);
→ The median of this red channel currently acting as support.
It is possible that the intensification of bearish sentiment will result in the S&P 500 index (US SPX 500 mini on FXOpen) declining towards the 5,700 level, which may be reinforced by the proximity of the lower boundary of the ascending channel.
Trade over 50 forex markets 24 hours a day with FXOpen. Take advantage of low commissions, deep liquidity, and spreads from 0.0 pips. Open your FXOpen account now or learn more about trading forex with FXOpen.
CFDs are complex instruments and come with a high risk of losing your money.
This article represents the opinion of the Companies operating under the FXOpen brand only. It is not to be construed as an offer, solicitation, or recommendation with respect to products and services provided by the Companies operating under the FXOpen brand, nor is it to be considered financial advice.
S&P 500 Index Drops to 2-Month Low
On Friday, the US unemployment data was released, as reported by ForexFactory:
→ The unemployment rate dropped from 4.2% to 4.1%;
→ The number of new jobs (Non-Farm Employment Change) increased by 256,000 over the month, although analysts had forecast an increase of 164,000 (previous value = 212,000).
According to Reuters, the strong labour market data strengthened the market participants' view that the Federal Reserve will be cautious in cutting interest rates in 2025.
Based on CME Group’s FedWatch tool, traders expect the Fed to reduce borrowing costs for the first time in June and then keep it at that level for the remainder of the year.
Expectations that tight monetary policy will persist longer than usual have led to bearish sentiment. As a result, the S&P 500 index (US SPX 500 mini on FXOpen) dropped below the 5,800 mark this morning, its lowest point since early November.
Technical analysis of the S&P 500 index (US SPX 500 mini on FXOpen) shows:
→ A bearish Head and Shoulders (SHS) pattern is visible on the chart;
→ The price has broken below the median of the ascending channel (marked in blue).
The strengthening bearish sentiment may lead to:
→ The price fluctuating within the descending channel, the boundaries of which are already visible (marked in red);
→ The median of this red channel currently acting as support.
It is possible that the intensification of bearish sentiment will result in the S&P 500 index (US SPX 500 mini on FXOpen) declining towards the 5,700 level, which may be reinforced by the proximity of the lower boundary of the ascending channel.
Trade over 50 forex markets 24 hours a day with FXOpen. Take advantage of low commissions, deep liquidity, and spreads from 0.0 pips. Open your FXOpen account now or learn more about trading forex with FXOpen.
CFDs are complex instruments and come with a high risk of losing your money.
This article represents the opinion of the Companies operating under the FXOpen brand only. It is not to be construed as an offer, solicitation, or recommendation with respect to products and services provided by the Companies operating under the FXOpen brand, nor is it to be considered financial advice.
👍3
Media is too big
VIEW IN TELEGRAM
#StockMarket #oilprices #forextrading #marketanalysis
Daily Market News with FXOpen - 13 January 2025
🔸European Markets Set to Start the New Trading Week in Mixed Territory;
🔸Surging Dollar Pressures Peers as Further Fed Cuts in Question;
🔸Oil Jumps as New US Sanctions to Curb Russian Supply to China, India.
Open your FXOpen account now or learn more about trading forex with FXOpen.
CFDs are complex instruments and come with a high risk of losing your money.
Daily Market News with FXOpen - 13 January 2025
🔸European Markets Set to Start the New Trading Week in Mixed Territory;
🔸Surging Dollar Pressures Peers as Further Fed Cuts in Question;
🔸Oil Jumps as New US Sanctions to Curb Russian Supply to China, India.
Open your FXOpen account now or learn more about trading forex with FXOpen.
CFDs are complex instruments and come with a high risk of losing your money.
#stockmarket #stocktrading #AAPL #MarketUpdates
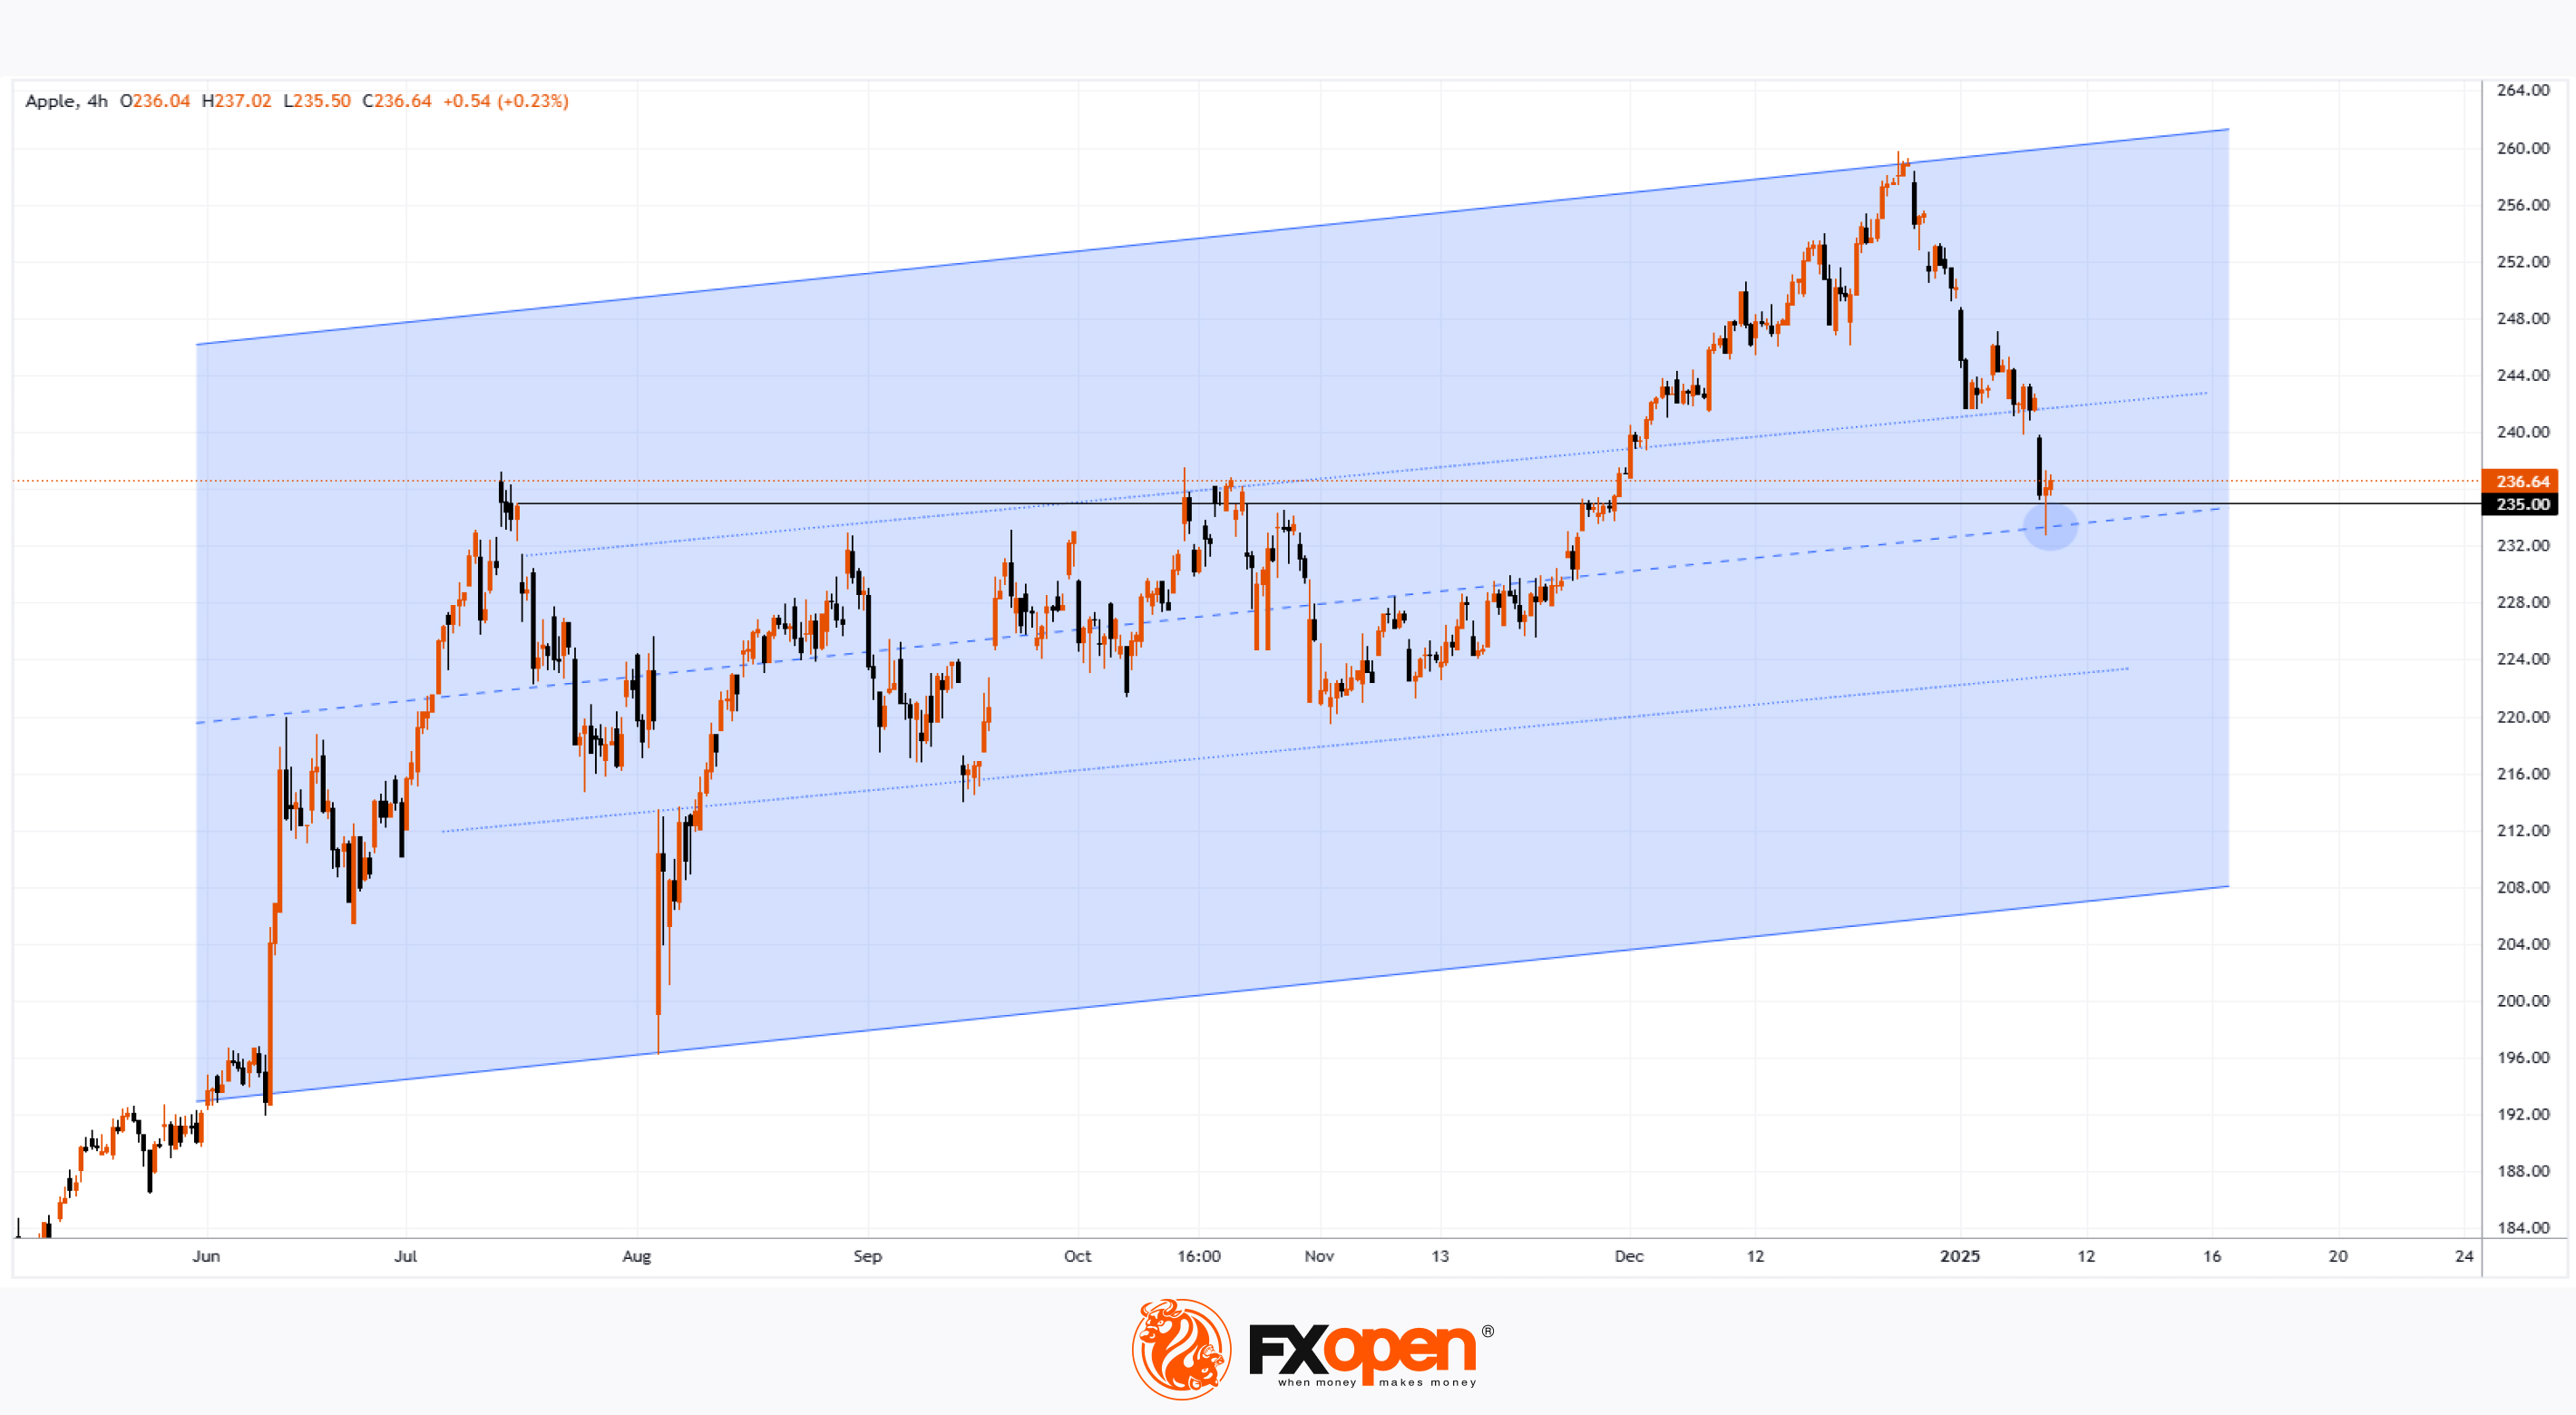
Apple (AAPL) Stock Price Drops Below $240
The last time Apple (AAPL) stock traded below the $240 mark was in late November last year.
Bearish sentiment is being driven by negative news surrounding the company:
→ CNBC reports analysts' views that the excessively thin design of the new iPhone SE 4 models will complicate sales in China. The analysts also note a decline in the appeal of the Apple Intelligence feature.
→ Investment firm Moffett Nathanson downgraded Apple’s stock rating from "Neutral" to "Sell" and lowered its target price for AAPL from $202 to $188. According to analysts, the 30% growth in Apple stock for 2024 is largely unjustified.
→ Criticism from Mark Zuckerberg, who believes that Apple has not invented anything groundbreaking for a long time.
As we mentioned on 27 December, Apple’s stock appeared overbought and vulnerable to a correction.
Technical analysis of the AAPL chart today shows that the price has dropped to:
→ The median of the current channel (marked in blue);
→ The $235 level, which previously acted as resistance.
Therefore, it is plausible that in the short term, this block formed by these two lines may provide support to the falling price. This hypothesis is supported by the long lower wick on Friday’s candle, indicating increased buyer activity.
According to TipRanks:
→ Analysts' 12-month price target for AAPL stock averages $244.77;
→ Of 29 analysts surveyed, 19 recommend buying AAPL stock, while 3 recommend selling.
Trade global index CFDs with zero commission and tight spreads. Open your FXOpen account now or learn more about trading index CFDs with FXOpen.
CFDs are complex instruments and come with a high risk of losing your money.
This article represents the opinion of the Companies operating under the FXOpen brand only. It is not to be construed as an offer, solicitation, or recommendation with respect to products and services provided by the Companies operating under the FXOpen brand, nor is it to be considered financial advice.
Apple (AAPL) Stock Price Drops Below $240
The last time Apple (AAPL) stock traded below the $240 mark was in late November last year.
Bearish sentiment is being driven by negative news surrounding the company:
→ CNBC reports analysts' views that the excessively thin design of the new iPhone SE 4 models will complicate sales in China. The analysts also note a decline in the appeal of the Apple Intelligence feature.
→ Investment firm Moffett Nathanson downgraded Apple’s stock rating from "Neutral" to "Sell" and lowered its target price for AAPL from $202 to $188. According to analysts, the 30% growth in Apple stock for 2024 is largely unjustified.
→ Criticism from Mark Zuckerberg, who believes that Apple has not invented anything groundbreaking for a long time.
As we mentioned on 27 December, Apple’s stock appeared overbought and vulnerable to a correction.
Technical analysis of the AAPL chart today shows that the price has dropped to:
→ The median of the current channel (marked in blue);
→ The $235 level, which previously acted as resistance.
Therefore, it is plausible that in the short term, this block formed by these two lines may provide support to the falling price. This hypothesis is supported by the long lower wick on Friday’s candle, indicating increased buyer activity.
According to TipRanks:
→ Analysts' 12-month price target for AAPL stock averages $244.77;
→ Of 29 analysts surveyed, 19 recommend buying AAPL stock, while 3 recommend selling.
Trade global index CFDs with zero commission and tight spreads. Open your FXOpen account now or learn more about trading index CFDs with FXOpen.
CFDs are complex instruments and come with a high risk of losing your money.
This article represents the opinion of the Companies operating under the FXOpen brand only. It is not to be construed as an offer, solicitation, or recommendation with respect to products and services provided by the Companies operating under the FXOpen brand, nor is it to be considered financial advice.
👍3
#FinanceNews #GlobalMarkets #USInflation #GBP #StockMarketNews #MarketTrends
Market Insights with Gary Thomson: UK & US Inflation, UK GDP Growth, Corporate Earnings Statements
We’re excited to launch our new forward-looking ‘Market Insights’ series! Hosted by FXOpen’s UK COO, Gary Thomson, this series provides a fresh perspective on global markets, highlighting upcoming economic data, geopolitical events, and central bank announcements.
In this episode:
🔸 How could the US inflation rate influence the US dollar?
🔸 What might UK GDP growth and inflation data mean for the struggling British pound?
🔸 Which corporate earnings reports could drive the US stock market this week?
Don’t miss out—gain insights to stay ahead in your trading journey!
https://cutt.ly/ve9yWQJB
To take advantage of price fluctuations in the foreign exchange markets, consider enlisting the services of a reliable broker like FXOpen.
⚠️
This forecast represents FXOpen Companies opinion only, it should not be construed as an offer, invitation or recommendation in respect to FXOpen Companies products and services or as financial advice.
Market Insights with Gary Thomson: UK & US Inflation, UK GDP Growth, Corporate Earnings Statements
We’re excited to launch our new forward-looking ‘Market Insights’ series! Hosted by FXOpen’s UK COO, Gary Thomson, this series provides a fresh perspective on global markets, highlighting upcoming economic data, geopolitical events, and central bank announcements.
In this episode:
🔸 How could the US inflation rate influence the US dollar?
🔸 What might UK GDP growth and inflation data mean for the struggling British pound?
🔸 Which corporate earnings reports could drive the US stock market this week?
Don’t miss out—gain insights to stay ahead in your trading journey!
https://cutt.ly/ve9yWQJB
To take advantage of price fluctuations in the foreign exchange markets, consider enlisting the services of a reliable broker like FXOpen.
⚠️
This forecast represents FXOpen Companies opinion only, it should not be construed as an offer, invitation or recommendation in respect to FXOpen Companies products and services or as financial advice.
YouTube
Market Insights with Gary Thomson: UK & US Inflation, UK GDP Growth, Corporate Earnings Statements
We’re excited to launch our new forward-looking ‘Market Insights’ series! Hosted by FXOpen’s UK COO, Gary Thomson, this series provides a fresh perspective on global markets, highlighting upcoming economic data, geopolitical events, and central bank announcements.…
👍3
#oilprices #MarketUpdates #marketanalysis
Brent Oil Price Retreats from a 3-Month High
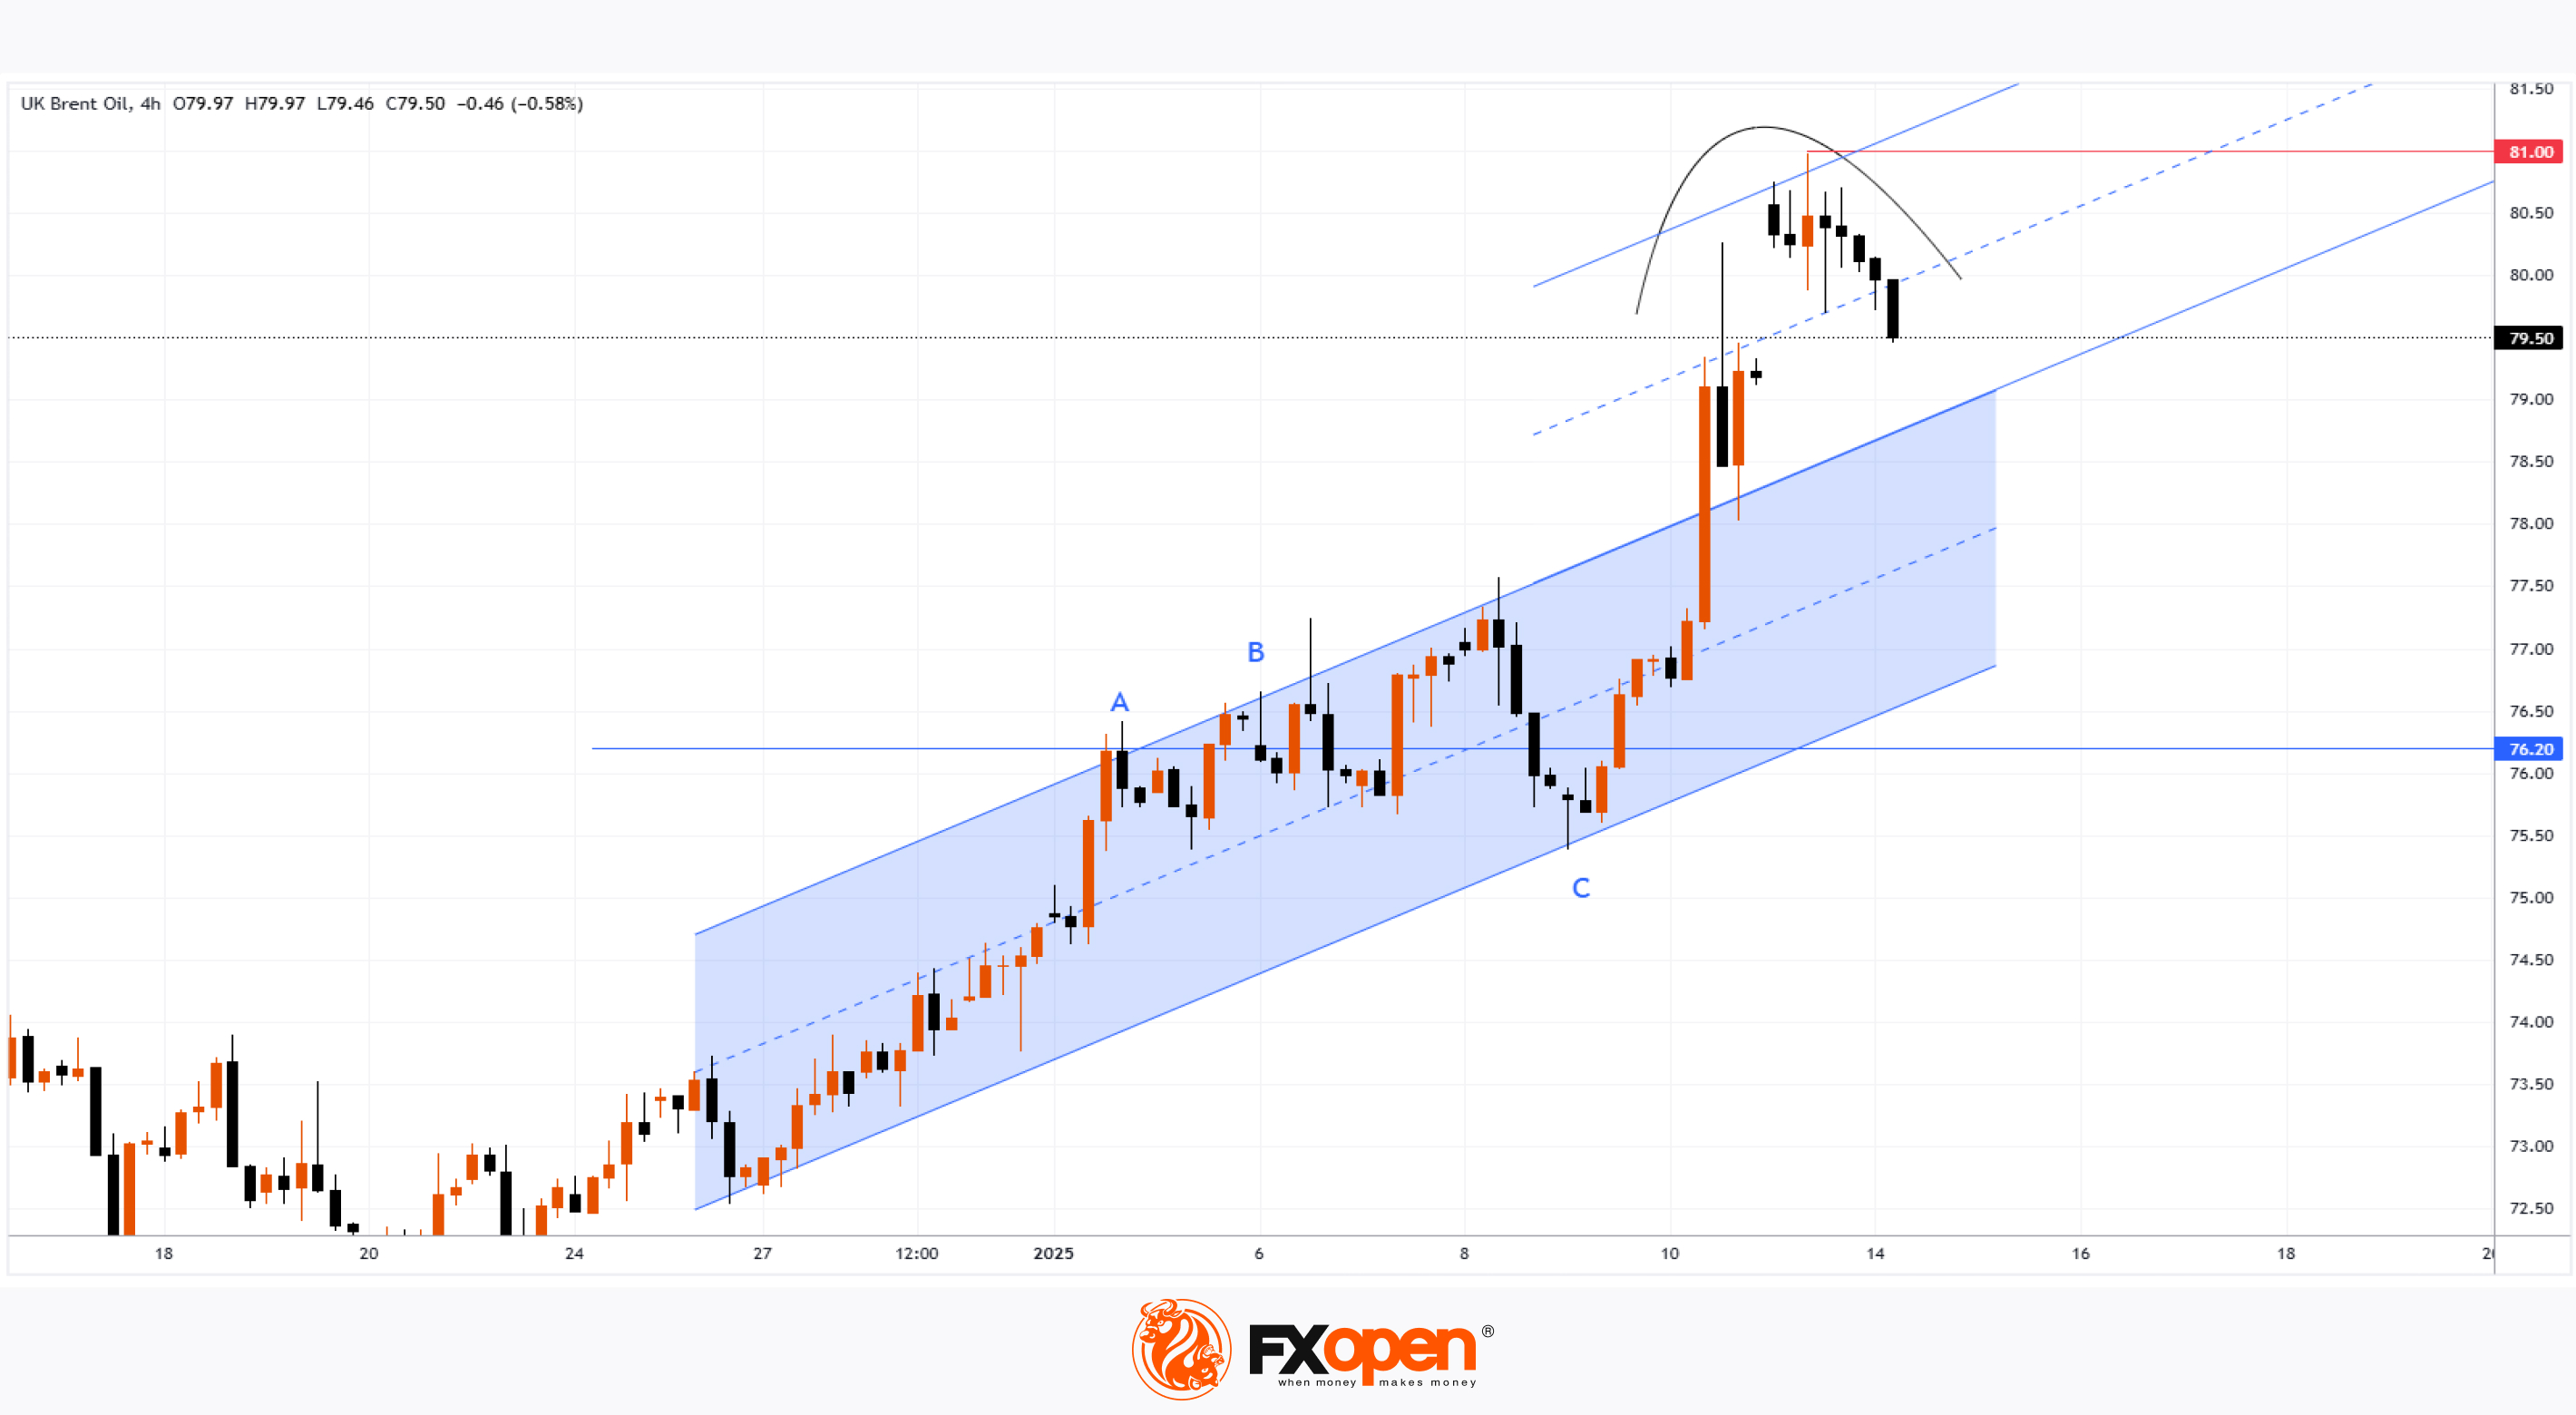
On January 6, while analysing the XBR/USD chart, we:
→ constructed an upward structure using blue trend lines;
→ highlighted the potential for a pullback after the formation of peaks A and B around the $76.20 level.
What happened next?
As shown on the XBR/USD chart, Brent oil prices retreated on January 8 to the lower blue line (point C), where bulls successfully resumed the uptrend, pushing the price close to $81—a level last seen in early October 2024, near a key peak (not shown on the chart).
According to The Wall Street Journal:
→ Demand was supported by sanctions imposed by the outgoing Biden administration on Russia’s oil industry.
→ Jonathan Ng, an OCBC Asean economist, noted that the price range of $78–83 appears to be a “relatively comfortable zone” for Brent oil in the near term.
From a technical analysis perspective, the XBR/USD chart displays price action resembling a rounding top pattern. Therefore, it’s possible that after the bullish momentum triggered by the sanctions, another pullback towards the blue channel could occur in the short term.
Going forward, much will depend on the political and trade policies adopted by the incoming Trump administration.
Start trading commodities with tight spreads. Open your trading account now or learn more about trading commodity CFDs with FXOpen.
CFDs are complex instruments and come with a high risk of losing your money.
This article represents the opinion of the Companies operating under the FXOpen brand only. It is not to be construed as an offer, solicitation, or recommendation with respect to products and services provided by the Companies operating under the FXOpen brand, nor is it to be considered financial advice.
Brent Oil Price Retreats from a 3-Month High
On January 6, while analysing the XBR/USD chart, we:
→ constructed an upward structure using blue trend lines;
→ highlighted the potential for a pullback after the formation of peaks A and B around the $76.20 level.
What happened next?
As shown on the XBR/USD chart, Brent oil prices retreated on January 8 to the lower blue line (point C), where bulls successfully resumed the uptrend, pushing the price close to $81—a level last seen in early October 2024, near a key peak (not shown on the chart).
According to The Wall Street Journal:
→ Demand was supported by sanctions imposed by the outgoing Biden administration on Russia’s oil industry.
→ Jonathan Ng, an OCBC Asean economist, noted that the price range of $78–83 appears to be a “relatively comfortable zone” for Brent oil in the near term.
From a technical analysis perspective, the XBR/USD chart displays price action resembling a rounding top pattern. Therefore, it’s possible that after the bullish momentum triggered by the sanctions, another pullback towards the blue channel could occur in the short term.
Going forward, much will depend on the political and trade policies adopted by the incoming Trump administration.
Start trading commodities with tight spreads. Open your trading account now or learn more about trading commodity CFDs with FXOpen.
CFDs are complex instruments and come with a high risk of losing your money.
This article represents the opinion of the Companies operating under the FXOpen brand only. It is not to be construed as an offer, solicitation, or recommendation with respect to products and services provided by the Companies operating under the FXOpen brand, nor is it to be considered financial advice.
👍2
#stockmarket #stocktrading #tsla #MarketTrends #MarketUpdates
Tesla (TSLA) Stock Price Rises Above $400
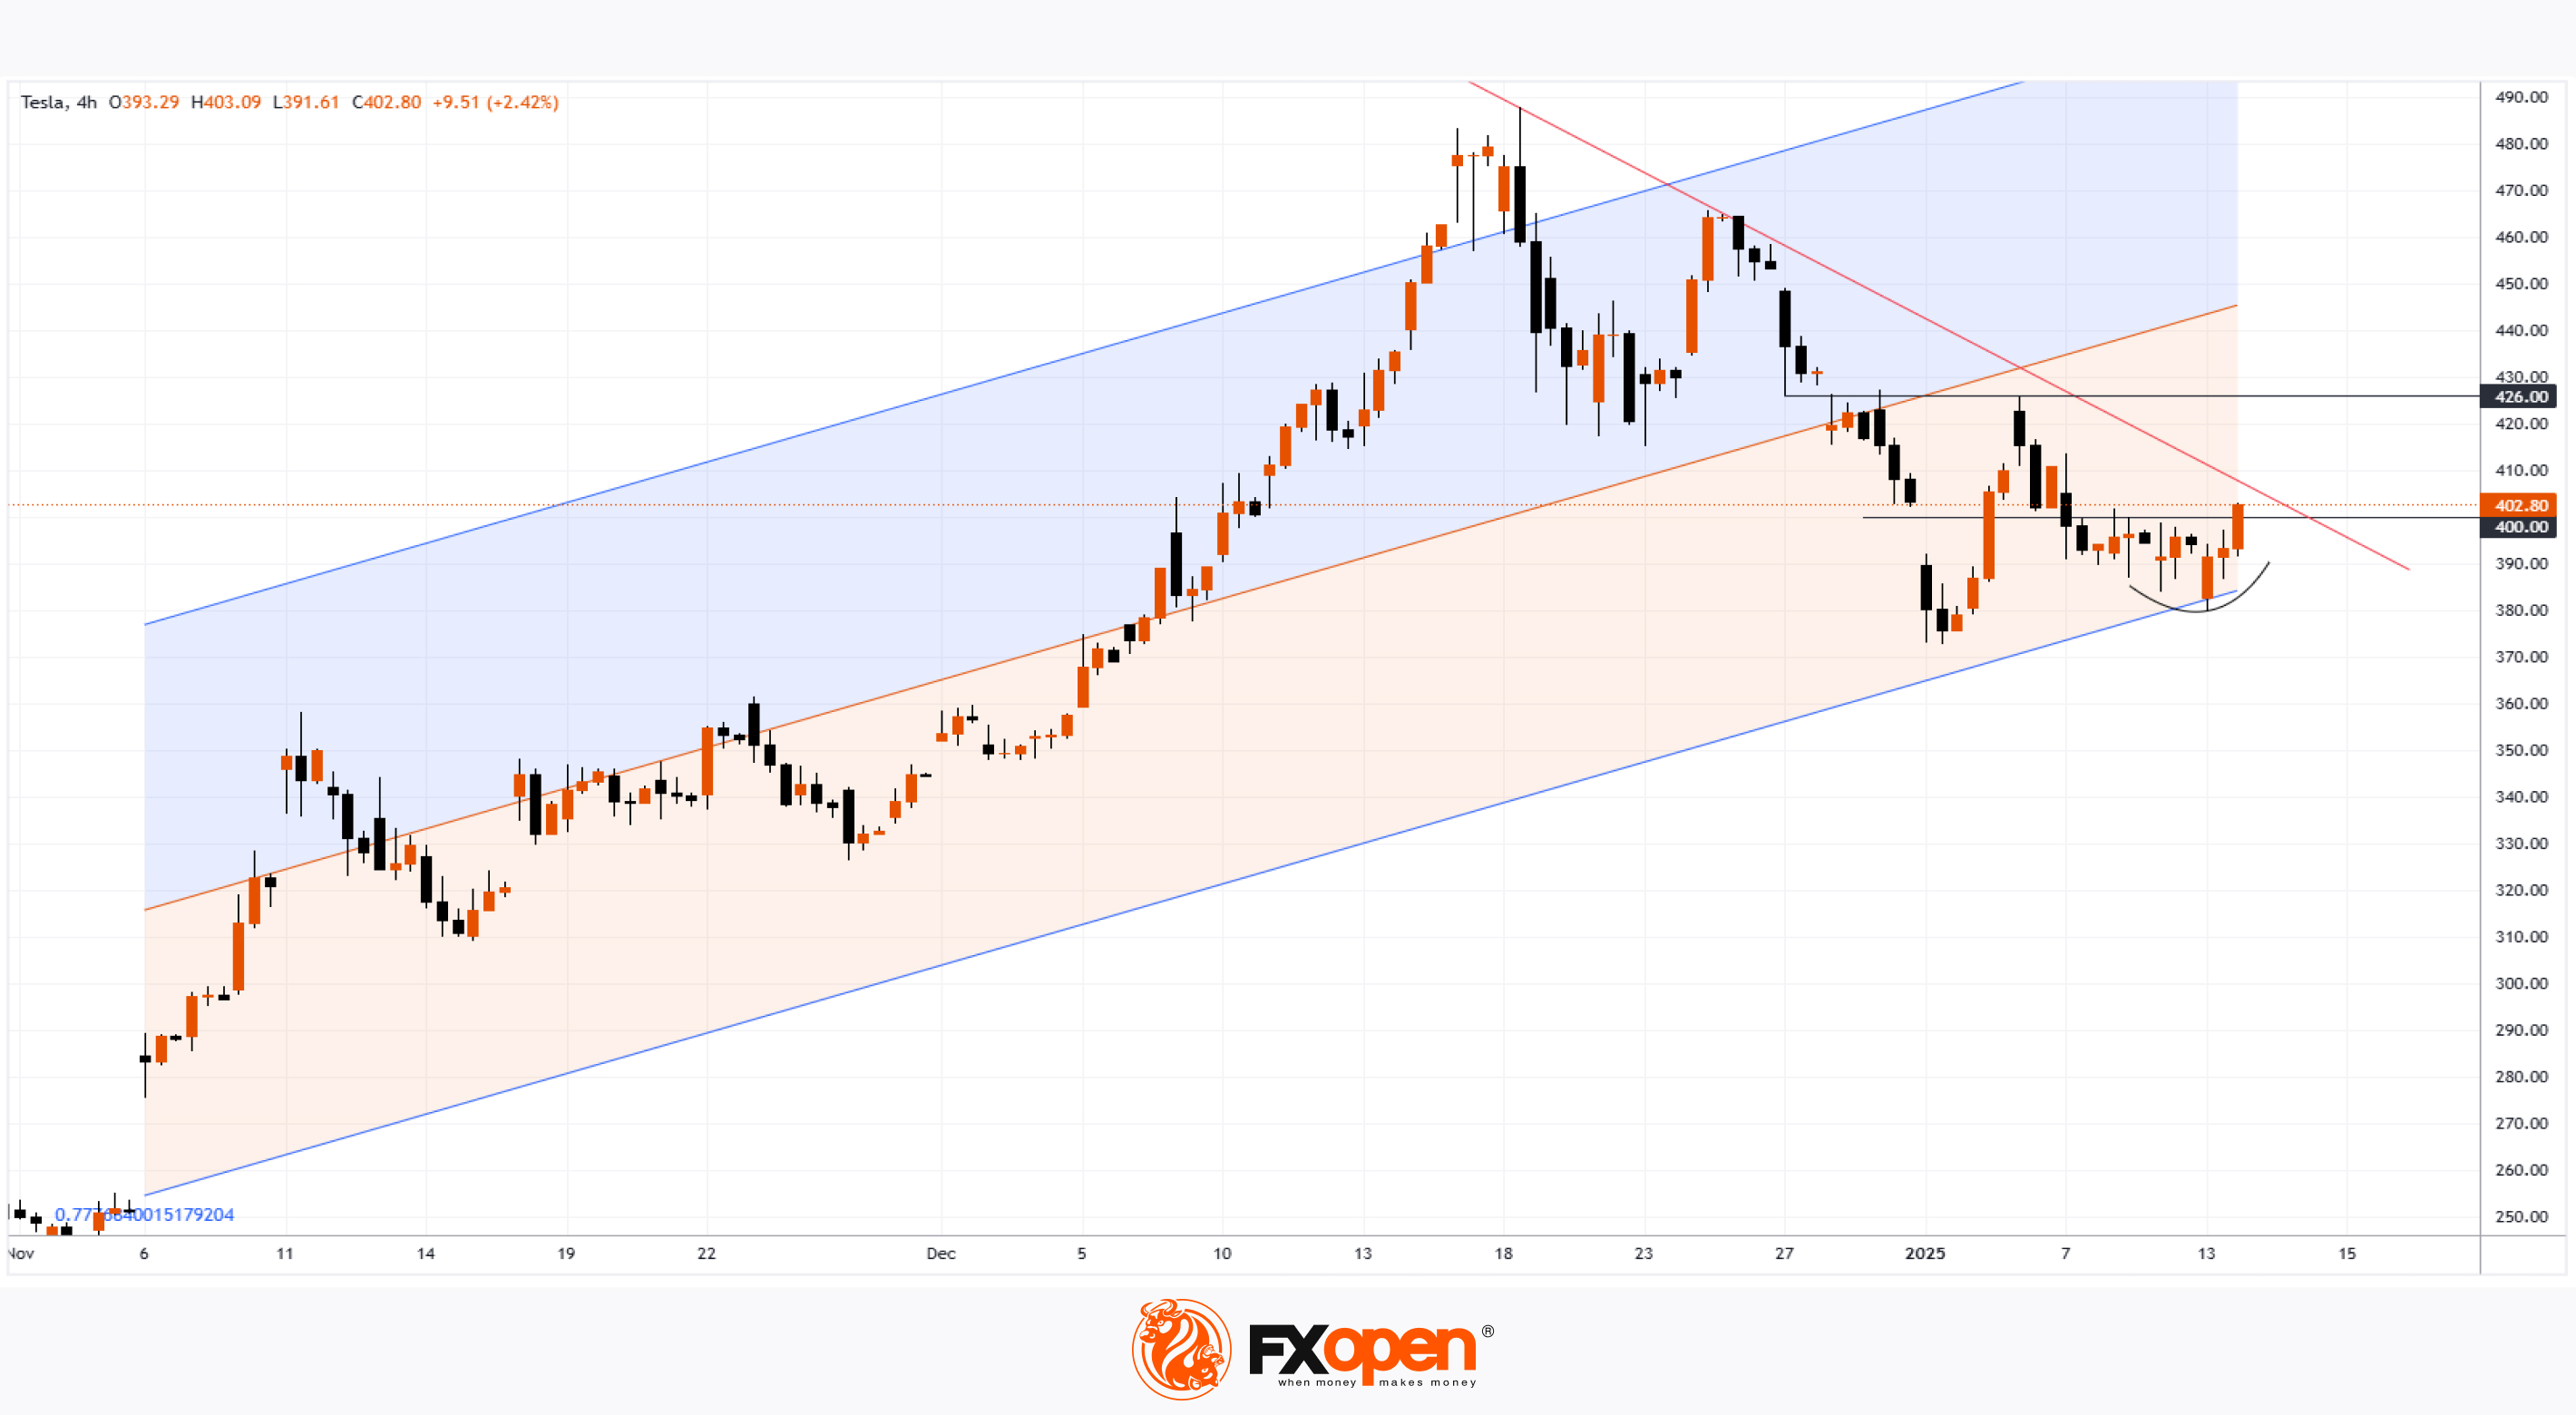
According to the Tesla (TSLA) chart, the stock price increased by 2% on Monday, closing above the key psychological level of $400.
Bullish sentiment was driven by Morgan Stanley analysts raising their target price for Tesla (TSLA) from $400 to $430, citing the company's "highly promising" progress in autonomous vehicle (AV) technology.
From a technical analysis perspective, this upward move is notable. Applying a linear regression trend channel from early November, when Tesla’s stock began a sharp rise following news of Trump’s victory (supported by Elon Musk), reveals:
→ a reversal upward from the lower boundary of the trend channel;
→ the potential for an upward breakout through the resistance of the red descending trend line, which formed as the price declined from the record high near $488 on December 18.
This suggests that bulls may be attempting to resume movement within the regression channel. If successful, a reasonable target could be the median line of the channel, implying a potential price increase towards $450, with resistance at $426 being a key level to watch.
According to TipRanks:
→ 13 out of 34 analysts recommend buying TSLA stock.
→ The average 12-month price target for TSLA is $323.56.
Trade global index CFDs with zero commission and tight spreads. Open your FXOpen account now or learn more about trading index CFDs with FXOpen.
CFDs are complex instruments and come with a high risk of losing your money.
This article represents the opinion of the Companies operating under the FXOpen brand only. It is not to be construed as an offer, solicitation, or recommendation with respect to products and services provided by the Companies operating under the FXOpen brand, nor is it to be considered financial advice.
Tesla (TSLA) Stock Price Rises Above $400
According to the Tesla (TSLA) chart, the stock price increased by 2% on Monday, closing above the key psychological level of $400.
Bullish sentiment was driven by Morgan Stanley analysts raising their target price for Tesla (TSLA) from $400 to $430, citing the company's "highly promising" progress in autonomous vehicle (AV) technology.
From a technical analysis perspective, this upward move is notable. Applying a linear regression trend channel from early November, when Tesla’s stock began a sharp rise following news of Trump’s victory (supported by Elon Musk), reveals:
→ a reversal upward from the lower boundary of the trend channel;
→ the potential for an upward breakout through the resistance of the red descending trend line, which formed as the price declined from the record high near $488 on December 18.
This suggests that bulls may be attempting to resume movement within the regression channel. If successful, a reasonable target could be the median line of the channel, implying a potential price increase towards $450, with resistance at $426 being a key level to watch.
According to TipRanks:
→ 13 out of 34 analysts recommend buying TSLA stock.
→ The average 12-month price target for TSLA is $323.56.
Trade global index CFDs with zero commission and tight spreads. Open your FXOpen account now or learn more about trading index CFDs with FXOpen.
CFDs are complex instruments and come with a high risk of losing your money.
This article represents the opinion of the Companies operating under the FXOpen brand only. It is not to be construed as an offer, solicitation, or recommendation with respect to products and services provided by the Companies operating under the FXOpen brand, nor is it to be considered financial advice.
👍2
Media is too big
VIEW IN TELEGRAM
#oilprices #usdollar #stockmarket #MarketUpdates
Daily Market News with FXOpen - 14 January 2025
🔸Dollar Drifts Near 2-Year High as Rate-Cut Bets Fade, Eyes on Tariffs;
🔸Oil Prices Remain Near Four-Month Highs as Markets Weigh Russia Sanctions Impact;
🔸European Markets Set to Reverse Negative Momentum at the Open, but Bond Yields Are Still in Focus.
CFDs are complex instruments and come with a high risk of losing your money.
Daily Market News with FXOpen - 14 January 2025
🔸Dollar Drifts Near 2-Year High as Rate-Cut Bets Fade, Eyes on Tariffs;
🔸Oil Prices Remain Near Four-Month Highs as Markets Weigh Russia Sanctions Impact;
🔸European Markets Set to Reverse Negative Momentum at the Open, but Bond Yields Are Still in Focus.
CFDs are complex instruments and come with a high risk of losing your money.
👍2
#GBPUSD #marketanalysis #MarketTrends #forextrading
GBP/USD Analysis: Bulls Find Renewed Hope
This morning, UK inflation data was released, as reported by ForexFactory:
→ Consumer Price Index (CPI): actual = 2.5%, expected = 2.6%, previous = 2.6%;
→ Core CPI: actual = 3.2%, expected = 3.4%, previous = 3.5%.
The foreign exchange market reacted with a surge in volatility as UK inflation showed a decline.
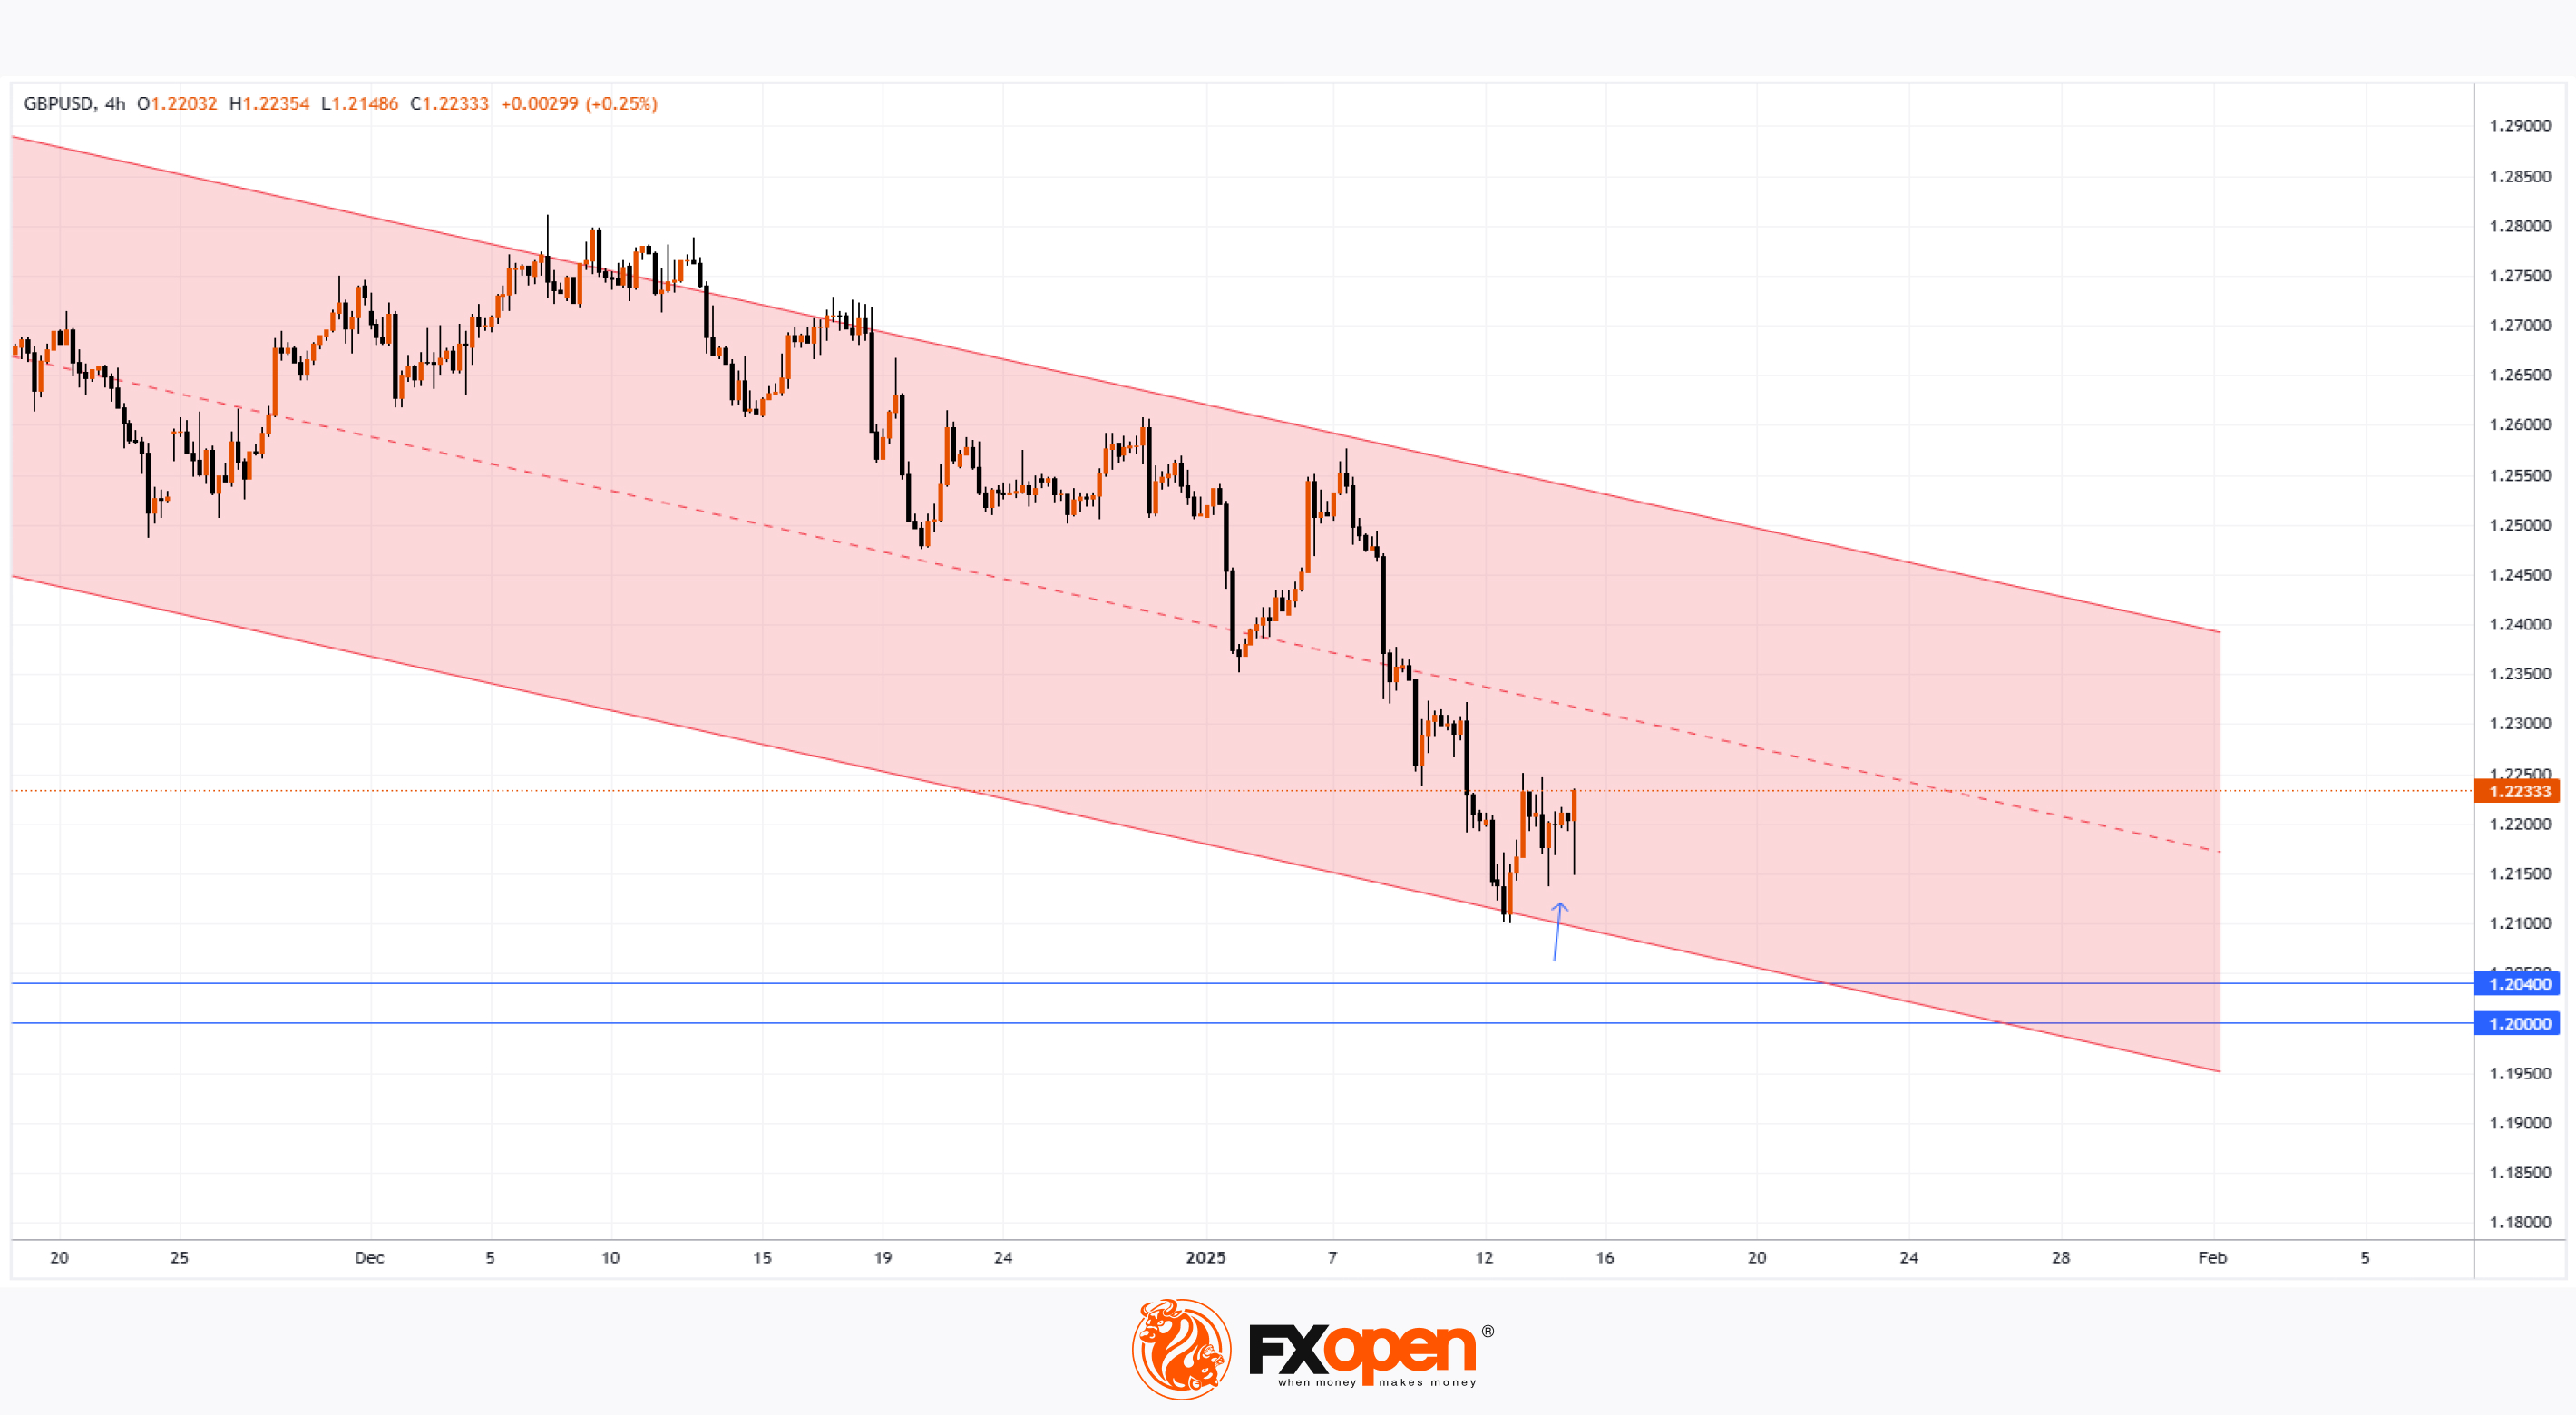
At the same time, a technical analysis of the GBP/USD chart offers some hope for bulls following a drop of more than 9% from the peaks of September 2024 (interestingly, on 10th September 2024, we noted that bulls were facing challenges).
When analysing today’s GBP/USD price movements, we observe that at the start of 2025, the price has approached a key support zone formed by:
→ the lower boundary of the descending channel (drawn in red);
→ the psychological level of 1.2000;
→ the significant 2023 low around the 1.2040 level.
The long lower wicks on the 4-hour candles, including today’s (highlighted with an arrow), can be interpreted as a signal of increasing demand. This could be an early sign that the pound is gaining confidence to resist the building pressure from the dollar.
Traders’ attention today will be on the release of the US CPI report (at 16:30 GMT+3), which may further support the case for strengthening bulls.
Trade over 50 forex markets 24 hours a day with FXOpen. Take advantage of low commissions, deep liquidity, and spreads from 0.0 pips. Open your FXOpen account now or learn more about trading forex with FXOpen.
CFDs are complex instruments and come with a high risk of losing your money.
This article represents the opinion of the Companies operating under the FXOpen brand only. It is not to be construed as an offer, solicitation, or recommendation with respect to products and services provided by the Companies operating under the FXOpen brand, nor is it to be considered financial advice.
GBP/USD Analysis: Bulls Find Renewed Hope
This morning, UK inflation data was released, as reported by ForexFactory:
→ Consumer Price Index (CPI): actual = 2.5%, expected = 2.6%, previous = 2.6%;
→ Core CPI: actual = 3.2%, expected = 3.4%, previous = 3.5%.
The foreign exchange market reacted with a surge in volatility as UK inflation showed a decline.
At the same time, a technical analysis of the GBP/USD chart offers some hope for bulls following a drop of more than 9% from the peaks of September 2024 (interestingly, on 10th September 2024, we noted that bulls were facing challenges).
When analysing today’s GBP/USD price movements, we observe that at the start of 2025, the price has approached a key support zone formed by:
→ the lower boundary of the descending channel (drawn in red);
→ the psychological level of 1.2000;
→ the significant 2023 low around the 1.2040 level.
The long lower wicks on the 4-hour candles, including today’s (highlighted with an arrow), can be interpreted as a signal of increasing demand. This could be an early sign that the pound is gaining confidence to resist the building pressure from the dollar.
Traders’ attention today will be on the release of the US CPI report (at 16:30 GMT+3), which may further support the case for strengthening bulls.
Trade over 50 forex markets 24 hours a day with FXOpen. Take advantage of low commissions, deep liquidity, and spreads from 0.0 pips. Open your FXOpen account now or learn more about trading forex with FXOpen.
CFDs are complex instruments and come with a high risk of losing your money.
This article represents the opinion of the Companies operating under the FXOpen brand only. It is not to be construed as an offer, solicitation, or recommendation with respect to products and services provided by the Companies operating under the FXOpen brand, nor is it to be considered financial advice.
👍2
#stockmarket #stocktrading #MarketUpdates
Morgan Stanley (MS) Shares Display Strength Ahead of Earnings Release
The stock market is eagerly awaiting the start of the quarterly earnings season. Traditionally, it kicks off with reports from major players in the financial sector, including Morgan Stanley (MS). The bank's earnings report is scheduled for tomorrow, Thursday, before the opening of the main trading session.
According to Yahoo Finance, analysts expect:
→ Earnings per share (EPS) to be $1.62, indicating a 43.4% increase compared to the previous year;
→ Revenue to reach $14.8 billion, reflecting a 14.7% rise year-on-year.
Meanwhile, MS’s share price may also be influenced by internal organisational changes at Morgan Stanley. The bank has created a new division to enhance client relations and appointed a new head of wealth management.
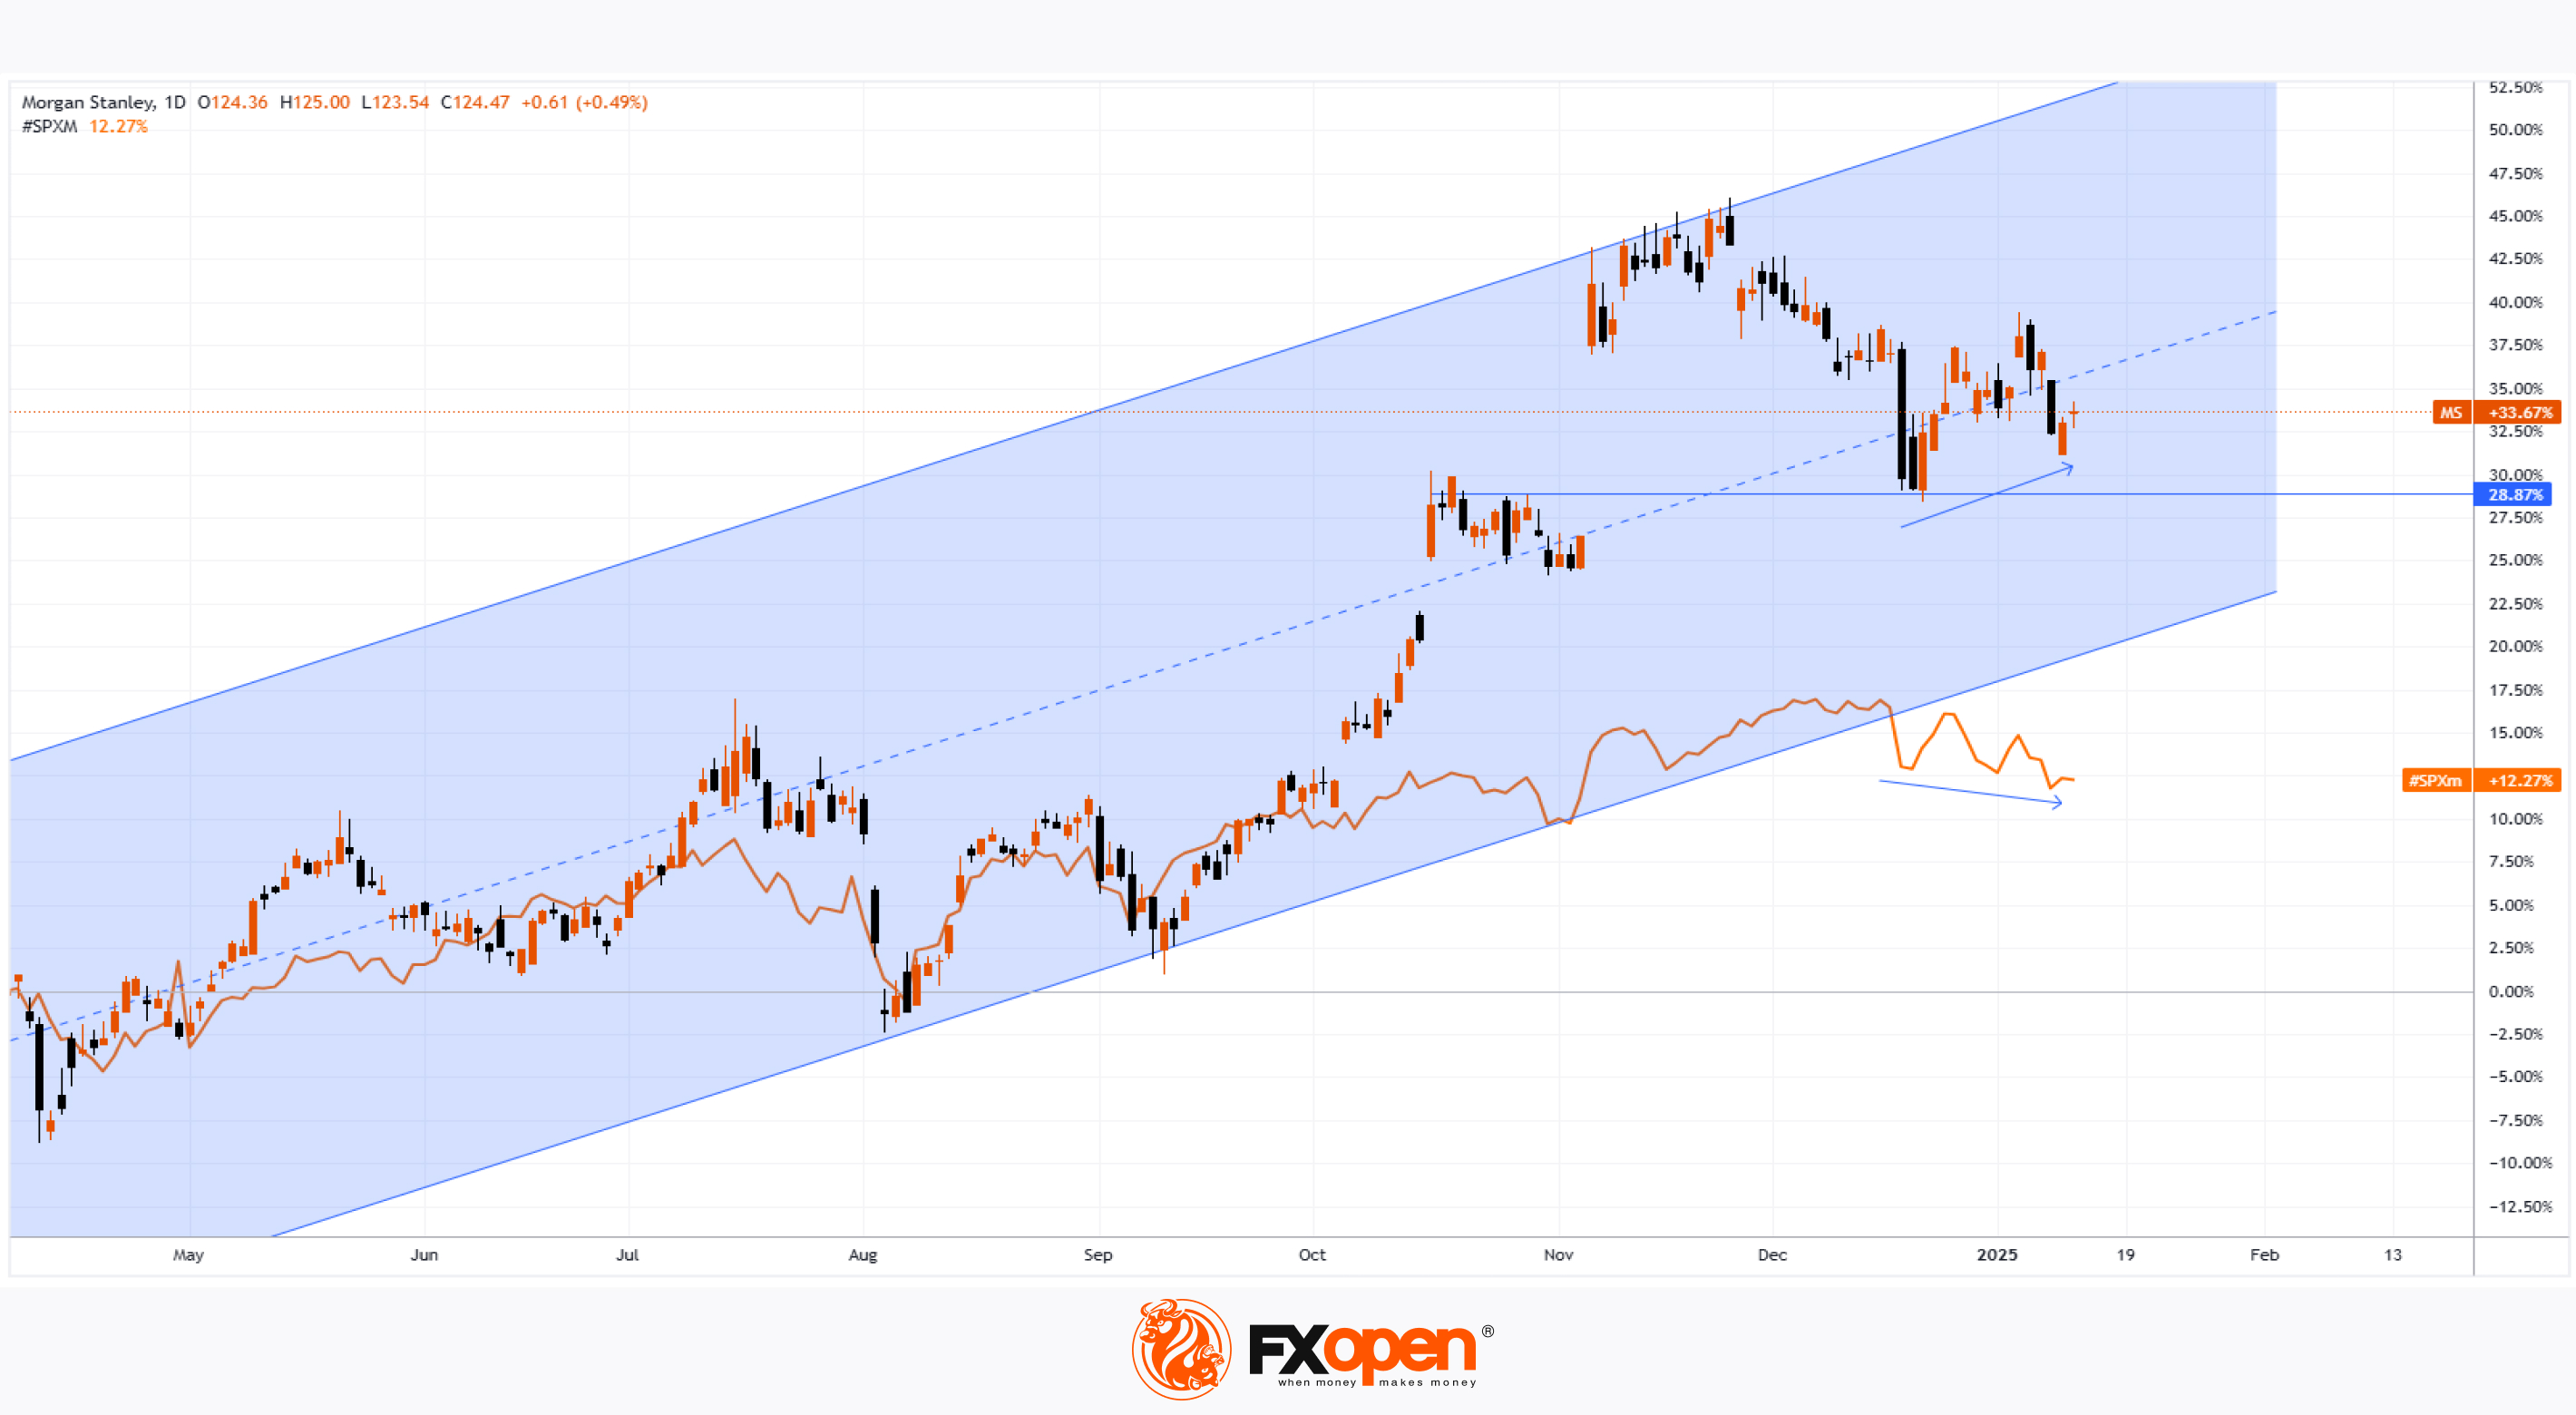
MarketWatch notes that the upcoming earnings season could be the strongest in three years (based on FactSet data), with the financial sector likely to be the largest contributor to profits this season. Furthermore, a technical analysis of Morgan Stanley’s (MS) stock chart suggests that market participants are optimistic.
Indeed:
→ Price fluctuations have formed an upward channel (marked in blue), with the share price stabilising around its median line—likely in anticipation of corporate news;
→ During the stock market decline in early 2025, MS’s share price fell less than the S&P 500 index (US SPX 500 mini on FXOpen), as indicated by arrows;
→ The $120 level appears to be a significant support zone.
It’s possible that today’s earnings reports from banks such as JPMorgan (JPM), Wells Fargo & Co. (WFC), Goldman Sachs Group Inc. (GS), and Citigroup Inc. (C) may offer clues about how MS’s stock price might move next.
Trade global index CFDs with zero commission and tight spreads. Open your FXOpen account now or learn more about trading index CFDs with FXOpen.
CFDs are complex instruments and come with a high risk of losing your money.
This article represents the opinion of the Companies operating under the FXOpen brand only. It is not to be construed as an offer, solicitation, or recommendation with respect to products and services provided by the Companies operating under the FXOpen brand, nor is it to be considered financial advice.
Morgan Stanley (MS) Shares Display Strength Ahead of Earnings Release
The stock market is eagerly awaiting the start of the quarterly earnings season. Traditionally, it kicks off with reports from major players in the financial sector, including Morgan Stanley (MS). The bank's earnings report is scheduled for tomorrow, Thursday, before the opening of the main trading session.
According to Yahoo Finance, analysts expect:
→ Earnings per share (EPS) to be $1.62, indicating a 43.4% increase compared to the previous year;
→ Revenue to reach $14.8 billion, reflecting a 14.7% rise year-on-year.
Meanwhile, MS’s share price may also be influenced by internal organisational changes at Morgan Stanley. The bank has created a new division to enhance client relations and appointed a new head of wealth management.
MarketWatch notes that the upcoming earnings season could be the strongest in three years (based on FactSet data), with the financial sector likely to be the largest contributor to profits this season. Furthermore, a technical analysis of Morgan Stanley’s (MS) stock chart suggests that market participants are optimistic.
Indeed:
→ Price fluctuations have formed an upward channel (marked in blue), with the share price stabilising around its median line—likely in anticipation of corporate news;
→ During the stock market decline in early 2025, MS’s share price fell less than the S&P 500 index (US SPX 500 mini on FXOpen), as indicated by arrows;
→ The $120 level appears to be a significant support zone.
It’s possible that today’s earnings reports from banks such as JPMorgan (JPM), Wells Fargo & Co. (WFC), Goldman Sachs Group Inc. (GS), and Citigroup Inc. (C) may offer clues about how MS’s stock price might move next.
Trade global index CFDs with zero commission and tight spreads. Open your FXOpen account now or learn more about trading index CFDs with FXOpen.
CFDs are complex instruments and come with a high risk of losing your money.
This article represents the opinion of the Companies operating under the FXOpen brand only. It is not to be construed as an offer, solicitation, or recommendation with respect to products and services provided by the Companies operating under the FXOpen brand, nor is it to be considered financial advice.
👍3
#commodities #silver #XAGUSD #tradingtips
Silver’s dual role as an industrial metal and investment asset creates an exciting market for traders.
🔸 How Can I Trade Silver Online?
Online silver trading can be done through platforms offering spot markets, futures, ETFs, and CFDs, which allow speculation on price movements without owning the metal.
🔸 Can You Trade Silver in Forex?
Silver (XAG) is often traded against the US dollar (XAG/USD), but also against currencies like the euro.
🔸 Which Pair Correlates With Silver?
Silver (XAG/USD) closely correlates with gold (XAU/USD). Both are known as safe-haven assets, though silver’s industrial demand adds unique price drivers.
🔸 Is There the Best Time to Trade Silver?
The most active trading hours are during the London-New York session overlap (1:00–5:00 pm GMT in winter, 12:00–4:00 pm GMT in summer), offering high liquidity and volatility.
CFDs are complex instruments and come with a high risk of losing your money.
Silver’s dual role as an industrial metal and investment asset creates an exciting market for traders.
🔸 How Can I Trade Silver Online?
Online silver trading can be done through platforms offering spot markets, futures, ETFs, and CFDs, which allow speculation on price movements without owning the metal.
🔸 Can You Trade Silver in Forex?
Silver (XAG) is often traded against the US dollar (XAG/USD), but also against currencies like the euro.
🔸 Which Pair Correlates With Silver?
Silver (XAG/USD) closely correlates with gold (XAU/USD). Both are known as safe-haven assets, though silver’s industrial demand adds unique price drivers.
🔸 Is There the Best Time to Trade Silver?
The most active trading hours are during the London-New York session overlap (1:00–5:00 pm GMT in winter, 12:00–4:00 pm GMT in summer), offering high liquidity and volatility.
CFDs are complex instruments and come with a high risk of losing your money.

👍2
#marketanalysis #sp500 #stockmarket #stocks
S&P 500 Index Rises to Psychological Level
The US stock market experienced an upswing following the release of inflation data yesterday. According to ForexFactory:
→ The annual Consumer Price Index (CPI) matched expectations at 2.9%.
→ The monthly Core CPI came in at 0.2%, below analysts' forecast of 0.3%.
Market participants interpreted this as a positive signal, leading to the S&P 500 index (US SPX 500 mini on FXOpen) gaining over 1% in the first 30 minutes after the data release.
As reported by Reuters:
→ Concerns about inflation eased, reviving hopes for a potential Federal Reserve rate cut, buoyed by a strong start to the earnings season (which we will cover in more detail later);
→ However, the rally may be short-lived, as inflation in the US remains uncomfortably high and could increase further due to aggressive tariff and tax policies under the new Trump administration;
→ Analysts caution that the Federal Reserve's rate is likely to remain unchanged for some time.
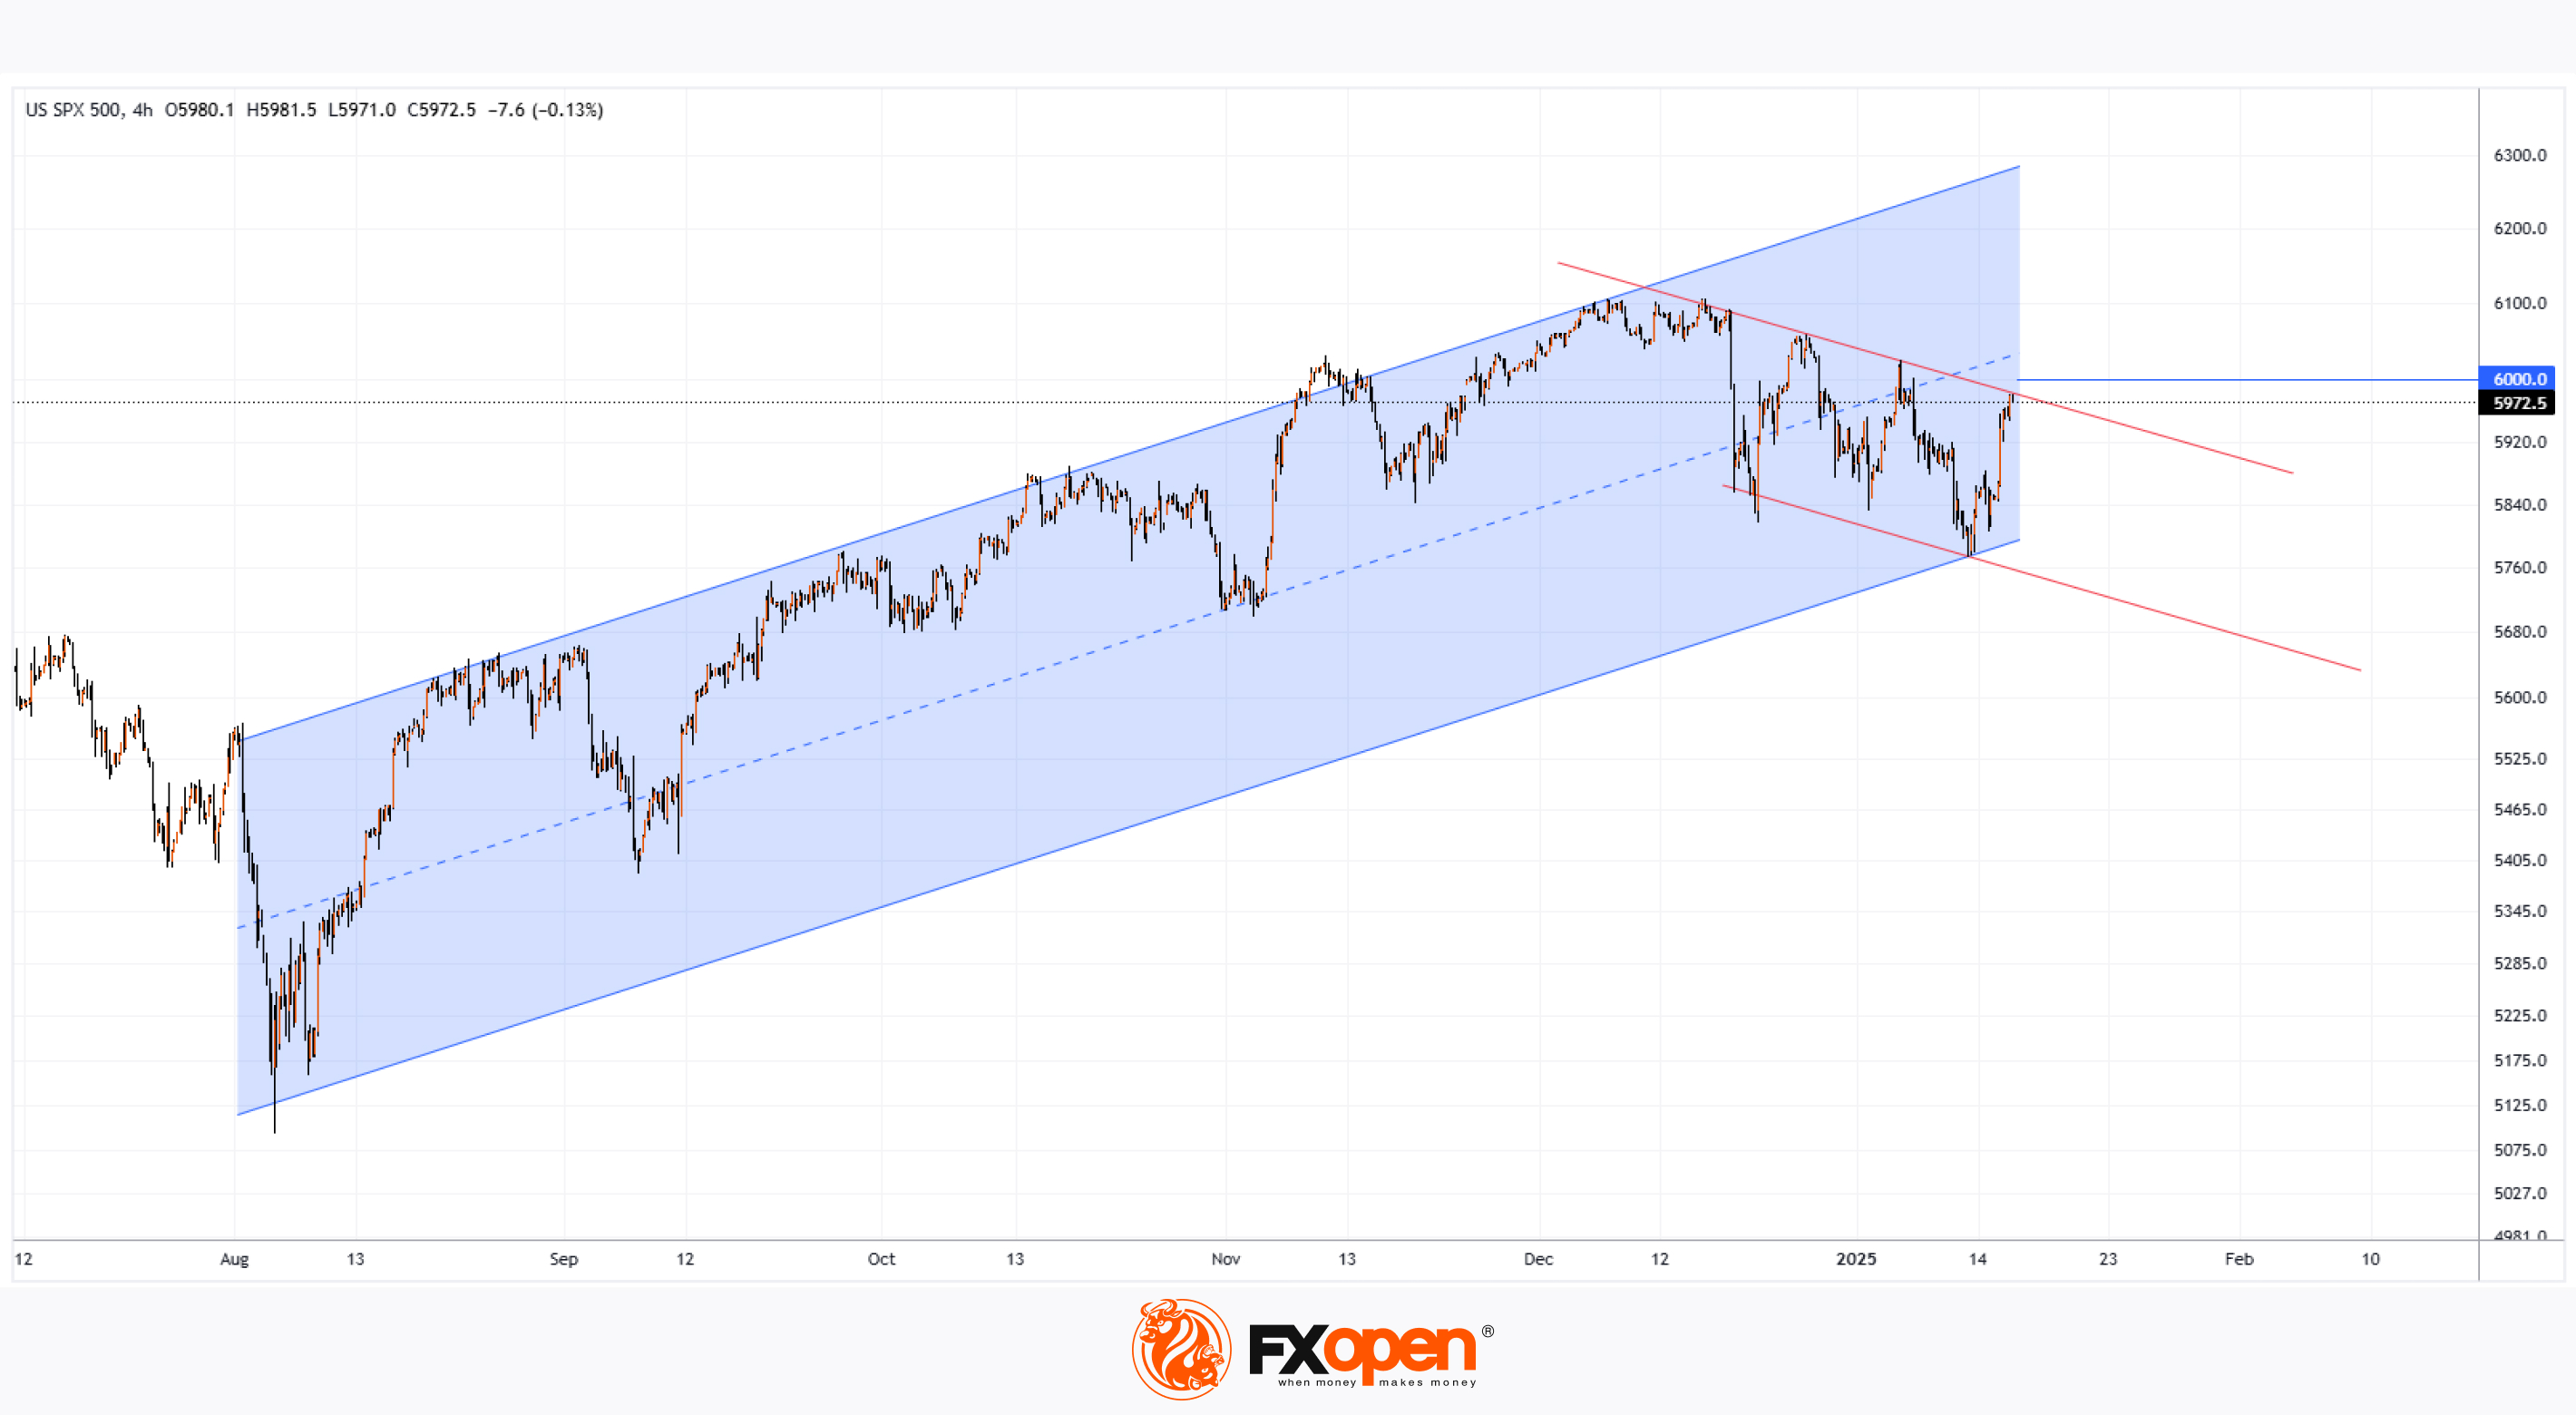
Technical analysis of the S&P 500 index chart (US SPX 500 mini on FXOpen) shows that since early August—when the Japanese stock market crash triggered concerns of a global recession, dragging US equities lower—the price has been in an upward trend, marked by a blue channel. The January mid-month low has provided a more precise point to define the lower boundary of this channel.
From this perspective, traders should note that the current S&P 500 price has reached a resistance zone, which consists of:
→ The median line of the blue channel;
→ The psychological level of 6,000 points;
→ The upper red line, drawn through the local highs of December 2024 and January 2025, suggesting that the decline beginning on 18th December could be viewed as an intermediate correction within the blue ascending channel.
This resistance area may serve as a key test of the bulls' determination to complete the correction and resume the upward trend.
Trade global index CFDs with zero commission and tight spreads. Open your FXOpen account now or learn more about trading index CFDs with FXOpen.
CFDs are complex instruments and come with a high risk of losing your money.
This article represents the opinion of the Companies operating under the FXOpen brand only. It is not to be construed as an offer, solicitation, or recommendation with respect to products and services provided by the Companies operating under the FXOpen brand, nor is it to be considered financial advice.
S&P 500 Index Rises to Psychological Level
The US stock market experienced an upswing following the release of inflation data yesterday. According to ForexFactory:
→ The annual Consumer Price Index (CPI) matched expectations at 2.9%.
→ The monthly Core CPI came in at 0.2%, below analysts' forecast of 0.3%.
Market participants interpreted this as a positive signal, leading to the S&P 500 index (US SPX 500 mini on FXOpen) gaining over 1% in the first 30 minutes after the data release.
As reported by Reuters:
→ Concerns about inflation eased, reviving hopes for a potential Federal Reserve rate cut, buoyed by a strong start to the earnings season (which we will cover in more detail later);
→ However, the rally may be short-lived, as inflation in the US remains uncomfortably high and could increase further due to aggressive tariff and tax policies under the new Trump administration;
→ Analysts caution that the Federal Reserve's rate is likely to remain unchanged for some time.
Technical analysis of the S&P 500 index chart (US SPX 500 mini on FXOpen) shows that since early August—when the Japanese stock market crash triggered concerns of a global recession, dragging US equities lower—the price has been in an upward trend, marked by a blue channel. The January mid-month low has provided a more precise point to define the lower boundary of this channel.
From this perspective, traders should note that the current S&P 500 price has reached a resistance zone, which consists of:
→ The median line of the blue channel;
→ The psychological level of 6,000 points;
→ The upper red line, drawn through the local highs of December 2024 and January 2025, suggesting that the decline beginning on 18th December could be viewed as an intermediate correction within the blue ascending channel.
This resistance area may serve as a key test of the bulls' determination to complete the correction and resume the upward trend.
Trade global index CFDs with zero commission and tight spreads. Open your FXOpen account now or learn more about trading index CFDs with FXOpen.
CFDs are complex instruments and come with a high risk of losing your money.
This article represents the opinion of the Companies operating under the FXOpen brand only. It is not to be construed as an offer, solicitation, or recommendation with respect to products and services provided by the Companies operating under the FXOpen brand, nor is it to be considered financial advice.
👍2