
#stockmarket #stocktrading #adobe #marketanalysis
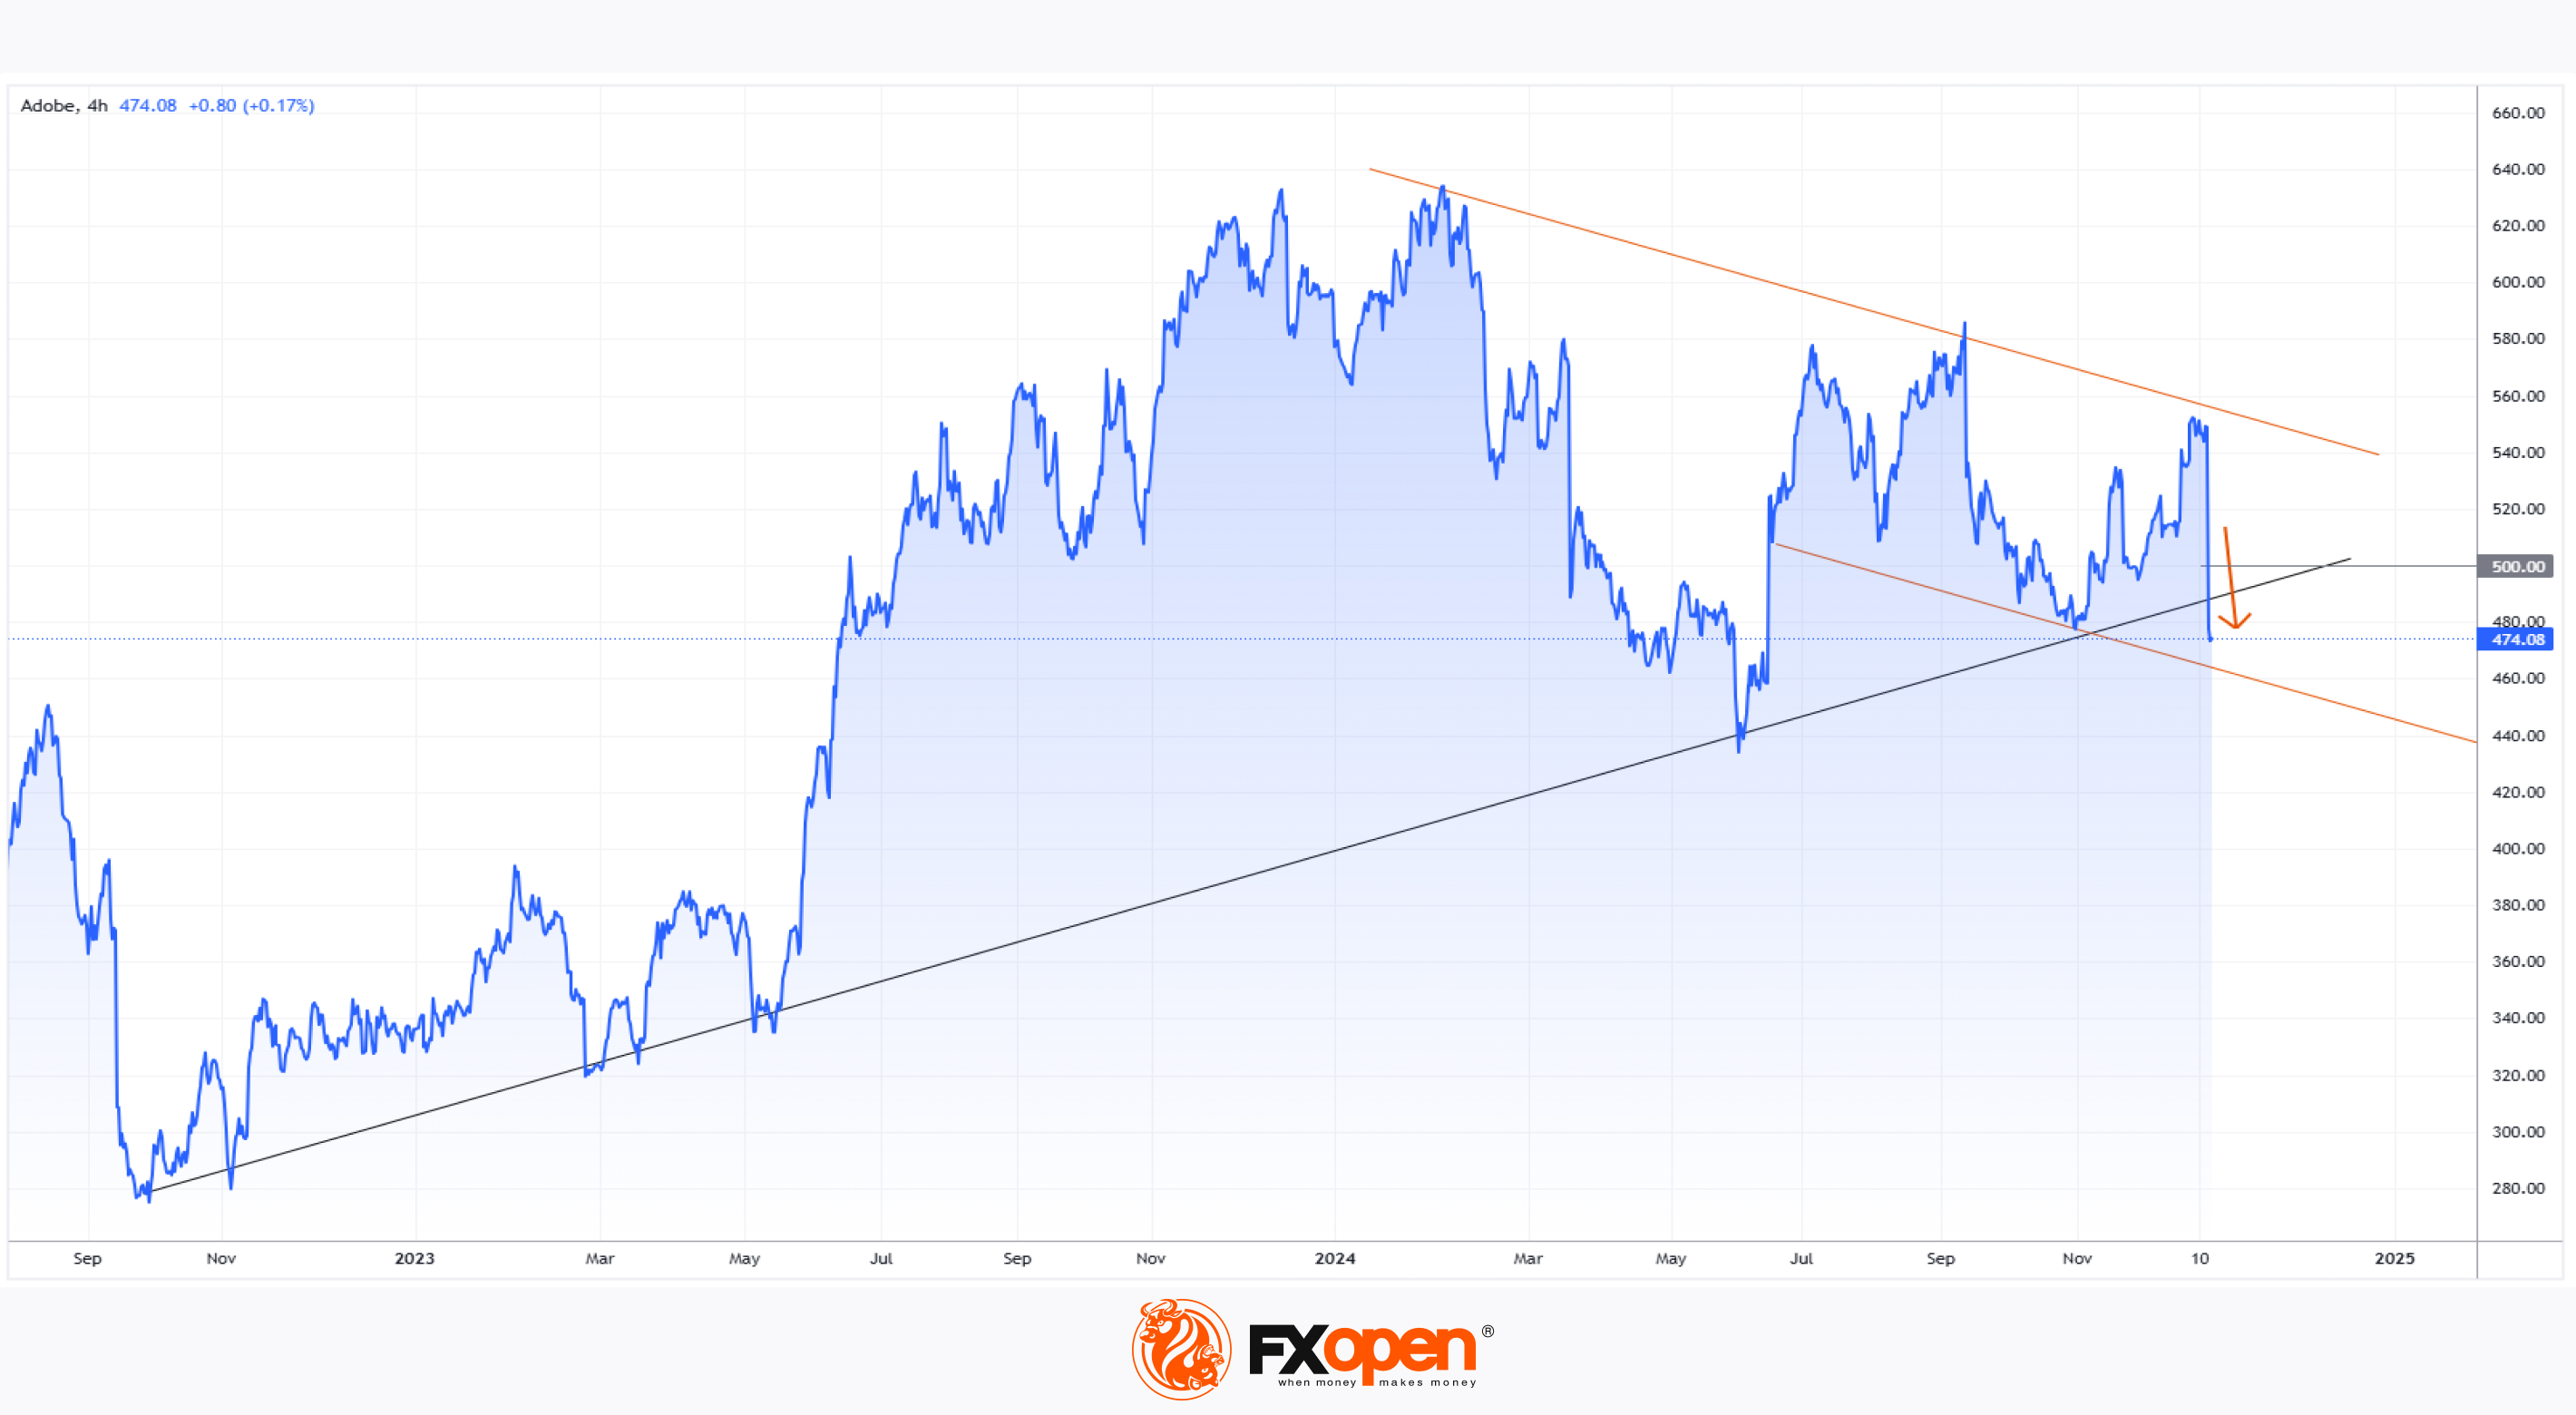
Adobe (ADBE) Shares Plunge Over 13%
On Wednesday evening, Adobe Inc. (ADBE) released its quarterly financial results:
→ Earnings per share: Actual = $4.81, Expected = $4.66;
→ Revenue: Actual = $5.61 billion, Expected = $5.54 billion.
Despite exceeding analyst expectations and showing growth compared to the previous quarter, Adobe’s stock opened Thursday with a bearish gap and continued to decline throughout the session, closing more than 13% lower than Wednesday’s close.
The sell-off was driven by Adobe’s disappointing 2025 forecast, projecting slower-than-expected revenue and earnings per share growth. According to Yahoo Finance, this stems from increasing competition (from Google, OpenAI, and others) and concerns over monetising AI tools, which have already contributed to a 20% drop in Adobe’s stock this year.
Technical Analysis of Adobe Inc. (ADBE) Stock
The stock price is:
→ Forming a descending channel (highlighted in orange), with its boundaries becoming increasingly evident;
→ Breaking below both a long-term trendline (marked with an arrow) dating back to 2022 and the psychological level of $500 per share.
The outlook appears grim, although TipRanks data indicates that analysts remain optimistic:
→ 22 out of 30 analysts recommend buying ADBE stock;
→ The average price target for ADBE is $603 within 12 months, suggesting a 27% upside from current levels.
However, Adobe’s 2025 projections amidst stiff competition may prompt a reassessment of its investment value, potentially leading to a consolidation of ADBE’s price below the $500 psychological threshold.
Trade global index CFDs with zero commission and tight spreads. Open your FXOpen account now or learn more about trading index CFDs with FXOpen.
CFDs are complex instruments and come with a high risk of losing your money.
This article represents the opinion of the Companies operating under the FXOpen brand only. It is not to be construed as an offer, solicitation, or recommendation with respect to products and services provided by the Companies operating under the FXOpen brand, nor is it to be considered financial advice.
Adobe (ADBE) Shares Plunge Over 13%
On Wednesday evening, Adobe Inc. (ADBE) released its quarterly financial results:
→ Earnings per share: Actual = $4.81, Expected = $4.66;
→ Revenue: Actual = $5.61 billion, Expected = $5.54 billion.
Despite exceeding analyst expectations and showing growth compared to the previous quarter, Adobe’s stock opened Thursday with a bearish gap and continued to decline throughout the session, closing more than 13% lower than Wednesday’s close.
The sell-off was driven by Adobe’s disappointing 2025 forecast, projecting slower-than-expected revenue and earnings per share growth. According to Yahoo Finance, this stems from increasing competition (from Google, OpenAI, and others) and concerns over monetising AI tools, which have already contributed to a 20% drop in Adobe’s stock this year.
Technical Analysis of Adobe Inc. (ADBE) Stock
The stock price is:
→ Forming a descending channel (highlighted in orange), with its boundaries becoming increasingly evident;
→ Breaking below both a long-term trendline (marked with an arrow) dating back to 2022 and the psychological level of $500 per share.
The outlook appears grim, although TipRanks data indicates that analysts remain optimistic:
→ 22 out of 30 analysts recommend buying ADBE stock;
→ The average price target for ADBE is $603 within 12 months, suggesting a 27% upside from current levels.
However, Adobe’s 2025 projections amidst stiff competition may prompt a reassessment of its investment value, potentially leading to a consolidation of ADBE’s price below the $500 psychological threshold.
Trade global index CFDs with zero commission and tight spreads. Open your FXOpen account now or learn more about trading index CFDs with FXOpen.
CFDs are complex instruments and come with a high risk of losing your money.
This article represents the opinion of the Companies operating under the FXOpen brand only. It is not to be construed as an offer, solicitation, or recommendation with respect to products and services provided by the Companies operating under the FXOpen brand, nor is it to be considered financial advice.
👍2
#Inflation #InterestRates #ForexTrading #StockMarket #Commodities #FinanceNews #EconomicOutlook #MarketTrends
Market Year Wrap With Gary Thomson: 2024 Market Insights & 2025 Outlook
As we approach the close of 2024, it’s time to reflect on results and think of potential opportunities for the year ahead. Join Gary Thomson, the COO of FXOpen UK, as he sums up the key market trends that shaped 2024 and provides insights on what to expect in 2025.
🔸 Inflation and Interest Rates
🔸 Forex Market Trends
🔸 Commodity Markets
🔸 Stock Market Highlights
🔸 2025 Outlook
Stay in the know and empower yourself with our short, yet power-packed video. Watch it now and stay updated with FXOpen. Don't miss out on this invaluable opportunity to sharpen your trading skills and make informed decisions.
https://cutt.ly/geVFs2Oo
To take advantage of price fluctuations in the foreign exchange markets, consider enlisting the services of a reliable broker like FXOpen.
⚠️
This forecast represents FXOpen Companies opinion only, it should not be construed as an offer, invitation or recommendation in respect to FXOpen Companies products and services or as financial advice.
Market Year Wrap With Gary Thomson: 2024 Market Insights & 2025 Outlook
As we approach the close of 2024, it’s time to reflect on results and think of potential opportunities for the year ahead. Join Gary Thomson, the COO of FXOpen UK, as he sums up the key market trends that shaped 2024 and provides insights on what to expect in 2025.
🔸 Inflation and Interest Rates
🔸 Forex Market Trends
🔸 Commodity Markets
🔸 Stock Market Highlights
🔸 2025 Outlook
Stay in the know and empower yourself with our short, yet power-packed video. Watch it now and stay updated with FXOpen. Don't miss out on this invaluable opportunity to sharpen your trading skills and make informed decisions.
https://cutt.ly/geVFs2Oo
To take advantage of price fluctuations in the foreign exchange markets, consider enlisting the services of a reliable broker like FXOpen.
⚠️
This forecast represents FXOpen Companies opinion only, it should not be construed as an offer, invitation or recommendation in respect to FXOpen Companies products and services or as financial advice.
YouTube
Market Year Wrap With Gary Thomson: 2024 Market Insights & 2025 Outlook
As we approach the close of 2024, it’s time to reflect on results and think of potential opportunities for the year ahead. Join Gary Thomson, the COO of FXOpen UK, as he sums up the key market trends that shaped 2024 and provides insights on what to expect…
👍2
#marketanalysis #stockmarket #stocktrading
Broadcom Inc. (AVGO) Stock Price Soars Nearly 20%
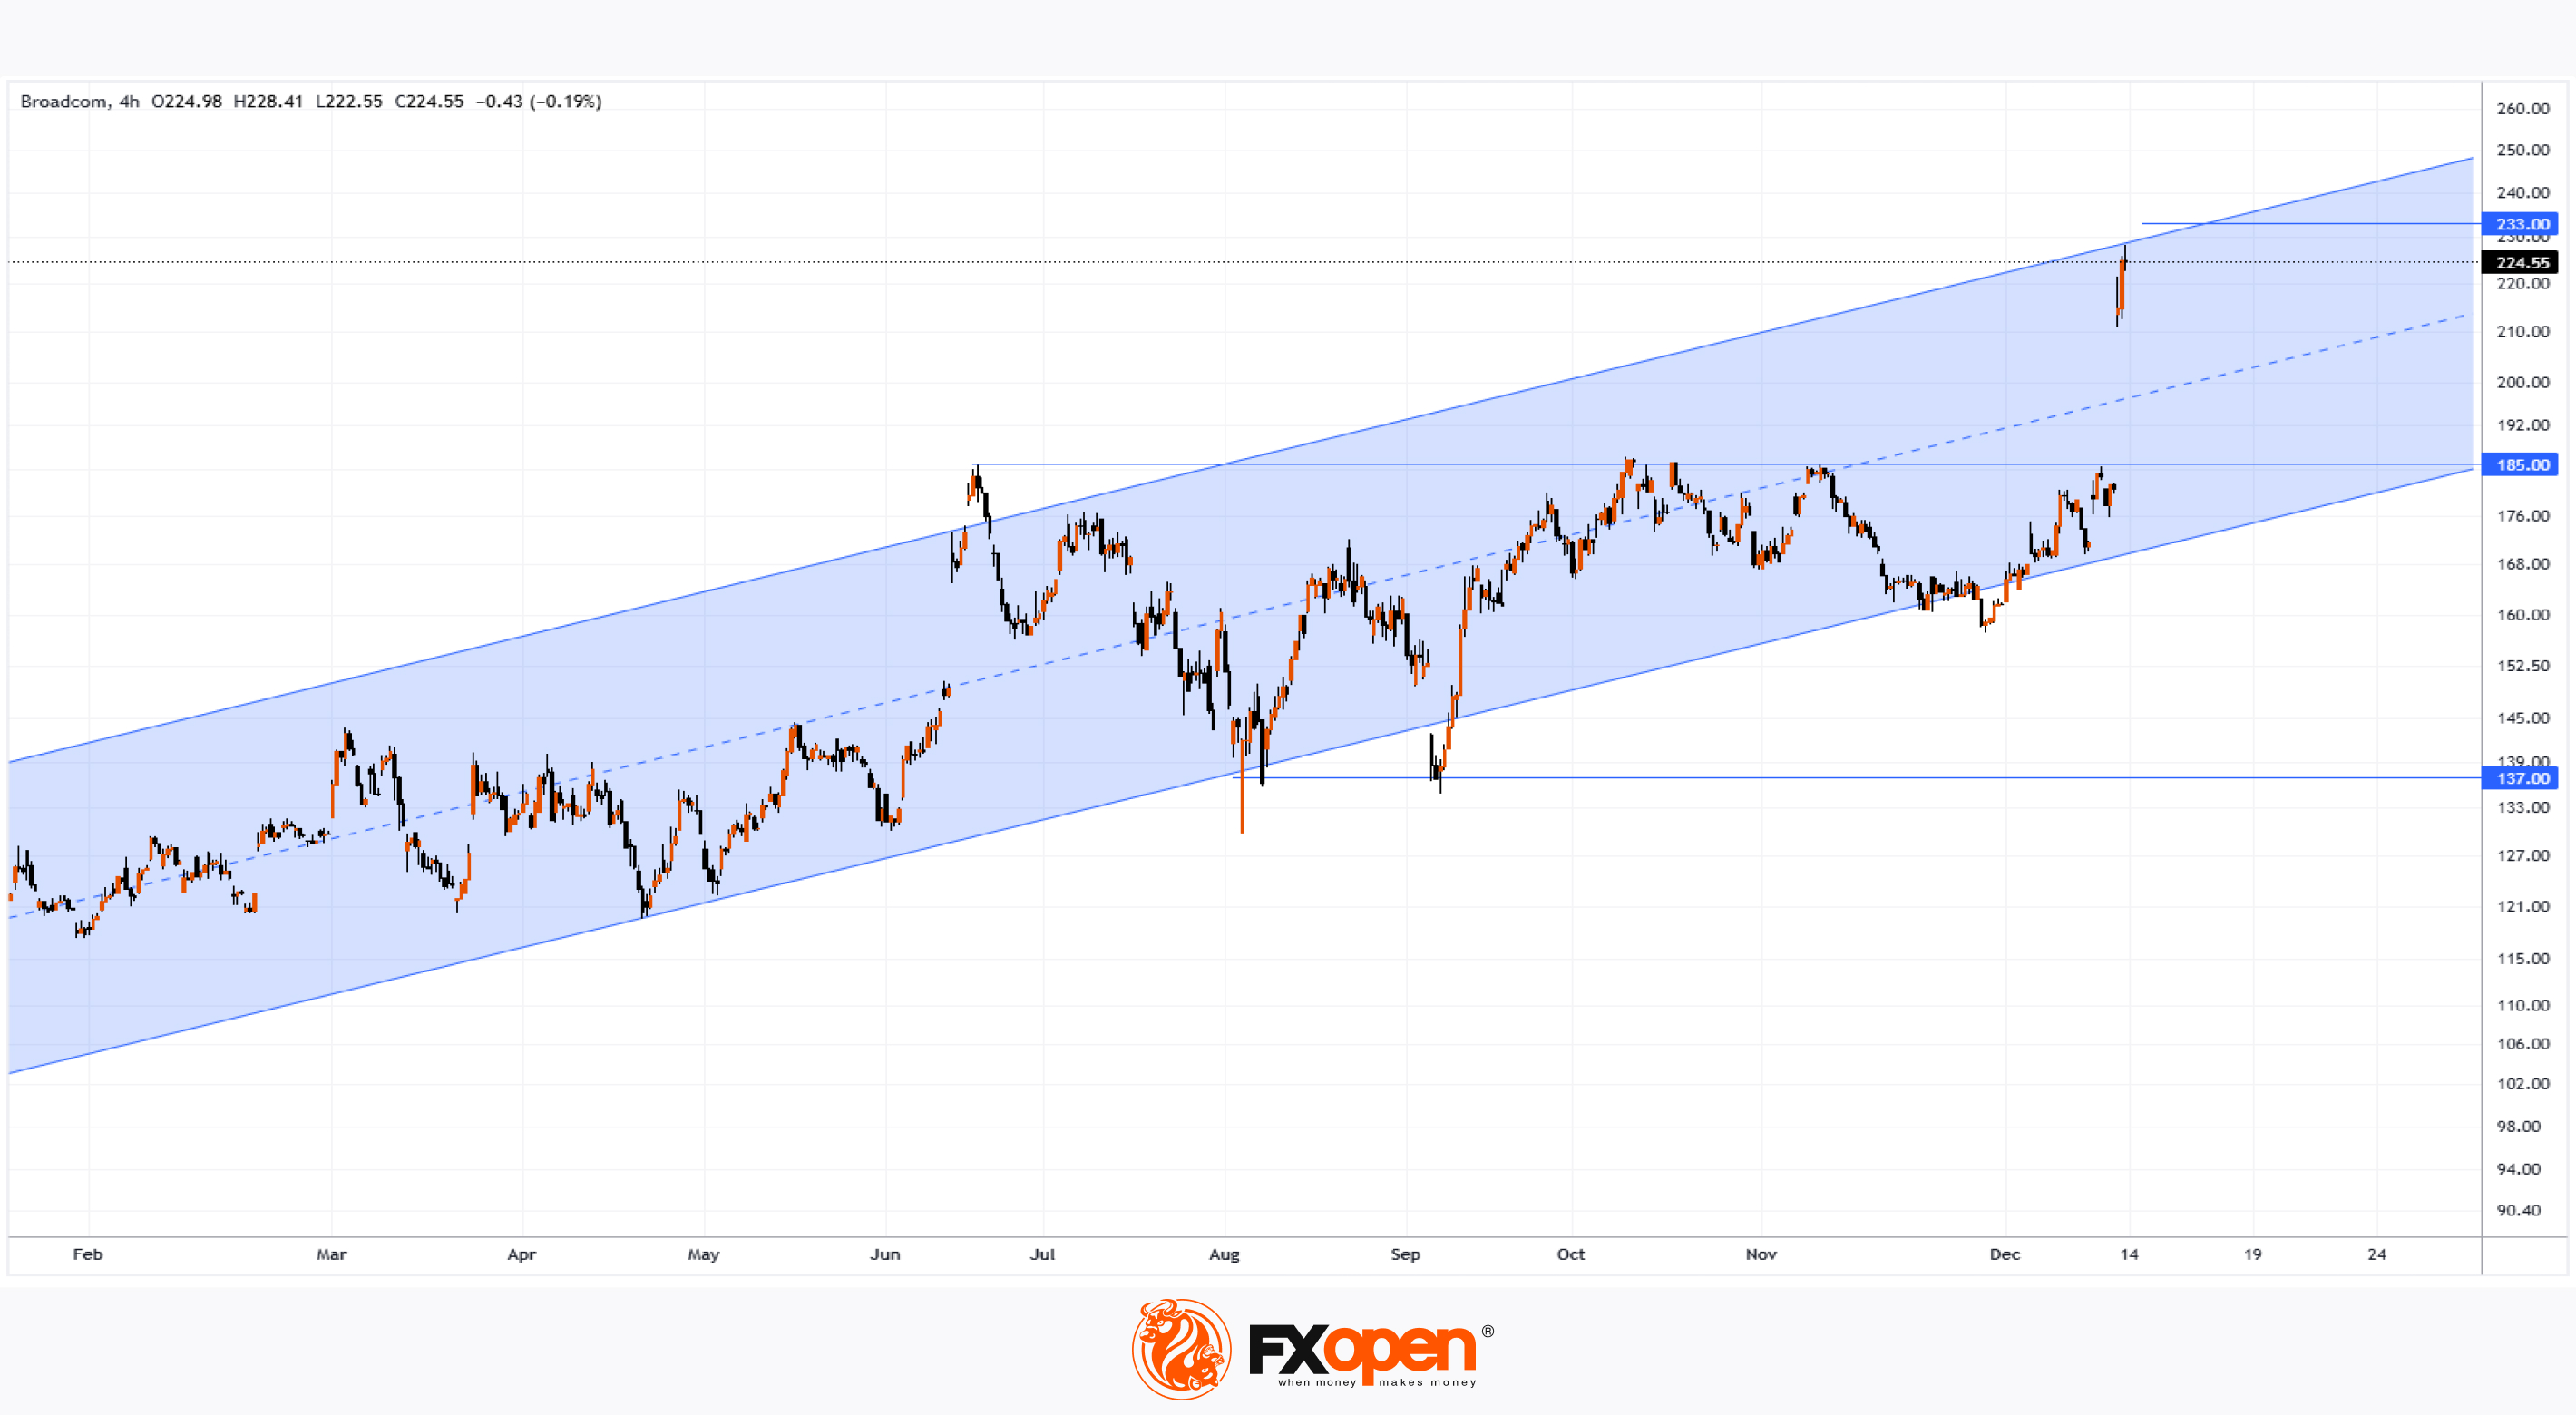
The chart shows that at the end of last week, Broadcom Inc. (AVGO) stock price surged nearly 20%, breaking the psychological barrier of $200 per share and pushing the company’s market capitalisation to $1 trillion.
Last week, the company released its quarterly earnings report. The actual figures were close to analysts' forecasts — earnings per share of $1.42 vs $1.39 expected and fourth-quarter revenue of $14.05 billion vs $14.07 billion expected. However, the extraordinary rise in stock price was driven by a strong market reaction to the company's optimistic forecast, which is based on robust sales of chips designed for artificial intelligence (AI) applications.
Media reports highlight that the company’s revenue growth from the AI boom reached 220% year-over-year, and the total AI chip market could reach approximately $90 billion by 2027.
Technical analysis of the AVGO chart indicates the formation of a significant bullish gap:
→ In 2024, the price formed an ascending channel (shown in blue). Now it is near its upper boundary.
→ By measuring the width of the range between $139 and $185 to set a target for price movement following its bullish breakout, the level of $233 is obtained.
If the bullish momentum continues, the AVGO stock price could rise above the upper boundary of the ascending channel (as it did in mid-June), potentially reaching the specified target. Following this sharp increase, the price might correct, possibly moving toward the area of the bullish gap.
According to TipRanks, the average price target for AVGO shares is $229. However, given the information on anticipated future earnings released last Friday, these forecasts may be revised upwards.
Trade global index CFDs with zero commission and tight spreads. Open your FXOpen account now or learn more about trading index CFDs with FXOpen.
CFDs are complex instruments and come with a high risk of losing your money.
This article represents the opinion of the Companies operating under the FXOpen brand only. It is not to be construed as an offer, solicitation, or recommendation with respect to products and services provided by the Companies operating under the FXOpen brand, nor is it to be considered financial advice.
Broadcom Inc. (AVGO) Stock Price Soars Nearly 20%
The chart shows that at the end of last week, Broadcom Inc. (AVGO) stock price surged nearly 20%, breaking the psychological barrier of $200 per share and pushing the company’s market capitalisation to $1 trillion.
Last week, the company released its quarterly earnings report. The actual figures were close to analysts' forecasts — earnings per share of $1.42 vs $1.39 expected and fourth-quarter revenue of $14.05 billion vs $14.07 billion expected. However, the extraordinary rise in stock price was driven by a strong market reaction to the company's optimistic forecast, which is based on robust sales of chips designed for artificial intelligence (AI) applications.
Media reports highlight that the company’s revenue growth from the AI boom reached 220% year-over-year, and the total AI chip market could reach approximately $90 billion by 2027.
Technical analysis of the AVGO chart indicates the formation of a significant bullish gap:
→ In 2024, the price formed an ascending channel (shown in blue). Now it is near its upper boundary.
→ By measuring the width of the range between $139 and $185 to set a target for price movement following its bullish breakout, the level of $233 is obtained.
If the bullish momentum continues, the AVGO stock price could rise above the upper boundary of the ascending channel (as it did in mid-June), potentially reaching the specified target. Following this sharp increase, the price might correct, possibly moving toward the area of the bullish gap.
According to TipRanks, the average price target for AVGO shares is $229. However, given the information on anticipated future earnings released last Friday, these forecasts may be revised upwards.
Trade global index CFDs with zero commission and tight spreads. Open your FXOpen account now or learn more about trading index CFDs with FXOpen.
CFDs are complex instruments and come with a high risk of losing your money.
This article represents the opinion of the Companies operating under the FXOpen brand only. It is not to be construed as an offer, solicitation, or recommendation with respect to products and services provided by the Companies operating under the FXOpen brand, nor is it to be considered financial advice.
👍3
#marketanalysis #MarketNews #stockmarket #NASDAQ
Nasdaq 100 Reaches Record High
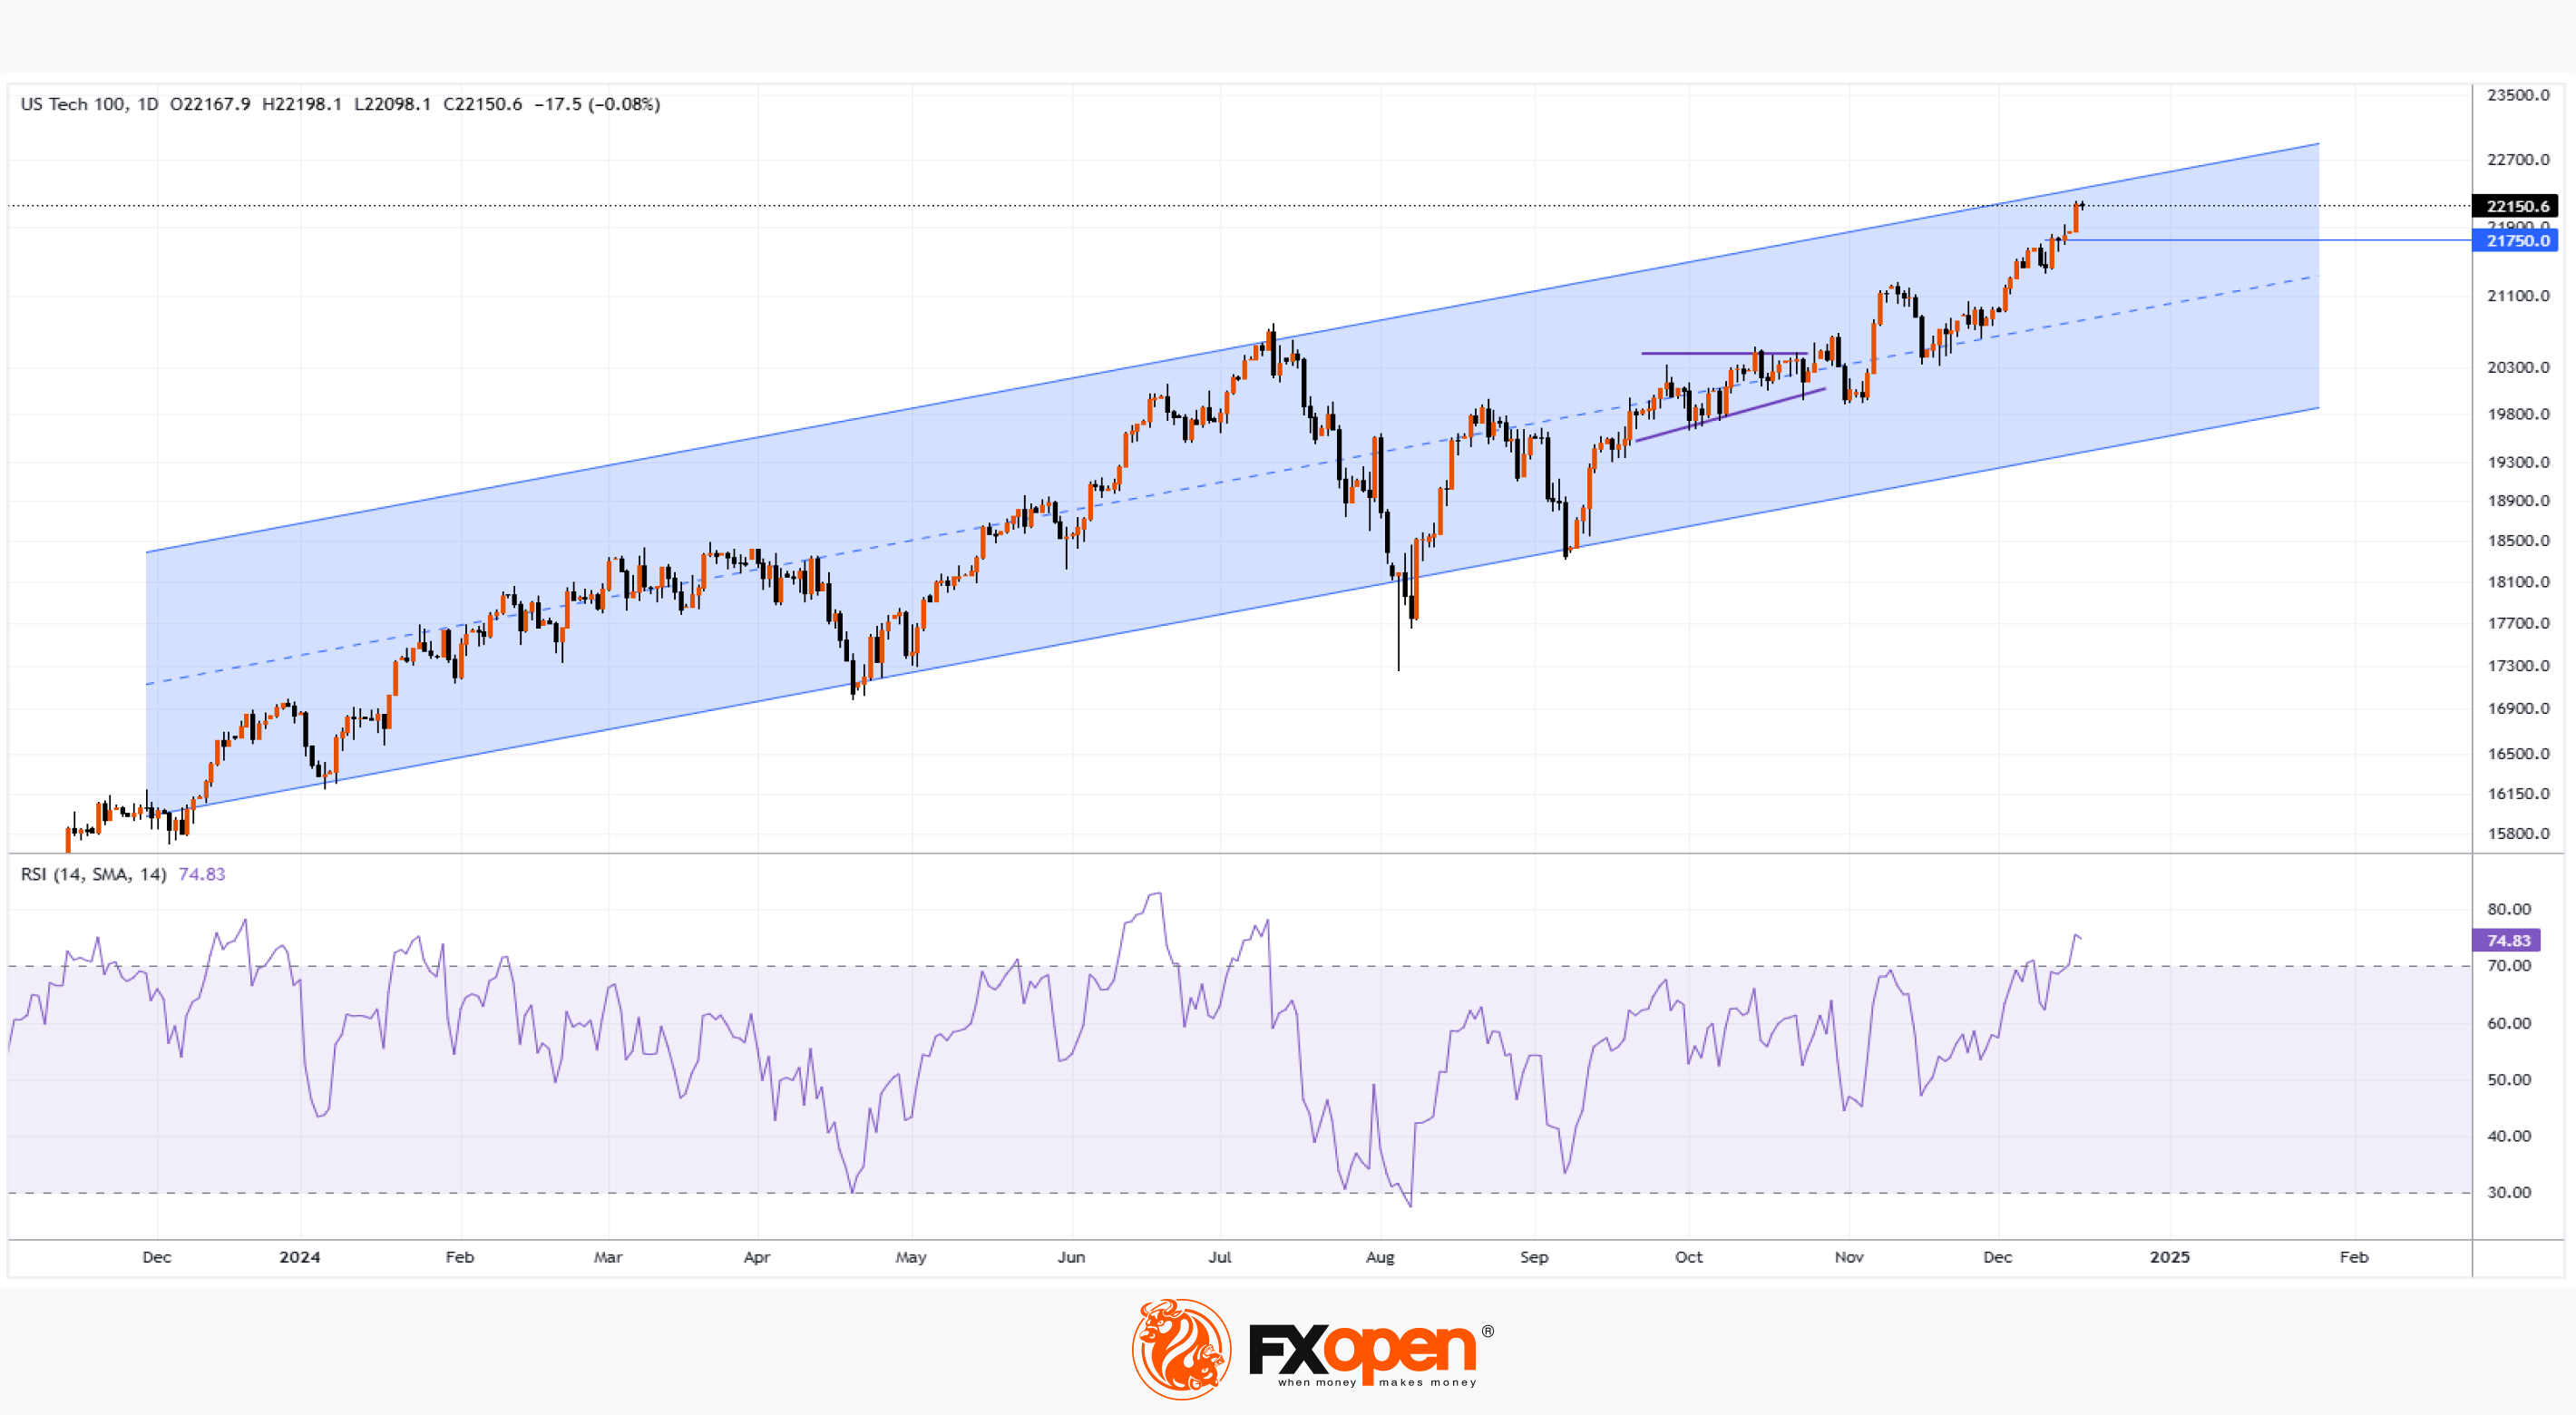
On 29th October, analysing the Nasdaq 100 (US Tech 100 mini on FXOpen) chart, we:
→ Drew a blue upward channel relevant for 2024.
→ Noted that the price was in a consolidation phase (indicated by narrowing purple lines) at the channel's median, suggesting a potential balance of supply and demand forces.
→ Warned that earnings season could trigger a volatility spike.
→ Suggested that the price was likely heading toward a new all-time high.
Since then:
→ Amid company earnings reports, we observed a volatility spike in November, which was further amplified by the release of US presidential election results.
→ The index achieved a new all-time high.
The Nasdaq 100 (US Tech 100 mini on FXOpen) chart shows that the index surpassed the $22,000 level for the first time yesterday. This was supported by positive trader sentiment ahead of tomorrow's Fed interest rate decision. According to Forex Factory, the rate will be cut by another 25 basis points (returning to the February 2023 level).
Meanwhile, the technical analysis of the Nasdaq 100 (US Tech 100 mini on FXOpen) reveals that:
→ The price has approached the upper boundary of the upward channel, which could serve as strong resistance.
→ Since early December, the index has risen by approximately 5.5%, and the RSI indicator has entered the overbought zone for the first time since July.
Under such conditions, bulls may struggle to continue the upward momentum, as more investors might look to lock in profits ahead of the holiday season. Additionally, the market's reaction to tomorrow's Fed interest rate release at 21:00 GMT+2 may play a key role.
Trade global index CFDs with zero commission and tight spreads. Open your FXOpen account now or learn more about trading index CFDs with FXOpen.
CFDs are complex instruments and come with a high risk of losing your money.
This article represents the opinion of the Companies operating under the FXOpen brand only. It is not to be construed as an offer, solicitation, or recommendation with respect to products and services provided by the Companies operating under the FXOpen brand, nor is it to be considered financial advice.
Nasdaq 100 Reaches Record High
On 29th October, analysing the Nasdaq 100 (US Tech 100 mini on FXOpen) chart, we:
→ Drew a blue upward channel relevant for 2024.
→ Noted that the price was in a consolidation phase (indicated by narrowing purple lines) at the channel's median, suggesting a potential balance of supply and demand forces.
→ Warned that earnings season could trigger a volatility spike.
→ Suggested that the price was likely heading toward a new all-time high.
Since then:
→ Amid company earnings reports, we observed a volatility spike in November, which was further amplified by the release of US presidential election results.
→ The index achieved a new all-time high.
The Nasdaq 100 (US Tech 100 mini on FXOpen) chart shows that the index surpassed the $22,000 level for the first time yesterday. This was supported by positive trader sentiment ahead of tomorrow's Fed interest rate decision. According to Forex Factory, the rate will be cut by another 25 basis points (returning to the February 2023 level).
Meanwhile, the technical analysis of the Nasdaq 100 (US Tech 100 mini on FXOpen) reveals that:
→ The price has approached the upper boundary of the upward channel, which could serve as strong resistance.
→ Since early December, the index has risen by approximately 5.5%, and the RSI indicator has entered the overbought zone for the first time since July.
Under such conditions, bulls may struggle to continue the upward momentum, as more investors might look to lock in profits ahead of the holiday season. Additionally, the market's reaction to tomorrow's Fed interest rate release at 21:00 GMT+2 may play a key role.
Trade global index CFDs with zero commission and tight spreads. Open your FXOpen account now or learn more about trading index CFDs with FXOpen.
CFDs are complex instruments and come with a high risk of losing your money.
This article represents the opinion of the Companies operating under the FXOpen brand only. It is not to be construed as an offer, solicitation, or recommendation with respect to products and services provided by the Companies operating under the FXOpen brand, nor is it to be considered financial advice.
👍2
#nvidia #NVDA #stockmarket #stocktrading
Nvidia (NVDA) Stock Price Falls to a Two-Month Low
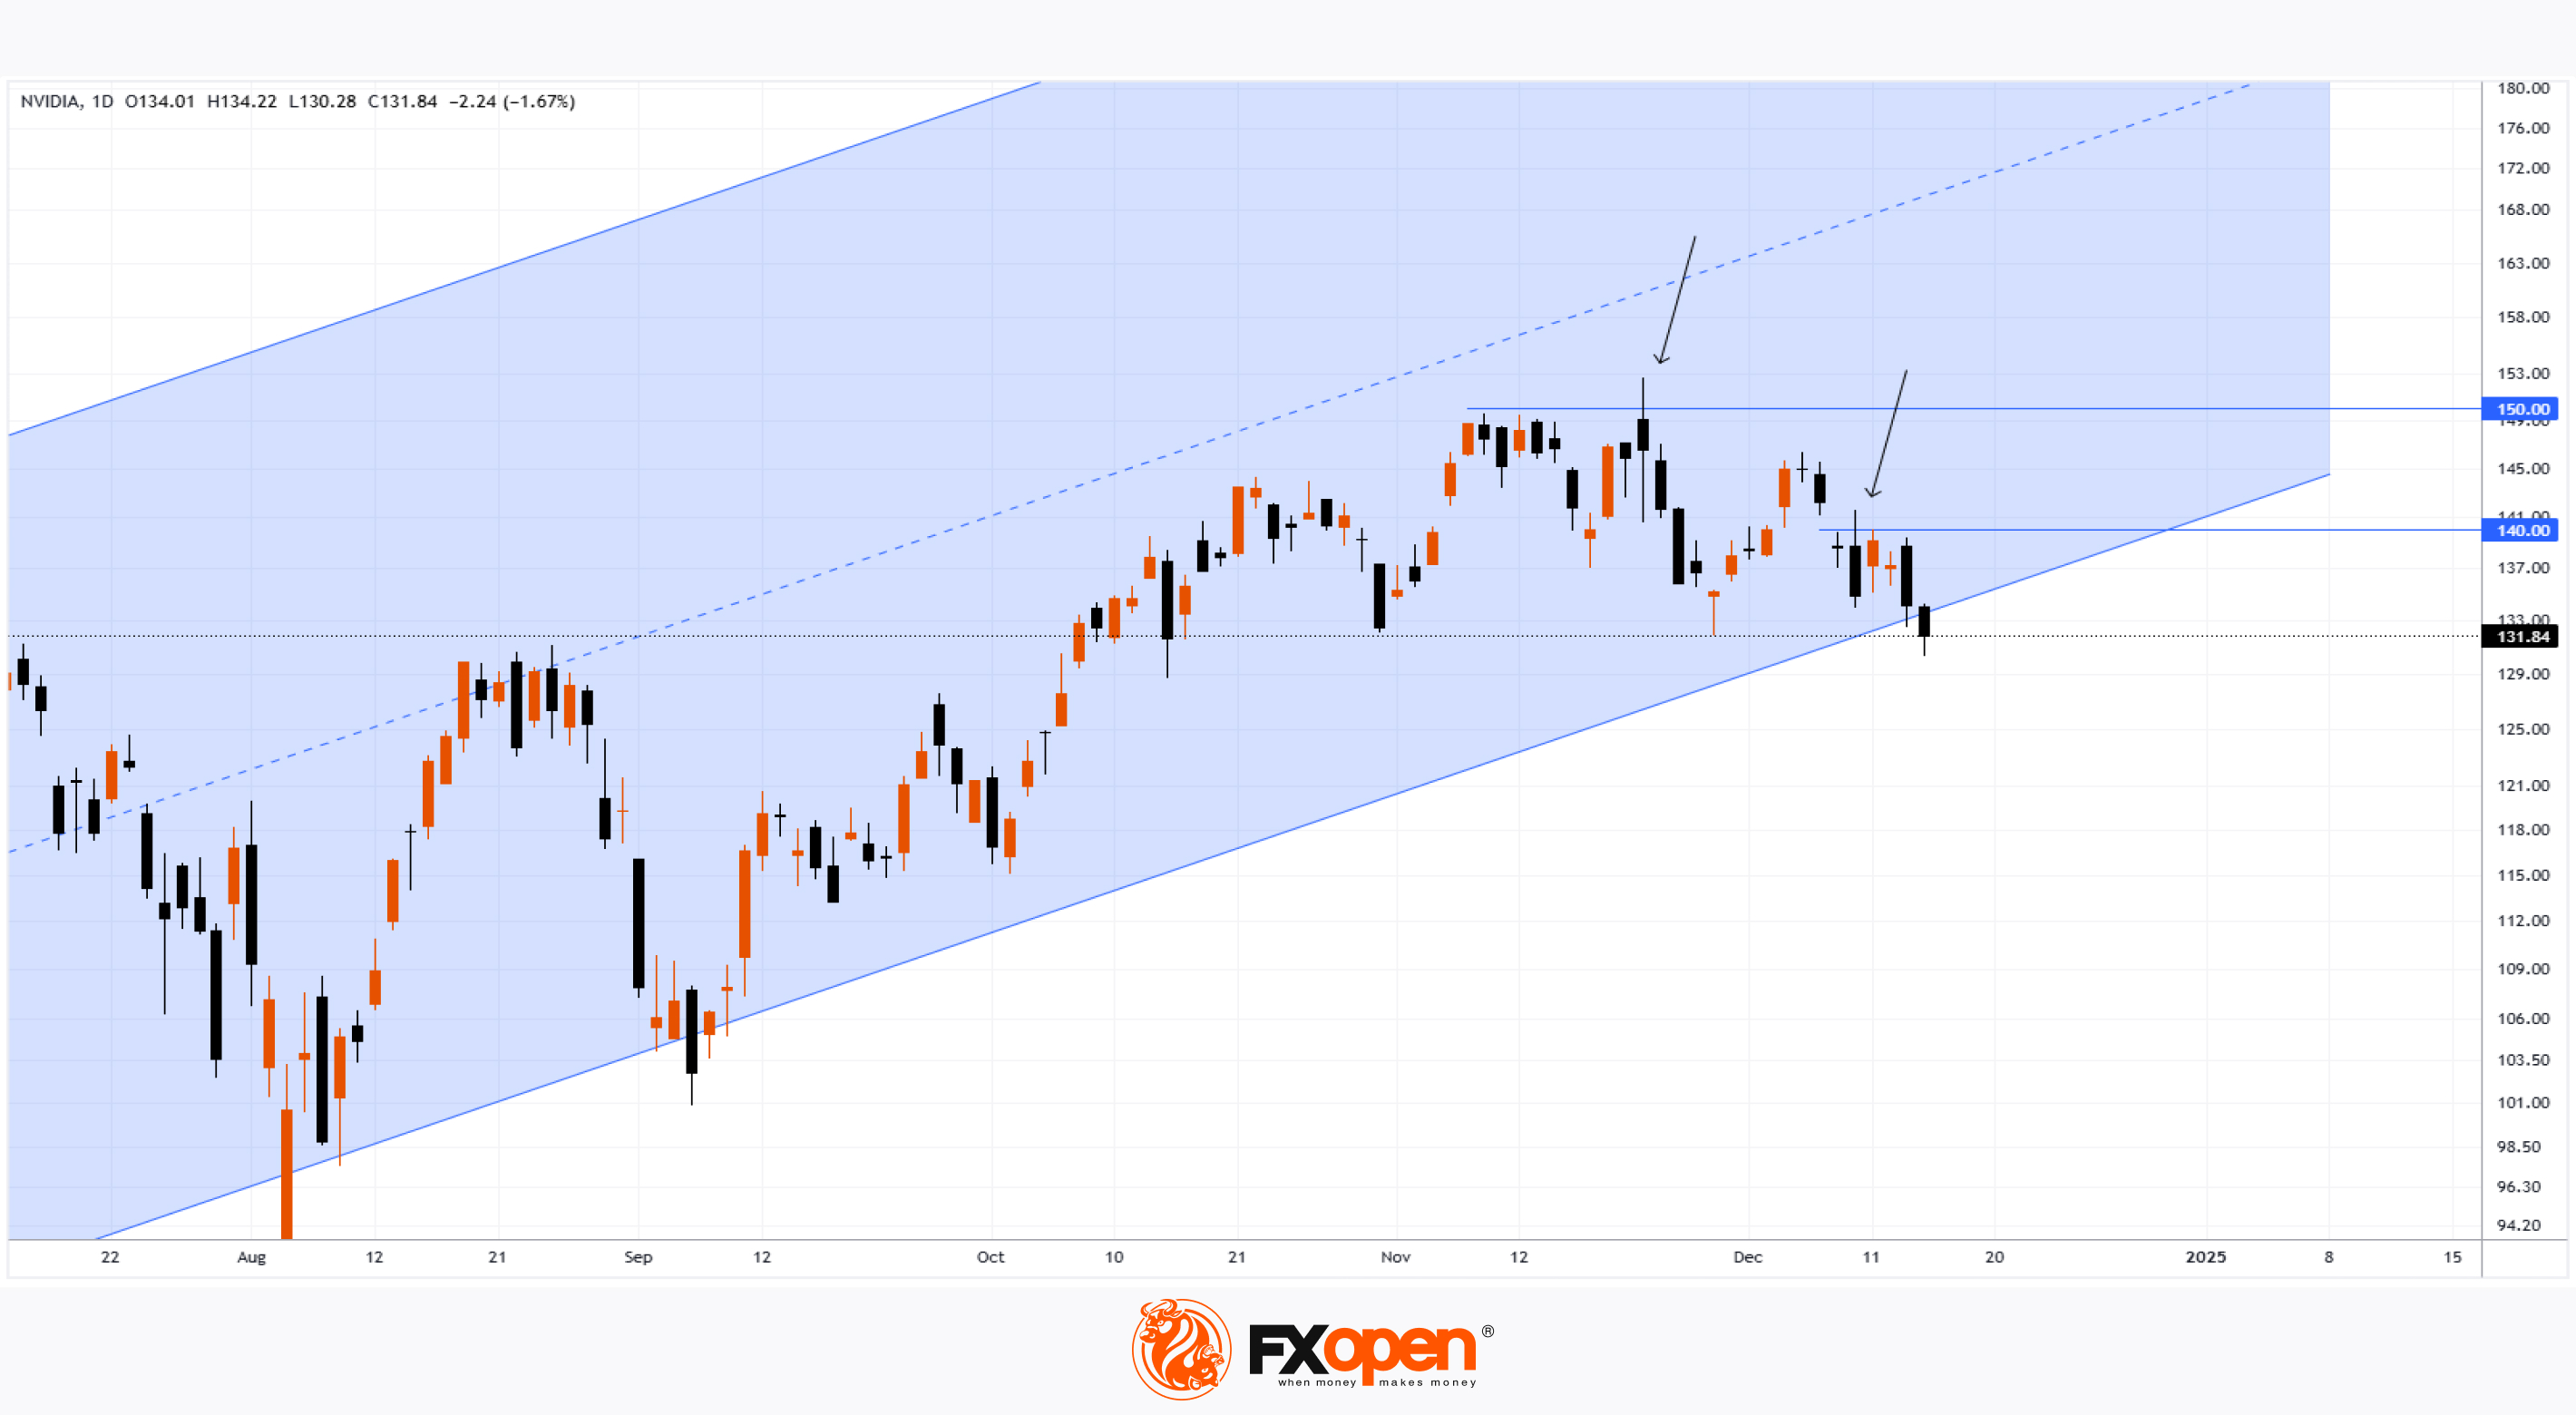
While the Nasdaq 100 index (US Tech 100 mini on FXOpen) climbed to an all-time high, Nvidia's (NVDA) stock price dropped below $131 during yesterday's trading session for the first time since mid-October. This bearish behaviour suggests a weakening of Nvidia's leading position. What is the reason?
A key driver could be the significant surge in Broadcom Inc. (AVGO) shares, a competitor to Nvidia. Following a roughly 20% price increase for AVGO in one day, another growth day followed, as we anticipated yesterday. As a result, amid Broadcom's strong forecast for 2025, AVGO shares have risen by 54% since early December, and investors may be reallocating their portfolios, selling NVDA and buying AVGO.
Technical analysis of Nvidia's (NVDA) stock chart reveals a concerning picture — bears may break the lower boundary of the blue channel, which has acted as support throughout 2024. Importantly, bears managed to push the price downwards both from the $150 level and the $140 level (indicated by arrows).
According to the Nasdaq exchange, NVDA's stock price in today's pre-market trading has fallen below $130. If this does not trigger demand for the stock of one of the leading companies in the AI boom, it will be another worrying signal.
According to TipRanks, analysts remain optimistic for now:
→ 37 out of 40 analysts recommend buying NVDA shares.
→ The average price target for NVDA is $177 within 12 months.
Trade global index CFDs with zero commission and tight spreads. Open your FXOpen account now or learn more about trading index CFDs with FXOpen.
CFDs are complex instruments and come with a high risk of losing your money.
This article represents the opinion of the Companies operating under the FXOpen brand only. It is not to be construed as an offer, solicitation, or recommendation with respect to products and services provided by the Companies operating under the FXOpen brand, nor is it to be considered financial advice.
Nvidia (NVDA) Stock Price Falls to a Two-Month Low
While the Nasdaq 100 index (US Tech 100 mini on FXOpen) climbed to an all-time high, Nvidia's (NVDA) stock price dropped below $131 during yesterday's trading session for the first time since mid-October. This bearish behaviour suggests a weakening of Nvidia's leading position. What is the reason?
A key driver could be the significant surge in Broadcom Inc. (AVGO) shares, a competitor to Nvidia. Following a roughly 20% price increase for AVGO in one day, another growth day followed, as we anticipated yesterday. As a result, amid Broadcom's strong forecast for 2025, AVGO shares have risen by 54% since early December, and investors may be reallocating their portfolios, selling NVDA and buying AVGO.
Technical analysis of Nvidia's (NVDA) stock chart reveals a concerning picture — bears may break the lower boundary of the blue channel, which has acted as support throughout 2024. Importantly, bears managed to push the price downwards both from the $150 level and the $140 level (indicated by arrows).
According to the Nasdaq exchange, NVDA's stock price in today's pre-market trading has fallen below $130. If this does not trigger demand for the stock of one of the leading companies in the AI boom, it will be another worrying signal.
According to TipRanks, analysts remain optimistic for now:
→ 37 out of 40 analysts recommend buying NVDA shares.
→ The average price target for NVDA is $177 within 12 months.
Trade global index CFDs with zero commission and tight spreads. Open your FXOpen account now or learn more about trading index CFDs with FXOpen.
CFDs are complex instruments and come with a high risk of losing your money.
This article represents the opinion of the Companies operating under the FXOpen brand only. It is not to be construed as an offer, solicitation, or recommendation with respect to products and services provided by the Companies operating under the FXOpen brand, nor is it to be considered financial advice.
👍3
#stockmarket #stocktrading #AMZN #marketanalysis
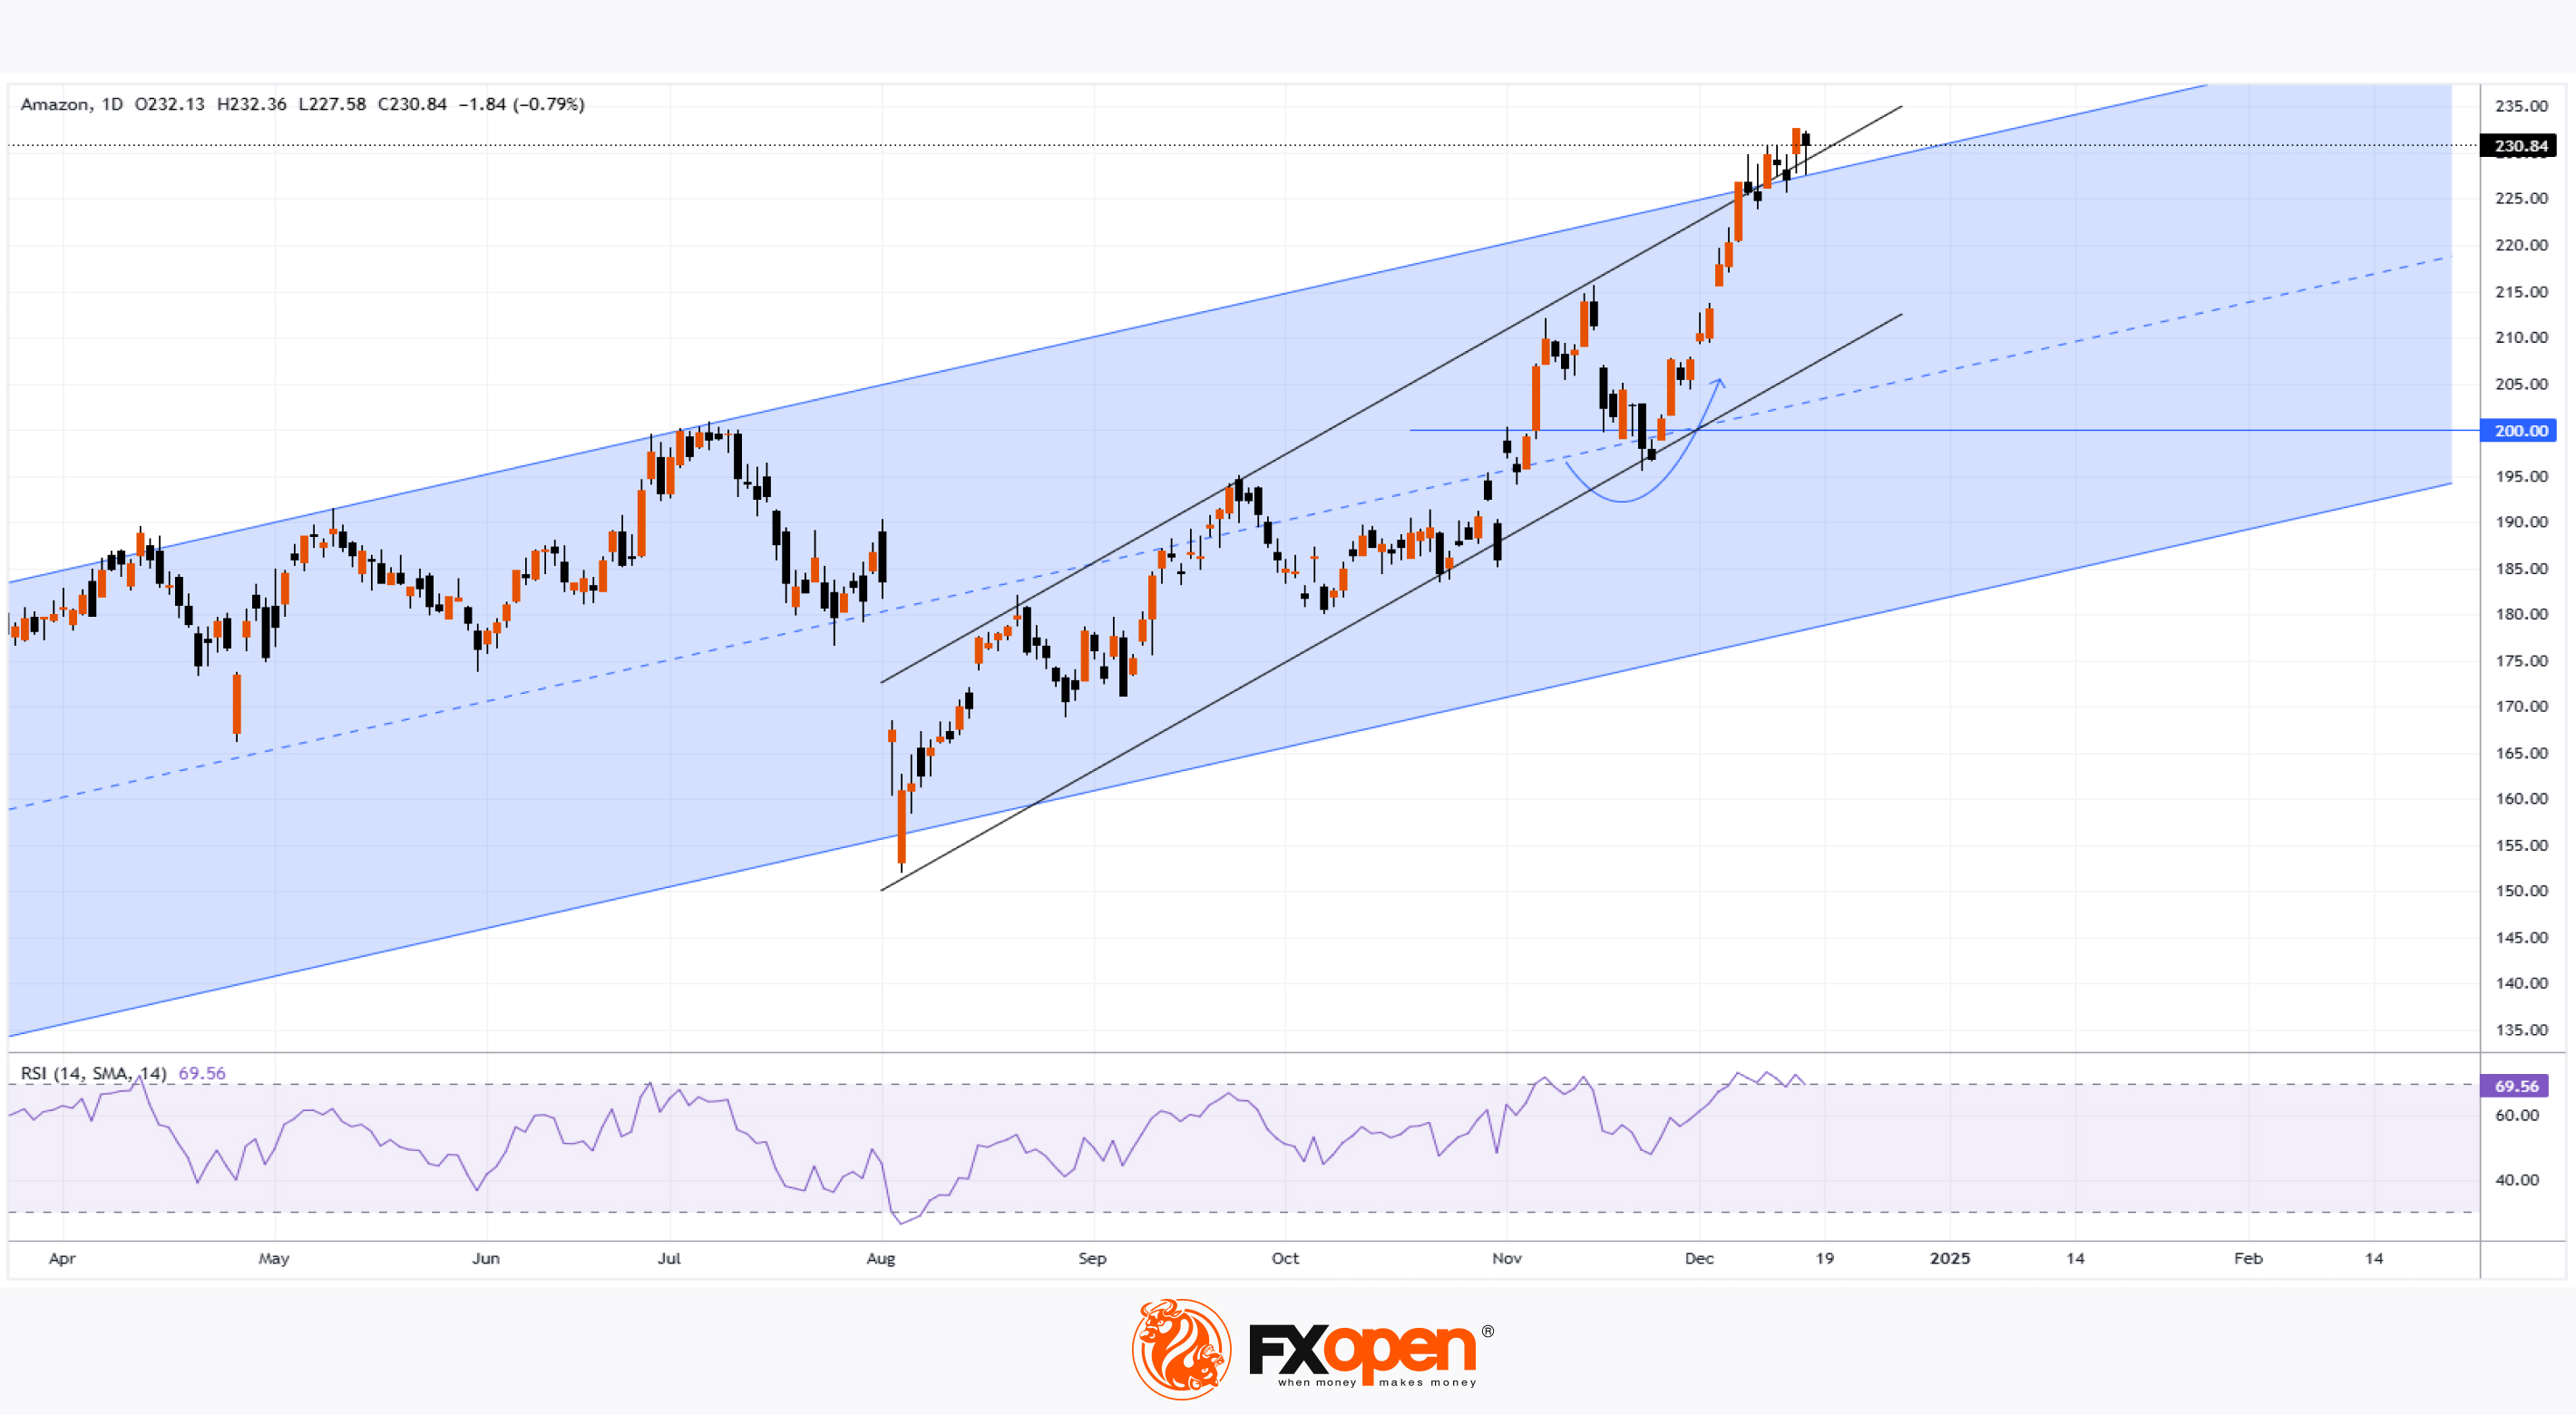
Amazon (AMZN) Stock Price Surpassed $230 for the First Time
On 12th November, while analysing Amazon (AMZN) stock chart, we:
→ drew two ascending channels (a long-term one marked in blue and a steeper one represented by black lines);
→ anticipated a test of the $200 level as part of a correction.
According to the AMZN chart, since then:
→ the price corrected with a test of the $200 level (indicated by an arrow), aided by the median line of the blue channel;
→ it continued to climb within the mentioned channels, reaching a new all-time high — this week, the price hit $233.
Positive market sentiment is driven, among other factors, by:
→ Amazon's strong earnings report for the previous quarter;
→ expectations of a Federal Reserve rate cut, which helped the Nasdaq 100 index reach a new record, as we reported yesterday.
Can the price continue rising?
Technical analysis of Amazon’s stock chart today suggests this might be challenging because:
→ the price is near the resistance lines of both channels;
→ the RSI indicator is in the overbought zone, and you can spot a bearish divergence forming (a sign of weakening buyer momentum).
Given these arguments, the price could undergo a correction. If so, it might drop to the lower boundary of the short-term black channel.
According to TipRanks:
→ 45 out of 46 surveyed Wall Street analysts recommend buying AMZN stock;
→ on average, they predict AMZN’s price will reach $244 within 12 months.
Trade global index CFDs with zero commission and tight spreads. Open your FXOpen account now or learn more about trading index CFDs with FXOpen.
CFDs are complex instruments and come with a high risk of losing your money.
This article represents the opinion of the Companies operating under the FXOpen brand only. It is not to be construed as an offer, solicitation, or recommendation with respect to products and services provided by the Companies operating under the FXOpen brand, nor is it to be considered financial advice.
Amazon (AMZN) Stock Price Surpassed $230 for the First Time
On 12th November, while analysing Amazon (AMZN) stock chart, we:
→ drew two ascending channels (a long-term one marked in blue and a steeper one represented by black lines);
→ anticipated a test of the $200 level as part of a correction.
According to the AMZN chart, since then:
→ the price corrected with a test of the $200 level (indicated by an arrow), aided by the median line of the blue channel;
→ it continued to climb within the mentioned channels, reaching a new all-time high — this week, the price hit $233.
Positive market sentiment is driven, among other factors, by:
→ Amazon's strong earnings report for the previous quarter;
→ expectations of a Federal Reserve rate cut, which helped the Nasdaq 100 index reach a new record, as we reported yesterday.
Can the price continue rising?
Technical analysis of Amazon’s stock chart today suggests this might be challenging because:
→ the price is near the resistance lines of both channels;
→ the RSI indicator is in the overbought zone, and you can spot a bearish divergence forming (a sign of weakening buyer momentum).
Given these arguments, the price could undergo a correction. If so, it might drop to the lower boundary of the short-term black channel.
According to TipRanks:
→ 45 out of 46 surveyed Wall Street analysts recommend buying AMZN stock;
→ on average, they predict AMZN’s price will reach $244 within 12 months.
Trade global index CFDs with zero commission and tight spreads. Open your FXOpen account now or learn more about trading index CFDs with FXOpen.
CFDs are complex instruments and come with a high risk of losing your money.
This article represents the opinion of the Companies operating under the FXOpen brand only. It is not to be construed as an offer, solicitation, or recommendation with respect to products and services provided by the Companies operating under the FXOpen brand, nor is it to be considered financial advice.
👍2
#marketanalysis #MarketNews #tradingforex #EURUSD
Forex Traders Await the Fed's Decision
The Federal Reserve is set to announce its interest rate decision today at 21:00 GMT+2, with Fed Chair Jerome Powell holding a press conference 30 minutes later. According to Forex Factory, the market expects a rate cut to 4.25%-4.50% from the current 4.50%-4.75%.
Analysts at Apollo Global Management, in their Economic Outlook, predict:
→ In 2025, the Fed will continue lowering rates but at a slower pace than the market anticipates;
→ By the end of 2025, the rate is expected to settle at 4.0%.
In anticipation of today's decision, the currency markets are experiencing a period of calm.
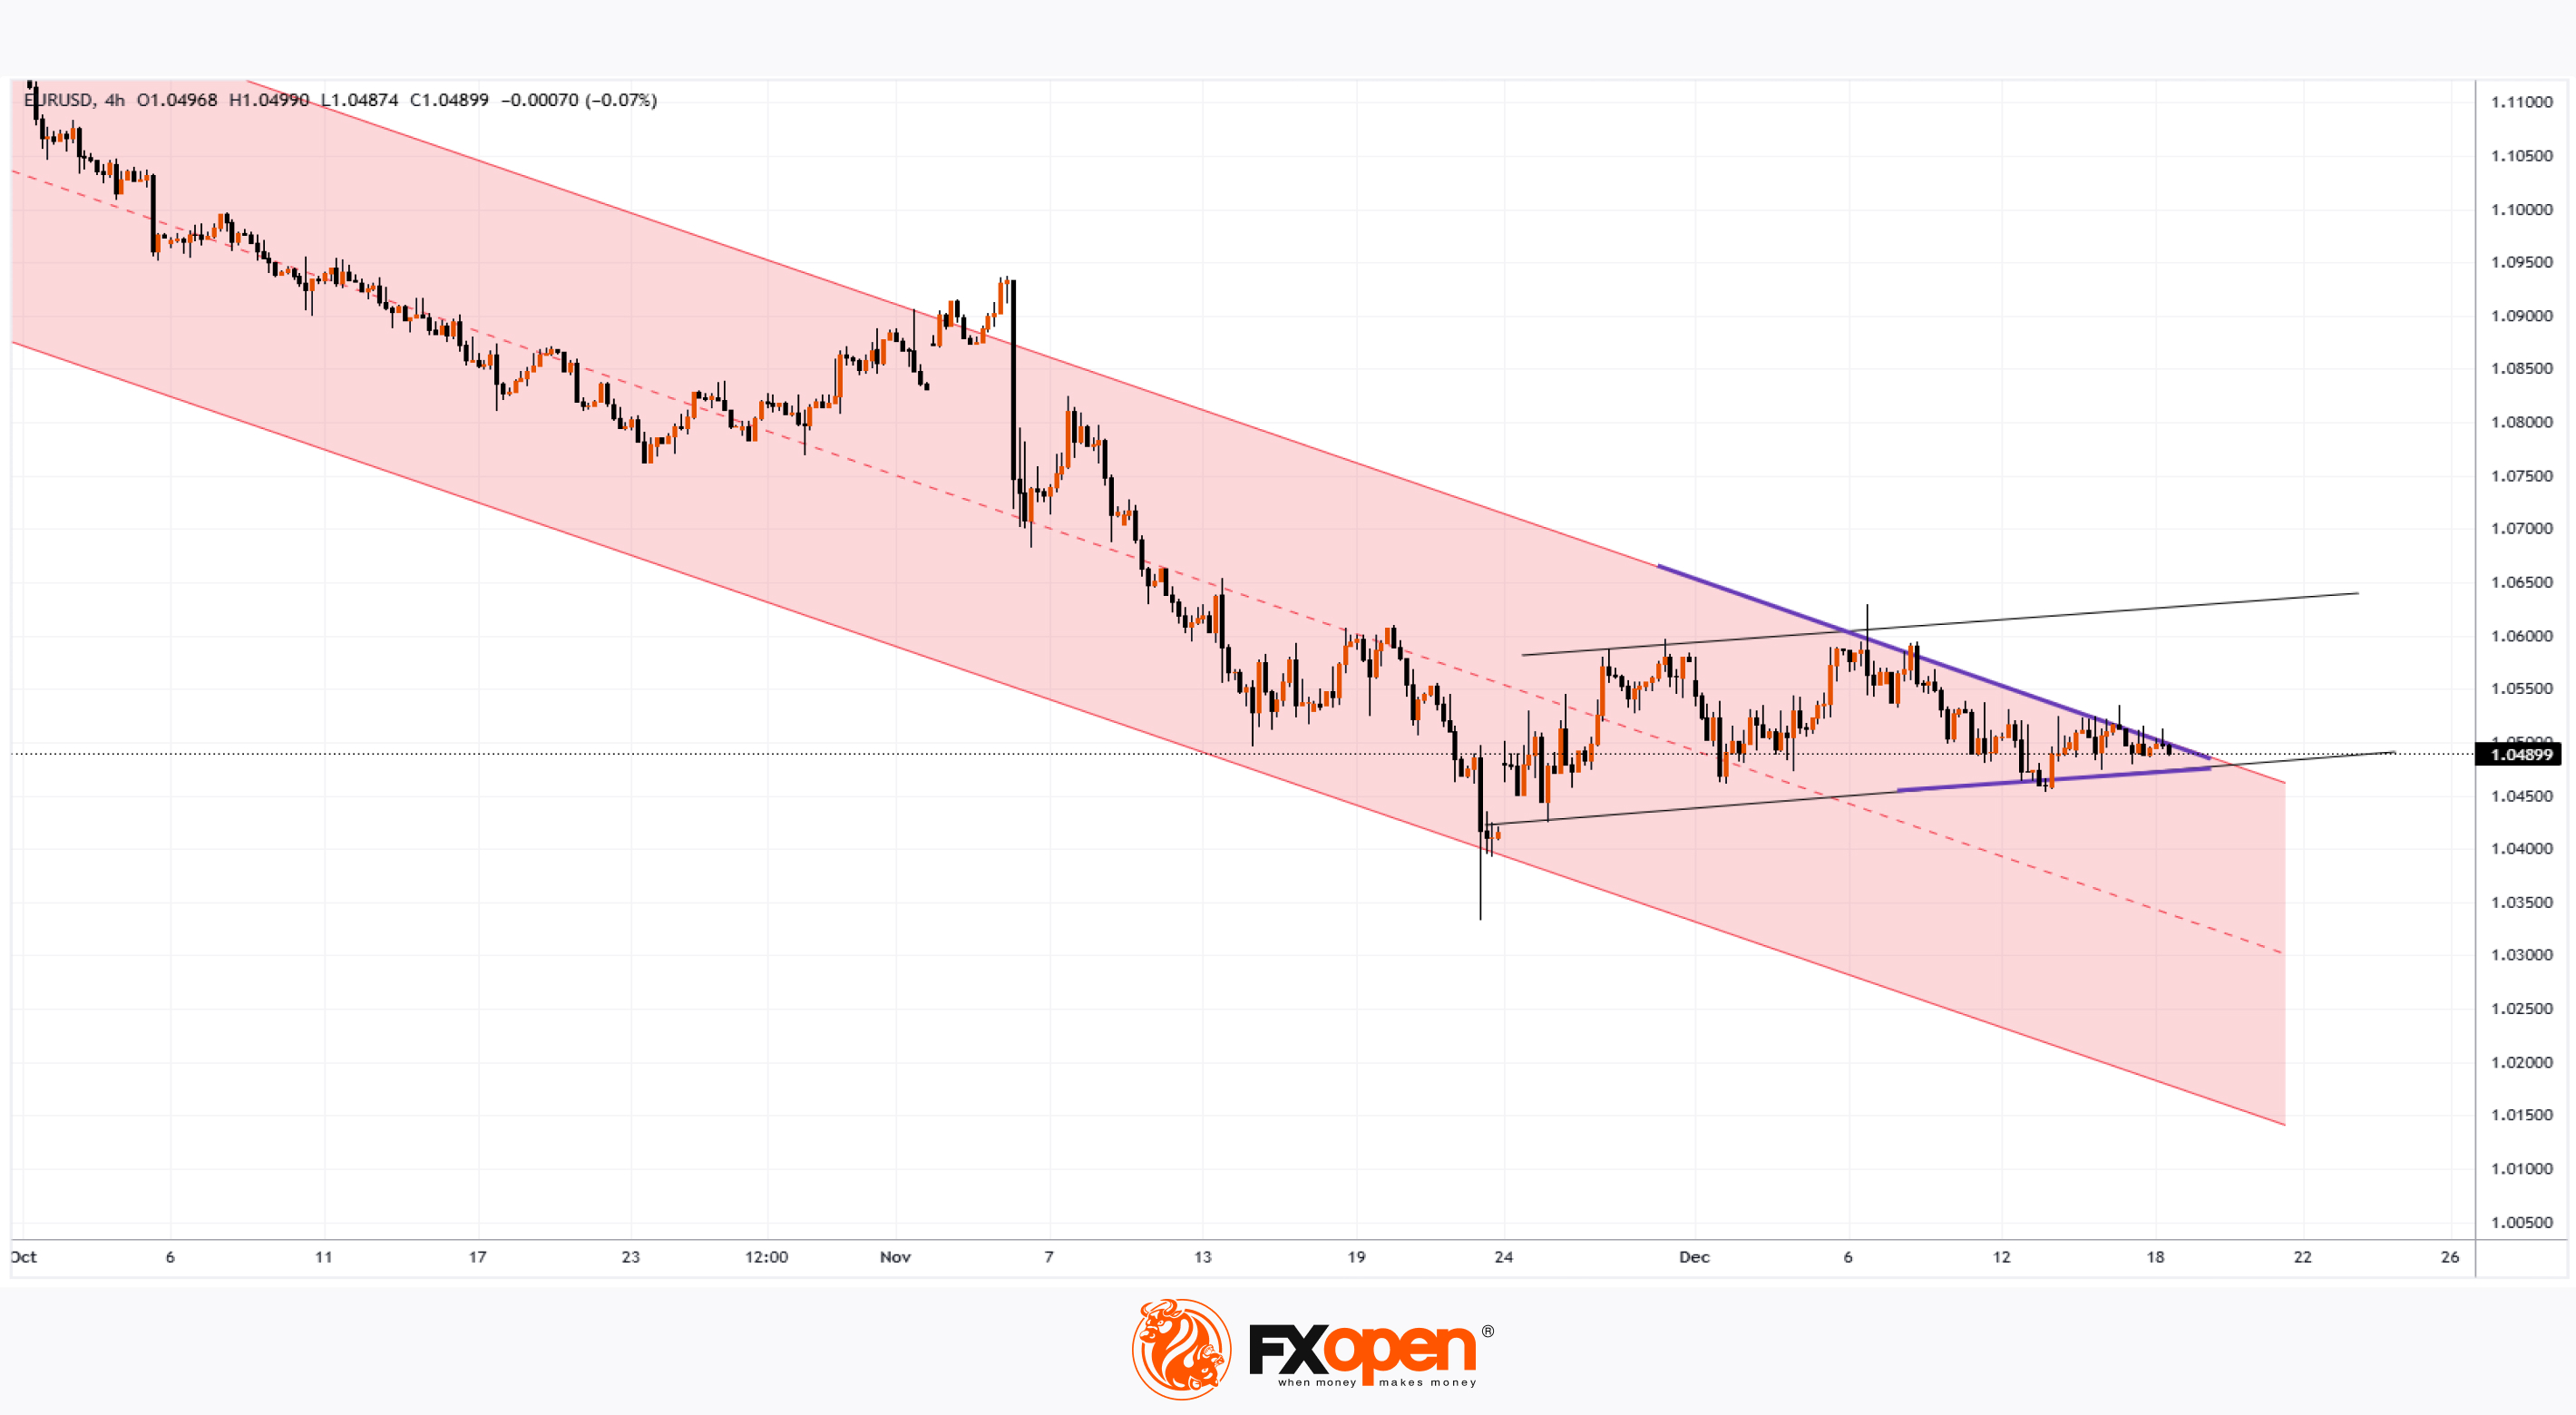
The technical analysis of the EUR/USD chart shows that the pair consolidates between the upper boundary of a descending channel and the lower black support line, forming a narrowing triangle pattern (highlighted in purple).
Today's Fed meeting could trigger a surge in volatility, potentially driving sharp movements in USD pairs. For EUR/USD, opposite scenarios are possible:
→ An upward movement with a bullish breakout of the upper boundary of the long-term descending channel;
→ Continuation of the downtrend with a breakout below the lower black support line.
Trade over 50 forex markets 24 hours a day with FXOpen. Take advantage of low commissions, deep liquidity, and spreads from 0.0 pips. Open your FXOpen account now or learn more about trading forex with FXOpen.
CFDs are complex instruments and come with a high risk of losing your money.
This article represents the opinion of the Companies operating under the FXOpen brand only. It is not to be construed as an offer, solicitation, or recommendation with respect to products and services provided by the Companies operating under the FXOpen brand, nor is it to be considered financial advice.
Forex Traders Await the Fed's Decision
The Federal Reserve is set to announce its interest rate decision today at 21:00 GMT+2, with Fed Chair Jerome Powell holding a press conference 30 minutes later. According to Forex Factory, the market expects a rate cut to 4.25%-4.50% from the current 4.50%-4.75%.
Analysts at Apollo Global Management, in their Economic Outlook, predict:
→ In 2025, the Fed will continue lowering rates but at a slower pace than the market anticipates;
→ By the end of 2025, the rate is expected to settle at 4.0%.
In anticipation of today's decision, the currency markets are experiencing a period of calm.
The technical analysis of the EUR/USD chart shows that the pair consolidates between the upper boundary of a descending channel and the lower black support line, forming a narrowing triangle pattern (highlighted in purple).
Today's Fed meeting could trigger a surge in volatility, potentially driving sharp movements in USD pairs. For EUR/USD, opposite scenarios are possible:
→ An upward movement with a bullish breakout of the upper boundary of the long-term descending channel;
→ Continuation of the downtrend with a breakout below the lower black support line.
Trade over 50 forex markets 24 hours a day with FXOpen. Take advantage of low commissions, deep liquidity, and spreads from 0.0 pips. Open your FXOpen account now or learn more about trading forex with FXOpen.
CFDs are complex instruments and come with a high risk of losing your money.
This article represents the opinion of the Companies operating under the FXOpen brand only. It is not to be construed as an offer, solicitation, or recommendation with respect to products and services provided by the Companies operating under the FXOpen brand, nor is it to be considered financial advice.
👍2
#NASDAQ #stockmarket #stocktrading #MarketNews
Nasdaq 100 Index Plummets After Fed Decision
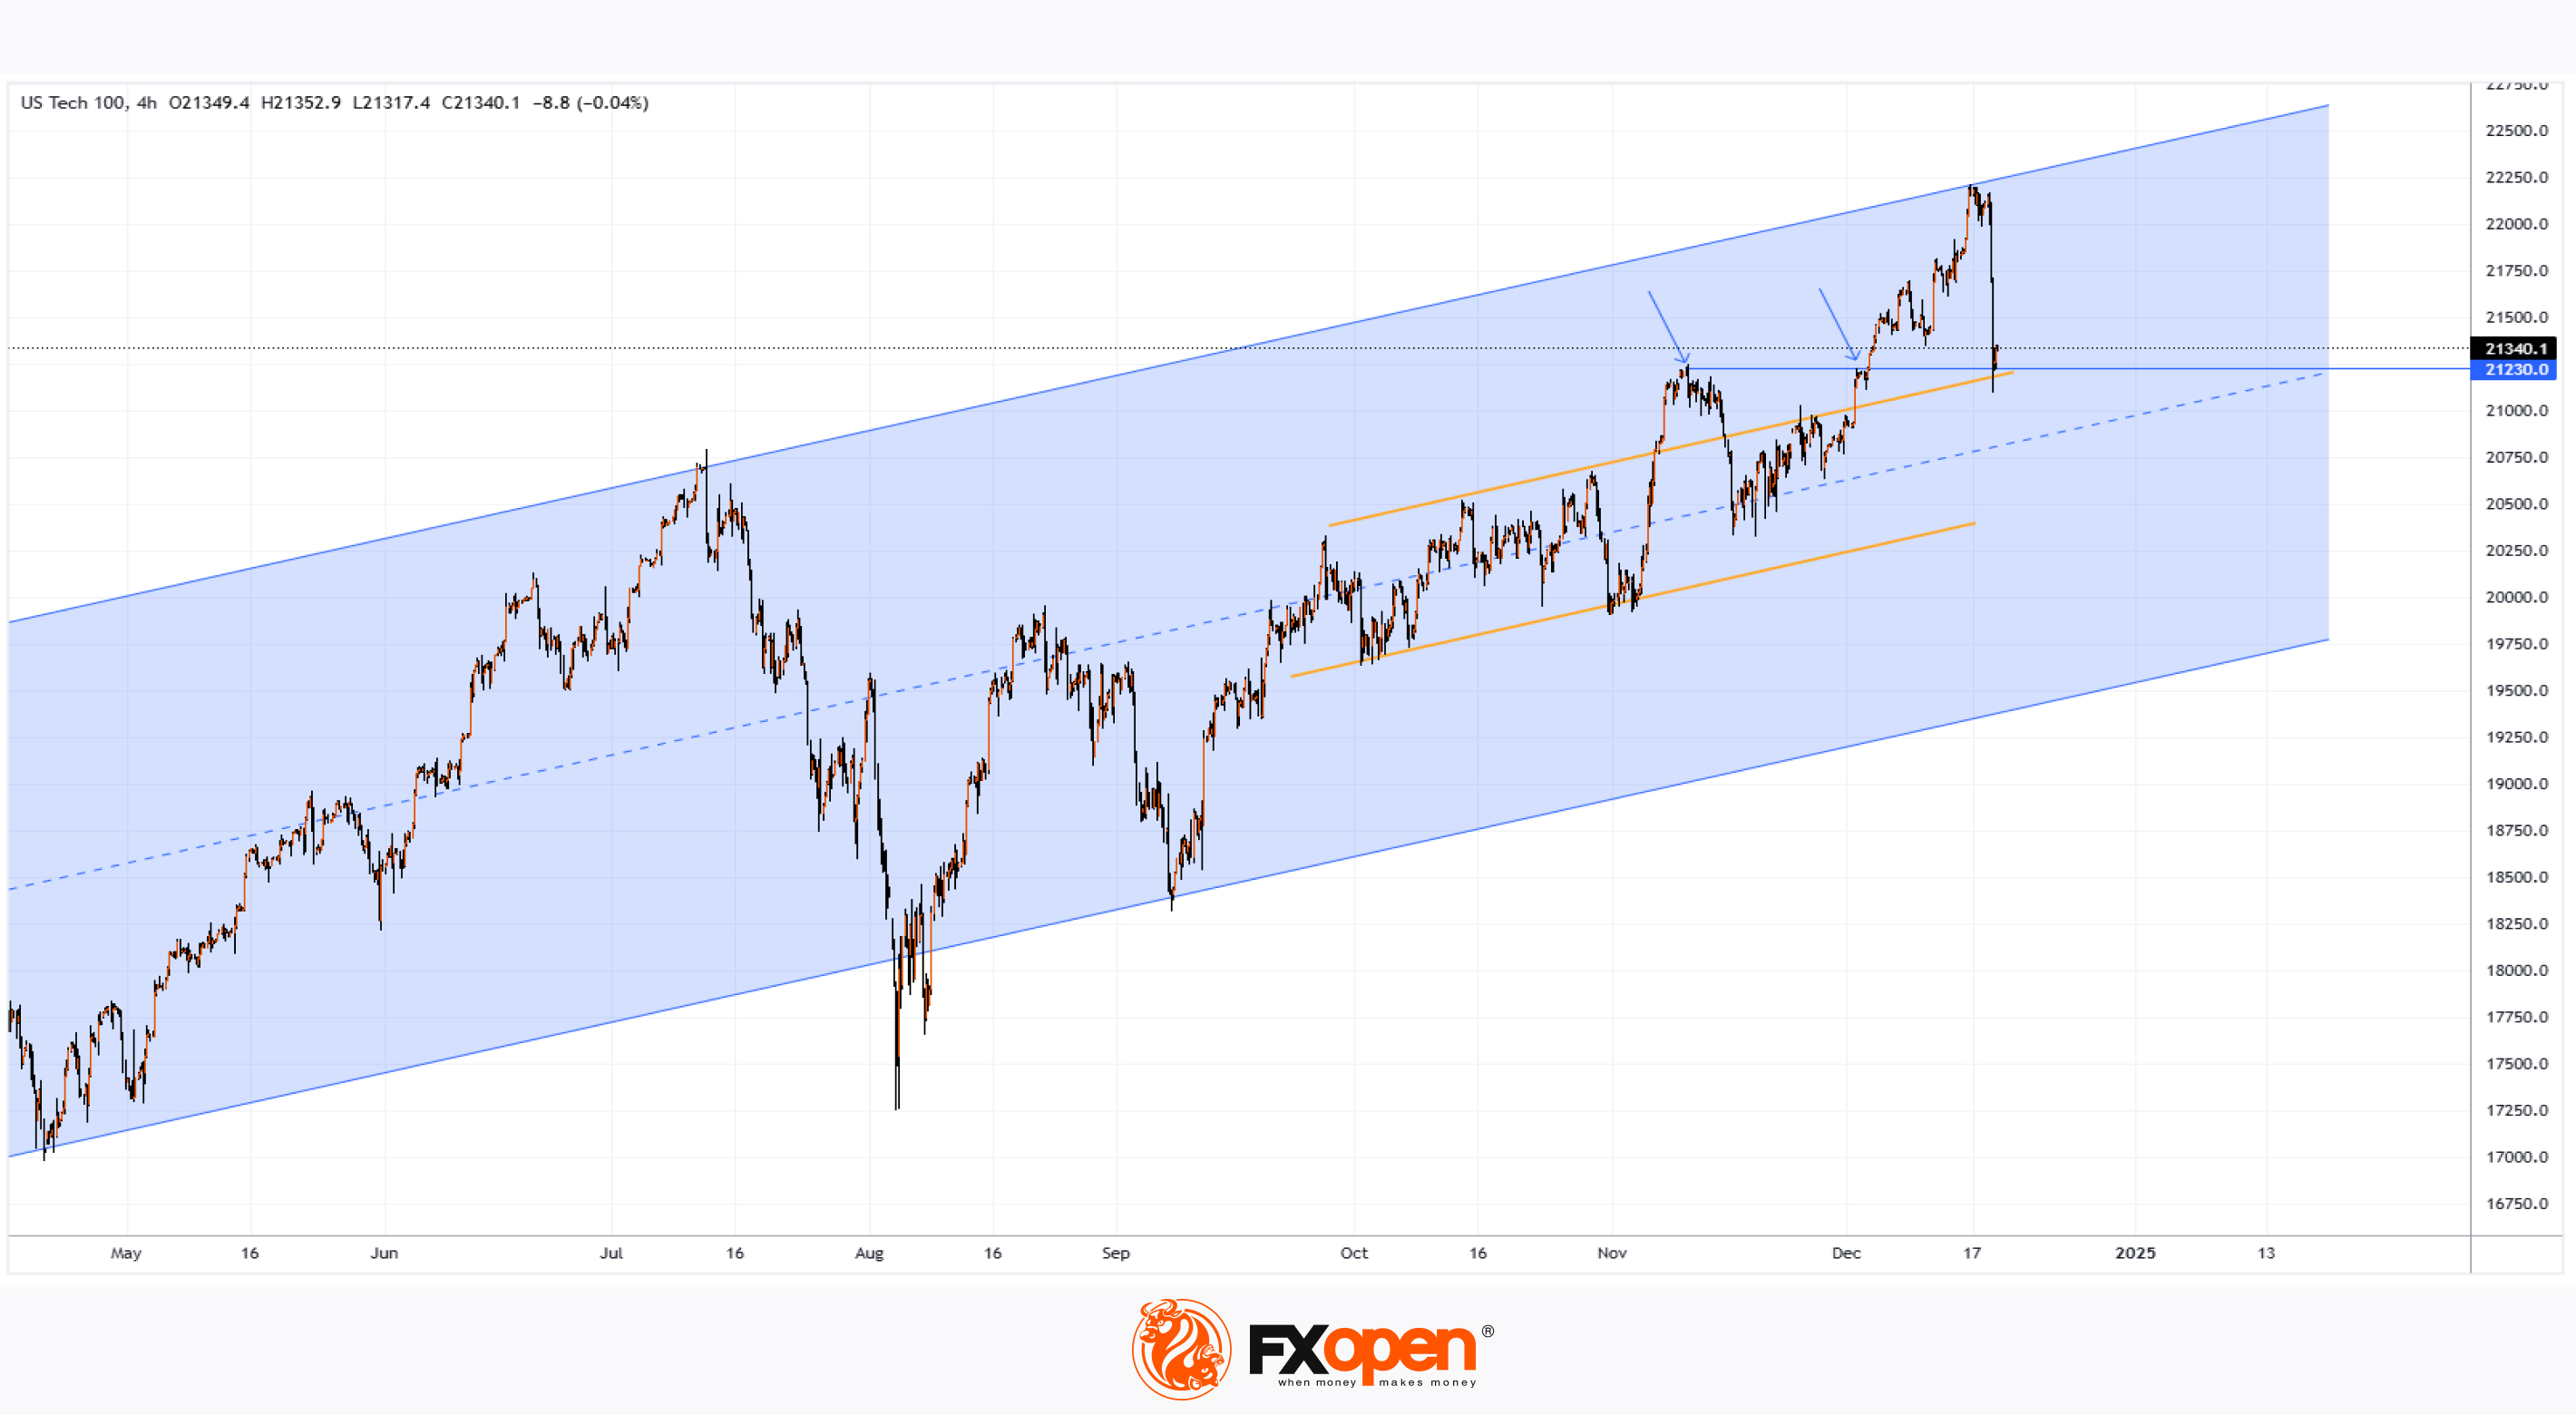
On 17th December, analysing the Nasdaq 100 chart (US Tech 100 mini on FXOpen), we:
→ Drew a blue upward channel relevant for 2024;
→ Noted that the price was near the upper boundary of the channel, while the RSI indicator had entered the overbought zone;
→ Suggested that bulls might face difficulties in pushing the price to a new all-time high.
Yesterday, the Fed cut the interest rate by 0.25%. Although it was anticipated, the market reaction was sharply negative. The Nasdaq 100 (US Tech 100 mini on FXOpen) dropped by approximately 4%.
The steep market reaction was driven by Fed Chair Jerome Powell’s comments during the press conference, where he stated that the FOMC plans to cut rates only twice in 2025, contrary to market expectations of four cuts.
Technical analysis of the Nasdaq 100 (US Tech 100 mini on FXOpen) chart shows that:
→ The price remains in the upper half of the channel, supported by the 21,230 level, which previously acted as resistance (as indicated by arrows).
→ We can assume that the area around the median of the blue channel (marked by orange lines) could act as a barrier to further downward momentum, as medians often serve as equilibrium zones where supply and demand balance out.
What’s next? According to analysts at Zacks, record highs for the tech stock index may not be a topic of discussion in the near future.
There is a possibility that a local descending channel could form, potentially driving the price into the lower half of the broader upward channel.
Trade global index CFDs with zero commission and tight spreads. Open your FXOpen account now or learn more about trading index CFDs with FXOpen.
CFDs are complex instruments and come with a high risk of losing your money.
This article represents the opinion of the Companies operating under the FXOpen brand only. It is not to be construed as an offer, solicitation, or recommendation with respect to products and services provided by the Companies operating under the FXOpen brand, nor is it to be considered financial advice.
Nasdaq 100 Index Plummets After Fed Decision
On 17th December, analysing the Nasdaq 100 chart (US Tech 100 mini on FXOpen), we:
→ Drew a blue upward channel relevant for 2024;
→ Noted that the price was near the upper boundary of the channel, while the RSI indicator had entered the overbought zone;
→ Suggested that bulls might face difficulties in pushing the price to a new all-time high.
Yesterday, the Fed cut the interest rate by 0.25%. Although it was anticipated, the market reaction was sharply negative. The Nasdaq 100 (US Tech 100 mini on FXOpen) dropped by approximately 4%.
The steep market reaction was driven by Fed Chair Jerome Powell’s comments during the press conference, where he stated that the FOMC plans to cut rates only twice in 2025, contrary to market expectations of four cuts.
Technical analysis of the Nasdaq 100 (US Tech 100 mini on FXOpen) chart shows that:
→ The price remains in the upper half of the channel, supported by the 21,230 level, which previously acted as resistance (as indicated by arrows).
→ We can assume that the area around the median of the blue channel (marked by orange lines) could act as a barrier to further downward momentum, as medians often serve as equilibrium zones where supply and demand balance out.
What’s next? According to analysts at Zacks, record highs for the tech stock index may not be a topic of discussion in the near future.
There is a possibility that a local descending channel could form, potentially driving the price into the lower half of the broader upward channel.
Trade global index CFDs with zero commission and tight spreads. Open your FXOpen account now or learn more about trading index CFDs with FXOpen.
CFDs are complex instruments and come with a high risk of losing your money.
This article represents the opinion of the Companies operating under the FXOpen brand only. It is not to be construed as an offer, solicitation, or recommendation with respect to products and services provided by the Companies operating under the FXOpen brand, nor is it to be considered financial advice.
👍2
#USDJPY #forextrading #tradingtips #marketanalysis
USD/JPY Rises to a Nearly 5-Month High
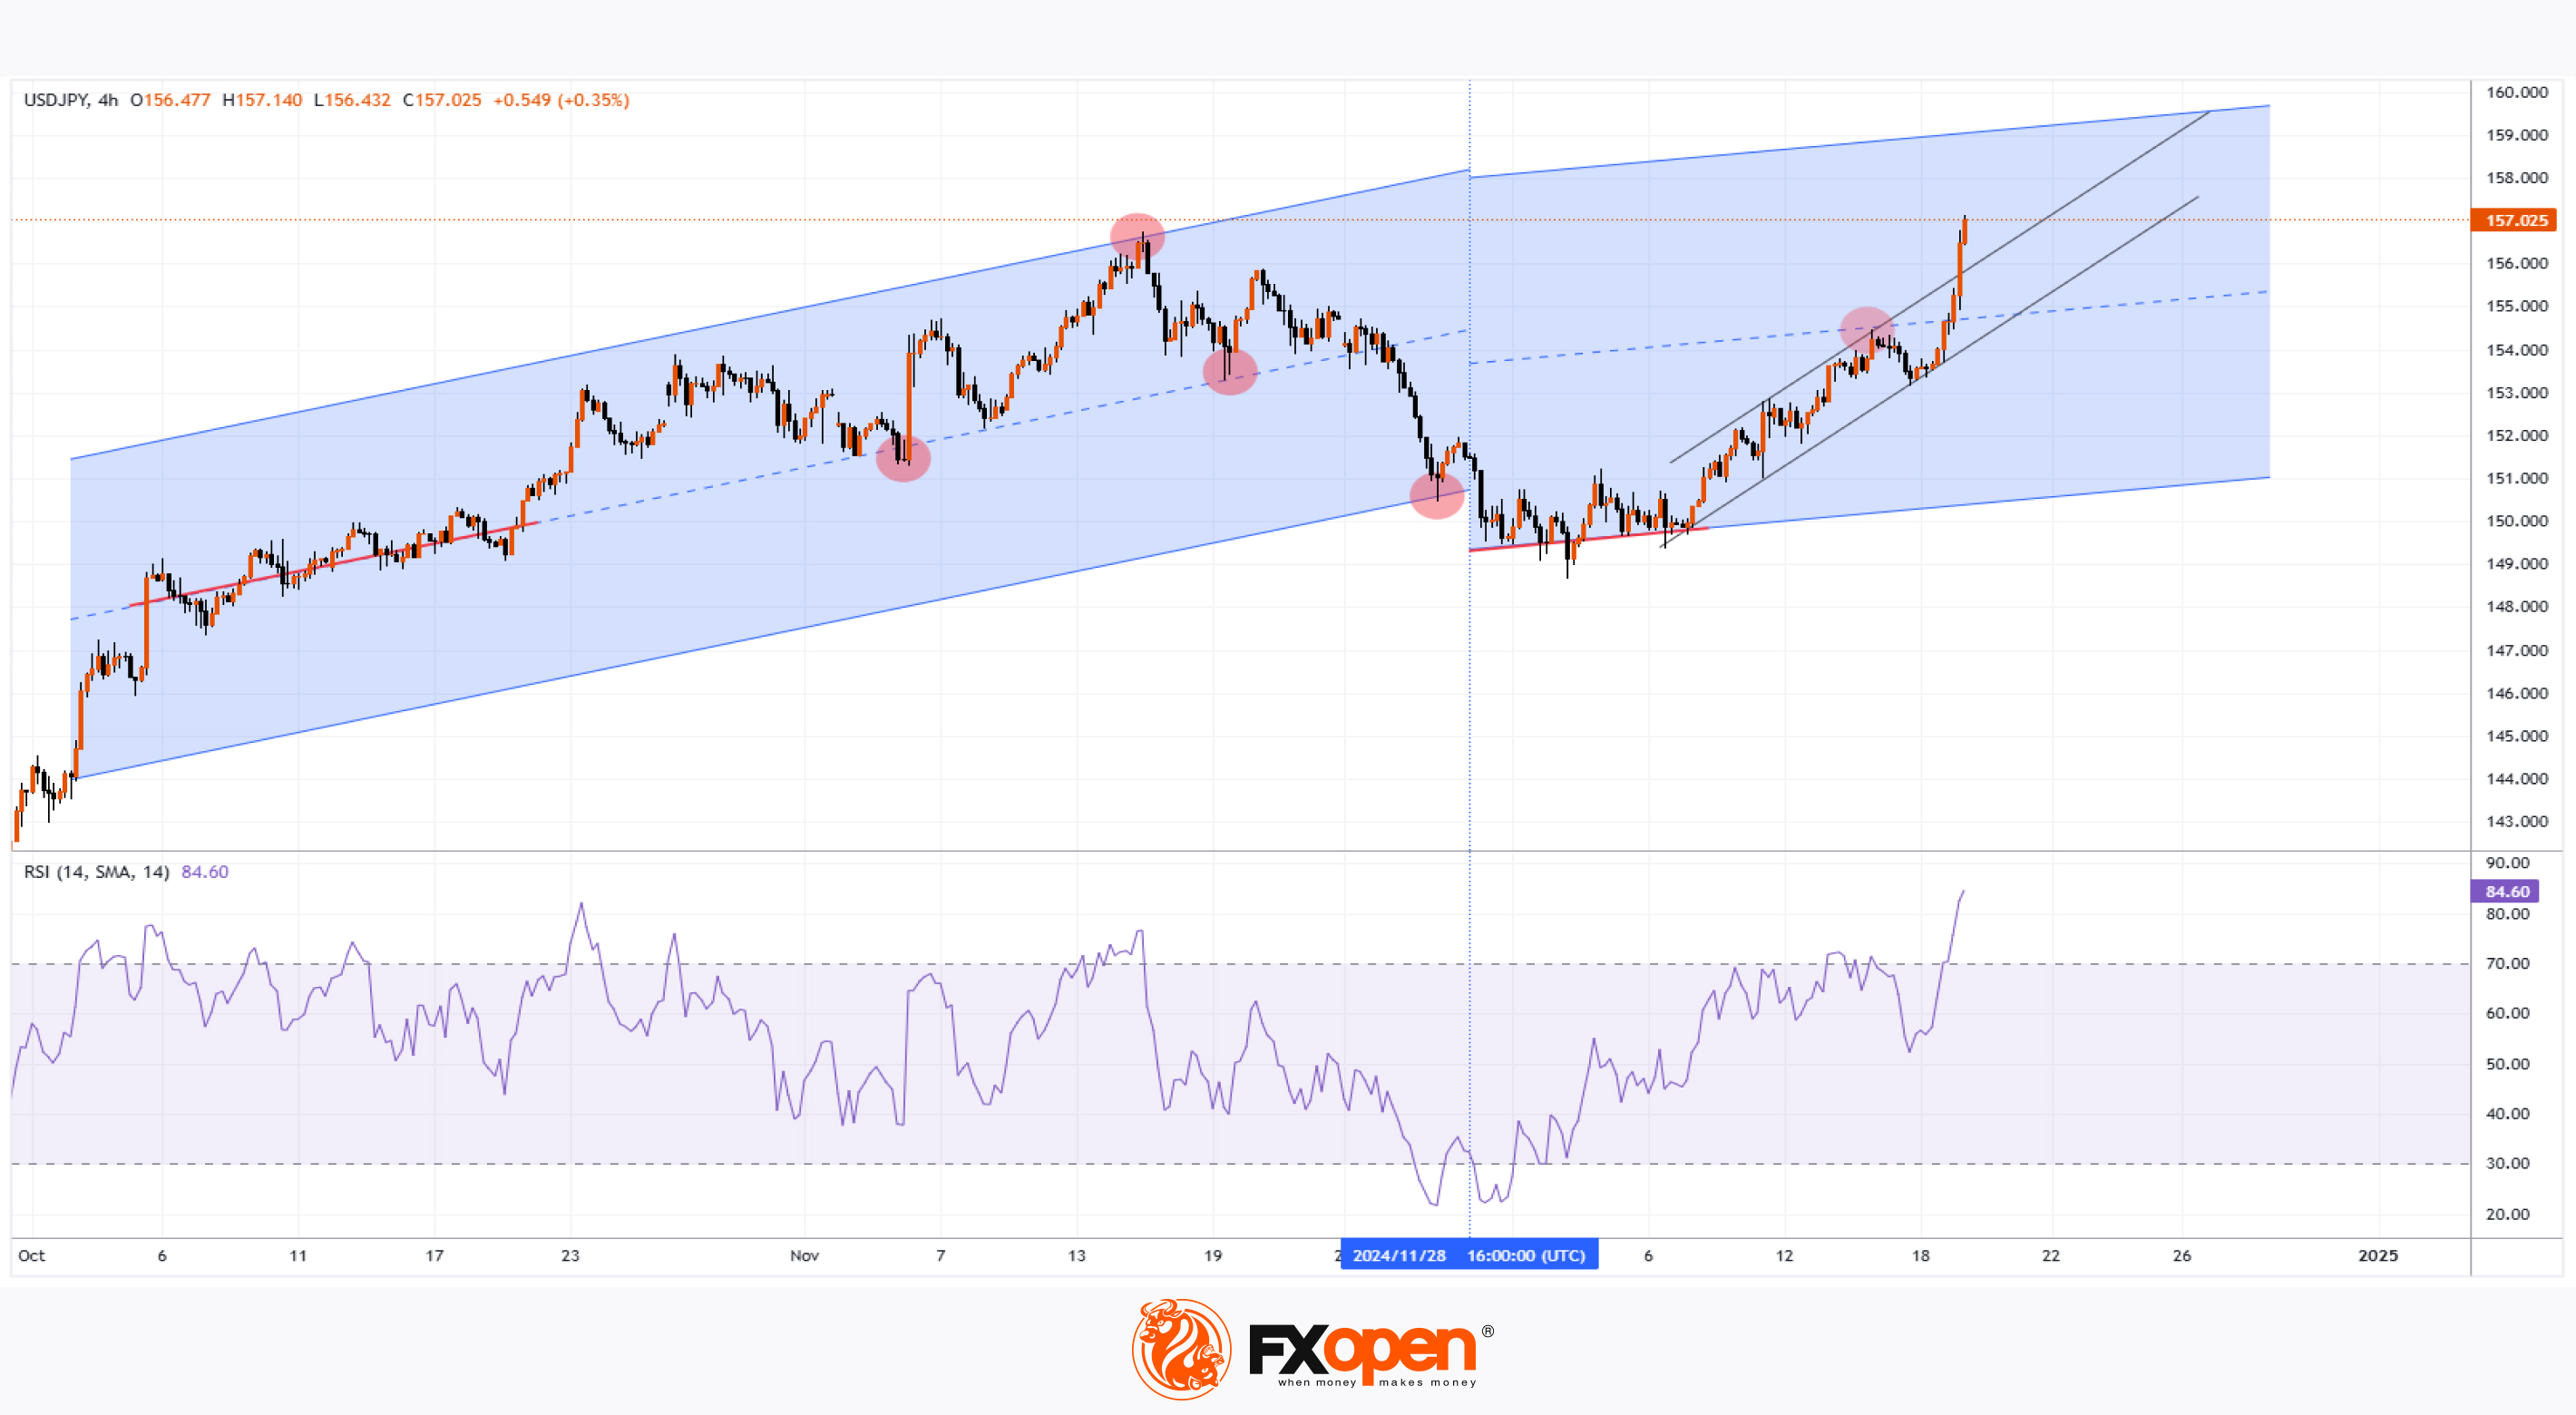
According to the USD/JPY chart today, the US dollar has climbed to 157 yen. This movement was driven by monetary policies of both countries' central banks.
The Federal Reserve took a hawkish stance, with Chair Jerome Powell suggesting the possibility of fewer rate cuts in 2025 than earlier expected.
On the other side, the Bank of Japan's Governor Kazuo Ueda, as reported by Reuters, made "surprisingly dovish" remarks. He delivered a cautious outlook on monetary policy following the central bank’s decision to maintain its interest rates unchanged.
He emphasised that:
→ Real interest rates remain very low.
→ New risks are emerging due to trade policies proposed by US President-elect Donald Trump.
Technical analysis of the 4-hour USD/JPY chart shows that:
→ The pair moves in an upward trend, but based on pivot points (marked in red), the slope of the ascending channel might shift.
→ The RSI is at a multi-month high, and the black trendlines highlight significant demand strength in the market throughout December.
We can suggest that the US dollar is significantly overbought relative to the yen. Could a pullback, such as to the lower black trendline, be expected? Given the importance of fundamental factors such as central bank decisions, any potential pullback might not threaten the continuation of the current uptrend through the end of the year.
Trade over 50 forex markets 24 hours a day with FXOpen. Take advantage of low commissions, deep liquidity, and spreads from 0.0 pips. Open your FXOpen account now or learn more about trading forex with FXOpen.
CFDs are complex instruments and come with a high risk of losing your money.
This article represents the opinion of the Companies operating under the FXOpen brand only. It is not to be construed as an offer, solicitation, or recommendation with respect to products and services provided by the Companies operating under the FXOpen brand, nor is it to be considered financial advice.
USD/JPY Rises to a Nearly 5-Month High
According to the USD/JPY chart today, the US dollar has climbed to 157 yen. This movement was driven by monetary policies of both countries' central banks.
The Federal Reserve took a hawkish stance, with Chair Jerome Powell suggesting the possibility of fewer rate cuts in 2025 than earlier expected.
On the other side, the Bank of Japan's Governor Kazuo Ueda, as reported by Reuters, made "surprisingly dovish" remarks. He delivered a cautious outlook on monetary policy following the central bank’s decision to maintain its interest rates unchanged.
He emphasised that:
→ Real interest rates remain very low.
→ New risks are emerging due to trade policies proposed by US President-elect Donald Trump.
Technical analysis of the 4-hour USD/JPY chart shows that:
→ The pair moves in an upward trend, but based on pivot points (marked in red), the slope of the ascending channel might shift.
→ The RSI is at a multi-month high, and the black trendlines highlight significant demand strength in the market throughout December.
We can suggest that the US dollar is significantly overbought relative to the yen. Could a pullback, such as to the lower black trendline, be expected? Given the importance of fundamental factors such as central bank decisions, any potential pullback might not threaten the continuation of the current uptrend through the end of the year.
Trade over 50 forex markets 24 hours a day with FXOpen. Take advantage of low commissions, deep liquidity, and spreads from 0.0 pips. Open your FXOpen account now or learn more about trading forex with FXOpen.
CFDs are complex instruments and come with a high risk of losing your money.
This article represents the opinion of the Companies operating under the FXOpen brand only. It is not to be construed as an offer, solicitation, or recommendation with respect to products and services provided by the Companies operating under the FXOpen brand, nor is it to be considered financial advice.
👍2
#stockmarket #stocktrading #marketanalysis
Micron Technology (MU) Stock Drops 16%
On Wednesday, Micron Technology released its quarterly earnings report after the main trading session closed. The results aligned closely with analysts' expectations: earnings per share came in at $1.79, slightly above the forecast of $1.76, while revenue met projections at $8.71 billion.
Despite meeting estimates, the chipmaker issued a disappointing forecast for the next quarter, citing weak demand for personal computers (PCs) and smartphones. This overshadowed positive projections for the growth of the artificial intelligence (AI) chip market. Morningstar analyst William Kerwin warned of a potential "significant decline" in revenue from chips used in smartphones and PCs in 2025, driven by challenging market conditions.
As a result, Micron Technology's stock opened Thursday's session with a significant bearish gap and continued to slide throughout the day, closing 16% lower than Wednesday's closing price.
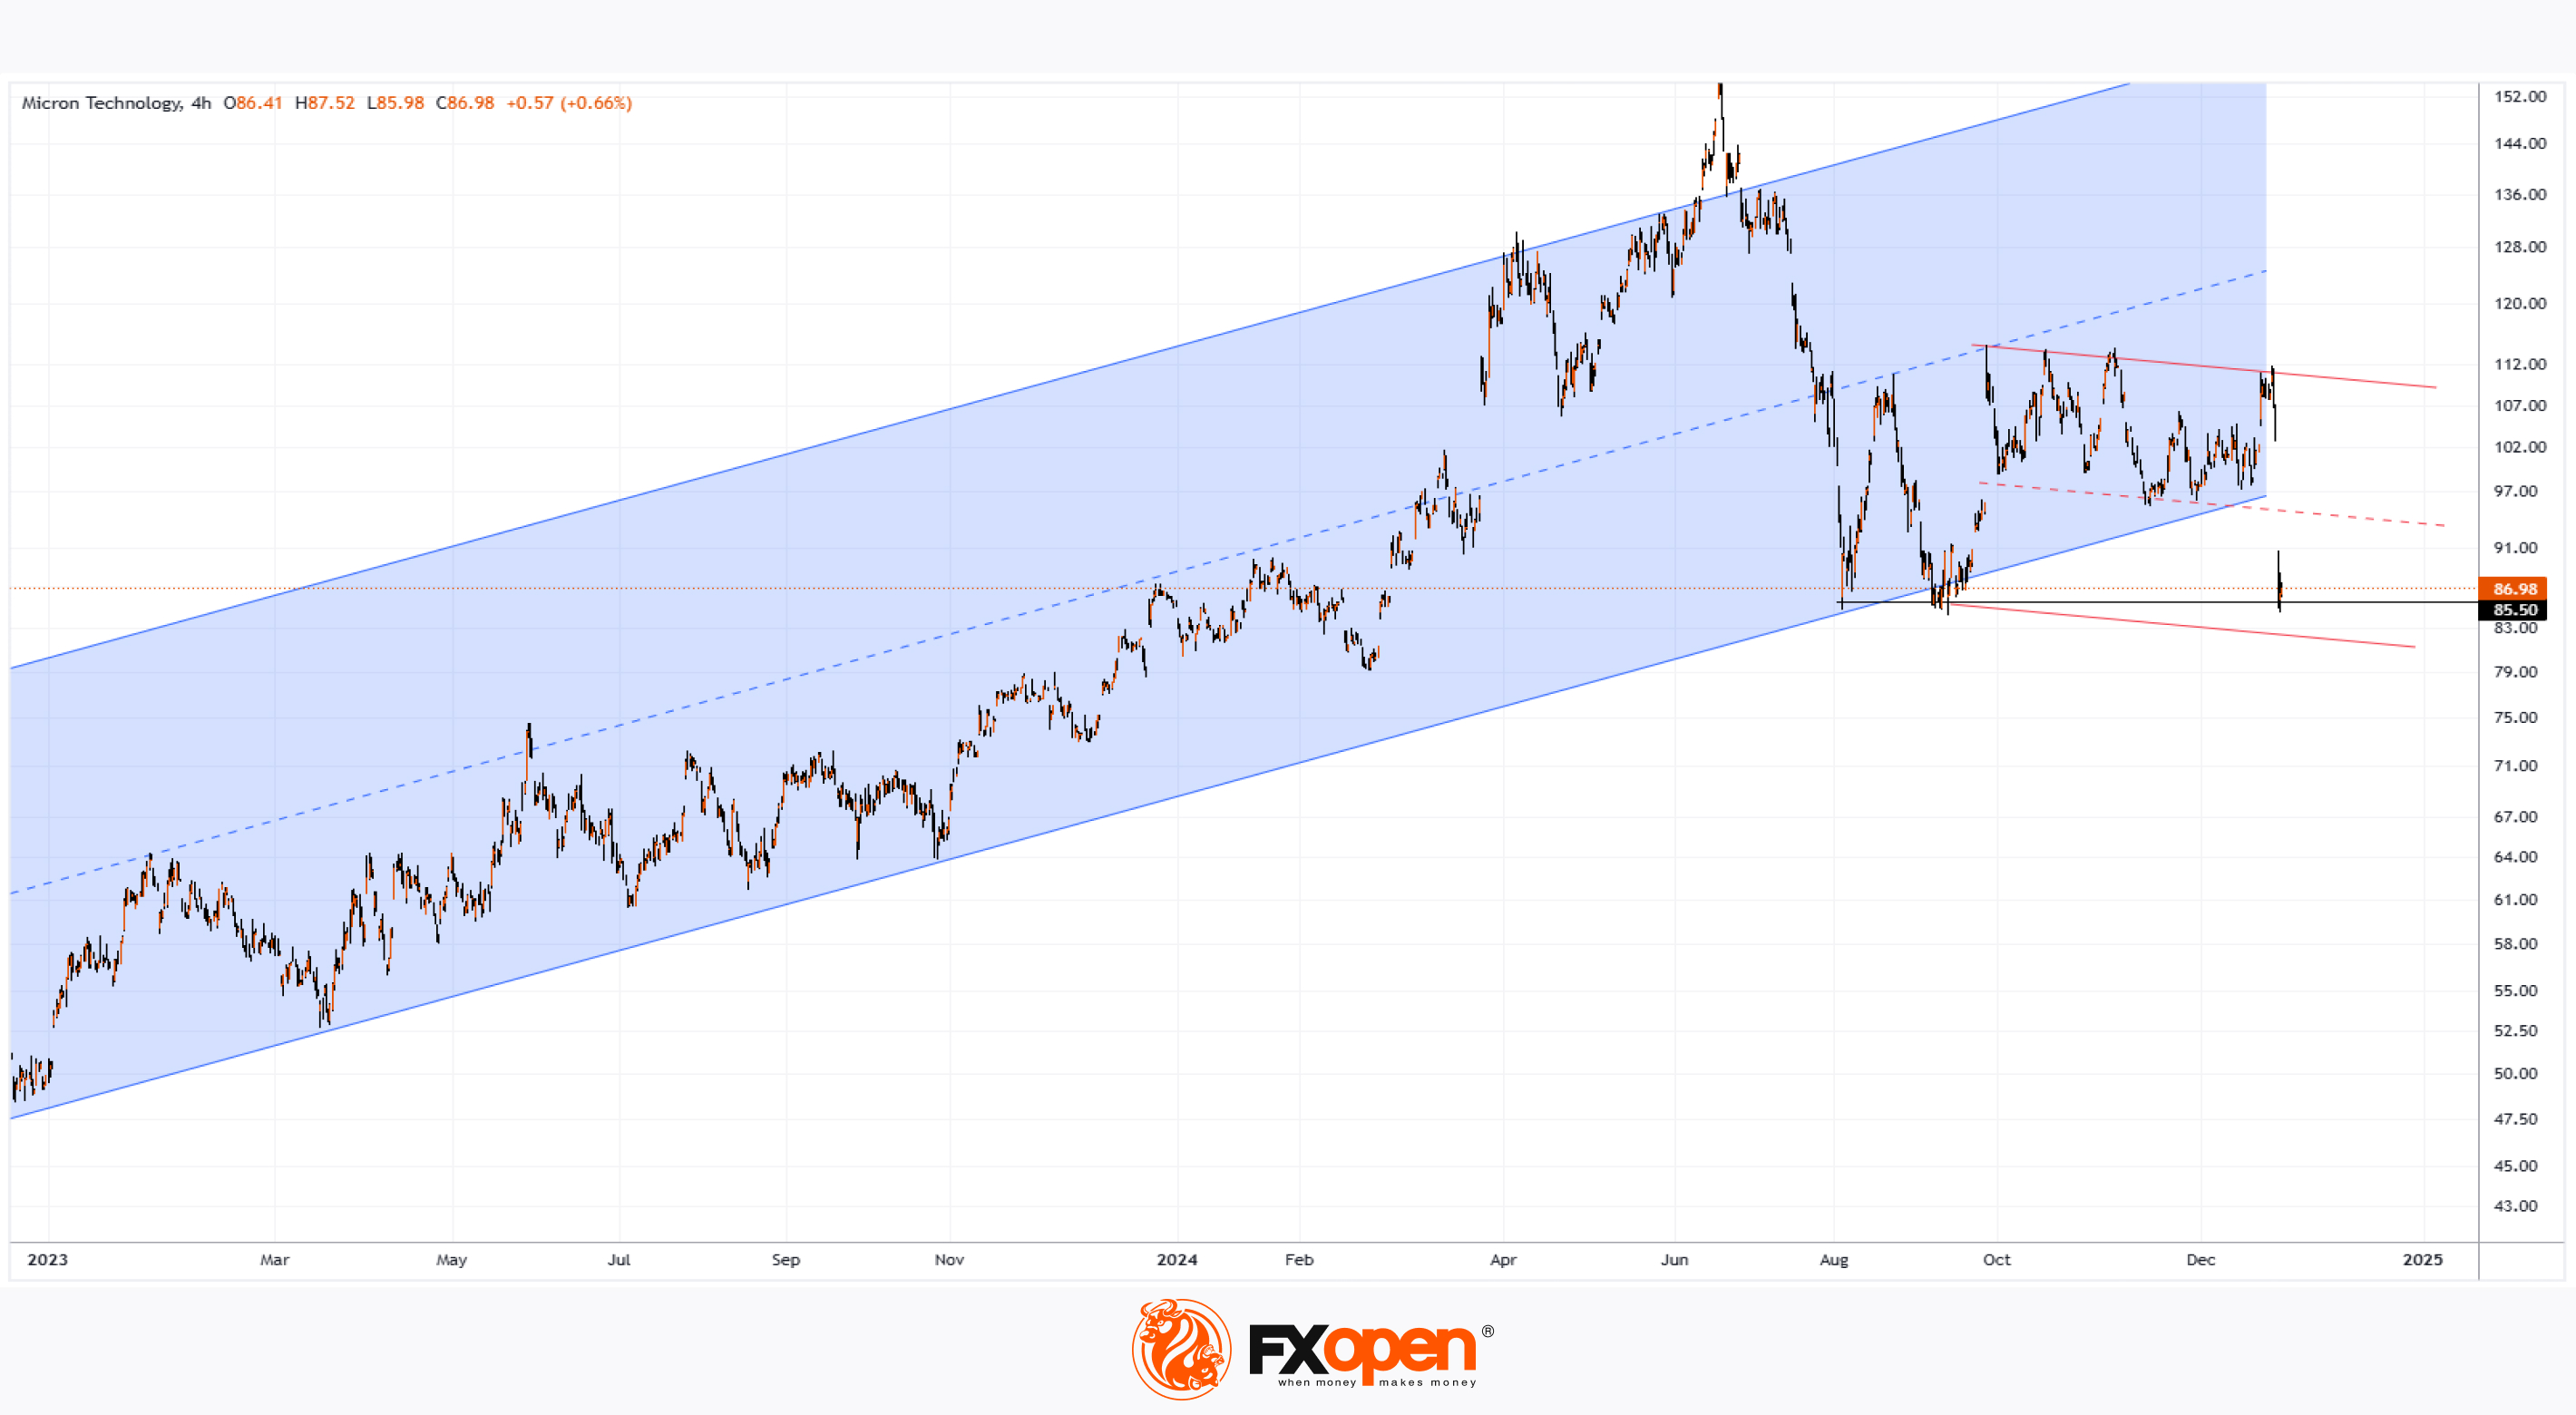
The chart of Micron Technology shares reveals bearish signals, as the price has broken below the support line of the long-term upward channel defined by key reversal points.
Currently, the stock is hovering around the $85.50 support level, which successfully halted the bearish momentum in August and September. However, with market sentiment dampened by Jerome Powell’s cautious comments about the pace of rate cuts in 2025, MU shares may face further downside. If this happens, the downward channel (highlighted in red) could become the dominant trend.
Analysts remain optimistic despite recent developments. According to TipRanks:
→ 23 out of 24 analysts recommend buying MU stock.
→ The average 12-month price target is $153.05.
That said, if the stock continues to deviate from the blue upward channel, analysts may adjust their price targets downwards to reflect the changing outlook.
Trade over 50 forex markets 24 hours a day with FXOpen. Take advantage of low commissions, deep liquidity, and spreads from 0.0 pips. Open your FXOpen account now or learn more about trading forex with FXOpen.
CFDs are complex instruments and come with a high risk of losing your money.
This article represents the opinion of the Companies operating under the FXOpen brand only. It is not to be construed as an offer, solicitation, or recommendation with respect to products and services provided by the Companies operating under the FXOpen brand, nor is it to be considered financial advice.
Micron Technology (MU) Stock Drops 16%
On Wednesday, Micron Technology released its quarterly earnings report after the main trading session closed. The results aligned closely with analysts' expectations: earnings per share came in at $1.79, slightly above the forecast of $1.76, while revenue met projections at $8.71 billion.
Despite meeting estimates, the chipmaker issued a disappointing forecast for the next quarter, citing weak demand for personal computers (PCs) and smartphones. This overshadowed positive projections for the growth of the artificial intelligence (AI) chip market. Morningstar analyst William Kerwin warned of a potential "significant decline" in revenue from chips used in smartphones and PCs in 2025, driven by challenging market conditions.
As a result, Micron Technology's stock opened Thursday's session with a significant bearish gap and continued to slide throughout the day, closing 16% lower than Wednesday's closing price.
The chart of Micron Technology shares reveals bearish signals, as the price has broken below the support line of the long-term upward channel defined by key reversal points.
Currently, the stock is hovering around the $85.50 support level, which successfully halted the bearish momentum in August and September. However, with market sentiment dampened by Jerome Powell’s cautious comments about the pace of rate cuts in 2025, MU shares may face further downside. If this happens, the downward channel (highlighted in red) could become the dominant trend.
Analysts remain optimistic despite recent developments. According to TipRanks:
→ 23 out of 24 analysts recommend buying MU stock.
→ The average 12-month price target is $153.05.
That said, if the stock continues to deviate from the blue upward channel, analysts may adjust their price targets downwards to reflect the changing outlook.
Trade over 50 forex markets 24 hours a day with FXOpen. Take advantage of low commissions, deep liquidity, and spreads from 0.0 pips. Open your FXOpen account now or learn more about trading forex with FXOpen.
CFDs are complex instruments and come with a high risk of losing your money.
This article represents the opinion of the Companies operating under the FXOpen brand only. It is not to be construed as an offer, solicitation, or recommendation with respect to products and services provided by the Companies operating under the FXOpen brand, nor is it to be considered financial advice.
👍2
#GBPUSD #forextrading #marketanalysis #MarketUpdates
GBP/USD Analysis: Pair Recovers from 7-Month Low
The GBP/USD pair dropped below the psychological level of 1.25 today, a level last seen in early May. Over the past two days, the pair has declined by more than 1.5%, driven by central bank decisions.
On one hand, the US dollar strengthened after the Federal Reserve chair's comments on Wednesday, hinting at potentially higher interest rates in 2025.
On the other hand, the pound weakened on Thursday after news from the Bank of England (BoE). According to media reports:
→ The BoE kept the interest rate unchanged.
→ Market expectations for the BoE's February decision are putting additional pressure on the pound.
Technical analysis of the GBP/USD chart reflects a continuation of bearish momentum, with the pair moving within a descending channel:
→ In mid-December, the price broke below the lower boundary of a narrowing triangle (highlighted in blue), signalling the potential resumption of the downtrend.
→ Around the same time, trading was concentrated near the 1.265 level. Despite repeated tests of this level, it seems that the bears took control.
Looking ahead, the pair may consolidate near the channel’s median line as the year comes to a close, with this zone acting as a balance point between supply and demand. Stronger directional moves might materialise in 2025.
Trade over 50 forex markets 24 hours a day with FXOpen. Take advantage of low commissions, deep liquidity, and spreads from 0.0 pips. Open your FXOpen account now or learn more about trading forex with FXOpen.
CFDs are complex instruments and come with a high risk of losing your money.
This article represents the opinion of the Companies operating under the FXOpen brand only. It is not to be construed as an offer, solicitation, or recommendation with respect to products and services provided by the Companies operating under the FXOpen brand, nor is it to be considered financial advice.
GBP/USD Analysis: Pair Recovers from 7-Month Low
The GBP/USD pair dropped below the psychological level of 1.25 today, a level last seen in early May. Over the past two days, the pair has declined by more than 1.5%, driven by central bank decisions.
On one hand, the US dollar strengthened after the Federal Reserve chair's comments on Wednesday, hinting at potentially higher interest rates in 2025.
On the other hand, the pound weakened on Thursday after news from the Bank of England (BoE). According to media reports:
→ The BoE kept the interest rate unchanged.
→ Market expectations for the BoE's February decision are putting additional pressure on the pound.
Technical analysis of the GBP/USD chart reflects a continuation of bearish momentum, with the pair moving within a descending channel:
→ In mid-December, the price broke below the lower boundary of a narrowing triangle (highlighted in blue), signalling the potential resumption of the downtrend.
→ Around the same time, trading was concentrated near the 1.265 level. Despite repeated tests of this level, it seems that the bears took control.
Looking ahead, the pair may consolidate near the channel’s median line as the year comes to a close, with this zone acting as a balance point between supply and demand. Stronger directional moves might materialise in 2025.
Trade over 50 forex markets 24 hours a day with FXOpen. Take advantage of low commissions, deep liquidity, and spreads from 0.0 pips. Open your FXOpen account now or learn more about trading forex with FXOpen.
CFDs are complex instruments and come with a high risk of losing your money.
This article represents the opinion of the Companies operating under the FXOpen brand only. It is not to be construed as an offer, solicitation, or recommendation with respect to products and services provided by the Companies operating under the FXOpen brand, nor is it to be considered financial advice.

👍2
#marketanalysis #MarketUpdates #goldprice #XAUUSD
XAU/USD Chart Analysis and Analytical Gold Price Forecast for 2025
With the holiday season underway, this week may be less volatile than the previous one, which was dominated by central bank decisions. This presents an opportunity to analyse the broader trends and outlook for gold prices in 2025.
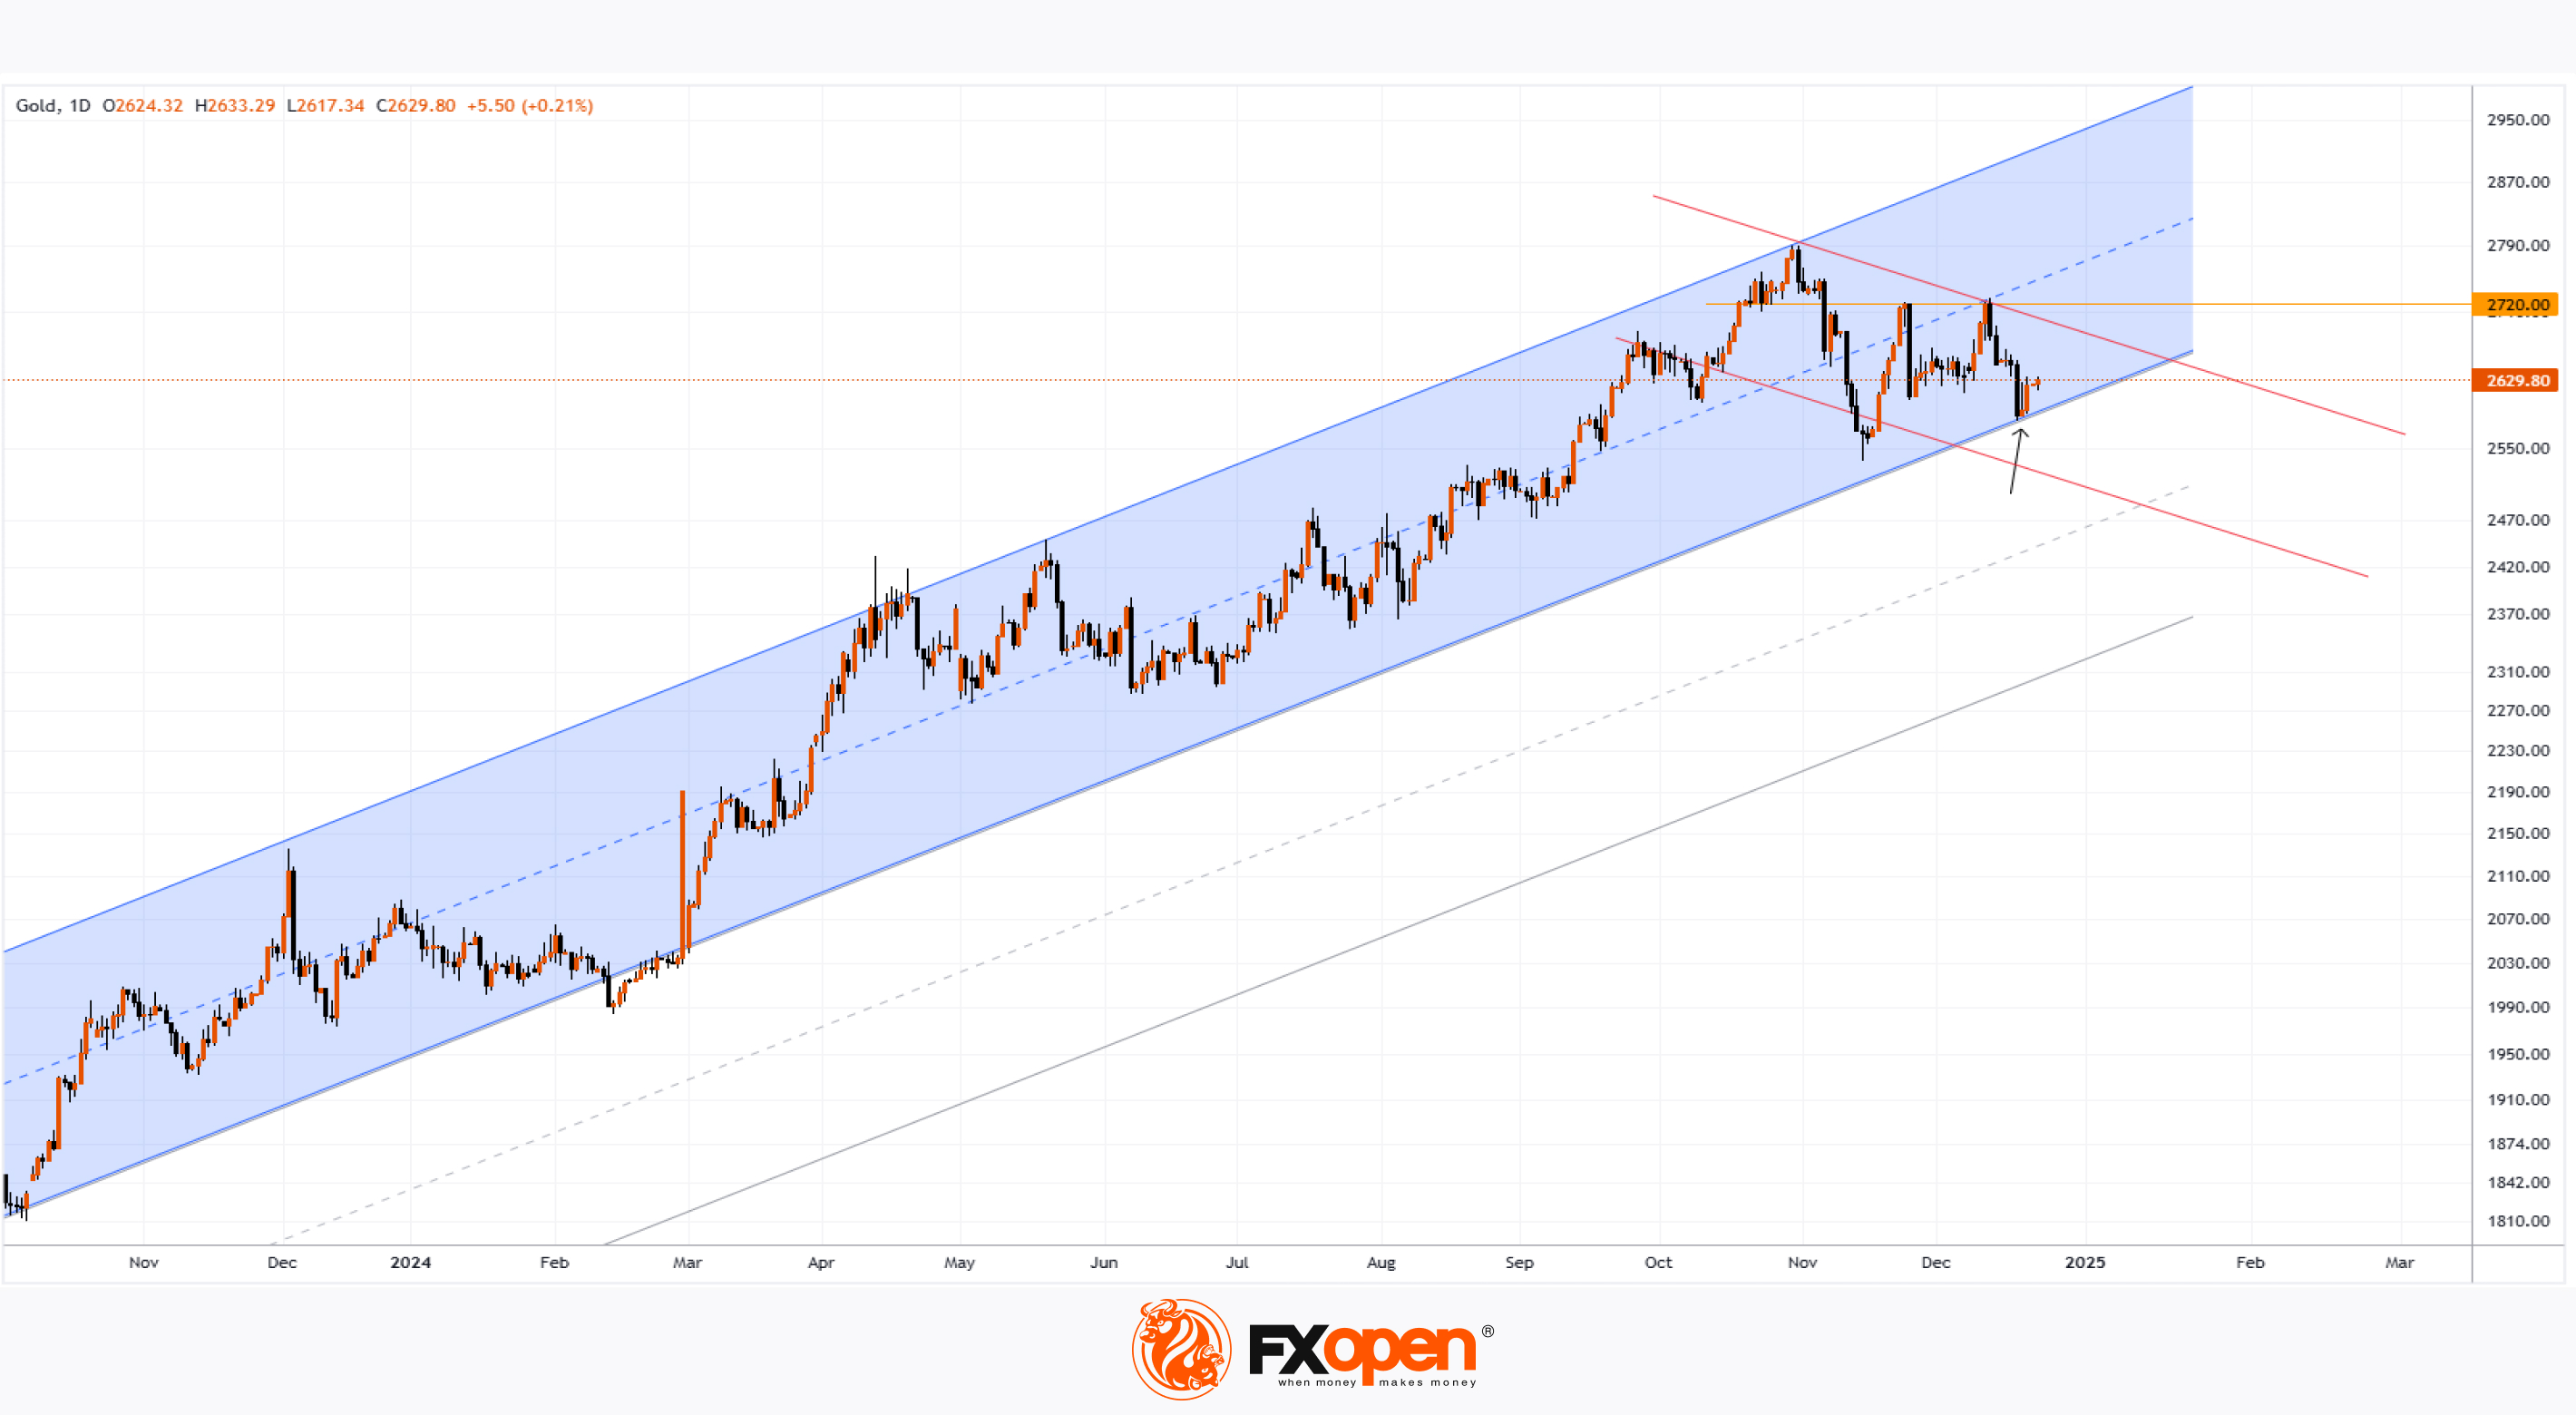
The XAU/USD chart reveals that gold prices have been moving within an ascending channel, gaining approximately 27% since the start of 2024.
The short-term outlook appears bearish due to the following factors:
- Gold prices fell after last week’s Federal Reserve interest rate cut, signalling increased selling pressure.
- The $2,720 level remains a key resistance, having reversed the price downward in November and December.
- While a recent upward reversal (indicated by an arrow) shows renewed buying interest near the lower boundary of the ascending channel, persistent selling pressure could still lead to a bearish trend. This might result in a breakdown below the blue channel's lower boundary and the formation of a descending channel (outlined in red).
Despite short-term challenges, analysts remain optimistic about gold's prospects for 2025. Donald Trump's return to the White House may significantly change global trade, Western alliances, and geopolitical dynamics. These uncertainties may increase demand for gold as a so-called safe-haven asset.
A BullionVault survey of around 1,450 participants predicts that gold prices could reach $3,070 by the end of 2025, driven by concerns over geopolitics and mounting national debt.
In this context, even if the lower boundary of the blue channel is breached, bullish momentum could resume, possibly from one of the grey support levels.
Start trading commodities with tight spreads. Open your trading account now or learn more about trading commodity CFDs with FXOpen.
CFDs are complex instruments and come with a high risk of losing your money.
This article represents the opinion of the Companies operating under the FXOpen brand only. It is not to be construed as an offer, solicitation, or recommendation with respect to products and services provided by the Companies operating under the FXOpen brand, nor is it to be considered financial advice.
XAU/USD Chart Analysis and Analytical Gold Price Forecast for 2025
With the holiday season underway, this week may be less volatile than the previous one, which was dominated by central bank decisions. This presents an opportunity to analyse the broader trends and outlook for gold prices in 2025.
The XAU/USD chart reveals that gold prices have been moving within an ascending channel, gaining approximately 27% since the start of 2024.
The short-term outlook appears bearish due to the following factors:
- Gold prices fell after last week’s Federal Reserve interest rate cut, signalling increased selling pressure.
- The $2,720 level remains a key resistance, having reversed the price downward in November and December.
- While a recent upward reversal (indicated by an arrow) shows renewed buying interest near the lower boundary of the ascending channel, persistent selling pressure could still lead to a bearish trend. This might result in a breakdown below the blue channel's lower boundary and the formation of a descending channel (outlined in red).
Despite short-term challenges, analysts remain optimistic about gold's prospects for 2025. Donald Trump's return to the White House may significantly change global trade, Western alliances, and geopolitical dynamics. These uncertainties may increase demand for gold as a so-called safe-haven asset.
A BullionVault survey of around 1,450 participants predicts that gold prices could reach $3,070 by the end of 2025, driven by concerns over geopolitics and mounting national debt.
In this context, even if the lower boundary of the blue channel is breached, bullish momentum could resume, possibly from one of the grey support levels.
Start trading commodities with tight spreads. Open your trading account now or learn more about trading commodity CFDs with FXOpen.
CFDs are complex instruments and come with a high risk of losing your money.
This article represents the opinion of the Companies operating under the FXOpen brand only. It is not to be construed as an offer, solicitation, or recommendation with respect to products and services provided by the Companies operating under the FXOpen brand, nor is it to be considered financial advice.
👍2
#tsla #stockmarket #stocktrading #MarketNews
Tesla (TSLA) Stock Underperforms the Broader Market
Analysing Tesla (TSLA) stock chart on 12th December, we:
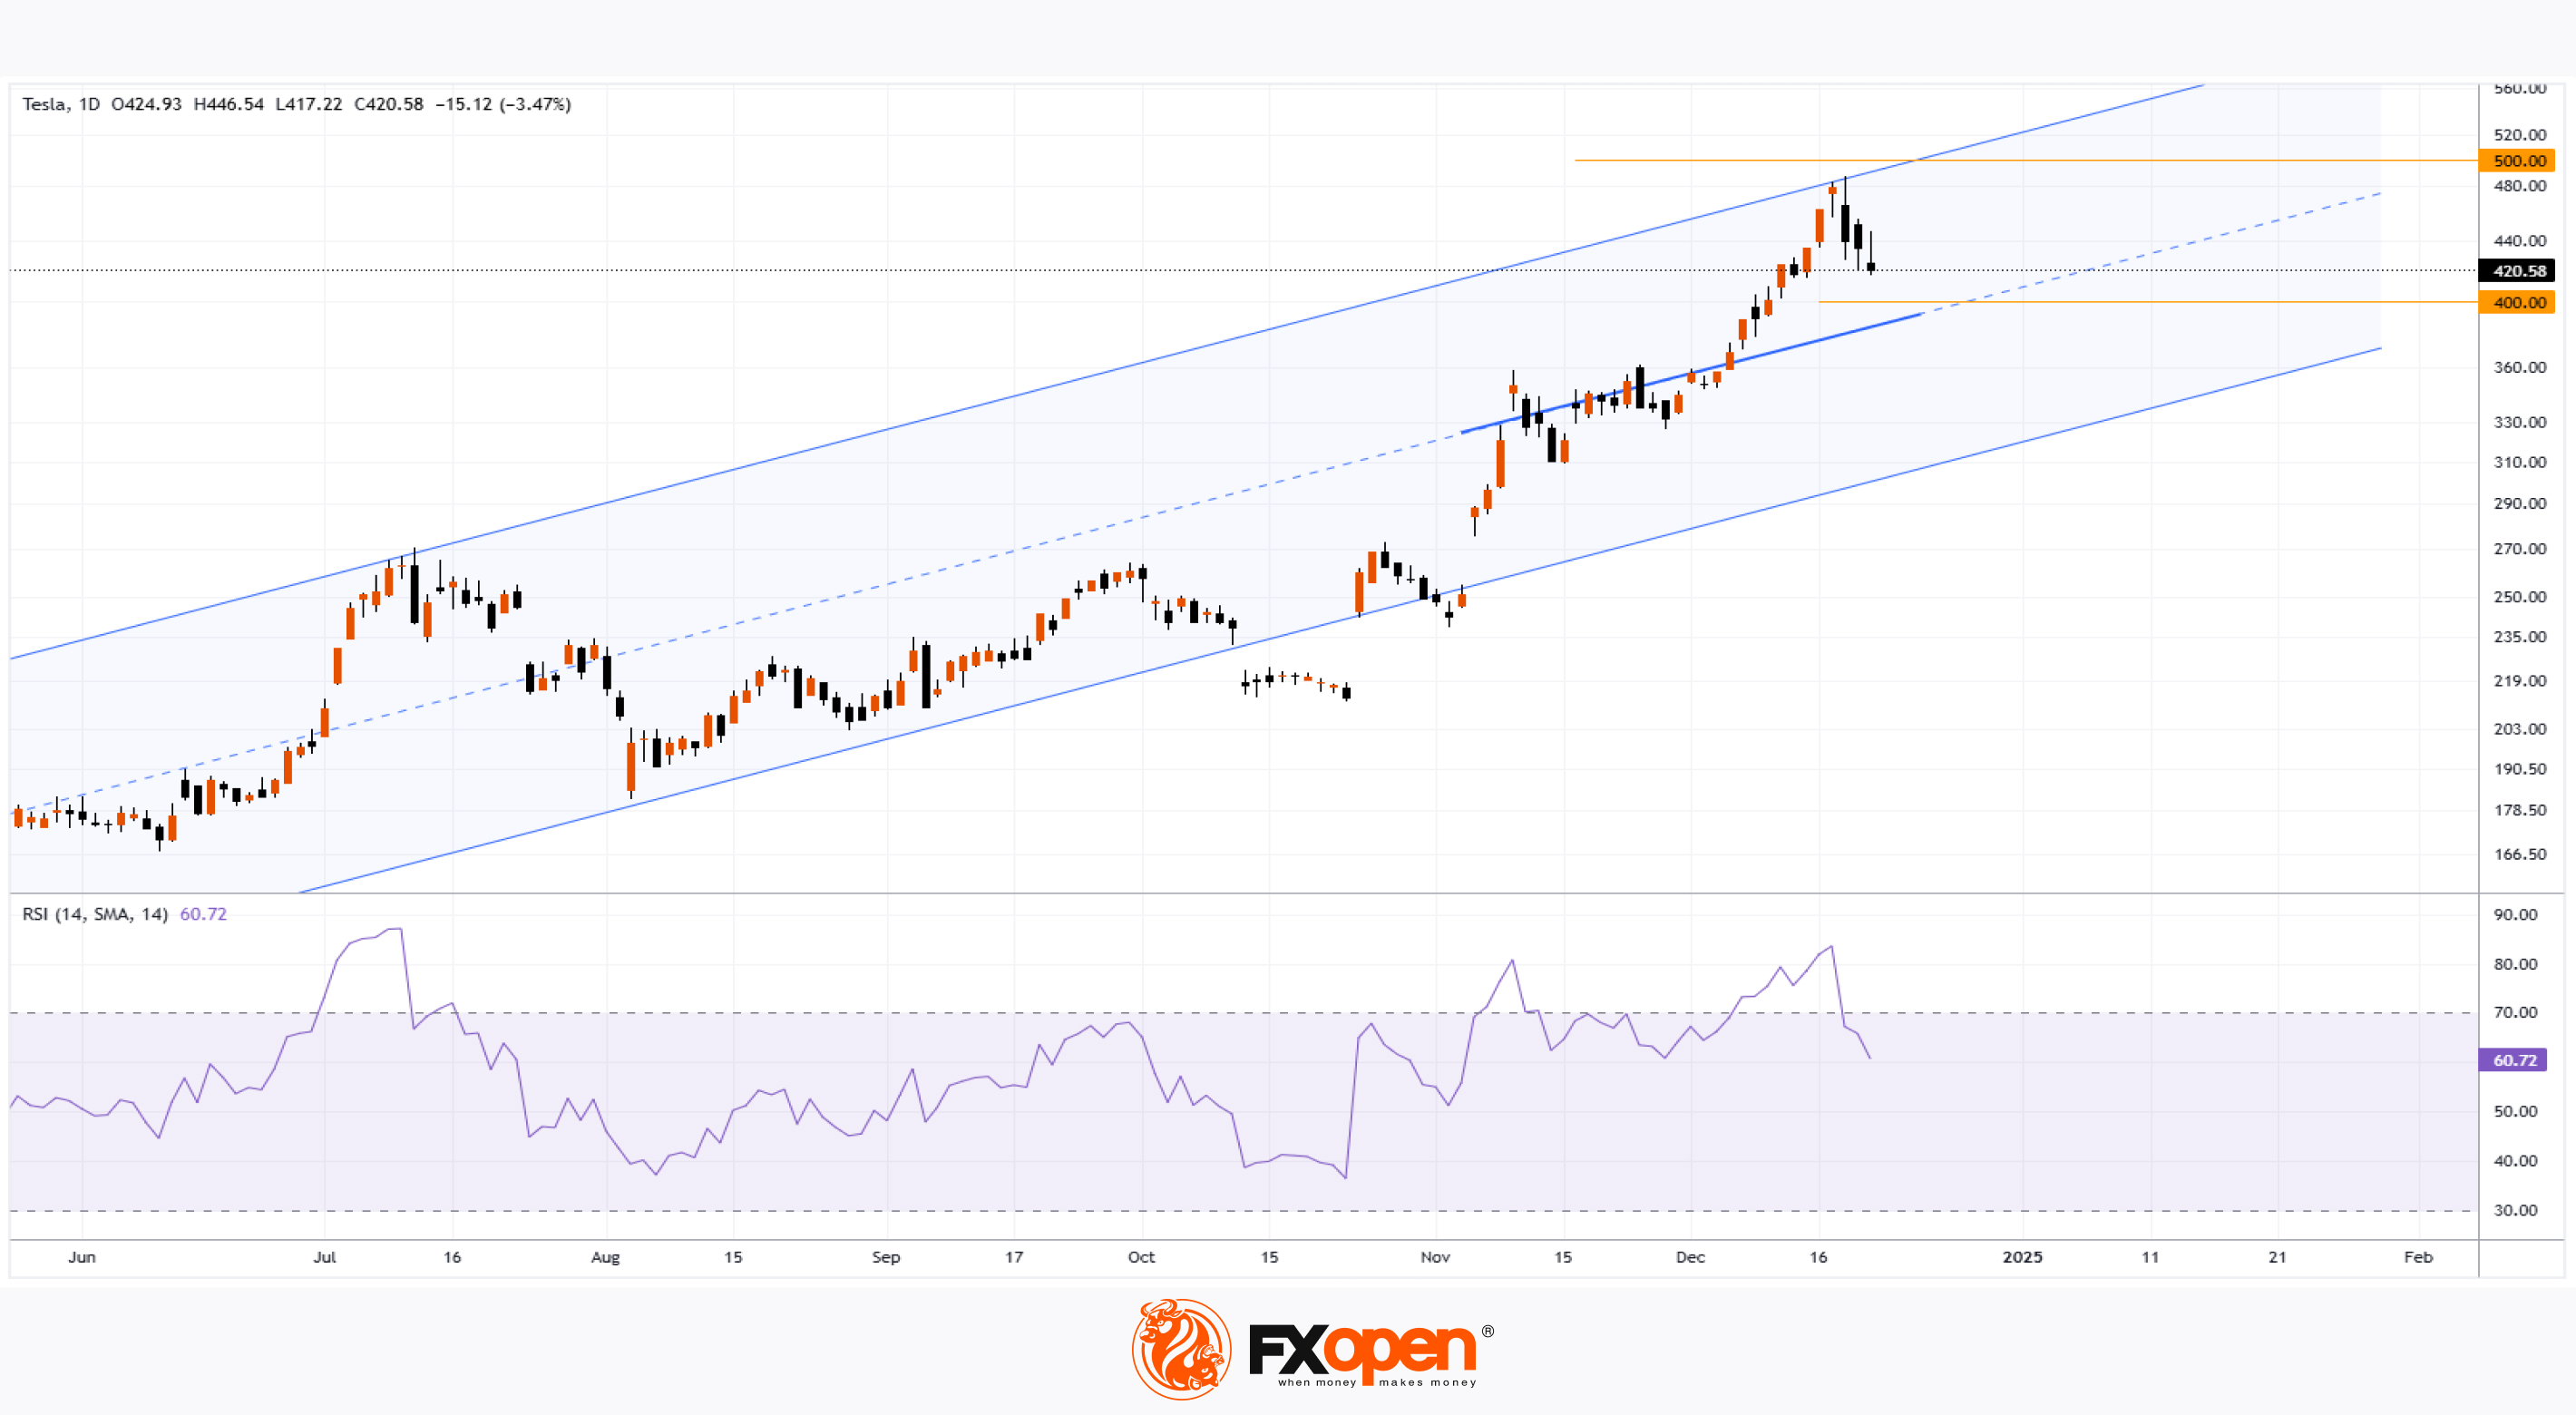
→ Identified an ascending channel, with the November price consolidation around $350 (marked by a thick blue line) potentially indicating the median line of the long-term ascending channel (highlighted in blue).
→ Mentioned that TSLA stock price could move toward the upper boundary of the channel, located near the psychological level of $500. However, the stock remained vulnerable to a pullback with a potential test of the $400 level.
What happened after our forecast?
According to Tesla (TSLA) stock chart:
→ The price bounced off the upper boundary of the channel, falling short of the psychological $500 level by approximately 2.5%.
→ On Friday, TSLA stock dropped by more than 3%, making it the worst-performing stock within the S&P 500 index (US SPX 500 mini on FXOpen).
This indicates that buyer momentum may have waned, leading to a correction from overbought levels (as indicated by the RSI) toward fair value, which could align with the channel’s median line. A test of the $400 level could be relevant.
Meanwhile, Wall Street analysts are pessimistic. According to TipRanks:
→ Only 13 out of 34 surveyed analysts recommend buying TSLA stock.
→ The average price target for TSLA is $293.76 by the end of 2025.
Read detailed Analytical Tesla (TSLA) stock price forecasts for 2025–2030.
Trade global index CFDs with zero commission and tight spreads. Open your FXOpen account now or learn more about trading index CFDs with FXOpen.
CFDs are complex instruments and come with a high risk of losing your money.
This article represents the opinion of the Companies operating under the FXOpen brand only. It is not to be construed as an offer, solicitation, or recommendation with respect to products and services provided by the Companies operating under the FXOpen brand, nor is it to be considered financial advice.
Tesla (TSLA) Stock Underperforms the Broader Market
Analysing Tesla (TSLA) stock chart on 12th December, we:
→ Identified an ascending channel, with the November price consolidation around $350 (marked by a thick blue line) potentially indicating the median line of the long-term ascending channel (highlighted in blue).
→ Mentioned that TSLA stock price could move toward the upper boundary of the channel, located near the psychological level of $500. However, the stock remained vulnerable to a pullback with a potential test of the $400 level.
What happened after our forecast?
According to Tesla (TSLA) stock chart:
→ The price bounced off the upper boundary of the channel, falling short of the psychological $500 level by approximately 2.5%.
→ On Friday, TSLA stock dropped by more than 3%, making it the worst-performing stock within the S&P 500 index (US SPX 500 mini on FXOpen).
This indicates that buyer momentum may have waned, leading to a correction from overbought levels (as indicated by the RSI) toward fair value, which could align with the channel’s median line. A test of the $400 level could be relevant.
Meanwhile, Wall Street analysts are pessimistic. According to TipRanks:
→ Only 13 out of 34 surveyed analysts recommend buying TSLA stock.
→ The average price target for TSLA is $293.76 by the end of 2025.
Read detailed Analytical Tesla (TSLA) stock price forecasts for 2025–2030.
Trade global index CFDs with zero commission and tight spreads. Open your FXOpen account now or learn more about trading index CFDs with FXOpen.
CFDs are complex instruments and come with a high risk of losing your money.
This article represents the opinion of the Companies operating under the FXOpen brand only. It is not to be construed as an offer, solicitation, or recommendation with respect to products and services provided by the Companies operating under the FXOpen brand, nor is it to be considered financial advice.
👍2
#marketanalysis #stockmarket #AMD #stocks
AMD Stock Price Rebounds from Yearly Low. 2025 Forecast
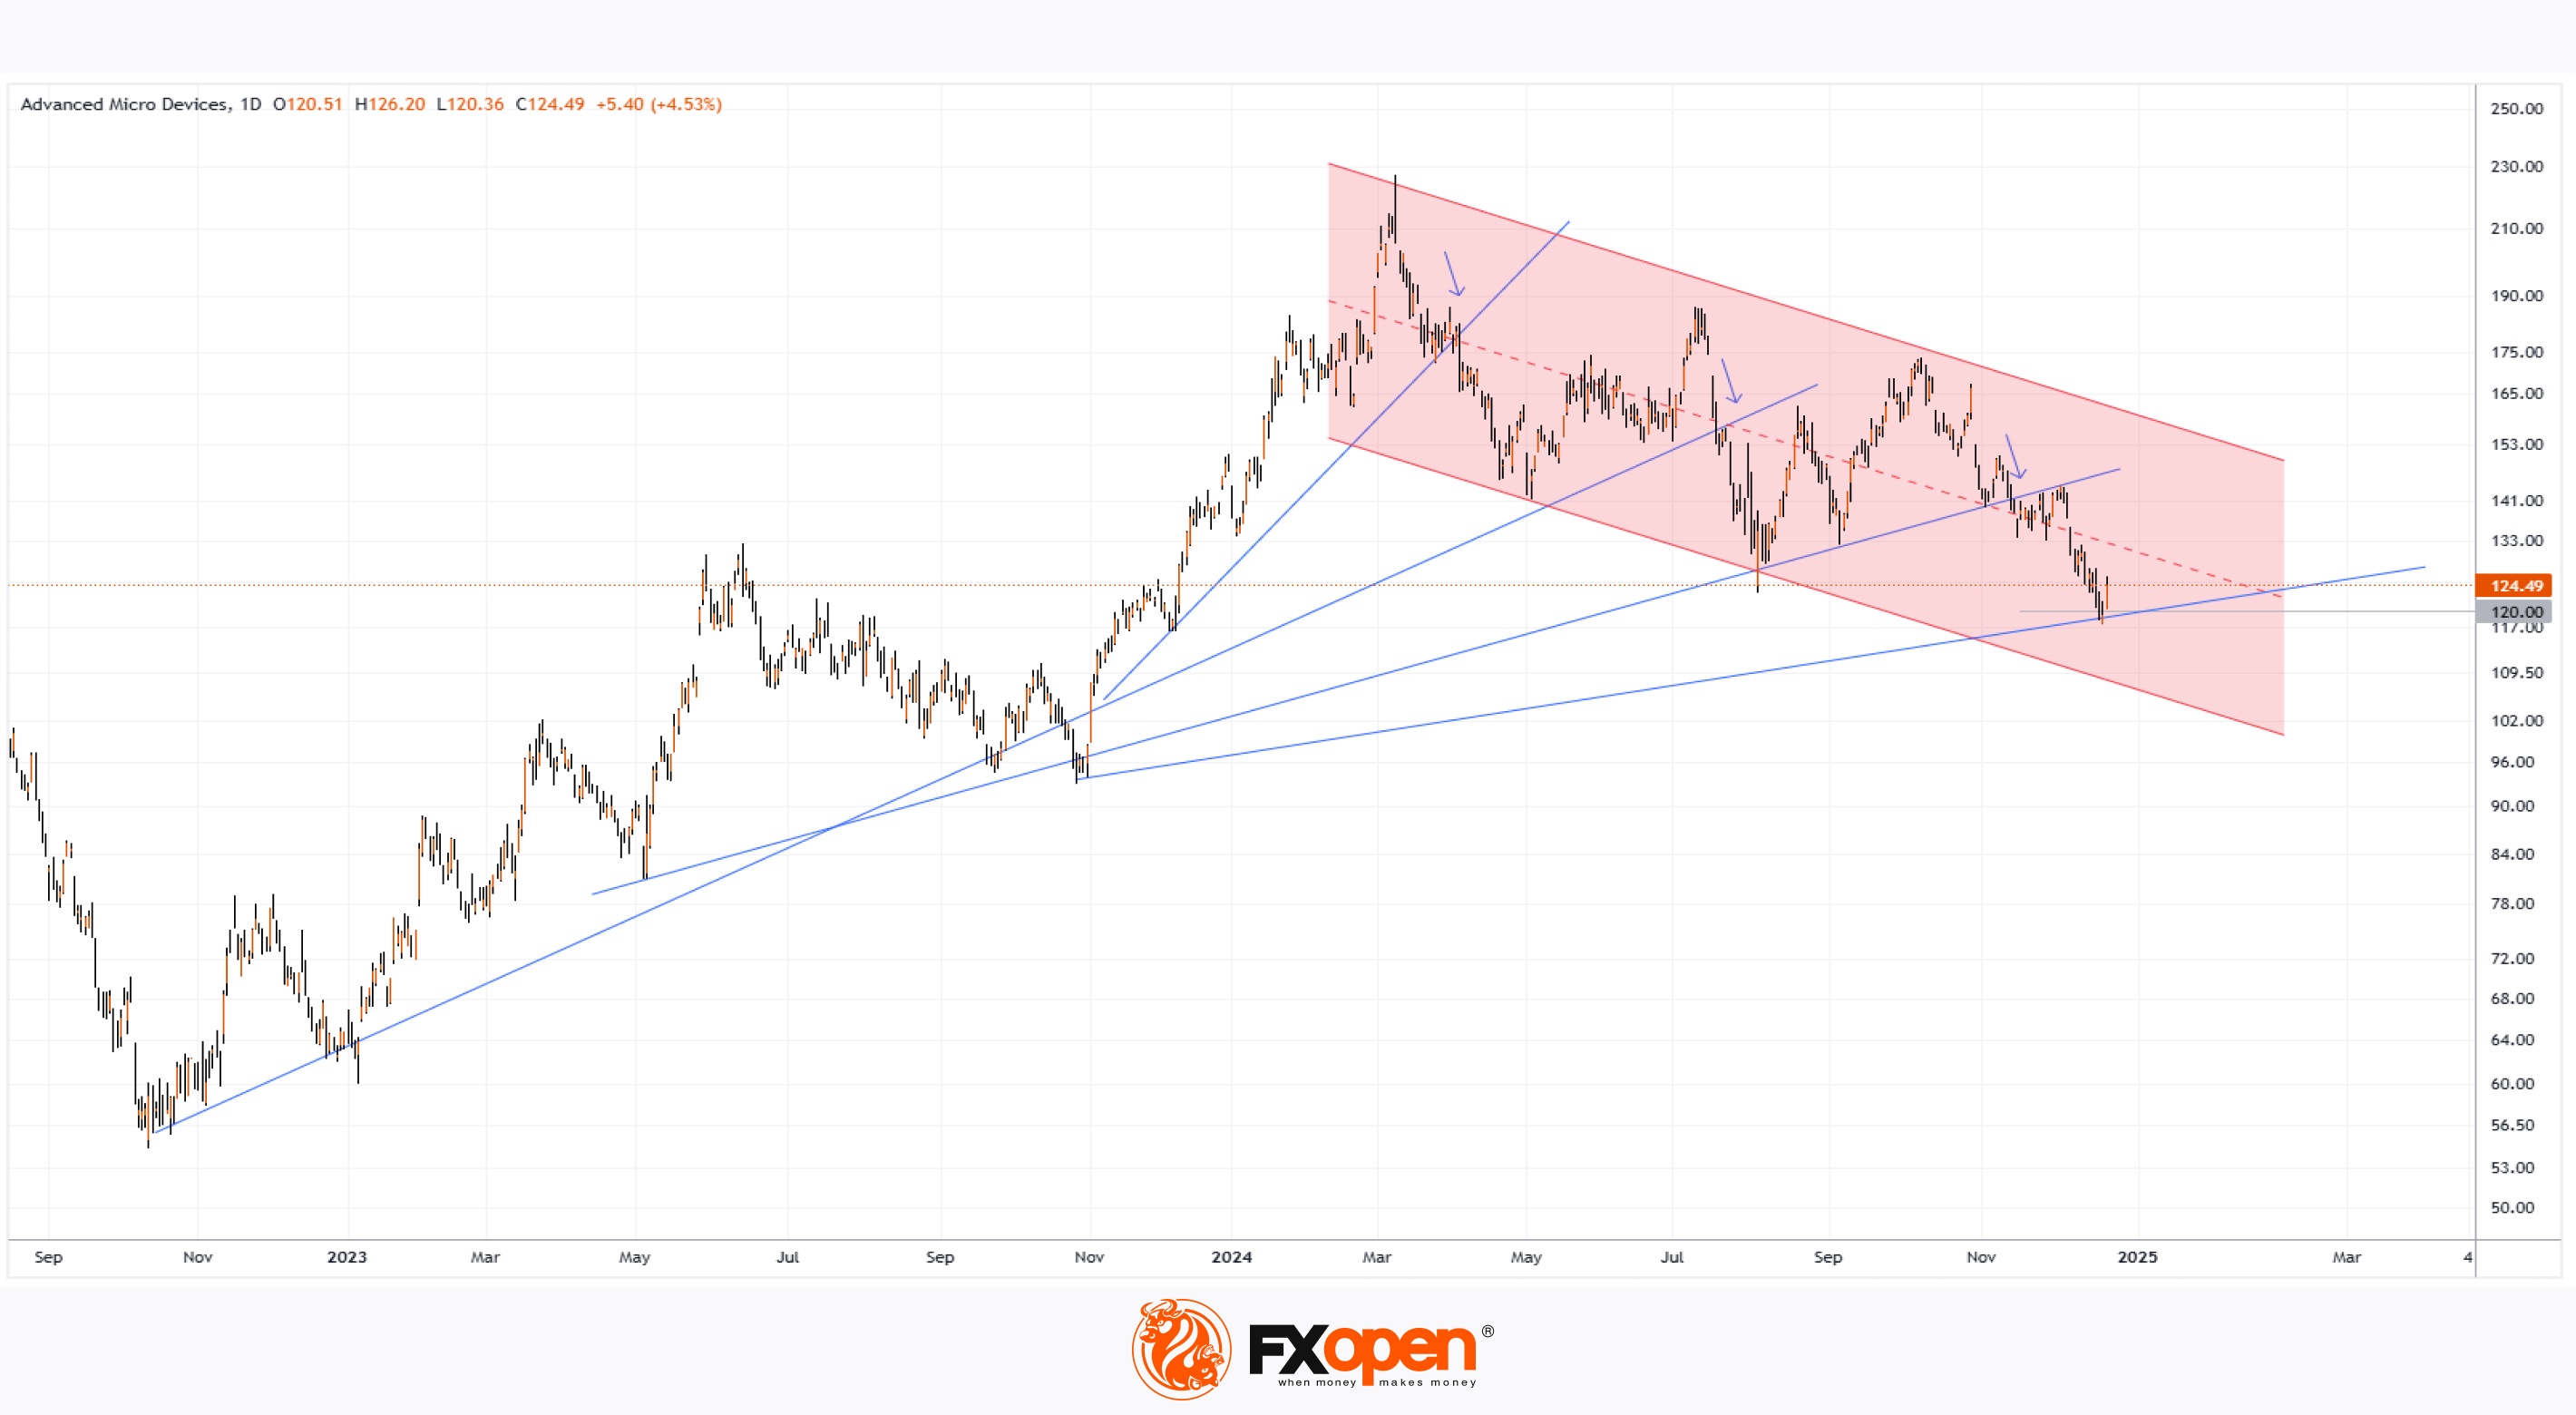
As the chart indicates, Advanced Micro Devices (AMD) reached its yearly low on 20th December, dropping below $120.
However, on Monday, AMD emerged as one of the top-performing stocks in the market. The trading session opened with a bullish gap, and by the close, the stock had gained approximately 4.5% compared to Friday's close. Meanwhile, the S&P 500 (US SPX 500 mini on FXOpen) rose by 0.7% on the same day.
According to technical analysis of the AMD stock chart, in 2024, the price formed a descending price channel (highlighted in red), characterised by the following:
- Bears broke below three trendlines, forming a structure reminiscent of Gann fans.
- The fourth (lowest) trendline could serve as a strong support level, preventing the price from reaching the bottom of the channel. The sharp upward reversal from the $120 level may be considered a sign supporting this scenario.
Price action suggests increasing demand, and analysts (as outlined below) believe buyers may play a more active role in 2025.
AMD Stock Price Forecast for 2025
In 2024, AMD underperformed the market. Amid the AI boom, Nvidia (NVDA) and Broadcom (AVGO) stocks reached all-time highs, while AMD's stock price dropped by about 12% since the beginning of 2024.
According to Yahoo Finance, the company’s strategic approach provides a rationale for investors to hold or buy AMD shares heading into 2025.
AMD has historically avoided introducing revolutionary products. Instead, the company enters established markets with alternative products that offer specific advantages.
This strategy could apply to the AI boom:
- 2024: AMD’s stock declines as the company adopts a wait-and-see approach, assessing the AI market's needs.
- 2025: AMD could benefit from the AI race, possibly through new processors in its EPYC series.
According to TipRanks:
- 22 out of 30 surveyed analysts recommend buying AMD shares.
- The average price target for AMD is $182 by the end of 2025, representing a 46% increase from current levels.
Trade global index CFDs with zero commission and tight spreads. Open your FXOpen account now or learn more about trading index CFDs with FXOpen.
CFDs are complex instruments and come with a high risk of losing your money.
This article represents the opinion of the Companies operating under the FXOpen brand only. It is not to be construed as an offer, solicitation, or recommendation with respect to products and services provided by the Companies operating under the FXOpen brand, nor is it to be considered financial advice.
AMD Stock Price Rebounds from Yearly Low. 2025 Forecast
As the chart indicates, Advanced Micro Devices (AMD) reached its yearly low on 20th December, dropping below $120.
However, on Monday, AMD emerged as one of the top-performing stocks in the market. The trading session opened with a bullish gap, and by the close, the stock had gained approximately 4.5% compared to Friday's close. Meanwhile, the S&P 500 (US SPX 500 mini on FXOpen) rose by 0.7% on the same day.
According to technical analysis of the AMD stock chart, in 2024, the price formed a descending price channel (highlighted in red), characterised by the following:
- Bears broke below three trendlines, forming a structure reminiscent of Gann fans.
- The fourth (lowest) trendline could serve as a strong support level, preventing the price from reaching the bottom of the channel. The sharp upward reversal from the $120 level may be considered a sign supporting this scenario.
Price action suggests increasing demand, and analysts (as outlined below) believe buyers may play a more active role in 2025.
AMD Stock Price Forecast for 2025
In 2024, AMD underperformed the market. Amid the AI boom, Nvidia (NVDA) and Broadcom (AVGO) stocks reached all-time highs, while AMD's stock price dropped by about 12% since the beginning of 2024.
According to Yahoo Finance, the company’s strategic approach provides a rationale for investors to hold or buy AMD shares heading into 2025.
AMD has historically avoided introducing revolutionary products. Instead, the company enters established markets with alternative products that offer specific advantages.
This strategy could apply to the AI boom:
- 2024: AMD’s stock declines as the company adopts a wait-and-see approach, assessing the AI market's needs.
- 2025: AMD could benefit from the AI race, possibly through new processors in its EPYC series.
According to TipRanks:
- 22 out of 30 surveyed analysts recommend buying AMD shares.
- The average price target for AMD is $182 by the end of 2025, representing a 46% increase from current levels.
Trade global index CFDs with zero commission and tight spreads. Open your FXOpen account now or learn more about trading index CFDs with FXOpen.
CFDs are complex instruments and come with a high risk of losing your money.
This article represents the opinion of the Companies operating under the FXOpen brand only. It is not to be construed as an offer, solicitation, or recommendation with respect to products and services provided by the Companies operating under the FXOpen brand, nor is it to be considered financial advice.
👍2
#marketanalysis #MarketNews #NZDUSD #forextrading
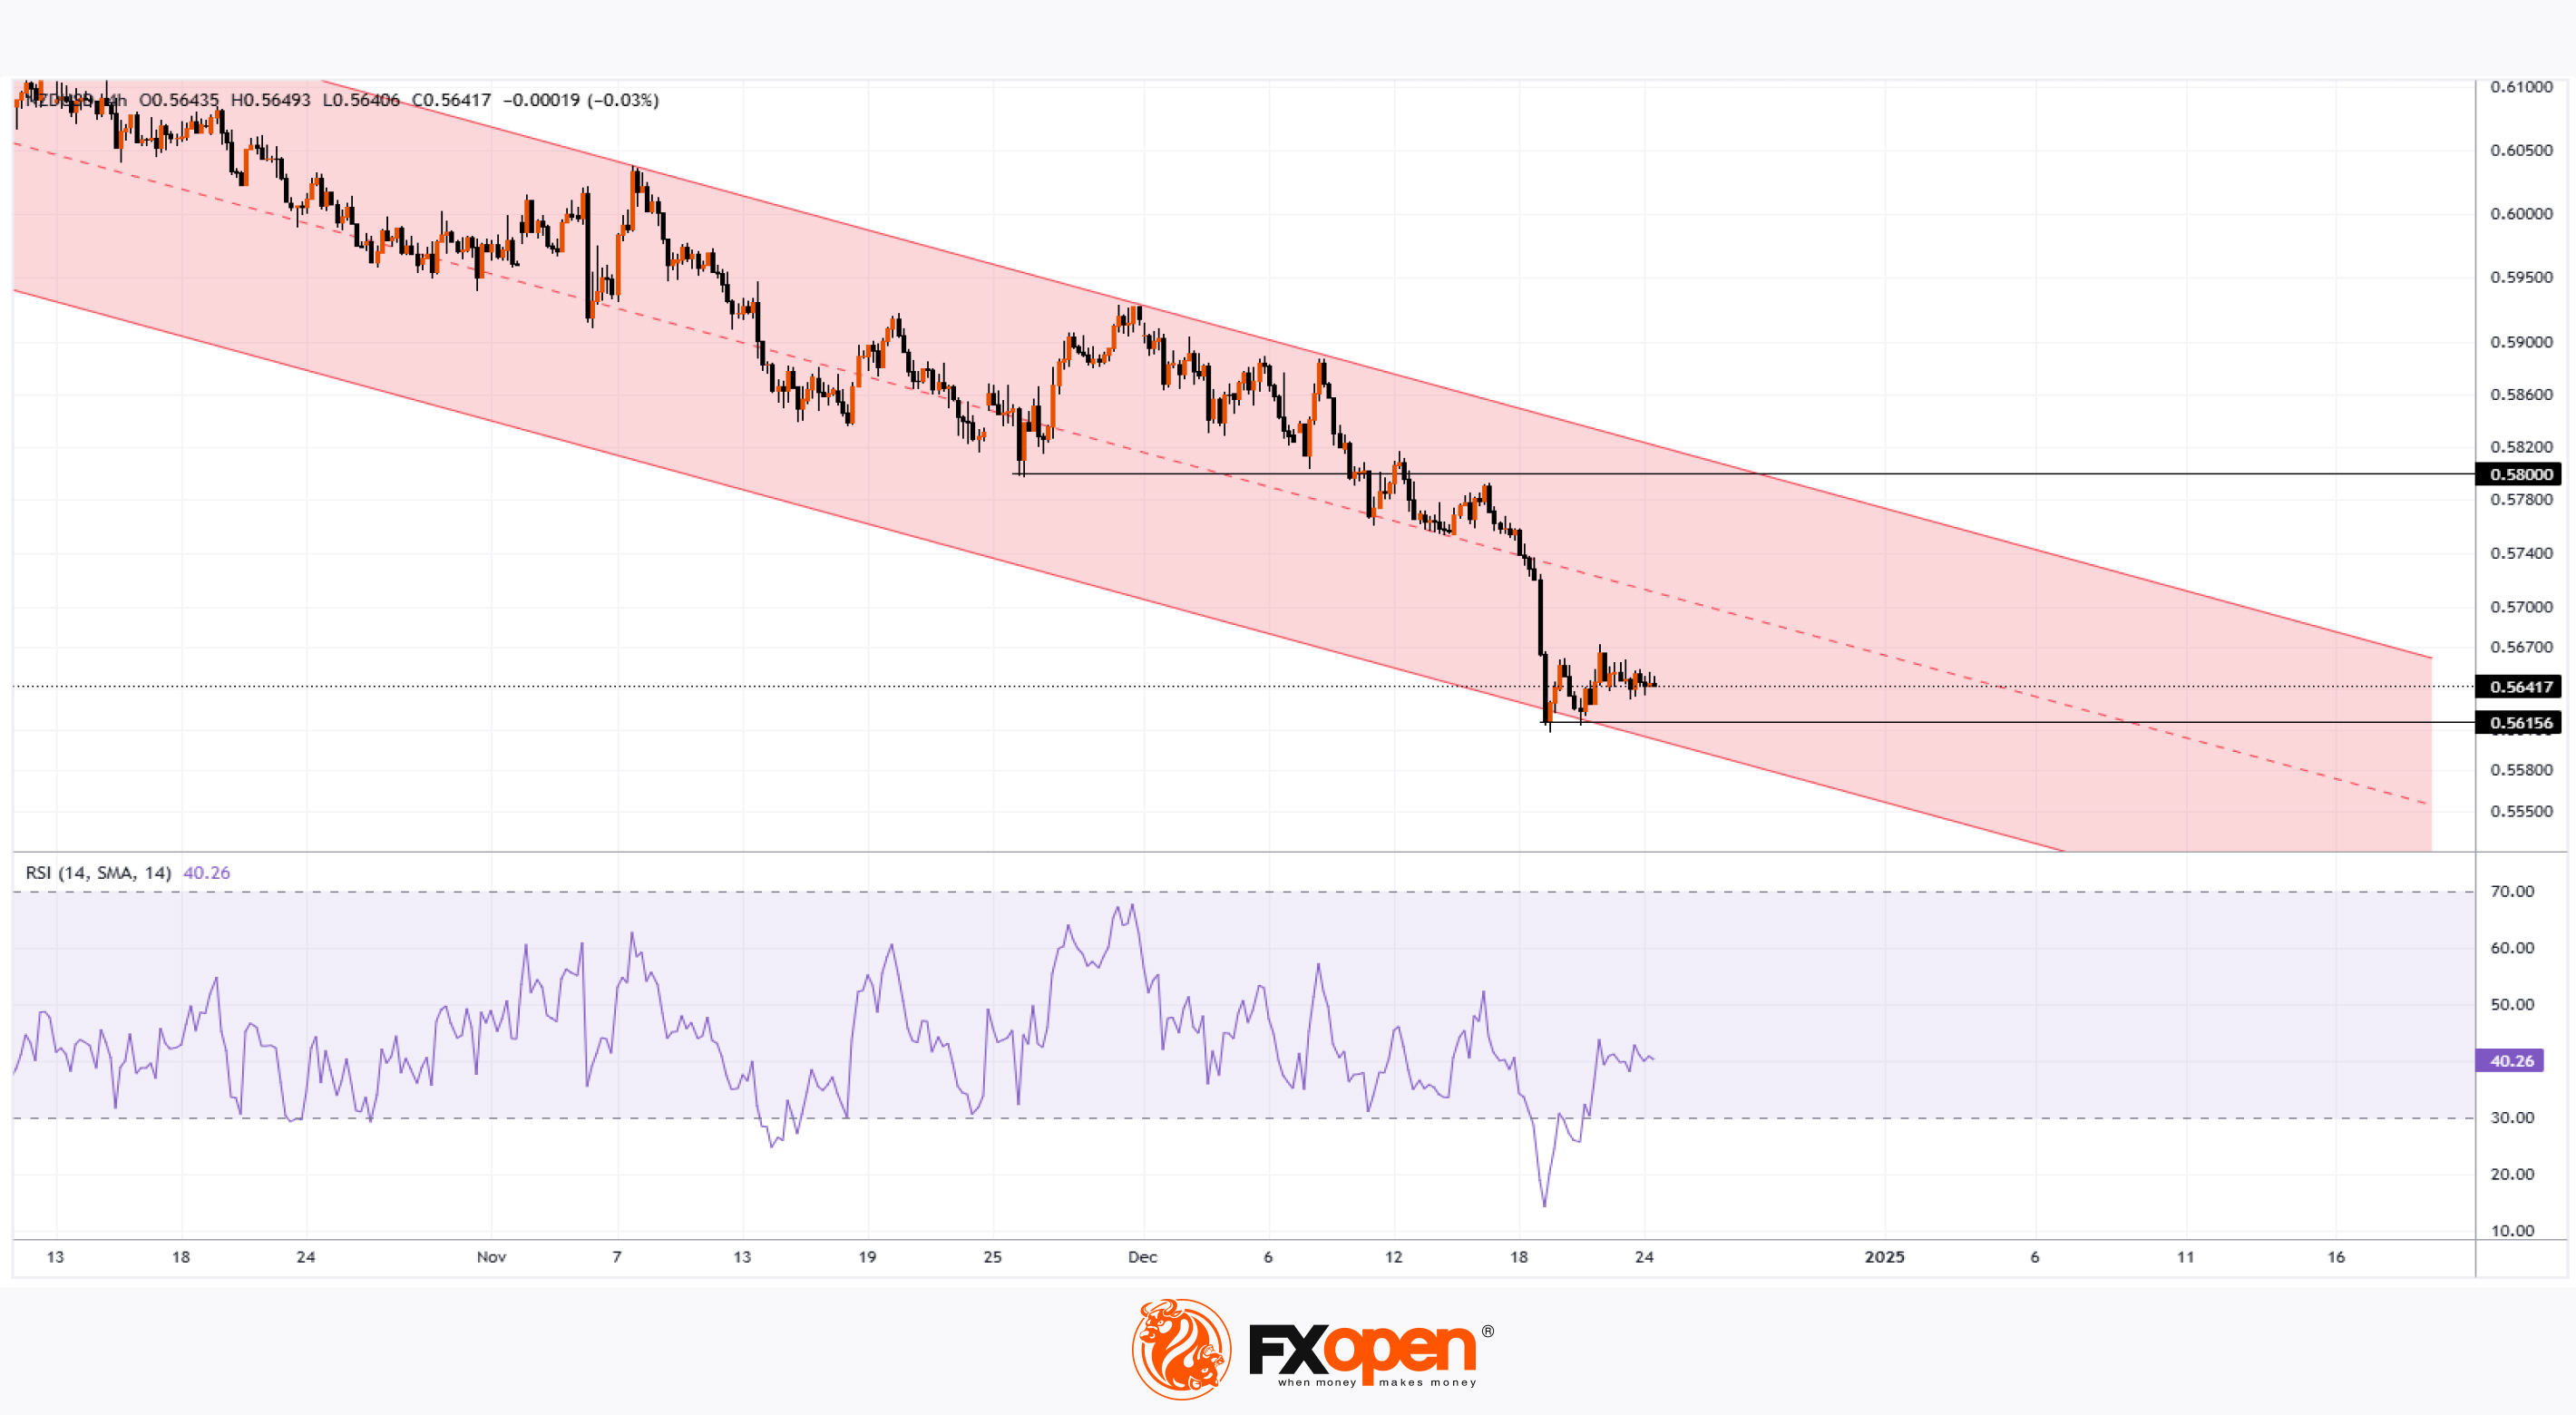
NZD/USD Stabilises Ahead of the Holidays
Forex trading is slowing down as the holidays approach, offering a pause after significant movements driven by various news events, including central bank decisions.
Notably, NZD/USD reached its lowest level since October 2022 at the end of last week.
The decline in NZD/USD has been influenced by two main factors:
1. The dollar gained momentum following the Federal Reserve's decision to lower the interest rate by 0.25% and its forward guidance for 2025.
2. According to Reuters:
→ New Zealand's economy contracted much more sharply than expected in the second and third quarters.
→ Market participants anticipate that the Reserve Bank of New Zealand may lower interest rates by 0.5% in February.
Technical analysis of the NZD/USD 4-hour chart depicts a bearish outlook:
- The 0.58 level, which served as support in November, turned into resistance in December.
- The price is currently hovering near the lower boundary of a descending channel that has been in place since October.
- The RSI indicator signals that the market is approaching oversold conditions.
While bears may attempt to extend the downtrend by pushing the price below last week’s low, this could create a divergence pattern on the RSI indicator, offering hope for a potential bullish reversal.
Trade over 50 forex markets 24 hours a day with FXOpen. Take advantage of low commissions, deep liquidity, and spreads from 0.0 pips. Open your FXOpen account now or learn more about trading forex with FXOpen.
CFDs are complex instruments and come with a high risk of losing your money.
This article represents the opinion of the Companies operating under the FXOpen brand only. It is not to be construed as an offer, solicitation, or recommendation with respect to products and services provided by the Companies operating under the FXOpen brand, nor is it to be considered financial advice.
NZD/USD Stabilises Ahead of the Holidays
Forex trading is slowing down as the holidays approach, offering a pause after significant movements driven by various news events, including central bank decisions.
Notably, NZD/USD reached its lowest level since October 2022 at the end of last week.
The decline in NZD/USD has been influenced by two main factors:
1. The dollar gained momentum following the Federal Reserve's decision to lower the interest rate by 0.25% and its forward guidance for 2025.
2. According to Reuters:
→ New Zealand's economy contracted much more sharply than expected in the second and third quarters.
→ Market participants anticipate that the Reserve Bank of New Zealand may lower interest rates by 0.5% in February.
Technical analysis of the NZD/USD 4-hour chart depicts a bearish outlook:
- The 0.58 level, which served as support in November, turned into resistance in December.
- The price is currently hovering near the lower boundary of a descending channel that has been in place since October.
- The RSI indicator signals that the market is approaching oversold conditions.
While bears may attempt to extend the downtrend by pushing the price below last week’s low, this could create a divergence pattern on the RSI indicator, offering hope for a potential bullish reversal.
Trade over 50 forex markets 24 hours a day with FXOpen. Take advantage of low commissions, deep liquidity, and spreads from 0.0 pips. Open your FXOpen account now or learn more about trading forex with FXOpen.
CFDs are complex instruments and come with a high risk of losing your money.
This article represents the opinion of the Companies operating under the FXOpen brand only. It is not to be construed as an offer, solicitation, or recommendation with respect to products and services provided by the Companies operating under the FXOpen brand, nor is it to be considered financial advice.
👍2
#stockmarket #stocktrading #MarketUpdates #MarketNews
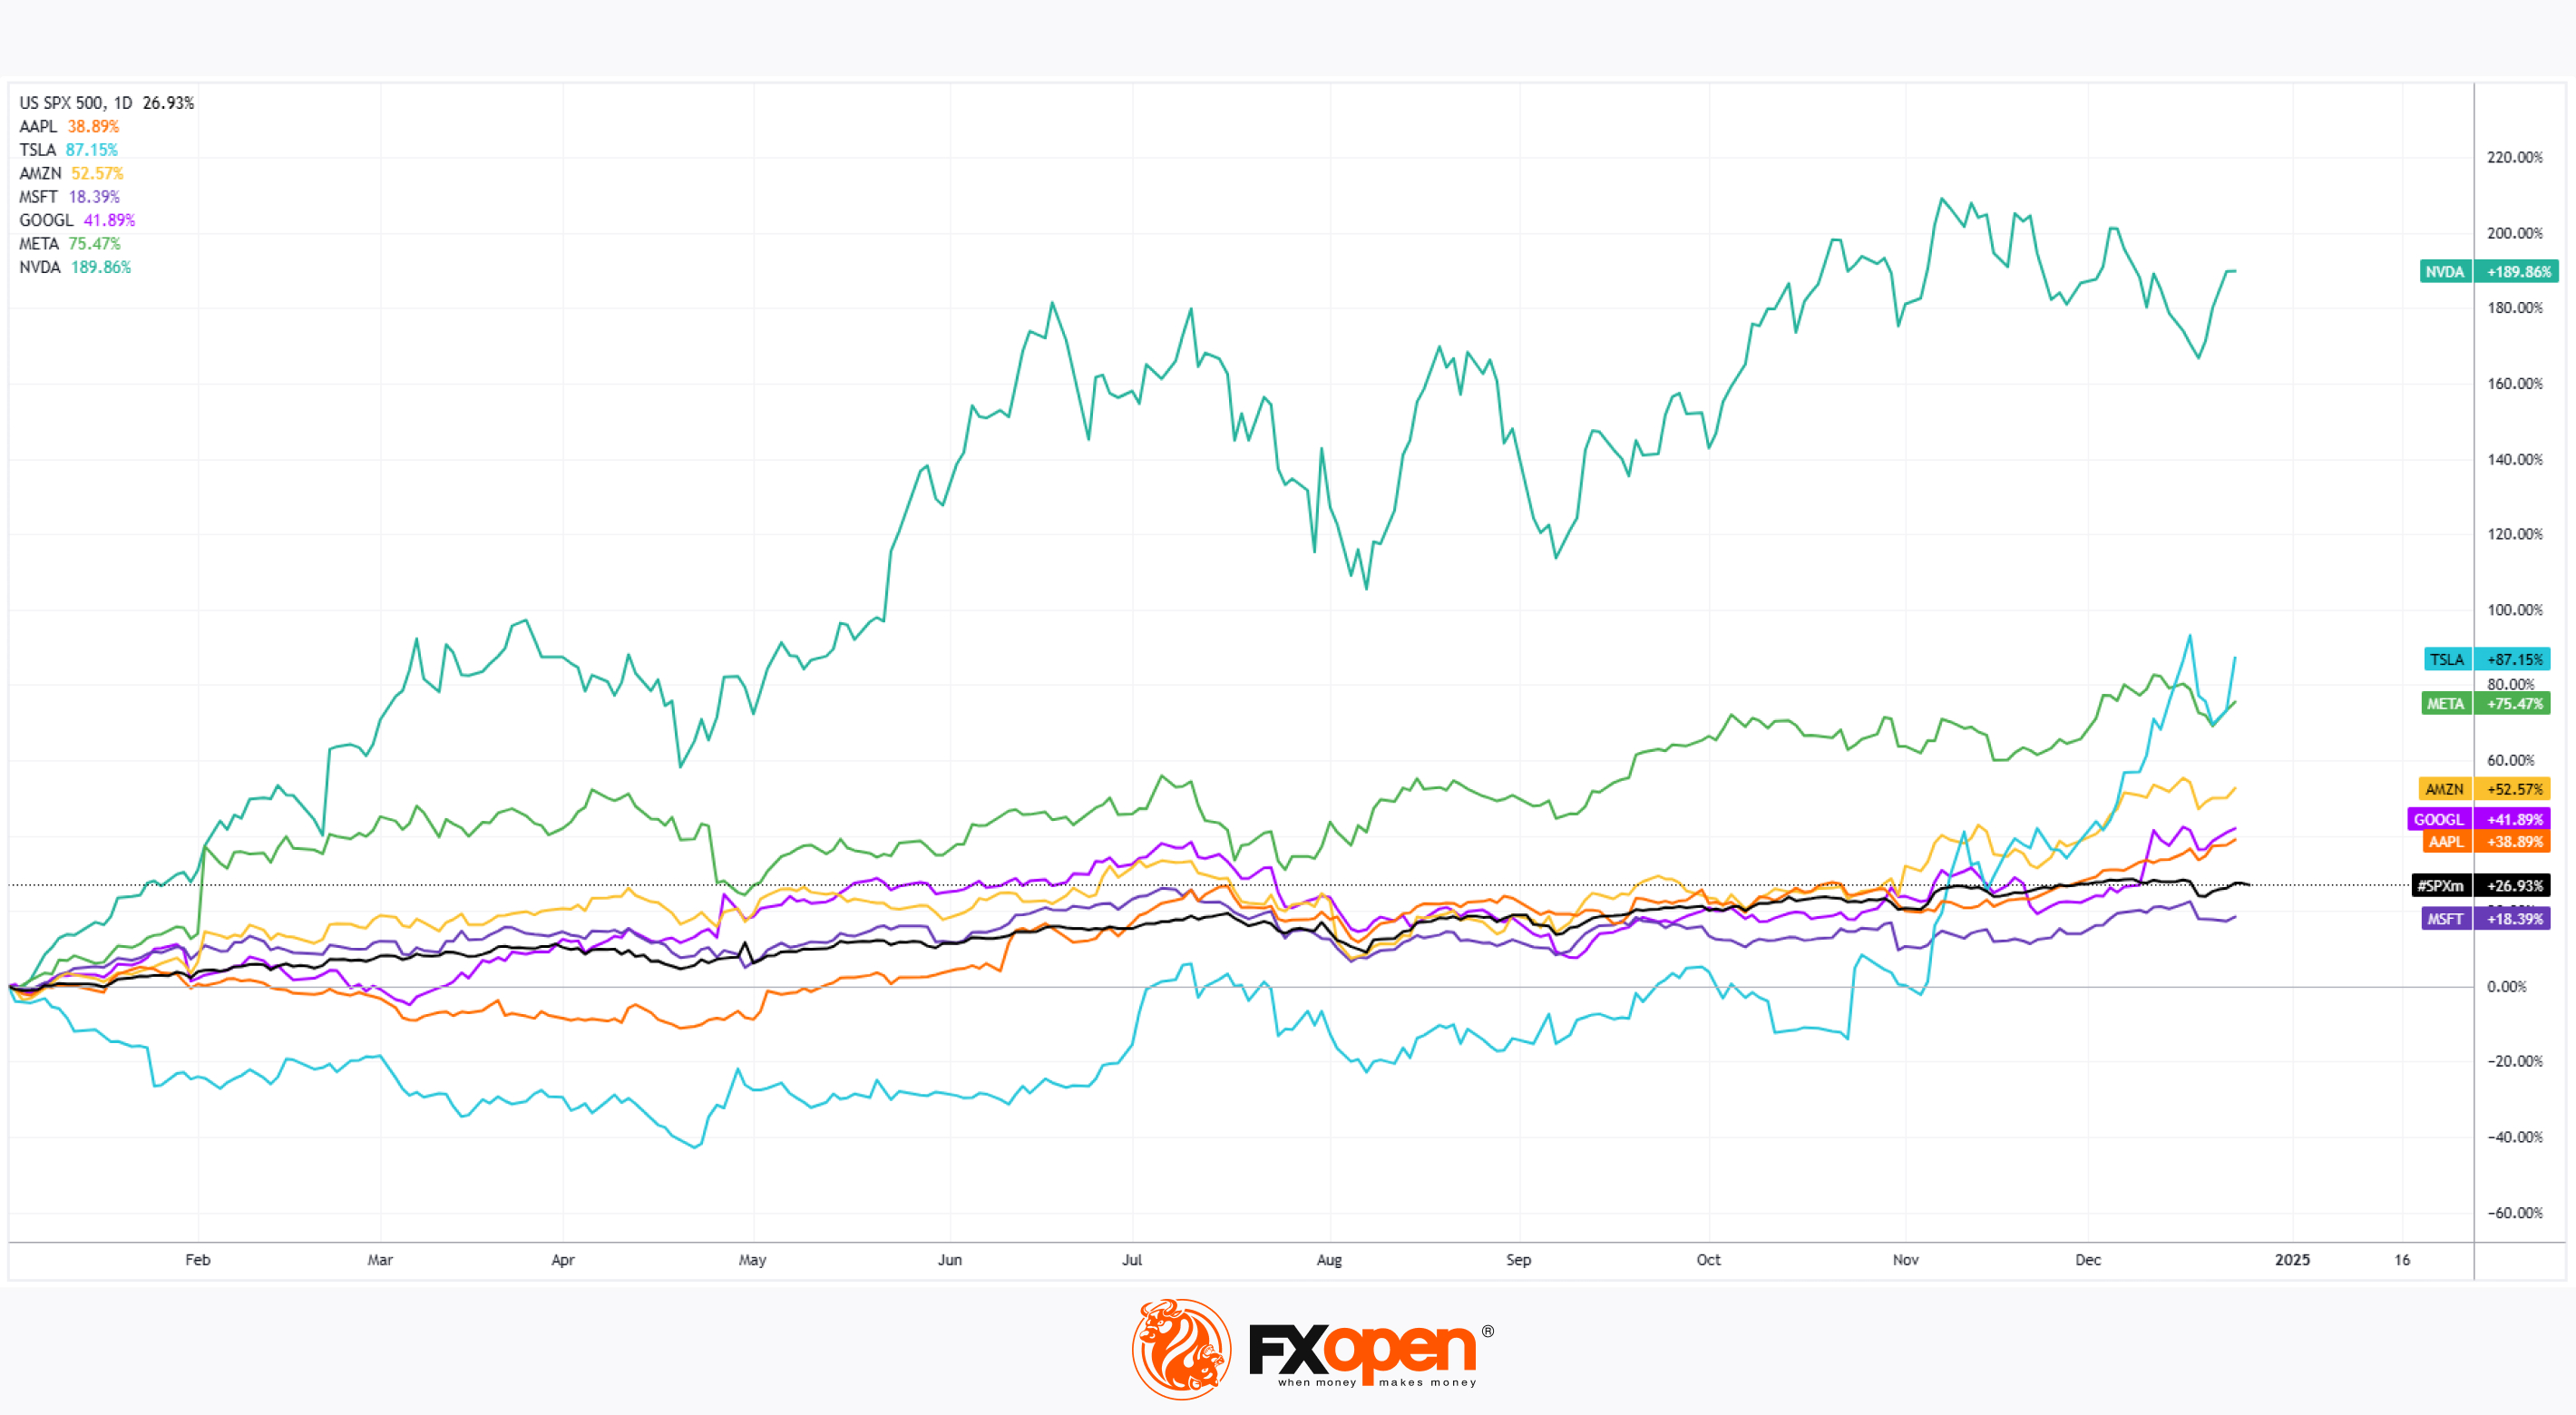
The Magnificent Seven Stocks: A Stellar 2024 and an Uncertain 2025
The Magnificent Seven is a term used to describe the seven largest technology companies that dominate the global economy through their scale, innovation, and high market capitalisation.
These companies are often key drivers of the US stock market, and in 2024 (as in 2023), they confirmed their leadership, with most outperforming the broader market indices.
Below are approximate performance estimates for the end of 2024:
→ S&P 500 (US SPX 500 mini on FXOpen): +26%
→ Apple (AAPL): +38%
→ Microsoft (MSFT): +18%
→ Amazon (AMZN): +52%
→ Alphabet (GOOGL): +42%
→ Meta Platforms (META): +43%
→ Tesla (TSLA): +87%
→ Nvidia (NVDA): +189%
What does 2025 hold for the Magnificent Seven?
Motley Fool offers a cautious outlook for the coming year, suggesting that some of these leaders may run out of steam due to inflated stock prices relative to their intrinsic value and profit forecasts.
Zacks analysts have examined the fundamentals and identified three stocks from the Magnificent 7 that are worth considering for value investors:
1. Alphabet (GOOGL)
Alphabet has the lowest price-to-earnings (P/E) ratio among the Magnificent 7, standing at 23.9. While this doesn’t say it is a value stock (value stocks typically have a P/E below 15), it is relatively cheap compared to its peers. Moreover, Alphabet now pays dividends.
2. Meta Platforms (META)
Meta Platforms remains attractively valued with a forward P/E of just 25.8. It also boasts a relatively low price/earnings-to-growth (PEG) ratio of 1.3 (a PEG below 1.0 indicates a reasonable price relative to expected profit growth). The 1.3 PEG is appealing, and like Alphabet, Meta has started paying dividends.
3. Amazon.com (AMZN)
Once aiming to be the "store for everything," Amazon has expanded far beyond this with its AWS division, Whole Foods, sports and entertainment programming on Prime, and even chip manufacturing. Amazon has the lowest price-to-sales (P/S) ratio among the Magnificent Seven, at 3.8. Although a P/S below 1.0 is typically considered attractive, Amazon remains appealing to investors. For comparison, Microsoft’s P/S ratio is 13.1, while Nvidia’s is 29.
Trade global index CFDs with zero commission and tight spreads. Open your FXOpen account now or learn more about trading index CFDs with FXOpen.
CFDs are complex instruments and come with a high risk of losing your money.
This article represents the opinion of the Companies operating under the FXOpen brand only. It is not to be construed as an offer, solicitation, or recommendation with respect to products and services provided by the Companies operating under the FXOpen brand, nor is it to be considered financial advice.
The Magnificent Seven Stocks: A Stellar 2024 and an Uncertain 2025
The Magnificent Seven is a term used to describe the seven largest technology companies that dominate the global economy through their scale, innovation, and high market capitalisation.
These companies are often key drivers of the US stock market, and in 2024 (as in 2023), they confirmed their leadership, with most outperforming the broader market indices.
Below are approximate performance estimates for the end of 2024:
→ S&P 500 (US SPX 500 mini on FXOpen): +26%
→ Apple (AAPL): +38%
→ Microsoft (MSFT): +18%
→ Amazon (AMZN): +52%
→ Alphabet (GOOGL): +42%
→ Meta Platforms (META): +43%
→ Tesla (TSLA): +87%
→ Nvidia (NVDA): +189%
What does 2025 hold for the Magnificent Seven?
Motley Fool offers a cautious outlook for the coming year, suggesting that some of these leaders may run out of steam due to inflated stock prices relative to their intrinsic value and profit forecasts.
Zacks analysts have examined the fundamentals and identified three stocks from the Magnificent 7 that are worth considering for value investors:
1. Alphabet (GOOGL)
Alphabet has the lowest price-to-earnings (P/E) ratio among the Magnificent 7, standing at 23.9. While this doesn’t say it is a value stock (value stocks typically have a P/E below 15), it is relatively cheap compared to its peers. Moreover, Alphabet now pays dividends.
2. Meta Platforms (META)
Meta Platforms remains attractively valued with a forward P/E of just 25.8. It also boasts a relatively low price/earnings-to-growth (PEG) ratio of 1.3 (a PEG below 1.0 indicates a reasonable price relative to expected profit growth). The 1.3 PEG is appealing, and like Alphabet, Meta has started paying dividends.
3. Amazon.com (AMZN)
Once aiming to be the "store for everything," Amazon has expanded far beyond this with its AWS division, Whole Foods, sports and entertainment programming on Prime, and even chip manufacturing. Amazon has the lowest price-to-sales (P/S) ratio among the Magnificent Seven, at 3.8. Although a P/S below 1.0 is typically considered attractive, Amazon remains appealing to investors. For comparison, Microsoft’s P/S ratio is 13.1, while Nvidia’s is 29.
Trade global index CFDs with zero commission and tight spreads. Open your FXOpen account now or learn more about trading index CFDs with FXOpen.
CFDs are complex instruments and come with a high risk of losing your money.
This article represents the opinion of the Companies operating under the FXOpen brand only. It is not to be construed as an offer, solicitation, or recommendation with respect to products and services provided by the Companies operating under the FXOpen brand, nor is it to be considered financial advice.
👍2
#stockmarket #stocktrading #AAPL #MarketUpdates
Apple (AAPL) Stock Ends the Year Near Record Highs
In 2024, Apple Inc. (AAPL) shares surged by approximately 35%, fueled by the introduction of Apple Intelligence, a groundbreaking AI technology integrated into the company's ecosystem. This feature, designed for iPhones and other Apple products, enhances both productivity and user experience.
Following the June launch of Apple Intelligence, AAPL stock price saw a sharp rise (indicated by the arrow), marking the beginning of a steady upward trend within a channel (highlighted in blue) that remains intact.
In early August, a sell-off in Japan's stock market and fears of a global recession defined the channel's lower boundary. The stock subsequently rebounded, with prices fluctuating around the channel's central line (bolded) throughout autumn. This balance signified equilibrium between buyers and sellers.
As 2024 comes to a close, AAPL shares exhibit a strong upward momentum, resembling a Santa Claus rally. A new, steeper upward channel (depicted in purple) has emerged on the chart.
Analyst Predictions and Market Sentiment
Analysts are optimistic about AAPL’s prospects. Daniel Ives of Wedbush recently raised his price target for AAPL from $300 to $325, citing the underappreciated potential of Apple's AI initiatives. Ives believes the company is entering a multi-year iPhone upgrade cycle, driven by artificial intelligence integration.
Looking ahead to 2025, analysts project record-breaking iPhone sales of approximately 240 million units, marking a historic achievement for Apple. This momentum could drive AAPL shares to new highs. While the long-term outlook is positive, near-term risks remain.
Current Technical Indicators and Risks
Current technical indicators suggest AAPL may face a short-term correction:
-The price is approaching the upper boundary of the channel.
-The RSI indicates overbought conditions, with signs of a potential bearish divergence.
-Traders should consider the possibility of a pullback below the key psychological level of $250, with the price potentially retreating to the lower purple boundary.
TipRanks Insights
-Analysts’ average price target for AAPL by the end of 2025: $245.28.
-Among 29 analysts, 19 recommend buying, while 2 suggest selling.
Trade global index CFDs with zero commission and tight spreads. Open your FXOpen account now or learn more about trading index CFDs with FXOpen.
CFDs are complex instruments and come with a high risk of losing your money.
This article represents the opinion of the Companies operating under the FXOpen brand only. It is not to be construed as an offer, solicitation, or recommendation with respect to products and services provided by the Companies operating under the FXOpen brand, nor is it to be considered financial advice.
Apple (AAPL) Stock Ends the Year Near Record Highs
In 2024, Apple Inc. (AAPL) shares surged by approximately 35%, fueled by the introduction of Apple Intelligence, a groundbreaking AI technology integrated into the company's ecosystem. This feature, designed for iPhones and other Apple products, enhances both productivity and user experience.
Following the June launch of Apple Intelligence, AAPL stock price saw a sharp rise (indicated by the arrow), marking the beginning of a steady upward trend within a channel (highlighted in blue) that remains intact.
In early August, a sell-off in Japan's stock market and fears of a global recession defined the channel's lower boundary. The stock subsequently rebounded, with prices fluctuating around the channel's central line (bolded) throughout autumn. This balance signified equilibrium between buyers and sellers.
As 2024 comes to a close, AAPL shares exhibit a strong upward momentum, resembling a Santa Claus rally. A new, steeper upward channel (depicted in purple) has emerged on the chart.
Analyst Predictions and Market Sentiment
Analysts are optimistic about AAPL’s prospects. Daniel Ives of Wedbush recently raised his price target for AAPL from $300 to $325, citing the underappreciated potential of Apple's AI initiatives. Ives believes the company is entering a multi-year iPhone upgrade cycle, driven by artificial intelligence integration.
Looking ahead to 2025, analysts project record-breaking iPhone sales of approximately 240 million units, marking a historic achievement for Apple. This momentum could drive AAPL shares to new highs. While the long-term outlook is positive, near-term risks remain.
Current Technical Indicators and Risks
Current technical indicators suggest AAPL may face a short-term correction:
-The price is approaching the upper boundary of the channel.
-The RSI indicates overbought conditions, with signs of a potential bearish divergence.
-Traders should consider the possibility of a pullback below the key psychological level of $250, with the price potentially retreating to the lower purple boundary.
TipRanks Insights
-Analysts’ average price target for AAPL by the end of 2025: $245.28.
-Among 29 analysts, 19 recommend buying, while 2 suggest selling.
Trade global index CFDs with zero commission and tight spreads. Open your FXOpen account now or learn more about trading index CFDs with FXOpen.
CFDs are complex instruments and come with a high risk of losing your money.
This article represents the opinion of the Companies operating under the FXOpen brand only. It is not to be construed as an offer, solicitation, or recommendation with respect to products and services provided by the Companies operating under the FXOpen brand, nor is it to be considered financial advice.

👍2
#USDJPY #forextrading #marketanalysis
USD/JPY Analysis: Pair Reaches 5-Month High
The Japanese yen remains under pressure, trading near a five-month low against the US dollar. This trend is primarily driven by differences in monetary policy approaches.
On one side, the Federal Reserve maintains a hawkish stance, signalling a gradual slowing of monetary easing in 2025.
On the other, the Bank of Japan continues its cautious approach to policy tightening, as confirmed by a Reuters report published today. Although Japan’s Finance Minister issued warnings this week about potential market interventions, these statements have had little immediate impact.
According to technical analysis of the USD/JPY chart, the pair is trending within a well-defined upward channel (marked in blue) with the following notable developments:
→ In September, the psychological level of 140 yen per dollar served as strong support for bulls, while in December, this shifted to 150 yen per dollar (as indicated by arrows).
→ Since September, price movements have established a steeper upward channel (highlighted in purple).
→ The pair has now reached the median line of the longer-term blue channel, suggesting a potential for more stable trading. This stability may also be supported by reduced trading activity during the holiday season.
The current price action mirrors the conditions seen in summer 2024, when the pair steadily rose toward the critical level of 160 yen per dollar. As we enter early 2025, bulls may once again test this key threshold, seeking to push the pair higher.
Trade over 50 forex markets 24 hours a day with FXOpen. Take advantage of low commissions, deep liquidity, and spreads from 0.0 pips. Open your FXOpen account now or learn more about trading forex with FXOpen.
CFDs are complex instruments and come with a high risk of losing your money.
This article represents the opinion of the Companies operating under the FXOpen brand only. It is not to be construed as an offer, solicitation, or recommendation with respect to products and services provided by the Companies operating under the FXOpen brand, nor is it to be considered financial advice.
USD/JPY Analysis: Pair Reaches 5-Month High
The Japanese yen remains under pressure, trading near a five-month low against the US dollar. This trend is primarily driven by differences in monetary policy approaches.
On one side, the Federal Reserve maintains a hawkish stance, signalling a gradual slowing of monetary easing in 2025.
On the other, the Bank of Japan continues its cautious approach to policy tightening, as confirmed by a Reuters report published today. Although Japan’s Finance Minister issued warnings this week about potential market interventions, these statements have had little immediate impact.
According to technical analysis of the USD/JPY chart, the pair is trending within a well-defined upward channel (marked in blue) with the following notable developments:
→ In September, the psychological level of 140 yen per dollar served as strong support for bulls, while in December, this shifted to 150 yen per dollar (as indicated by arrows).
→ Since September, price movements have established a steeper upward channel (highlighted in purple).
→ The pair has now reached the median line of the longer-term blue channel, suggesting a potential for more stable trading. This stability may also be supported by reduced trading activity during the holiday season.
The current price action mirrors the conditions seen in summer 2024, when the pair steadily rose toward the critical level of 160 yen per dollar. As we enter early 2025, bulls may once again test this key threshold, seeking to push the pair higher.
Trade over 50 forex markets 24 hours a day with FXOpen. Take advantage of low commissions, deep liquidity, and spreads from 0.0 pips. Open your FXOpen account now or learn more about trading forex with FXOpen.
CFDs are complex instruments and come with a high risk of losing your money.
This article represents the opinion of the Companies operating under the FXOpen brand only. It is not to be construed as an offer, solicitation, or recommendation with respect to products and services provided by the Companies operating under the FXOpen brand, nor is it to be considered financial advice.
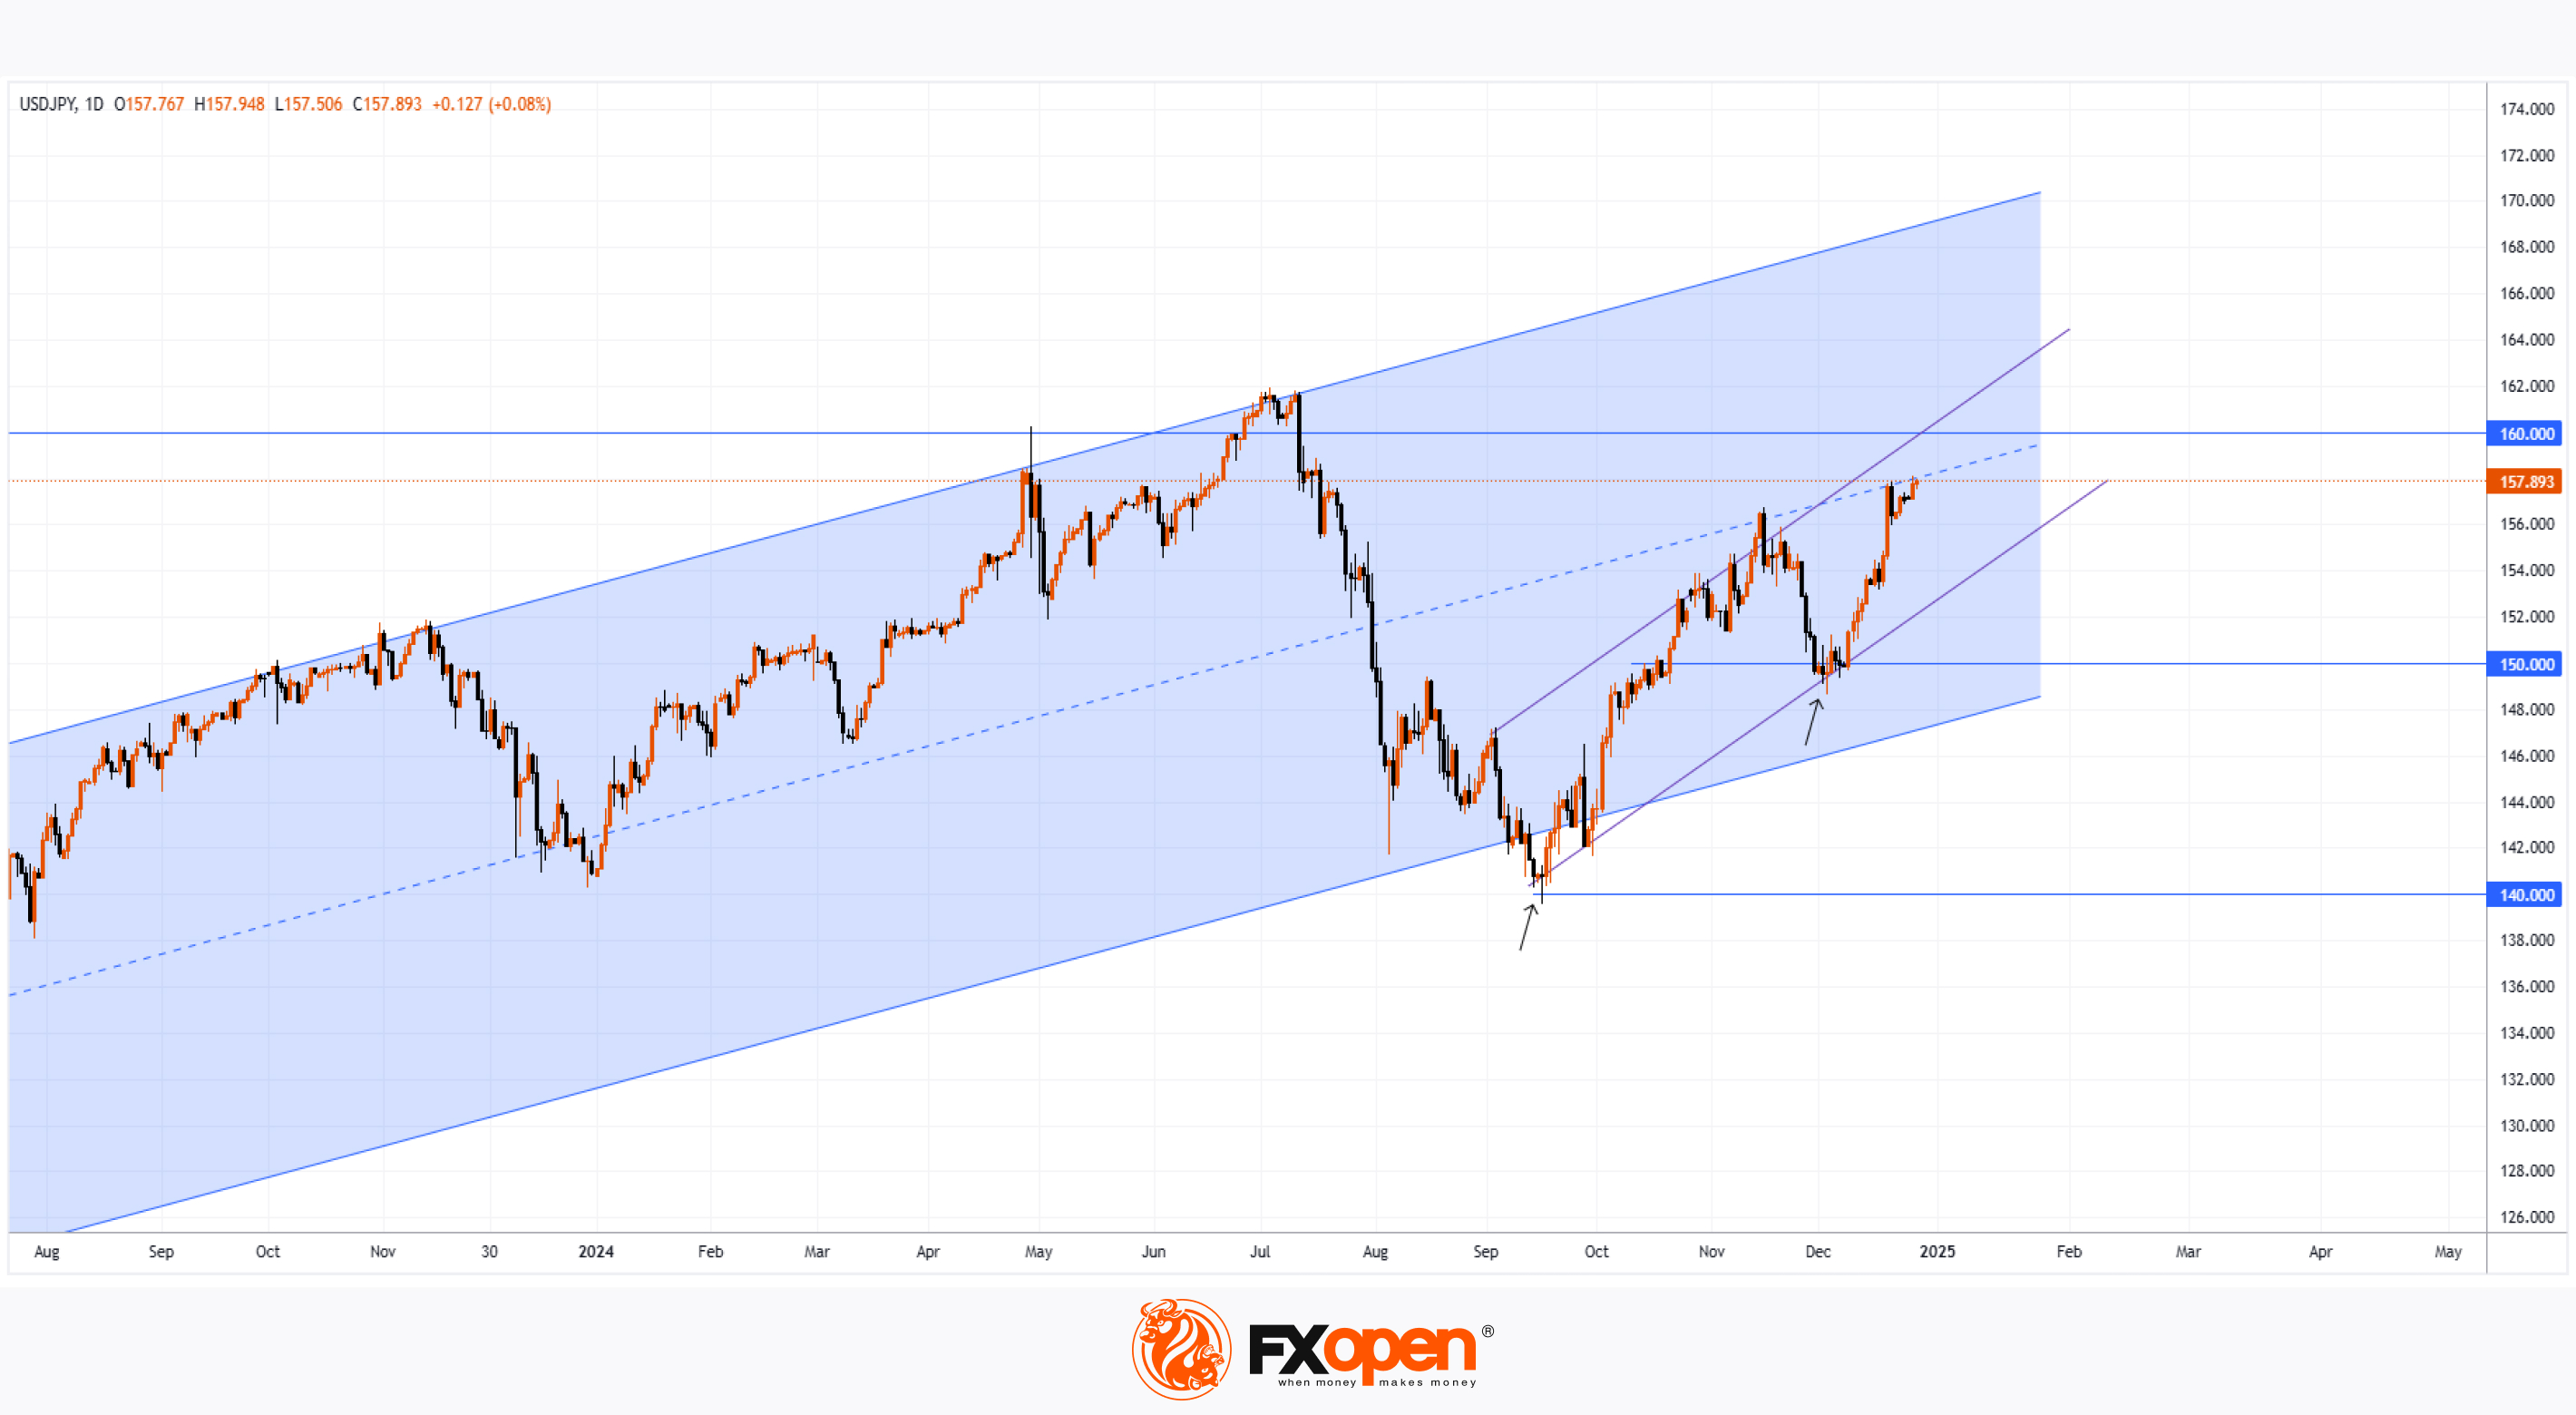
👍3
#MarketNews #stocktrading #nikkei225 #stocks
Nikkei 225 Struggles to Hold Above the Psychological Level
The Nikkei 225 (Japan 225 on FXOpen) has risen nearly 20% in 2024, marking its best performance since 1989, according to Trading Economics. This impressive gain is especially noteworthy considering the market plunge in early August, triggered partly by the Bank of Japan’s historic interest rate hike.
According to today's chart of the Japanese stock market index Nikkei 225 (Japan 225 on FXOpen):
→ Late last week (marked with an arrow), the index surpassed the psychological 40,000 level, reaching a 5-month high.
→ However, as this week began, the Nikkei 225 dropped below 40,000, failing to sustain its position above this key level.
Potential influencing factors:
→ Portfolio adjustments as the new year begins.
→ News about a potential merger between Nissan and Honda.
→ A weakening yen, which supports Japan’s export-driven industries.
Technical analysis of the Japan 225 (Japan 225 on FXOpen) chart shows that:
→ Bulls have been forming an A-B-C-D-E structure of higher highs, outlining an ascending channel (shown in blue). Despite this, the 40,000 level remains a strong resistance point.
→ The bears are gaining an edge with Line 1, which splits the channel into quarters and signals increasing resistance.
Given these dynamics, Friday’s peak could be a false bullish breakout. The Nikkei 225 (Japan 225 on FXOpen) might retreat towards the median line or drop further to test support around 37,800.
Trade global index CFDs with zero commission and tight spreads. Open your FXOpen account now or learn more about trading index CFDs with FXOpen.
CFDs are complex instruments and come with a high risk of losing your money.
This article represents the opinion of the Companies operating under the FXOpen brand only. It is not to be construed as an offer, solicitation, or recommendation with respect to products and services provided by the Companies operating under the FXOpen brand, nor is it to be considered financial advice.
Nikkei 225 Struggles to Hold Above the Psychological Level
The Nikkei 225 (Japan 225 on FXOpen) has risen nearly 20% in 2024, marking its best performance since 1989, according to Trading Economics. This impressive gain is especially noteworthy considering the market plunge in early August, triggered partly by the Bank of Japan’s historic interest rate hike.
According to today's chart of the Japanese stock market index Nikkei 225 (Japan 225 on FXOpen):
→ Late last week (marked with an arrow), the index surpassed the psychological 40,000 level, reaching a 5-month high.
→ However, as this week began, the Nikkei 225 dropped below 40,000, failing to sustain its position above this key level.
Potential influencing factors:
→ Portfolio adjustments as the new year begins.
→ News about a potential merger between Nissan and Honda.
→ A weakening yen, which supports Japan’s export-driven industries.
Technical analysis of the Japan 225 (Japan 225 on FXOpen) chart shows that:
→ Bulls have been forming an A-B-C-D-E structure of higher highs, outlining an ascending channel (shown in blue). Despite this, the 40,000 level remains a strong resistance point.
→ The bears are gaining an edge with Line 1, which splits the channel into quarters and signals increasing resistance.
Given these dynamics, Friday’s peak could be a false bullish breakout. The Nikkei 225 (Japan 225 on FXOpen) might retreat towards the median line or drop further to test support around 37,800.
Trade global index CFDs with zero commission and tight spreads. Open your FXOpen account now or learn more about trading index CFDs with FXOpen.
CFDs are complex instruments and come with a high risk of losing your money.
This article represents the opinion of the Companies operating under the FXOpen brand only. It is not to be construed as an offer, solicitation, or recommendation with respect to products and services provided by the Companies operating under the FXOpen brand, nor is it to be considered financial advice.
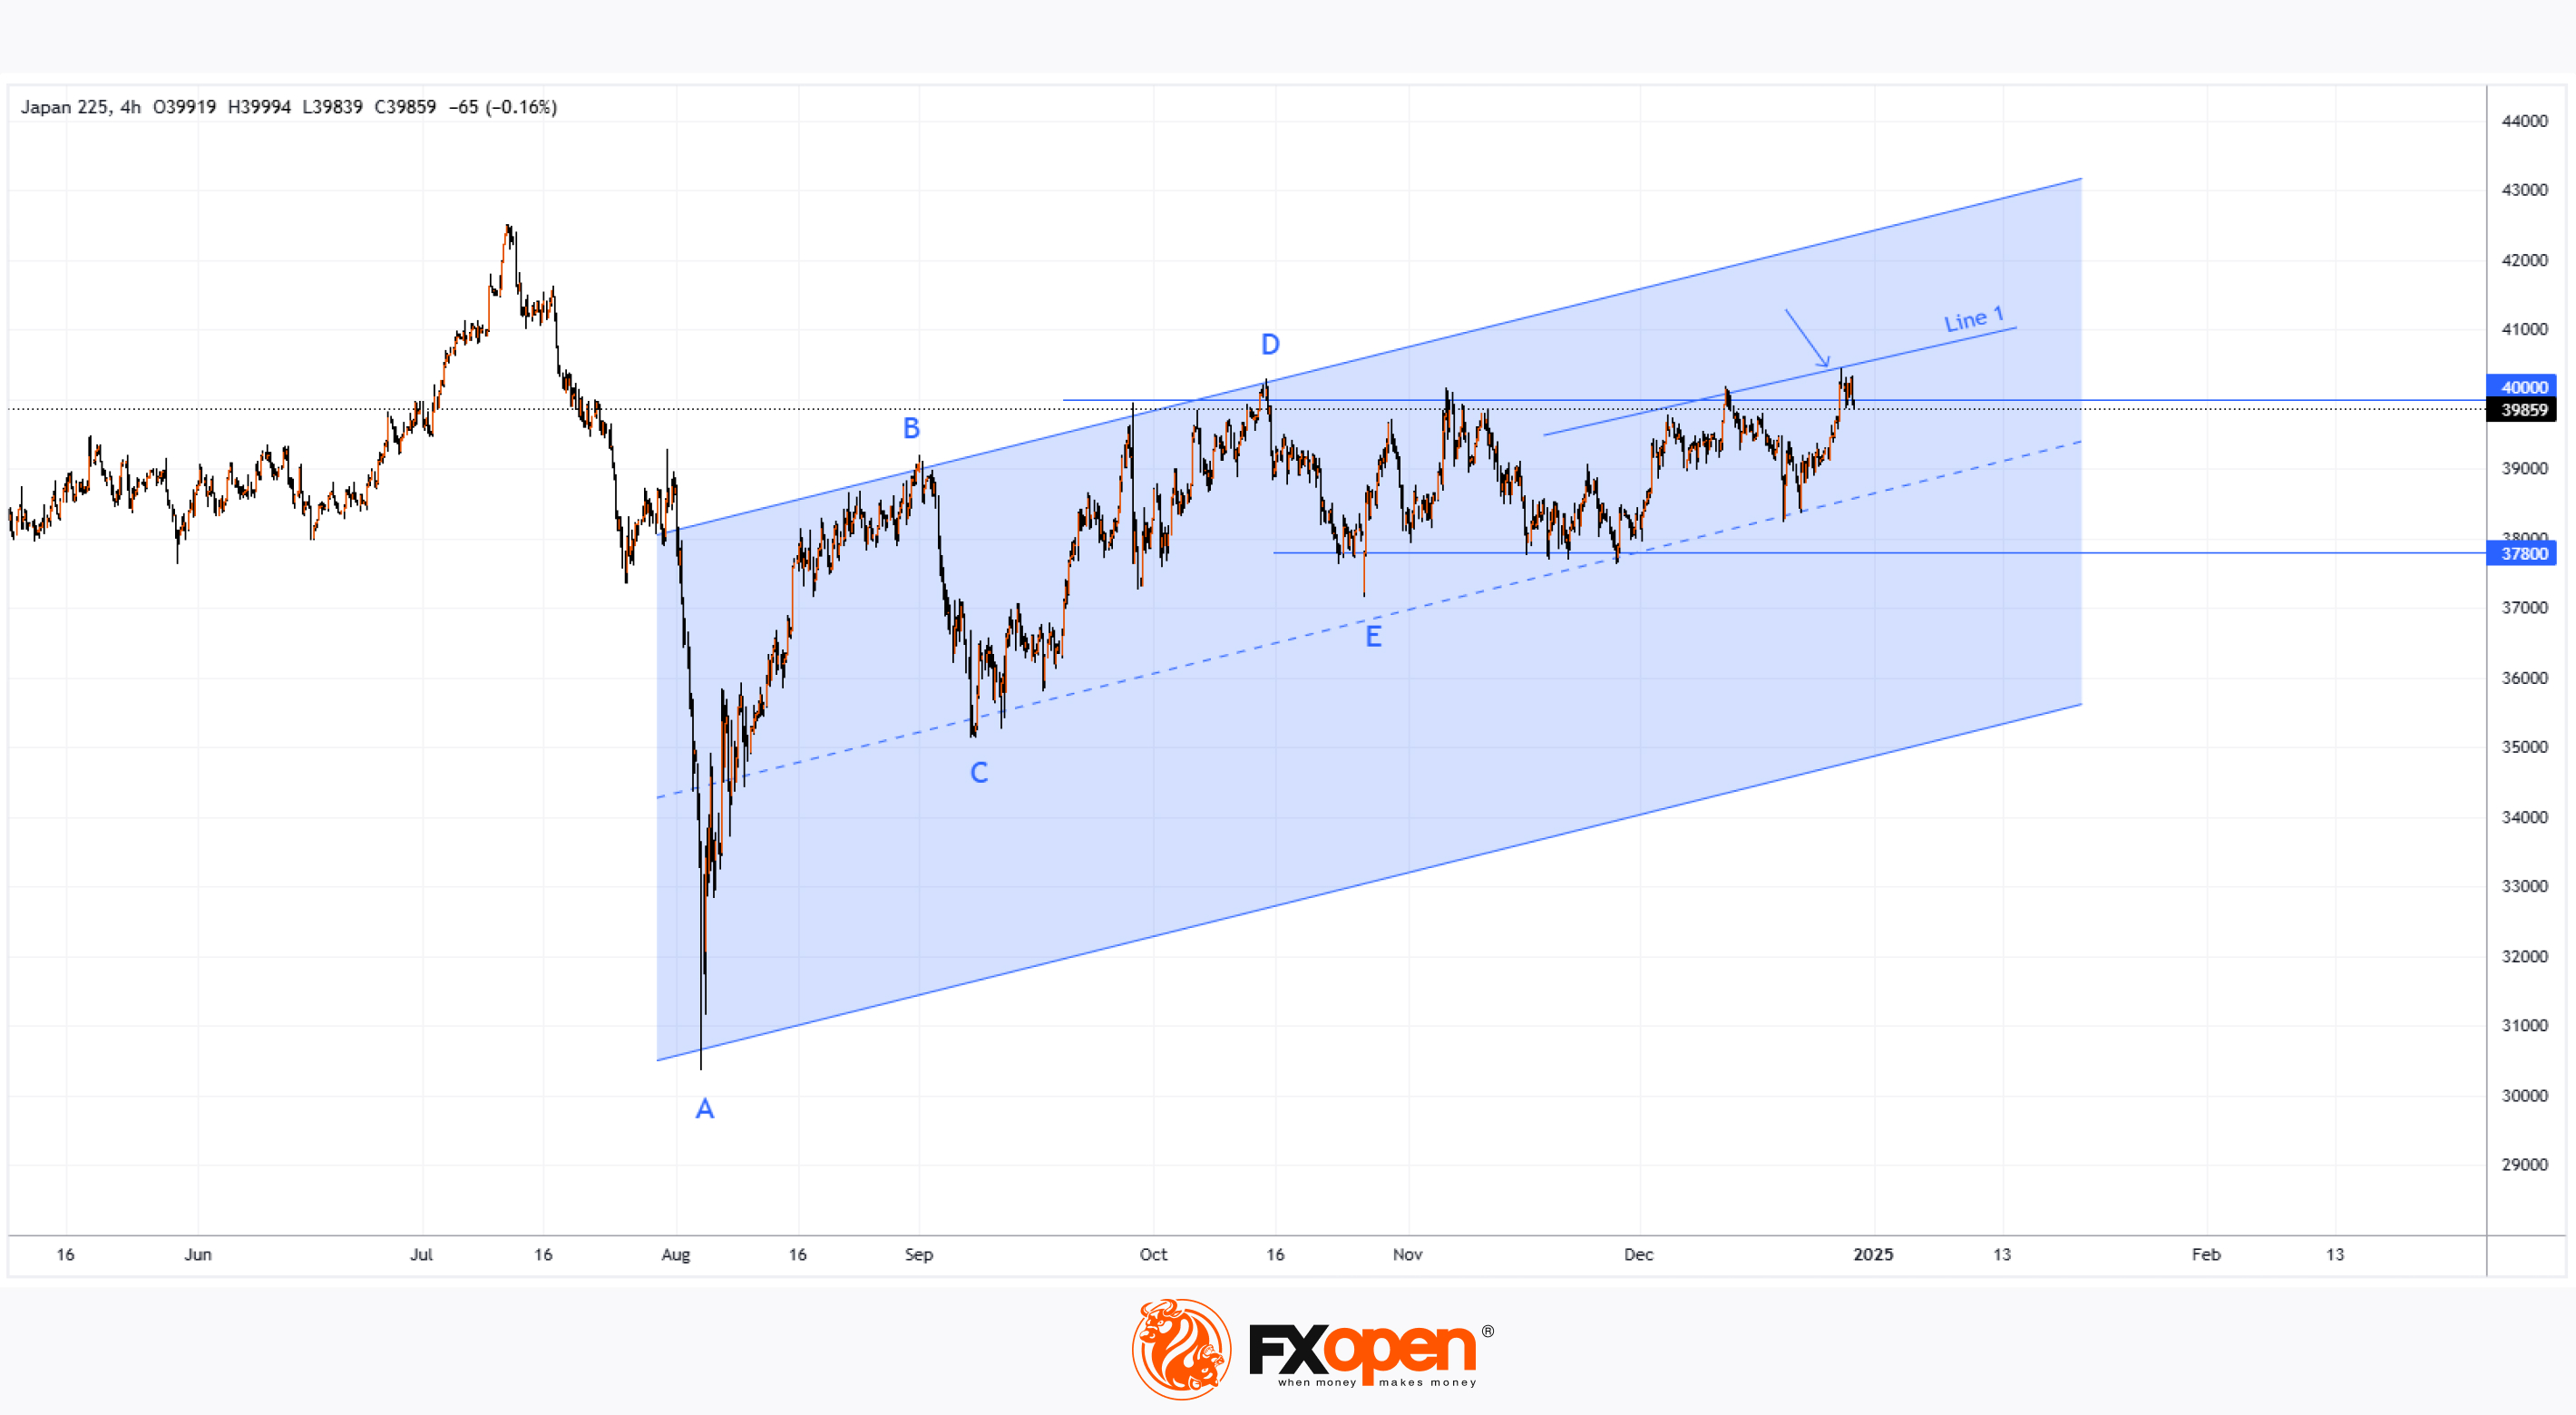
👍1
#usdollar #forextrading #forex #marketanalysis
The Dollar Index Rises by 6.7% in 2024
Throughout 2024, the US dollar traded with mixed dynamics but showed consistent strengthening over the past three months.
According to WSJ and Reuters, the following factors contributed to this growth:
→ Reports of a strong US economy and expectations that further interest rate cuts by the Federal Reserve will be limited.
→ Projections of policies under President-elect Donald Trump, which are anticipated to focus on tax reductions, increased tariffs, and stricter immigration controls.
During the low-volatility holiday trading period, the US Dollar Index—a tool measuring the dollar's strength against a basket of major currencies—hovered around a two-year high, where it may close a strong year.
Meanwhile, the euro remains near two-year lows, but bulls hold onto hope.
As technical analysis of the EUR/USD chart indicates today:
→ The price is near a support level formed by an ascending channel (marked in blue).
→ Simultaneously, price fluctuations are shaping a bullish “cup and handle” pattern below the 1.0444 level—signalling growing interest among buyers.
A breakout above the red descending trendline could help bulls start 2025 confidently, potentially pushing the price higher from the lower boundary of the channel.
Trade over 50 forex markets 24 hours a day with FXOpen. Take advantage of low commissions, deep liquidity, and spreads from 0.0 pips. Open your FXOpen account now or learn more about trading forex with FXOpen.
CFDs are complex instruments and come with a high risk of losing your money.
This article represents the opinion of the Companies operating under the FXOpen brand only. It is not to be construed as an offer, solicitation, or recommendation with respect to products and services provided by the Companies operating under the FXOpen brand, nor is it to be considered financial advice.
The Dollar Index Rises by 6.7% in 2024
Throughout 2024, the US dollar traded with mixed dynamics but showed consistent strengthening over the past three months.
According to WSJ and Reuters, the following factors contributed to this growth:
→ Reports of a strong US economy and expectations that further interest rate cuts by the Federal Reserve will be limited.
→ Projections of policies under President-elect Donald Trump, which are anticipated to focus on tax reductions, increased tariffs, and stricter immigration controls.
During the low-volatility holiday trading period, the US Dollar Index—a tool measuring the dollar's strength against a basket of major currencies—hovered around a two-year high, where it may close a strong year.
Meanwhile, the euro remains near two-year lows, but bulls hold onto hope.
As technical analysis of the EUR/USD chart indicates today:
→ The price is near a support level formed by an ascending channel (marked in blue).
→ Simultaneously, price fluctuations are shaping a bullish “cup and handle” pattern below the 1.0444 level—signalling growing interest among buyers.
A breakout above the red descending trendline could help bulls start 2025 confidently, potentially pushing the price higher from the lower boundary of the channel.
Trade over 50 forex markets 24 hours a day with FXOpen. Take advantage of low commissions, deep liquidity, and spreads from 0.0 pips. Open your FXOpen account now or learn more about trading forex with FXOpen.
CFDs are complex instruments and come with a high risk of losing your money.
This article represents the opinion of the Companies operating under the FXOpen brand only. It is not to be construed as an offer, solicitation, or recommendation with respect to products and services provided by the Companies operating under the FXOpen brand, nor is it to be considered financial advice.

👍1