
#sp500 #stockmarket #stocktrading #MarketUpdates
S&P 500 Index Hits a New Record
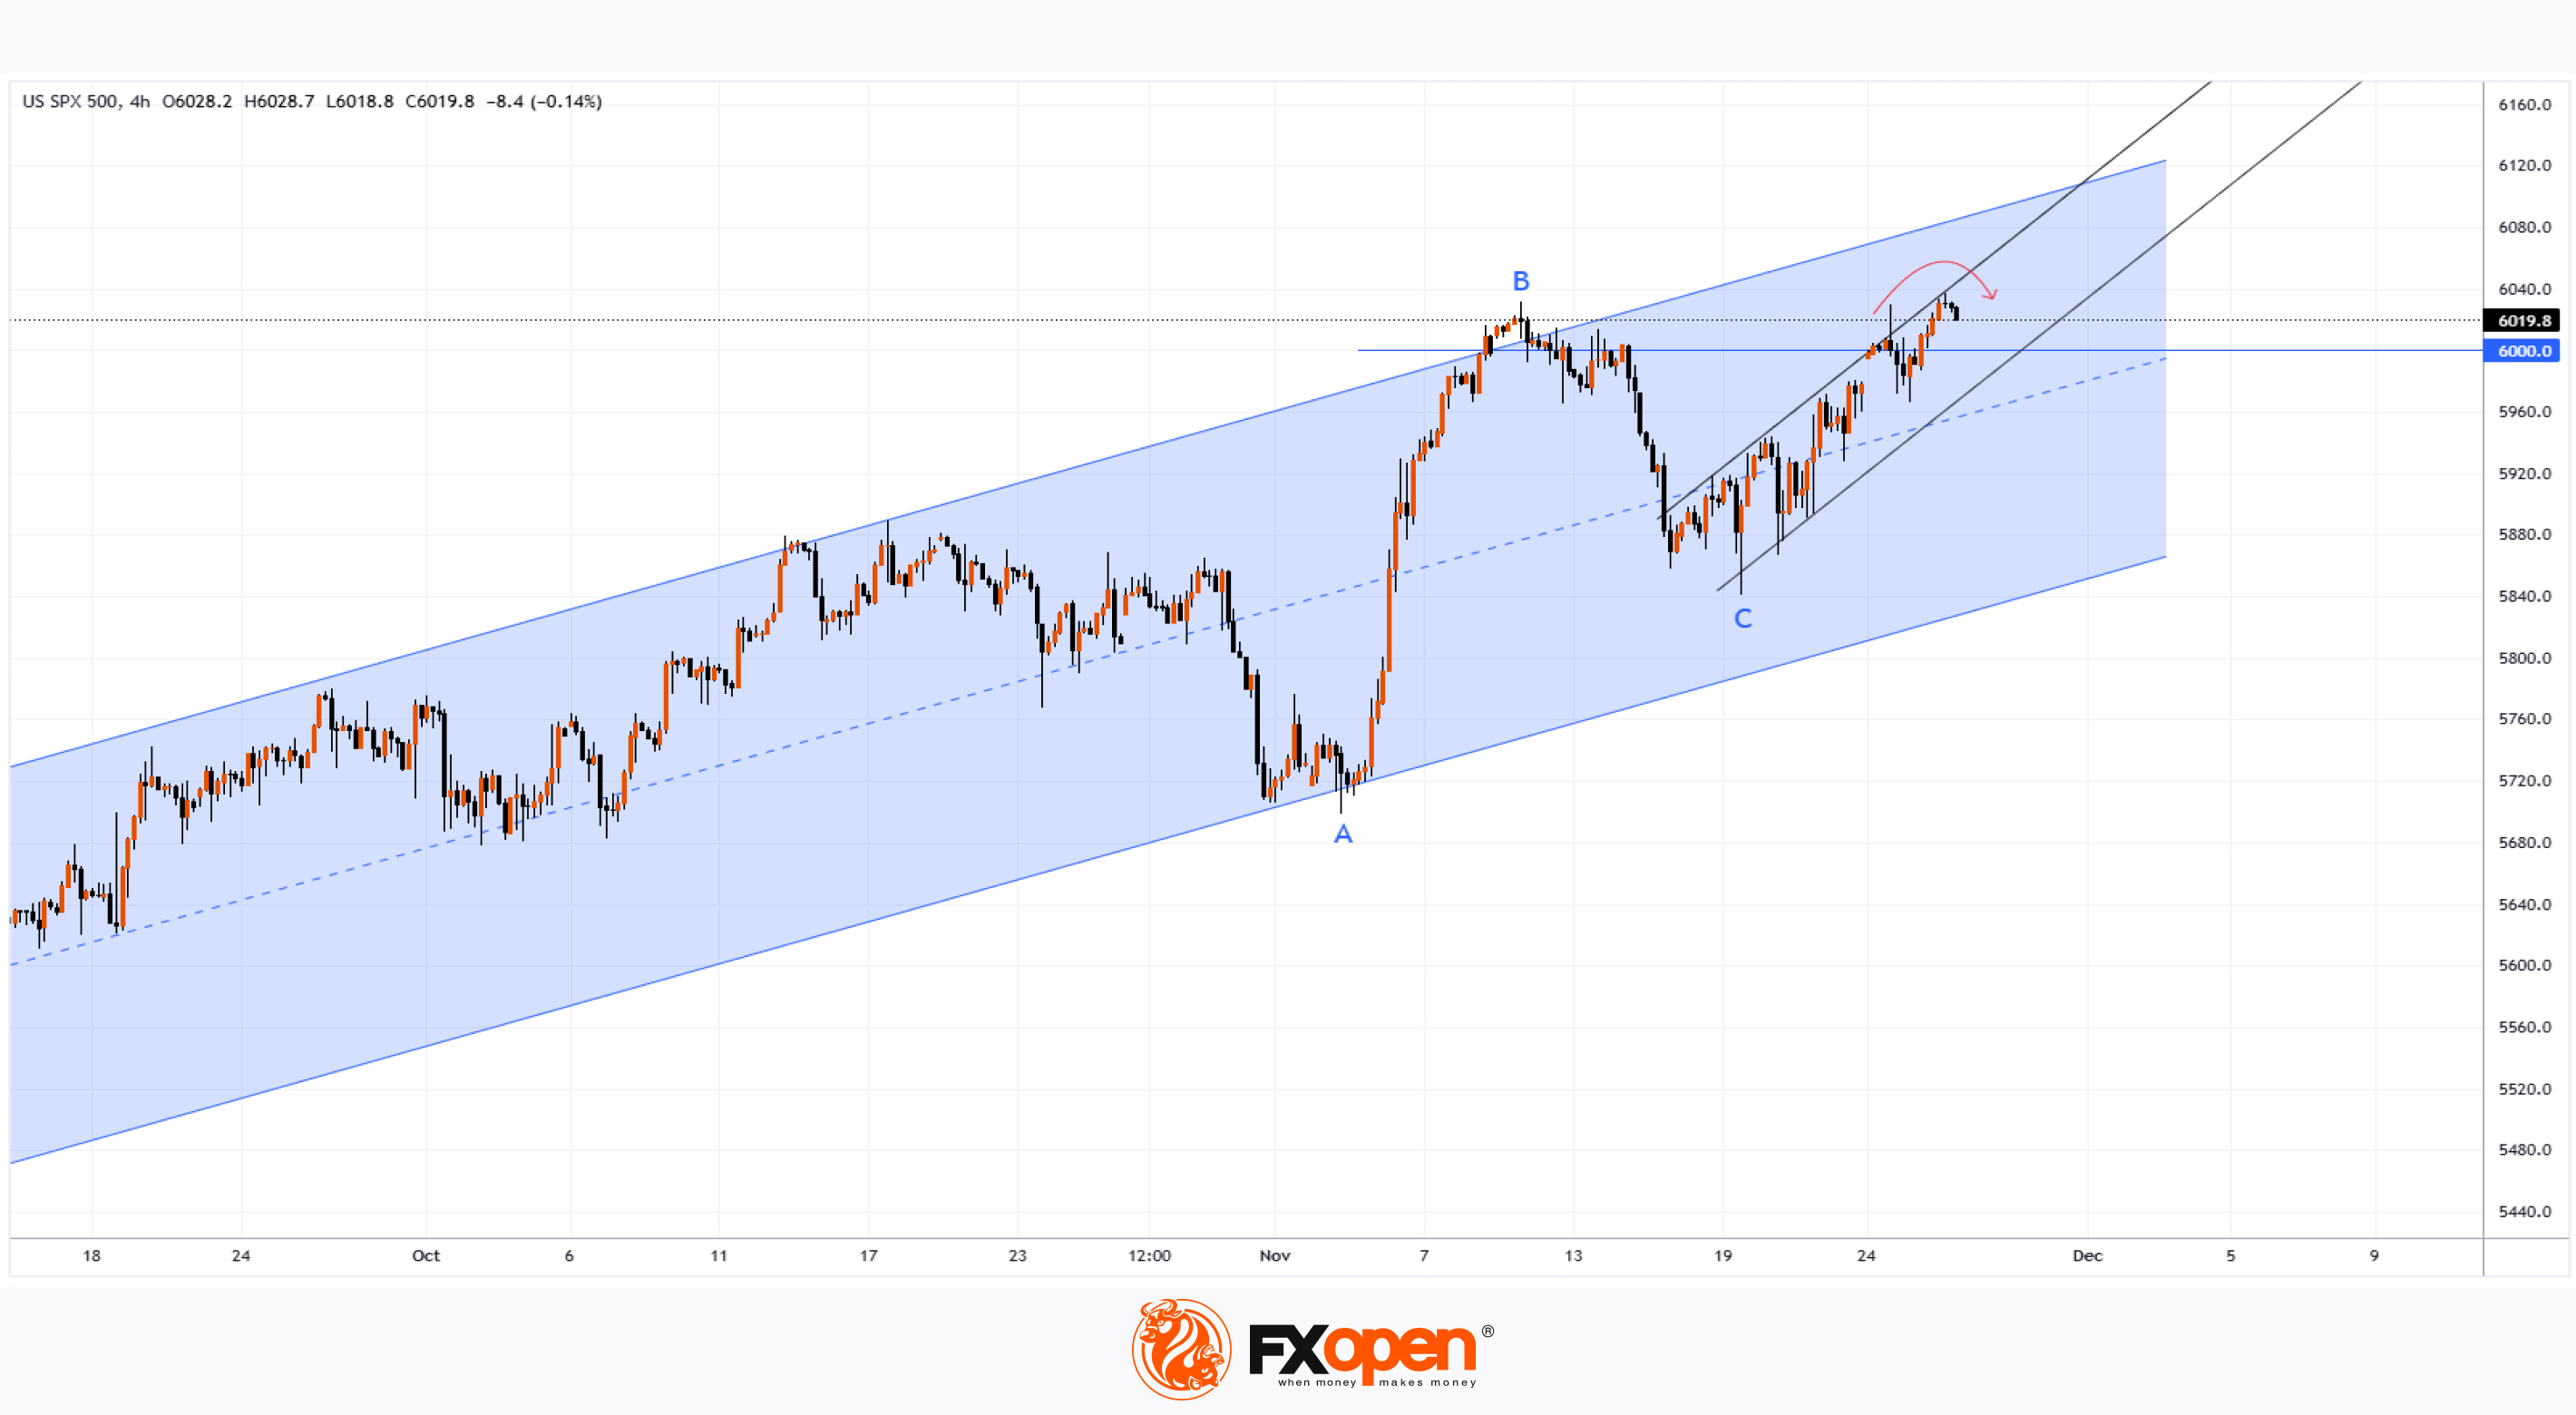
As shown on the S&P 500 chart (US SPX 500 mini on FXOpen), the stock index has reached a new record, surpassing the high set on 11 November.
Bullish sentiment on Wall Street was driven by the announcement that Trump has selected Scott Bessent, a renowned investor and hedge fund manager, as Treasury Secretary.
A technical analysis of the S&P 500 chart (US SPX 500 mini on FXOpen) reveals that the price is moving within two ascending channels:
→ The medium-term blue channel that began in August.
→ The short-term steeper channel (marked with black lines), which has pushed the price from the lower half of the blue channel to its upper half.
→ The decline from B to C retraced approximately 50% of the rise from A to B.
However, how robust is this bullish sentiment? Two bearish factors warrant attention:
→ Rising Cboe Skew Index: Reuters reports an increase in the Cboe Skew (.SKEWX), a financial tool reflecting investor caution. Concerns may stem from potential inflation spikes, Trump’s tariffs, and other risks.
→ Possible False Breakout: The chart indicates that after setting a new high, the price turned downward (marked with a red arrow), potentially signalling a false bullish breakout of the previous high.
The strength of demand will become clearer following the market's reaction to the release of the Personal Consumption Expenditures (PCE) index, scheduled for today at 18:00 GMT+3.
Trade over 50 forex markets 24 hours a day with FXOpen. Take advantage of low commissions, deep liquidity, and spreads from 0.0 pips. Open your FXOpen account now or learn more about trading forex with FXOpen.
CFDs are complex instruments and come with a high risk of losing your money.
This article represents the opinion of the Companies operating under the FXOpen brand only. It is not to be construed as an offer, solicitation, or recommendation with respect to products and services provided by the Companies operating under the FXOpen brand, nor is it to be considered financial advice.
S&P 500 Index Hits a New Record
As shown on the S&P 500 chart (US SPX 500 mini on FXOpen), the stock index has reached a new record, surpassing the high set on 11 November.
Bullish sentiment on Wall Street was driven by the announcement that Trump has selected Scott Bessent, a renowned investor and hedge fund manager, as Treasury Secretary.
A technical analysis of the S&P 500 chart (US SPX 500 mini on FXOpen) reveals that the price is moving within two ascending channels:
→ The medium-term blue channel that began in August.
→ The short-term steeper channel (marked with black lines), which has pushed the price from the lower half of the blue channel to its upper half.
→ The decline from B to C retraced approximately 50% of the rise from A to B.
However, how robust is this bullish sentiment? Two bearish factors warrant attention:
→ Rising Cboe Skew Index: Reuters reports an increase in the Cboe Skew (.SKEWX), a financial tool reflecting investor caution. Concerns may stem from potential inflation spikes, Trump’s tariffs, and other risks.
→ Possible False Breakout: The chart indicates that after setting a new high, the price turned downward (marked with a red arrow), potentially signalling a false bullish breakout of the previous high.
The strength of demand will become clearer following the market's reaction to the release of the Personal Consumption Expenditures (PCE) index, scheduled for today at 18:00 GMT+3.
Trade over 50 forex markets 24 hours a day with FXOpen. Take advantage of low commissions, deep liquidity, and spreads from 0.0 pips. Open your FXOpen account now or learn more about trading forex with FXOpen.
CFDs are complex instruments and come with a high risk of losing your money.
This article represents the opinion of the Companies operating under the FXOpen brand only. It is not to be construed as an offer, solicitation, or recommendation with respect to products and services provided by the Companies operating under the FXOpen brand, nor is it to be considered financial advice.
👍3
#oilprices #brentoil #OPEC #MarketNews
Brent Crude Oil Consolidates Ahead of OPEC+ Meeting
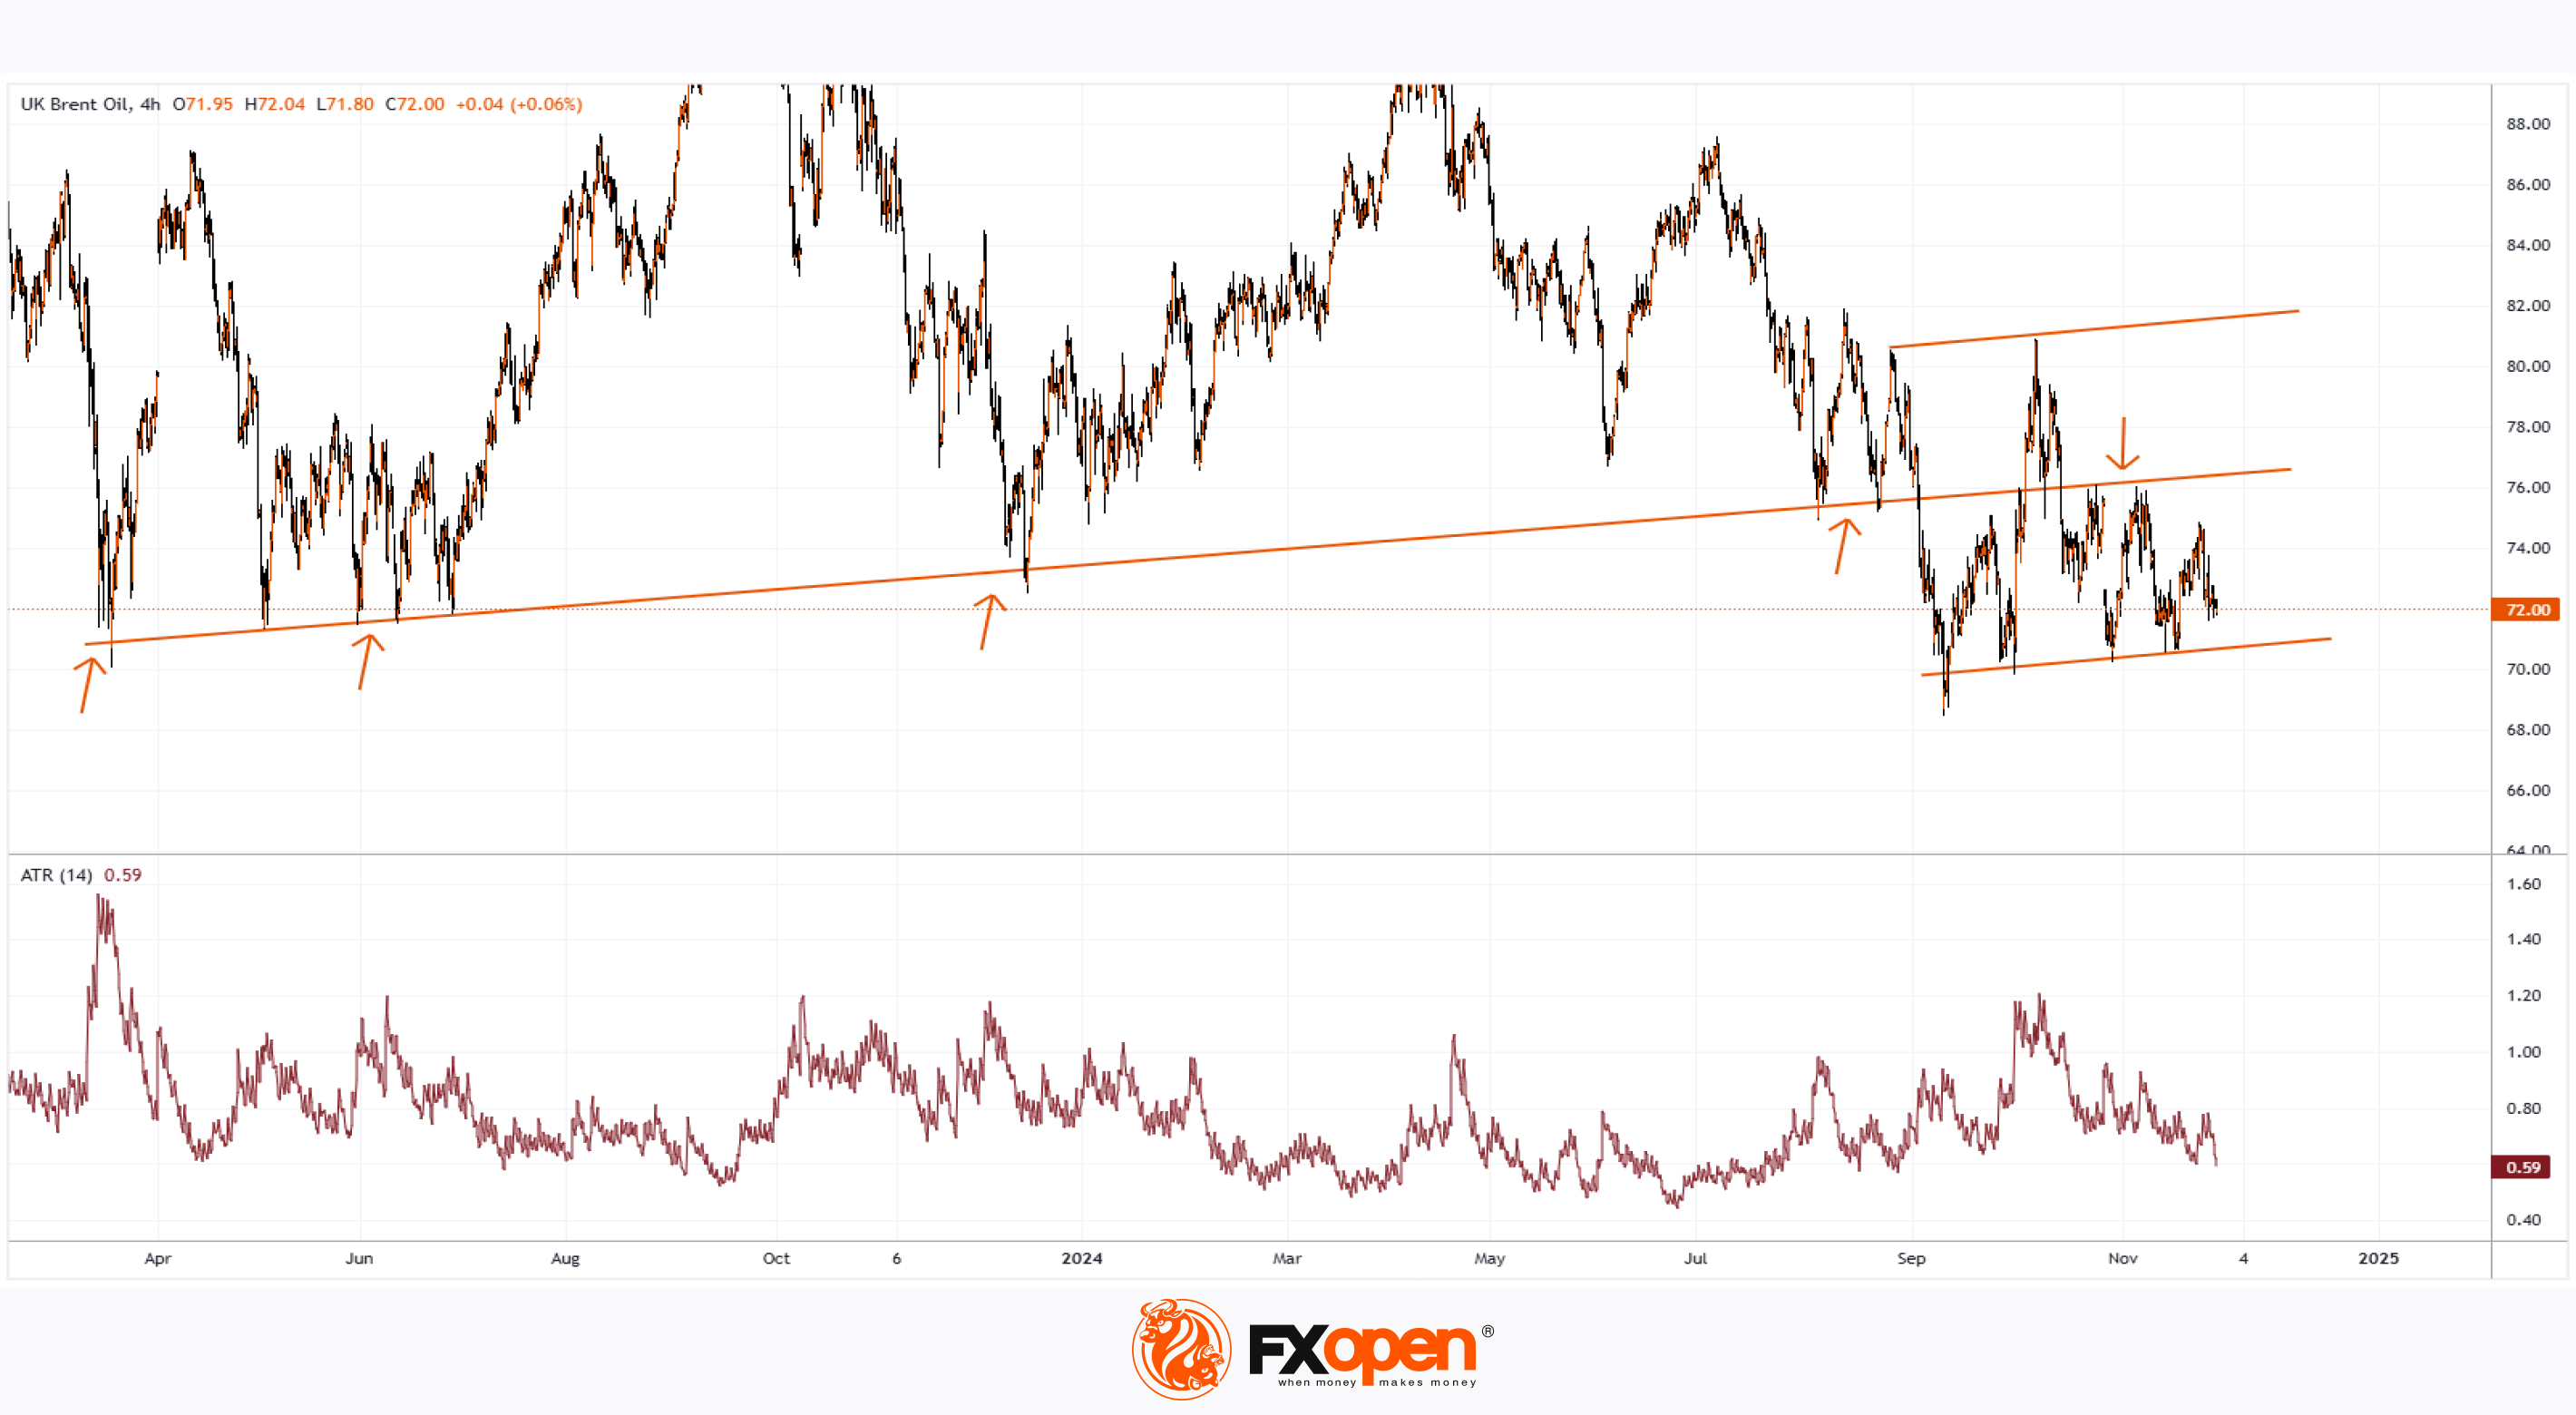
The ATR indicator on the XBR/USD chart has dropped to its lowest level since early autumn, signalling reduced volatility. This likely reflects market participants awaiting announcements from the OPEC+ meeting scheduled for 1 December.
Overall, Brent crude prices remain under pressure due to:
→ reduced tensions in the Middle East, with reports this week confirming a ceasefire agreement between Israel and the Lebanese militant group Hezbollah;
→ news of rising crude oil inventories in the U.S.;
→ forecasts of slower oil demand growth from China in 2025.
On the other hand, the $70-71 range serves as strong support, marked by key lows from 2023-2024.
From a technical analysis perspective, the fluctuations in XBR/USD oil prices are forming a pattern resembling Andrew’s Pitchfork, although it is not an exact match.
Key observations:
→ The central line has shifted from support to resistance, as indicated by the arrows.
→ The lower line is preventing the price from breaking the year's lows.
If the OPEC+ meeting brings no surprises, the period of reduced volatility may persist, with Brent crude prices fluctuating within this range.
Start trading commodities with tight spreads. Open your trading account now or learn more about trading commodity CFDs with FXOpen.
CFDs are complex instruments and come with a high risk of losing your money.
This article represents the opinion of the Companies operating under the FXOpen brand only. It is not to be construed as an offer, solicitation, or recommendation with respect to products and services provided by the Companies operating under the FXOpen brand, nor is it to be considered financial advice.
Brent Crude Oil Consolidates Ahead of OPEC+ Meeting
The ATR indicator on the XBR/USD chart has dropped to its lowest level since early autumn, signalling reduced volatility. This likely reflects market participants awaiting announcements from the OPEC+ meeting scheduled for 1 December.
Overall, Brent crude prices remain under pressure due to:
→ reduced tensions in the Middle East, with reports this week confirming a ceasefire agreement between Israel and the Lebanese militant group Hezbollah;
→ news of rising crude oil inventories in the U.S.;
→ forecasts of slower oil demand growth from China in 2025.
On the other hand, the $70-71 range serves as strong support, marked by key lows from 2023-2024.
From a technical analysis perspective, the fluctuations in XBR/USD oil prices are forming a pattern resembling Andrew’s Pitchfork, although it is not an exact match.
Key observations:
→ The central line has shifted from support to resistance, as indicated by the arrows.
→ The lower line is preventing the price from breaking the year's lows.
If the OPEC+ meeting brings no surprises, the period of reduced volatility may persist, with Brent crude prices fluctuating within this range.
Start trading commodities with tight spreads. Open your trading account now or learn more about trading commodity CFDs with FXOpen.
CFDs are complex instruments and come with a high risk of losing your money.
This article represents the opinion of the Companies operating under the FXOpen brand only. It is not to be construed as an offer, solicitation, or recommendation with respect to products and services provided by the Companies operating under the FXOpen brand, nor is it to be considered financial advice.
👍3
#USDJPY #MarketNews #MarketUpdates #forextrading
USD/JPY Chart Analysis: Bears Target the 150 Yen per Dollar Level
Thanksgiving in the U.S. might have been expected to bring calm to financial markets, but Forex trading in Asia tells a different story following the release of Japan's Consumer Price Index (CPI).
According to Forex Factory:
→ Actual = 2.2%
→ Forecast = 2.0%
→ Previous = 1.8%
Signs of sustained inflation growth have spurred currency market participants to buy yen, speculating that the Bank of Japan might raise interest rates. The upcoming December meeting could see rates increased to 0.5%, which would mark the highest level since 2008.
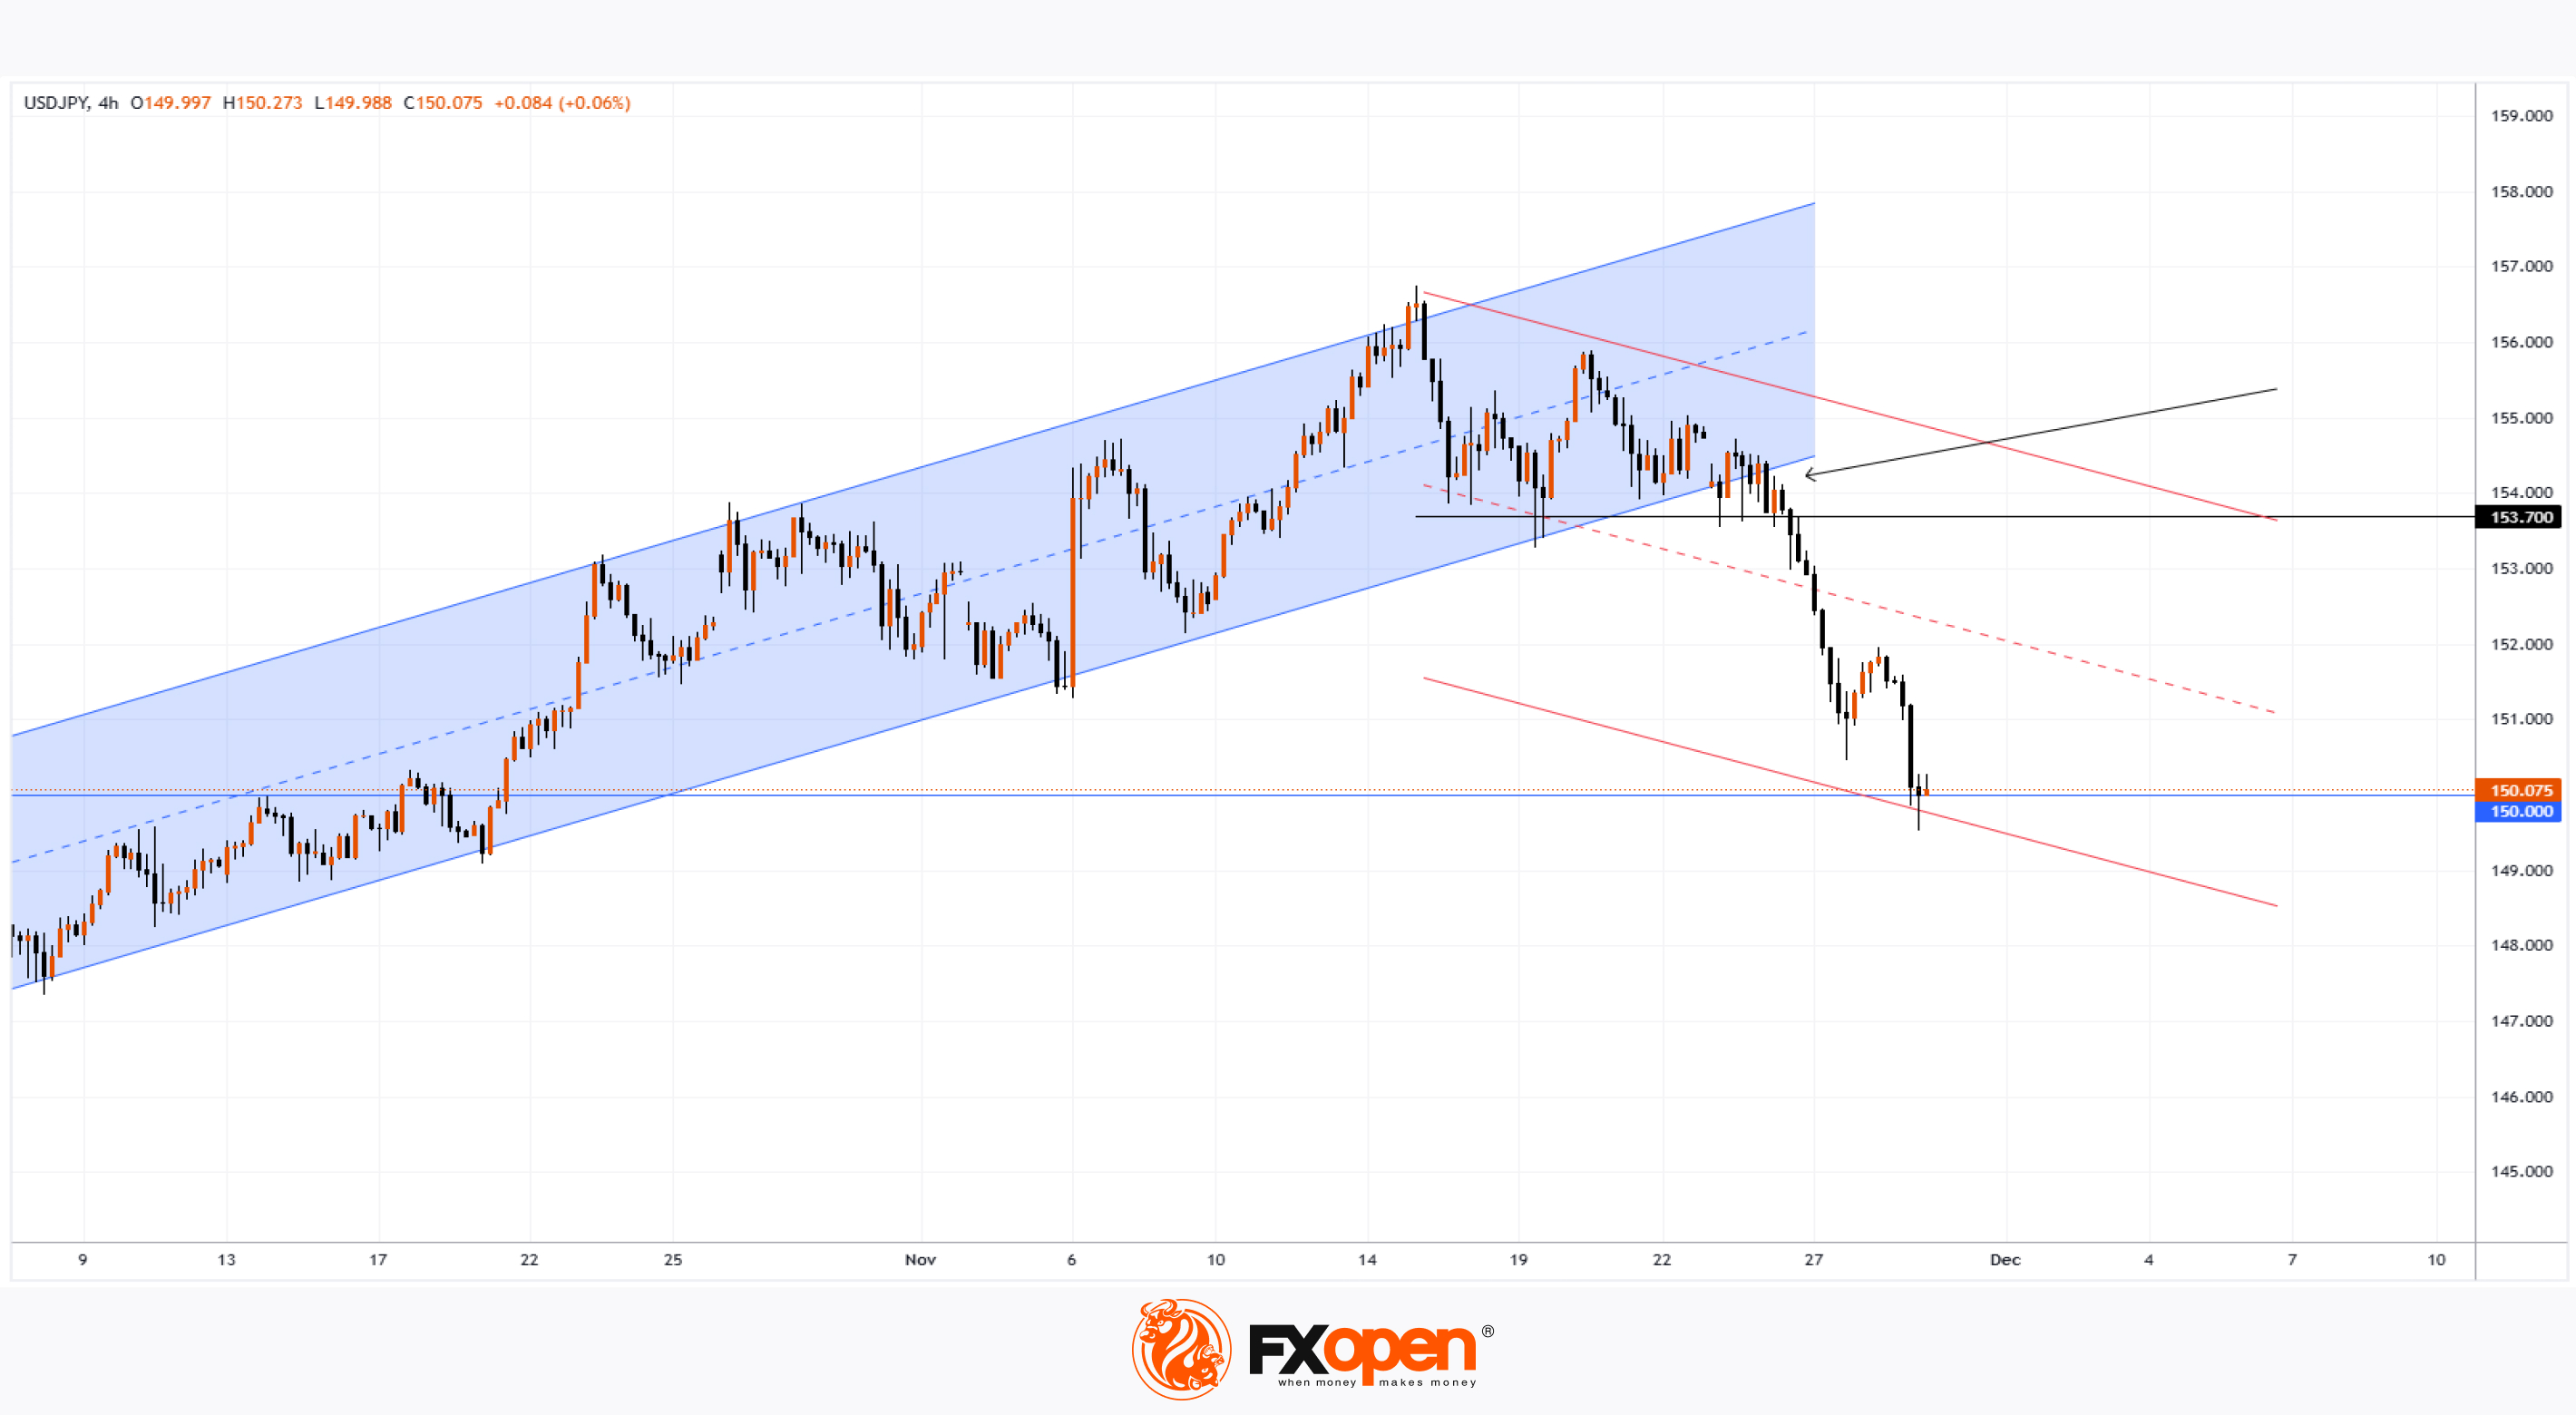
As a result, the yen strengthened by approximately 1% today, hitting its highest level in six weeks and briefly dipping below the psychological level of 150 yen per dollar.
Technical analysis of the USD/JPY chart:
→ The blue upward channel, in place since early October, has lost its strength. A downward trajectory (indicated in red) now appears more relevant on the USD/JPY chart.
→ A bearish breakout below the lower boundary of the blue channel occurred (marked with an arrow) near the 153.7 level. Notably, this level served as support in mid-November. It’s reasonable to assume that bears now hold full control at this level, which could manifest at lower levels—such as the 152 yen per dollar mark, where a local high was established yesterday.
If the psychological level of 150 yen per dollar acts as support, it may only lead to a temporary bounce before a new wave of bearish momentum emerges, as the market anticipates the Bank of Japan's policy meeting.
Trade over 50 forex markets 24 hours a day with FXOpen. Take advantage of low commissions, deep liquidity, and spreads from 0.0 pips. Open your FXOpen account now or learn more about trading forex with FXOpen.
CFDs are complex instruments and come with a high risk of losing your money.
This article represents the opinion of the Companies operating under the FXOpen brand only. It is not to be construed as an offer, solicitation, or recommendation with respect to products and services provided by the Companies operating under the FXOpen brand, nor is it to be considered financial advice.
USD/JPY Chart Analysis: Bears Target the 150 Yen per Dollar Level
Thanksgiving in the U.S. might have been expected to bring calm to financial markets, but Forex trading in Asia tells a different story following the release of Japan's Consumer Price Index (CPI).
According to Forex Factory:
→ Actual = 2.2%
→ Forecast = 2.0%
→ Previous = 1.8%
Signs of sustained inflation growth have spurred currency market participants to buy yen, speculating that the Bank of Japan might raise interest rates. The upcoming December meeting could see rates increased to 0.5%, which would mark the highest level since 2008.
As a result, the yen strengthened by approximately 1% today, hitting its highest level in six weeks and briefly dipping below the psychological level of 150 yen per dollar.
Technical analysis of the USD/JPY chart:
→ The blue upward channel, in place since early October, has lost its strength. A downward trajectory (indicated in red) now appears more relevant on the USD/JPY chart.
→ A bearish breakout below the lower boundary of the blue channel occurred (marked with an arrow) near the 153.7 level. Notably, this level served as support in mid-November. It’s reasonable to assume that bears now hold full control at this level, which could manifest at lower levels—such as the 152 yen per dollar mark, where a local high was established yesterday.
If the psychological level of 150 yen per dollar acts as support, it may only lead to a temporary bounce before a new wave of bearish momentum emerges, as the market anticipates the Bank of Japan's policy meeting.
Trade over 50 forex markets 24 hours a day with FXOpen. Take advantage of low commissions, deep liquidity, and spreads from 0.0 pips. Open your FXOpen account now or learn more about trading forex with FXOpen.
CFDs are complex instruments and come with a high risk of losing your money.
This article represents the opinion of the Companies operating under the FXOpen brand only. It is not to be construed as an offer, solicitation, or recommendation with respect to products and services provided by the Companies operating under the FXOpen brand, nor is it to be considered financial advice.
👍3
#stockmarket #stocktrading #MarketNews #marketanalysis
HP Inc. (HPQ) Shares Drop 11%
HP Inc. (HPQ) shares plummeted 11% following the release of its quarterly earnings report:
→ Earnings per share (EPS): Actual = $0.93, Expected = $0.93
→ Revenue: Actual = $14.05 billion, Expected = $13.09 billion
While HP Inc.'s reported revenue and EPS aligned closely with analysts’ expectations, the market was disappointed by its forward guidance. According to FactSet, the company forecast EPS for the next quarter at $0.73, falling short of the $0.85 expected by analysts.
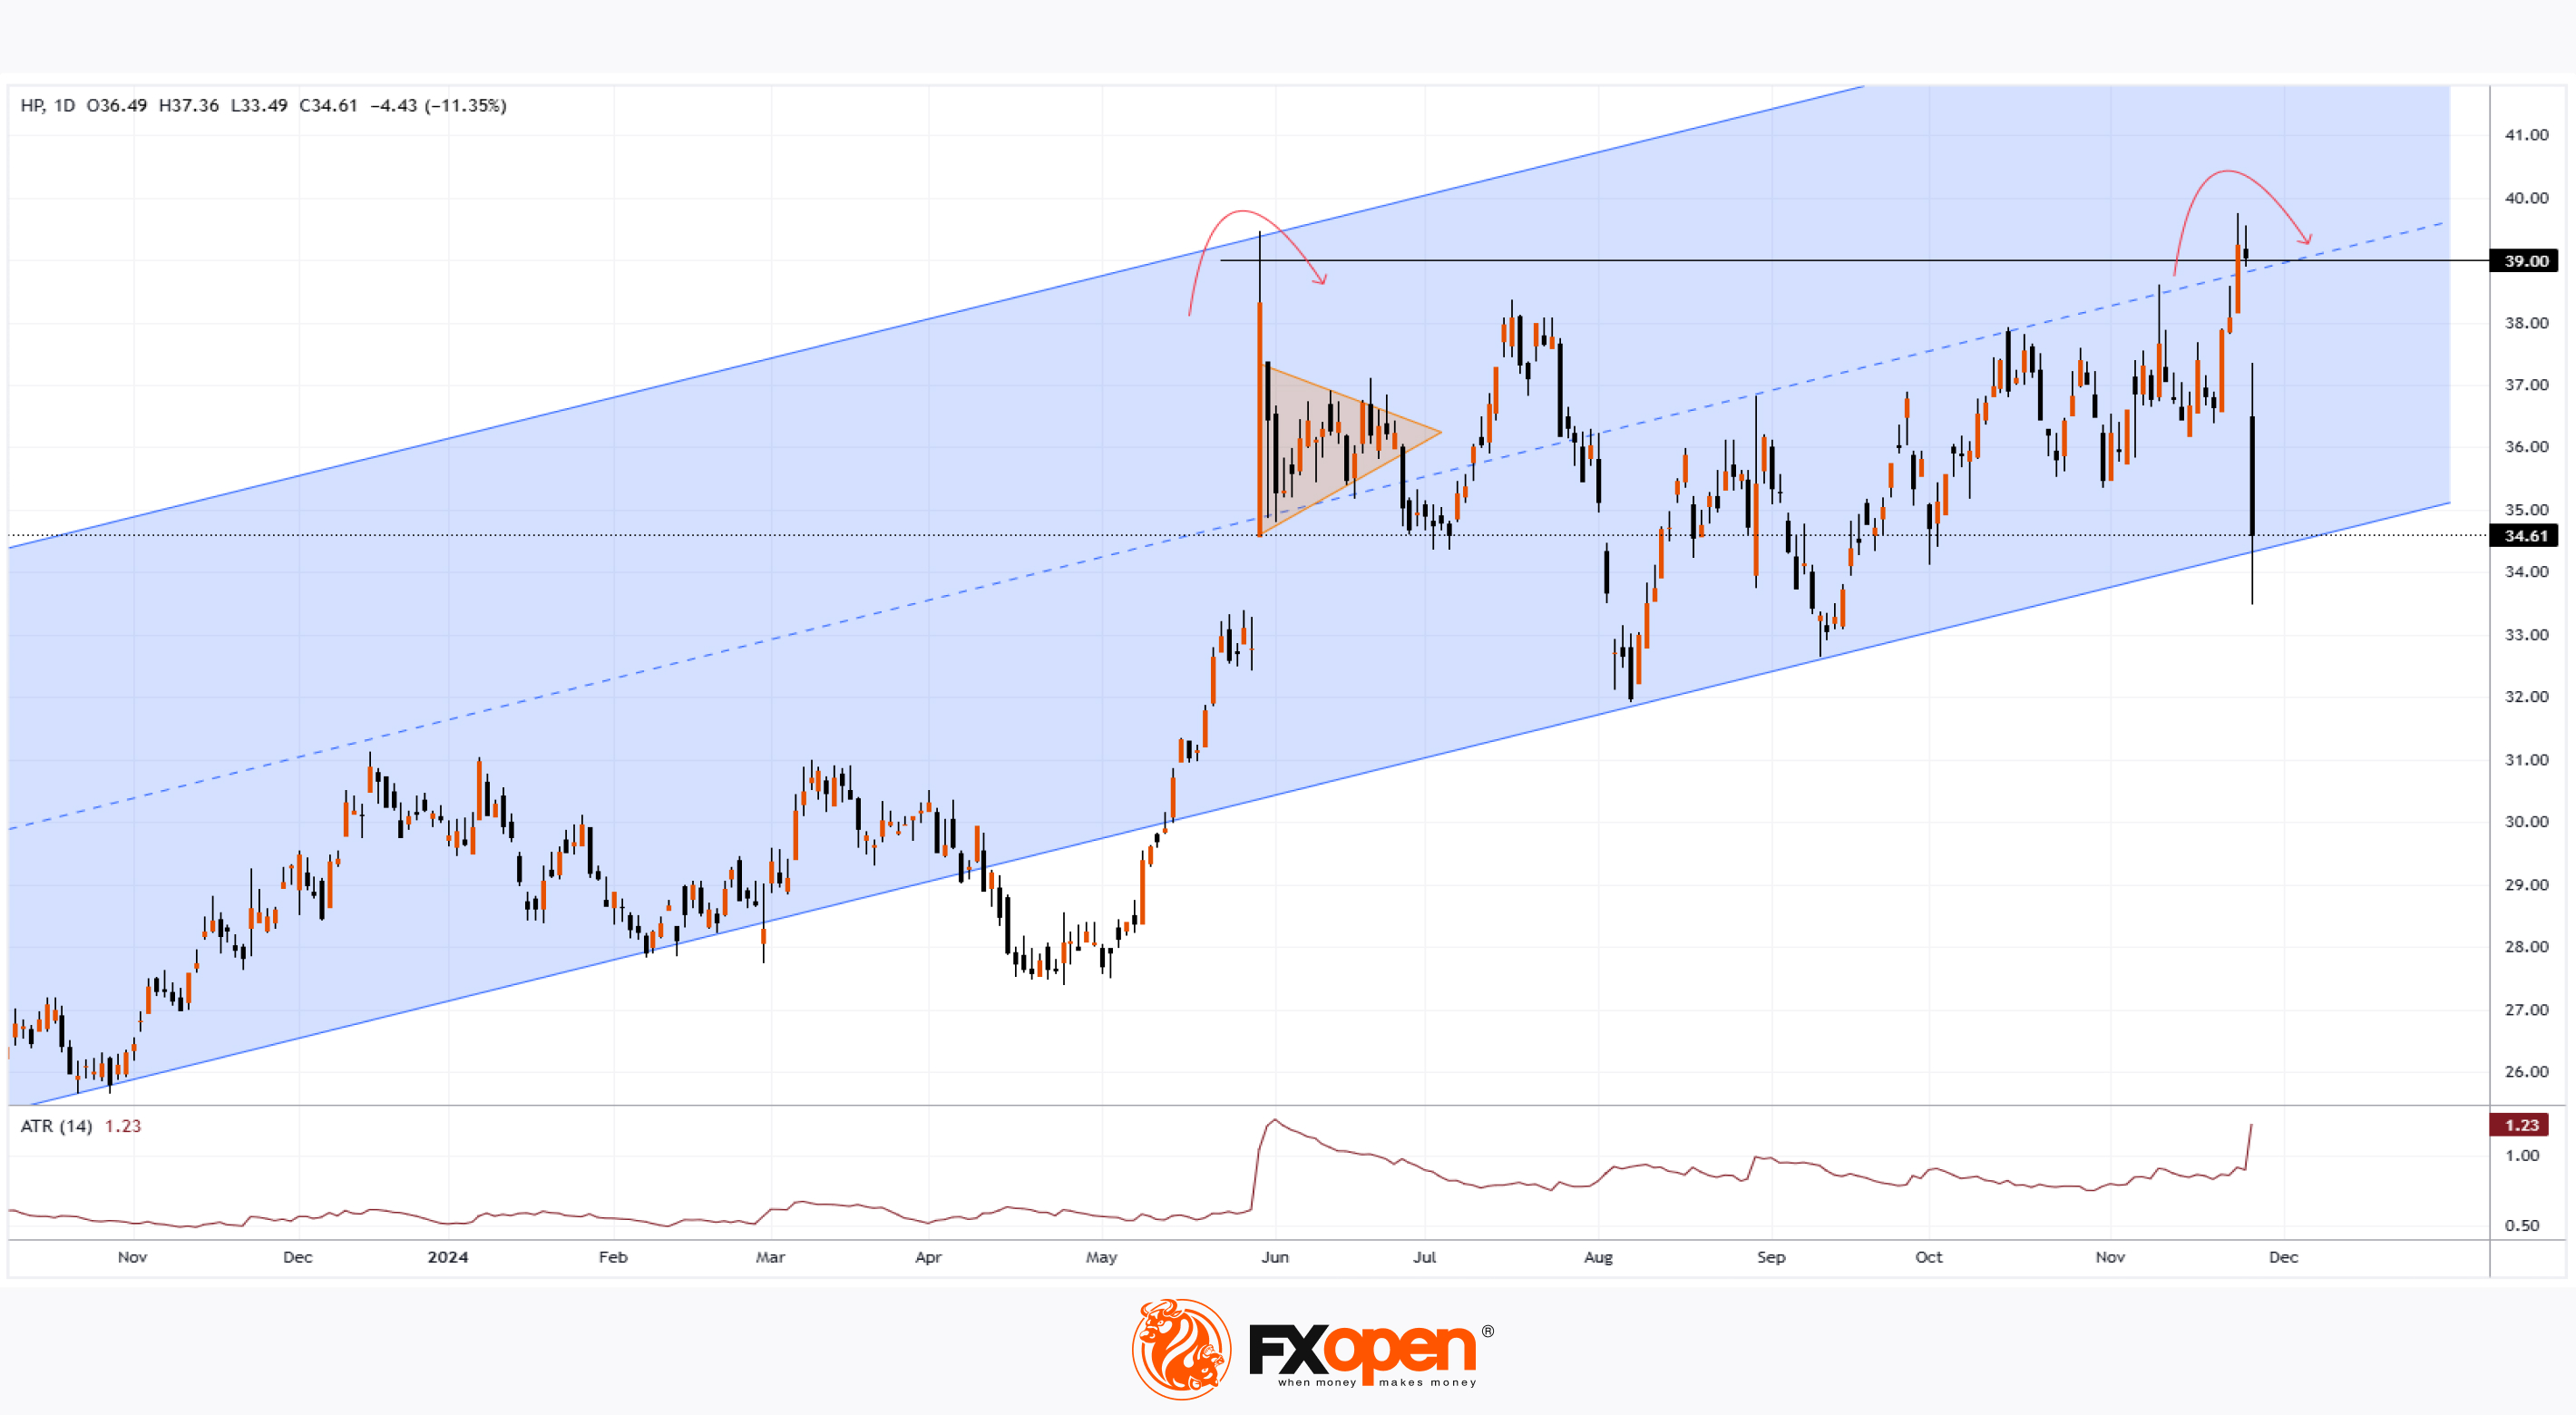
As a result, HPQ shares dropped below $35 for the first time since October 1. Is now the time to buy shares in this leading provider of PCs and high-tech products?
Analysts remain cautious, according to TipRanks:
→ Only 3 out of 15 analysts recommend buying HPQ shares.
→ The average 12-month price target for HPQ stands at $36, though post-earnings revisions may lower these estimates.
Technical Analysis of HPQ Shares:
→ The stock is trading within an upward channel (indicated in blue), and the long lower shadow on yesterday’s candle suggests strong demand near the channel’s lower boundary.
→ The $39 level has acted as resistance for the second time this year (highlighted by arrows) and is likely to remain significant.
→ The ATR indicator signals a notable spike in volatility.
Given the sharp price movement, it is reasonable to anticipate another period of price consolidation on the HPQ chart, similar to the pattern observed during the summer (highlighted by the orange triangle).
Trade global index CFDs with zero commission and tight spreads. Open your FXOpen account now or learn more about trading index CFDs with FXOpen.
CFDs are complex instruments and come with a high risk of losing your money.
This article represents the opinion of the Companies operating under the FXOpen brand only. It is not to be construed as an offer, solicitation, or recommendation with respect to products and services provided by the Companies operating under the FXOpen brand, nor is it to be considered financial advice.
HP Inc. (HPQ) Shares Drop 11%
HP Inc. (HPQ) shares plummeted 11% following the release of its quarterly earnings report:
→ Earnings per share (EPS): Actual = $0.93, Expected = $0.93
→ Revenue: Actual = $14.05 billion, Expected = $13.09 billion
While HP Inc.'s reported revenue and EPS aligned closely with analysts’ expectations, the market was disappointed by its forward guidance. According to FactSet, the company forecast EPS for the next quarter at $0.73, falling short of the $0.85 expected by analysts.
As a result, HPQ shares dropped below $35 for the first time since October 1. Is now the time to buy shares in this leading provider of PCs and high-tech products?
Analysts remain cautious, according to TipRanks:
→ Only 3 out of 15 analysts recommend buying HPQ shares.
→ The average 12-month price target for HPQ stands at $36, though post-earnings revisions may lower these estimates.
Technical Analysis of HPQ Shares:
→ The stock is trading within an upward channel (indicated in blue), and the long lower shadow on yesterday’s candle suggests strong demand near the channel’s lower boundary.
→ The $39 level has acted as resistance for the second time this year (highlighted by arrows) and is likely to remain significant.
→ The ATR indicator signals a notable spike in volatility.
Given the sharp price movement, it is reasonable to anticipate another period of price consolidation on the HPQ chart, similar to the pattern observed during the summer (highlighted by the orange triangle).
Trade global index CFDs with zero commission and tight spreads. Open your FXOpen account now or learn more about trading index CFDs with FXOpen.
CFDs are complex instruments and come with a high risk of losing your money.
This article represents the opinion of the Companies operating under the FXOpen brand only. It is not to be construed as an offer, solicitation, or recommendation with respect to products and services provided by the Companies operating under the FXOpen brand, nor is it to be considered financial advice.
👍3
#SP500 #StockMarket #DollarDecline #BrentCrudeOil #OPECplus #BlackFriday2024 #OilMarket #MarketAnalysis
Weekly Market Wrap With Gary Thomson: SP500, US Dollar, Brent Crude Oil, Black Friday
Get the latest scoop on the week's hottest headlines, all in one convenient video. Join Gary Thomson, the COO of FXOpen UK, as he breaks down the most significant news reports and shares his expert insights.
🔸 S&P 500 Index Hits a New Record;
🔸 Dollar Declines Following Weak Macroeconomic Data;
🔸 Brent Crude Oil Consolidates Ahead of OPEC+ Meeting;
🔸 How Black Friday Could Impact the Stock Market in 2024;
Stay in the know and empower yourself with our short, yet power-packed video. Watch it now and stay updated with FXOpen. Don't miss out on this invaluable opportunity to sharpen your trading skills and make informed decisions.
https://cutt.ly/feZqoWBh
To take advantage of price fluctuations in the foreign exchange markets, consider enlisting the services of a reliable broker like FXOpen.
⚠️
This forecast represents FXOpen Companies opinion only, it should not be construed as an offer, invitation or recommendation in respect to FXOpen Companies products and services or as financial advice.
Weekly Market Wrap With Gary Thomson: SP500, US Dollar, Brent Crude Oil, Black Friday
Get the latest scoop on the week's hottest headlines, all in one convenient video. Join Gary Thomson, the COO of FXOpen UK, as he breaks down the most significant news reports and shares his expert insights.
🔸 S&P 500 Index Hits a New Record;
🔸 Dollar Declines Following Weak Macroeconomic Data;
🔸 Brent Crude Oil Consolidates Ahead of OPEC+ Meeting;
🔸 How Black Friday Could Impact the Stock Market in 2024;
Stay in the know and empower yourself with our short, yet power-packed video. Watch it now and stay updated with FXOpen. Don't miss out on this invaluable opportunity to sharpen your trading skills and make informed decisions.
https://cutt.ly/feZqoWBh
To take advantage of price fluctuations in the foreign exchange markets, consider enlisting the services of a reliable broker like FXOpen.
⚠️
This forecast represents FXOpen Companies opinion only, it should not be construed as an offer, invitation or recommendation in respect to FXOpen Companies products and services or as financial advice.
YouTube
Weekly Market Wrap With Gary Thomson: SP500, US Dollar, Brent Crude Oil, Black Friday
Get the latest scoop on the week's hottest headlines, all in one convenient video. Join Gary Thomson, the COO of FXOpen UK, as he breaks down the most significant news reports and shares his expert insights
- S&P 500 Index Hits a New Record
- Dollar Declines…
- S&P 500 Index Hits a New Record
- Dollar Declines…
👍4
#stockmarket #stocktrading #marketanalysis
MicroStrategy (MSTR) Stock Price Surged Over 60% in November
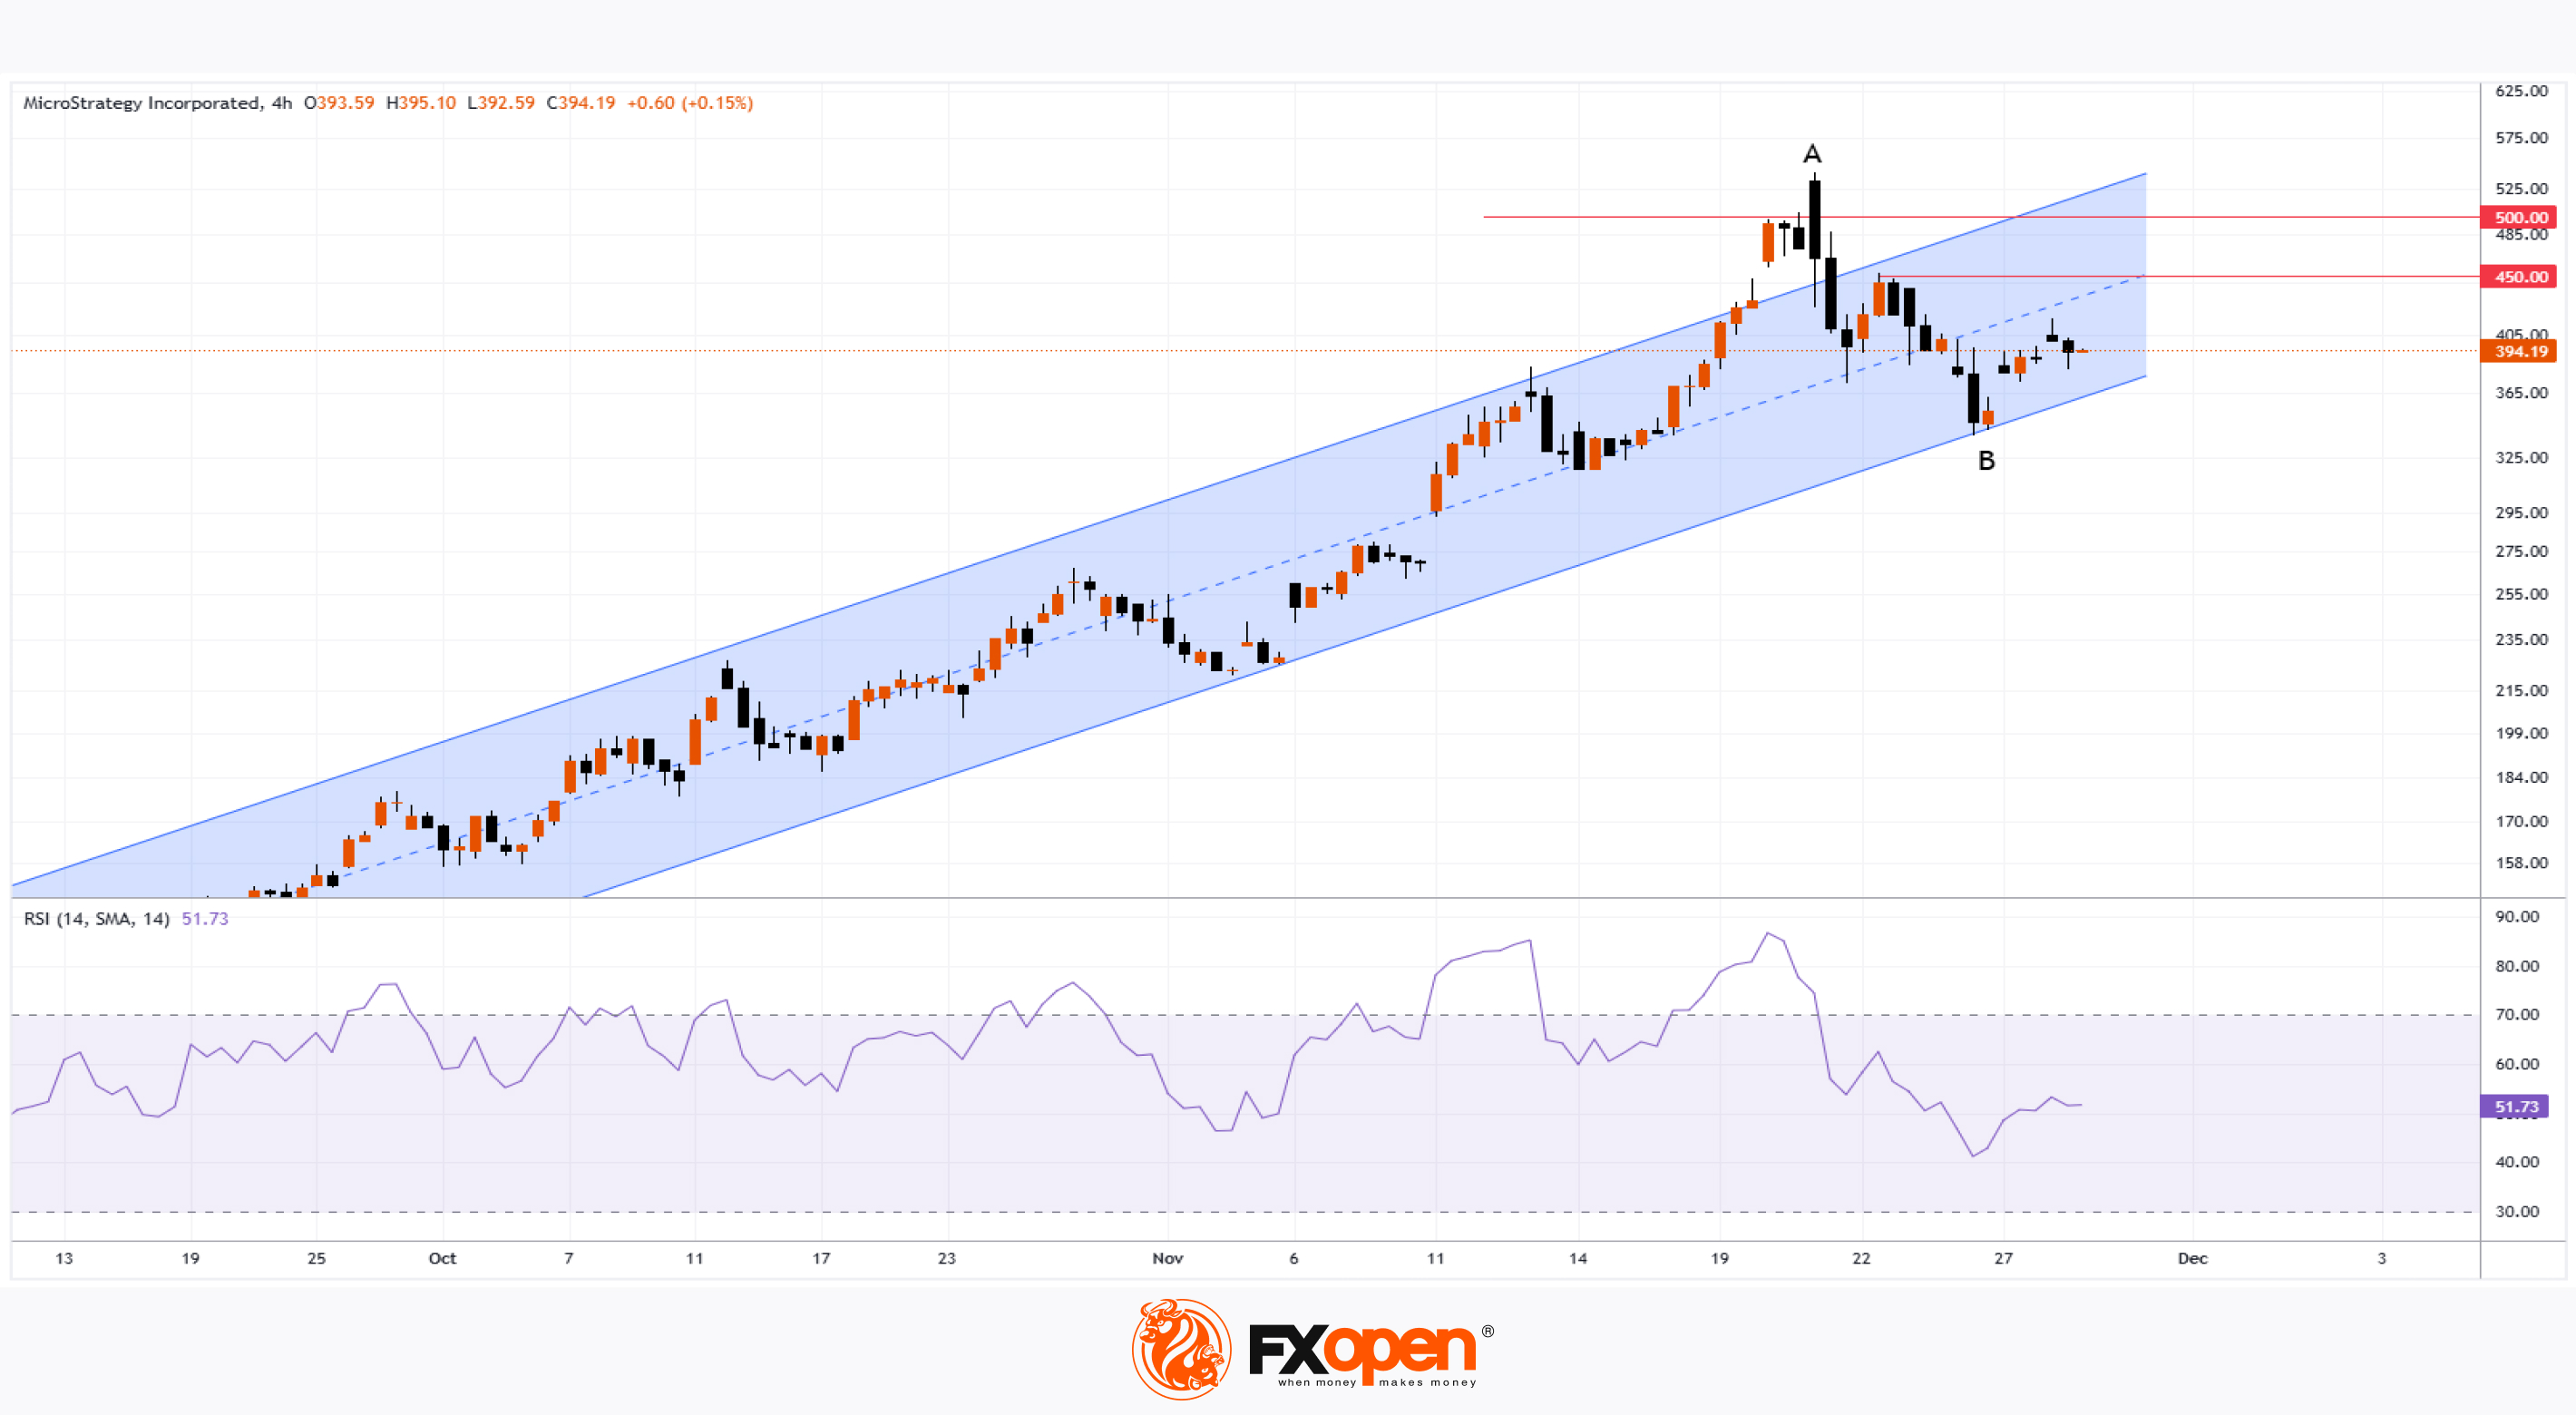
According to the MicroStrategy Incorporated (MSTR) stock chart:
→ At the start of November, the stock price was around $244;
→ Last Friday, it closed just below $395;
→ This represents a more than 60% increase in MSTR’s price over the month, making it one of the top performers on the U.S. stock market;
→ At its peak on 21 November, the stock traded above $520, reflecting a 115% surge in just three weeks.
Two key drivers supported the bullish sentiment:
Bitcoin holdings by MicroStrategy.
According to Benzinga, the company owns nearly 2% of the global Bitcoin supply, a figure projected to rise to 4% by 2023. The current surge in BTC/USD towards $100,000 has significantly increased MicroStrategy's value. Co-founder Michael Saylor stated that the company earns an average of $500 million daily from its Bitcoin investments.
Market capitalisation milestones.
In November, MicroStrategy's market capitalisation exceeded $100 billion for the first time. On this note, Seeking Alpha highlighted the potential for MicroStrategy's inclusion in the Nasdaq 100 index. This could prompt large funds tracking the index to purchase MSTR shares for their portfolios.
Technical analysis of MSTR’s price chart indicates that since mid-September, price fluctuations have formed an ascending channel (marked in blue).
The decline from point A to B appears overly steep to be classified as a strict correction within the uptrend, which followed the achievement of extreme overbought conditions (visible on the RSI indicator).
While the stock rebounded upwards upon reaching the lower boundary of the channel (point B), the question remains whether the bulls can replicate November’s extraordinary success.
Buyers should exercise caution based on bearish price action around psychological levels:
→ The price failed to hold above $500.
→ On 22 November, the $450 level acted as resistance.
Meanwhile, according to TipRanks:
→ All 8 surveyed analysts recommend buying MSTR stock.
→ The average price target for MSTR is $494 within the next 12 months.
Trade global index CFDs with zero commission and tight spreads. Open your FXOpen account now or learn more about trading index CFDs with FXOpen.
CFDs are complex instruments and come with a high risk of losing your money.
This article represents the opinion of the Companies operating under the FXOpen brand only. It is not to be construed as an offer, solicitation, or recommendation with respect to products and services provided by the Companies operating under the FXOpen brand, nor is it to be considered financial advice.
MicroStrategy (MSTR) Stock Price Surged Over 60% in November
According to the MicroStrategy Incorporated (MSTR) stock chart:
→ At the start of November, the stock price was around $244;
→ Last Friday, it closed just below $395;
→ This represents a more than 60% increase in MSTR’s price over the month, making it one of the top performers on the U.S. stock market;
→ At its peak on 21 November, the stock traded above $520, reflecting a 115% surge in just three weeks.
Two key drivers supported the bullish sentiment:
Bitcoin holdings by MicroStrategy.
According to Benzinga, the company owns nearly 2% of the global Bitcoin supply, a figure projected to rise to 4% by 2023. The current surge in BTC/USD towards $100,000 has significantly increased MicroStrategy's value. Co-founder Michael Saylor stated that the company earns an average of $500 million daily from its Bitcoin investments.
Market capitalisation milestones.
In November, MicroStrategy's market capitalisation exceeded $100 billion for the first time. On this note, Seeking Alpha highlighted the potential for MicroStrategy's inclusion in the Nasdaq 100 index. This could prompt large funds tracking the index to purchase MSTR shares for their portfolios.
Technical analysis of MSTR’s price chart indicates that since mid-September, price fluctuations have formed an ascending channel (marked in blue).
The decline from point A to B appears overly steep to be classified as a strict correction within the uptrend, which followed the achievement of extreme overbought conditions (visible on the RSI indicator).
While the stock rebounded upwards upon reaching the lower boundary of the channel (point B), the question remains whether the bulls can replicate November’s extraordinary success.
Buyers should exercise caution based on bearish price action around psychological levels:
→ The price failed to hold above $500.
→ On 22 November, the $450 level acted as resistance.
Meanwhile, according to TipRanks:
→ All 8 surveyed analysts recommend buying MSTR stock.
→ The average price target for MSTR is $494 within the next 12 months.
Trade global index CFDs with zero commission and tight spreads. Open your FXOpen account now or learn more about trading index CFDs with FXOpen.
CFDs are complex instruments and come with a high risk of losing your money.
This article represents the opinion of the Companies operating under the FXOpen brand only. It is not to be construed as an offer, solicitation, or recommendation with respect to products and services provided by the Companies operating under the FXOpen brand, nor is it to be considered financial advice.
👍3
#marketanalysis #MarketNews #XAGUSD #silverprice
XAG/USD Analysis: Silver Price Balances at Key Support
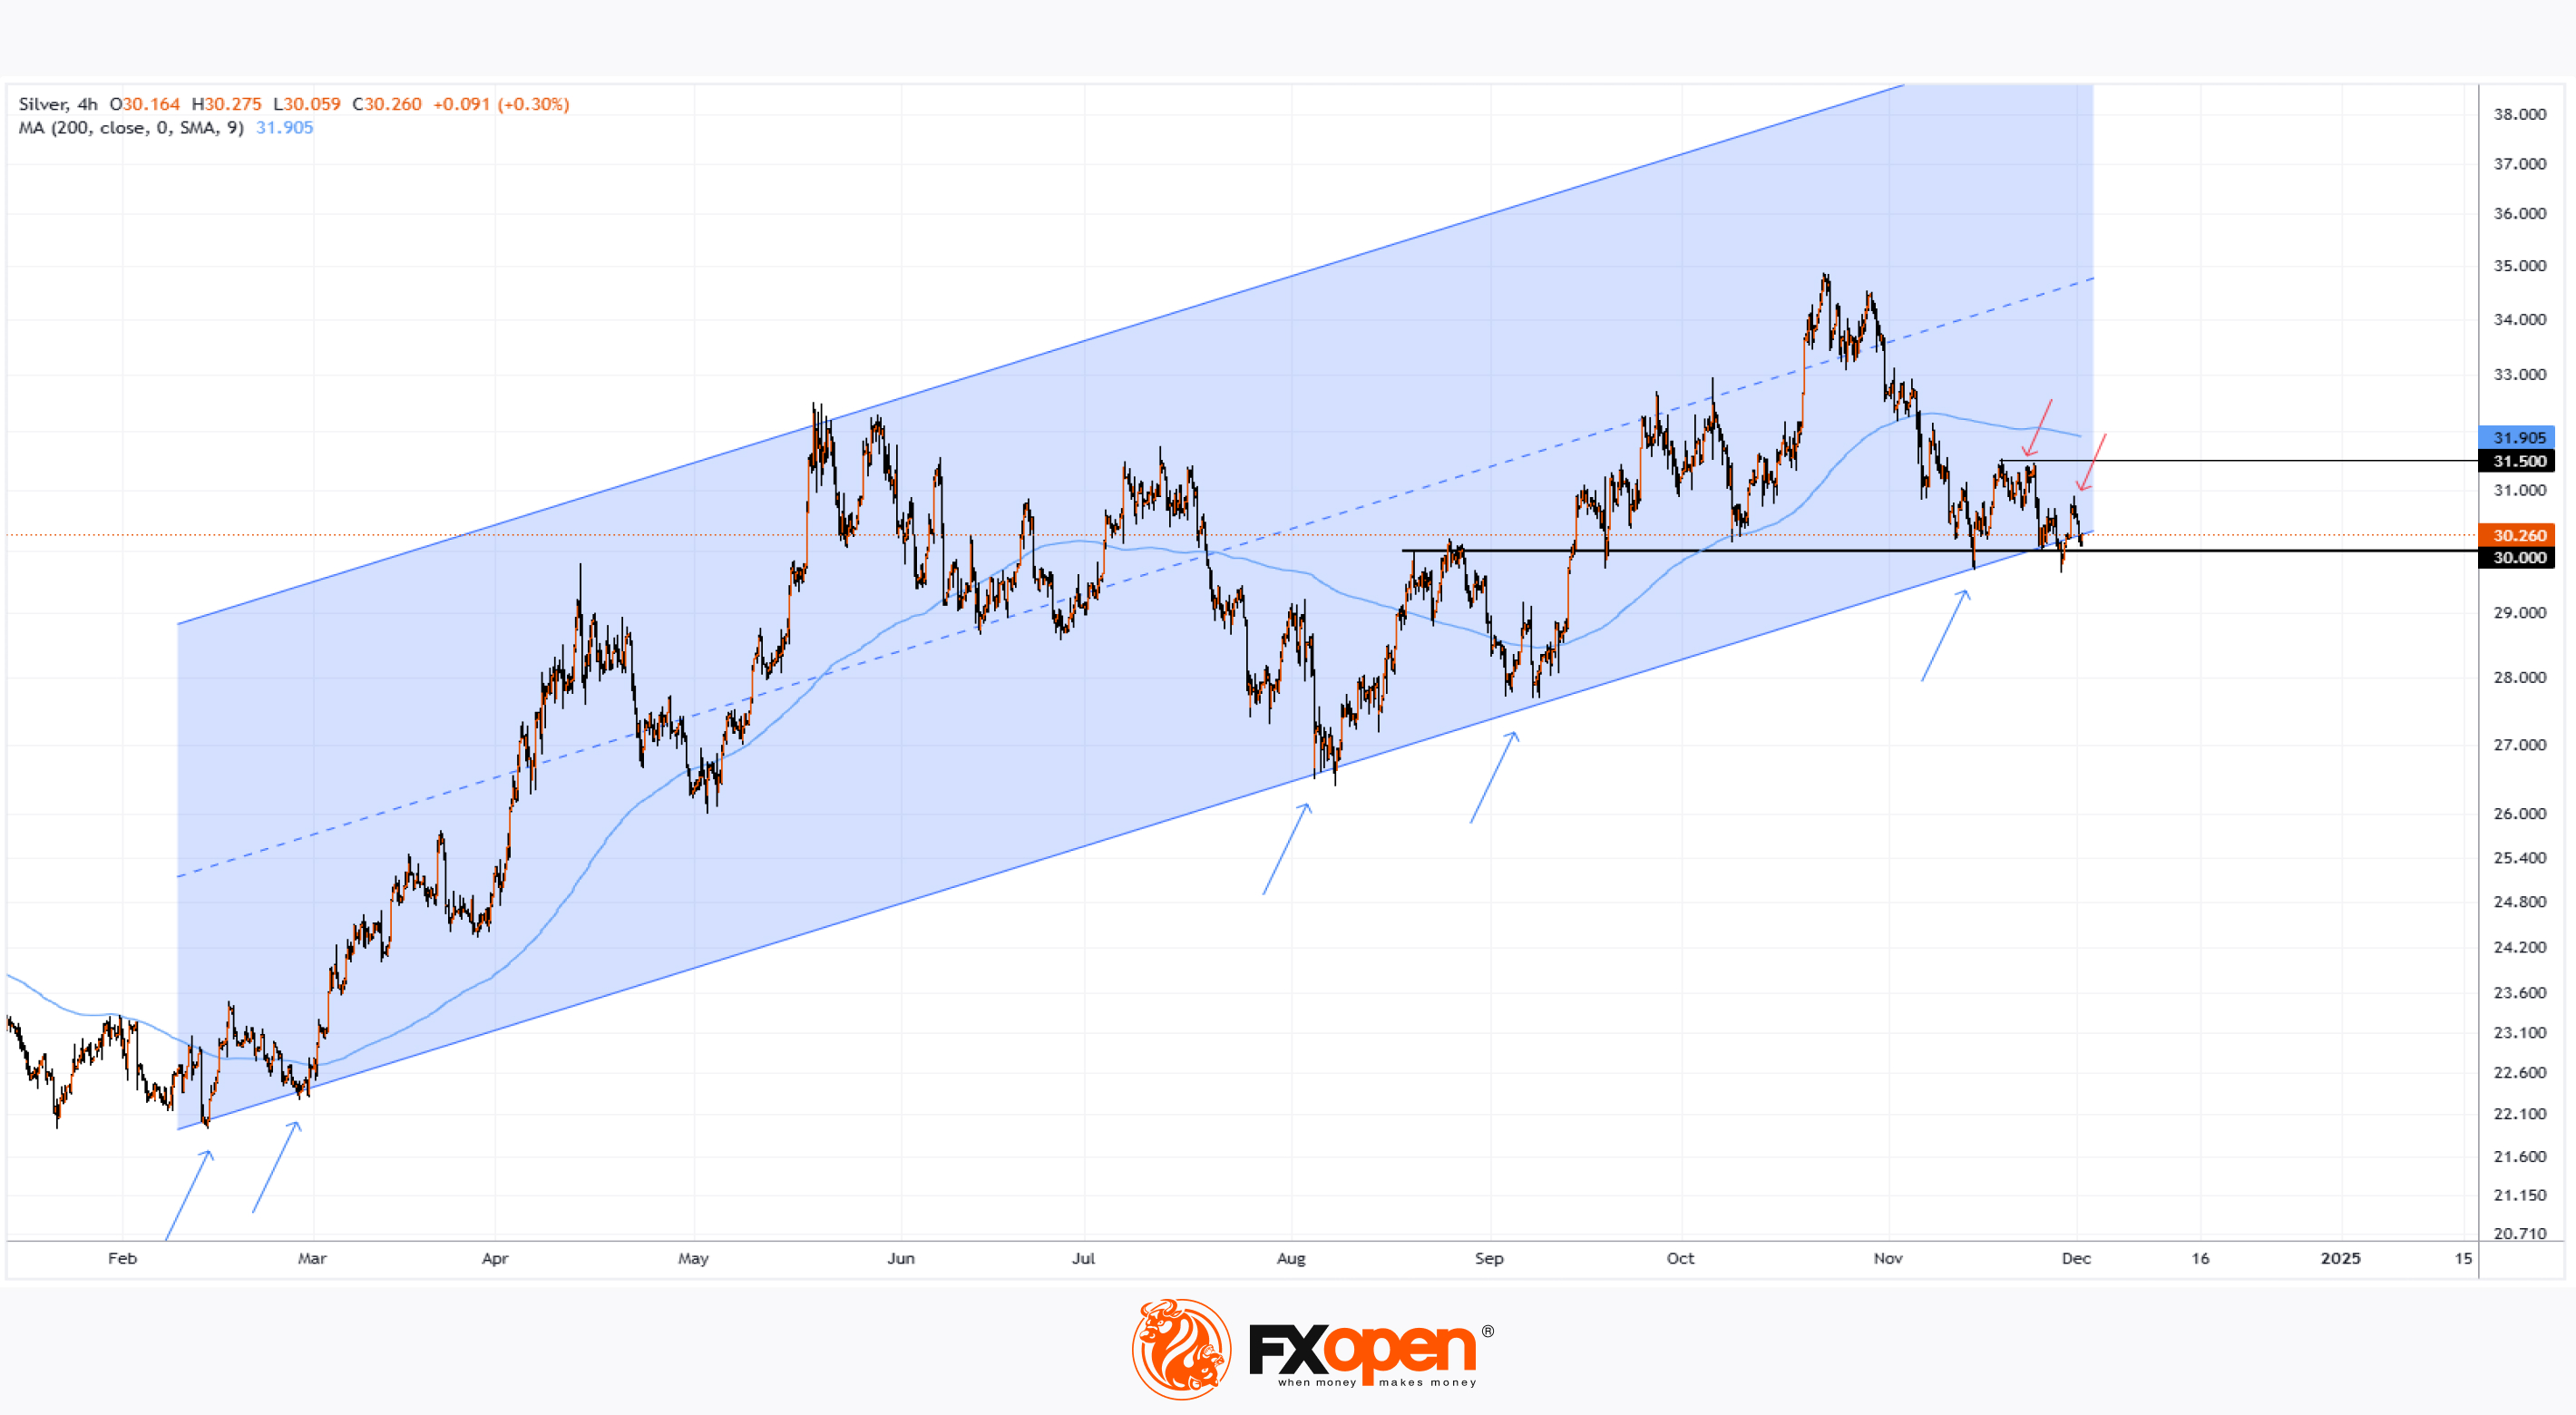
As reflected in the XAG/USD chart, the price of silver this morning is trading near $30.2, just above a critical support zone formed by:
→ The psychological level of $30.00;
→ The lower boundary of the ascending channel. As indicated by the blue arrows, this lower boundary has consistently provided support, enabling bullish reversals in silver prices throughout 2024.
However, the price is currently below the 200-day moving average (MA), which is trending downward. An examination of price action in November reveals a lack of sustained growth following two breaches of the psychological level. As the red arrows illustrate:
→ On the first occasion, the price encountered resistance near $31.50;
→ On the second, it failed to rise above $31.
This could indicate weak demand, increasing the risk of a bearish breakout below the key support zone, potentially breaking the 2024 uptrend.
Meanwhile, analysts remain optimistic, citing strong fundamentals. According to media reports:
→ ANZ Research analysts forecast silver prices reaching $35.4 in 2025;
→ JP Morgan analysts predict silver at $36;
→ Saxo Bank analysts anticipate prices climbing to $40 by 2025.
Start trading commodities with tight spreads. Open your trading account now or learn more about trading commodity CFDs with FXOpen.
CFDs are complex instruments and come with a high risk of losing your money.
This article represents the opinion of the Companies operating under the FXOpen brand only. It is not to be construed as an offer, solicitation, or recommendation with respect to products and services provided by the Companies operating under the FXOpen brand, nor is it to be considered financial advice.
XAG/USD Analysis: Silver Price Balances at Key Support
As reflected in the XAG/USD chart, the price of silver this morning is trading near $30.2, just above a critical support zone formed by:
→ The psychological level of $30.00;
→ The lower boundary of the ascending channel. As indicated by the blue arrows, this lower boundary has consistently provided support, enabling bullish reversals in silver prices throughout 2024.
However, the price is currently below the 200-day moving average (MA), which is trending downward. An examination of price action in November reveals a lack of sustained growth following two breaches of the psychological level. As the red arrows illustrate:
→ On the first occasion, the price encountered resistance near $31.50;
→ On the second, it failed to rise above $31.
This could indicate weak demand, increasing the risk of a bearish breakout below the key support zone, potentially breaking the 2024 uptrend.
Meanwhile, analysts remain optimistic, citing strong fundamentals. According to media reports:
→ ANZ Research analysts forecast silver prices reaching $35.4 in 2025;
→ JP Morgan analysts predict silver at $36;
→ Saxo Bank analysts anticipate prices climbing to $40 by 2025.
Start trading commodities with tight spreads. Open your trading account now or learn more about trading commodity CFDs with FXOpen.
CFDs are complex instruments and come with a high risk of losing your money.
This article represents the opinion of the Companies operating under the FXOpen brand only. It is not to be construed as an offer, solicitation, or recommendation with respect to products and services provided by the Companies operating under the FXOpen brand, nor is it to be considered financial advice.
👍4
#stockmarket #stocktrading #MarketNews #marketanalysis
Super Micro Computer (SMCI) Shares Surge Nearly 30%
Yesterday, the S&P 500 (tracked as US SPX 500 mini on FXOpen) hit another record high for the year, with Super Micro Computer (SMCI) leading the charge. SMCI shares soared by 28.50% during the session.
SMCI has been highly volatile this year. In the first 2.5 months, its stock price skyrocketed over 300%, breaking the psychological $100-per-share mark, fueled by the AI boom.
However, this rally was followed by a period of consolidation and then a sharp downtrend, partly driven by accounting concerns. According to Investing, the company failed to file its 10-K form for the fiscal year 2024 due to accounting issues, leading Nasdaq to threaten delisting. Meanwhile, Ernst & Young (EY), the company’s auditor, announced it was unwilling to associate itself with the financial statements prepared by Super Micro Computer’s management.
As a result, SMCI shares dropped below $20 earlier this month. Fortunately for shareholders, it was revealed yesterday that:
→ No errors were found in Super Micro Computer's financial reports.
→ The company will not need to amend its previously filed reports.
→ The CFO will be replaced.
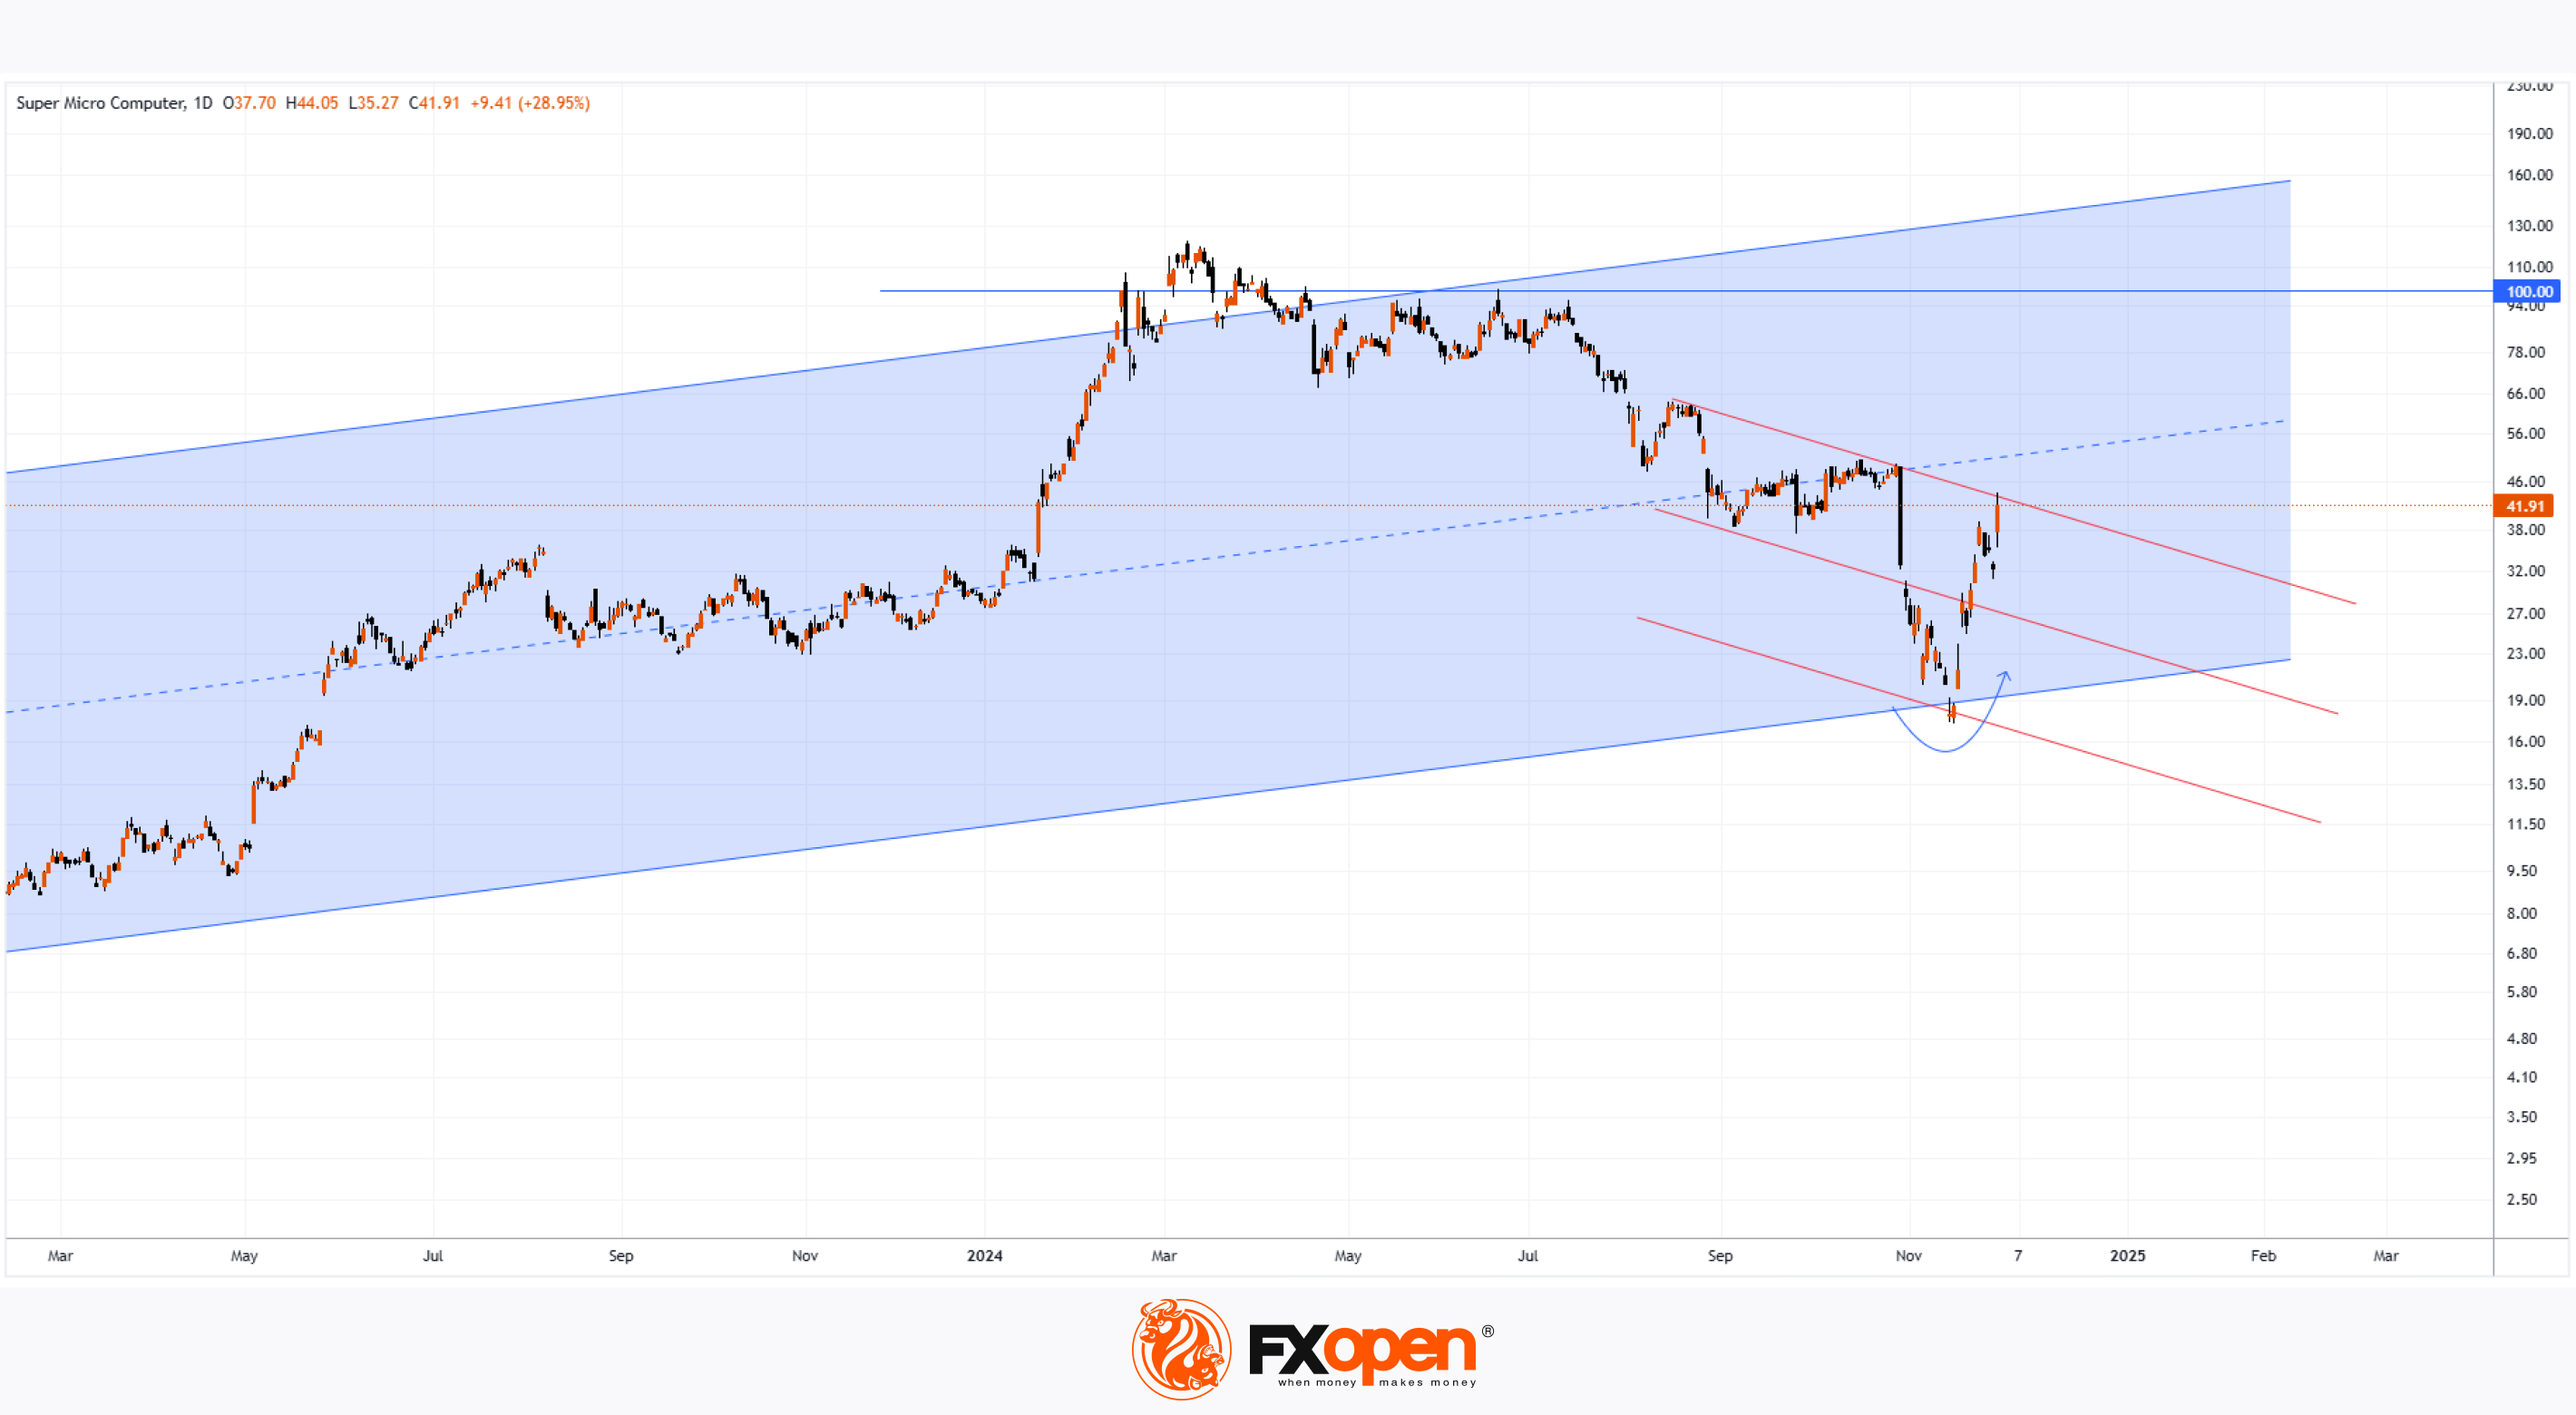
These developments sparked bullish momentum, propelling the stock from Friday’s closing price of $32.50 to yesterday’s close of $41.91.
Technical Analysis of SMCI Shares
Since 2022, the stock's wide price swings have formed an ascending channel (marked in blue). Key observations include:
→ The consolidation from late August to late November suggests the median of this channel is an equilibrium zone for supply and demand.
→ A mid-November bounce off the channel’s lower boundary (indicated by an arrow).
Will SMCI Continue Its Rally?
This week’s strong momentum may sustain further gains, potentially enabling bulls to break above the resistance line (uppermost of the three red lines) and push towards the median of the blue channel before the holiday season begins.
According to TipRanks:
→ Only 2 of 9 analysts recommend buying SMCI shares.
→ The average 12-month price target for SMCI is $38. However, these forecasts may be revised upwards in light of the latest positive news.
Trade global index CFDs with zero commission and tight spreads. Open your FXOpen account now or learn more about trading index CFDs with FXOpen.
CFDs are complex instruments and come with a high risk of losing your money.
This article represents the opinion of the Companies operating under the FXOpen brand only. It is not to be construed as an offer, solicitation, or recommendation with respect to products and services provided by the Companies operating under the FXOpen brand, nor is it to be considered financial advice.
Super Micro Computer (SMCI) Shares Surge Nearly 30%
Yesterday, the S&P 500 (tracked as US SPX 500 mini on FXOpen) hit another record high for the year, with Super Micro Computer (SMCI) leading the charge. SMCI shares soared by 28.50% during the session.
SMCI has been highly volatile this year. In the first 2.5 months, its stock price skyrocketed over 300%, breaking the psychological $100-per-share mark, fueled by the AI boom.
However, this rally was followed by a period of consolidation and then a sharp downtrend, partly driven by accounting concerns. According to Investing, the company failed to file its 10-K form for the fiscal year 2024 due to accounting issues, leading Nasdaq to threaten delisting. Meanwhile, Ernst & Young (EY), the company’s auditor, announced it was unwilling to associate itself with the financial statements prepared by Super Micro Computer’s management.
As a result, SMCI shares dropped below $20 earlier this month. Fortunately for shareholders, it was revealed yesterday that:
→ No errors were found in Super Micro Computer's financial reports.
→ The company will not need to amend its previously filed reports.
→ The CFO will be replaced.
These developments sparked bullish momentum, propelling the stock from Friday’s closing price of $32.50 to yesterday’s close of $41.91.
Technical Analysis of SMCI Shares
Since 2022, the stock's wide price swings have formed an ascending channel (marked in blue). Key observations include:
→ The consolidation from late August to late November suggests the median of this channel is an equilibrium zone for supply and demand.
→ A mid-November bounce off the channel’s lower boundary (indicated by an arrow).
Will SMCI Continue Its Rally?
This week’s strong momentum may sustain further gains, potentially enabling bulls to break above the resistance line (uppermost of the three red lines) and push towards the median of the blue channel before the holiday season begins.
According to TipRanks:
→ Only 2 of 9 analysts recommend buying SMCI shares.
→ The average 12-month price target for SMCI is $38. However, these forecasts may be revised upwards in light of the latest positive news.
Trade global index CFDs with zero commission and tight spreads. Open your FXOpen account now or learn more about trading index CFDs with FXOpen.
CFDs are complex instruments and come with a high risk of losing your money.
This article represents the opinion of the Companies operating under the FXOpen brand only. It is not to be construed as an offer, solicitation, or recommendation with respect to products and services provided by the Companies operating under the FXOpen brand, nor is it to be considered financial advice.
👍3
#marketanalysis #MarketNews #stocktrading #stockmarket #AAPL
Apple (AAPL) Stock Hits Record High
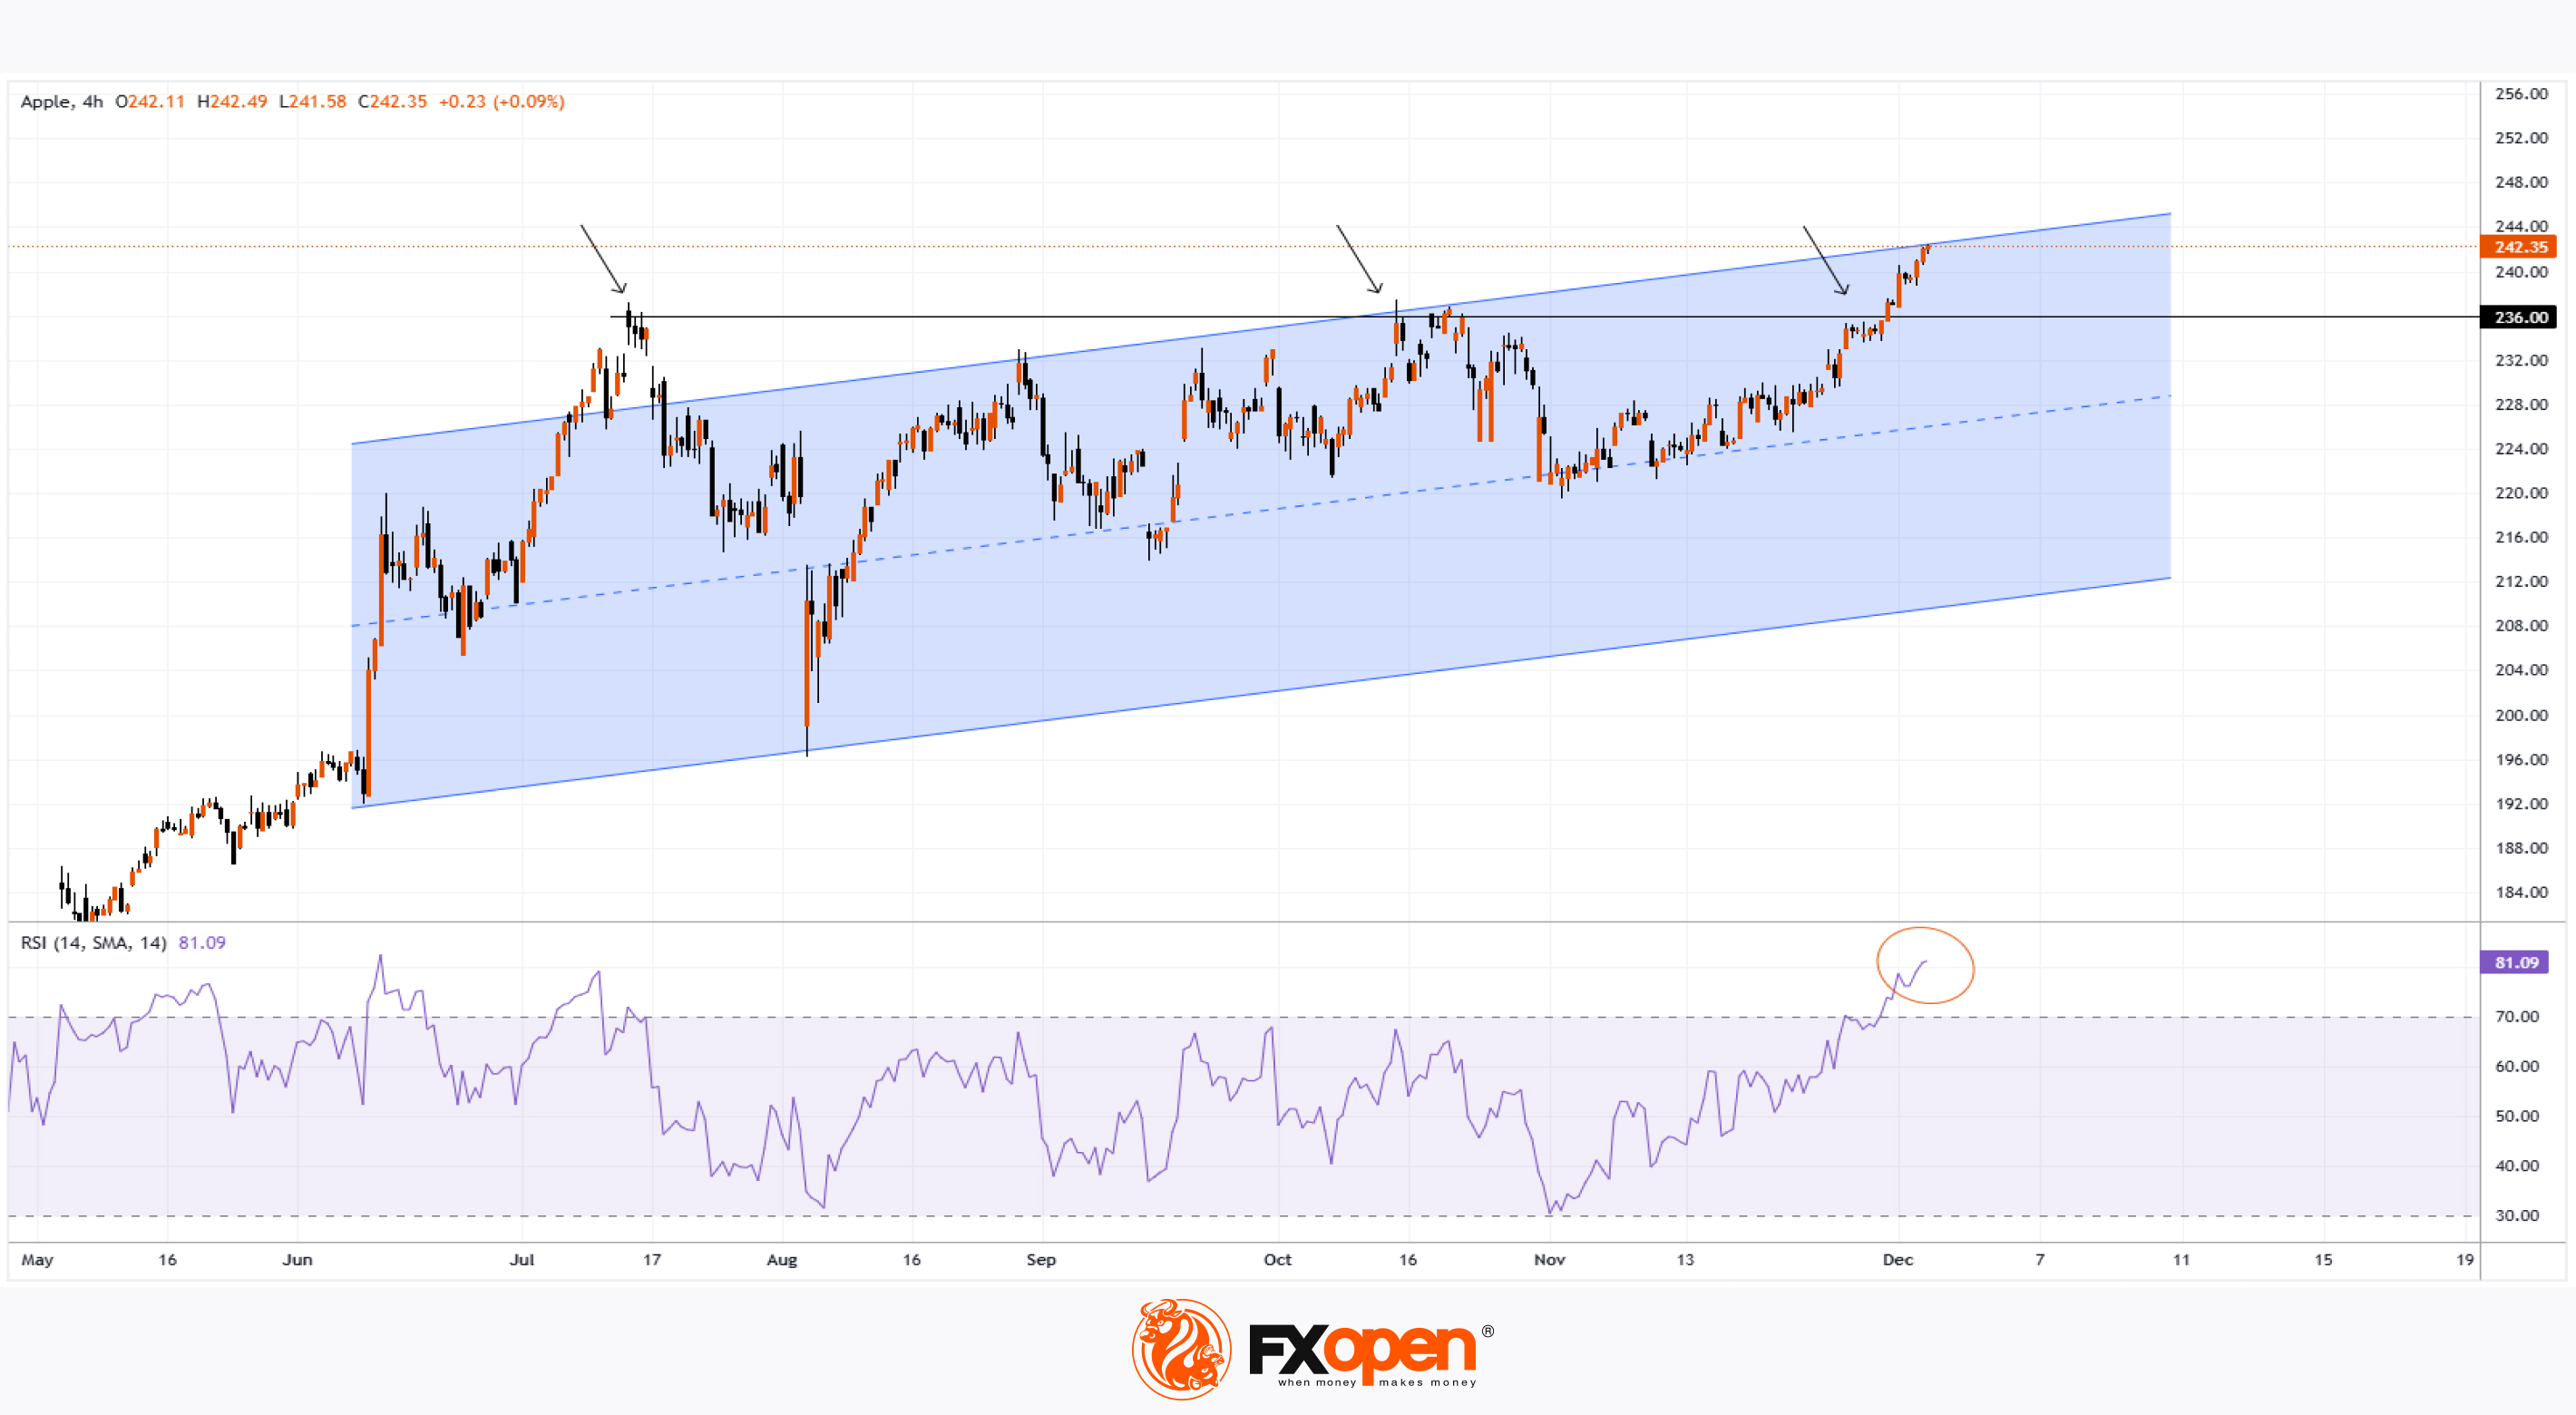
The Apple (AAPL) stock chart reveals:
→ Yesterday’s closing price exceeded $242 for the first time in history.
→ The stock has risen nearly 30% since the start of 2024.
→ Over the past 30 days, it has gained approximately 9%.
Dan Ives, an analyst at Wedbush, commented that: "Wall Street is beginning to grasp that the iPhone 16 marks the start of a supercycle." According to his insights shared via Barron’s:
→ Sales in China remain robust.
→ New AI-powered features in the iPhone 16 could drive over 90 million users to upgrade.
→ This could lead to a record-breaking year for iPhone sales and push Apple’s market capitalization to $4 trillion by 2025.
Ives has set a price target for AAPL at $300—roughly 23% above current levels. But is now the right time to invest in AAPL stock?
Technical Analysis of AAPL’s 4-Hour Chart:
→ The RSI indicator is in the overbought zone.
→ The price is near the upper boundary of an ascending channel (marked in blue), which formed after the company introduced Apple Intelligence in June.
This positioning suggests the stock may be vulnerable to a correction. If that occurs, the price could test the $236 level, which previously acted as resistance (as shown by arrows).
According to TipRanks:
→ 23 out of 33 analysts recommend buying AAPL stock.
→ The average 12-month price target for AAPL is $243.
Trade global index CFDs with zero commission and tight spreads. Open your FXOpen account now or learn more about trading index CFDs with FXOpen.
CFDs are complex instruments and come with a high risk of losing your money.
This article represents the opinion of the Companies operating under the FXOpen brand only. It is not to be construed as an offer, solicitation, or recommendation with respect to products and services provided by the Companies operating under the FXOpen brand, nor is it to be considered financial advice.
Apple (AAPL) Stock Hits Record High
The Apple (AAPL) stock chart reveals:
→ Yesterday’s closing price exceeded $242 for the first time in history.
→ The stock has risen nearly 30% since the start of 2024.
→ Over the past 30 days, it has gained approximately 9%.
Dan Ives, an analyst at Wedbush, commented that: "Wall Street is beginning to grasp that the iPhone 16 marks the start of a supercycle." According to his insights shared via Barron’s:
→ Sales in China remain robust.
→ New AI-powered features in the iPhone 16 could drive over 90 million users to upgrade.
→ This could lead to a record-breaking year for iPhone sales and push Apple’s market capitalization to $4 trillion by 2025.
Ives has set a price target for AAPL at $300—roughly 23% above current levels. But is now the right time to invest in AAPL stock?
Technical Analysis of AAPL’s 4-Hour Chart:
→ The RSI indicator is in the overbought zone.
→ The price is near the upper boundary of an ascending channel (marked in blue), which formed after the company introduced Apple Intelligence in June.
This positioning suggests the stock may be vulnerable to a correction. If that occurs, the price could test the $236 level, which previously acted as resistance (as shown by arrows).
According to TipRanks:
→ 23 out of 33 analysts recommend buying AAPL stock.
→ The average 12-month price target for AAPL is $243.
Trade global index CFDs with zero commission and tight spreads. Open your FXOpen account now or learn more about trading index CFDs with FXOpen.
CFDs are complex instruments and come with a high risk of losing your money.
This article represents the opinion of the Companies operating under the FXOpen brand only. It is not to be construed as an offer, solicitation, or recommendation with respect to products and services provided by the Companies operating under the FXOpen brand, nor is it to be considered financial advice.
👍2
#stockmarket #stocktrading #MarketNews #marketanalysis
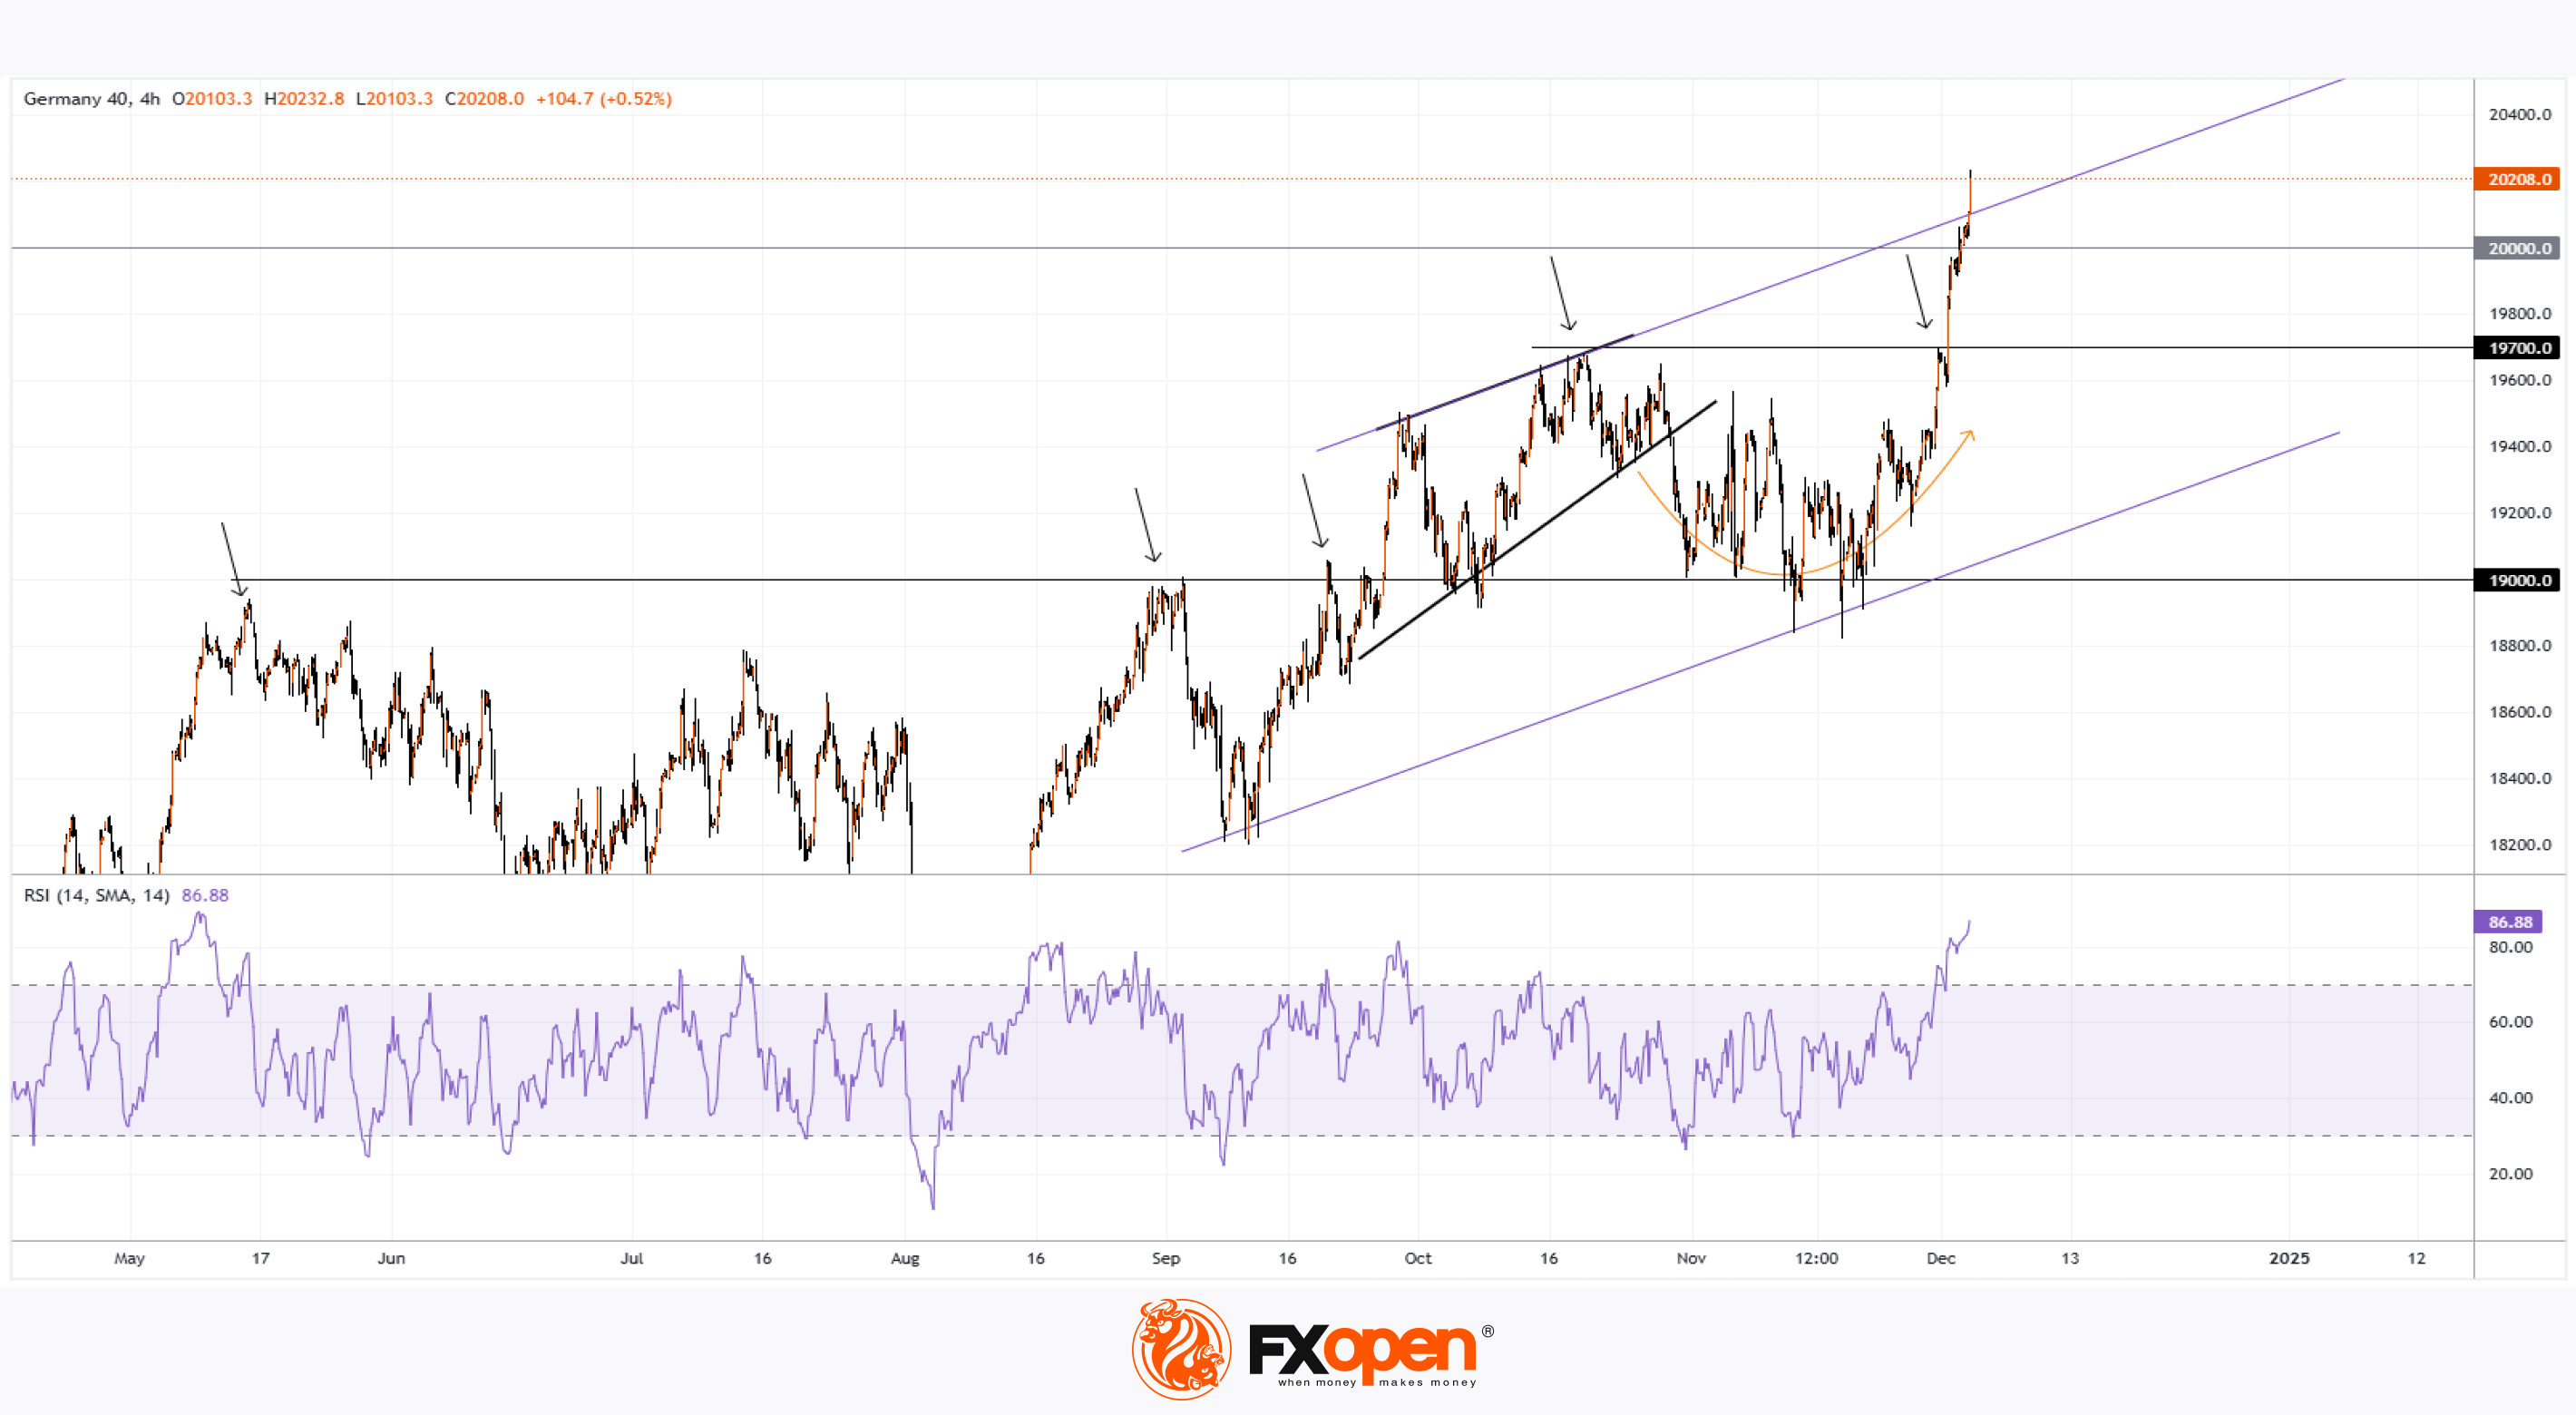
DAX 40 Index Closes Above 20,000 for the First Time
On 24 October, we noted that the DAX 40 stock index (Germany 40 mini on FXOpen) was losing bullish momentum and could break downward from the Bearish Rising Wedge pattern (marked with black lines).
Since then, as indicated by the orange arrow on the DAX 40 chart:
→ The price dropped below the pattern.
→ It found support at the psychological level of 19,000, which had previously acted as resistance (marked by arrows).
→ The price then rose to a historic high, breaking the 20,000 level.
Interestingly, the index has risen despite media reports stating:
→ The IFO Business Climate Index has fallen for the fifth consecutive month.
→ The German Services PMI has remained below 50.0. New data released today confirms that economic weakness is spreading beyond the manufacturing sector.
The bullish sentiment may be driven by the weakening euro, which makes German export-oriented companies more attractive to investors.
Today, the chart of the German stock index DAX 40 (Germany 40 mini on FXOpen) indicates that the stock market may be overbought:
→ The RSI indicator is at its highest level since May.
→ The price is near the upper boundary of the channel (marked with purple lines), constructed from key reversal points in autumn 2024.
Given these factors, it seems plausible that a correction could be forming under the current conditions. After the rally that started in late November, the DAX 40 index (Germany 40 mini on FXOpen) may decline towards the former resistance level of 19,700.
Trade global index CFDs with zero commission and tight spreads. Open your FXOpen account now or learn more about trading index CFDs with FXOpen.
CFDs are complex instruments and come with a high risk of losing your money.
This article represents the opinion of the Companies operating under the FXOpen brand only. It is not to be construed as an offer, solicitation, or recommendation with respect to products and services provided by the Companies operating under the FXOpen brand, nor is it to be considered financial advice.
DAX 40 Index Closes Above 20,000 for the First Time
On 24 October, we noted that the DAX 40 stock index (Germany 40 mini on FXOpen) was losing bullish momentum and could break downward from the Bearish Rising Wedge pattern (marked with black lines).
Since then, as indicated by the orange arrow on the DAX 40 chart:
→ The price dropped below the pattern.
→ It found support at the psychological level of 19,000, which had previously acted as resistance (marked by arrows).
→ The price then rose to a historic high, breaking the 20,000 level.
Interestingly, the index has risen despite media reports stating:
→ The IFO Business Climate Index has fallen for the fifth consecutive month.
→ The German Services PMI has remained below 50.0. New data released today confirms that economic weakness is spreading beyond the manufacturing sector.
The bullish sentiment may be driven by the weakening euro, which makes German export-oriented companies more attractive to investors.
Today, the chart of the German stock index DAX 40 (Germany 40 mini on FXOpen) indicates that the stock market may be overbought:
→ The RSI indicator is at its highest level since May.
→ The price is near the upper boundary of the channel (marked with purple lines), constructed from key reversal points in autumn 2024.
Given these factors, it seems plausible that a correction could be forming under the current conditions. After the rally that started in late November, the DAX 40 index (Germany 40 mini on FXOpen) may decline towards the former resistance level of 19,700.
Trade global index CFDs with zero commission and tight spreads. Open your FXOpen account now or learn more about trading index CFDs with FXOpen.
CFDs are complex instruments and come with a high risk of losing your money.
This article represents the opinion of the Companies operating under the FXOpen brand only. It is not to be construed as an offer, solicitation, or recommendation with respect to products and services provided by the Companies operating under the FXOpen brand, nor is it to be considered financial advice.
👍2
#META #marketanalysis #MarketNews #stockmarket
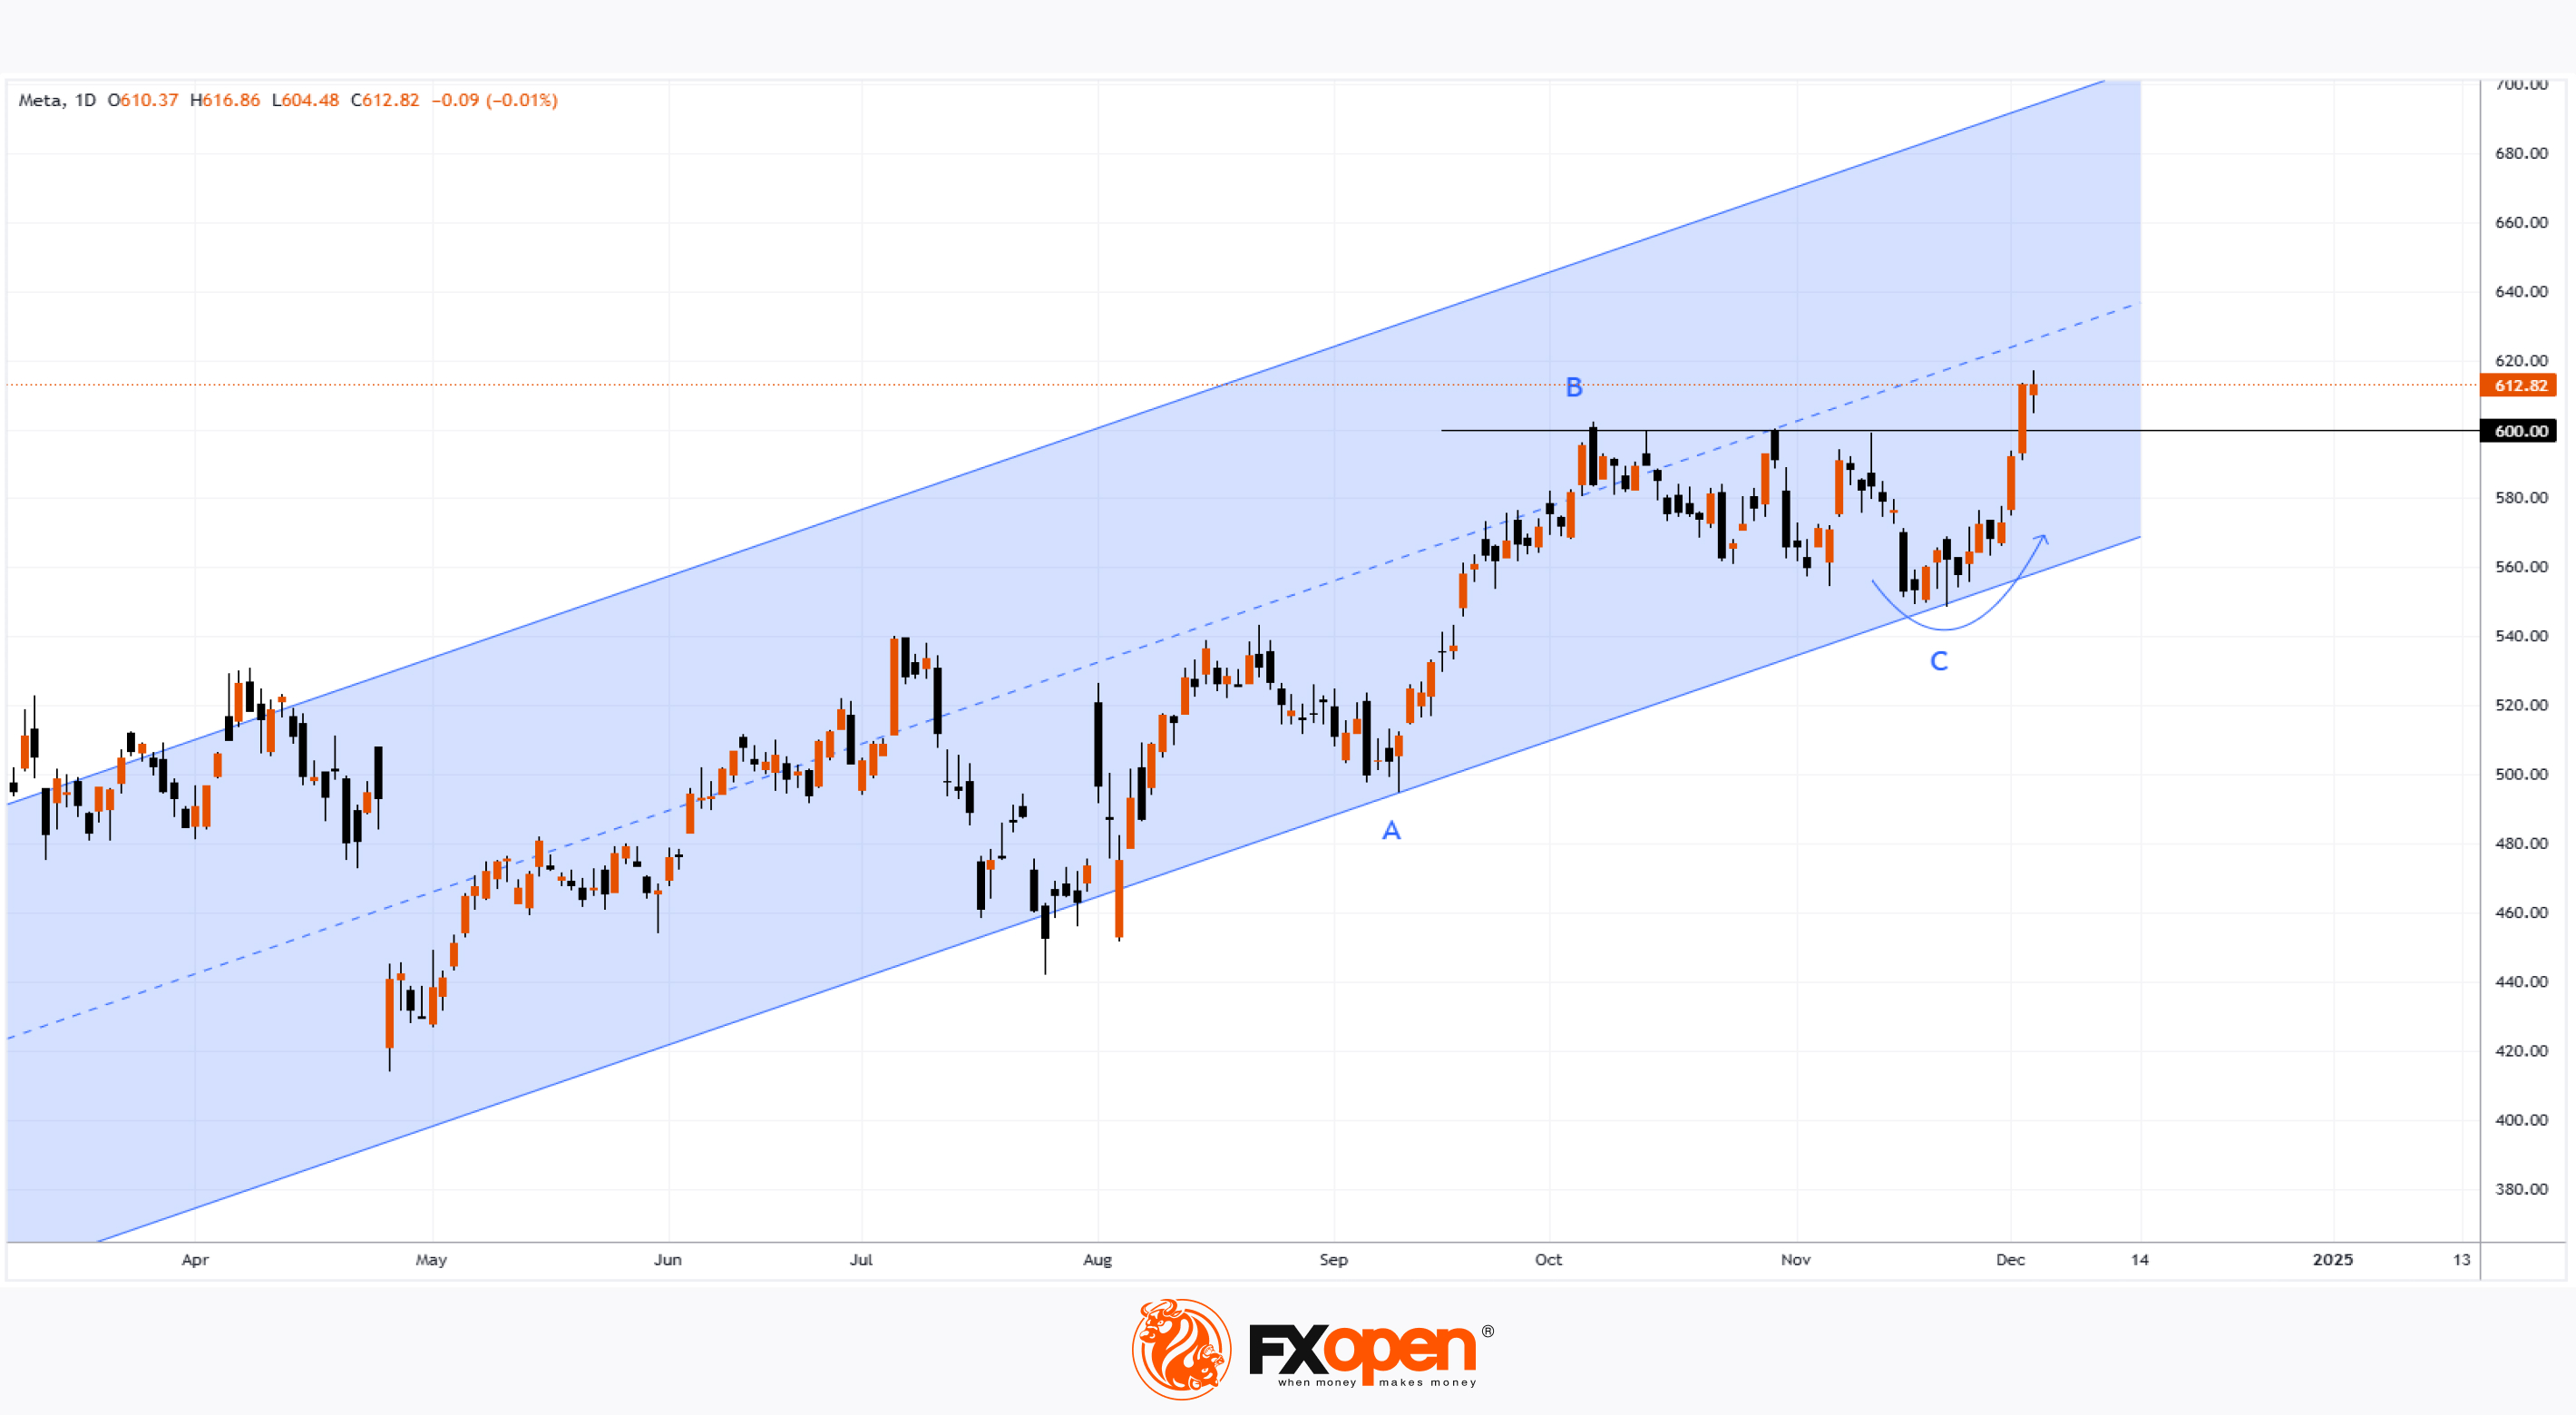
Meta Platforms (META) Stock Surges Above $600
On 19 November, we analysed the Meta Platforms (META) stock chart, highlighting:
→ the formation of a long-term upward channel (shown in blue);
→ the importance of the psychological $600 level;
→ the scenario of a bullish trend resumption with a rebound from the channel's lower boundary.
Since then:
→ as anticipated, the price reversed upwards (indicated by an arrow);
→ it broke key resistance at $600, reaching an all-time high.
The bullish momentum in META's stock price was supported by reports that:
→ AI-based tools are helping the company better monetise its vast user base and boost advertising revenue;
→ CEO Mark Zuckerberg dined with Donald Trump, suggesting their relationship may improve after Trump's prior criticism of Zuckerberg's platforms over information policies.
What’s Next?
Technical analysis of Meta Platforms (META) stock shows:
→ the decline from B to C represents approximately 50% of the rise from A to B – a bullish signal;
→ after two strong candles on Monday and Tuesday, price growth slowed on Wednesday – a bearish signal.
This suggests that buying momentum may be weakening, and bulls might now focus on maintaining levels above $600.
Analysts remain optimistic. According to TipRanks:
→ 40 out of 44 surveyed analysts recommend buying META stock;
→ the average 12-month price target for META is $662.
Trade global index CFDs with zero commission and tight spreads. Open your FXOpen account now or learn more about trading index CFDs with FXOpen.
CFDs are complex instruments and come with a high risk of losing your money.
This article represents the opinion of the Companies operating under the FXOpen brand only. It is not to be construed as an offer, solicitation, or recommendation with respect to products and services provided by the Companies operating under the FXOpen brand, nor is it to be considered financial advice.
Meta Platforms (META) Stock Surges Above $600
On 19 November, we analysed the Meta Platforms (META) stock chart, highlighting:
→ the formation of a long-term upward channel (shown in blue);
→ the importance of the psychological $600 level;
→ the scenario of a bullish trend resumption with a rebound from the channel's lower boundary.
Since then:
→ as anticipated, the price reversed upwards (indicated by an arrow);
→ it broke key resistance at $600, reaching an all-time high.
The bullish momentum in META's stock price was supported by reports that:
→ AI-based tools are helping the company better monetise its vast user base and boost advertising revenue;
→ CEO Mark Zuckerberg dined with Donald Trump, suggesting their relationship may improve after Trump's prior criticism of Zuckerberg's platforms over information policies.
What’s Next?
Technical analysis of Meta Platforms (META) stock shows:
→ the decline from B to C represents approximately 50% of the rise from A to B – a bullish signal;
→ after two strong candles on Monday and Tuesday, price growth slowed on Wednesday – a bearish signal.
This suggests that buying momentum may be weakening, and bulls might now focus on maintaining levels above $600.
Analysts remain optimistic. According to TipRanks:
→ 40 out of 44 surveyed analysts recommend buying META stock;
→ the average 12-month price target for META is $662.
Trade global index CFDs with zero commission and tight spreads. Open your FXOpen account now or learn more about trading index CFDs with FXOpen.
CFDs are complex instruments and come with a high risk of losing your money.
This article represents the opinion of the Companies operating under the FXOpen brand only. It is not to be construed as an offer, solicitation, or recommendation with respect to products and services provided by the Companies operating under the FXOpen brand, nor is it to be considered financial advice.
👍2
#gasprices #MarketUpdates #MarketNews
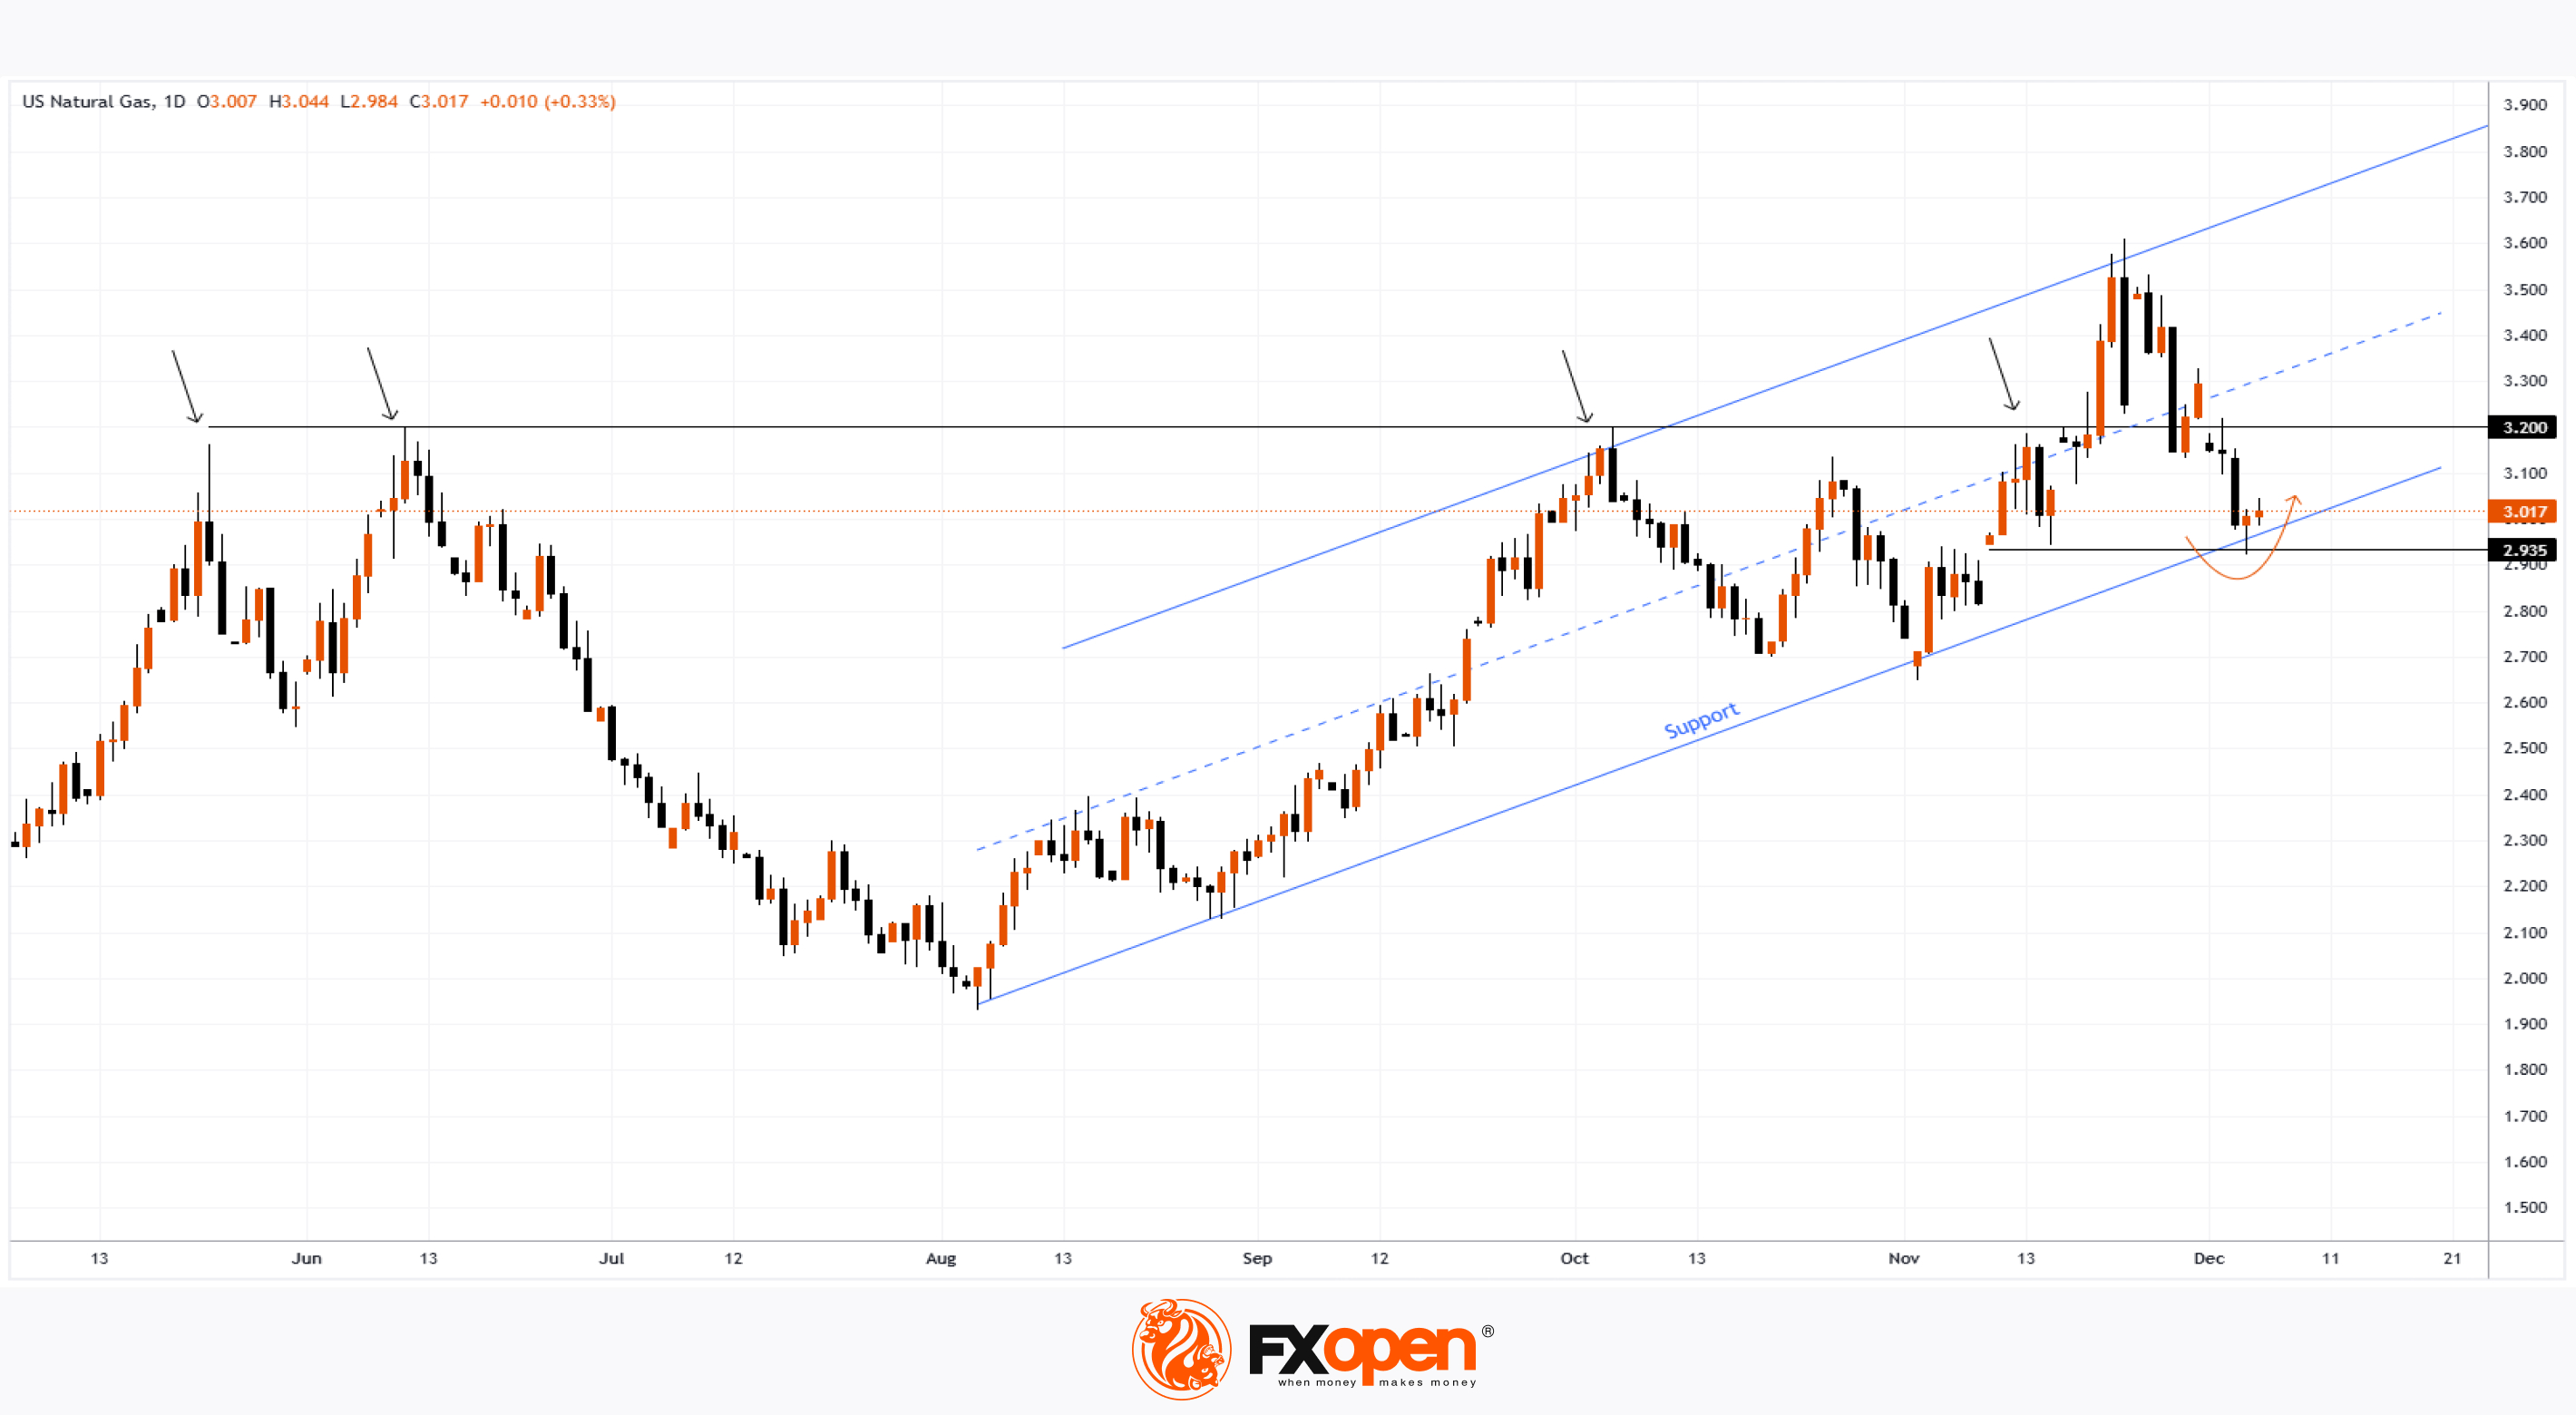
Natural Gas Prices Rebound from 2.5-Month Low
On 19 November, we analysed the natural gas price chart, noting:
→ the formation of an upward channel (marked in blue);
→ a potential bullish attempt to break the key $3.200 level, which had acted as resistance (highlighted with arrows).
As seen on the XNG/USD chart, the price did rise above $3.200 but failed to hold. After fluctuating in the upper half of the channel, it dropped below $3.200 to the channel's lower boundary, driven by:
→ a bearish report from the Energy Information Administration, showing US gas inventories above the five-year average;
→ a report from financial firm LSEG noting increased average gas production across 48 US states.
This decline pushed natural gas prices to a 2.5-month low around the $2.935 level.
What Could Happen Next?
From a technical perspective on the XNG/USD chart:
→ support from the channel's lower boundary (reinforced by the psychological $3.000 mark) is already evident in an emerging price reversal (indicated by an arrow);
→ on the other hand, the $3.200 level may resume acting as resistance.
It’s likely that natural gas prices will fluctuate between $3.000 and $3.200, with weather forecasts playing a decisive role in shaping consumption expectations for the winter season.
Start trading commodities with tight spreads. Open your trading account now or learn more about trading commodity CFDs with FXOpen.
CFDs are complex instruments and come with a high risk of losing your money.
This article represents the opinion of the Companies operating under the FXOpen brand only. It is not to be construed as an offer, solicitation, or recommendation with respect to products and services provided by the Companies operating under the FXOpen brand, nor is it to be considered financial advice.
Natural Gas Prices Rebound from 2.5-Month Low
On 19 November, we analysed the natural gas price chart, noting:
→ the formation of an upward channel (marked in blue);
→ a potential bullish attempt to break the key $3.200 level, which had acted as resistance (highlighted with arrows).
As seen on the XNG/USD chart, the price did rise above $3.200 but failed to hold. After fluctuating in the upper half of the channel, it dropped below $3.200 to the channel's lower boundary, driven by:
→ a bearish report from the Energy Information Administration, showing US gas inventories above the five-year average;
→ a report from financial firm LSEG noting increased average gas production across 48 US states.
This decline pushed natural gas prices to a 2.5-month low around the $2.935 level.
What Could Happen Next?
From a technical perspective on the XNG/USD chart:
→ support from the channel's lower boundary (reinforced by the psychological $3.000 mark) is already evident in an emerging price reversal (indicated by an arrow);
→ on the other hand, the $3.200 level may resume acting as resistance.
It’s likely that natural gas prices will fluctuate between $3.000 and $3.200, with weather forecasts playing a decisive role in shaping consumption expectations for the winter season.
Start trading commodities with tight spreads. Open your trading account now or learn more about trading commodity CFDs with FXOpen.
CFDs are complex instruments and come with a high risk of losing your money.
This article represents the opinion of the Companies operating under the FXOpen brand only. It is not to be construed as an offer, solicitation, or recommendation with respect to products and services provided by the Companies operating under the FXOpen brand, nor is it to be considered financial advice.
👍2
#stockmarket #stocktrading #MarketNews #marketanalysis
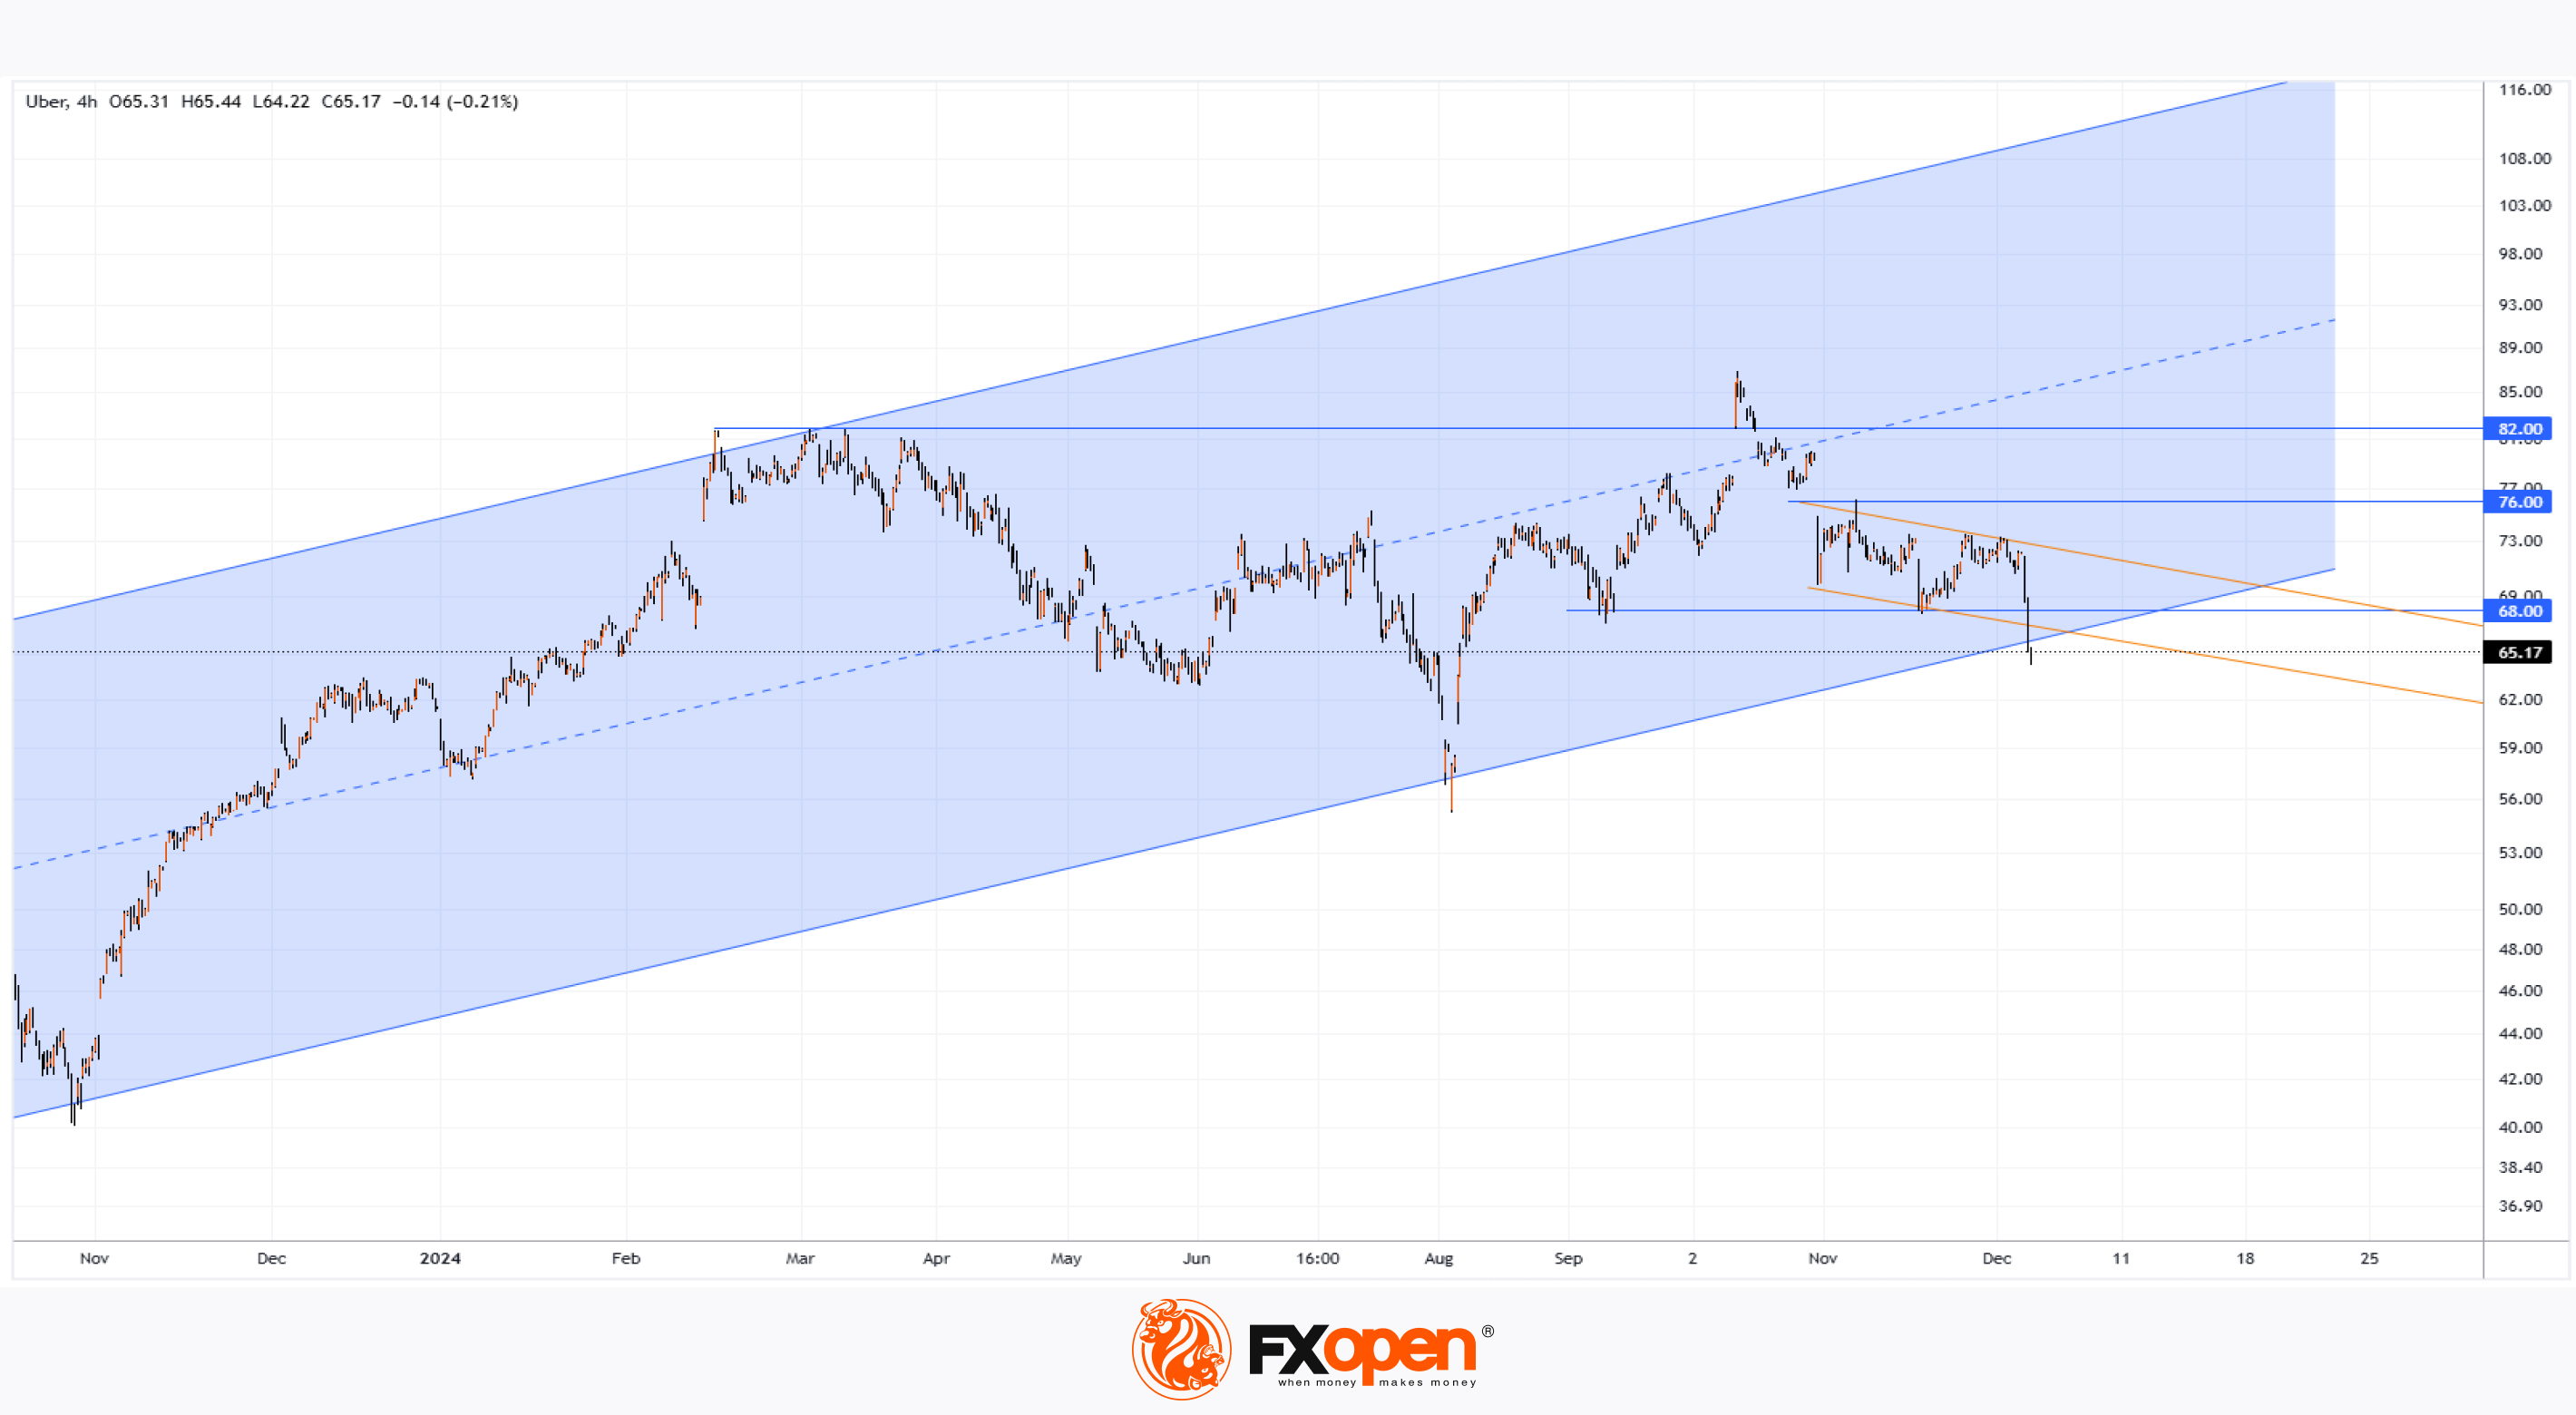
Uber Shares Drop Nearly 10%
In 2024, Uber Technologies (UBER) stock has come under significant pressure, partly due to mounting competition:
→ Tesla is reportedly advancing its autonomous taxi development.
→ Yesterday, Waymo (owned by Alphabet, Google’s parent company) announced plans to train its driverless taxis in Miami in 2025, aiming to launch the service in 2026.
According to Business Insider, Uber and Lyft drivers report that Waymo's autonomous taxis, already operating in Phoenix and other cities, are noticeably impacting their earnings. This seems to exemplify a scenario where humans are being replaced by robots.
What’s Next for Uber Stock?
Technical analysis of UBER's price chart shows the stock remains within a long-term upward channel (indicated in blue), but bearish signs are emerging:
→ The price spike in October to an all-time high resulted in a false breakout of resistance at $82.
→ Late October saw a large bearish gap, sending the price below $76, which then acted as resistance in November.
→ Currently, UBER shares are trading below $68, a key support level since early autumn.
This creates a downward trend on the chart (highlighted by orange lines), threatening to breach the long-term upward trajectory. However, bulls may attempt to leverage support from the lower boundary of the channel to regain momentum.
Analysts remain optimistic. According to TipRanks:
→ 34 out of 36 analysts recommend buying UBER stock.
→ The average 12-month price target for UBER is $93.26.
Trade global index CFDs with zero commission and tight spreads. Open your FXOpen account now or learn more about trading index CFDs with FXOpen.
CFDs are complex instruments and come with a high risk of losing your money.
This article represents the opinion of the Companies operating under the FXOpen brand only. It is not to be construed as an offer, solicitation, or recommendation with respect to products and services provided by the Companies operating under the FXOpen brand, nor is it to be considered financial advice.
Uber Shares Drop Nearly 10%
In 2024, Uber Technologies (UBER) stock has come under significant pressure, partly due to mounting competition:
→ Tesla is reportedly advancing its autonomous taxi development.
→ Yesterday, Waymo (owned by Alphabet, Google’s parent company) announced plans to train its driverless taxis in Miami in 2025, aiming to launch the service in 2026.
According to Business Insider, Uber and Lyft drivers report that Waymo's autonomous taxis, already operating in Phoenix and other cities, are noticeably impacting their earnings. This seems to exemplify a scenario where humans are being replaced by robots.
What’s Next for Uber Stock?
Technical analysis of UBER's price chart shows the stock remains within a long-term upward channel (indicated in blue), but bearish signs are emerging:
→ The price spike in October to an all-time high resulted in a false breakout of resistance at $82.
→ Late October saw a large bearish gap, sending the price below $76, which then acted as resistance in November.
→ Currently, UBER shares are trading below $68, a key support level since early autumn.
This creates a downward trend on the chart (highlighted by orange lines), threatening to breach the long-term upward trajectory. However, bulls may attempt to leverage support from the lower boundary of the channel to regain momentum.
Analysts remain optimistic. According to TipRanks:
→ 34 out of 36 analysts recommend buying UBER stock.
→ The average 12-month price target for UBER is $93.26.
Trade global index CFDs with zero commission and tight spreads. Open your FXOpen account now or learn more about trading index CFDs with FXOpen.
CFDs are complex instruments and come with a high risk of losing your money.
This article represents the opinion of the Companies operating under the FXOpen brand only. It is not to be construed as an offer, solicitation, or recommendation with respect to products and services provided by the Companies operating under the FXOpen brand, nor is it to be considered financial advice.
👍2
#DAX40 #JPY #NaturalGas #AppleStock #AAPL #MarketNews #Investing #EnergyMarkets
Weekly Market Wrap With Gary Thomson: DAX 40, Yen, Natural Gas, Apple stocks
Get the latest scoop on the week's hottest headlines, all in one convenient video. Join Gary Thomson, the COO of FXOpen UK, as he breaks down the most significant news reports and shares his expert insights.
🔸DAX 40 Index Closes Above 20,000 for the First Time
🔸Yen Strengthens on Rate Hike Expectations; Euro Tests Recent Lows
🔸Natural Gas Prices Rebound from 2.5-Month Low
🔸Apple (AAPL) Stock Hits Record High
Stay in the know and empower yourself with our short, yet power-packed video. Watch it now and stay updated with FXOpen. Don't miss out on this invaluable opportunity to sharpen your trading skills and make informed decisions.
https://cutt.ly/CeXHG6wQ
To take advantage of price fluctuations in the foreign exchange markets, consider enlisting the services of a reliable broker like FXOpen.
⚠️
This forecast represents FXOpen Companies opinion only, it should not be construed as an offer, invitation or recommendation in respect to FXOpen Companies products and services or as financial advice.
Weekly Market Wrap With Gary Thomson: DAX 40, Yen, Natural Gas, Apple stocks
Get the latest scoop on the week's hottest headlines, all in one convenient video. Join Gary Thomson, the COO of FXOpen UK, as he breaks down the most significant news reports and shares his expert insights.
🔸DAX 40 Index Closes Above 20,000 for the First Time
🔸Yen Strengthens on Rate Hike Expectations; Euro Tests Recent Lows
🔸Natural Gas Prices Rebound from 2.5-Month Low
🔸Apple (AAPL) Stock Hits Record High
Stay in the know and empower yourself with our short, yet power-packed video. Watch it now and stay updated with FXOpen. Don't miss out on this invaluable opportunity to sharpen your trading skills and make informed decisions.
https://cutt.ly/CeXHG6wQ
To take advantage of price fluctuations in the foreign exchange markets, consider enlisting the services of a reliable broker like FXOpen.
⚠️
This forecast represents FXOpen Companies opinion only, it should not be construed as an offer, invitation or recommendation in respect to FXOpen Companies products and services or as financial advice.
YouTube
Weekly Market Wrap With Gary Thomson: DAX 40, Yen, Natural Gas, Apple stocks
Get the latest scoop on the week's hottest headlines, all in one convenient video. Join Gary Thomson, the COO of FXOpen UK, as he breaks down the most significant news reports and shares his expert insights
- DAX 40 Index Closes Above 20,000 for the First…
- DAX 40 Index Closes Above 20,000 for the First…
👍2
#AUDUSD #forextrading #tradingtips #marketanalysis
AUD/USD at a Critical Support Level
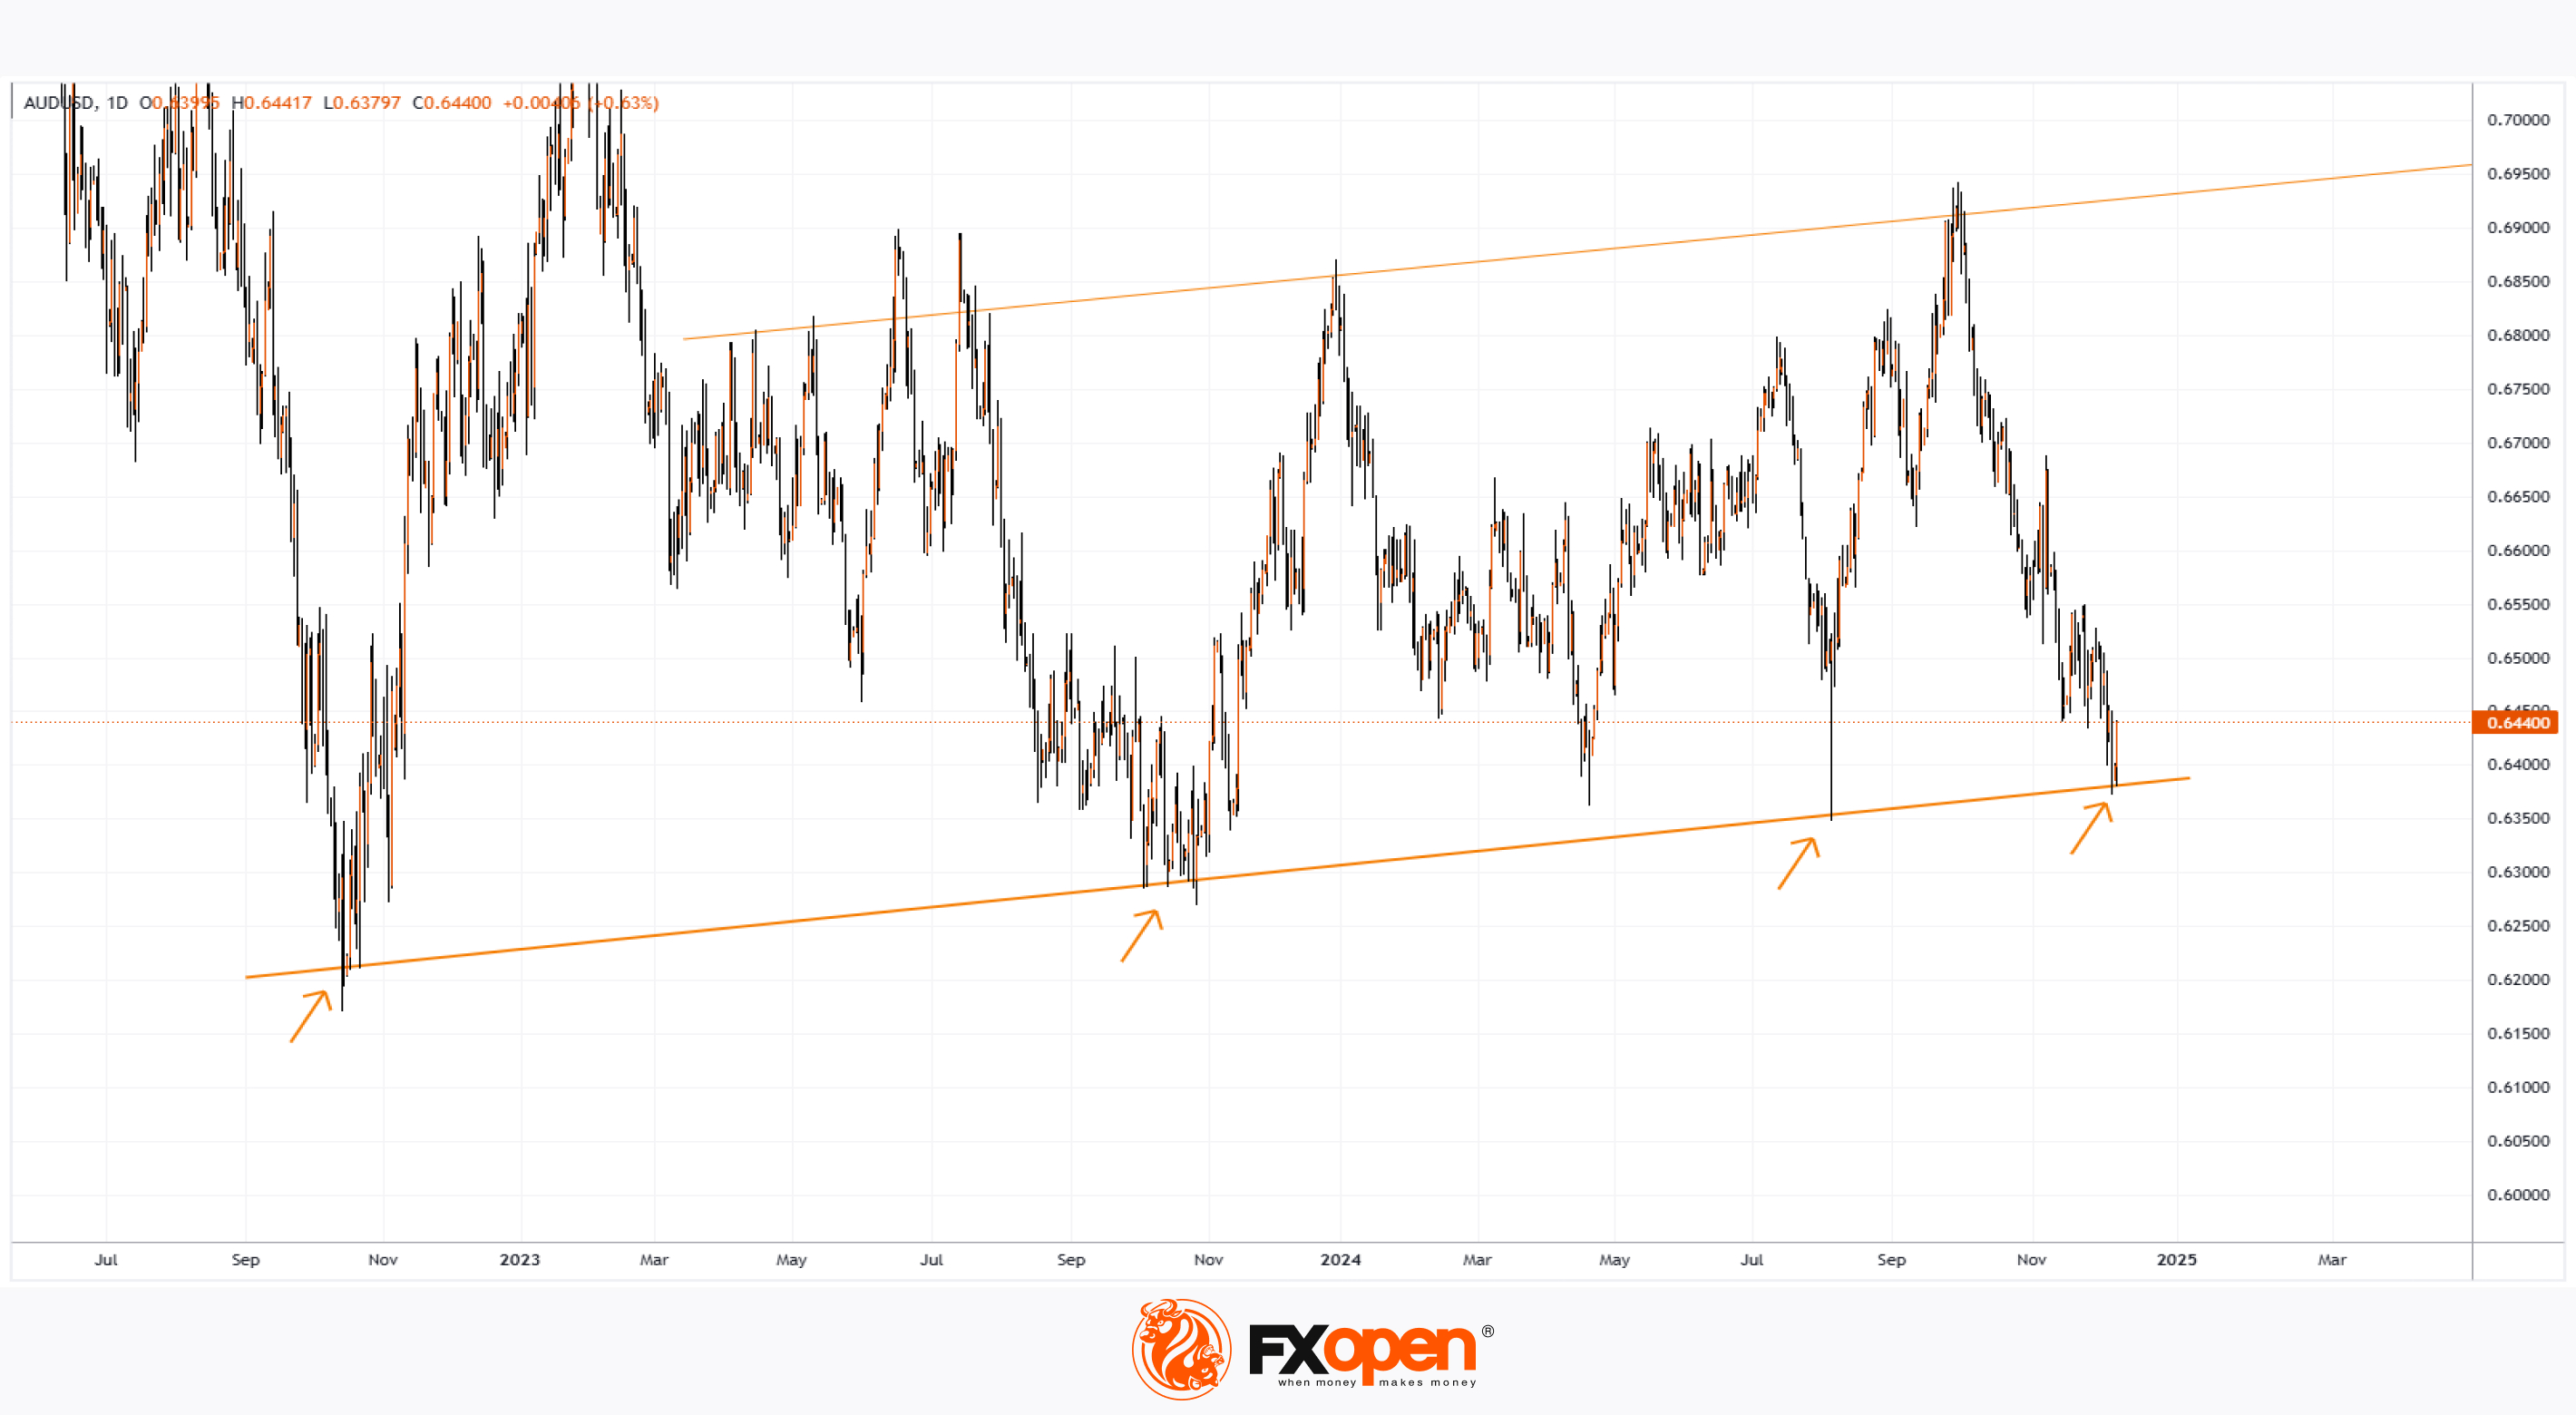
The AUD/USD chart reveals that since late October, the pair has been in a downtrend. This is largely driven by monetary policy differences: while the Federal Reserve has begun cutting interest rates, the Reserve Bank of Australia (RBA) has yet to initiate rate reductions.
Tomorrow, the RBA will announce its decision on interest rates. All 44 economists surveyed by Reuters expect the rate to remain at 4.35%, given persistently high core inflation (3.5%) and low unemployment.
Previously, experts forecasted rate cuts in the first quarter of 2025. However, most now anticipate reductions no earlier than the second quarter, as the RBA focuses on bringing inflation back to its 2–3% target range.
Meanwhile, the AUD/USD chart highlights that the price is sitting at a key support level (marked by a red line), which has already reversed the pair upward three times since the latter half of 2022 (indicated with arrows).
Tomorrow's crucial RBA decision is likely to strongly influence whether this support will manage to reverse the price upward for the fourth time. Monday's robust price action suggests that another upward reversal is possible.
Trade over 50 forex markets 24 hours a day with FXOpen. Take advantage of low commissions, deep liquidity, and spreads from 0.0 pips. Open your FXOpen account now or learn more about trading forex with FXOpen.
CFDs are complex instruments and come with a high risk of losing your money.
This article represents the opinion of the Companies operating under the FXOpen brand only. It is not to be construed as an offer, solicitation, or recommendation with respect to products and services provided by the Companies operating under the FXOpen brand, nor is it to be considered financial advice.
AUD/USD at a Critical Support Level
The AUD/USD chart reveals that since late October, the pair has been in a downtrend. This is largely driven by monetary policy differences: while the Federal Reserve has begun cutting interest rates, the Reserve Bank of Australia (RBA) has yet to initiate rate reductions.
Tomorrow, the RBA will announce its decision on interest rates. All 44 economists surveyed by Reuters expect the rate to remain at 4.35%, given persistently high core inflation (3.5%) and low unemployment.
Previously, experts forecasted rate cuts in the first quarter of 2025. However, most now anticipate reductions no earlier than the second quarter, as the RBA focuses on bringing inflation back to its 2–3% target range.
Meanwhile, the AUD/USD chart highlights that the price is sitting at a key support level (marked by a red line), which has already reversed the pair upward three times since the latter half of 2022 (indicated with arrows).
Tomorrow's crucial RBA decision is likely to strongly influence whether this support will manage to reverse the price upward for the fourth time. Monday's robust price action suggests that another upward reversal is possible.
Trade over 50 forex markets 24 hours a day with FXOpen. Take advantage of low commissions, deep liquidity, and spreads from 0.0 pips. Open your FXOpen account now or learn more about trading forex with FXOpen.
CFDs are complex instruments and come with a high risk of losing your money.
This article represents the opinion of the Companies operating under the FXOpen brand only. It is not to be construed as an offer, solicitation, or recommendation with respect to products and services provided by the Companies operating under the FXOpen brand, nor is it to be considered financial advice.
👍1
#marketanalysis #MarketNews #stockmarket #stocktrading #MSFT
Microsoft (MSFT) Stock Hits a 4.5-Month High
On 31 October, our analysis of Microsoft (MSFT) stock highlighted:
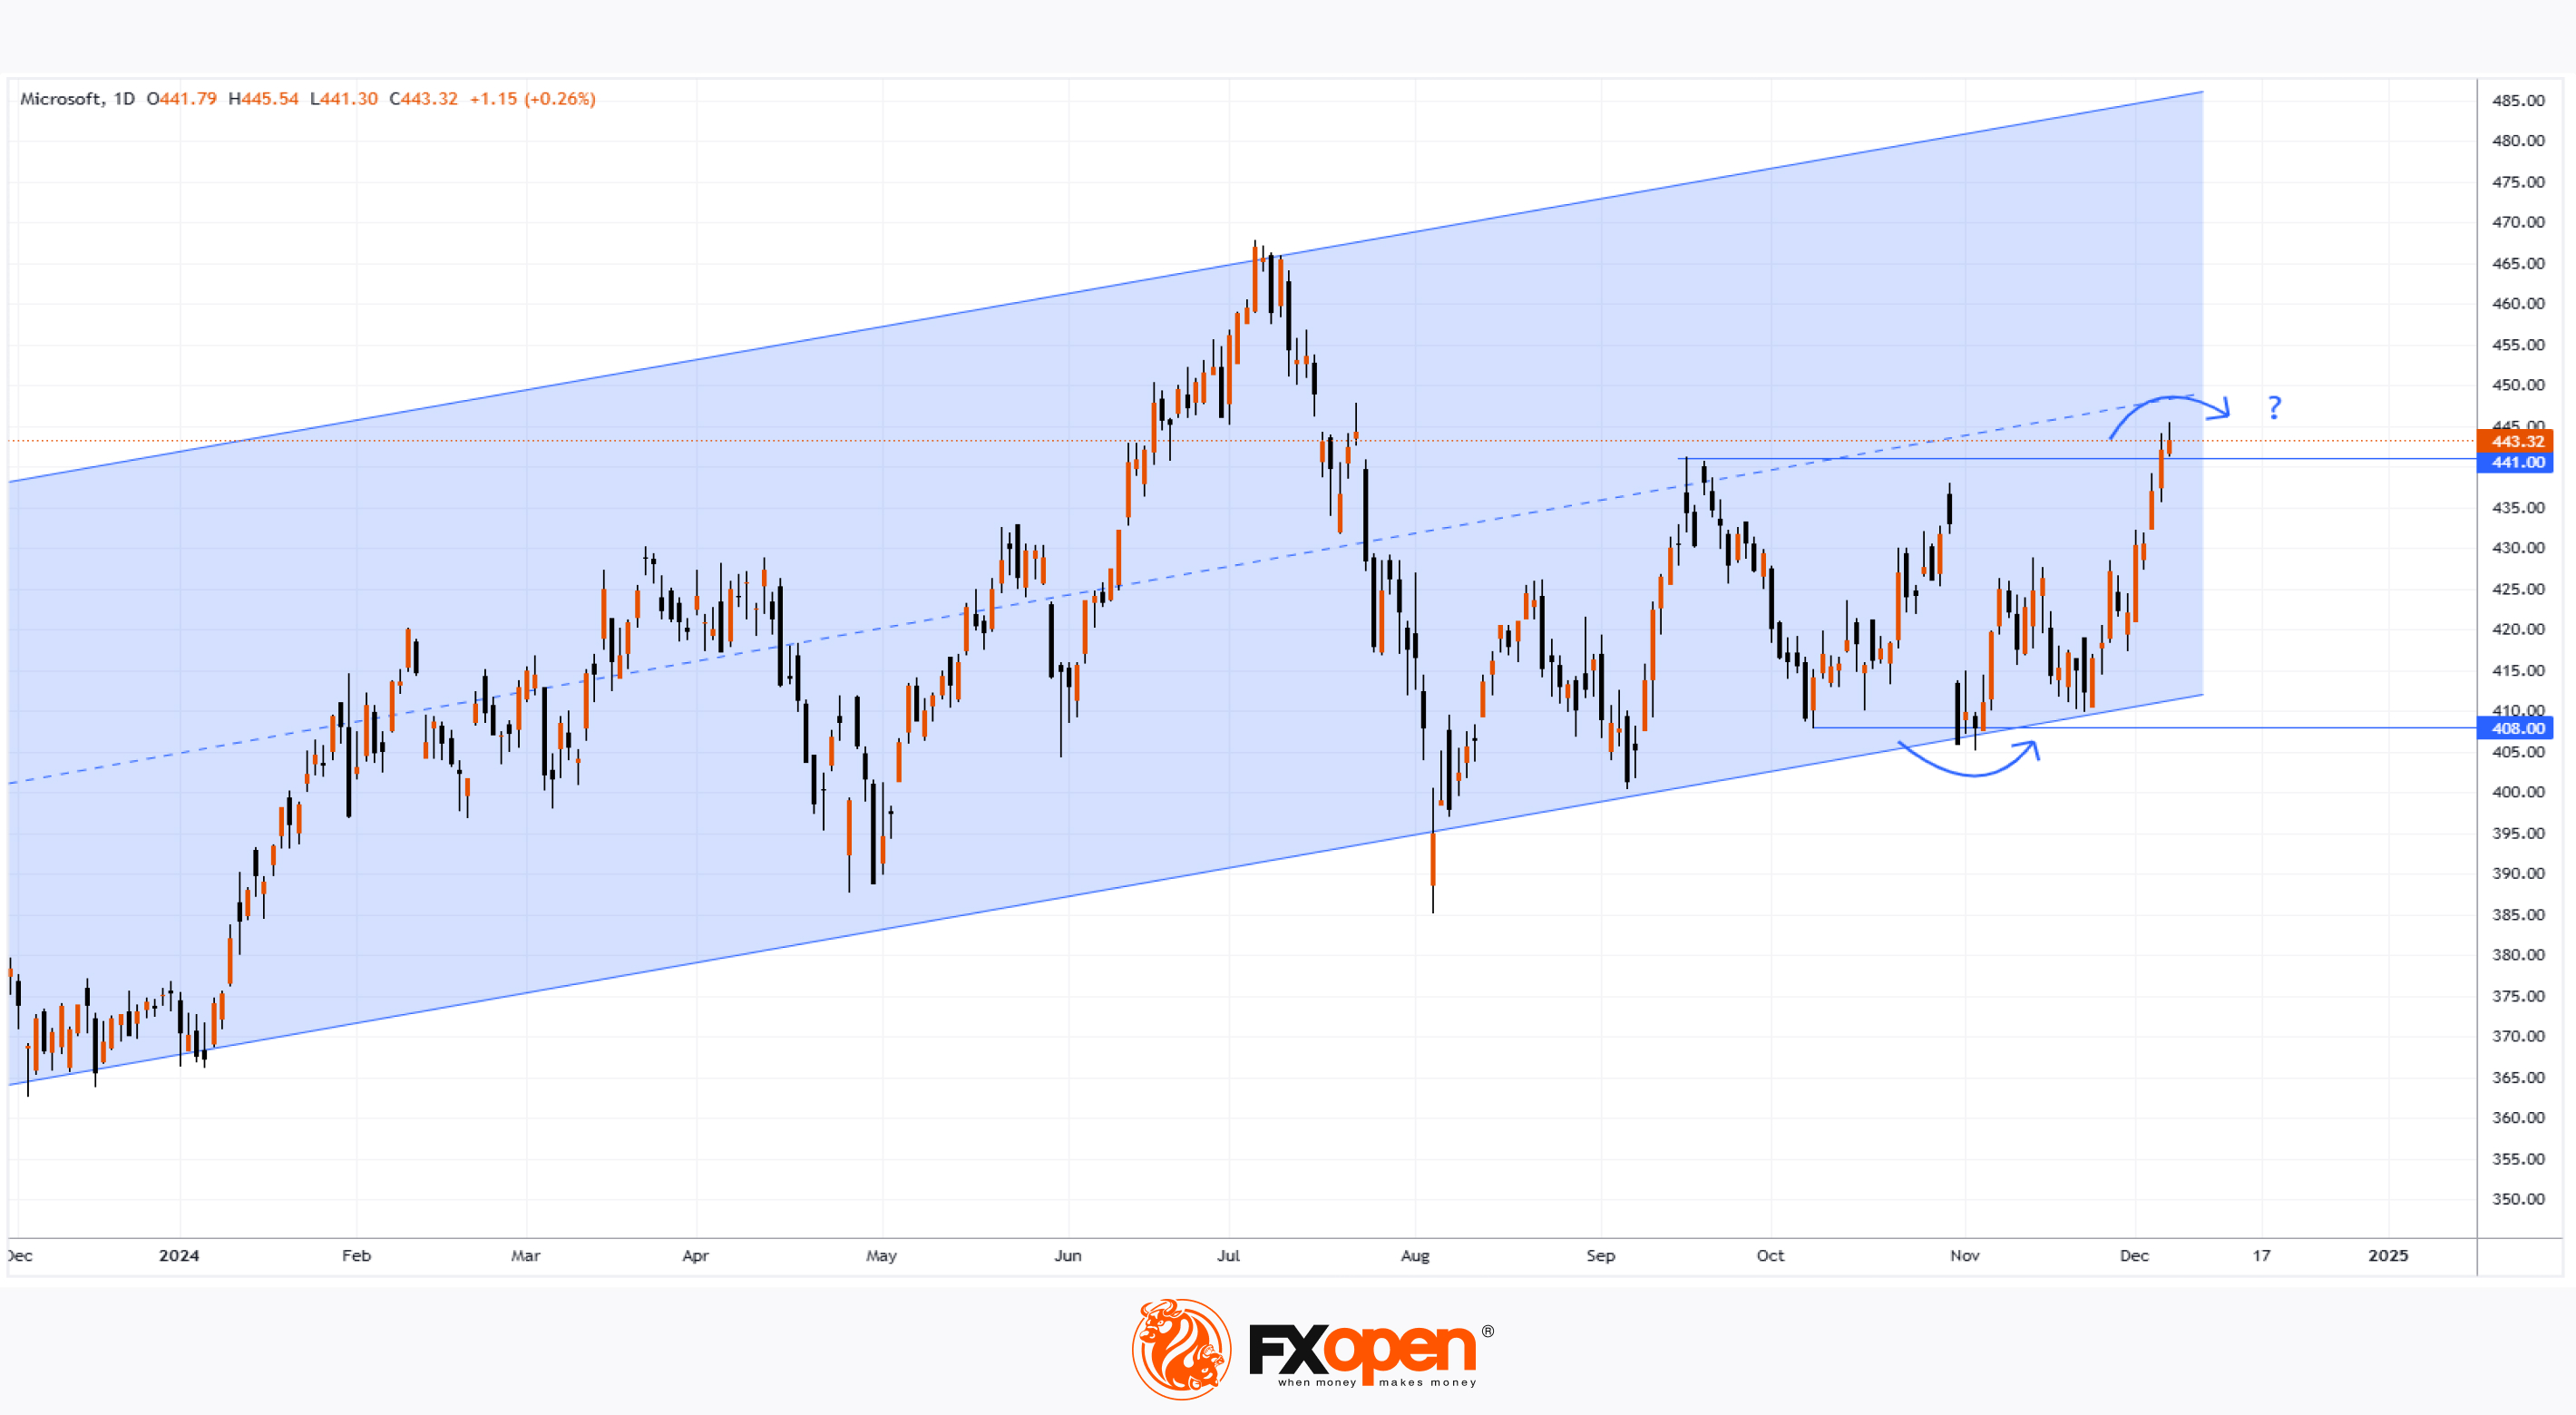
→ The price is forming a long-term upward channel, illustrated in blue.
→ The channel’s lower boundary serves as a significant support level.
On Friday, MSFT stock climbed to $445, its highest level since mid-July, buoyed by news that OpenAI may grant Microsoft access to key AI-related technologies.
Will the Price Continue to Rise?
There are reasons to suspect that the bullish momentum may not sustain.
Technical analysis of MSFT’s chart today suggests:
→ The price is near the median of the long-term channel, and this median could act as resistance. This is hinted at by the long upper shadows on Thursday and Friday’s candles.
→ The emerging bullish breakout above the September high around $441 might prove to be a false breakout, similar to the false bearish breakout of early October support near $408 (highlighted with arrows).
Additionally, Microsoft’s stock has underperformed compared to market indices, which are at historic highs. This could mean the price may retrace to $430 or lower, aligning more closely with average autumn levels.
Analysts, however, remain optimistic about MSFT’s prospects. According to TipRanks:
→ 26 out of 29 analysts recommend buying MSFT stock.
→ The average 12-month price target for MSFT is $497.
Trade global index CFDs with zero commission and tight spreads. Open your FXOpen account now or learn more about trading index CFDs with FXOpen.
CFDs are complex instruments and come with a high risk of losing your money.
This article represents the opinion of the Companies operating under the FXOpen brand only. It is not to be construed as an offer, solicitation, or recommendation with respect to products and services provided by the Companies operating under the FXOpen brand, nor is it to be considered financial advice.
Microsoft (MSFT) Stock Hits a 4.5-Month High
On 31 October, our analysis of Microsoft (MSFT) stock highlighted:
→ The price is forming a long-term upward channel, illustrated in blue.
→ The channel’s lower boundary serves as a significant support level.
On Friday, MSFT stock climbed to $445, its highest level since mid-July, buoyed by news that OpenAI may grant Microsoft access to key AI-related technologies.
Will the Price Continue to Rise?
There are reasons to suspect that the bullish momentum may not sustain.
Technical analysis of MSFT’s chart today suggests:
→ The price is near the median of the long-term channel, and this median could act as resistance. This is hinted at by the long upper shadows on Thursday and Friday’s candles.
→ The emerging bullish breakout above the September high around $441 might prove to be a false breakout, similar to the false bearish breakout of early October support near $408 (highlighted with arrows).
Additionally, Microsoft’s stock has underperformed compared to market indices, which are at historic highs. This could mean the price may retrace to $430 or lower, aligning more closely with average autumn levels.
Analysts, however, remain optimistic about MSFT’s prospects. According to TipRanks:
→ 26 out of 29 analysts recommend buying MSFT stock.
→ The average 12-month price target for MSFT is $497.
Trade global index CFDs with zero commission and tight spreads. Open your FXOpen account now or learn more about trading index CFDs with FXOpen.
CFDs are complex instruments and come with a high risk of losing your money.
This article represents the opinion of the Companies operating under the FXOpen brand only. It is not to be construed as an offer, solicitation, or recommendation with respect to products and services provided by the Companies operating under the FXOpen brand, nor is it to be considered financial advice.
👍2
#stockmarket #stocktrading #nvidia #NVDA
Nvidia (NVDA) Stock Drops Amid Investigation in China
On 21 November, our analysis of Nvidia (NVDA) stock price revealed:
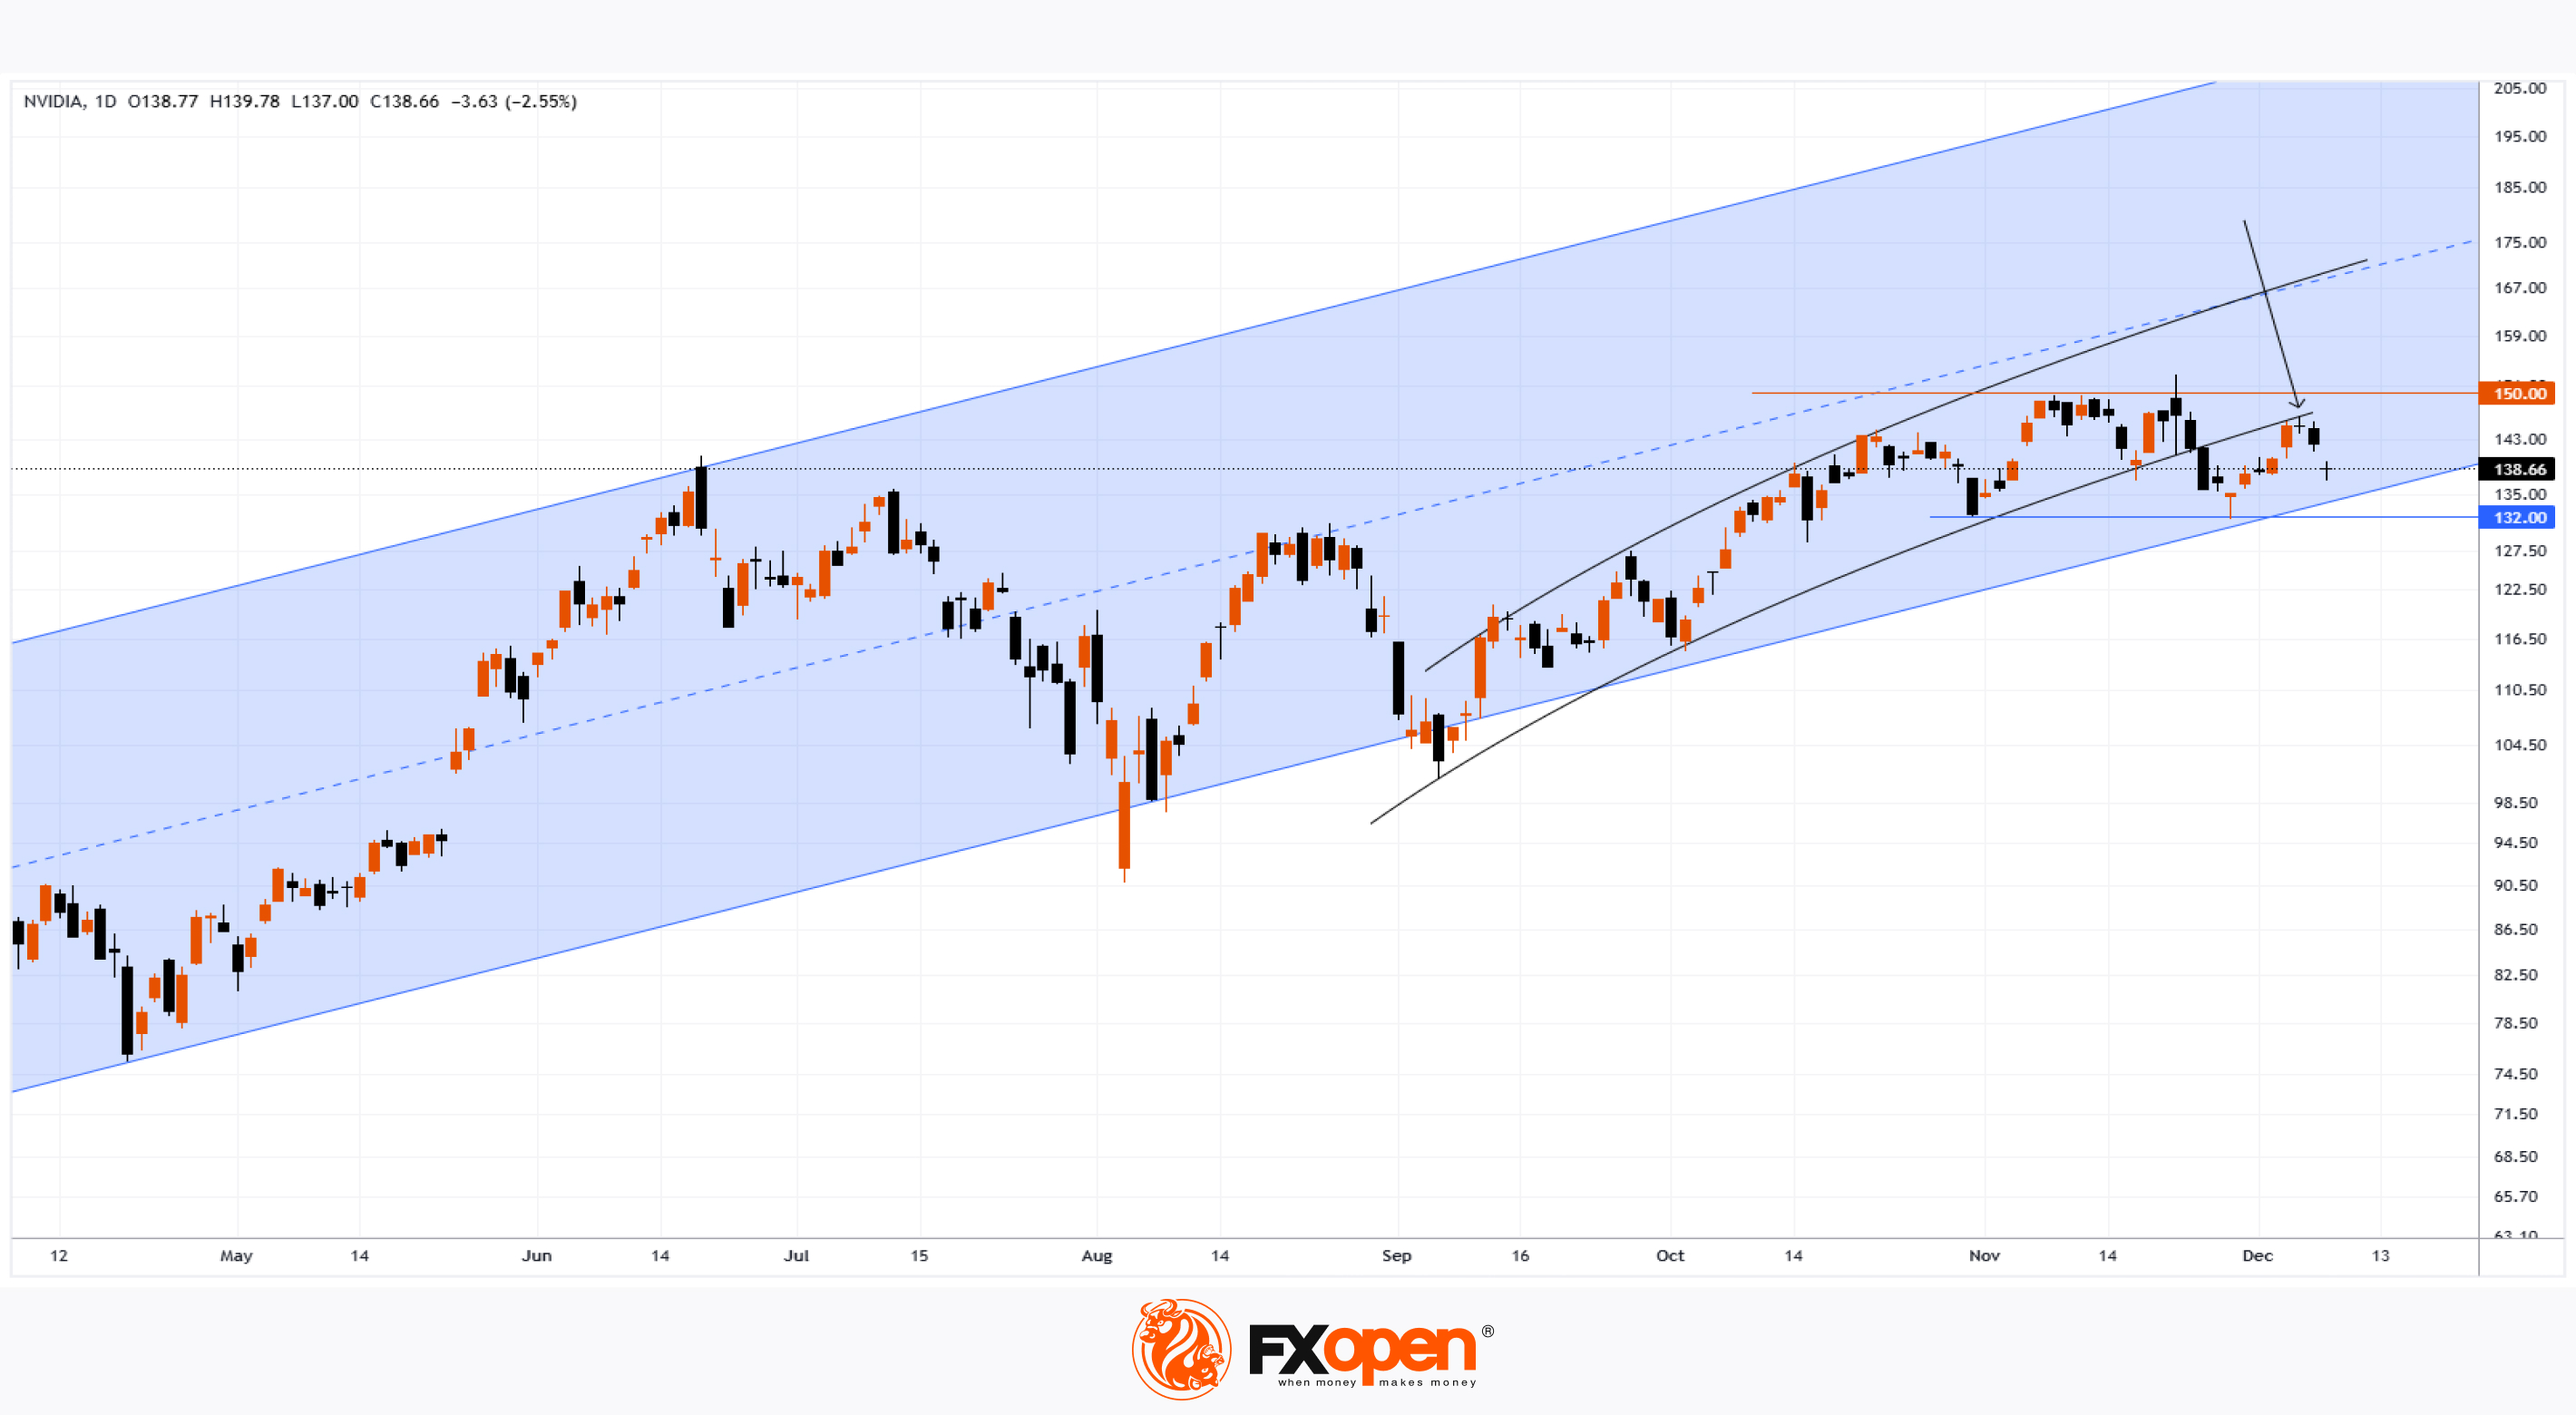
→ The continuation of a long-term upward channel (illustrated in blue).
→ The significance of resistance at the psychological level of $150.
Since then, NVDA’s stock price has failed to surpass the highlighted resistance level, despite stock indices reaching record highs, indicating Nvidia's relative underperformance compared to the broader market. It seems the AI-driven rally may be losing steam.
Investor concerns were heightened yesterday by news that China has launched an antitrust investigation into Nvidia, suspecting the company of violating the country’s competition laws. In response, Nvidia stated that it complies with its obligations wherever it operates and is ready to cooperate with regulators.
Following this announcement, NVDA’s stock price experienced a modest decline, further reinforcing a bearish outlook.
Technical analysis of Nvidia (NVDA) stock chart indicates that if the price fluctuations since September are viewed as forming a channel with curved lines (drawn in black), it becomes evident (as marked by an arrow) that the lower line has shifted its role from support to resistance — a bearish signal.
In this context, the situation appears balanced, with buyers and sellers consolidating NVDA's price within a range of $132 to $150. The eventual breakout from this range could result in a significant swing—but in which direction?
According to TipRanks, analysts remain optimistic:
→ 37 out of 40 analysts recommend buying NVDA stock.
→ The average 12-month price target for NVDA is $176.
Trade global index CFDs with zero commission and tight spreads. Open your FXOpen account now or learn more about trading index CFDs with FXOpen.
CFDs are complex instruments and come with a high risk of losing your money.
This article represents the opinion of the Companies operating under the FXOpen brand only. It is not to be construed as an offer, solicitation, or recommendation with respect to products and services provided by the Companies operating under the FXOpen brand, nor is it to be considered financial advice.
Nvidia (NVDA) Stock Drops Amid Investigation in China
On 21 November, our analysis of Nvidia (NVDA) stock price revealed:
→ The continuation of a long-term upward channel (illustrated in blue).
→ The significance of resistance at the psychological level of $150.
Since then, NVDA’s stock price has failed to surpass the highlighted resistance level, despite stock indices reaching record highs, indicating Nvidia's relative underperformance compared to the broader market. It seems the AI-driven rally may be losing steam.
Investor concerns were heightened yesterday by news that China has launched an antitrust investigation into Nvidia, suspecting the company of violating the country’s competition laws. In response, Nvidia stated that it complies with its obligations wherever it operates and is ready to cooperate with regulators.
Following this announcement, NVDA’s stock price experienced a modest decline, further reinforcing a bearish outlook.
Technical analysis of Nvidia (NVDA) stock chart indicates that if the price fluctuations since September are viewed as forming a channel with curved lines (drawn in black), it becomes evident (as marked by an arrow) that the lower line has shifted its role from support to resistance — a bearish signal.
In this context, the situation appears balanced, with buyers and sellers consolidating NVDA's price within a range of $132 to $150. The eventual breakout from this range could result in a significant swing—but in which direction?
According to TipRanks, analysts remain optimistic:
→ 37 out of 40 analysts recommend buying NVDA stock.
→ The average 12-month price target for NVDA is $176.
Trade global index CFDs with zero commission and tight spreads. Open your FXOpen account now or learn more about trading index CFDs with FXOpen.
CFDs are complex instruments and come with a high risk of losing your money.
This article represents the opinion of the Companies operating under the FXOpen brand only. It is not to be construed as an offer, solicitation, or recommendation with respect to products and services provided by the Companies operating under the FXOpen brand, nor is it to be considered financial advice.
👍2
#stockmarket #stocktrading #marketanalysis
HSI Index Falls Amid Disappointing Chinese Economic Data
On Tuesday, Hong Kong's HSI index (traded as Hong Kong 50 on FXOpen) declined, erasing gains from the previous session due to worsening market sentiment following the release of disappointing Chinese economic data for November. As reported by the media:
→ China's export growth slowed to 6.7% year-on-year, falling short of the forecasted 8.5%, according to a Reuters survey. This marks a significant deceleration compared to the 12.7% growth recorded in October.
→ Additionally, Chinese imports contracted, decreasing by 3.9% year-on-year in November, further deteriorating from the 2.3% decline seen in the previous month.
These figures have heightened concerns about the state of China’s economy, with consumer demand remaining weak amid the potential for tariff increases under the Trump administration.
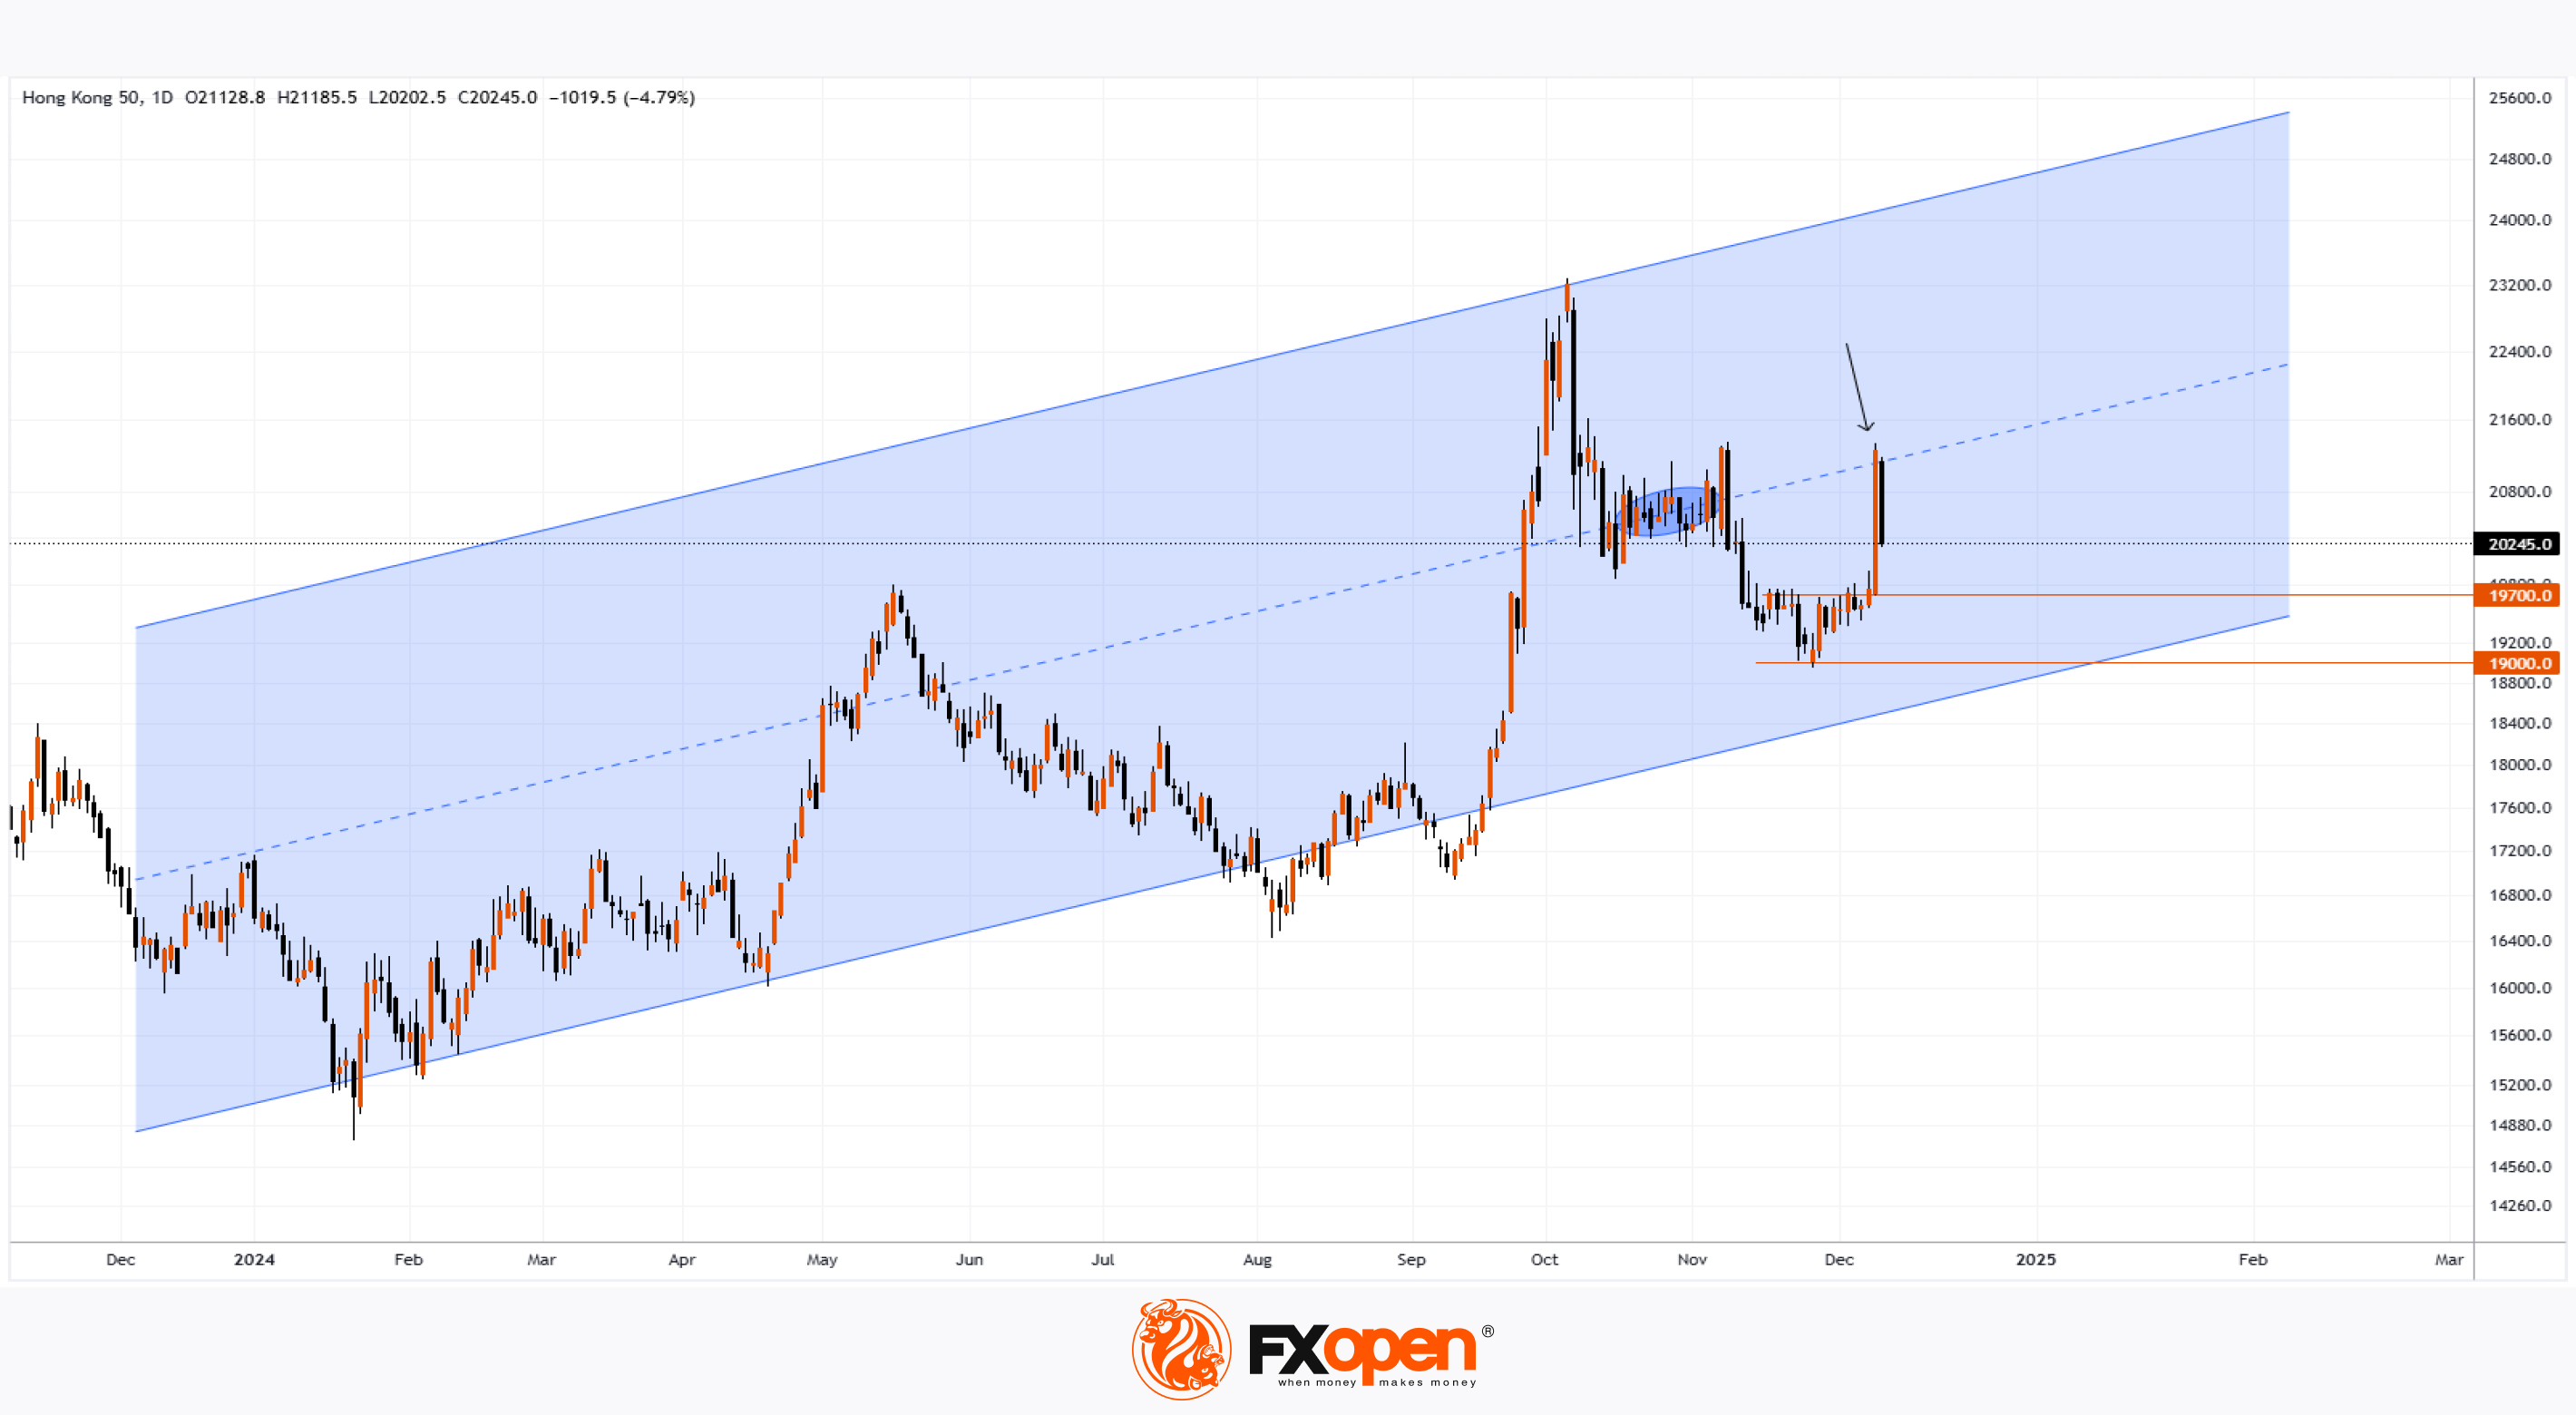
Technical analysis of the Hong Kong HSI Index chart (Hong Kong 50 on FXOpen) reveals that price action throughout 2024 has established an ascending channel (illustrated in blue). Notably:
→ The median line of the channel has previously acted as a "magnet" for price (highlighted with a blue oval), typically indicating equilibrium between supply and demand.
→ However, as marked with an arrow, it has recently acted as resistance, turning the price downward this week.
This sharp shift in sentiment suggests that the HSI index value (Hong Kong 50 on FXOpen) could retreat to the previous consolidation zone between the 19,000–19,700 levels.
Trade global index CFDs with zero commission and tight spreads. Open your FXOpen account now or learn more about trading index CFDs with FXOpen.
CFDs are complex instruments and come with a high risk of losing your money.
This article represents the opinion of the Companies operating under the FXOpen brand only. It is not to be construed as an offer, solicitation, or recommendation with respect to products and services provided by the Companies operating under the FXOpen brand, nor is it to be considered financial advice.
HSI Index Falls Amid Disappointing Chinese Economic Data
On Tuesday, Hong Kong's HSI index (traded as Hong Kong 50 on FXOpen) declined, erasing gains from the previous session due to worsening market sentiment following the release of disappointing Chinese economic data for November. As reported by the media:
→ China's export growth slowed to 6.7% year-on-year, falling short of the forecasted 8.5%, according to a Reuters survey. This marks a significant deceleration compared to the 12.7% growth recorded in October.
→ Additionally, Chinese imports contracted, decreasing by 3.9% year-on-year in November, further deteriorating from the 2.3% decline seen in the previous month.
These figures have heightened concerns about the state of China’s economy, with consumer demand remaining weak amid the potential for tariff increases under the Trump administration.
Technical analysis of the Hong Kong HSI Index chart (Hong Kong 50 on FXOpen) reveals that price action throughout 2024 has established an ascending channel (illustrated in blue). Notably:
→ The median line of the channel has previously acted as a "magnet" for price (highlighted with a blue oval), typically indicating equilibrium between supply and demand.
→ However, as marked with an arrow, it has recently acted as resistance, turning the price downward this week.
This sharp shift in sentiment suggests that the HSI index value (Hong Kong 50 on FXOpen) could retreat to the previous consolidation zone between the 19,000–19,700 levels.
Trade global index CFDs with zero commission and tight spreads. Open your FXOpen account now or learn more about trading index CFDs with FXOpen.
CFDs are complex instruments and come with a high risk of losing your money.
This article represents the opinion of the Companies operating under the FXOpen brand only. It is not to be construed as an offer, solicitation, or recommendation with respect to products and services provided by the Companies operating under the FXOpen brand, nor is it to be considered financial advice.
👍1
#GOOGL #stockmarket #stocks #MarketNews
Alphabet Inc. (GOOGL) Shares Rise Over 5% in a Single Day
As the chart indicates, during yesterday’s trading session, shares of Alphabet Inc. (GOOGL), Google’s parent company, climbed to their highest level since July. This surge was driven by market participants' reaction to the company unveiling Willow, a quantum computing chip. According to Google, this chip can perform in less than five minutes computations that would take some of today’s fastest supercomputers 10 septillion years.
“We see Willow as a significant step on our journey towards building a practical quantum computer with real-world applications in areas such as drug discovery, nuclear fusion, battery design, and more,” Google CEO Sundar Pichai stated on X (formerly Twitter) on Monday.
On 22 November, when analysing the price chart of Alphabet Inc. (GOOGL) shares, we:
→ Drew an upward channel (marked in blue);
→ Highlighted the support formed at the former resistance level of $167, from which the price rallied to current levels.
What are the potential scenarios for the trend's development?
Technical analysis of Alphabet Inc. (GOOGL) shares suggests:
→ The bullish gap, with a “leap” above the psychological level of $180, could act as future support;
→ The price is near the median of the long-term blue channel, where supply and demand forces often balance out;
→ If the bullish momentum persists, the price could rise to the upper thickened line, which reflects a steeper bullish trajectory.
It’s possible that this upper thickened line, reinforced by the current high near $191.20, will act as significant resistance through the end of 2024, prompting the price to consolidate around the channel's median line.
According to TipRanks surveys:
→ 27 out of 33 analysts recommend buying GOOGL shares;
→ The average 12-month price target for GOOGL shares is $209.
Trade global index CFDs with zero commission and tight spreads. Open your FXOpen account now or learn more about trading index CFDs with FXOpen.
CFDs are complex instruments and come with a high risk of losing your money.
This article represents the opinion of the Companies operating under the FXOpen brand only. It is not to be construed as an offer, solicitation, or recommendation with respect to products and services provided by the Companies operating under the FXOpen brand, nor is it to be considered financial advice.
Alphabet Inc. (GOOGL) Shares Rise Over 5% in a Single Day
As the chart indicates, during yesterday’s trading session, shares of Alphabet Inc. (GOOGL), Google’s parent company, climbed to their highest level since July. This surge was driven by market participants' reaction to the company unveiling Willow, a quantum computing chip. According to Google, this chip can perform in less than five minutes computations that would take some of today’s fastest supercomputers 10 septillion years.
“We see Willow as a significant step on our journey towards building a practical quantum computer with real-world applications in areas such as drug discovery, nuclear fusion, battery design, and more,” Google CEO Sundar Pichai stated on X (formerly Twitter) on Monday.
On 22 November, when analysing the price chart of Alphabet Inc. (GOOGL) shares, we:
→ Drew an upward channel (marked in blue);
→ Highlighted the support formed at the former resistance level of $167, from which the price rallied to current levels.
What are the potential scenarios for the trend's development?
Technical analysis of Alphabet Inc. (GOOGL) shares suggests:
→ The bullish gap, with a “leap” above the psychological level of $180, could act as future support;
→ The price is near the median of the long-term blue channel, where supply and demand forces often balance out;
→ If the bullish momentum persists, the price could rise to the upper thickened line, which reflects a steeper bullish trajectory.
It’s possible that this upper thickened line, reinforced by the current high near $191.20, will act as significant resistance through the end of 2024, prompting the price to consolidate around the channel's median line.
According to TipRanks surveys:
→ 27 out of 33 analysts recommend buying GOOGL shares;
→ The average 12-month price target for GOOGL shares is $209.
Trade global index CFDs with zero commission and tight spreads. Open your FXOpen account now or learn more about trading index CFDs with FXOpen.
CFDs are complex instruments and come with a high risk of losing your money.
This article represents the opinion of the Companies operating under the FXOpen brand only. It is not to be construed as an offer, solicitation, or recommendation with respect to products and services provided by the Companies operating under the FXOpen brand, nor is it to be considered financial advice.

👍2
#GBPUSD #forextrading #tradingtips #marketanalysis
GBP/USD Declines Following UK GDP Data Release
Today, the UK GDP changes for October were published, as reported by Forex Factory (month-on-month):
→ Actual = -0.1%;
→ Forecast = +0.1%;
→ Previous = -0.1%.
The data revealed a slowing UK economy, defying analysts’ optimistic expectations. According to Reuters and other outlets, the latest GDP figures:
→ Could strengthen traders’ expectations of a more rapid interest rate cut by the Bank of England in 2025;
→ Undermine the target announced last week by Prime Minister Keir Starmer to make the UK the fastest-growing economy among G7 nations.
Technical Analysis of the GBP/USD 4-Hour Chart
→ From its December high (when a false breakout of the psychological 1.29 level occurred), the pound has weakened by approximately 1.4%, with the RSI indicator dipping into oversold territory for the first time this month.
→ The bullish trajectory (highlighted in blue), formed since late November, has lost its relevance after a breakout, suggesting bears are attempting to resume the downtrend within the red-shaded channel.
→ The 1.2615 level, which has repeatedly influenced the price (marked with arrows), may continue to act as support.
Looking ahead, the Bank of England’s meeting next Thursday is likely to trigger heightened volatility. While interest rates are expected to remain unchanged, any surprises could significantly impact the current bearish momentum.
Trade over 50 forex markets 24 hours a day with FXOpen. Take advantage of low commissions, deep liquidity, and spreads from 0.0 pips. Open your FXOpen account now or learn more about trading forex with FXOpen.
CFDs are complex instruments and come with a high risk of losing your money.
This article represents the opinion of the Companies operating under the FXOpen brand only. It is not to be construed as an offer, solicitation, or recommendation with respect to products and services provided by the Companies operating under the FXOpen brand, nor is it to be considered financial advice.
GBP/USD Declines Following UK GDP Data Release
Today, the UK GDP changes for October were published, as reported by Forex Factory (month-on-month):
→ Actual = -0.1%;
→ Forecast = +0.1%;
→ Previous = -0.1%.
The data revealed a slowing UK economy, defying analysts’ optimistic expectations. According to Reuters and other outlets, the latest GDP figures:
→ Could strengthen traders’ expectations of a more rapid interest rate cut by the Bank of England in 2025;
→ Undermine the target announced last week by Prime Minister Keir Starmer to make the UK the fastest-growing economy among G7 nations.
Technical Analysis of the GBP/USD 4-Hour Chart
→ From its December high (when a false breakout of the psychological 1.29 level occurred), the pound has weakened by approximately 1.4%, with the RSI indicator dipping into oversold territory for the first time this month.
→ The bullish trajectory (highlighted in blue), formed since late November, has lost its relevance after a breakout, suggesting bears are attempting to resume the downtrend within the red-shaded channel.
→ The 1.2615 level, which has repeatedly influenced the price (marked with arrows), may continue to act as support.
Looking ahead, the Bank of England’s meeting next Thursday is likely to trigger heightened volatility. While interest rates are expected to remain unchanged, any surprises could significantly impact the current bearish momentum.
Trade over 50 forex markets 24 hours a day with FXOpen. Take advantage of low commissions, deep liquidity, and spreads from 0.0 pips. Open your FXOpen account now or learn more about trading forex with FXOpen.
CFDs are complex instruments and come with a high risk of losing your money.
This article represents the opinion of the Companies operating under the FXOpen brand only. It is not to be construed as an offer, solicitation, or recommendation with respect to products and services provided by the Companies operating under the FXOpen brand, nor is it to be considered financial advice.
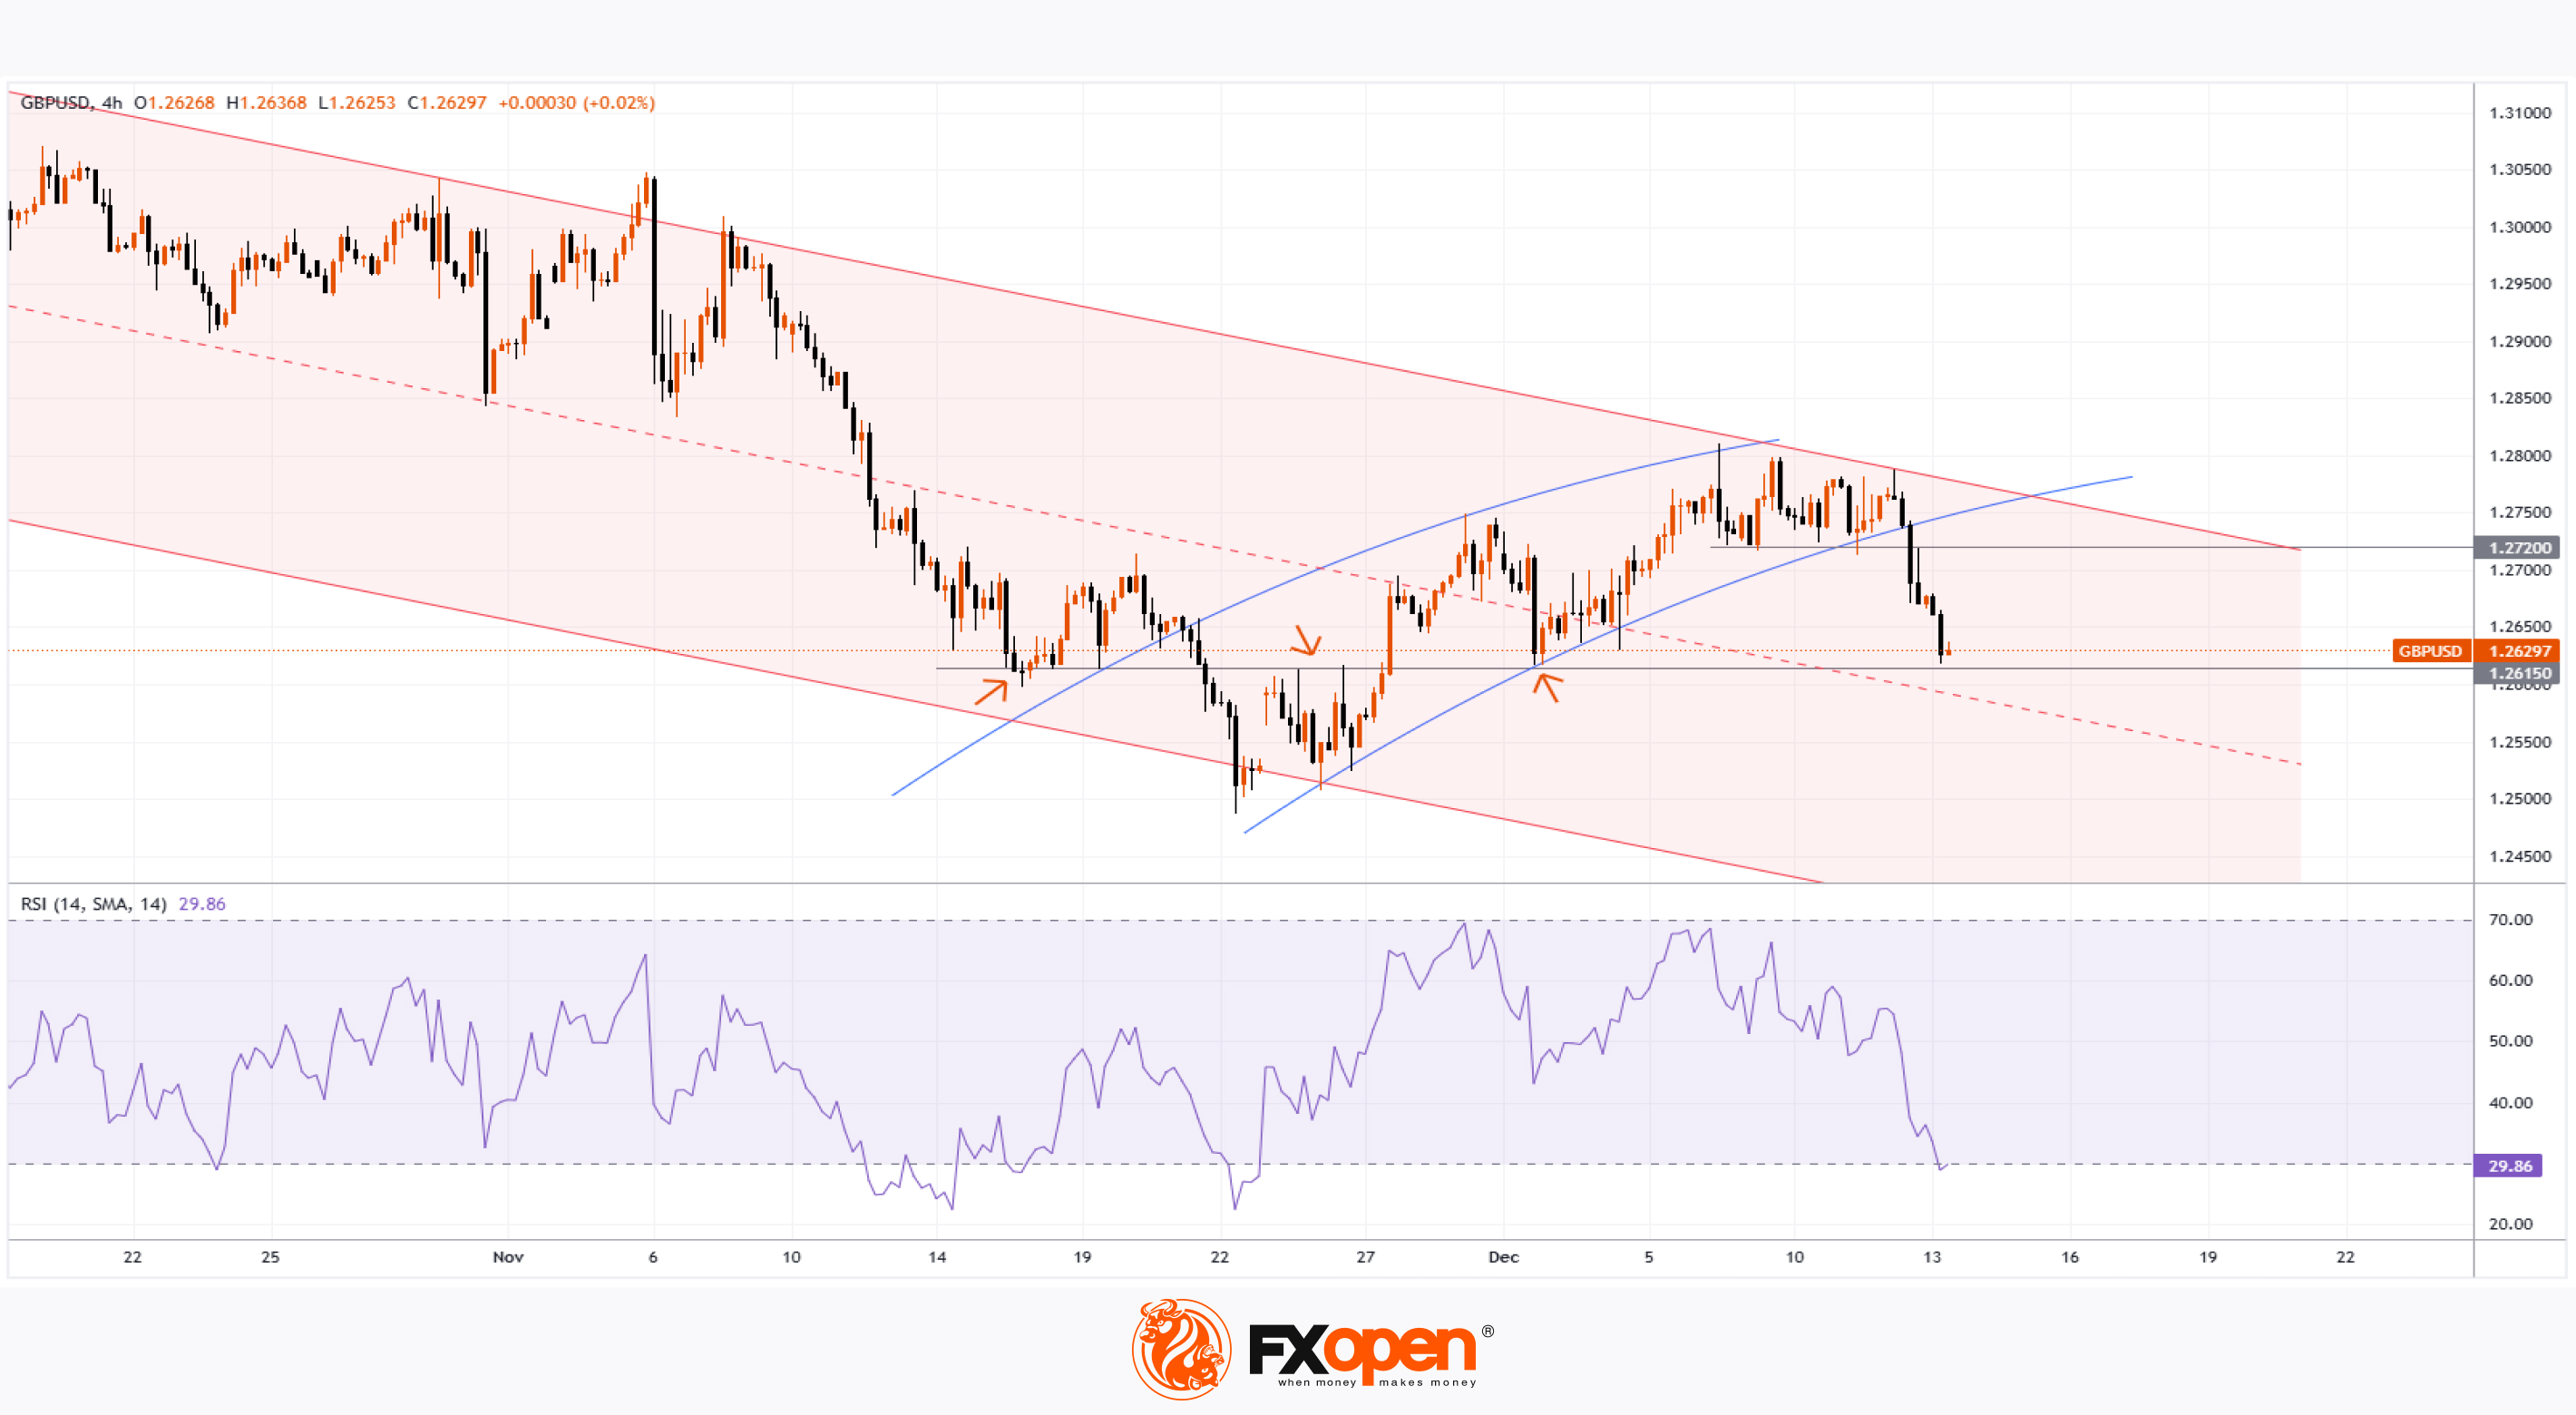
👍2