
#marketanalysis #MarketNews #stockmarket #stocktrading
Coinbase (COIN) Stock Rises Approximately 18% in Two Days
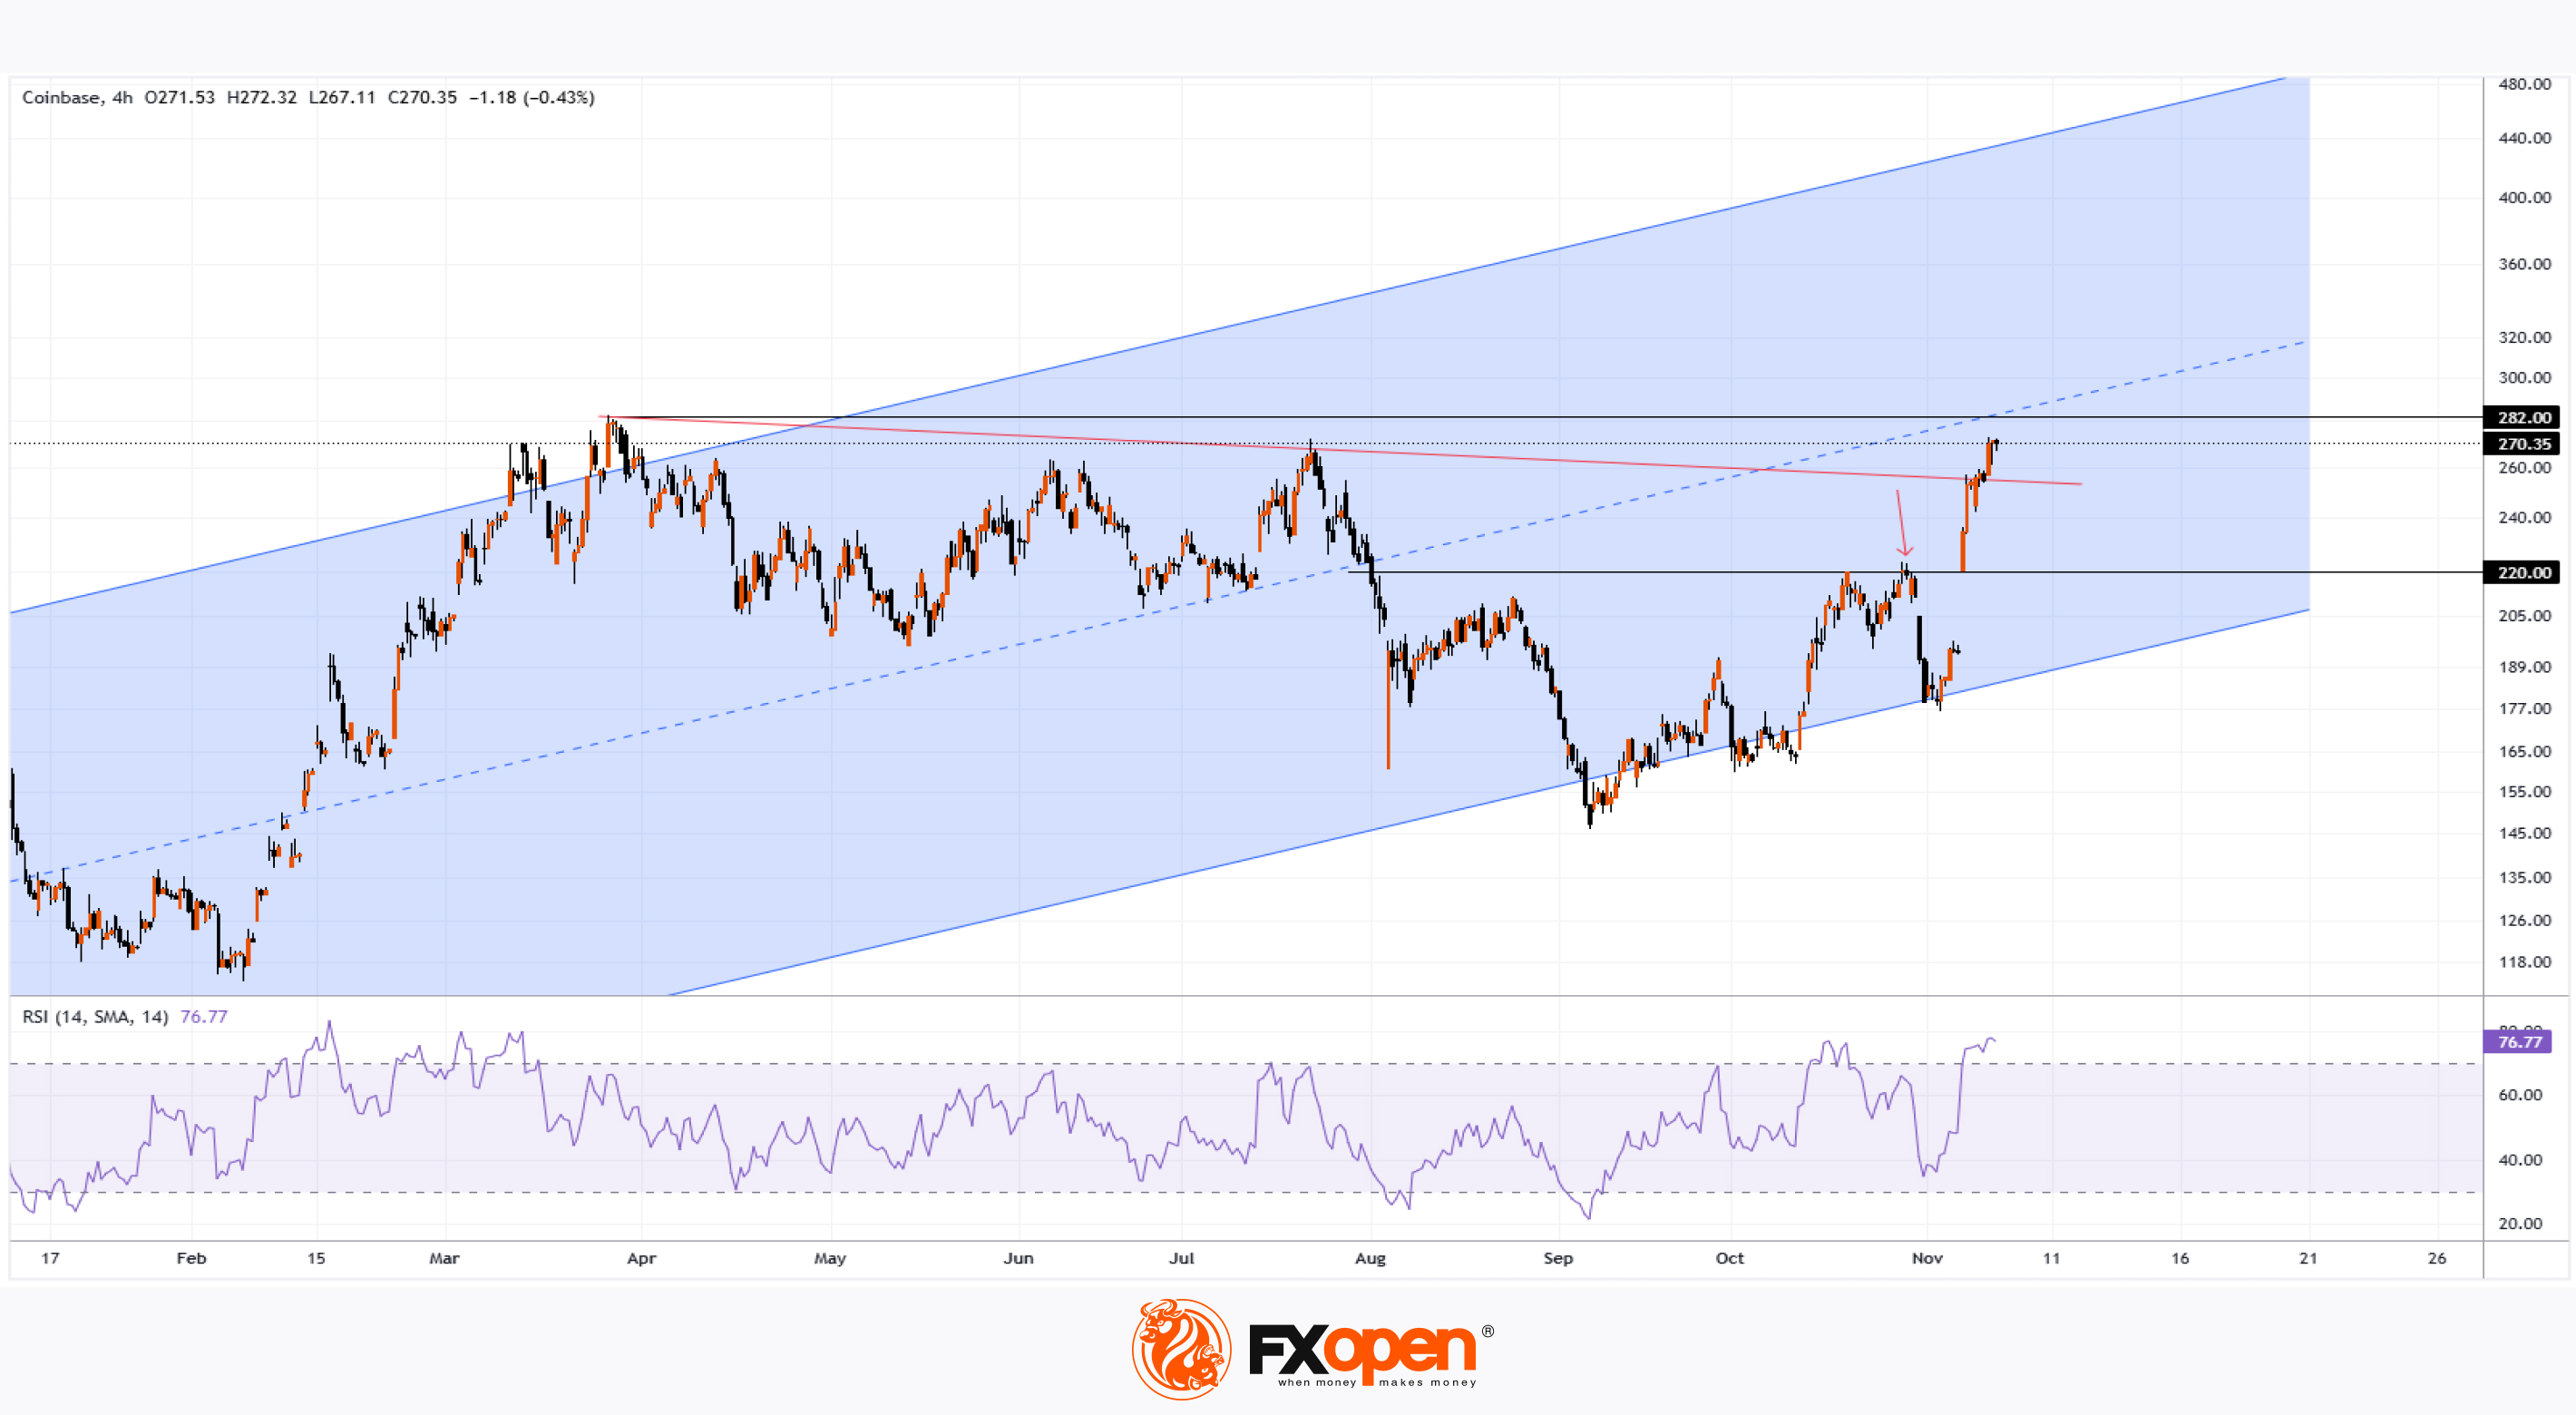
On 15 October, in our analysis of Coinbase (COIN) stock:
→ we established a long-term upward channel (shown in blue),
→ speculating that bulls were aiming to renew the trend from its lower boundary.
Then, on 30 October, Coinbase released its Q3 performance report to investors. Results fell short of expectations, leading to a decline in COIN’s price (indicated by a red arrow).
Despite this, today COIN’s stock price is providing investors with renewed optimism as it approaches its record high, currently around the $282.00 mark.
In this move, the price broke through:
→ the $220 resistance level,
→ a red trendline shown on the chart.
Key drivers of COIN's recent price increase:
→ the Fed's interest rate cut,
→ Trump’s election win, which market participants view as a positive signal.
What lies ahead?
The 4-hour technical analysis of COIN suggests that at the historical high, the price meets a median line. This raises the likelihood that the upward momentum may stall, leading to possible outcomes such as:
→ price stabilisation (as supply and demand typically balance around the median),
→ a corrective movement following the sharp rise, which seems fitting given the RSI indicator pointing to overbought conditions.
Trade global index CFDs with zero commission and tight spreads. Open your FXOpen account now or learn more about trading index CFDs with FXOpen.
CFDs are complex instruments and come with a high risk of losing your money.
This article represents the opinion of the Companies operating under the FXOpen brand only. It is not to be construed as an offer, solicitation, or recommendation with respect to products and services provided by the Companies operating under the FXOpen brand, nor is it to be considered financial advice.
Coinbase (COIN) Stock Rises Approximately 18% in Two Days
On 15 October, in our analysis of Coinbase (COIN) stock:
→ we established a long-term upward channel (shown in blue),
→ speculating that bulls were aiming to renew the trend from its lower boundary.
Then, on 30 October, Coinbase released its Q3 performance report to investors. Results fell short of expectations, leading to a decline in COIN’s price (indicated by a red arrow).
Despite this, today COIN’s stock price is providing investors with renewed optimism as it approaches its record high, currently around the $282.00 mark.
In this move, the price broke through:
→ the $220 resistance level,
→ a red trendline shown on the chart.
Key drivers of COIN's recent price increase:
→ the Fed's interest rate cut,
→ Trump’s election win, which market participants view as a positive signal.
What lies ahead?
The 4-hour technical analysis of COIN suggests that at the historical high, the price meets a median line. This raises the likelihood that the upward momentum may stall, leading to possible outcomes such as:
→ price stabilisation (as supply and demand typically balance around the median),
→ a corrective movement following the sharp rise, which seems fitting given the RSI indicator pointing to overbought conditions.
Trade global index CFDs with zero commission and tight spreads. Open your FXOpen account now or learn more about trading index CFDs with FXOpen.
CFDs are complex instruments and come with a high risk of losing your money.
This article represents the opinion of the Companies operating under the FXOpen brand only. It is not to be construed as an offer, solicitation, or recommendation with respect to products and services provided by the Companies operating under the FXOpen brand, nor is it to be considered financial advice.
👍3
#GBPUSD #forextrading #MarketUpdates #marketanalysis
GBP/USD Chart Analysis: Bears Apply Pressure to Key Support
According to ICE data, the U.S. Dollar Index futures have reached highs last seen in early July 2024. The dollar’s strength is attributed, in part, to anticipated economic stimulus measures outlined by the newly elected President Donald Trump during his campaign.
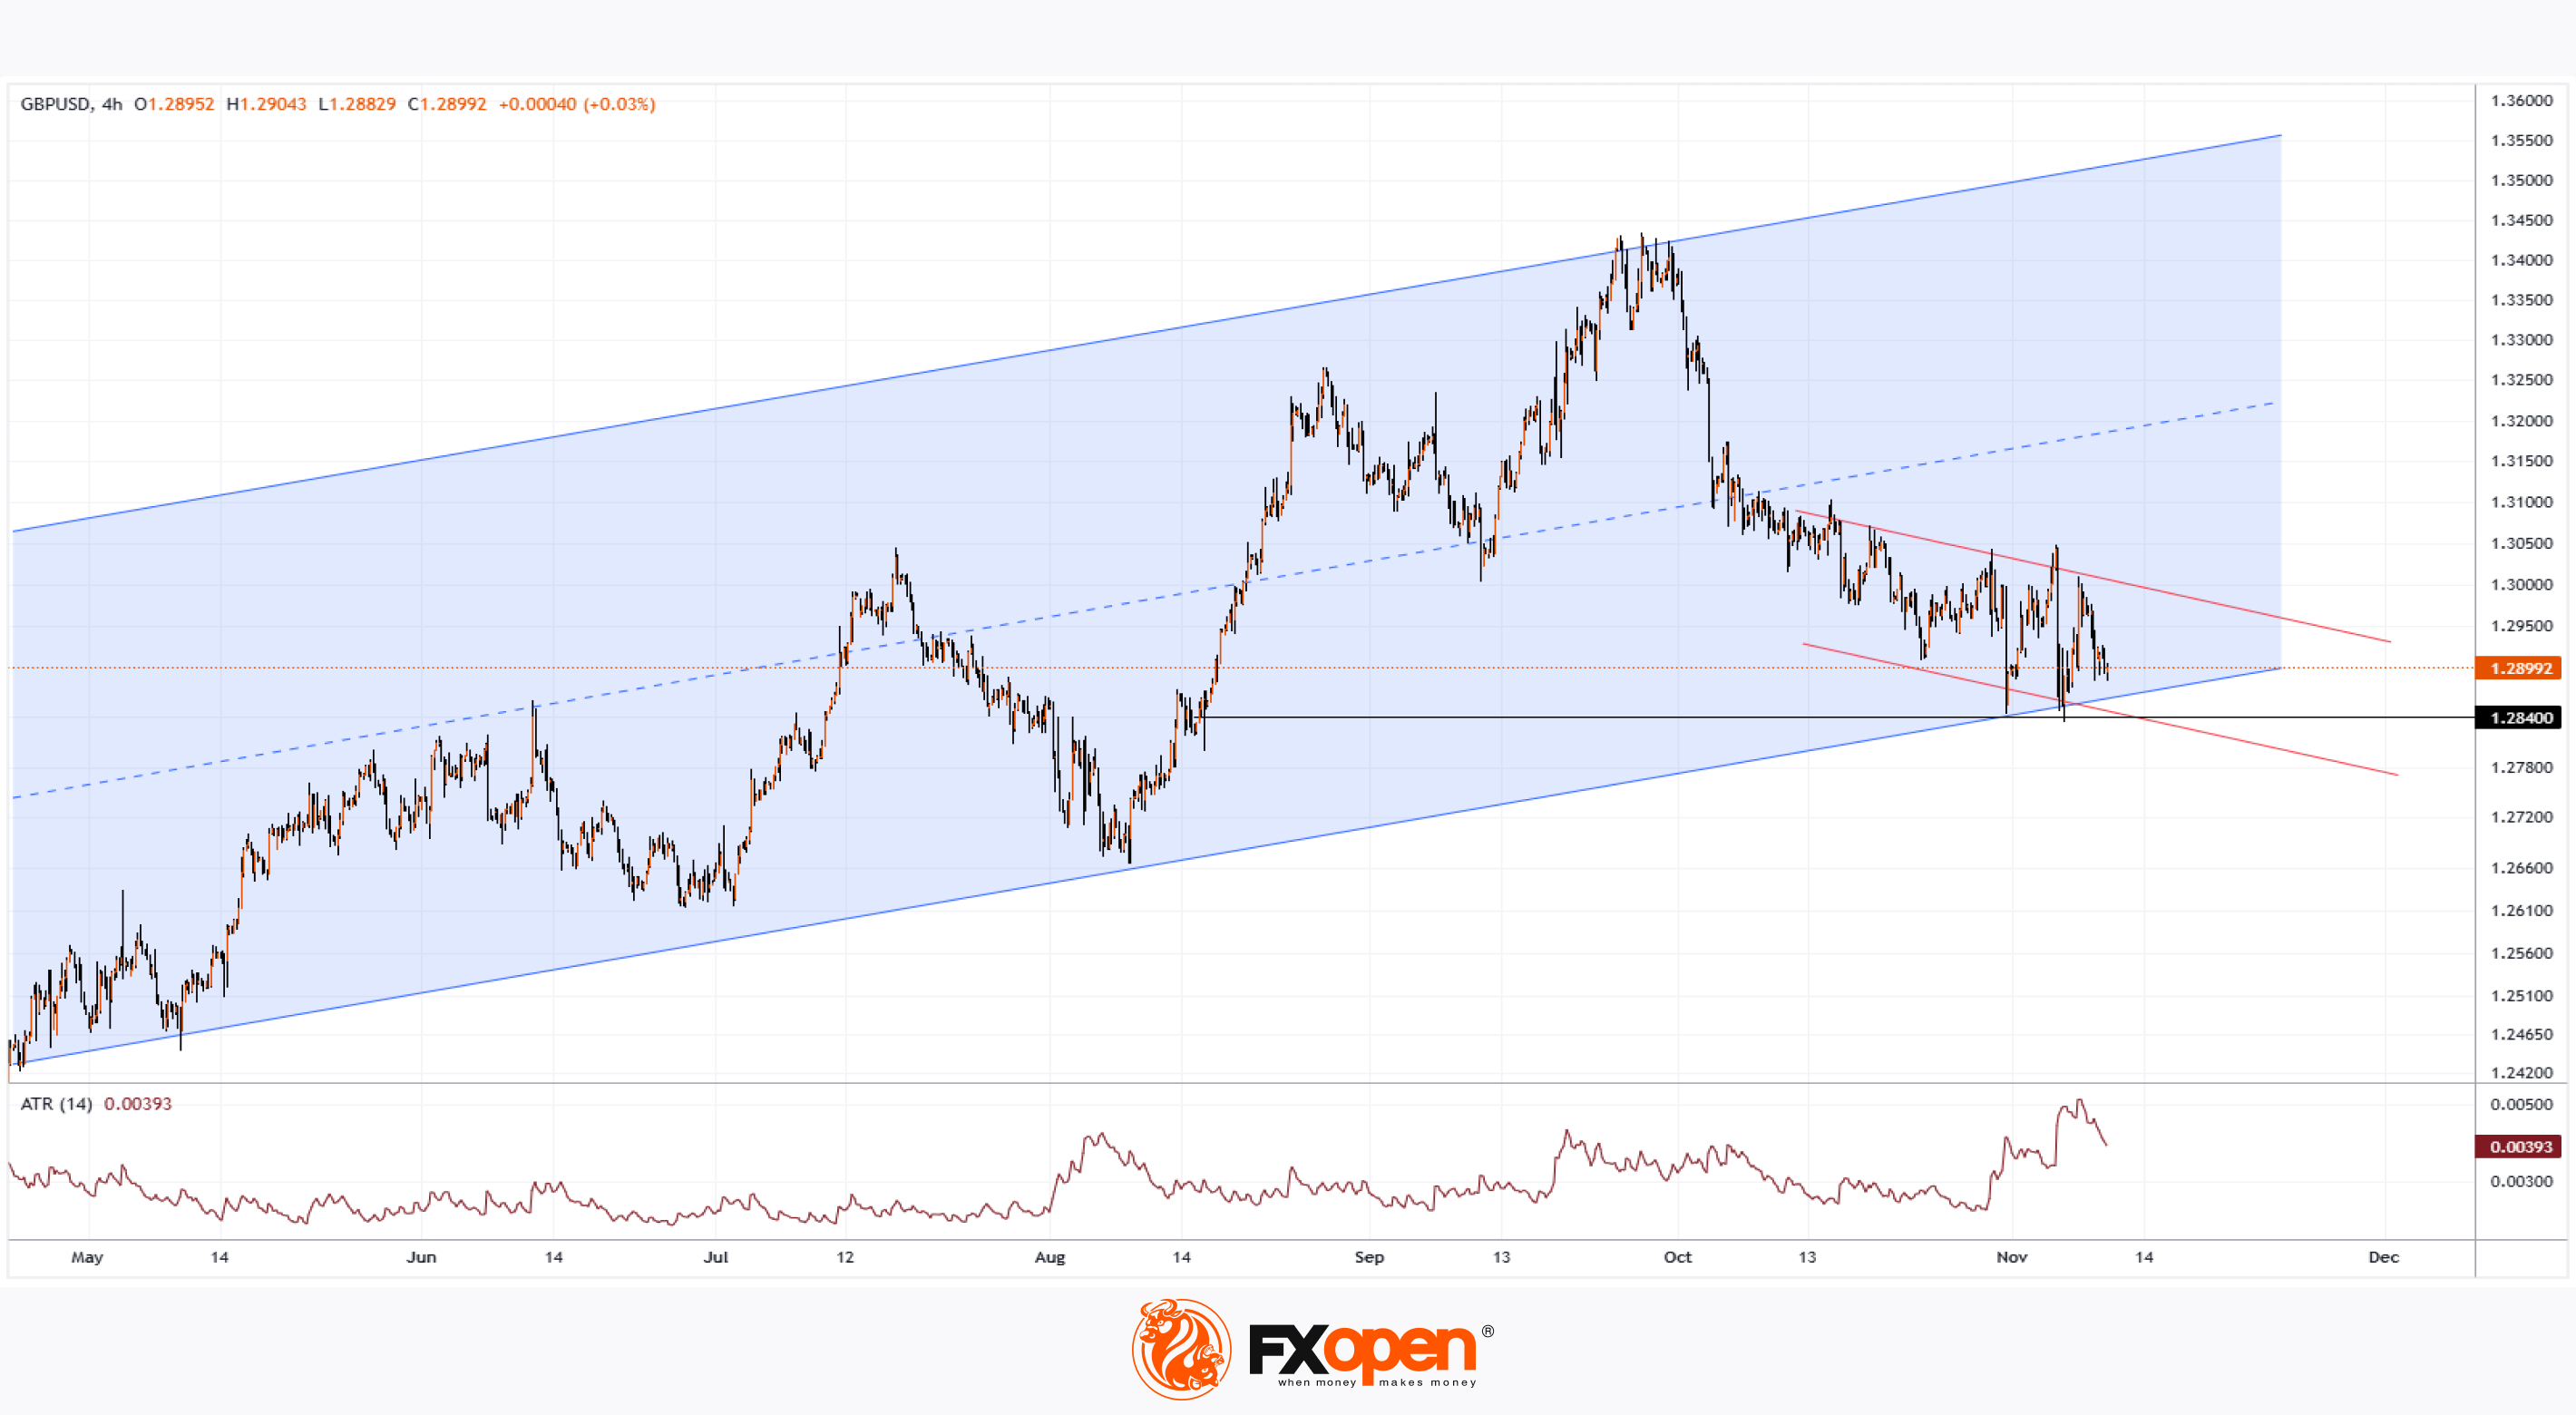
This has put pressure on other currencies paired with the dollar. Currently, the British pound is trading near 1.28400, close to a three-month low.
Today’s technical analysis of the 4-hour GBP/USD chart reveals:
→ long-term price fluctuations have shaped an upward channel since May;
→ the pair is near a key support level at the lower boundary of this channel;
→ a downtrend channel (in red) has formed since early October, highlighting recent bearish control; → the ATR indicator is at an annual high, indicating heightened volatility.
Key economic events are on the horizon:
→ UK labour market data on Tuesday at 10:00 (GMT+3),
→ U.S. CPI figures on Wednesday at 16:30 (GMT+3),
→ speeches by the Fed and Bank of England heads on Thursday.
With these events approaching, traders may anticipate continued wide fluctuations around the lower boundary of the upward channel.
Trade over 50 forex markets 24 hours a day with FXOpen. Take advantage of low commissions, deep liquidity, and spreads from 0.0 pips. Open your FXOpen account now or learn more about trading forex with FXOpen.
CFDs are complex instruments and come with a high risk of losing your money.
This article represents the opinion of the Companies operating under the FXOpen brand only. It is not to be construed as an offer, solicitation, or recommendation with respect to products and services provided by the Companies operating under the FXOpen brand, nor is it to be considered financial advice.
GBP/USD Chart Analysis: Bears Apply Pressure to Key Support
According to ICE data, the U.S. Dollar Index futures have reached highs last seen in early July 2024. The dollar’s strength is attributed, in part, to anticipated economic stimulus measures outlined by the newly elected President Donald Trump during his campaign.
This has put pressure on other currencies paired with the dollar. Currently, the British pound is trading near 1.28400, close to a three-month low.
Today’s technical analysis of the 4-hour GBP/USD chart reveals:
→ long-term price fluctuations have shaped an upward channel since May;
→ the pair is near a key support level at the lower boundary of this channel;
→ a downtrend channel (in red) has formed since early October, highlighting recent bearish control; → the ATR indicator is at an annual high, indicating heightened volatility.
Key economic events are on the horizon:
→ UK labour market data on Tuesday at 10:00 (GMT+3),
→ U.S. CPI figures on Wednesday at 16:30 (GMT+3),
→ speeches by the Fed and Bank of England heads on Thursday.
With these events approaching, traders may anticipate continued wide fluctuations around the lower boundary of the upward channel.
Trade over 50 forex markets 24 hours a day with FXOpen. Take advantage of low commissions, deep liquidity, and spreads from 0.0 pips. Open your FXOpen account now or learn more about trading forex with FXOpen.
CFDs are complex instruments and come with a high risk of losing your money.
This article represents the opinion of the Companies operating under the FXOpen brand only. It is not to be construed as an offer, solicitation, or recommendation with respect to products and services provided by the Companies operating under the FXOpen brand, nor is it to be considered financial advice.
👍3
#AMZN #stockmarket #stocktrading #MarketUpdates
Amazon Stock (AMZN) Holds Above $200
On Thursday, October 31, Amazon released its Q3 earnings report:
→ Earnings per share: actual = $1.43, forecast = $1.14;
→ Gross sales: actual = $158.8 billion, forecast = $157.2 billion.
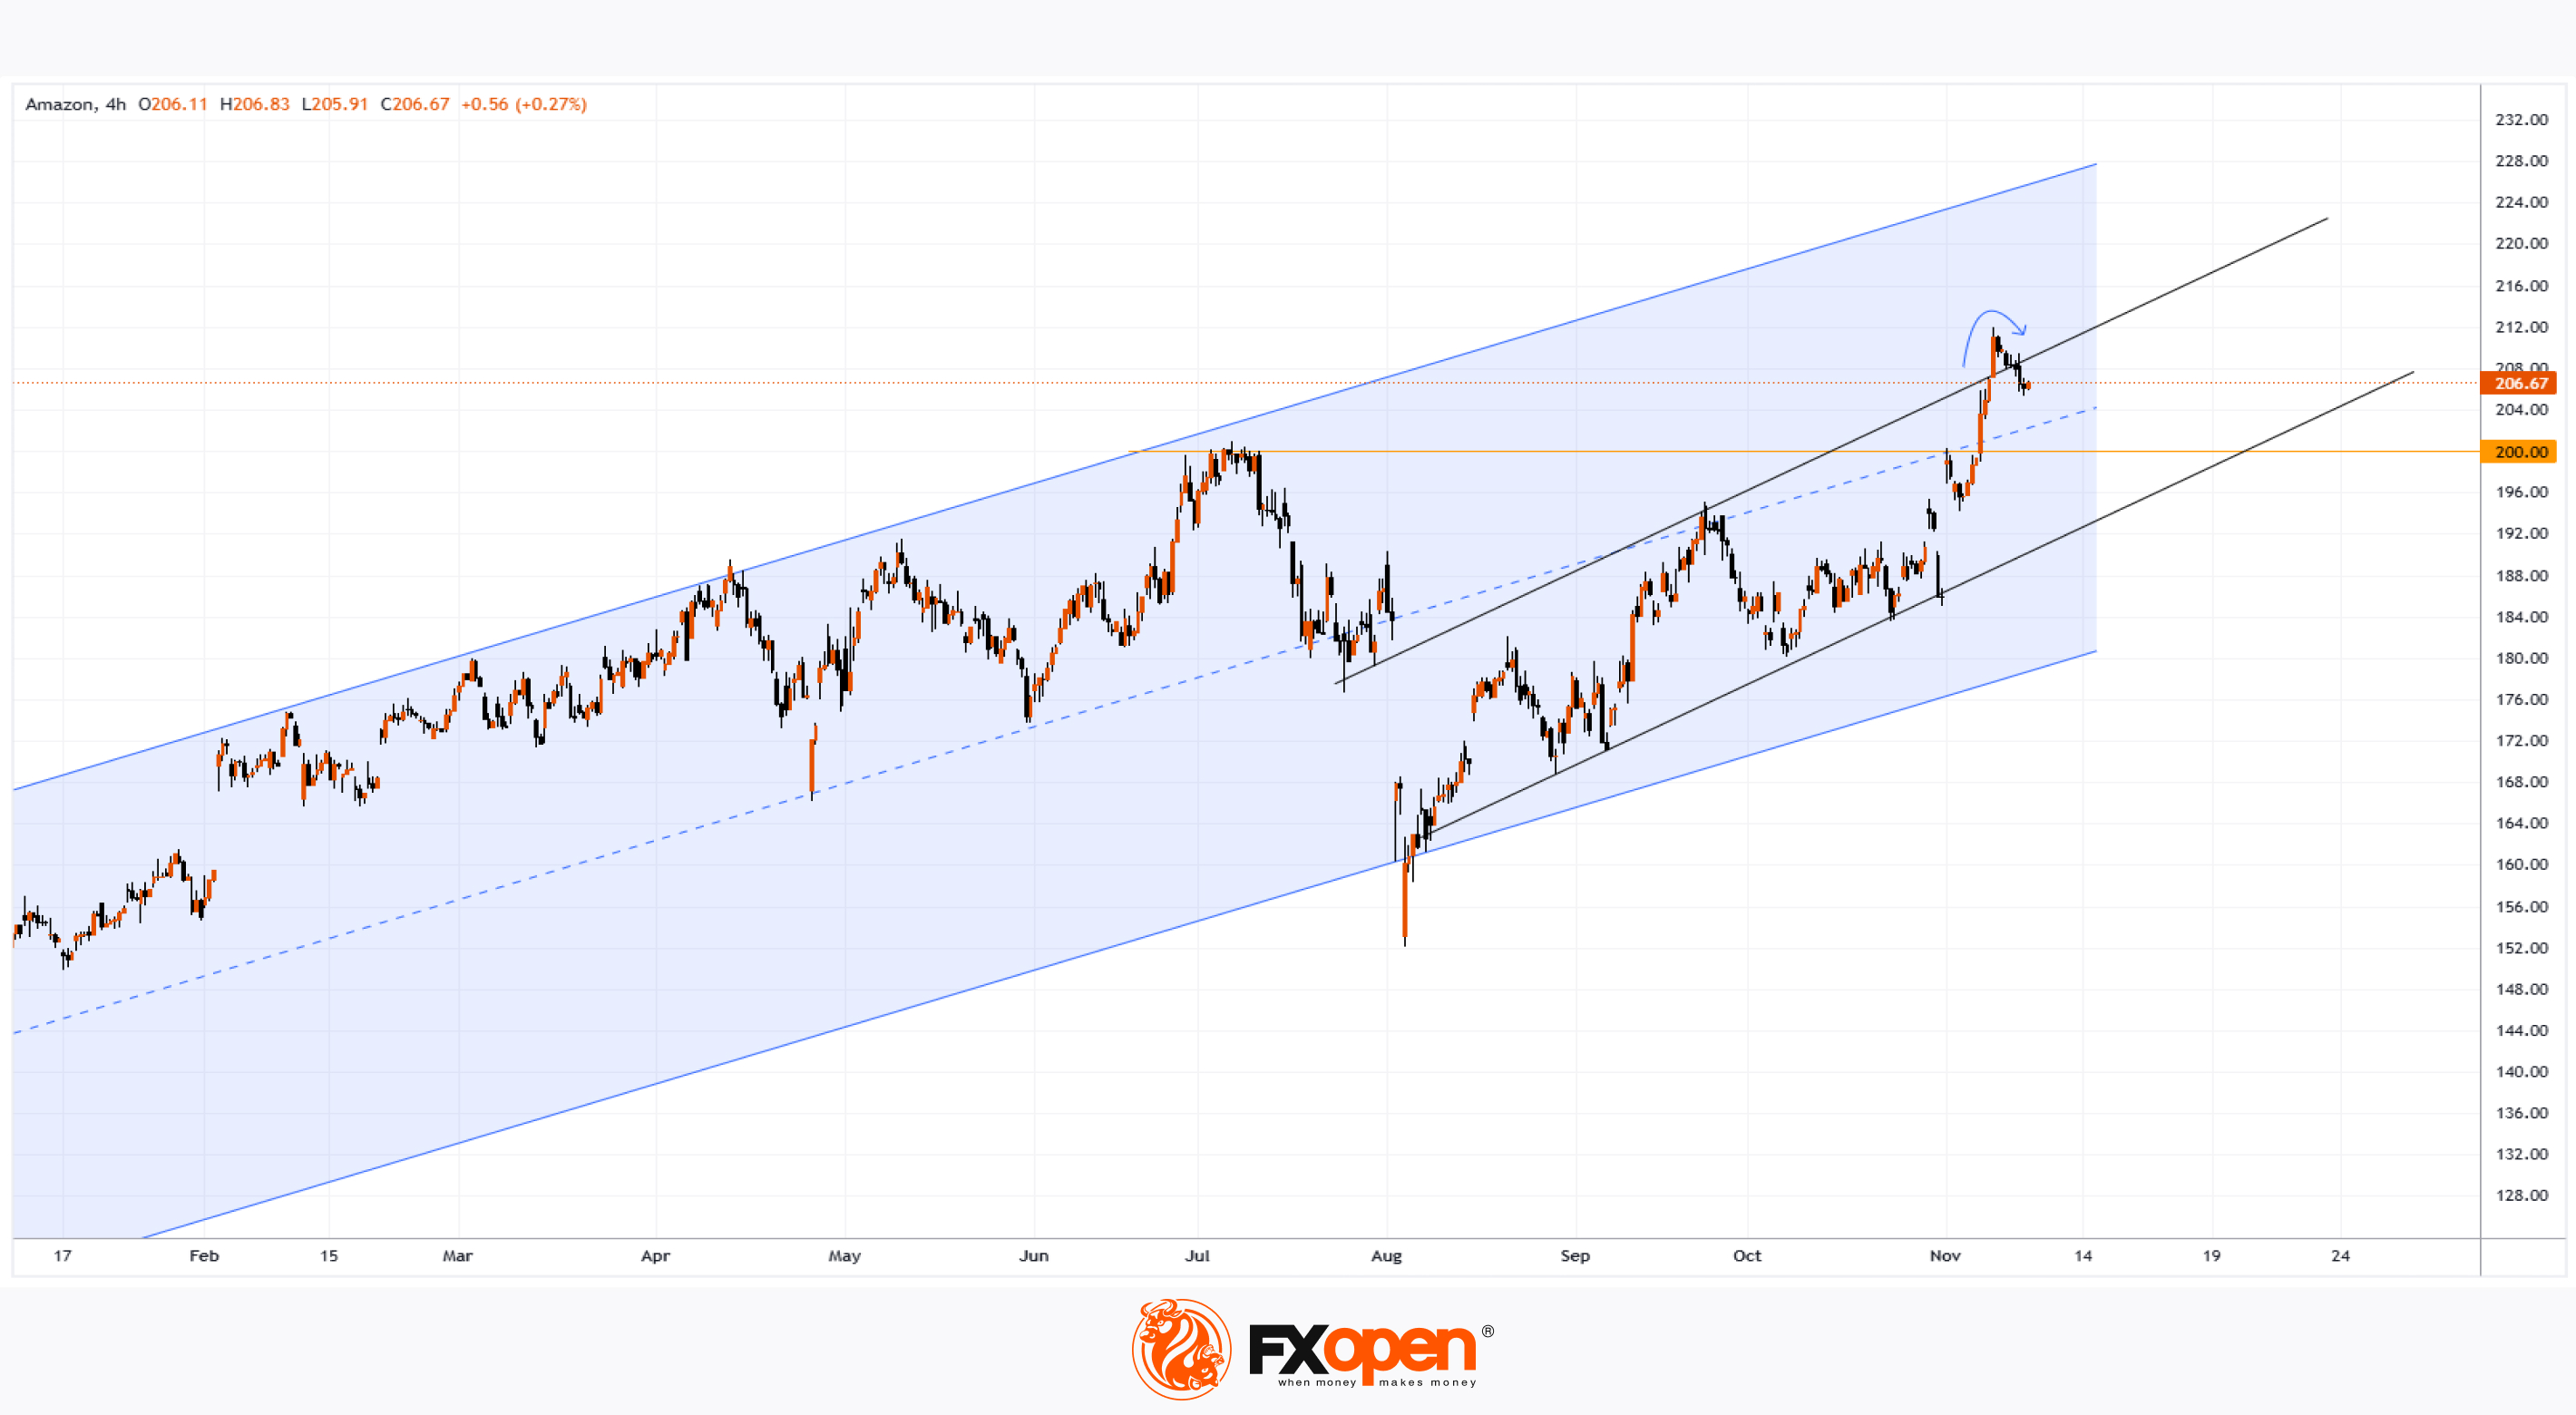
The report exceeded analyst expectations, with additional optimism driven by Trump’s victory and a Fed rate cut, pushing Amazon’s stock price past the psychological $200 mark and reaching a new high above $210.
Today, Amazon’s stock chart shows the price beginning to round off (indicated by an arrow). Does this signal the end of the bullish trend?
Unlikely, given the strong fundamental support. In technical terms, it may be more accurate to consider the price’s vulnerability to a correction, especially as it sits near the upper boundary of an ascending channel.
Should a correction occur, a retest of the $200 level is possible. Support may come from the median line of the long-term blue channel or the lower boundary of the short-term black channel.
According to TipRanks, which surveyed 45 Wall Street analysts:
→ 44 analysts recommend buying AMZN stock;
→ On average, they forecast a 12-month price target of $238.
Trade global index CFDs with zero commission and tight spreads. Open your FXOpen account now or learn more about trading index CFDs with FXOpen.
CFDs are complex instruments and come with a high risk of losing your money.
This article represents the opinion of the Companies operating under the FXOpen brand only. It is not to be construed as an offer, solicitation, or recommendation with respect to products and services provided by the Companies operating under the FXOpen brand, nor is it to be considered financial advice.
Amazon Stock (AMZN) Holds Above $200
On Thursday, October 31, Amazon released its Q3 earnings report:
→ Earnings per share: actual = $1.43, forecast = $1.14;
→ Gross sales: actual = $158.8 billion, forecast = $157.2 billion.
The report exceeded analyst expectations, with additional optimism driven by Trump’s victory and a Fed rate cut, pushing Amazon’s stock price past the psychological $200 mark and reaching a new high above $210.
Today, Amazon’s stock chart shows the price beginning to round off (indicated by an arrow). Does this signal the end of the bullish trend?
Unlikely, given the strong fundamental support. In technical terms, it may be more accurate to consider the price’s vulnerability to a correction, especially as it sits near the upper boundary of an ascending channel.
Should a correction occur, a retest of the $200 level is possible. Support may come from the median line of the long-term blue channel or the lower boundary of the short-term black channel.
According to TipRanks, which surveyed 45 Wall Street analysts:
→ 44 analysts recommend buying AMZN stock;
→ On average, they forecast a 12-month price target of $238.
Trade global index CFDs with zero commission and tight spreads. Open your FXOpen account now or learn more about trading index CFDs with FXOpen.
CFDs are complex instruments and come with a high risk of losing your money.
This article represents the opinion of the Companies operating under the FXOpen brand only. It is not to be construed as an offer, solicitation, or recommendation with respect to products and services provided by the Companies operating under the FXOpen brand, nor is it to be considered financial advice.
👍3
#XAUUSD #goldprice #marketanalysis #MarketUpdates
XAU/USD Analysis: Gold Price Drops to $2,600 per Ounce
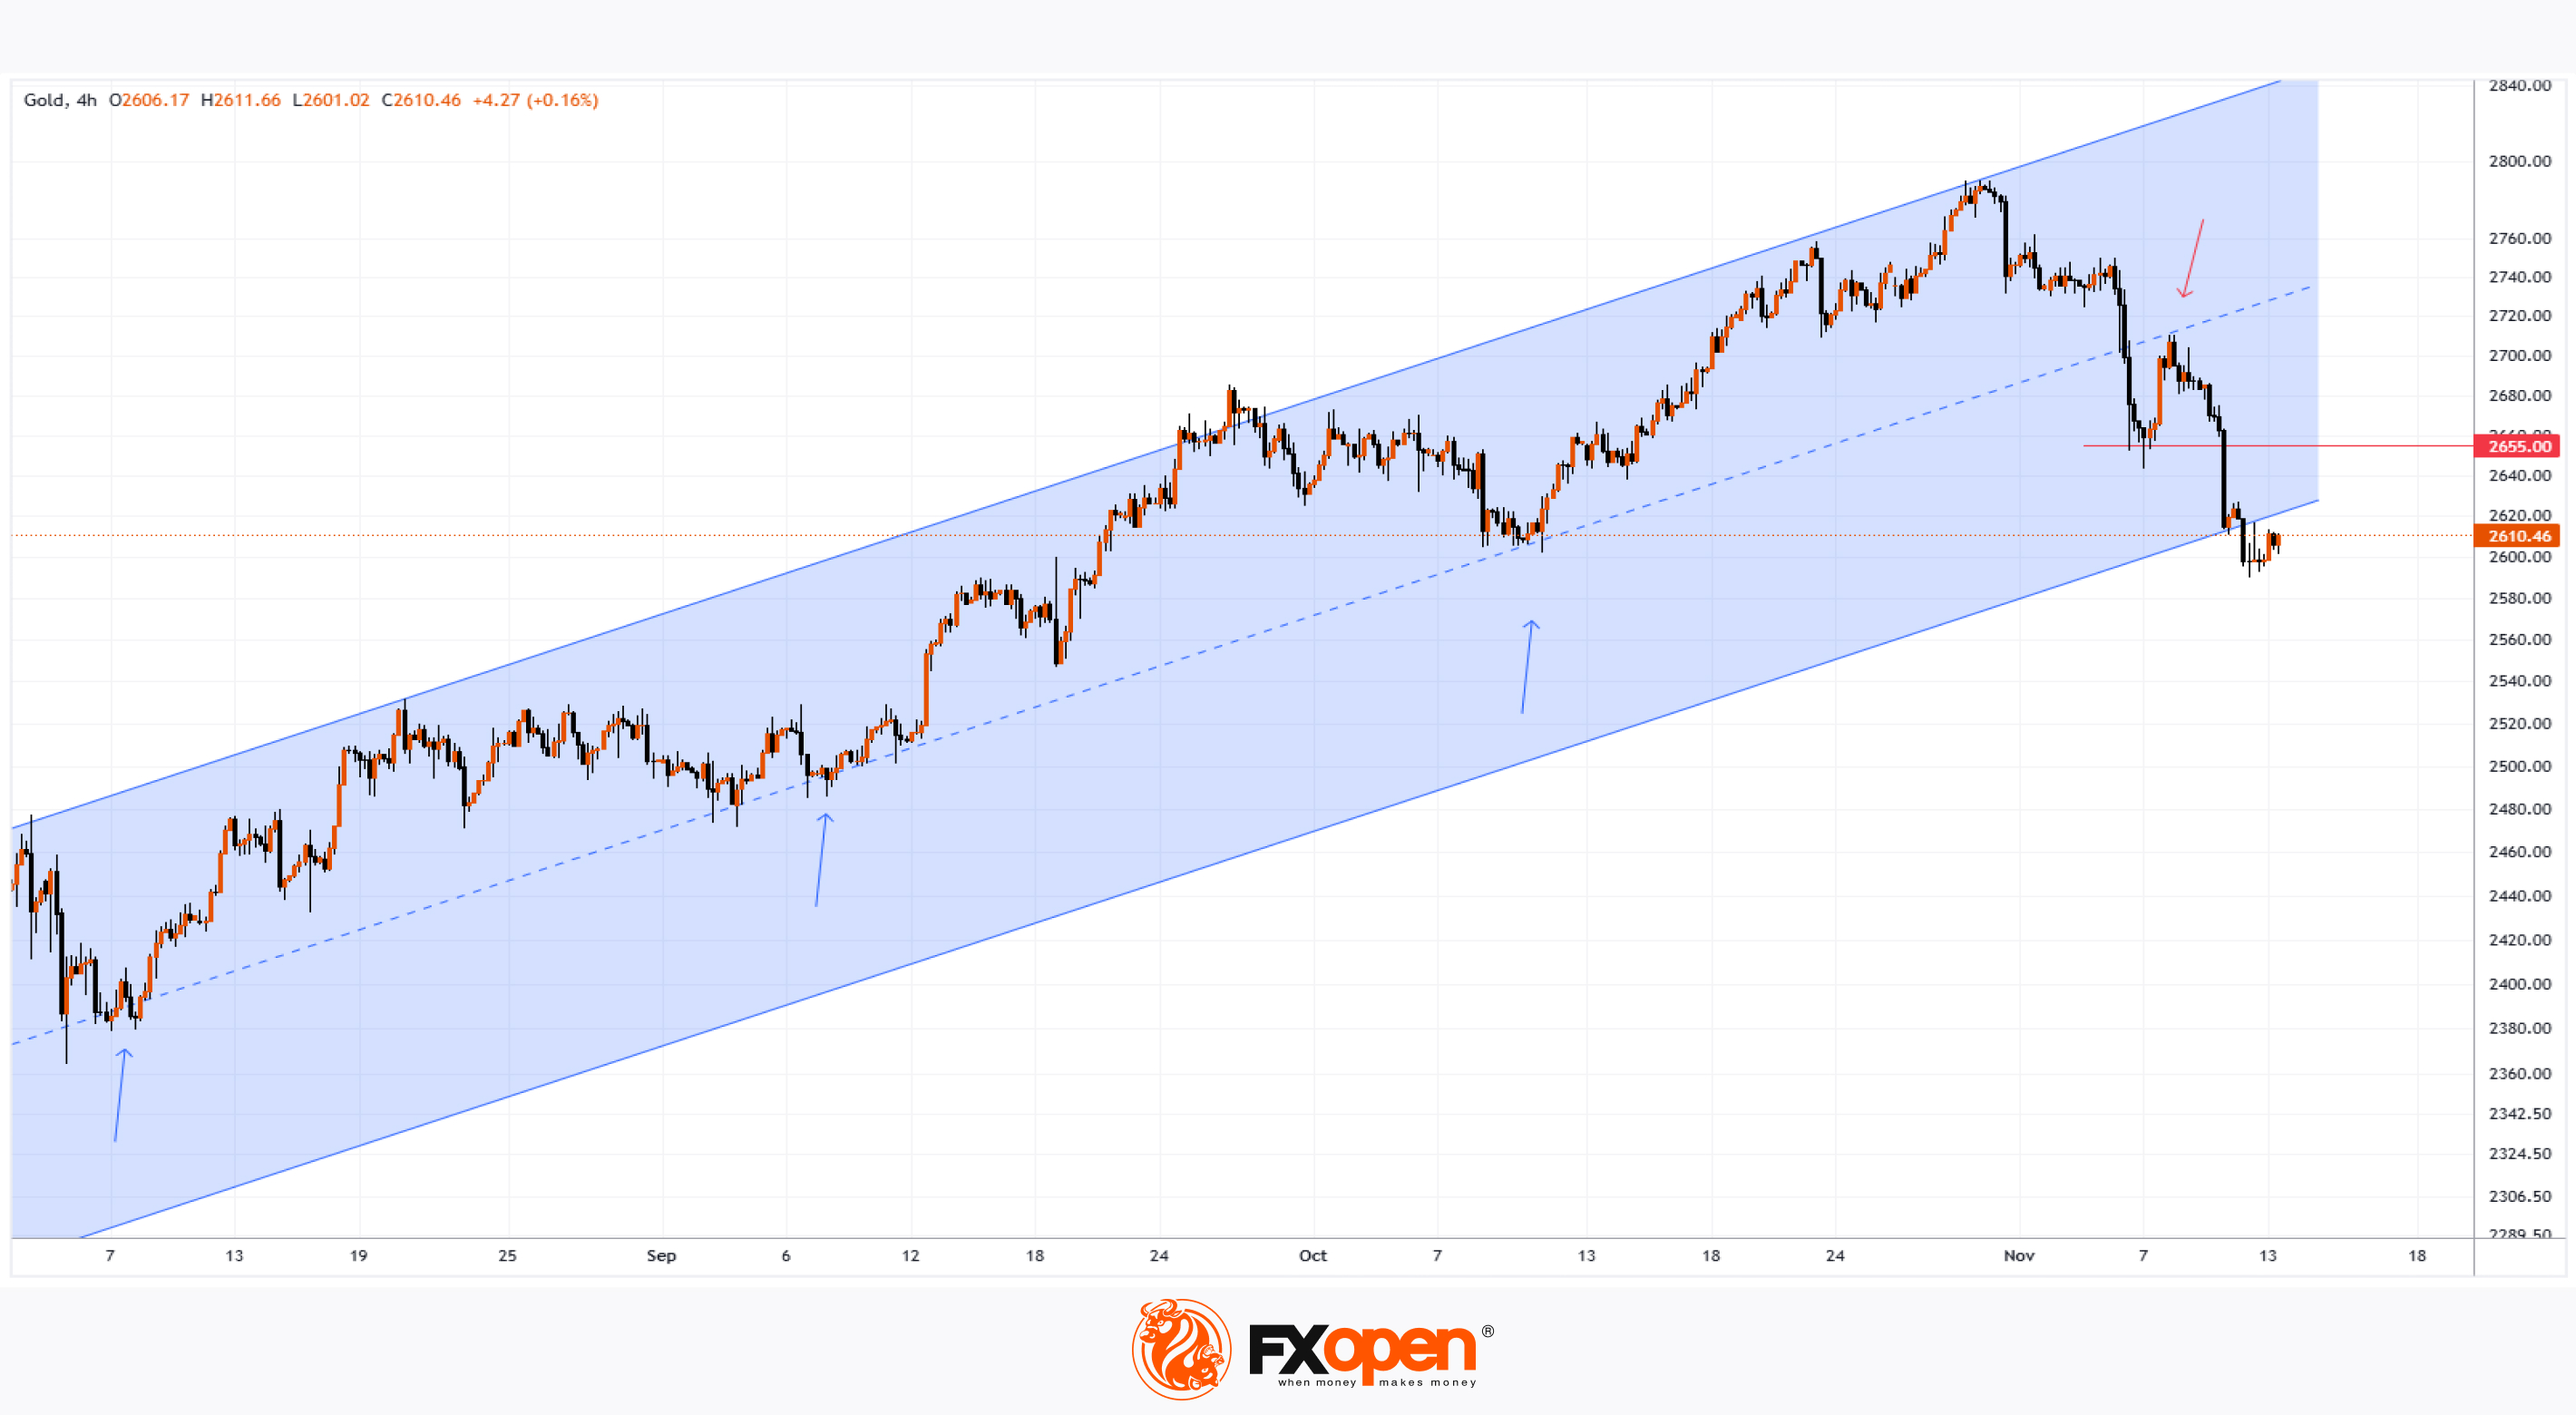
On November 4, when gold was trading around $2,750, we observed bearish signals on the XAU/USD chart.
Since then, the price has declined to the $2,600 level, briefly dipping below it — the lowest price since mid-September.
According to Trading Economics, investors may be losing interest in gold for several reasons:
→ Strong U.S. Dollar: A robust dollar reduces gold's appeal as a safe-haven asset.
→ Optimism Following Trump’s Election: Market participants are reacting to Trump’s fiscal and monetary policy pledges, shifting toward riskier assets.
→ Upcoming Key U.S. Inflation Data: The CPI data, expected today at 16:30 GMT+3, may reveal no unexpected negative trends.
Today’s XAU/USD technical analysis shows that:
→ Gold’s price is at the lower boundary of the blue channel, which has been extended to reflect recent trading data.
→ The channel’s median line has shifted from support to resistance (shown with arrows).
It is possible that today’s inflation news may catalyse one of two scenarios on the XAU/USD chart:
→ Bullish Rebound: Buyers may attempt to resume an uptrend from the lower boundary of the blue channel, facing resistance around $2,655.
→ Bearish Control: Sellers may continue to dominate, potentially making the blue channel less relevant as price stabilises below $2,600.
Start trading commodities with tight spreads. Open your trading account now or learn more about trading commodity CFDs with FXOpen.
CFDs are complex instruments and come with a high risk of losing your money.
This article represents the opinion of the Companies operating under the FXOpen brand only. It is not to be construed as an offer, solicitation, or recommendation with respect to products and services provided by the Companies operating under the FXOpen brand, nor is it to be considered financial advice.
XAU/USD Analysis: Gold Price Drops to $2,600 per Ounce
On November 4, when gold was trading around $2,750, we observed bearish signals on the XAU/USD chart.
Since then, the price has declined to the $2,600 level, briefly dipping below it — the lowest price since mid-September.
According to Trading Economics, investors may be losing interest in gold for several reasons:
→ Strong U.S. Dollar: A robust dollar reduces gold's appeal as a safe-haven asset.
→ Optimism Following Trump’s Election: Market participants are reacting to Trump’s fiscal and monetary policy pledges, shifting toward riskier assets.
→ Upcoming Key U.S. Inflation Data: The CPI data, expected today at 16:30 GMT+3, may reveal no unexpected negative trends.
Today’s XAU/USD technical analysis shows that:
→ Gold’s price is at the lower boundary of the blue channel, which has been extended to reflect recent trading data.
→ The channel’s median line has shifted from support to resistance (shown with arrows).
It is possible that today’s inflation news may catalyse one of two scenarios on the XAU/USD chart:
→ Bullish Rebound: Buyers may attempt to resume an uptrend from the lower boundary of the blue channel, facing resistance around $2,655.
→ Bearish Control: Sellers may continue to dominate, potentially making the blue channel less relevant as price stabilises below $2,600.
Start trading commodities with tight spreads. Open your trading account now or learn more about trading commodity CFDs with FXOpen.
CFDs are complex instruments and come with a high risk of losing your money.
This article represents the opinion of the Companies operating under the FXOpen brand only. It is not to be construed as an offer, solicitation, or recommendation with respect to products and services provided by the Companies operating under the FXOpen brand, nor is it to be considered financial advice.
👍3
#stockmarket #stocktrading #NVDA #nvidia #MarketUpdates
Nvidia (NVDA) Shares Consolidating Below $150
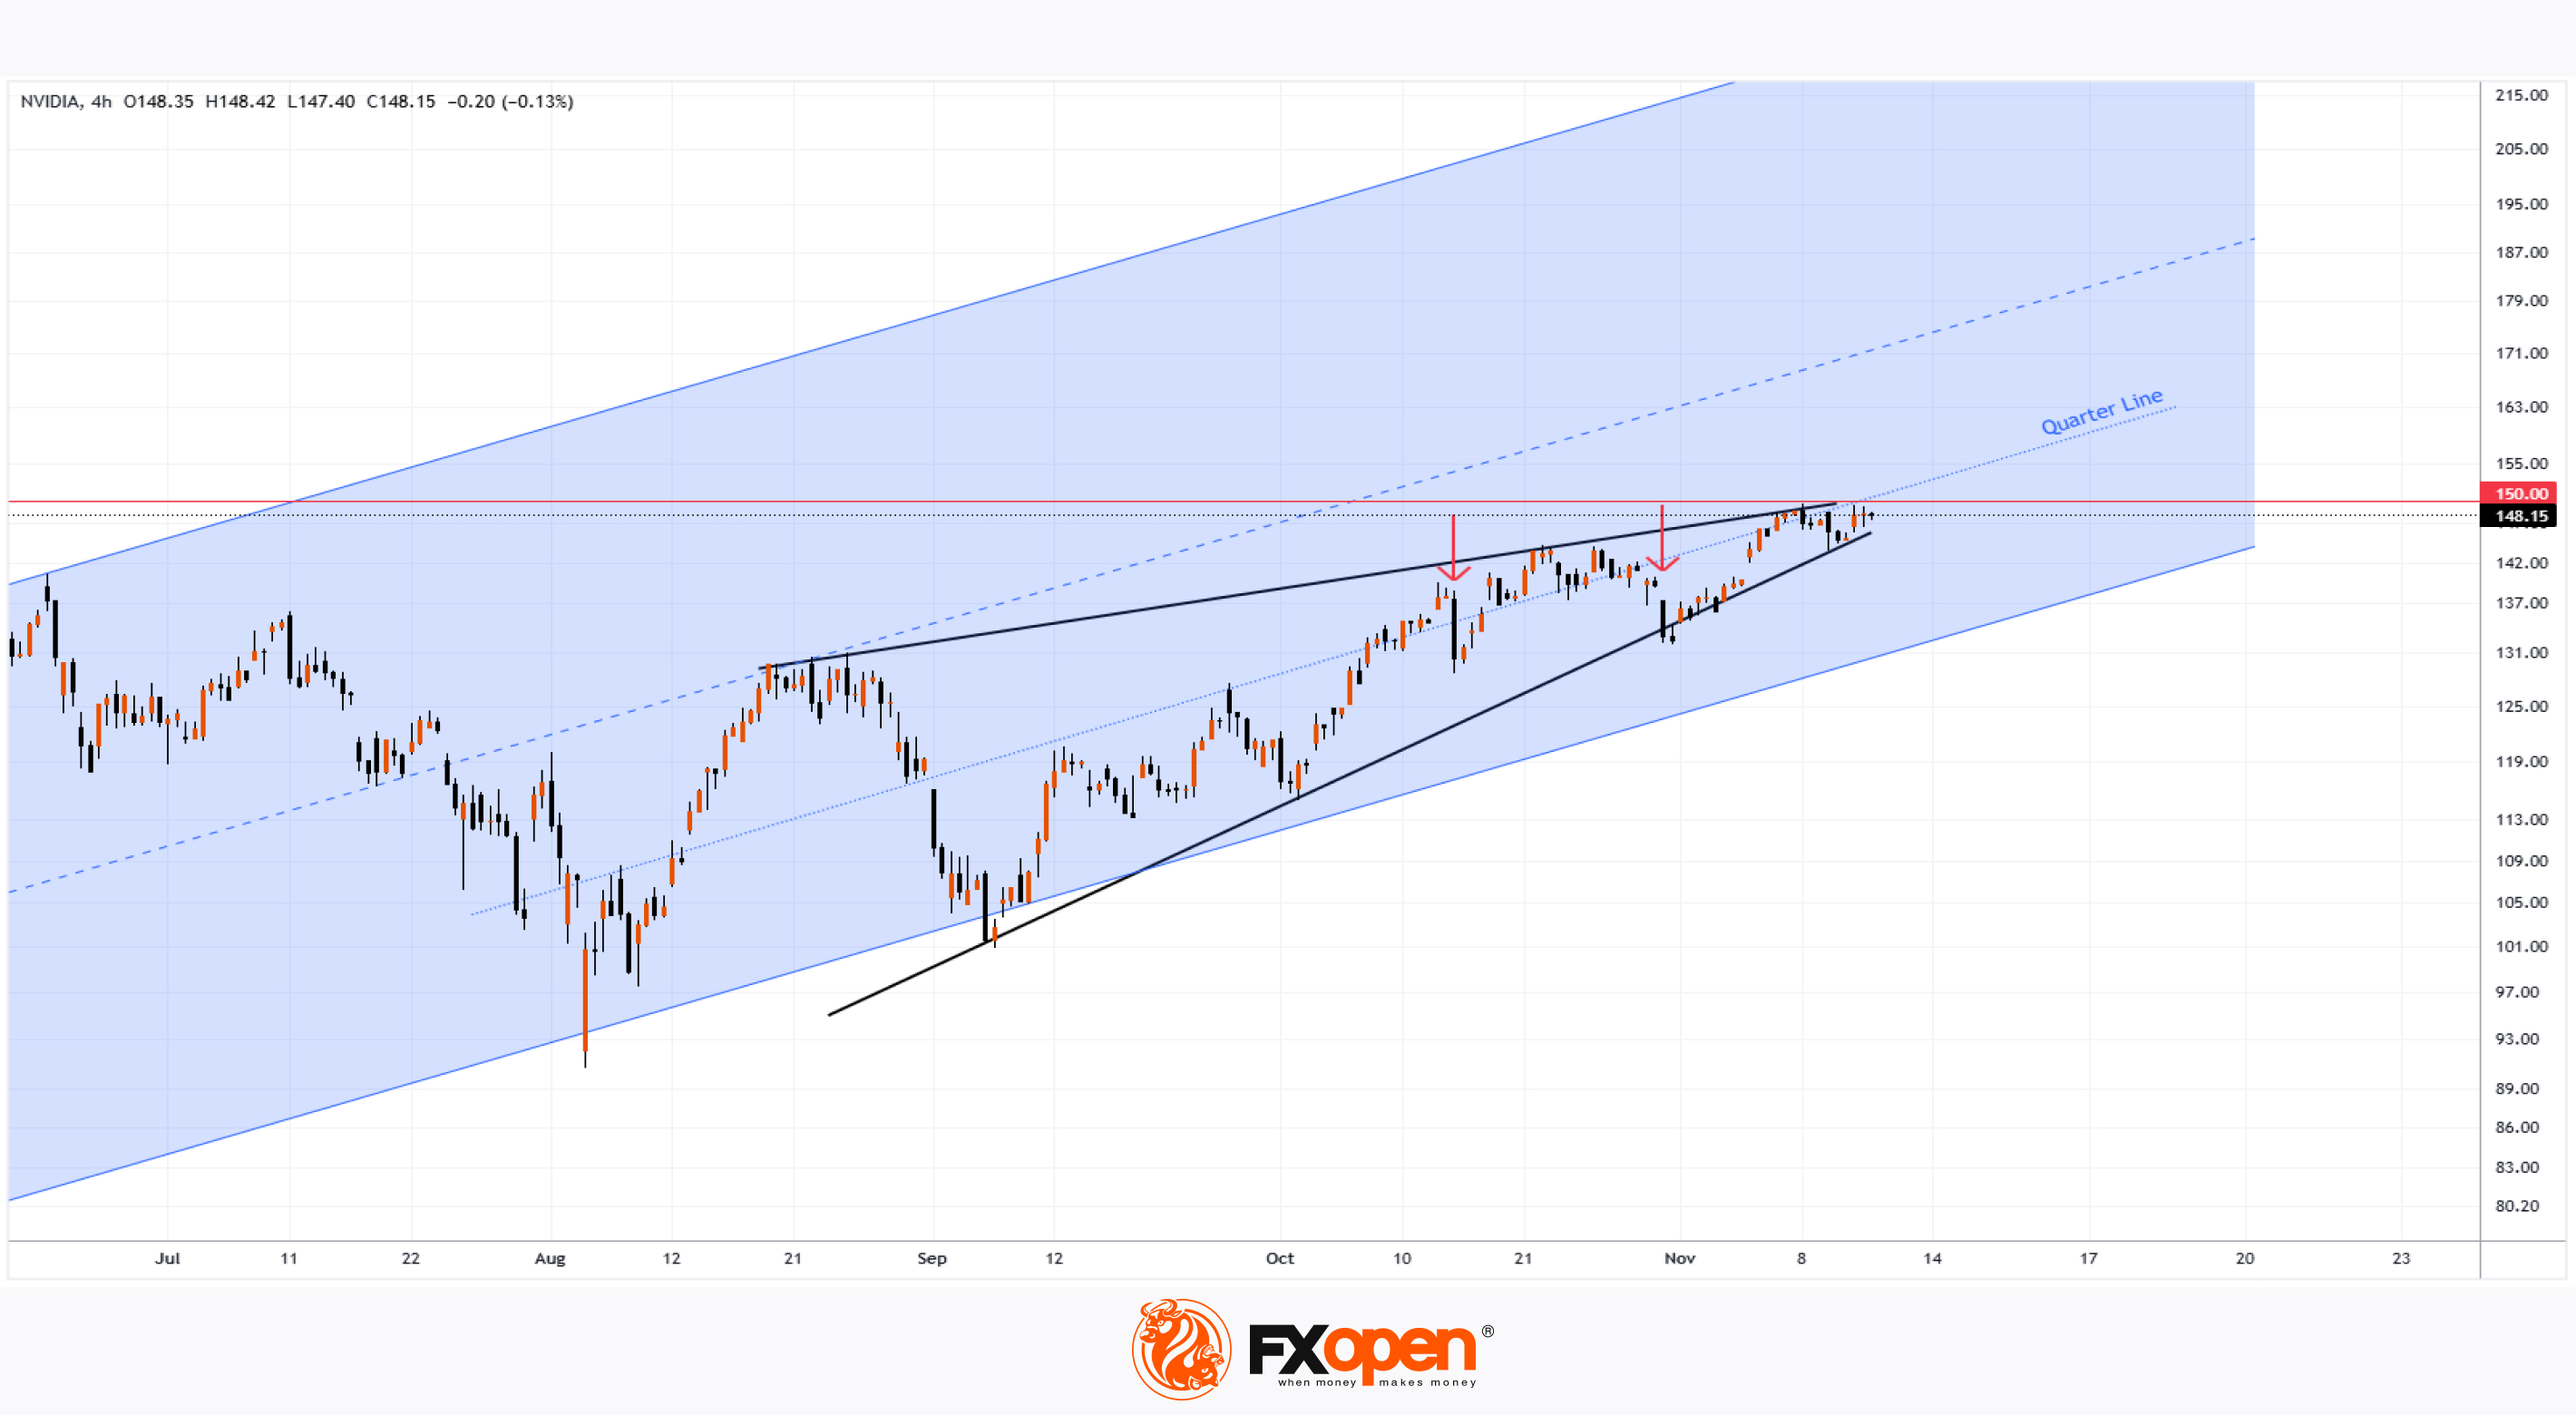
On October 22, while analysing Nvidia (NVDA) stock charts, we noted:
→ The stock had reached the $140 level;
→ A long-term ascending channel (shown in blue) was mapped;
→ Potential for price growth along the Quarter Line was suggested, dividing the lower half of the channel.
Bullish sentiment remains around Nvidia, one of the leading stocks of 2024, with the price now just below the $150 psychological mark about 29 days later. Nvidia’s technical analysis reveals that:
→ Price fluctuations are narrowing, forming a tightening triangle (illustrated with black lines), which may suggest consolidation as bulls hesitate before challenging a significant level;
→ Meanwhile, bears appear unable to gain momentum, as attempts to push prices down on wider candles (highlighted with red arrows) have not succeeded in setting a continued downtrend.
This indicates a balanced situation between demand and supply, with a slight edge for buyers. The sustainability of this buyer advantage will be tested if there’s an attempt to break above $150.
According to TipRanks:
→ 32 out of 42 analysts recommend buying NVDA stock;
→ The average price target for NVDA over the next 12 months is $157.
Trade global index CFDs with zero commission and tight spreads. Open your FXOpen account now or learn more about trading index CFDs with FXOpen.
CFDs are complex instruments and come with a high risk of losing your money.
This article represents the opinion of the Companies operating under the FXOpen brand only. It is not to be construed as an offer, solicitation, or recommendation with respect to products and services provided by the Companies operating under the FXOpen brand, nor is it to be considered financial advice.
Nvidia (NVDA) Shares Consolidating Below $150
On October 22, while analysing Nvidia (NVDA) stock charts, we noted:
→ The stock had reached the $140 level;
→ A long-term ascending channel (shown in blue) was mapped;
→ Potential for price growth along the Quarter Line was suggested, dividing the lower half of the channel.
Bullish sentiment remains around Nvidia, one of the leading stocks of 2024, with the price now just below the $150 psychological mark about 29 days later. Nvidia’s technical analysis reveals that:
→ Price fluctuations are narrowing, forming a tightening triangle (illustrated with black lines), which may suggest consolidation as bulls hesitate before challenging a significant level;
→ Meanwhile, bears appear unable to gain momentum, as attempts to push prices down on wider candles (highlighted with red arrows) have not succeeded in setting a continued downtrend.
This indicates a balanced situation between demand and supply, with a slight edge for buyers. The sustainability of this buyer advantage will be tested if there’s an attempt to break above $150.
According to TipRanks:
→ 32 out of 42 analysts recommend buying NVDA stock;
→ The average price target for NVDA over the next 12 months is $157.
Trade global index CFDs with zero commission and tight spreads. Open your FXOpen account now or learn more about trading index CFDs with FXOpen.
CFDs are complex instruments and come with a high risk of losing your money.
This article represents the opinion of the Companies operating under the FXOpen brand only. It is not to be construed as an offer, solicitation, or recommendation with respect to products and services provided by the Companies operating under the FXOpen brand, nor is it to be considered financial advice.
👍3
#sp500 #stockmarket #stocktrading #MarketUpdates
S&P 500 Index Stabilises Near Resistance Block
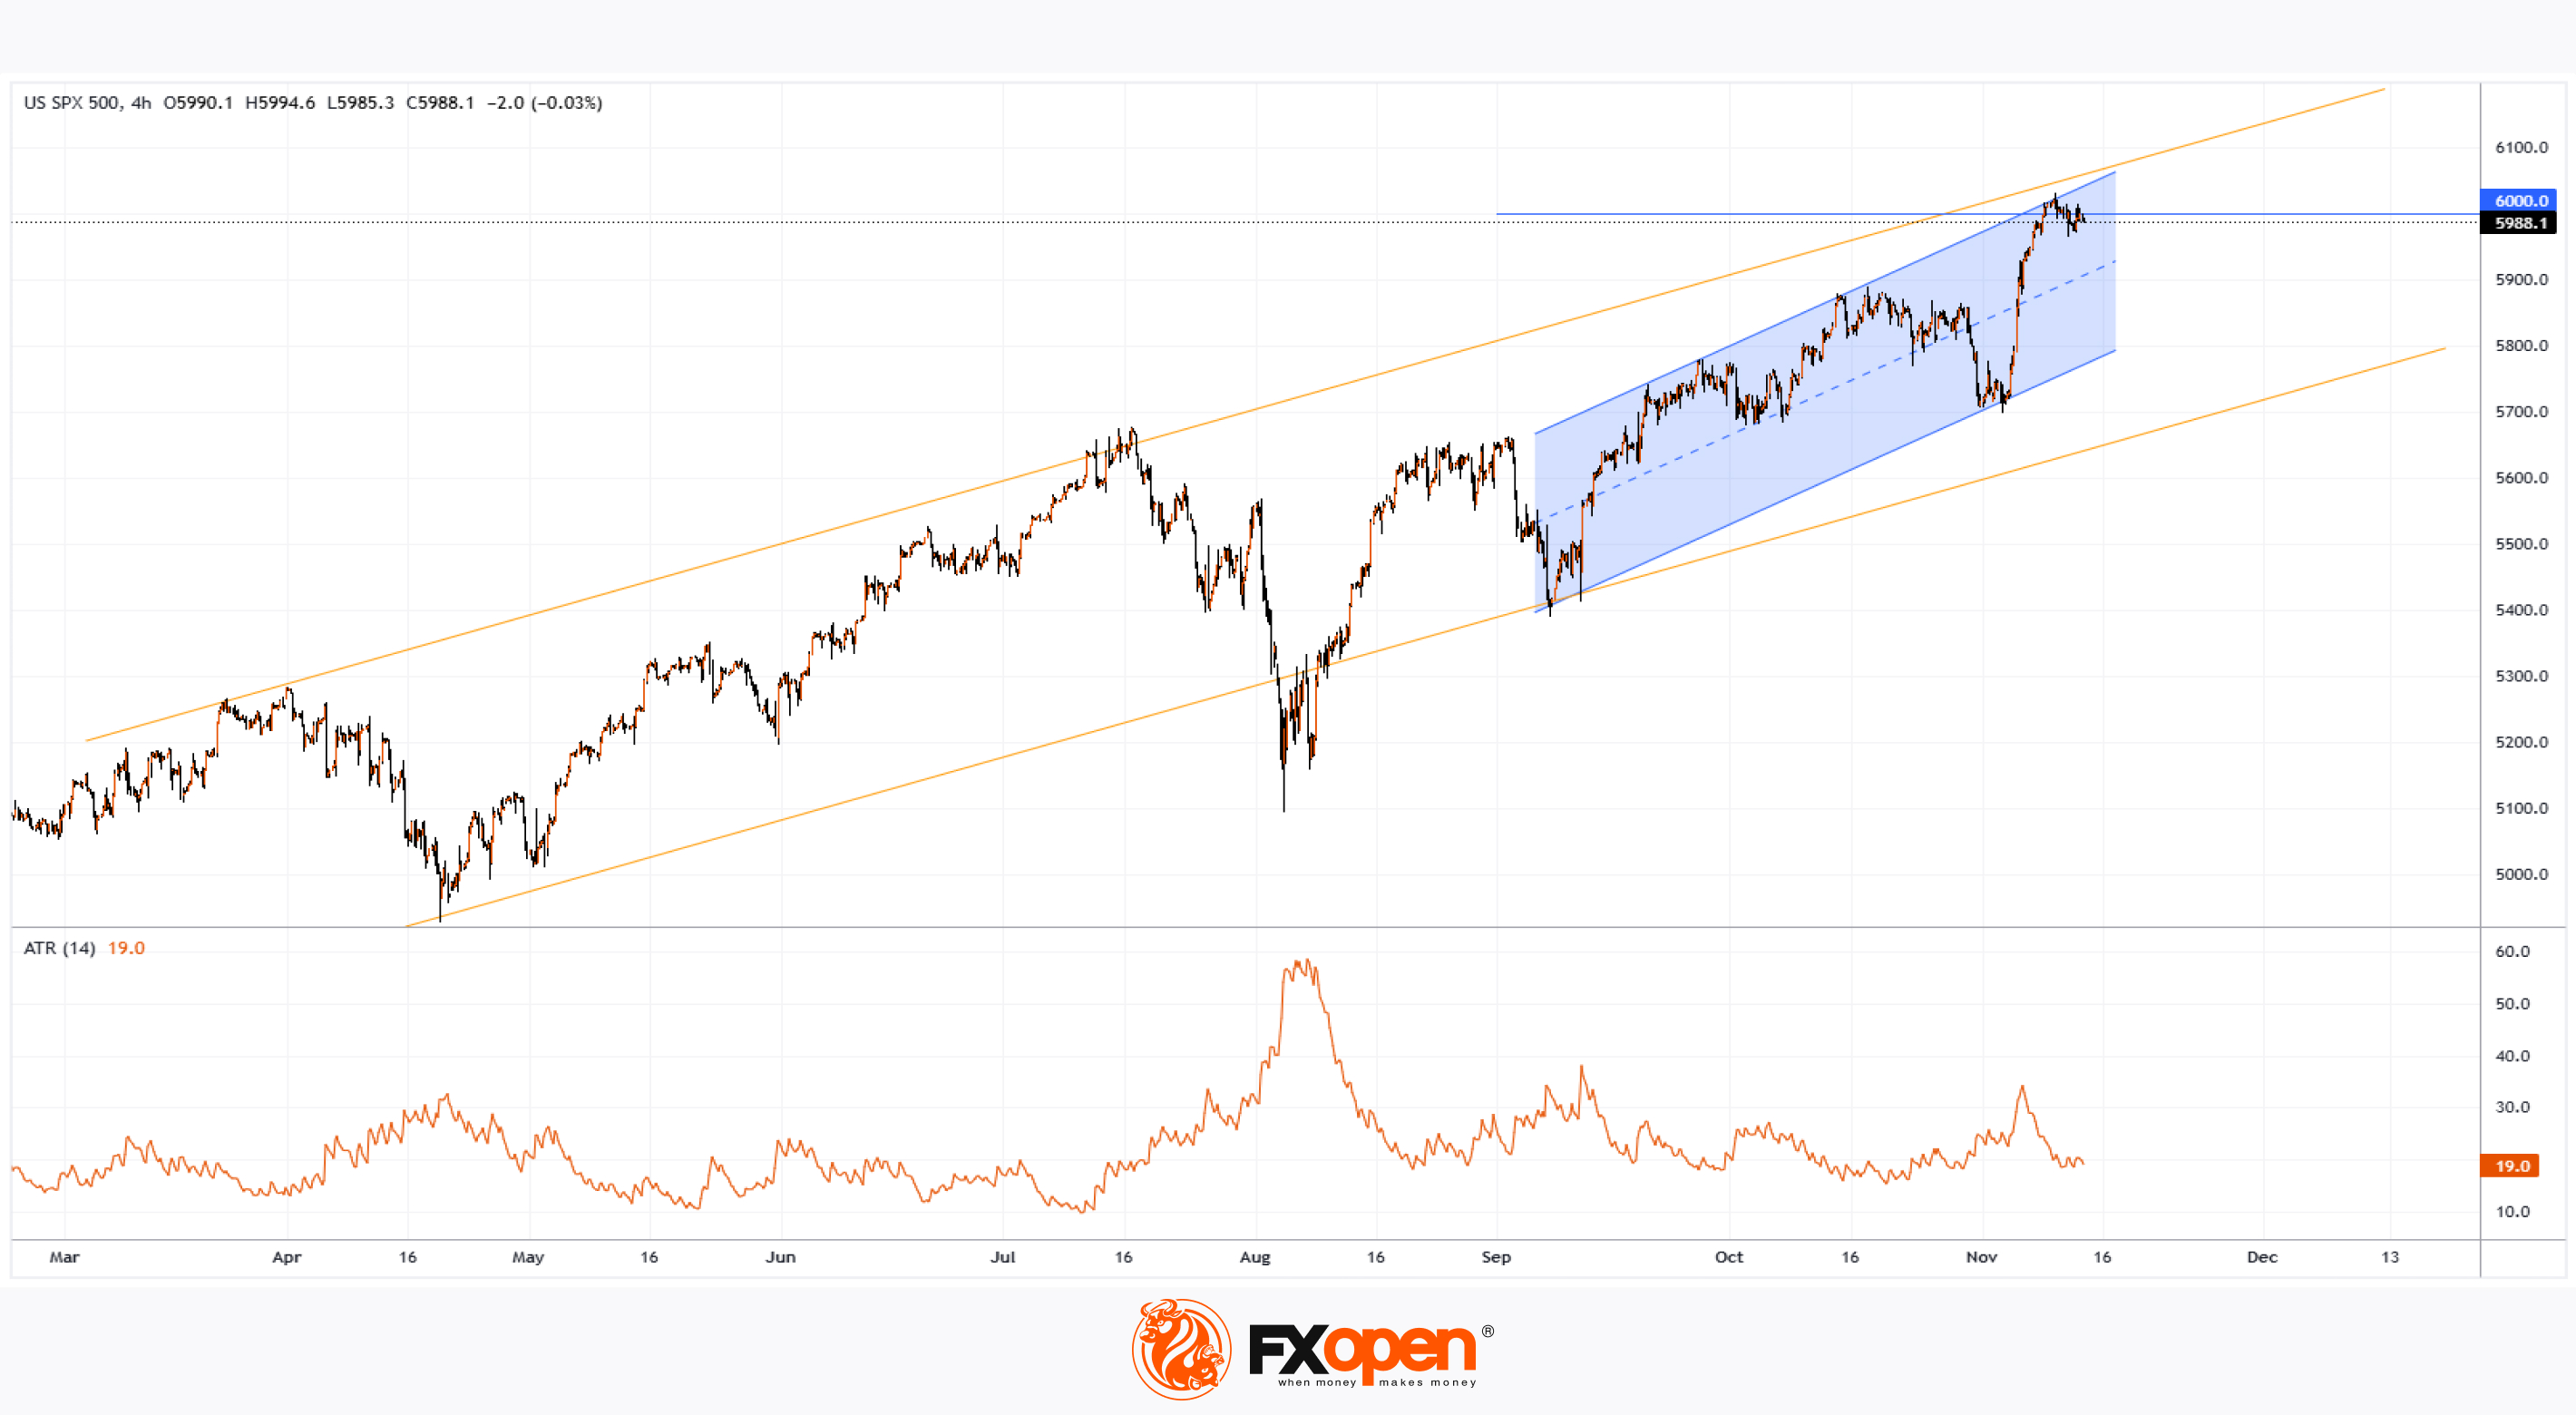
The ATR indicator on the S&P 500’s 4-hour chart (US SPX 500 mini on FXOpen) currently shows a reduction in price volatility.
This drop in volatility can likely be attributed to:
→ The market having fully absorbed the impact of Trump’s recent presidential win;
→ No unexpected news from yesterday’s CPI report, which matched analysts’ inflation expectations.
Looking ahead, Morgan Stanley analysts believe the bull market could face challenges from:
→ A rise in treasury bond yields, potentially diverting investor funds;
→ A strengthening dollar, which could reduce export revenues for large companies;
→ Indicators suggesting stock valuations are becoming even more stretched.
Technical analysis of the S&P 500 chart (US SPX 500 mini on FXOpen) highlights that price is at a resistance zone created by:
→ The upper boundary of the upward blue channel, which began in early September;
→ The upper edge of the long-term ascending channel (shown in orange, previously charted in our S&P 500 analysis on October 14);
→ The psychological level of 6,000 points.
Given these factors, it’s reasonable to anticipate that bulls may encounter difficulties if they attempt to push past the 6,000 level.
A potential pullback may emerge following the S&P 500's 4% rise since early November—perhaps towards the channel’s median or lower boundary.
Trade global index CFDs with zero commission and tight spreads. Open your FXOpen account now or learn more about trading index CFDs with FXOpen.
CFDs are complex instruments and come with a high risk of losing your money.
This article represents the opinion of the Companies operating under the FXOpen brand only. It is not to be construed as an offer, solicitation, or recommendation with respect to products and services provided by the Companies operating under the FXOpen brand, nor is it to be considered financial advice.
S&P 500 Index Stabilises Near Resistance Block
The ATR indicator on the S&P 500’s 4-hour chart (US SPX 500 mini on FXOpen) currently shows a reduction in price volatility.
This drop in volatility can likely be attributed to:
→ The market having fully absorbed the impact of Trump’s recent presidential win;
→ No unexpected news from yesterday’s CPI report, which matched analysts’ inflation expectations.
Looking ahead, Morgan Stanley analysts believe the bull market could face challenges from:
→ A rise in treasury bond yields, potentially diverting investor funds;
→ A strengthening dollar, which could reduce export revenues for large companies;
→ Indicators suggesting stock valuations are becoming even more stretched.
Technical analysis of the S&P 500 chart (US SPX 500 mini on FXOpen) highlights that price is at a resistance zone created by:
→ The upper boundary of the upward blue channel, which began in early September;
→ The upper edge of the long-term ascending channel (shown in orange, previously charted in our S&P 500 analysis on October 14);
→ The psychological level of 6,000 points.
Given these factors, it’s reasonable to anticipate that bulls may encounter difficulties if they attempt to push past the 6,000 level.
A potential pullback may emerge following the S&P 500's 4% rise since early November—perhaps towards the channel’s median or lower boundary.
Trade global index CFDs with zero commission and tight spreads. Open your FXOpen account now or learn more about trading index CFDs with FXOpen.
CFDs are complex instruments and come with a high risk of losing your money.
This article represents the opinion of the Companies operating under the FXOpen brand only. It is not to be construed as an offer, solicitation, or recommendation with respect to products and services provided by the Companies operating under the FXOpen brand, nor is it to be considered financial advice.
👍3
#stockmarket #marketanalysis #MarketNews #alibaba
Alibaba (BABA) Shares Drop Ahead of Earnings Report
Tomorrow, on 15 November, Alibaba (BABA) will release its third-quarter 2024 earnings report. Analysts forecast a drop in earnings per share to $2.11 from $2.26 in the previous quarter.
Ahead of the report, Alibaba's share price has shown a downward trend, with a decline of over 20% from its October high. This drop is attributed not only to the waning of the strong bullish momentum seen in the Chinese stock market in September but also to increased competition from Temu and Pinduoduo. However, JP Morgan analyst Alex Yao predicts that "Alibaba will stabilise its market share in the coming years," potentially supporting its position as China's largest supplier.
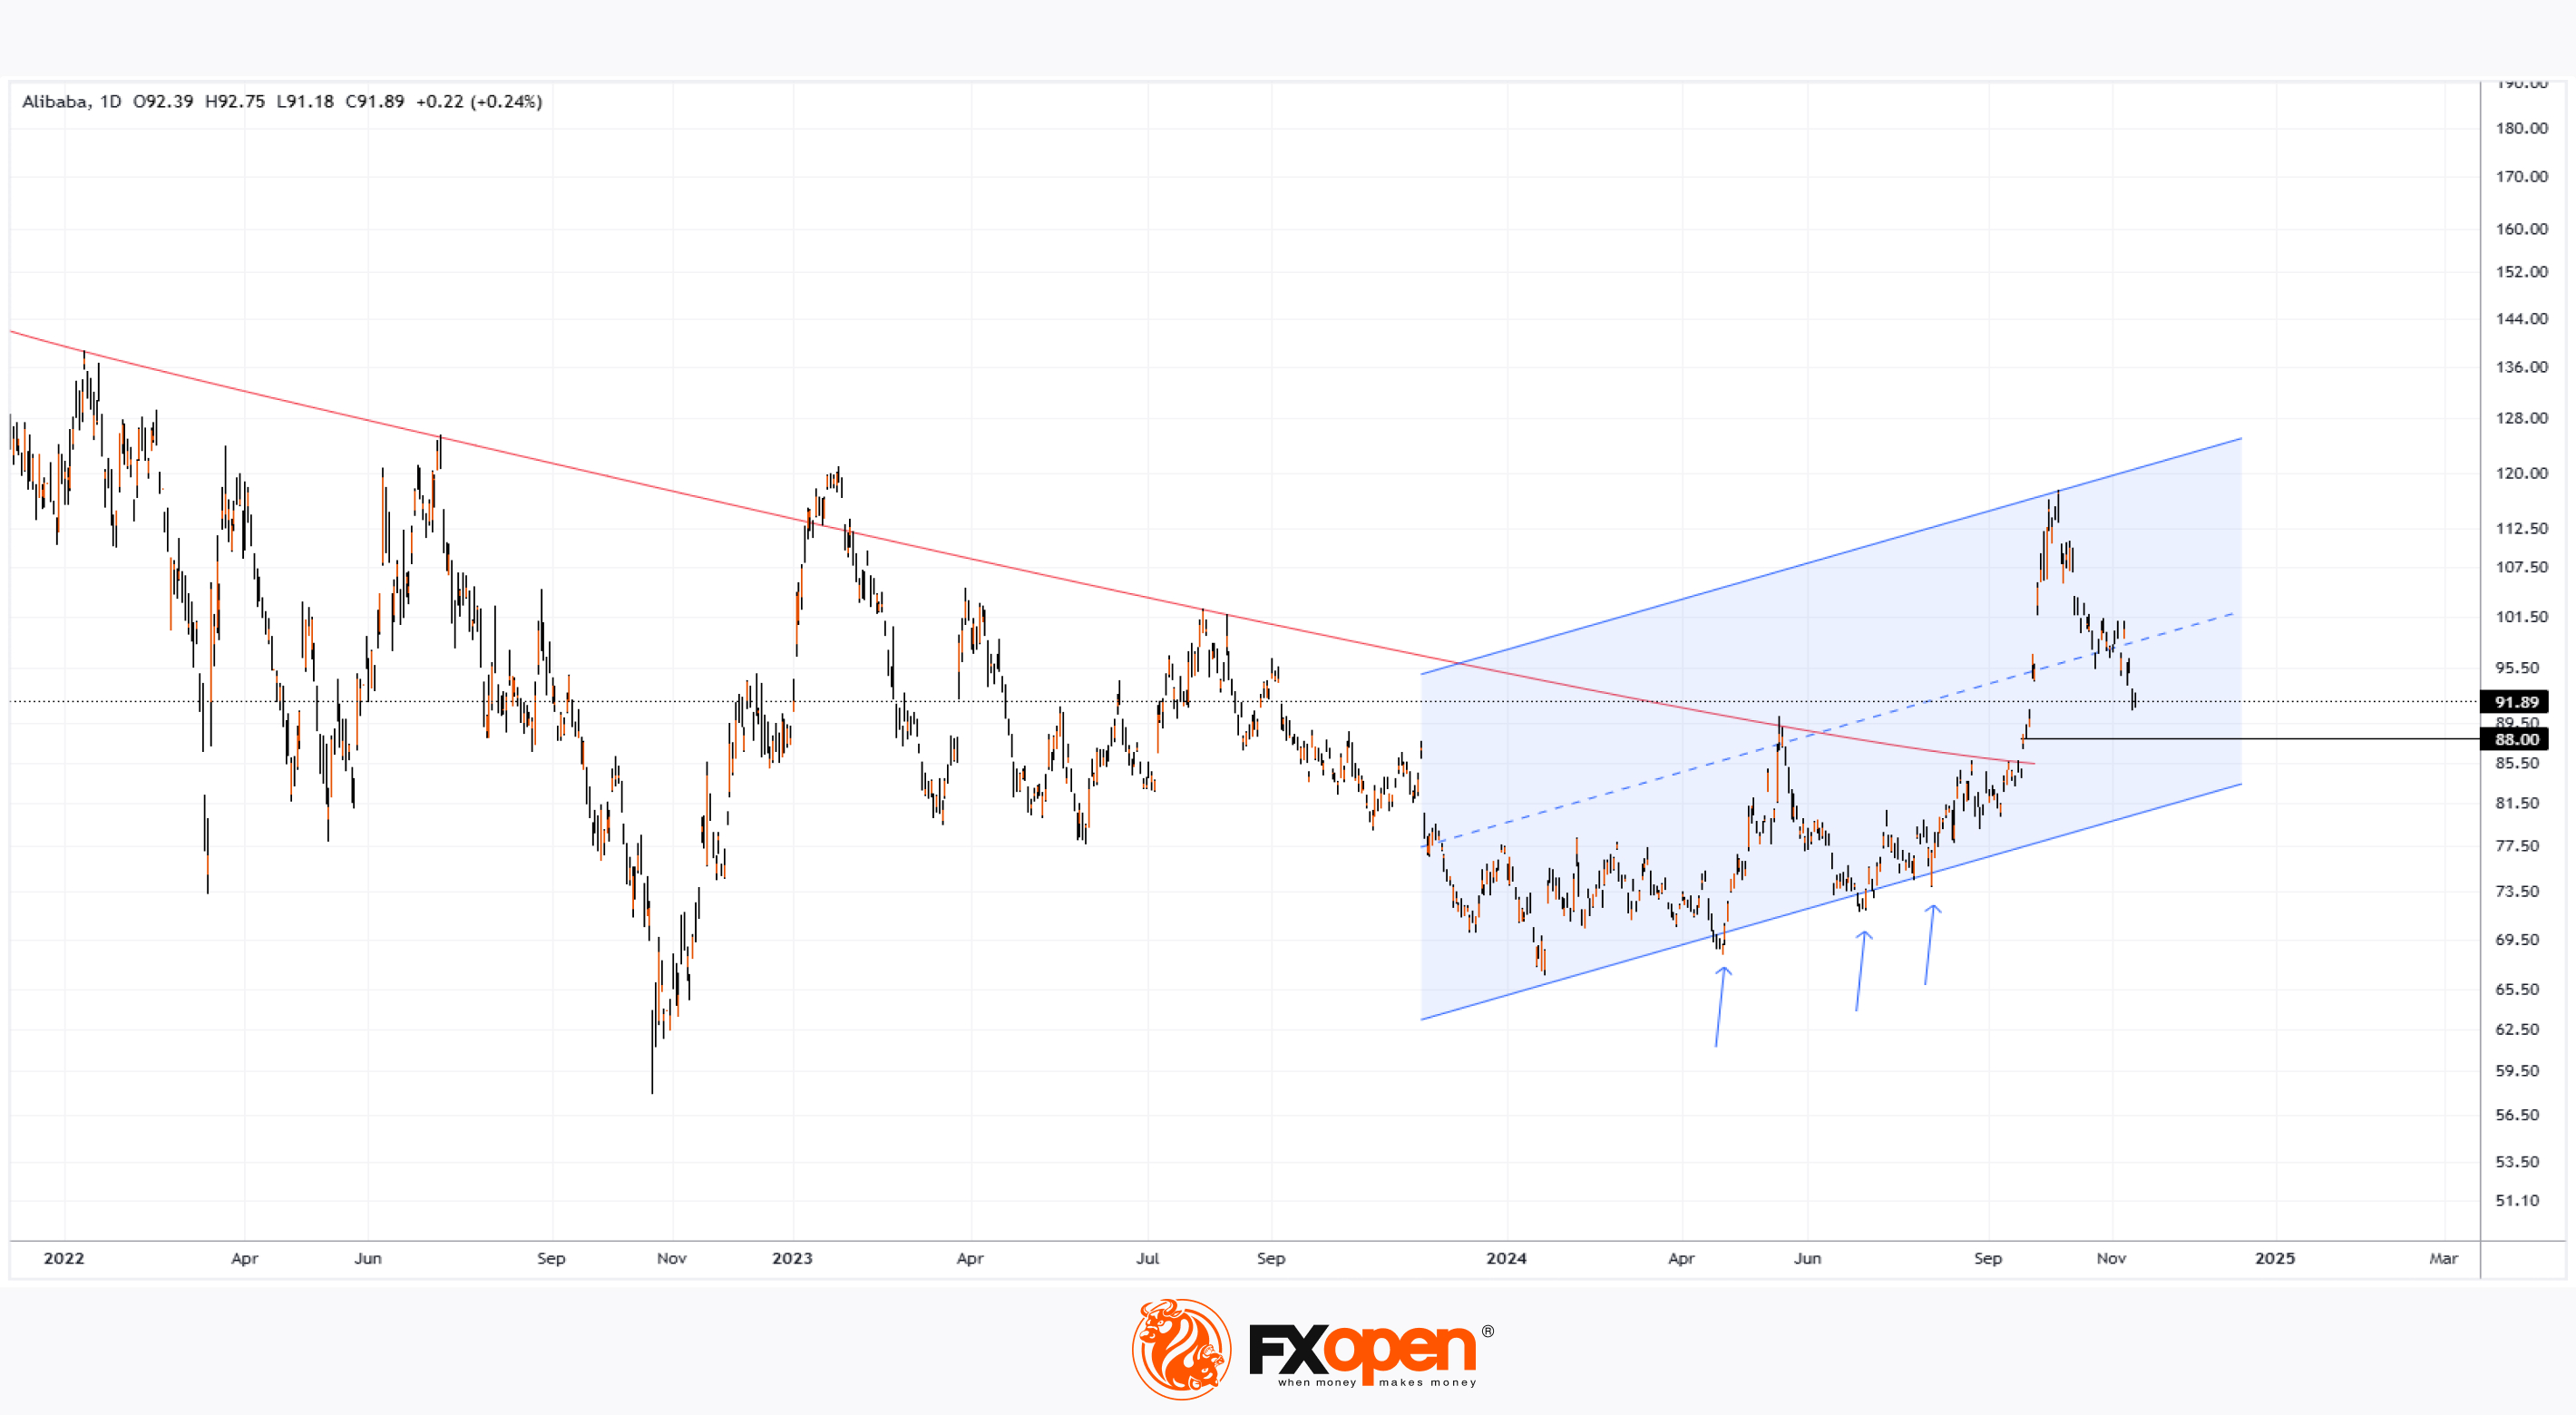
A technical analysis of Alibaba’s (BABA) price chart reveals that:
→ this autumn, the stock price broke above a multi-year descending trend line (in red);
→ signs of support lines and pivot points suggest an emerging upward channel that could gain relevance in the long term following the breakout.
It’s evident that near the breakout of the red trend line (around $88), there were fewer sellers than buyers, suggesting sustained demand could support a bullish reversal if the price dips below $90.
According to TipRanks:
→ 15 of 18 analysts recommend buying BABA shares;
→ the average 12-month price target for BABA is $124.4.
Trade global index CFDs with zero commission and tight spreads. Open your FXOpen account now or learn more about trading index CFDs with FXOpen.
CFDs are complex instruments and come with a high risk of losing your money.
This article represents the opinion of the Companies operating under the FXOpen brand only. It is not to be construed as an offer, solicitation, or recommendation with respect to products and services provided by the Companies operating under the FXOpen brand, nor is it to be considered financial advice.
Alibaba (BABA) Shares Drop Ahead of Earnings Report
Tomorrow, on 15 November, Alibaba (BABA) will release its third-quarter 2024 earnings report. Analysts forecast a drop in earnings per share to $2.11 from $2.26 in the previous quarter.
Ahead of the report, Alibaba's share price has shown a downward trend, with a decline of over 20% from its October high. This drop is attributed not only to the waning of the strong bullish momentum seen in the Chinese stock market in September but also to increased competition from Temu and Pinduoduo. However, JP Morgan analyst Alex Yao predicts that "Alibaba will stabilise its market share in the coming years," potentially supporting its position as China's largest supplier.
A technical analysis of Alibaba’s (BABA) price chart reveals that:
→ this autumn, the stock price broke above a multi-year descending trend line (in red);
→ signs of support lines and pivot points suggest an emerging upward channel that could gain relevance in the long term following the breakout.
It’s evident that near the breakout of the red trend line (around $88), there were fewer sellers than buyers, suggesting sustained demand could support a bullish reversal if the price dips below $90.
According to TipRanks:
→ 15 of 18 analysts recommend buying BABA shares;
→ the average 12-month price target for BABA is $124.4.
Trade global index CFDs with zero commission and tight spreads. Open your FXOpen account now or learn more about trading index CFDs with FXOpen.
CFDs are complex instruments and come with a high risk of losing your money.
This article represents the opinion of the Companies operating under the FXOpen brand only. It is not to be construed as an offer, solicitation, or recommendation with respect to products and services provided by the Companies operating under the FXOpen brand, nor is it to be considered financial advice.
👍4
#NFLX #stockmarket #stocktrading #MarketNews
Netflix (NFLX) Stock Hits Another All-Time High
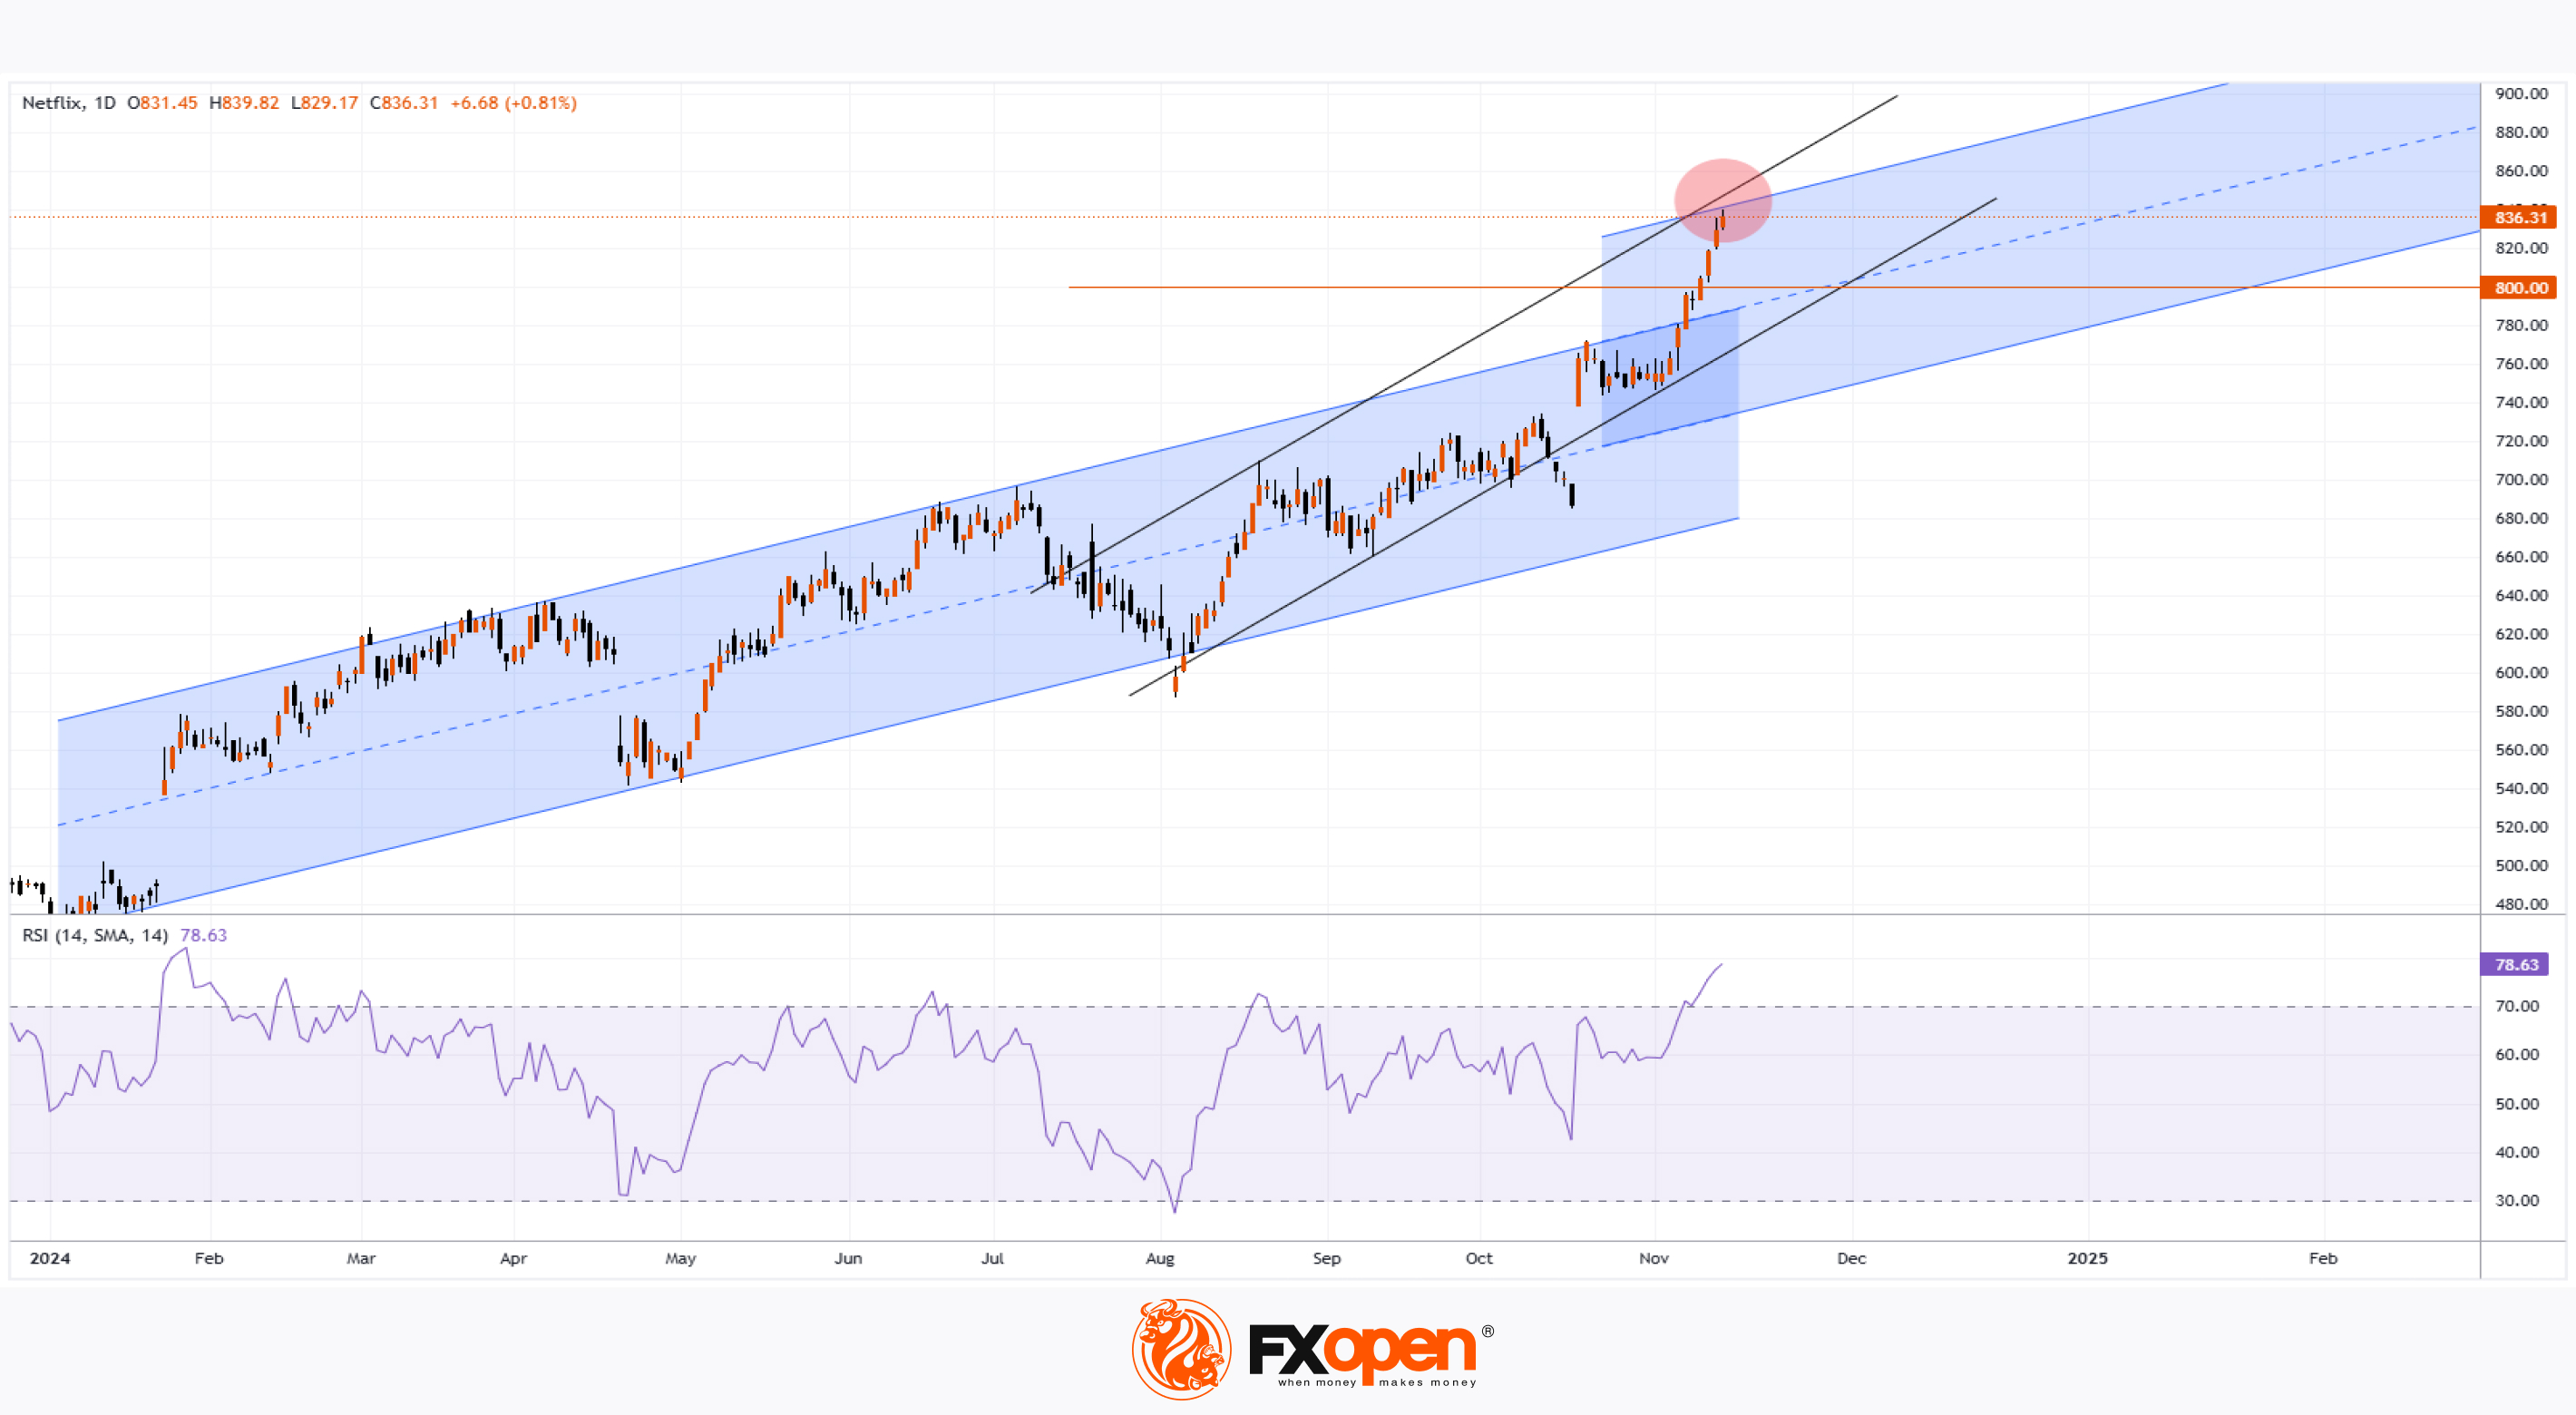
The daily chart for Netflix (NFLX) shows that its price has risen by more than 10% since the start of November, setting a series of new all-time highs. Today, Netflix's stock price is trading above $830.
The bullish momentum is attributed to several factors, including stronger-than-expected Q3 earnings:
→ Earnings per share (EPS): Actual = $5.40, Expectations = $5.11;
→ Revenue: Actual = $9.82 billion, Expectations = $9.11 billion;
→ Monthly active users: Reached 70 million.
Additionally, as reported by Benzinga, investor optimism has been bolstered by expectations that Donald Trump’s pro-business tax-cut policies could increase consumer spending, particularly in discretionary sectors like streaming video.
Technical Analysis of NFLX Stock
The daily chart indicates that Netflix's price has been trading within an upward channel (blue) throughout 2024. However, strong bullish sentiment has pushed the price beyond the channel's upper boundary. This allows analysts to:
→ Construct a parallel channel of the same width above the initial one;
→ Build a steeper channel (black lines).
The price is now in a resistance zone (marked with a red circle), formed by:
→ The upper boundary of the new channel;
→ The upper black trendline.
These observations suggest the possibility of a correction after the explosive rally. The RSI indicator, which has reached its highest levels since January, supports this view. If a correction occurs, the price could test the psychological level of $800.
Analyst Predictions
Analysts continue to raise their price targets for NFLX. According to TipRanks:
→ Out of 36 ratings, 24 analysts recommend buying NFLX shares, while 2 suggest selling;
→ The average 12-month price target for NFLX is now $925, compared to $720 during the previous analysis on 10 October.
Trade global index CFDs with zero commission and tight spreads. Open your FXOpen account now or learn more about trading index CFDs with FXOpen.
CFDs are complex instruments and come with a high risk of losing your money.
This article represents the opinion of the Companies operating under the FXOpen brand only. It is not to be construed as an offer, solicitation, or recommendation with respect to products and services provided by the Companies operating under the FXOpen brand, nor is it to be considered financial advice.
Netflix (NFLX) Stock Hits Another All-Time High
The daily chart for Netflix (NFLX) shows that its price has risen by more than 10% since the start of November, setting a series of new all-time highs. Today, Netflix's stock price is trading above $830.
The bullish momentum is attributed to several factors, including stronger-than-expected Q3 earnings:
→ Earnings per share (EPS): Actual = $5.40, Expectations = $5.11;
→ Revenue: Actual = $9.82 billion, Expectations = $9.11 billion;
→ Monthly active users: Reached 70 million.
Additionally, as reported by Benzinga, investor optimism has been bolstered by expectations that Donald Trump’s pro-business tax-cut policies could increase consumer spending, particularly in discretionary sectors like streaming video.
Technical Analysis of NFLX Stock
The daily chart indicates that Netflix's price has been trading within an upward channel (blue) throughout 2024. However, strong bullish sentiment has pushed the price beyond the channel's upper boundary. This allows analysts to:
→ Construct a parallel channel of the same width above the initial one;
→ Build a steeper channel (black lines).
The price is now in a resistance zone (marked with a red circle), formed by:
→ The upper boundary of the new channel;
→ The upper black trendline.
These observations suggest the possibility of a correction after the explosive rally. The RSI indicator, which has reached its highest levels since January, supports this view. If a correction occurs, the price could test the psychological level of $800.
Analyst Predictions
Analysts continue to raise their price targets for NFLX. According to TipRanks:
→ Out of 36 ratings, 24 analysts recommend buying NFLX shares, while 2 suggest selling;
→ The average 12-month price target for NFLX is now $925, compared to $720 during the previous analysis on 10 October.
Trade global index CFDs with zero commission and tight spreads. Open your FXOpen account now or learn more about trading index CFDs with FXOpen.
CFDs are complex instruments and come with a high risk of losing your money.
This article represents the opinion of the Companies operating under the FXOpen brand only. It is not to be construed as an offer, solicitation, or recommendation with respect to products and services provided by the Companies operating under the FXOpen brand, nor is it to be considered financial advice.
👍3
#brentoil #oilprices #oilindustry #MarketUpdates
Brent Crude Oil Analysis: Bulls Hold the Line at Key Support
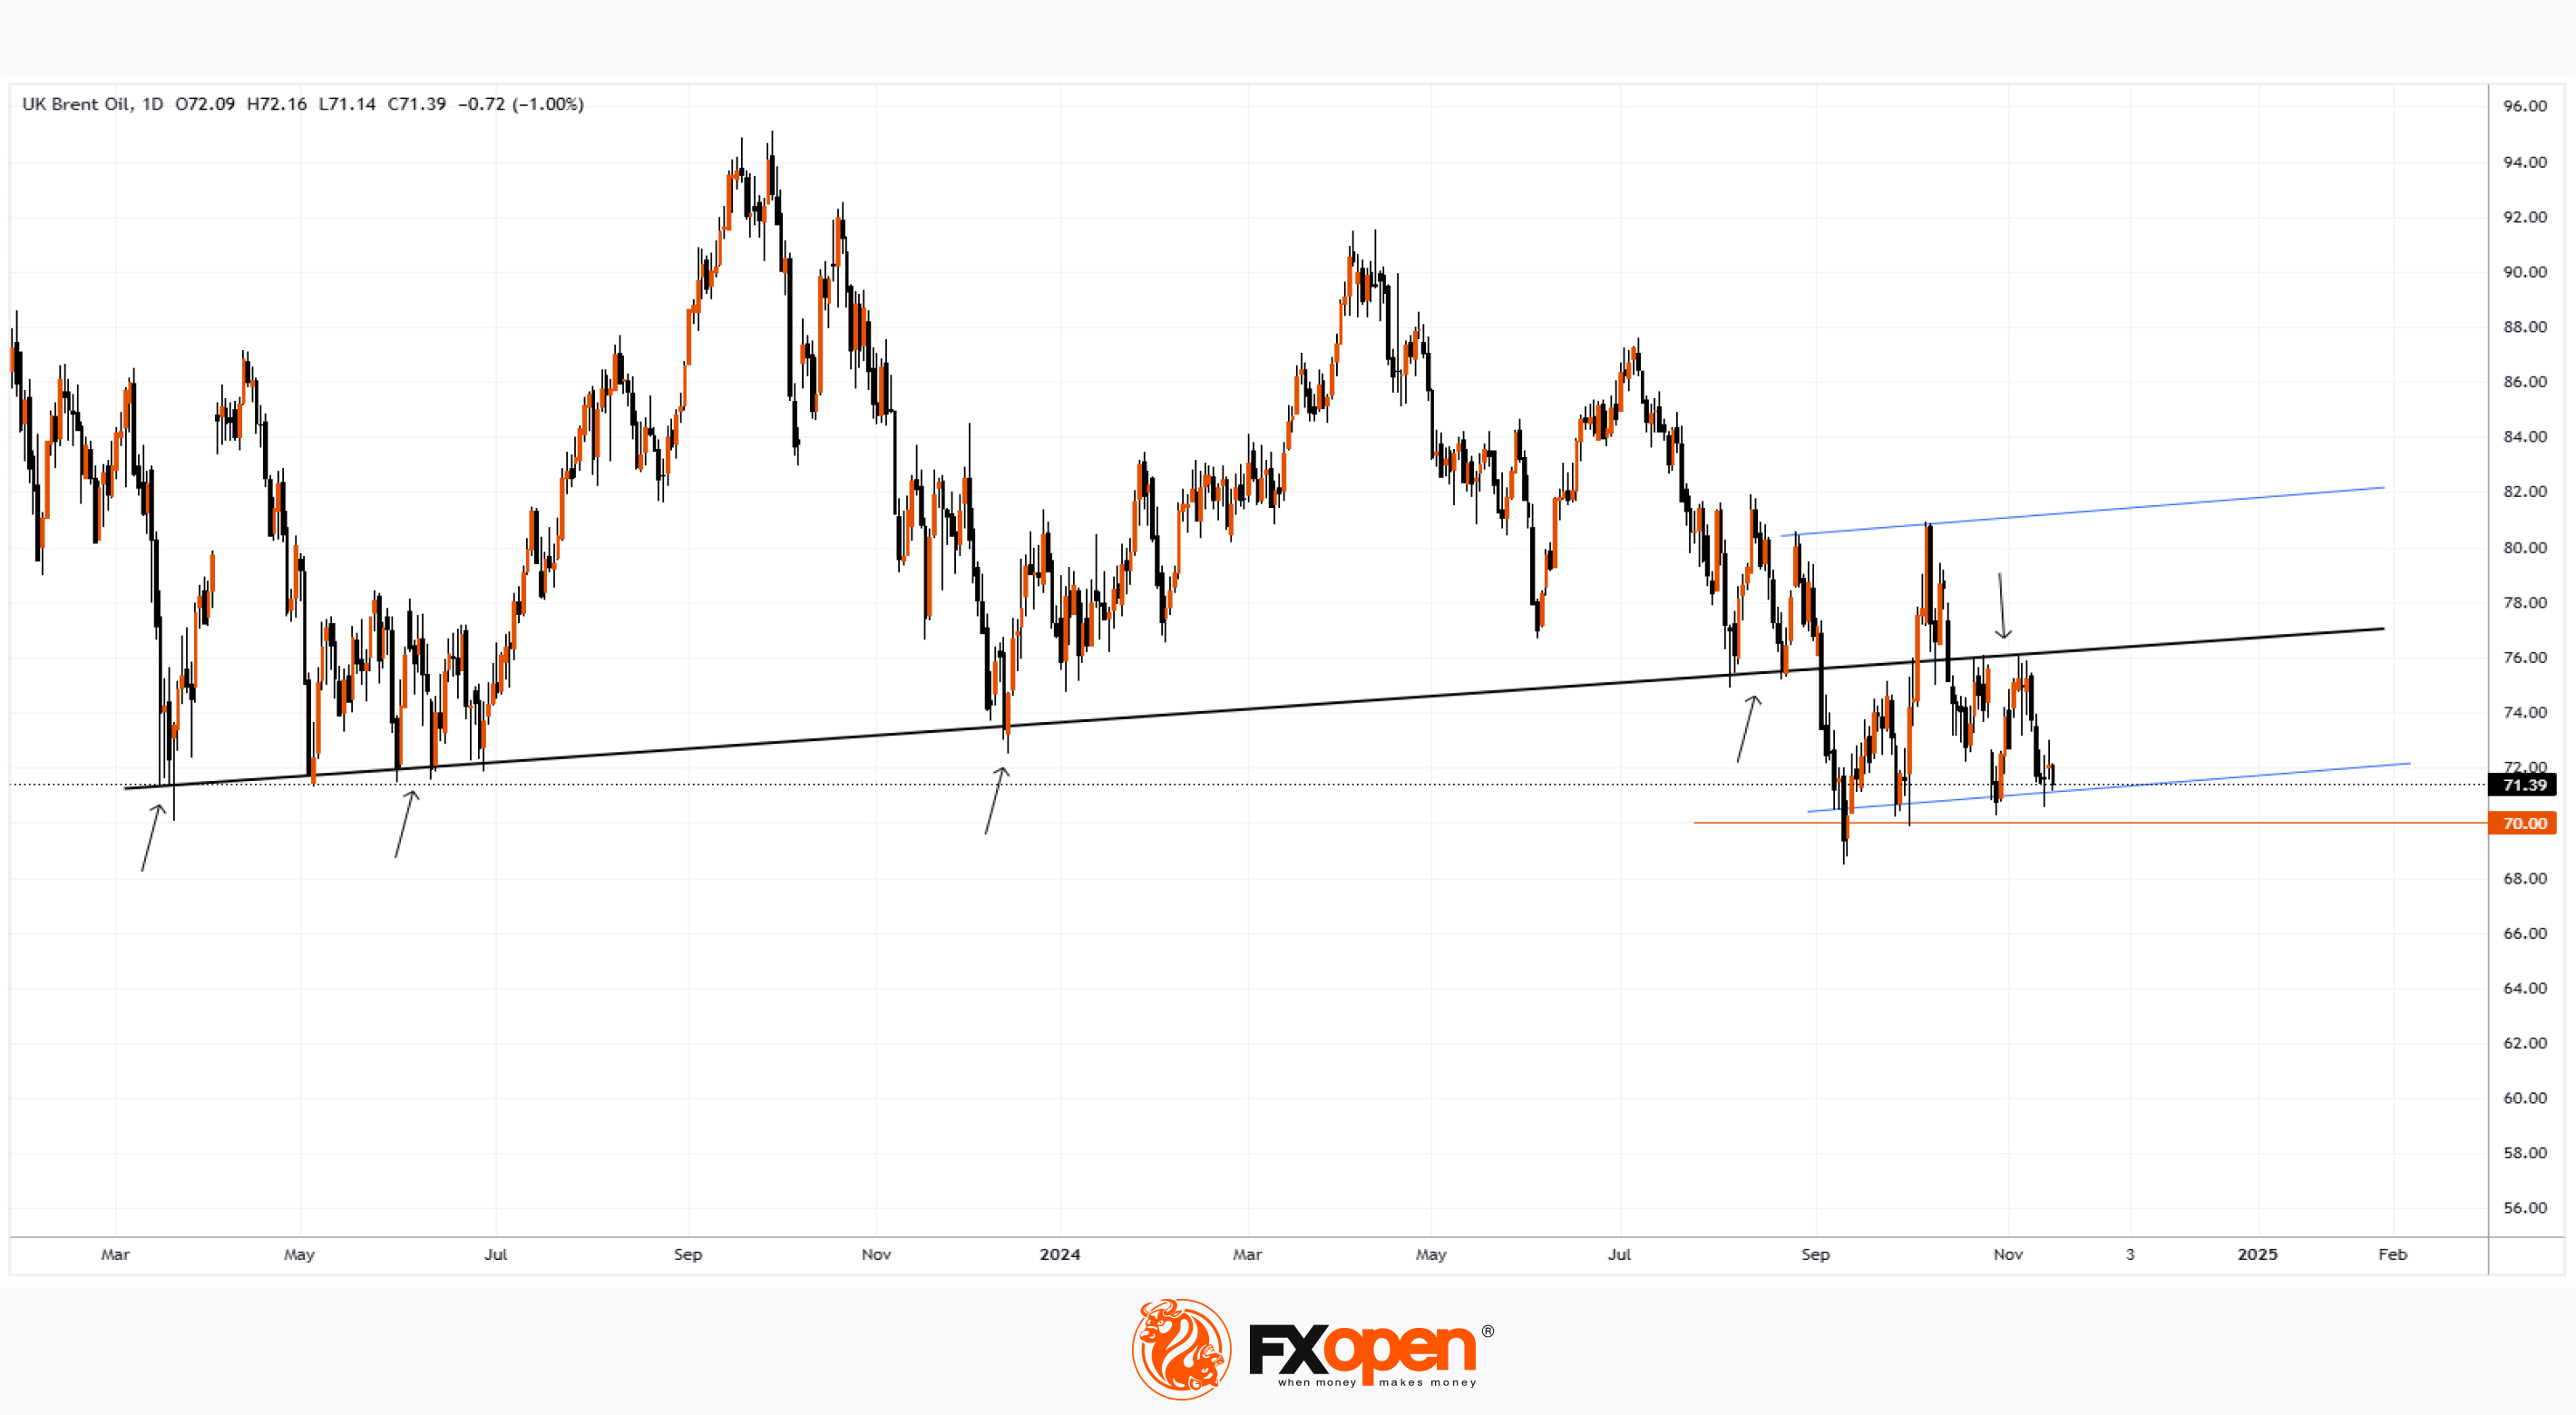
The XBR/USD chart reveals that Brent crude oil is trading near its lowest levels of the year.
Several factors are pressuring oil prices:
→ China's uncertain demand outlook: As the world's largest crude oil importer, any signs of weakening demand weigh heavily on the market.
→ A strengthening US dollar: Since Brent is priced in USD, a stronger dollar makes oil more expensive for international buyers, dampening demand.
→ Trump's promises to halt wars, including in the Middle East: This reduces geopolitical risk, which traditionally acts as a bullish factor for oil prices.
From a technical perspective, bears appear to maintain control as a key trendline has shifted from acting as support to resistance (as indicated by the arrows on the chart).
Currently, the price oscillates around this trendline, which serves as the median of a channel marked by blue boundaries:
→ The upper boundary has been tested only once.
→ The lower boundary is under consistent pressure. Bulls, however, have managed to keep the price above the psychological $70.00 level.
How long can demand forces sustain Brent above $70? A fresh bearish breakout below this level could occur, testing whether buyers can prevent the market from extending its downtrend, which has persisted since April 2024.
Trade global index CFDs with zero commission and tight spreads. Open your FXOpen account now or learn more about trading index CFDs with FXOpen.
CFDs are complex instruments and come with a high risk of losing your money.
This article represents the opinion of the Companies operating under the FXOpen brand only. It is not to be construed as an offer, solicitation, or recommendation with respect to products and services provided by the Companies operating under the FXOpen brand, nor is it to be considered financial advice.
Brent Crude Oil Analysis: Bulls Hold the Line at Key Support
The XBR/USD chart reveals that Brent crude oil is trading near its lowest levels of the year.
Several factors are pressuring oil prices:
→ China's uncertain demand outlook: As the world's largest crude oil importer, any signs of weakening demand weigh heavily on the market.
→ A strengthening US dollar: Since Brent is priced in USD, a stronger dollar makes oil more expensive for international buyers, dampening demand.
→ Trump's promises to halt wars, including in the Middle East: This reduces geopolitical risk, which traditionally acts as a bullish factor for oil prices.
From a technical perspective, bears appear to maintain control as a key trendline has shifted from acting as support to resistance (as indicated by the arrows on the chart).
Currently, the price oscillates around this trendline, which serves as the median of a channel marked by blue boundaries:
→ The upper boundary has been tested only once.
→ The lower boundary is under consistent pressure. Bulls, however, have managed to keep the price above the psychological $70.00 level.
How long can demand forces sustain Brent above $70? A fresh bearish breakout below this level could occur, testing whether buyers can prevent the market from extending its downtrend, which has persisted since April 2024.
Trade global index CFDs with zero commission and tight spreads. Open your FXOpen account now or learn more about trading index CFDs with FXOpen.
CFDs are complex instruments and come with a high risk of losing your money.
This article represents the opinion of the Companies operating under the FXOpen brand only. It is not to be construed as an offer, solicitation, or recommendation with respect to products and services provided by the Companies operating under the FXOpen brand, nor is it to be considered financial advice.
👍3
#TradingTips #forexstrategy
5 Popular Momentum Indicators
Momentum indicators are technical analysis tools that help traders gauge the force behind price movements. They can show optimal entry and exit points and provide valuable insight into whether a trend is likely to continue or reverse.
🔎Let’s break down five of the most popular indicators:
▪️The Average Directional Index, or ADX, is used to determine a trend’s strength.
▪️The Commodity Channel Index, or CCI, is a versatile momentum indicator that measures an asset's price deviation from its average price relative to its mean deviation. The indicator can also be used to identify divergences.
▪️The Relative Strength Index, or RSI, is an oscillator that measures the speed and change of price movements. Traders can look for divergence between the RSI and price to identify weakening trends and possible reversals.
▪️The Moving Average Convergence Divergence, or MACD, is a highly regarded trend-following momentum indicator. Traders use crossovers between the MACD and signal lines as potential entry and exit signals.
▪️The Momentum indicator measures the rate of change in an asset's price over a specific period. The Momentum is especially useful for identifying divergences.
Now that you have a comprehensive overview of momentum indicators and the signals they produce, it’s time to put your knowledge into practice.📈
https://cutt.ly/PeJTRp4Q
To take advantage of price fluctuations in the foreign exchange markets, consider enlisting the services of a reliable broker like FXOpen.
⚠️
This forecast represents FXOpen Companies opinion only, it should not be construed as an offer, invitation or recommendation in respect to FXOpen Companies products and services or as financial advice.
5 Popular Momentum Indicators
Momentum indicators are technical analysis tools that help traders gauge the force behind price movements. They can show optimal entry and exit points and provide valuable insight into whether a trend is likely to continue or reverse.
🔎Let’s break down five of the most popular indicators:
▪️The Average Directional Index, or ADX, is used to determine a trend’s strength.
▪️The Commodity Channel Index, or CCI, is a versatile momentum indicator that measures an asset's price deviation from its average price relative to its mean deviation. The indicator can also be used to identify divergences.
▪️The Relative Strength Index, or RSI, is an oscillator that measures the speed and change of price movements. Traders can look for divergence between the RSI and price to identify weakening trends and possible reversals.
▪️The Moving Average Convergence Divergence, or MACD, is a highly regarded trend-following momentum indicator. Traders use crossovers between the MACD and signal lines as potential entry and exit signals.
▪️The Momentum indicator measures the rate of change in an asset's price over a specific period. The Momentum is especially useful for identifying divergences.
Now that you have a comprehensive overview of momentum indicators and the signals they produce, it’s time to put your knowledge into practice.📈
https://cutt.ly/PeJTRp4Q
To take advantage of price fluctuations in the foreign exchange markets, consider enlisting the services of a reliable broker like FXOpen.
⚠️
This forecast represents FXOpen Companies opinion only, it should not be construed as an offer, invitation or recommendation in respect to FXOpen Companies products and services or as financial advice.
YouTube
5 Popular Momentum Indicators #indicatorstrading #adx #rsi #macd #cci
Momentum indicators are technical analysis tools that help traders gauge the force behind price movements. They can show optimal entry and exit points and provide valuable insight into whether a trend is likely to continue or reverse.
00:15 Let’s look at…
00:15 Let’s look at…
👍2
#stockmarket #stocktrading #MarketUpdates
Walt Disney Company (DIS) Shares Surge Over 11%
On 14 November, Walt Disney Company (DIS) released an investor report that exceeded analysts' expectations:
→ Earnings per share: Actual = $1.14; Expected = $1.10; Year-on-year growth = +39%.
→ Revenue: Actual = $22.57 billion; Expected = $22.42 billion.
The stock market responded positively, with DIS shares rising:
→ On 13 November, prior to the report's release, the stock closed at $102.56.
→ By the end of the week, DIS closed at $114.94, a gain of more than 11% post-announcement.
The company also reported an increase in its streaming subscribers, reaching 200 million. Investors view this growth as a positive signal for Walt Disney Company, similar to the optimism shown towards Netflix (NFLX), which we discussed on 15 November.
Will DIS shares continue to rise?
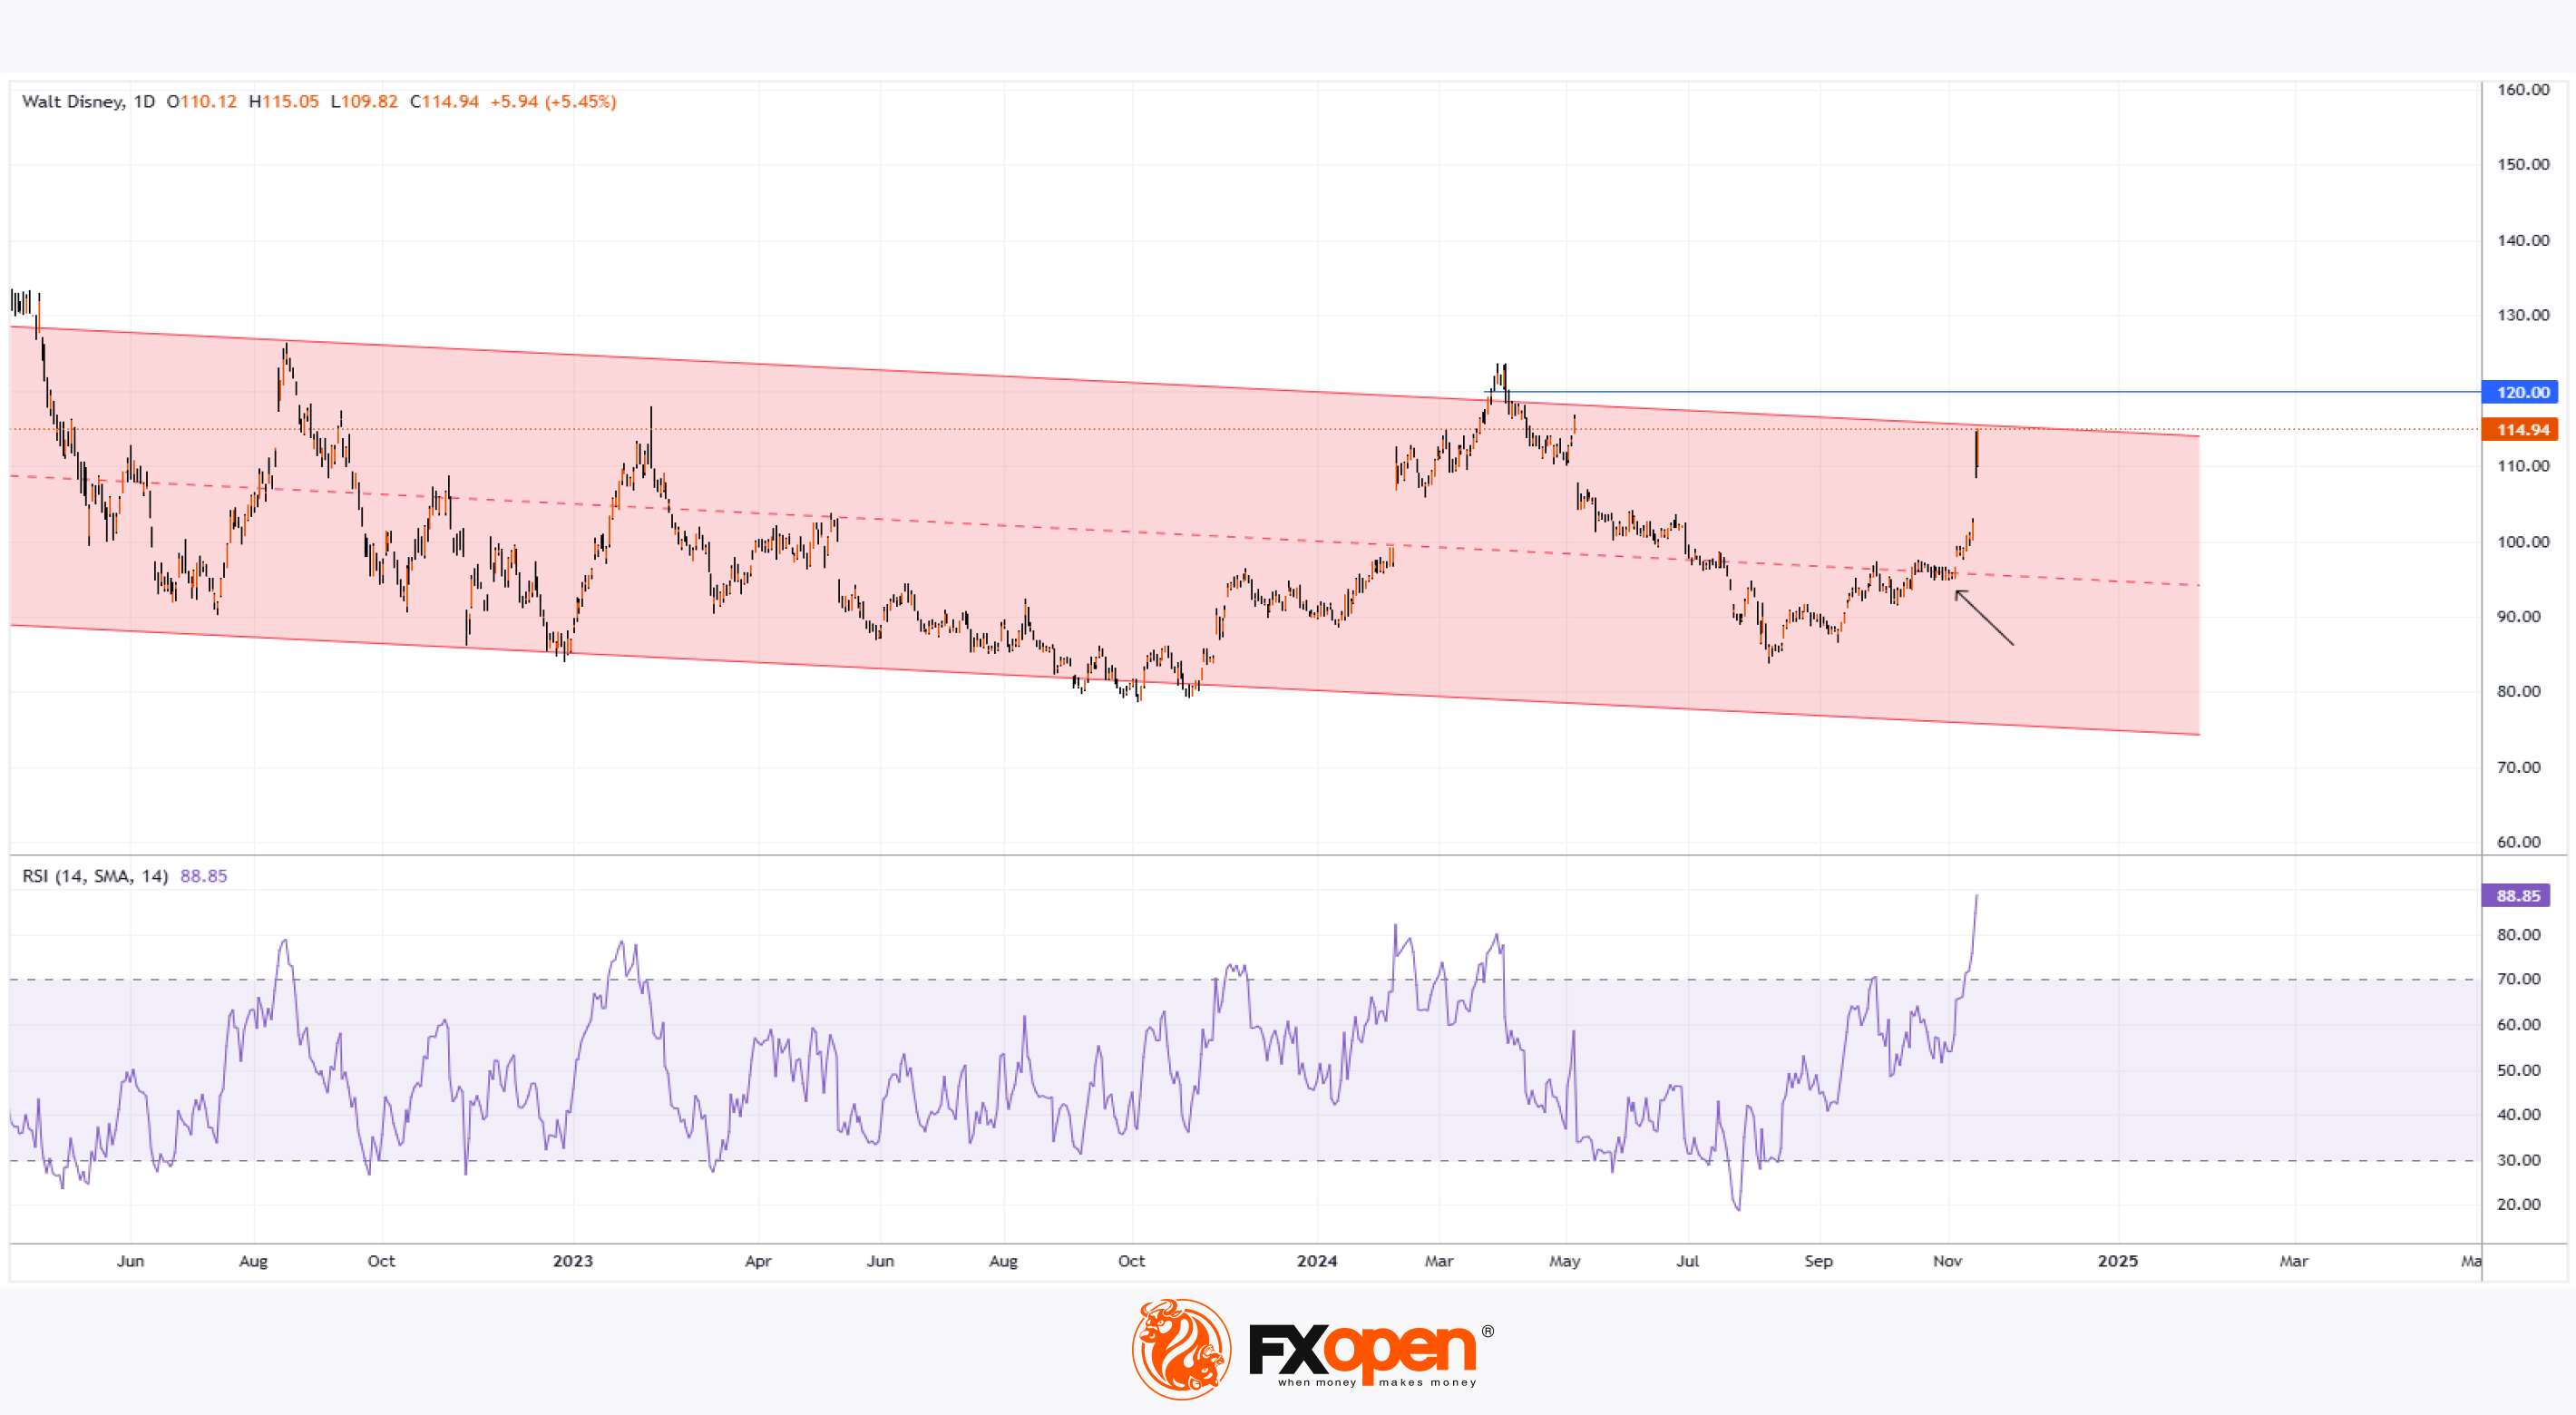
Technical analysis of DIS's daily chart indicates that in 2024, price movements have formed a descending channel (shown in red):
→ In late October, market volatility was low, consistent with price stabilisation near the channel's median (indicated by the arrow).
→ Following the news of the earnings report, the stock price climbed to the upper boundary of the channel.
→ The RSI indicator has reached its highest level in years.
Given this, it is plausible to suggest that DIS shares are in a position vulnerable to a correction. Should a correction occur and remain minor (e.g., without significantly dipping into the bullish gap formed last week), it could signal sufficient confidence among bulls to attempt a successful breakout above the channel’s upper boundary, potentially reaching key resistance near the psychological $120 level.
According to TipRanks:
→ 15 out of 30 analysts recommend buying DIS shares.
→ The average 12-month price target for DIS is $122.
Trade global index CFDs with zero commission and tight spreads. Open your FXOpen account now or learn more about trading index CFDs with FXOpen.
CFDs are complex instruments and come with a high risk of losing your money.
This article represents the opinion of the Companies operating under the FXOpen brand only. It is not to be construed as an offer, solicitation, or recommendation with respect to products and services provided by the Companies operating under the FXOpen brand, nor is it to be considered financial advice.
Walt Disney Company (DIS) Shares Surge Over 11%
On 14 November, Walt Disney Company (DIS) released an investor report that exceeded analysts' expectations:
→ Earnings per share: Actual = $1.14; Expected = $1.10; Year-on-year growth = +39%.
→ Revenue: Actual = $22.57 billion; Expected = $22.42 billion.
The stock market responded positively, with DIS shares rising:
→ On 13 November, prior to the report's release, the stock closed at $102.56.
→ By the end of the week, DIS closed at $114.94, a gain of more than 11% post-announcement.
The company also reported an increase in its streaming subscribers, reaching 200 million. Investors view this growth as a positive signal for Walt Disney Company, similar to the optimism shown towards Netflix (NFLX), which we discussed on 15 November.
Will DIS shares continue to rise?
Technical analysis of DIS's daily chart indicates that in 2024, price movements have formed a descending channel (shown in red):
→ In late October, market volatility was low, consistent with price stabilisation near the channel's median (indicated by the arrow).
→ Following the news of the earnings report, the stock price climbed to the upper boundary of the channel.
→ The RSI indicator has reached its highest level in years.
Given this, it is plausible to suggest that DIS shares are in a position vulnerable to a correction. Should a correction occur and remain minor (e.g., without significantly dipping into the bullish gap formed last week), it could signal sufficient confidence among bulls to attempt a successful breakout above the channel’s upper boundary, potentially reaching key resistance near the psychological $120 level.
According to TipRanks:
→ 15 out of 30 analysts recommend buying DIS shares.
→ The average 12-month price target for DIS is $122.
Trade global index CFDs with zero commission and tight spreads. Open your FXOpen account now or learn more about trading index CFDs with FXOpen.
CFDs are complex instruments and come with a high risk of losing your money.
This article represents the opinion of the Companies operating under the FXOpen brand only. It is not to be construed as an offer, solicitation, or recommendation with respect to products and services provided by the Companies operating under the FXOpen brand, nor is it to be considered financial advice.
👍3
#marketanalysis #MarketNews #gasprices
Natural Gas Prices Reach Yearly Highs
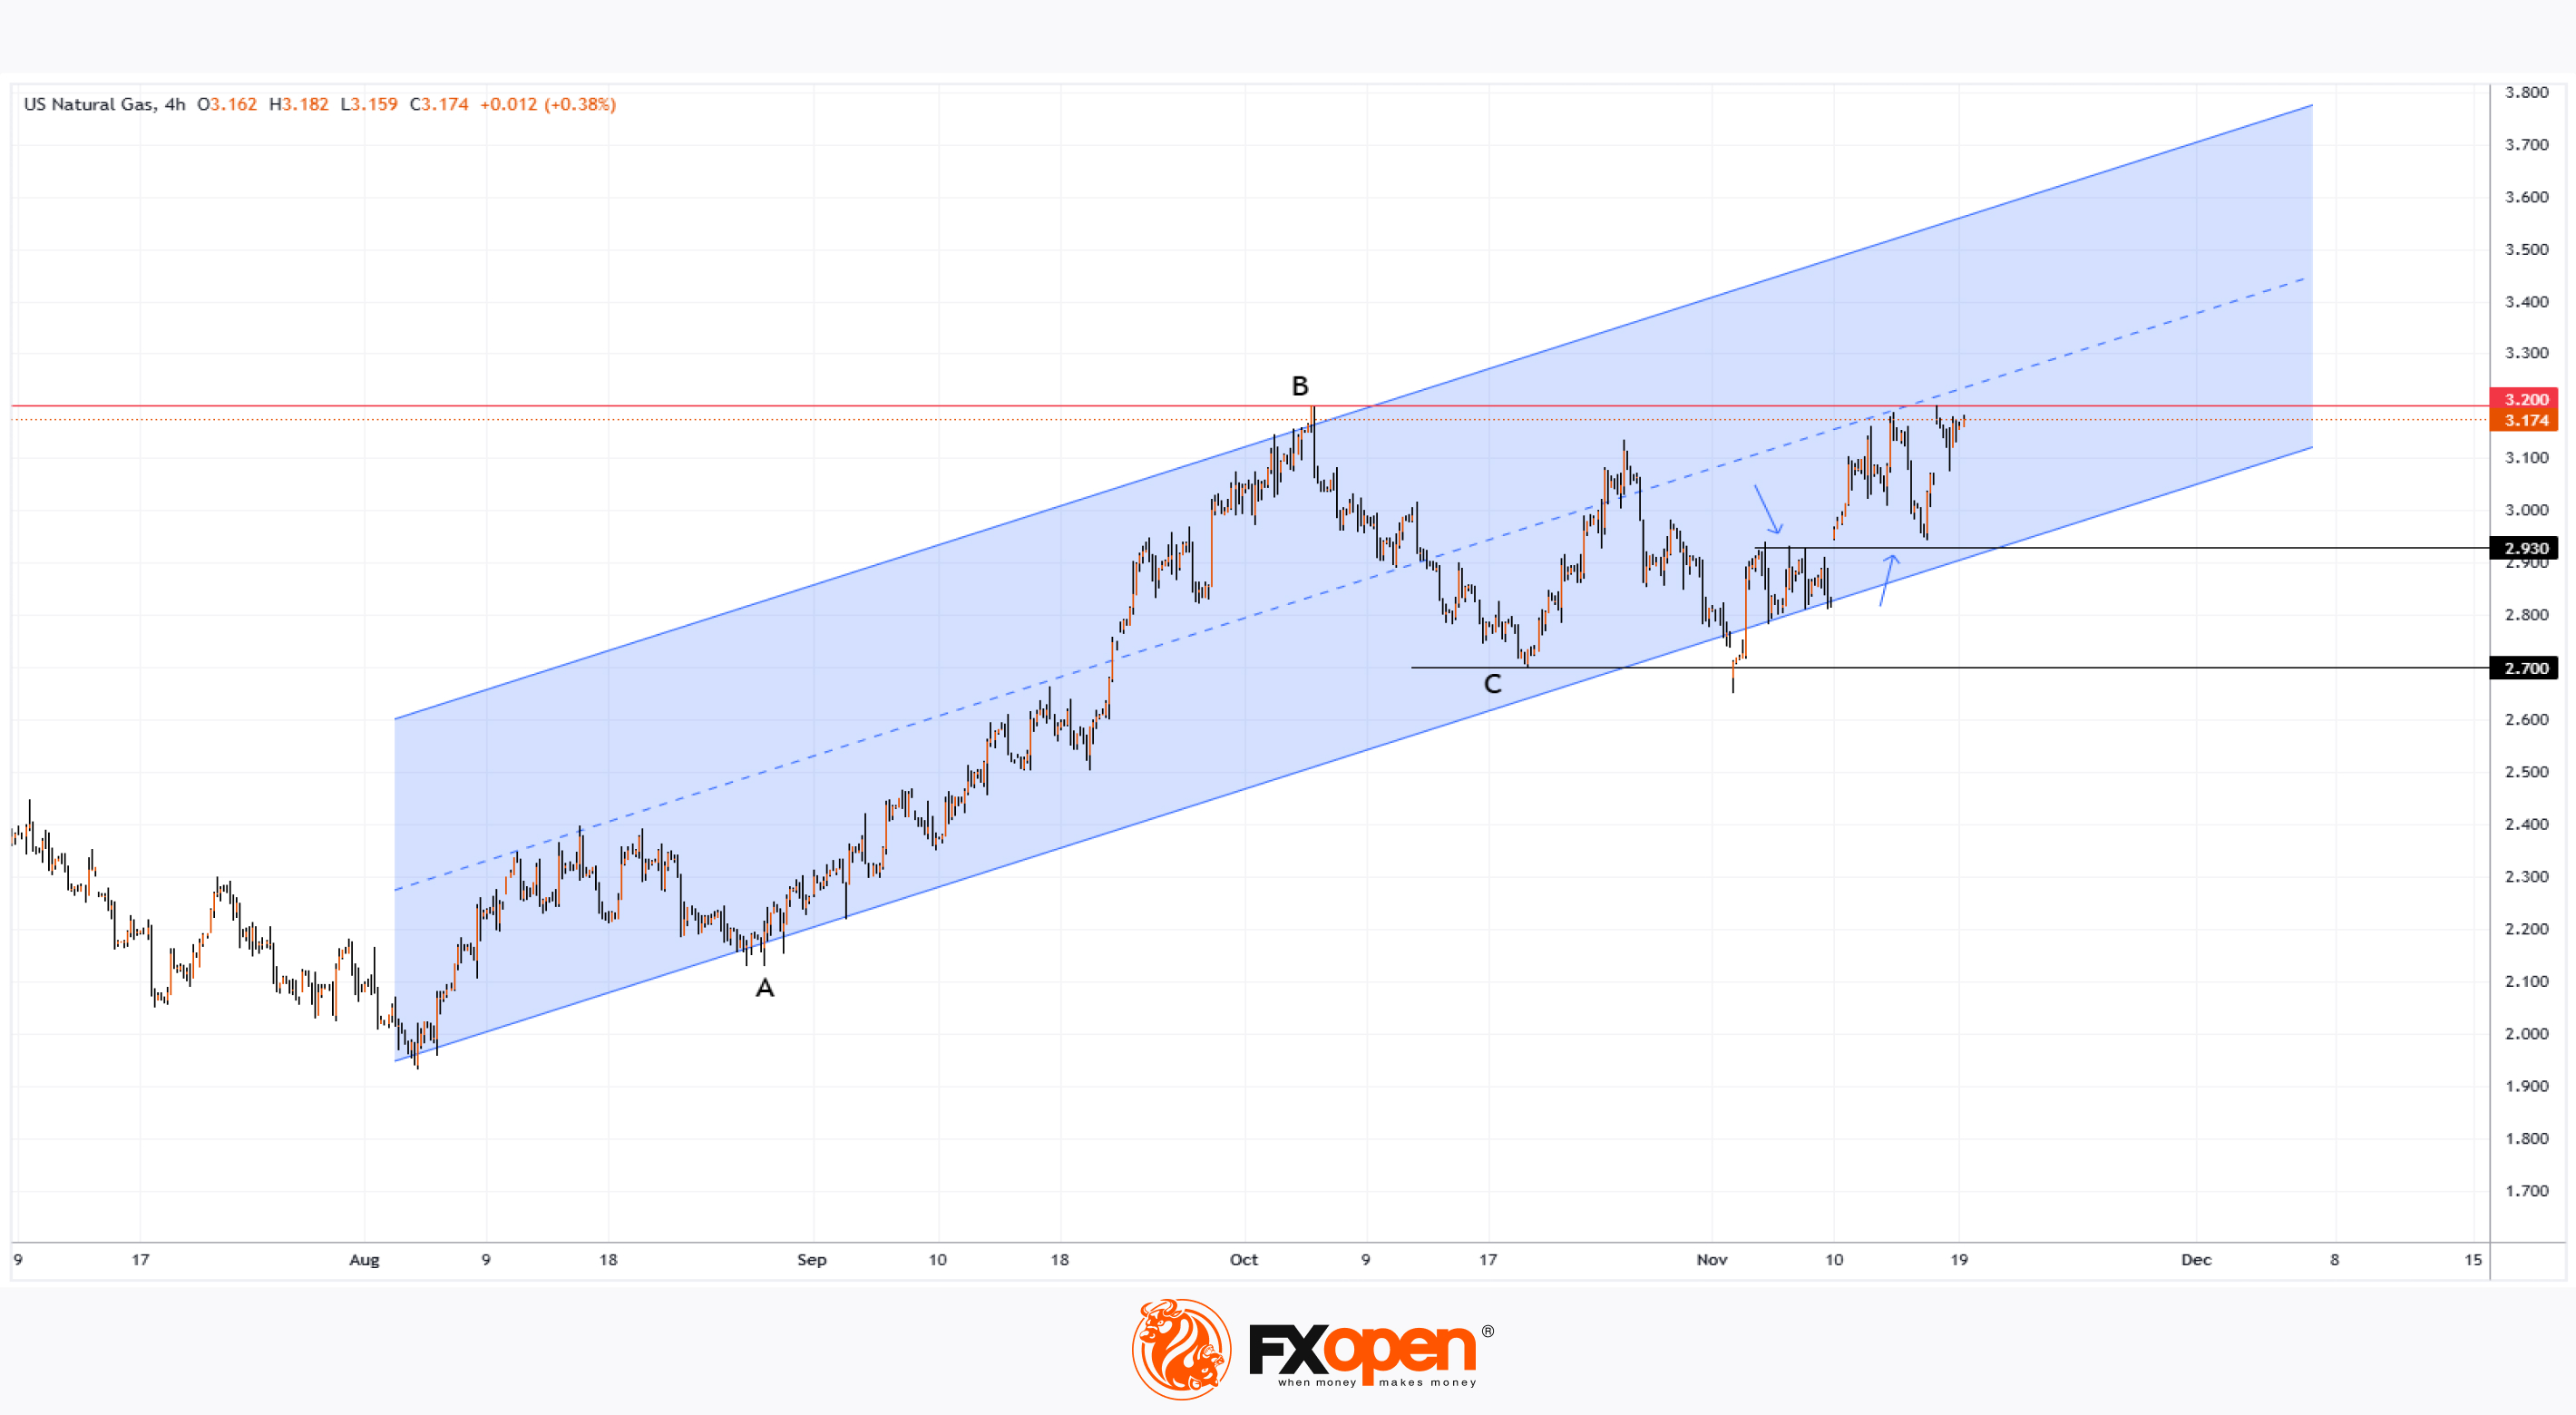
According to the XNG/USD chart, natural gas prices have risen by approximately 13% since early November and this week hit a new 2024 high.
Factors Driving Bullish Sentiment (as reported by Reuters):
→ A sharp increase in global gas prices.
→ Forecasts of colder weather and higher heating demand in the United States.
Will Natural Gas Prices Continue to Rise?
From a fundamental perspective, the Energy Information Administration (EIA) forecast on 13 November predicts natural gas prices could peak in January 2025.
From a technical analysis standpoint of the XNG/USD chart, the $3.200 level is a critical resistance, having previously triggered price reversals in October (B) and June (not shown on the chart). Price movements since early August have formed a trend channel (shown in blue).
Bullish Arguments:
→ The $2.7 level serves as support, aligned with Fibonacci retracement levels, as the B→C pullback is at 50% of the A→B rise.
→ The $2.93 level has flipped from resistance to support (indicated by arrows).
Bearish Arguments:
→ Prices reversed sharply downward earlier this week from the $3.200 level, showing seller activity.
→ Reports indicate utilities are injecting gas into storage at faster-than-expected rates, suggesting stockpiles could meet increased cold-weather demand.
Bulls may attempt to keep prices within the blue channel and make further attempts to breach the $3.200 level. However, XNG/USD signals show that bears are ready to push back.
Start trading commodities with tight spreads. Open your trading account now or learn more about trading commodity CFDs with FXOpen.
CFDs are complex instruments and come with a high risk of losing your money.
This article represents the opinion of the Companies operating under the FXOpen brand only. It is not to be construed as an offer, solicitation, or recommendation with respect to products and services provided by the Companies operating under the FXOpen brand, nor is it to be considered financial advice.
Natural Gas Prices Reach Yearly Highs
According to the XNG/USD chart, natural gas prices have risen by approximately 13% since early November and this week hit a new 2024 high.
Factors Driving Bullish Sentiment (as reported by Reuters):
→ A sharp increase in global gas prices.
→ Forecasts of colder weather and higher heating demand in the United States.
Will Natural Gas Prices Continue to Rise?
From a fundamental perspective, the Energy Information Administration (EIA) forecast on 13 November predicts natural gas prices could peak in January 2025.
From a technical analysis standpoint of the XNG/USD chart, the $3.200 level is a critical resistance, having previously triggered price reversals in October (B) and June (not shown on the chart). Price movements since early August have formed a trend channel (shown in blue).
Bullish Arguments:
→ The $2.7 level serves as support, aligned with Fibonacci retracement levels, as the B→C pullback is at 50% of the A→B rise.
→ The $2.93 level has flipped from resistance to support (indicated by arrows).
Bearish Arguments:
→ Prices reversed sharply downward earlier this week from the $3.200 level, showing seller activity.
→ Reports indicate utilities are injecting gas into storage at faster-than-expected rates, suggesting stockpiles could meet increased cold-weather demand.
Bulls may attempt to keep prices within the blue channel and make further attempts to breach the $3.200 level. However, XNG/USD signals show that bears are ready to push back.
Start trading commodities with tight spreads. Open your trading account now or learn more about trading commodity CFDs with FXOpen.
CFDs are complex instruments and come with a high risk of losing your money.
This article represents the opinion of the Companies operating under the FXOpen brand only. It is not to be construed as an offer, solicitation, or recommendation with respect to products and services provided by the Companies operating under the FXOpen brand, nor is it to be considered financial advice.
👍2
#META #stockmarket #stocktrading #MarketNews
Meta Platforms (META) Shares Dip Below $550
On 7 October, we analysed the Meta Platforms (META) price chart and highlighted:
→ The formation of a long-term upward channel (marked in blue).
→ The key drivers supporting bullish sentiment.
We also emphasised the psychological significance of the $600 level.
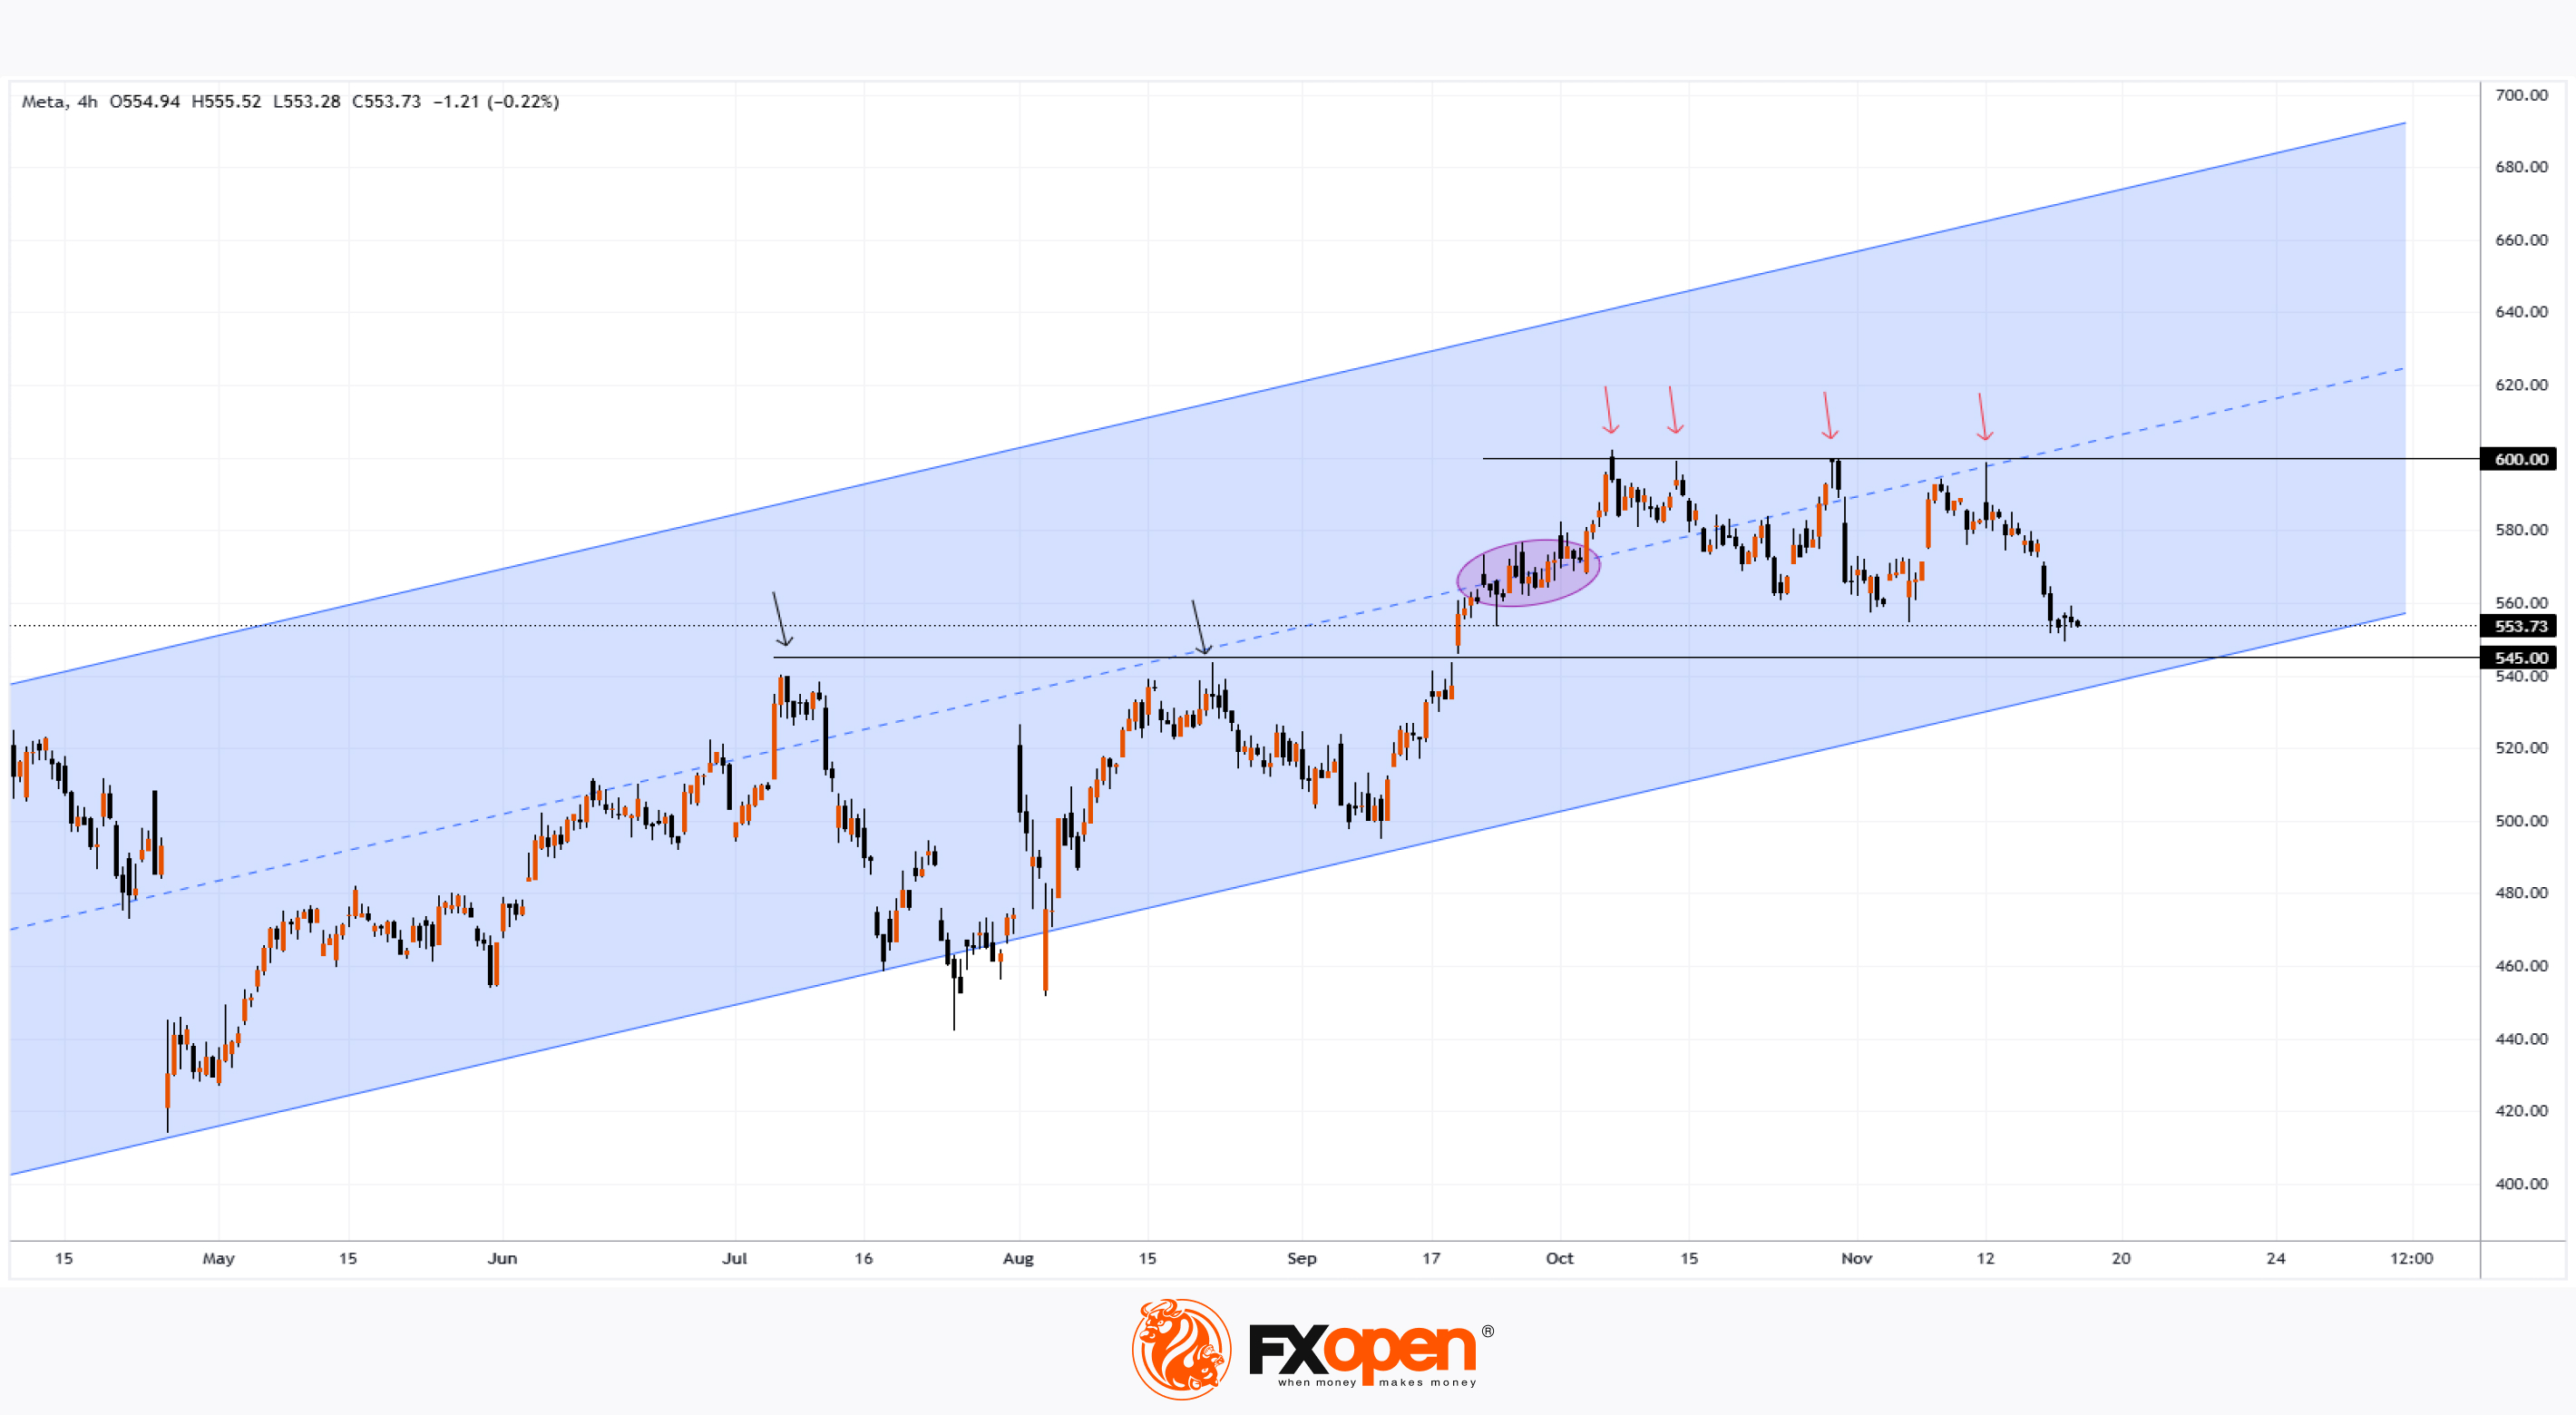
Since then, the price has approached this level four times, only to be met with resistance each time (indicated by red arrows).
Yesterday, for the first time since mid-September, META’s price fell below $550, suggesting that the stock underperformed the broader market during October and November.
What’s Next?
Technical analysis of the META price chart reveals that the stock is trading within a range defined by:
→ Resistance at $600, which has consistently proven robust.
→ Support at $545, a level that previously acted as resistance (marked by arrows).
While the channel median initially acted as a “magnet” for the price (highlighted with an oval), November patterns suggest the median now "repels" the price downward, a bearish indicator.
Bullish momentum might regain strength if the price approaches the lower boundary of the blue channel. However, the sustainability of demand at these levels and whether it can drive a successful breakout above $600 remains uncertain.
Analysts remain optimistic. According to a TipRanks survey:
→ 40 out of 44 analysts recommend buying META shares.
→ The average 12-month price target for META is $662.
Trade global index CFDs with zero commission and tight spreads. Open your FXOpen account now or learn more about trading index CFDs with FXOpen.
CFDs are complex instruments and come with a high risk of losing your money.
This article represents the opinion of the Companies operating under the FXOpen brand only. It is not to be construed as an offer, solicitation, or recommendation with respect to products and services provided by the Companies operating under the FXOpen brand, nor is it to be considered financial advice.
Meta Platforms (META) Shares Dip Below $550
On 7 October, we analysed the Meta Platforms (META) price chart and highlighted:
→ The formation of a long-term upward channel (marked in blue).
→ The key drivers supporting bullish sentiment.
We also emphasised the psychological significance of the $600 level.
Since then, the price has approached this level four times, only to be met with resistance each time (indicated by red arrows).
Yesterday, for the first time since mid-September, META’s price fell below $550, suggesting that the stock underperformed the broader market during October and November.
What’s Next?
Technical analysis of the META price chart reveals that the stock is trading within a range defined by:
→ Resistance at $600, which has consistently proven robust.
→ Support at $545, a level that previously acted as resistance (marked by arrows).
While the channel median initially acted as a “magnet” for the price (highlighted with an oval), November patterns suggest the median now "repels" the price downward, a bearish indicator.
Bullish momentum might regain strength if the price approaches the lower boundary of the blue channel. However, the sustainability of demand at these levels and whether it can drive a successful breakout above $600 remains uncertain.
Analysts remain optimistic. According to a TipRanks survey:
→ 40 out of 44 analysts recommend buying META shares.
→ The average 12-month price target for META is $662.
Trade global index CFDs with zero commission and tight spreads. Open your FXOpen account now or learn more about trading index CFDs with FXOpen.
CFDs are complex instruments and come with a high risk of losing your money.
This article represents the opinion of the Companies operating under the FXOpen brand only. It is not to be construed as an offer, solicitation, or recommendation with respect to products and services provided by the Companies operating under the FXOpen brand, nor is it to be considered financial advice.
👍3
#marketanalysis #MarketNews #stockmarket
Shopify (SHOP) Shares Retreat After Sharp Surge
On 12 November, Shopify released its Q3 earnings report, which exceeded analysts' expectations:
→ Earnings per share: actual = $0.36, forecast = $0.27;
→ Gross revenue: actual = $2.23 billion, forecast = $2.15 billion.
The company also provided strong earnings guidance for Q4. According to Zacks analysts, Q4 earnings per share could reach $0.39.
As a result, SHOP shares surged by more than 20% following the report's release. But is it the right time to buy now?
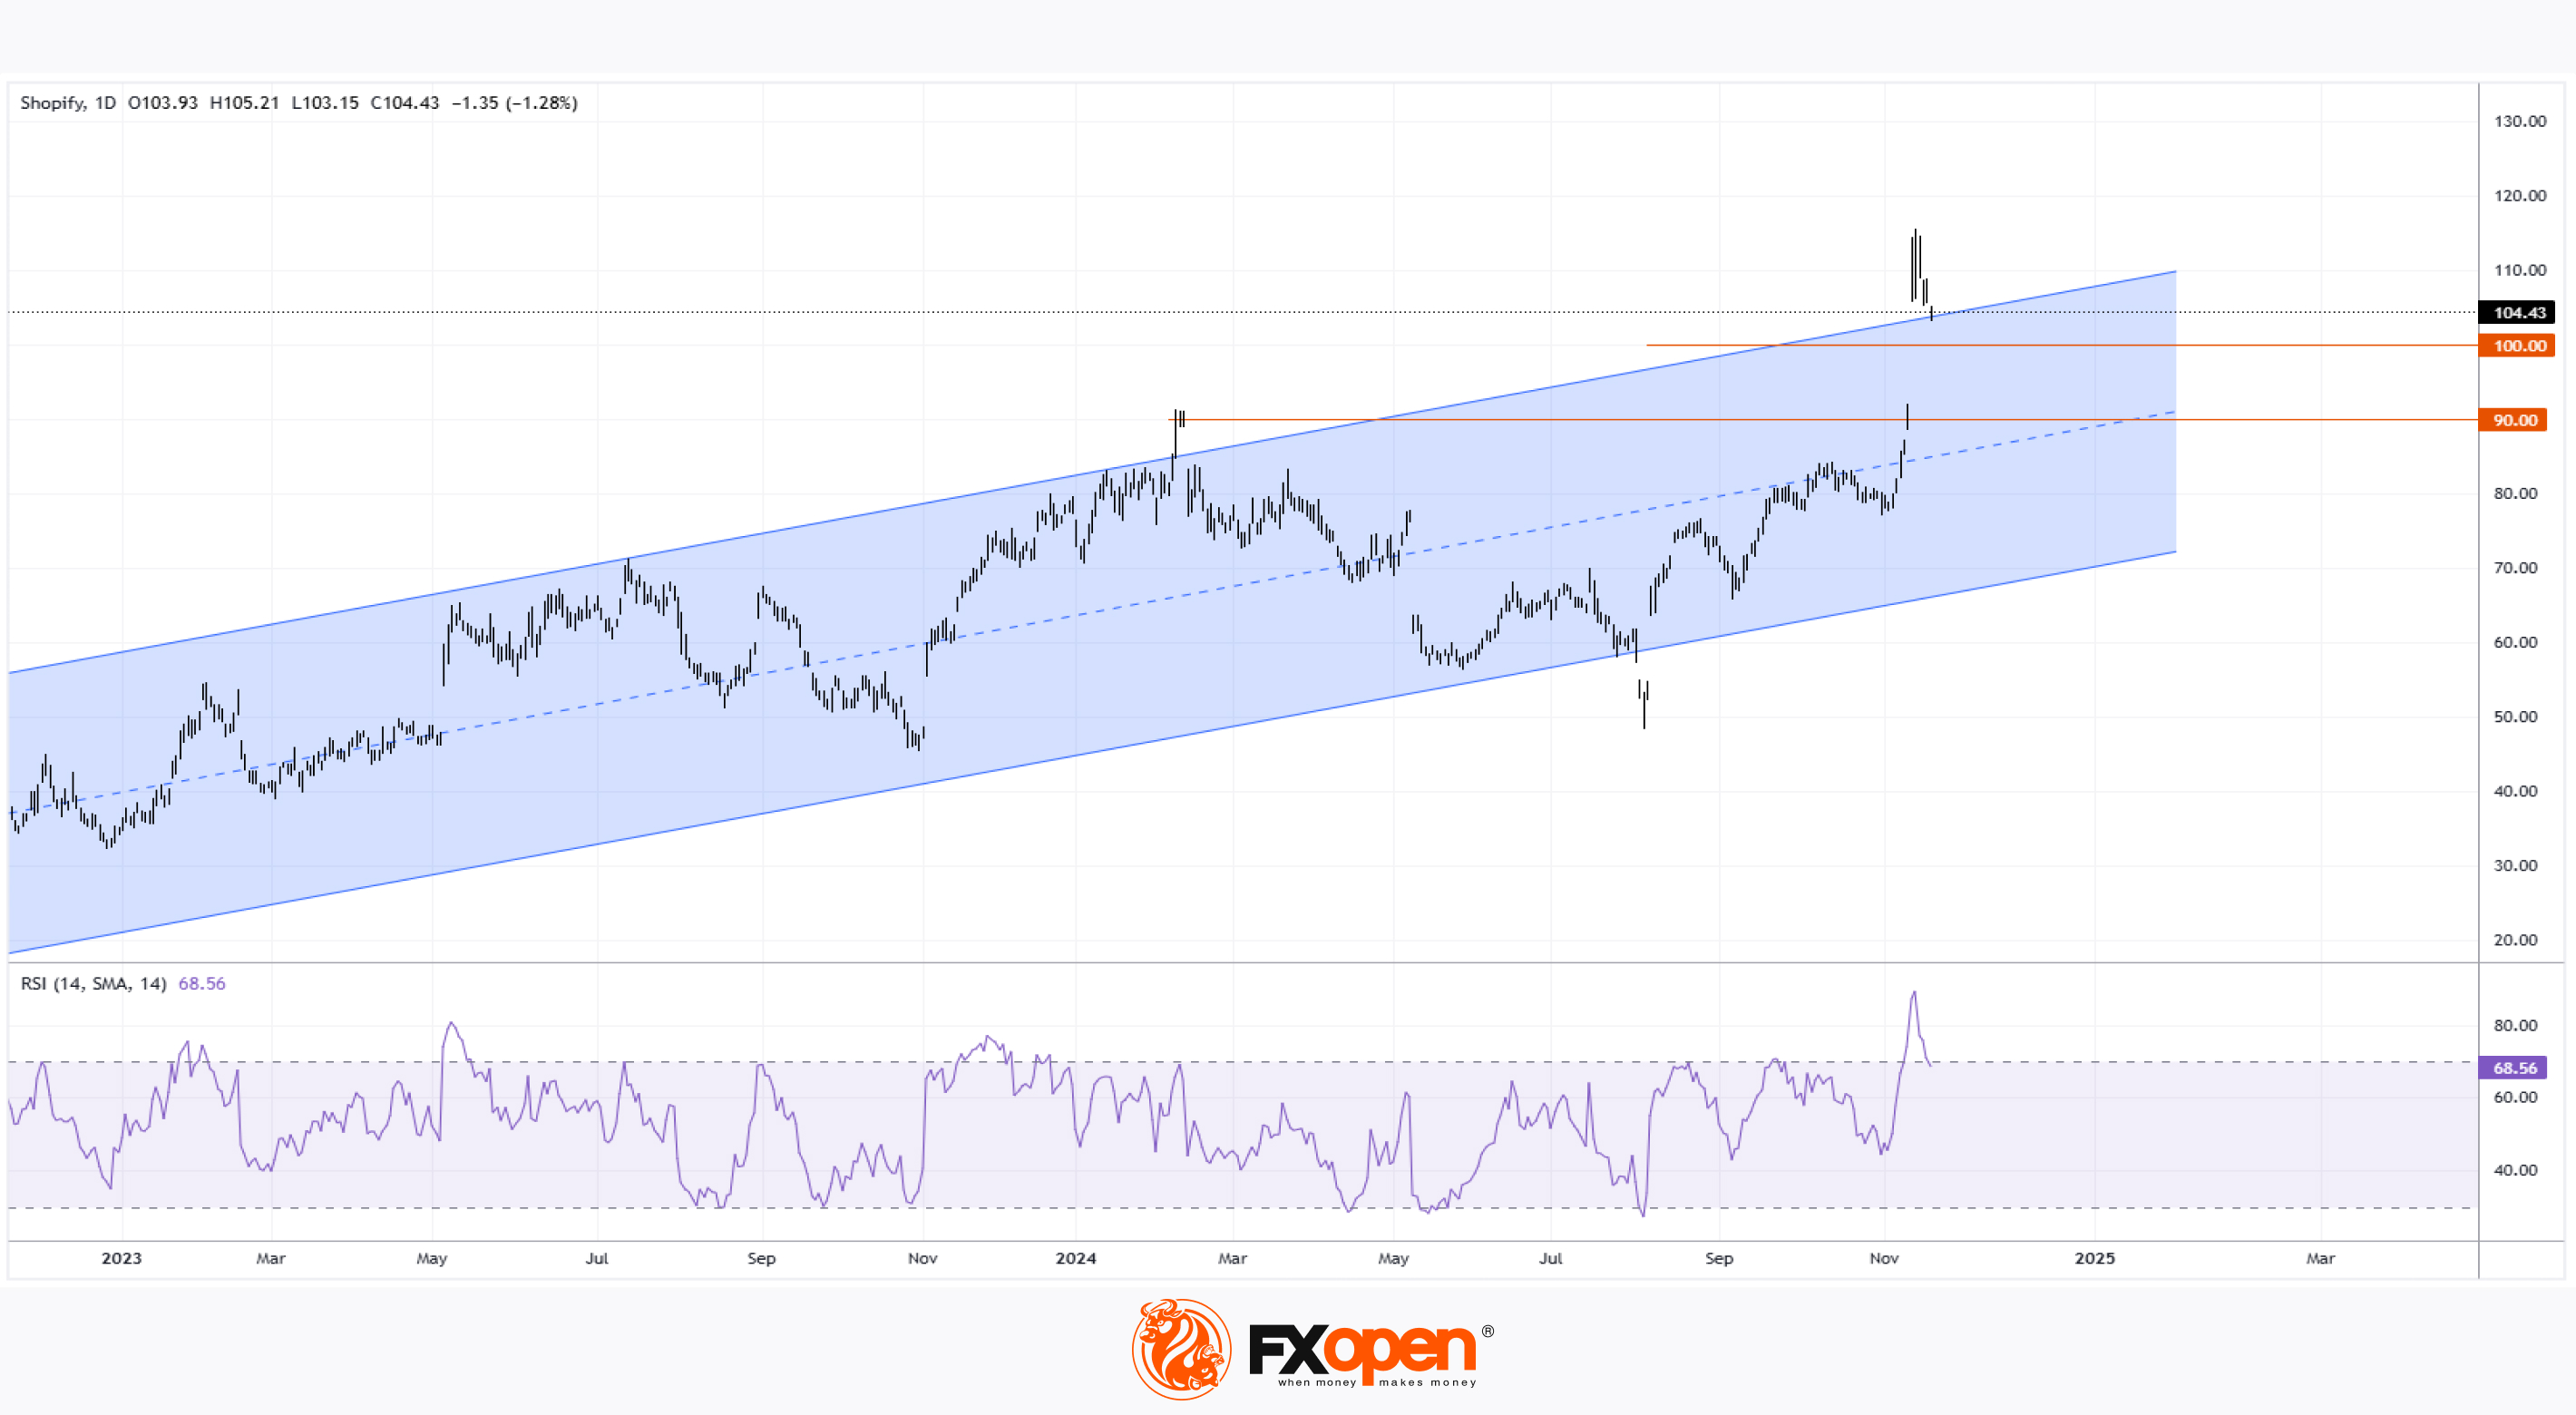
A review of SHOP’s price chart suggests that purchasing the stock under current conditions might be premature:
→ The price is above the upper boundary of the ascending channel (marked in blue), whereas it has typically remained within this channel since late 2022;
→ The RSI indicator signals extreme overbought conditions.
Recent price action supports the idea that the market's initial reaction may have been overly emotional, leaving the stock vulnerable to a pullback. For the first time since the report, SHOP shares closed below $105 yesterday.
While strong fundamentals underpin Shopify's long-term appeal, in the short term, the stock price could decline towards:
→ The psychological level of $100 per share;
→ Former resistance at $90;
→ The median of the ascending channel.
According to TipRanks:
→ 11 out of 18 analysts recommend buying SHOP stock;
→ The average price target for SHOP is $85 over the next 12 months.
Trade global index CFDs with zero commission and tight spreads. Open your FXOpen account now or learn more about trading index CFDs with FXOpen.
CFDs are complex instruments and come with a high risk of losing your money.
This article represents the opinion of the Companies operating under the FXOpen brand only. It is not to be construed as an offer, solicitation, or recommendation with respect to products and services provided by the Companies operating under the FXOpen brand, nor is it to be considered financial advice.
Shopify (SHOP) Shares Retreat After Sharp Surge
On 12 November, Shopify released its Q3 earnings report, which exceeded analysts' expectations:
→ Earnings per share: actual = $0.36, forecast = $0.27;
→ Gross revenue: actual = $2.23 billion, forecast = $2.15 billion.
The company also provided strong earnings guidance for Q4. According to Zacks analysts, Q4 earnings per share could reach $0.39.
As a result, SHOP shares surged by more than 20% following the report's release. But is it the right time to buy now?
A review of SHOP’s price chart suggests that purchasing the stock under current conditions might be premature:
→ The price is above the upper boundary of the ascending channel (marked in blue), whereas it has typically remained within this channel since late 2022;
→ The RSI indicator signals extreme overbought conditions.
Recent price action supports the idea that the market's initial reaction may have been overly emotional, leaving the stock vulnerable to a pullback. For the first time since the report, SHOP shares closed below $105 yesterday.
While strong fundamentals underpin Shopify's long-term appeal, in the short term, the stock price could decline towards:
→ The psychological level of $100 per share;
→ Former resistance at $90;
→ The median of the ascending channel.
According to TipRanks:
→ 11 out of 18 analysts recommend buying SHOP stock;
→ The average price target for SHOP is $85 over the next 12 months.
Trade global index CFDs with zero commission and tight spreads. Open your FXOpen account now or learn more about trading index CFDs with FXOpen.
CFDs are complex instruments and come with a high risk of losing your money.
This article represents the opinion of the Companies operating under the FXOpen brand only. It is not to be construed as an offer, solicitation, or recommendation with respect to products and services provided by the Companies operating under the FXOpen brand, nor is it to be considered financial advice.
👍2
#marketanalysis #MarketNews #stockmarket #stocktrading
Morgan Stanley: Trump’s Tariff Plans Could Lower Stock Indices
As reported by CNBC, Morgan Stanley analysts have evaluated the potential impact of tariff plans proposed by Donald Trump during his presidential campaign on the U.S. economy and stock market.
Key initiatives from the president-elect include:
→ Introducing a general tariff of 10% to 20% on all imported goods.
→ Imposing additional tariffs of 60% to 100% on imports from China.
Morgan Stanley’s Chief Global Economist, Seth Carpenter, suggests these measures could:
→ Eliminate the possibility of interest rate cuts in 2025 and constrain economic growth.
→ Threaten a slowdown in U.S. economic growth by 2026.
→ Drive inflation higher.
→ Pressure industries such as automotive, consumer electronics, machinery, construction, and retail. Increased producer costs are likely to be passed on to consumers.
These scenarios imply a negative outlook for the U.S. stock market. Tariffs may reduce investment appeal and raise borrowing costs for companies, potentially dampening market performance.
How Might This Affect Indices Like the Nasdaq 100 (US Tech 100 Mini on FXOpen)?
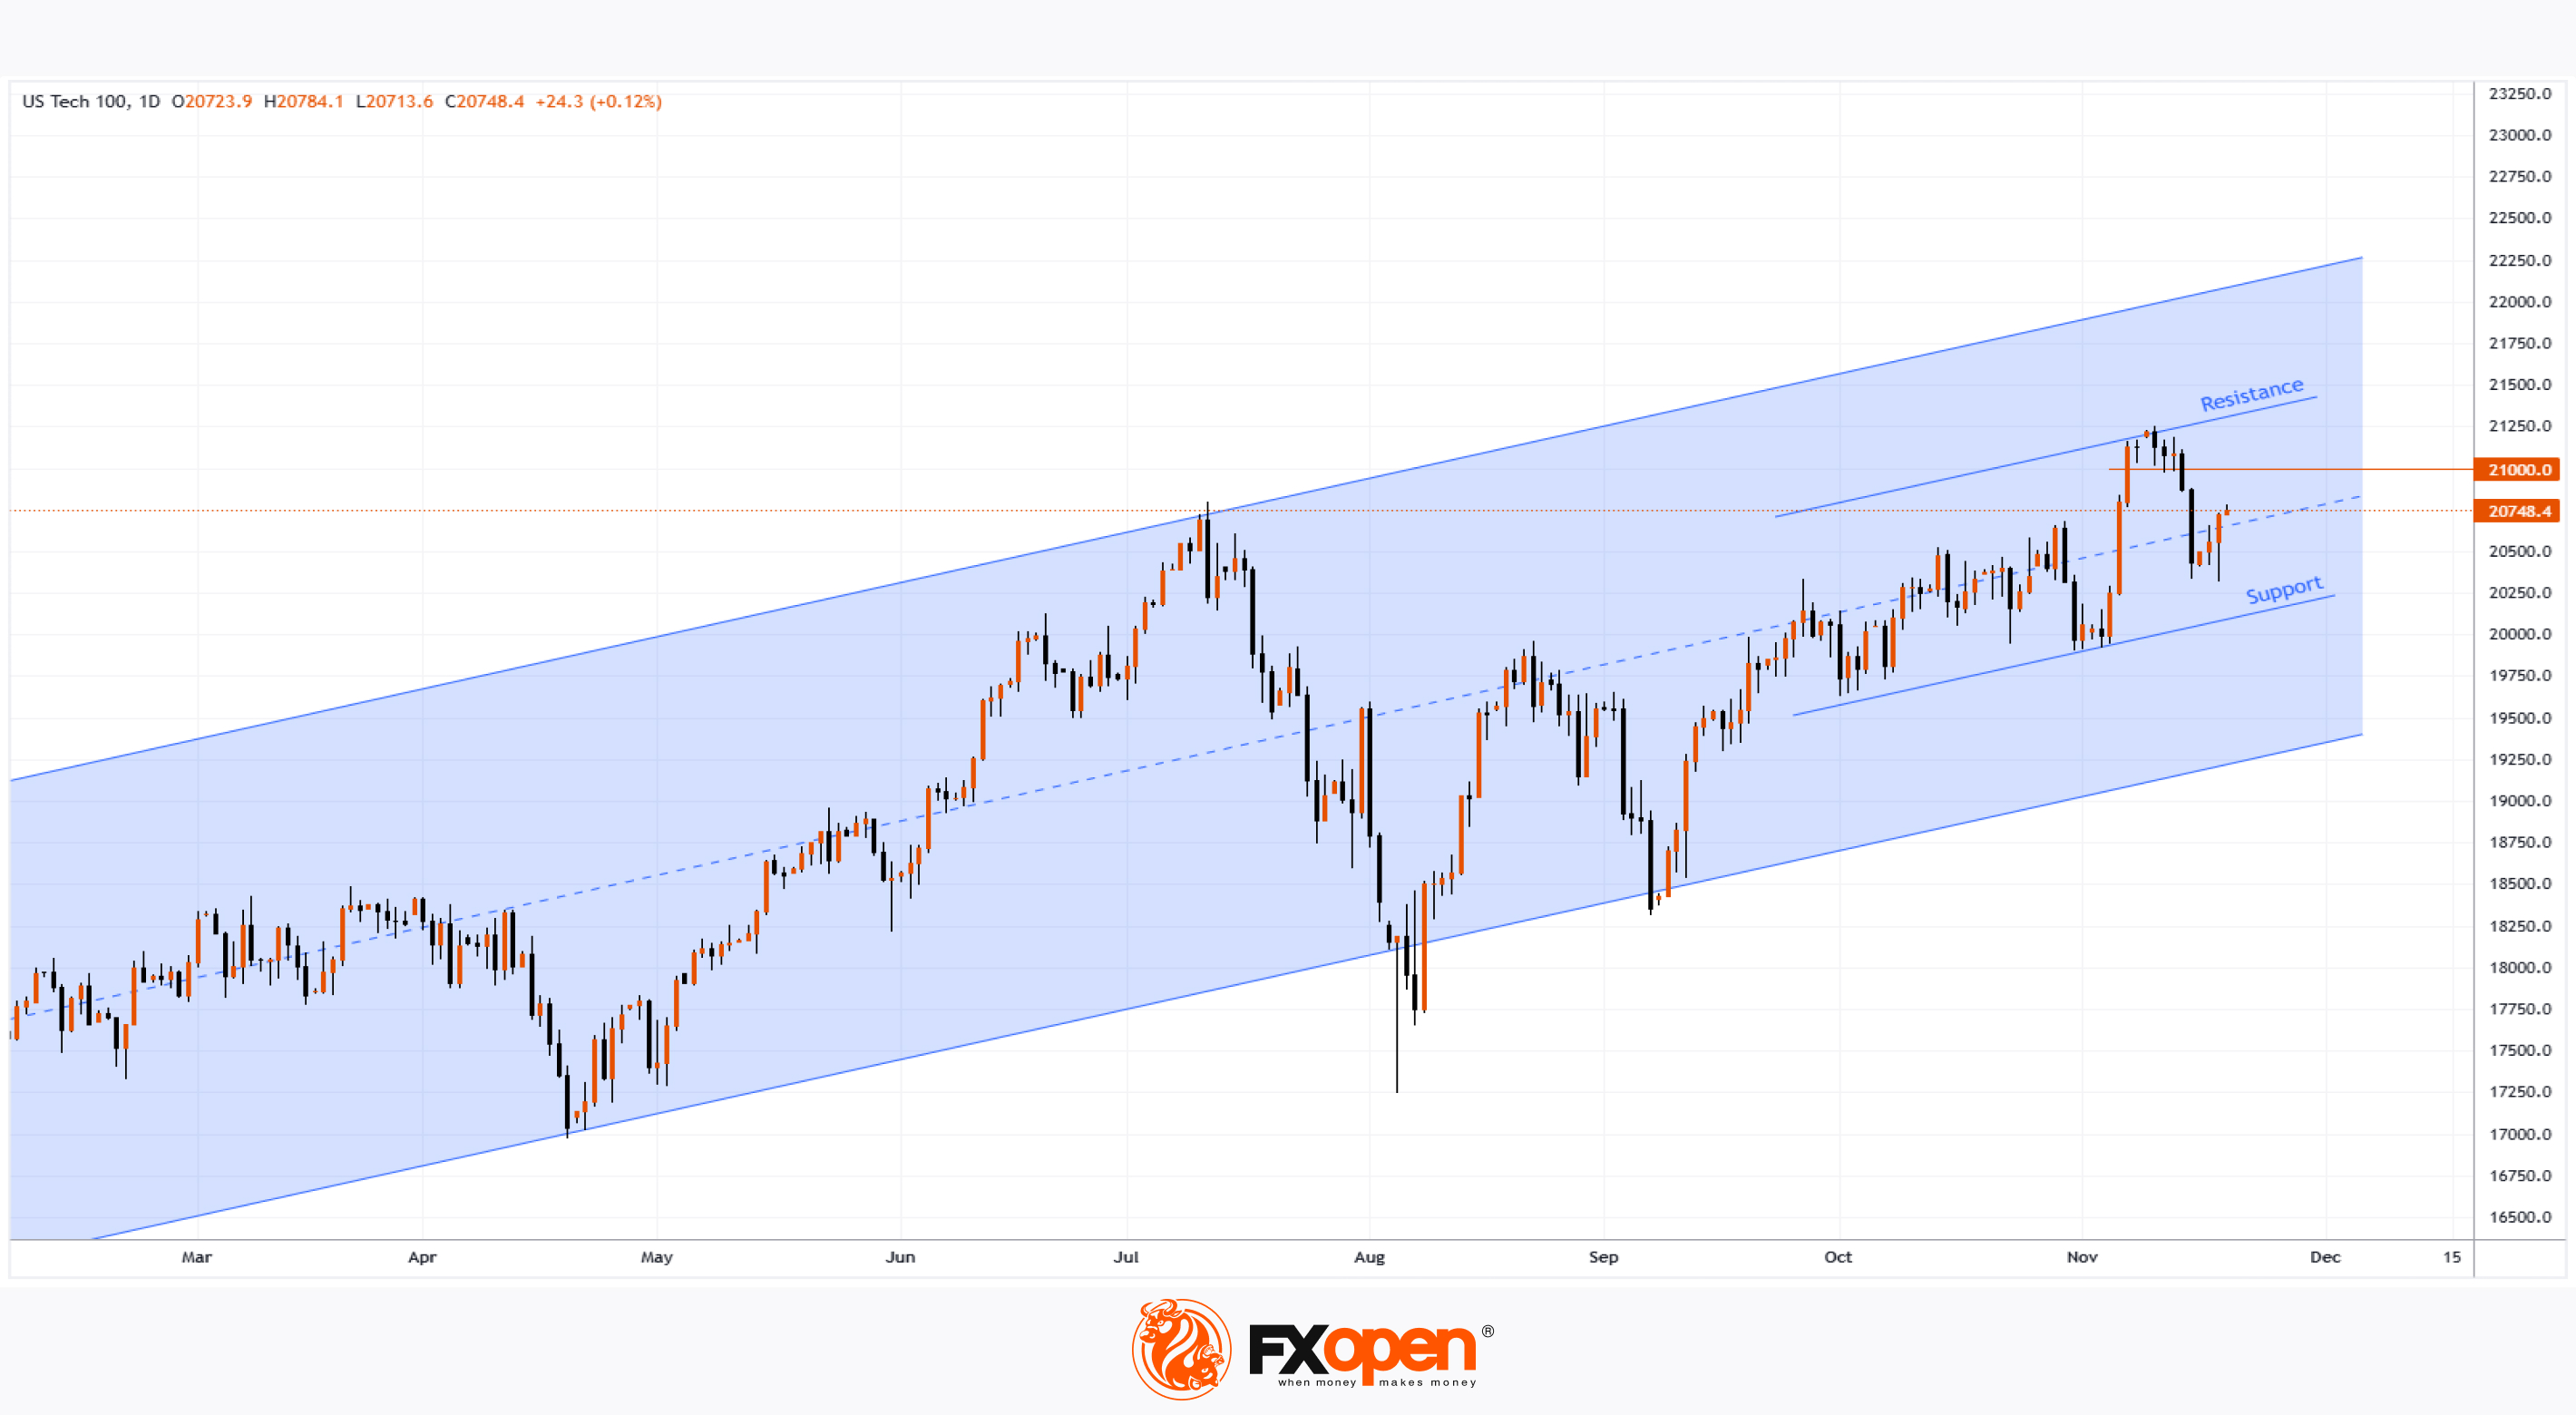
Technical analysis of the Nasdaq 100 chart (US Tech 100 Mini) indicates:
→ A broad upward channel has formed in 2024 (depicted in blue).
→ During October, prices gravitated toward the median line, creating a narrower channel between Resistance and Support levels.
→ Around the presidential election, prices spiked to a peak on 11 November but subsequently returned to the median.
The 21,000 level has emerged as a significant resistance point. It briefly acted as support, but the price failed to hold above it. Could bears successfully break away from the median's pull?
So far, the chart shows no clear signs of bearish activity. However, should such signals arise, they would lend greater weight to Morgan Stanley’s forecasts.
Trade global index CFDs with zero commission and tight spreads. Open your FXOpen account now or learn more about trading index CFDs with FXOpen.
CFDs are complex instruments and come with a high risk of losing your money.
This article represents the opinion of the Companies operating under the FXOpen brand only. It is not to be construed as an offer, solicitation, or recommendation with respect to products and services provided by the Companies operating under the FXOpen brand, nor is it to be considered financial advice.
Morgan Stanley: Trump’s Tariff Plans Could Lower Stock Indices
As reported by CNBC, Morgan Stanley analysts have evaluated the potential impact of tariff plans proposed by Donald Trump during his presidential campaign on the U.S. economy and stock market.
Key initiatives from the president-elect include:
→ Introducing a general tariff of 10% to 20% on all imported goods.
→ Imposing additional tariffs of 60% to 100% on imports from China.
Morgan Stanley’s Chief Global Economist, Seth Carpenter, suggests these measures could:
→ Eliminate the possibility of interest rate cuts in 2025 and constrain economic growth.
→ Threaten a slowdown in U.S. economic growth by 2026.
→ Drive inflation higher.
→ Pressure industries such as automotive, consumer electronics, machinery, construction, and retail. Increased producer costs are likely to be passed on to consumers.
These scenarios imply a negative outlook for the U.S. stock market. Tariffs may reduce investment appeal and raise borrowing costs for companies, potentially dampening market performance.
How Might This Affect Indices Like the Nasdaq 100 (US Tech 100 Mini on FXOpen)?
Technical analysis of the Nasdaq 100 chart (US Tech 100 Mini) indicates:
→ A broad upward channel has formed in 2024 (depicted in blue).
→ During October, prices gravitated toward the median line, creating a narrower channel between Resistance and Support levels.
→ Around the presidential election, prices spiked to a peak on 11 November but subsequently returned to the median.
The 21,000 level has emerged as a significant resistance point. It briefly acted as support, but the price failed to hold above it. Could bears successfully break away from the median's pull?
So far, the chart shows no clear signs of bearish activity. However, should such signals arise, they would lend greater weight to Morgan Stanley’s forecasts.
Trade global index CFDs with zero commission and tight spreads. Open your FXOpen account now or learn more about trading index CFDs with FXOpen.
CFDs are complex instruments and come with a high risk of losing your money.
This article represents the opinion of the Companies operating under the FXOpen brand only. It is not to be construed as an offer, solicitation, or recommendation with respect to products and services provided by the Companies operating under the FXOpen brand, nor is it to be considered financial advice.
👍3
#marketanalysis #MarketNews #stockmarket #nvidia #NVDA
Nvidia (NVDA) Stock Drops Following Earnings Report
On 13 November, we analysed Nvidia’s (NVDA) price chart and noted:
→ The continuation of a long-term upward channel (highlighted in blue).
→ A consolidation below the psychological $150 level, forming a narrowing triangle along the Quater Line, which divides the lower half of the channel.
On 20 November, Nvidia released its Q3 earnings report, which exceeded analysts’ expectations:
→ Earnings per share (EPS): $0.81 (expected: $0.74).
→ Revenue: $35.08 billion (expected: $33.17 billion).
→ Revenue growth: +94% year-on-year, +17% quarter-on-quarter.
Key Insights (via Reuters):
→ Optimism centres on Nvidia’s new Blackwell processors.
→ Concerns arise over a reduced revenue forecast due to supply chain constraints in chip production.
Despite strong results, Nvidia’s stock price dipped slightly following the report. Pre-market data suggests today’s trading could start around $142.50.
What’s Next?
Technical analysis of Nvidia’s chart indicates potential for further downside movement, with resistance levels formed by:
→ The psychological $150 mark.
→ A Resistance line running parallel above the correction channel (July–October) at a height equal to its range.
If bearish sentiment gains momentum in today’s main session, it could:
→ Confirm a bearish breakout from the consolidation triangle.
→ Threaten a breach of the lower boundary of the long-term growth channel.
In a worst-case scenario, NVDA could shift into a bearish trend within a descending channel (marked in red).
Analyst Outlook:
According to TipRanks:
→ 39 of 42 analysts recommend buying NVDA stock.
→ The average 12-month price target is $165.
Trade global index CFDs with zero commission and tight spreads. Open your FXOpen account now or learn more about trading index CFDs with FXOpen.
CFDs are complex instruments and come with a high risk of losing your money.
This article represents the opinion of the Companies operating under the FXOpen brand only. It is not to be construed as an offer, solicitation, or recommendation with respect to products and services provided by the Companies operating under the FXOpen brand, nor is it to be considered financial advice.
Nvidia (NVDA) Stock Drops Following Earnings Report
On 13 November, we analysed Nvidia’s (NVDA) price chart and noted:
→ The continuation of a long-term upward channel (highlighted in blue).
→ A consolidation below the psychological $150 level, forming a narrowing triangle along the Quater Line, which divides the lower half of the channel.
On 20 November, Nvidia released its Q3 earnings report, which exceeded analysts’ expectations:
→ Earnings per share (EPS): $0.81 (expected: $0.74).
→ Revenue: $35.08 billion (expected: $33.17 billion).
→ Revenue growth: +94% year-on-year, +17% quarter-on-quarter.
Key Insights (via Reuters):
→ Optimism centres on Nvidia’s new Blackwell processors.
→ Concerns arise over a reduced revenue forecast due to supply chain constraints in chip production.
Despite strong results, Nvidia’s stock price dipped slightly following the report. Pre-market data suggests today’s trading could start around $142.50.
What’s Next?
Technical analysis of Nvidia’s chart indicates potential for further downside movement, with resistance levels formed by:
→ The psychological $150 mark.
→ A Resistance line running parallel above the correction channel (July–October) at a height equal to its range.
If bearish sentiment gains momentum in today’s main session, it could:
→ Confirm a bearish breakout from the consolidation triangle.
→ Threaten a breach of the lower boundary of the long-term growth channel.
In a worst-case scenario, NVDA could shift into a bearish trend within a descending channel (marked in red).
Analyst Outlook:
According to TipRanks:
→ 39 of 42 analysts recommend buying NVDA stock.
→ The average 12-month price target is $165.
Trade global index CFDs with zero commission and tight spreads. Open your FXOpen account now or learn more about trading index CFDs with FXOpen.
CFDs are complex instruments and come with a high risk of losing your money.
This article represents the opinion of the Companies operating under the FXOpen brand only. It is not to be construed as an offer, solicitation, or recommendation with respect to products and services provided by the Companies operating under the FXOpen brand, nor is it to be considered financial advice.

👍2
#marketanalysis #goldprice #XAUUSD
Analysis of XAU/USD: Gold Price Rises by 5% in a Week
As shown in the XAU/USD chart, last Thursday, the price of gold dropped below $2,540. Today, however, the precious metal has surged above $2,660 per ounce.
The more than 5% weekly increase was driven by a new wave of international tensions, particularly the escalation surrounding the approval for Ukraine to use Western long-range weapons for strikes deep into Russian territory.
Technical analysis of the XAU/USD chart highlights that last week’s upward reversal once again demonstrates how effectively parallel channel lines can work. During the summer, the median line of the ascending channel (marked in blue) acted as support. However, following its bearish breakout on 11 November, the lower boundary of the channel, reinforced by the $2,535 level (which served as resistance in August and September), provided support for the price.
Will Gold Prices Continue to Rise?
Much will depend on the fundamental backdrop:
→ Geopolitical news;
→ The release of economic indicators. For instance, at 16:30 GMT+3 today, the US jobless claims report will be published, while tomorrow will bring PMI data for various countries.
Further growth in gold prices cannot be ruled out, especially given the long-term upward trend. However, it is worth noting that bulls have approached a significant resistance level near $2,677. This area saw bearish dominance on 11 November, leading to a breakout of the median line. Bears may attempt to defend control of this level.
Start trading commodities with tight spreads. Open your trading account now or learn more about trading commodity CFDs with FXOpen.
CFDs are complex instruments and come with a high risk of losing your money.
This article represents the opinion of the Companies operating under the FXOpen brand only. It is not to be construed as an offer, solicitation, or recommendation with respect to products and services provided by the Companies operating under the FXOpen brand, nor is it to be considered financial advice.
Analysis of XAU/USD: Gold Price Rises by 5% in a Week
As shown in the XAU/USD chart, last Thursday, the price of gold dropped below $2,540. Today, however, the precious metal has surged above $2,660 per ounce.
The more than 5% weekly increase was driven by a new wave of international tensions, particularly the escalation surrounding the approval for Ukraine to use Western long-range weapons for strikes deep into Russian territory.
Technical analysis of the XAU/USD chart highlights that last week’s upward reversal once again demonstrates how effectively parallel channel lines can work. During the summer, the median line of the ascending channel (marked in blue) acted as support. However, following its bearish breakout on 11 November, the lower boundary of the channel, reinforced by the $2,535 level (which served as resistance in August and September), provided support for the price.
Will Gold Prices Continue to Rise?
Much will depend on the fundamental backdrop:
→ Geopolitical news;
→ The release of economic indicators. For instance, at 16:30 GMT+3 today, the US jobless claims report will be published, while tomorrow will bring PMI data for various countries.
Further growth in gold prices cannot be ruled out, especially given the long-term upward trend. However, it is worth noting that bulls have approached a significant resistance level near $2,677. This area saw bearish dominance on 11 November, leading to a breakout of the median line. Bears may attempt to defend control of this level.
Start trading commodities with tight spreads. Open your trading account now or learn more about trading commodity CFDs with FXOpen.
CFDs are complex instruments and come with a high risk of losing your money.
This article represents the opinion of the Companies operating under the FXOpen brand only. It is not to be construed as an offer, solicitation, or recommendation with respect to products and services provided by the Companies operating under the FXOpen brand, nor is it to be considered financial advice.

👍2
#EURUSD #forextrading #MarketUpdates #MarketNews
EUR/USD Breaks 2023 Low
Today’s PMI figures were released and came in worse than analysts’ expectations. The Flash Manufacturing PMI and Flash Services PMI for both Germany and France fell below the 50.0 threshold, indicating that Europe’s economy is slowing down.
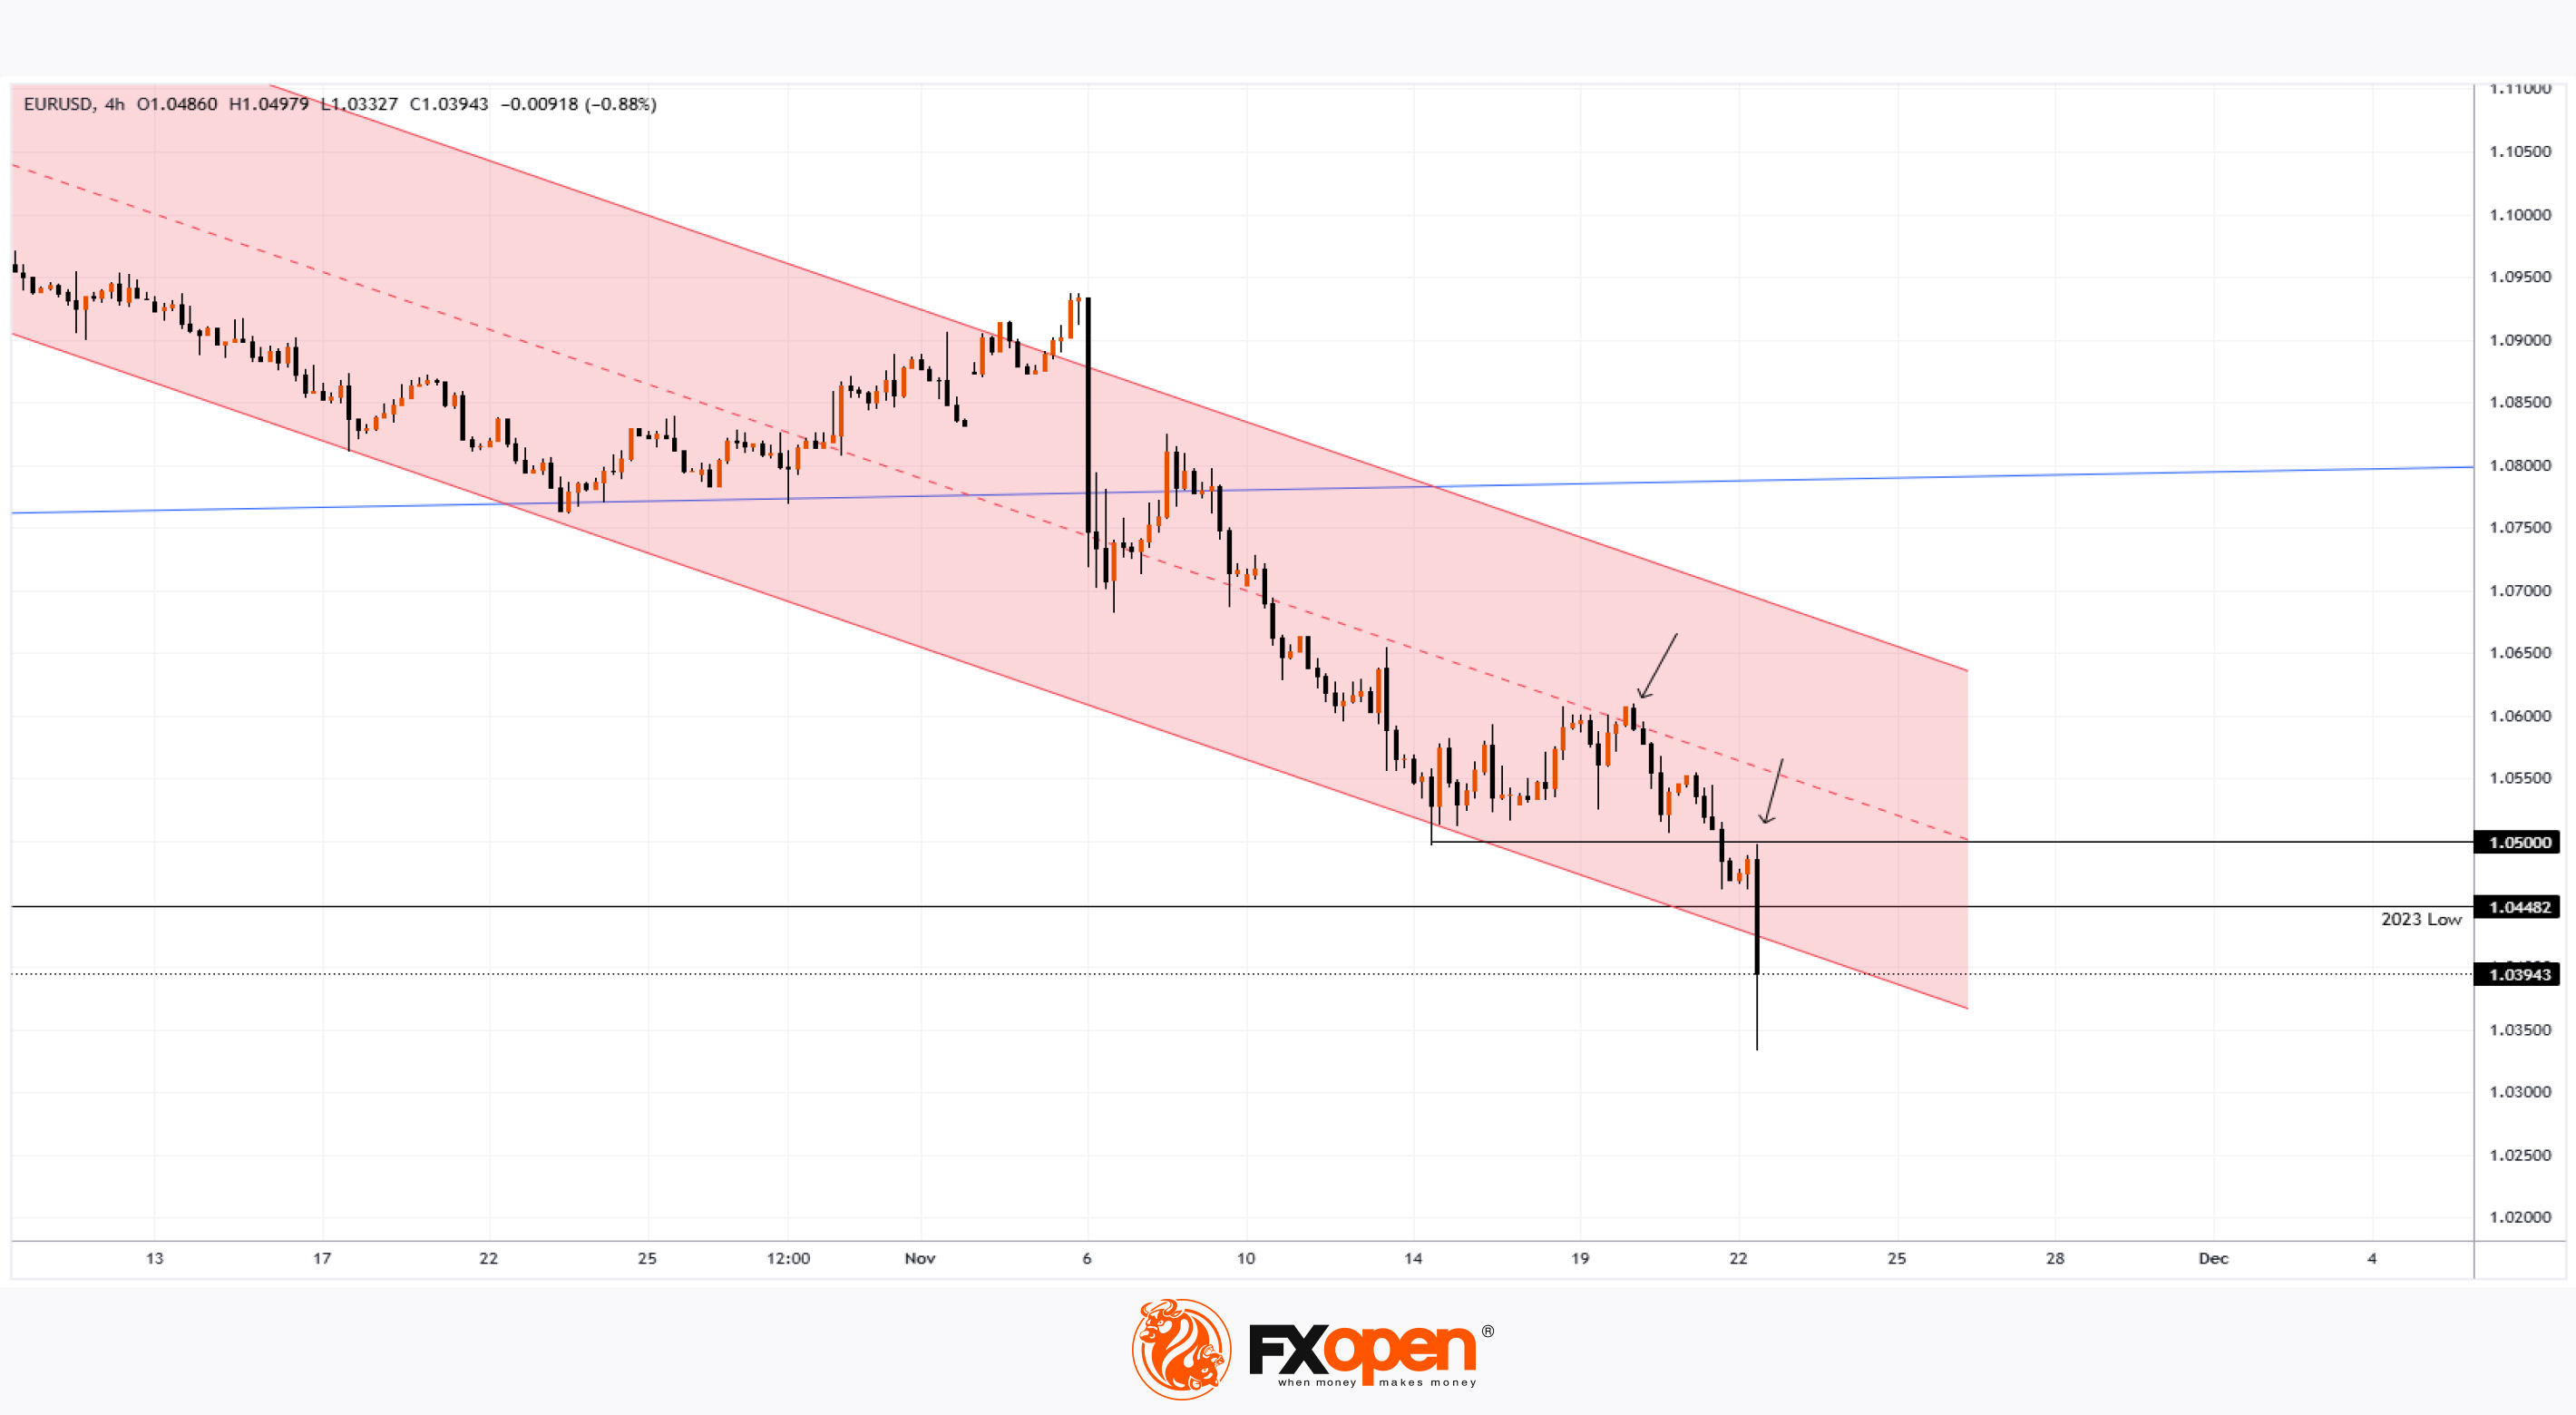
This weakened the euro further and exacerbated the situation on the EUR/USD chart, which has been in a downtrend since early October (as indicated by the red channel):
→ Earlier, support near the 1.0800 level (drawn through the spring-summer lows) was breached.
→ Today, the pair fell below the psychological level of 1.0500 and beneath the 2023 low.
Bears appear to be in control, with EUR/USD trading near the lower boundary of the channel. Arrows on the chart highlight that both the channel median and the 1.0500 level are acting as resistance.
On the other hand, bulls might find hope in the long lower shadow on today’s candle, which could signal emerging demand capable of providing support for the weakened euro.
Trade over 50 forex markets 24 hours a day with FXOpen. Take advantage of low commissions, deep liquidity, and spreads from 0.0 pips. Open your FXOpen account now or learn more about trading forex with FXOpen.
CFDs are complex instruments and come with a high risk of losing your money.
This article represents the opinion of the Companies operating under the FXOpen brand only. It is not to be construed as an offer, solicitation, or recommendation with respect to products and services provided by the Companies operating under the FXOpen brand, nor is it to be considered financial advice.
EUR/USD Breaks 2023 Low
Today’s PMI figures were released and came in worse than analysts’ expectations. The Flash Manufacturing PMI and Flash Services PMI for both Germany and France fell below the 50.0 threshold, indicating that Europe’s economy is slowing down.
This weakened the euro further and exacerbated the situation on the EUR/USD chart, which has been in a downtrend since early October (as indicated by the red channel):
→ Earlier, support near the 1.0800 level (drawn through the spring-summer lows) was breached.
→ Today, the pair fell below the psychological level of 1.0500 and beneath the 2023 low.
Bears appear to be in control, with EUR/USD trading near the lower boundary of the channel. Arrows on the chart highlight that both the channel median and the 1.0500 level are acting as resistance.
On the other hand, bulls might find hope in the long lower shadow on today’s candle, which could signal emerging demand capable of providing support for the weakened euro.
Trade over 50 forex markets 24 hours a day with FXOpen. Take advantage of low commissions, deep liquidity, and spreads from 0.0 pips. Open your FXOpen account now or learn more about trading forex with FXOpen.
CFDs are complex instruments and come with a high risk of losing your money.
This article represents the opinion of the Companies operating under the FXOpen brand only. It is not to be construed as an offer, solicitation, or recommendation with respect to products and services provided by the Companies operating under the FXOpen brand, nor is it to be considered financial advice.
👍2
#stockmarket #stocktrading #GOOGL #MarketNews
Alphabet Inc. (GOOGL) Shares Drop Over 4.5% in a Single Day
As the chart shows, during yesterday’s trading session, the stock price of Alphabet Inc. (GOOGL), the parent company of Google, declined by more than 4.5%. The drop was driven by regulatory pressure on the company concerning its Chrome browser, which may face a forced sale or breakup.
The US Department of Justice believes Google should end its monopoly on online search. A court case is scheduled for April next year, but the sharp decline in GOOGL’s share price reflects growing investor caution.
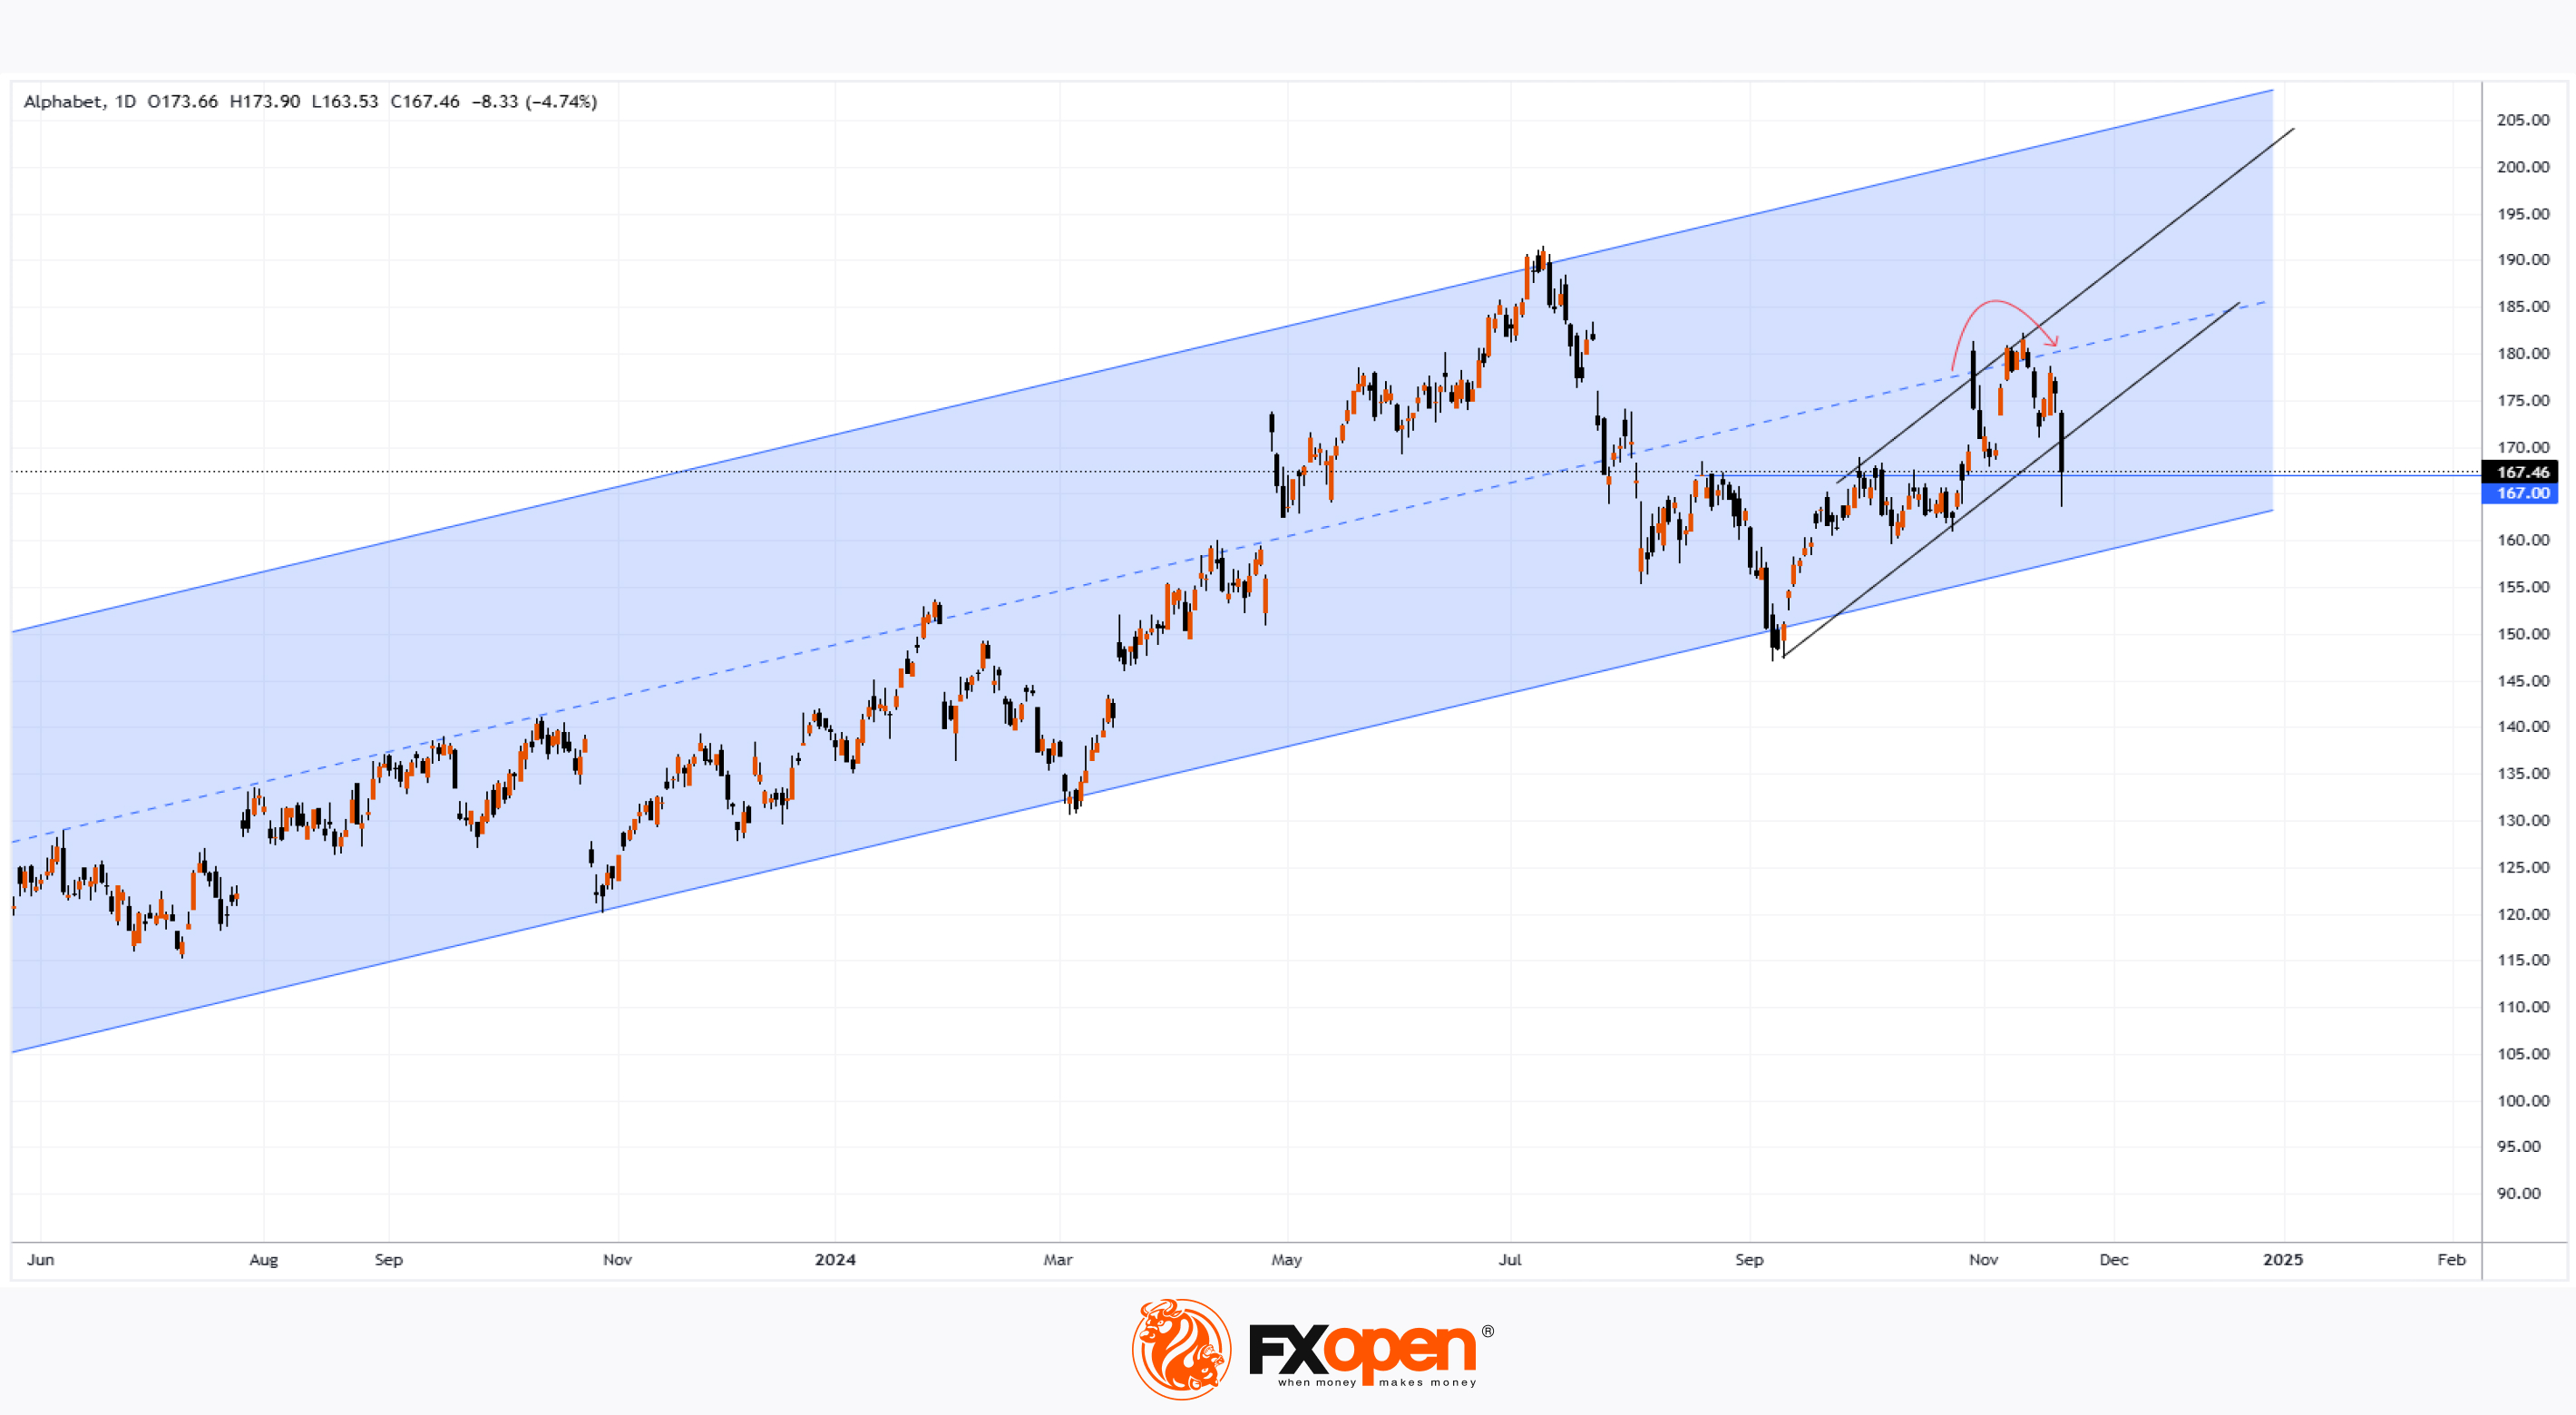
The technical chart for Alphabet Inc. shares reveals further reasons for concern due to several bearish indicators:
→ The price reversed downward (indicated by an arrow) from the median line of the long-term channel (shown in blue).
→ All bullish progress made following the earnings report (as analysed in our 30 October coverage of GOOGL shares) has now been lost.
→ The price has broken below the boundary of the steep ascending channel, which had been in place since early September, increasing the risk of a breach of the lower boundary of the blue long-term channel.
Currently, the price is holding support at the former resistance level of $167. However, will it be strong enough to counter the bearish momentum triggered by these developments?
Analysts Remain Optimistic
Despite recent turbulence, analysts maintain a positive outlook. According to a TipRanks survey:
→ 27 out of 34 analysts recommend buying GOOGL shares.
→ The average 12-month price target for GOOGL is $208.
Trade global index CFDs with zero commission and tight spreads. Open your FXOpen account now or learn more about trading index CFDs with FXOpen.
CFDs are complex instruments and come with a high risk of losing your money.
This article represents the opinion of the Companies operating under the FXOpen brand only. It is not to be construed as an offer, solicitation, or recommendation with respect to products and services provided by the Companies operating under the FXOpen brand, nor is it to be considered financial advice.
Alphabet Inc. (GOOGL) Shares Drop Over 4.5% in a Single Day
As the chart shows, during yesterday’s trading session, the stock price of Alphabet Inc. (GOOGL), the parent company of Google, declined by more than 4.5%. The drop was driven by regulatory pressure on the company concerning its Chrome browser, which may face a forced sale or breakup.
The US Department of Justice believes Google should end its monopoly on online search. A court case is scheduled for April next year, but the sharp decline in GOOGL’s share price reflects growing investor caution.
The technical chart for Alphabet Inc. shares reveals further reasons for concern due to several bearish indicators:
→ The price reversed downward (indicated by an arrow) from the median line of the long-term channel (shown in blue).
→ All bullish progress made following the earnings report (as analysed in our 30 October coverage of GOOGL shares) has now been lost.
→ The price has broken below the boundary of the steep ascending channel, which had been in place since early September, increasing the risk of a breach of the lower boundary of the blue long-term channel.
Currently, the price is holding support at the former resistance level of $167. However, will it be strong enough to counter the bearish momentum triggered by these developments?
Analysts Remain Optimistic
Despite recent turbulence, analysts maintain a positive outlook. According to a TipRanks survey:
→ 27 out of 34 analysts recommend buying GOOGL shares.
→ The average 12-month price target for GOOGL is $208.
Trade global index CFDs with zero commission and tight spreads. Open your FXOpen account now or learn more about trading index CFDs with FXOpen.
CFDs are complex instruments and come with a high risk of losing your money.
This article represents the opinion of the Companies operating under the FXOpen brand only. It is not to be construed as an offer, solicitation, or recommendation with respect to products and services provided by the Companies operating under the FXOpen brand, nor is it to be considered financial advice.
👍1
#stockmarket #stocktrading #MarketUpdates #MarketNews
Spotify (SPOT) Shares Hover Near All-Time High
According to the Spotify (SPOT) chart:
→ The stock price has risen by over 150% since the start of 2024.
→ It has formed an ascending channel (marked in blue).
→ Growth accelerated in November, surpassing the $400 level and climbing to around $470.
The large bullish gap on 13 November followed the release of a Q3 earnings report, which fell short of expectations: earnings per share were 14% below forecast, and gross revenue was 1% lower than anticipated.
However, the market reacted enthusiastically to the company’s plans to launch a “Super-Premium” tier, offering Hi-Fi music streaming and other innovations, including features related to video.
Spotify first announced its intention to introduce a higher-end Premium subscription with features like lossless, CD-quality audio several years ago, but licensing issues delayed the rollout.
According to TechCrunch, the new tier is expected to cost approximately $17–$18 per month, about $5 more than the current Premium subscription. Investors appear optimistic about potential revenue growth, driving SPOT's stock price to a historic high of $470.
Technical Analysis of SPOT
Daily chart indicators suggest the stock might be overbought:
→ The RSI indicator is above 70.
→ The price is near the upper boundary of the ascending channel.
Meanwhile, TipRanks analysts forecast an average target price for SPOT at $477 over the next 12 months.
This suggests that while SPOT has experienced remarkable growth in 2024, its upward momentum may be nearing exhaustion.
Trade global index CFDs with zero commission and tight spreads. Open your FXOpen account now or learn more about trading index CFDs with FXOpen.
CFDs are complex instruments and come with a high risk of losing your money.
This article represents the opinion of the Companies operating under the FXOpen brand only. It is not to be construed as an offer, solicitation, or recommendation with respect to products and services provided by the Companies operating under the FXOpen brand, nor is it to be considered financial advice.
Spotify (SPOT) Shares Hover Near All-Time High
According to the Spotify (SPOT) chart:
→ The stock price has risen by over 150% since the start of 2024.
→ It has formed an ascending channel (marked in blue).
→ Growth accelerated in November, surpassing the $400 level and climbing to around $470.
The large bullish gap on 13 November followed the release of a Q3 earnings report, which fell short of expectations: earnings per share were 14% below forecast, and gross revenue was 1% lower than anticipated.
However, the market reacted enthusiastically to the company’s plans to launch a “Super-Premium” tier, offering Hi-Fi music streaming and other innovations, including features related to video.
Spotify first announced its intention to introduce a higher-end Premium subscription with features like lossless, CD-quality audio several years ago, but licensing issues delayed the rollout.
According to TechCrunch, the new tier is expected to cost approximately $17–$18 per month, about $5 more than the current Premium subscription. Investors appear optimistic about potential revenue growth, driving SPOT's stock price to a historic high of $470.
Technical Analysis of SPOT
Daily chart indicators suggest the stock might be overbought:
→ The RSI indicator is above 70.
→ The price is near the upper boundary of the ascending channel.
Meanwhile, TipRanks analysts forecast an average target price for SPOT at $477 over the next 12 months.
This suggests that while SPOT has experienced remarkable growth in 2024, its upward momentum may be nearing exhaustion.
Trade global index CFDs with zero commission and tight spreads. Open your FXOpen account now or learn more about trading index CFDs with FXOpen.
CFDs are complex instruments and come with a high risk of losing your money.
This article represents the opinion of the Companies operating under the FXOpen brand only. It is not to be construed as an offer, solicitation, or recommendation with respect to products and services provided by the Companies operating under the FXOpen brand, nor is it to be considered financial advice.
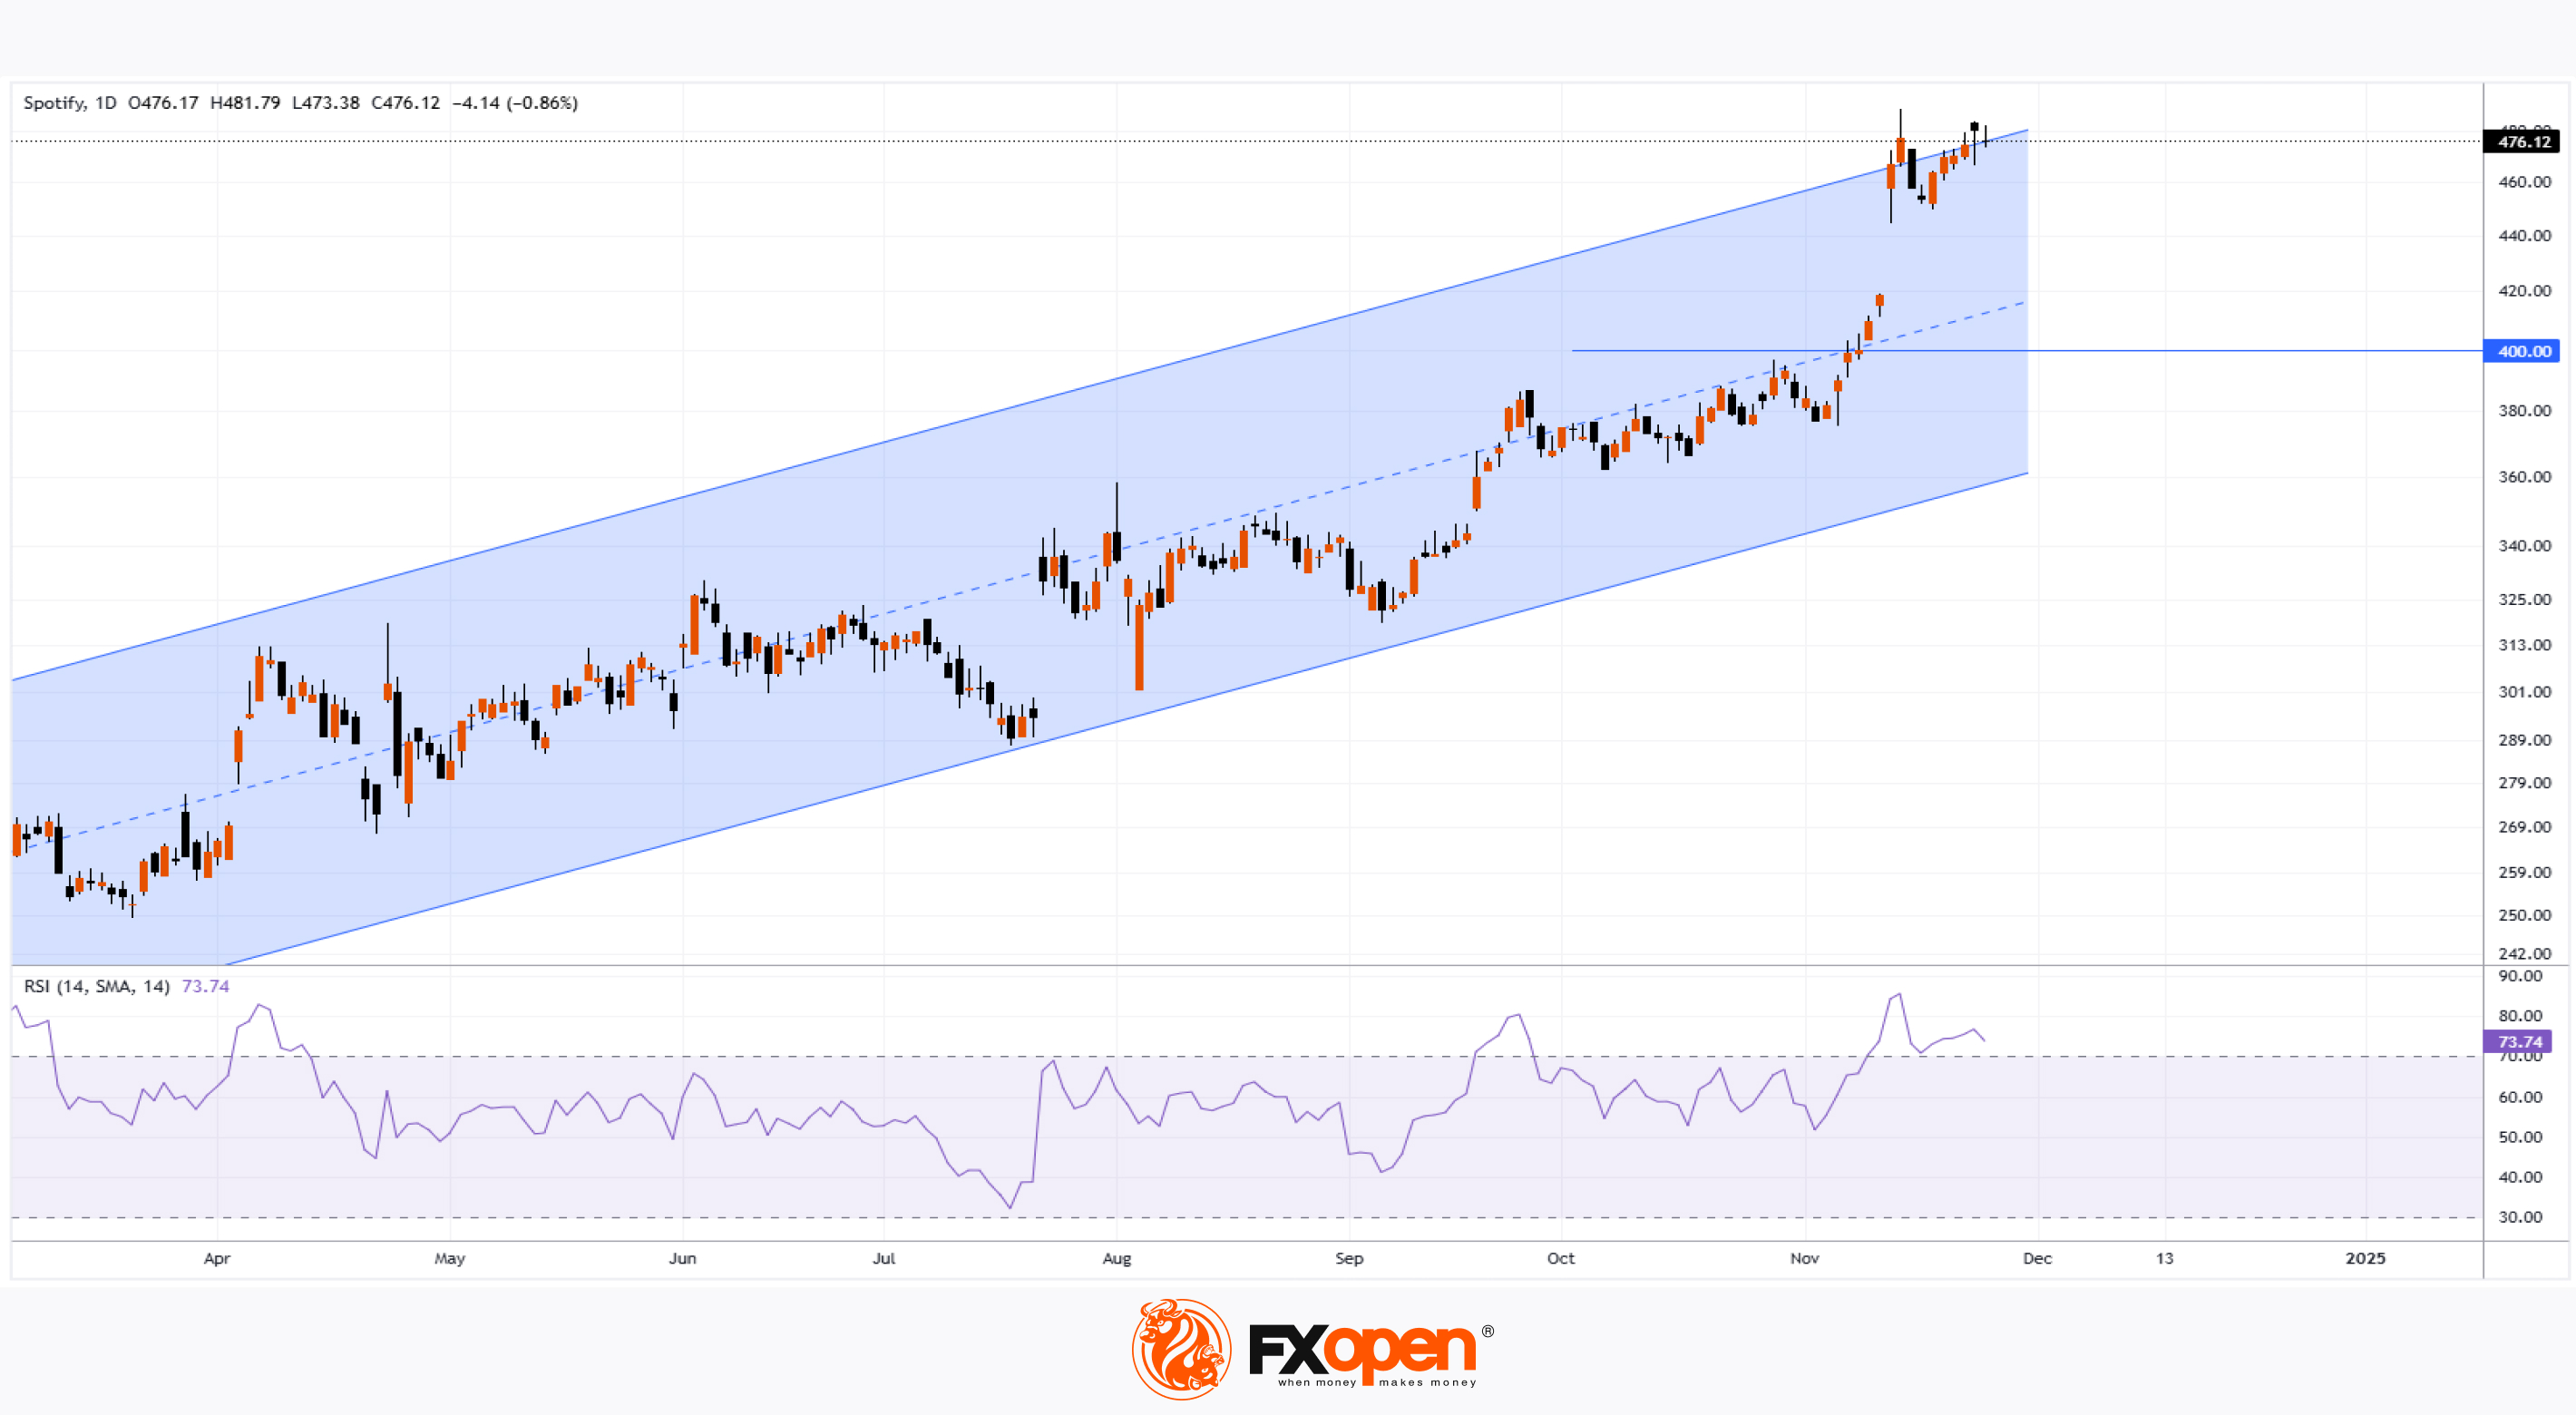
👍3