
#MarketNews #stockmarket #stocktrading #MarketUpdates
General Motors (GM) Shares Surge Nearly 10%
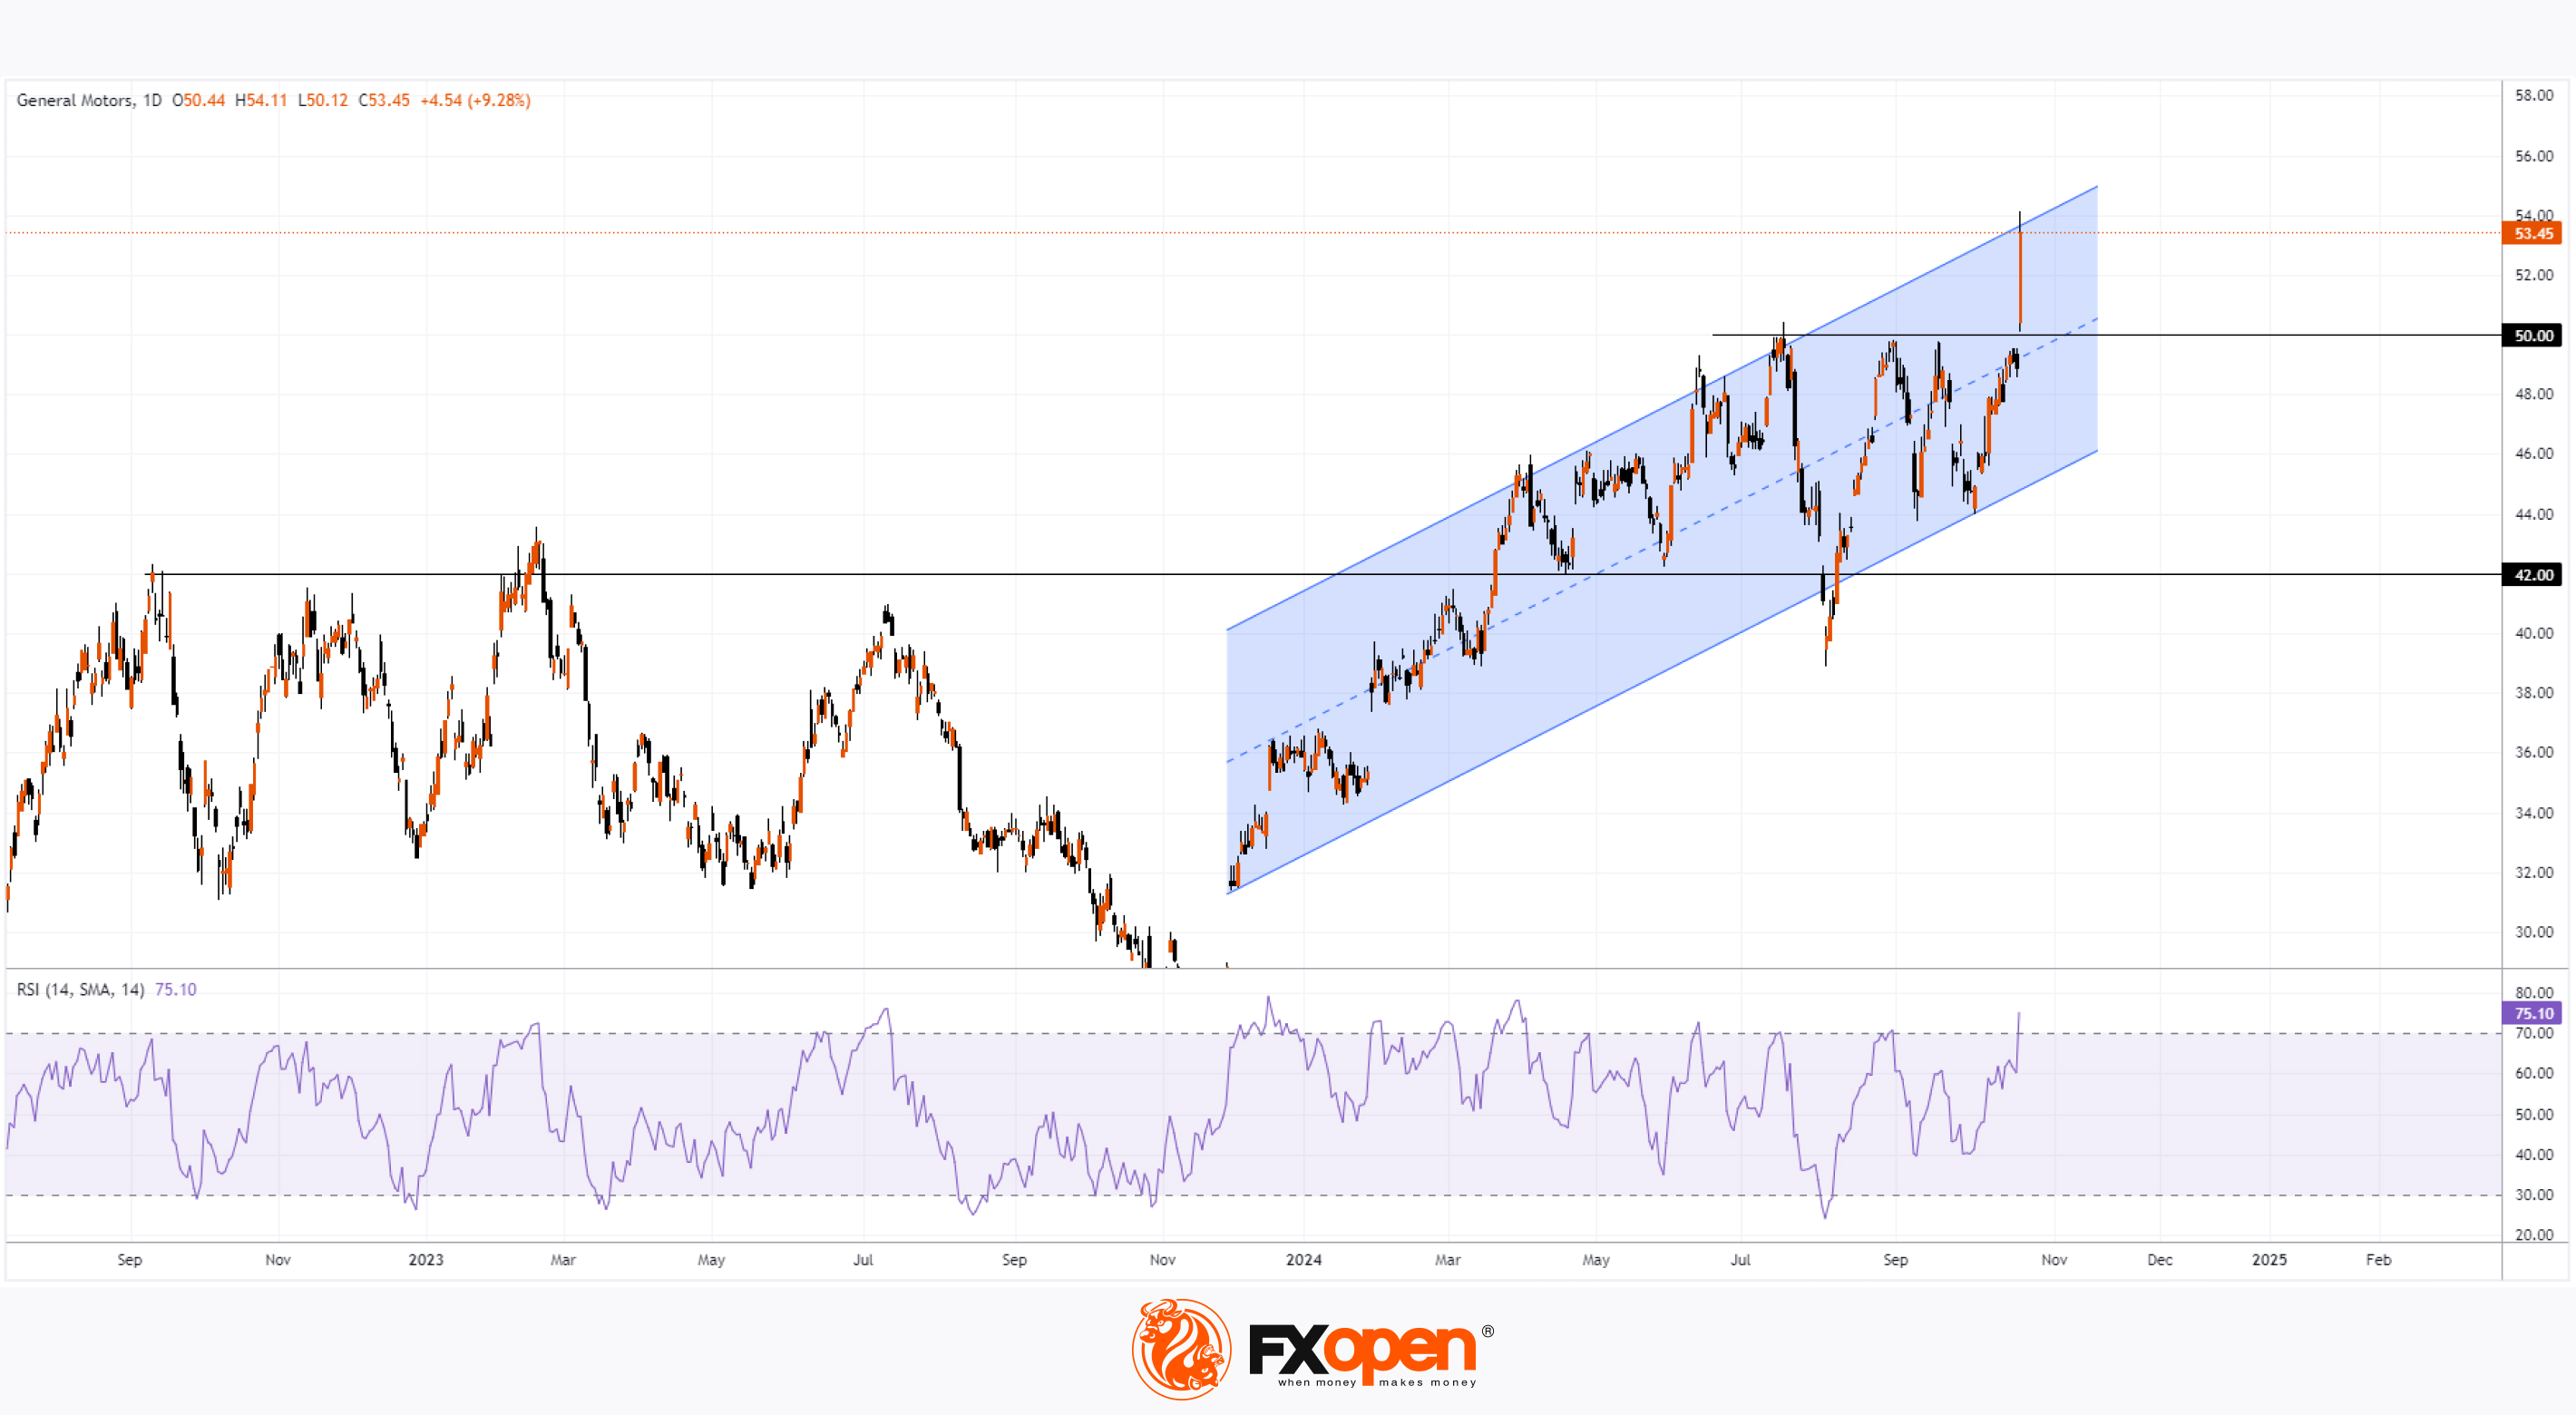
According to the chart for General Motors (GM), the following points stand out:
→ Yesterday, the share price closed above $53, a significant rise from just below $49 the previous day.
→ Since the beginning of the year, the stock has experienced an increase of around 50%.
The sharp rise in price can be attributed to the company's robust Q3 earnings report:
→ General Motors reported a 10% year-on-year increase in gross revenue for Q3, reaching $48.75 billion, significantly higher than analysts' expectations of $44.67 billion.
→ Earnings per share climbed by 30% year-on-year to $2.96, compared to a forecast of $2.49.
→ Additionally, the company raised its earnings guidance for the next quarter and indicated that it is intensifying efforts to launch autonomous vehicles.
Technical analysis of General Motors' stock reveals that:
→ In 2024, the stock has formed an upward channel (highlighted in blue), and the current price has reached its upper boundary.
→ The psychological barrier at $50 per share, which has acted as resistance since July, has now been breached. Notably, the $42 level served as resistance for several months before changing its role; $50 may follow this pattern in the future.
→ The RSI indicator has entered overbought territory.
Will the stock's upward trajectory continue? It is plausible that as investor enthusiasm from the strong earnings report subsides, GM's share price could experience a correction. This seems likely, given its proximity to the upper channel boundary and the overbought status indicated by the RSI. In such a scenario, the price could drop back towards the median line of the blue channel.
According to TipRanks, 11 out of 20 analysts recommend buying GM shares, with an average target price of $55 within the next 12 months. Given the strong fundamental data from General Motors, analysts' forecasts for GM stock may be adjusted upwards.
Trade global index CFDs with zero commission and tight spreads. Open your FXOpen account now or learn more about trading index CFDs with FXOpen.
CFDs are complex instruments and come with a high risk of losing your money.
This article represents the opinion of the Companies operating under the FXOpen brand only. It is not to be construed as an offer, solicitation, or recommendation with respect to products and services provided by the Companies operating under the FXOpen brand, nor is it to be considered financial advice.
General Motors (GM) Shares Surge Nearly 10%
According to the chart for General Motors (GM), the following points stand out:
→ Yesterday, the share price closed above $53, a significant rise from just below $49 the previous day.
→ Since the beginning of the year, the stock has experienced an increase of around 50%.
The sharp rise in price can be attributed to the company's robust Q3 earnings report:
→ General Motors reported a 10% year-on-year increase in gross revenue for Q3, reaching $48.75 billion, significantly higher than analysts' expectations of $44.67 billion.
→ Earnings per share climbed by 30% year-on-year to $2.96, compared to a forecast of $2.49.
→ Additionally, the company raised its earnings guidance for the next quarter and indicated that it is intensifying efforts to launch autonomous vehicles.
Technical analysis of General Motors' stock reveals that:
→ In 2024, the stock has formed an upward channel (highlighted in blue), and the current price has reached its upper boundary.
→ The psychological barrier at $50 per share, which has acted as resistance since July, has now been breached. Notably, the $42 level served as resistance for several months before changing its role; $50 may follow this pattern in the future.
→ The RSI indicator has entered overbought territory.
Will the stock's upward trajectory continue? It is plausible that as investor enthusiasm from the strong earnings report subsides, GM's share price could experience a correction. This seems likely, given its proximity to the upper channel boundary and the overbought status indicated by the RSI. In such a scenario, the price could drop back towards the median line of the blue channel.
According to TipRanks, 11 out of 20 analysts recommend buying GM shares, with an average target price of $55 within the next 12 months. Given the strong fundamental data from General Motors, analysts' forecasts for GM stock may be adjusted upwards.
Trade global index CFDs with zero commission and tight spreads. Open your FXOpen account now or learn more about trading index CFDs with FXOpen.
CFDs are complex instruments and come with a high risk of losing your money.
This article represents the opinion of the Companies operating under the FXOpen brand only. It is not to be construed as an offer, solicitation, or recommendation with respect to products and services provided by the Companies operating under the FXOpen brand, nor is it to be considered financial advice.
👍2
#tsla #stockmarket #stocktrading #tesla #MarketUpdates
Tesla (TSLA) Shares Surge by 11%
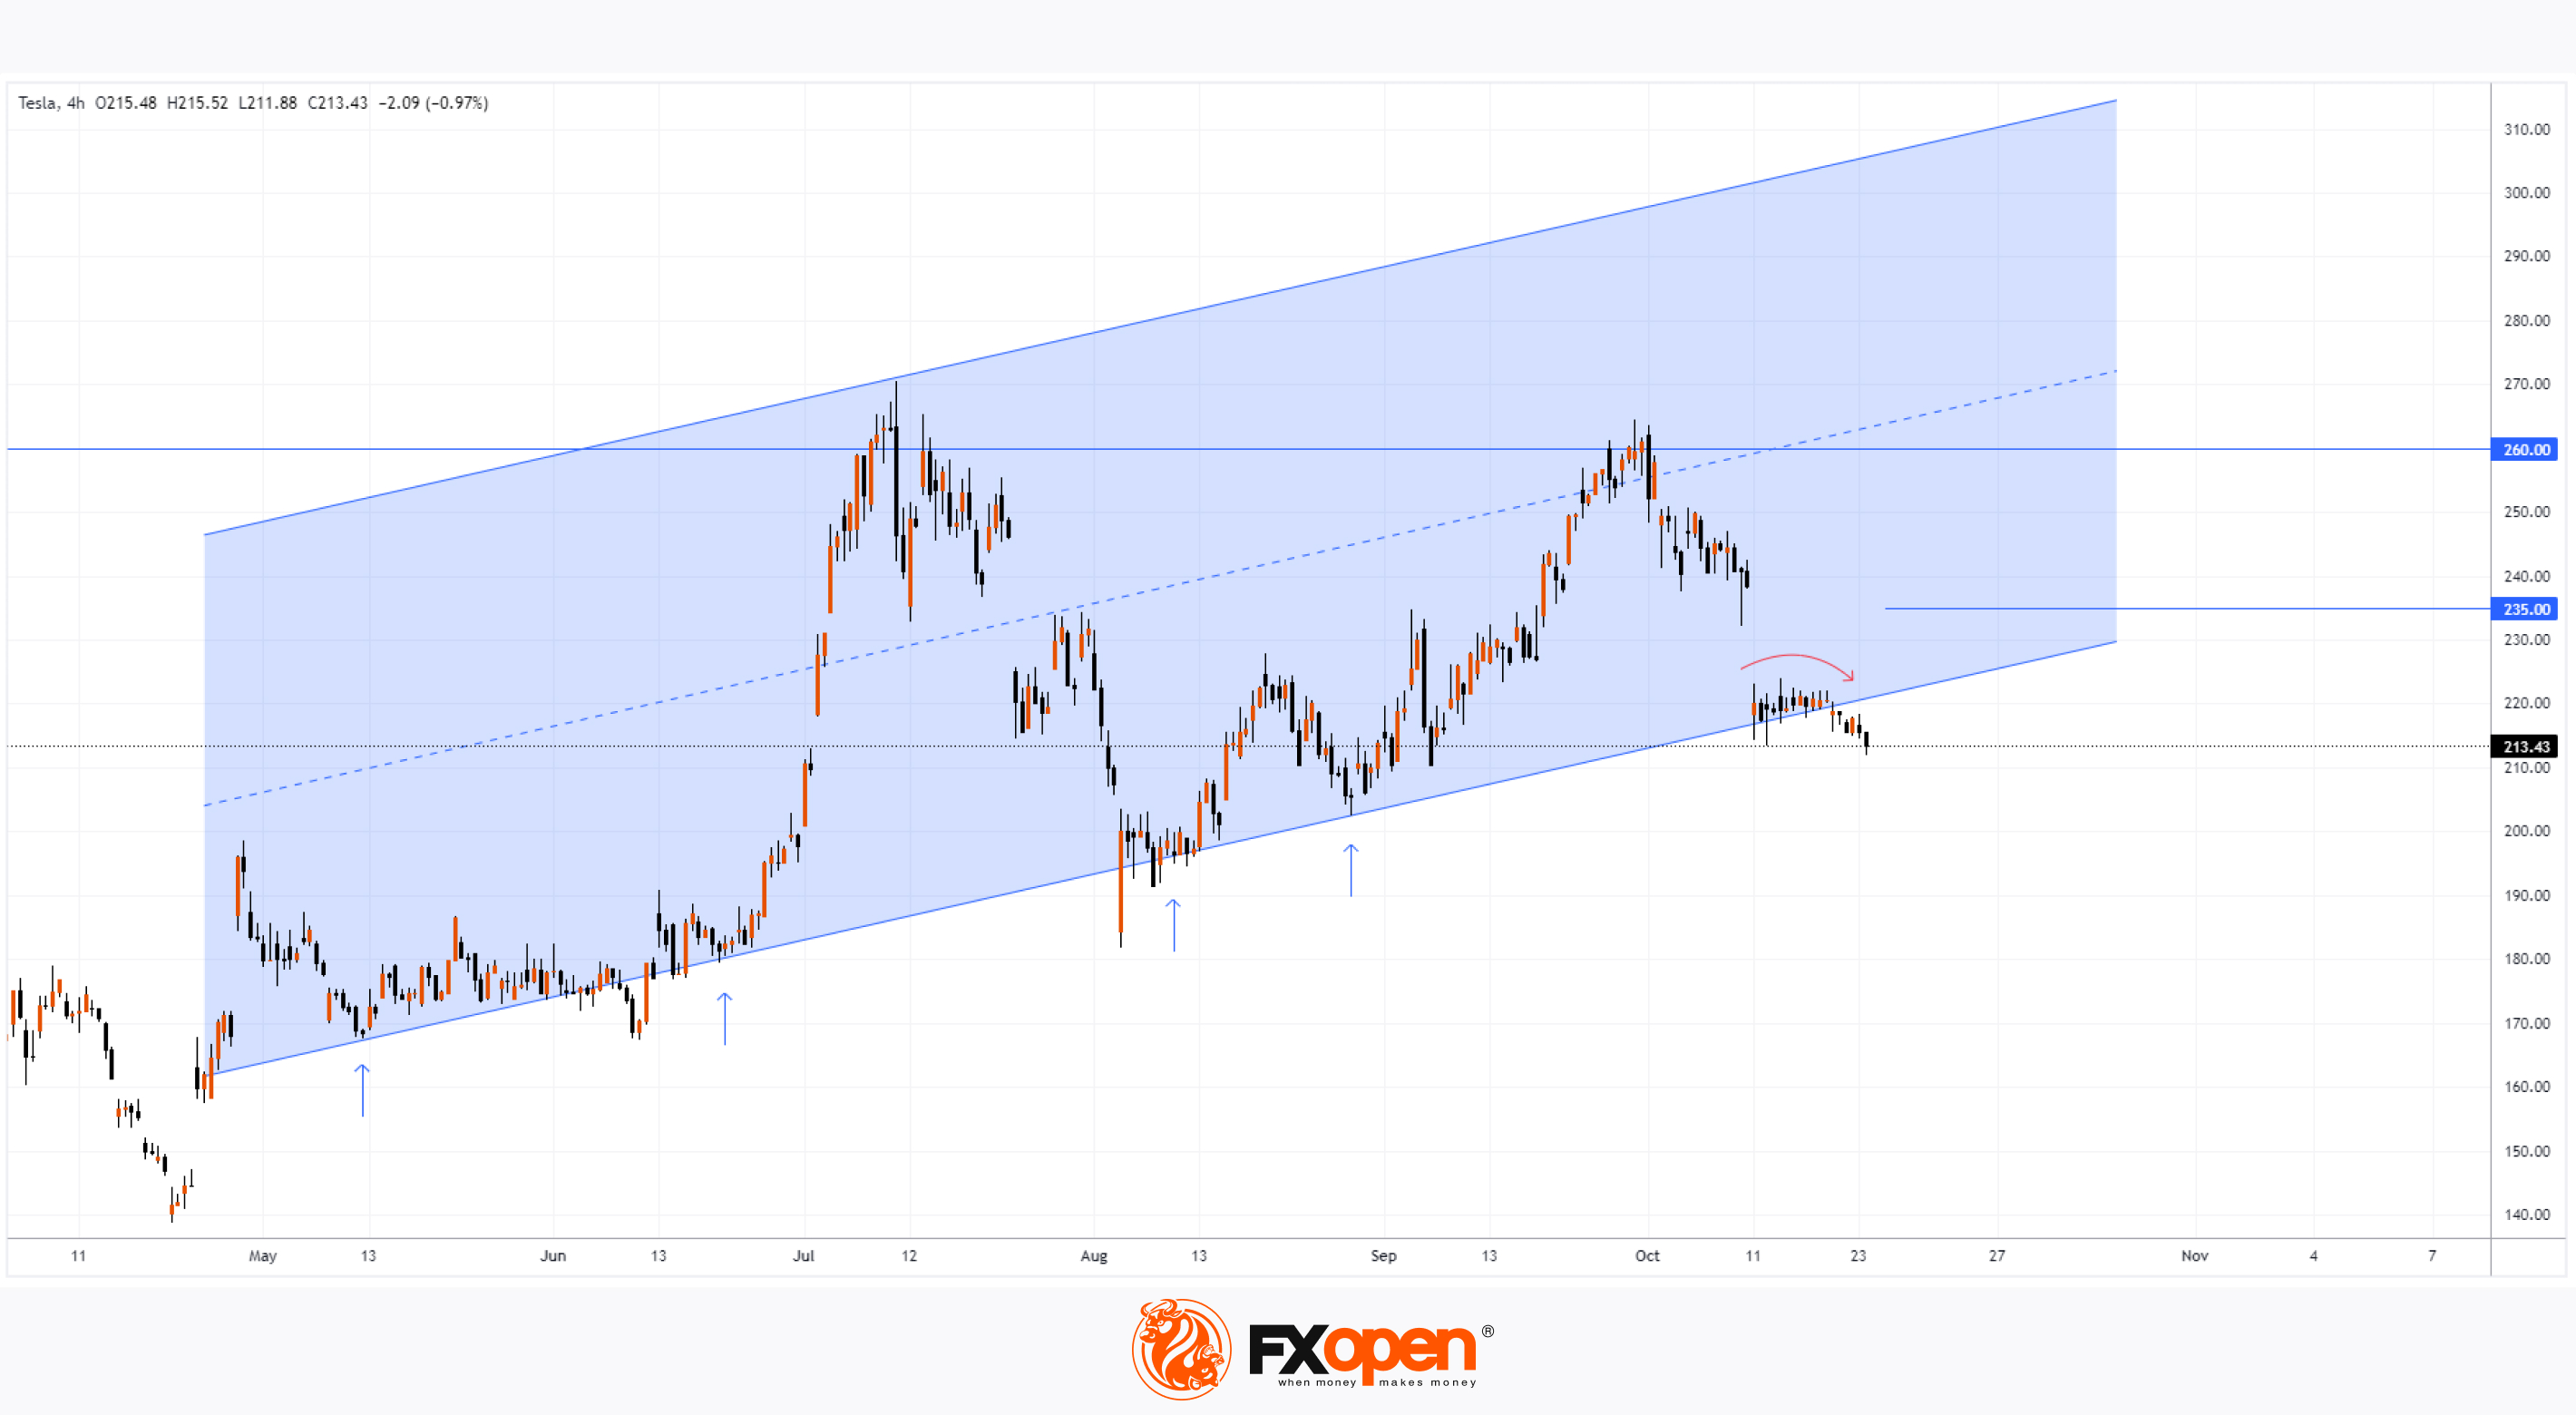
As shown by Tesla's stock chart, trading closed below $213.50 yesterday. However, following the main trading session, the company reported its third-quarter earnings:
→ Earnings per share (EPS): actual = $0.72, expected = $0.59
→ Gross revenue: actual = $25.46 billion, expected = $25.18 billion
Additionally, Tesla forecasted a sharp increase in vehicle sales, assuring investors that CEO Elon Musk remains focused on expanding the company's core electric vehicle business.
According to Reuters, this earnings report positively impacted investors who were previously concerned about:
→ Profit margins shrinking due to price cuts.
→ Musk potentially being distracted by new projects like the Cybercab robotaxi, Robovan, and humanoid robots (Optimus Gen), which were unveiled during the "We, Robot" event that caused a TSLA stock drop on October 11.
As a result, Tesla's pre-market share price shows a rise of over 11%, indicating that today's trading may open around $235.
The technical analysis of Tesla's (TSLA) stock chart provides crucial insights into the stock's recent bullish momentum:
→ Since May, Tesla's stock has moved within an upward channel (shown in blue), with the lower boundary acting as significant support (indicated by blue arrows).
→ The downward rounding in October (shown by the red arrow) may signal bearish pressure aimed at testing this support.
The bullish momentum following the earnings report suggests that the attempt to break below the channel's lower boundary failed. Therefore, bulls may continue to push TSLA's price upwards within the existing channel. It's possible we could see another attempt to challenge the key resistance level at $260 by the end of the year.
Trade global index CFDs with zero commission and tight spreads. Open your FXOpen account now or learn more about trading index CFDs with FXOpen.
CFDs are complex instruments and come with a high risk of losing your money.
This article represents the opinion of the Companies operating under the FXOpen brand only. It is not to be construed as an offer, solicitation, or recommendation with respect to products and services provided by the Companies operating under the FXOpen brand, nor is it to be considered financial advice.
Tesla (TSLA) Shares Surge by 11%
As shown by Tesla's stock chart, trading closed below $213.50 yesterday. However, following the main trading session, the company reported its third-quarter earnings:
→ Earnings per share (EPS): actual = $0.72, expected = $0.59
→ Gross revenue: actual = $25.46 billion, expected = $25.18 billion
Additionally, Tesla forecasted a sharp increase in vehicle sales, assuring investors that CEO Elon Musk remains focused on expanding the company's core electric vehicle business.
According to Reuters, this earnings report positively impacted investors who were previously concerned about:
→ Profit margins shrinking due to price cuts.
→ Musk potentially being distracted by new projects like the Cybercab robotaxi, Robovan, and humanoid robots (Optimus Gen), which were unveiled during the "We, Robot" event that caused a TSLA stock drop on October 11.
As a result, Tesla's pre-market share price shows a rise of over 11%, indicating that today's trading may open around $235.
The technical analysis of Tesla's (TSLA) stock chart provides crucial insights into the stock's recent bullish momentum:
→ Since May, Tesla's stock has moved within an upward channel (shown in blue), with the lower boundary acting as significant support (indicated by blue arrows).
→ The downward rounding in October (shown by the red arrow) may signal bearish pressure aimed at testing this support.
The bullish momentum following the earnings report suggests that the attempt to break below the channel's lower boundary failed. Therefore, bulls may continue to push TSLA's price upwards within the existing channel. It's possible we could see another attempt to challenge the key resistance level at $260 by the end of the year.
Trade global index CFDs with zero commission and tight spreads. Open your FXOpen account now or learn more about trading index CFDs with FXOpen.
CFDs are complex instruments and come with a high risk of losing your money.
This article represents the opinion of the Companies operating under the FXOpen brand only. It is not to be construed as an offer, solicitation, or recommendation with respect to products and services provided by the Companies operating under the FXOpen brand, nor is it to be considered financial advice.
👍2
#dax40 #stockmarket #stocktrading #MarketUpdates
DAX 40 Loses Upward Momentum
Today, Germany's PMI data was released, according to Forex Factory:
→ German Flash Manufacturing PMI: actual = 42.6, expected = 40.7, previous = 40.6;
→ German Flash Services PMI: actual = 51.4, expected = 50.6, previous = 50.6.
The DAX 40 index (Germany 40 mini on FXOpen) showed a slight intraday increase, which could be viewed positively, especially given that last week, the index reached a yearly high.
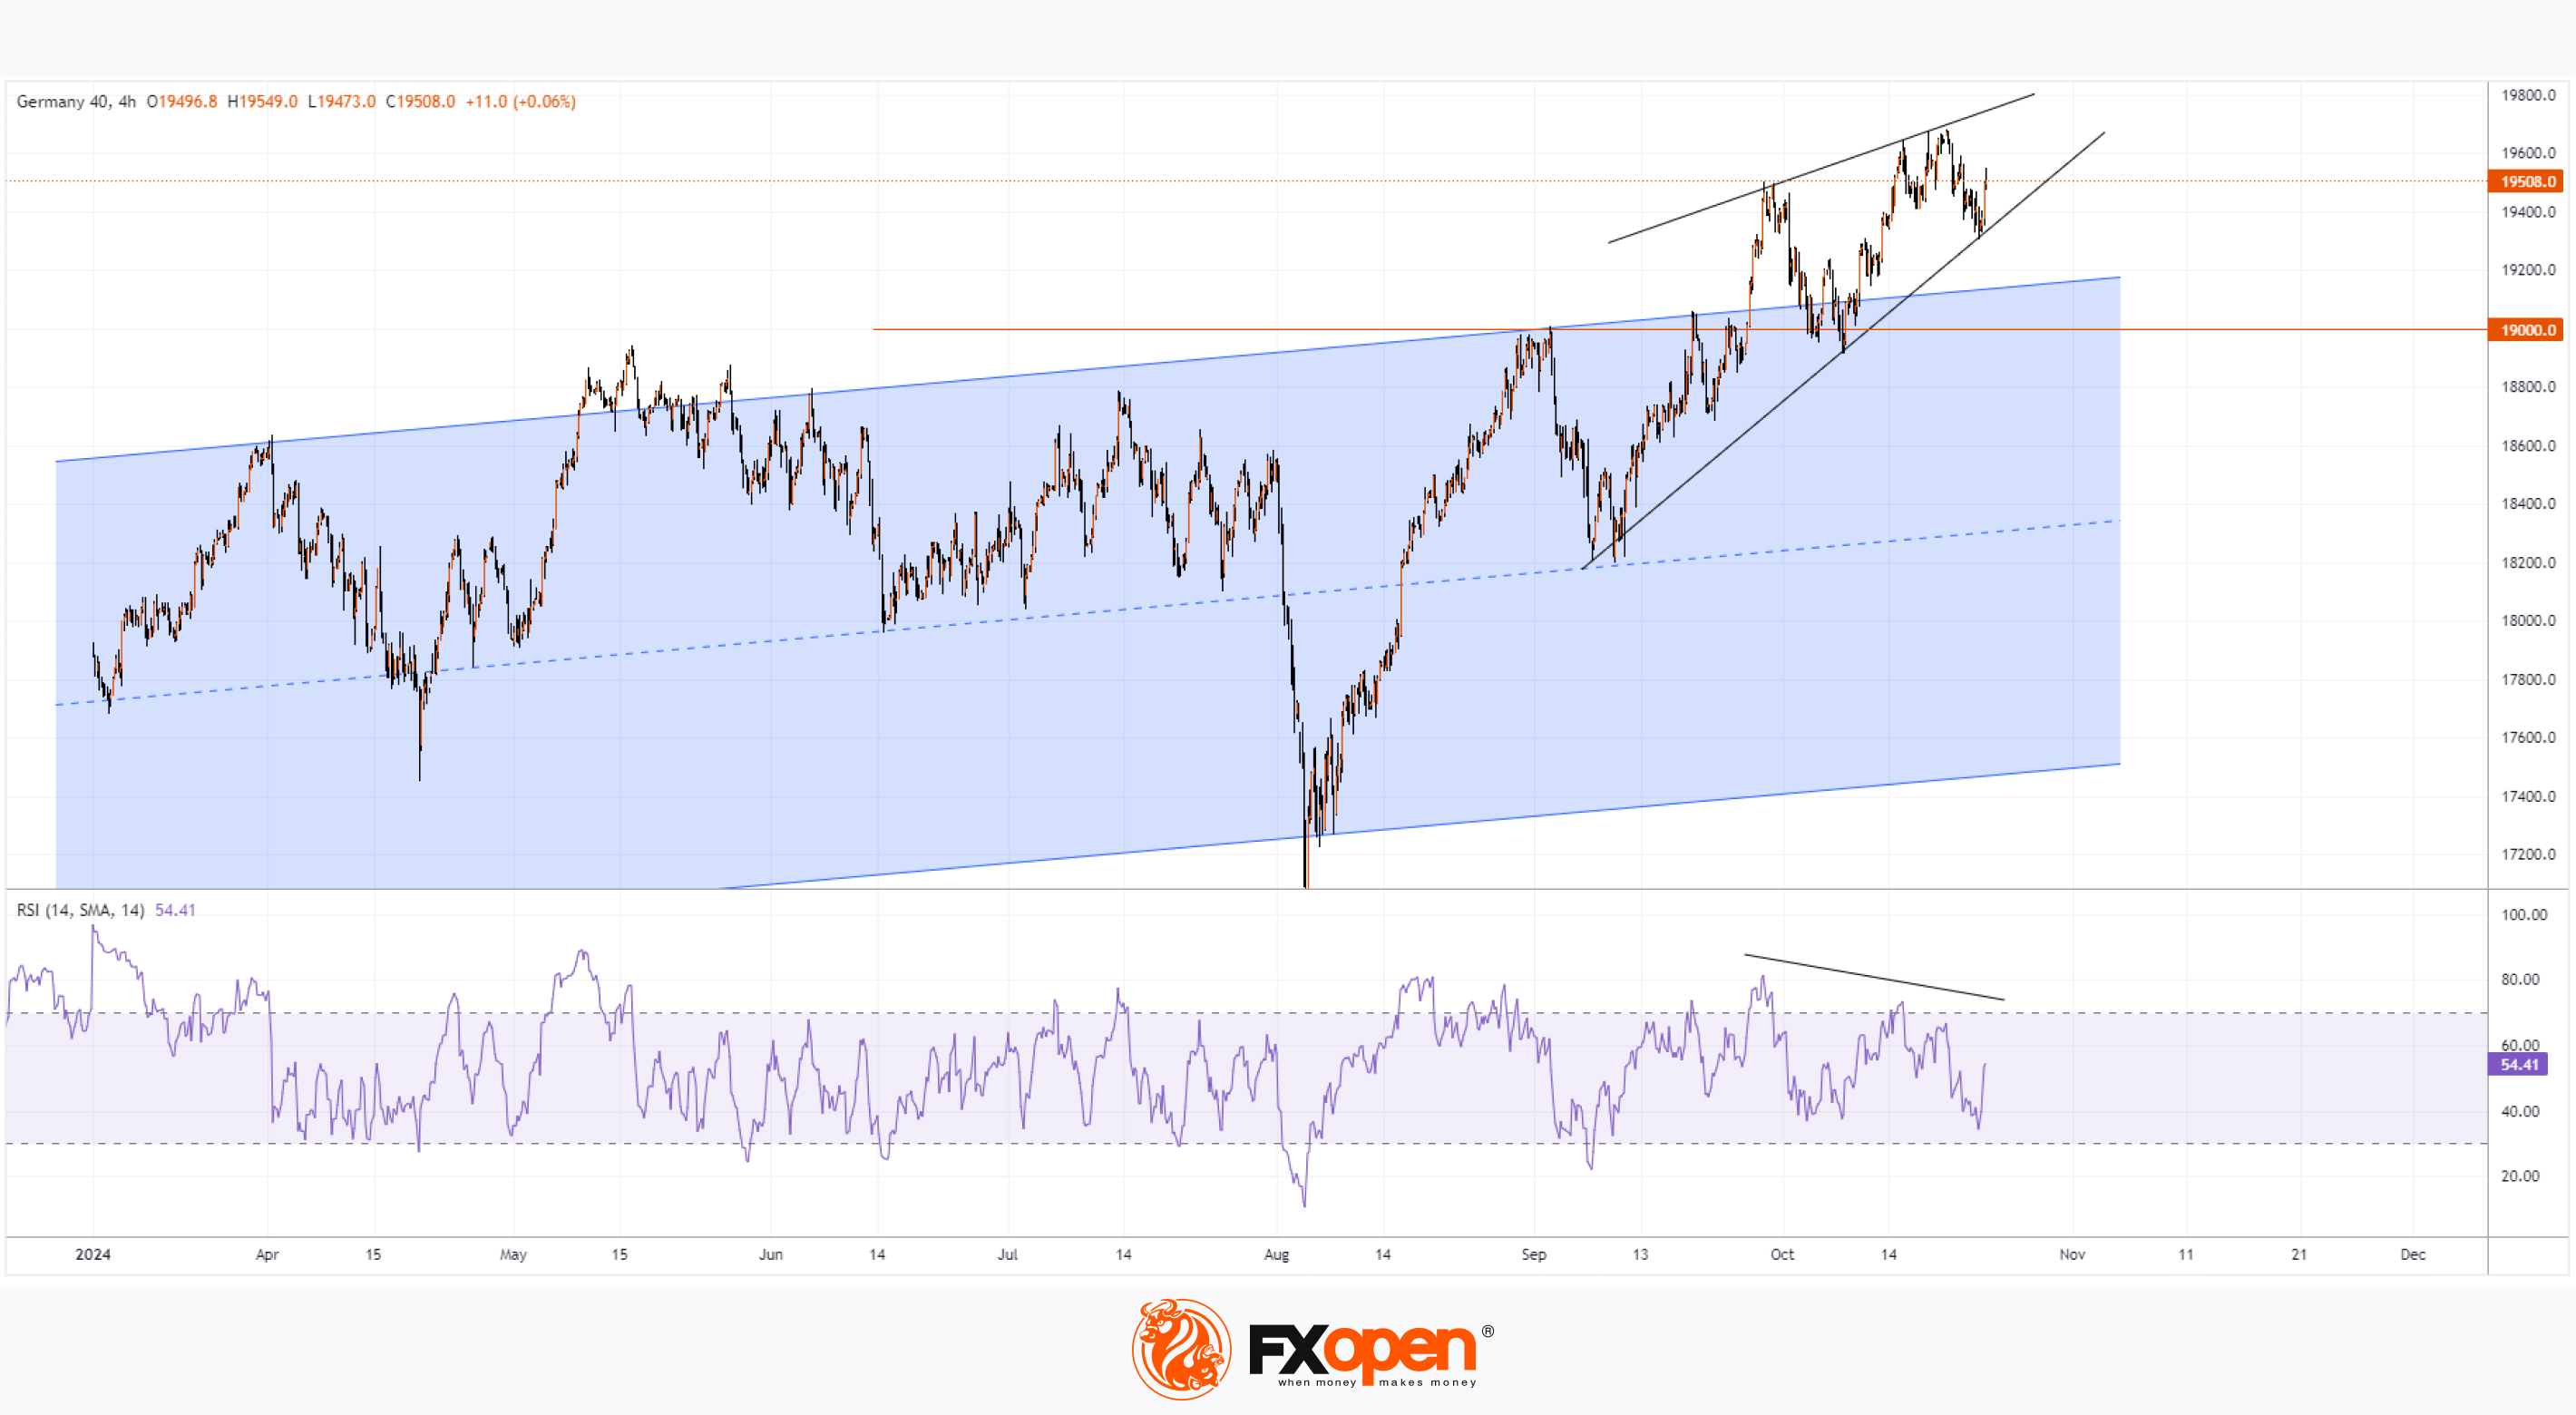
However, the chart for the DAX 40 (Germany 40 mini on FXOpen) shows signs of the upward momentum slowing:
→ The RSI indicator is showing bearish divergence;
→ Price fluctuations are forming a triangle that could turn into a bearish reversal pattern known as a Bearish Rising Wedge (marked by black lines).
If a bearish break below the lower black line occurs, it might indicate that the bulls failed to maintain the momentum above the blue channel, within which the DAX 40 index had fluctuated for most of 2024.
Thus, a potential pullback towards the psychological level of 19,000 should not be ruled out.
Trade global index CFDs with zero commission and tight spreads. Open your FXOpen account now or learn more about trading index CFDs with FXOpen.
CFDs are complex instruments and come with a high risk of losing your money.
This article represents the opinion of the Companies operating under the FXOpen brand only. It is not to be construed as an offer, solicitation, or recommendation with respect to products and services provided by the Companies operating under the FXOpen brand, nor is it to be considered financial advice.
DAX 40 Loses Upward Momentum
Today, Germany's PMI data was released, according to Forex Factory:
→ German Flash Manufacturing PMI: actual = 42.6, expected = 40.7, previous = 40.6;
→ German Flash Services PMI: actual = 51.4, expected = 50.6, previous = 50.6.
The DAX 40 index (Germany 40 mini on FXOpen) showed a slight intraday increase, which could be viewed positively, especially given that last week, the index reached a yearly high.
However, the chart for the DAX 40 (Germany 40 mini on FXOpen) shows signs of the upward momentum slowing:
→ The RSI indicator is showing bearish divergence;
→ Price fluctuations are forming a triangle that could turn into a bearish reversal pattern known as a Bearish Rising Wedge (marked by black lines).
If a bearish break below the lower black line occurs, it might indicate that the bulls failed to maintain the momentum above the blue channel, within which the DAX 40 index had fluctuated for most of 2024.
Thus, a potential pullback towards the psychological level of 19,000 should not be ruled out.
Trade global index CFDs with zero commission and tight spreads. Open your FXOpen account now or learn more about trading index CFDs with FXOpen.
CFDs are complex instruments and come with a high risk of losing your money.
This article represents the opinion of the Companies operating under the FXOpen brand only. It is not to be construed as an offer, solicitation, or recommendation with respect to products and services provided by the Companies operating under the FXOpen brand, nor is it to be considered financial advice.
👍2
#MarketNews #marketanalysis #stocktrading #stockmarket
Coca-Cola (KO) Share Price Drops Sharply After Earnings Report
On 23 October, Coca-Cola (KO) released its third-quarter earnings, which exceeded forecasts:
→ Earnings per share (EPS): Actual = $0.77; Expected = $0.74
→ Gross revenue: Actual = $11.95 billion; Expected = $11.69 billion
Despite these positive results, KO's share price saw a sharp decline, likely due to market concerns about fourth-quarter sales forecasts, which face risks associated with currency fluctuations.
Technical Analysis of Coca-Cola (KO) Stock Chart:
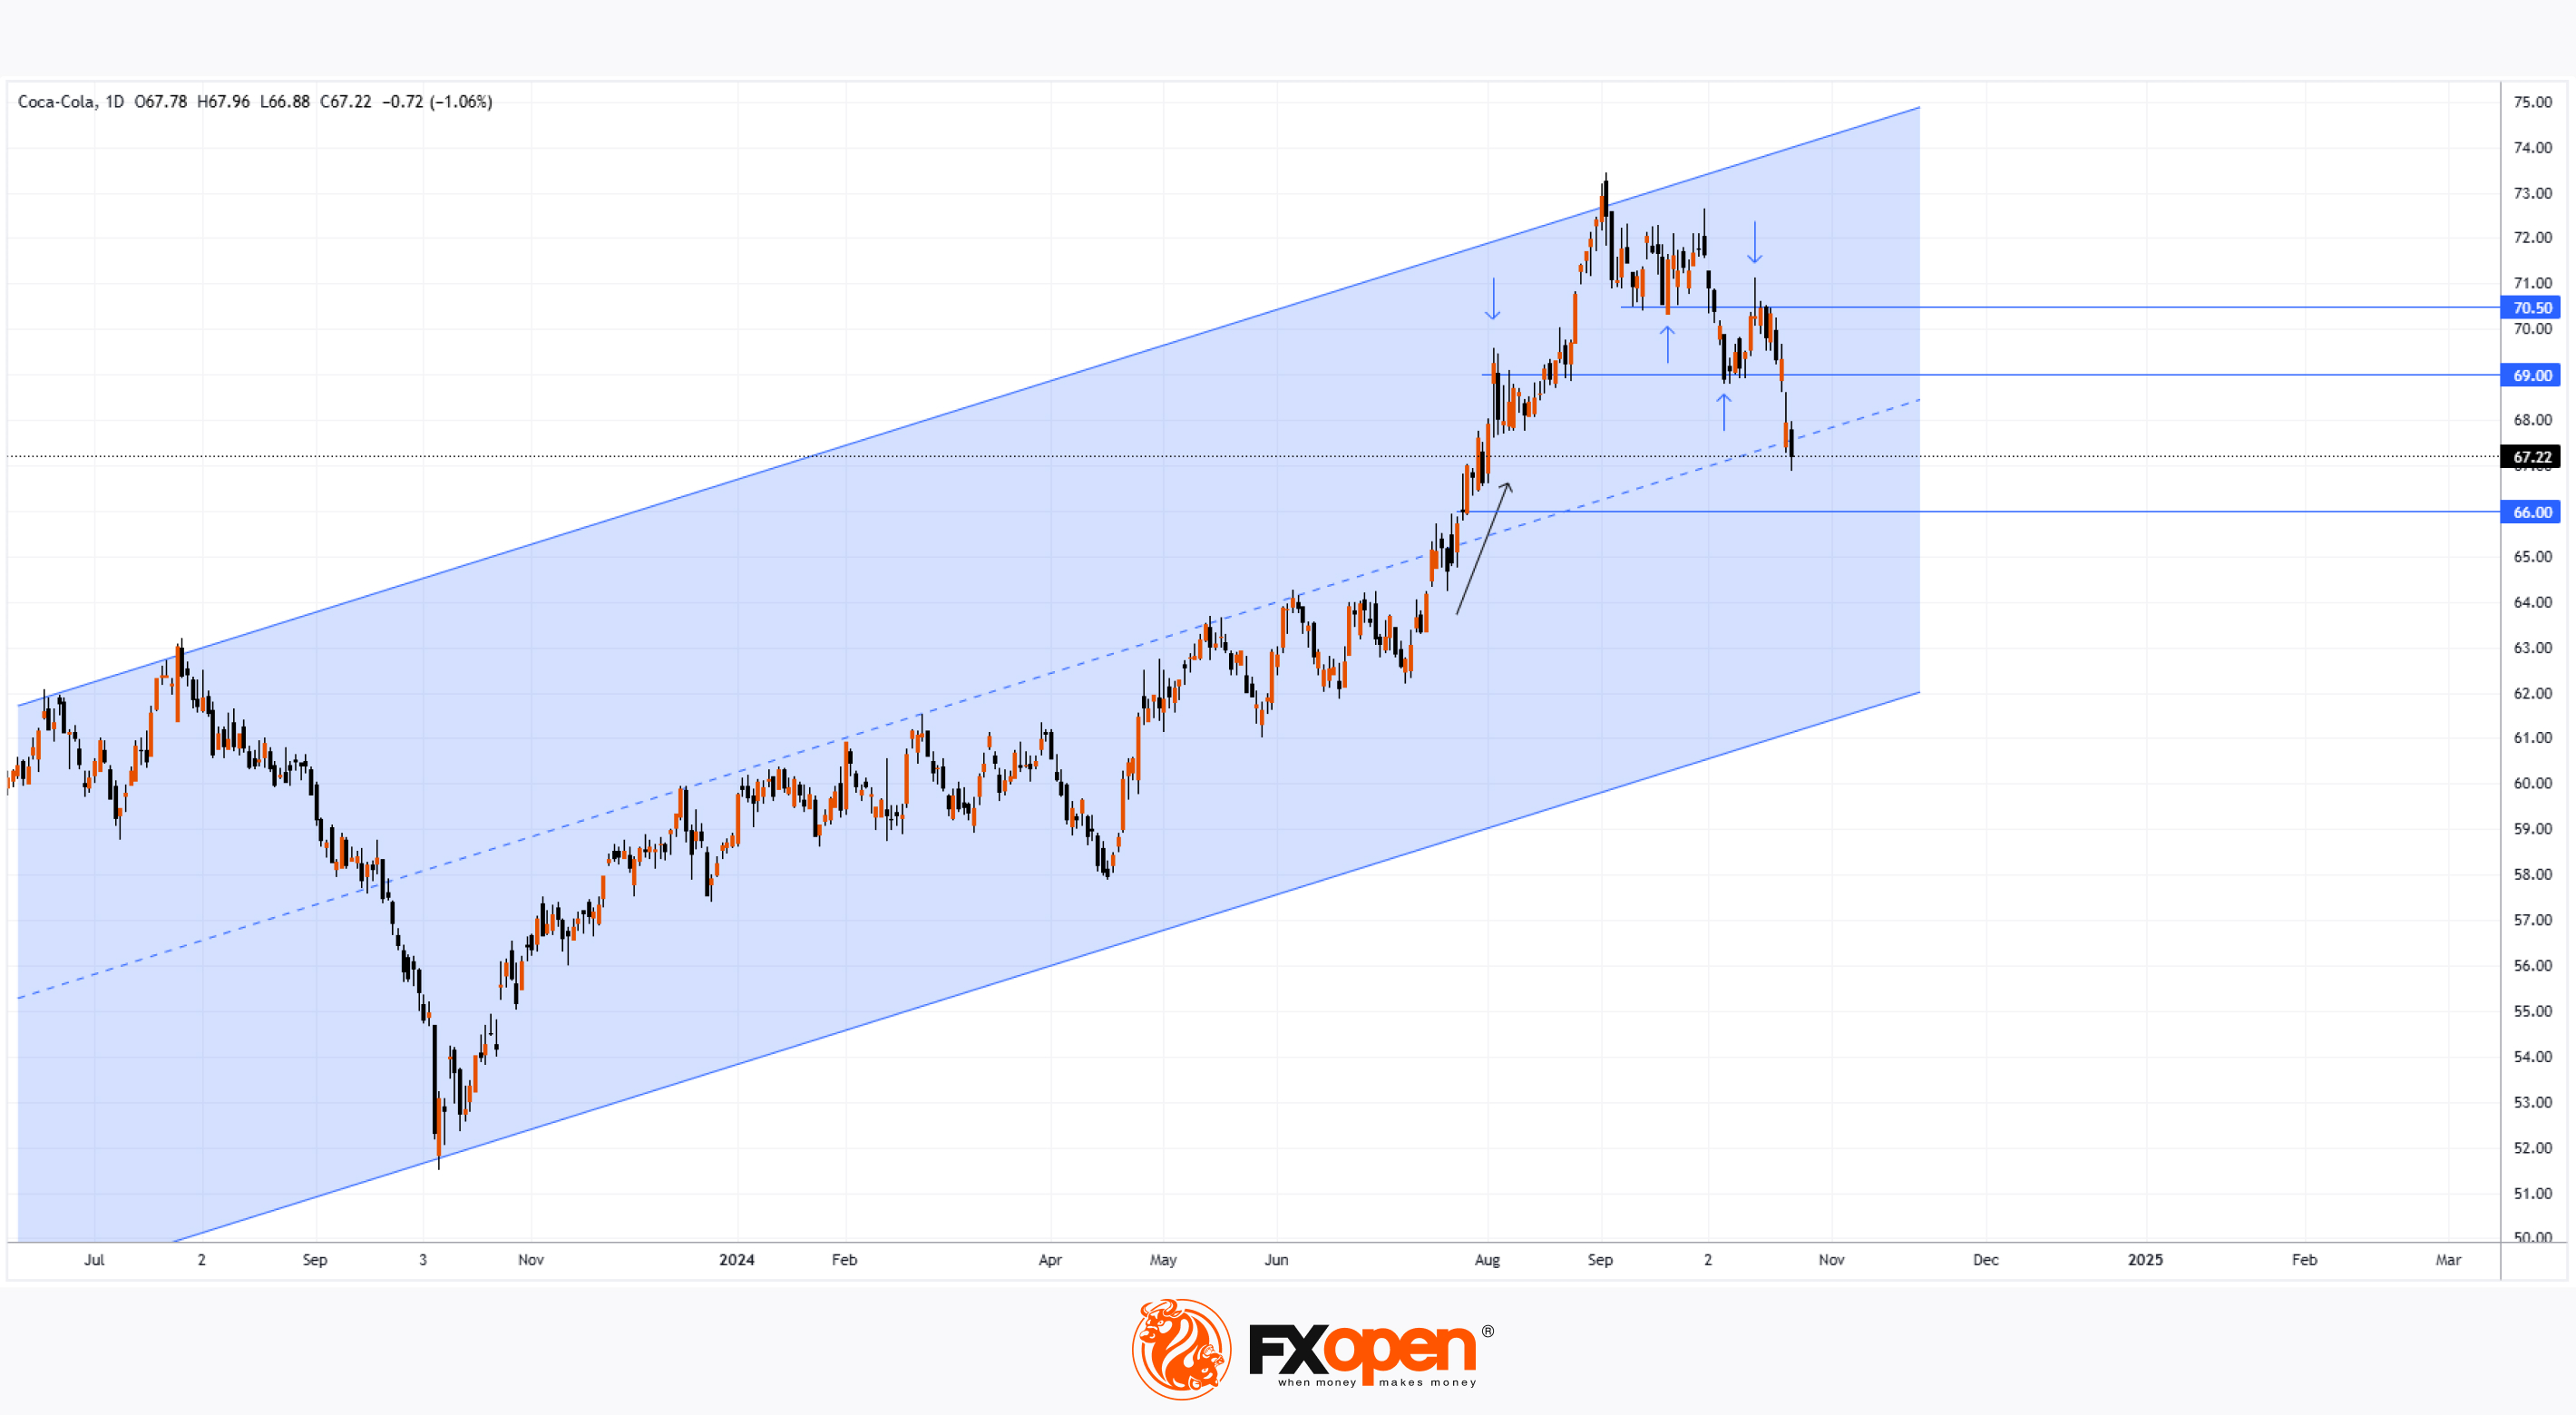
→ In 2024, price fluctuations formed an upward channel (shown in blue), with a notable surge in early August (marked by a black arrow), even as broader markets were under pressure from recession fears and the decline of the Japanese stock market. This suggests that buyer interest around the $66 level remains strong.
→ Since then, the price has oscillated between $69 and $70.50, with these levels alternately serving as support and resistance (marked by blue arrows), as well as testing the upper boundary of the blue channel.
→ Currently, KO’s price sits near the midpoint of the blue channel, indicating potential support at this level, which could significantly slow the downward momentum observed post-earnings.
Furthermore, bulls may attempt to resume the upward trend within the blue channel, with $69 acting as a key level to test the strength of demand.
Analysts remain optimistic. According to TipRanks data: → 11 of 15 analysts recommend buying KO stock;
→ The average KO price target is $75.46 over the next 12 months.
Trade global index CFDs with zero commission and tight spreads. Open your FXOpen account now or learn more about trading index CFDs with FXOpen.
CFDs are complex instruments and come with a high risk of losing your money.
This article represents the opinion of the Companies operating under the FXOpen brand only. It is not to be construed as an offer, solicitation, or recommendation with respect to products and services provided by the Companies operating under the FXOpen brand, nor is it to be considered financial advice.
Coca-Cola (KO) Share Price Drops Sharply After Earnings Report
On 23 October, Coca-Cola (KO) released its third-quarter earnings, which exceeded forecasts:
→ Earnings per share (EPS): Actual = $0.77; Expected = $0.74
→ Gross revenue: Actual = $11.95 billion; Expected = $11.69 billion
Despite these positive results, KO's share price saw a sharp decline, likely due to market concerns about fourth-quarter sales forecasts, which face risks associated with currency fluctuations.
Technical Analysis of Coca-Cola (KO) Stock Chart:
→ In 2024, price fluctuations formed an upward channel (shown in blue), with a notable surge in early August (marked by a black arrow), even as broader markets were under pressure from recession fears and the decline of the Japanese stock market. This suggests that buyer interest around the $66 level remains strong.
→ Since then, the price has oscillated between $69 and $70.50, with these levels alternately serving as support and resistance (marked by blue arrows), as well as testing the upper boundary of the blue channel.
→ Currently, KO’s price sits near the midpoint of the blue channel, indicating potential support at this level, which could significantly slow the downward momentum observed post-earnings.
Furthermore, bulls may attempt to resume the upward trend within the blue channel, with $69 acting as a key level to test the strength of demand.
Analysts remain optimistic. According to TipRanks data: → 11 of 15 analysts recommend buying KO stock;
→ The average KO price target is $75.46 over the next 12 months.
Trade global index CFDs with zero commission and tight spreads. Open your FXOpen account now or learn more about trading index CFDs with FXOpen.
CFDs are complex instruments and come with a high risk of losing your money.
This article represents the opinion of the Companies operating under the FXOpen brand only. It is not to be construed as an offer, solicitation, or recommendation with respect to products and services provided by the Companies operating under the FXOpen brand, nor is it to be considered financial advice.
👍2
#crudeoil #oilprices #MarketUpdates
A Bearish Gap on the Brent Crude Oil Chart
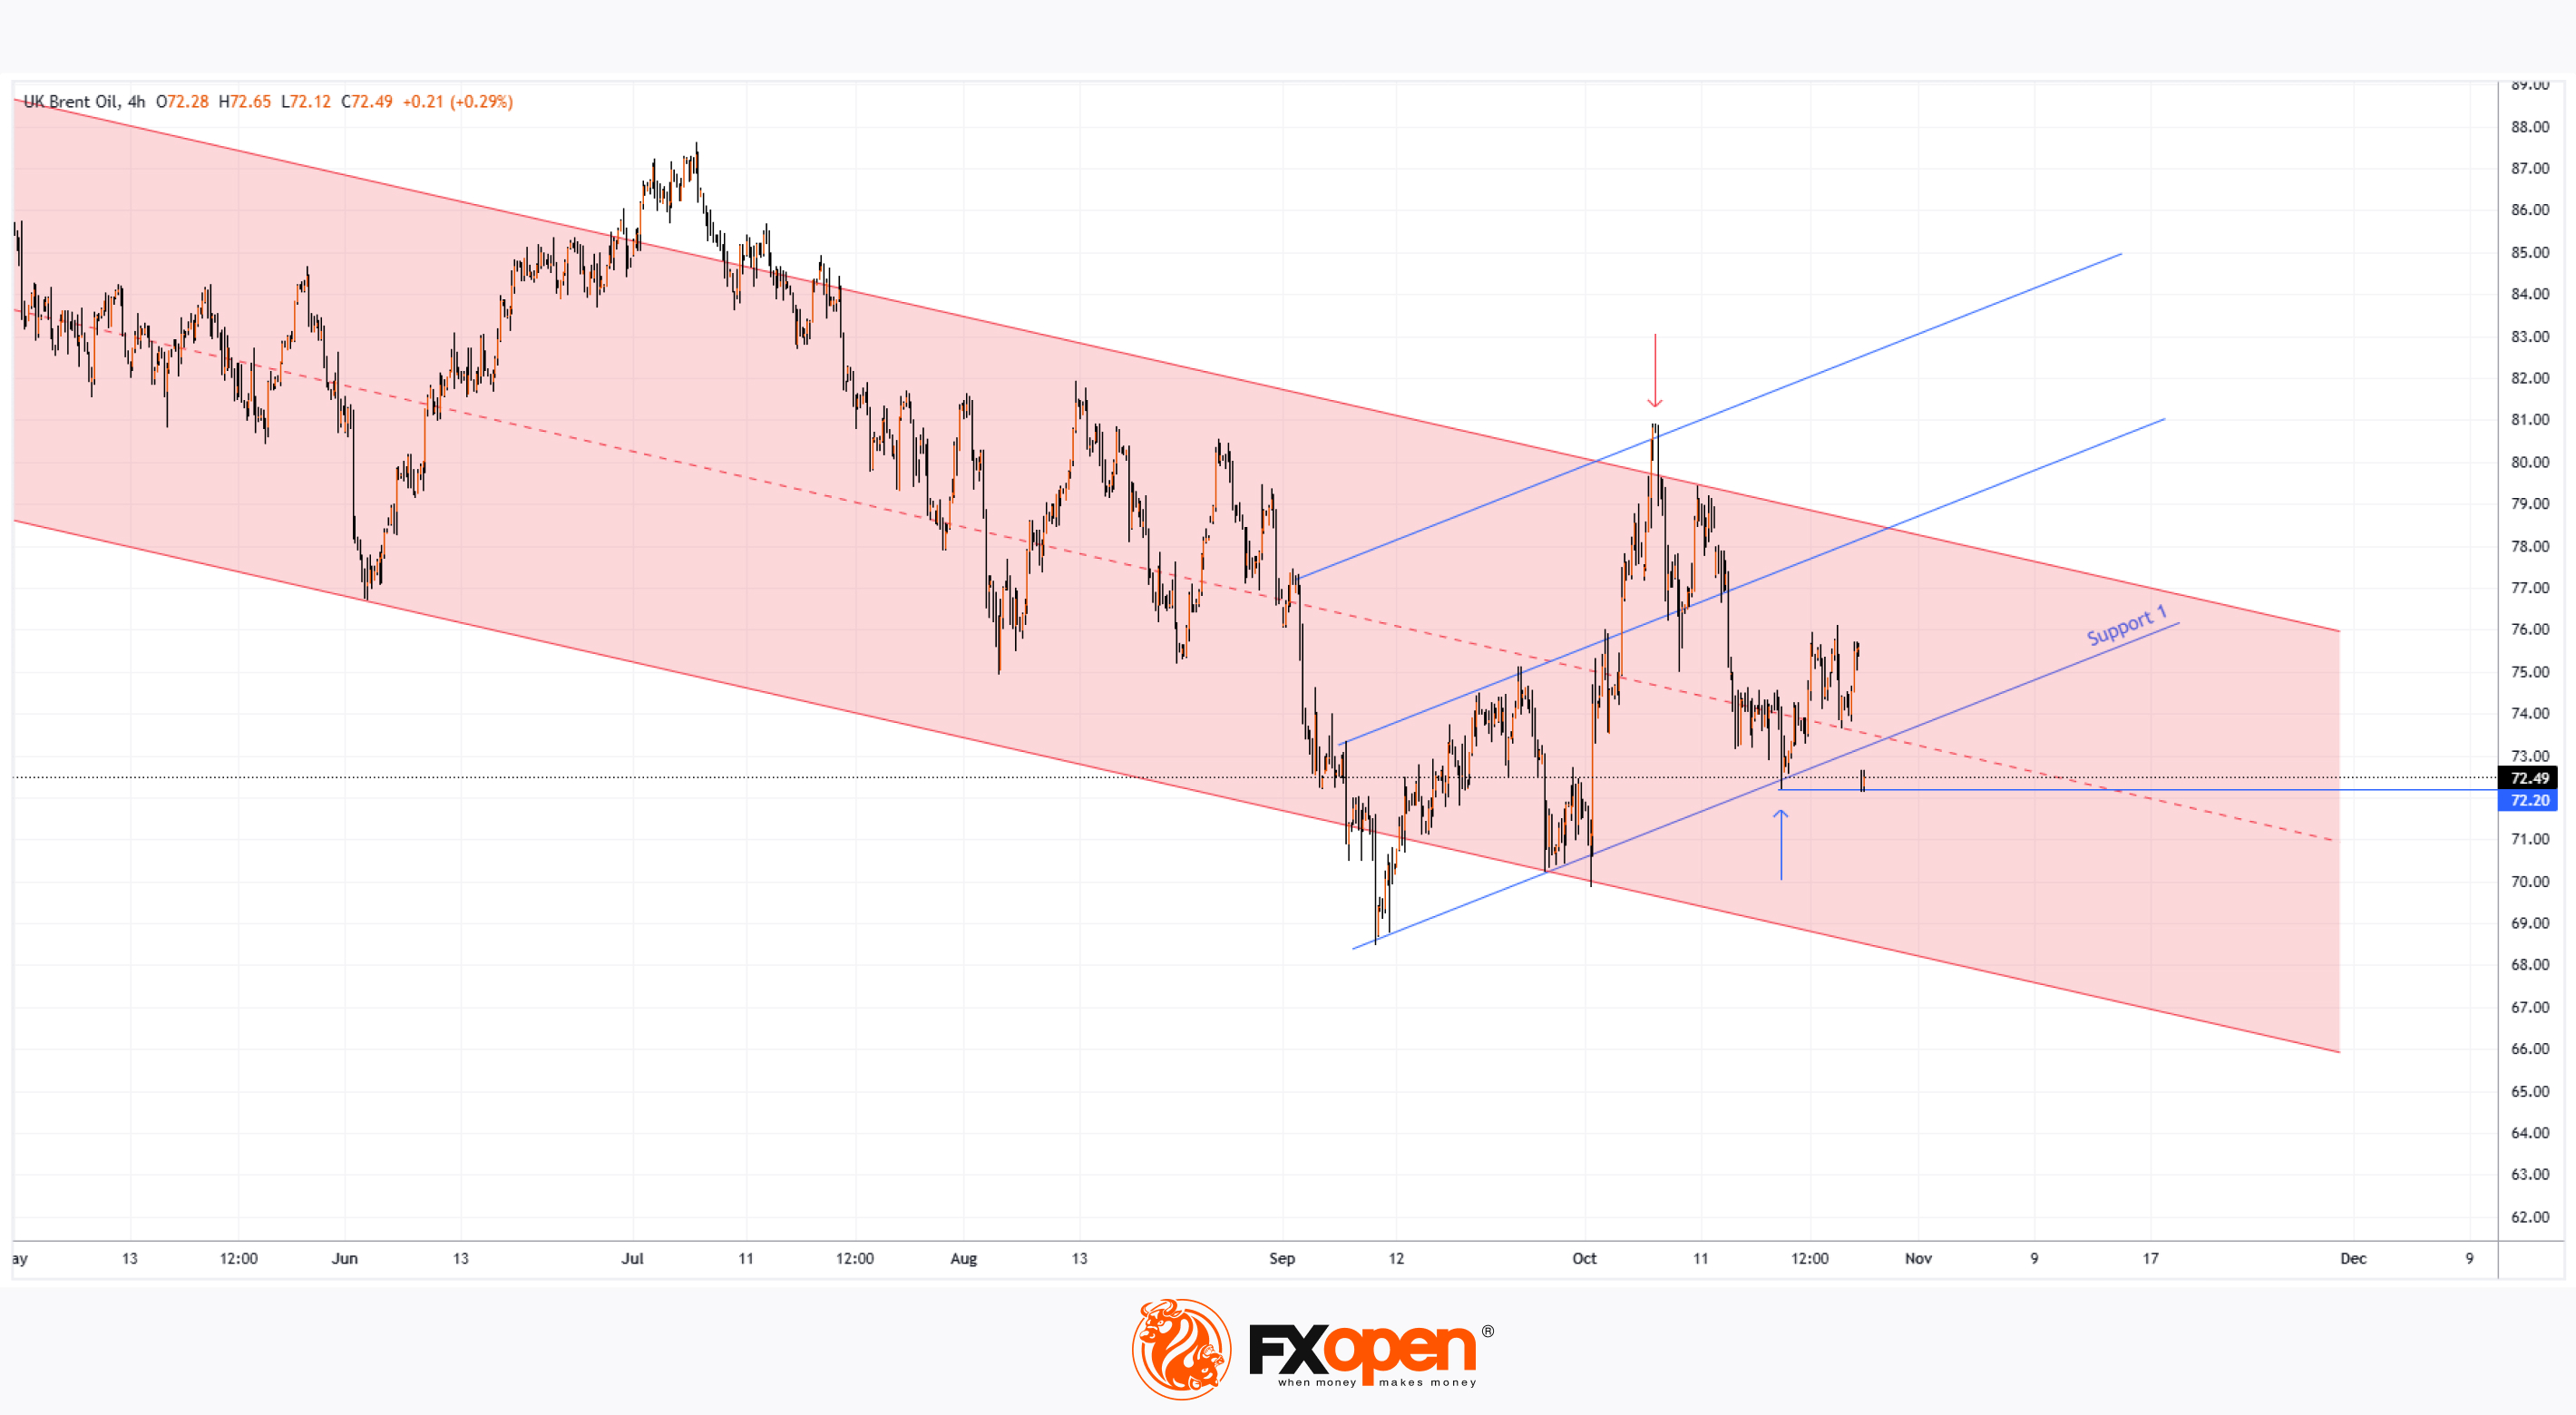
As the XBR/USD chart shows, Brent crude oil prices formed a gap at the start of this week: while Friday’s session closed at 75.60, Monday’s opening price dropped below 72.60.
According to Reuters, this development is tied to the fact that Israel’s recent missile strike on Iran did not impact oil or nuclear facilities, reducing the immediate risk of escalation.
Will Brent Crude Oil Prices Continue Falling?
In terms of technical analysis for XBR/USD today:
→ The price is within a descending channel (shown in red) that has been active since early summer. A bullish breakout attempt on 7 October was unsuccessful (marked by a red arrow), and Brent crude has since dropped over 10%. Price consolidation between 17-22 October near the median of this red channel confirms its current relevance.
→ Bulls had an opportunity to show strength with a bounce (marked by a blue arrow) from Support Line 1, which forms part of an upward structure represented by blue lines. However, today’s bearish gap erased these gains.
This allows traders to consider two scenarios:
→ Bearish Scenario: After breaking below Support, Brent could continue along the red descending channel. If the channel’s median line holds as resistance, this bearish outlook may be confirmed.
→ Bullish Scenario: Today’s bearish breach of the 18 October low could prove false, leading to a potential recovery back toward the structure of three blue lines.
Ultimately, which scenario plays out will largely depend on volatile news related to geopolitical tensions, the U.S. presidential election, and economic data from major economies.
Start trading commodities with tight spreads. Open your trading account now or learn more about trading commodity CFDs with FXOpen.
CFDs are complex instruments and come with a high risk of losing your money.
This article represents the opinion of the Companies operating under the FXOpen brand only. It is not to be construed as an offer, solicitation, or recommendation with respect to products and services provided by the Companies operating under the FXOpen brand, nor is it to be considered financial advice.
A Bearish Gap on the Brent Crude Oil Chart
As the XBR/USD chart shows, Brent crude oil prices formed a gap at the start of this week: while Friday’s session closed at 75.60, Monday’s opening price dropped below 72.60.
According to Reuters, this development is tied to the fact that Israel’s recent missile strike on Iran did not impact oil or nuclear facilities, reducing the immediate risk of escalation.
Will Brent Crude Oil Prices Continue Falling?
In terms of technical analysis for XBR/USD today:
→ The price is within a descending channel (shown in red) that has been active since early summer. A bullish breakout attempt on 7 October was unsuccessful (marked by a red arrow), and Brent crude has since dropped over 10%. Price consolidation between 17-22 October near the median of this red channel confirms its current relevance.
→ Bulls had an opportunity to show strength with a bounce (marked by a blue arrow) from Support Line 1, which forms part of an upward structure represented by blue lines. However, today’s bearish gap erased these gains.
This allows traders to consider two scenarios:
→ Bearish Scenario: After breaking below Support, Brent could continue along the red descending channel. If the channel’s median line holds as resistance, this bearish outlook may be confirmed.
→ Bullish Scenario: Today’s bearish breach of the 18 October low could prove false, leading to a potential recovery back toward the structure of three blue lines.
Ultimately, which scenario plays out will largely depend on volatile news related to geopolitical tensions, the U.S. presidential election, and economic data from major economies.
Start trading commodities with tight spreads. Open your trading account now or learn more about trading commodity CFDs with FXOpen.
CFDs are complex instruments and come with a high risk of losing your money.
This article represents the opinion of the Companies operating under the FXOpen brand only. It is not to be construed as an offer, solicitation, or recommendation with respect to products and services provided by the Companies operating under the FXOpen brand, nor is it to be considered financial advice.
👍2
#USDJPY #marketanalysis #MarketNews #tradingtips
USD/JPY Chart Analysis: Rate Hits Autumn High
Today’s USD/JPY chart indicates that the U.S. dollar has strengthened against the yen by over 6.6% since the beginning of the month. Starting this trading week, the rate has surpassed 153 yen per dollar, a level not seen since August 31.
This bullish sentiment towards the dollar has been driven by the outcome of Japan’s parliamentary elections over the weekend. According to Reuters, investors believe that the loss of the ruling coalition’s majority in Japan’s parliament reduces the likelihood of a future interest rate hike, contributing to the yen's weakening.
On October 10, there was speculation that bears might halt the October rally (marked by the blue channel) and guide the rate back down within a descending channel from its upper boundary (marked in red), with the psychological level of 150 yen per dollar acting as resistance.
However, bulls maintained their momentum (which originated from the psychological level of 140 yen) and continued the rally, breaking through this resistance. Per USD/JPY technical analysis, the 150 yen level may now serve as a support line.
The RSI indicator currently suggests the formation of a potential bearish divergence, hinting that a slight correction might occur as the market anticipates key upcoming news, which could heavily influence the sustainability of the current USD/JPY rally:
→ The Bank of Japan’s interest rate decision, expected on Thursday
→ Key U.S. labor market data releases scheduled for later in the week
Trade over 50 forex markets 24 hours a day with FXOpen. Take advantage of low commissions, deep liquidity, and spreads from 0.0 pips. Open your FXOpen account now or learn more about trading forex with FXOpen.
CFDs are complex instruments and come with a high risk of losing your money.
This article represents the opinion of the Companies operating under the FXOpen brand only. It is not to be construed as an offer, solicitation, or recommendation with respect to products and services provided by the Companies operating under the FXOpen brand, nor is it to be considered financial advice.
USD/JPY Chart Analysis: Rate Hits Autumn High
Today’s USD/JPY chart indicates that the U.S. dollar has strengthened against the yen by over 6.6% since the beginning of the month. Starting this trading week, the rate has surpassed 153 yen per dollar, a level not seen since August 31.
This bullish sentiment towards the dollar has been driven by the outcome of Japan’s parliamentary elections over the weekend. According to Reuters, investors believe that the loss of the ruling coalition’s majority in Japan’s parliament reduces the likelihood of a future interest rate hike, contributing to the yen's weakening.
On October 10, there was speculation that bears might halt the October rally (marked by the blue channel) and guide the rate back down within a descending channel from its upper boundary (marked in red), with the psychological level of 150 yen per dollar acting as resistance.
However, bulls maintained their momentum (which originated from the psychological level of 140 yen) and continued the rally, breaking through this resistance. Per USD/JPY technical analysis, the 150 yen level may now serve as a support line.
The RSI indicator currently suggests the formation of a potential bearish divergence, hinting that a slight correction might occur as the market anticipates key upcoming news, which could heavily influence the sustainability of the current USD/JPY rally:
→ The Bank of Japan’s interest rate decision, expected on Thursday
→ Key U.S. labor market data releases scheduled for later in the week
Trade over 50 forex markets 24 hours a day with FXOpen. Take advantage of low commissions, deep liquidity, and spreads from 0.0 pips. Open your FXOpen account now or learn more about trading forex with FXOpen.
CFDs are complex instruments and come with a high risk of losing your money.
This article represents the opinion of the Companies operating under the FXOpen brand only. It is not to be construed as an offer, solicitation, or recommendation with respect to products and services provided by the Companies operating under the FXOpen brand, nor is it to be considered financial advice.

👍1
#stockmarket #stocktrading #MCD #MarketUpdates
McDonald's (MCD) Stock Trades Below $300 Ahead of Earnings Report
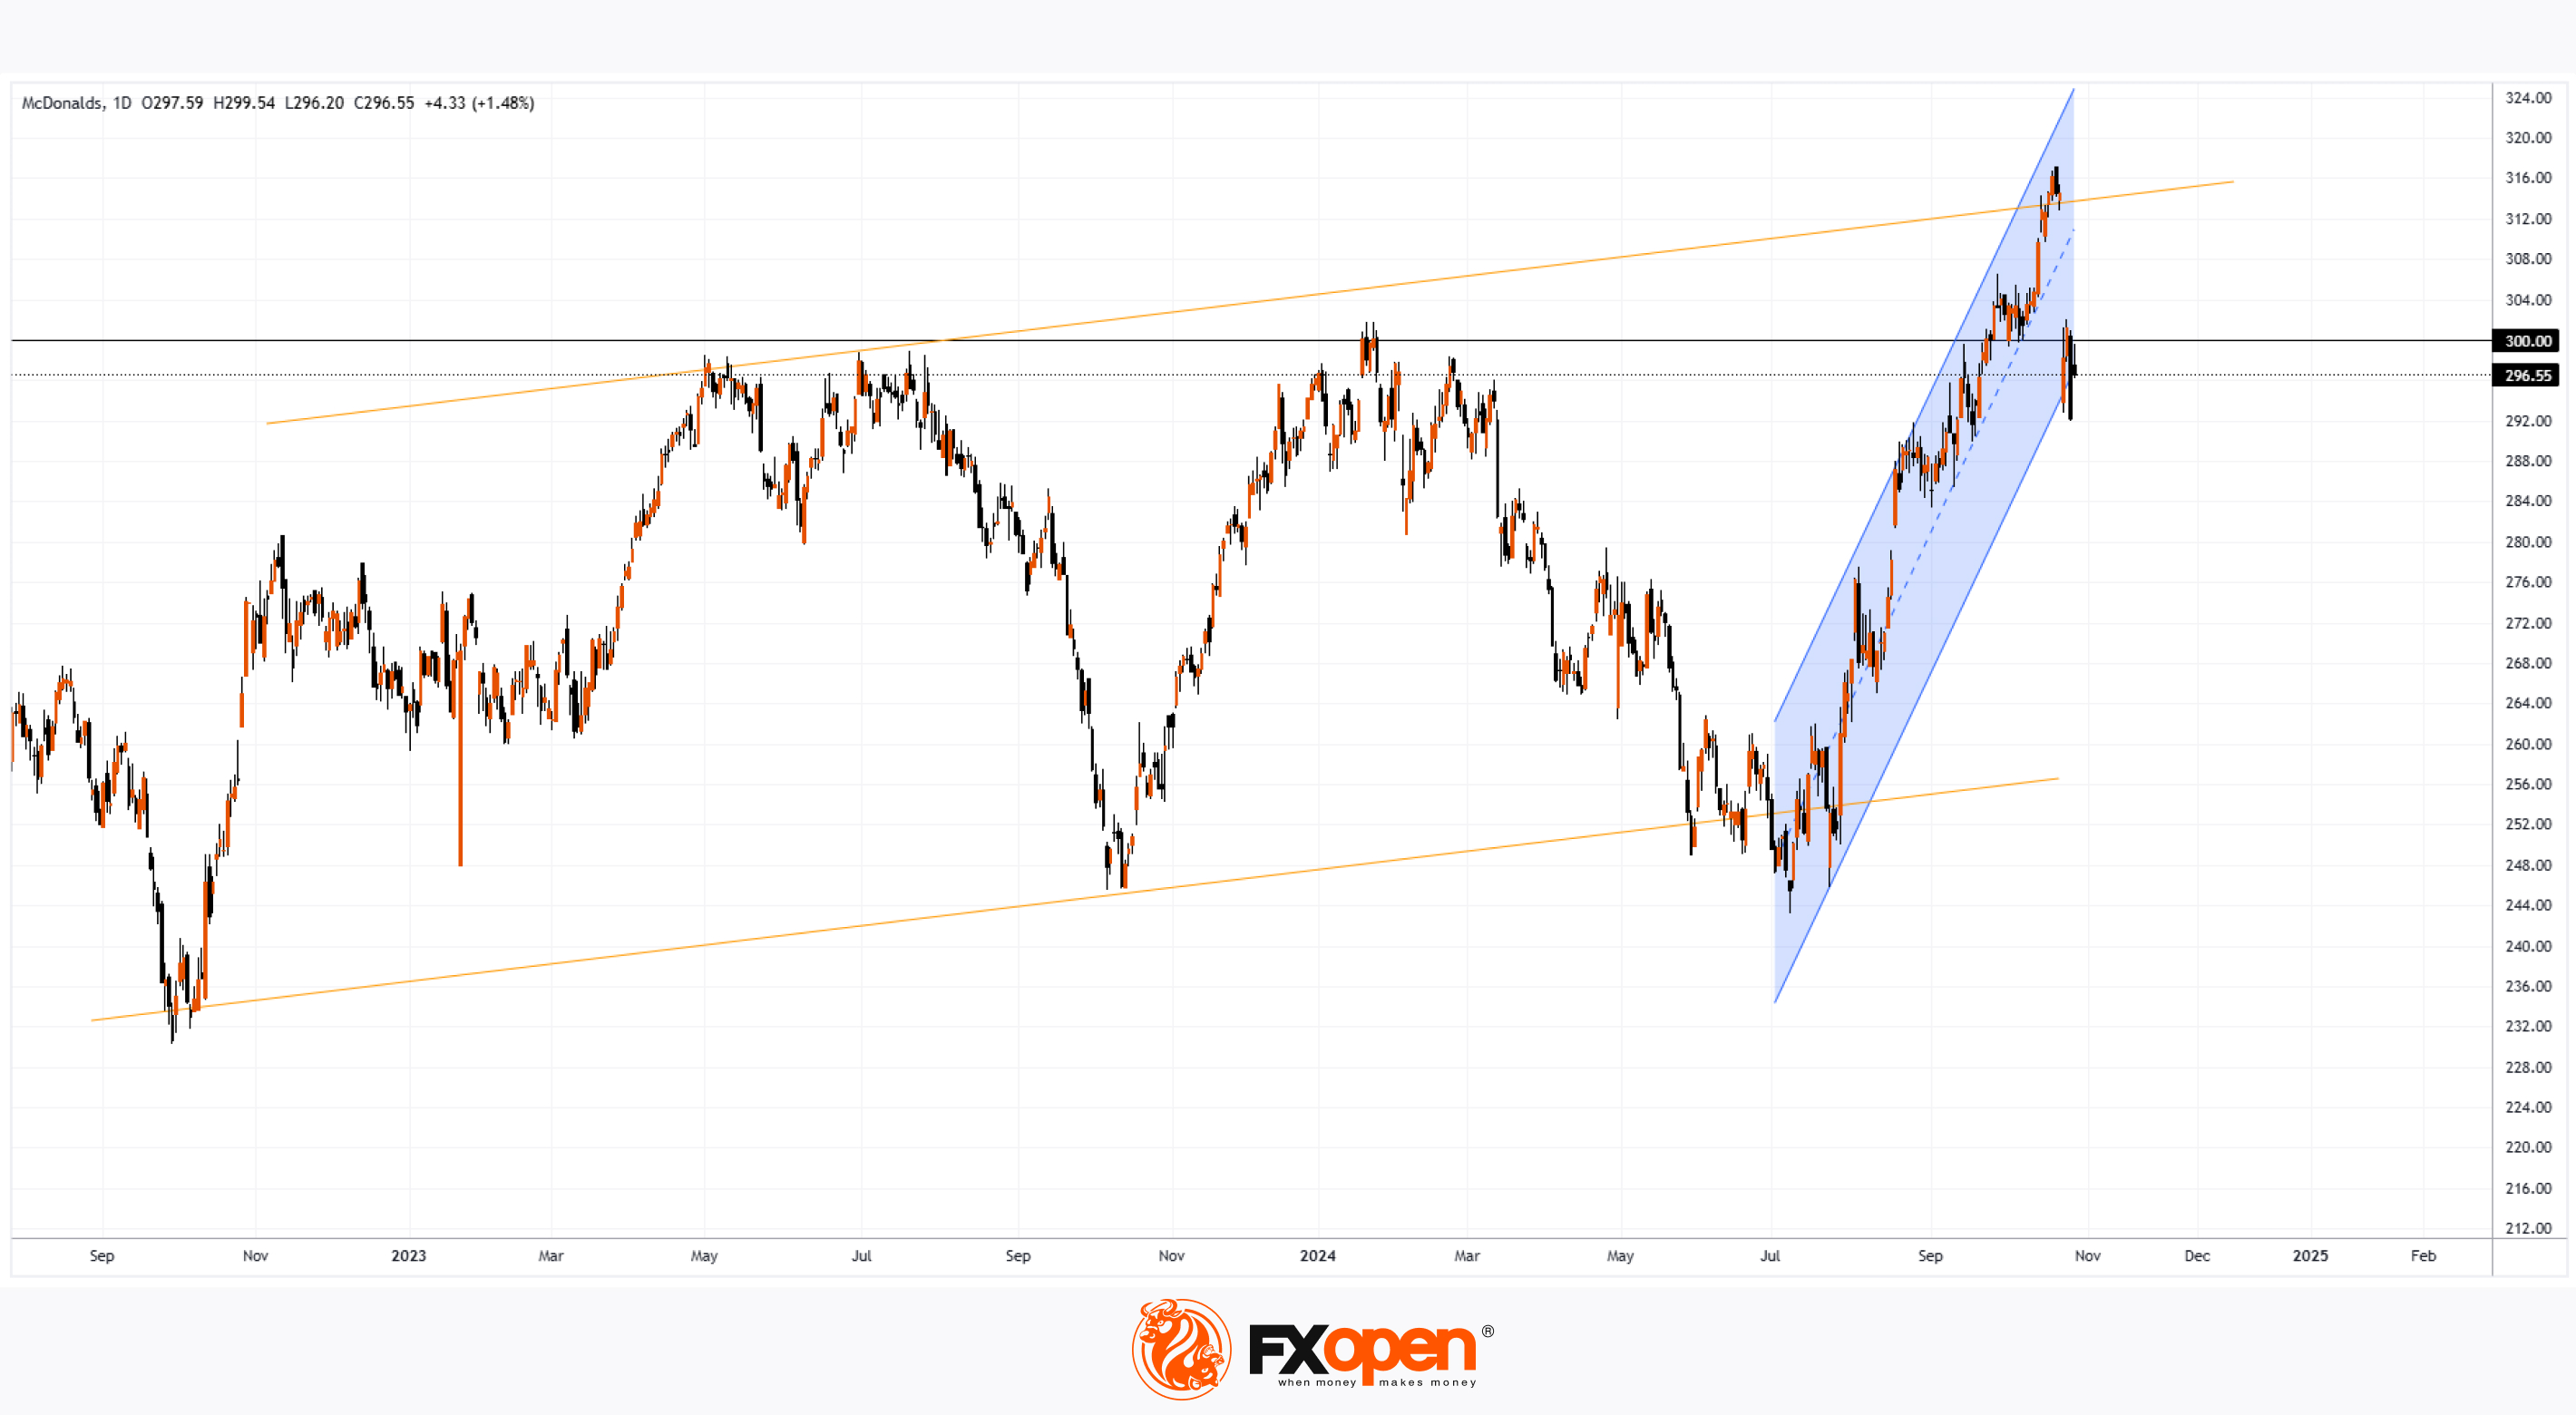
The $300 level has proven psychologically significant for McDonald’s (MCD) stock:
→ In summer 2023, bullish investors failed to push the price above this mark, leading to a decline from $298 in July to $246 by October.
→ Again, in January 2024, the price briefly surpassed $300 but quickly dropped, eventually falling to $245 by July.
This autumn, it appeared the level had been breached when an uptrend (highlighted by the blue channel) lifted MCD above $315. However, reports of customer food poisoning incidents hit the news, causing MCD’s stock to plummet to $295 on October 23, making the orange channel more prominent in the technical analysis.
Analysts have subsequently downgraded McDonald’s ratings:
→ Guggenheim’s Gregory Frankfort downgraded MCD from “Buy” to “Neutral” on October 23, setting a target price of $285.
→ Baird’s David Tarantino followed suit, lowering his rating from “Outperform” to “Neutral” and adjusting his price target from $320 to $290.
Will MCD stock be able to reclaim the $300 mark? Much hinges on the company’s earnings report due out today, with analysts forecasting:
→ Quarterly earnings of $3.20 per share, a slight rise from last year’s $3.19 per share.
→ Quarterly revenue at $6.82 billion.
If investors react negatively to the report, it could push MCD below the critical $300 level and trigger a bearish break in the uptrend established since July.
Trade global index CFDs with zero commission and tight spreads. Open your FXOpen account now or learn more about trading index CFDs with FXOpen.
CFDs are complex instruments and come with a high risk of losing your money.
This article represents the opinion of the Companies operating under the FXOpen brand only. It is not to be construed as an offer, solicitation, or recommendation with respect to products and services provided by the Companies operating under the FXOpen brand, nor is it to be considered financial advice.
McDonald's (MCD) Stock Trades Below $300 Ahead of Earnings Report
The $300 level has proven psychologically significant for McDonald’s (MCD) stock:
→ In summer 2023, bullish investors failed to push the price above this mark, leading to a decline from $298 in July to $246 by October.
→ Again, in January 2024, the price briefly surpassed $300 but quickly dropped, eventually falling to $245 by July.
This autumn, it appeared the level had been breached when an uptrend (highlighted by the blue channel) lifted MCD above $315. However, reports of customer food poisoning incidents hit the news, causing MCD’s stock to plummet to $295 on October 23, making the orange channel more prominent in the technical analysis.
Analysts have subsequently downgraded McDonald’s ratings:
→ Guggenheim’s Gregory Frankfort downgraded MCD from “Buy” to “Neutral” on October 23, setting a target price of $285.
→ Baird’s David Tarantino followed suit, lowering his rating from “Outperform” to “Neutral” and adjusting his price target from $320 to $290.
Will MCD stock be able to reclaim the $300 mark? Much hinges on the company’s earnings report due out today, with analysts forecasting:
→ Quarterly earnings of $3.20 per share, a slight rise from last year’s $3.19 per share.
→ Quarterly revenue at $6.82 billion.
If investors react negatively to the report, it could push MCD below the critical $300 level and trigger a bearish break in the uptrend established since July.
Trade global index CFDs with zero commission and tight spreads. Open your FXOpen account now or learn more about trading index CFDs with FXOpen.
CFDs are complex instruments and come with a high risk of losing your money.
This article represents the opinion of the Companies operating under the FXOpen brand only. It is not to be construed as an offer, solicitation, or recommendation with respect to products and services provided by the Companies operating under the FXOpen brand, nor is it to be considered financial advice.
👍2
#NASDAQ #stockmarket #stocktrading #MarketUpdates
Nasdaq 100 Consolidates Ahead of Major Market Leader Earnings Reports
This week, five companies with market capitalisations exceeding $1 trillion are set to release their quarterly earnings:
→ Alphabet (GOOGL) on October 29
→ Microsoft (MSFT) on October 30
→ Meta Platforms (META) on October 30
→ Apple (AAPL) on October 31
→ Amazon (AMZN) on October 31
These results and profit forecasts from leading tech giants could fuel momentum for the Nasdaq 100 (US Tech 100 mini on FXOpen).
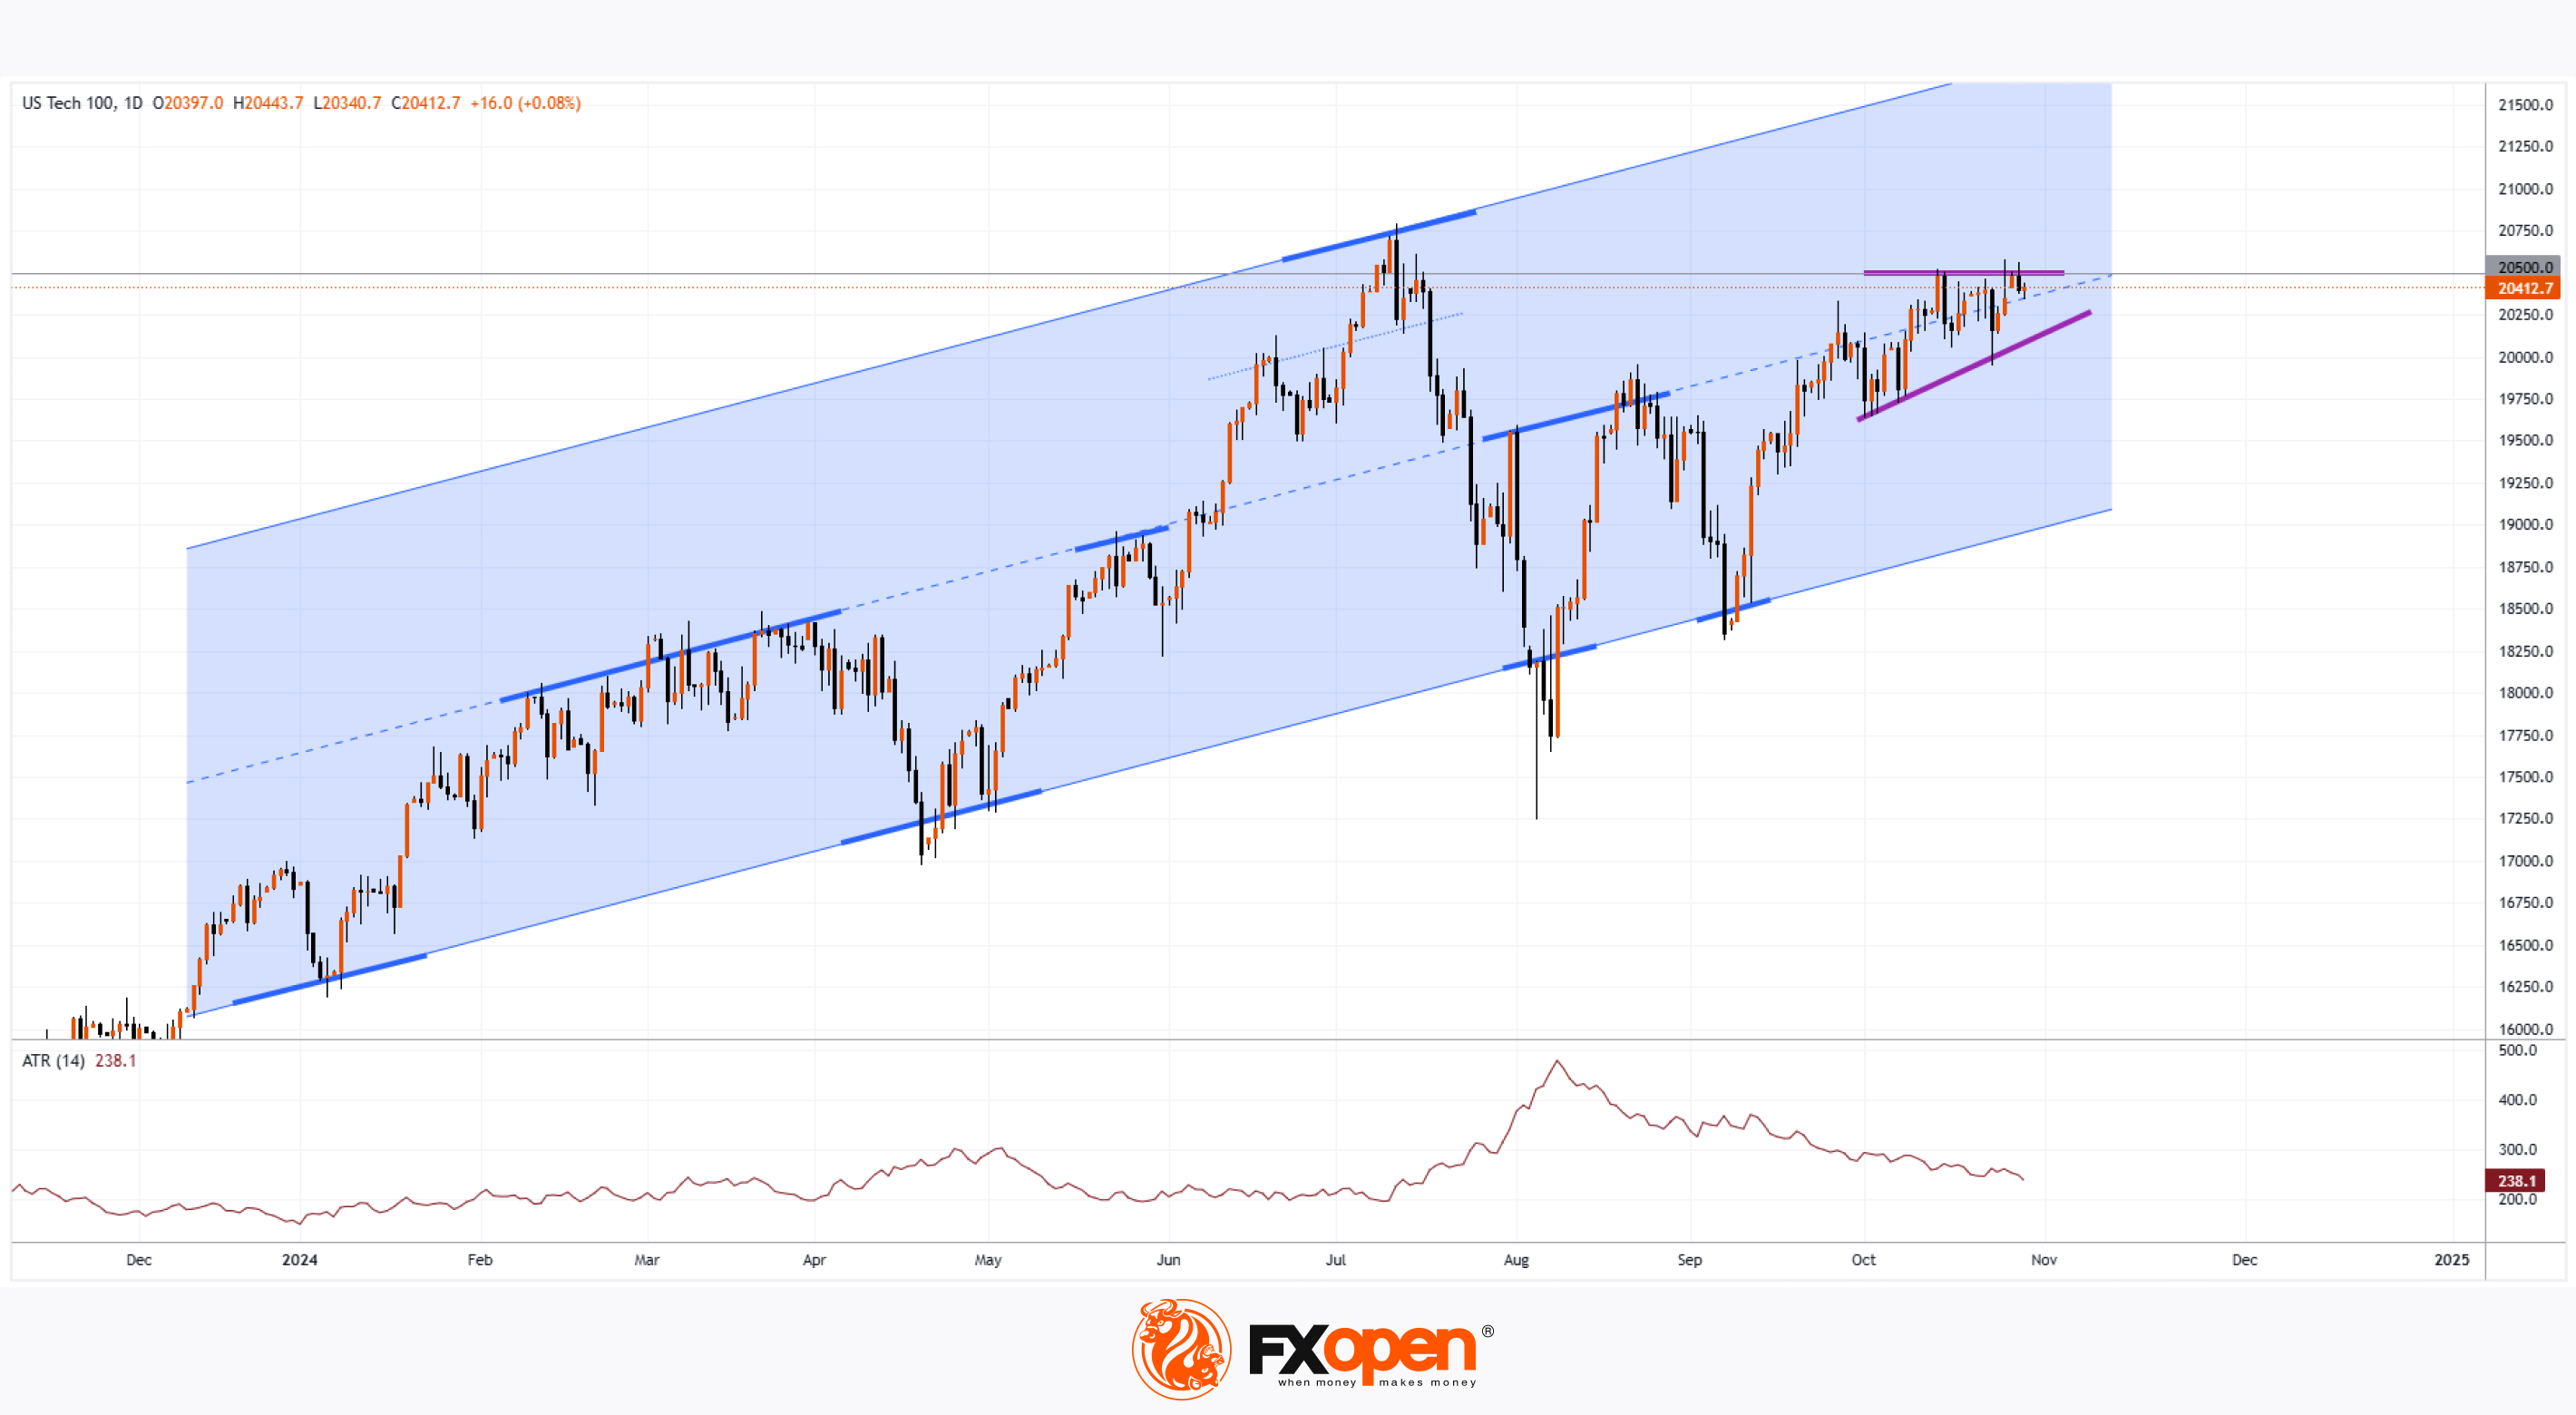
For now, technical analysis of the Nasdaq 100 (US Tech 100 mini on FXOpen) chart suggests the index is in a state of consolidation. Supporting this view:
→ The blue upward channel, based on key 2024 reversals (marked with bold lines), shows price movement near the channel median, indicating a potential balance between supply and demand.
→ A narrowing triangle formation (highlighted by purple lines, with the upper line aligning with the psychological level of 20,500) reflects a reduction in volatility, signalling consolidation in anticipation of the earnings releases.
→ A decline in the ATR indicator, reaching its lowest in approximately 3.5 months, also suggests subdued market activity.
If these tech earnings surprise to the upside, it’s possible the Nasdaq 100 (US Tech 100 mini on FXOpen) could break out of the purple triangle, setting its sights on a fresh all-time high, surpassing the previous peak from July 11.
Trade global index CFDs with zero commission and tight spreads. Open your FXOpen account now or learn more about trading index CFDs with FXOpen.
CFDs are complex instruments and come with a high risk of losing your money.
This article represents the opinion of the Companies operating under the FXOpen brand only. It is not to be construed as an offer, solicitation, or recommendation with respect to products and services provided by the Companies operating under the FXOpen brand, nor is it to be considered financial advice.
Nasdaq 100 Consolidates Ahead of Major Market Leader Earnings Reports
This week, five companies with market capitalisations exceeding $1 trillion are set to release their quarterly earnings:
→ Alphabet (GOOGL) on October 29
→ Microsoft (MSFT) on October 30
→ Meta Platforms (META) on October 30
→ Apple (AAPL) on October 31
→ Amazon (AMZN) on October 31
These results and profit forecasts from leading tech giants could fuel momentum for the Nasdaq 100 (US Tech 100 mini on FXOpen).
For now, technical analysis of the Nasdaq 100 (US Tech 100 mini on FXOpen) chart suggests the index is in a state of consolidation. Supporting this view:
→ The blue upward channel, based on key 2024 reversals (marked with bold lines), shows price movement near the channel median, indicating a potential balance between supply and demand.
→ A narrowing triangle formation (highlighted by purple lines, with the upper line aligning with the psychological level of 20,500) reflects a reduction in volatility, signalling consolidation in anticipation of the earnings releases.
→ A decline in the ATR indicator, reaching its lowest in approximately 3.5 months, also suggests subdued market activity.
If these tech earnings surprise to the upside, it’s possible the Nasdaq 100 (US Tech 100 mini on FXOpen) could break out of the purple triangle, setting its sights on a fresh all-time high, surpassing the previous peak from July 11.
Trade global index CFDs with zero commission and tight spreads. Open your FXOpen account now or learn more about trading index CFDs with FXOpen.
CFDs are complex instruments and come with a high risk of losing your money.
This article represents the opinion of the Companies operating under the FXOpen brand only. It is not to be construed as an offer, solicitation, or recommendation with respect to products and services provided by the Companies operating under the FXOpen brand, nor is it to be considered financial advice.
👍2
#marketanalysis #MarketNews #stockmarket #stocktrading
Alphabet Inc. (GOOGL) Shares Rise to $180 Following Earnings Report
On September 10, we noted that GOOGL shares:
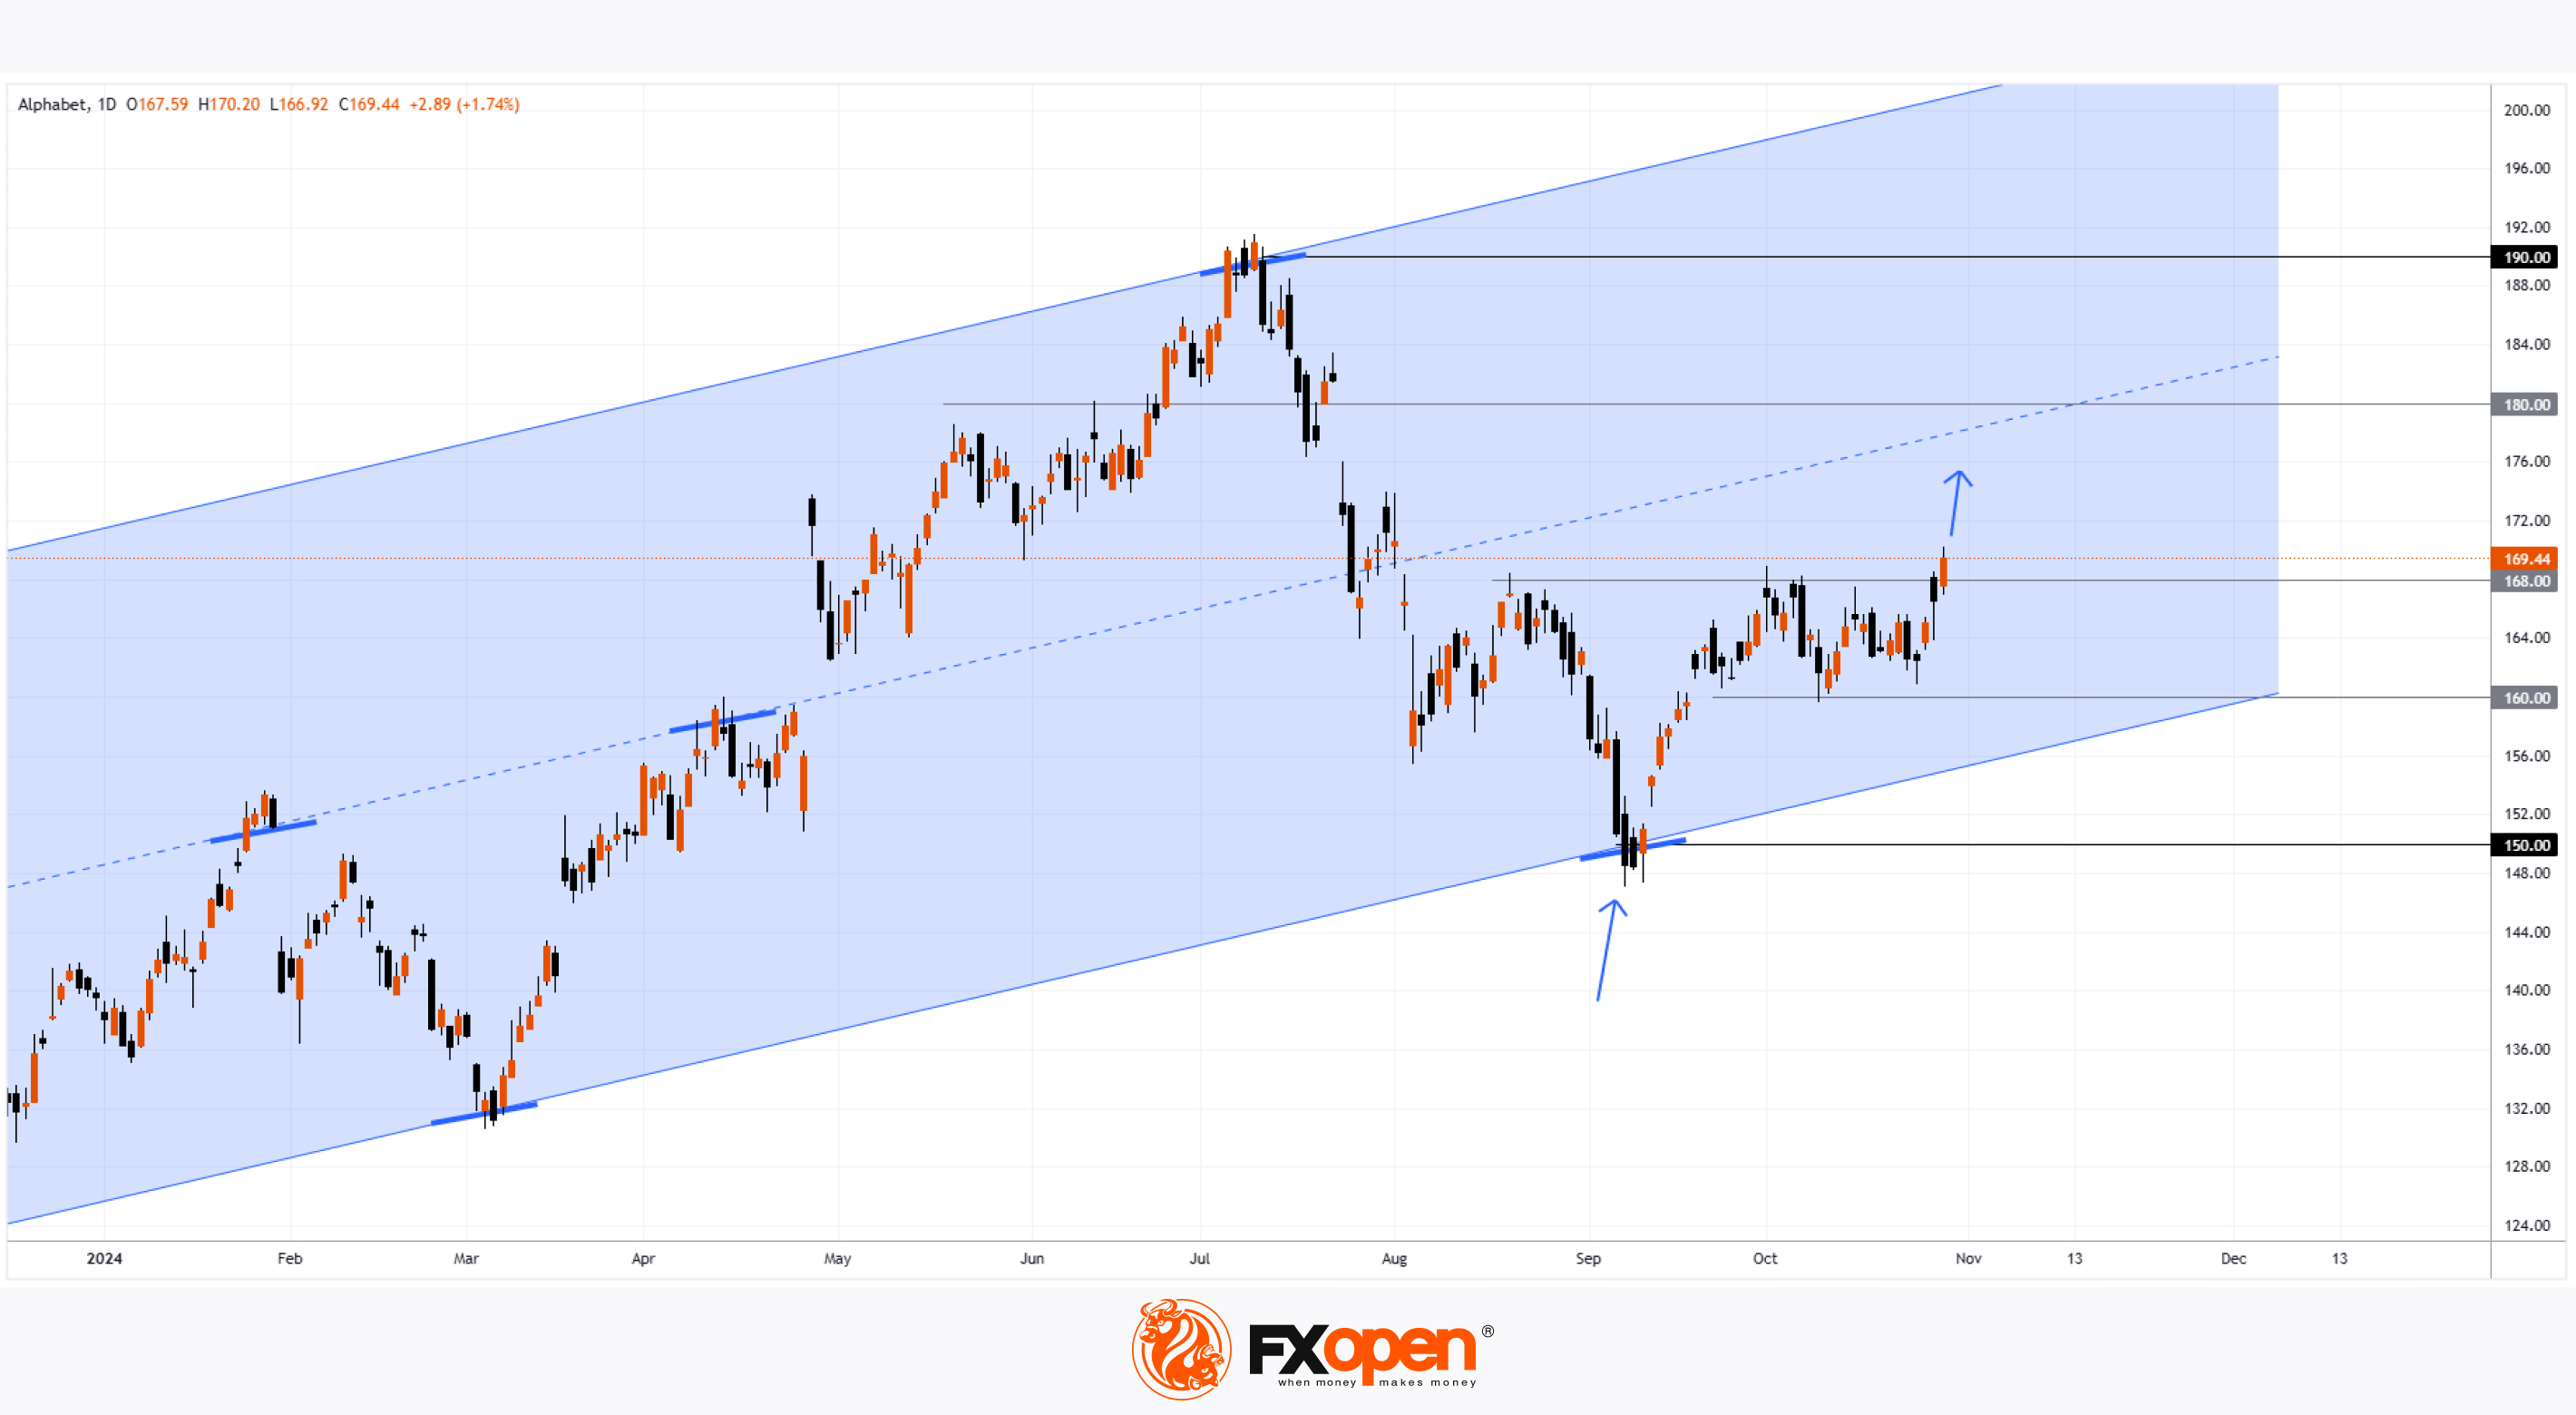
→ Were forming an ascending channel (highlighted in blue on the chart below, updated with the latest trading data);
→ Could begin to rebound from the psychological support level of $150 (indicated by an arrow).
Since then, the price did indeed turn upward from that level, fluctuating in October between a support level of $160 and a resistance level of $168, signaling a supply-demand equilibrium.
However, this balance now appears to be shifting, as Alphabet Inc. (GOOGL) released its Q3 earnings report post-market yesterday, surpassing expectations:
→ Earnings per share: actual = $2.12, expected = $1.84
→ Gross revenue: actual = $88.27 billion, expected = $86.39 billion.
Investors were likely encouraged by the company’s statement that its AI investments are "paying off." Consequently, Alphabet's shares rose to $180 in after-hours trading, suggesting a likely opening at this level in today's main session.
Today’s technical analysis for GOOGL suggests that trading will likely open with a bullish gap, as:
→ The price breaks above its range, crossing the $168 resistance;
→ It reaches the median of the long-term ascending channel, where a new buyer-seller consensus may form.
If this bullish sentiment persists, GOOGL's price may continue climbing toward its historical high near $190 this year.
According to a TipRanks survey:
→ 22 out of 28 analysts recommend buying GOOGL shares.
→ The average 12-month price target for GOOGL is $201.54.
Trade global index CFDs with zero commission and tight spreads. Open your FXOpen account now or learn more about trading index CFDs with FXOpen.
CFDs are complex instruments and come with a high risk of losing your money.
This article represents the opinion of the Companies operating under the FXOpen brand only. It is not to be construed as an offer, solicitation, or recommendation with respect to products and services provided by the Companies operating under the FXOpen brand, nor is it to be considered financial advice.
Alphabet Inc. (GOOGL) Shares Rise to $180 Following Earnings Report
On September 10, we noted that GOOGL shares:
→ Were forming an ascending channel (highlighted in blue on the chart below, updated with the latest trading data);
→ Could begin to rebound from the psychological support level of $150 (indicated by an arrow).
Since then, the price did indeed turn upward from that level, fluctuating in October between a support level of $160 and a resistance level of $168, signaling a supply-demand equilibrium.
However, this balance now appears to be shifting, as Alphabet Inc. (GOOGL) released its Q3 earnings report post-market yesterday, surpassing expectations:
→ Earnings per share: actual = $2.12, expected = $1.84
→ Gross revenue: actual = $88.27 billion, expected = $86.39 billion.
Investors were likely encouraged by the company’s statement that its AI investments are "paying off." Consequently, Alphabet's shares rose to $180 in after-hours trading, suggesting a likely opening at this level in today's main session.
Today’s technical analysis for GOOGL suggests that trading will likely open with a bullish gap, as:
→ The price breaks above its range, crossing the $168 resistance;
→ It reaches the median of the long-term ascending channel, where a new buyer-seller consensus may form.
If this bullish sentiment persists, GOOGL's price may continue climbing toward its historical high near $190 this year.
According to a TipRanks survey:
→ 22 out of 28 analysts recommend buying GOOGL shares.
→ The average 12-month price target for GOOGL is $201.54.
Trade global index CFDs with zero commission and tight spreads. Open your FXOpen account now or learn more about trading index CFDs with FXOpen.
CFDs are complex instruments and come with a high risk of losing your money.
This article represents the opinion of the Companies operating under the FXOpen brand only. It is not to be construed as an offer, solicitation, or recommendation with respect to products and services provided by the Companies operating under the FXOpen brand, nor is it to be considered financial advice.
👍3
#usdchf #forextrading #tradingtips #tradingforex
Technical Analysis of USD/CHF: Rate Reaches Key Resistance Level
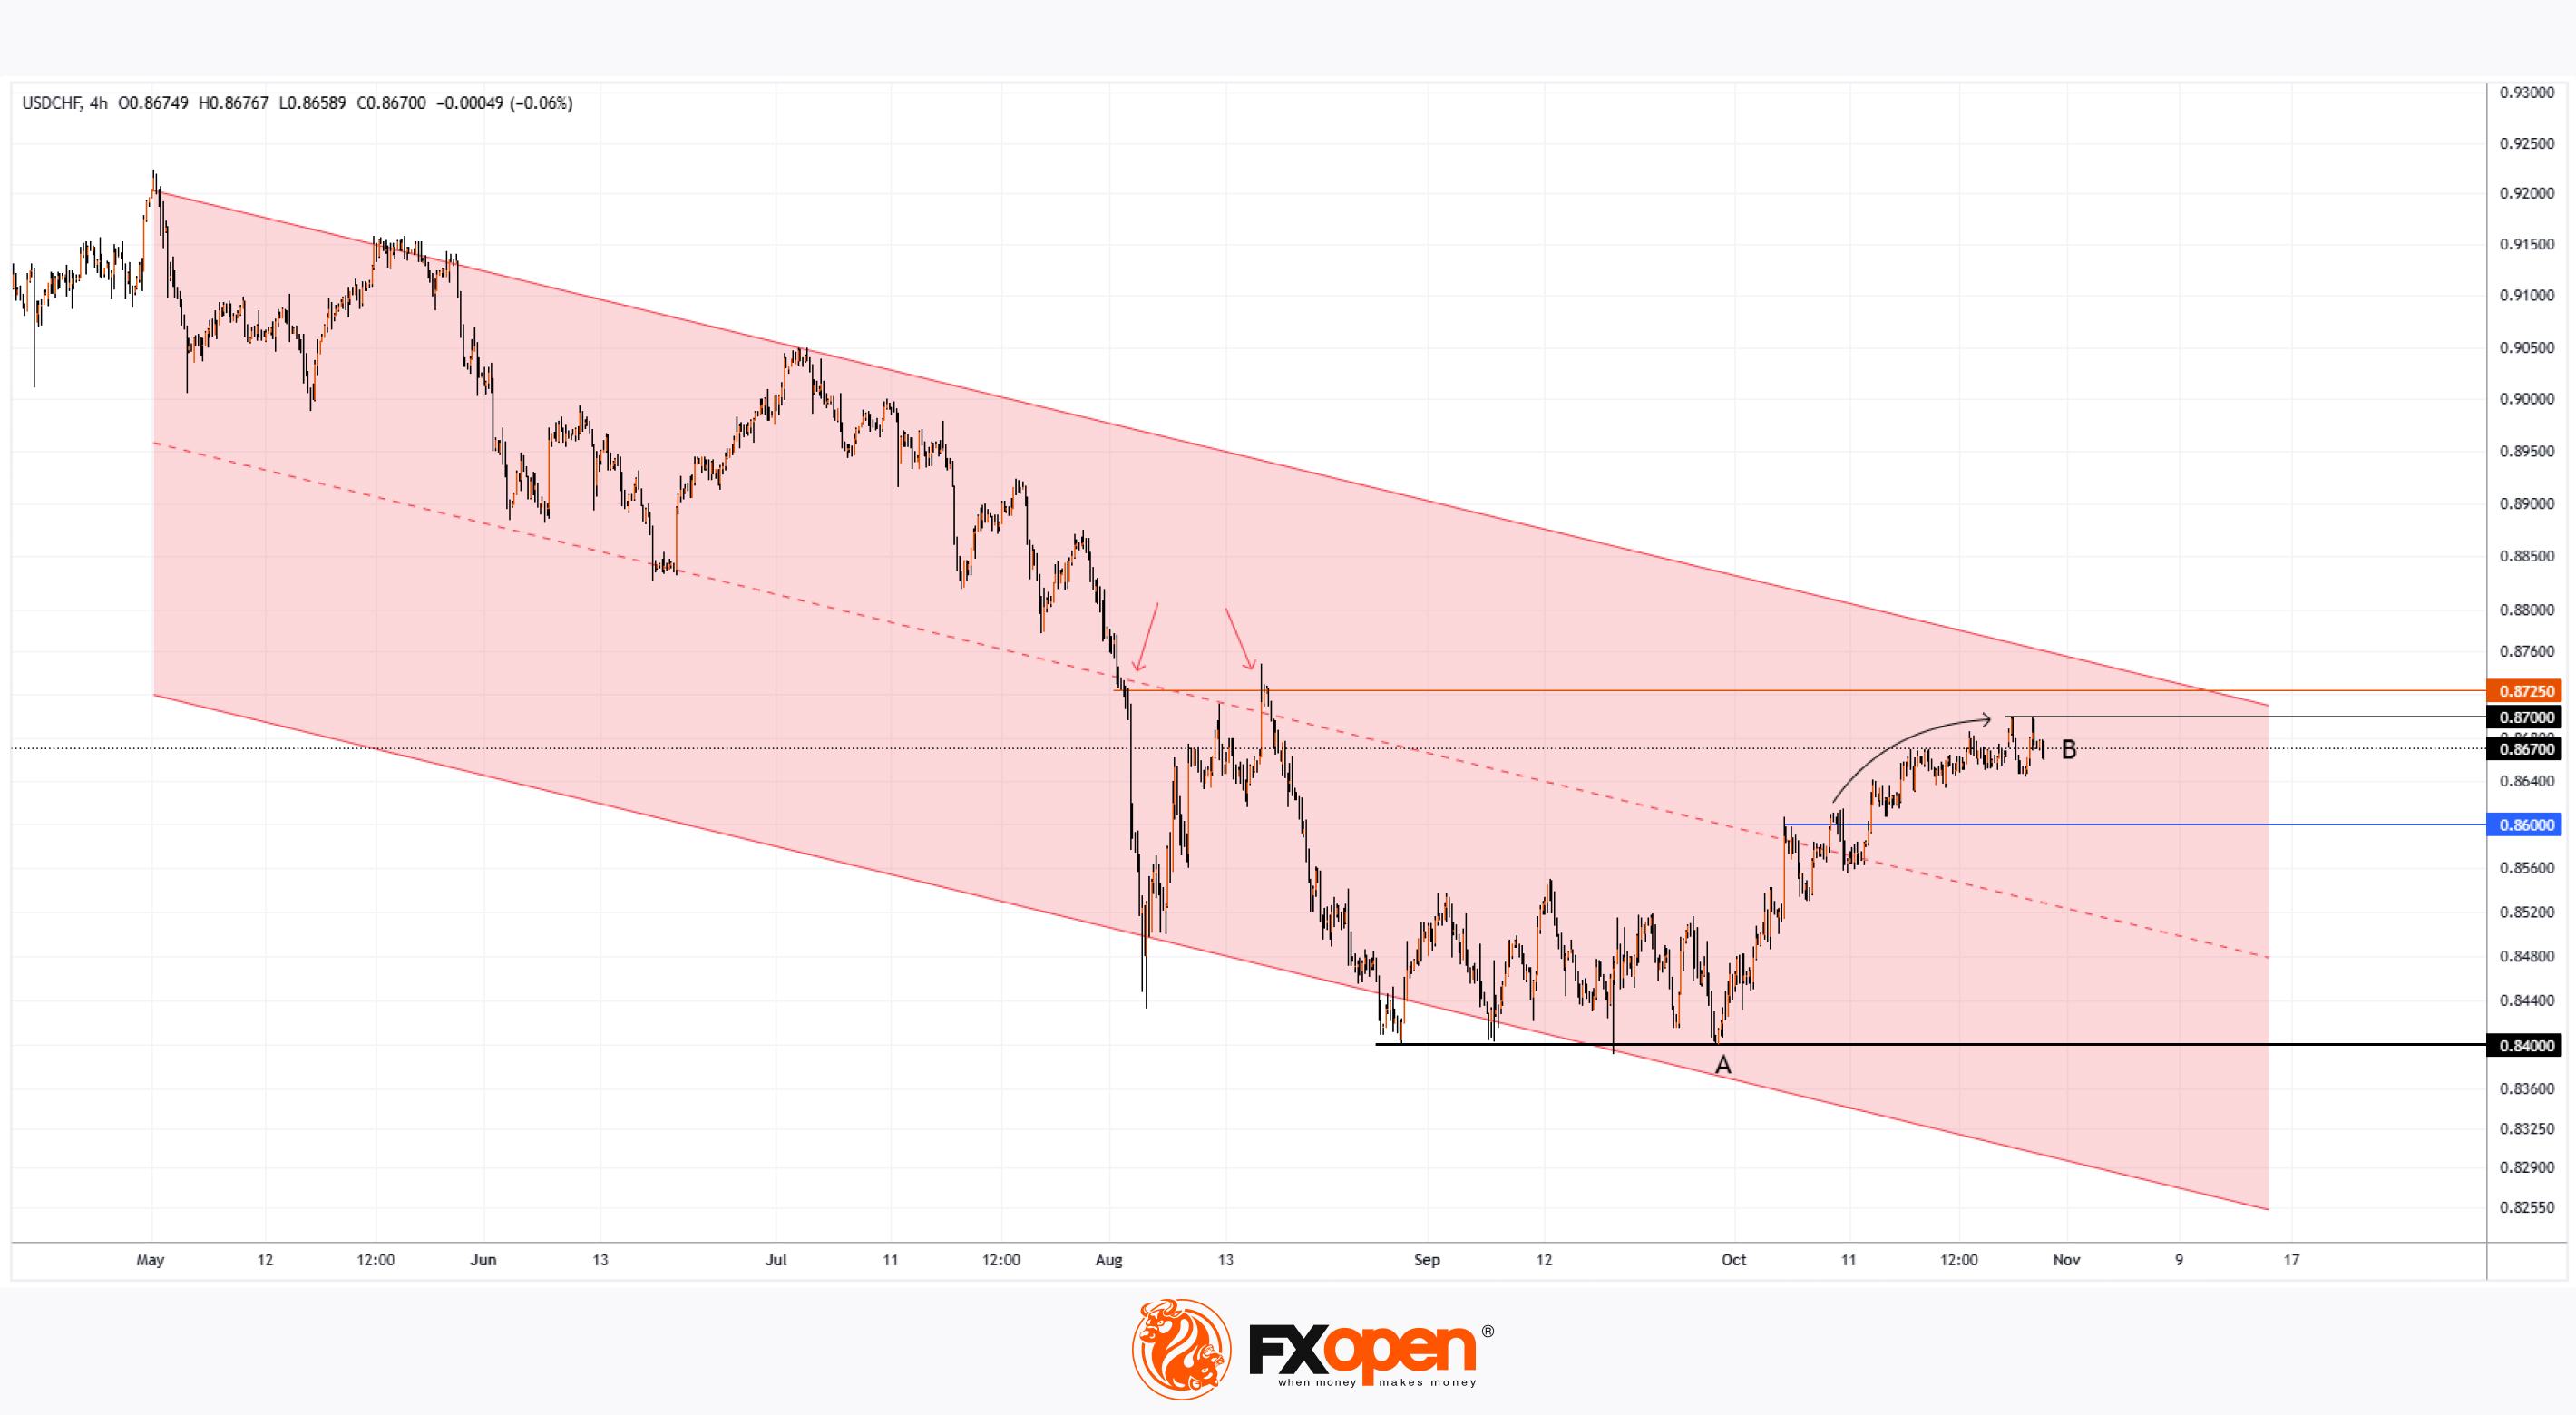
As seen on the USD/CHF chart, the pair has been moving within a descending channel (highlighted in red) since May.
In September, price action confirmed that the 0.84000 level, near the lower channel boundary, serves as strong support—after several unsuccessful attempts to break below it, the pair rebounded from point A to point B, rising by over 3% to the current level around 0.86750.
The U.S. dollar’s recent strength has been supported by:
→ Expectations of a Trump victory in the upcoming presidential election,
→ Rising yields on long-term U.S. Treasury bonds.
However, technical analysis of the USD/CHF chart suggests that the pair faces significant pressure at this level:
→ From the proximity to the upper boundary of the descending channel,
→ From the 0.8725 resistance level, tested in August (indicated by an arrow),
→ From the psychological level of 0.87000, which has twice deflected price downward this week.
Further supporting this outlook, a rounding top pattern (illustrated by a black arrow) appears to be forming, potentially signaling a bearish reversal.
Given these factors, a stronger bearish presence may emerge, with USD/CHF likely to test the 0.86000 level, which recently served as resistance but was subsequently broken earlier this month.
Trade over 50 forex markets 24 hours a day with FXOpen. Take advantage of low commissions, deep liquidity, and spreads from 0.0 pips. Open your FXOpen account now or learn more about trading forex with FXOpen.
CFDs are complex instruments and come with a high risk of losing your money.
This article represents the opinion of the Companies operating under the FXOpen brand only. It is not to be construed as an offer, solicitation, or recommendation with respect to products and services provided by the Companies operating under the FXOpen brand, nor is it to be considered financial advice.
Technical Analysis of USD/CHF: Rate Reaches Key Resistance Level
As seen on the USD/CHF chart, the pair has been moving within a descending channel (highlighted in red) since May.
In September, price action confirmed that the 0.84000 level, near the lower channel boundary, serves as strong support—after several unsuccessful attempts to break below it, the pair rebounded from point A to point B, rising by over 3% to the current level around 0.86750.
The U.S. dollar’s recent strength has been supported by:
→ Expectations of a Trump victory in the upcoming presidential election,
→ Rising yields on long-term U.S. Treasury bonds.
However, technical analysis of the USD/CHF chart suggests that the pair faces significant pressure at this level:
→ From the proximity to the upper boundary of the descending channel,
→ From the 0.8725 resistance level, tested in August (indicated by an arrow),
→ From the psychological level of 0.87000, which has twice deflected price downward this week.
Further supporting this outlook, a rounding top pattern (illustrated by a black arrow) appears to be forming, potentially signaling a bearish reversal.
Given these factors, a stronger bearish presence may emerge, with USD/CHF likely to test the 0.86000 level, which recently served as resistance but was subsequently broken earlier this month.
Trade over 50 forex markets 24 hours a day with FXOpen. Take advantage of low commissions, deep liquidity, and spreads from 0.0 pips. Open your FXOpen account now or learn more about trading forex with FXOpen.
CFDs are complex instruments and come with a high risk of losing your money.
This article represents the opinion of the Companies operating under the FXOpen brand only. It is not to be construed as an offer, solicitation, or recommendation with respect to products and services provided by the Companies operating under the FXOpen brand, nor is it to be considered financial advice.
👍2
#MSFT #stockmarket #stocktrading #MarketUpdates
Microsoft (MSFT) Shares Decline Despite Strong Earnings Report
On 9 October, our analysis of Microsoft (MSFT) suggested that the stock price:
→ Was forming an ascending channel (shown in blue on the chart);
→ Could see a rebound from its lower boundary (indicated by an arrow).
Since then, the price indeed moved upward from this support around the $411 level, even surpassing $437. However, following Microsoft’s Q3 earnings report released post-market yesterday, the share price faced heightened volatility.
In the Q3 report:
→ Earnings per share (EPS) came in at $3.30, exceeding the expected $3.10;
→ Gross revenue was $65.58 billion, also above the forecasted $64.57 billion.
Despite these positive figures, MSFT shares saw a decline due to high volatility during after-hours trading, reaching $444 at one point and then falling to around $410. This drop may be due to Microsoft’s rising expenses. As reported by The Wall Street Journal, Microsoft’s capital expenditures in 2024 have hit $53 billion (about 28% of revenue), a substantial increase from the 12% average of revenue allocated to capital costs between 2014 and 2023.
As of pre-market trading today, MSFT is trading around $417 (approximately -4% from yesterday’s close), likely setting the opening level for today’s main session.
Today’s technical analysis of MSFT suggests that the opening may see a bearish gap, potentially pushing MSFT’s price toward the lower boundary of the ascending blue channel, where a new consensus between buyers and sellers could emerge. This sets up two scenarios:
→ Bulls may see an opportunity for another rebound;
→ Bears could aim for a breakdown of this key support level, with potential testing of the psychological $400 level.
Analyst sentiment remains positive. According to TipRanks surveys:
→ 27 out of 30 analysts recommend buying MSFT shares;
→ The average 12-month target price for MSFT is $503.
Trade global index CFDs with zero commission and tight spreads. Open your FXOpen account now or learn more about trading index CFDs with FXOpen.
CFDs are complex instruments and come with a high risk of losing your money.
This article represents the opinion of the Companies operating under the FXOpen brand only. It is not to be construed as an offer, solicitation, or recommendation with respect to products and services provided by the Companies operating under the FXOpen brand, nor is it to be considered financial advice.
Microsoft (MSFT) Shares Decline Despite Strong Earnings Report
On 9 October, our analysis of Microsoft (MSFT) suggested that the stock price:
→ Was forming an ascending channel (shown in blue on the chart);
→ Could see a rebound from its lower boundary (indicated by an arrow).
Since then, the price indeed moved upward from this support around the $411 level, even surpassing $437. However, following Microsoft’s Q3 earnings report released post-market yesterday, the share price faced heightened volatility.
In the Q3 report:
→ Earnings per share (EPS) came in at $3.30, exceeding the expected $3.10;
→ Gross revenue was $65.58 billion, also above the forecasted $64.57 billion.
Despite these positive figures, MSFT shares saw a decline due to high volatility during after-hours trading, reaching $444 at one point and then falling to around $410. This drop may be due to Microsoft’s rising expenses. As reported by The Wall Street Journal, Microsoft’s capital expenditures in 2024 have hit $53 billion (about 28% of revenue), a substantial increase from the 12% average of revenue allocated to capital costs between 2014 and 2023.
As of pre-market trading today, MSFT is trading around $417 (approximately -4% from yesterday’s close), likely setting the opening level for today’s main session.
Today’s technical analysis of MSFT suggests that the opening may see a bearish gap, potentially pushing MSFT’s price toward the lower boundary of the ascending blue channel, where a new consensus between buyers and sellers could emerge. This sets up two scenarios:
→ Bulls may see an opportunity for another rebound;
→ Bears could aim for a breakdown of this key support level, with potential testing of the psychological $400 level.
Analyst sentiment remains positive. According to TipRanks surveys:
→ 27 out of 30 analysts recommend buying MSFT shares;
→ The average 12-month target price for MSFT is $503.
Trade global index CFDs with zero commission and tight spreads. Open your FXOpen account now or learn more about trading index CFDs with FXOpen.
CFDs are complex instruments and come with a high risk of losing your money.
This article represents the opinion of the Companies operating under the FXOpen brand only. It is not to be construed as an offer, solicitation, or recommendation with respect to products and services provided by the Companies operating under the FXOpen brand, nor is it to be considered financial advice.

👍2
#marketanalysis #MarketNews #NASDAQ #stockmarket
How AI is Becoming a Bearish Factor for the Nasdaq 100
In 2024, the Nasdaq 100 index (US Tech 100 mini on FXOpen) has risen by approximately 20%, with optimism around the integration of artificial intelligence (AI) acting as one of the bullish drivers.
However, yesterday's reports from Microsoft (MSFT) and Meta Platforms (META) indicated that AI, as a factor influencing stock prices, may be shifting from a bullish to a bearish driver. The issue lies in the rising expenses that these tech giants are incurring in the race for leadership in this area.
Earlier today, we noted that due to increasing expenditures, MSFT shares fell by roughly 4%, despite a strong earnings report.
A similar trend is seen in Meta Platforms' stock: actual earnings per share and gross revenue exceeded analysts’ expectations. However, due to high capital investments, META shares in pre-market trading today are around 3% lower than yesterday's opening.
Meanwhile, technical analysis of the Nasdaq 100 (US Tech 100 mini on FXOpen) index chart indicates several bearish signals:
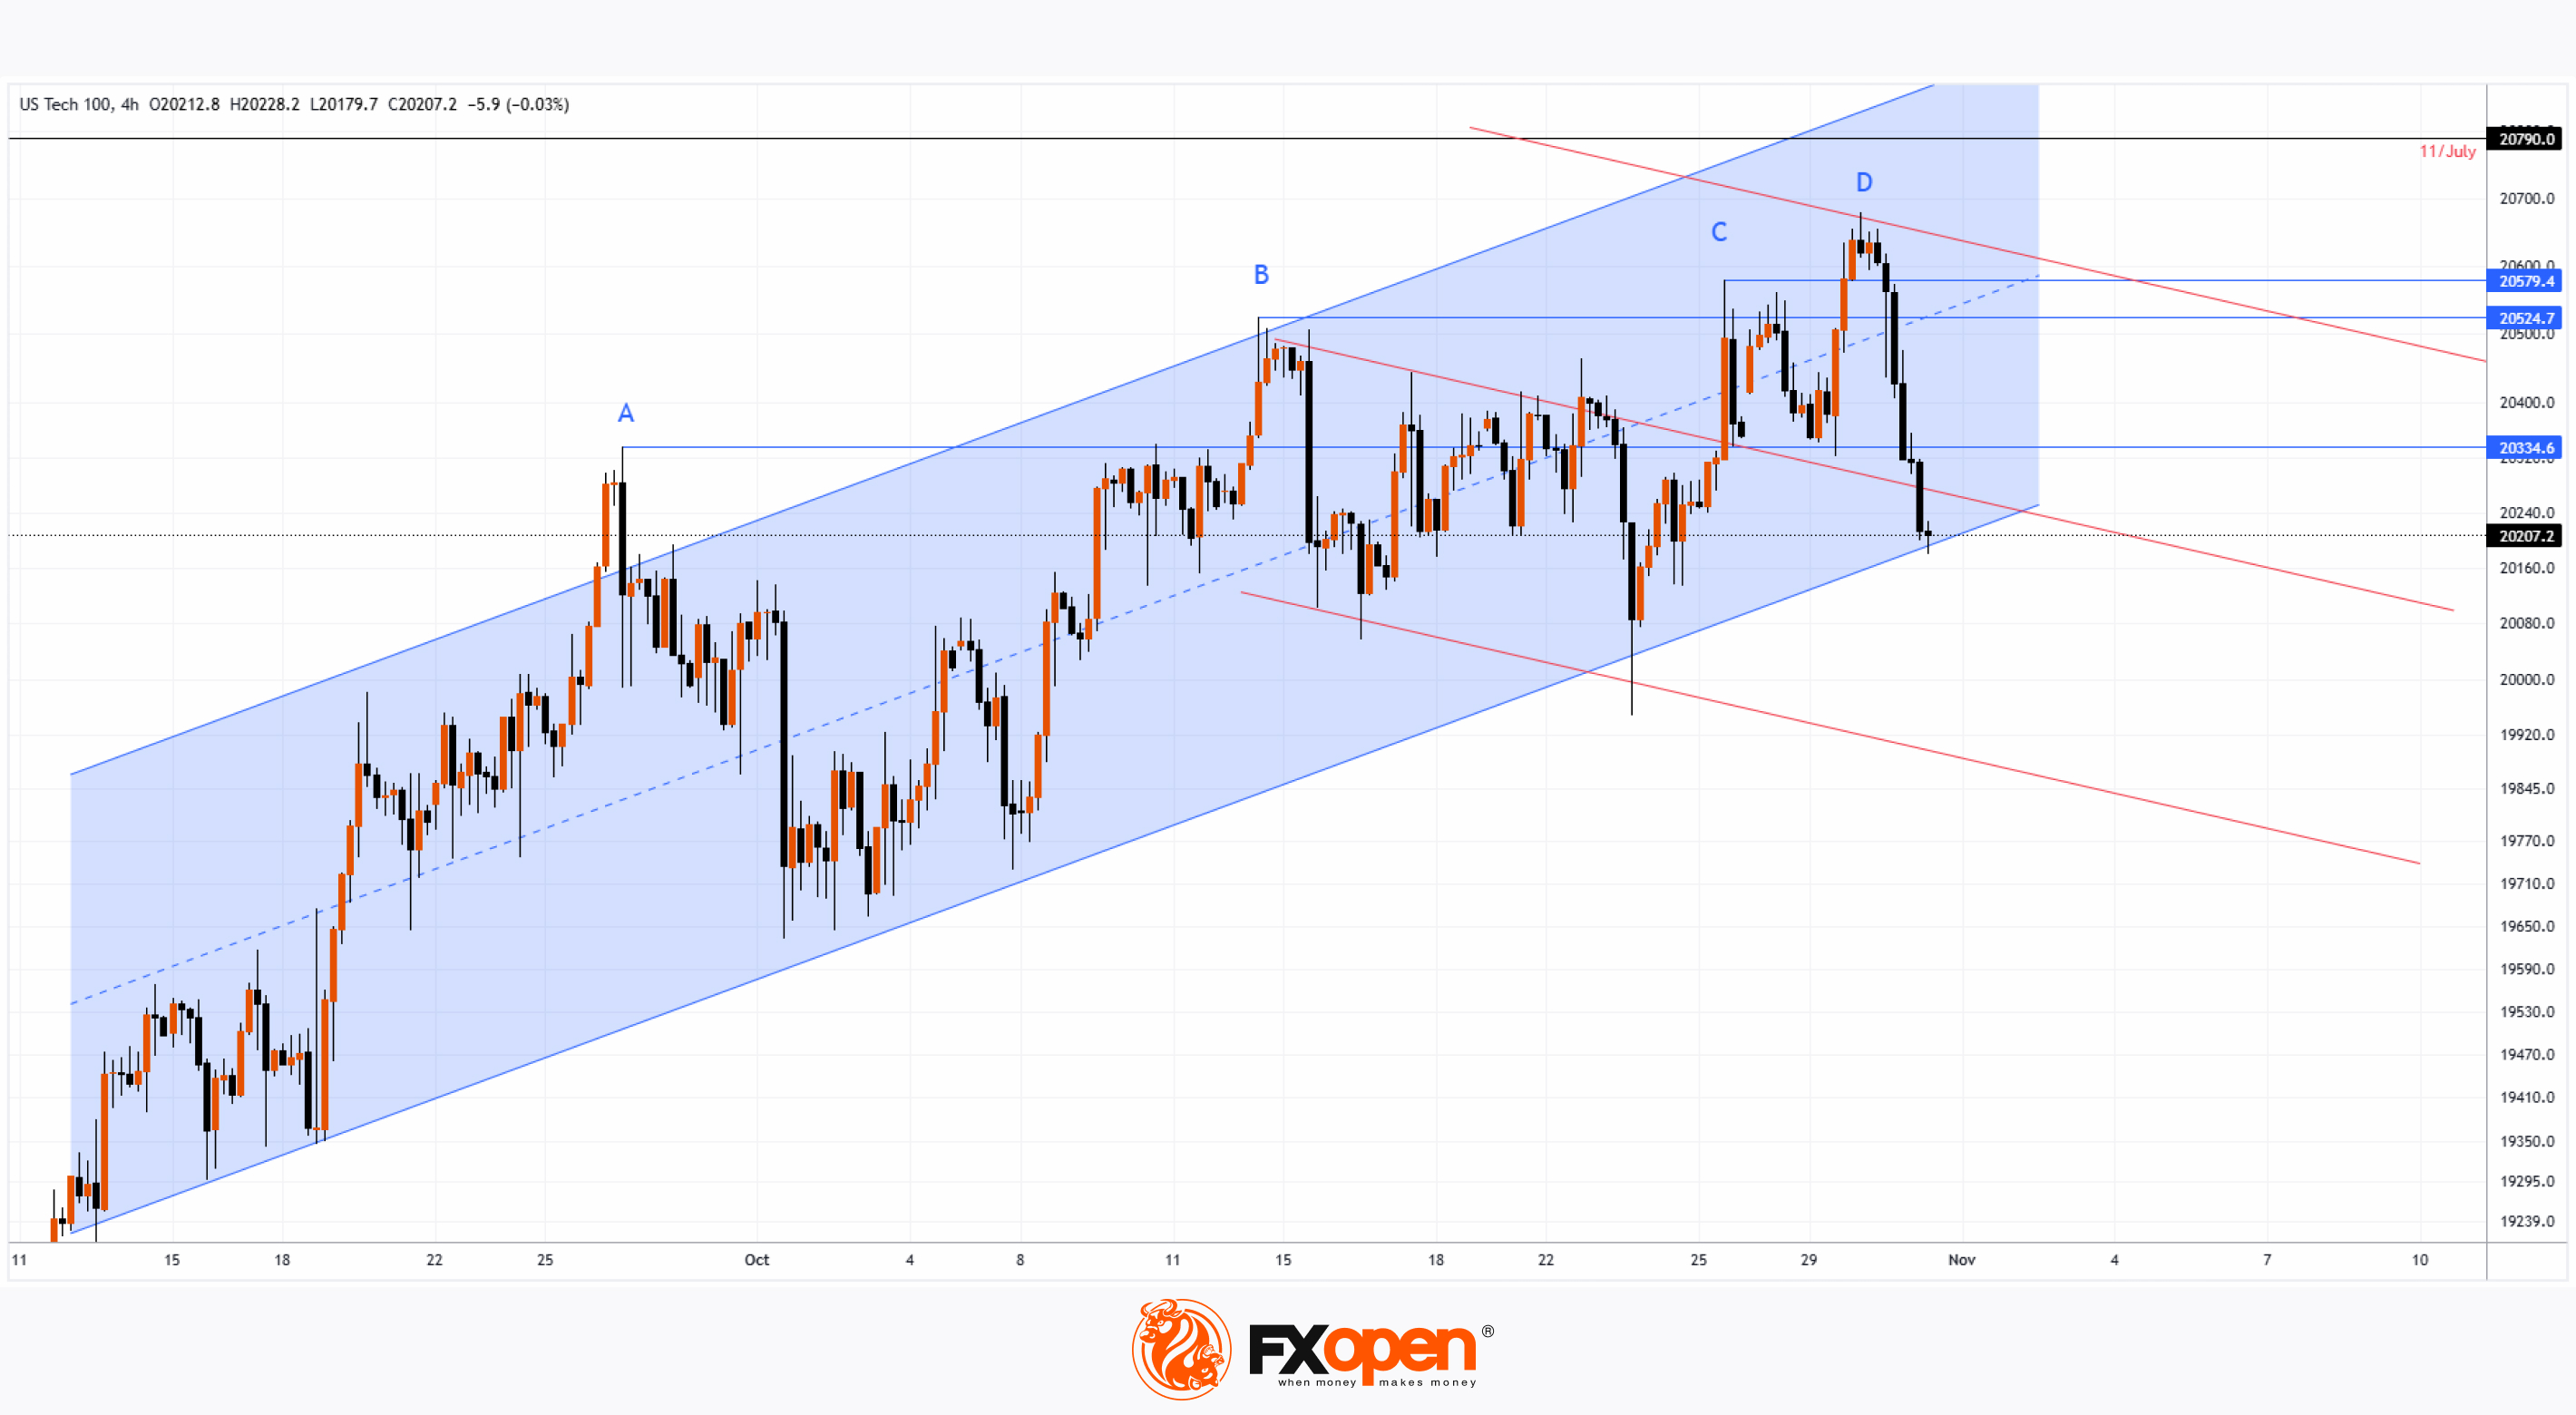
→ Since mid-September, price fluctuations have formed an ascending channel, constructed using linear regression (shown in blue). However, following the reports from Microsoft and Meta Platforms, the index value has sharply dropped from the upper half of the channel to its lower boundary.
→ The pattern of peaks A-B-C-D shows that bulls find it difficult to maintain momentum: each successive peak only slightly exceeds the previous one, followed by a decline.
Considering this information, it is reasonable to assume that the current ascending channel may be unable to drive the price to the July 11 peak and could be breached by bears. Additionally, the formation of a bearish channel is not out of the question (its preliminary outline is shown in red).
Trade global index CFDs with zero commission and tight spreads. Open your FXOpen account now or learn more about trading index CFDs with FXOpen.
CFDs are complex instruments and come with a high risk of losing your money.
This article represents the opinion of the Companies operating under the FXOpen brand only. It is not to be construed as an offer, solicitation, or recommendation with respect to products and services provided by the Companies operating under the FXOpen brand, nor is it to be considered financial advice.
How AI is Becoming a Bearish Factor for the Nasdaq 100
In 2024, the Nasdaq 100 index (US Tech 100 mini on FXOpen) has risen by approximately 20%, with optimism around the integration of artificial intelligence (AI) acting as one of the bullish drivers.
However, yesterday's reports from Microsoft (MSFT) and Meta Platforms (META) indicated that AI, as a factor influencing stock prices, may be shifting from a bullish to a bearish driver. The issue lies in the rising expenses that these tech giants are incurring in the race for leadership in this area.
Earlier today, we noted that due to increasing expenditures, MSFT shares fell by roughly 4%, despite a strong earnings report.
A similar trend is seen in Meta Platforms' stock: actual earnings per share and gross revenue exceeded analysts’ expectations. However, due to high capital investments, META shares in pre-market trading today are around 3% lower than yesterday's opening.
Meanwhile, technical analysis of the Nasdaq 100 (US Tech 100 mini on FXOpen) index chart indicates several bearish signals:
→ Since mid-September, price fluctuations have formed an ascending channel, constructed using linear regression (shown in blue). However, following the reports from Microsoft and Meta Platforms, the index value has sharply dropped from the upper half of the channel to its lower boundary.
→ The pattern of peaks A-B-C-D shows that bulls find it difficult to maintain momentum: each successive peak only slightly exceeds the previous one, followed by a decline.
Considering this information, it is reasonable to assume that the current ascending channel may be unable to drive the price to the July 11 peak and could be breached by bears. Additionally, the formation of a bearish channel is not out of the question (its preliminary outline is shown in red).
Trade global index CFDs with zero commission and tight spreads. Open your FXOpen account now or learn more about trading index CFDs with FXOpen.
CFDs are complex instruments and come with a high risk of losing your money.
This article represents the opinion of the Companies operating under the FXOpen brand only. It is not to be construed as an offer, solicitation, or recommendation with respect to products and services provided by the Companies operating under the FXOpen brand, nor is it to be considered financial advice.
👍2
#FTSE #stockmarket #stocktrading #MarketUpdates
FTSE Index Rebounds from Near Three-Month Low
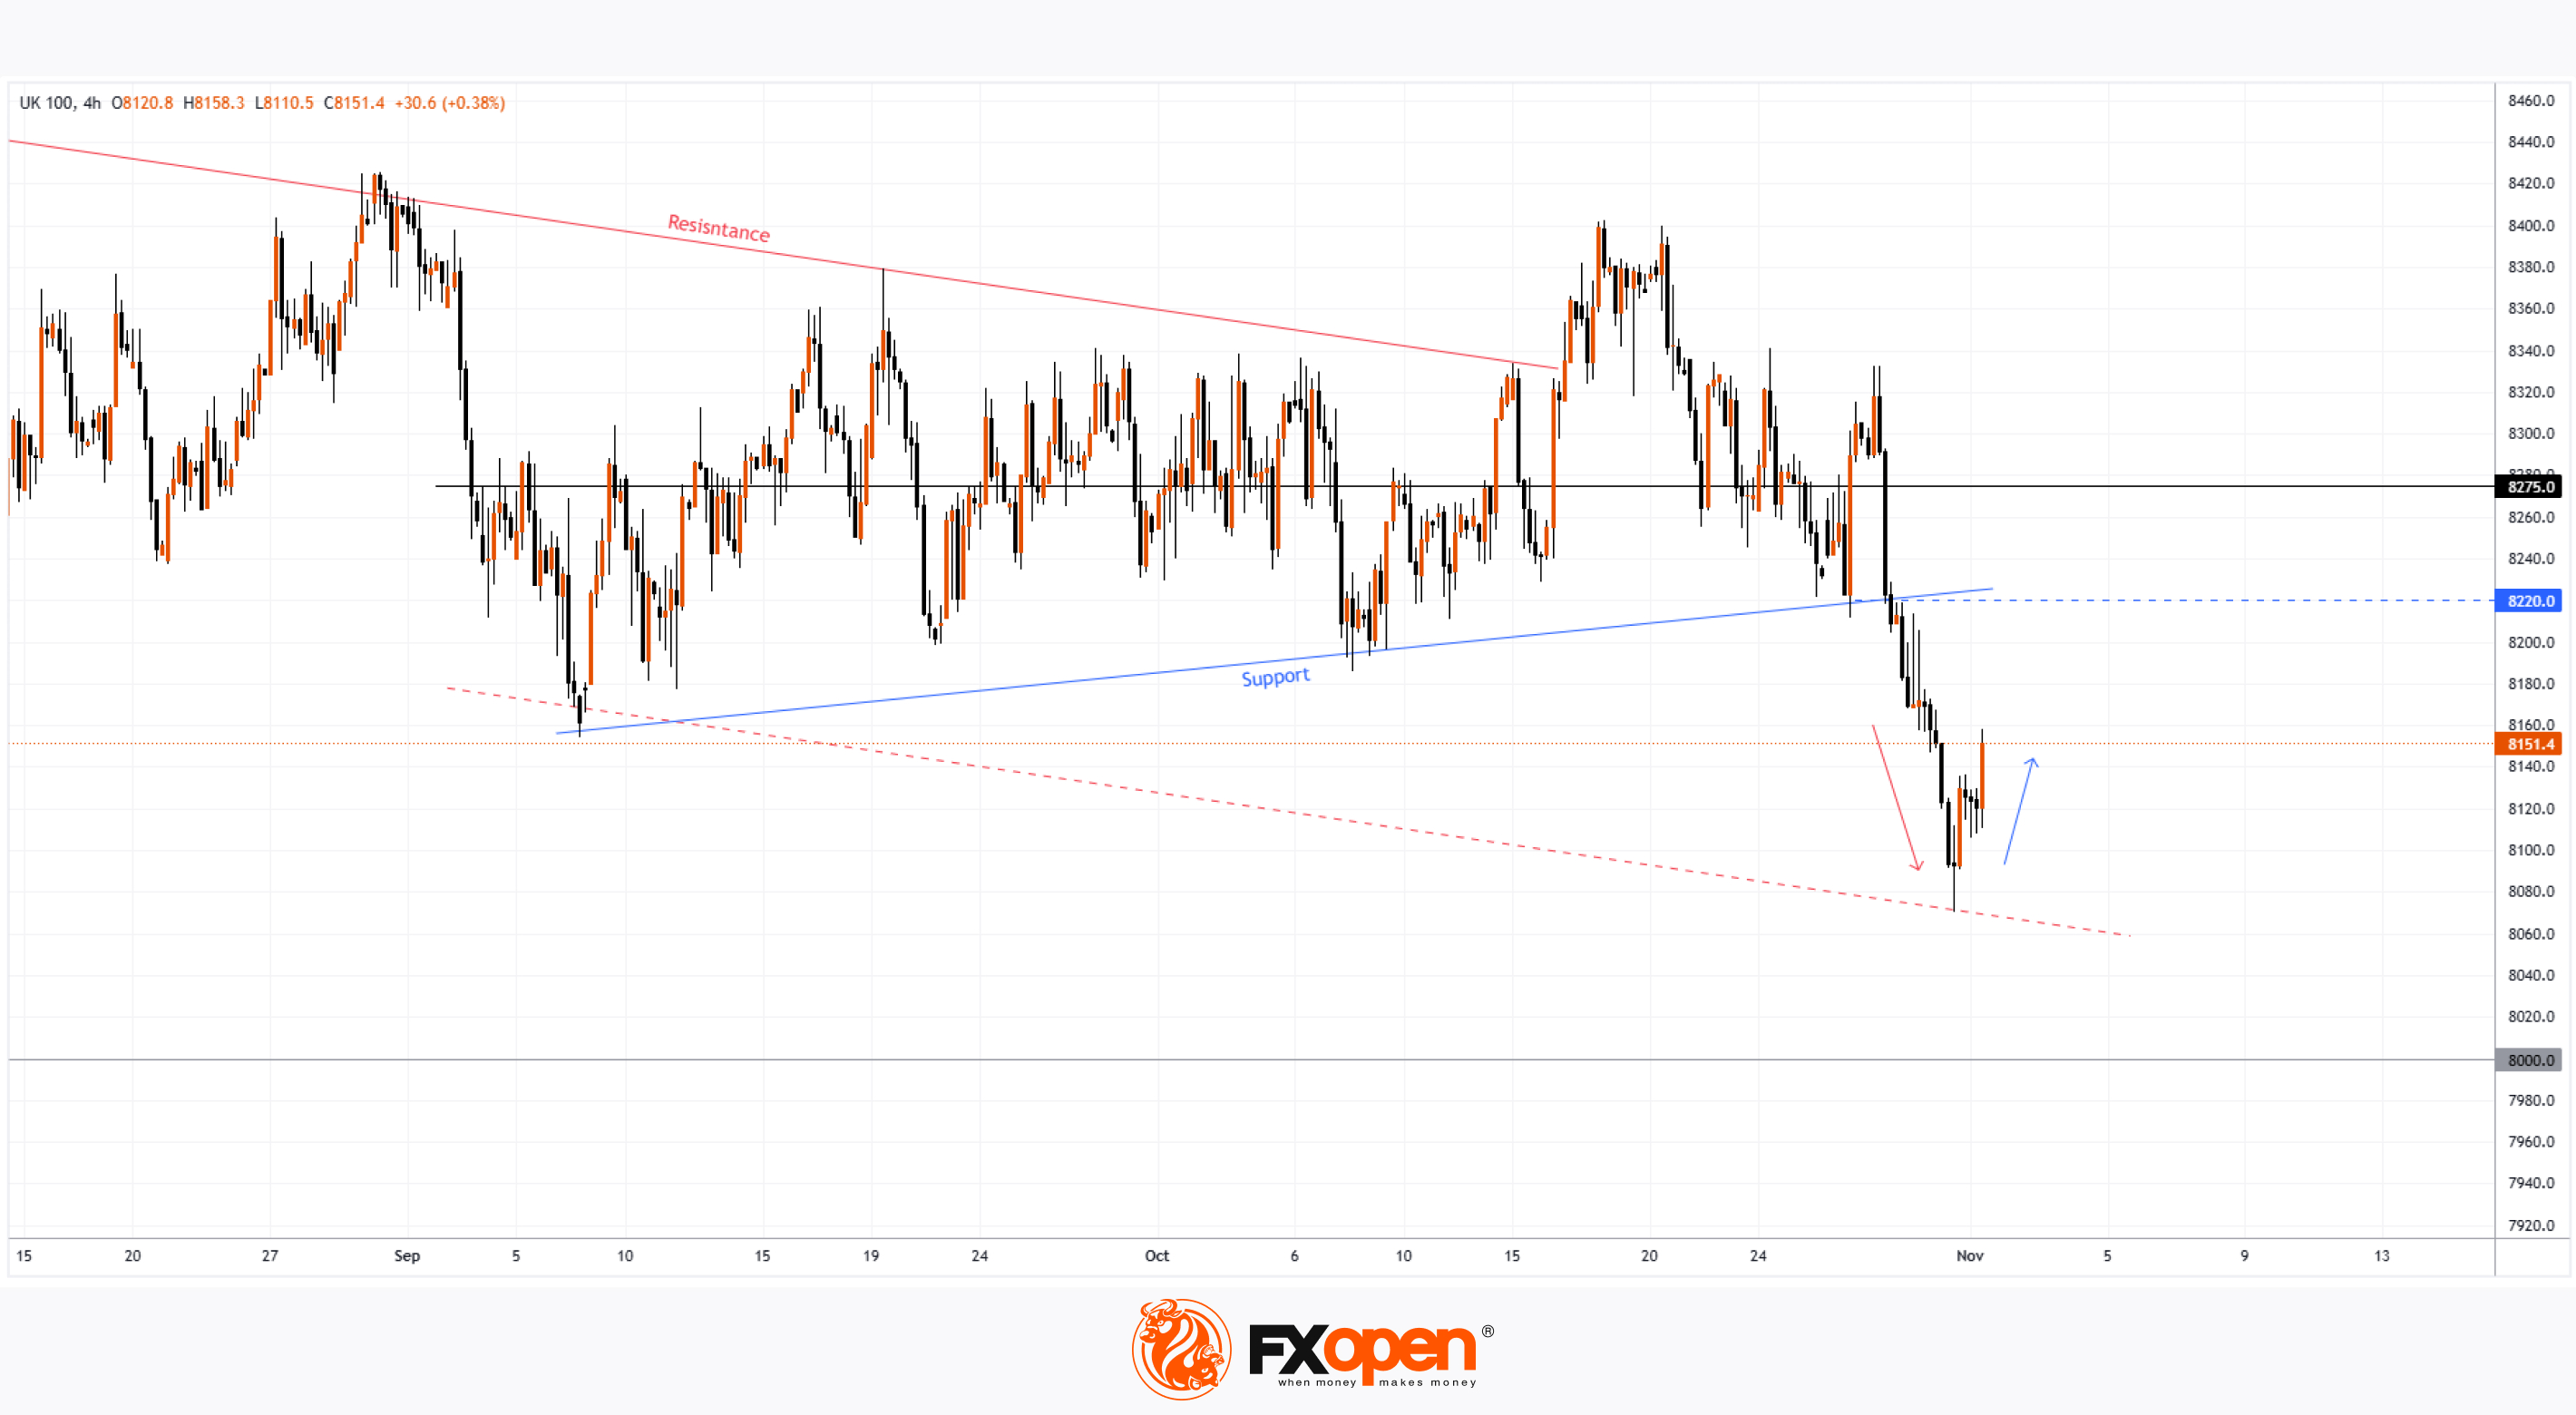
The chart for the British FTSE 100 index (UK 100 on FXOpen) illustrates:
→ Indicated by the red arrow: Yesterday, the index fell below the 8100 level for the first time since early August, driven by bearish sentiment in the U.S. stock market following reports from Microsoft (MSFT) and Meta Platforms (META), as we noted previously.
→ Indicated by the blue arrow: Today, the FTSE 100 is rebounding on the back of local economic data releases, including UK housing prices, which, according to Trading Economics, grew less than expected.
Technical analysis of the FTSE 100 (UK 100 on FXOpen) suggests that the UK stock market may be entering a downtrend, as:
→ It’s plausible that the market has been in a period of consolidation since September, forming a narrowing triangle pattern between the Support and Resistance lines.
→ An attempted bullish breakout of the Resistance line in late October failed to trigger an uptrend, while the bearish breach of the Support line appears more substantial.
→ The arrows indicate that today’s uptick may simply be a bounce from the lower boundary of a descending channel.
What’s next?
Given the correlation with the U.S. stock market, traders will likely focus on today’s key U.S. employment report due at 15:30 GMT+3, which could provide critical signals on interest rate prospects ahead of next week’s Fed meeting.
As long as the FTSE 100 index price (UK 100 on FXOpen) remains below the 8220 breakout level for the Support line, it appears the bears retain greater control.
Trade global index CFDs with zero commission and tight spreads. Open your FXOpen account now or learn more about trading index CFDs with FXOpen.
CFDs are complex instruments and come with a high risk of losing your money.
This article represents the opinion of the Companies operating under the FXOpen brand only. It is not to be construed as an offer, solicitation, or recommendation with respect to products and services provided by the Companies operating under the FXOpen brand, nor is it to be considered financial advice.
FTSE Index Rebounds from Near Three-Month Low
The chart for the British FTSE 100 index (UK 100 on FXOpen) illustrates:
→ Indicated by the red arrow: Yesterday, the index fell below the 8100 level for the first time since early August, driven by bearish sentiment in the U.S. stock market following reports from Microsoft (MSFT) and Meta Platforms (META), as we noted previously.
→ Indicated by the blue arrow: Today, the FTSE 100 is rebounding on the back of local economic data releases, including UK housing prices, which, according to Trading Economics, grew less than expected.
Technical analysis of the FTSE 100 (UK 100 on FXOpen) suggests that the UK stock market may be entering a downtrend, as:
→ It’s plausible that the market has been in a period of consolidation since September, forming a narrowing triangle pattern between the Support and Resistance lines.
→ An attempted bullish breakout of the Resistance line in late October failed to trigger an uptrend, while the bearish breach of the Support line appears more substantial.
→ The arrows indicate that today’s uptick may simply be a bounce from the lower boundary of a descending channel.
What’s next?
Given the correlation with the U.S. stock market, traders will likely focus on today’s key U.S. employment report due at 15:30 GMT+3, which could provide critical signals on interest rate prospects ahead of next week’s Fed meeting.
As long as the FTSE 100 index price (UK 100 on FXOpen) remains below the 8220 breakout level for the Support line, it appears the bears retain greater control.
Trade global index CFDs with zero commission and tight spreads. Open your FXOpen account now or learn more about trading index CFDs with FXOpen.
CFDs are complex instruments and come with a high risk of losing your money.
This article represents the opinion of the Companies operating under the FXOpen brand only. It is not to be construed as an offer, solicitation, or recommendation with respect to products and services provided by the Companies operating under the FXOpen brand, nor is it to be considered financial advice.
👍2
#StockMarket #MSFT #GOOGL #Nasdaq100 #FinancialNews #Investing #USMarkets
Weekly Market Wrap With Gary Thomson: NASDAQ 100, US Dollar, GOOGLE, MSFT Shares Price
Get the latest scoop on the week's hottest headlines, all in one convenient video. Join Gary Thomson, the COO of FXOpen UK, as he breaks down the most significant news reports and shares his expert insights.
🔸 Nasdaq 100 consolidates ahead of major market leader earnings report;
🔸 Dollar continues aggressive rise ahead of U.S. elections;
🔸 Alphabet Inc. (GOOGL) shares rise to $180 following earnings report;
🔸 Microsoft (MSFT) shares decline despite strong earnings report;
Stay in the know and empower yourself with our short, yet power-packed video. Watch it now and stay updated with FXOpen. Don't miss out on this invaluable opportunity to sharpen your trading skills and make informed decisions.
https://cutt.ly/VeF8427m
To take advantage of price fluctuations in the foreign exchange markets, consider enlisting the services of a reliable broker like FXOpen.
⚠️
This forecast represents FXOpen Companies opinion only, it should not be construed as an offer, invitation or recommendation in respect to FXOpen Companies products and services or as financial advice.
Weekly Market Wrap With Gary Thomson: NASDAQ 100, US Dollar, GOOGLE, MSFT Shares Price
Get the latest scoop on the week's hottest headlines, all in one convenient video. Join Gary Thomson, the COO of FXOpen UK, as he breaks down the most significant news reports and shares his expert insights.
🔸 Nasdaq 100 consolidates ahead of major market leader earnings report;
🔸 Dollar continues aggressive rise ahead of U.S. elections;
🔸 Alphabet Inc. (GOOGL) shares rise to $180 following earnings report;
🔸 Microsoft (MSFT) shares decline despite strong earnings report;
Stay in the know and empower yourself with our short, yet power-packed video. Watch it now and stay updated with FXOpen. Don't miss out on this invaluable opportunity to sharpen your trading skills and make informed decisions.
https://cutt.ly/VeF8427m
To take advantage of price fluctuations in the foreign exchange markets, consider enlisting the services of a reliable broker like FXOpen.
⚠️
This forecast represents FXOpen Companies opinion only, it should not be construed as an offer, invitation or recommendation in respect to FXOpen Companies products and services or as financial advice.
YouTube
Weekly Market Wrap With Gary Thomson: NASDAQ 100, US Dollar, GOOGLE, MSFT Shares Price
Get the latest scoop on the week's hottest headlines, all in one convenient video. Join Gary Thomson, the COO of FXOpen UK, as he breaks down the most significant news reports and shares his expert insights
- NASDAQ 100 CONSOLIDATES AHEAD OF MAJOR MARKET…
- NASDAQ 100 CONSOLIDATES AHEAD OF MAJOR MARKET…
👍2
#marketanalysis #MarketNews #stockmarket
Warren Buffett Moves to Cash
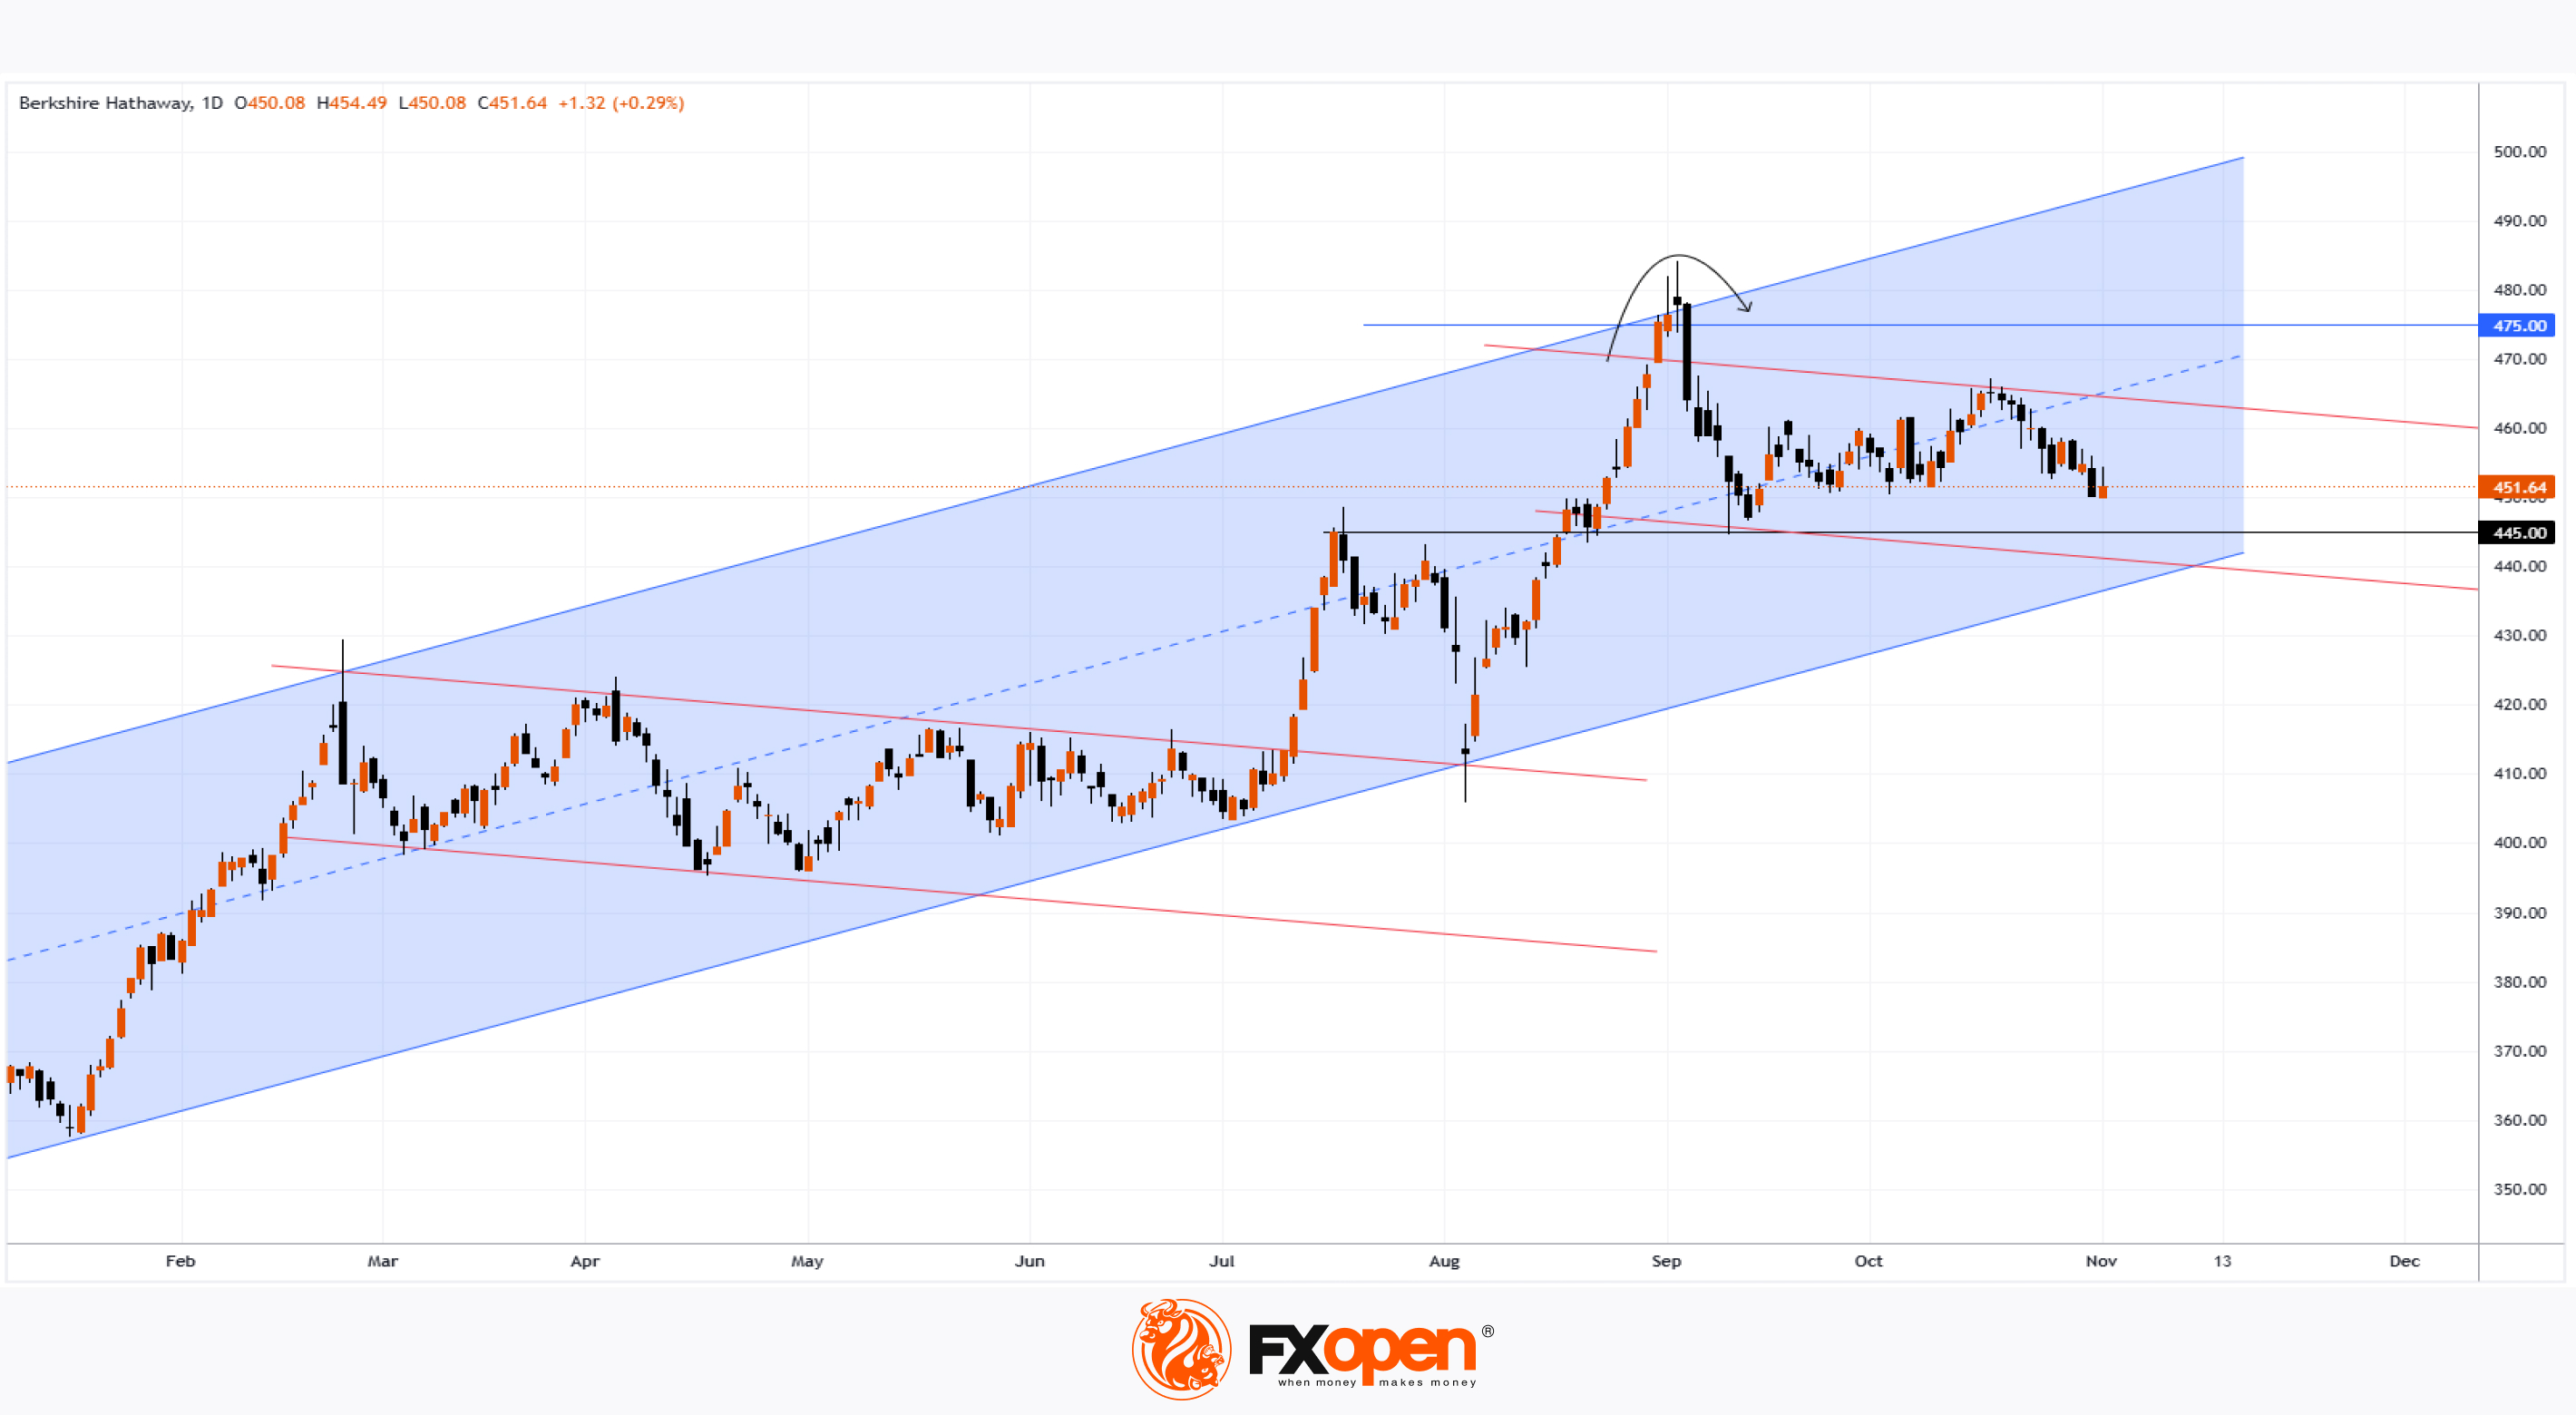
On August 30, when the price of Berkshire Hathaway's Class B shares (BRK.B) surpassed $465, we noted that:
→ the stock was forming an ascending channel (shown in blue);
→ as the price neared $475, the likelihood of a slowdown in the bullish trend increased.
Since then (indicated by the arrow):
→ the price hit the upper channel boundary,
→ reversed downward after briefly exceeding $475,
→ and dropped to around $455 by November 1, when Warren Buffett’s Berkshire Hathaway reported Q3 earnings.
Analyst forecasts were close to the report’s actual figures:
→ Earnings per share: forecast = $4.9, actual = $4.7.
→ Revenue: forecast = $92.2 billion, actual = $92.9 billion.
→ Berkshire Hathaway’s investment income more than doubled year-over-year, reaching $3.5 billion for the quarter.
Meanwhile, some noteworthy news includes:
→ Berkshire significantly reduced its Apple (AAPL) holdings and refrained from new investments, even as stock indexes hover near historical highs.
→ Cash reserves reached a record $325 billion.
This has led to speculation that Buffett may believe:
→ stock prices are overvalued;
→ a market correction could be imminent.
Interestingly, Berkshire Hathaway is also holding off on buybacks—could Buffett be expecting a further price drop?
Technical analysis of the BRK.B chart suggests:
→ The price has fallen into the lower half of the blue channel, which remains relevant.
→ It’s possible that after a bearish reversal from $475 at the upper channel boundary, the stock has been in a correction phase since September (indicated by red lines), resembling the period from February 26 to July 10.
Traders may want to watch for demand around:
→ $445 (previous resistance in July),
→ the lower boundary of the ascending channel.
Trade global index CFDs with zero commission and tight spreads. Open your FXOpen account now or learn more about trading index CFDs with FXOpen.
CFDs are complex instruments and come with a high risk of losing your money.
This article represents the opinion of the Companies operating under the FXOpen brand only. It is not to be construed as an offer, solicitation, or recommendation with respect to products and services provided by the Companies operating under the FXOpen brand, nor is it to be considered financial advice.
Warren Buffett Moves to Cash
On August 30, when the price of Berkshire Hathaway's Class B shares (BRK.B) surpassed $465, we noted that:
→ the stock was forming an ascending channel (shown in blue);
→ as the price neared $475, the likelihood of a slowdown in the bullish trend increased.
Since then (indicated by the arrow):
→ the price hit the upper channel boundary,
→ reversed downward after briefly exceeding $475,
→ and dropped to around $455 by November 1, when Warren Buffett’s Berkshire Hathaway reported Q3 earnings.
Analyst forecasts were close to the report’s actual figures:
→ Earnings per share: forecast = $4.9, actual = $4.7.
→ Revenue: forecast = $92.2 billion, actual = $92.9 billion.
→ Berkshire Hathaway’s investment income more than doubled year-over-year, reaching $3.5 billion for the quarter.
Meanwhile, some noteworthy news includes:
→ Berkshire significantly reduced its Apple (AAPL) holdings and refrained from new investments, even as stock indexes hover near historical highs.
→ Cash reserves reached a record $325 billion.
This has led to speculation that Buffett may believe:
→ stock prices are overvalued;
→ a market correction could be imminent.
Interestingly, Berkshire Hathaway is also holding off on buybacks—could Buffett be expecting a further price drop?
Technical analysis of the BRK.B chart suggests:
→ The price has fallen into the lower half of the blue channel, which remains relevant.
→ It’s possible that after a bearish reversal from $475 at the upper channel boundary, the stock has been in a correction phase since September (indicated by red lines), resembling the period from February 26 to July 10.
Traders may want to watch for demand around:
→ $445 (previous resistance in July),
→ the lower boundary of the ascending channel.
Trade global index CFDs with zero commission and tight spreads. Open your FXOpen account now or learn more about trading index CFDs with FXOpen.
CFDs are complex instruments and come with a high risk of losing your money.
This article represents the opinion of the Companies operating under the FXOpen brand only. It is not to be construed as an offer, solicitation, or recommendation with respect to products and services provided by the Companies operating under the FXOpen brand, nor is it to be considered financial advice.
👍2
#XAUUSD #goldprice #marketanalysis #MarketNews
XAU/USD Analysis: Gold Price Chart Displays Bearish Signals
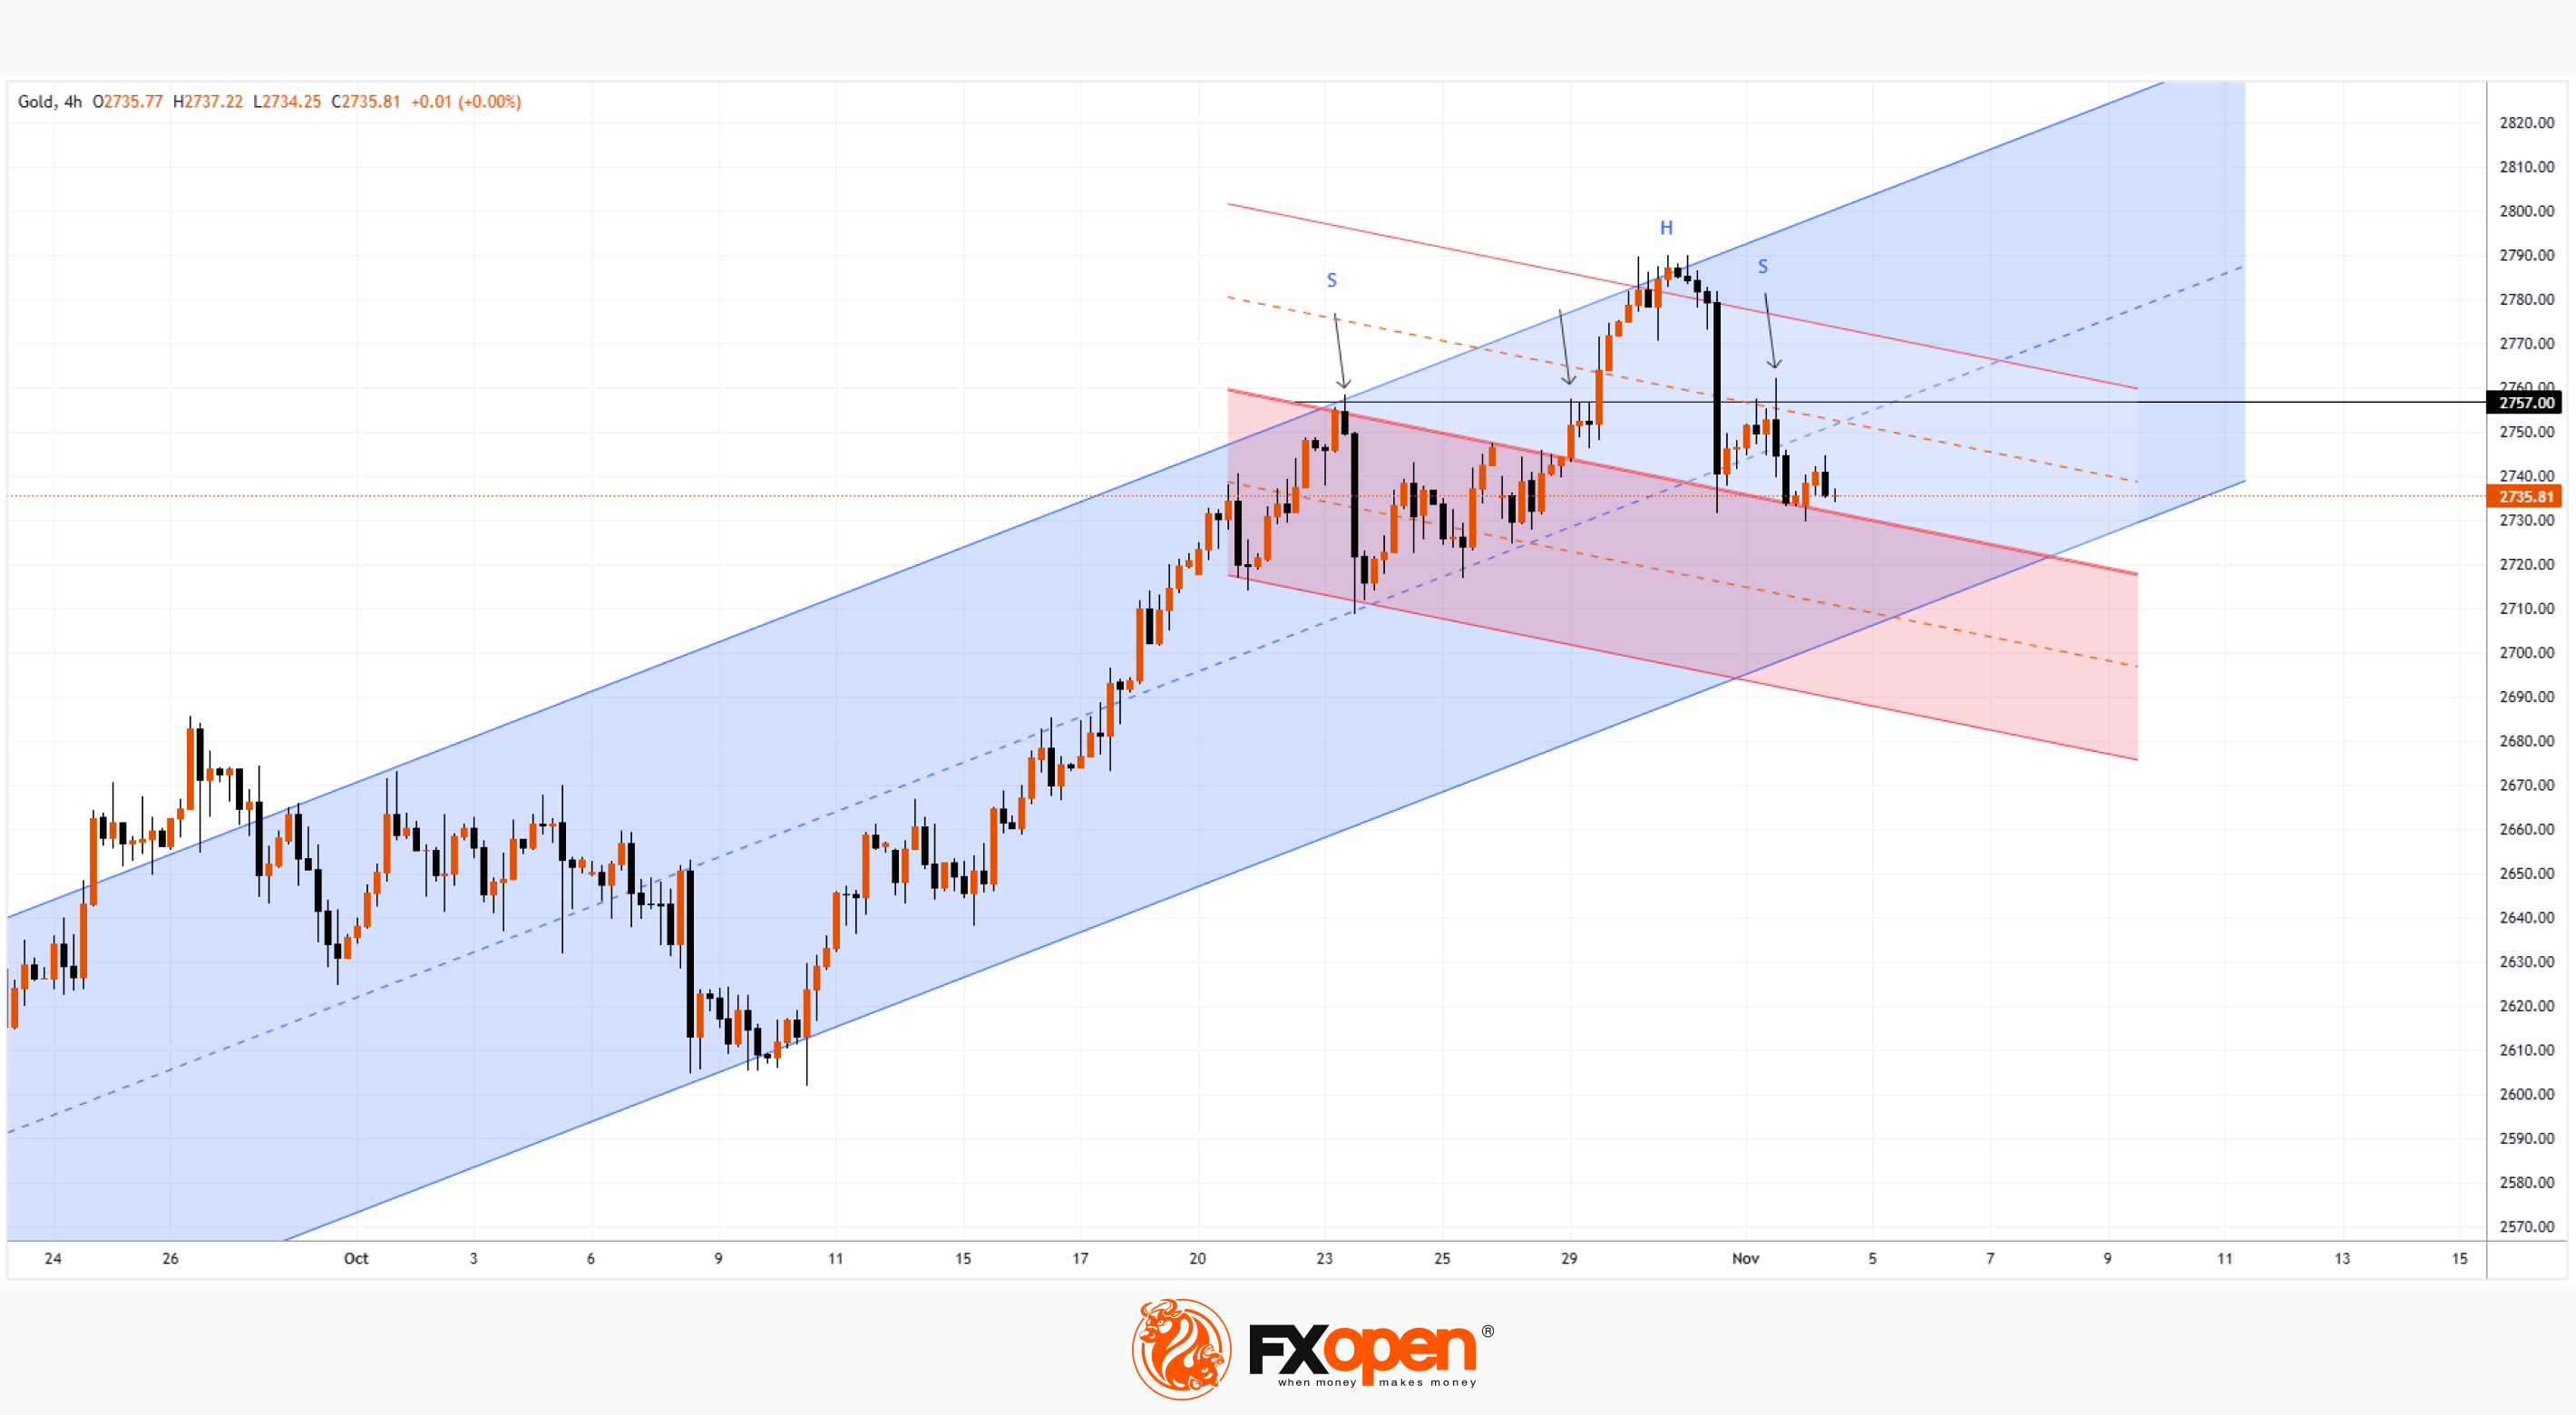
Analysing the XAU/USD chart on October 18, we:
→ Established a long-term upward channel (indicated in blue);
→ Suggested that the target for bulls might be the upper red line, drawn parallel to the red corrective channel.
Since then:
→ The gold price rose to the upper red line and the top of the blue channel,
→ But then experienced a bearish reversal, dropping sharply on October 31 amid economic news.
Today, technical analysis of the XAU/USD chart shows several bearish signals, specifically:
→ Gold has moved into the lower half of the blue channel, crossing below its midpoint—indicating supply pressure;
→ The $2757 level has once again acted as resistance (marked with arrows);
→ A bearish "Head and Shoulders" pattern (SHS) is forming on the chart.
A central question for November will likely be whether bulls can keep the gold price within the ascending channel. The channel’s lower boundary may serve as a support level.
However, it’s possible that, with new developments in geopolitics and macroeconomics, the XAU/USD chart will continue to display price action within a more defined downward channel.
Start trading commodities with tight spreads. Open your trading account now or learn more about trading commodity CFDs with FXOpen.
CFDs are complex instruments and come with a high risk of losing your money.
This article represents the opinion of the Companies operating under the FXOpen brand only. It is not to be construed as an offer, solicitation, or recommendation with respect to products and services provided by the Companies operating under the FXOpen brand, nor is it to be considered financial advice.
XAU/USD Analysis: Gold Price Chart Displays Bearish Signals
Analysing the XAU/USD chart on October 18, we:
→ Established a long-term upward channel (indicated in blue);
→ Suggested that the target for bulls might be the upper red line, drawn parallel to the red corrective channel.
Since then:
→ The gold price rose to the upper red line and the top of the blue channel,
→ But then experienced a bearish reversal, dropping sharply on October 31 amid economic news.
Today, technical analysis of the XAU/USD chart shows several bearish signals, specifically:
→ Gold has moved into the lower half of the blue channel, crossing below its midpoint—indicating supply pressure;
→ The $2757 level has once again acted as resistance (marked with arrows);
→ A bearish "Head and Shoulders" pattern (SHS) is forming on the chart.
A central question for November will likely be whether bulls can keep the gold price within the ascending channel. The channel’s lower boundary may serve as a support level.
However, it’s possible that, with new developments in geopolitics and macroeconomics, the XAU/USD chart will continue to display price action within a more defined downward channel.
Start trading commodities with tight spreads. Open your trading account now or learn more about trading commodity CFDs with FXOpen.
CFDs are complex instruments and come with a high risk of losing your money.
This article represents the opinion of the Companies operating under the FXOpen brand only. It is not to be construed as an offer, solicitation, or recommendation with respect to products and services provided by the Companies operating under the FXOpen brand, nor is it to be considered financial advice.
👍2
#AAPL #stockmarket #stocktrading #MarketUpdates
Apple Report Drives Bearish Sentiment for AAPL Stock
Apple, the largest U.S. market-cap company, released its Q3 earnings report on October 31:
→ Earnings per share (EPS): Actual = $0.97, Expected = $1.60
→ Gross revenue: Actual = $94.9 billion, Expected = $94.5 billion
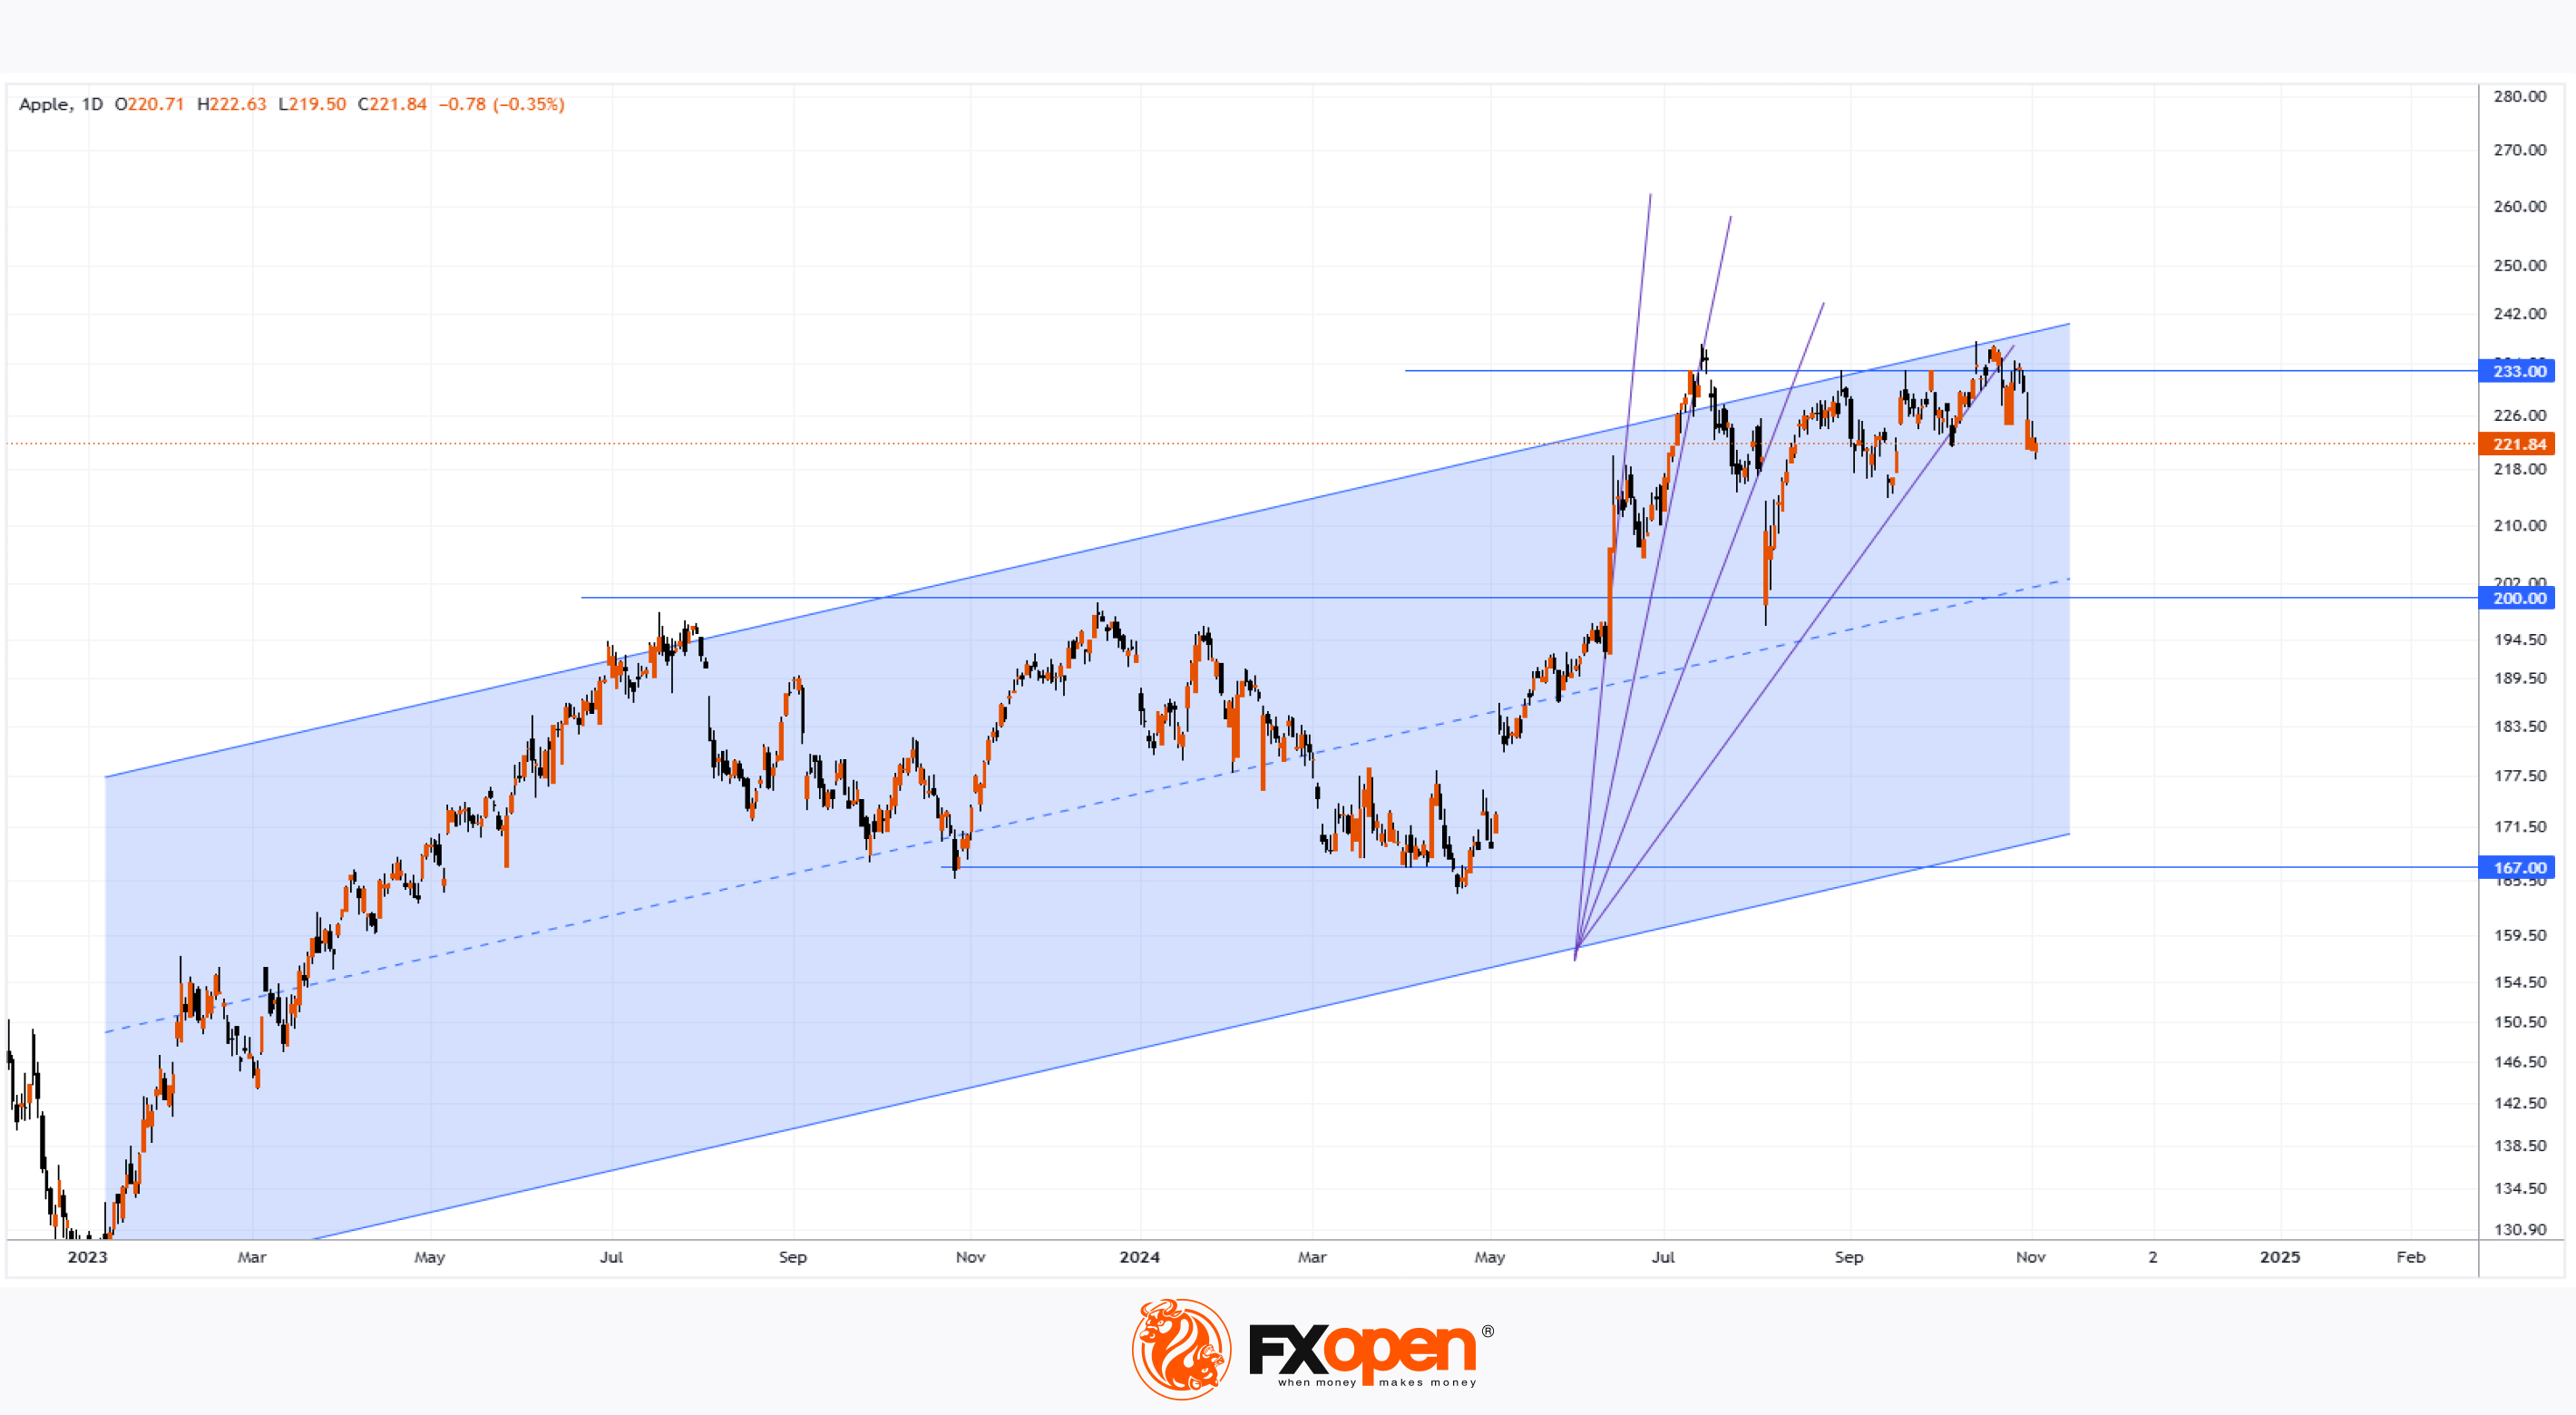
The nearly 40% miss on EPS likely disappointed investors, contributing to bearish pressure. As seen in AAPL’s chart, prices dropped below $220 — a level last seen in early September.
Could the decline deepen? Today’s technical analysis of AAPL presents a few arguments for a bearish outlook:
→ In 2023-2024, the stock moved within a broad range between $167 and $200. When the bullish breakout of this range occurred in June 2024, $233 became a potential target, showing signs of resistance. The resistance around $233 is also reinforced by the upper boundary of a long-term ascending channel (in blue).
→ Trendline slopes have been gradually flattening (in purple), a sign of waning buying momentum.
This weakening demand near $233 may lead to further bearish attempts to push AAPL below $220 toward the median of its long-term rising channel.
Meanwhile, Wall Street analysts remain optimistic. According to TipRanks:
→ 23 of 34 analysts recommend buying AAPL;
→ The average 12-month price target is $245.
Trade global index CFDs with zero commission and tight spreads. Open your FXOpen account now or learn more about trading index CFDs with FXOpen.
CFDs are complex instruments and come with a high risk of losing your money.
This article represents the opinion of the Companies operating under the FXOpen brand only. It is not to be construed as an offer, solicitation, or recommendation with respect to products and services provided by the Companies operating under the FXOpen brand, nor is it to be considered financial advice.
Apple Report Drives Bearish Sentiment for AAPL Stock
Apple, the largest U.S. market-cap company, released its Q3 earnings report on October 31:
→ Earnings per share (EPS): Actual = $0.97, Expected = $1.60
→ Gross revenue: Actual = $94.9 billion, Expected = $94.5 billion
The nearly 40% miss on EPS likely disappointed investors, contributing to bearish pressure. As seen in AAPL’s chart, prices dropped below $220 — a level last seen in early September.
Could the decline deepen? Today’s technical analysis of AAPL presents a few arguments for a bearish outlook:
→ In 2023-2024, the stock moved within a broad range between $167 and $200. When the bullish breakout of this range occurred in June 2024, $233 became a potential target, showing signs of resistance. The resistance around $233 is also reinforced by the upper boundary of a long-term ascending channel (in blue).
→ Trendline slopes have been gradually flattening (in purple), a sign of waning buying momentum.
This weakening demand near $233 may lead to further bearish attempts to push AAPL below $220 toward the median of its long-term rising channel.
Meanwhile, Wall Street analysts remain optimistic. According to TipRanks:
→ 23 of 34 analysts recommend buying AAPL;
→ The average 12-month price target is $245.
Trade global index CFDs with zero commission and tight spreads. Open your FXOpen account now or learn more about trading index CFDs with FXOpen.
CFDs are complex instruments and come with a high risk of losing your money.
This article represents the opinion of the Companies operating under the FXOpen brand only. It is not to be construed as an offer, solicitation, or recommendation with respect to products and services provided by the Companies operating under the FXOpen brand, nor is it to be considered financial advice.
👍2
#sp500 #stockmarket #stocktrading #marketanalysis
How the U.S. Presidential Election May Impact the S&P 500
Today, 5 November, the U.S. presidential election is underway, and it may serve as a significant driver of volatility for global stock markets.
According to EuroNews, heightened market fluctuations are expected throughout the voting period on 5 November, potentially mirroring reactions observed during the Brexit referendum and the 2016 U.S. election. Newsweek notes that historically, U.S. stock markets tend to rise regardless of the election winner. In 2020, for example, American stocks rose immediately after election day and continued upward even as Trump contested the results.
Investor’s Business Daily highlights Tony Roth, CIO of Wilmington Trust, who argues that U.S. stock markets could climb regardless of whether Harris or Trump wins, as both candidates provide viable economic paths that could support market sentiment.
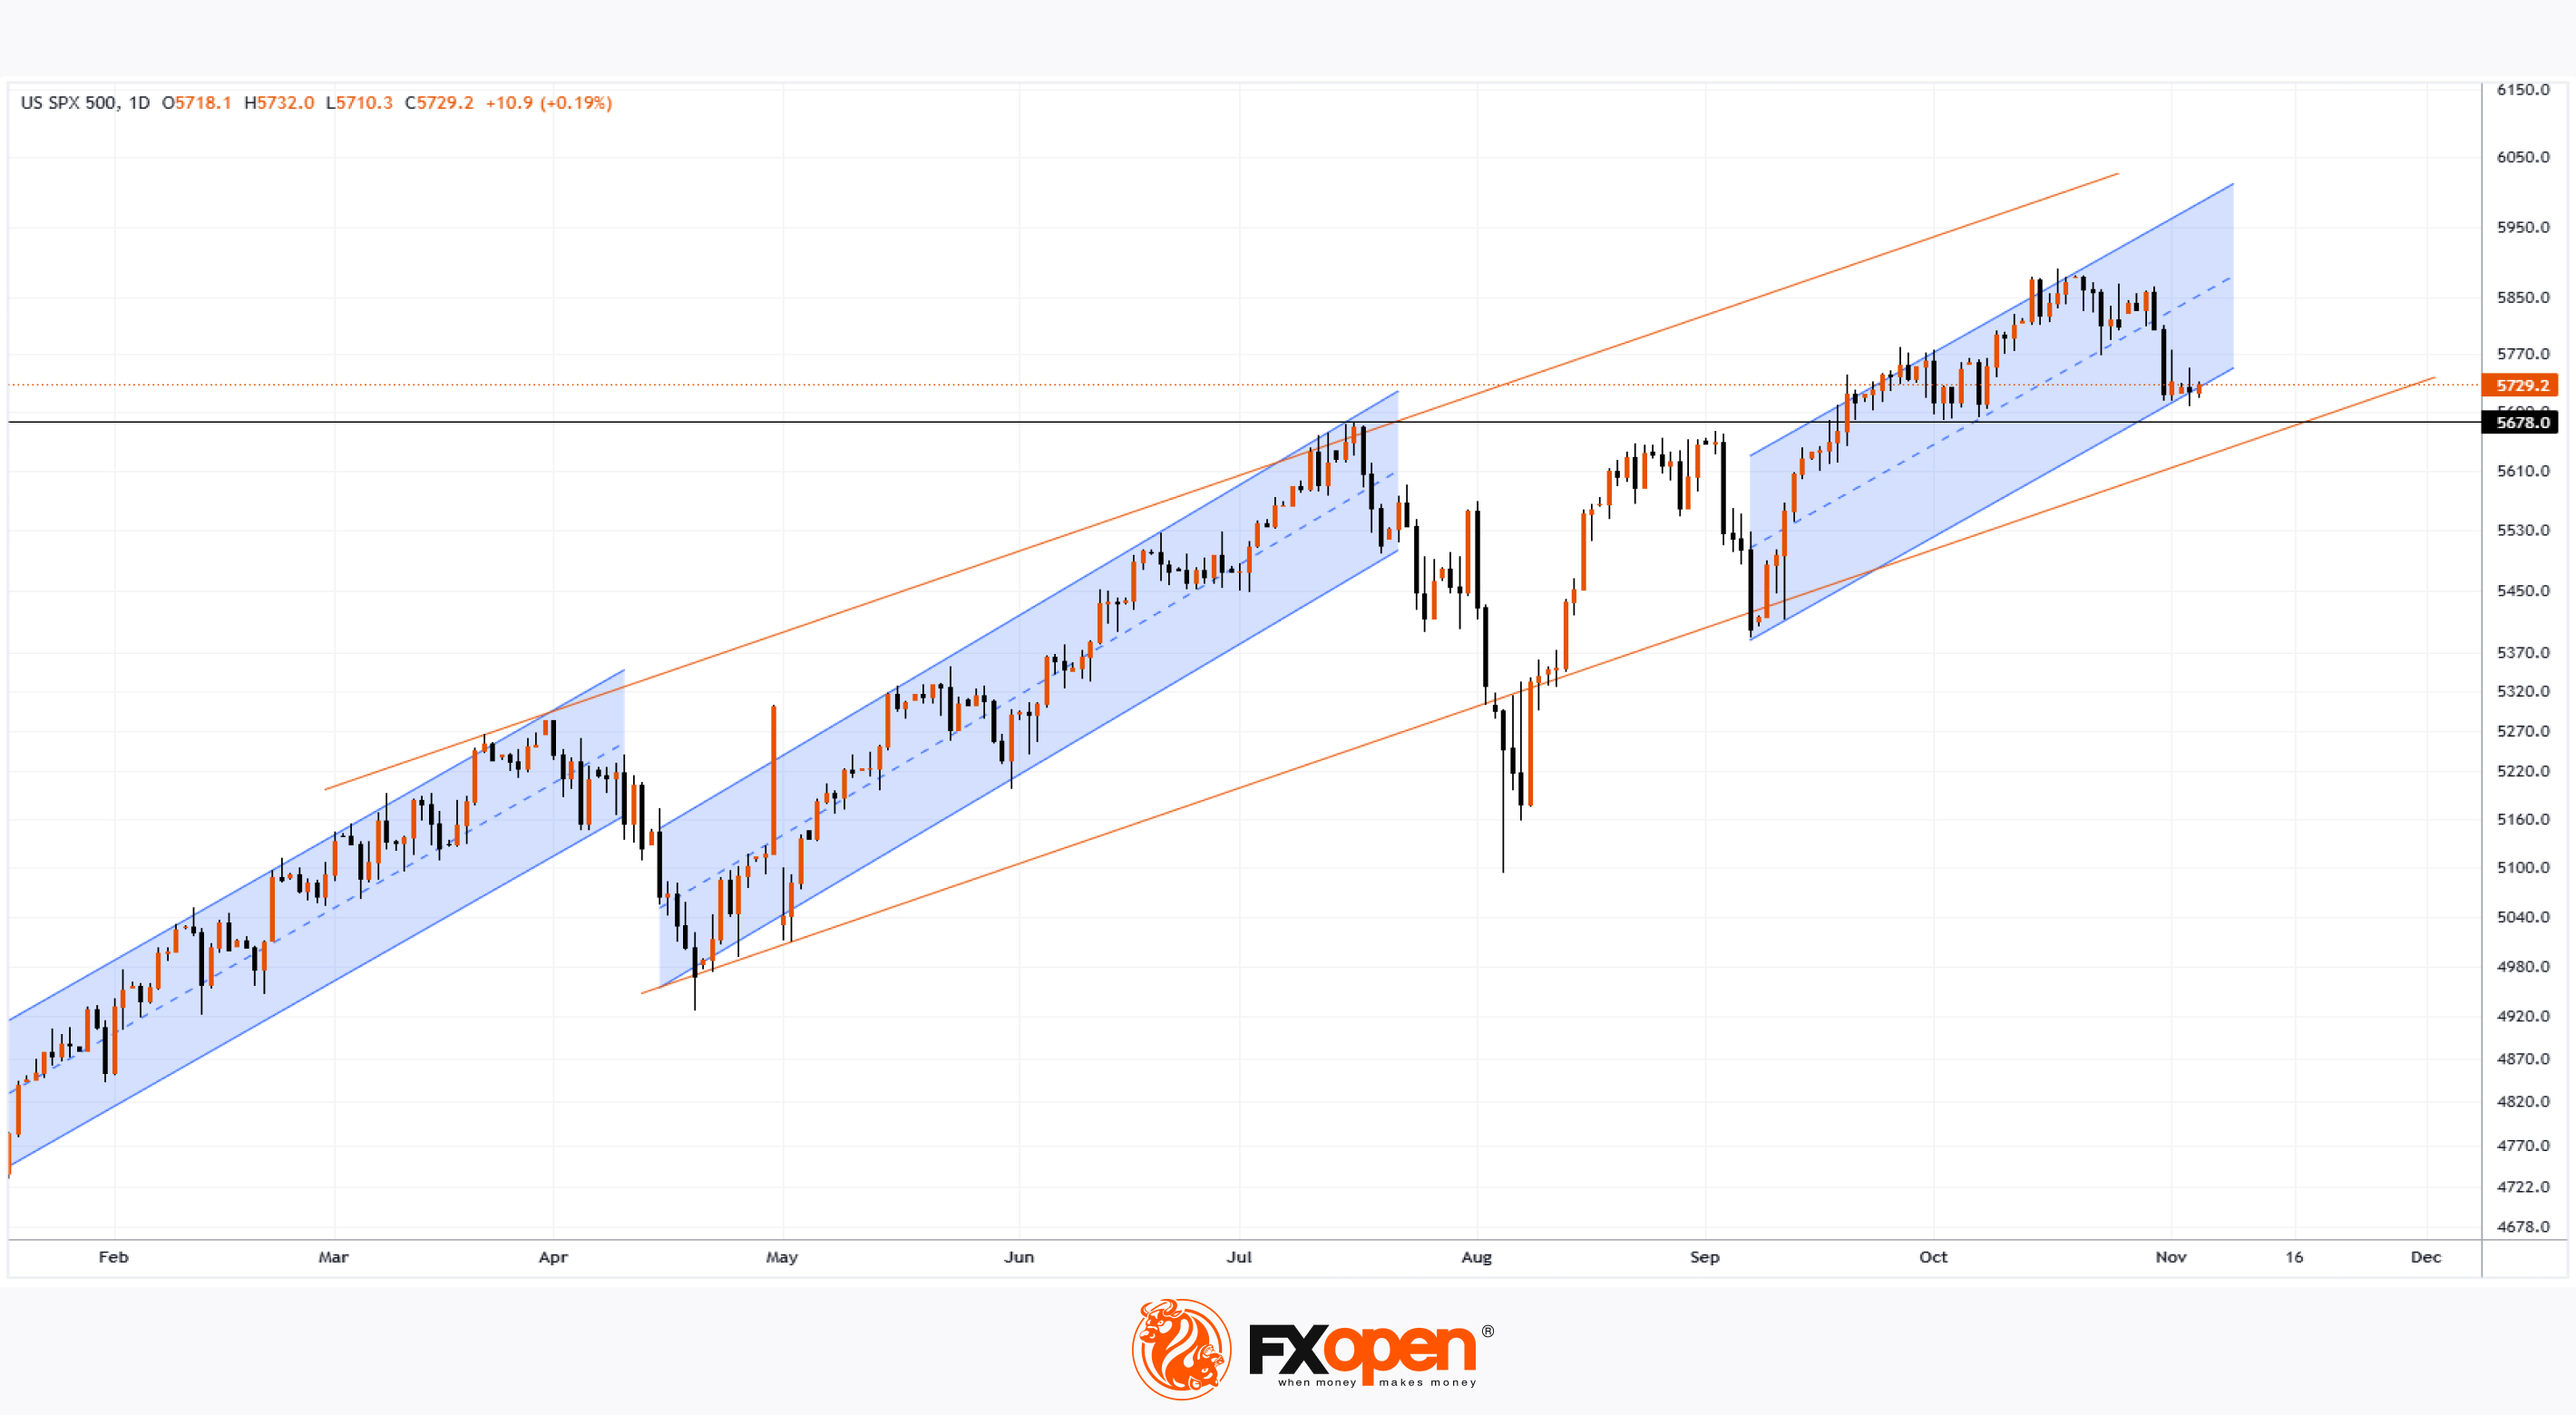
On 14 October, analysing the S&P 500 chart (US SPX 500 mini on FXOpen), we plotted three narrow upward channels (shown in blue), noting:
→ each channel has a similar slope and width;
→ connecting the maximum of Channel 1, the peak and trough of Channel 2, and the low of Channel 3 outlines a larger channel (in orange).
Today’s technical analysis of the S&P 500 (US SPX 500 mini on FXOpen) shows the current index level near the lower edge of the third blue channel, with additional support around:
→ former resistance at $5678;
→ the lower orange boundary.
Election results may trigger a volatility spike, potentially testing or reinforcing these support levels, which could shape future market momentum.
Trade global index CFDs with zero commission and tight spreads. Open your FXOpen account now or learn more about trading index CFDs with FXOpen.
CFDs are complex instruments and come with a high risk of losing your money.
This article represents the opinion of the Companies operating under the FXOpen brand only. It is not to be construed as an offer, solicitation, or recommendation with respect to products and services provided by the Companies operating under the FXOpen brand, nor is it to be considered financial advice.
How the U.S. Presidential Election May Impact the S&P 500
Today, 5 November, the U.S. presidential election is underway, and it may serve as a significant driver of volatility for global stock markets.
According to EuroNews, heightened market fluctuations are expected throughout the voting period on 5 November, potentially mirroring reactions observed during the Brexit referendum and the 2016 U.S. election. Newsweek notes that historically, U.S. stock markets tend to rise regardless of the election winner. In 2020, for example, American stocks rose immediately after election day and continued upward even as Trump contested the results.
Investor’s Business Daily highlights Tony Roth, CIO of Wilmington Trust, who argues that U.S. stock markets could climb regardless of whether Harris or Trump wins, as both candidates provide viable economic paths that could support market sentiment.
On 14 October, analysing the S&P 500 chart (US SPX 500 mini on FXOpen), we plotted three narrow upward channels (shown in blue), noting:
→ each channel has a similar slope and width;
→ connecting the maximum of Channel 1, the peak and trough of Channel 2, and the low of Channel 3 outlines a larger channel (in orange).
Today’s technical analysis of the S&P 500 (US SPX 500 mini on FXOpen) shows the current index level near the lower edge of the third blue channel, with additional support around:
→ former resistance at $5678;
→ the lower orange boundary.
Election results may trigger a volatility spike, potentially testing or reinforcing these support levels, which could shape future market momentum.
Trade global index CFDs with zero commission and tight spreads. Open your FXOpen account now or learn more about trading index CFDs with FXOpen.
CFDs are complex instruments and come with a high risk of losing your money.
This article represents the opinion of the Companies operating under the FXOpen brand only. It is not to be construed as an offer, solicitation, or recommendation with respect to products and services provided by the Companies operating under the FXOpen brand, nor is it to be considered financial advice.
👍2
#tsla #tesla #stockmarket #MarketNews
Tesla (TSLA) Stock Surges Following Trump’s Election Win
According to the TSLA chart:
→ Tesla shares opened this week at $244.25.
→ By yesterday’s close, the stock had reached $296.52.
This reflects a gain of over 21% for the week, with the major boost occurring on 6 November, as news broke of Trump’s U.S. presidential victory—a candidate supported by Tesla’s CEO, Elon Musk.
As CNBC reports:
→ Musk reportedly invested at least $130 million into Trump’s campaign, lending his support as a significant effort in recent months.
→ The president-elect has pledged to roll back regulations that Musk opposes, leading Wall Street to bet on potential advantages for Tesla under the new administration.
Back on 24 October, after Tesla’s earnings report, we noted:
→ Since May, the price has been fluctuating within an upward channel (shown in blue), with the lower boundary acting as a strong support level.
→ The bullish momentum after the earnings release indicated a failed attempt by bears to break this lower boundary (shown with a red arrow).
→ Bulls might continue driving TSLA's price within this channel, aiming to breach the key resistance at $260.
Currently, technical analysis on TSLA shows an aggressive movement into the upper half of the channel. It’s possible that the channel’s upper boundary will become a target for the ongoing rally (marked by black lines). Here:
→ The $300 level per share might present psychological resistance in the coming days.
→ Support may come from the blue channel’s median line or the key $260 level, where the price rebounded twice in 2024.
Trade global index CFDs with zero commission and tight spreads. Open your FXOpen account now or learn more about trading index CFDs with FXOpen.
CFDs are complex instruments and come with a high risk of losing your money.
This article represents the opinion of the Companies operating under the FXOpen brand only. It is not to be construed as an offer, solicitation, or recommendation with respect to products and services provided by the Companies operating under the FXOpen brand, nor is it to be considered financial advice.
Tesla (TSLA) Stock Surges Following Trump’s Election Win
According to the TSLA chart:
→ Tesla shares opened this week at $244.25.
→ By yesterday’s close, the stock had reached $296.52.
This reflects a gain of over 21% for the week, with the major boost occurring on 6 November, as news broke of Trump’s U.S. presidential victory—a candidate supported by Tesla’s CEO, Elon Musk.
As CNBC reports:
→ Musk reportedly invested at least $130 million into Trump’s campaign, lending his support as a significant effort in recent months.
→ The president-elect has pledged to roll back regulations that Musk opposes, leading Wall Street to bet on potential advantages for Tesla under the new administration.
Back on 24 October, after Tesla’s earnings report, we noted:
→ Since May, the price has been fluctuating within an upward channel (shown in blue), with the lower boundary acting as a strong support level.
→ The bullish momentum after the earnings release indicated a failed attempt by bears to break this lower boundary (shown with a red arrow).
→ Bulls might continue driving TSLA's price within this channel, aiming to breach the key resistance at $260.
Currently, technical analysis on TSLA shows an aggressive movement into the upper half of the channel. It’s possible that the channel’s upper boundary will become a target for the ongoing rally (marked by black lines). Here:
→ The $300 level per share might present psychological resistance in the coming days.
→ Support may come from the blue channel’s median line or the key $260 level, where the price rebounded twice in 2024.
Trade global index CFDs with zero commission and tight spreads. Open your FXOpen account now or learn more about trading index CFDs with FXOpen.
CFDs are complex instruments and come with a high risk of losing your money.
This article represents the opinion of the Companies operating under the FXOpen brand only. It is not to be construed as an offer, solicitation, or recommendation with respect to products and services provided by the Companies operating under the FXOpen brand, nor is it to be considered financial advice.
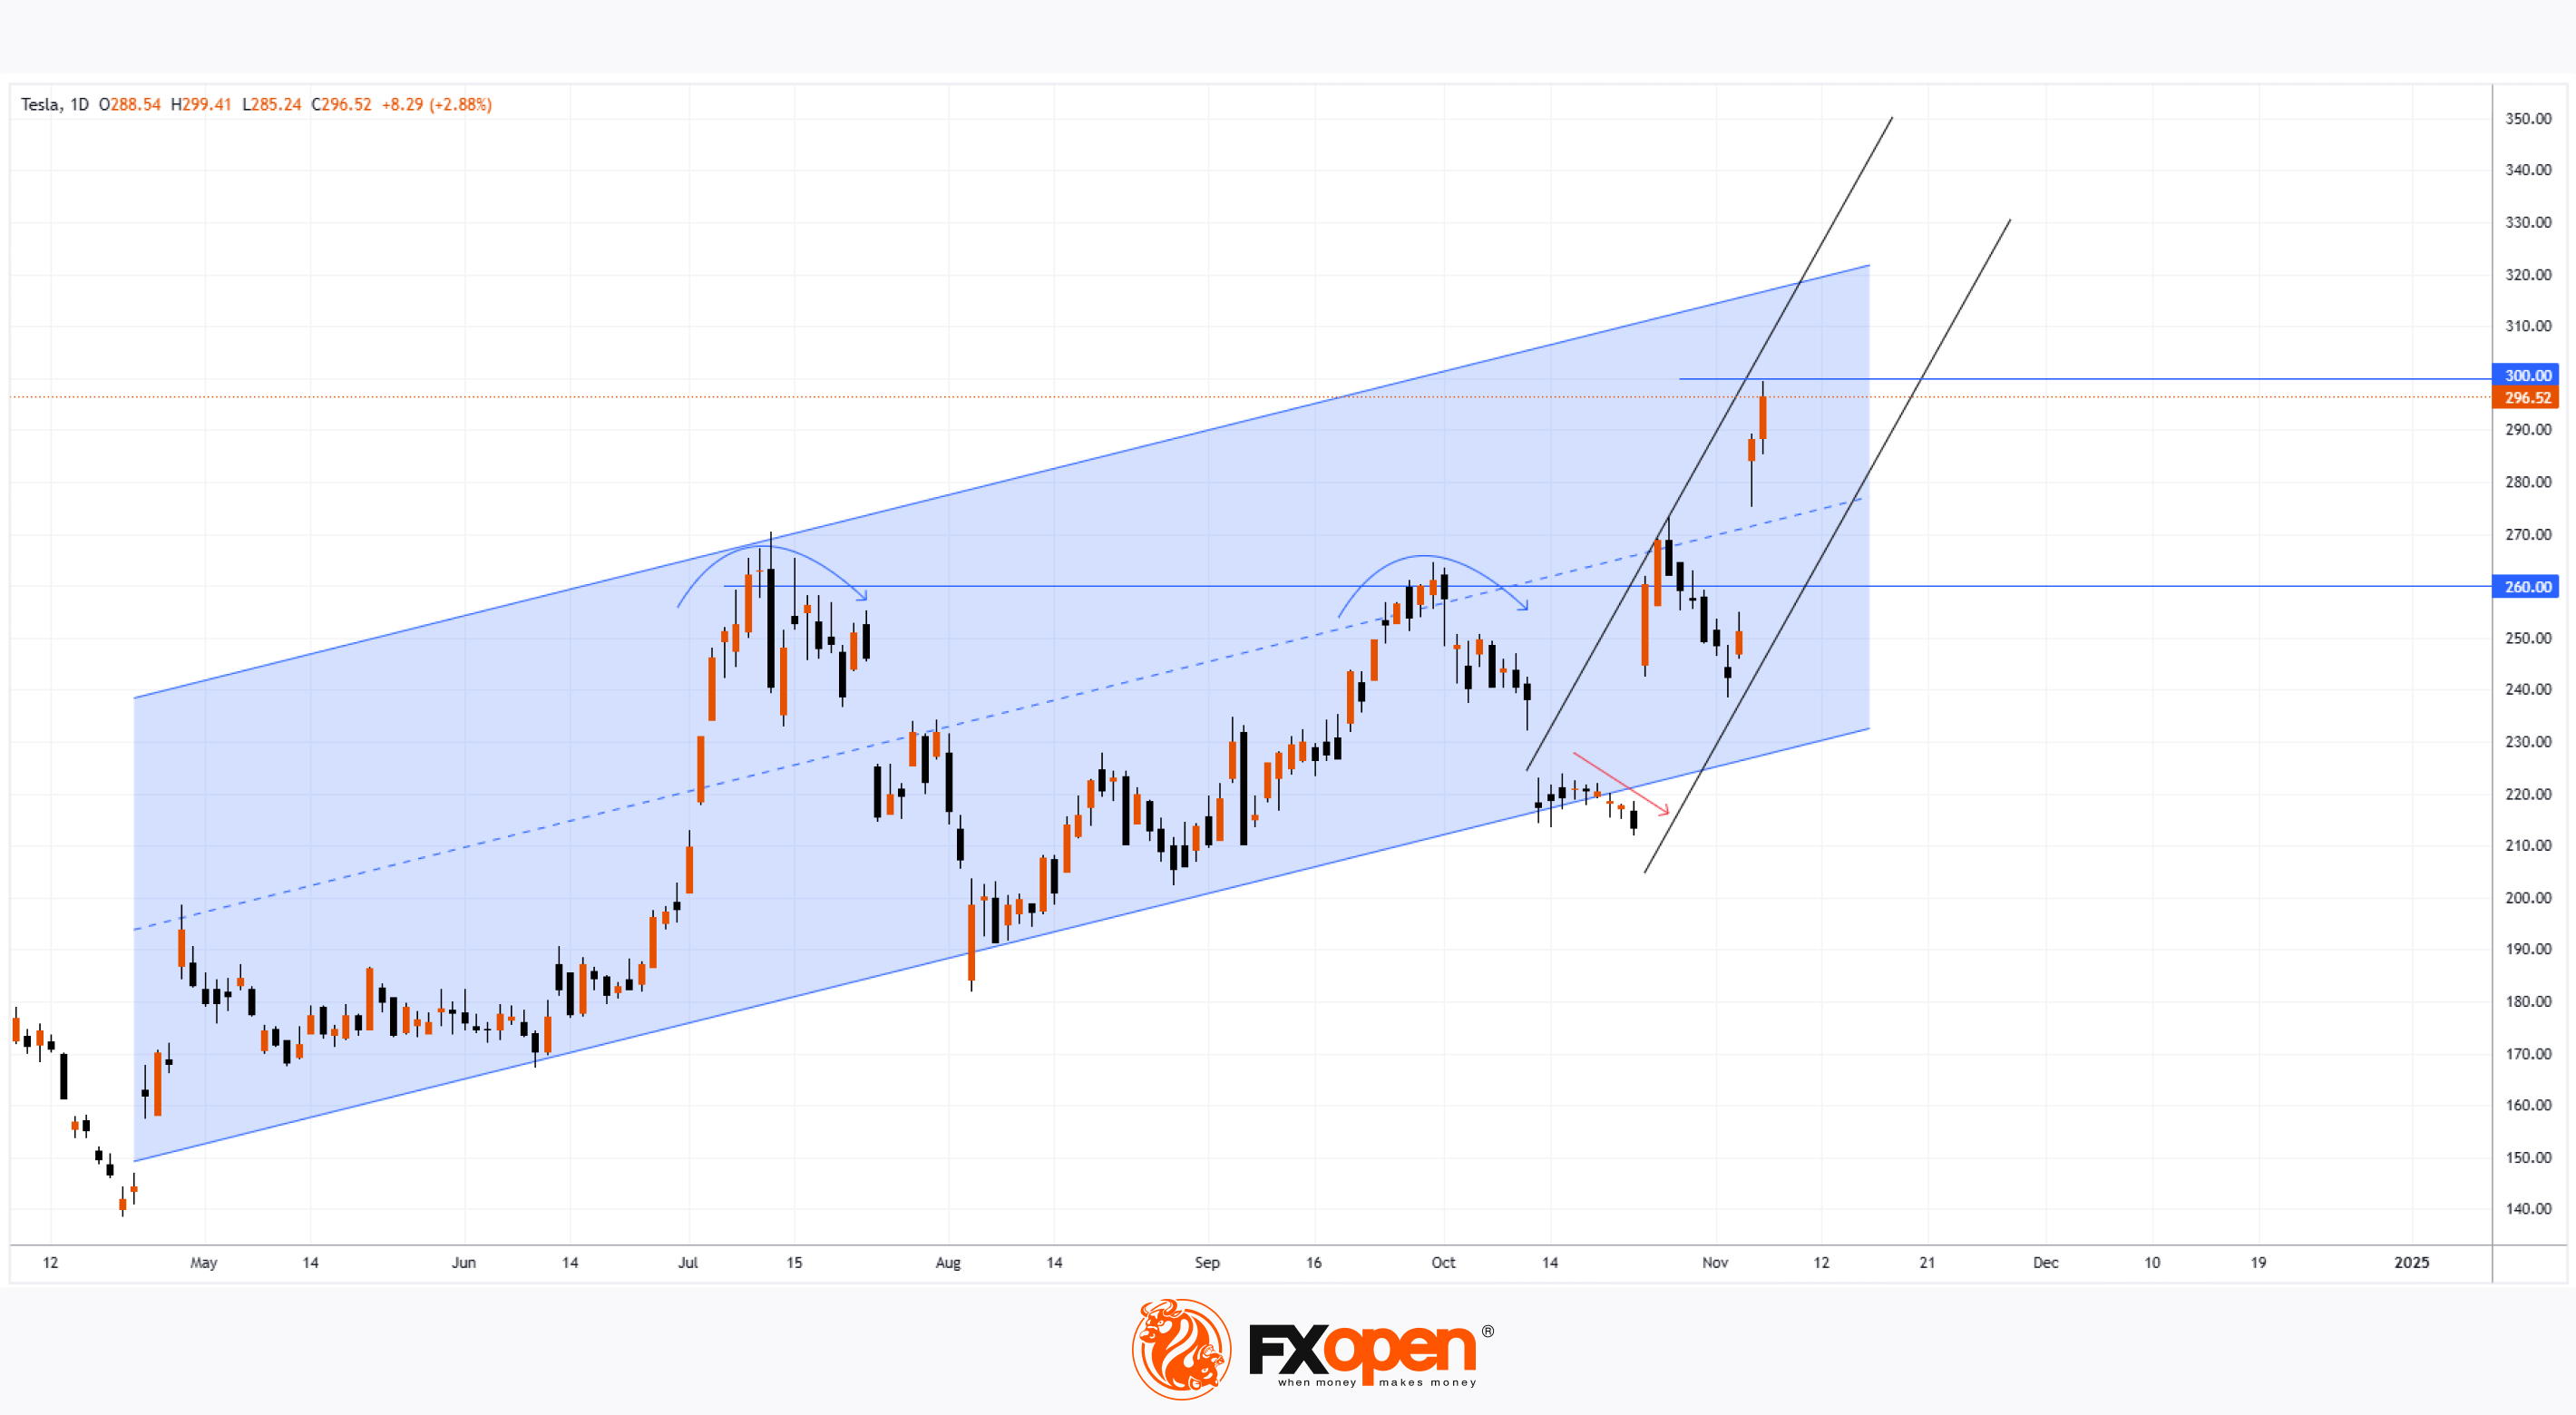
👍2
#MarketNews #stockmarket #forextrading #NASDAQ
Fed Cuts Rate by 0.25%; Stocks Reach Highs
Yesterday, the Federal Reserve announced a unanimous decision to lower the interest rate from 4.75% to 4.50%, marking the second consecutive cut—a move in line with analyst expectations and forecasts.
“This move will support further progress in controlling inflation as we aim for a more neutral stance over time,” said Fed Chair Jerome Powell.
According to Bloomberg, this decision aligns with the Fed’s efforts to support robust U.S. economic growth, creating positive sentiment for stock indices as newly re-elected President Donald Trump is expected to introduce economic stimulus measures.
However, could tensions arise between the new administration and the Fed? Trump has a record of publicly criticizing Powell and even considered dismissing him during his first term. At a press conference yesterday, Powell was asked if he would step down if requested by Trump, to which he replied decisively, “No.” He added that the removal or demotion of Fed board members, including himself, is “not legally permissible.” Powell emphasized that the U.S. election results would have "no effect" on the Fed’s decisions in the near term.
For now, optimism prevails on U.S. stock markets. Analysis of the Nasdaq 100 index (US Tech 100 mini on FXOpen) shows that:
→ The price has reached a historic high, surpassing the round figure of 21,000 points and the previous peak set in July around 20,800.
→ It has moved above the upper boundary of the ascending channel (shown in blue), within which it had fluctuated following the early August sell-off.
→ The RSI indicator signals significant market overbought conditions.
Given these factors, the market could be vulnerable to a correction after this recent rally. If a pullback occurs, it may indicate that market sentiment has already priced in the impact of the election outcome and the Fed rate cut. Additionally, the upper black line shown on the chart may act as resistance, potentially cooling the current bullish momentum.
Trade global index CFDs with zero commission and tight spreads. Open your FXOpen account now or learn more about trading index CFDs with FXOpen.
CFDs are complex instruments and come with a high risk of losing your money.
This article represents the opinion of the Companies operating under the FXOpen brand only. It is not to be construed as an offer, solicitation, or recommendation with respect to products and services provided by the Companies operating under the FXOpen brand, nor is it to be considered financial advice.
Fed Cuts Rate by 0.25%; Stocks Reach Highs
Yesterday, the Federal Reserve announced a unanimous decision to lower the interest rate from 4.75% to 4.50%, marking the second consecutive cut—a move in line with analyst expectations and forecasts.
“This move will support further progress in controlling inflation as we aim for a more neutral stance over time,” said Fed Chair Jerome Powell.
According to Bloomberg, this decision aligns with the Fed’s efforts to support robust U.S. economic growth, creating positive sentiment for stock indices as newly re-elected President Donald Trump is expected to introduce economic stimulus measures.
However, could tensions arise between the new administration and the Fed? Trump has a record of publicly criticizing Powell and even considered dismissing him during his first term. At a press conference yesterday, Powell was asked if he would step down if requested by Trump, to which he replied decisively, “No.” He added that the removal or demotion of Fed board members, including himself, is “not legally permissible.” Powell emphasized that the U.S. election results would have "no effect" on the Fed’s decisions in the near term.
For now, optimism prevails on U.S. stock markets. Analysis of the Nasdaq 100 index (US Tech 100 mini on FXOpen) shows that:
→ The price has reached a historic high, surpassing the round figure of 21,000 points and the previous peak set in July around 20,800.
→ It has moved above the upper boundary of the ascending channel (shown in blue), within which it had fluctuated following the early August sell-off.
→ The RSI indicator signals significant market overbought conditions.
Given these factors, the market could be vulnerable to a correction after this recent rally. If a pullback occurs, it may indicate that market sentiment has already priced in the impact of the election outcome and the Fed rate cut. Additionally, the upper black line shown on the chart may act as resistance, potentially cooling the current bullish momentum.
Trade global index CFDs with zero commission and tight spreads. Open your FXOpen account now or learn more about trading index CFDs with FXOpen.
CFDs are complex instruments and come with a high risk of losing your money.
This article represents the opinion of the Companies operating under the FXOpen brand only. It is not to be construed as an offer, solicitation, or recommendation with respect to products and services provided by the Companies operating under the FXOpen brand, nor is it to be considered financial advice.
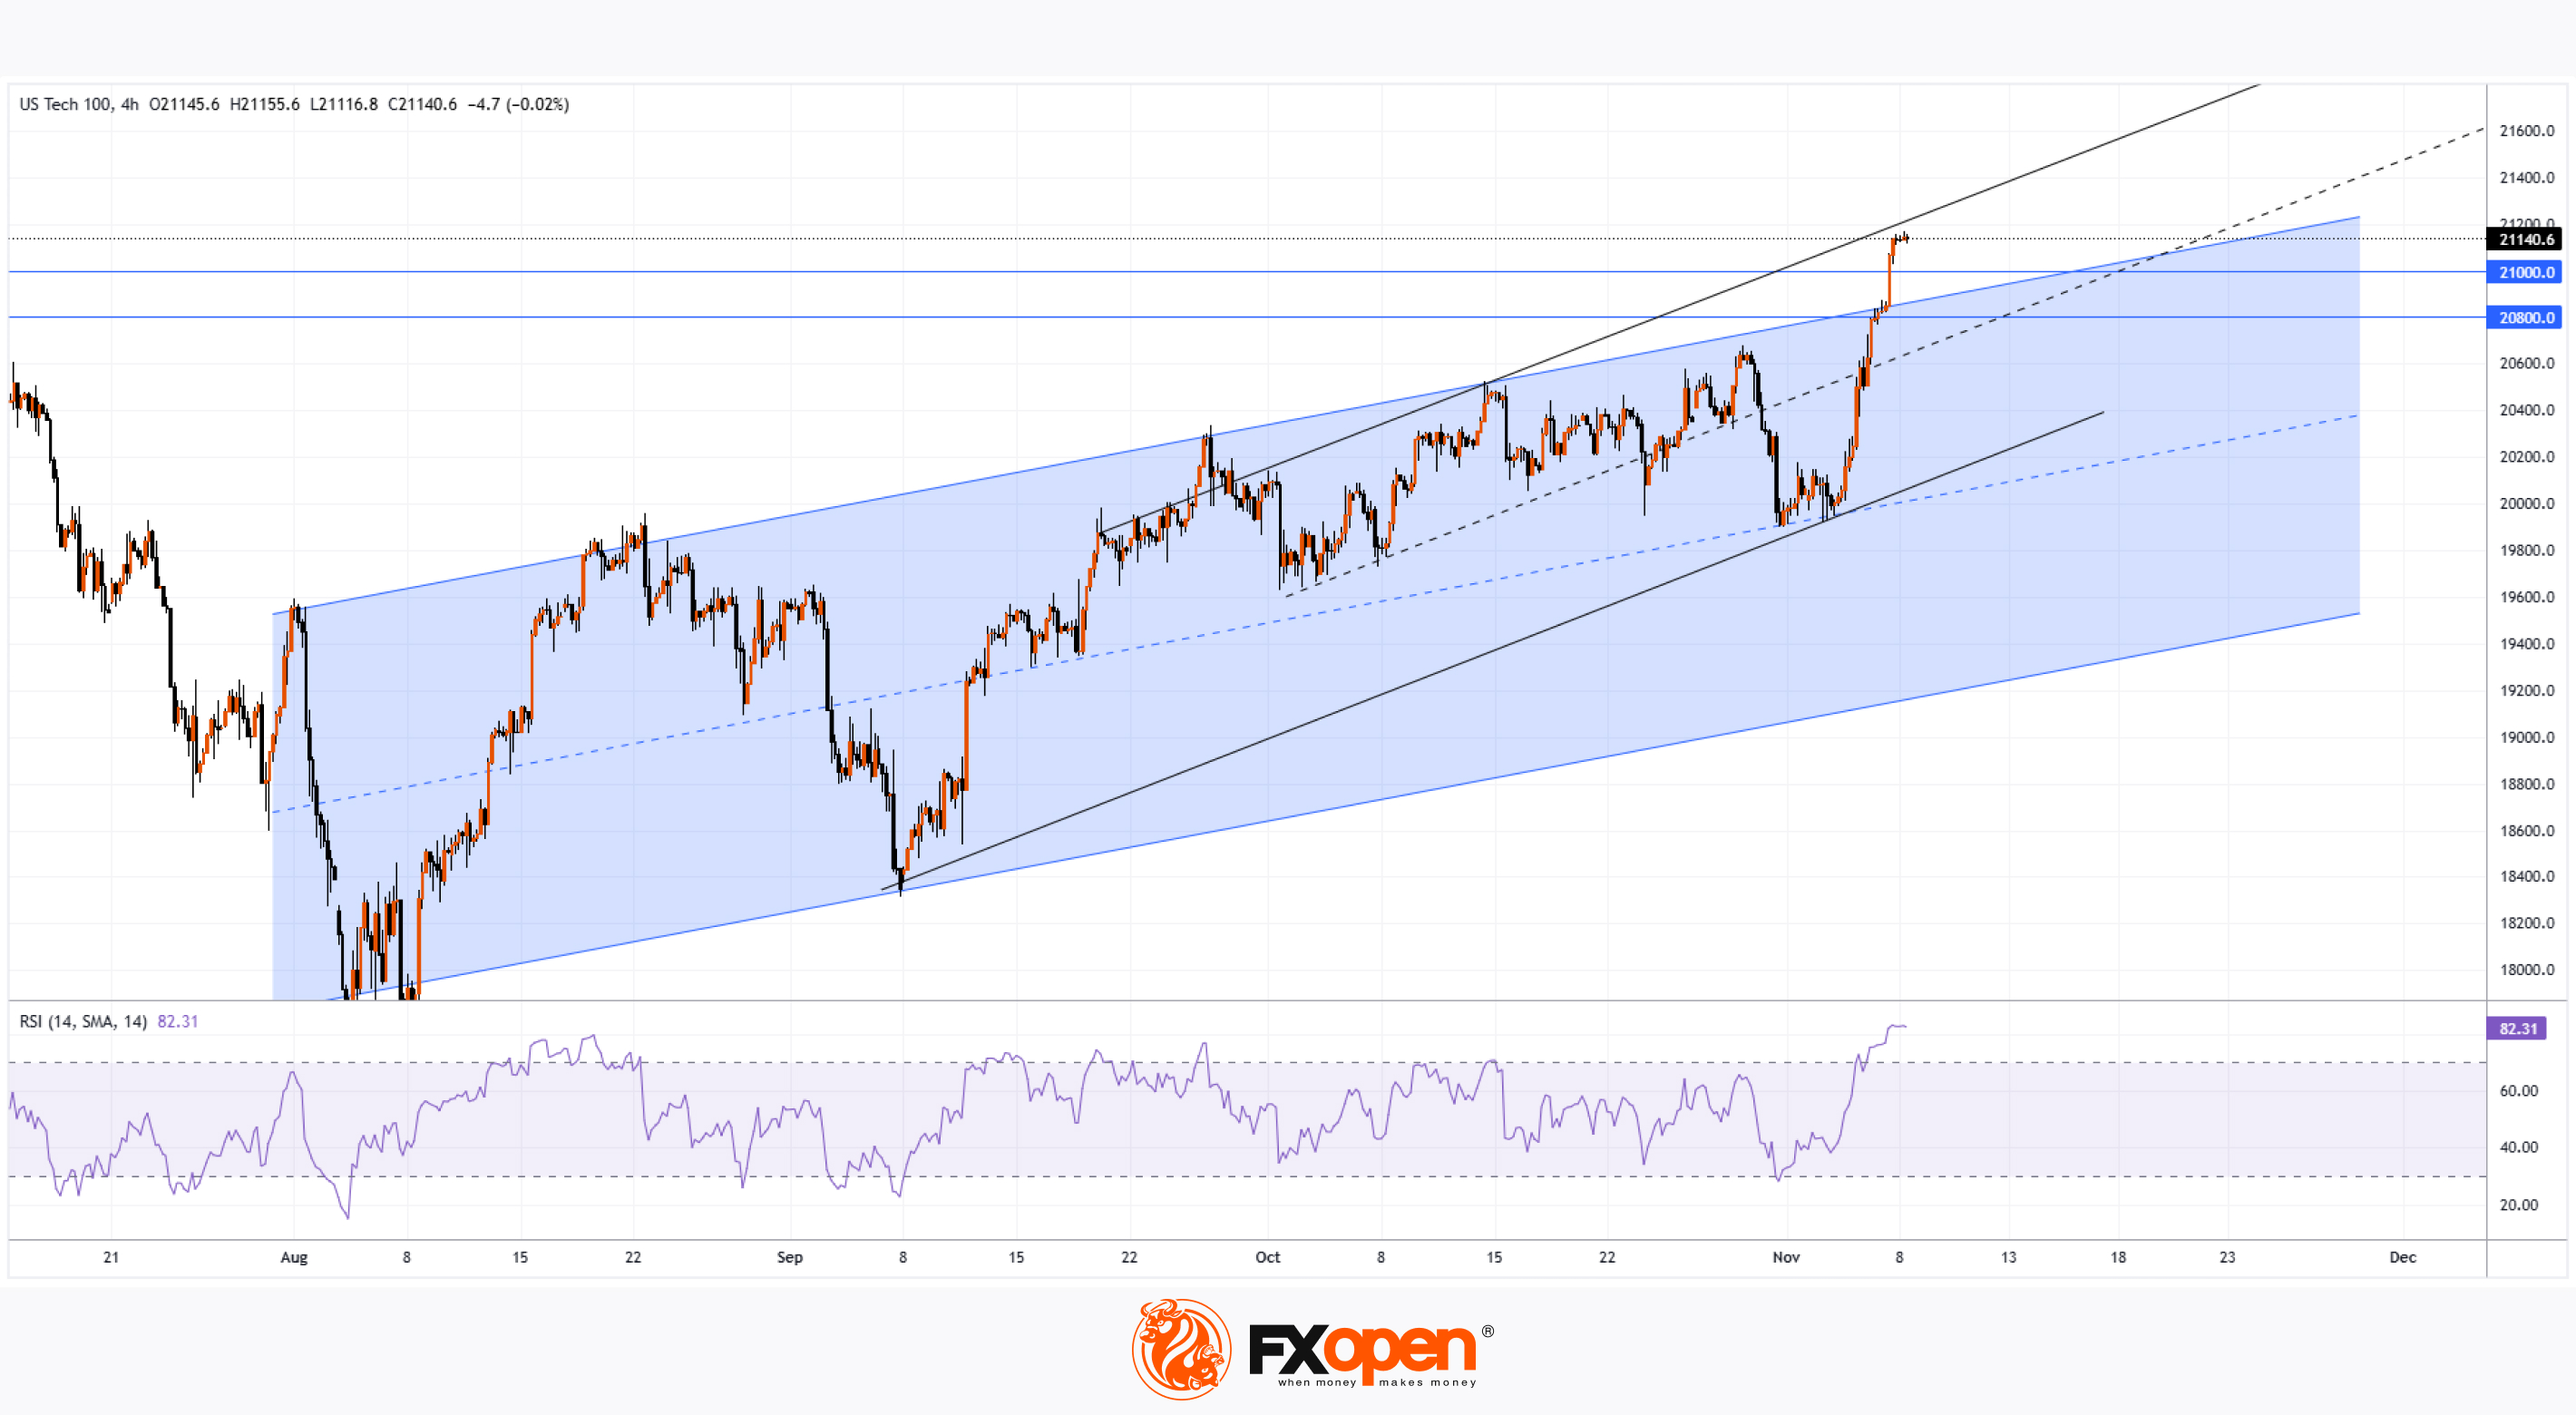
👍2