
#XAUUSD #marketanalysis #MarketNews #goldprice
Analysis of XAU/USD: Gold Price Drops to a Two-Week Low
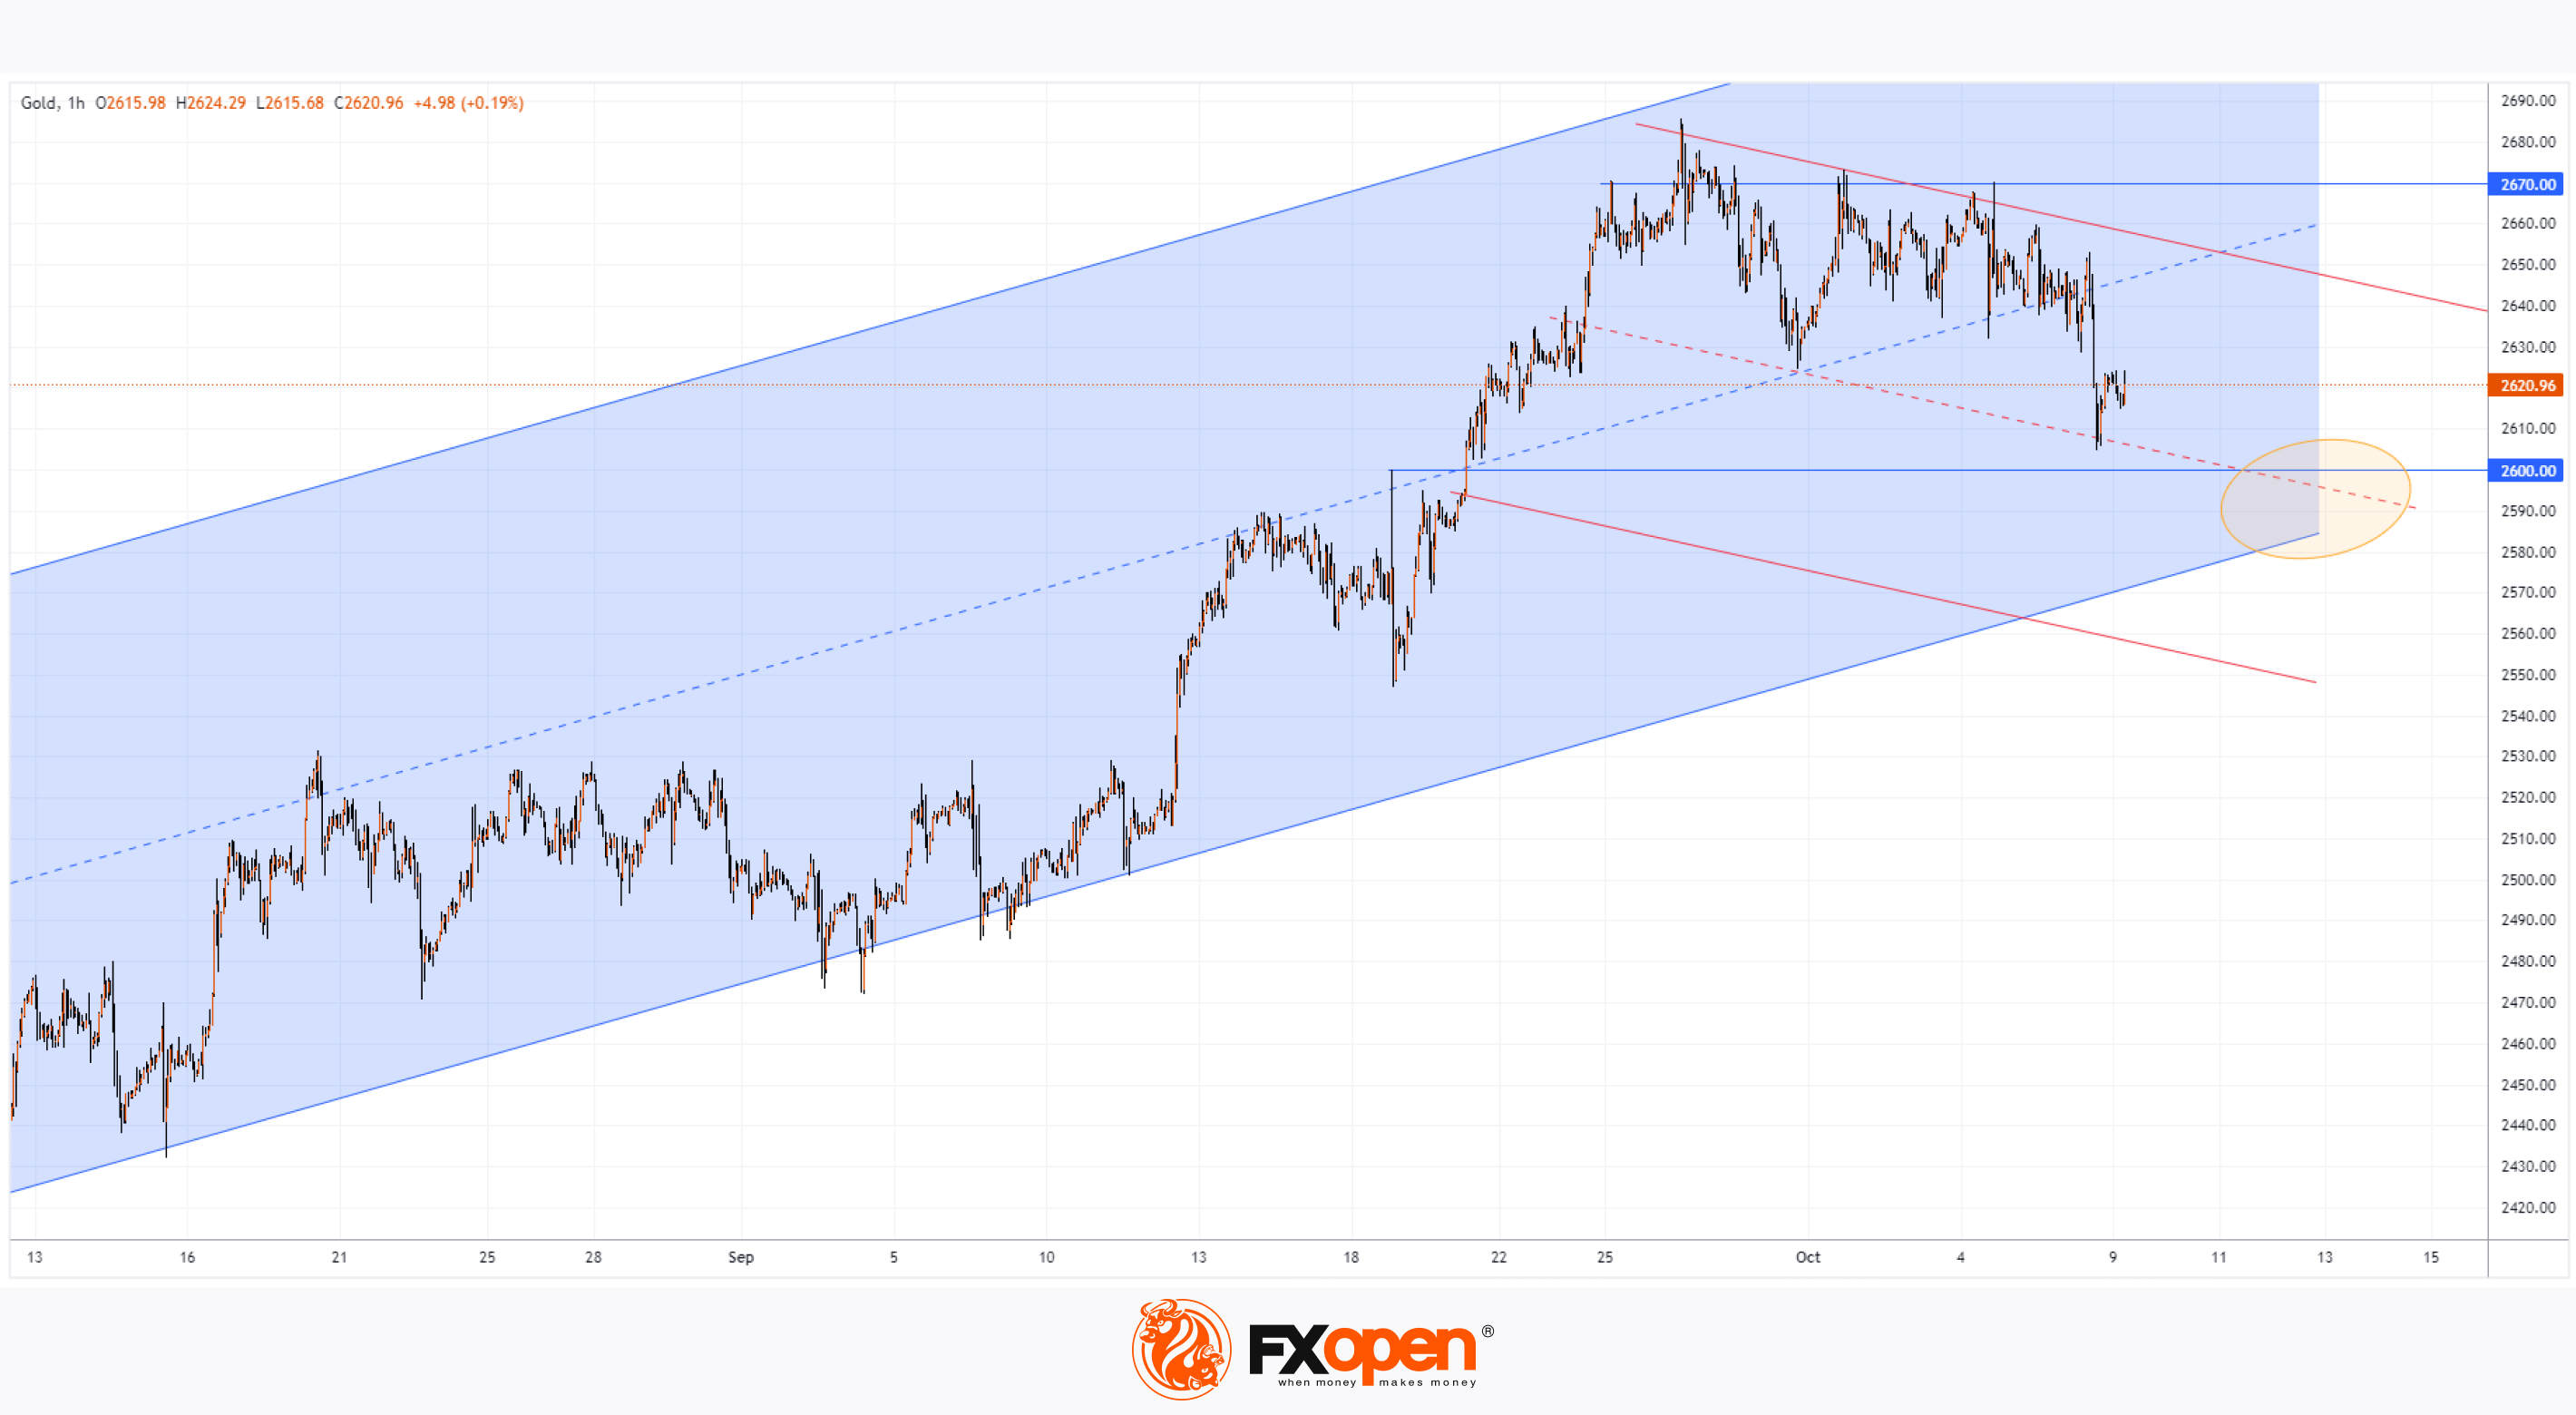
The XAU/USD chart shows that yesterday, the price of gold fell below $2610, a level not seen since 20th September.
Bearish sentiment has been driven by the continued strengthening of the US dollar. According to Trading Economics:
→ This is due to market participants lowering expectations for an aggressive rate cut by the Federal Reserve.
→ Currently, there is an 89% probability that the Fed will decide on a 25 basis point rate cut in November.
The technical analysis of the XAU/USD chart indicates that gold is still within the upward channel (shown in blue), which began in August 2024. However:
→ The gold price has broken below the median line of the blue channel.
→ The price decline from the historic peak reached on 26th September is forming a descending channel (shown in red), which can be considered a correction within the broader upward trend.
→ The $2670 level is showing signs of resistance, while the psychological level of $2600 could act as support, as seen during the bullish breakout in mid-September.
It is possible that bulls will attempt to resume the upward trend, using the area (marked by an orange circle) created by the following support levels:
→ The lower boundary of the blue channel.
→ The red channel line.
→ The psychological level of $2600.
Be prepared for potential volatility spikes. The FOMC meeting minutes will be released today at 21:00 GMT+3, which could trigger sharp movements in the gold price.
Start trading commodities with tight spreads. Open your trading account now or learn more about trading commodity CFDs with FXOpen.
CFDs are complex instruments and come with a high risk of losing your money.
This article represents the opinion of the Companies operating under the FXOpen brand only. It is not to be construed as an offer, solicitation, or recommendation with respect to products and services provided by the Companies operating under the FXOpen brand, nor is it to be considered financial advice.
Analysis of XAU/USD: Gold Price Drops to a Two-Week Low
The XAU/USD chart shows that yesterday, the price of gold fell below $2610, a level not seen since 20th September.
Bearish sentiment has been driven by the continued strengthening of the US dollar. According to Trading Economics:
→ This is due to market participants lowering expectations for an aggressive rate cut by the Federal Reserve.
→ Currently, there is an 89% probability that the Fed will decide on a 25 basis point rate cut in November.
The technical analysis of the XAU/USD chart indicates that gold is still within the upward channel (shown in blue), which began in August 2024. However:
→ The gold price has broken below the median line of the blue channel.
→ The price decline from the historic peak reached on 26th September is forming a descending channel (shown in red), which can be considered a correction within the broader upward trend.
→ The $2670 level is showing signs of resistance, while the psychological level of $2600 could act as support, as seen during the bullish breakout in mid-September.
It is possible that bulls will attempt to resume the upward trend, using the area (marked by an orange circle) created by the following support levels:
→ The lower boundary of the blue channel.
→ The red channel line.
→ The psychological level of $2600.
Be prepared for potential volatility spikes. The FOMC meeting minutes will be released today at 21:00 GMT+3, which could trigger sharp movements in the gold price.
Start trading commodities with tight spreads. Open your trading account now or learn more about trading commodity CFDs with FXOpen.
CFDs are complex instruments and come with a high risk of losing your money.
This article represents the opinion of the Companies operating under the FXOpen brand only. It is not to be construed as an offer, solicitation, or recommendation with respect to products and services provided by the Companies operating under the FXOpen brand, nor is it to be considered financial advice.
👍2
#stockmarket #MSFT #marketanalysis #MarketUpdates
Microsoft (MSFT) Shares Drop Over 3% This Month
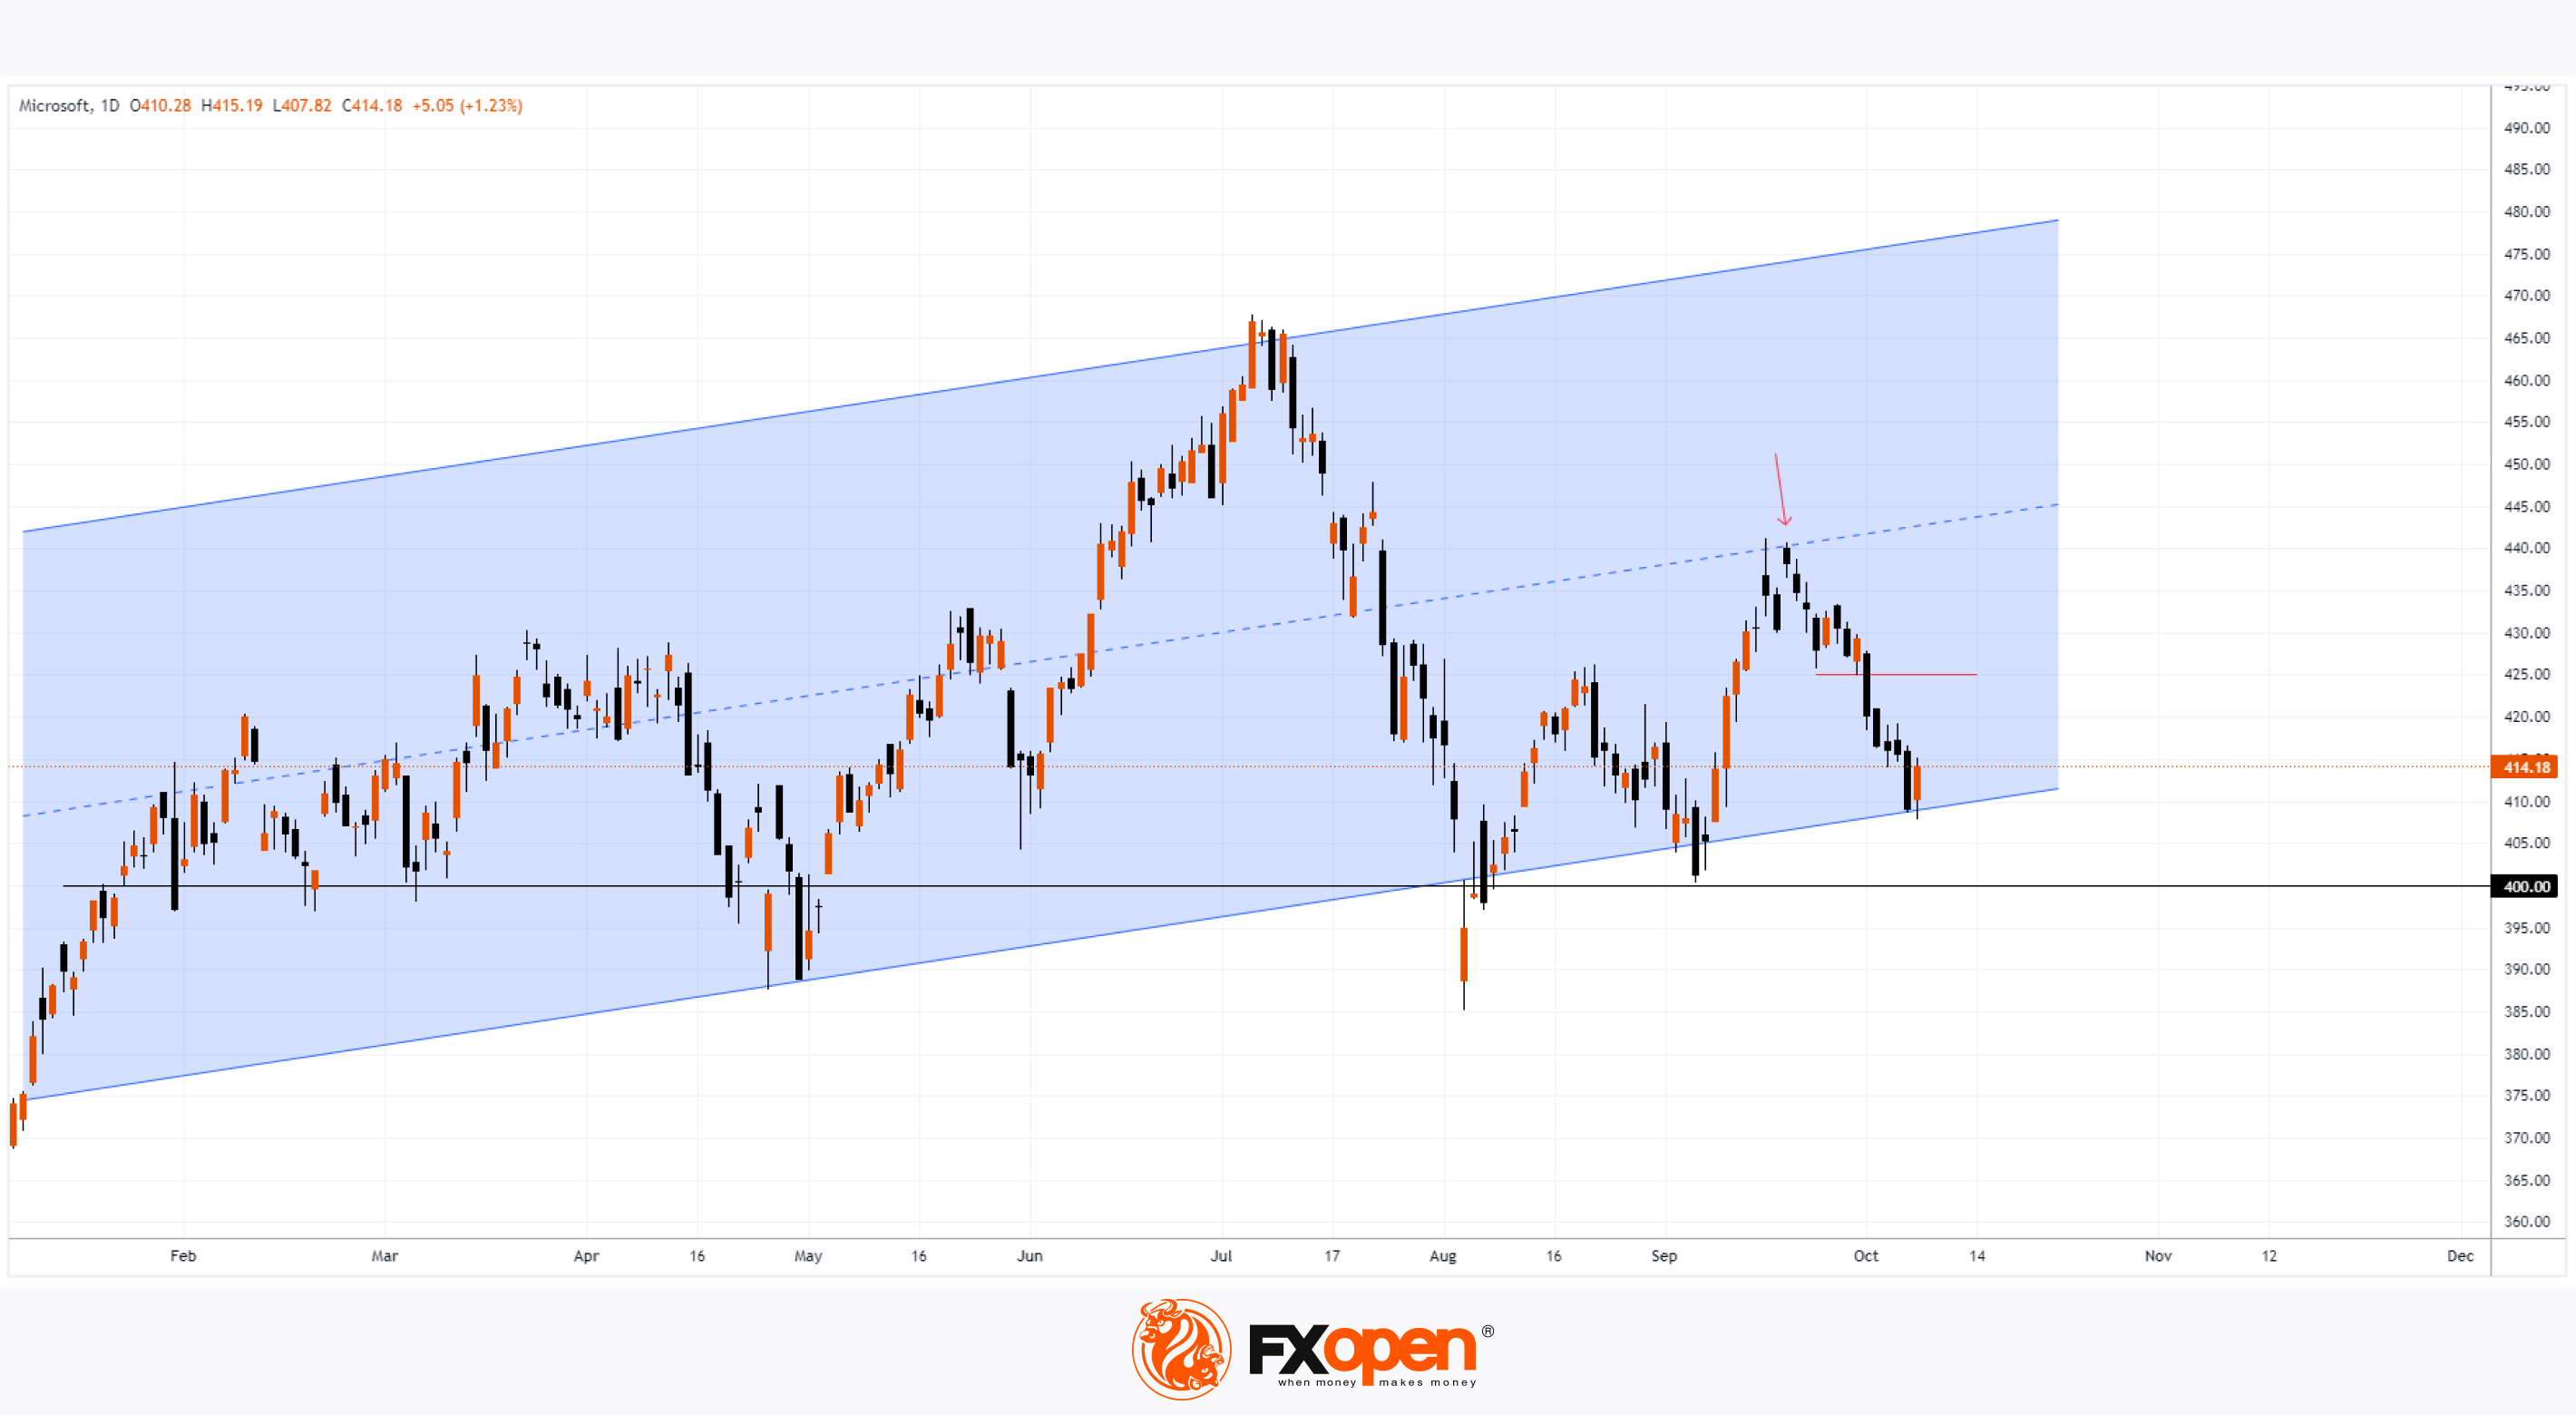
An overview of stock market charts since the beginning of the month reveals that while the Nasdaq 100 index (US Tech 100 mini on FXOpen) is in positive territory, Microsoft (MSFT) shares have underperformed significantly. The opening price on 1st October was $427.47, but by yesterday's close, it had fallen over 3%.
One of the key drivers behind this bearish sentiment is analysis from Oppenheimer, suggesting that Microsoft's financial performance may be negatively impacted by losses related to OpenAI. Additionally, Oppenheimer downgraded Microsoft's stock rating, a concerning sign ahead of the upcoming third-quarter earnings season.
Technical analysis of Microsoft's (MSFT) stock chart shows that the price is hovering around a critical support zone, which is formed by:
→ the lower boundary of an upward channel that has been in place since early 2024 (marked in blue);
→ the psychological level of $400 per share.
What could happen next?
Bullish outlook: Microsoft's (MSFT) share price may reverse upwards from this support zone. Yesterday’s bullish candle indicates a potential increase in demand.
Bearish outlook: The median line of the blue channel has acted as resistance (shown by the arrow). It’s possible that the next level where bears could confirm control is the former support at $425.
Which scenario plays out largely depends on Microsoft's upcoming earnings report, scheduled for 22nd October.
Trade global index CFDs with zero commission and tight spreads. Open your FXOpen account now or learn more about trading index CFDs with FXOpen.
CFDs are complex instruments and come with a high risk of losing your money.
This article represents the opinion of the Companies operating under the FXOpen brand only. It is not to be construed as an offer, solicitation, or recommendation with respect to products and services provided by the Companies operating under the FXOpen brand, nor is it to be considered financial advice.
Microsoft (MSFT) Shares Drop Over 3% This Month
An overview of stock market charts since the beginning of the month reveals that while the Nasdaq 100 index (US Tech 100 mini on FXOpen) is in positive territory, Microsoft (MSFT) shares have underperformed significantly. The opening price on 1st October was $427.47, but by yesterday's close, it had fallen over 3%.
One of the key drivers behind this bearish sentiment is analysis from Oppenheimer, suggesting that Microsoft's financial performance may be negatively impacted by losses related to OpenAI. Additionally, Oppenheimer downgraded Microsoft's stock rating, a concerning sign ahead of the upcoming third-quarter earnings season.
Technical analysis of Microsoft's (MSFT) stock chart shows that the price is hovering around a critical support zone, which is formed by:
→ the lower boundary of an upward channel that has been in place since early 2024 (marked in blue);
→ the psychological level of $400 per share.
What could happen next?
Bullish outlook: Microsoft's (MSFT) share price may reverse upwards from this support zone. Yesterday’s bullish candle indicates a potential increase in demand.
Bearish outlook: The median line of the blue channel has acted as resistance (shown by the arrow). It’s possible that the next level where bears could confirm control is the former support at $425.
Which scenario plays out largely depends on Microsoft's upcoming earnings report, scheduled for 22nd October.
Trade global index CFDs with zero commission and tight spreads. Open your FXOpen account now or learn more about trading index CFDs with FXOpen.
CFDs are complex instruments and come with a high risk of losing your money.
This article represents the opinion of the Companies operating under the FXOpen brand only. It is not to be construed as an offer, solicitation, or recommendation with respect to products and services provided by the Companies operating under the FXOpen brand, nor is it to be considered financial advice.
👍2
#marketanalysis #MarketNews #NFLX #stockmarket
The Netflix (NFLX) Share Price Has Reached an All-Time High
As shown in the daily chart for Netflix (NFLX), during yesterday’s trading session, the price exceeded $725, marking a new all-time high.
The bullish sentiment is driven by the upcoming release of the third-quarter earnings report, scheduled for 17 October. According to Zacks analysts' forecasts: → earnings per share are expected to reach $5.07, up 35.92% compared to the same quarter last year; → gross revenue is forecast to be $9.76 billion, an increase of 14.31% year-on-year.
A technical analysis of Netflix’s (NFLX) daily chart indicates that the price is moving within an upward channel (shown in blue), which has been in play since the start of 2024. Specifically:
→ the price made a convincing recovery after the stock market’s panic-driven decline on 5 August;
→ the median line acted as support (indicated by an arrow);
→ since mid-September, the price has remained in the upper quarter of the blue channel;
→ while the psychological level of $700 showed resistance in late August, the NFLX price is now firmly holding above it.
These observations suggest strong buying pressure for NFLX shares. However, the current situation could be disrupted by the earnings release. What if the actual figures fall short of market expectations? In that case, a significant correction is possible – perhaps down to the channel's median line.
In the meantime, analysts maintain a cautiously optimistic outlook. According to TipRanks, out of 37 ratings, 25 analysts recommend buying NFLX shares, while 2 suggest selling. The average price target for NFLX is $720 over the next 12 months.
Trade global index CFDs with zero commission and tight spreads. Open your FXOpen account now or learn more about trading index CFDs with FXOpen.
CFDs are complex instruments and come with a high risk of losing your money.
This article represents the opinion of the Companies operating under the FXOpen brand only. It is not to be construed as an offer, solicitation, or recommendation with respect to products and services provided by the Companies operating under the FXOpen brand, nor is it to be considered financial advice.
The Netflix (NFLX) Share Price Has Reached an All-Time High
As shown in the daily chart for Netflix (NFLX), during yesterday’s trading session, the price exceeded $725, marking a new all-time high.
The bullish sentiment is driven by the upcoming release of the third-quarter earnings report, scheduled for 17 October. According to Zacks analysts' forecasts: → earnings per share are expected to reach $5.07, up 35.92% compared to the same quarter last year; → gross revenue is forecast to be $9.76 billion, an increase of 14.31% year-on-year.
A technical analysis of Netflix’s (NFLX) daily chart indicates that the price is moving within an upward channel (shown in blue), which has been in play since the start of 2024. Specifically:
→ the price made a convincing recovery after the stock market’s panic-driven decline on 5 August;
→ the median line acted as support (indicated by an arrow);
→ since mid-September, the price has remained in the upper quarter of the blue channel;
→ while the psychological level of $700 showed resistance in late August, the NFLX price is now firmly holding above it.
These observations suggest strong buying pressure for NFLX shares. However, the current situation could be disrupted by the earnings release. What if the actual figures fall short of market expectations? In that case, a significant correction is possible – perhaps down to the channel's median line.
In the meantime, analysts maintain a cautiously optimistic outlook. According to TipRanks, out of 37 ratings, 25 analysts recommend buying NFLX shares, while 2 suggest selling. The average price target for NFLX is $720 over the next 12 months.
Trade global index CFDs with zero commission and tight spreads. Open your FXOpen account now or learn more about trading index CFDs with FXOpen.
CFDs are complex instruments and come with a high risk of losing your money.
This article represents the opinion of the Companies operating under the FXOpen brand only. It is not to be construed as an offer, solicitation, or recommendation with respect to products and services provided by the Companies operating under the FXOpen brand, nor is it to be considered financial advice.

👍2
#USDJPY #forextrading #marketanalysis #MarketNews
USD/JPY Chart Analysis: Bears May Take Control
As shown in today’s USD/JPY chart, the US dollar has gained over 3.6% against the yen since the start of the month. Yesterday, the exchange rate surpassed the peak formed on 16 August around the 149.40 level, marking a 10-week high.
The bullish sentiment towards the US dollar has been influenced by increased market confidence in the Federal Reserve’s patient approach to further monetary easing, as reported by Reuters.
Can the USD/JPY rise continue?
From a technical analysis perspective, bears have a chance to take control, as the rate is nearing a resistance zone formed by:
→ the upper boundary of the descending channel (shown in red);
→ the psychological level of 150 yen per dollar.
Additional arguments supporting the potential for a bearish reversal include:
→ the price decline after briefly exceeding the 16 August peak (a possible false bullish breakout);
→ divergence on the RSI indicator.
The release of the US CPI data today at 15:30 GMT+3 could serve as a catalyst for a bearish move. The resulting price action will provide traders with important insights on whether the market is nearing the end of an intermediate recovery (shown with blue lines) within the descending channel (shown in red).
Trade over 50 forex markets 24 hours a day with FXOpen. Take advantage of low commissions, deep liquidity, and spreads from 0.0 pips. Open your FXOpen account now or learn more about trading forex with FXOpen.
CFDs are complex instruments and come with a high risk of losing your money.
This article represents the opinion of the Companies operating under the FXOpen brand only. It is not to be construed as an offer, solicitation, or recommendation with respect to products and services provided by the Companies operating under the FXOpen brand, nor is it to be considered financial advice.
USD/JPY Chart Analysis: Bears May Take Control
As shown in today’s USD/JPY chart, the US dollar has gained over 3.6% against the yen since the start of the month. Yesterday, the exchange rate surpassed the peak formed on 16 August around the 149.40 level, marking a 10-week high.
The bullish sentiment towards the US dollar has been influenced by increased market confidence in the Federal Reserve’s patient approach to further monetary easing, as reported by Reuters.
Can the USD/JPY rise continue?
From a technical analysis perspective, bears have a chance to take control, as the rate is nearing a resistance zone formed by:
→ the upper boundary of the descending channel (shown in red);
→ the psychological level of 150 yen per dollar.
Additional arguments supporting the potential for a bearish reversal include:
→ the price decline after briefly exceeding the 16 August peak (a possible false bullish breakout);
→ divergence on the RSI indicator.
The release of the US CPI data today at 15:30 GMT+3 could serve as a catalyst for a bearish move. The resulting price action will provide traders with important insights on whether the market is nearing the end of an intermediate recovery (shown with blue lines) within the descending channel (shown in red).
Trade over 50 forex markets 24 hours a day with FXOpen. Take advantage of low commissions, deep liquidity, and spreads from 0.0 pips. Open your FXOpen account now or learn more about trading forex with FXOpen.
CFDs are complex instruments and come with a high risk of losing your money.
This article represents the opinion of the Companies operating under the FXOpen brand only. It is not to be construed as an offer, solicitation, or recommendation with respect to products and services provided by the Companies operating under the FXOpen brand, nor is it to be considered financial advice.

👍2
#usdcad #marketanalysis #MarketNews #forextrading
USD/CAD Analysis: Exchange Rate Rises for Seven Consecutive Days
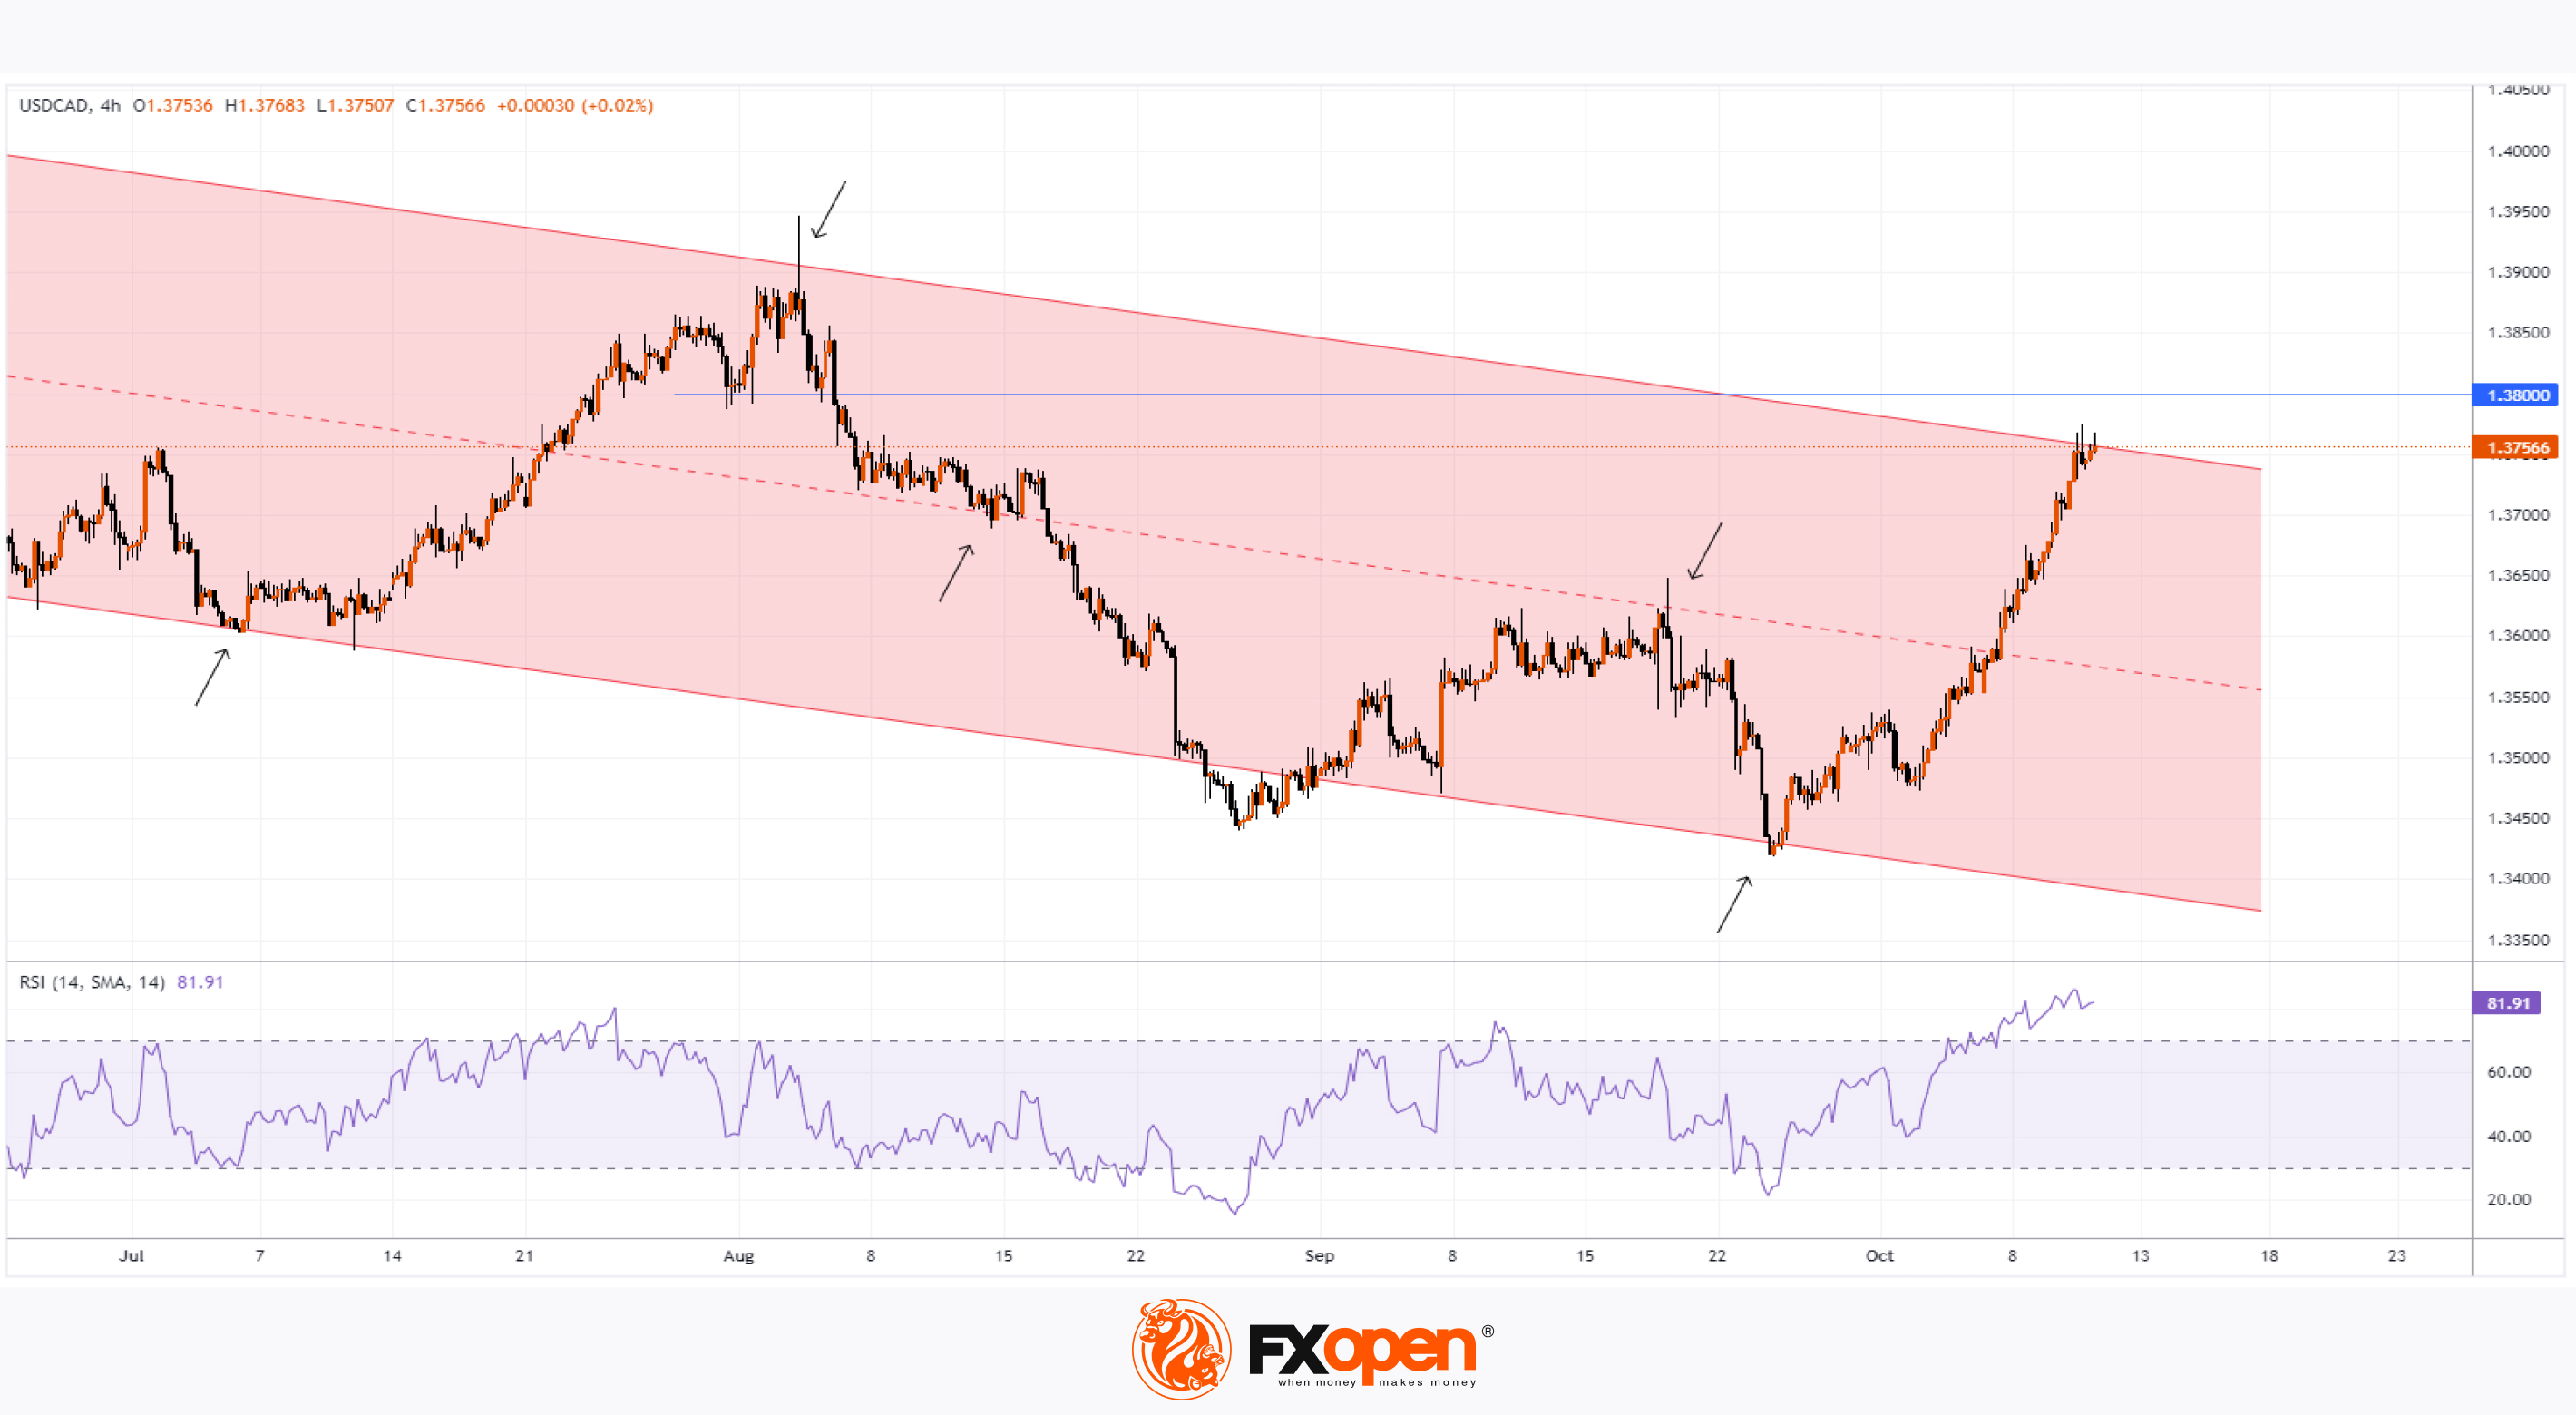
Data shows that USD/CAD has formed seven consecutive bullish candles since 3 October, and today could mark the eighth in this sequence.
This strong rise in the pair has been driven by the strengthening of the US dollar amid several fundamental factors. Media reports suggest that traders are reassessing the likelihood of further Federal Reserve rate cuts after yesterday’s inflation data release (as reported by Forex Factory):
→ Core Consumer Price Index (CPI) month-on-month: actual = 0.3%, expected = 0.2%, previous = 0.3%;
→ CPI month-on-month: actual = 0.2%, expected = 0.1%, previous = 0.2%;
→ CPI year-on-year: actual = 2.4%, expected = 2.3%, previous = 2.5%.
Market participants may be speculating that the Fed will hold off on further monetary easing. Will the US dollar continue to strengthen against the CAD?
Technical analysis of the 4-hour USD/CAD chart shows that:
→ The RSI indicator remains above 80, a rare occurrence in 2024;
→ The price is nearing the upper boundary of a descending channel (drawn from key reversal points marked by arrows);
→ The price is below the 1.3800 level, which acted as support in August but was broken, suggesting potential resistance.
These technical factors point to the possibility of at least a bearish correction from overbought levels after a 2% rise in USD/CAD from its October low. The long upper wicks on recent candles further support this idea.
Bears may attempt to take control with the release of key news today:
→ 15:30 GMT+3 – Canadian labour market data;
→ 15:30 GMT+3 – US Producer Price Index (PPI) data.
Trade over 50 forex markets 24 hours a day with FXOpen. Take advantage of low commissions, deep liquidity, and spreads from 0.0 pips. Open your FXOpen account now or learn more about trading forex with FXOpen.
CFDs are complex instruments and come with a high risk of losing your money.
This article represents the opinion of the Companies operating under the FXOpen brand only. It is not to be construed as an offer, solicitation, or recommendation with respect to products and services provided by the Companies operating under the FXOpen brand, nor is it to be considered financial advice.
USD/CAD Analysis: Exchange Rate Rises for Seven Consecutive Days
Data shows that USD/CAD has formed seven consecutive bullish candles since 3 October, and today could mark the eighth in this sequence.
This strong rise in the pair has been driven by the strengthening of the US dollar amid several fundamental factors. Media reports suggest that traders are reassessing the likelihood of further Federal Reserve rate cuts after yesterday’s inflation data release (as reported by Forex Factory):
→ Core Consumer Price Index (CPI) month-on-month: actual = 0.3%, expected = 0.2%, previous = 0.3%;
→ CPI month-on-month: actual = 0.2%, expected = 0.1%, previous = 0.2%;
→ CPI year-on-year: actual = 2.4%, expected = 2.3%, previous = 2.5%.
Market participants may be speculating that the Fed will hold off on further monetary easing. Will the US dollar continue to strengthen against the CAD?
Technical analysis of the 4-hour USD/CAD chart shows that:
→ The RSI indicator remains above 80, a rare occurrence in 2024;
→ The price is nearing the upper boundary of a descending channel (drawn from key reversal points marked by arrows);
→ The price is below the 1.3800 level, which acted as support in August but was broken, suggesting potential resistance.
These technical factors point to the possibility of at least a bearish correction from overbought levels after a 2% rise in USD/CAD from its October low. The long upper wicks on recent candles further support this idea.
Bears may attempt to take control with the release of key news today:
→ 15:30 GMT+3 – Canadian labour market data;
→ 15:30 GMT+3 – US Producer Price Index (PPI) data.
Trade over 50 forex markets 24 hours a day with FXOpen. Take advantage of low commissions, deep liquidity, and spreads from 0.0 pips. Open your FXOpen account now or learn more about trading forex with FXOpen.
CFDs are complex instruments and come with a high risk of losing your money.
This article represents the opinion of the Companies operating under the FXOpen brand only. It is not to be construed as an offer, solicitation, or recommendation with respect to products and services provided by the Companies operating under the FXOpen brand, nor is it to be considered financial advice.
👍2
#tsla #stockmarket #stocktrading #marketanalysis
Tesla (TSLA) Shares Fall After ‘We, Robot’ Presentation
On 10 October, at the Warner Brothers studio in Burbank, California, Elon Musk unveiled three products during the presentation of “We, Robot”:
→ Cybercab – an autonomous robotaxi that Musk claims will be produced in very large quantities.
→ Robovan – an autonomous bus capable of transporting 20 people or cargo, with an expected price tag of under $30,000.
→ Optimus Gen 2 – humanoid robots that participated in the event, with Musk showcasing a video of how Optimus can be used in home settings.
Elon Musk stated that Tesla anticipates the arrival of fully autonomous vehicles without supervision in Texas and California by next year.
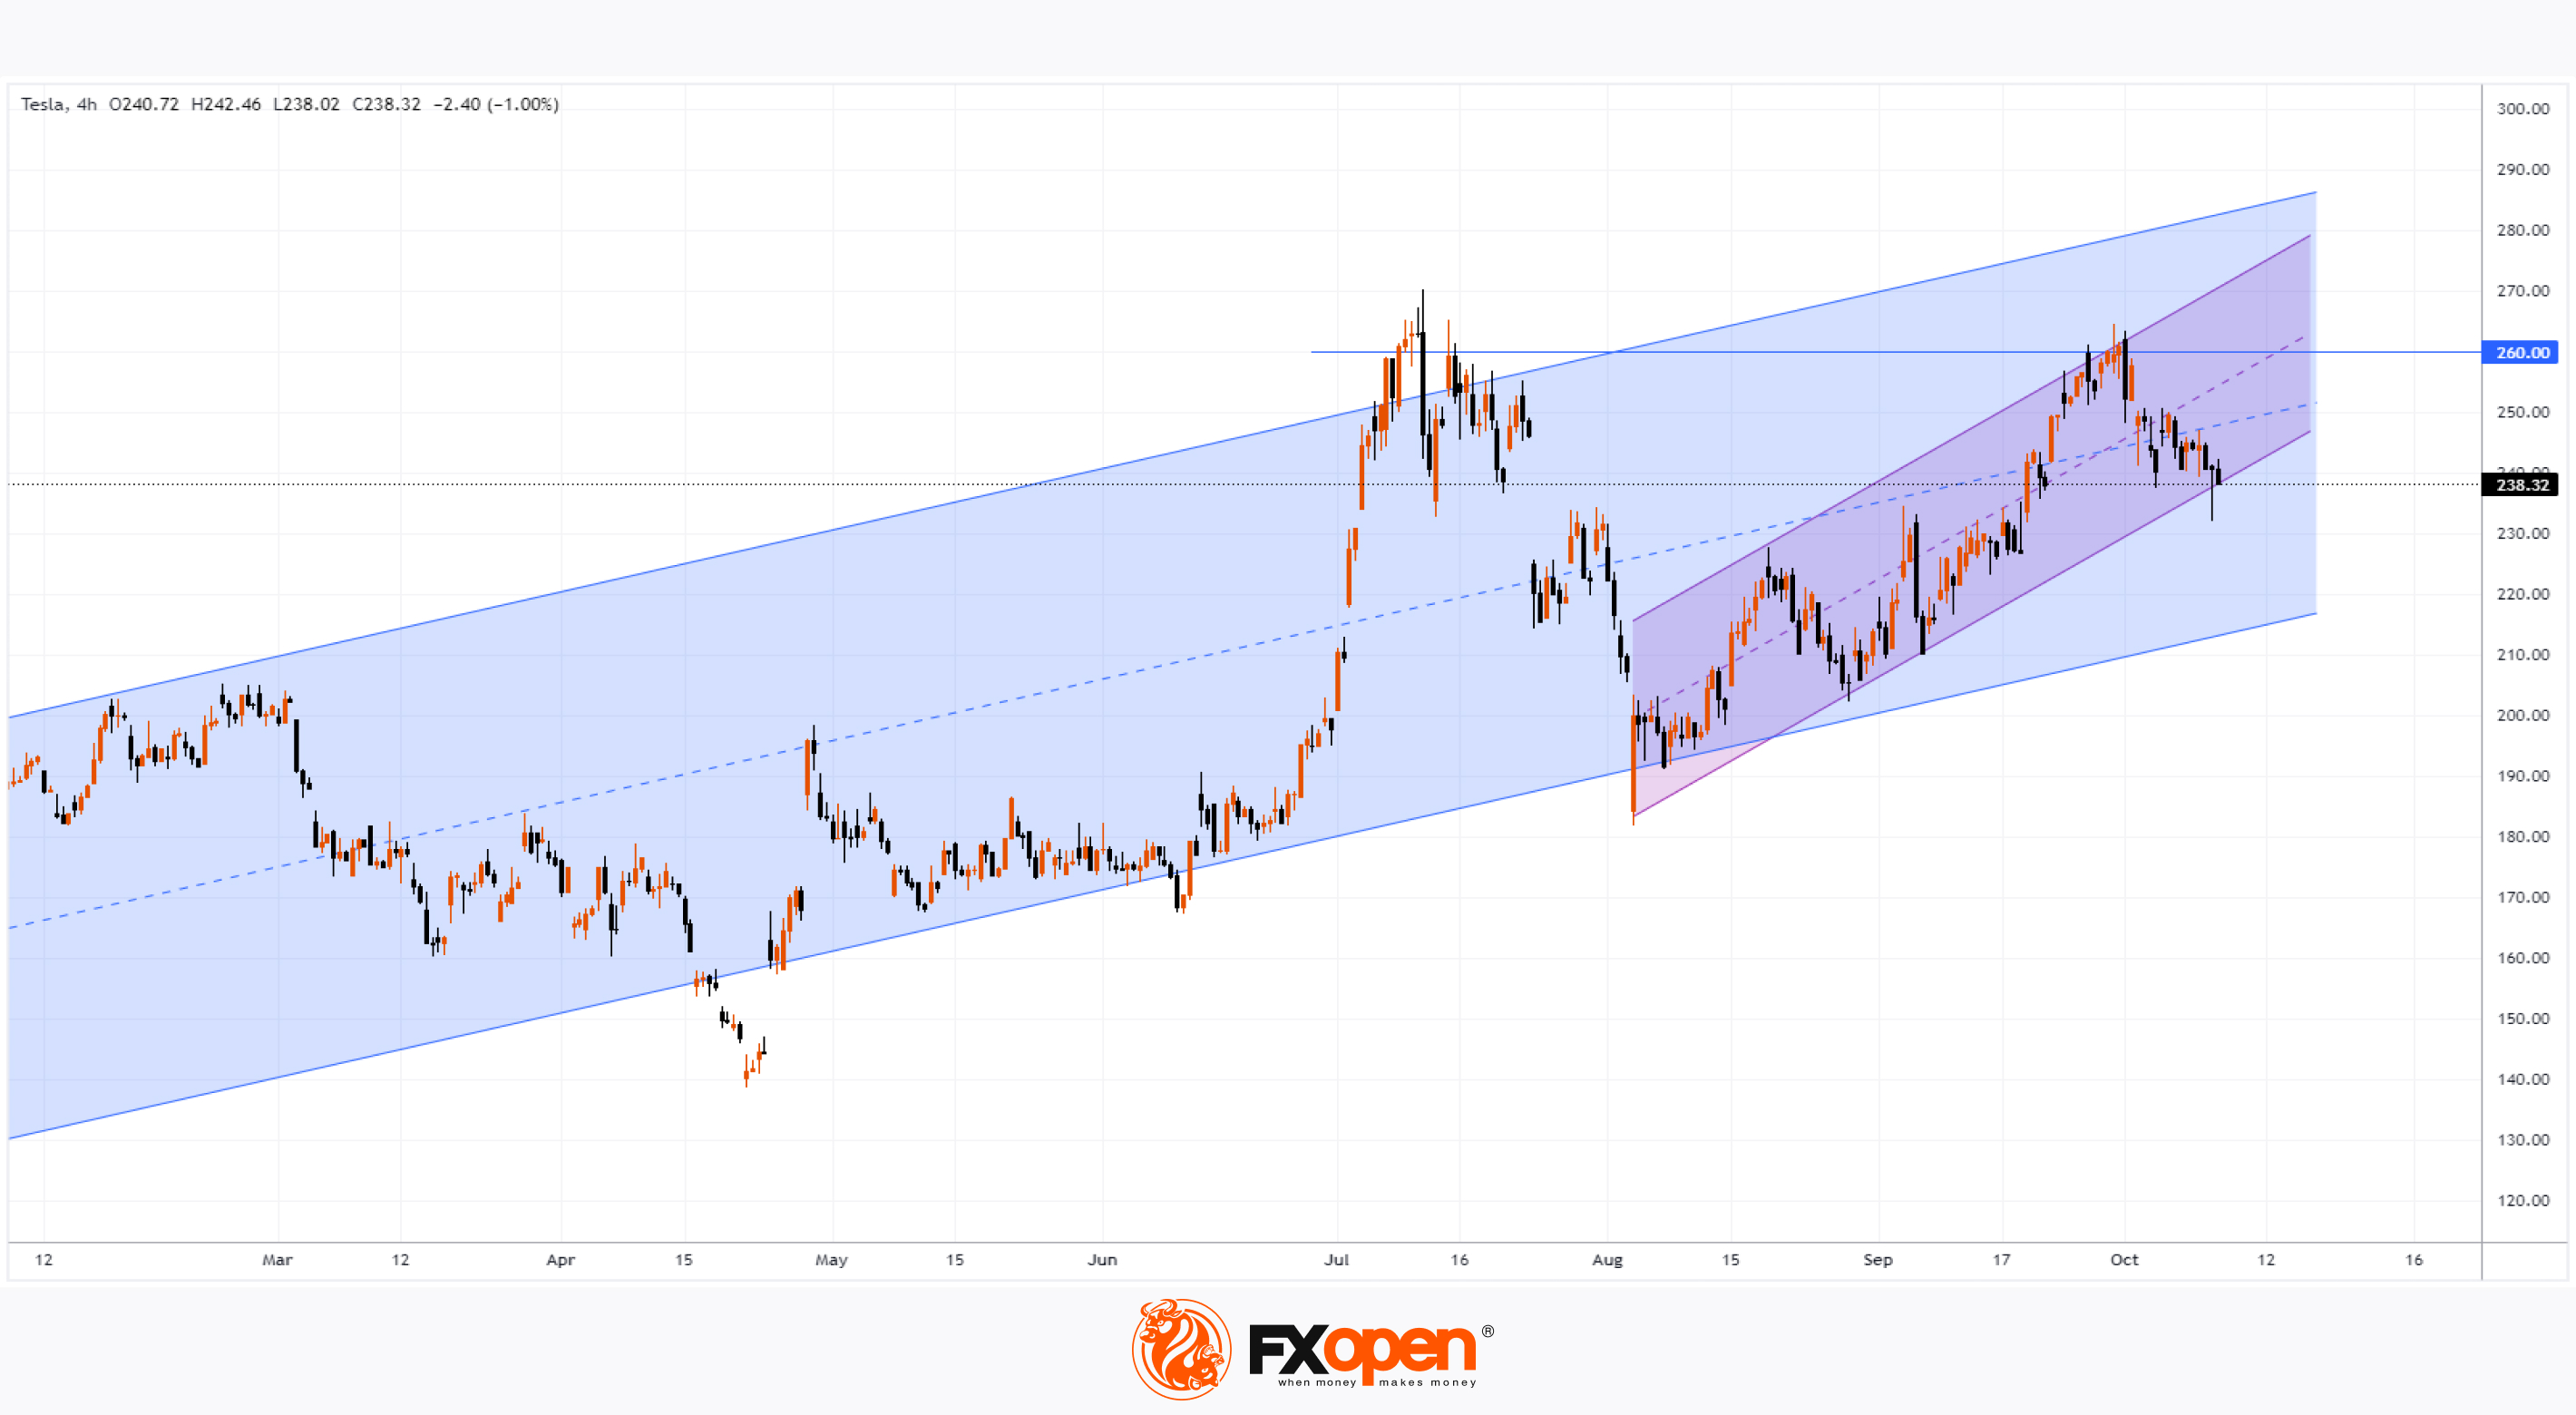
Despite the revolutionary nature of the products presented under the Tesla brand, investors seem disappointed, as TSLA shares are trading around $225 in pre-market today, down from over $238 at yesterday's close.
Technical analysis of the Tesla (TSLA) stock chart indicates that the ascending channel (marked in purple), which has guided the price upward since August, may break downward at the market open today.
From a broader perspective, TSLA shares are within a wide ascending channel (shown in blue) – the bearish momentum following the “We, Robot” event could potentially push the price down to the lower boundary, further distancing it from resistance at the $260 level.
Investors may reevaluate their initial reactions to the unveiled Cybercab, Robovan, and Optimus. Nonetheless, the current decline in TSLA's stock price serves as a warning ahead of the earnings report scheduled for 23 October.
Trade global index CFDs with zero commission and tight spreads. Open your FXOpen account now or learn more about trading index CFDs with FXOpen.
CFDs are complex instruments and come with a high risk of losing your money.
This article represents the opinion of the Companies operating under the FXOpen brand only. It is not to be construed as an offer, solicitation, or recommendation with respect to products and services provided by the Companies operating under the FXOpen brand, nor is it to be considered financial advice.
Tesla (TSLA) Shares Fall After ‘We, Robot’ Presentation
On 10 October, at the Warner Brothers studio in Burbank, California, Elon Musk unveiled three products during the presentation of “We, Robot”:
→ Cybercab – an autonomous robotaxi that Musk claims will be produced in very large quantities.
→ Robovan – an autonomous bus capable of transporting 20 people or cargo, with an expected price tag of under $30,000.
→ Optimus Gen 2 – humanoid robots that participated in the event, with Musk showcasing a video of how Optimus can be used in home settings.
Elon Musk stated that Tesla anticipates the arrival of fully autonomous vehicles without supervision in Texas and California by next year.
Despite the revolutionary nature of the products presented under the Tesla brand, investors seem disappointed, as TSLA shares are trading around $225 in pre-market today, down from over $238 at yesterday's close.
Technical analysis of the Tesla (TSLA) stock chart indicates that the ascending channel (marked in purple), which has guided the price upward since August, may break downward at the market open today.
From a broader perspective, TSLA shares are within a wide ascending channel (shown in blue) – the bearish momentum following the “We, Robot” event could potentially push the price down to the lower boundary, further distancing it from resistance at the $260 level.
Investors may reevaluate their initial reactions to the unveiled Cybercab, Robovan, and Optimus. Nonetheless, the current decline in TSLA's stock price serves as a warning ahead of the earnings report scheduled for 23 October.
Trade global index CFDs with zero commission and tight spreads. Open your FXOpen account now or learn more about trading index CFDs with FXOpen.
CFDs are complex instruments and come with a high risk of losing your money.
This article represents the opinion of the Companies operating under the FXOpen brand only. It is not to be construed as an offer, solicitation, or recommendation with respect to products and services provided by the Companies operating under the FXOpen brand, nor is it to be considered financial advice.
👍2
#StockMarket #FinancialNews #GlobalMarkets #GoldPrices #TechStocks #MSFT #NFLX #MarketUpdate
Weekly Market Wrap With Gary Thomson: Hang Seng Index, XAU/USD, Microsoft and Netflix Shares
Get the latest scoop on the week's hottest headlines, all in one convenient video. Join Gary Thomson, the COO of FXOpen UK, as he breaks down the most significant news reports and shares his expert insights.
🔸 Hang Seng Index (HSI) Drops Nearly 10% Today
🔸 Analysis of XAU/USD: Gold Price Drops to a Two-Week Low
🔸 Microsoft (MSFT) Shares Drop Over 3% This Month
🔸The Netflix (NFLX) Share Price Has Reached an All-Time High
Stay in the know and empower yourself with our short, yet power-packed video. Watch it now and stay updated with FXOpen. Don't miss out on this invaluable opportunity to sharpen your trading skills and make informed decisions.
https://cutt.ly/XeAfLryh
To take advantage of price fluctuations in the foreign exchange markets, consider enlisting the services of a reliable broker like FXOpen.
⚠️
This forecast represents FXOpen Companies opinion only, it should not be construed as an offer, invitation or recommendation in respect to FXOpen Companies products and services or as financial advice.
Weekly Market Wrap With Gary Thomson: Hang Seng Index, XAU/USD, Microsoft and Netflix Shares
Get the latest scoop on the week's hottest headlines, all in one convenient video. Join Gary Thomson, the COO of FXOpen UK, as he breaks down the most significant news reports and shares his expert insights.
🔸 Hang Seng Index (HSI) Drops Nearly 10% Today
🔸 Analysis of XAU/USD: Gold Price Drops to a Two-Week Low
🔸 Microsoft (MSFT) Shares Drop Over 3% This Month
🔸The Netflix (NFLX) Share Price Has Reached an All-Time High
Stay in the know and empower yourself with our short, yet power-packed video. Watch it now and stay updated with FXOpen. Don't miss out on this invaluable opportunity to sharpen your trading skills and make informed decisions.
https://cutt.ly/XeAfLryh
To take advantage of price fluctuations in the foreign exchange markets, consider enlisting the services of a reliable broker like FXOpen.
⚠️
This forecast represents FXOpen Companies opinion only, it should not be construed as an offer, invitation or recommendation in respect to FXOpen Companies products and services or as financial advice.
YouTube
Weekly Market Wrap With Gary Thomson: Hang Seng Index, XAU/USD, Microsoft and Netflix Shares
Get the latest scoop on the week's hottest headlines, all in one convenient video. Join Gary Thomson, the COO of FXOpen UK, as he breaks down the most significant news reports and shares his expert insights.
00:25 Hang Seng Index (HSI) Drops Nearly 10% Today…
00:25 Hang Seng Index (HSI) Drops Nearly 10% Today…
👍2
#sp500 #stockmarket #marketanalysis #MarketNews
S&P 500 Reaches Another Record High
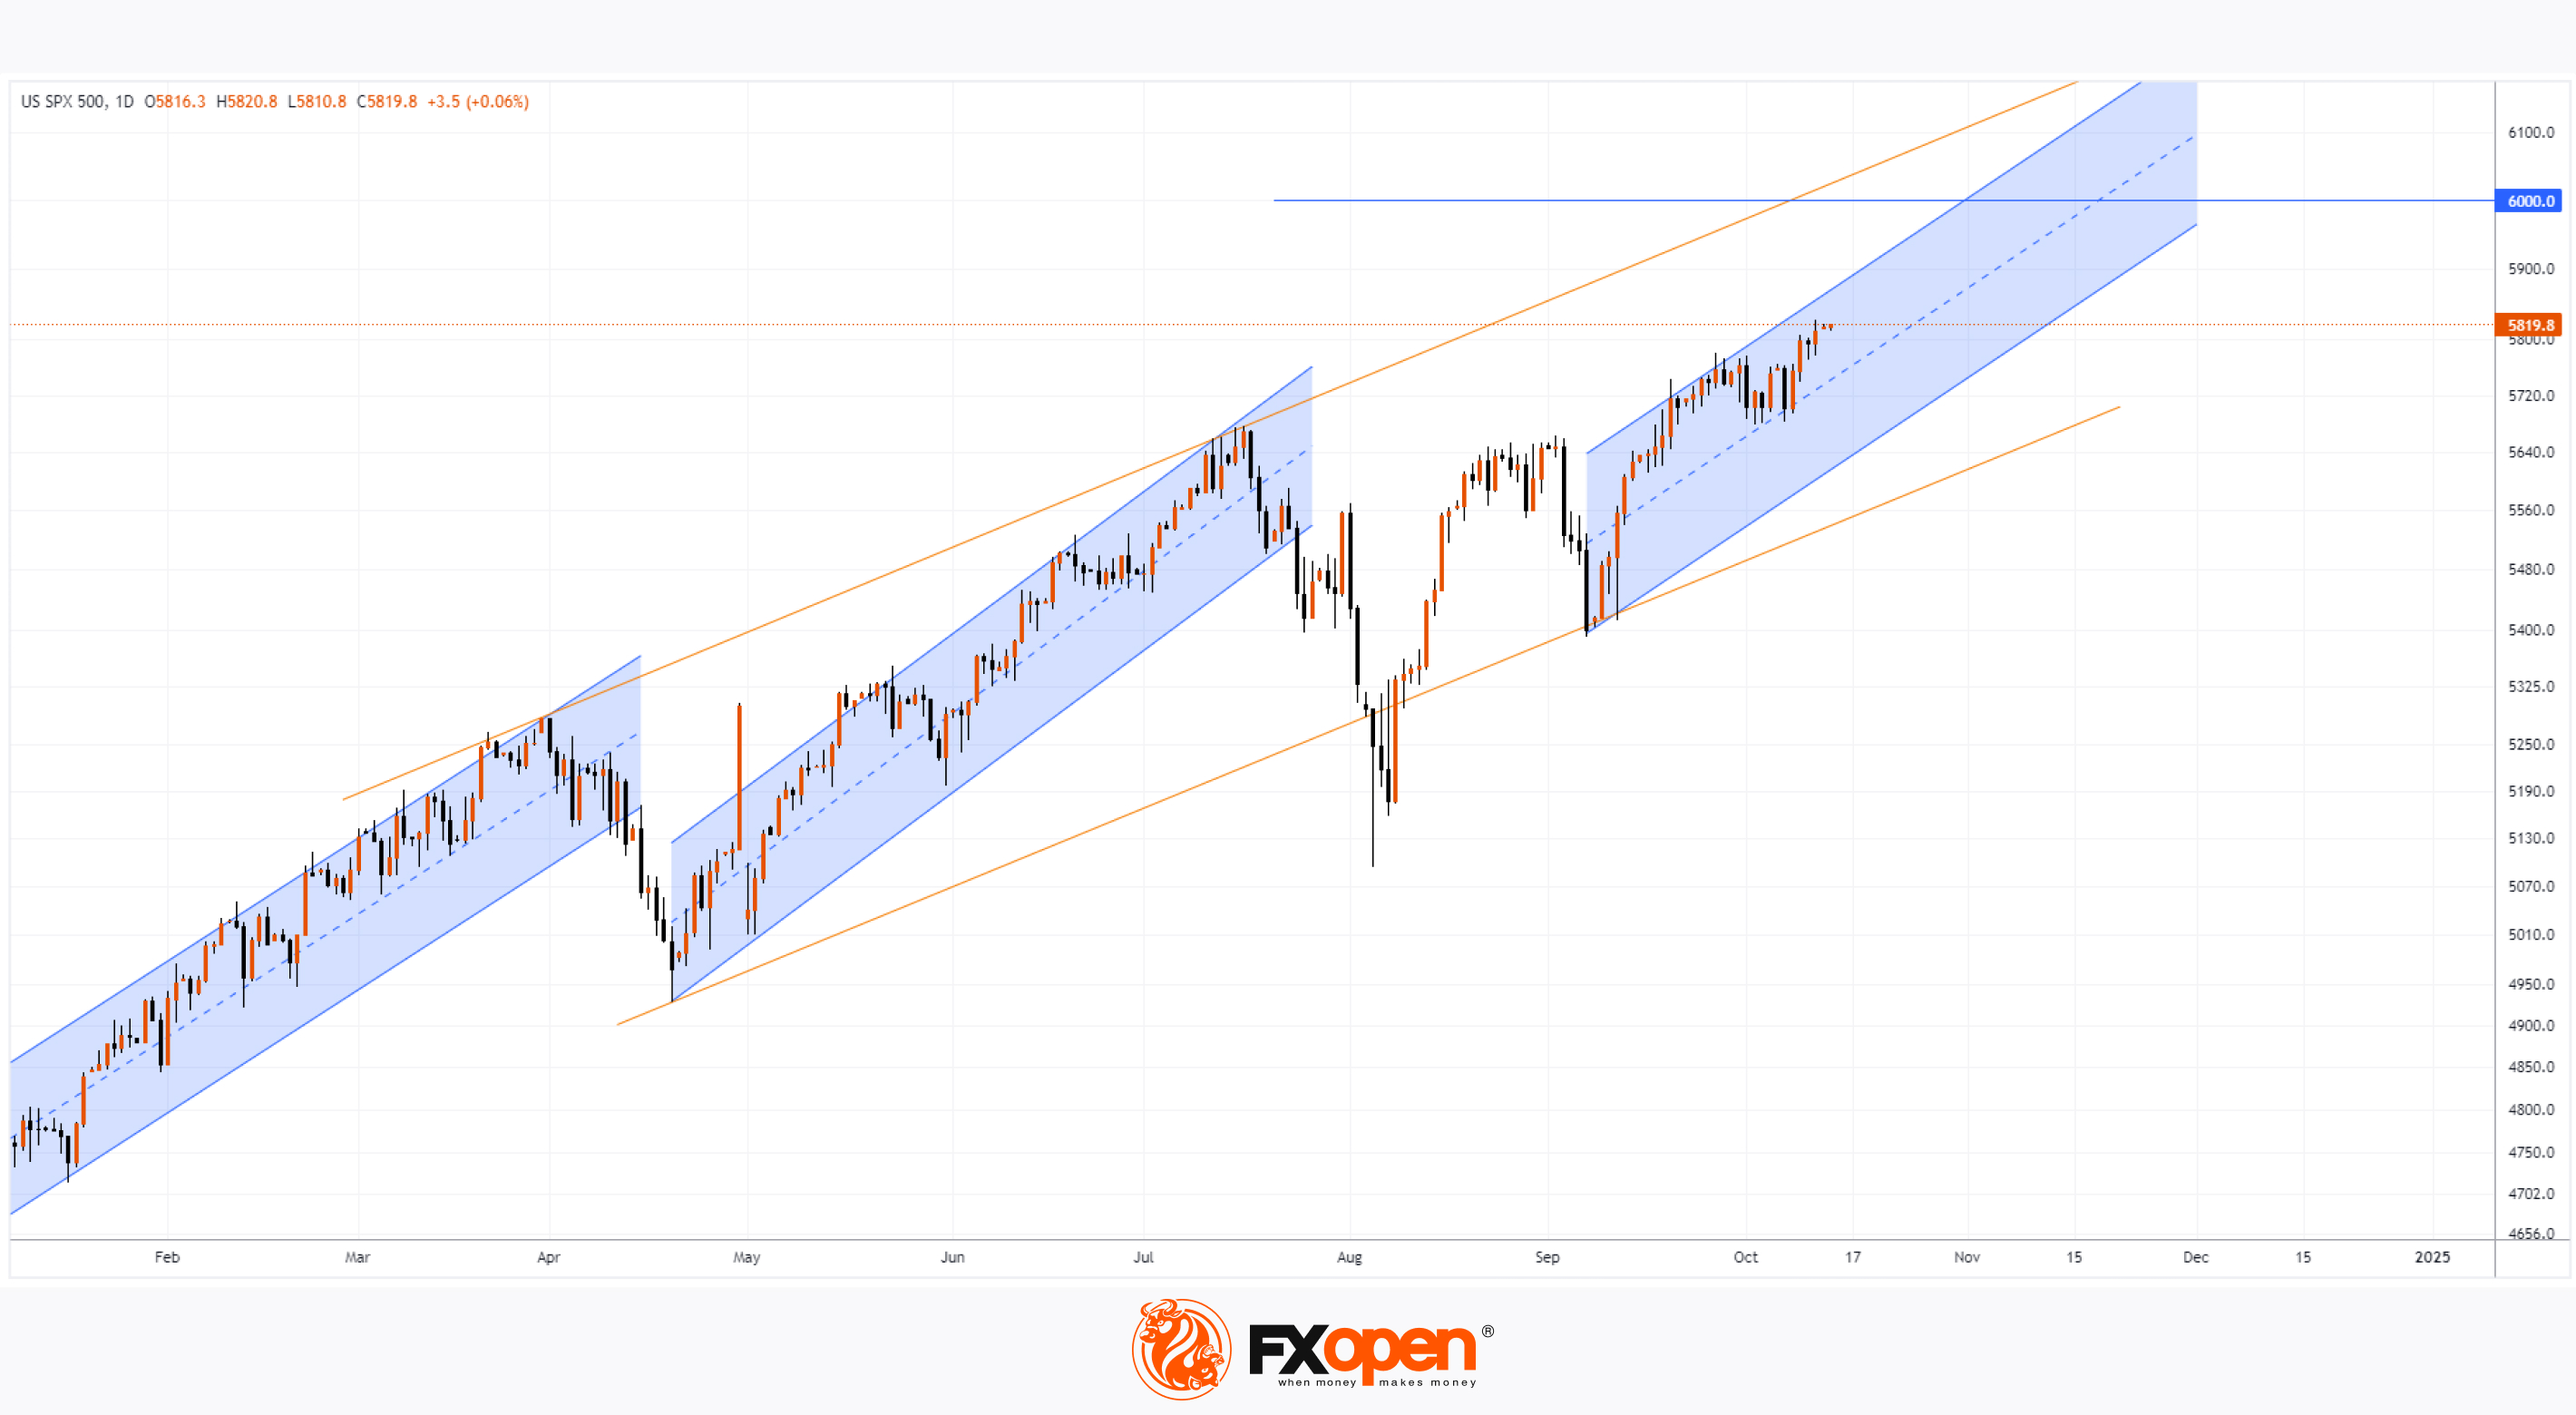
As shown by the S&P 500 chart (US SPX 500 mini on FXOpen), the leading US stock index set its 45th record of the year, closing above 5800 on Friday. This marks the fifth consecutive week of growth, with the index up more than 22% since the start of the year.
According to Reuters, the bullish market sentiment is driven by the start of Q3 earnings season, with companies possibly issuing bolder forecasts due to the beginning of the Fed’s rate-cutting cycle.
What are the prospects for the index until the end of 2024?
A technical analysis of the daily S&P 500 chart (US SPX 500 mini on FXOpen) shows:
In 2024, price action has been contained within three relatively narrow ascending channels (shown in blue), where:
→ The first two channels remained valid for at least 80 candles, and the third has now reached 30 candles;
→ The channels have similar slopes and widths;
→ Drawing lines through the high of Channel 1, the high and low of Channel 2, and the low of Channel 3 forms a larger channel (shown in orange).
If the bullish sentiment persists, the S&P 500 (US SPX 500 mini on FXOpen) may continue to rise within the third blue channel towards the upper orange line.
However, several factors could significantly impact the market before the year's end: → Labour market data, as well as Fed decisions and comments;
→ US presidential elections and budget approval;
→ Company earnings and forecasts that fall well below market expectations.
Goldman Sachs analysts predict that the S&P 500 could reach 6,000 by the end of 2024.
Trade global index CFDs with zero commission and tight spreads. Open your FXOpen account now or learn more about trading index CFDs with FXOpen.
CFDs are complex instruments and come with a high risk of losing your money.
This article represents the opinion of the Companies operating under the FXOpen brand only. It is not to be construed as an offer, solicitation, or recommendation with respect to products and services provided by the Companies operating under the FXOpen brand, nor is it to be considered financial advice.
S&P 500 Reaches Another Record High
As shown by the S&P 500 chart (US SPX 500 mini on FXOpen), the leading US stock index set its 45th record of the year, closing above 5800 on Friday. This marks the fifth consecutive week of growth, with the index up more than 22% since the start of the year.
According to Reuters, the bullish market sentiment is driven by the start of Q3 earnings season, with companies possibly issuing bolder forecasts due to the beginning of the Fed’s rate-cutting cycle.
What are the prospects for the index until the end of 2024?
A technical analysis of the daily S&P 500 chart (US SPX 500 mini on FXOpen) shows:
In 2024, price action has been contained within three relatively narrow ascending channels (shown in blue), where:
→ The first two channels remained valid for at least 80 candles, and the third has now reached 30 candles;
→ The channels have similar slopes and widths;
→ Drawing lines through the high of Channel 1, the high and low of Channel 2, and the low of Channel 3 forms a larger channel (shown in orange).
If the bullish sentiment persists, the S&P 500 (US SPX 500 mini on FXOpen) may continue to rise within the third blue channel towards the upper orange line.
However, several factors could significantly impact the market before the year's end: → Labour market data, as well as Fed decisions and comments;
→ US presidential elections and budget approval;
→ Company earnings and forecasts that fall well below market expectations.
Goldman Sachs analysts predict that the S&P 500 could reach 6,000 by the end of 2024.
Trade global index CFDs with zero commission and tight spreads. Open your FXOpen account now or learn more about trading index CFDs with FXOpen.
CFDs are complex instruments and come with a high risk of losing your money.
This article represents the opinion of the Companies operating under the FXOpen brand only. It is not to be construed as an offer, solicitation, or recommendation with respect to products and services provided by the Companies operating under the FXOpen brand, nor is it to be considered financial advice.
👍2
#gasprices #XNGUSD #MarketNews #marketanalysis
Natural Gas Price Drops Over 8% Since the Start of the Month
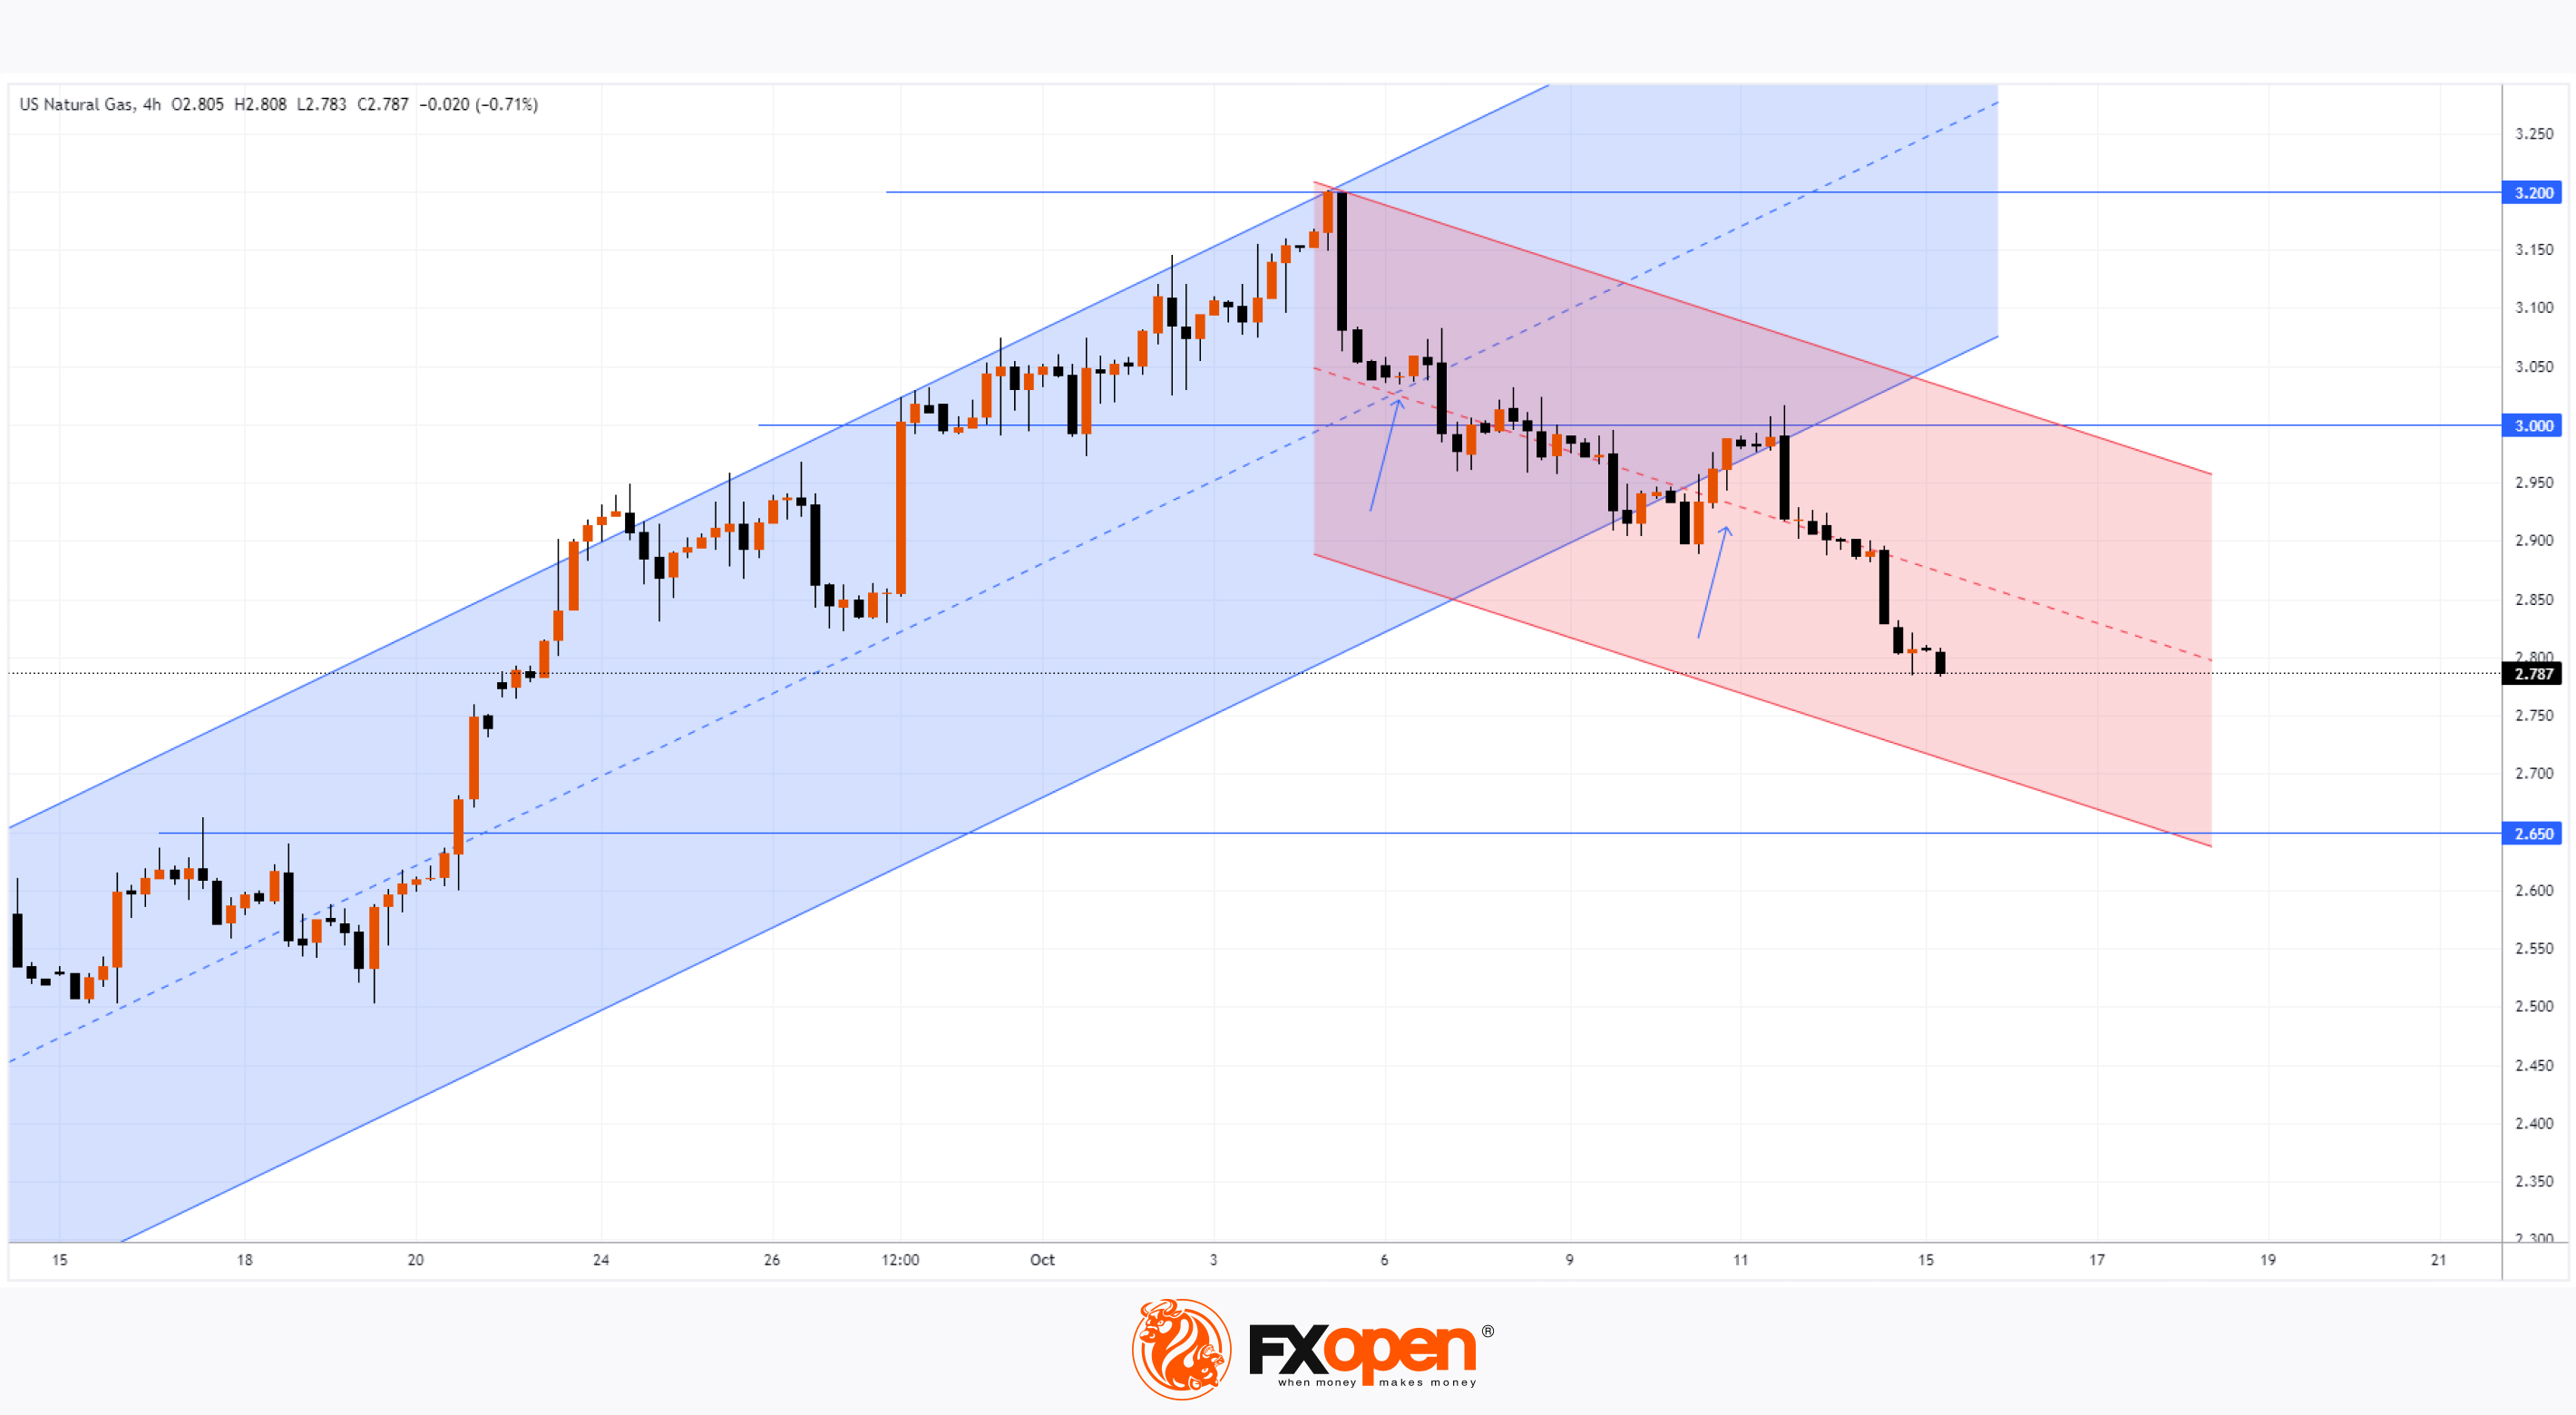
On 26 September, when analysing the XNG/USD natural gas price chart, we noted that:
→ Bulls might be "gathering strength" for a potential attempt to break the psychological level of 3.00.
→ If successful, this would pave the way towards the yearly high around 3.20.
Since then, the price of natural gas:
→ Broke above the 3.00 level on 27 September;
→ Reached 3.20 on 4 October, after which it reversed downward.
Bearish sentiment was driven by:
→ News that Hurricane Helen had minimal impact on natural gas processing facilities along the U.S. Gulf Coast;
→ Adequate gas reserves ensuring sufficient supply;
→ Weather forecasts indicating short-term gas demand at the end of September.
Technical analysis of the XNG/USD chart shows the upward channel (marked in blue) has lost relevance. It’s evident that:
→ The bounce from the median line (shown by the first arrow) was weak;
→ The attempt to re-enter the channel from its lower boundary (as shown by the second arrow) led to a test of the 3.00 psychological level, which acted as resistance.
There are no signs yet of bulls trying to regain control on the XNG/USD chart. If the supply and demand balance remains unchanged, the natural gas price may continue its decline within the red downward channel, possibly towards its lower boundary, reinforced by the former resistance at 2.65.
Start trading commodities with tight spreads. Open your trading account now or learn more about trading commodity CFDs with FXOpen.
CFDs are complex instruments and come with a high risk of losing your money.
This article represents the opinion of the Companies operating under the FXOpen brand only. It is not to be construed as an offer, solicitation, or recommendation with respect to products and services provided by the Companies operating under the FXOpen brand, nor is it to be considered financial advice.
Natural Gas Price Drops Over 8% Since the Start of the Month
On 26 September, when analysing the XNG/USD natural gas price chart, we noted that:
→ Bulls might be "gathering strength" for a potential attempt to break the psychological level of 3.00.
→ If successful, this would pave the way towards the yearly high around 3.20.
Since then, the price of natural gas:
→ Broke above the 3.00 level on 27 September;
→ Reached 3.20 on 4 October, after which it reversed downward.
Bearish sentiment was driven by:
→ News that Hurricane Helen had minimal impact on natural gas processing facilities along the U.S. Gulf Coast;
→ Adequate gas reserves ensuring sufficient supply;
→ Weather forecasts indicating short-term gas demand at the end of September.
Technical analysis of the XNG/USD chart shows the upward channel (marked in blue) has lost relevance. It’s evident that:
→ The bounce from the median line (shown by the first arrow) was weak;
→ The attempt to re-enter the channel from its lower boundary (as shown by the second arrow) led to a test of the 3.00 psychological level, which acted as resistance.
There are no signs yet of bulls trying to regain control on the XNG/USD chart. If the supply and demand balance remains unchanged, the natural gas price may continue its decline within the red downward channel, possibly towards its lower boundary, reinforced by the former resistance at 2.65.
Start trading commodities with tight spreads. Open your trading account now or learn more about trading commodity CFDs with FXOpen.
CFDs are complex instruments and come with a high risk of losing your money.
This article represents the opinion of the Companies operating under the FXOpen brand only. It is not to be construed as an offer, solicitation, or recommendation with respect to products and services provided by the Companies operating under the FXOpen brand, nor is it to be considered financial advice.
👍2
#nvidia #NVDA #stockmarket #marketanalysis
Nvidia (NVDA) Shares Fall Over 4%, Missing a Record High
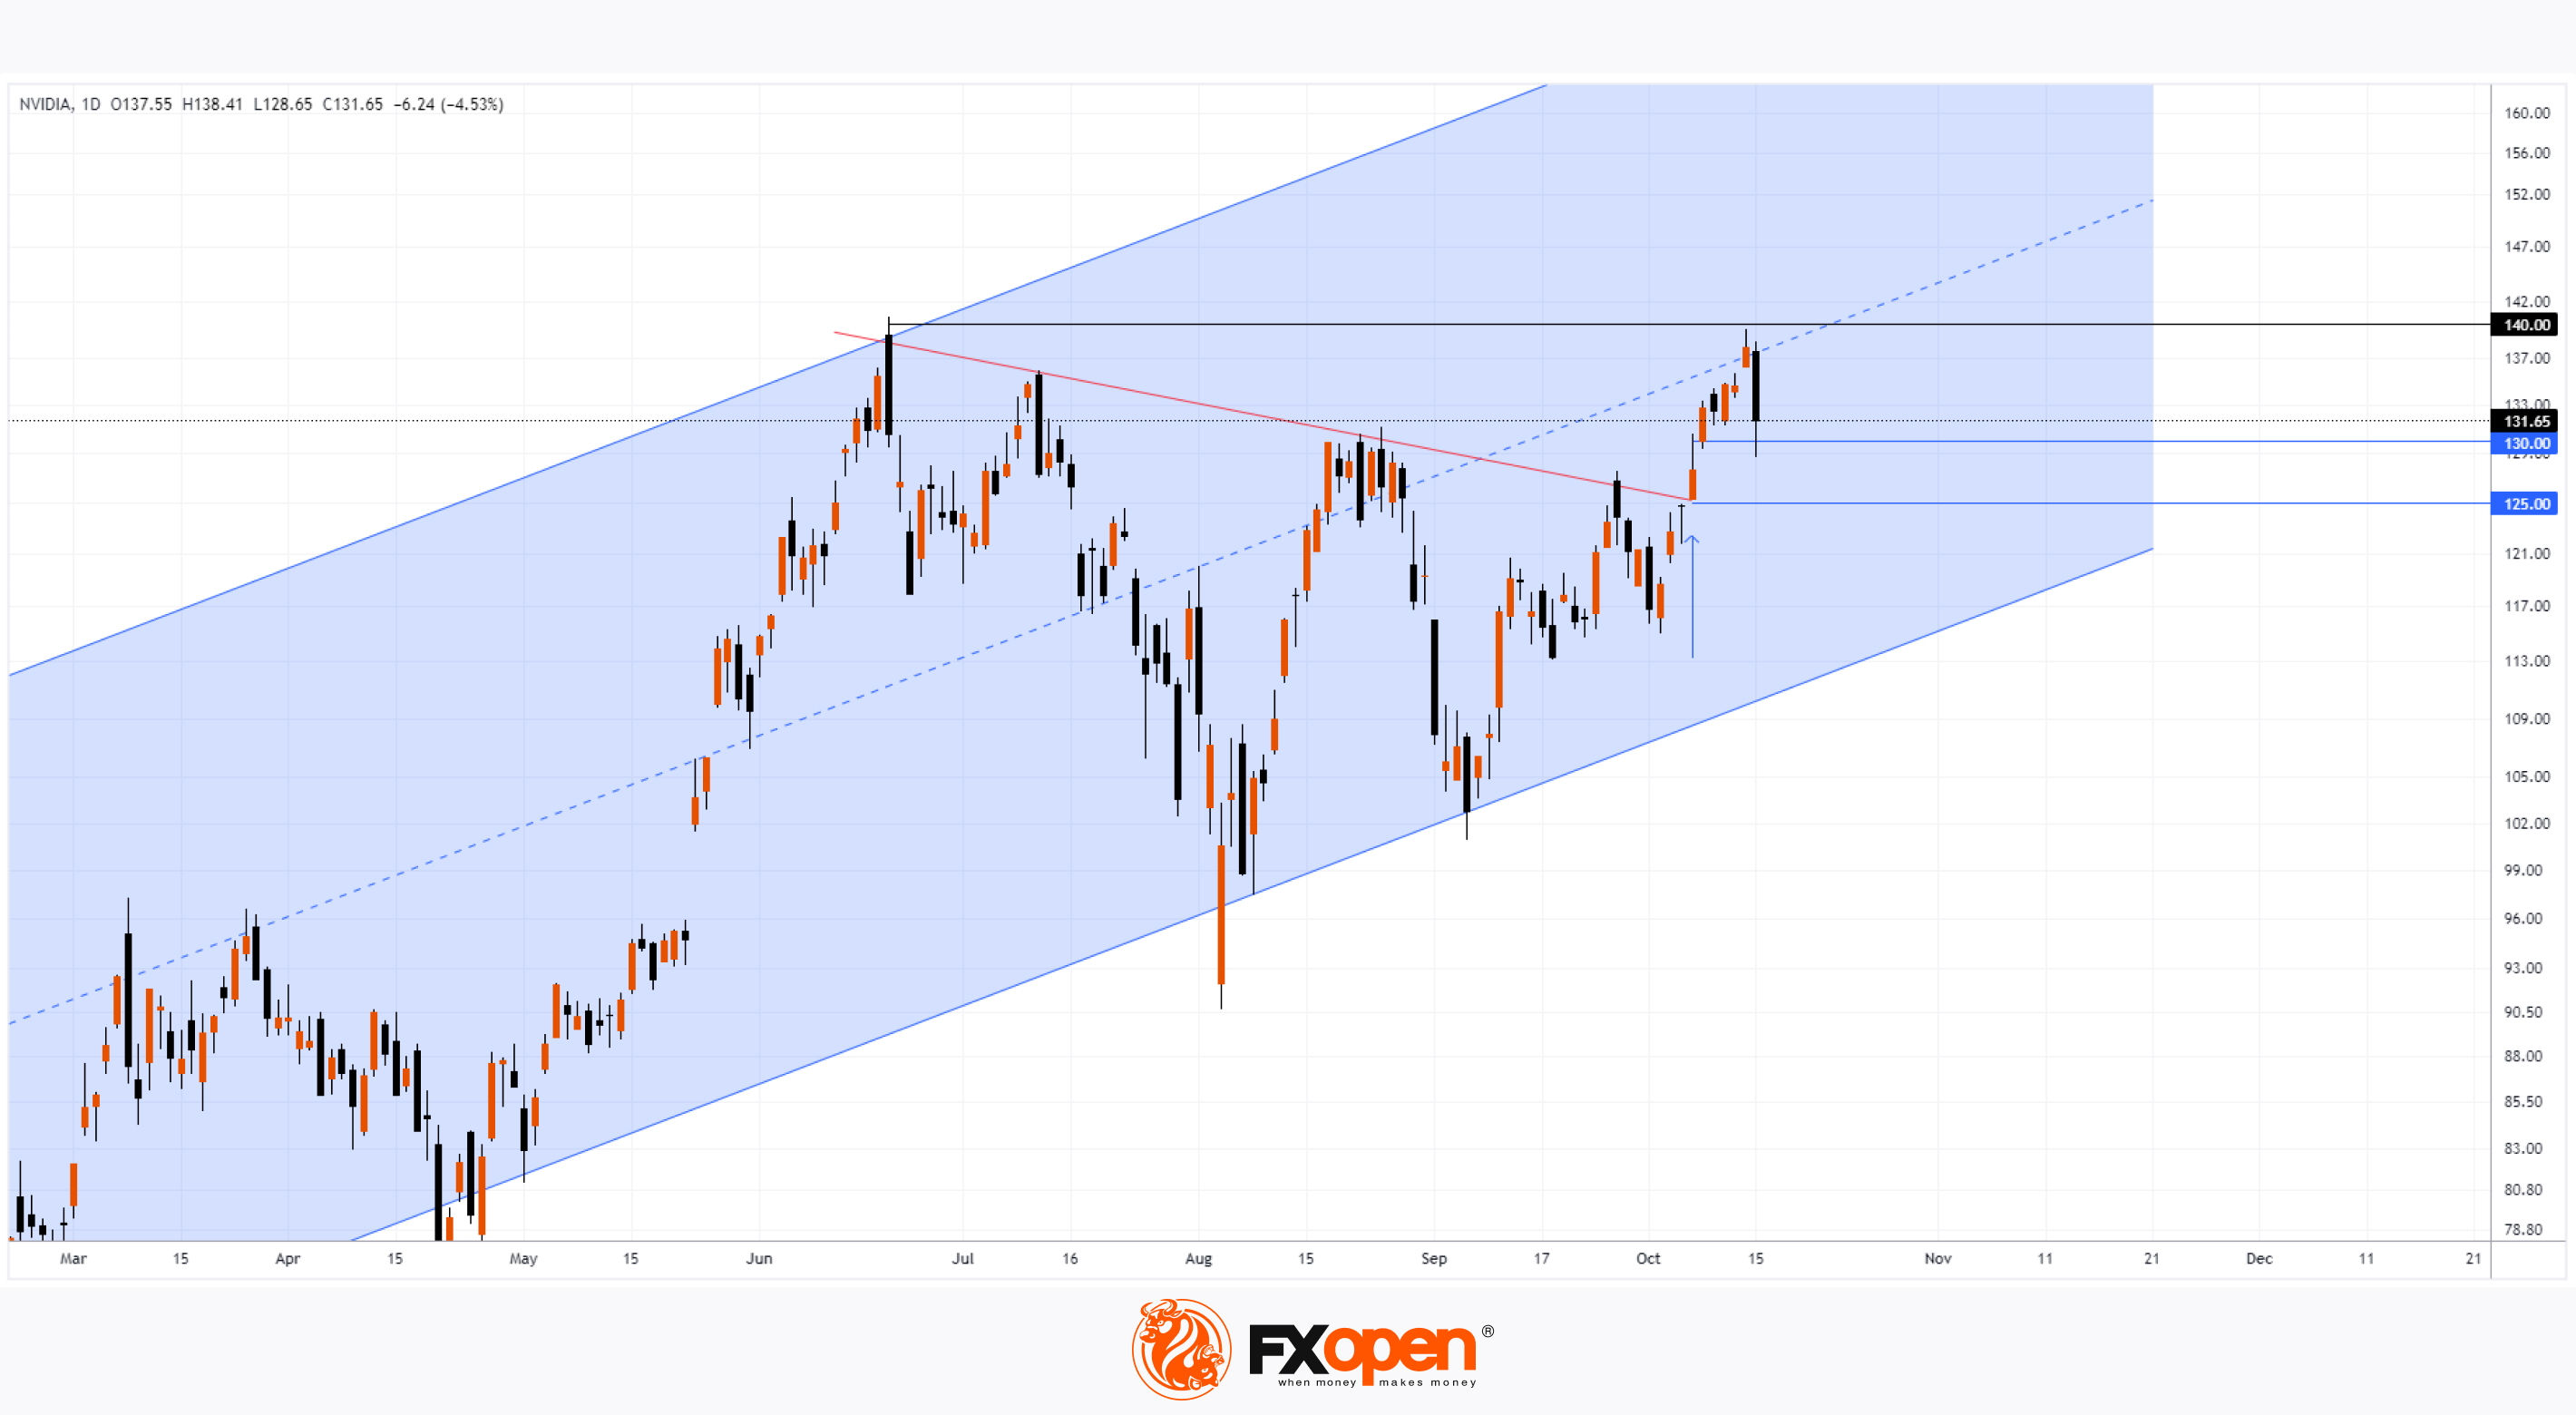
On 12 September, when analysing Nvidia’s (NVDA) stock chart, we drew an upward channel (shown in blue) and noted several resistance levels, including:
→ a downward trendline (shown in red);
→ a psychological level at $130.
As Nvidia’s (NVDA) stock chart shows, the bulls managed to overcome this resistance zone with a strong candle on 7 October (marked with an arrow).
Afterwards, Nvidia’s (NVDA) stock price reached the median line of the blue channel, but sharply reversed downwards yesterday. The bearish sentiment was driven by:
→ a broader decline in the US stock market, potentially due to investors reassessing risks following the initial corporate earnings results as the reporting season gains momentum;
→ rumours that the US government is preparing restrictive measures (which may affect Nvidia) to prevent the export of high-tech chip manufacturing technology abroad.
As a result, Nvidia’s (NVDA) stock price dropped by approximately 4% yesterday, just shy of the record set on 20 June.
What’s next?
A technical analysis of Nvidia’s (NVDA) stock chart suggests that support could come from the zone formed by the strong bullish candle on 7 October:
→ this area includes a combination of psychological levels at $130 and $125;
→ here, demand forces proved their strength, overcoming the red resistance line that had been in play for nearly four months (this line could now act as support);
→ a bullish Fair Value Gap can be found on the daily chart in this area.
These bullish factors suggest that the price could make another attempt to set a new record by rebounding from the $125-130 support zone.
On the other hand, the bears are showing signs of control around the psychological level of $140, near the record high and the median line of the blue channel.
Meanwhile, forecasts remain positive. According to a Tipranks survey of 42 analysts, 39 recommend buying NVDA shares, with the average price target for NVDA standing at $152.86 in 12 months.
Trade global index CFDs with zero commission and tight spreads. Open your FXOpen account now or learn more about trading index CFDs with FXOpen.
CFDs are complex instruments and come with a high risk of losing your money.
This article represents the opinion of the Companies operating under the FXOpen brand only. It is not to be construed as an offer, solicitation, or recommendation with respect to products and services provided by the Companies operating under the FXOpen brand, nor is it to be considered financial advice.
Nvidia (NVDA) Shares Fall Over 4%, Missing a Record High
On 12 September, when analysing Nvidia’s (NVDA) stock chart, we drew an upward channel (shown in blue) and noted several resistance levels, including:
→ a downward trendline (shown in red);
→ a psychological level at $130.
As Nvidia’s (NVDA) stock chart shows, the bulls managed to overcome this resistance zone with a strong candle on 7 October (marked with an arrow).
Afterwards, Nvidia’s (NVDA) stock price reached the median line of the blue channel, but sharply reversed downwards yesterday. The bearish sentiment was driven by:
→ a broader decline in the US stock market, potentially due to investors reassessing risks following the initial corporate earnings results as the reporting season gains momentum;
→ rumours that the US government is preparing restrictive measures (which may affect Nvidia) to prevent the export of high-tech chip manufacturing technology abroad.
As a result, Nvidia’s (NVDA) stock price dropped by approximately 4% yesterday, just shy of the record set on 20 June.
What’s next?
A technical analysis of Nvidia’s (NVDA) stock chart suggests that support could come from the zone formed by the strong bullish candle on 7 October:
→ this area includes a combination of psychological levels at $130 and $125;
→ here, demand forces proved their strength, overcoming the red resistance line that had been in play for nearly four months (this line could now act as support);
→ a bullish Fair Value Gap can be found on the daily chart in this area.
These bullish factors suggest that the price could make another attempt to set a new record by rebounding from the $125-130 support zone.
On the other hand, the bears are showing signs of control around the psychological level of $140, near the record high and the median line of the blue channel.
Meanwhile, forecasts remain positive. According to a Tipranks survey of 42 analysts, 39 recommend buying NVDA shares, with the average price target for NVDA standing at $152.86 in 12 months.
Trade global index CFDs with zero commission and tight spreads. Open your FXOpen account now or learn more about trading index CFDs with FXOpen.
CFDs are complex instruments and come with a high risk of losing your money.
This article represents the opinion of the Companies operating under the FXOpen brand only. It is not to be construed as an offer, solicitation, or recommendation with respect to products and services provided by the Companies operating under the FXOpen brand, nor is it to be considered financial advice.
👍2
#GBPUSD #marketanalysis #forextrading #MarketUpdates
Pound Falls After Inflation Report
The Consumer Price Index (CPI) report for the UK was released today, showing that inflation is decreasing at a faster rate than analysts had predicted. According to data from ForexFactory:
→ Yearly CPI: actual = 1.7%, forecast = 1.9%, previous = 2.2%;
→ Yearly Core CPI: actual = 3.2%, forecast = 3.4%, previous = 3.6%.
The currency market responded with a decline in the pound sterling against other currencies. Traders likely assume that the Bank of England now has stronger reasons to consider easing its current monetary policy, aimed at curbing inflation.
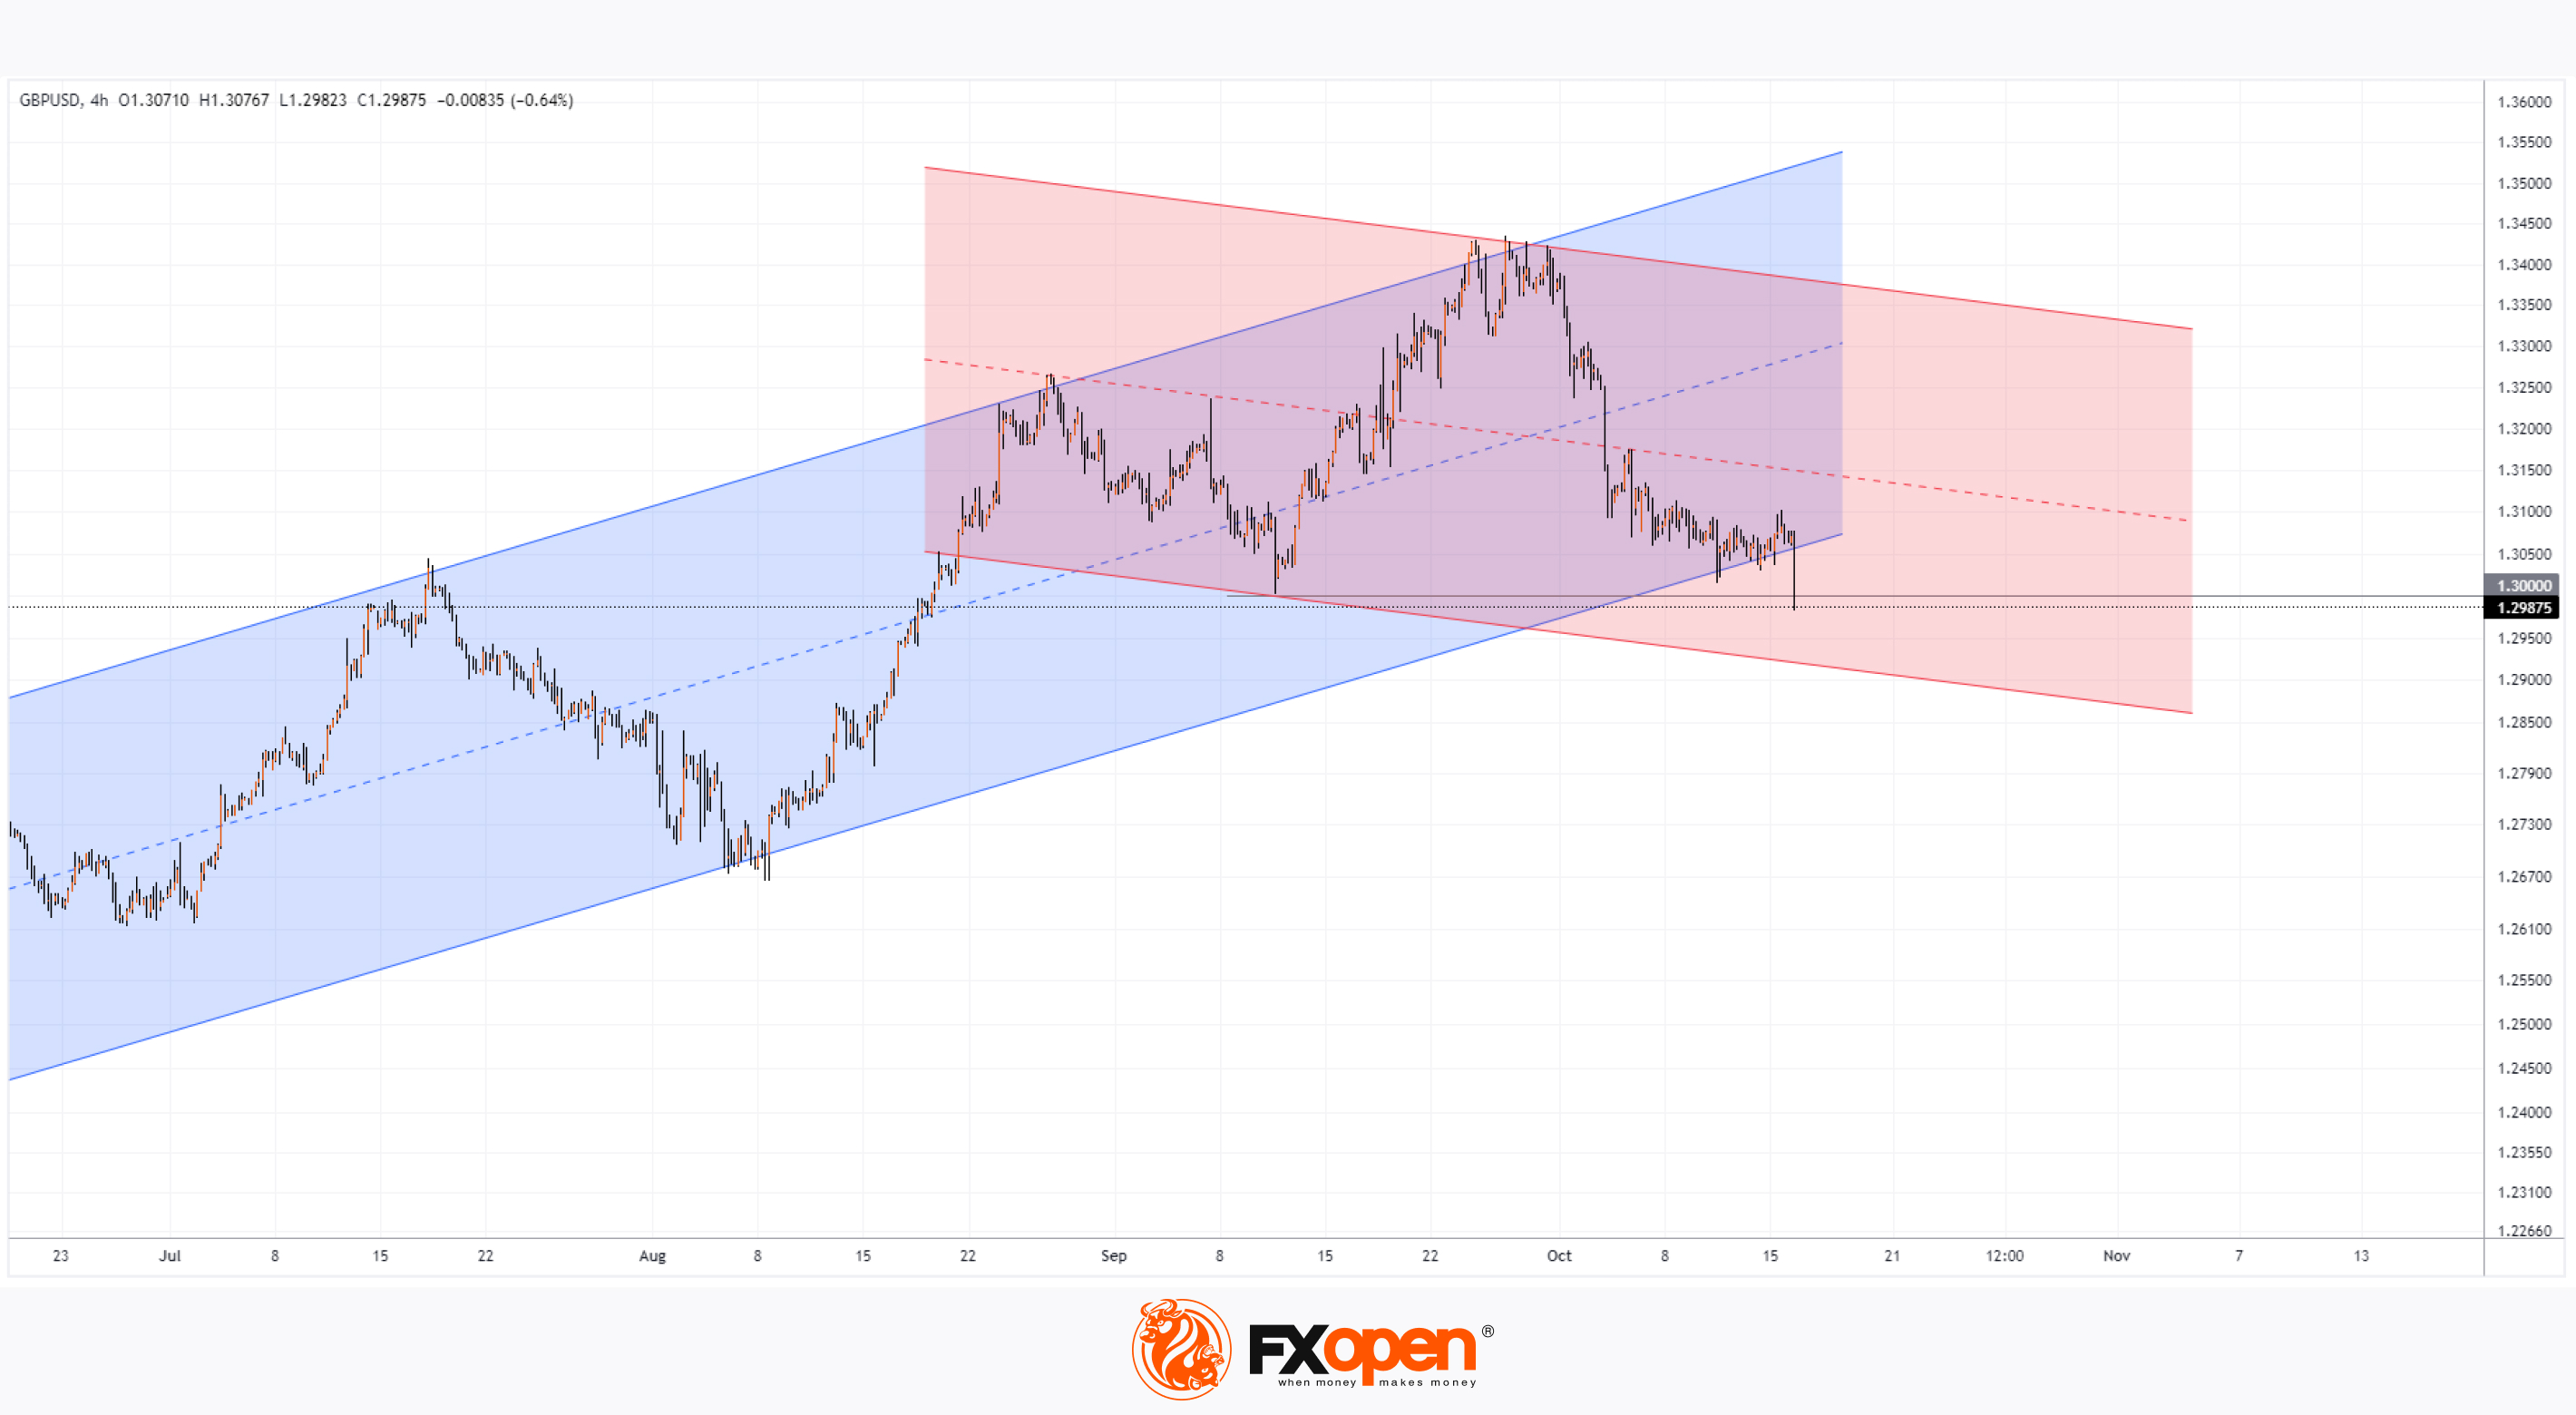
Specifically, the GBP/USD rate fell to its lowest in nearly two months.
Technical analysis of the GBP/USD chart shows that:
→ The price dropped below the psychological level of 1.3000;
→ It fell beneath the lower boundary of the ascending channel (shown in blue), which had been relevant since May 2024. Resistance could be expected after breaking this line.
Bearish momentum may extend into the US trading session. It is possible that the GBP/USD rate could drop further to 1.2900, where the lower boundary of a developing descending channel is becoming clearer on the GBP/USD chart today.
Trade over 50 forex markets 24 hours a day with FXOpen. Take advantage of low commissions, deep liquidity, and spreads from 0.0 pips. Open your FXOpen account now or learn more about trading forex with FXOpen.
CFDs are complex instruments and come with a high risk of losing your money.
This article represents the opinion of the Companies operating under the FXOpen brand only. It is not to be construed as an offer, solicitation, or recommendation with respect to products and services provided by the Companies operating under the FXOpen brand, nor is it to be considered financial advice.
Pound Falls After Inflation Report
The Consumer Price Index (CPI) report for the UK was released today, showing that inflation is decreasing at a faster rate than analysts had predicted. According to data from ForexFactory:
→ Yearly CPI: actual = 1.7%, forecast = 1.9%, previous = 2.2%;
→ Yearly Core CPI: actual = 3.2%, forecast = 3.4%, previous = 3.6%.
The currency market responded with a decline in the pound sterling against other currencies. Traders likely assume that the Bank of England now has stronger reasons to consider easing its current monetary policy, aimed at curbing inflation.
Specifically, the GBP/USD rate fell to its lowest in nearly two months.
Technical analysis of the GBP/USD chart shows that:
→ The price dropped below the psychological level of 1.3000;
→ It fell beneath the lower boundary of the ascending channel (shown in blue), which had been relevant since May 2024. Resistance could be expected after breaking this line.
Bearish momentum may extend into the US trading session. It is possible that the GBP/USD rate could drop further to 1.2900, where the lower boundary of a developing descending channel is becoming clearer on the GBP/USD chart today.
Trade over 50 forex markets 24 hours a day with FXOpen. Take advantage of low commissions, deep liquidity, and spreads from 0.0 pips. Open your FXOpen account now or learn more about trading forex with FXOpen.
CFDs are complex instruments and come with a high risk of losing your money.
This article represents the opinion of the Companies operating under the FXOpen brand only. It is not to be construed as an offer, solicitation, or recommendation with respect to products and services provided by the Companies operating under the FXOpen brand, nor is it to be considered financial advice.
👍3
#marketanalysis #MarketNews #stockmarket
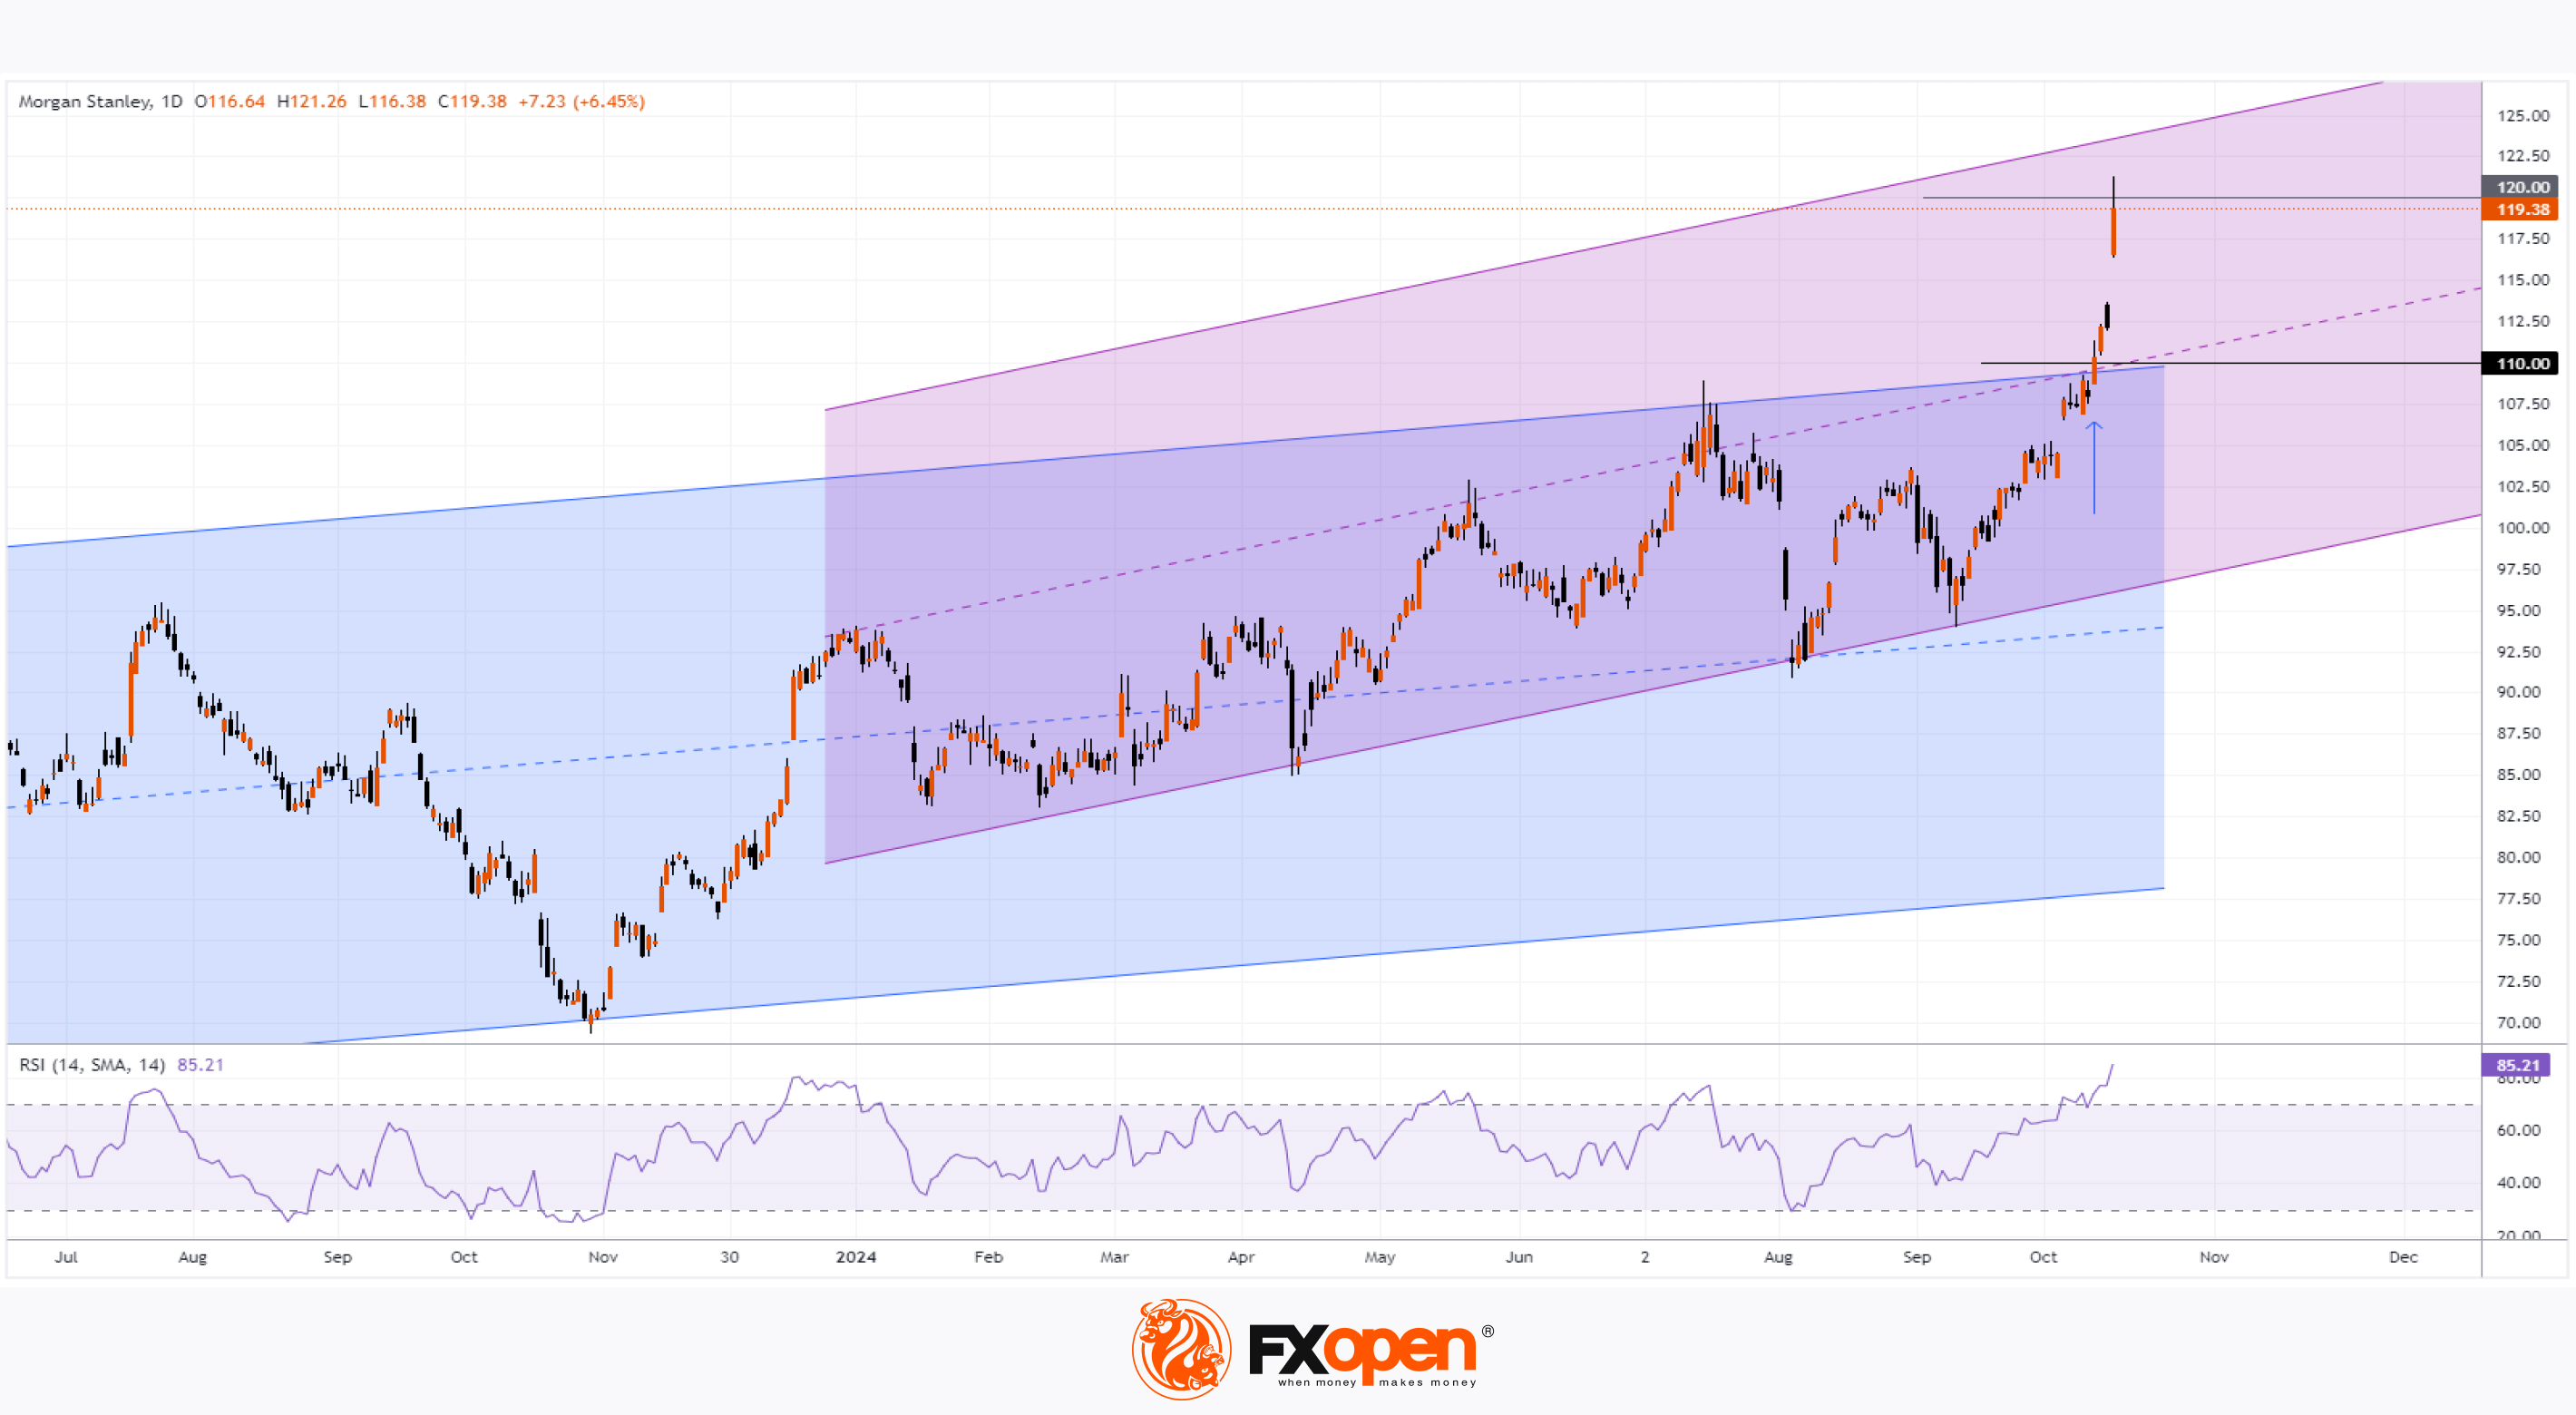
Morgan Stanley (MS) Shares Rise 6.45%, Setting Historic High
Morgan Stanley (MS) reported its third-quarter results:
→ Earnings per share: actual = $1.88, forecast = $1.59
→ Gross revenue: actual = $15.38 billion, forecast = $14.35 billion
According to Barron’s, Morgan Stanley’s profit increased by 32% compared to last year, driven by heightened activity in investment banking, which had previously been pressured by the Federal Reserve's high interest rates.
Market participants reacted positively to Morgan Stanley’s success, with MS shares rising 6.45% in a day, reaching an all-time high. Will the rally continue?
A technical analysis of the daily MS stock chart indicates:
→ The price action has formed a long-term channel (shown in blue), and in October, the price broke through its upper boundary. A strong price movement (indicated by an arrow) occurred at this resistance level around $110, influenced by strong reports from other banks. Bulls demonstrated dominance here, and this level may now serve as support.
→ In 2024, a steeper price growth trend is observed, providing anchor points for constructing an upward channel, shown in purple. Today, the MS stock price is positioned in the upper half of this channel, nearing its upper limit.
→ The RSI indicator is at its highest since January 2020.
→ Yesterday's candle closed well below the highs, with the price unable to hold above the psychological level of $120.
Given these factors, it is reasonable to suggest that the MS stock price is vulnerable to a correction as the initial reaction to the strong report may wane. If a correction occurs, it’s possible the price may retreat to the $110 level, where two channel lines converge, potentially providing support.
Analysts’ forecasts also indicate a likelihood of a pullback. According to TipRanks, the average price target for MS shares is $112 over the next 12 months, with 4 out of 12 analysts recommending buying Morgan Stanley (MS) shares.
Trade global index CFDs with zero commission and tight spreads. Open your FXOpen account now or learn more about trading index CFDs with FXOpen.
CFDs are complex instruments and come with a high risk of losing your money.
This article represents the opinion of the Companies operating under the FXOpen brand only. It is not to be construed as an offer, solicitation, or recommendation with respect to products and services provided by the Companies operating under the FXOpen brand, nor is it to be considered financial advice.
Morgan Stanley (MS) Shares Rise 6.45%, Setting Historic High
Morgan Stanley (MS) reported its third-quarter results:
→ Earnings per share: actual = $1.88, forecast = $1.59
→ Gross revenue: actual = $15.38 billion, forecast = $14.35 billion
According to Barron’s, Morgan Stanley’s profit increased by 32% compared to last year, driven by heightened activity in investment banking, which had previously been pressured by the Federal Reserve's high interest rates.
Market participants reacted positively to Morgan Stanley’s success, with MS shares rising 6.45% in a day, reaching an all-time high. Will the rally continue?
A technical analysis of the daily MS stock chart indicates:
→ The price action has formed a long-term channel (shown in blue), and in October, the price broke through its upper boundary. A strong price movement (indicated by an arrow) occurred at this resistance level around $110, influenced by strong reports from other banks. Bulls demonstrated dominance here, and this level may now serve as support.
→ In 2024, a steeper price growth trend is observed, providing anchor points for constructing an upward channel, shown in purple. Today, the MS stock price is positioned in the upper half of this channel, nearing its upper limit.
→ The RSI indicator is at its highest since January 2020.
→ Yesterday's candle closed well below the highs, with the price unable to hold above the psychological level of $120.
Given these factors, it is reasonable to suggest that the MS stock price is vulnerable to a correction as the initial reaction to the strong report may wane. If a correction occurs, it’s possible the price may retreat to the $110 level, where two channel lines converge, potentially providing support.
Analysts’ forecasts also indicate a likelihood of a pullback. According to TipRanks, the average price target for MS shares is $112 over the next 12 months, with 4 out of 12 analysts recommending buying Morgan Stanley (MS) shares.
Trade global index CFDs with zero commission and tight spreads. Open your FXOpen account now or learn more about trading index CFDs with FXOpen.
CFDs are complex instruments and come with a high risk of losing your money.
This article represents the opinion of the Companies operating under the FXOpen brand only. It is not to be construed as an offer, solicitation, or recommendation with respect to products and services provided by the Companies operating under the FXOpen brand, nor is it to be considered financial advice.
👍3
#XAUUSD #goldprice #marketanalysis #MarketUpdates
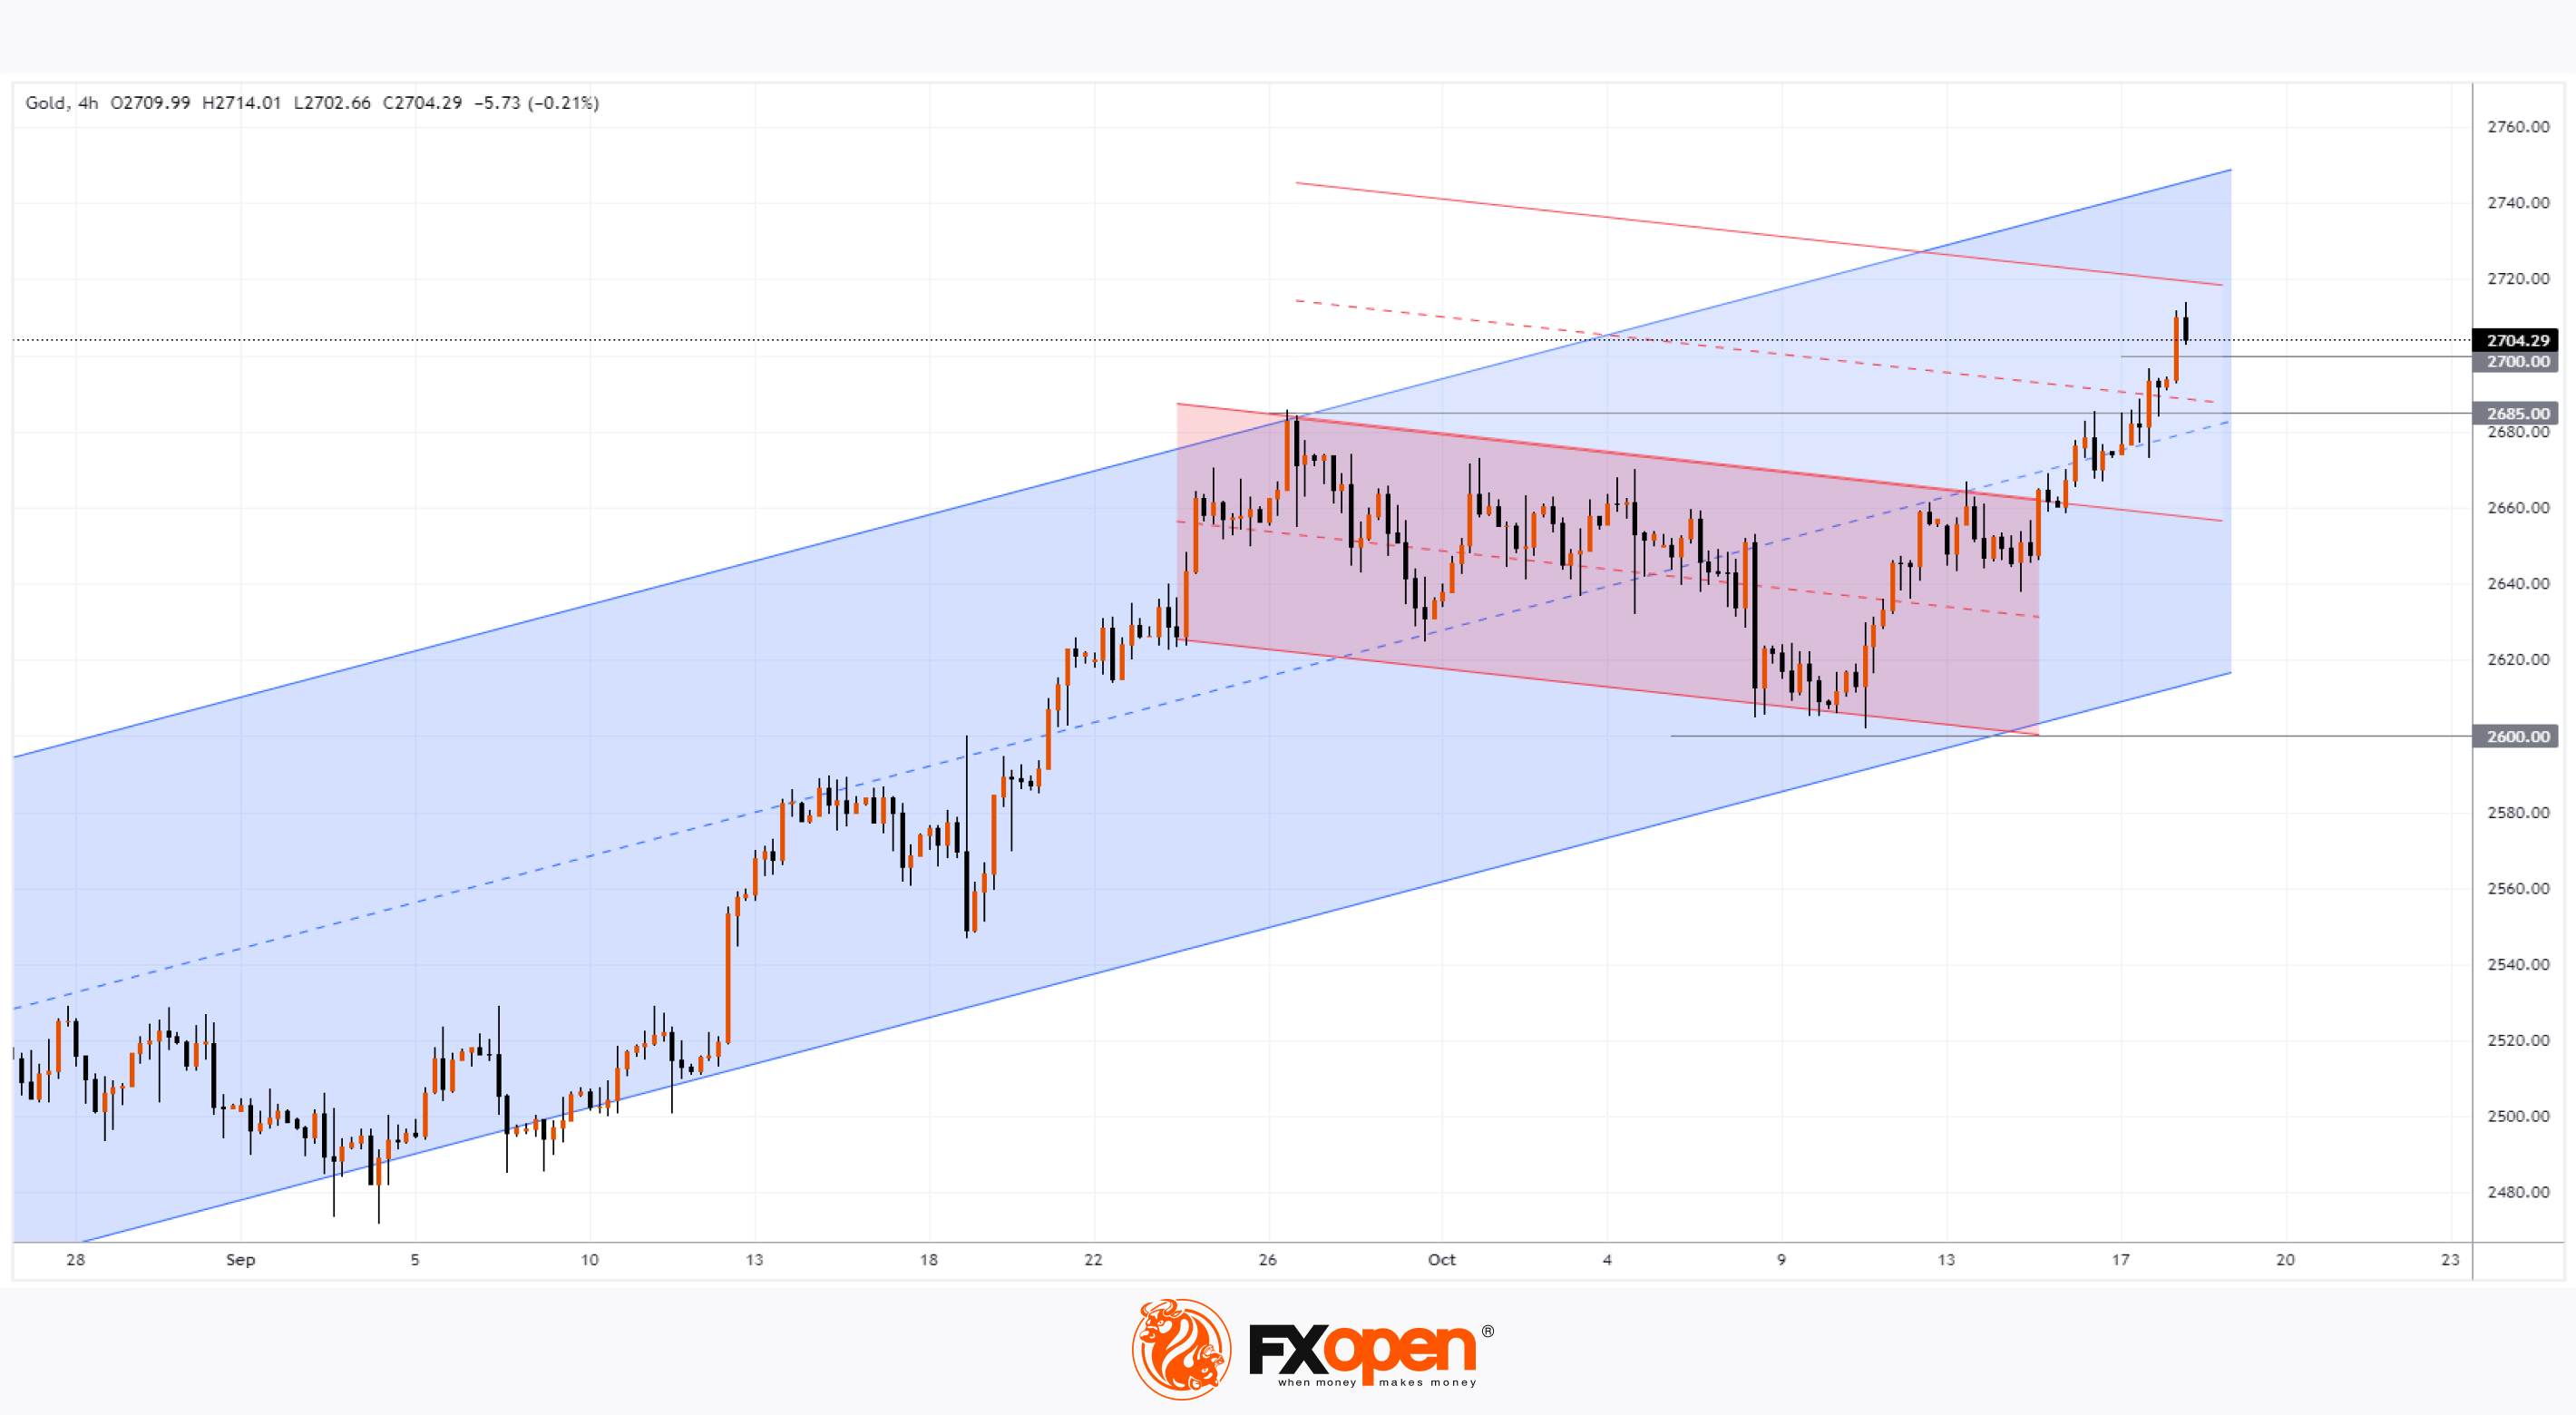
XAU/USD Analysis: Gold Price Surpasses $2700 for the First Time
The XAU/USD chart shows that gold has reached a historic high, surpassing the psychological level of $2700.
According to Yahoo Finance:
→ Bullish momentum is being driven by central banks increasing their gold reserves;
→ Goldman Sachs analysts have raised their gold price target from $2700 to $2900.
On 9 October, when analysing the gold price chart, we identified an ascending channel (shown in blue) and suggested that bulls might attempt to resume the upward trend from the $2600 level. Since then, the price has broken above a downward channel (shown in red), which could be viewed as a corrective move.
Today, a technical analysis of the XAU/USD chart indicates that gold has moved into the upper half of the blue channel, surpassing its median, signalling strong demand.
Can the rally continue?
It is possible that gold's price will continue to be supported by economic news and geopolitical instability.
From a technical perspective, the gold price has several support levels on the chart:
→ The median line of the blue channel;
→ Previous resistance near the $2685 level;
→ The psychological level of $2700.
Considering the height of the red corrective channel on the XAU/USD chart, the bulls' target could be the upper boundary of a parallel channel of the same height, projected higher.
Start trading commodities with tight spreads. Open your trading account now or learn more about trading commodity CFDs with FXOpen.
CFDs are complex instruments and come with a high risk of losing your money.
This article represents the opinion of the Companies operating under the FXOpen brand only. It is not to be construed as an offer, solicitation, or recommendation with respect to products and services provided by the Companies operating under the FXOpen brand, nor is it to be considered financial advice.
XAU/USD Analysis: Gold Price Surpasses $2700 for the First Time
The XAU/USD chart shows that gold has reached a historic high, surpassing the psychological level of $2700.
According to Yahoo Finance:
→ Bullish momentum is being driven by central banks increasing their gold reserves;
→ Goldman Sachs analysts have raised their gold price target from $2700 to $2900.
On 9 October, when analysing the gold price chart, we identified an ascending channel (shown in blue) and suggested that bulls might attempt to resume the upward trend from the $2600 level. Since then, the price has broken above a downward channel (shown in red), which could be viewed as a corrective move.
Today, a technical analysis of the XAU/USD chart indicates that gold has moved into the upper half of the blue channel, surpassing its median, signalling strong demand.
Can the rally continue?
It is possible that gold's price will continue to be supported by economic news and geopolitical instability.
From a technical perspective, the gold price has several support levels on the chart:
→ The median line of the blue channel;
→ Previous resistance near the $2685 level;
→ The psychological level of $2700.
Considering the height of the red corrective channel on the XAU/USD chart, the bulls' target could be the upper boundary of a parallel channel of the same height, projected higher.
Start trading commodities with tight spreads. Open your trading account now or learn more about trading commodity CFDs with FXOpen.
CFDs are complex instruments and come with a high risk of losing your money.
This article represents the opinion of the Companies operating under the FXOpen brand only. It is not to be construed as an offer, solicitation, or recommendation with respect to products and services provided by the Companies operating under the FXOpen brand, nor is it to be considered financial advice.
👍3
#stockmarket #stocktrading #MarketNews #marketanalysis
Taiwan Semiconductor (TSM) Shares Rise by Nearly 10%
Taiwan Semiconductor Manufacturing Company Limited (TSM) posted quarterly results that exceeded analyst expectations, driven by strong demand for AI-related chips:
→ Earnings per share: Actual = $1.95, Expected = $1.79;
→ Revenue: Actual = $23.6 billion, Expected = $23.3 billion.
According to the Wall Street Journal:
→ The company expects its revenue from servers and AI processors to triple this year, representing about 15% of its total revenue.
→ TSMC forecasts Q4 revenue between $26.1 billion and $26.9 billion.
→ Citi analysts believe TSMC's gross profit could continue growing next year.
→ Morningstar analyst Felix Lee noted that TSMC is well-positioned against competitors like Samsung and Intel.
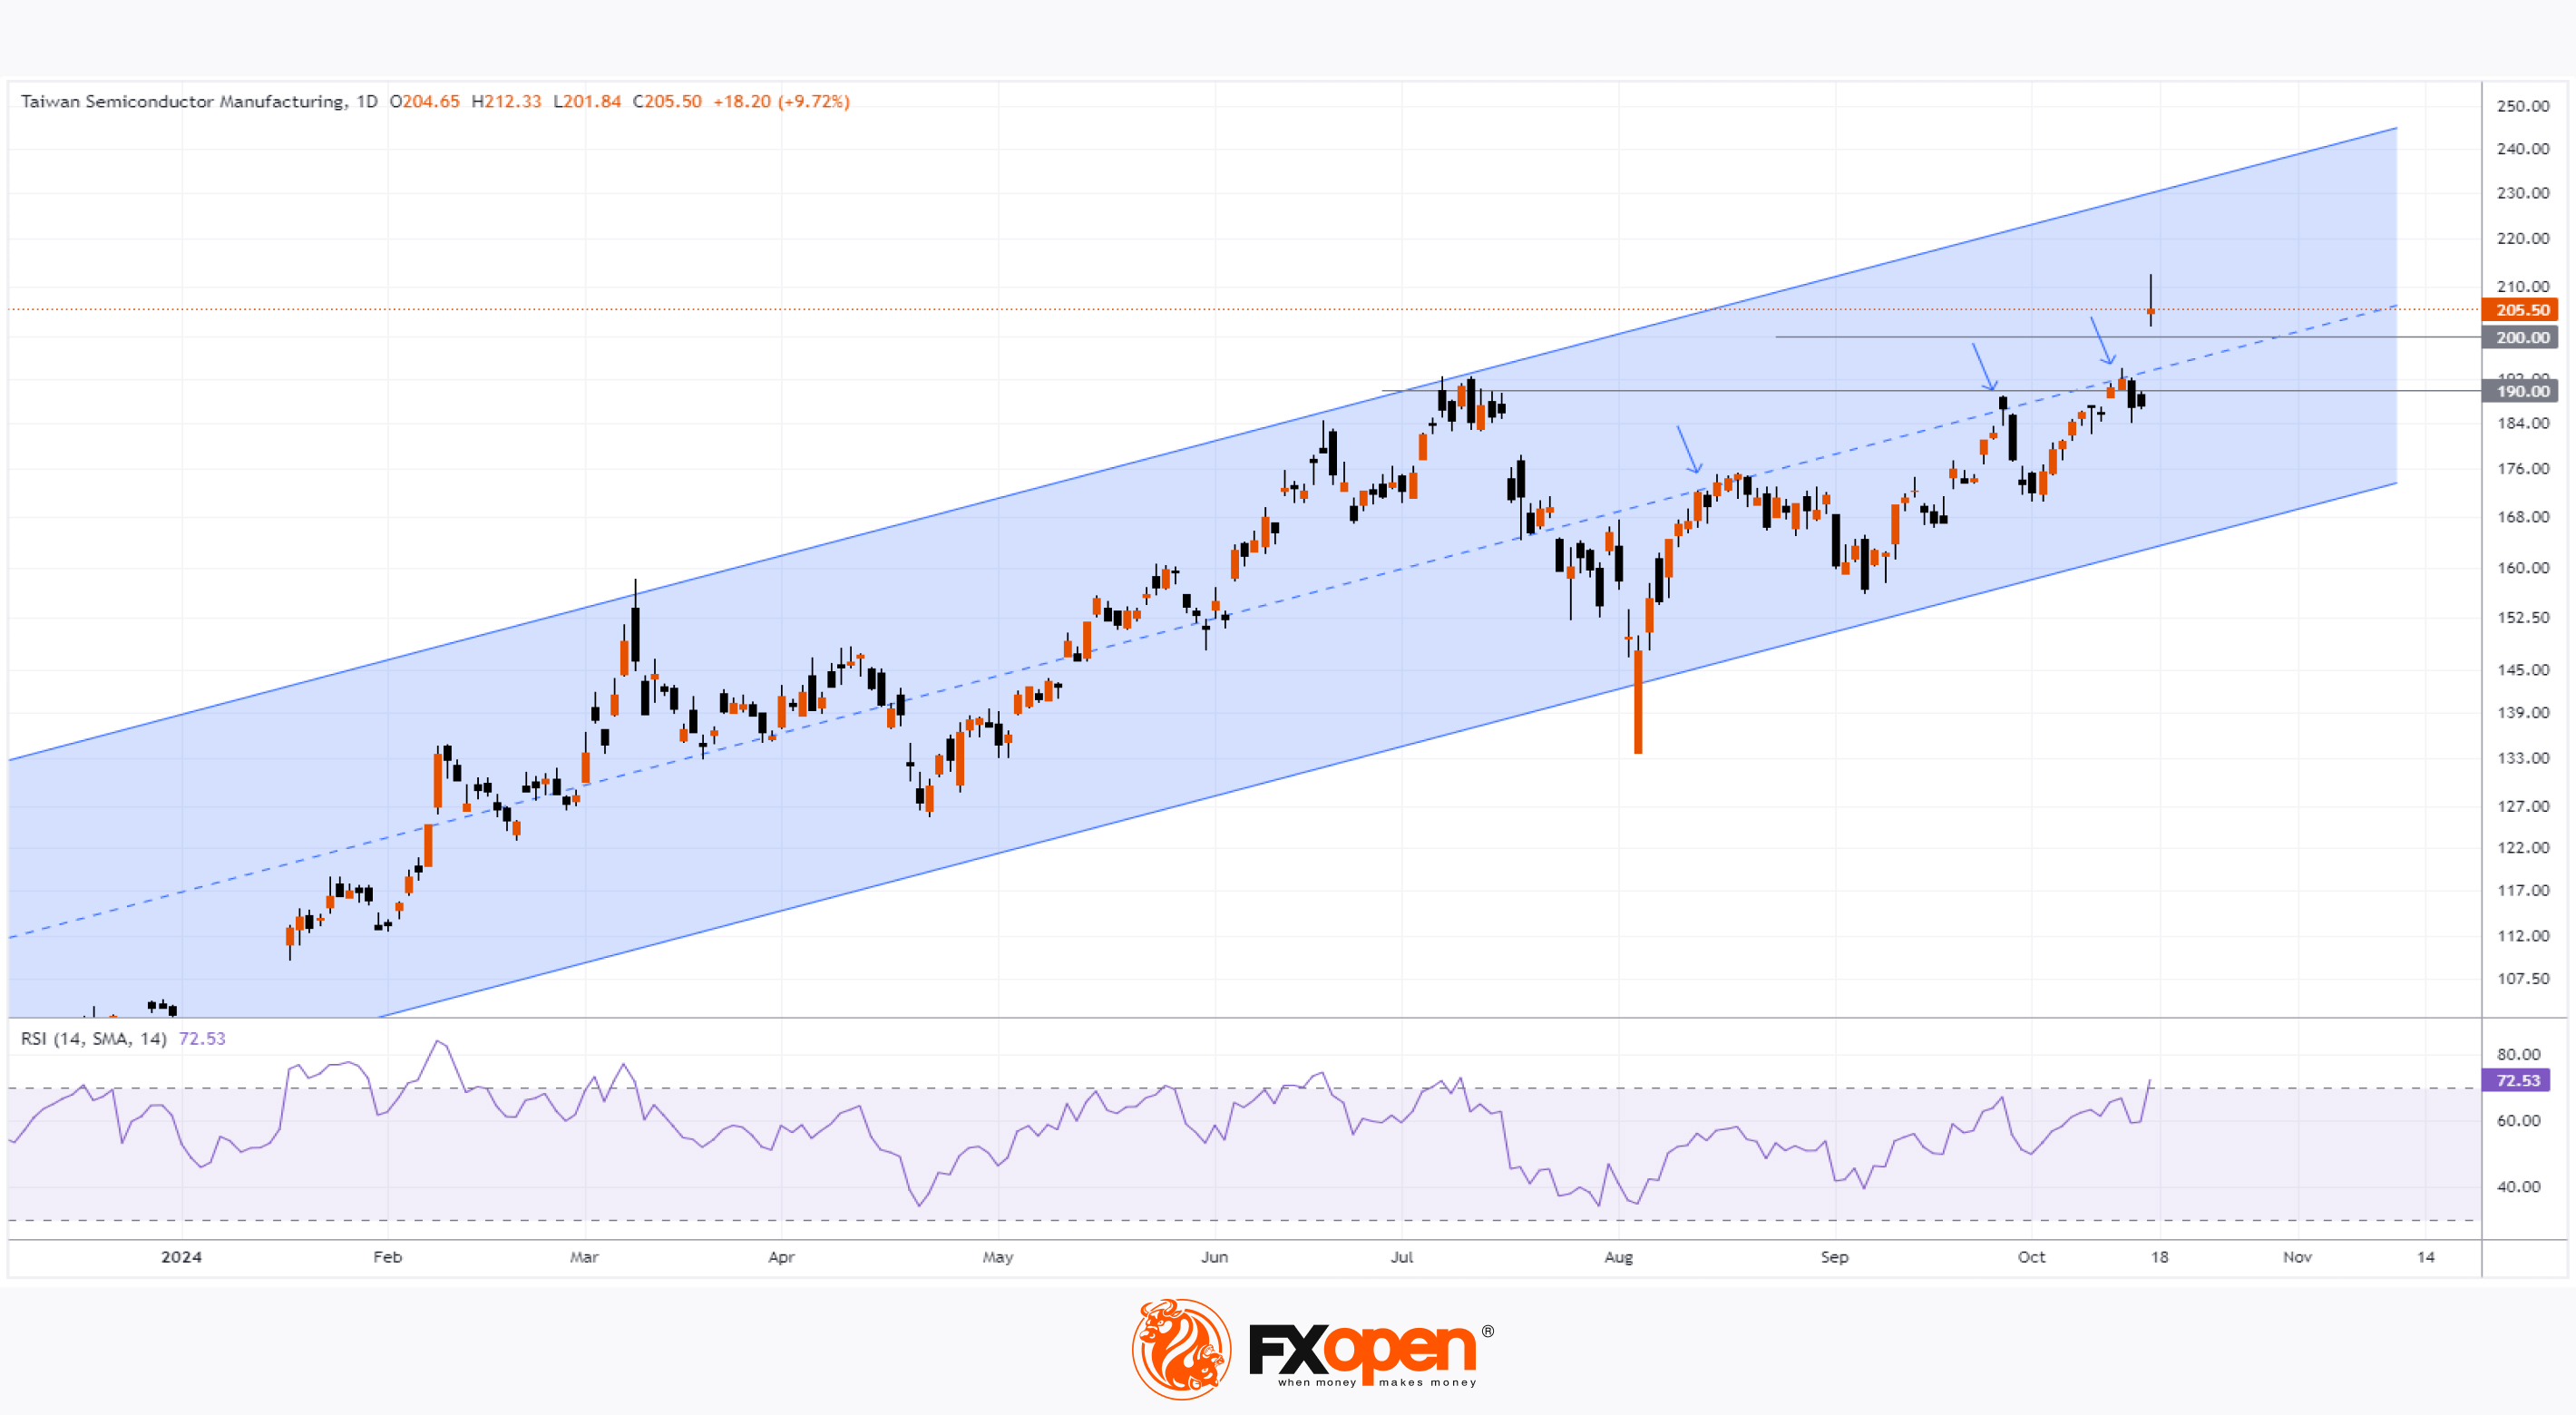
TSMC shares surged following the report. Today's stock chart shows: → A 10% increase, reaching an all-time high;
→ The stock surpassed the psychological $200 level;
→ Year-to-date price growth is around 100%.
Technical analysis of the TSM stock chart indicates:
→ The price has been rising within an ascending channel since 2024 (marked in blue), with yesterday’s move pushing it into the upper half of the channel, surpassing the median resistance.
→ On strong news, a bullish gap formed between $190-$200, potentially acting as support.
→ The RSI indicator entered overbought territory, with a long upper wick on the candle suggesting a possible correction.
Optimistic forecasts could sustain long-term bullish sentiment, although short-term corrections may occur from the overbought zone towards support levels like the channel's median or the bullish gap area.
Trade global index CFDs with zero commission and tight spreads. Open your FXOpen account now or learn more about trading index CFDs with FXOpen.
CFDs are complex instruments and come with a high risk of losing your money.
This article represents the opinion of the Companies operating under the FXOpen brand only. It is not to be construed as an offer, solicitation, or recommendation with respect to products and services provided by the Companies operating under the FXOpen brand, nor is it to be considered financial advice.
Taiwan Semiconductor (TSM) Shares Rise by Nearly 10%
Taiwan Semiconductor Manufacturing Company Limited (TSM) posted quarterly results that exceeded analyst expectations, driven by strong demand for AI-related chips:
→ Earnings per share: Actual = $1.95, Expected = $1.79;
→ Revenue: Actual = $23.6 billion, Expected = $23.3 billion.
According to the Wall Street Journal:
→ The company expects its revenue from servers and AI processors to triple this year, representing about 15% of its total revenue.
→ TSMC forecasts Q4 revenue between $26.1 billion and $26.9 billion.
→ Citi analysts believe TSMC's gross profit could continue growing next year.
→ Morningstar analyst Felix Lee noted that TSMC is well-positioned against competitors like Samsung and Intel.
TSMC shares surged following the report. Today's stock chart shows: → A 10% increase, reaching an all-time high;
→ The stock surpassed the psychological $200 level;
→ Year-to-date price growth is around 100%.
Technical analysis of the TSM stock chart indicates:
→ The price has been rising within an ascending channel since 2024 (marked in blue), with yesterday’s move pushing it into the upper half of the channel, surpassing the median resistance.
→ On strong news, a bullish gap formed between $190-$200, potentially acting as support.
→ The RSI indicator entered overbought territory, with a long upper wick on the candle suggesting a possible correction.
Optimistic forecasts could sustain long-term bullish sentiment, although short-term corrections may occur from the overbought zone towards support levels like the channel's median or the bullish gap area.
Trade global index CFDs with zero commission and tight spreads. Open your FXOpen account now or learn more about trading index CFDs with FXOpen.
CFDs are complex instruments and come with a high risk of losing your money.
This article represents the opinion of the Companies operating under the FXOpen brand only. It is not to be construed as an offer, solicitation, or recommendation with respect to products and services provided by the Companies operating under the FXOpen brand, nor is it to be considered financial advice.
👍3
#StockMarket #ForexNews #Investing #NVIDIA #EURUSD #NaturalGas #FinanceNews
Weekly Market Wrap With Gary Thomson: GBP, EUR, Natural Gas and NVIDIA (NVDA) Shares
Get the latest scoop on the week's hottest headlines, all in one convenient video. Join Gary Thomson, the COO of FXOpen UK, as he breaks down the most significant news reports and shares his expert insights.
🔸Pound Falls After Inflation Report
🔸Euro Tests Key Support Levels Ahead of ECB Meeting
🔸Natural Gas Price Drops Over 8% Since the Start of the Month
🔸NVIDIA (NVDA) Shares Fall Over 4%, Missing a Record High
Stay in the know and empower yourself with our short, yet power-packed video. Watch it now and stay updated with FXOpen. Don't miss out on this invaluable opportunity to sharpen your trading skills and make informed decisions.
https://cutt.ly/5eSDnhf3
To take advantage of price fluctuations in the foreign exchange markets, consider enlisting the services of a reliable broker like FXOpen.
⚠️
This forecast represents FXOpen Companies opinion only, it should not be construed as an offer, invitation or recommendation in respect to FXOpen Companies products and services or as financial advice.
Weekly Market Wrap With Gary Thomson: GBP, EUR, Natural Gas and NVIDIA (NVDA) Shares
Get the latest scoop on the week's hottest headlines, all in one convenient video. Join Gary Thomson, the COO of FXOpen UK, as he breaks down the most significant news reports and shares his expert insights.
🔸Pound Falls After Inflation Report
🔸Euro Tests Key Support Levels Ahead of ECB Meeting
🔸Natural Gas Price Drops Over 8% Since the Start of the Month
🔸NVIDIA (NVDA) Shares Fall Over 4%, Missing a Record High
Stay in the know and empower yourself with our short, yet power-packed video. Watch it now and stay updated with FXOpen. Don't miss out on this invaluable opportunity to sharpen your trading skills and make informed decisions.
https://cutt.ly/5eSDnhf3
To take advantage of price fluctuations in the foreign exchange markets, consider enlisting the services of a reliable broker like FXOpen.
⚠️
This forecast represents FXOpen Companies opinion only, it should not be construed as an offer, invitation or recommendation in respect to FXOpen Companies products and services or as financial advice.
YouTube
Weekly Market Wrap With Gary Thomson: GBP, EUR, Natural Gas and NVIDIA (NVDA) Shares
Get the latest scoop on the week's hottest headlines, all in one convenient video. Join Gary Thomson, the COO of FXOpen UK, as he breaks down the most signif...
👍3
#EURUSD #forextrading #tradingforex #MarketUpdates
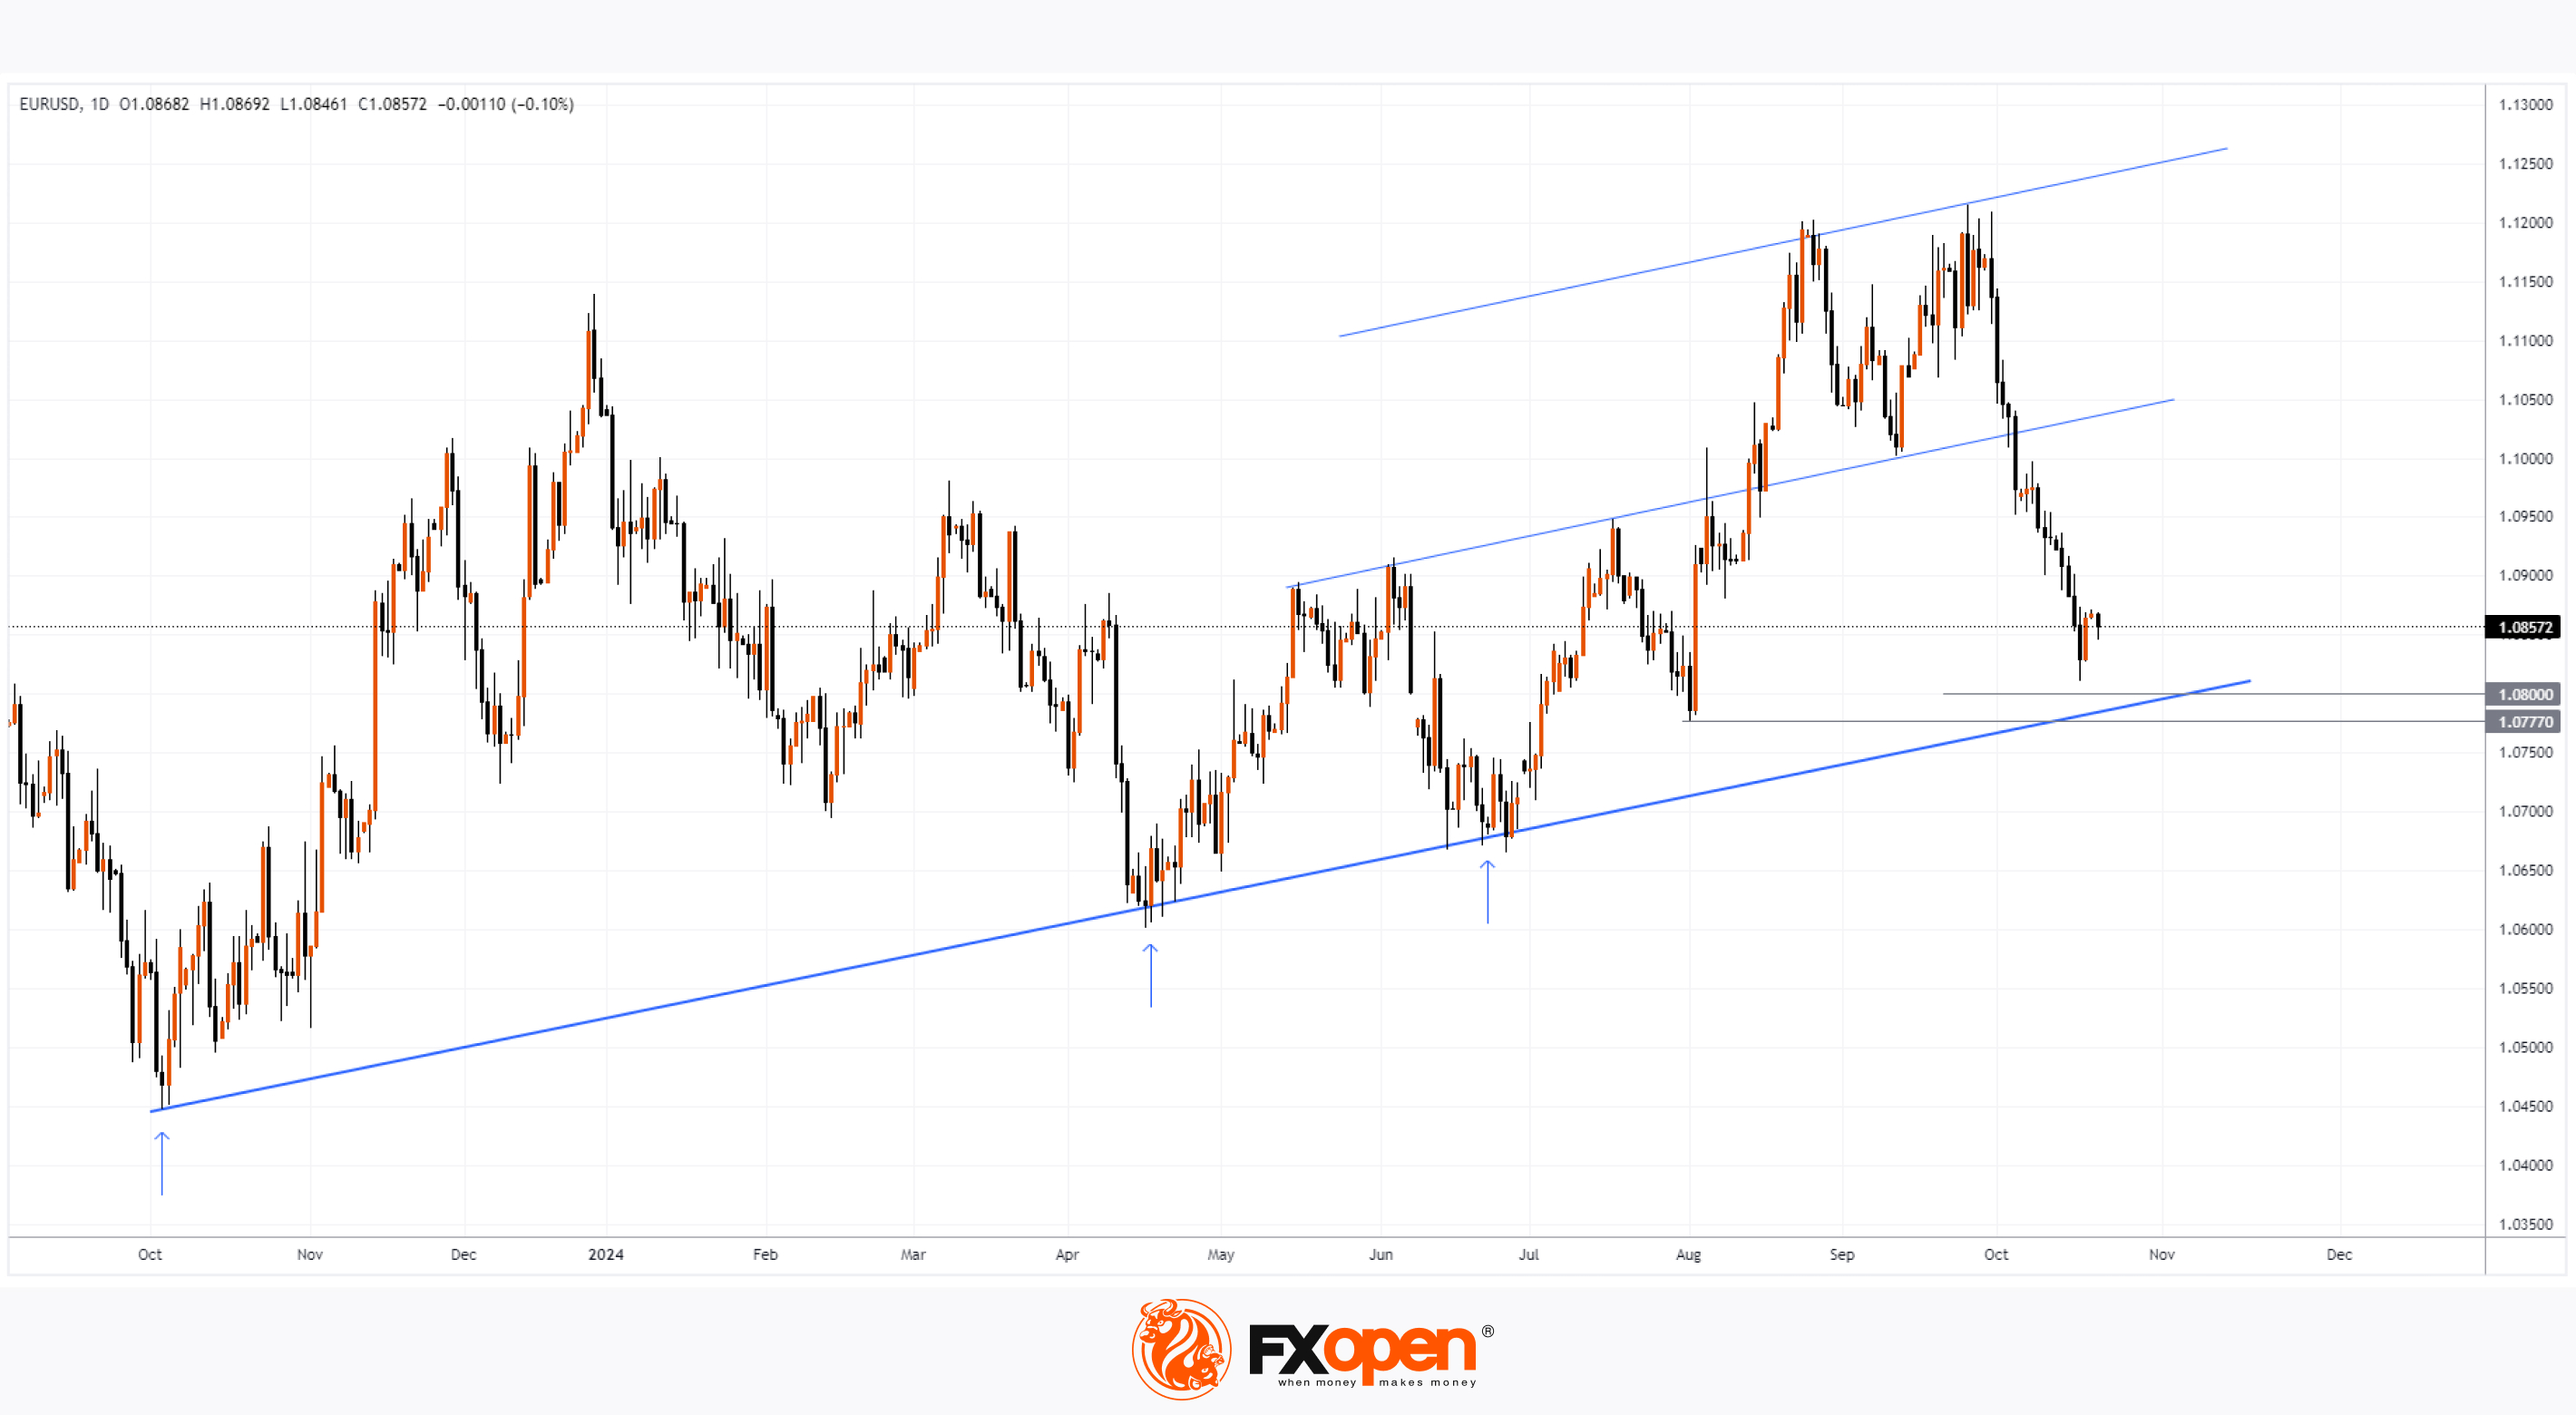
EUR/USD Approaching Key Support Level
Last week, the European Central Bank (ECB) cut interest rates as expected, marking the third reduction this year. According to Trading Economics, market participants speculate there could be another rate cut in December. This dovish stance is weakening the euro, as the ECB signals deteriorating economic prospects in the Eurozone.
In contrast, the U.S. dollar remains strong, supported by:
→ Robust economic data, including retail sales figures that exceeded expectations last week.
→ Expectations that Trump may win the next U.S. election, with his proposed trade and tax policies likely to support the dollar.
As a result, EUR/USD continued its decline last week, with the pair falling by about 2.5% since the start of October. Will the downtrend persist?
Today's technical analysis of the EUR/USD daily chart shows that the pair is approaching a key support line (marked in blue), connecting significant lows from 2023-2024 (highlighted by arrows).
Additional support may come from:
→ The psychological level of 1.0800;
→ A previous significant low near 1.0777.
Thus, the EUR/USD area formed by these lines could present challenges to the developing bearish trend.
Trade over 50 forex markets 24 hours a day with FXOpen. Take advantage of low commissions, deep liquidity, and spreads from 0.0 pips. Open your FXOpen account now or learn more about trading forex with FXOpen.
CFDs are complex instruments and come with a high risk of losing your money.
This article represents the opinion of the Companies operating under the FXOpen brand only. It is not to be construed as an offer, solicitation, or recommendation with respect to products and services provided by the Companies operating under the FXOpen brand, nor is it to be considered financial advice.
EUR/USD Approaching Key Support Level
Last week, the European Central Bank (ECB) cut interest rates as expected, marking the third reduction this year. According to Trading Economics, market participants speculate there could be another rate cut in December. This dovish stance is weakening the euro, as the ECB signals deteriorating economic prospects in the Eurozone.
In contrast, the U.S. dollar remains strong, supported by:
→ Robust economic data, including retail sales figures that exceeded expectations last week.
→ Expectations that Trump may win the next U.S. election, with his proposed trade and tax policies likely to support the dollar.
As a result, EUR/USD continued its decline last week, with the pair falling by about 2.5% since the start of October. Will the downtrend persist?
Today's technical analysis of the EUR/USD daily chart shows that the pair is approaching a key support line (marked in blue), connecting significant lows from 2023-2024 (highlighted by arrows).
Additional support may come from:
→ The psychological level of 1.0800;
→ A previous significant low near 1.0777.
Thus, the EUR/USD area formed by these lines could present challenges to the developing bearish trend.
Trade over 50 forex markets 24 hours a day with FXOpen. Take advantage of low commissions, deep liquidity, and spreads from 0.0 pips. Open your FXOpen account now or learn more about trading forex with FXOpen.
CFDs are complex instruments and come with a high risk of losing your money.
This article represents the opinion of the Companies operating under the FXOpen brand only. It is not to be construed as an offer, solicitation, or recommendation with respect to products and services provided by the Companies operating under the FXOpen brand, nor is it to be considered financial advice.
👍2
#NFLX #netflix #stockmarket #stocktrading #marketanalysis
Netflix (NFLX) Shares Hit Record High in Aggressive Move
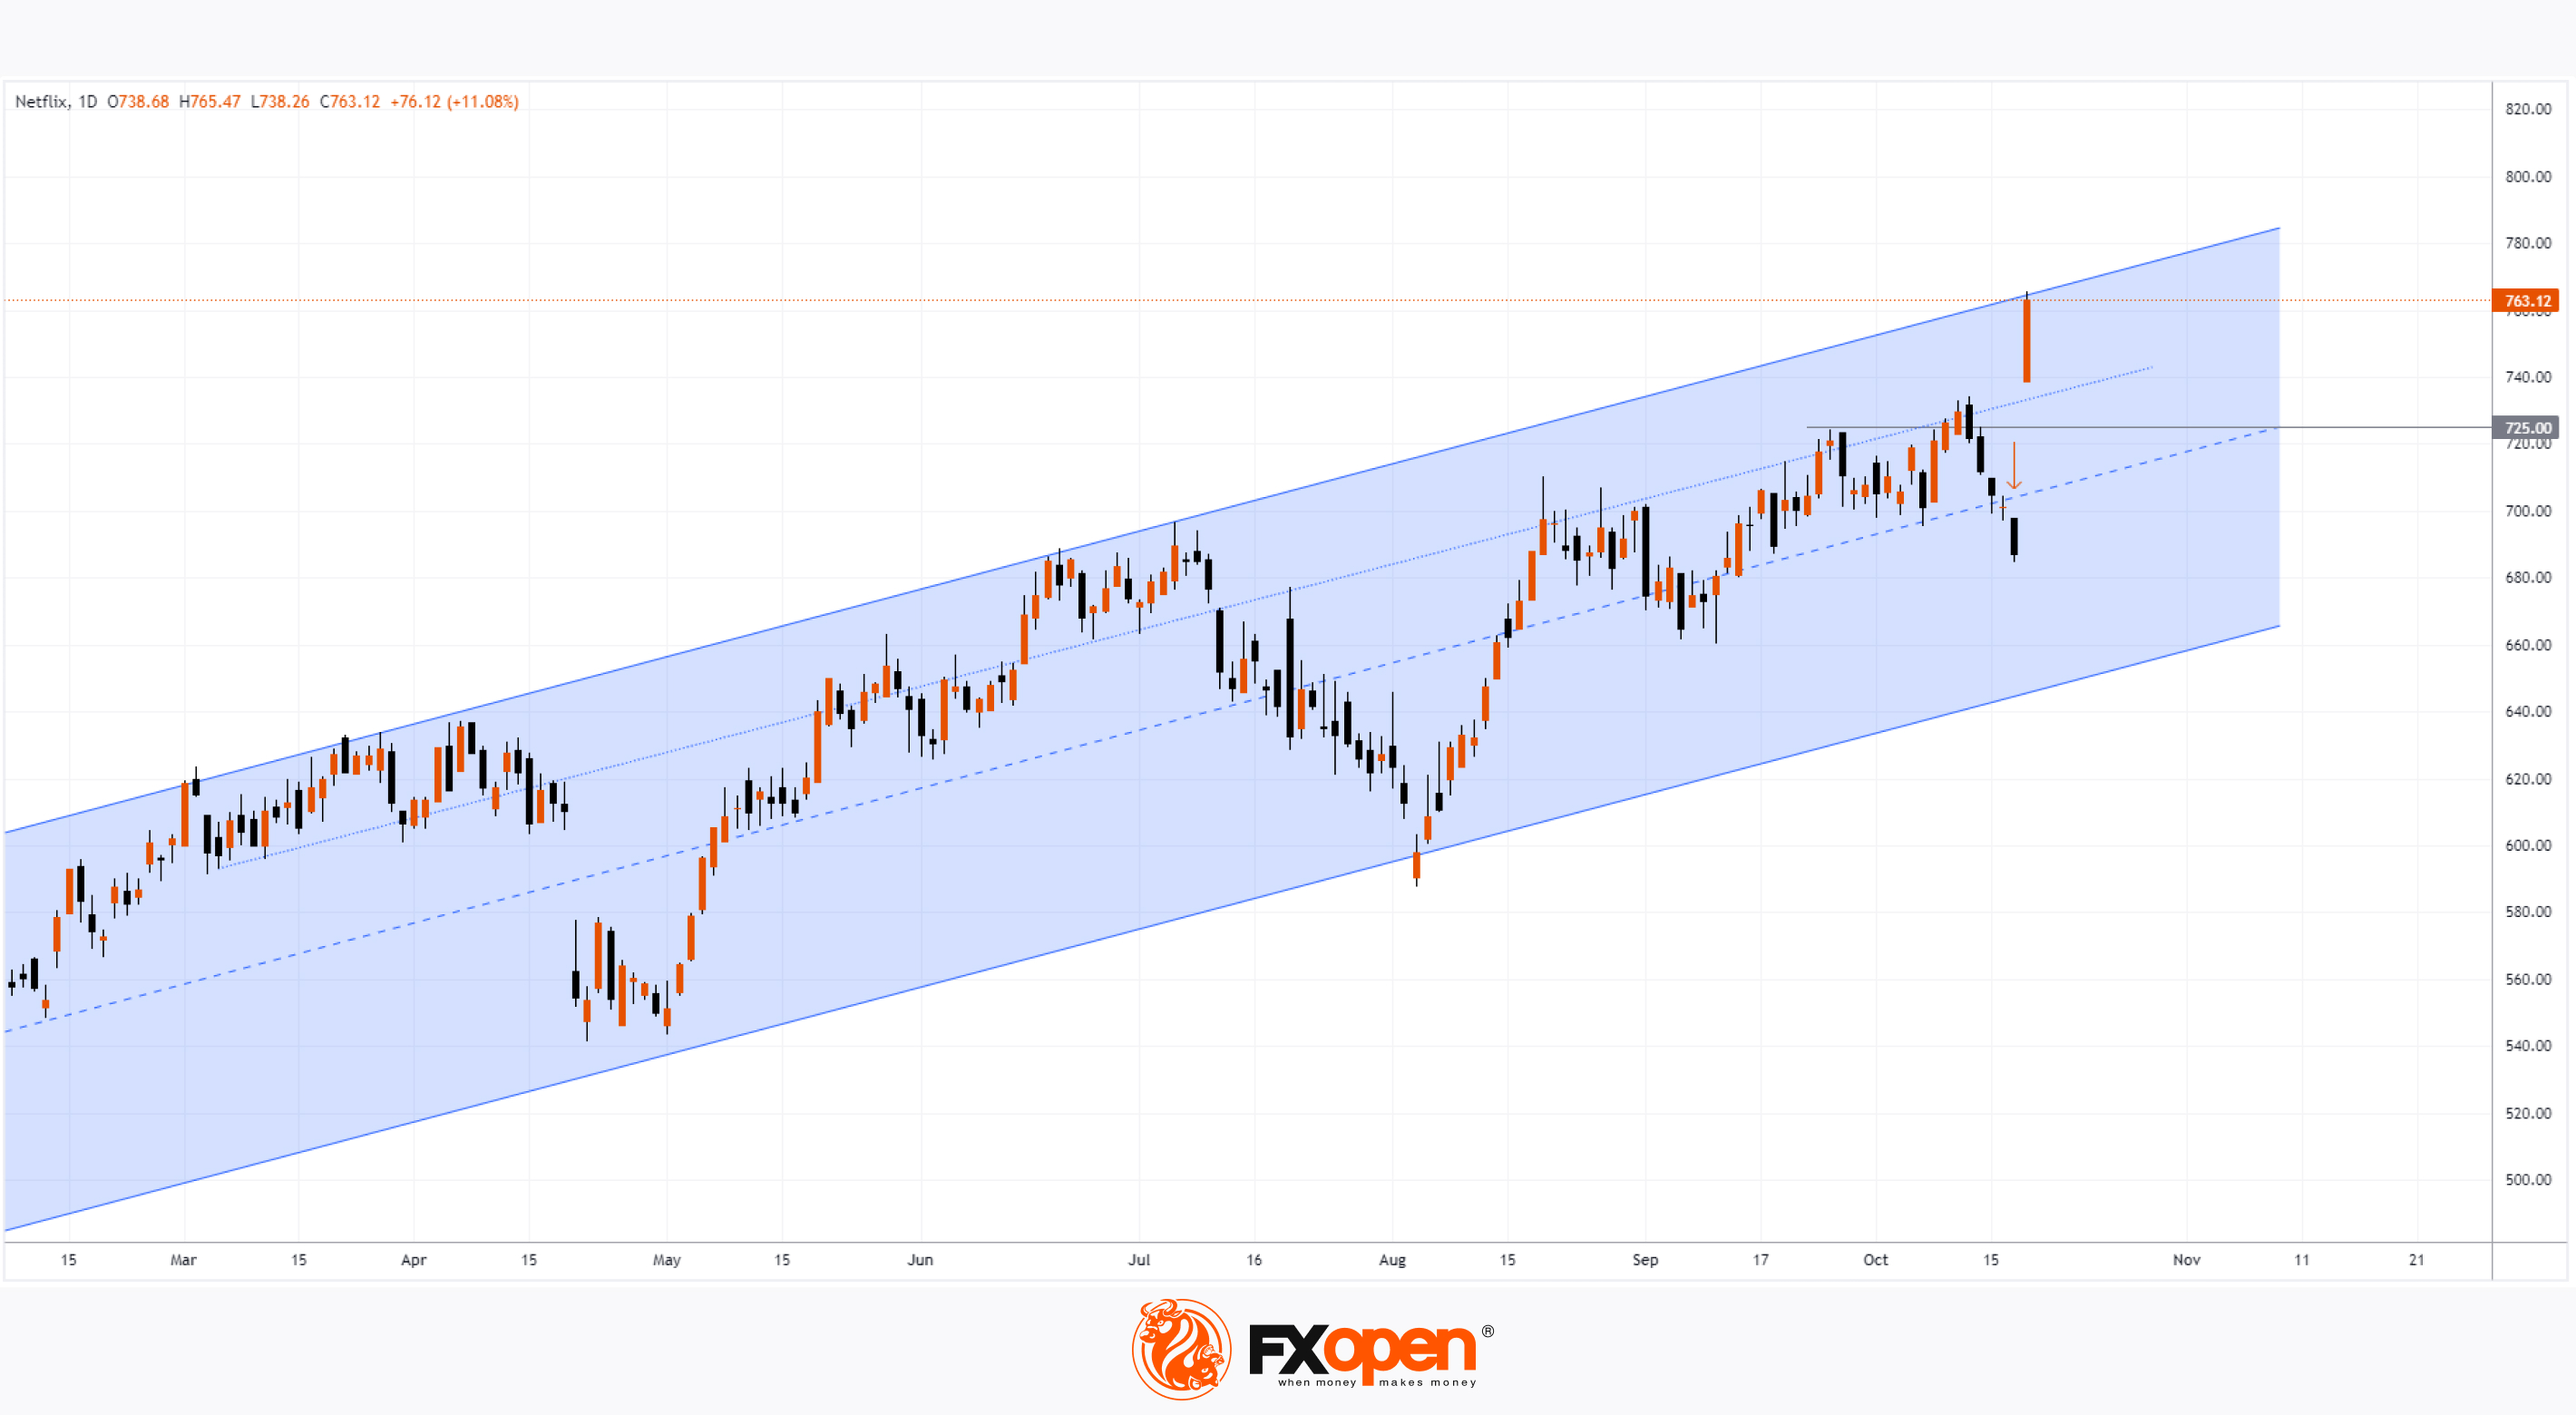
Netflix (NFLX) shares reached a record high in a dynamic move. As shown in Netflix's stock chart, the price hit an all-time peak, with Friday’s candle closing above $760. This follows an aggressive rebound, given that on Thursday, the price had fallen below the psychological level of $700.
This sharp move created a significant bullish gap, with the difference between Thursday’s and Friday’s closing prices exceeding 11%. The catalyst for this surge in volatility was the release of Netflix's strong third-quarter results:
→ Earnings per share: Actual = $5.40, Expected = $5.11;
→ Gross revenue: Actual = $9.82 billion, Expected = $9.77 billion. Netflix also forecast a 15% growth in Q4 2024;
→ Free cash flow increased from $1.213 billion in Q2 to $2.194 billion in Q3.
A technical analysis of Netflix's stock shows a steady upward channel throughout 2024 (depicted in blue). Thursday's drop (marked with an arrow) appears to have been a bear trap, as the chart demonstrates the potential risk of short positions, which were anticipating a drop below the $700 mark into the lower half of the upward channel.
It is notable that NFLX has now reached the upper boundary of this channel. This may prompt investors to lock in profits, potentially slowing the bullish momentum seen late last week.
If a correction occurs, potential support could be found at:
→ Psychological levels of $725 and $750;
→ The mid-line dividing the upper half of the channel into two quarters (indicated by dotted lines).
Trade global index CFDs with zero commission and tight spreads. Open your FXOpen account now or learn more about trading index CFDs with FXOpen.
CFDs are complex instruments and come with a high risk of losing your money.
This article represents the opinion of the Companies operating under the FXOpen brand only. It is not to be construed as an offer, solicitation, or recommendation with respect to products and services provided by the Companies operating under the FXOpen brand, nor is it to be considered financial advice.
Netflix (NFLX) Shares Hit Record High in Aggressive Move
Netflix (NFLX) shares reached a record high in a dynamic move. As shown in Netflix's stock chart, the price hit an all-time peak, with Friday’s candle closing above $760. This follows an aggressive rebound, given that on Thursday, the price had fallen below the psychological level of $700.
This sharp move created a significant bullish gap, with the difference between Thursday’s and Friday’s closing prices exceeding 11%. The catalyst for this surge in volatility was the release of Netflix's strong third-quarter results:
→ Earnings per share: Actual = $5.40, Expected = $5.11;
→ Gross revenue: Actual = $9.82 billion, Expected = $9.77 billion. Netflix also forecast a 15% growth in Q4 2024;
→ Free cash flow increased from $1.213 billion in Q2 to $2.194 billion in Q3.
A technical analysis of Netflix's stock shows a steady upward channel throughout 2024 (depicted in blue). Thursday's drop (marked with an arrow) appears to have been a bear trap, as the chart demonstrates the potential risk of short positions, which were anticipating a drop below the $700 mark into the lower half of the upward channel.
It is notable that NFLX has now reached the upper boundary of this channel. This may prompt investors to lock in profits, potentially slowing the bullish momentum seen late last week.
If a correction occurs, potential support could be found at:
→ Psychological levels of $725 and $750;
→ The mid-line dividing the upper half of the channel into two quarters (indicated by dotted lines).
Trade global index CFDs with zero commission and tight spreads. Open your FXOpen account now or learn more about trading index CFDs with FXOpen.
CFDs are complex instruments and come with a high risk of losing your money.
This article represents the opinion of the Companies operating under the FXOpen brand only. It is not to be construed as an offer, solicitation, or recommendation with respect to products and services provided by the Companies operating under the FXOpen brand, nor is it to be considered financial advice.
👍2
#nvidia #NVDA #stockmarket #stocktrading #MarketUpdates
Nvidia Shares (NVDA) Close Above $140 for the First Time
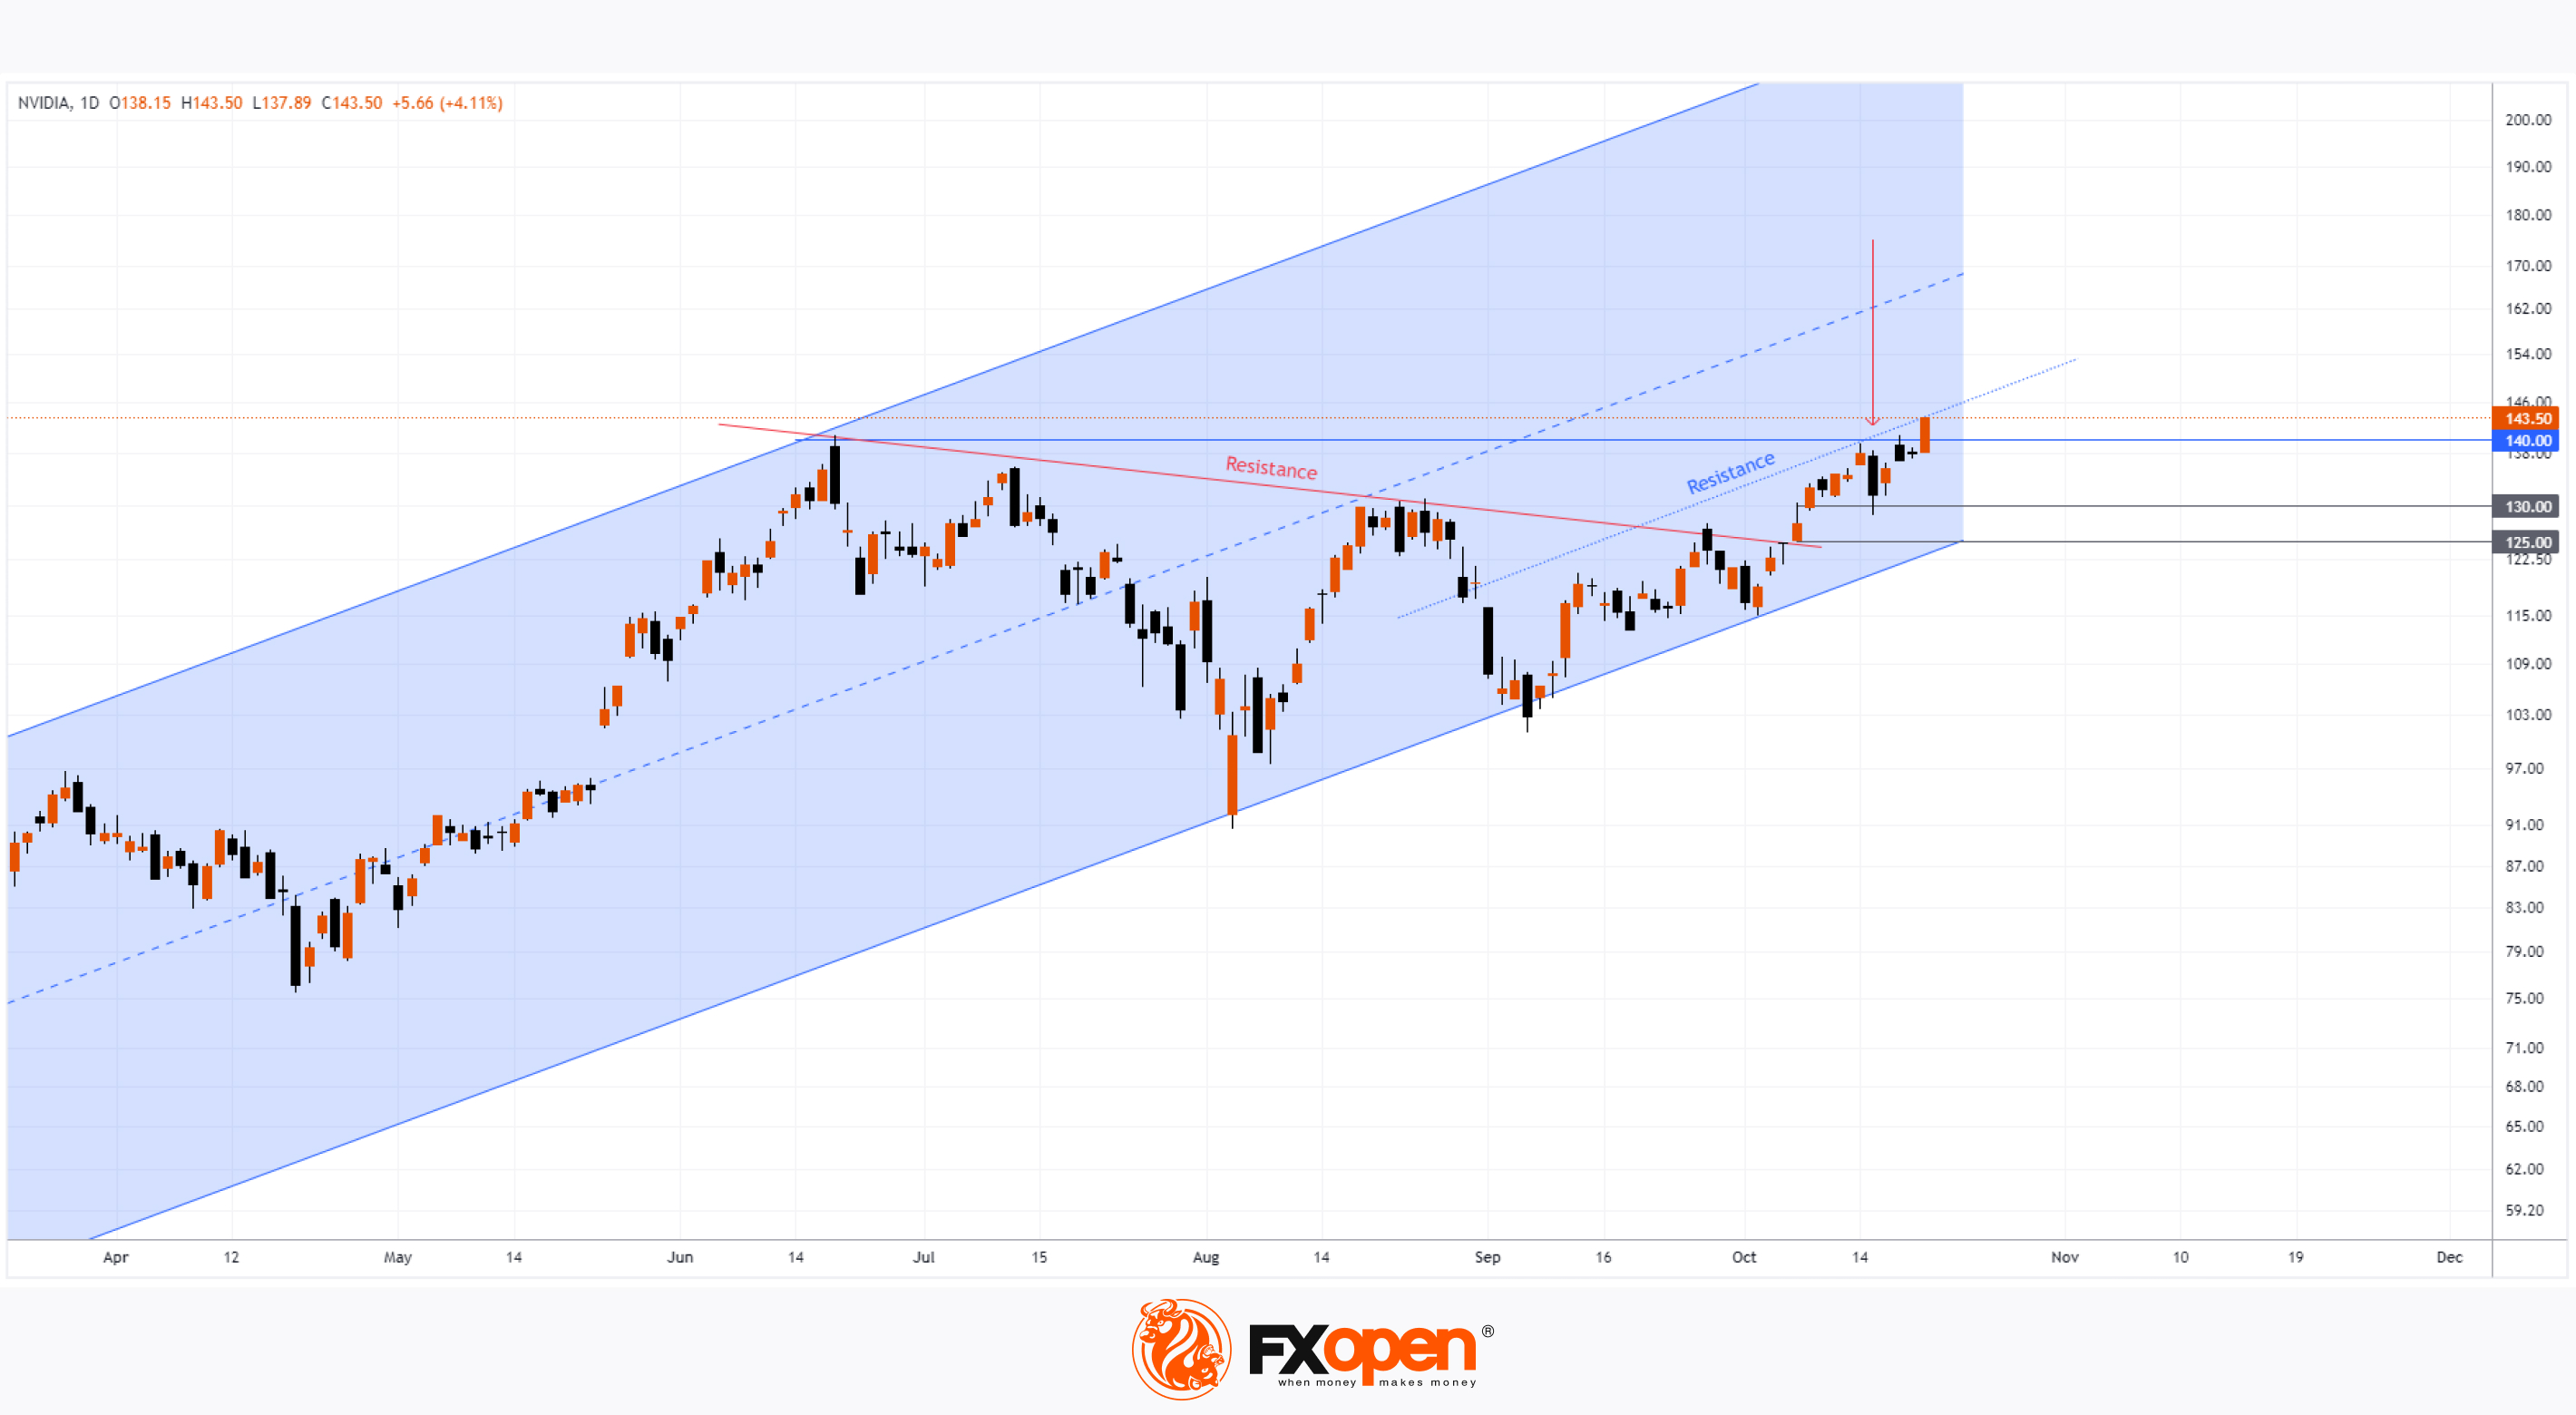
As shown on the Nvidia (NVDA) stock chart, yesterday’s candle closed above the psychological level of $140 for the first time in history. This represents a price increase of over 186% since the beginning of 2024 and more than a ninefold rise since early 2023, following the launch of ChatGPT.
According to Benzinga:
→ Nvidia's shares continue to benefit from the surging demand for AI technologies, with hyperscalers buying its graphic chips in vast quantities to rapidly build data centres with advanced AI capabilities.
→ Nvidia’s CEO, Jensen Huang, has stated that the next-generation Blackwell GPU platform is in "insane" demand. Despite production being in full swing, the demand remains extraordinarily high.
On 16 October, while analysing Nvidia’s chart, we highlighted an upward channel (marked in blue) and noted the sharp reversal from the $140 level (indicated by a red arrow). However, we anticipated support from the area linked to the strong bullish candle from 7 October. This is because:
→ The psychological levels of $130 and $125 are located here.
→ This zone showed strong demand by breaking through a four-month resistance line (red), which may now act as support.
→ There’s also a bullish Fair Value Gap on the daily chart.
Our predictions of a record high following a rebound from the $125-$130 support area were accurate, but what lies ahead?
Last week, BofA Securities analyst Vivek Arya maintained a "Buy" rating for Nvidia, raising the target price from $165 to $190 after upgrading profit forecasts for 2025 and 2026. Arya particularly noted Taiwan Semiconductor Manufacturing Company Ltd.’s strong earnings.
Indeed, the robust fundamentals suggest the upward trend (in blue) could continue, possibly leading the price along the blue Resistance line, which divides the lower half of the channel into two equal parts.
Volatility spikes in the near future could be triggered by earnings reports from Nvidia’s clients this month, including Alphabet (GOOGL), Meta Platforms (META), and Microsoft (MSFT). Nvidia's own earnings report is due on 14 November.
Trade global index CFDs with zero commission and tight spreads. Open your FXOpen account now or learn more about trading index CFDs with FXOpen.
CFDs are complex instruments and come with a high risk of losing your money.
This article represents the opinion of the Companies operating under the FXOpen brand only. It is not to be construed as an offer, solicitation, or recommendation with respect to products and services provided by the Companies operating under the FXOpen brand, nor is it to be considered financial advice.
Nvidia Shares (NVDA) Close Above $140 for the First Time
As shown on the Nvidia (NVDA) stock chart, yesterday’s candle closed above the psychological level of $140 for the first time in history. This represents a price increase of over 186% since the beginning of 2024 and more than a ninefold rise since early 2023, following the launch of ChatGPT.
According to Benzinga:
→ Nvidia's shares continue to benefit from the surging demand for AI technologies, with hyperscalers buying its graphic chips in vast quantities to rapidly build data centres with advanced AI capabilities.
→ Nvidia’s CEO, Jensen Huang, has stated that the next-generation Blackwell GPU platform is in "insane" demand. Despite production being in full swing, the demand remains extraordinarily high.
On 16 October, while analysing Nvidia’s chart, we highlighted an upward channel (marked in blue) and noted the sharp reversal from the $140 level (indicated by a red arrow). However, we anticipated support from the area linked to the strong bullish candle from 7 October. This is because:
→ The psychological levels of $130 and $125 are located here.
→ This zone showed strong demand by breaking through a four-month resistance line (red), which may now act as support.
→ There’s also a bullish Fair Value Gap on the daily chart.
Our predictions of a record high following a rebound from the $125-$130 support area were accurate, but what lies ahead?
Last week, BofA Securities analyst Vivek Arya maintained a "Buy" rating for Nvidia, raising the target price from $165 to $190 after upgrading profit forecasts for 2025 and 2026. Arya particularly noted Taiwan Semiconductor Manufacturing Company Ltd.’s strong earnings.
Indeed, the robust fundamentals suggest the upward trend (in blue) could continue, possibly leading the price along the blue Resistance line, which divides the lower half of the channel into two equal parts.
Volatility spikes in the near future could be triggered by earnings reports from Nvidia’s clients this month, including Alphabet (GOOGL), Meta Platforms (META), and Microsoft (MSFT). Nvidia's own earnings report is due on 14 November.
Trade global index CFDs with zero commission and tight spreads. Open your FXOpen account now or learn more about trading index CFDs with FXOpen.
CFDs are complex instruments and come with a high risk of losing your money.
This article represents the opinion of the Companies operating under the FXOpen brand only. It is not to be construed as an offer, solicitation, or recommendation with respect to products and services provided by the Companies operating under the FXOpen brand, nor is it to be considered financial advice.
👍1
#silver #XAGUSD #marketanalysis #MarketUpdates
XAG/USD Analysis: Silver Price Approaching $35
Precious metal prices are fluctuating near multi-year highs due to safe-haven demand driven by:
→ Uncertainty surrounding the U.S. elections,
→ Ongoing tensions in the Middle East,
→ Expectations of central banks lowering interest rates.
As seen on the XAG/USD chart, silver prices:
→ Are near their highest levels in 12 years,
→ Are approaching the $35 mark,
→ Have risen by over 43% since the start of the year.
Technical analysis of the XAG/USD chart indicates that silver is following an upward trend (shown in a blue channel), with the current price near its median line. This suggests a potential balance between supply and demand, which could stabilise price fluctuations.
Key observations:
→ A red resistance line on the chart reflects a corrective phase within the blue channel.
→ Breaking through this resistance in September triggered a strong bullish impulse (marked by a blue arrow).
→ This impulse was so robust that it pushed the price above the psychological $30 level, turning it into support.
A similar pattern might emerge in the future. After another strong bullish move (marked by a second blue arrow), the $32.5 level could also become a support area.
Start trading commodities with tight spreads. Open your trading account now or learn more about trading commodity CFDs with FXOpen.
CFDs are complex instruments and come with a high risk of losing your money.
This article represents the opinion of the Companies operating under the FXOpen brand only. It is not to be construed as an offer, solicitation, or recommendation with respect to products and services provided by the Companies operating under the FXOpen brand, nor is it to be considered financial advice.
XAG/USD Analysis: Silver Price Approaching $35
Precious metal prices are fluctuating near multi-year highs due to safe-haven demand driven by:
→ Uncertainty surrounding the U.S. elections,
→ Ongoing tensions in the Middle East,
→ Expectations of central banks lowering interest rates.
As seen on the XAG/USD chart, silver prices:
→ Are near their highest levels in 12 years,
→ Are approaching the $35 mark,
→ Have risen by over 43% since the start of the year.
Technical analysis of the XAG/USD chart indicates that silver is following an upward trend (shown in a blue channel), with the current price near its median line. This suggests a potential balance between supply and demand, which could stabilise price fluctuations.
Key observations:
→ A red resistance line on the chart reflects a corrective phase within the blue channel.
→ Breaking through this resistance in September triggered a strong bullish impulse (marked by a blue arrow).
→ This impulse was so robust that it pushed the price above the psychological $30 level, turning it into support.
A similar pattern might emerge in the future. After another strong bullish move (marked by a second blue arrow), the $32.5 level could also become a support area.
Start trading commodities with tight spreads. Open your trading account now or learn more about trading commodity CFDs with FXOpen.
CFDs are complex instruments and come with a high risk of losing your money.
This article represents the opinion of the Companies operating under the FXOpen brand only. It is not to be construed as an offer, solicitation, or recommendation with respect to products and services provided by the Companies operating under the FXOpen brand, nor is it to be considered financial advice.
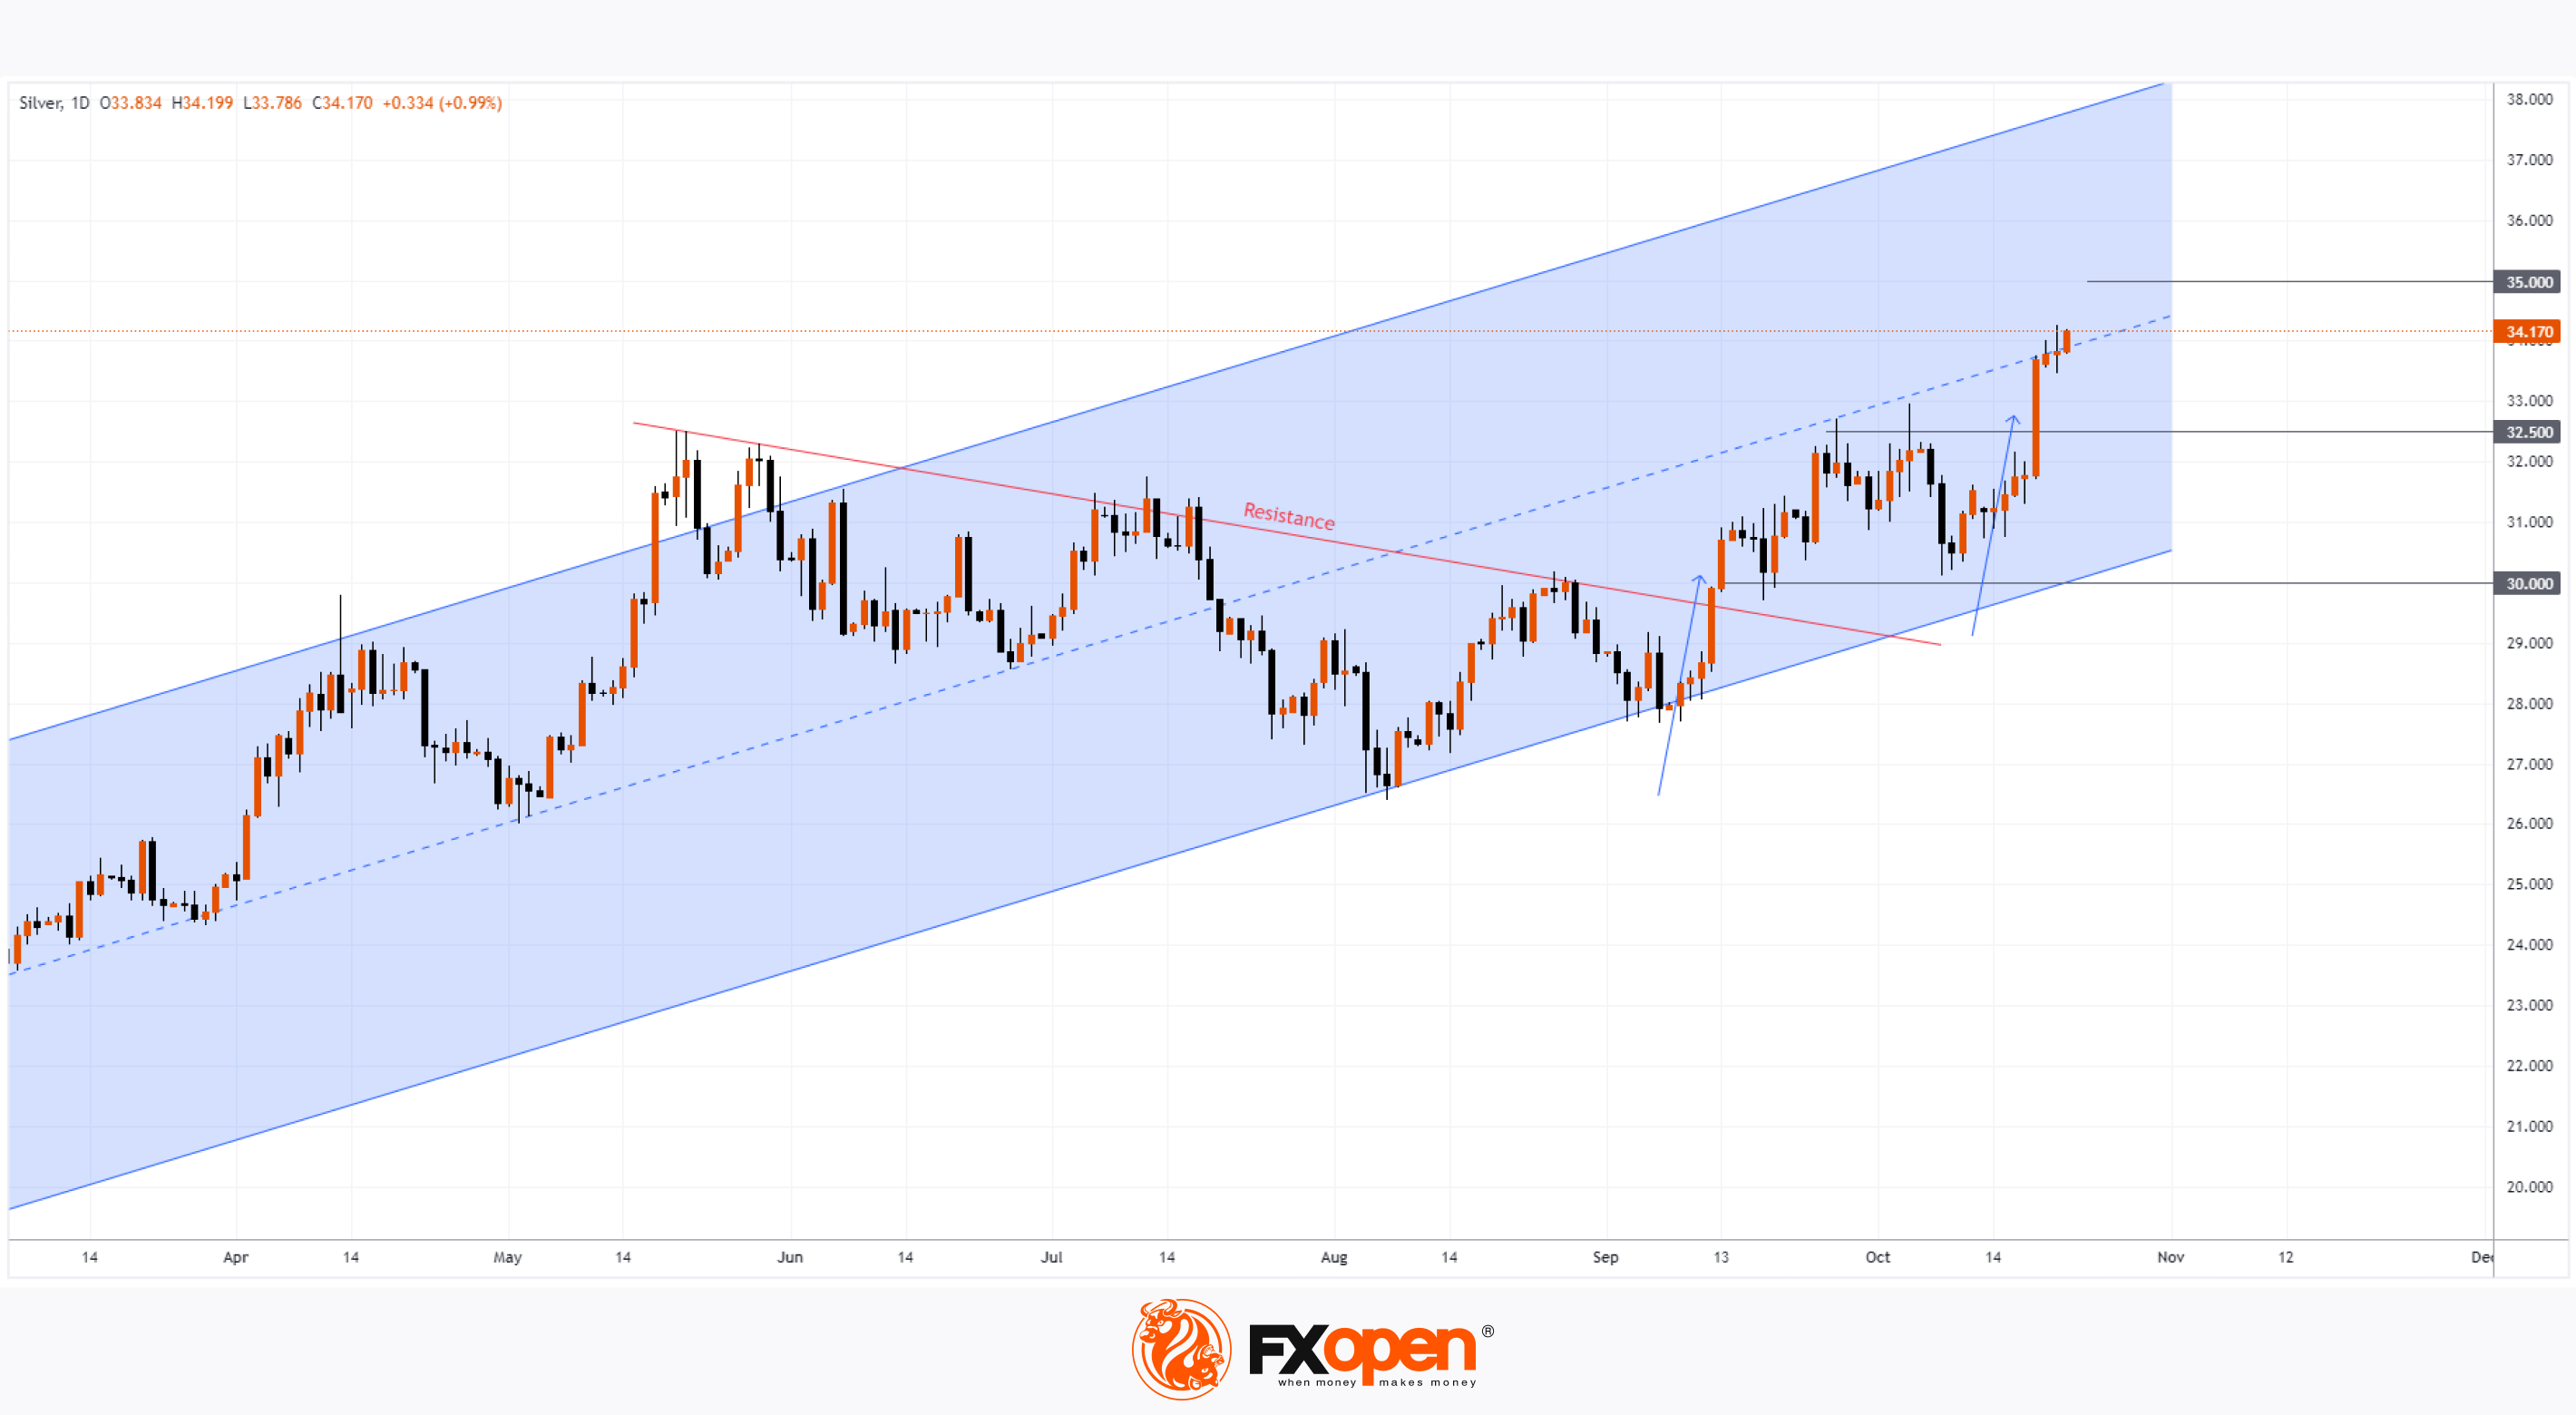
👍2
#nikkei225 #stockmarket #stocktrading #MarketUpdates
Nikkei 225: Resuming Decline?
In mid-October, the Nikkei 225 index (Japan 225 on FXOpen) attempted to breach the psychological barrier of 40,000 points but ultimately failed, reversing its course downwards.
This week, the index has continued its downward trend, driven by concerns surrounding the upcoming elections for Japan's House of Representatives scheduled for October 27. According to Reuters, the ruling Liberal Democratic Party (LDP) and its coalition partner, Komeito, may lose their majority in the elections.
Meanwhile, technical analysis of the Nikkei 225 (Japan 225 on FXOpen) chart reveals several bearish indicators:
→ The lower bounds of both the previously active blue and purple ascending channels have acted as resistance, along with the noted 40,000 level.
→ The price has broken below the ascending trend line (marked in red) around 39,000, suggesting that bears have gained enough strength to push through. Consequently, the 39,000 level may now serve as resistance.
Overall, the situation appears increasingly concerning. Could the rise from point V to C be merely a corrective move following the downward impulse from A to B? If so, a downward reversal from 40,000, coupled with a bearish breach of the trend line, could signal a resumption of the downtrend, potentially leading to a decline towards the 37,000 level, which has previously interacted with the price on multiple occasions.
Trade global index CFDs with zero commission and tight spreads. Open your FXOpen account now or learn more about trading index CFDs with FXOpen.
CFDs are complex instruments and come with a high risk of losing your money.
This article represents the opinion of the Companies operating under the FXOpen brand only. It is not to be construed as an offer, solicitation, or recommendation with respect to products and services provided by the Companies operating under the FXOpen brand, nor is it to be considered financial advice.
Nikkei 225: Resuming Decline?
In mid-October, the Nikkei 225 index (Japan 225 on FXOpen) attempted to breach the psychological barrier of 40,000 points but ultimately failed, reversing its course downwards.
This week, the index has continued its downward trend, driven by concerns surrounding the upcoming elections for Japan's House of Representatives scheduled for October 27. According to Reuters, the ruling Liberal Democratic Party (LDP) and its coalition partner, Komeito, may lose their majority in the elections.
Meanwhile, technical analysis of the Nikkei 225 (Japan 225 on FXOpen) chart reveals several bearish indicators:
→ The lower bounds of both the previously active blue and purple ascending channels have acted as resistance, along with the noted 40,000 level.
→ The price has broken below the ascending trend line (marked in red) around 39,000, suggesting that bears have gained enough strength to push through. Consequently, the 39,000 level may now serve as resistance.
Overall, the situation appears increasingly concerning. Could the rise from point V to C be merely a corrective move following the downward impulse from A to B? If so, a downward reversal from 40,000, coupled with a bearish breach of the trend line, could signal a resumption of the downtrend, potentially leading to a decline towards the 37,000 level, which has previously interacted with the price on multiple occasions.
Trade global index CFDs with zero commission and tight spreads. Open your FXOpen account now or learn more about trading index CFDs with FXOpen.
CFDs are complex instruments and come with a high risk of losing your money.
This article represents the opinion of the Companies operating under the FXOpen brand only. It is not to be construed as an offer, solicitation, or recommendation with respect to products and services provided by the Companies operating under the FXOpen brand, nor is it to be considered financial advice.
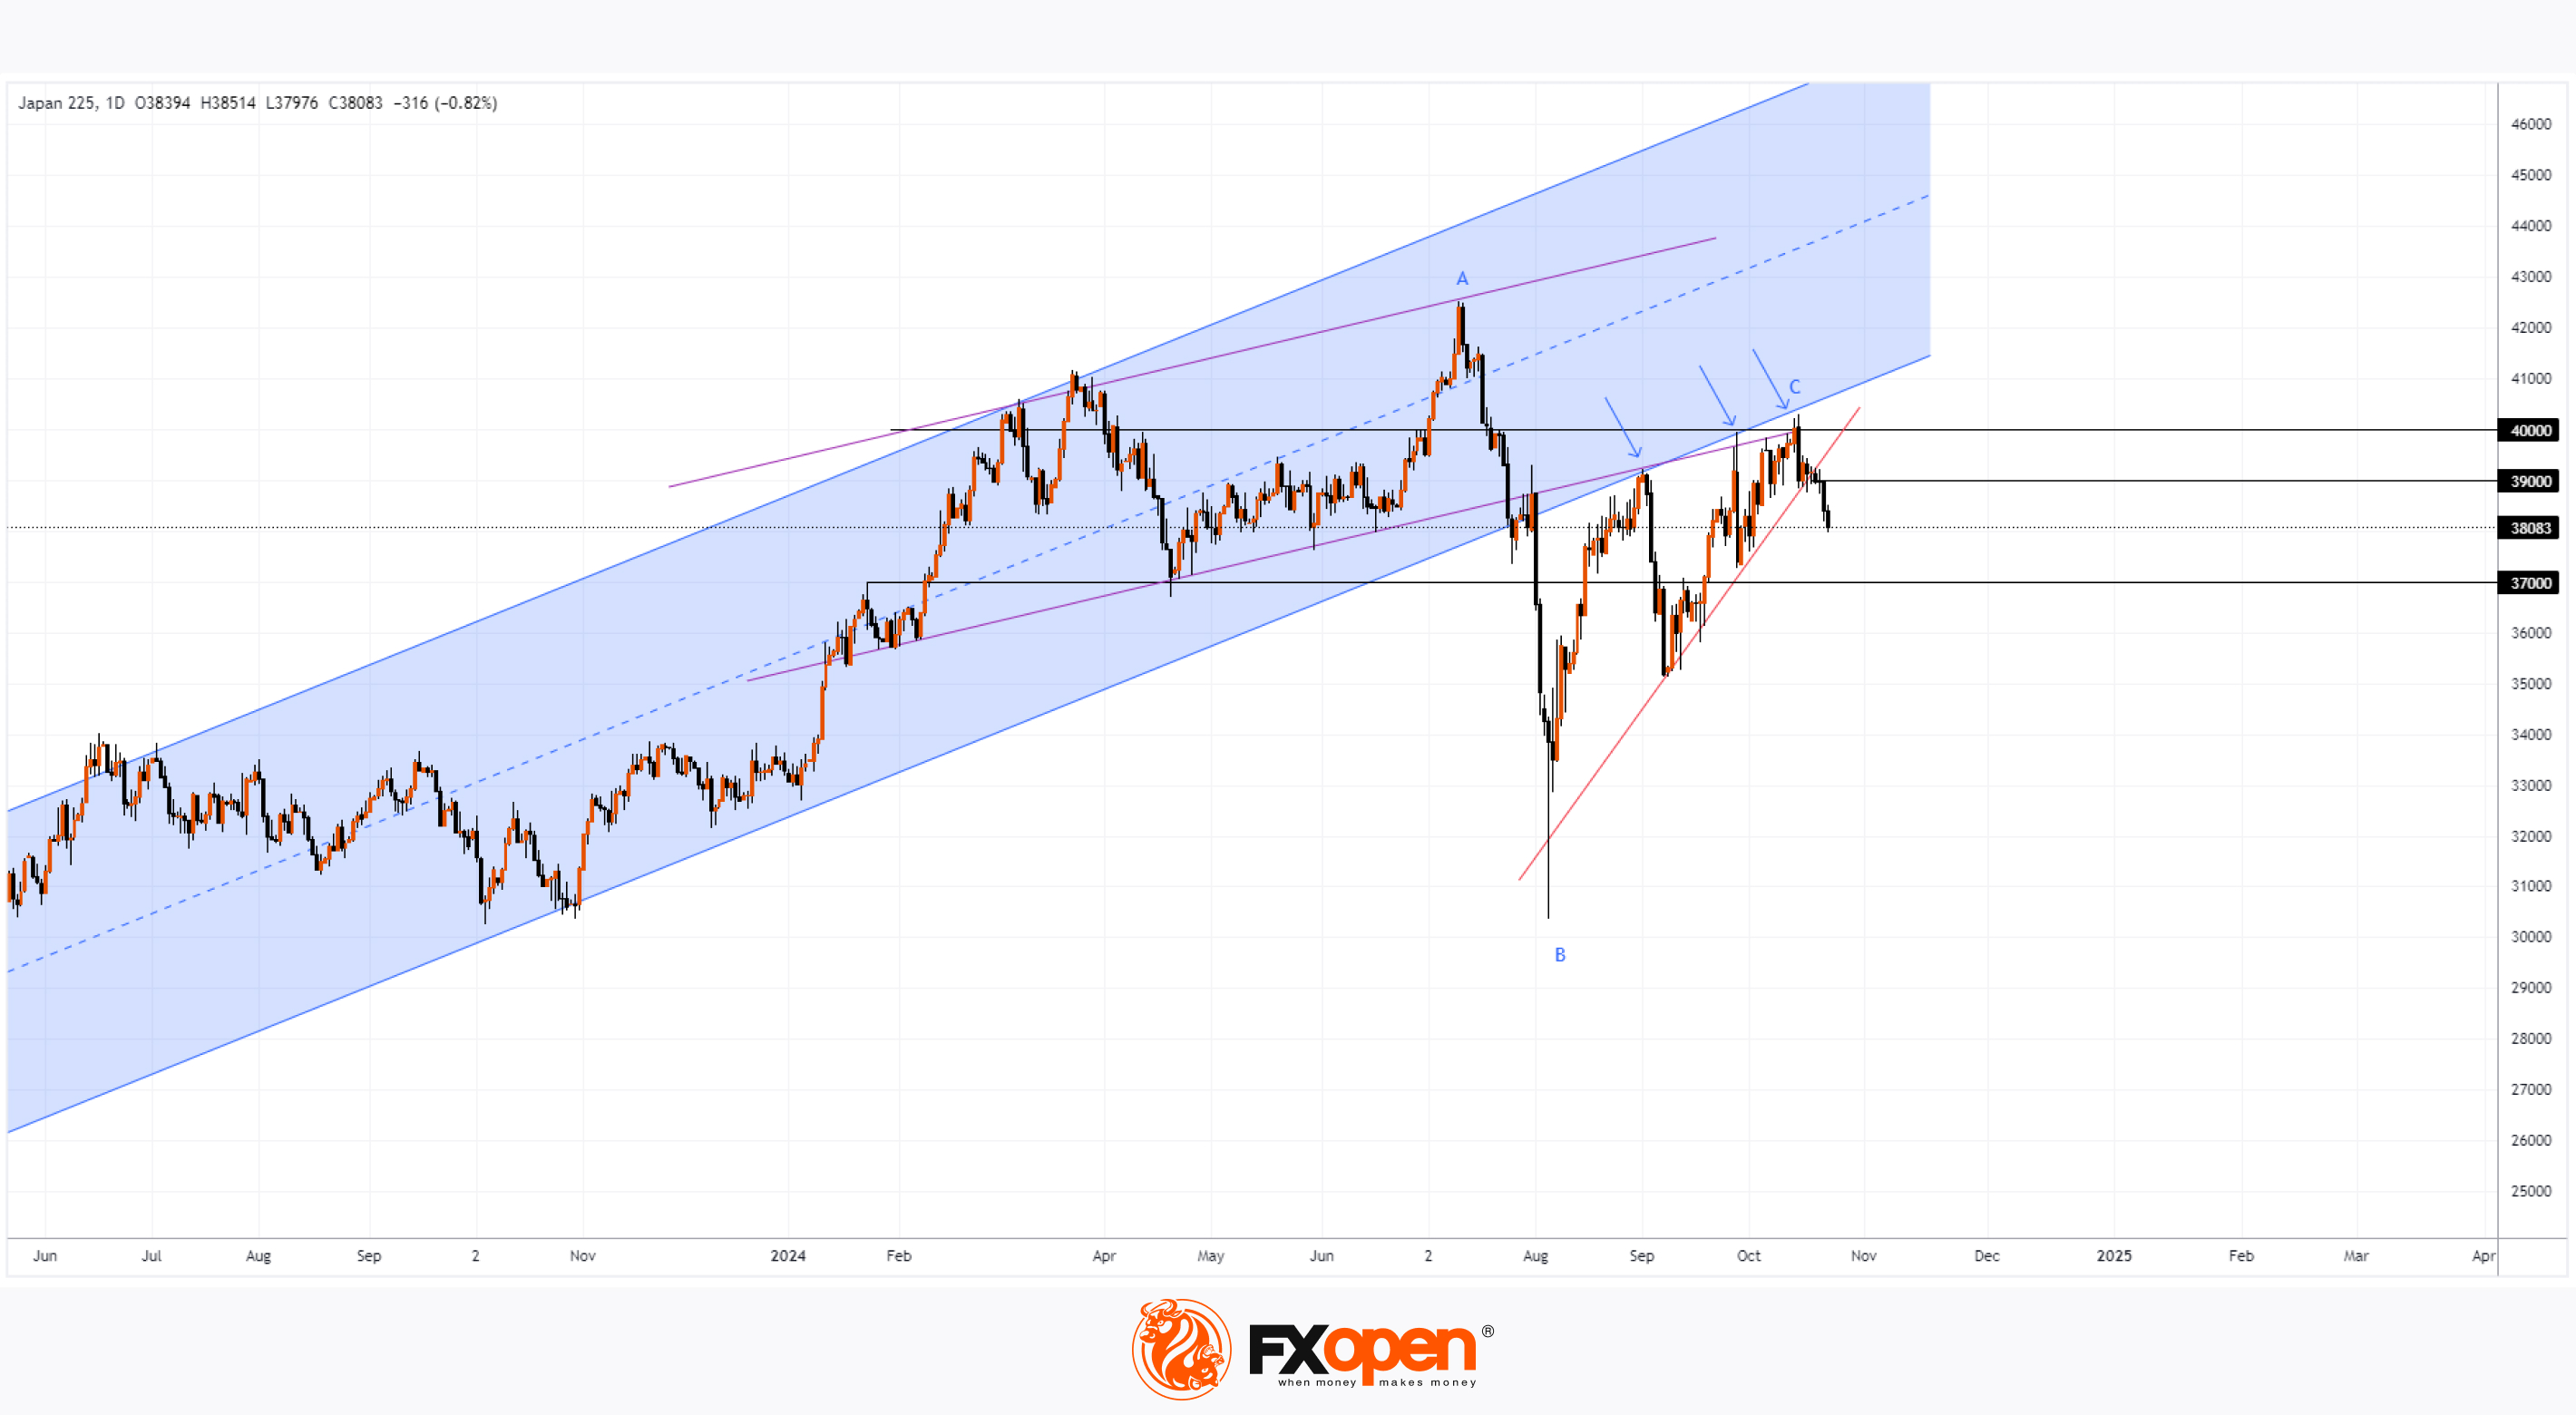
👍2