
#stockmarket #stocktrading #marketanalysis #MarketNews
Adobe (ADBE) Shares Plunge, Holding Near 22-Month Lows
Last week, Adobe Inc. (ADBE) reported its quarterly financial results:
→ Earnings per share: Actual = $5.08, Expected = $4.97
→ Gross revenue: Actual = $5.71 billion, Expected = $5.66 billion
Additionally, according to CNBC, the design software giant announced plans to double its AI revenue by the end of the financial year. However, despite these positive figures, Adobe Inc. (ADBE) shares plummeted by approximately 13%, returning to price levels last seen in May 2023.
This decline may reflect investor concerns over Adobe’s AI monetisation strategy and the potential loss of its competitive edge in generative AI.
Technical Analysis of Adobe Inc. (ADBE) Shares
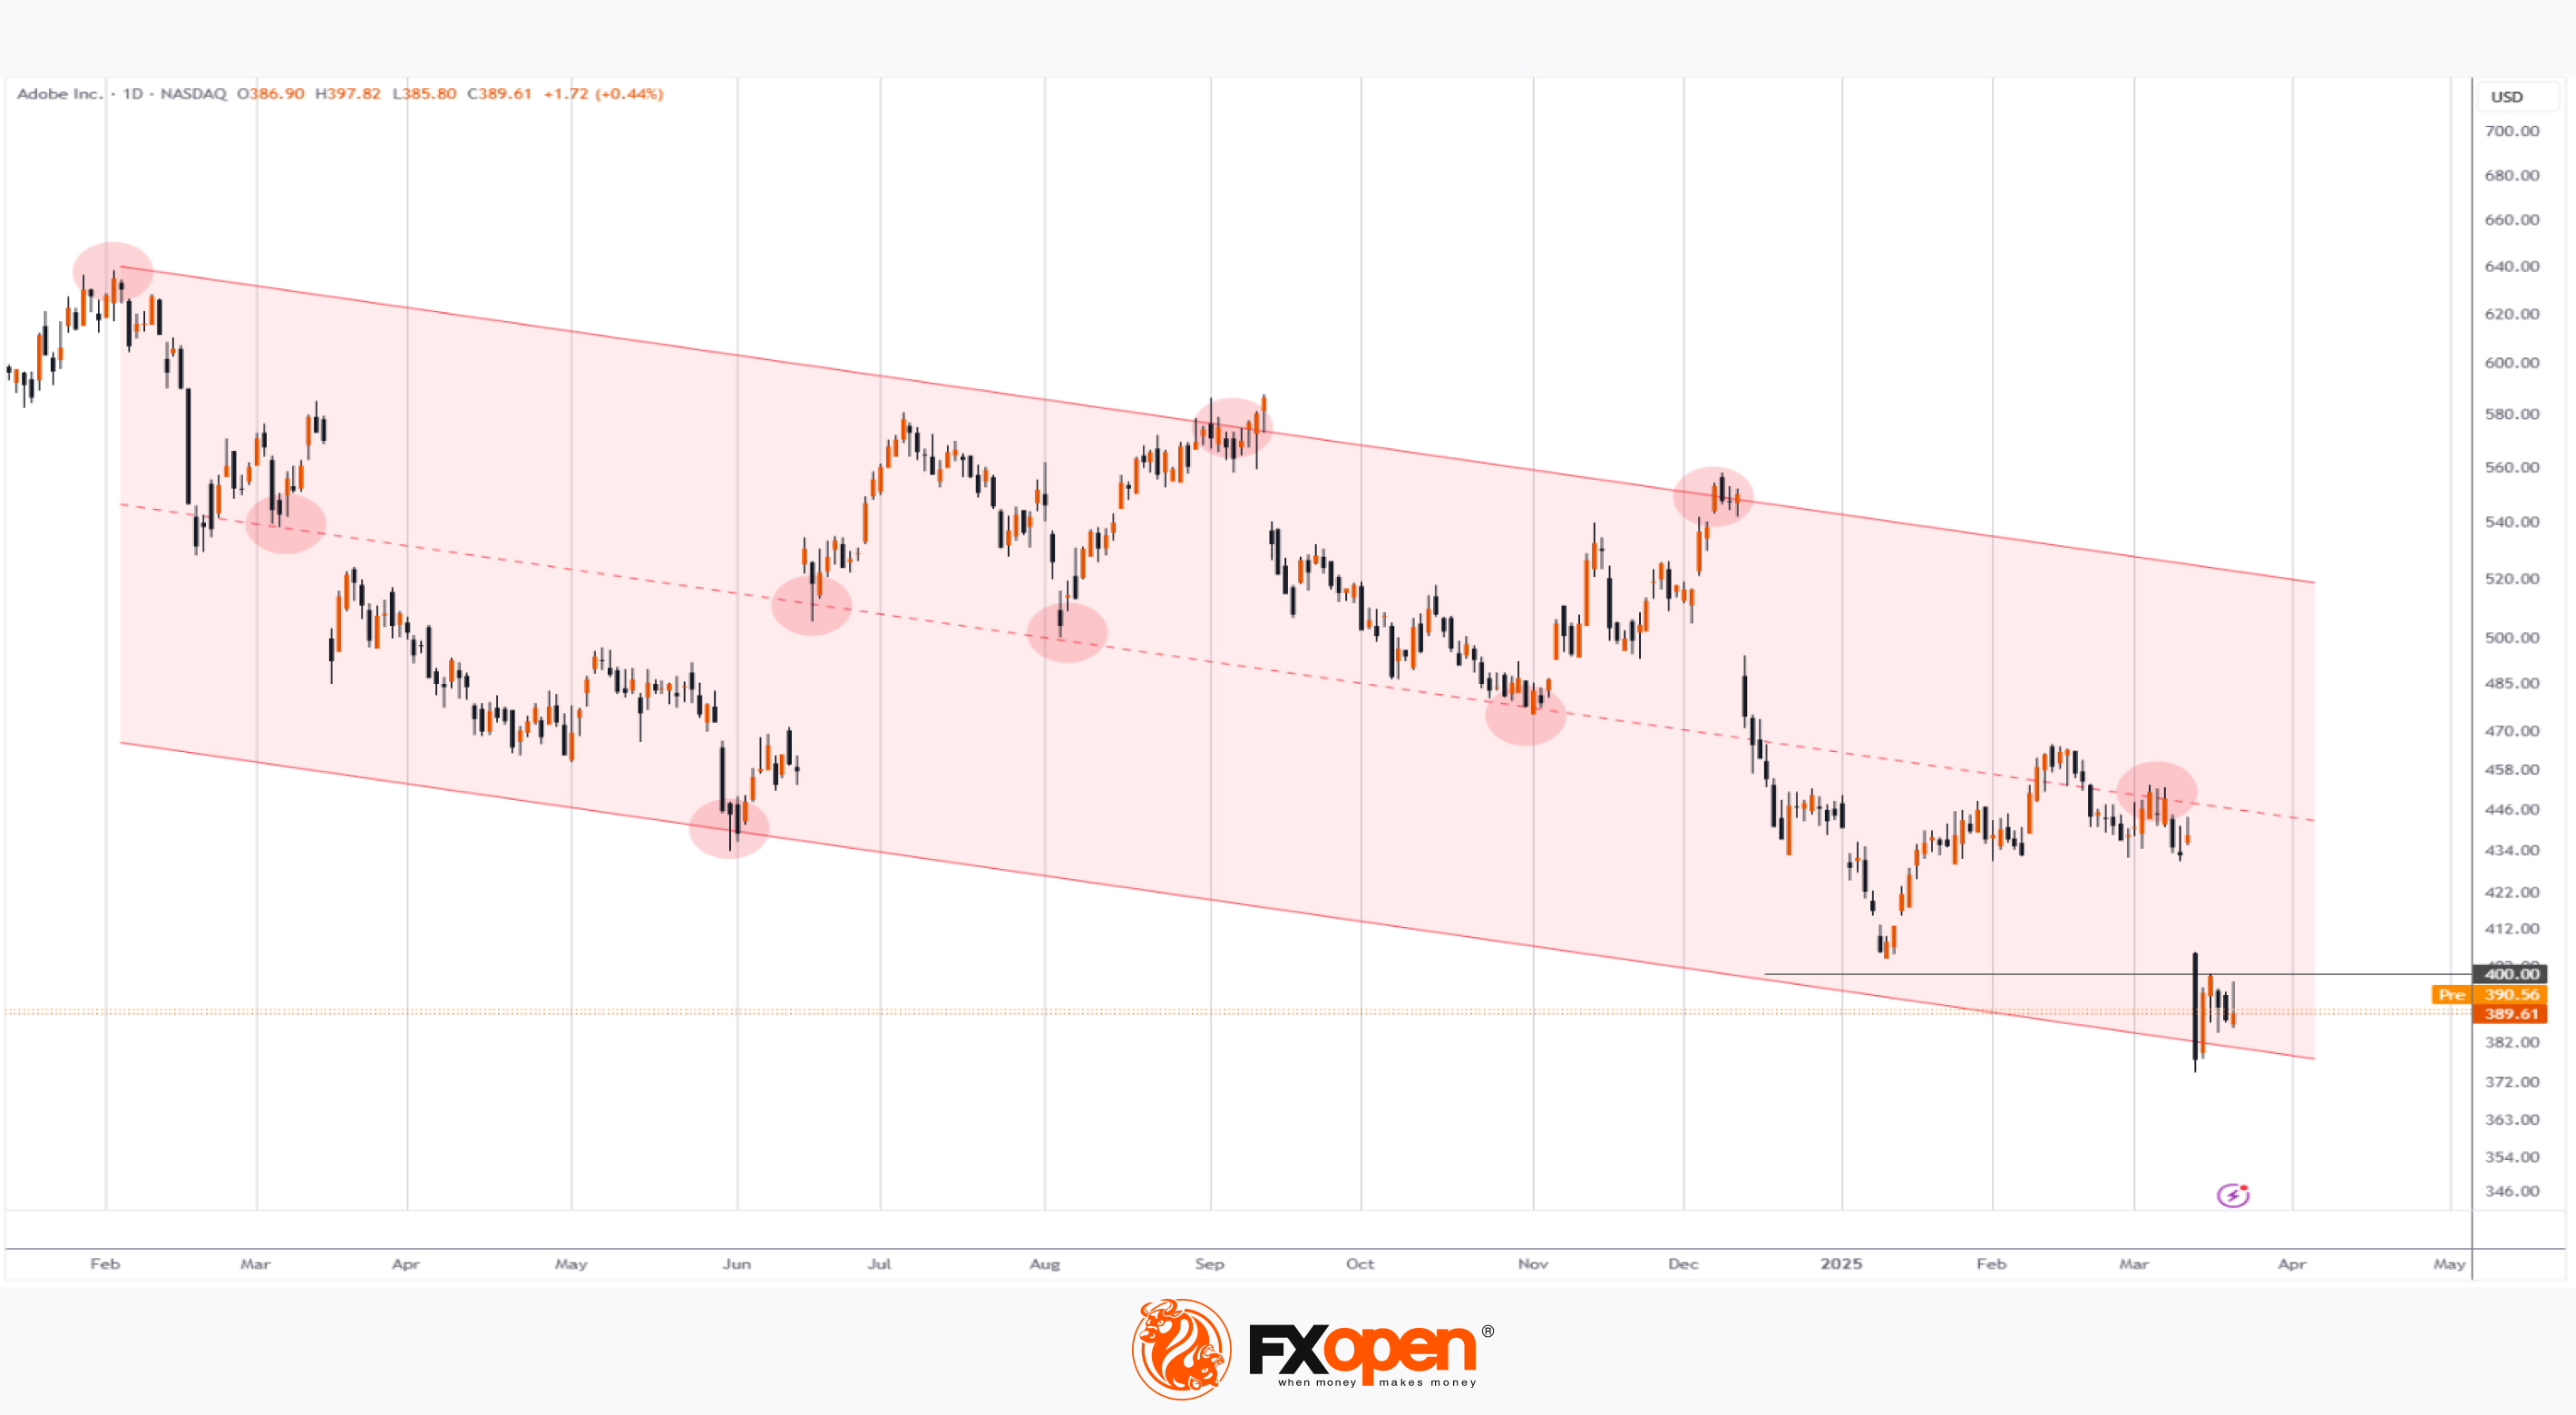
Price movements have established key points (marked with circles) forming a downward channel, which has remained relevant for over a year:
→ The price has fallen to the lower boundary, which previously acted as support in June 2024.
→ It remains below the psychological level of $400 but has not dropped significantly further.
→ The price has not fallen below the 13 January low, recorded after the earnings report.
These factors suggest that demand is preventing further declines in ADBE shares. If positive catalysts emerge, buyers may attempt to push the price back above the $400 level, potentially opening the path towards the channel’s median.
Trade global index CFDs with zero commission and tight spreads. Open your FXOpen account now or learn more about trading index CFDs with FXOpen.
CFDs are complex instruments and come with a high risk of losing your money.
This article represents the opinion of the Companies operating under the FXOpen brand only. It is not to be construed as an offer, solicitation, or recommendation with respect to products and services provided by the Companies operating under the FXOpen brand, nor is it to be considered financial advice.
Adobe (ADBE) Shares Plunge, Holding Near 22-Month Lows
Last week, Adobe Inc. (ADBE) reported its quarterly financial results:
→ Earnings per share: Actual = $5.08, Expected = $4.97
→ Gross revenue: Actual = $5.71 billion, Expected = $5.66 billion
Additionally, according to CNBC, the design software giant announced plans to double its AI revenue by the end of the financial year. However, despite these positive figures, Adobe Inc. (ADBE) shares plummeted by approximately 13%, returning to price levels last seen in May 2023.
This decline may reflect investor concerns over Adobe’s AI monetisation strategy and the potential loss of its competitive edge in generative AI.
Technical Analysis of Adobe Inc. (ADBE) Shares
Price movements have established key points (marked with circles) forming a downward channel, which has remained relevant for over a year:
→ The price has fallen to the lower boundary, which previously acted as support in June 2024.
→ It remains below the psychological level of $400 but has not dropped significantly further.
→ The price has not fallen below the 13 January low, recorded after the earnings report.
These factors suggest that demand is preventing further declines in ADBE shares. If positive catalysts emerge, buyers may attempt to push the price back above the $400 level, potentially opening the path towards the channel’s median.
Trade global index CFDs with zero commission and tight spreads. Open your FXOpen account now or learn more about trading index CFDs with FXOpen.
CFDs are complex instruments and come with a high risk of losing your money.
This article represents the opinion of the Companies operating under the FXOpen brand only. It is not to be construed as an offer, solicitation, or recommendation with respect to products and services provided by the Companies operating under the FXOpen brand, nor is it to be considered financial advice.
👍2
#oilprices #oilindustry #MarketUpdates #marketanalysis
XBR/USD Analysis: Price Near Resistance Zone
As seen on the XBR/USD chart, Brent crude oil prices are hovering near last week’s highs this morning as market participants assess various influencing factors, including:
→ New U.S. sanctions on Iran, which are limiting its export capacity and tightening global supply, particularly to China.
→ Ongoing negotiations between the U.S., Ukraine, and Russia in Saudi Arabia, which could potentially lead to increased Russian oil exports.
→ OPEC+ plans to raise oil production starting in April.
Technical Analysis of XBR/USD
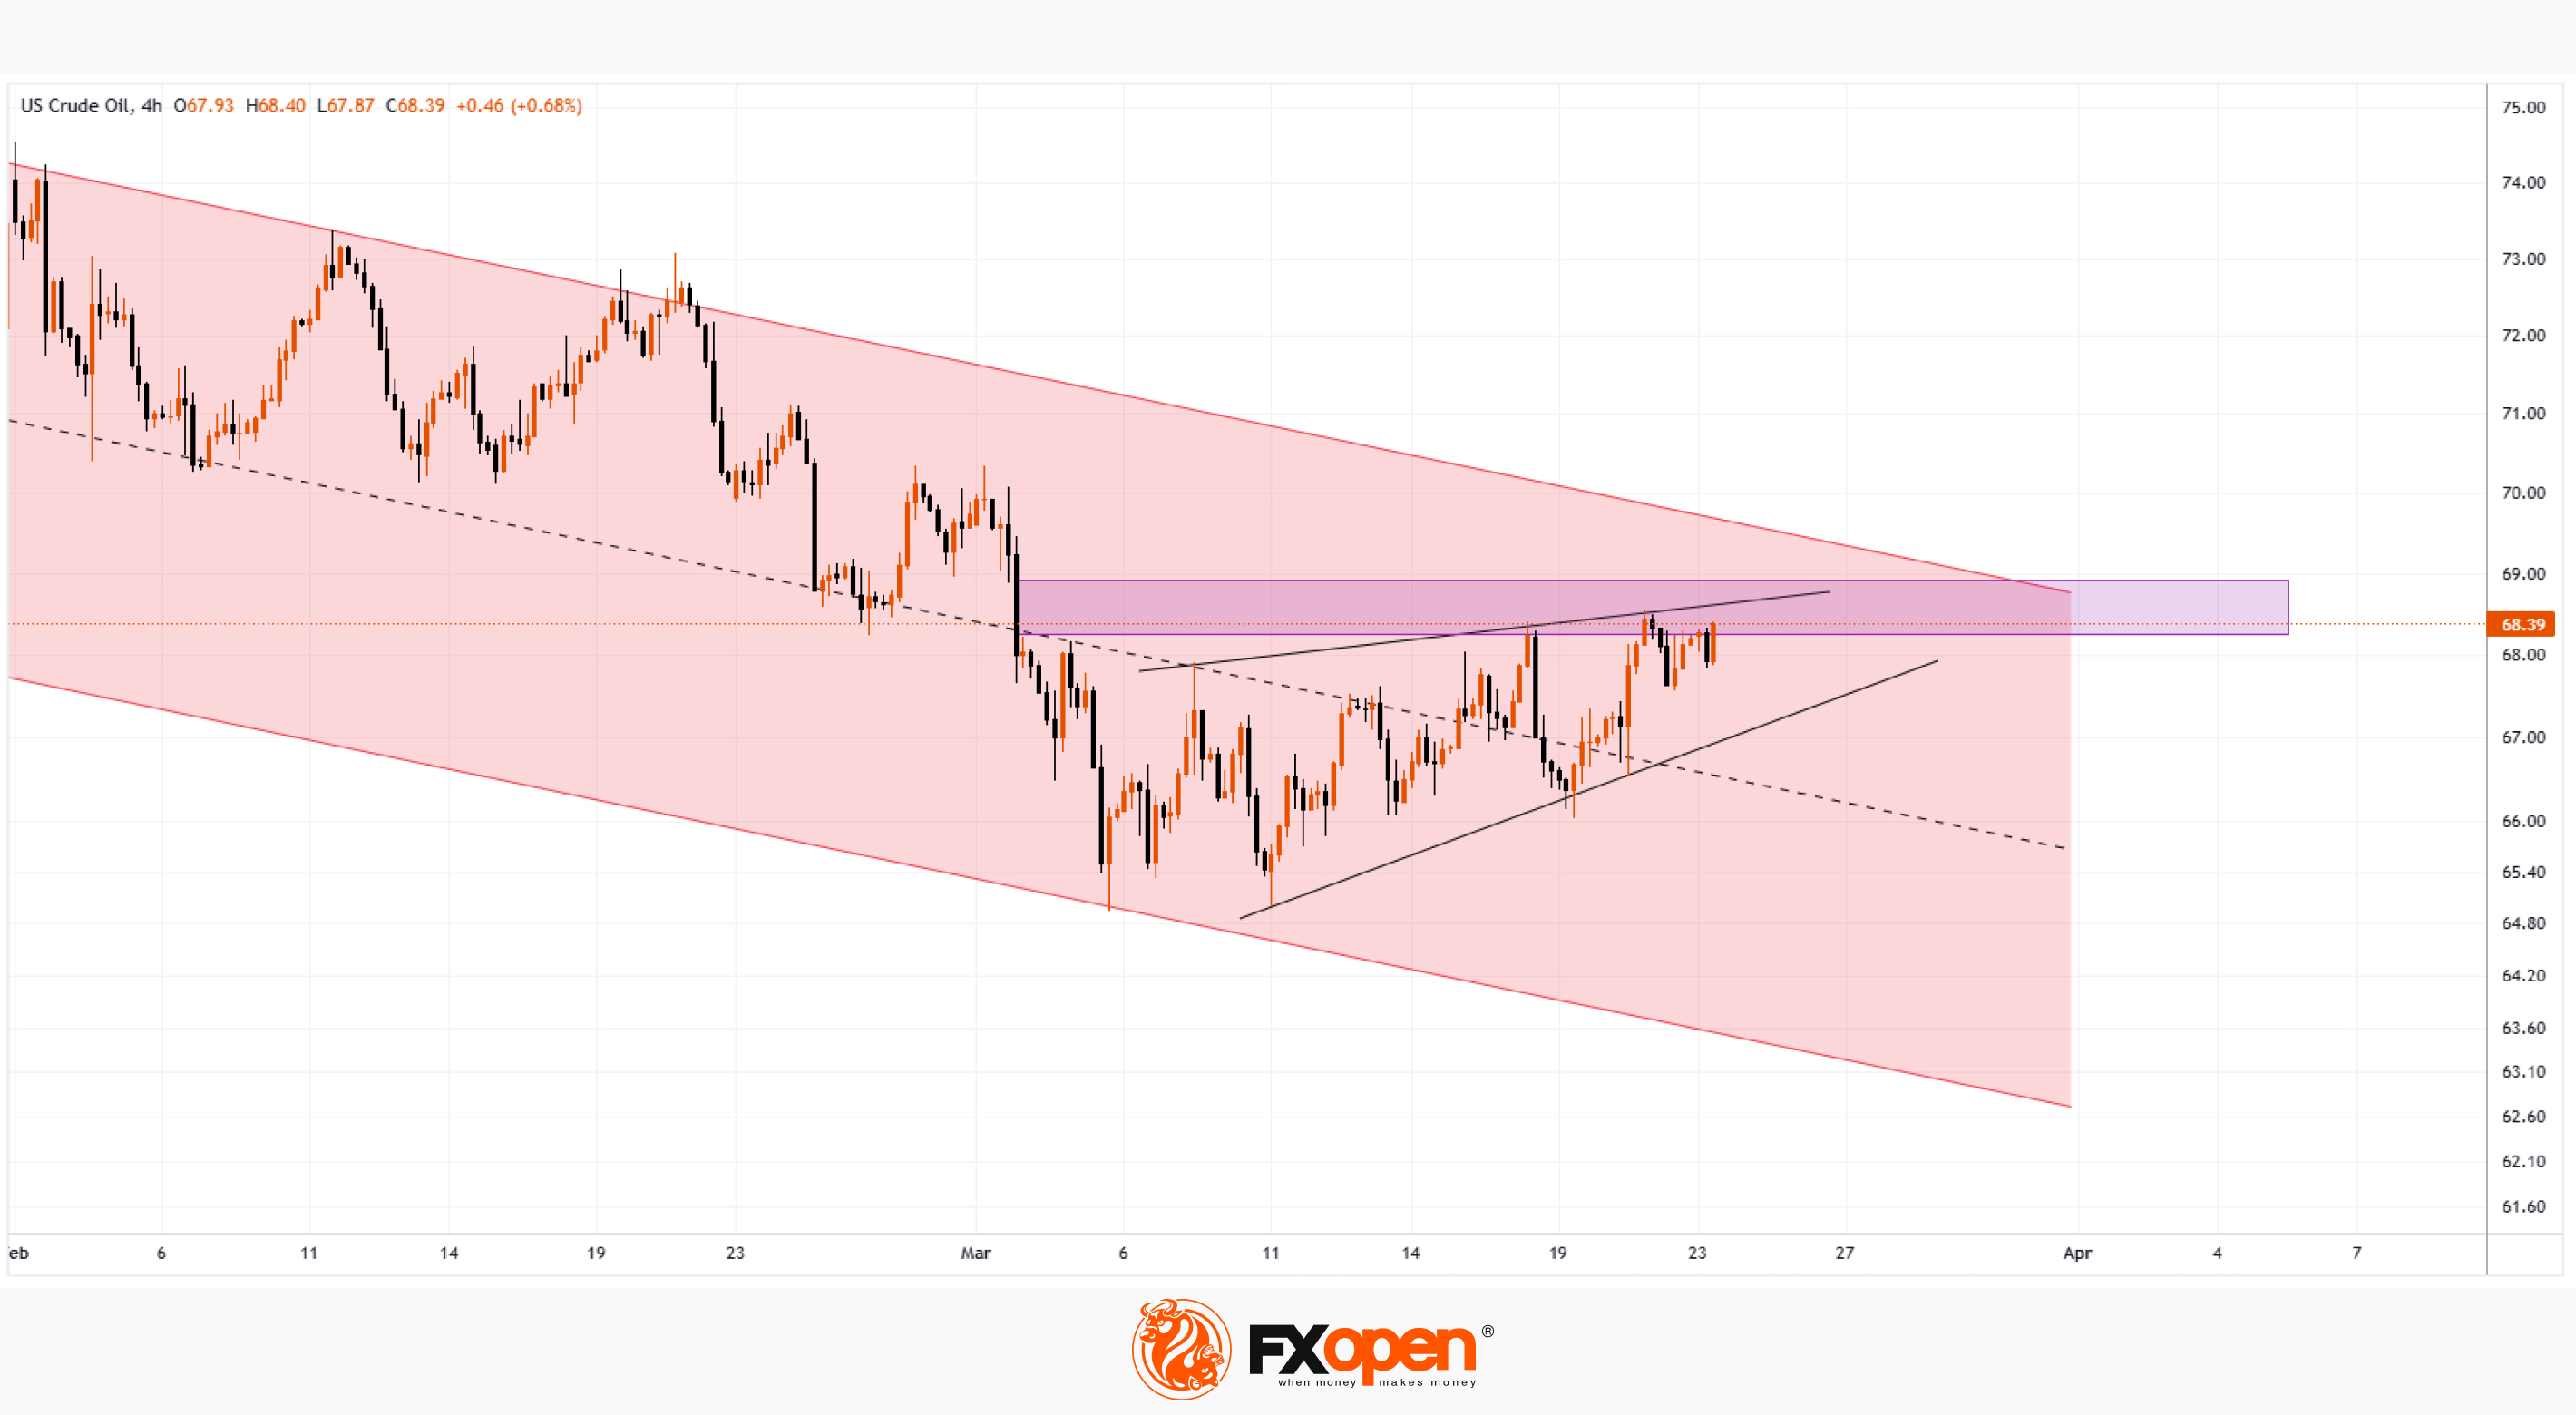
From a technical perspective, Brent crude oil is trading near a key resistance zone, which consists of:
→ A bearish Fair Value Gap (highlighted in purple).
→ The upper boundary of the descending channel.
→ The upper boundary of a narrowing triangle (shown in black), which can be interpreted as a Rising Wedge pattern.
The Rising Wedge may represent a corrective rebound within a broader bearish trend. If buyers fail to break through this resistance zone, Brent crude prices could resume their downtrend within the red channel.
Start trading commodities with tight spreads. Open your trading account now or learn more about trading commodity CFDs with FXOpen.
CFDs are complex instruments and come with a high risk of losing your money.
This article represents the opinion of the Companies operating under the FXOpen brand only. It is not to be construed as an offer, solicitation, or recommendation with respect to products and services provided by the Companies operating under the FXOpen brand, nor is it to be considered financial advice.
XBR/USD Analysis: Price Near Resistance Zone
As seen on the XBR/USD chart, Brent crude oil prices are hovering near last week’s highs this morning as market participants assess various influencing factors, including:
→ New U.S. sanctions on Iran, which are limiting its export capacity and tightening global supply, particularly to China.
→ Ongoing negotiations between the U.S., Ukraine, and Russia in Saudi Arabia, which could potentially lead to increased Russian oil exports.
→ OPEC+ plans to raise oil production starting in April.
Technical Analysis of XBR/USD
From a technical perspective, Brent crude oil is trading near a key resistance zone, which consists of:
→ A bearish Fair Value Gap (highlighted in purple).
→ The upper boundary of the descending channel.
→ The upper boundary of a narrowing triangle (shown in black), which can be interpreted as a Rising Wedge pattern.
The Rising Wedge may represent a corrective rebound within a broader bearish trend. If buyers fail to break through this resistance zone, Brent crude prices could resume their downtrend within the red channel.
Start trading commodities with tight spreads. Open your trading account now or learn more about trading commodity CFDs with FXOpen.
CFDs are complex instruments and come with a high risk of losing your money.
This article represents the opinion of the Companies operating under the FXOpen brand only. It is not to be construed as an offer, solicitation, or recommendation with respect to products and services provided by the Companies operating under the FXOpen brand, nor is it to be considered financial advice.
👍3
#sp500 #stocktrading #stockmarket #MarketUpdates
S&P 500 Analysis: Markets Start the Week on a Positive Note
A week ago, while analysing the S&P 500 index chart (US SPX 500 mini on FXOpen), we noted that the market had officially entered a correction phase, as the price had declined more than 10% from its February 19 peak. This drop was driven by mounting uncertainty over the potential economic damage caused by the Trump administration’s tariff policies in international trade.
However, this morning, markets are showing signs of optimism following reassuring statements from officials over the weekend.
According to Reuters:
→ Trump announced plans to hold talks with Chinese President Xi Jinping, while the U.S. Trade Representative is set to meet his Chinese counterpart this week.
→ The European Union has taken a conciliatory stance, delaying its initial countermeasures against the U.S. until mid-April.
As a result, sentiment appears to have shifted towards optimism, with the S&P 500 index (US SPX 500 mini on FXOpen) trading approximately 4% above this month’s low.
Technical Analysis of the S&P 500 Index (US SPX 500 mini on FXOpen)
As noted on 17 March:
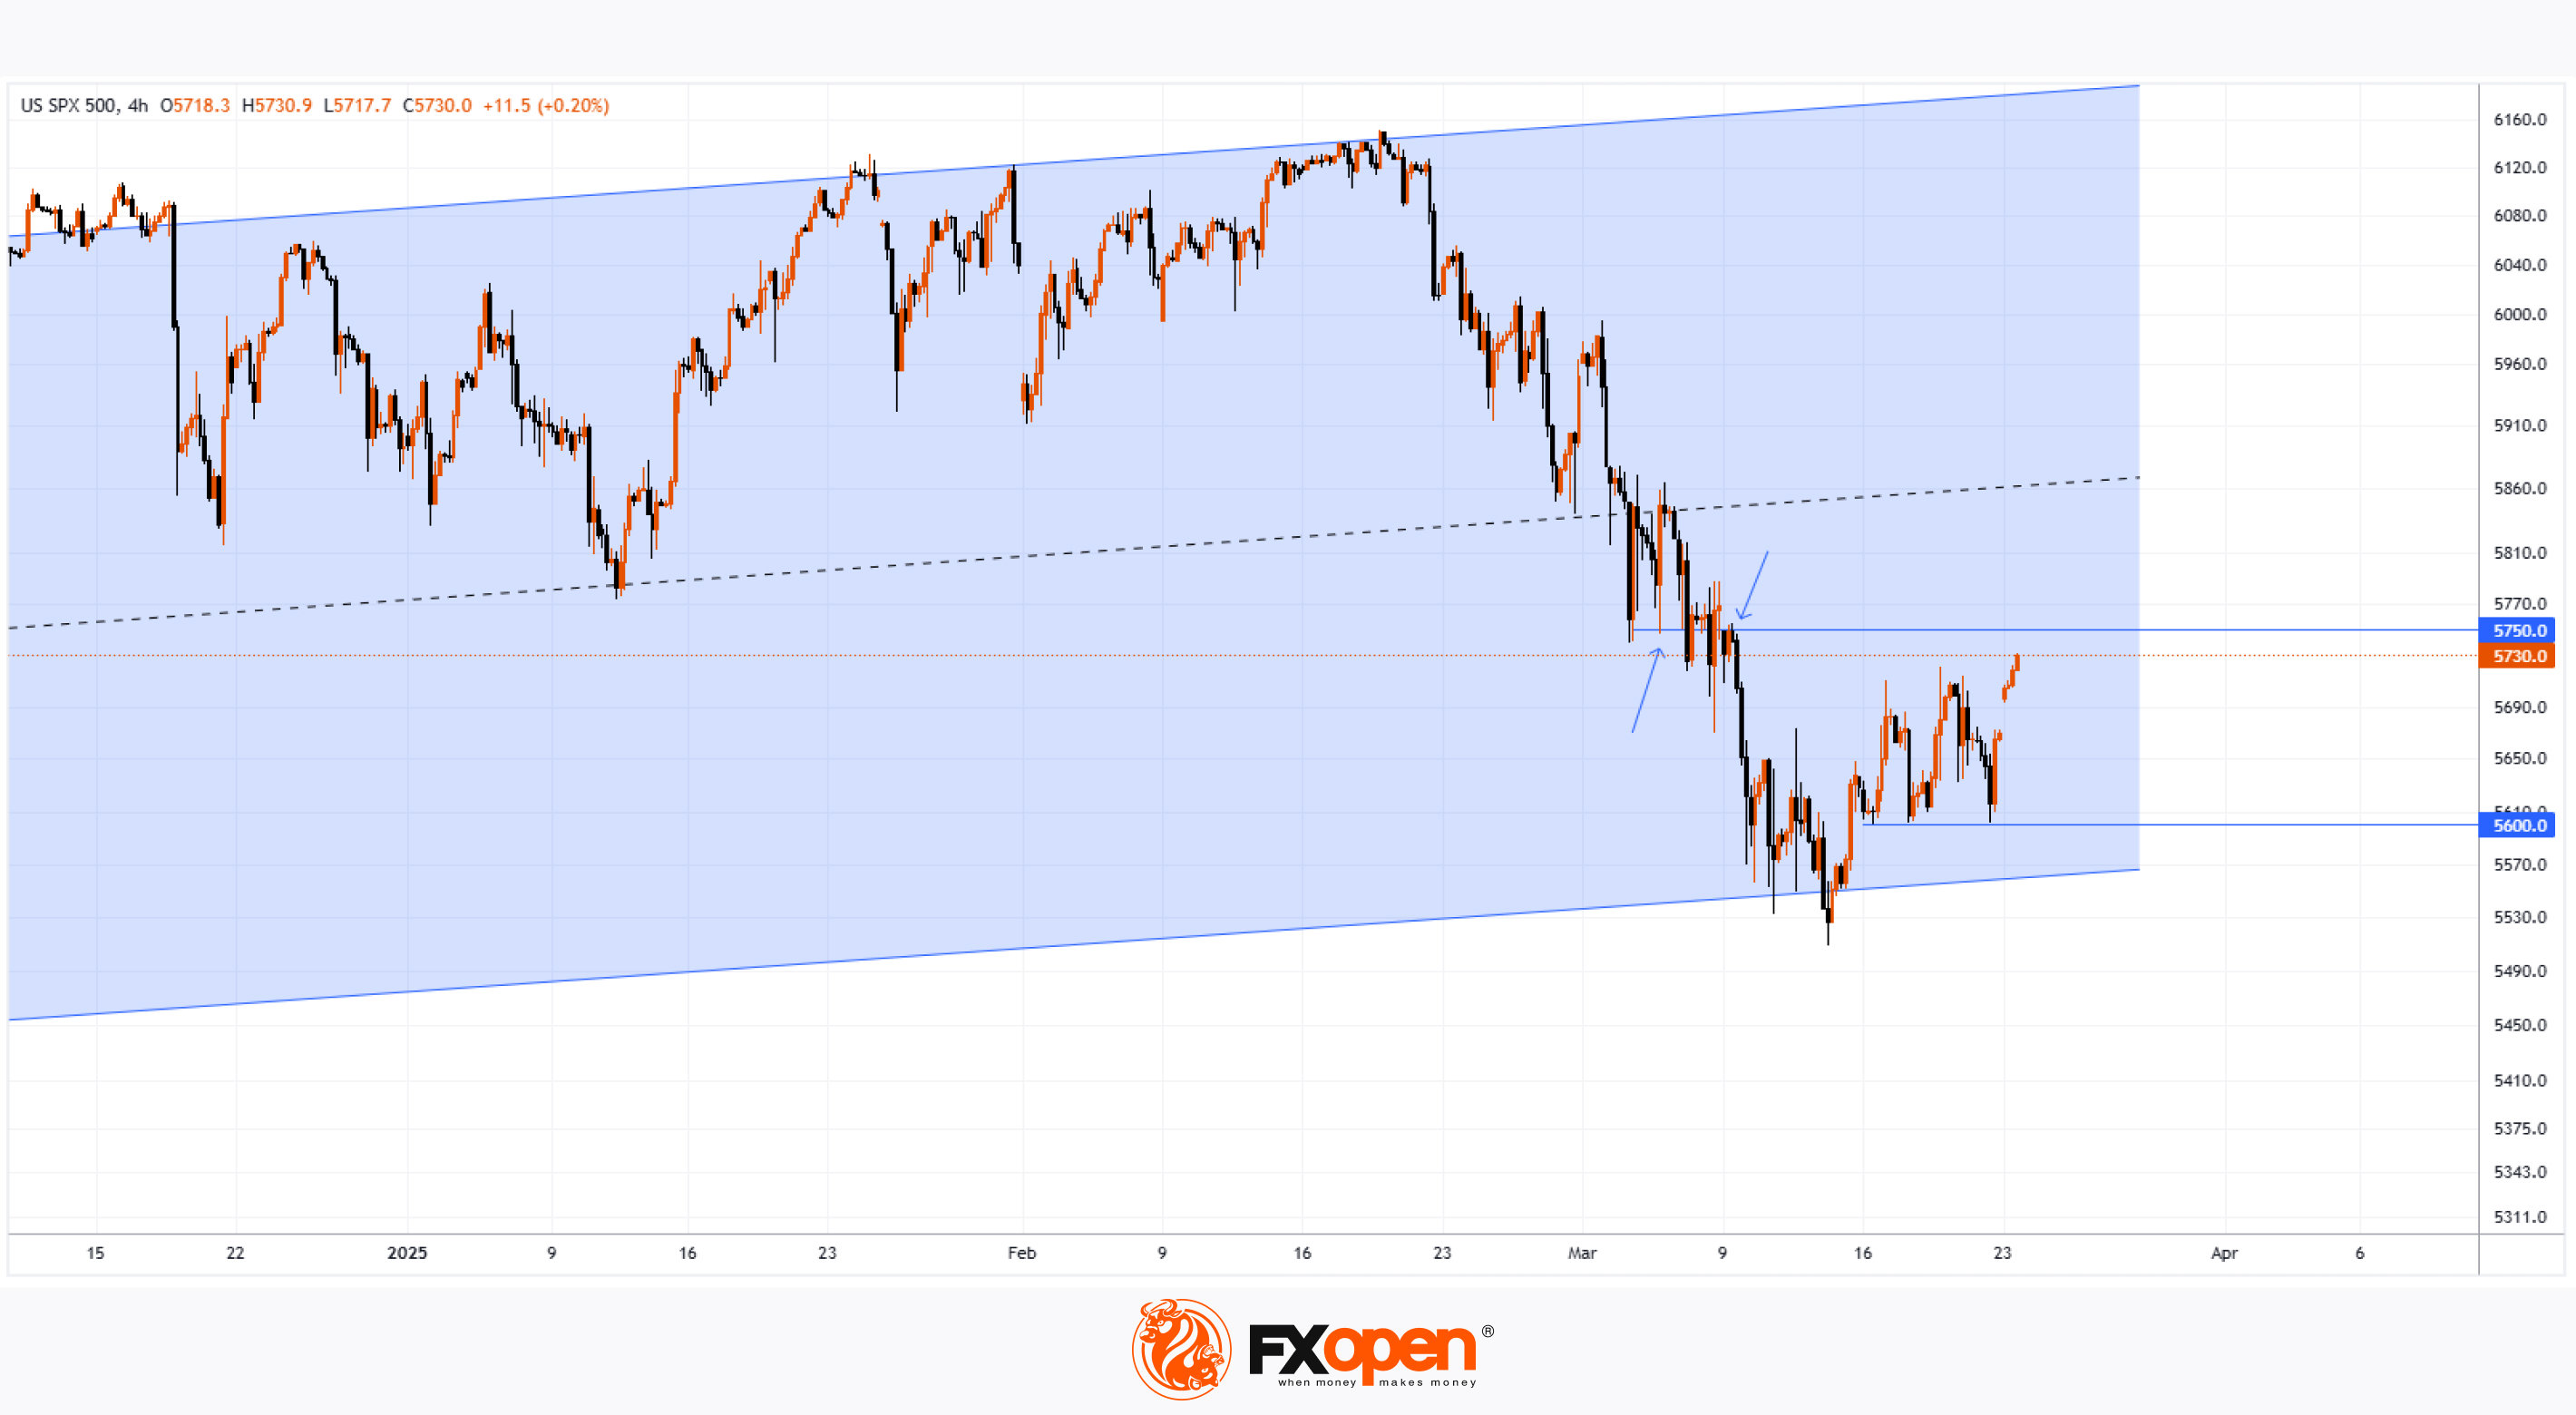
→ The price is forming an ascending channel (marked in blue).
→ The fact that the price has reached the lower boundary of the channel suggests that bearish momentum may be fading.
Currently, we are witnessing an attempt at a bullish reversal from the channel’s lower boundary.
From a bearish perspective, resistance may emerge around the 5750 level, where the price has previously reacted (as indicated by the arrows).
From a bullish perspective:
→ Bears have lost control of the 5600 level.
→ A bullish gap at the start of the week indicates a significant shift in market sentiment. If positive news continues to emerge throughout the week, the S&P 500 index (US SPX 500 mini on FXOpen) could attempt a rise towards the median of the identified channel.
Trade global index CFDs with zero commission and tight spreads. Open your FXOpen account now or learn more about trading index CFDs with FXOpen.
CFDs are complex instruments and come with a high risk of losing your money.
This article represents the opinion of the Companies operating under the FXOpen brand only. It is not to be construed as an offer, solicitation, or recommendation with respect to products and services provided by the Companies operating under the FXOpen brand, nor is it to be considered financial advice.
S&P 500 Analysis: Markets Start the Week on a Positive Note
A week ago, while analysing the S&P 500 index chart (US SPX 500 mini on FXOpen), we noted that the market had officially entered a correction phase, as the price had declined more than 10% from its February 19 peak. This drop was driven by mounting uncertainty over the potential economic damage caused by the Trump administration’s tariff policies in international trade.
However, this morning, markets are showing signs of optimism following reassuring statements from officials over the weekend.
According to Reuters:
→ Trump announced plans to hold talks with Chinese President Xi Jinping, while the U.S. Trade Representative is set to meet his Chinese counterpart this week.
→ The European Union has taken a conciliatory stance, delaying its initial countermeasures against the U.S. until mid-April.
As a result, sentiment appears to have shifted towards optimism, with the S&P 500 index (US SPX 500 mini on FXOpen) trading approximately 4% above this month’s low.
Technical Analysis of the S&P 500 Index (US SPX 500 mini on FXOpen)
As noted on 17 March:
→ The price is forming an ascending channel (marked in blue).
→ The fact that the price has reached the lower boundary of the channel suggests that bearish momentum may be fading.
Currently, we are witnessing an attempt at a bullish reversal from the channel’s lower boundary.
From a bearish perspective, resistance may emerge around the 5750 level, where the price has previously reacted (as indicated by the arrows).
From a bullish perspective:
→ Bears have lost control of the 5600 level.
→ A bullish gap at the start of the week indicates a significant shift in market sentiment. If positive news continues to emerge throughout the week, the S&P 500 index (US SPX 500 mini on FXOpen) could attempt a rise towards the median of the identified channel.
Trade global index CFDs with zero commission and tight spreads. Open your FXOpen account now or learn more about trading index CFDs with FXOpen.
CFDs are complex instruments and come with a high risk of losing your money.
This article represents the opinion of the Companies operating under the FXOpen brand only. It is not to be construed as an offer, solicitation, or recommendation with respect to products and services provided by the Companies operating under the FXOpen brand, nor is it to be considered financial advice.
👍3
#UKInflation #BoE #GBP #InterestRates #USEconomy #InflationData #FederalReserve #StockMarket #EarningsSeason
Market Insights with Gary Thomson: UK & US Inflation, US Durable Goods Orders, and Earnings Reports
In this video, we’ll explore the key economic events, market trends, and corporate news shaping the financial landscape. Get ready for expert insights into forex, commodities, and stocks to help you navigate the week ahead. Let’s dive in!
In this episode, we discuss:
🔸UK Inflation Rate
The UK’s inflation report on Wednesday will be crucial after the BoE’s decision to hold rates at 4.5%. With inflation surpassing the 2% target and energy costs rising, will the GBP face more pressure?
🔸US Durable Goods Orders
US durable goods orders will be in focus on Wednesday after January’s strong 3.1% rise. Will the trend continue, or is a slowdown ahead?
🔸US PCE Price Index
The US PCE Price Index drops on Friday, offering key inflation insights. Will it reinforce easing trends or fuel market volatility?
🔸Corporate Earnings Statements
Corporate earnings reports could drive market volatility this week. Will results surprise investors or fall short? Stay prepared!
Don’t miss out—gain insights to stay ahead in your trading journey.
https://cutt.ly/Urprz9v8
To take advantage of price fluctuations in the foreign exchange markets, consider enlisting the services of a reliable broker like FXOpen.
⚠️
This forecast represents FXOpen Companies opinion only, it should not be construed as an offer, invitation or recommendation in respect to FXOpen Companies products and services or as financial advice.
Market Insights with Gary Thomson: UK & US Inflation, US Durable Goods Orders, and Earnings Reports
In this video, we’ll explore the key economic events, market trends, and corporate news shaping the financial landscape. Get ready for expert insights into forex, commodities, and stocks to help you navigate the week ahead. Let’s dive in!
In this episode, we discuss:
🔸UK Inflation Rate
The UK’s inflation report on Wednesday will be crucial after the BoE’s decision to hold rates at 4.5%. With inflation surpassing the 2% target and energy costs rising, will the GBP face more pressure?
🔸US Durable Goods Orders
US durable goods orders will be in focus on Wednesday after January’s strong 3.1% rise. Will the trend continue, or is a slowdown ahead?
🔸US PCE Price Index
The US PCE Price Index drops on Friday, offering key inflation insights. Will it reinforce easing trends or fuel market volatility?
🔸Corporate Earnings Statements
Corporate earnings reports could drive market volatility this week. Will results surprise investors or fall short? Stay prepared!
Don’t miss out—gain insights to stay ahead in your trading journey.
https://cutt.ly/Urprz9v8
To take advantage of price fluctuations in the foreign exchange markets, consider enlisting the services of a reliable broker like FXOpen.
⚠️
This forecast represents FXOpen Companies opinion only, it should not be construed as an offer, invitation or recommendation in respect to FXOpen Companies products and services or as financial advice.
YouTube
Market Insights with Gary Thomson: UK & US Inflation, US Durable Goods Orders, and Earnings Reports
In this video, we’ll explore the key economic events, market trends, and corporate news shaping the financial landscape. Get ready for expert insights into forex, commodities, and stocks to help you navigate the week ahead. Let’s dive in!
In this episode…
In this episode…
👍3
Welcome to the FXOpen Official Channel!
Stay informed and connected with everything FXOpen!
👉 Access all essential links in one place, including our blog and official website:
🔗 https://linktr.ee/fxopen
📚 Explore market insights, updates, and resources.
💼 Visit our official platforms for trading and support.
Follow the link now to stay updated and take full advantage of our services! 🎯
Stay informed and connected with everything FXOpen!
👉 Access all essential links in one place, including our blog and official website:
🔗 https://linktr.ee/fxopen
📚 Explore market insights, updates, and resources.
💼 Visit our official platforms for trading and support.
Follow the link now to stay updated and take full advantage of our services! 🎯
Linktree
FXOpen | Instagram, Facebook | Linktree
Linktree. Make your link do more.
👍3🤩1
FXOpen official pinned «Welcome to the FXOpen Official Channel! Stay informed and connected with everything FXOpen! 👉 Access all essential links in one place, including our blog and official website: 🔗 https://linktr.ee/fxopen 📚 Explore market insights, updates, and resources.…»
#forextrading #tradingtips #eurcad #marketanalysis
Forex Traders Focus on Trump’s Tariff News
As April 2 approaches—the date when Trump's international trade tariffs are set to take effect—traders are increasingly concentrating on this highly uncertain issue.
Yesterday, the U.S. president stated that:
→ Tariffs on cars would be introduced "soon" (but not all possible tariffs would be imposed);
→ Some countries might receive exemptions;
→ Nations purchasing oil from Venezuela could face 25% tariffs.
Following these remarks:
→ Oil prices rose;
→ U.S. stocks gained as Wall Street (according to Reuters) interpreted the comments as a sign of flexibility in trade negotiations.
Given this backdrop, the EUR/CAD chart is particularly interesting, as both Europe and Canada frequently feature in news related to the White House's trade policies.
EUR/CAD Exchange Rate Today
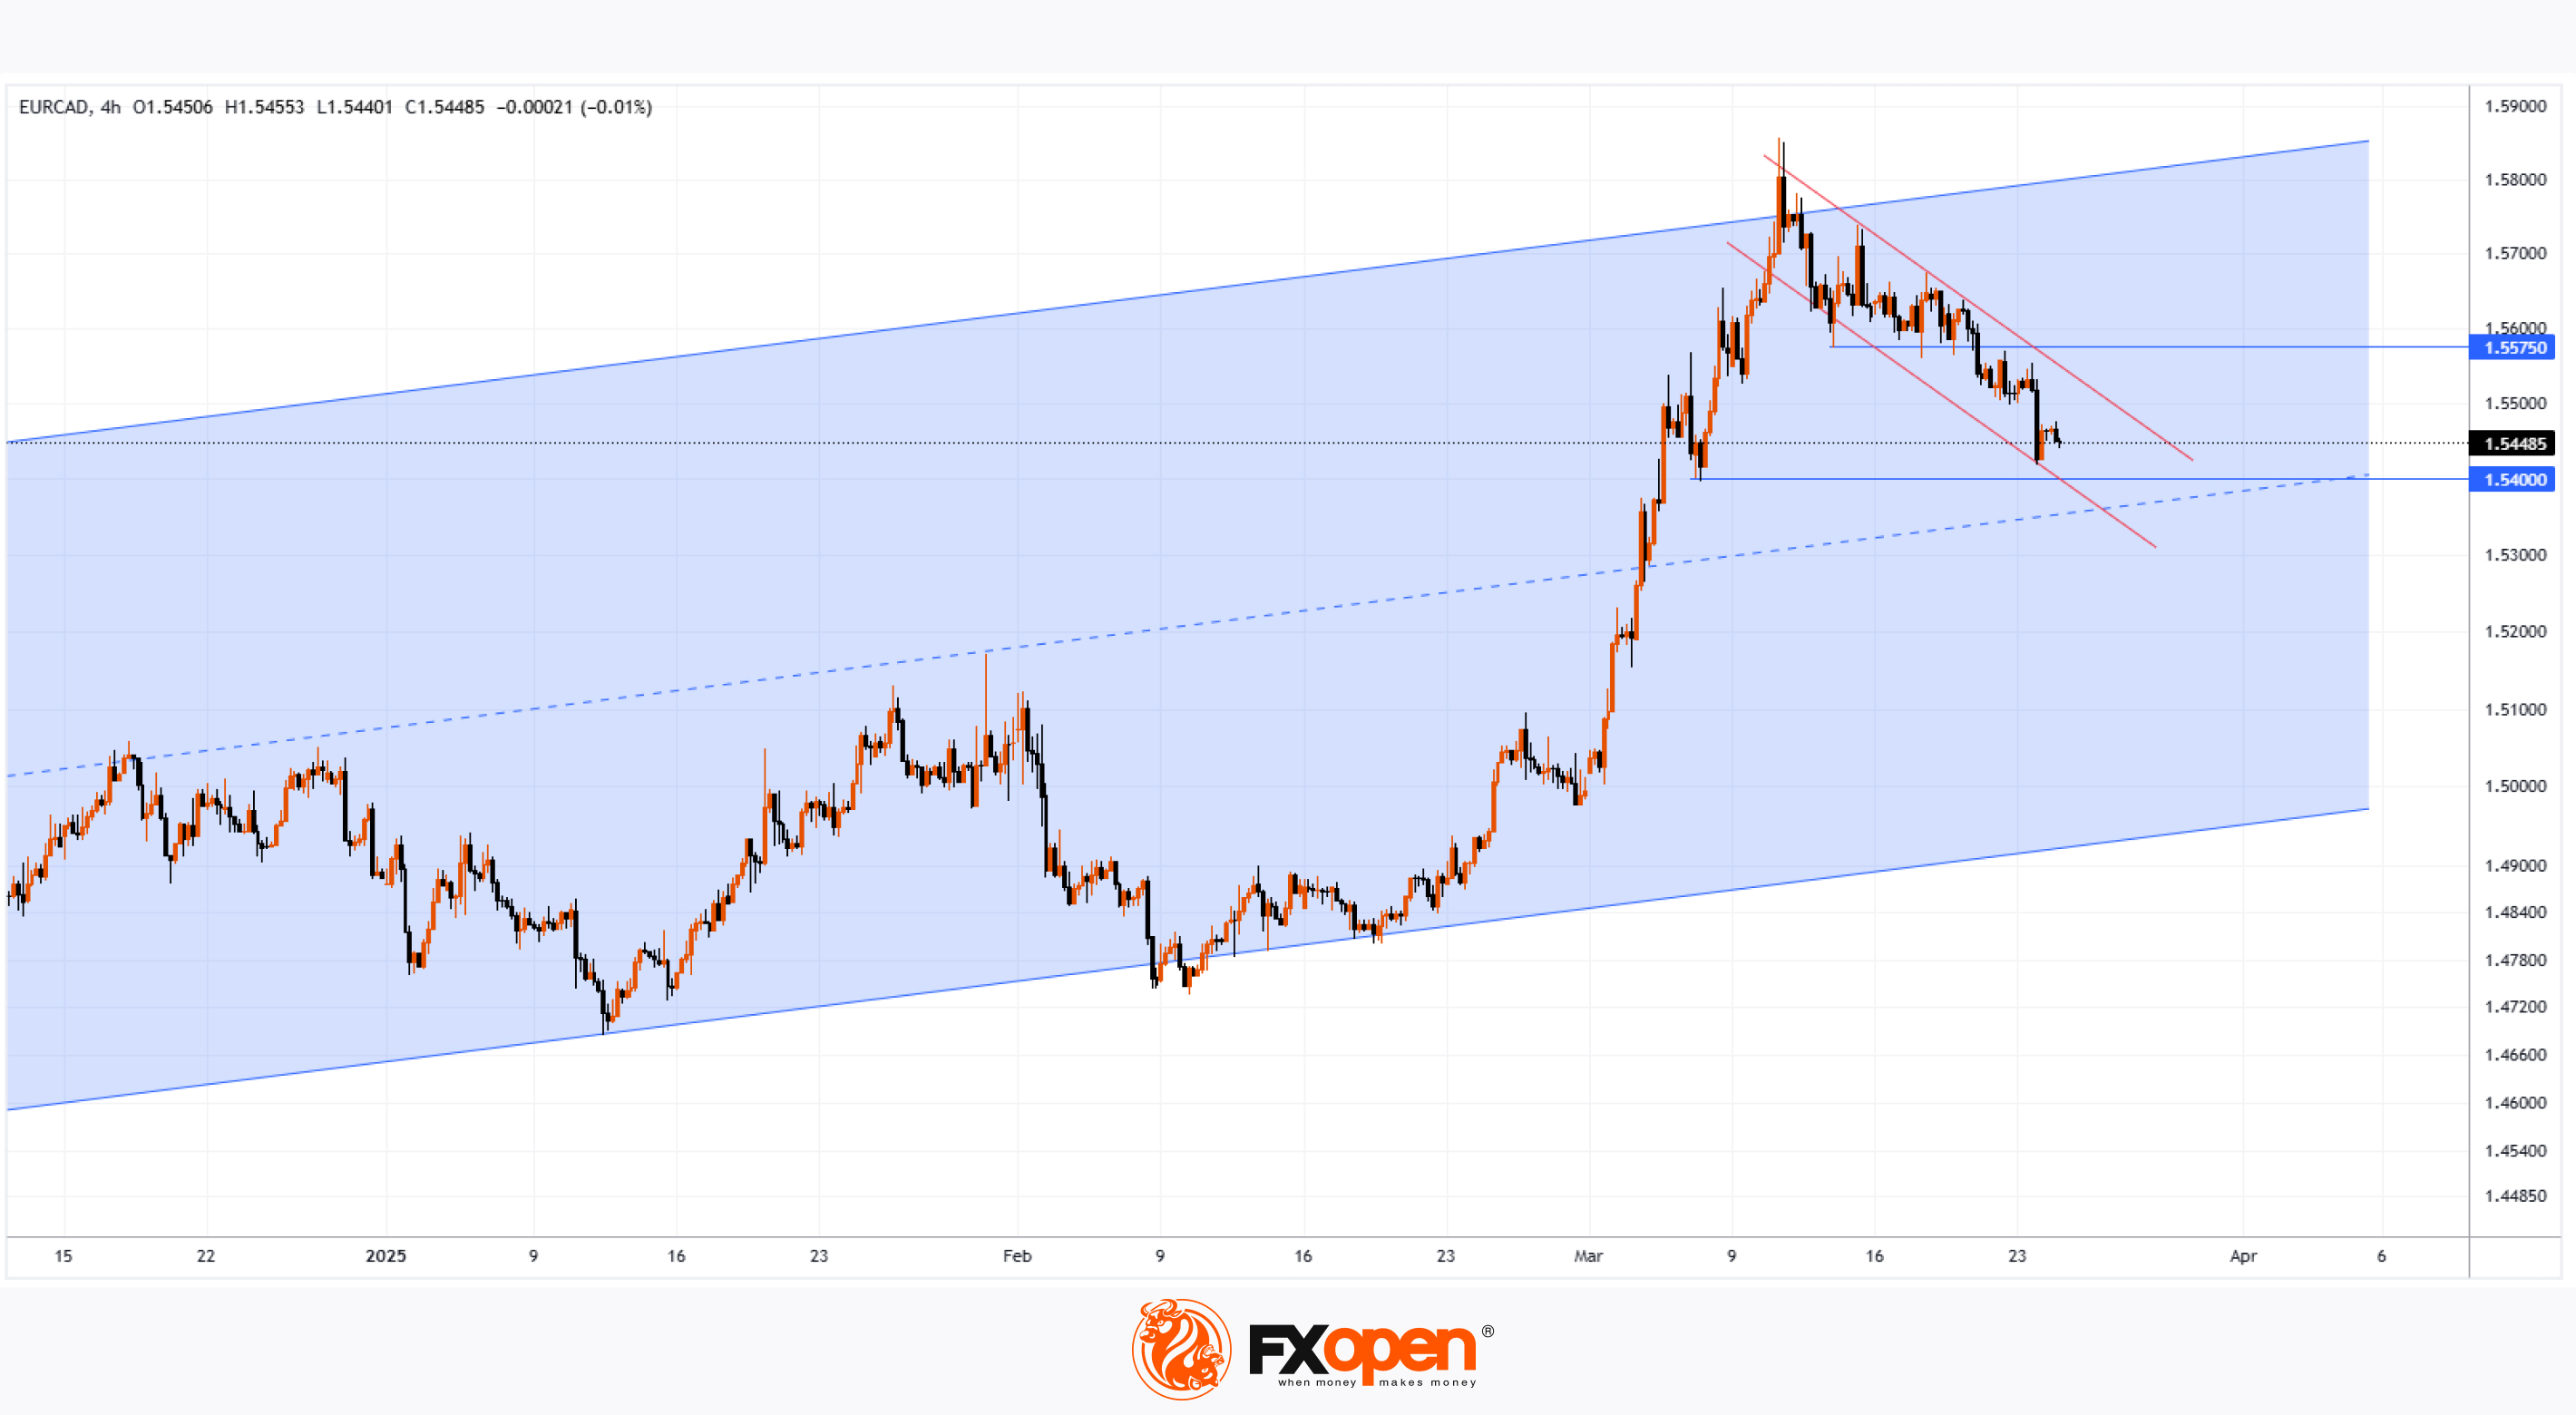
As seen on the EUR/CAD chart, the pair has slightly declined at the start of the week, dipping towards 1.54450. However, market volatility remains high:
→ The pair has gained approximately 2.85% since early March;
→ The decline from March’s peak is around 2.6%.
Technical Analysis of EUR/CAD
The pair’s volatile price swings have formed a trend channel (marked in blue).
Notably, the 1.57750 level has shifted from support to resistance, signalling bearish dominance. This is further reflected in the price movement within the red channel. If bears maintain control, EUR/CAD may drop towards a support zone, which includes:
→ The median of the blue channel;
→ The 1.54000 support level, drawn from early March’s local low.
Trade over 50 forex markets 24 hours a day with FXOpen. Take advantage of low commissions, deep liquidity, and spreads from 0.0 pips. Open your FXOpen account now or learn more about trading forex with FXOpen.
CFDs are complex instruments and come with a high risk of losing your money.
This article represents the opinion of the Companies operating under the FXOpen brand only. It is not to be construed as an offer, solicitation, or recommendation with respect to products and services provided by the Companies operating under the FXOpen brand, nor is it to be considered financial advice.
Forex Traders Focus on Trump’s Tariff News
As April 2 approaches—the date when Trump's international trade tariffs are set to take effect—traders are increasingly concentrating on this highly uncertain issue.
Yesterday, the U.S. president stated that:
→ Tariffs on cars would be introduced "soon" (but not all possible tariffs would be imposed);
→ Some countries might receive exemptions;
→ Nations purchasing oil from Venezuela could face 25% tariffs.
Following these remarks:
→ Oil prices rose;
→ U.S. stocks gained as Wall Street (according to Reuters) interpreted the comments as a sign of flexibility in trade negotiations.
Given this backdrop, the EUR/CAD chart is particularly interesting, as both Europe and Canada frequently feature in news related to the White House's trade policies.
EUR/CAD Exchange Rate Today
As seen on the EUR/CAD chart, the pair has slightly declined at the start of the week, dipping towards 1.54450. However, market volatility remains high:
→ The pair has gained approximately 2.85% since early March;
→ The decline from March’s peak is around 2.6%.
Technical Analysis of EUR/CAD
The pair’s volatile price swings have formed a trend channel (marked in blue).
Notably, the 1.57750 level has shifted from support to resistance, signalling bearish dominance. This is further reflected in the price movement within the red channel. If bears maintain control, EUR/CAD may drop towards a support zone, which includes:
→ The median of the blue channel;
→ The 1.54000 support level, drawn from early March’s local low.
Trade over 50 forex markets 24 hours a day with FXOpen. Take advantage of low commissions, deep liquidity, and spreads from 0.0 pips. Open your FXOpen account now or learn more about trading forex with FXOpen.
CFDs are complex instruments and come with a high risk of losing your money.
This article represents the opinion of the Companies operating under the FXOpen brand only. It is not to be construed as an offer, solicitation, or recommendation with respect to products and services provided by the Companies operating under the FXOpen brand, nor is it to be considered financial advice.
👍4
#stockmarket #stocktrading #MarketUpdates #MarketNews
Boeing (BA) Share Price Rally Slows Near Key Resistance
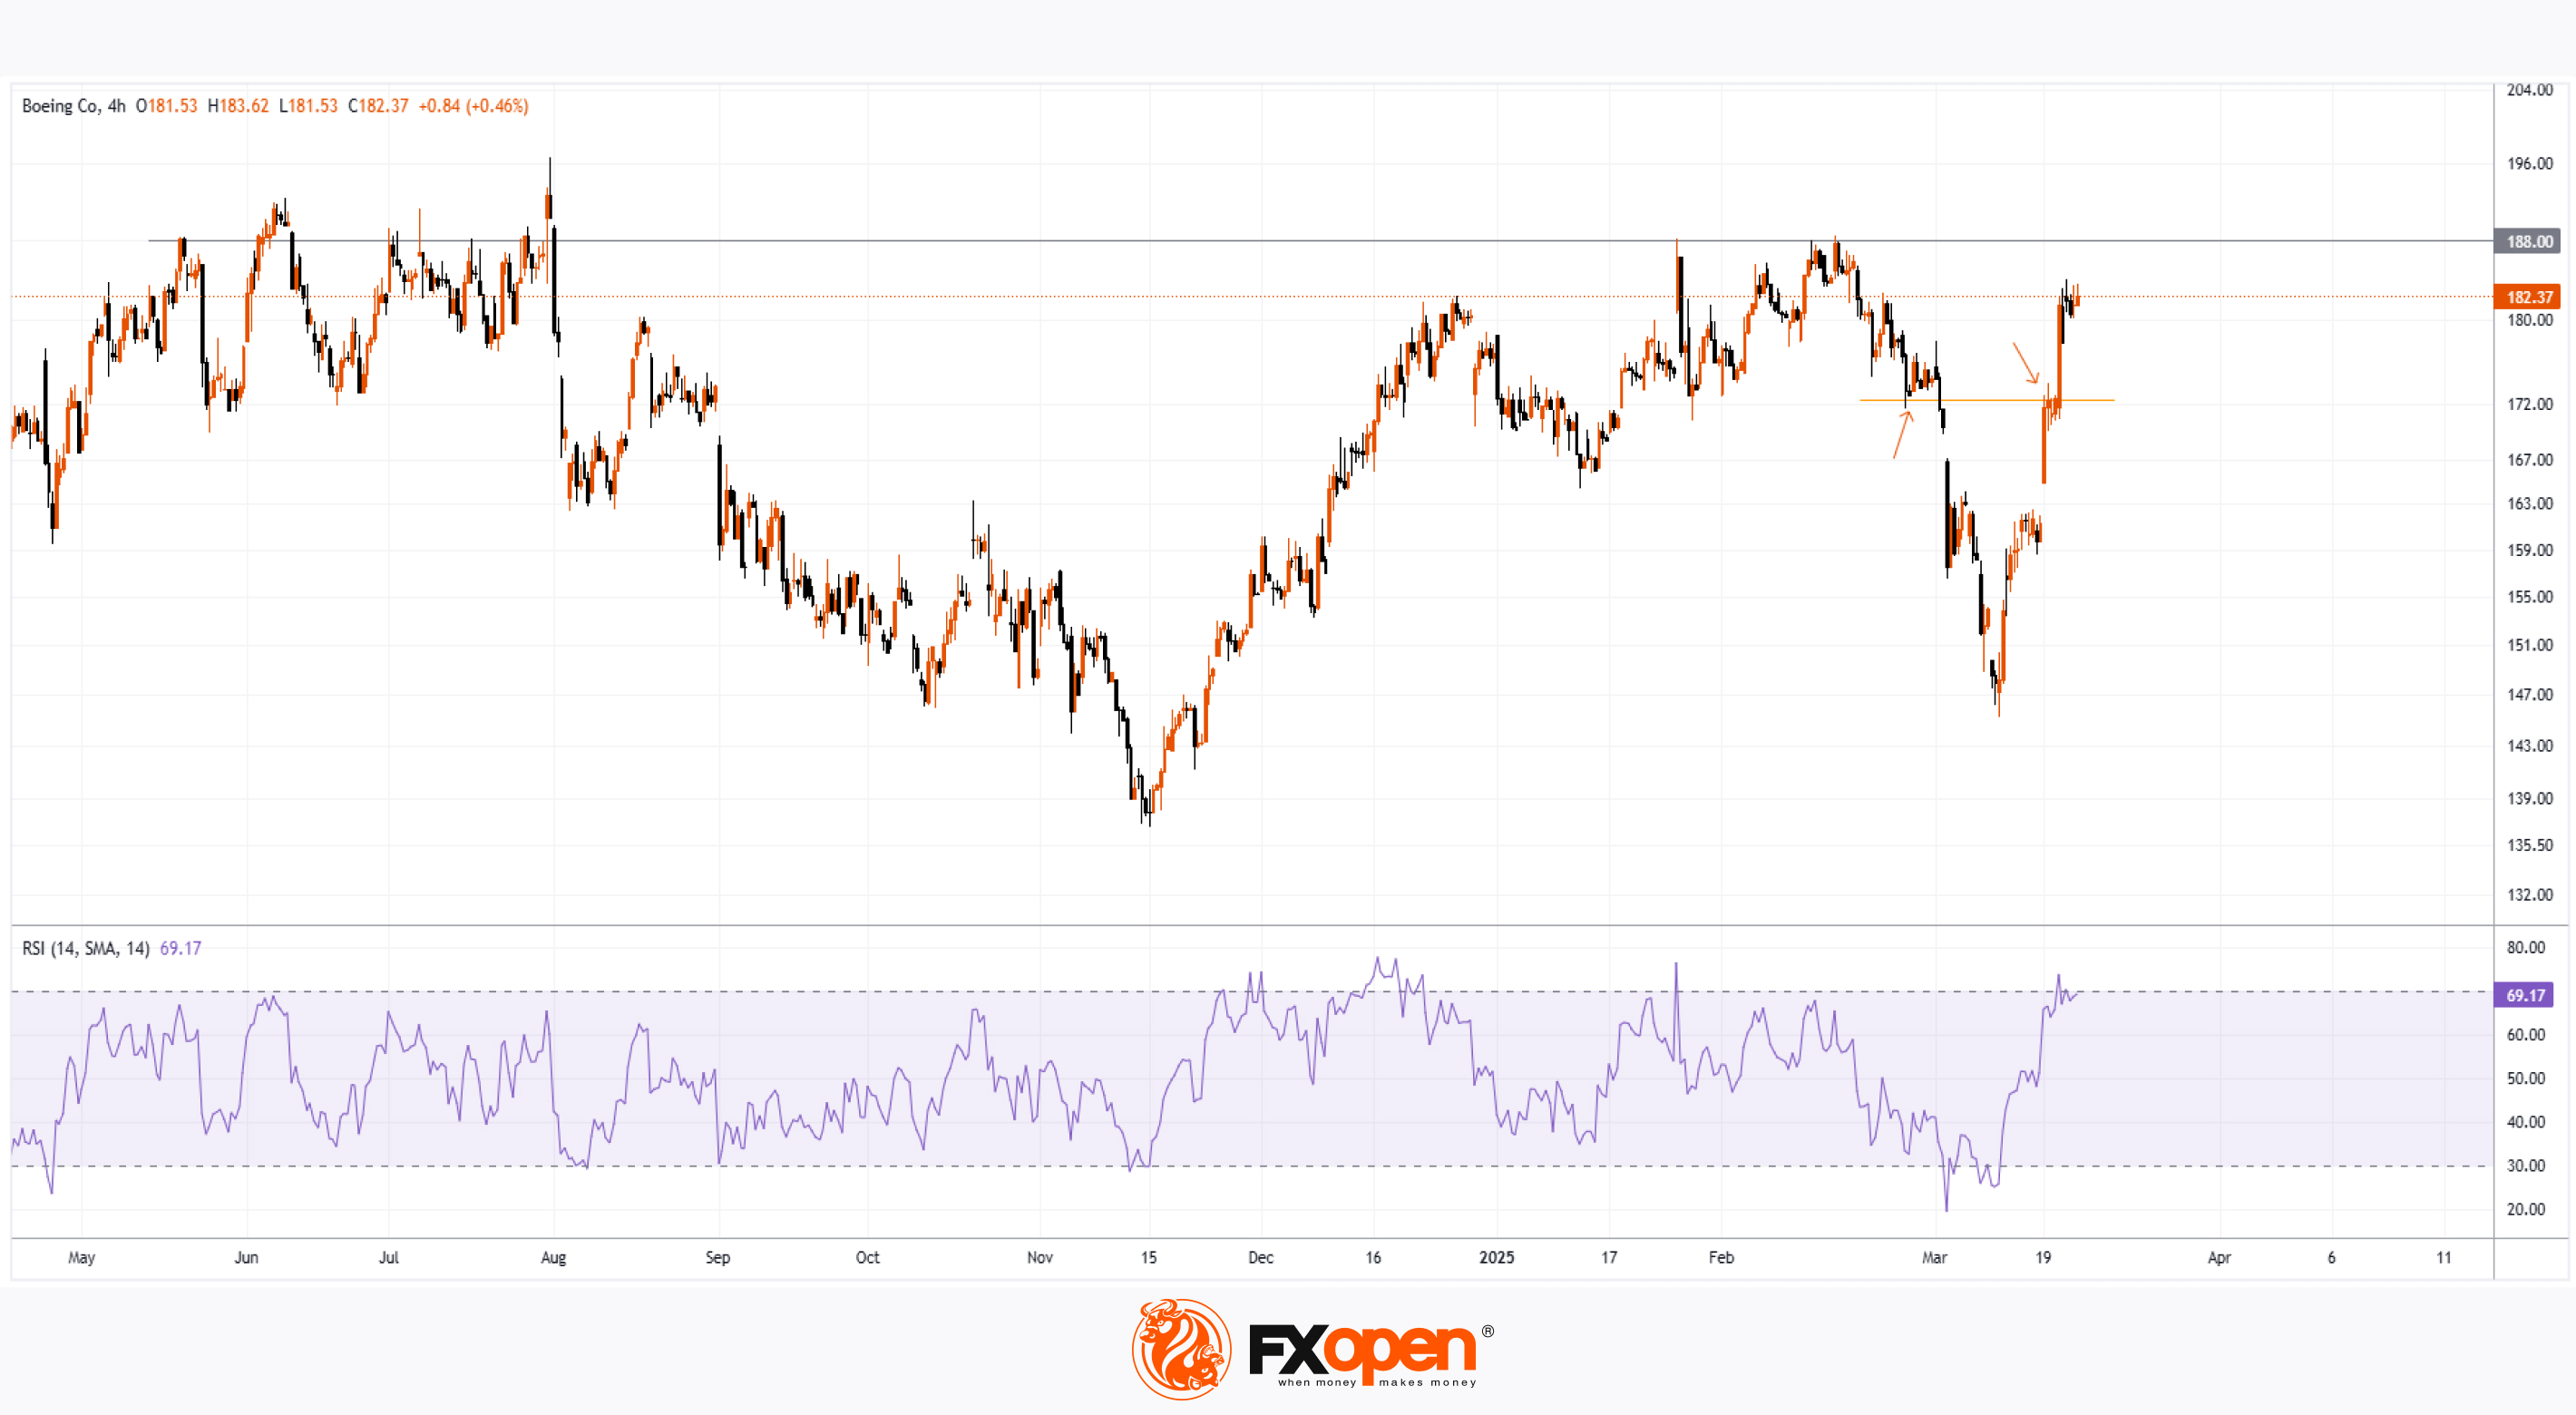
The Boeing (BA) stock chart shows that since its March low, the price has surged by approximately 25%, significantly outperforming the S&P 500 index (US SPX 500 mini on FXOpen).
This rally was driven by the news that Boeing secured a contract to develop the next generation of fighter jets for the U.S. Navy, beating its main competitor, Lockheed Martin.
According to Business Insider, this success is tied to Boeing’s development of the F-47 fighter jet under the Next Generation Air Dominance (NGAD) programme, which will bring the company contracts worth around $20 billion.
Technical Analysis of Boeing (BA) Stock
Throughout March, bulls managed to break through local resistance around $172 (as indicated by orange arrows). However, the rally has now reached a stronger obstacle—the $188 level:
▪️This area marks the 2025 high.
▪️Bulls also struggled to sustain prices above $188 in mid-2024.
With the RSI indicator nearing overbought levels, a correction after such an impressive two-month rally seems like a plausible scenario.
Trade global index CFDs with zero commission and tight spreads. Open your FXOpen account now or learn more about trading index CFDs with FXOpen.
CFDs are complex instruments and come with a high risk of losing your money.
This article represents the opinion of the Companies operating under the FXOpen brand only. It is not to be construed as an offer, solicitation, or recommendation with respect to products and services provided by the Companies operating under the FXOpen brand, nor is it to be considered financial advice.
Boeing (BA) Share Price Rally Slows Near Key Resistance
The Boeing (BA) stock chart shows that since its March low, the price has surged by approximately 25%, significantly outperforming the S&P 500 index (US SPX 500 mini on FXOpen).
This rally was driven by the news that Boeing secured a contract to develop the next generation of fighter jets for the U.S. Navy, beating its main competitor, Lockheed Martin.
According to Business Insider, this success is tied to Boeing’s development of the F-47 fighter jet under the Next Generation Air Dominance (NGAD) programme, which will bring the company contracts worth around $20 billion.
Technical Analysis of Boeing (BA) Stock
Throughout March, bulls managed to break through local resistance around $172 (as indicated by orange arrows). However, the rally has now reached a stronger obstacle—the $188 level:
▪️This area marks the 2025 high.
▪️Bulls also struggled to sustain prices above $188 in mid-2024.
With the RSI indicator nearing overbought levels, a correction after such an impressive two-month rally seems like a plausible scenario.
Trade global index CFDs with zero commission and tight spreads. Open your FXOpen account now or learn more about trading index CFDs with FXOpen.
CFDs are complex instruments and come with a high risk of losing your money.
This article represents the opinion of the Companies operating under the FXOpen brand only. It is not to be construed as an offer, solicitation, or recommendation with respect to products and services provided by the Companies operating under the FXOpen brand, nor is it to be considered financial advice.
👍3
#inflation #MarketUpdates #MarketNews #marketanalysis
UK Inflation Declines
Today, the latest UK Consumer Price Index (CPI) figures were released. According to ForexFactory:
▪️The actual annual CPI came in at 2.8%,
▪️Analysts had expected it to remain at the previous level of 3.0%.
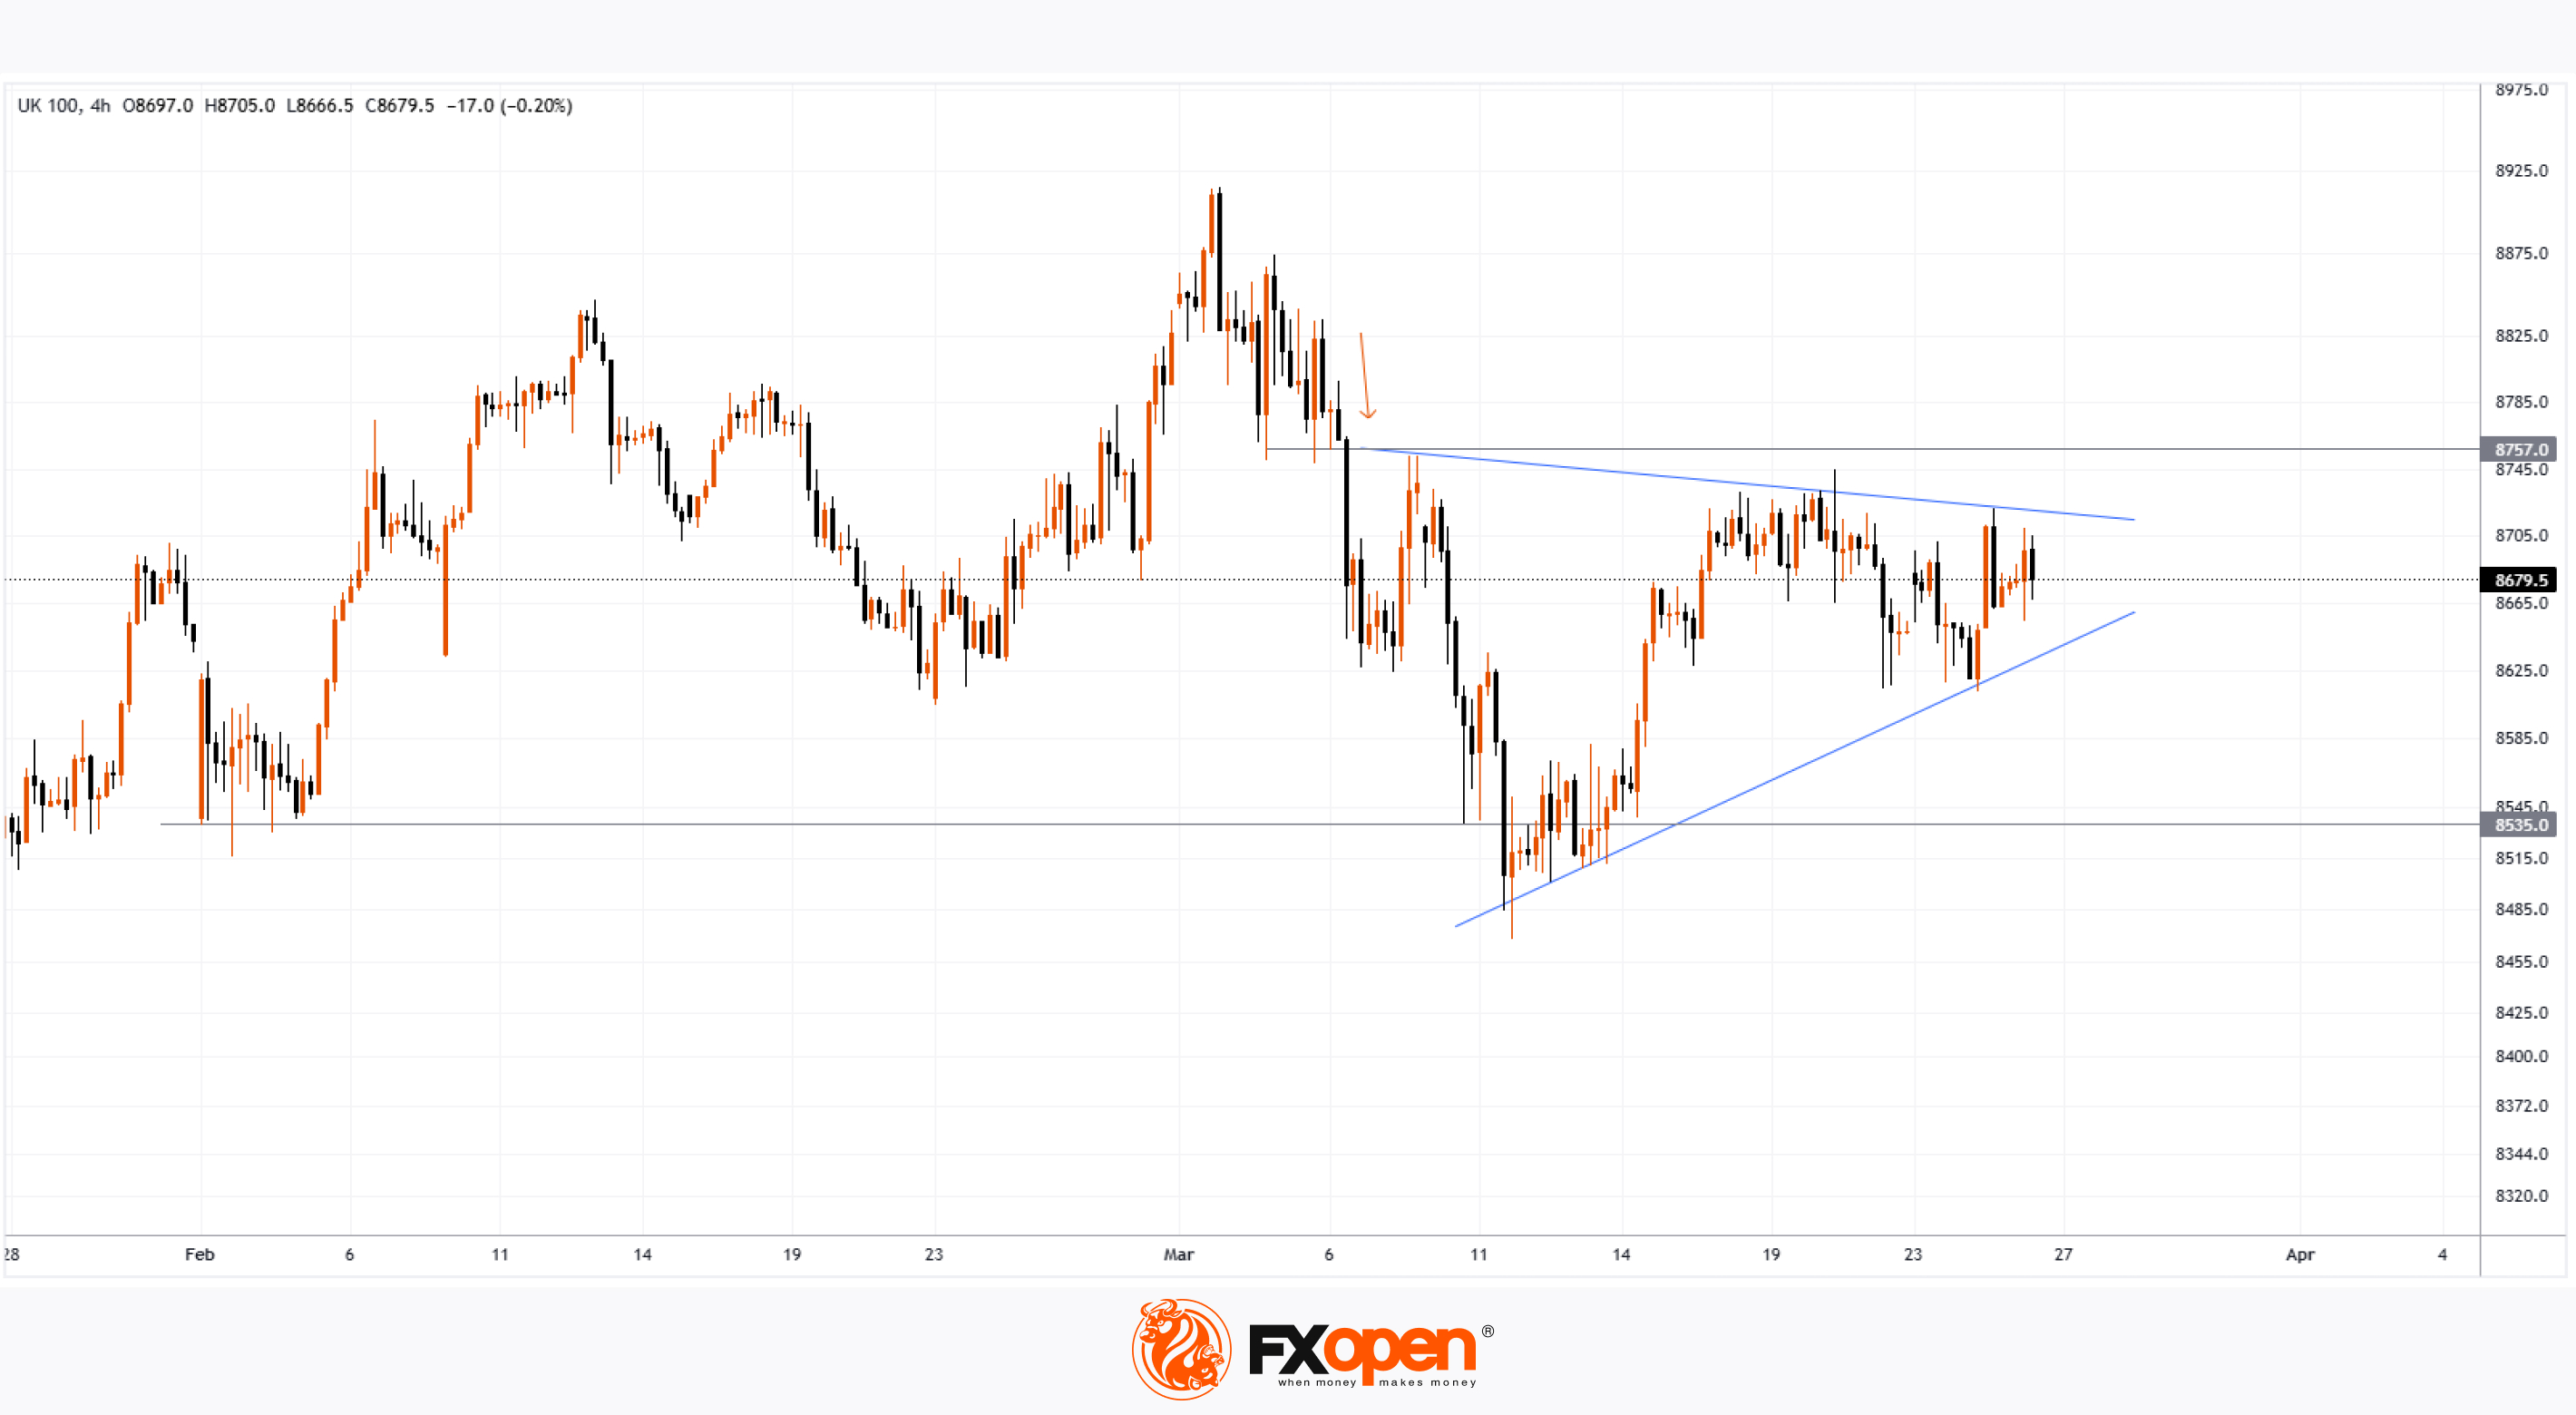
As a result, the British pound weakened, and a slight spike in volatility was observed on the FTSE 100 stock index chart (UK 100 on FXOpen)
Technical Analysis of FTSE 100
In early March, bearish activity (indicated by an arrow) led to a break of the support level around 8757, which then acted as resistance.
However, as soon as bears pushed the price below the February low, bulls stepped in.
Currently, the UK stock index chart is forming a narrowing triangle, which can be interpreted as a sign of equilibrium between supply and demand. However, this pattern will eventually be broken.
It is possible that the release of significant news—such as developments in international trade tariffs—could disrupt the balance of supply and demand, triggering a trend movement for the FTSE 100 index (UK 100 on FXOpen).
Trade global index CFDs with zero commission and tight spreads. Open your FXOpen account now or learn more about trading index CFDs with FXOpen.
CFDs are complex instruments and come with a high risk of losing your money.
This article represents the opinion of the Companies operating under the FXOpen brand only. It is not to be construed as an offer, solicitation, or recommendation with respect to products and services provided by the Companies operating under the FXOpen brand, nor is it to be considered financial advice.
UK Inflation Declines
Today, the latest UK Consumer Price Index (CPI) figures were released. According to ForexFactory:
▪️The actual annual CPI came in at 2.8%,
▪️Analysts had expected it to remain at the previous level of 3.0%.
As a result, the British pound weakened, and a slight spike in volatility was observed on the FTSE 100 stock index chart (UK 100 on FXOpen)
Technical Analysis of FTSE 100
In early March, bearish activity (indicated by an arrow) led to a break of the support level around 8757, which then acted as resistance.
However, as soon as bears pushed the price below the February low, bulls stepped in.
Currently, the UK stock index chart is forming a narrowing triangle, which can be interpreted as a sign of equilibrium between supply and demand. However, this pattern will eventually be broken.
It is possible that the release of significant news—such as developments in international trade tariffs—could disrupt the balance of supply and demand, triggering a trend movement for the FTSE 100 index (UK 100 on FXOpen).
Trade global index CFDs with zero commission and tight spreads. Open your FXOpen account now or learn more about trading index CFDs with FXOpen.
CFDs are complex instruments and come with a high risk of losing your money.
This article represents the opinion of the Companies operating under the FXOpen brand only. It is not to be construed as an offer, solicitation, or recommendation with respect to products and services provided by the Companies operating under the FXOpen brand, nor is it to be considered financial advice.
👍4
#nvidia #NVDA #stockmarket #stocktrading #marketanalysis
Nvidia (NVDA) Share Price Continues Bearish Trend
Earlier this month, our analysis of NVDA's share price led us to:
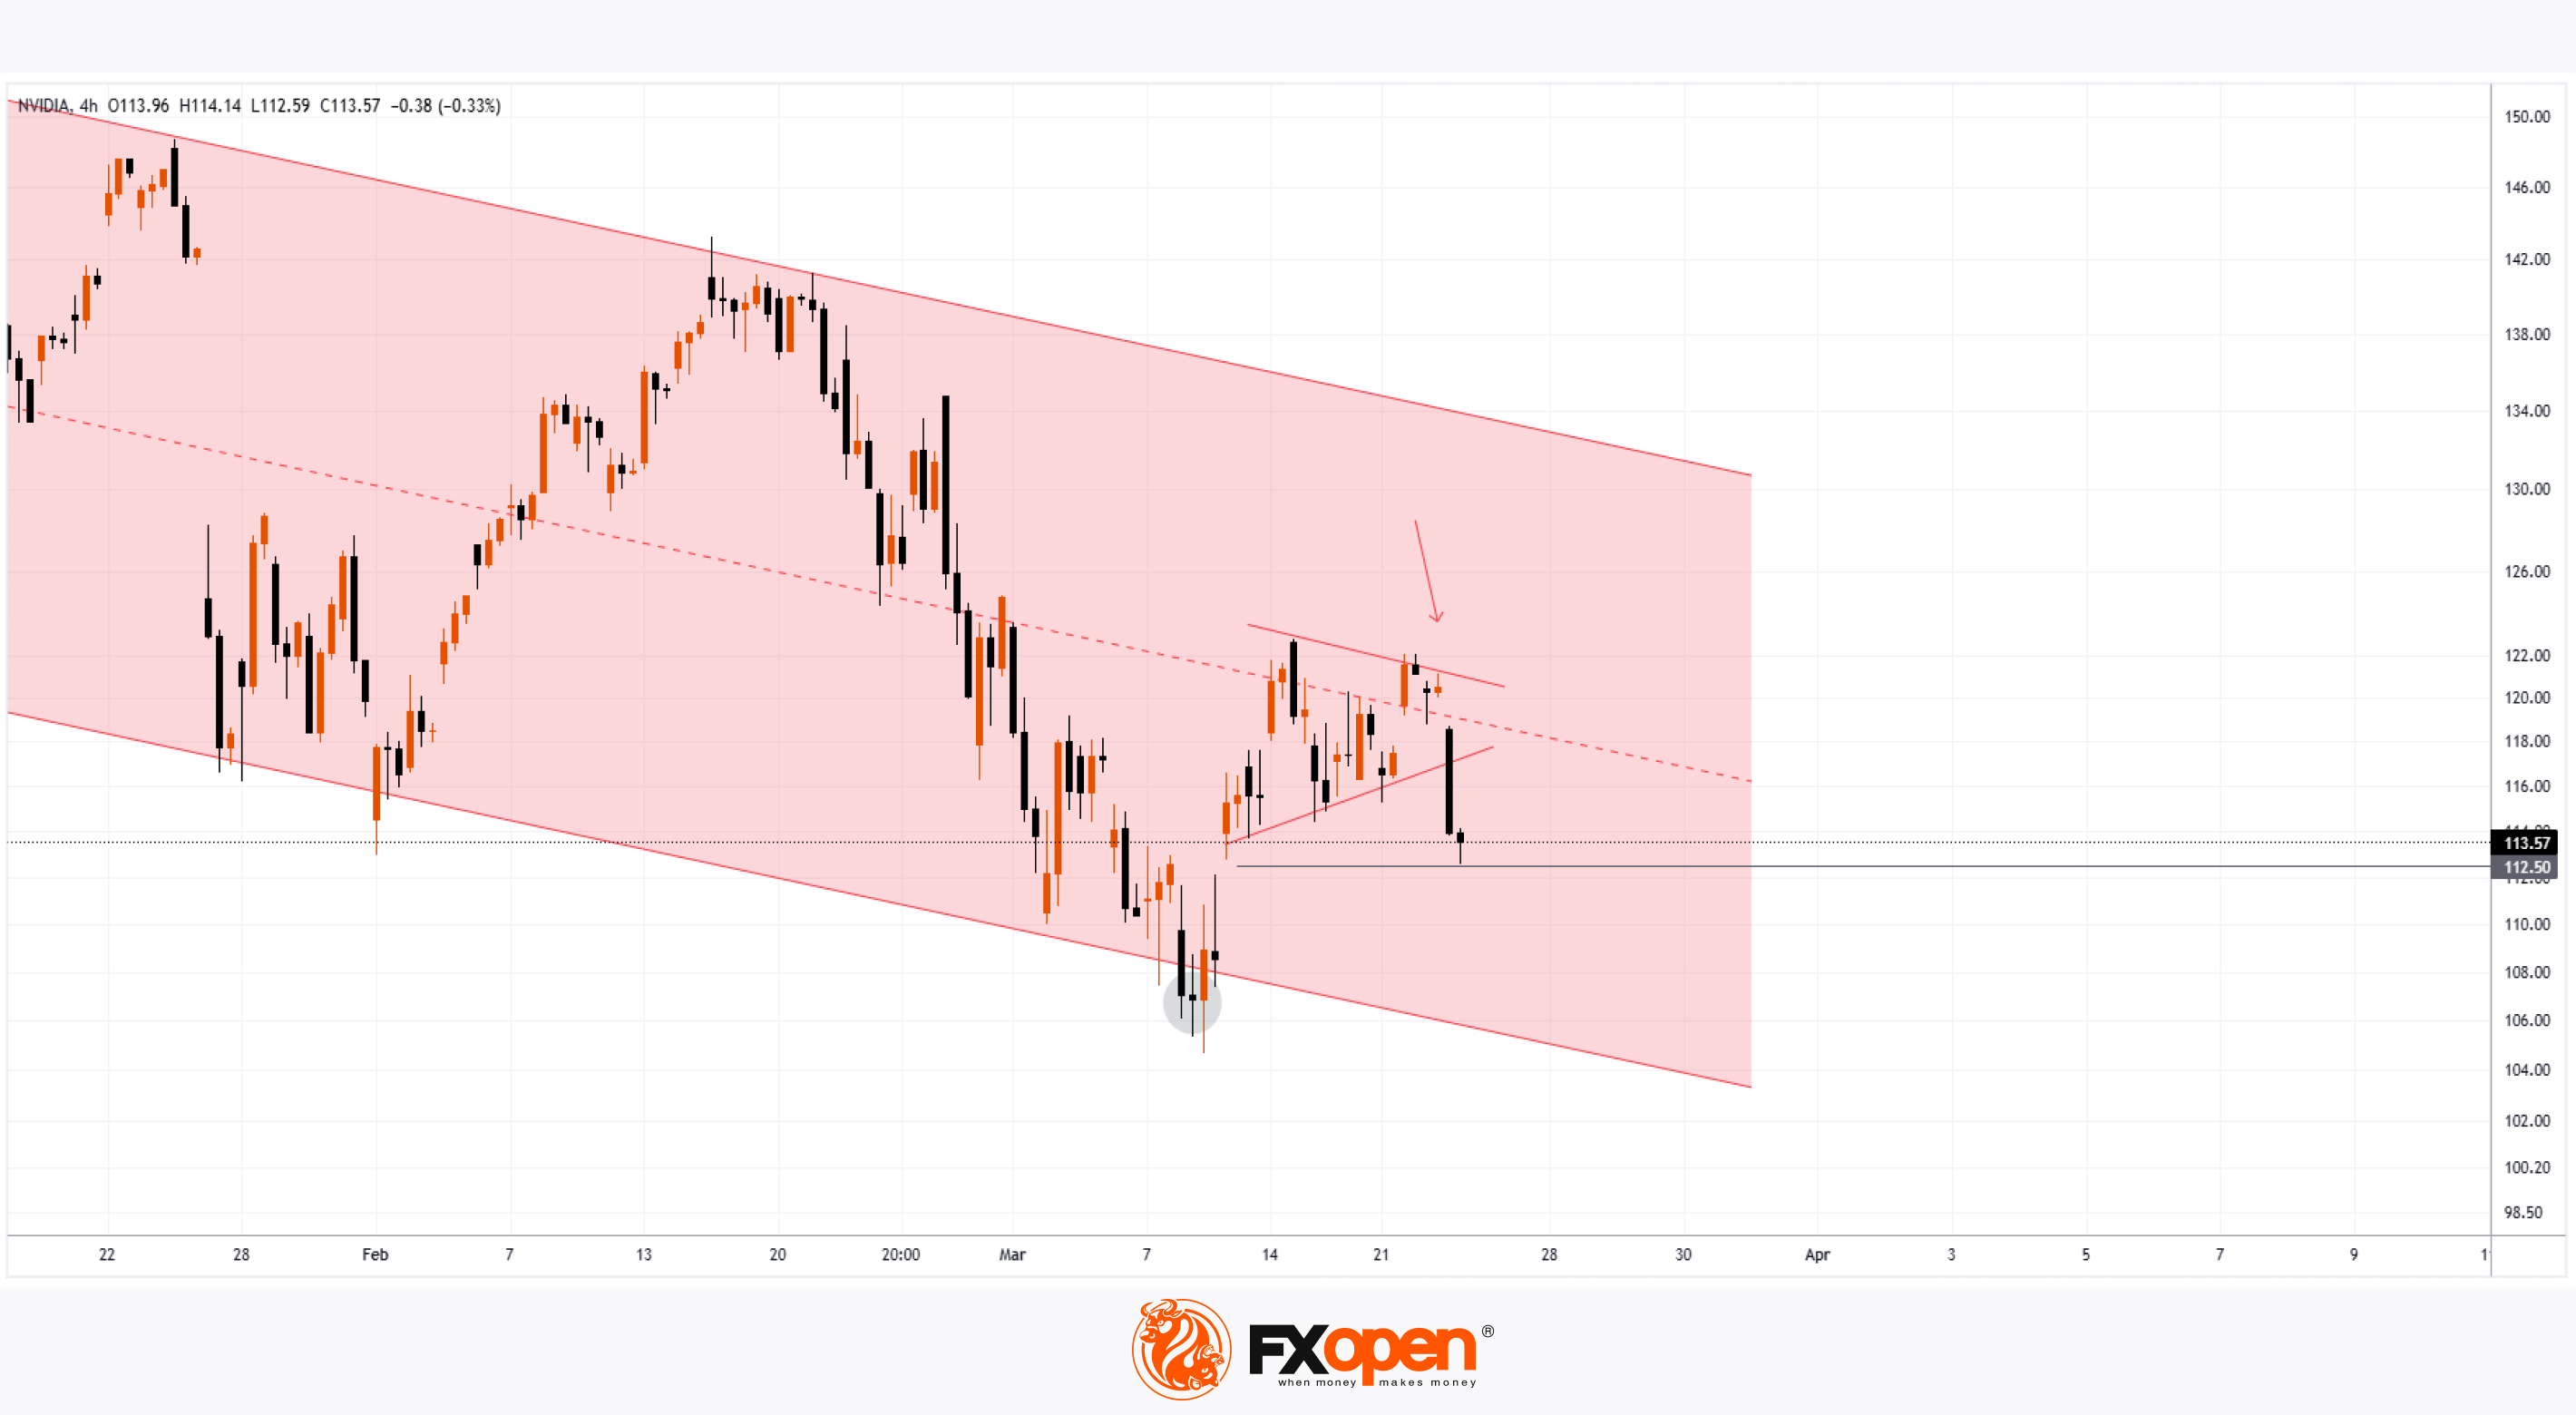
→ Establish a downward channel (marked in red).
→ Suggest that the lower boundary could act as support, which was confirmed (circled).
On 13 March, we anticipated the median line of this channel might serve as resistance, and yesterday’s ~5% drop in NVDA’s share price (marked by a red arrow) aligns with this scenario.
As a result, NVDA’s price has declined by approximately 17% since the start of 2025, despite being a market leader in 2024.
Why Did Nvidia (NVDA) Shares Drop Yesterday?
Market sentiment turned negative amid concerns that the Trump administration may soon impose previously delayed international trade tariffs.
Additionally, the Financial Times reported that Chinese regulators are encouraging firms to adopt data centre chips that meet stringent environmental standards. This raises concerns that Nvidia’s H20 chip, despite complying with U.S. export controls, may not meet China’s environmental regulations. Investors seemingly viewed this as a bearish signal for Nvidia’s future sales in China.
Technical Analysis of Nvidia’s Share Price
Currently, NVDA’s price is encountering resistance at the bullish gap formed on 12 March, around $112.50.
Given the broader market context, this setup could indicate an attempt by bears to resume the downtrend after a temporary rebound from oversold conditions. A consolidation pattern in the form of a narrowing triangle (marked in red) has also emerged.
If market conditions remain challenging, bears may push NVDA’s price towards the psychologically significant $100 level.
Trade global index CFDs with zero commission and tight spreads. Open your FXOpen account now or learn more about trading index CFDs with FXOpen.
CFDs are complex instruments and come with a high risk of losing your money.
This article represents the opinion of the Companies operating under the FXOpen brand only. It is not to be construed as an offer, solicitation, or recommendation with respect to products and services provided by the Companies operating under the FXOpen brand, nor is it to be considered financial advice.
Nvidia (NVDA) Share Price Continues Bearish Trend
Earlier this month, our analysis of NVDA's share price led us to:
→ Establish a downward channel (marked in red).
→ Suggest that the lower boundary could act as support, which was confirmed (circled).
On 13 March, we anticipated the median line of this channel might serve as resistance, and yesterday’s ~5% drop in NVDA’s share price (marked by a red arrow) aligns with this scenario.
As a result, NVDA’s price has declined by approximately 17% since the start of 2025, despite being a market leader in 2024.
Why Did Nvidia (NVDA) Shares Drop Yesterday?
Market sentiment turned negative amid concerns that the Trump administration may soon impose previously delayed international trade tariffs.
Additionally, the Financial Times reported that Chinese regulators are encouraging firms to adopt data centre chips that meet stringent environmental standards. This raises concerns that Nvidia’s H20 chip, despite complying with U.S. export controls, may not meet China’s environmental regulations. Investors seemingly viewed this as a bearish signal for Nvidia’s future sales in China.
Technical Analysis of Nvidia’s Share Price
Currently, NVDA’s price is encountering resistance at the bullish gap formed on 12 March, around $112.50.
Given the broader market context, this setup could indicate an attempt by bears to resume the downtrend after a temporary rebound from oversold conditions. A consolidation pattern in the form of a narrowing triangle (marked in red) has also emerged.
If market conditions remain challenging, bears may push NVDA’s price towards the psychologically significant $100 level.
Trade global index CFDs with zero commission and tight spreads. Open your FXOpen account now or learn more about trading index CFDs with FXOpen.
CFDs are complex instruments and come with a high risk of losing your money.
This article represents the opinion of the Companies operating under the FXOpen brand only. It is not to be construed as an offer, solicitation, or recommendation with respect to products and services provided by the Companies operating under the FXOpen brand, nor is it to be considered financial advice.
👍3
#gasprices #commodities #MarketUpdates #MarketNews
XNG/USD Analysis: Natural Gas Price Drops to March Low
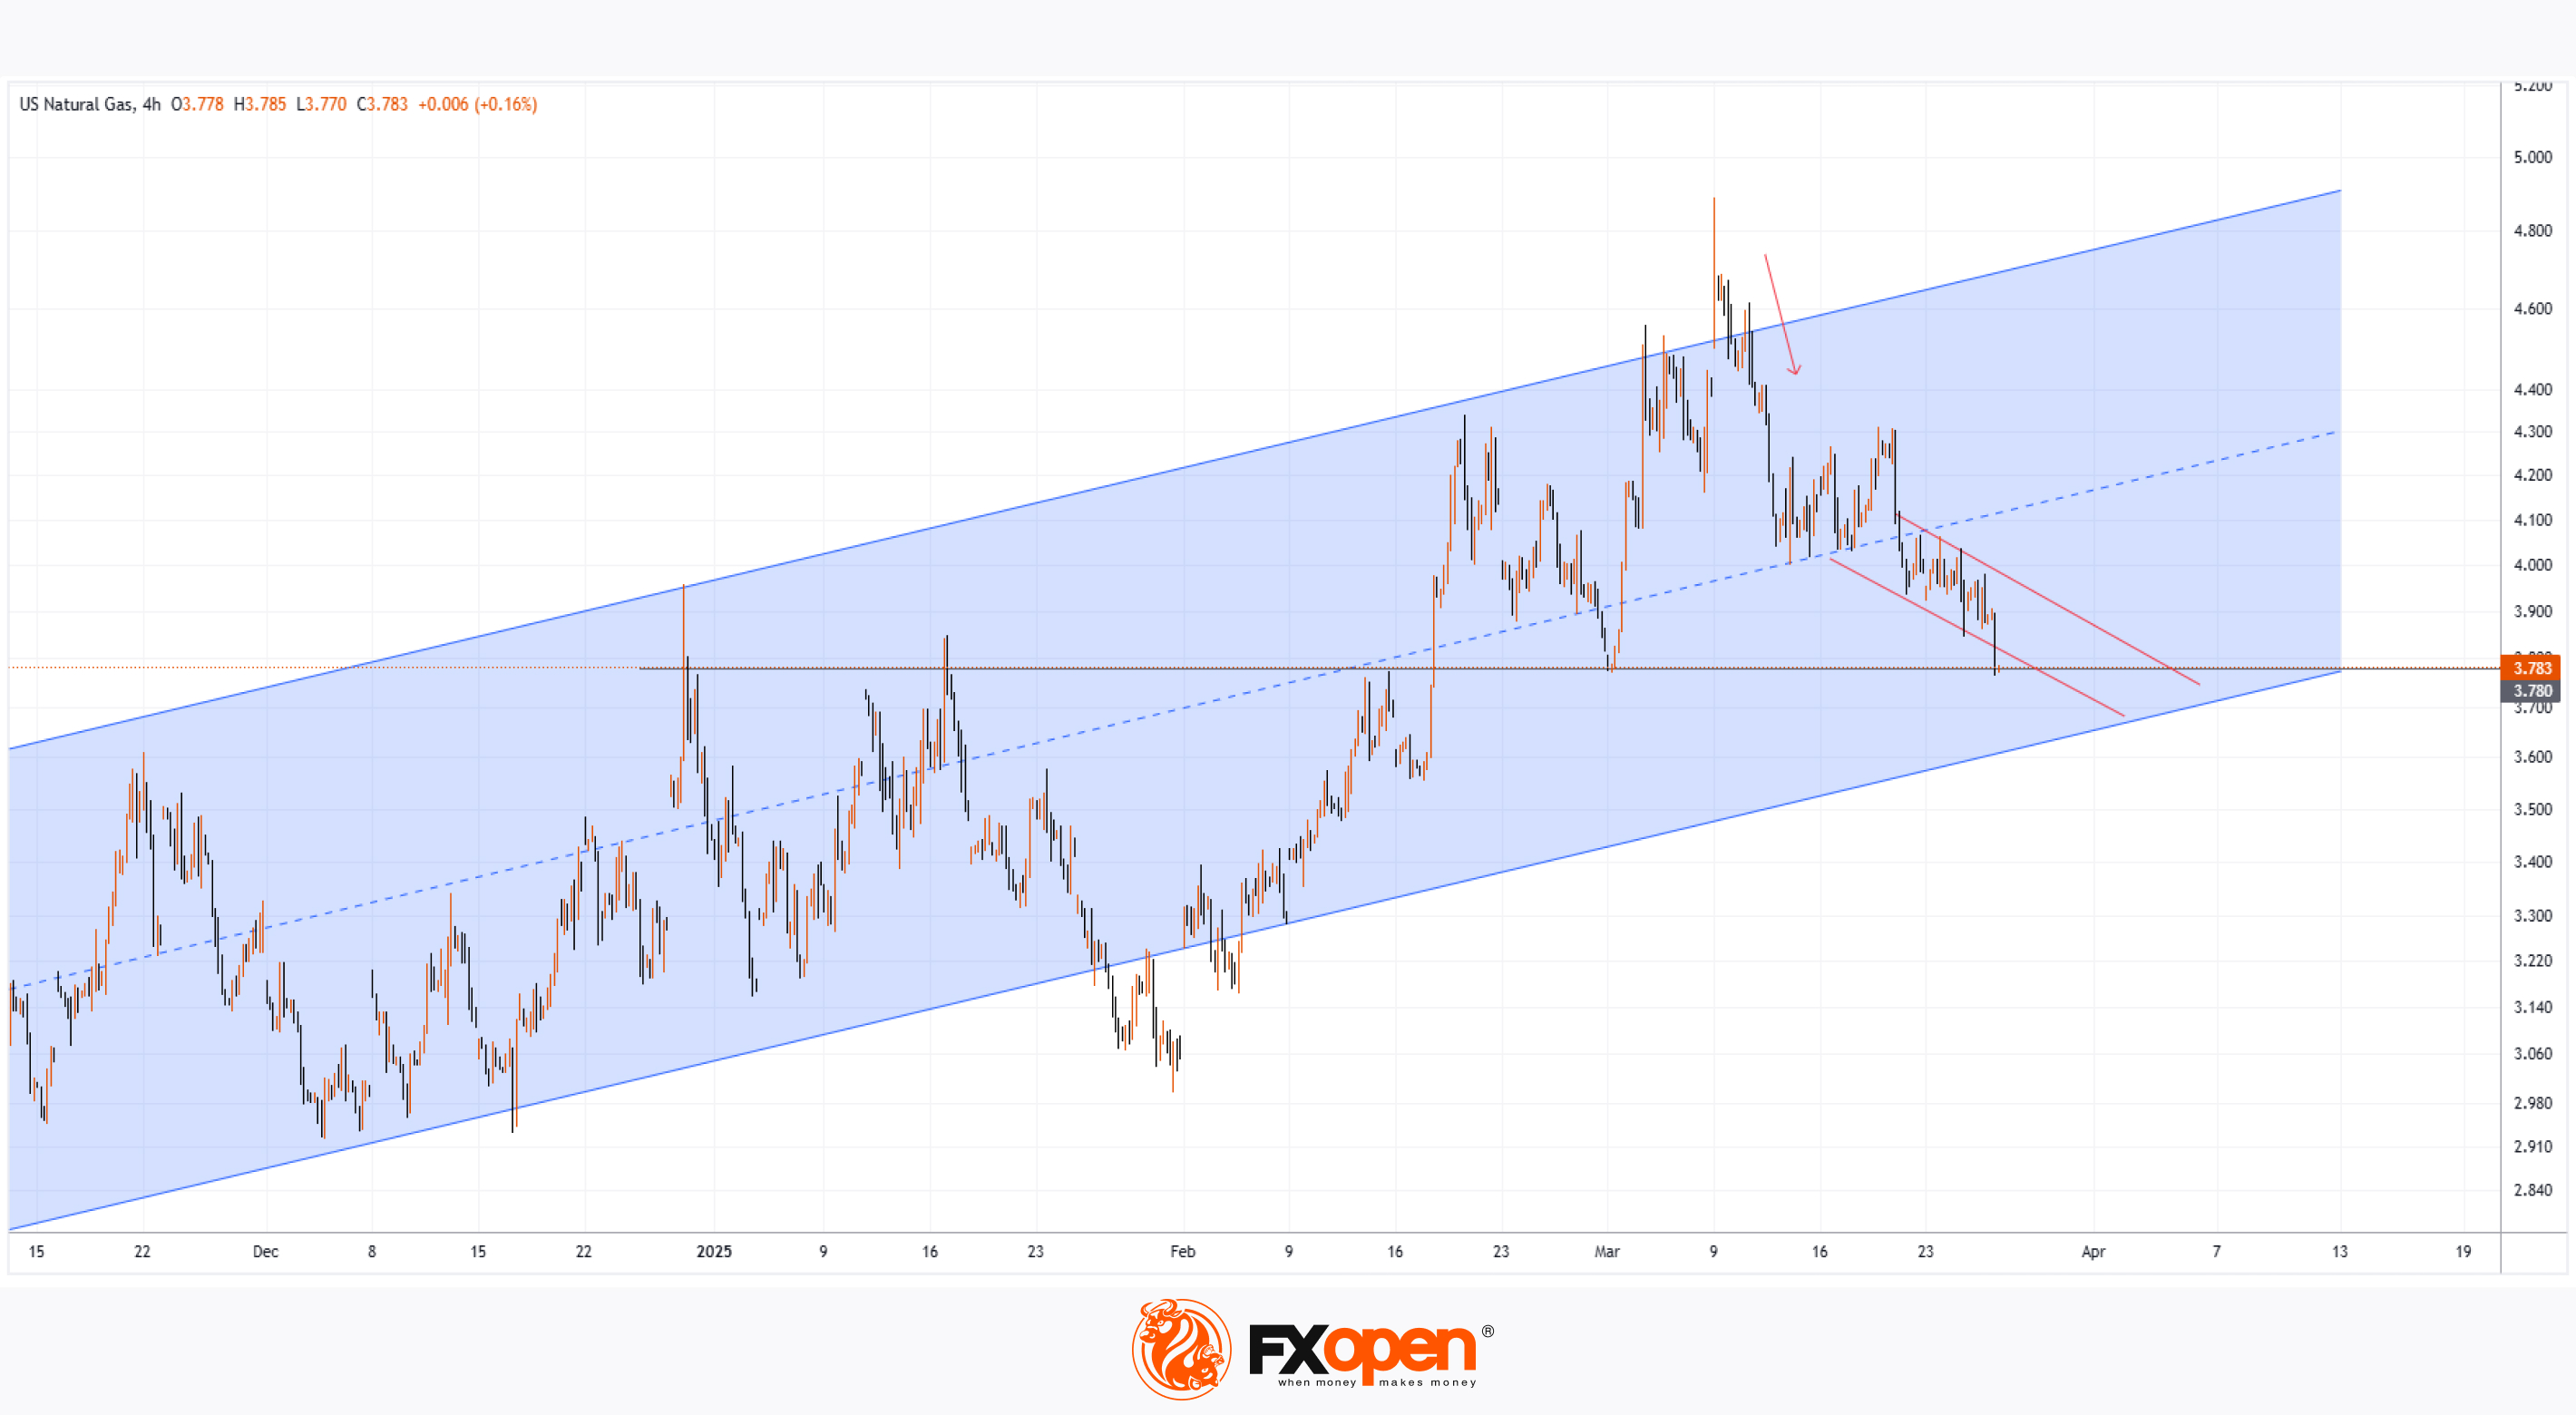
On 27 January, our analysis of the natural gas chart highlighted the formation of an ascending channel. Later, on 10 March, we noted that the sharp price increase had created technical conditions for a correction.
Since then, as indicated by the arrow on the XNG/USD chart, natural gas prices have declined by approximately 19%.
Why Is the Price of Natural Gas Falling?
▪️Unseasonably Warm Weather: Atmospheric G2 reported on Wednesday that forecasts now indicate significant warming across the eastern half of the U.S. from 31 March to 4 April. This could reduce demand for natural gas used in heating.
▪️Rising Inventories: According to the EIA’s forecast, weekly natural gas storage levels are expected to increase by +33 billion cubic feet over the past week.
Technical Analysis of XNG/USD Chart
Looking at the broader trend since the start of the year, the ascending channel (marked in blue) remains relevant. However, bears have pushed the price below its median line, shifting movement into a short-term downward channel (marked in red).
Currently, natural gas is trading near the $3.780/MMBtu level, a key price point that has previously acted as both support and resistance. Whether a bearish breakdown or a bullish rebound occurs largely depends on the upcoming EIA report, scheduled for release at 17:30 GMT+3.
Start trading commodities with tight spreads. Open your trading account now or learn more about trading commodity CFDs with FXOpen.
CFDs are complex instruments and come with a high risk of losing your money.
This article represents the opinion of the Companies operating under the FXOpen brand only. It is not to be construed as an offer, solicitation, or recommendation with respect to products and services provided by the Companies operating under the FXOpen brand, nor is it to be considered financial advice.
XNG/USD Analysis: Natural Gas Price Drops to March Low
On 27 January, our analysis of the natural gas chart highlighted the formation of an ascending channel. Later, on 10 March, we noted that the sharp price increase had created technical conditions for a correction.
Since then, as indicated by the arrow on the XNG/USD chart, natural gas prices have declined by approximately 19%.
Why Is the Price of Natural Gas Falling?
▪️Unseasonably Warm Weather: Atmospheric G2 reported on Wednesday that forecasts now indicate significant warming across the eastern half of the U.S. from 31 March to 4 April. This could reduce demand for natural gas used in heating.
▪️Rising Inventories: According to the EIA’s forecast, weekly natural gas storage levels are expected to increase by +33 billion cubic feet over the past week.
Technical Analysis of XNG/USD Chart
Looking at the broader trend since the start of the year, the ascending channel (marked in blue) remains relevant. However, bears have pushed the price below its median line, shifting movement into a short-term downward channel (marked in red).
Currently, natural gas is trading near the $3.780/MMBtu level, a key price point that has previously acted as both support and resistance. Whether a bearish breakdown or a bullish rebound occurs largely depends on the upcoming EIA report, scheduled for release at 17:30 GMT+3.
Start trading commodities with tight spreads. Open your trading account now or learn more about trading commodity CFDs with FXOpen.
CFDs are complex instruments and come with a high risk of losing your money.
This article represents the opinion of the Companies operating under the FXOpen brand only. It is not to be construed as an offer, solicitation, or recommendation with respect to products and services provided by the Companies operating under the FXOpen brand, nor is it to be considered financial advice.
👍3
#XAUUSD #goldprice #commodities #MarketNews
Gold Price Hits Record High
On 19 March, we reported that gold had surpassed $3,000 per ounce for the first time in history and suggested this psychological level could be tested.
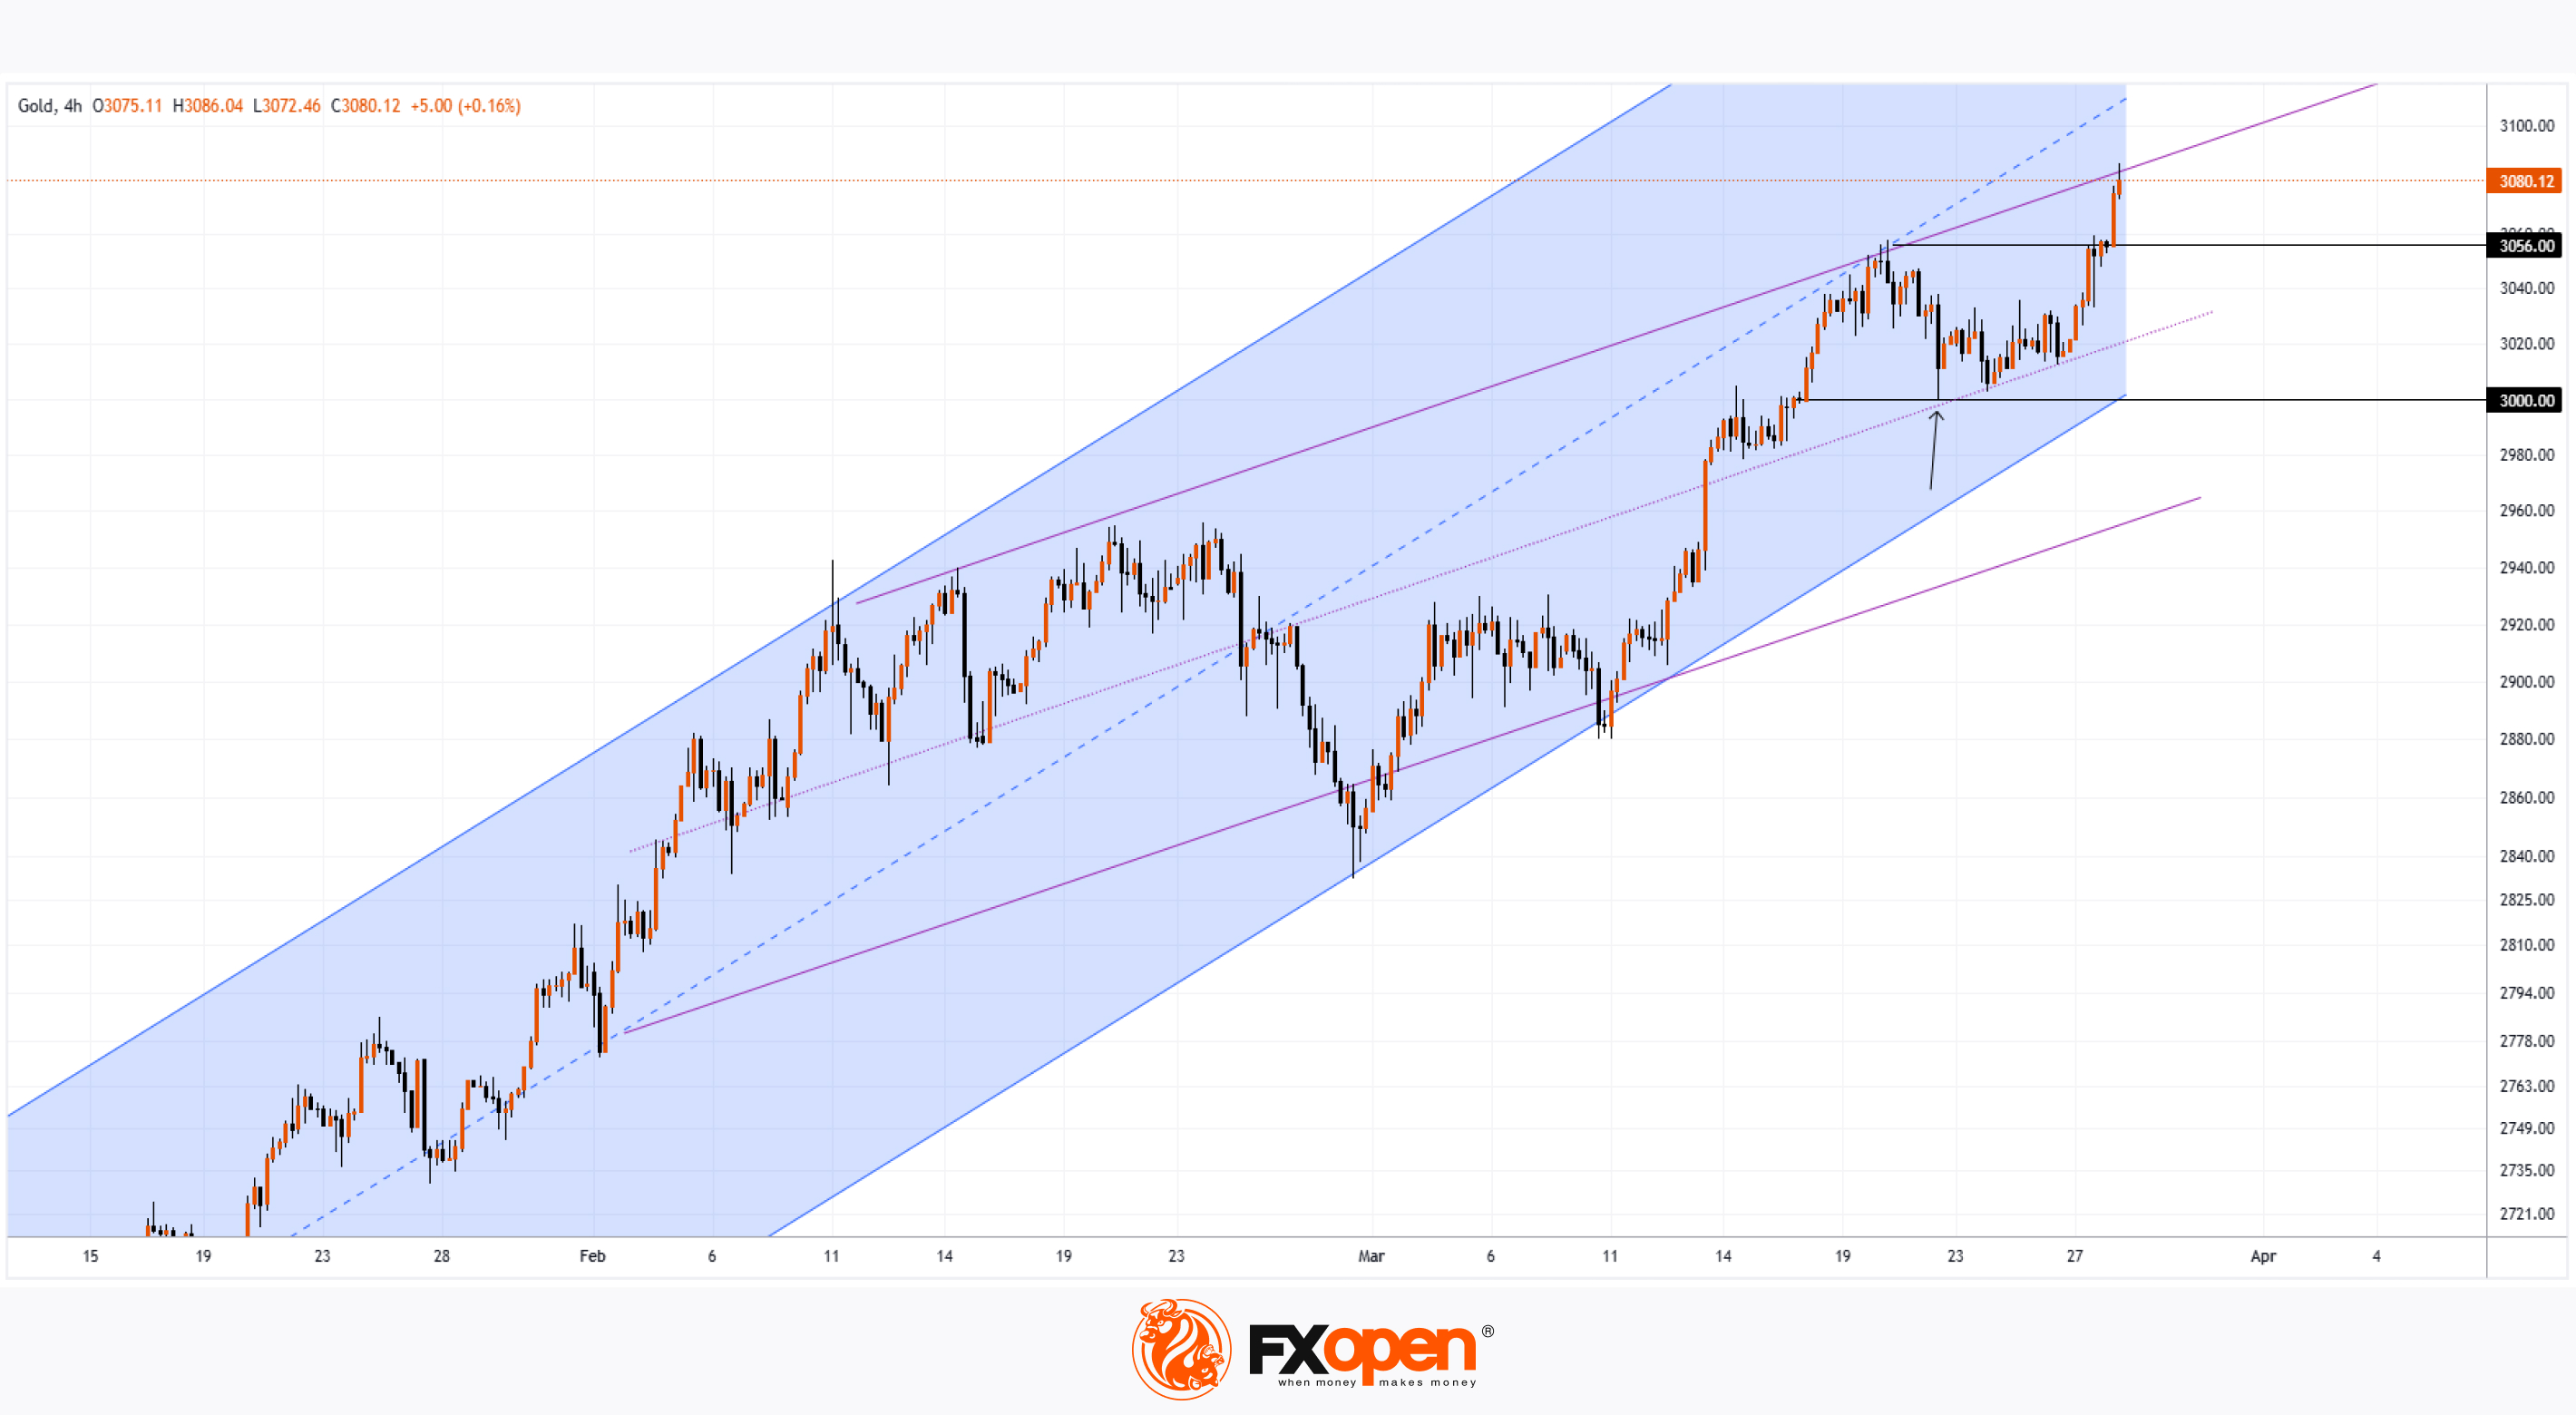
As shown on the XAU/USD chart, the price briefly dipped below $3,000 but quickly rebounded. According to the Smart Money Concept methodology, this may have been a liquidity sweep triggered by stop-loss orders placed below the key level. Regardless, the test occurred (as indicated by the arrow), and the bulls resumed the rally. The new all-time high is now around $3,080 and could be broken again today.
Why Is Gold Rising?
➝ Uncertainty over Trump’s tariff plans
➝ Expectations of lower interest rates
Gold is traditionally seen as a hedge against economic and political uncertainty and tends to perform well in a low-rate environment. Analysts at Goldman Sachs have raised their year-end 2025 gold price forecast to $3,300.
Technical Analysis of XAU/USD
➝ Looking at gold’s broader trend, price movements continue to follow an upward channel (marked in blue), which has remained relevant since early 2025.
➝ Alternatively, a second, less steep ascending channel (marked in purple) suggests that gold is currently near its upper boundary, indicating a possible pullback. However, the $3,056 level—previously resistance—could now act as support, paving the way for a move towards the next milestone at $3,100.
Start trading commodities with tight spreads. Open your trading account now or learn more about trading commodity CFDs with FXOpen.
CFDs are complex instruments and come with a high risk of losing your money.
This article represents the opinion of the Companies operating under the FXOpen brand only. It is not to be construed as an offer, solicitation, or recommendation with respect to products and services provided by the Companies operating under the FXOpen brand, nor is it to be considered financial advice.
Gold Price Hits Record High
On 19 March, we reported that gold had surpassed $3,000 per ounce for the first time in history and suggested this psychological level could be tested.
As shown on the XAU/USD chart, the price briefly dipped below $3,000 but quickly rebounded. According to the Smart Money Concept methodology, this may have been a liquidity sweep triggered by stop-loss orders placed below the key level. Regardless, the test occurred (as indicated by the arrow), and the bulls resumed the rally. The new all-time high is now around $3,080 and could be broken again today.
Why Is Gold Rising?
➝ Uncertainty over Trump’s tariff plans
➝ Expectations of lower interest rates
Gold is traditionally seen as a hedge against economic and political uncertainty and tends to perform well in a low-rate environment. Analysts at Goldman Sachs have raised their year-end 2025 gold price forecast to $3,300.
Technical Analysis of XAU/USD
➝ Looking at gold’s broader trend, price movements continue to follow an upward channel (marked in blue), which has remained relevant since early 2025.
➝ Alternatively, a second, less steep ascending channel (marked in purple) suggests that gold is currently near its upper boundary, indicating a possible pullback. However, the $3,056 level—previously resistance—could now act as support, paving the way for a move towards the next milestone at $3,100.
Start trading commodities with tight spreads. Open your trading account now or learn more about trading commodity CFDs with FXOpen.
CFDs are complex instruments and come with a high risk of losing your money.
This article represents the opinion of the Companies operating under the FXOpen brand only. It is not to be construed as an offer, solicitation, or recommendation with respect to products and services provided by the Companies operating under the FXOpen brand, nor is it to be considered financial advice.
👍2
#stockmarket #stocktrading #trumptariff #MarketUpdates #marketanalysis
Ford (F) Share Price Drops Following Trump's Tariffs
President Trump has fulfilled his promise to impose tariffs on foreign car manufacturers, introducing a 25% tariff on all cars and light trucks not made in the United States, as well as on "certain auto parts."
As reported by Yahoo Finance: "This will continue to drive growth like you've never seen before," Trump stated from the White House on Wednesday while signing the tariff order. The 25% tariffs are set to take effect on 2 April, adding to existing duties. The White House announced that $100 billion in annual tariffs would be collected.
Why Have Ford (F) Shares Fallen?
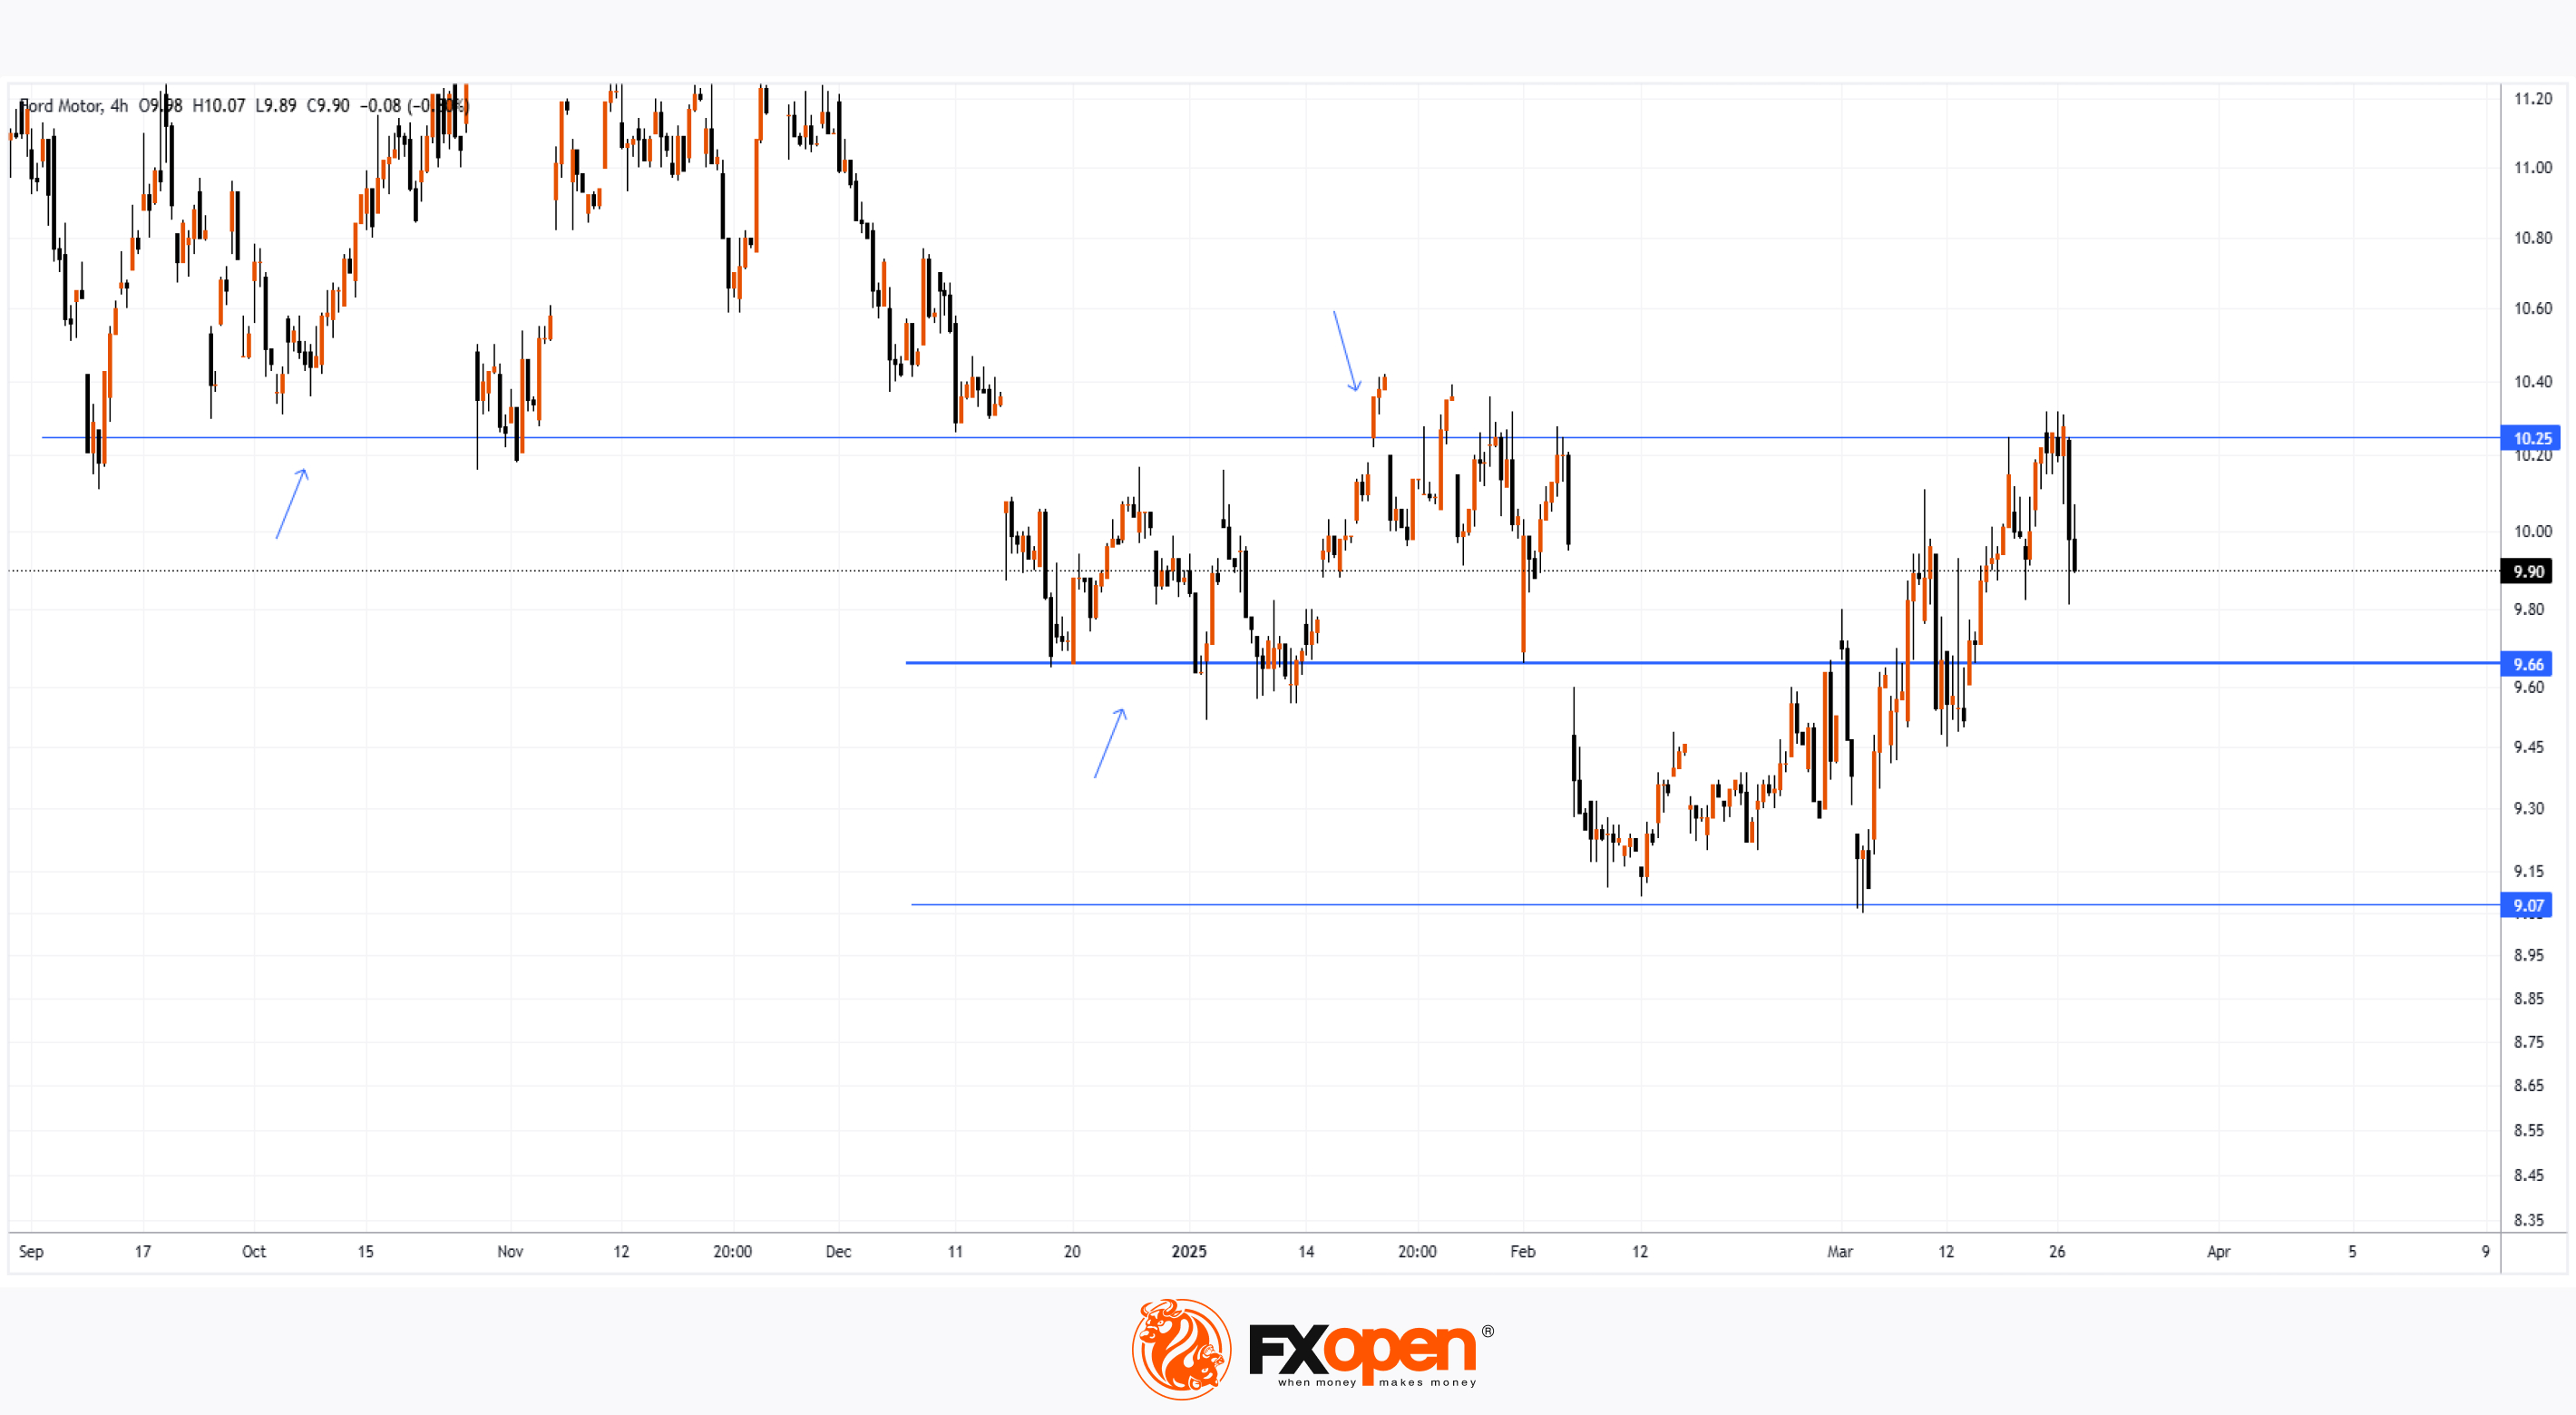
Trump’s decision has led to a sharp drop in car manufacturers’ share prices, particularly in Europe. However, shares of American automakers have also declined. Ford (F) shares, according to the price chart, fell by approximately 4% yesterday.
This decline is due to the fact that Ford (as well as GM and Stellantis) has manufacturing facilities in Canada, Mexico, and China, which now means higher costs due to the impact of tariffs on supply chains.
Technical Analysis of Ford (F) Share Price Chart
As we noted when analysing Ford (F) shares on 6 March, Trump's tariff policy previously helped the price recover from a four-year low.
However, it now seems that “the pendulum has swung the other way.” Examining the price chart, we can identify three levels that actively interact with the price (some key reversals are marked with an arrow), with the middle level appearing to act as a median for the "pendulum" of market sentiment.
From this perspective, we can reasonably assume that:
→ The $10.25 level continues to act as resistance;
→ The $9.66 level, acting as a median for Ford (F) price fluctuations, may "attract" the price.
Trade global index CFDs with zero commission and tight spreads. Open your FXOpen account now or learn more about trading index CFDs with FXOpen.
CFDs are complex instruments and come with a high risk of losing your money.
This article represents the opinion of the Companies operating under the FXOpen brand only. It is not to be construed as an offer, solicitation, or recommendation with respect to products and services provided by the Companies operating under the FXOpen brand, nor is it to be considered financial advice.
Ford (F) Share Price Drops Following Trump's Tariffs
President Trump has fulfilled his promise to impose tariffs on foreign car manufacturers, introducing a 25% tariff on all cars and light trucks not made in the United States, as well as on "certain auto parts."
As reported by Yahoo Finance: "This will continue to drive growth like you've never seen before," Trump stated from the White House on Wednesday while signing the tariff order. The 25% tariffs are set to take effect on 2 April, adding to existing duties. The White House announced that $100 billion in annual tariffs would be collected.
Why Have Ford (F) Shares Fallen?
Trump’s decision has led to a sharp drop in car manufacturers’ share prices, particularly in Europe. However, shares of American automakers have also declined. Ford (F) shares, according to the price chart, fell by approximately 4% yesterday.
This decline is due to the fact that Ford (as well as GM and Stellantis) has manufacturing facilities in Canada, Mexico, and China, which now means higher costs due to the impact of tariffs on supply chains.
Technical Analysis of Ford (F) Share Price Chart
As we noted when analysing Ford (F) shares on 6 March, Trump's tariff policy previously helped the price recover from a four-year low.
However, it now seems that “the pendulum has swung the other way.” Examining the price chart, we can identify three levels that actively interact with the price (some key reversals are marked with an arrow), with the middle level appearing to act as a median for the "pendulum" of market sentiment.
From this perspective, we can reasonably assume that:
→ The $10.25 level continues to act as resistance;
→ The $9.66 level, acting as a median for Ford (F) price fluctuations, may "attract" the price.
Trade global index CFDs with zero commission and tight spreads. Open your FXOpen account now or learn more about trading index CFDs with FXOpen.
CFDs are complex instruments and come with a high risk of losing your money.
This article represents the opinion of the Companies operating under the FXOpen brand only. It is not to be construed as an offer, solicitation, or recommendation with respect to products and services provided by the Companies operating under the FXOpen brand, nor is it to be considered financial advice.
👍2
#marketanalysis #stockmarket #stocks #MarketUpdates
Stock Markets Decline Amid Trump Tariff News
Comparing the approximate difference between last week's opening and closing prices on stock index charts:
➝ The US S&P 500 (US SPX 500 mini on FXOpen) fell by 2.4%.
➝ The European Euro Stoxx 50 (Europe 50 on FXOpen) dropped by 2%.
Why Are Stocks Falling?
The bearish sentiment in stock markets is largely driven by news surrounding White House tariff policies, as reflected in Federal Reserve statements late last week:
➝ Boston Fed President Susan Collins stated that tariffs will "inevitably" fuel inflation, at least in the short term.
➝ Richmond Fed President Thomas Barkin noted that rapid shifts in US trade policy have created uncertainty for businesses.
US developments are also weighing on European stock markets, which were already under pressure following President Donald Trump’s announcement of a 25% tariff on foreign cars. Trump has also threatened further tariffs on the EU and Canada, heightening trade tensions.
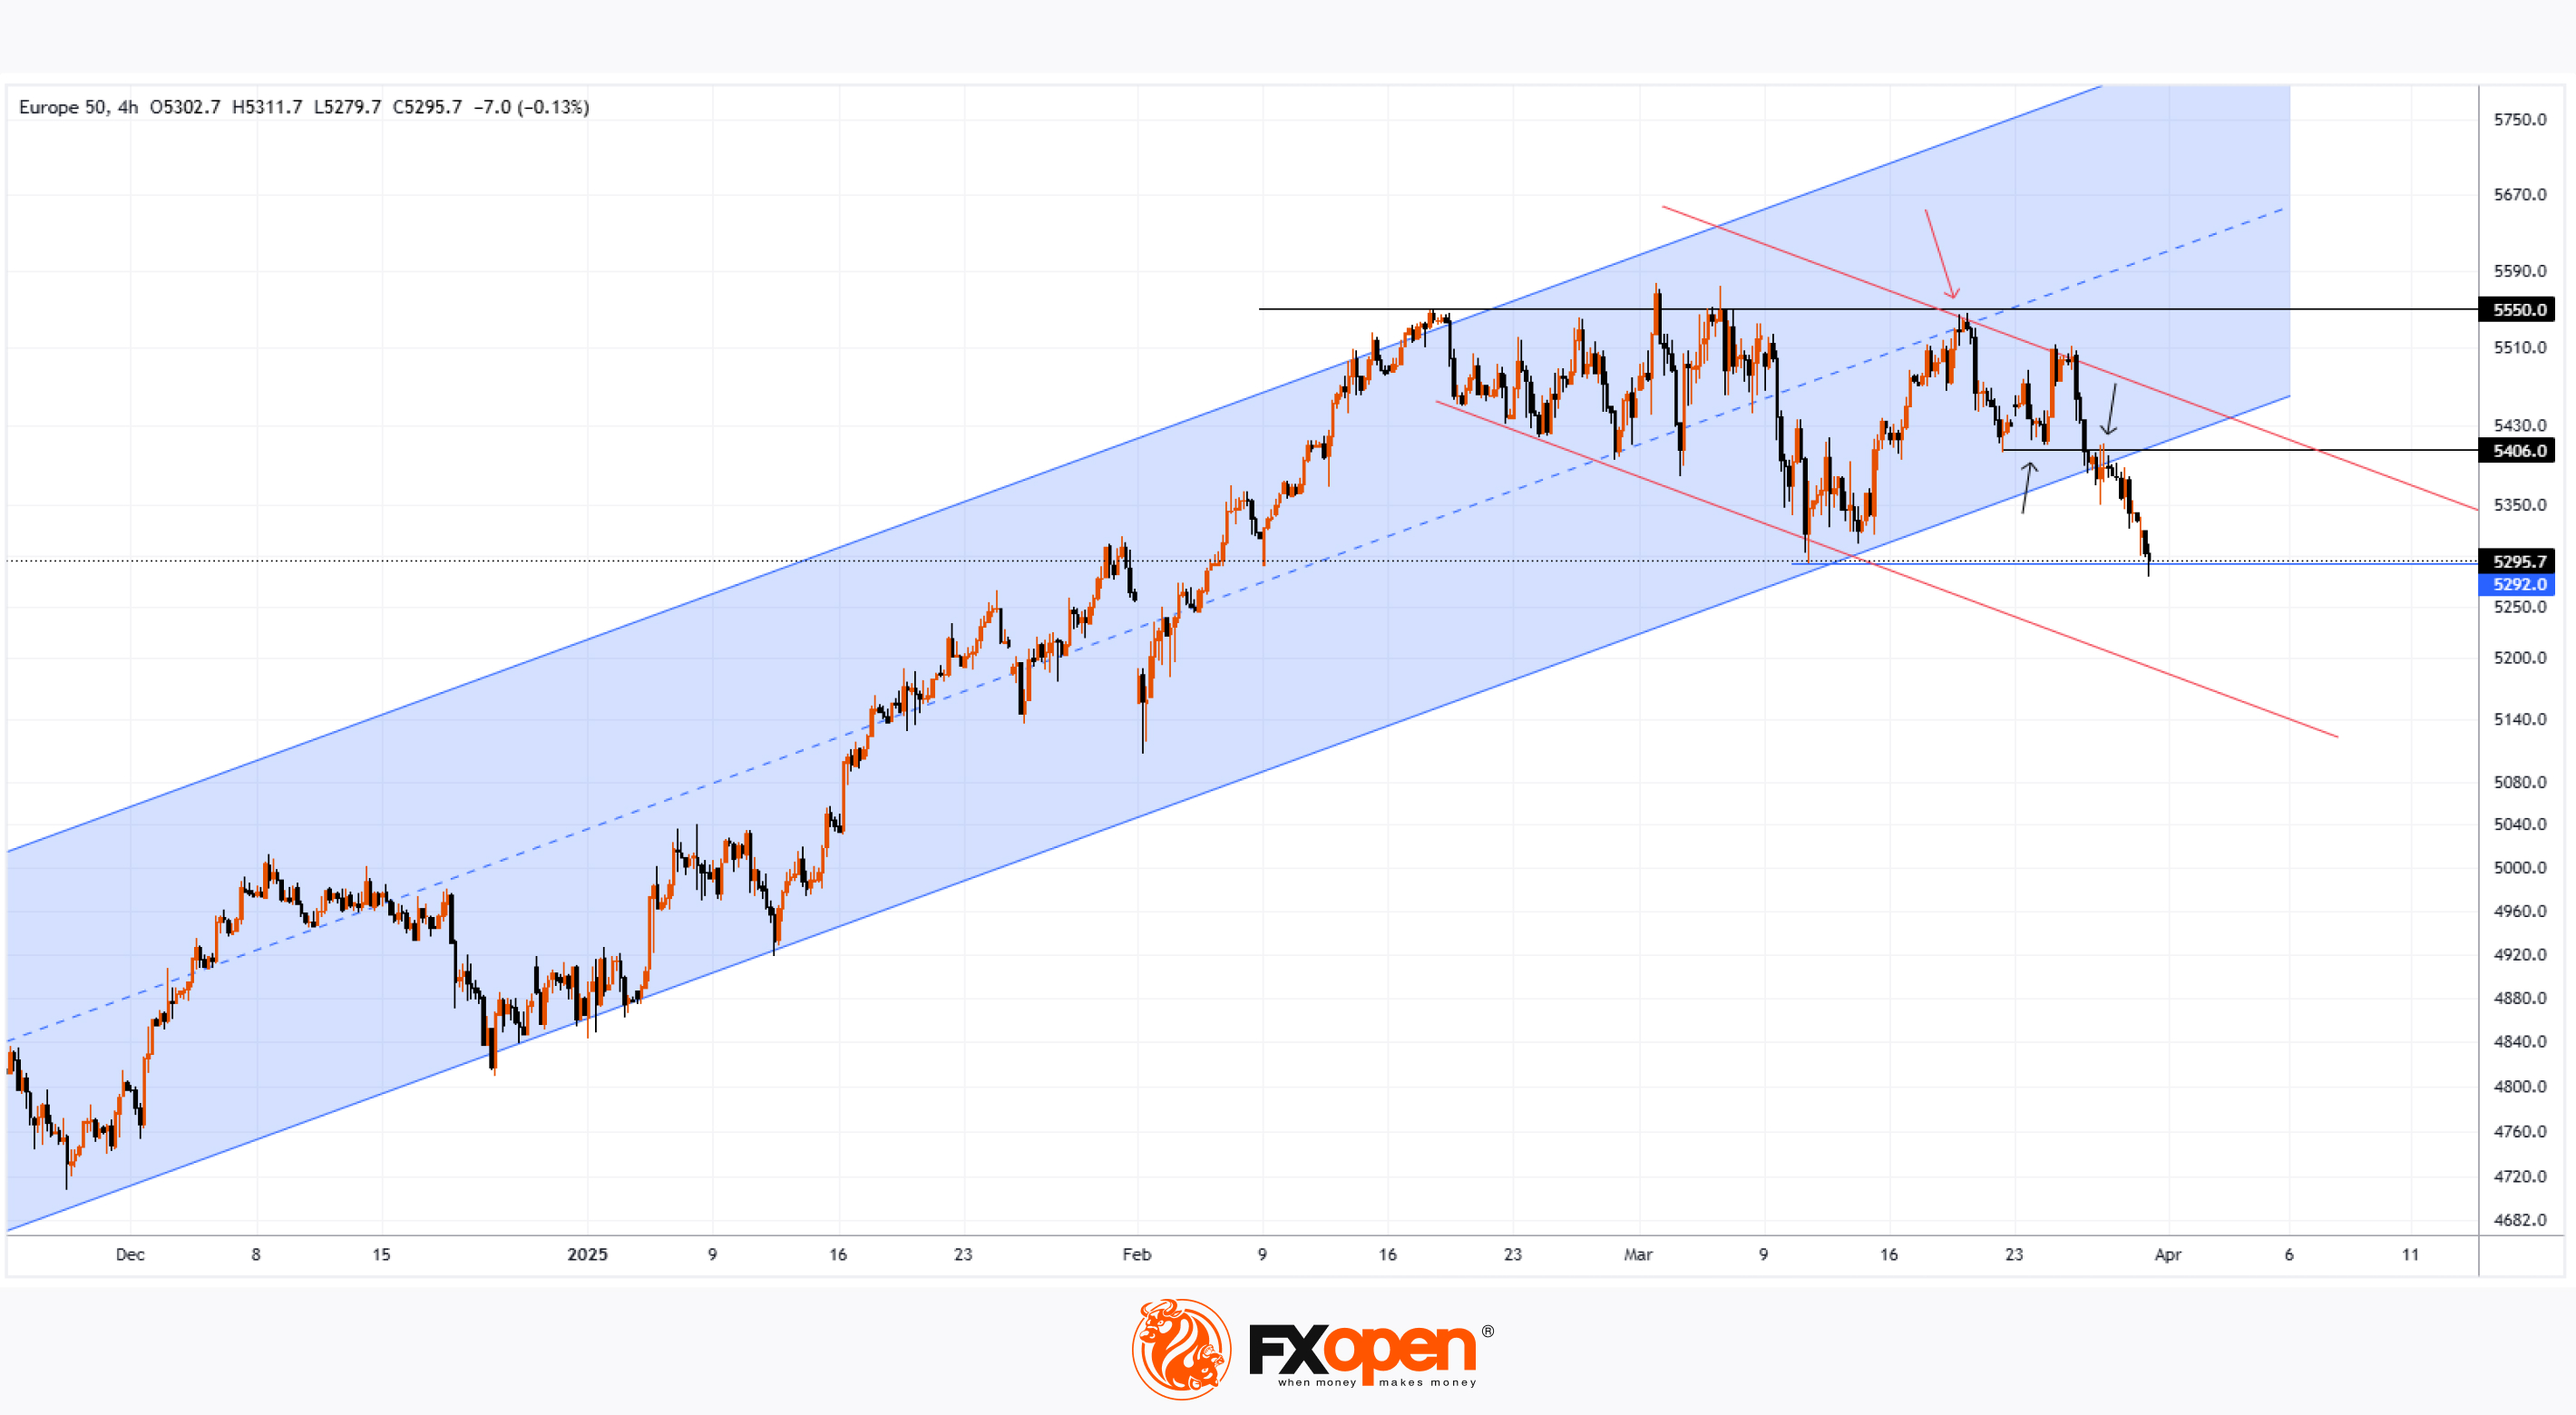
Today, the Euro Stoxx 50 index opened with a bearish gap, hitting its lowest level since early 2025, falling below the previous yearly low of 5,292. This reflects growing market concerns ahead of 2 April, when Trump is expected to confirm the implementation of new tariffs.
Technical Analysis of the Euro Stoxx 50 Index (Europe 50 on FXOpen)
Since late 2024, the price has been moving within an ascending channel (marked in blue), but today, it has fallen below the lower boundary—suggesting the channel is losing relevance. Bearish dominance is evident through the following signals:
➝ The 5,550 level proved to be an insurmountable resistance for bulls.
➝ The median of the blue channel acted as resistance (marked by a red arrow).
➝ The 5,406 level shifted from support to resistance (marked by black arrows).
If the bearish trend persists, the Euro Stoxx 50 index (Europe 50 on FXOpen) could continue fluctuating within a descending channel (outlined in red).
Trade global index CFDs with zero commission and tight spreads. Open your FXOpen account now or learn more about trading index CFDs with FXOpen.
CFDs are complex instruments and come with a high risk of losing your money.
This article represents the opinion of the Companies operating under the FXOpen brand only. It is not to be construed as an offer, solicitation, or recommendation with respect to products and services provided by the Companies operating under the FXOpen brand, nor is it to be considered financial advice.
Stock Markets Decline Amid Trump Tariff News
Comparing the approximate difference between last week's opening and closing prices on stock index charts:
➝ The US S&P 500 (US SPX 500 mini on FXOpen) fell by 2.4%.
➝ The European Euro Stoxx 50 (Europe 50 on FXOpen) dropped by 2%.
Why Are Stocks Falling?
The bearish sentiment in stock markets is largely driven by news surrounding White House tariff policies, as reflected in Federal Reserve statements late last week:
➝ Boston Fed President Susan Collins stated that tariffs will "inevitably" fuel inflation, at least in the short term.
➝ Richmond Fed President Thomas Barkin noted that rapid shifts in US trade policy have created uncertainty for businesses.
US developments are also weighing on European stock markets, which were already under pressure following President Donald Trump’s announcement of a 25% tariff on foreign cars. Trump has also threatened further tariffs on the EU and Canada, heightening trade tensions.
Today, the Euro Stoxx 50 index opened with a bearish gap, hitting its lowest level since early 2025, falling below the previous yearly low of 5,292. This reflects growing market concerns ahead of 2 April, when Trump is expected to confirm the implementation of new tariffs.
Technical Analysis of the Euro Stoxx 50 Index (Europe 50 on FXOpen)
Since late 2024, the price has been moving within an ascending channel (marked in blue), but today, it has fallen below the lower boundary—suggesting the channel is losing relevance. Bearish dominance is evident through the following signals:
➝ The 5,550 level proved to be an insurmountable resistance for bulls.
➝ The median of the blue channel acted as resistance (marked by a red arrow).
➝ The 5,406 level shifted from support to resistance (marked by black arrows).
If the bearish trend persists, the Euro Stoxx 50 index (Europe 50 on FXOpen) could continue fluctuating within a descending channel (outlined in red).
Trade global index CFDs with zero commission and tight spreads. Open your FXOpen account now or learn more about trading index CFDs with FXOpen.
CFDs are complex instruments and come with a high risk of losing your money.
This article represents the opinion of the Companies operating under the FXOpen brand only. It is not to be construed as an offer, solicitation, or recommendation with respect to products and services provided by the Companies operating under the FXOpen brand, nor is it to be considered financial advice.
👍2
#stockmarket #stocktrading #GOOGL #MarketUpdates
Alphabet (GOOGL) Stock Hits 2025 Low
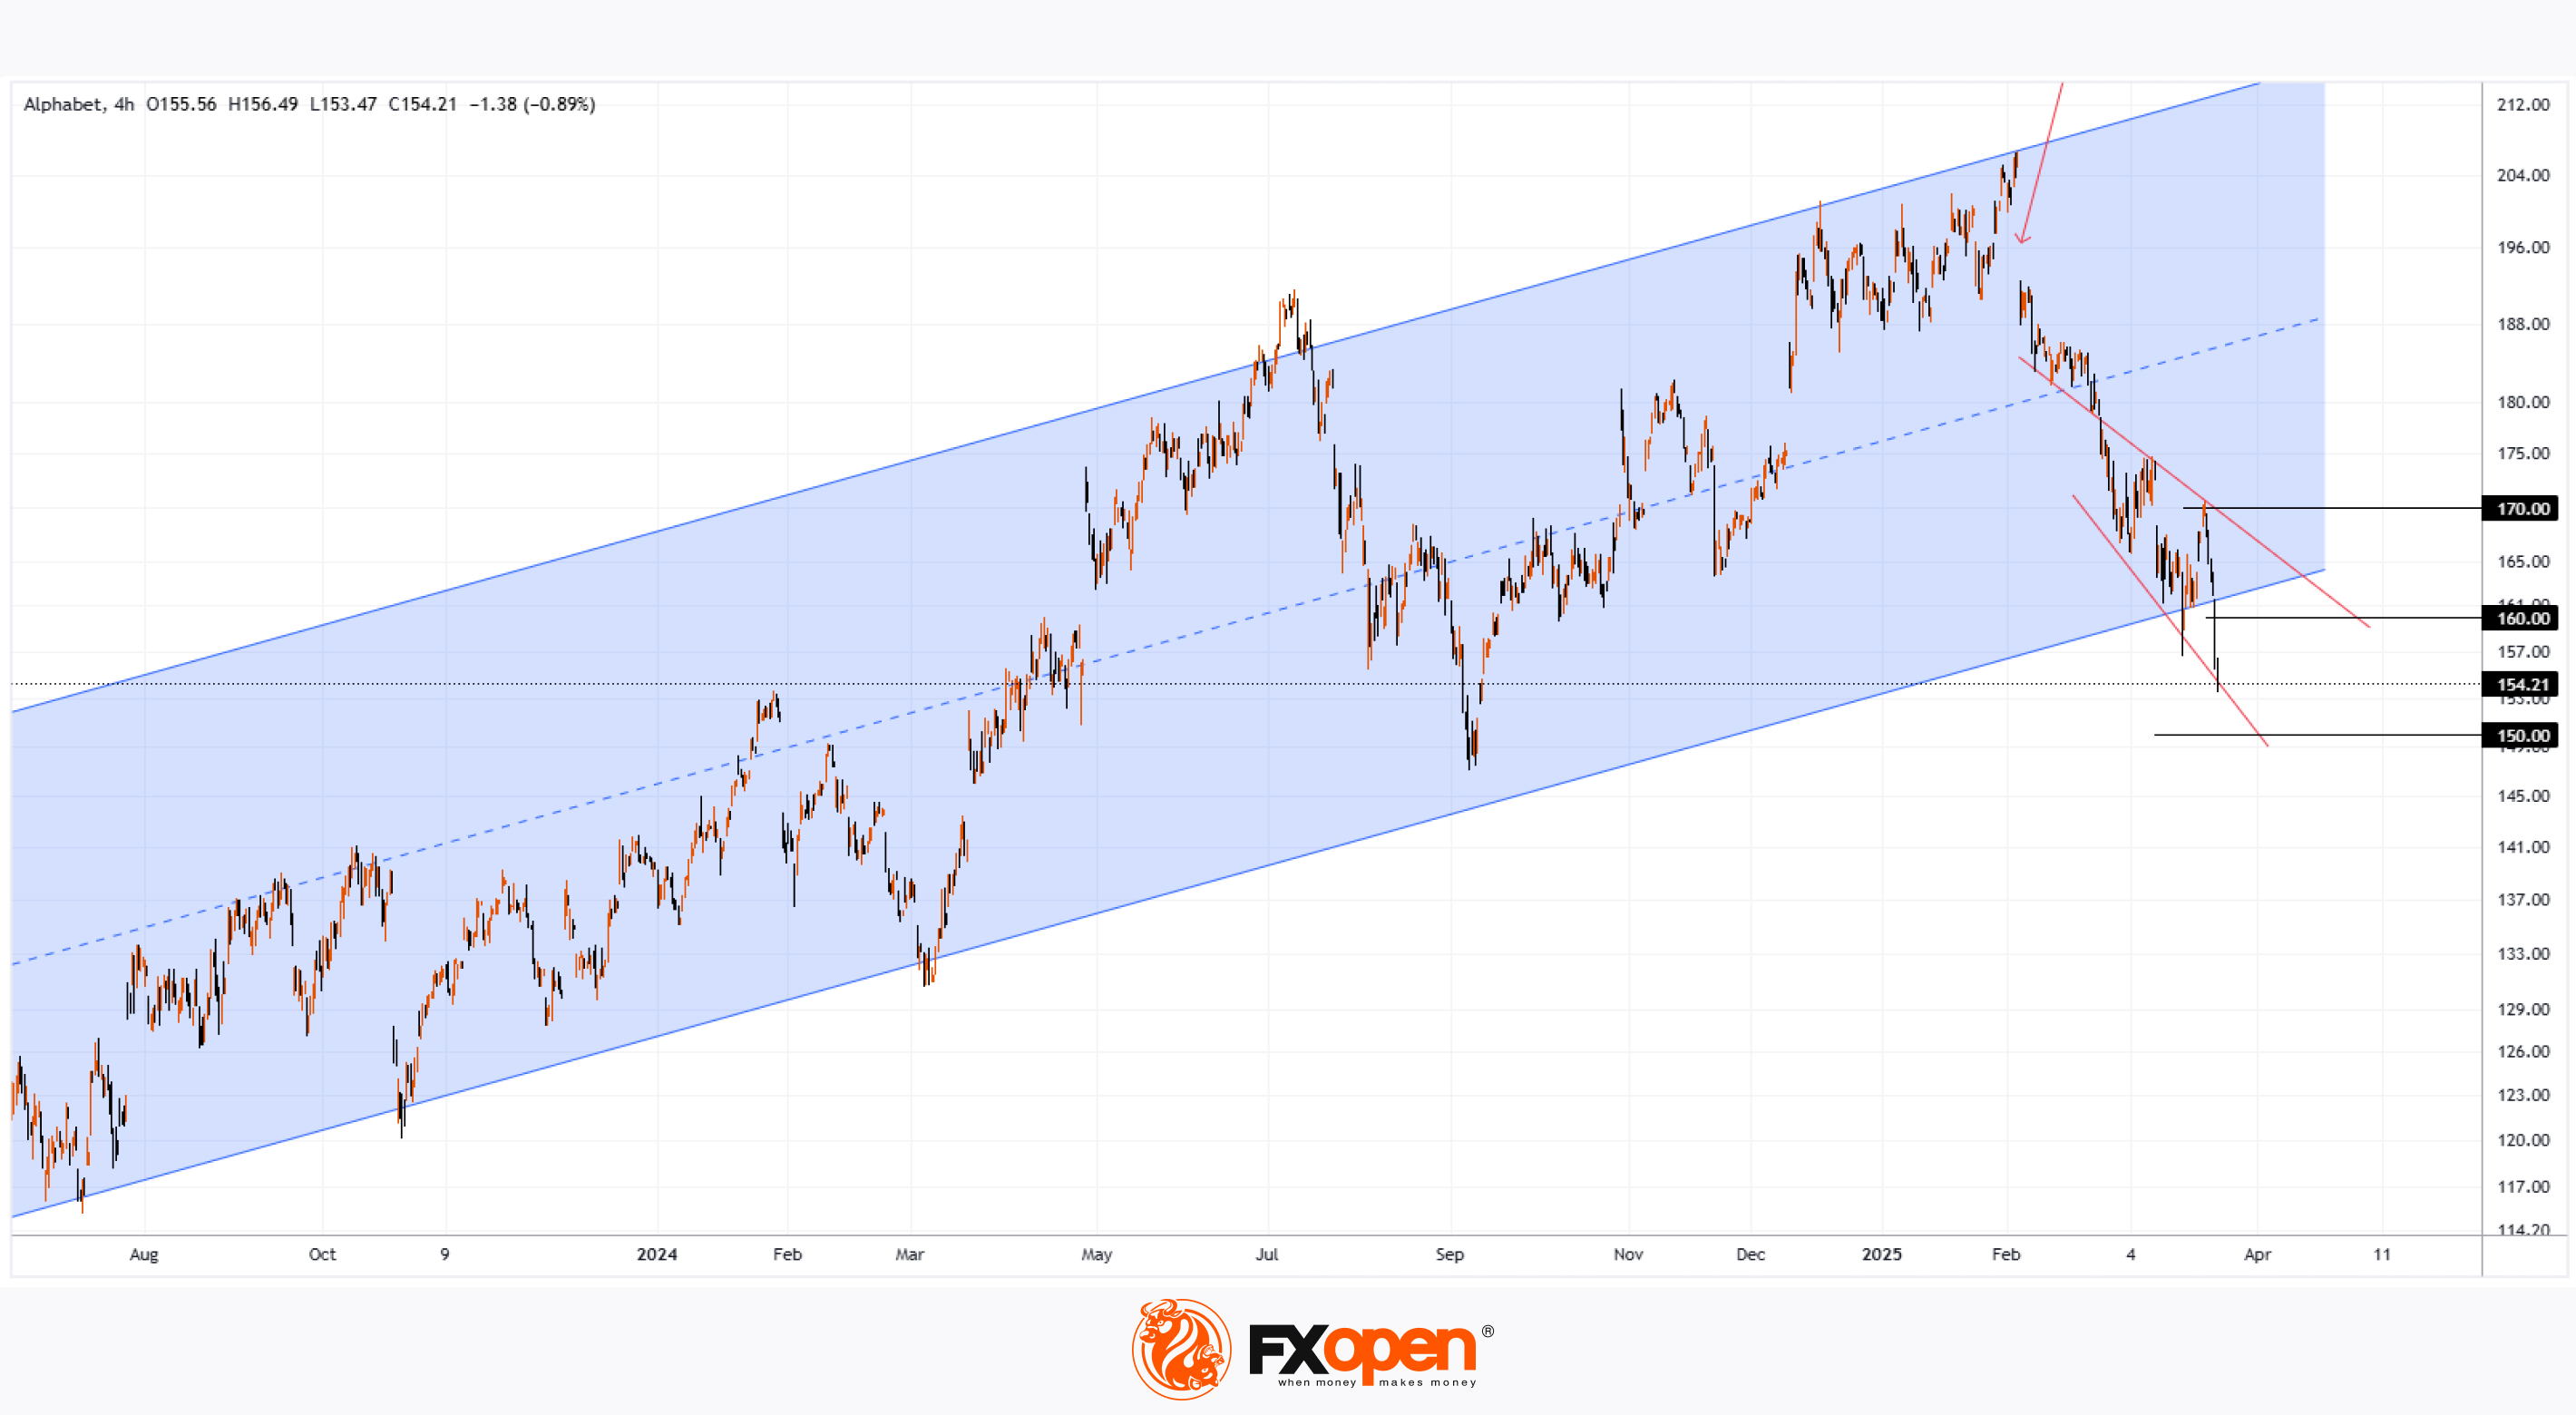
As seen on the Alphabet (GOOGL) stock chart, the price has dropped close to $156—a level not seen since September 2024.
Since the start of 2025, the stock has fallen by more than 18%.
Why Is GOOGL Falling?
As mentioned earlier today, overall market sentiment remains bearish due to the White House’s tariff policies.
For Alphabet (GOOGL), the situation has worsened today due to the following developments (as reported by the media):
➝ Google has admitted liability and agreed to pay $100 million in cash to settle a US class-action lawsuit accusing the company of overcharging advertisers, according to Reuters. Alphabet shares dropped 4.4%.
➝ Google’s division was found guilty of anti-competitive behaviour in India related to its app store billing system.
Technical Analysis of Alphabet (GOOGL)
In February, we noted investors’ negative reaction to the company’s earnings report, which led to a bearish gap (marked by a red arrow).
Since then, bears have maintained control, pushing the price below the lower boundary of the ascending channel that had been valid since 2023. Key signals include:
➝ The $170 level (near the bearish gap on 10 March) acted as resistance on 25 March.
➝ Bears showed little reaction to bulls at the $160 level and have kept the price contained between two downward-sloping red lines.
Bears may now be targeting the psychological level of $150. If bulls want to maintain control over GOOGL’s long-term uptrend, they need to take action soon.
Trade global index CFDs with zero commission and tight spreads. Open your FXOpen account now or learn more about trading index CFDs with FXOpen.
CFDs are complex instruments and come with a high risk of losing your money.
This article represents the opinion of the Companies operating under the FXOpen brand only. It is not to be construed as an offer, solicitation, or recommendation with respect to products and services provided by the Companies operating under the FXOpen brand, nor is it to be considered financial advice.
Alphabet (GOOGL) Stock Hits 2025 Low
As seen on the Alphabet (GOOGL) stock chart, the price has dropped close to $156—a level not seen since September 2024.
Since the start of 2025, the stock has fallen by more than 18%.
Why Is GOOGL Falling?
As mentioned earlier today, overall market sentiment remains bearish due to the White House’s tariff policies.
For Alphabet (GOOGL), the situation has worsened today due to the following developments (as reported by the media):
➝ Google has admitted liability and agreed to pay $100 million in cash to settle a US class-action lawsuit accusing the company of overcharging advertisers, according to Reuters. Alphabet shares dropped 4.4%.
➝ Google’s division was found guilty of anti-competitive behaviour in India related to its app store billing system.
Technical Analysis of Alphabet (GOOGL)
In February, we noted investors’ negative reaction to the company’s earnings report, which led to a bearish gap (marked by a red arrow).
Since then, bears have maintained control, pushing the price below the lower boundary of the ascending channel that had been valid since 2023. Key signals include:
➝ The $170 level (near the bearish gap on 10 March) acted as resistance on 25 March.
➝ Bears showed little reaction to bulls at the $160 level and have kept the price contained between two downward-sloping red lines.
Bears may now be targeting the psychological level of $150. If bulls want to maintain control over GOOGL’s long-term uptrend, they need to take action soon.
Trade global index CFDs with zero commission and tight spreads. Open your FXOpen account now or learn more about trading index CFDs with FXOpen.
CFDs are complex instruments and come with a high risk of losing your money.
This article represents the opinion of the Companies operating under the FXOpen brand only. It is not to be construed as an offer, solicitation, or recommendation with respect to products and services provided by the Companies operating under the FXOpen brand, nor is it to be considered financial advice.
👍3
#InterestRates #AUD #Unemploymentrates #USJobsReport #stockmarket #forextrading #StockMarketVolatility
Market Insights with Gary Thomson: UK & US Inflation, US Durable Goods Orders, and Earnings Reports
In this video, we’ll explore the key economic events, market trends, and corporate news shaping the financial landscape. Get ready for expert insights into forex, commodities, and stocks to help you navigate the week ahead. Let’s dive in!
In this episode, we discuss:
🔸 RBA Interest Rate Decision
The Reserve Bank of Australia is expected to keep rates steady at 4.1%. However, with inflation easing, a rate cut could be on the horizon as early as May. Could RBA’s guidance drive major moves in AUD markets?
🔸 US Nonfarm Payrolls and Unemployment Rate
Factors like government efficiency measures, trade war concerns, and rising bankruptcies could influence this month's job data. In February, the US dollar weakened after the NFP and unemployment rate release—will history repeat itself?
🔸 Unemployment Rate in Canada
Trade tariffs continue to pressure the Canadian economy, with the National Bank of Canada forecasting unemployment could rise to 7.0–7.5% soon. How might March data impact the Canadian dollar?
🔸 Corporate Earnings Statements
Corporate earnings reports could also shake the markets. Which companies could trigger high volatility in the stock market?
Don’t miss out—gain insights to stay ahead in your trading journey.
https://cutt.ly/oraPazyq
To take advantage of price fluctuations in the foreign exchange markets, consider enlisting the services of a reliable broker like FXOpen.
⚠️
This forecast represents FXOpen Companies opinion only, it should not be construed as an offer, invitation or recommendation in respect to FXOpen Companies products and services or as financial advice.
Market Insights with Gary Thomson: UK & US Inflation, US Durable Goods Orders, and Earnings Reports
In this video, we’ll explore the key economic events, market trends, and corporate news shaping the financial landscape. Get ready for expert insights into forex, commodities, and stocks to help you navigate the week ahead. Let’s dive in!
In this episode, we discuss:
🔸 RBA Interest Rate Decision
The Reserve Bank of Australia is expected to keep rates steady at 4.1%. However, with inflation easing, a rate cut could be on the horizon as early as May. Could RBA’s guidance drive major moves in AUD markets?
🔸 US Nonfarm Payrolls and Unemployment Rate
Factors like government efficiency measures, trade war concerns, and rising bankruptcies could influence this month's job data. In February, the US dollar weakened after the NFP and unemployment rate release—will history repeat itself?
🔸 Unemployment Rate in Canada
Trade tariffs continue to pressure the Canadian economy, with the National Bank of Canada forecasting unemployment could rise to 7.0–7.5% soon. How might March data impact the Canadian dollar?
🔸 Corporate Earnings Statements
Corporate earnings reports could also shake the markets. Which companies could trigger high volatility in the stock market?
Don’t miss out—gain insights to stay ahead in your trading journey.
https://cutt.ly/oraPazyq
To take advantage of price fluctuations in the foreign exchange markets, consider enlisting the services of a reliable broker like FXOpen.
⚠️
This forecast represents FXOpen Companies opinion only, it should not be construed as an offer, invitation or recommendation in respect to FXOpen Companies products and services or as financial advice.
YouTube
Market Insights with Gary Thomson: RBA Rates, US and Canada’s Employment Data & Earnings Reports
In this video, we’ll explore the key economic events, market trends, and corporate news shaping the financial landscape. Get ready for expert insights into forex, commodities, and stocks to help you navigate the week ahead. Let’s dive in!
In this episode…
In this episode…
👍2
#commodities #oilprices #brentoil #XBRUSD #marketanalysis
Brent Crude Oil Price Rises Above $71
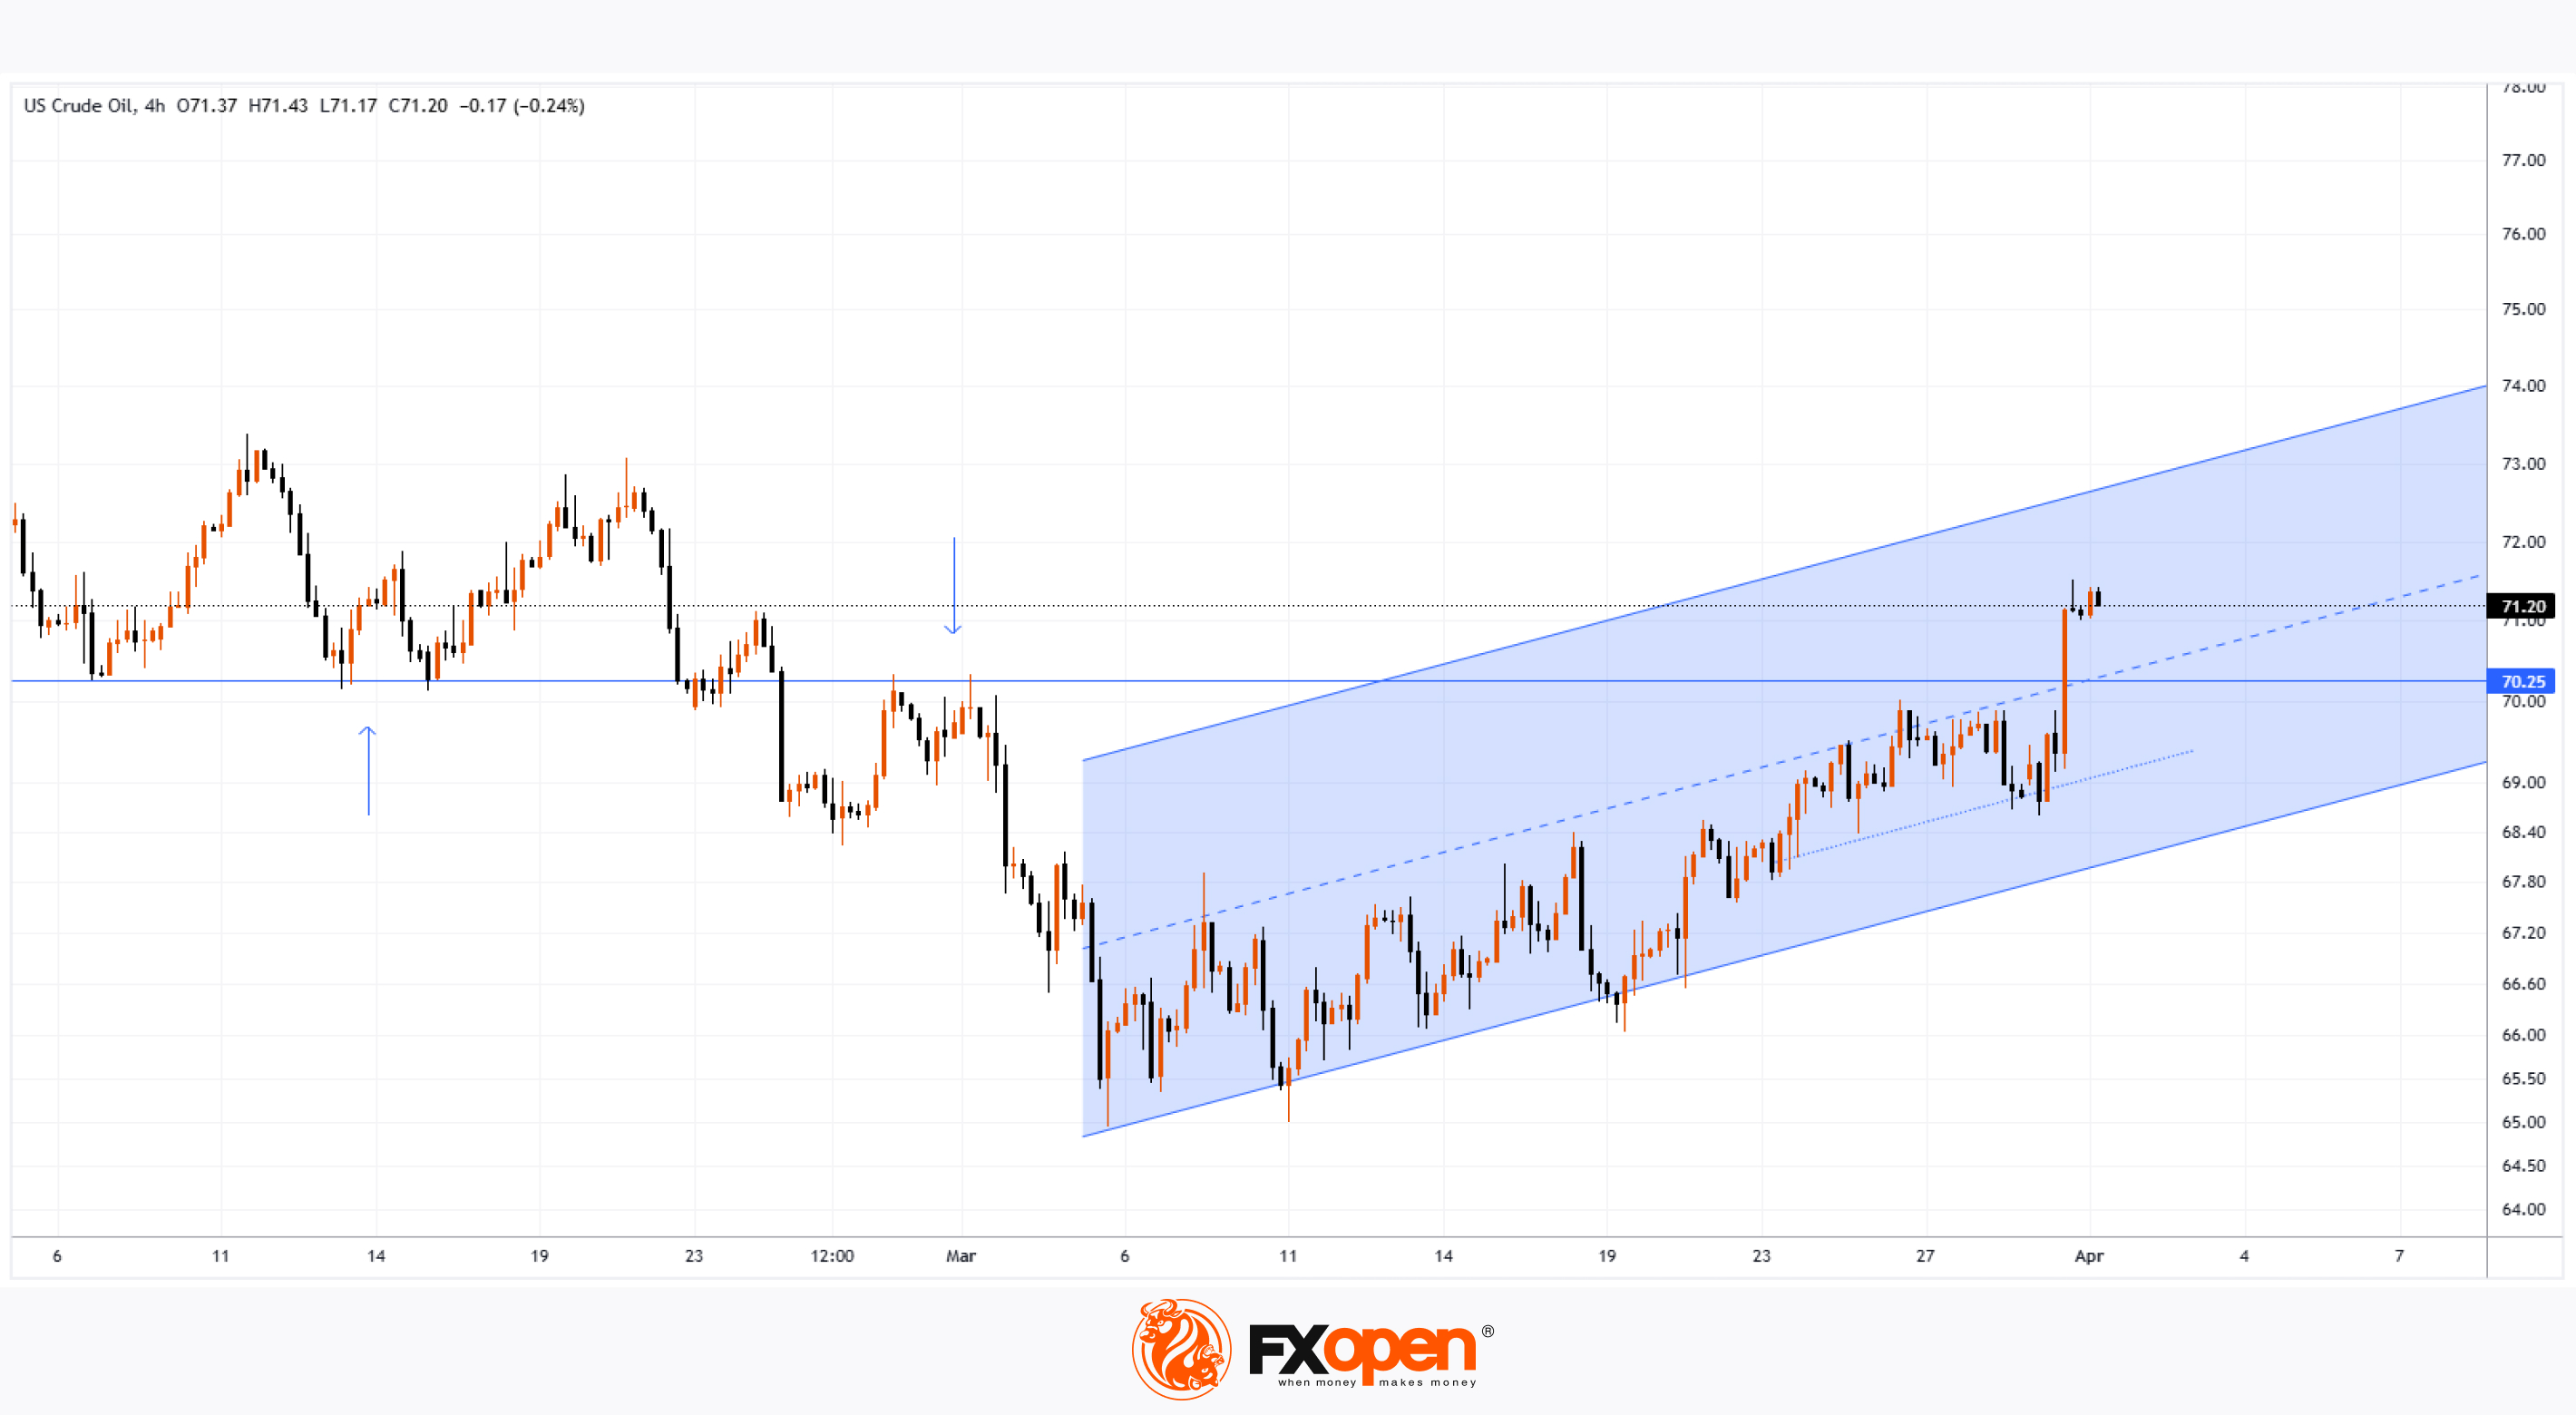
Brent crude oil is trading above $71 per barrel today, marking its highest level since late February. As shown on the XBR/USD chart, the price surged by approximately 2.6% on the last day of March.
Why Has Oil Risen?
Bullish sentiment in the market is driven by the US President’s stance on Russia and Iran. According to Trading Economics:
➝ Trump has vowed to impose tariffs of 25–50% on buyers of Russian oil if he believes Moscow is obstructing his efforts to end the war in Ukraine. This could put pressure on key importers such as India and China.
➝ He has also threatened Iran with further tariffs and airstrikes until the country agrees to abandon its nuclear weapons programme.
The rise in Brent crude prices appears to reflect traders’ concerns over potential disruptions to global oil supply chains.
Technical Analysis of XBR/USD
In early March, oil formed a bullish Double Bottom pattern (see the lows on 5 and 11 March), followed by an upward trend within a rising channel (marked in blue).
Notably, the XBR/USD chart shows that the price:
➝ Has moved into the upper half of the channel.
➝ Broke through key resistance at around $70.25, a level that previously acted as support multiple times (as indicated by the arrows).
As a result, the median of the channel, reinforced by the $70.25 level, may now serve as support, keeping Brent crude within the blue channel. However, market direction will likely depend on the news cycle, particularly sharp statements from the White House.
Start trading commodities with tight spreads. Open your trading account now or learn more about trading commodity CFDs with FXOpen.
CFDs are complex instruments and come with a high risk of losing your money.
This article represents the opinion of the Companies operating under the FXOpen brand only. It is not to be construed as an offer, solicitation, or recommendation with respect to products and services provided by the Companies operating under the FXOpen brand, nor is it to be considered financial advice.
Brent Crude Oil Price Rises Above $71
Brent crude oil is trading above $71 per barrel today, marking its highest level since late February. As shown on the XBR/USD chart, the price surged by approximately 2.6% on the last day of March.
Why Has Oil Risen?
Bullish sentiment in the market is driven by the US President’s stance on Russia and Iran. According to Trading Economics:
➝ Trump has vowed to impose tariffs of 25–50% on buyers of Russian oil if he believes Moscow is obstructing his efforts to end the war in Ukraine. This could put pressure on key importers such as India and China.
➝ He has also threatened Iran with further tariffs and airstrikes until the country agrees to abandon its nuclear weapons programme.
The rise in Brent crude prices appears to reflect traders’ concerns over potential disruptions to global oil supply chains.
Technical Analysis of XBR/USD
In early March, oil formed a bullish Double Bottom pattern (see the lows on 5 and 11 March), followed by an upward trend within a rising channel (marked in blue).
Notably, the XBR/USD chart shows that the price:
➝ Has moved into the upper half of the channel.
➝ Broke through key resistance at around $70.25, a level that previously acted as support multiple times (as indicated by the arrows).
As a result, the median of the channel, reinforced by the $70.25 level, may now serve as support, keeping Brent crude within the blue channel. However, market direction will likely depend on the news cycle, particularly sharp statements from the White House.
Start trading commodities with tight spreads. Open your trading account now or learn more about trading commodity CFDs with FXOpen.
CFDs are complex instruments and come with a high risk of losing your money.
This article represents the opinion of the Companies operating under the FXOpen brand only. It is not to be construed as an offer, solicitation, or recommendation with respect to products and services provided by the Companies operating under the FXOpen brand, nor is it to be considered financial advice.
👍1
#stockmarket #stocktrading #MarketUpdates #MarketNews
Moderna (MRNA) Shares Plunge Nearly 9%
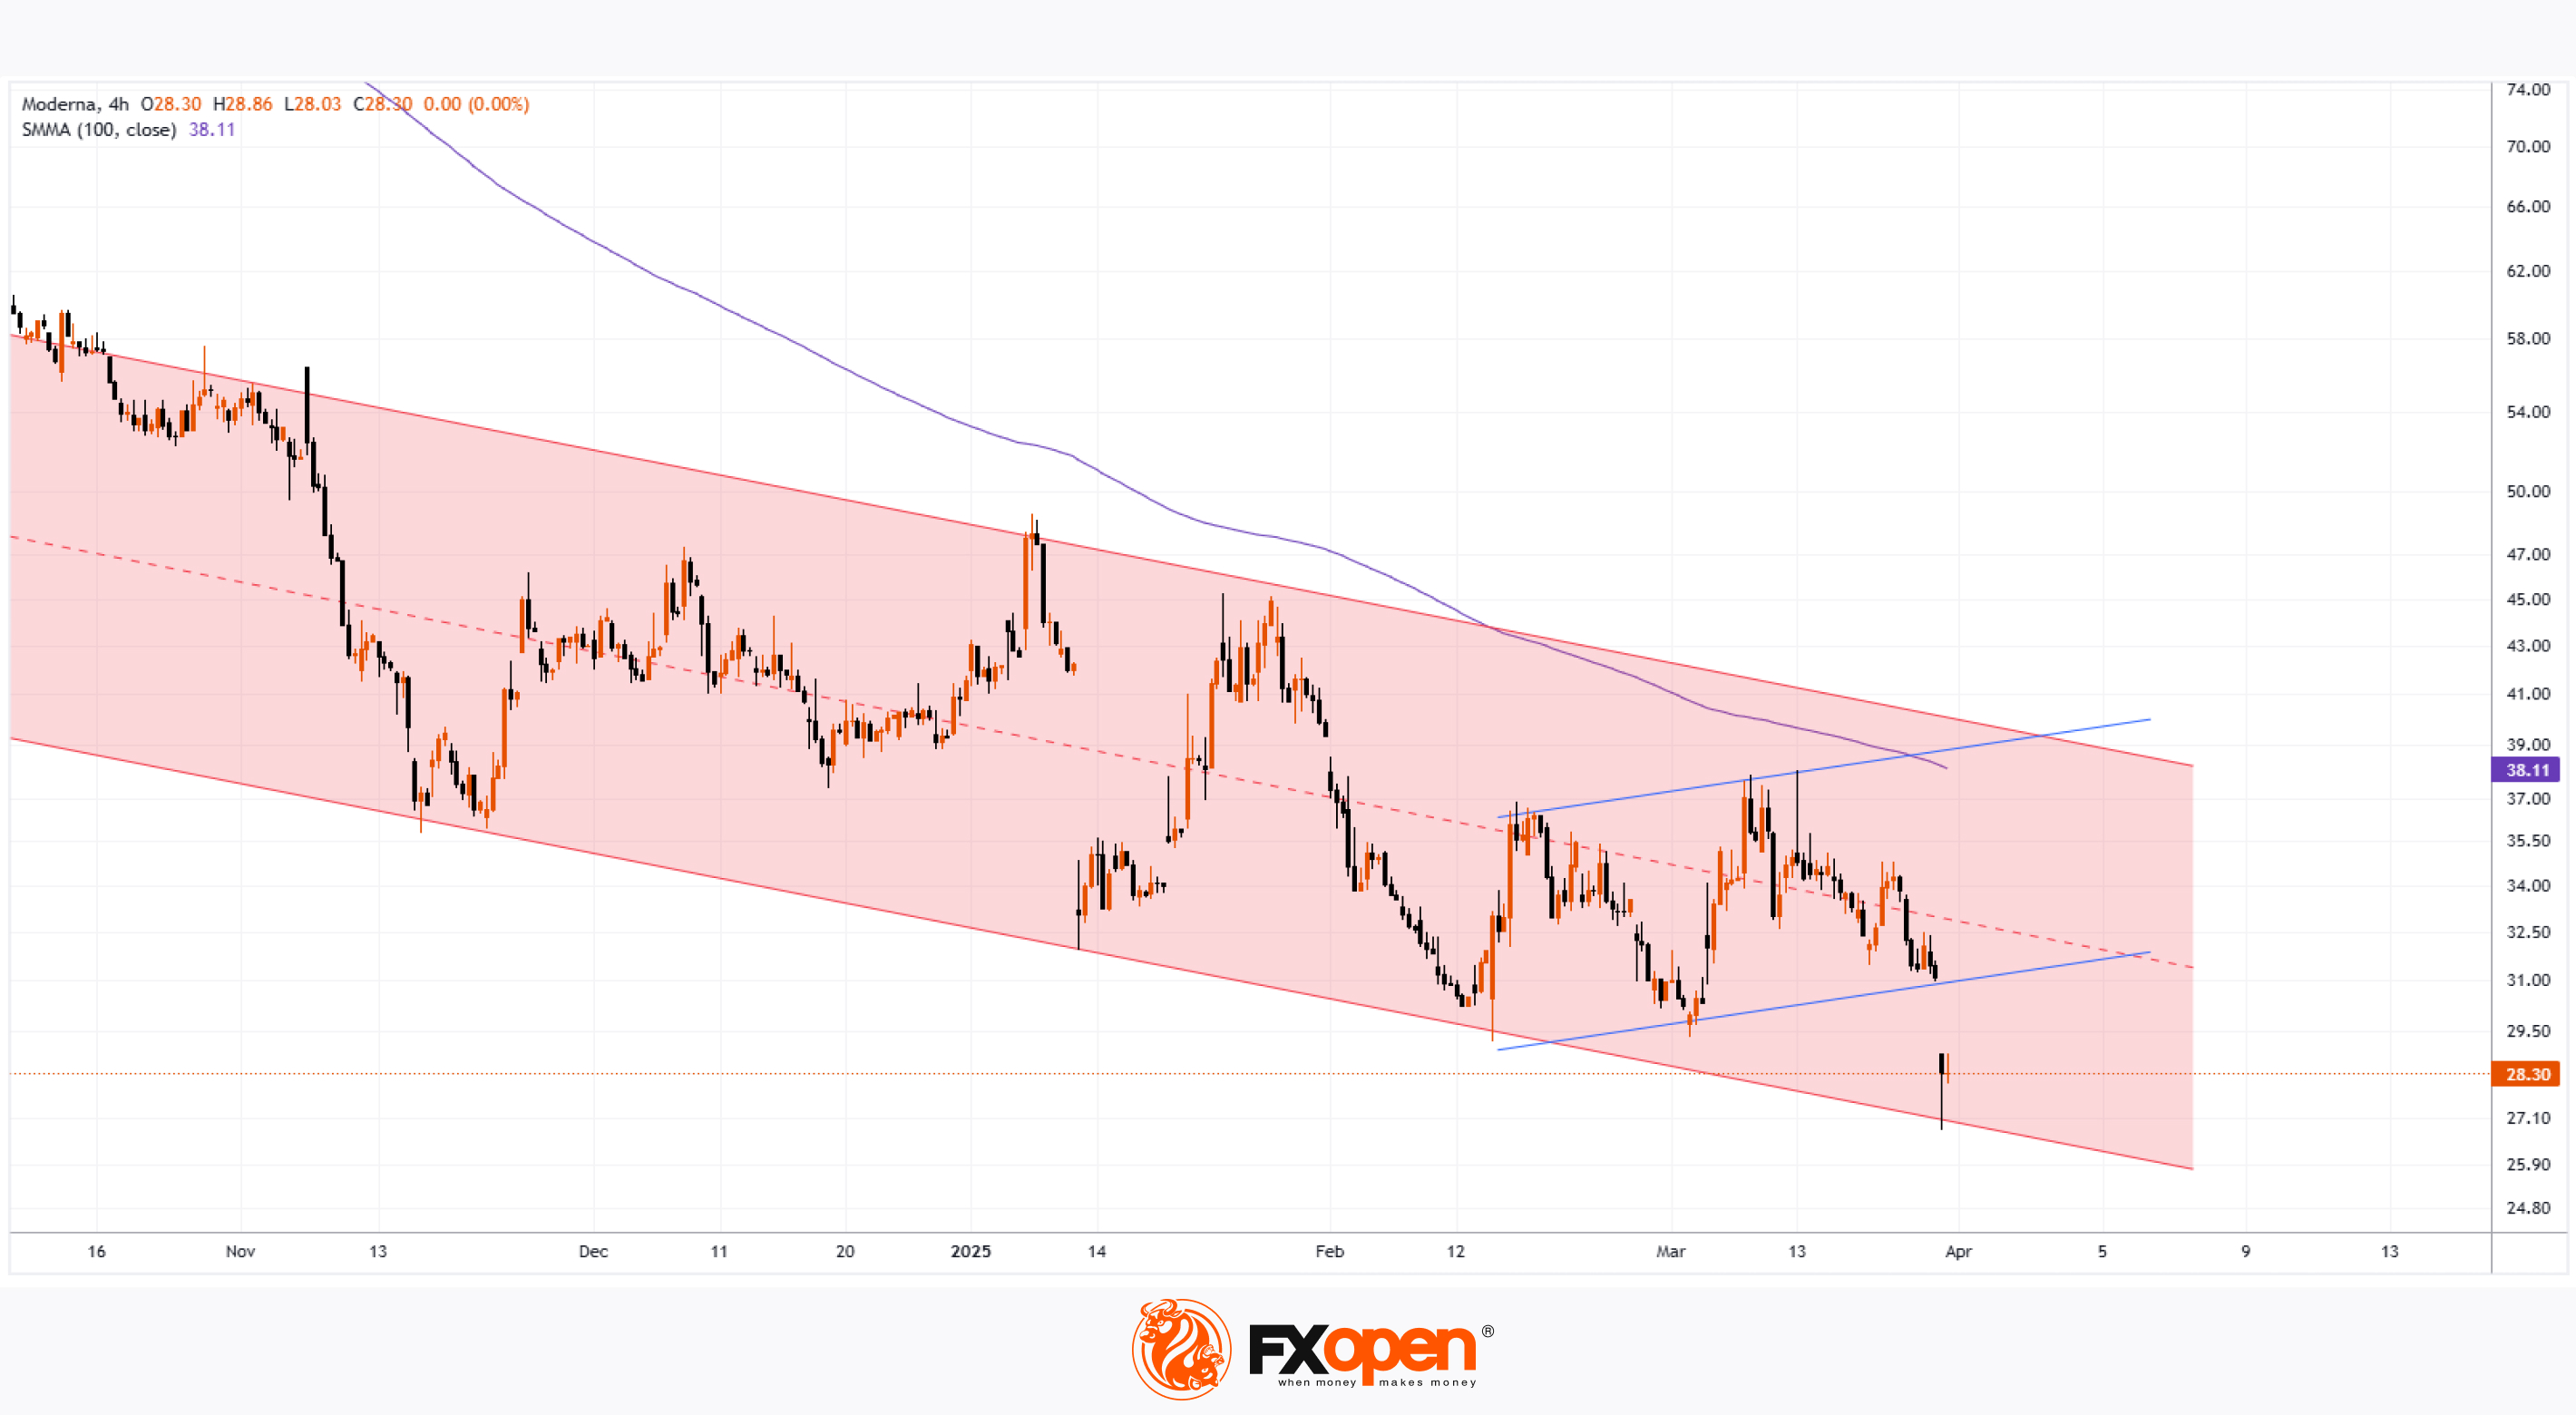
Moderna (MRNA) shares tumbled by approximately 8.9%, falling below $29—marking their lowest level since April 2020, when global markets were shaken by the COVID-19 pandemic.
Since the start of 2025, MRNA’s share price has declined by around 32%.
Why Did MRNA Shares Drop?
On Monday, MRNA led the decline among US biotech stocks following the resignation of Peter Marks, director of the FDA’s Center for Biologics Evaluation and Research. Marks had held this position for over a decade.
During Trump’s first term, Marks oversaw the rollout of COVID-19 vaccines and established guidelines for emerging treatments such as cell and gene therapy.
However, in Trump’s second term, Robert F. Kennedy Jr. now serves as Health Secretary. According to The Wall Street Journal, Marks criticised Kennedy’s stance on vaccines in his resignation letter, calling it “misinformation and lies.”
The pharmaceutical industry was already under pressure amid speculation that Trump’s tariff plans could extend to prescription drugs, which are typically exempt from such measures. Marks' departure has further intensified uncertainty regarding regulatory decisions under the new administration.
Technical Analysis of MRNA Shares
The chart indicates that:
➝ The stock remains in a downtrend that began with a sharp drop in August last year (reinforced by the moving average).
➝ Over the past five months, it has been forming a descending channel (marked in red).
➝ The lower boundary of this channel acted as support yesterday.
The formation of higher lows and highs (marked in blue) had given bulls some hope in March 2025. However, yesterday’s bearish gap appears to have shattered that optimism.
It is possible that the lower blue trendline and the median of the red channel will act as resistance moving forward, further darkening the outlook for MRNA’s share price—especially given the ongoing negative news surrounding the stock.
Trade global index CFDs with zero commission and tight spreads. Open your FXOpen account now or learn more about trading index CFDs with FXOpen.
CFDs are complex instruments and come with a high risk of losing your money.
This article represents the opinion of the Companies operating under the FXOpen brand only. It is not to be construed as an offer, solicitation, or recommendation with respect to products and services provided by the Companies operating under the FXOpen brand, nor is it to be considered financial advice.
Moderna (MRNA) Shares Plunge Nearly 9%
Moderna (MRNA) shares tumbled by approximately 8.9%, falling below $29—marking their lowest level since April 2020, when global markets were shaken by the COVID-19 pandemic.
Since the start of 2025, MRNA’s share price has declined by around 32%.
Why Did MRNA Shares Drop?
On Monday, MRNA led the decline among US biotech stocks following the resignation of Peter Marks, director of the FDA’s Center for Biologics Evaluation and Research. Marks had held this position for over a decade.
During Trump’s first term, Marks oversaw the rollout of COVID-19 vaccines and established guidelines for emerging treatments such as cell and gene therapy.
However, in Trump’s second term, Robert F. Kennedy Jr. now serves as Health Secretary. According to The Wall Street Journal, Marks criticised Kennedy’s stance on vaccines in his resignation letter, calling it “misinformation and lies.”
The pharmaceutical industry was already under pressure amid speculation that Trump’s tariff plans could extend to prescription drugs, which are typically exempt from such measures. Marks' departure has further intensified uncertainty regarding regulatory decisions under the new administration.
Technical Analysis of MRNA Shares
The chart indicates that:
➝ The stock remains in a downtrend that began with a sharp drop in August last year (reinforced by the moving average).
➝ Over the past five months, it has been forming a descending channel (marked in red).
➝ The lower boundary of this channel acted as support yesterday.
The formation of higher lows and highs (marked in blue) had given bulls some hope in March 2025. However, yesterday’s bearish gap appears to have shattered that optimism.
It is possible that the lower blue trendline and the median of the red channel will act as resistance moving forward, further darkening the outlook for MRNA’s share price—especially given the ongoing negative news surrounding the stock.
Trade global index CFDs with zero commission and tight spreads. Open your FXOpen account now or learn more about trading index CFDs with FXOpen.
CFDs are complex instruments and come with a high risk of losing your money.
This article represents the opinion of the Companies operating under the FXOpen brand only. It is not to be construed as an offer, solicitation, or recommendation with respect to products and services provided by the Companies operating under the FXOpen brand, nor is it to be considered financial advice.
👍3
#stockmarket #stocktrading #MarketUpdates #MarketNews
Johnson & Johnson (JNJ) Shares Drop Over 7%
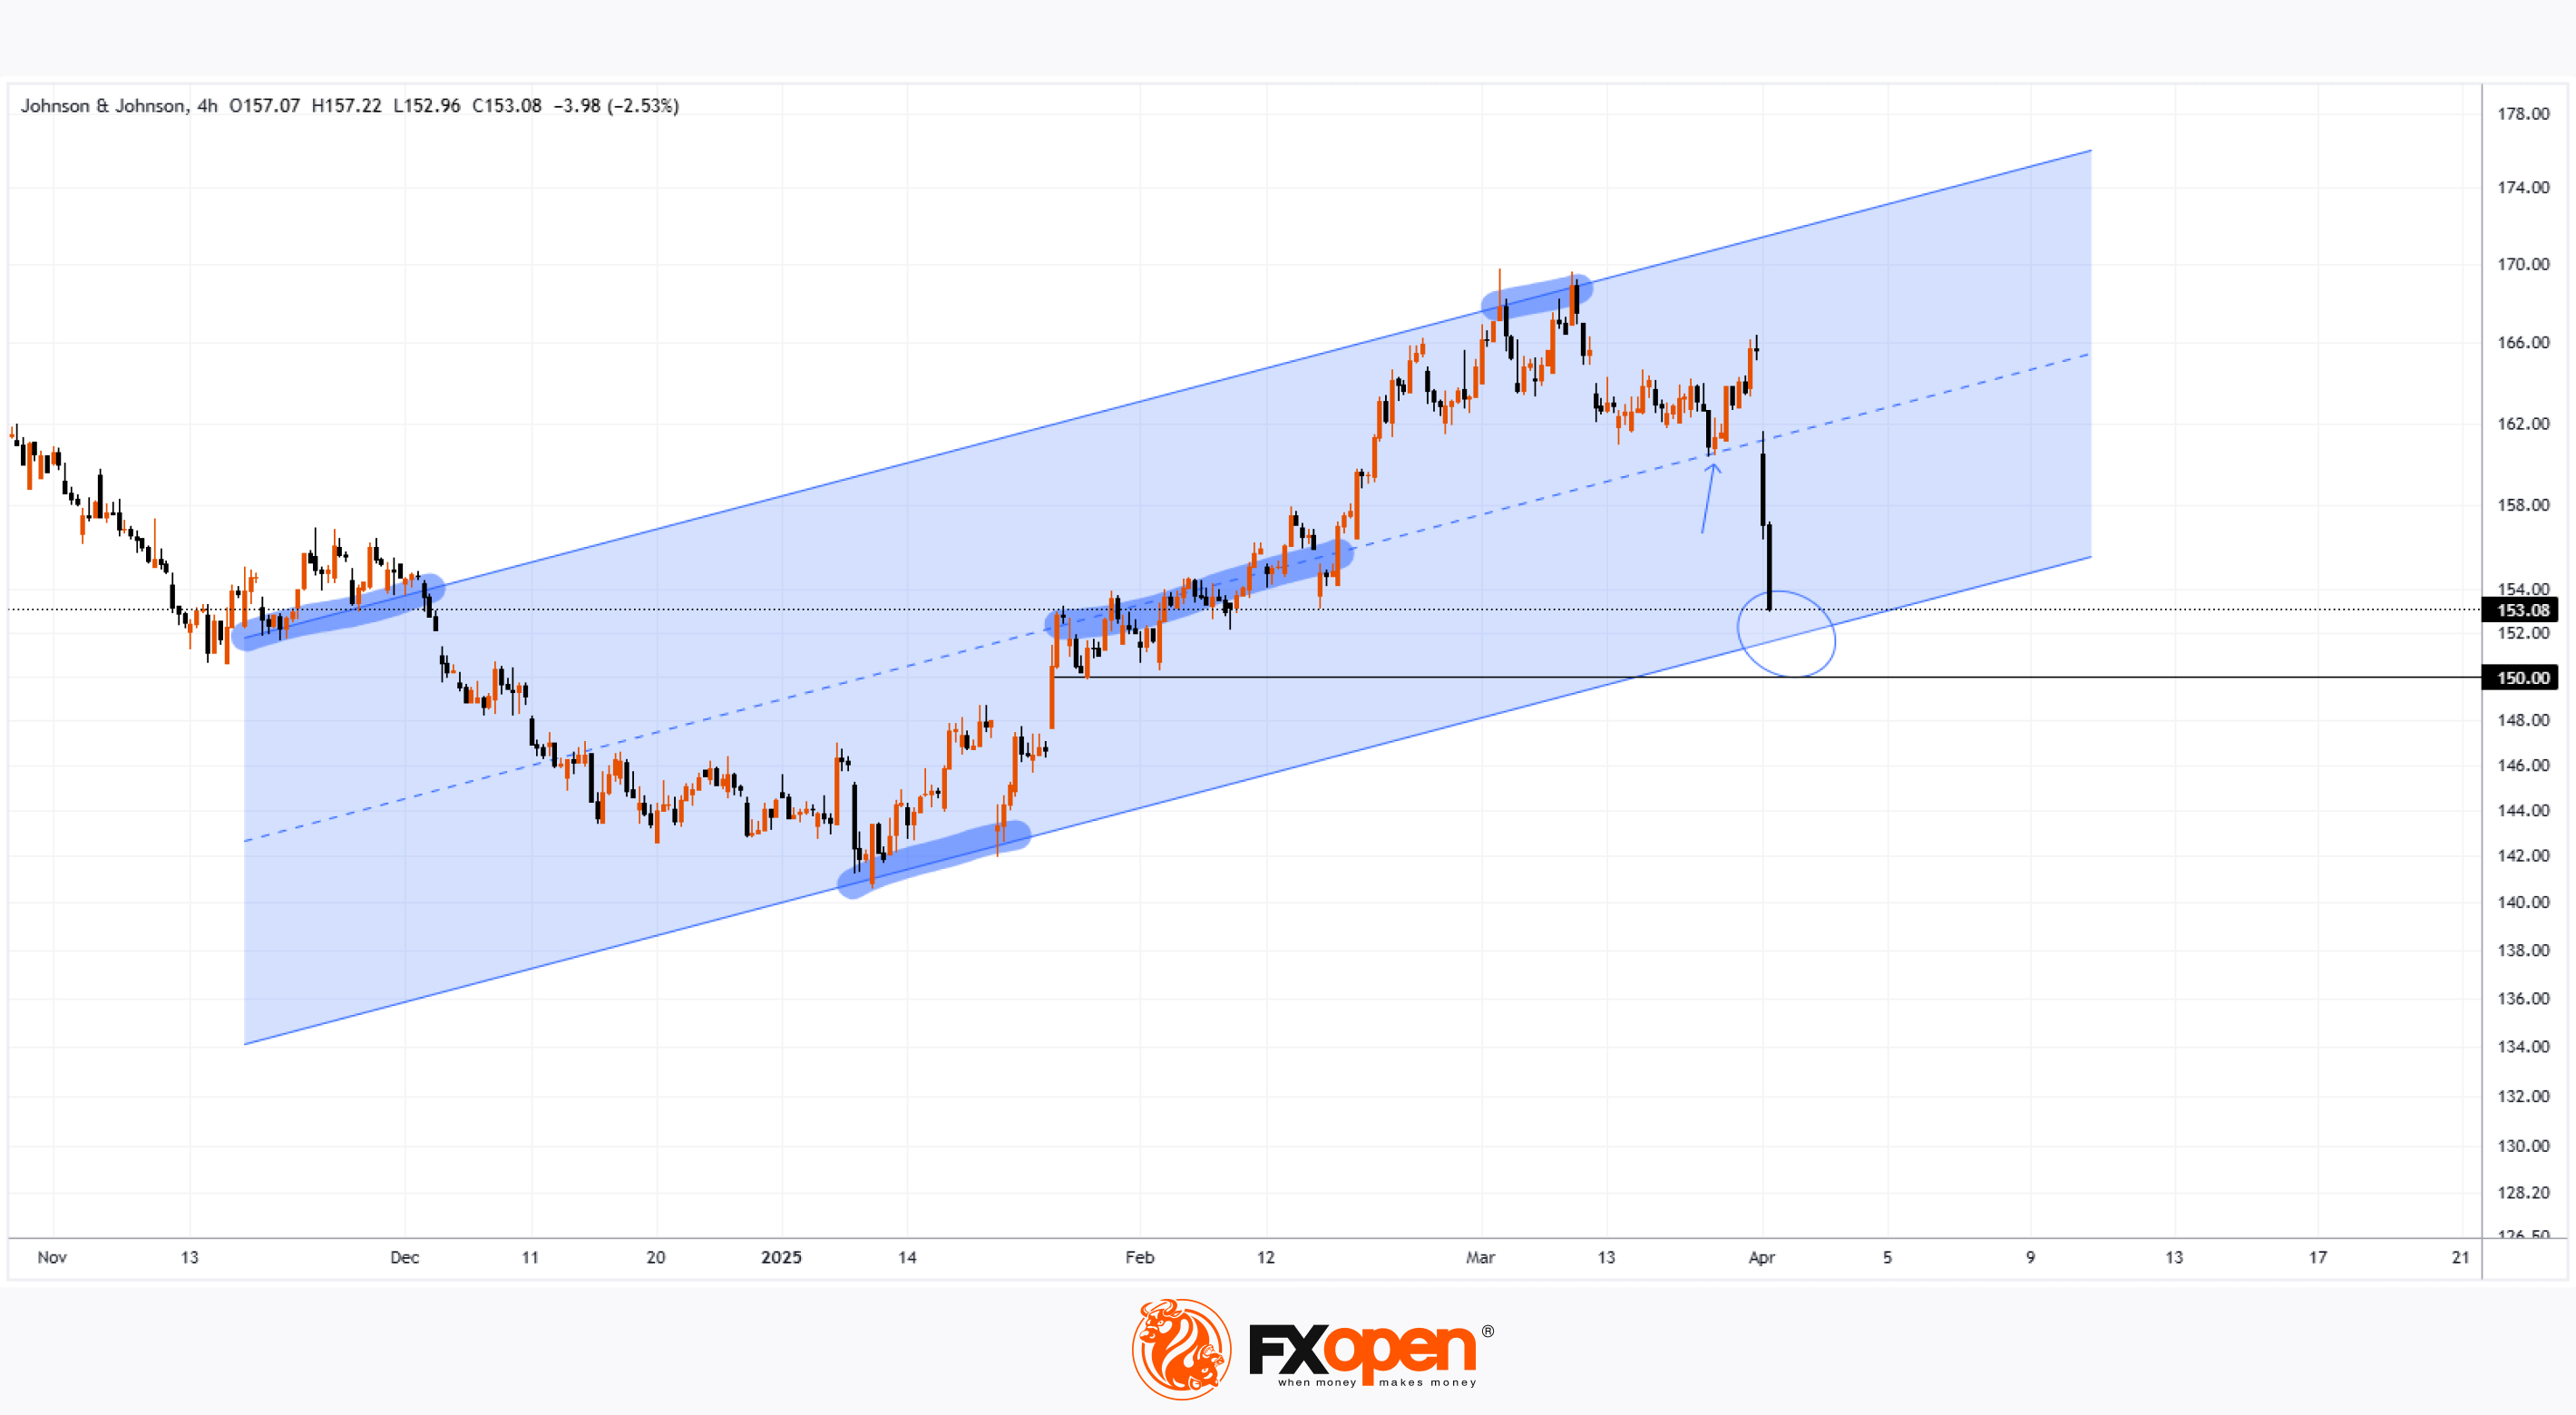
As the chart shows, Johnson & Johnson (JNJ) shares declined by approximately 7.6%, reaching their lowest level since late February. This marked one of the worst performances in the stock market yesterday.
Why Did JNJ Shares Fall?
Two major bearish factors contributed to the decline:
▪️A Texas judge rejected Johnson & Johnson's third attempt to settle lawsuits related to allegations that its baby powder and other talc-based products harmed consumers.
▪️On Tuesday, Johnson & Johnson announced that its upcoming acquisition of Intra-Cellular Therapies is expected to dilute adjusted earnings per share by approximately $0.25 for the full year 2025. Investors appear to have reacted negatively to this outlook, despite the company’s expectation that the deal will generate around $700 million in additional sales.
Technical Analysis of JNJ Stock Chart
Price movements in 2025 have formed an ascending channel (marked in blue), with indicators highlighting how:
→ The channel’s boundaries have acted as support and resistance levels.
→ The channel’s median line has served as a “magnet” for price action, reflecting the balance between supply and demand.
As JNJ's share price approaches the lower boundary (circled), just above the psychological support level at $150—previously a key level in February—traders have reasons to anticipate that the decline may slow down or even lead to a significant rebound from this support area.
Trade global index CFDs with zero commission and tight spreads. Open your FXOpen account now or learn more about trading index CFDs with FXOpen.
CFDs are complex instruments and come with a high risk of losing your money.
This article represents the opinion of the Companies operating under the FXOpen brand only. It is not to be construed as an offer, solicitation, or recommendation with respect to products and services provided by the Companies operating under the FXOpen brand, nor is it to be considered financial advice.
Johnson & Johnson (JNJ) Shares Drop Over 7%
As the chart shows, Johnson & Johnson (JNJ) shares declined by approximately 7.6%, reaching their lowest level since late February. This marked one of the worst performances in the stock market yesterday.
Why Did JNJ Shares Fall?
Two major bearish factors contributed to the decline:
▪️A Texas judge rejected Johnson & Johnson's third attempt to settle lawsuits related to allegations that its baby powder and other talc-based products harmed consumers.
▪️On Tuesday, Johnson & Johnson announced that its upcoming acquisition of Intra-Cellular Therapies is expected to dilute adjusted earnings per share by approximately $0.25 for the full year 2025. Investors appear to have reacted negatively to this outlook, despite the company’s expectation that the deal will generate around $700 million in additional sales.
Technical Analysis of JNJ Stock Chart
Price movements in 2025 have formed an ascending channel (marked in blue), with indicators highlighting how:
→ The channel’s boundaries have acted as support and resistance levels.
→ The channel’s median line has served as a “magnet” for price action, reflecting the balance between supply and demand.
As JNJ's share price approaches the lower boundary (circled), just above the psychological support level at $150—previously a key level in February—traders have reasons to anticipate that the decline may slow down or even lead to a significant rebound from this support area.
Trade global index CFDs with zero commission and tight spreads. Open your FXOpen account now or learn more about trading index CFDs with FXOpen.
CFDs are complex instruments and come with a high risk of losing your money.
This article represents the opinion of the Companies operating under the FXOpen brand only. It is not to be construed as an offer, solicitation, or recommendation with respect to products and services provided by the Companies operating under the FXOpen brand, nor is it to be considered financial advice.
👍2
#XAUUSD #xau #goldprice #MarketUpdates #commodities
Gold Prices Hover Near Record Highs Ahead of Trump’s Tariff Announcement
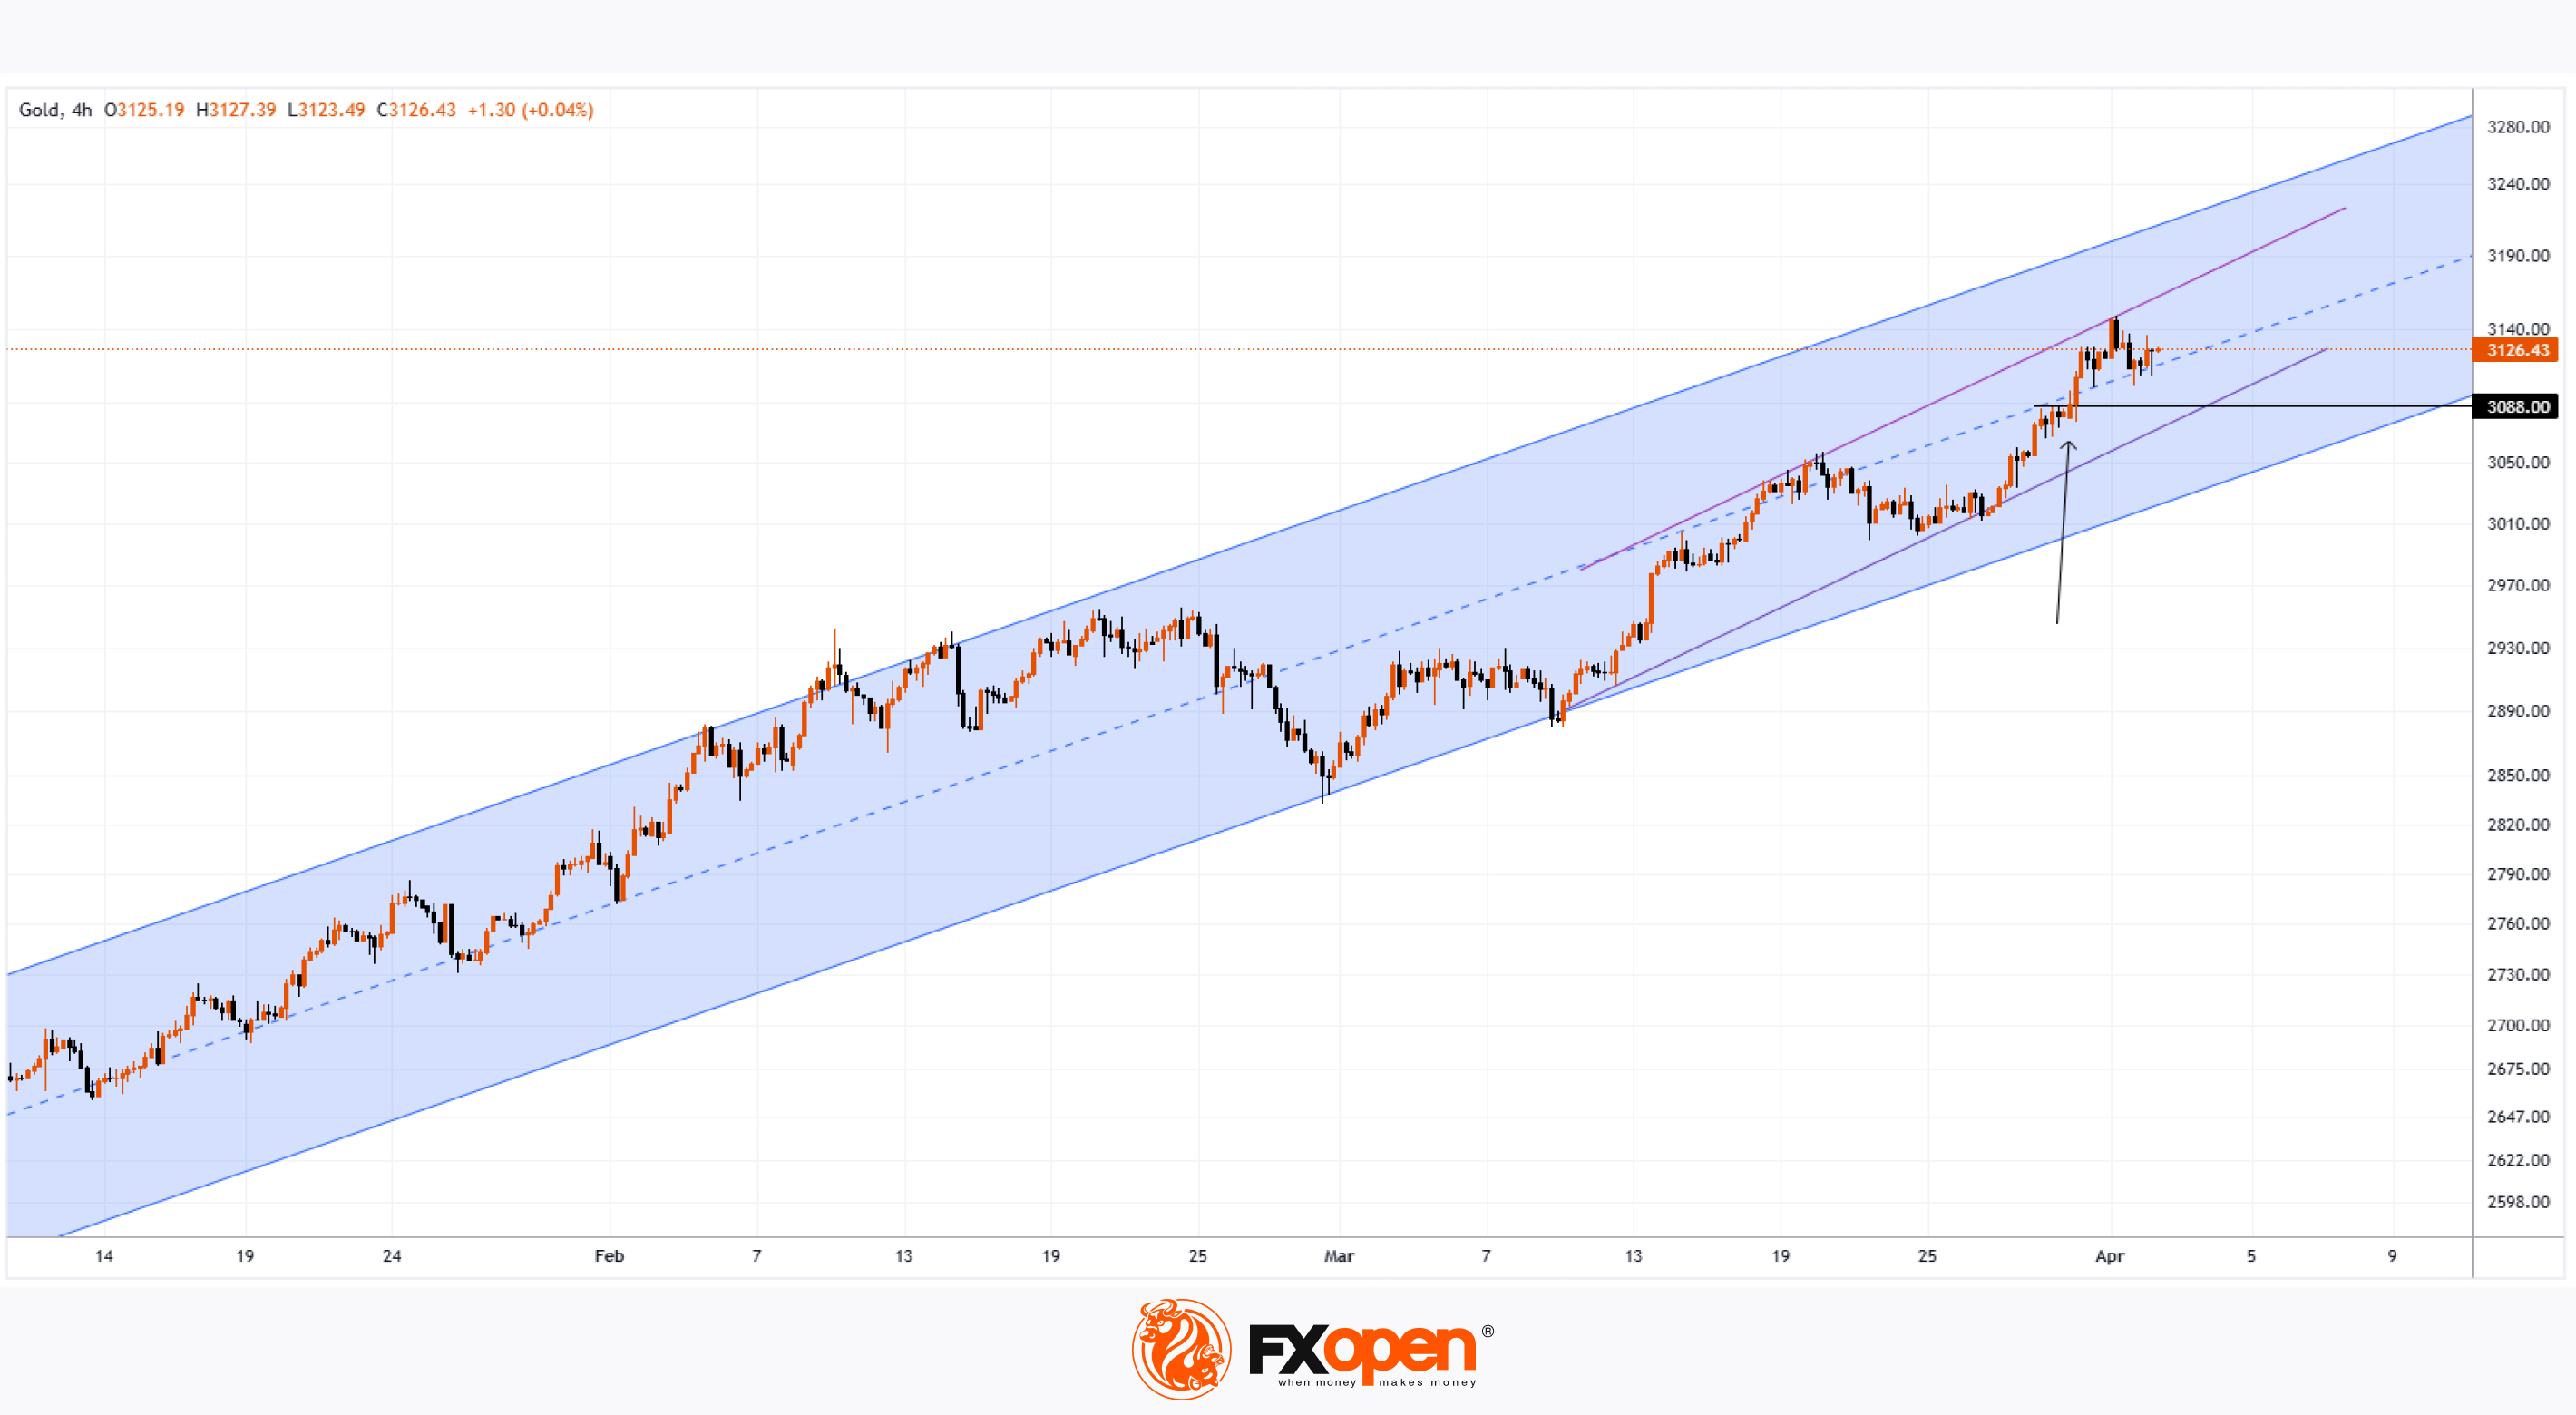
As shown on the XAU/USD chart today, gold prices are fluctuating near their all-time high, set when the price of an ounce surpassed $3,140 for the first time in history.
Gold has risen by approximately 19% in the first three months of 2025.
Why Is Gold Rising?
On 2 April, traders' sentiment is driving gold prices higher in anticipation of US President Trump’s tariff announcements, expected later this evening.
This event enhances gold’s appeal as a safe-haven asset, as concerns grow that Trump’s aggressive trade policies could slow global economic growth and fuel inflation.
Additionally, media reports highlight strong demand for gold from central banks, while exchange-traded funds linked to the precious metal are seeing capital inflows from investors concerned about geopolitical uncertainty.
Technical Analysis of XAU/USD
Gold price movements have formed two ascending channels in 2025: a broader blue channel and a steeper purple channel.
Notably, gold is currently trading near the midpoints of both channels, indicating that supply and demand may have reached equilibrium after buyers broke through resistance around $3,088 (marked by an arrow).
It is likely that XAU/USD will exhibit low volatility until news about Trump’s tariffs emerges. This could trigger sharp price movements, with a potential test of the purple channel’s boundaries in the near future.
Start trading commodities with tight spreads. Open your trading account now or learn more about trading commodity CFDs with FXOpen.
CFDs are complex instruments and come with a high risk of losing your money.
This article represents the opinion of the Companies operating under the FXOpen brand only. It is not to be construed as an offer, solicitation, or recommendation with respect to products and services provided by the Companies operating under the FXOpen brand, nor is it to be considered financial advice.
Gold Prices Hover Near Record Highs Ahead of Trump’s Tariff Announcement
As shown on the XAU/USD chart today, gold prices are fluctuating near their all-time high, set when the price of an ounce surpassed $3,140 for the first time in history.
Gold has risen by approximately 19% in the first three months of 2025.
Why Is Gold Rising?
On 2 April, traders' sentiment is driving gold prices higher in anticipation of US President Trump’s tariff announcements, expected later this evening.
This event enhances gold’s appeal as a safe-haven asset, as concerns grow that Trump’s aggressive trade policies could slow global economic growth and fuel inflation.
Additionally, media reports highlight strong demand for gold from central banks, while exchange-traded funds linked to the precious metal are seeing capital inflows from investors concerned about geopolitical uncertainty.
Technical Analysis of XAU/USD
Gold price movements have formed two ascending channels in 2025: a broader blue channel and a steeper purple channel.
Notably, gold is currently trading near the midpoints of both channels, indicating that supply and demand may have reached equilibrium after buyers broke through resistance around $3,088 (marked by an arrow).
It is likely that XAU/USD will exhibit low volatility until news about Trump’s tariffs emerges. This could trigger sharp price movements, with a potential test of the purple channel’s boundaries in the near future.
Start trading commodities with tight spreads. Open your trading account now or learn more about trading commodity CFDs with FXOpen.
CFDs are complex instruments and come with a high risk of losing your money.
This article represents the opinion of the Companies operating under the FXOpen brand only. It is not to be construed as an offer, solicitation, or recommendation with respect to products and services provided by the Companies operating under the FXOpen brand, nor is it to be considered financial advice.
👍3