
#EURUSD #forextrading #forex #marketanalysis #MarketNews
EUR/USD Shows Optimism Ahead of Trump–Putin Meeting
The meeting between the Presidents of the United States and the Russian Federation, scheduled for today in Alaska, is a major geopolitical event with the potential to exert a significant influence on financial markets.
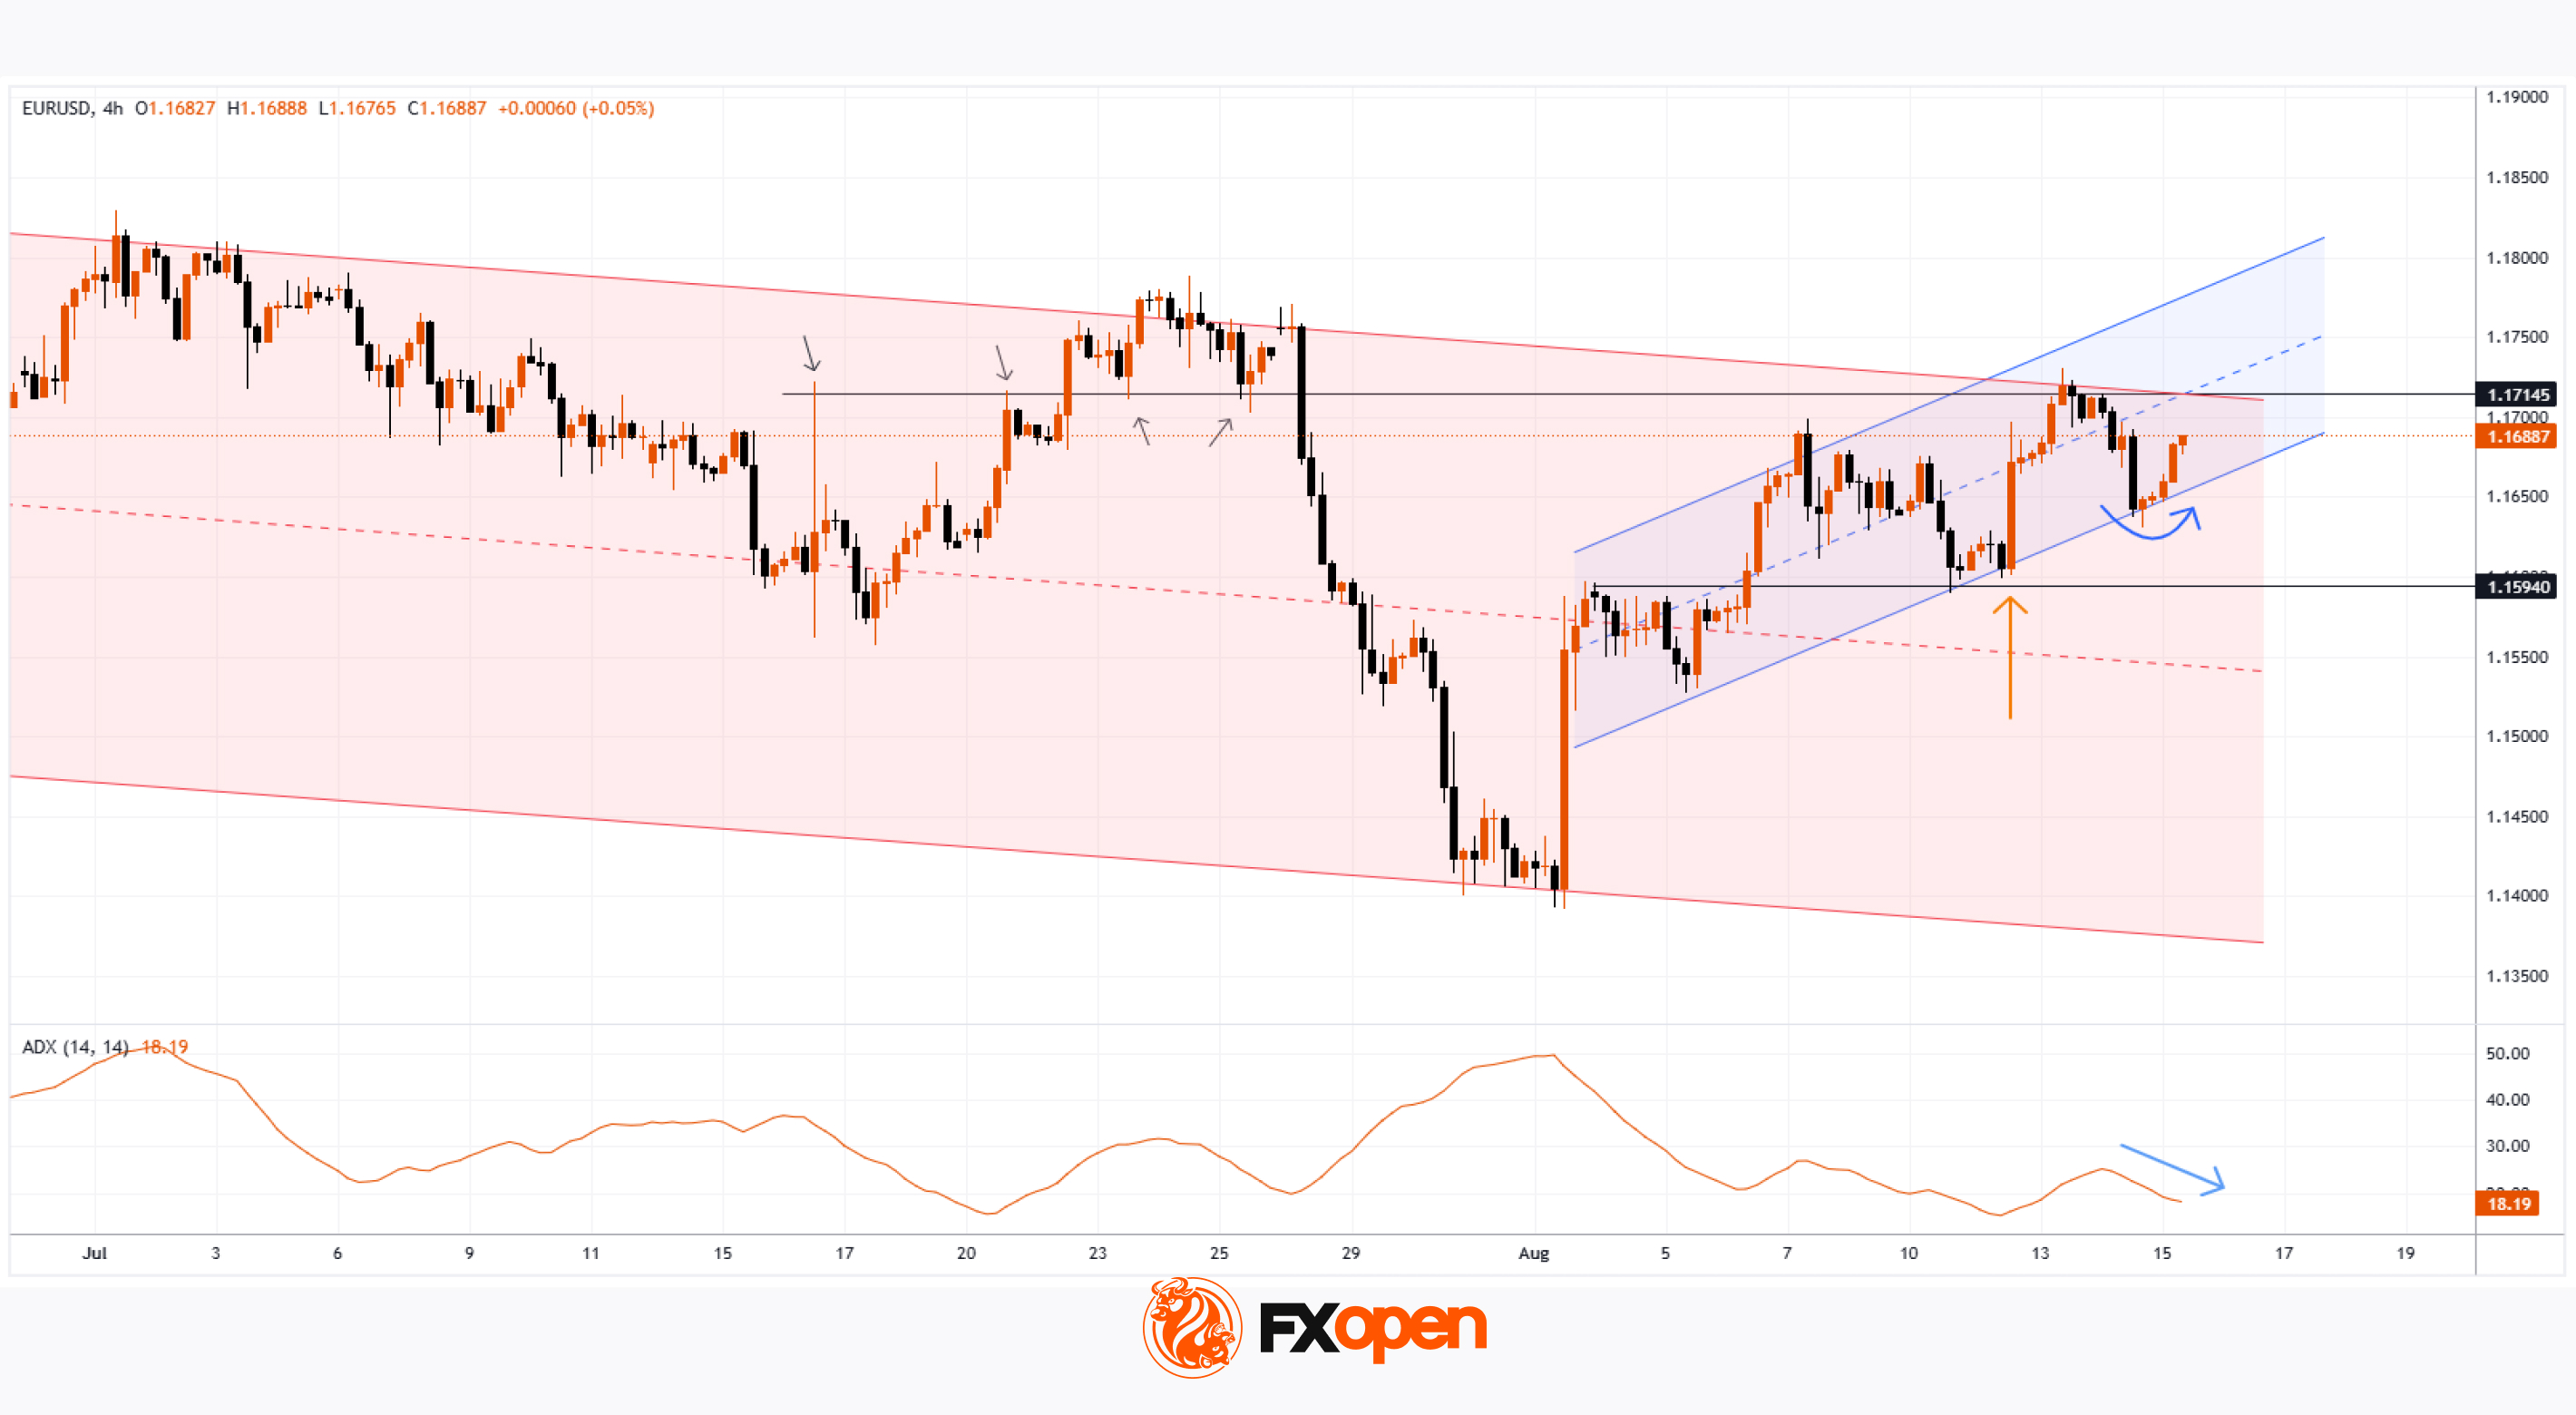
Expectations are mounting that the talks could lead to a cessation of hostilities in Ukraine – a prospect acting as a bullish factor for the euro. As a result, the EUR/USD chart has been displaying an upward trajectory this week (highlighted by the blue channel).
The blue arrow indicates that:
→ Yesterday’s release of the highest Producer Price Index (PPI) figures in three years triggered a sharp strengthening of the US dollar – possibly because market participants assumed the Federal Reserve might postpone monetary policy easing in light of rising producer prices (widely considered a consequence of Trump’s tariff measures).
→ However, the lower boundary of the upward channel prevented further decline, and today EUR/USD is showing optimism ahead of the presidential meeting.
EUR/USD Technical Analysis
On 7 August, we plotted a descending channel based on the sequence of lower highs and lows formed over the summer.
From the bearish perspective, the price is currently near a cluster of key resistance levels, which include:
→ the upper boundary of the descending (red) channel;
→ the 1.17145 level (a historical price interaction zone, as shown by the arrows on the left side of the chart);
→ the median line of the ascending (blue) channel.
Conversely, the bulls could be supported by:
→ the lower boundary of the blue channel;
→ the aggressive buying momentum evident in the sharp EUR/USD rally on 12 August (highlighted by the orange arrow).
The bullish case is further reinforced by the fact that buyers managed to fully recover from the decline that began on 28 July.
Given the above, we could assume some consolidation today as the market awaits the outcome of the presidential talks. The fact that the ADX indicator is hovering near its lows and trending downward underscores the current indecision and caution in the market.
However, Monday’s open could prove highly volatile. Be prepared for sharp EUR/USD movements in either direction, depending on statements made by the US and Russian leaders.
Trade over 50 forex markets 24 hours a day with FXOpen. Take advantage of low commissions, deep liquidity, and spreads from 0.0 pips. Open your FXOpen account now or learn more about trading forex with FXOpen.
CFDs are complex instruments and come with a high risk of losing your money.
This article represents the opinion of the Companies operating under the FXOpen brand only. It is not to be construed as an offer, solicitation, or recommendation with respect to products and services provided by the Companies operating under the FXOpen brand, nor is it to be considered financial advice.
👍2
#stockmarket #stocktrading #marketanalysis #MarketNews #NASDAQ
Nasdaq 100 Analysis: Tech Stocks Face Sell-Offs
As the chart shows, the Nasdaq 100 index (US Tech 100 mini on FXOpen) fell by approximately 1.6% yesterday.
According to media reports, bearish sentiment has been fuelled by the approach of key events:
→ the release of the FOMC meeting minutes (today at 21:00 GMT+3);
→ Jerome Powell’s speech at the Jackson Hole symposium on Friday. Market participants are preparing for remarks from the Fed Chair on the trajectory of interest rates.
Notably, the S&P 500 declined less significantly, while the Dow Jones remained virtually unchanged. This suggests that:
→ tech stocks are heavily overvalued due to AI-driven hype;
→ capital shifted yesterday from risk assets (including cryptocurrencies) into so-called safe havens.
Could tech stocks continue to decline?
Technical Analysis of the Nasdaq 100 (US Tech 100 mini on FXOpen)
Analysing the Nasdaq 100 index chart (US Tech 100 mini on FXOpen) on 5 August, we plotted the main upward channel (shown in blue). It remains valid, as since then the price has:
1→ reached the upper boundary, which (as often happens) acted as resistance;
2→ retreated to the median line, where volatility decreased (a sign of balance between supply and demand), but only briefly.
Yesterday’s low coincided with the lower boundary of the channel.
From a bullish perspective, buyers might rely on:
→ a resumption of the uptrend from the lower boundary (as was the case in early August);
→ support at the 50% retracement level after the A→B impulse (located around the current price area);
→ a rebound from the oversold zone indicated by the RSI;
→ support at the 7 August low of 23,250 (a false bearish breakout remains possible).
On the other hand: the price has confidently broken through the channel median and then accelerated downwards (a sign of imbalance in favour of sellers). This imbalance zone (which, under the Smart Money Concept methodology, is considered a bearish Fair Value Gap) could act as resistance going forward.
Given the pace of yesterday’s decline, we could assume that sellers currently hold the initiative. Should we see weak rebounds (in the style of a dead cat bounce) from the channel’s lower boundary, the likelihood of a bearish breakout could increase.
Trade global index CFDs with zero commission and tight spreads. Open your FXOpen account now or learn more about trading index CFDs with FXOpen.
CFDs are complex instruments and come with a high risk of losing your money.
This article represents the opinion of the Companies operating under the FXOpen brand only. It is not to be construed as an offer, solicitation, or recommendation with respect to products and services provided by the Companies operating under the FXOpen brand, nor is it to be considered financial advice.
👍1
#coinbase #stocktrading #stockmarket #marketanalysis #MarketNews
Coinbase (COIN) shares fall to a 2-month low
According to the chart of Coinbase Global (COIN), the stock price of the cryptocurrency exchange is sliding towards the $295 level, a 2-month low.
It is worth recalling that last month we reported that COIN stock had surged to an all-time high around $400. At that time, we:
→ highlighted the long-term grey channel and the short-term blue one;
→ suggested a potential correction from the upper boundary of the grey channel.
Since then, COIN’s share price has declined by more than 20% (yesterday’s drop was fuelled by a broader risk-off sentiment in technology stocks, which we analysed earlier today in the context of the Nasdaq 100 index). If this is indeed a correction from the all-time high, it looks too deep for a bull market. Could COIN shares extend their decline?
Technical analysis of Coinbase (COIN) stock
From a broader perspective, the grey channel remains valid. Following the release of a disappointing earnings report on 1 August, COIN formed a bearish gap and found support near the median of this channel.
Note the price action (highlighted with an arrow) – the bulls attempted to push the price higher but failed. This resembles either a false breakout of the 1 August high or a retest of the gap’s lower boundary – in both cases, a bearish signal. Particularly so given the candlestick with a long upper shadow, forming a gravestone doji pattern.
The MACD indicator suggests “clouds are gathering”: the histogram is approaching zero, while the two lines have turned downward. If the bears manage to build on their advantage, this would imply that:
→ market participants view the psychological $300 level as too high for COIN;
→ the price is moving away from the median of the grey channel and might approach its lower boundary, where buyers typically tend to step in.
If this scenario unfolds, the bears will need to show persistence, given the importance of support at $273.70, where the price rallied strongly in mid-June (a sign of aggressive buying).
It is also worth noting a series of bullish news related to Coinbase (completion of the Deribit exchange acquisition, improved regulatory outlook) – but the stock is already down more than 30% from its record high, which raises concerns.
Trade global index CFDs with zero commission and tight spreads. Open your FXOpen account now or learn more about trading index CFDs with FXOpen.
CFDs are complex instruments and come with a high risk of losing your money.
This article represents the opinion of the Companies operating under the FXOpen brand only. It is not to be construed as an offer, solicitation, or recommendation with respect to products and services provided by the Companies operating under the FXOpen brand, nor is it to be considered financial advice.
👍2
#NZDUSD #forextrading #tradingtips #marketanalysis #MarketNews
NZD/USD Holds Near Four-Month Low
As today’s NZD/USD chart shows, the pair is trading near a four-month low following a sharp decline. The drop occurred yesterday after the Reserve Bank of New Zealand cut the official cash rate by 25 basis points to a three-year low of 3.0% and indicated that the rate could fall further to 2.55% by May 2026.
According to Trading Economics:
- Analysts now expect at least two additional rate cuts before the end of the year;
- There is a risk of deeper cuts depending on incoming economic data.
New Zealand’s exports are also under pressure, particularly due to the 15% US tariffs that came into effect earlier this month, threatening to undermine the country’s competitiveness in key markets. According to Reuters, Citi analysts expect GDP to contract in the second quarter, raising the risk of a recession in New Zealand.
Technical Analysis of the NZD/USD 4-Hour Chart
NZD/USD price action since early July has formed a downward channel (marked in red), reflecting a bearish outlook. Key observations:
→ Yesterday’s drop was sharp, with a very long candle closing near its lows – a bearish signal;
→ However, the lower boundary of the channel acted as strong support, holding back further pressure.
Looking at the broader context:
→ The B→C recovery reached approximately the 0.618 Fibonacci retracement level after the A→B impulse;
→ The D→E rebound from the channel’s median was modest, signalling weak demand.
Given the strength of the channel’s lower boundary and the oversold condition (as shown by the RSI), bulls have some grounds to expect a potential rebound. In that case, NZD/USD could face resistance from the QL line, which divides the descending channel into two quarters.
Reaching the resistance zone formed by the channel median and the 0.589 level (previously acted as support during the inverse head and shoulders pattern - highlighted with arrows) could be difficult in the near term under current conditions.
Trade over 50 forex markets 24 hours a day with FXOpen. Take advantage of low commissions, deep liquidity, and spreads from 0.0 pips. Open your FXOpen account now or learn more about trading forex with FXOpen.
CFDs are complex instruments and come with a high risk of losing your money.
This article represents the opinion of the Companies operating under the FXOpen brand only. It is not to be construed as an offer, solicitation, or recommendation with respect to products and services provided by the Companies operating under the FXOpen brand, nor is it to be considered financial advice.
👍1
#stockmarket #stocktrading #marketanalysis #MarketNews
Palantir Technologies (PLTR) Shares Plunge Below $150
Shares of Palantir Technologies (PLTR), a company specialising in big data analytics software, delivered an unpleasant surprise to investors:
→ just last week, the stock was trading at its all-time high of around $190;
→ yesterday, the price collapsed below $150. At yesterday’s intraday low, PLTR stock had dropped almost 25% from its record peak.
Why Did Palantir Technologies (PLTR) Stock Fall?
Bearish sentiment may have been driven by:
→ capital rotation from risk assets into so-called defensive stocks ahead of the Federal Reserve Chair’s speech at the Jackson Hole Symposium (as we reported yesterday);
→ growing speculation that a “bubble” is forming in the technology sector, which could burst.
According to Investor’s Business Daily, Andrew Left, founder of Citron Research, bet on downside in PLTR, arguing that the stock is severely overvalued following its phenomenal 340% rally in 2024.
Technical Analysis of Palantir Technologies (PLTR) Stock
In our previous analysis of PLTR’s price action, we:
→ identified an ascending channel (shown in blue);
→ suggested that the upcoming earnings release would push the stock towards the upper boundary of this blue channel.
Indeed, the strong earnings report on 5 August acted as a catalyst for the surge (breaking through resistance at $160, as indicated by the arrow) towards the channel’s upper boundary. However, the optimism stemming from these fundamentals was swiftly and completely erased – a highly significant bearish signal.
That said, the bulls still have valid reasons to remain hopeful, as the price:
→ staged a false bearish breakout below the key $145 level, which had previously acted as resistance (and has now flipped into support);
→ closed yesterday’s volatile session above its opening price (forming a dragonfly doji on the daily chart);
→ thus, the blue channel remains valid, with demand showing signs of aggression.
We can assume that the market has undergone a stress test and, after the volatility spike, the price has returned to the prevailing ascending channel, maintaining the uptrend. If so, the bulls will need to prove their resolve by overcoming key resistance levels at $160 and $170 (these mark not only the gap boundaries but also psychological barriers). If successful, PLTR’s price could advance towards the channel’s median line.
Trade global index CFDs with zero commission and tight spreads. Open your FXOpen account now or learn more about trading index CFDs with FXOpen.
CFDs are complex instruments and come with a high risk of losing your money.
This article represents the opinion of the Companies operating under the FXOpen brand only. It is not to be construed as an offer, solicitation, or recommendation with respect to products and services provided by the Companies operating under the FXOpen brand, nor is it to be considered financial advice.
👍2
#AUDUSD #forextrading #tradingtips #marketanalysis #MarketNews
Australian Dollar Surges Sharply
As illustrated by the AUD/USD chart, while the pair was trading near a two-month low at the start of Friday, today it has jumped by more than 1.1%.
The primary driver behind this rally is the weakening US dollar, which reflects the market’s reaction to Jerome Powell’s comments at the Jackson Hole Symposium. He stated that the risks of declining employment are rising. And if these risks materialise, it could happen very quickly. According to Reuters, this strengthens the likelihood of a Federal Reserve rate cut at its meeting next month.
At the same time, market participants are preparing for the release of Australia’s CPI data, scheduled for this Wednesday.
Technical Analysis of AUD/USD
On 14 August, we reviewed the dynamics of the Australian dollar and highlighted the following:
→ a descending channel was identified, with the AUD/USD chart signalling prevailing bearish sentiment;
→ the psychological level of 0.6500 was marked as critical.
Since then:
→ the pair broke through the support line S around 0.6500;
→ on Friday it dropped to a two-month low;
→ but today it is showing signs of strength.
What Could Happen Next?
Bearish outlook:
→ the pair remains within the descending channel;
→ low 5 continues the sequence of lower highs and lower lows;
→ the sharp rally in AUD/USD might prove to be an overly emotional reaction to the Fed Chair’s remarks.
Bullish outlook:
→ when forming low 5, the price fell only slightly below low 3. In SMC terminology, this can be interpreted as a bullish Liquidity Grab;
→ the black arrow indicates a long lower shadow – a sign that demand persisted over the weekend.
Price action suggests an attempt to test the resistance area formed by:
→ the 0.6500 level,
→ the QH line dividing the upper half of the channel into two quarters,
→ the bearish candle (marked with a red arrow), where selling pressure was previously aggressive, breaking support at S – meaning supply dominance may still remain to some extent.
If bulls manage to secure a foothold above 0.6500, this mght be interpreted as a significant shift in market sentiment in favour of demand. In the longer term, this could drive AUD/USD towards the upper boundary of the channel (with a possible breakout scenario).
Trade over 50 forex markets 24 hours a day with FXOpen. Take advantage of low commissions, deep liquidity, and spreads from 0.0 pips. Open your FXOpen account now or learn more about trading forex with FXOpen.
CFDs are complex instruments and come with a high risk of losing your money.
This article represents the opinion of the Companies operating under the FXOpen brand only. It is not to be construed as an offer, solicitation, or recommendation with respect to products and services provided by the Companies operating under the FXOpen brand, nor is it to be considered financial advice.
👍2
#EURUSD #forextrading #tradingtips #marketanalysis #MarketUpdates
EUR/USD Exchange Rate Shows Increased Volatility
Powell’s speech on Friday had a distinctly dovish tone. Expectations of an interest rate cut strengthened, which led to a sharp weakening of the dollar — on the EUR/USD chart, a bullish impulse A→B was formed.
On Monday, as often happens after an initial emotional reaction to major news, the price corrected as market participants reassessed prospects in light of the Fed Chair’s softened rhetoric.
What is particularly notable is that the correction was most evident on the EUR/USD chart, where the decline B→C almost completely offset Friday’s surge. This could point to underlying weakness in the euro, which seems justified when considering that the euro index EXY (the euro’s performance against a basket of currencies) has risen by roughly 13% since the beginning of the year.
The EUR/USD rate reacted less strongly to the news that President Trump had decided to dismiss Lisa Cook, a member of the Federal Reserve’s Board of Governors. While the media debates whether the President has the authority to remove her, traders may instead assess how EUR/USD could fluctuate following the A→B→C volatility swing.
Technical Analysis of the EUR/USD Chart
Recently, we outlined a descending channel using the sequence of lower highs and lows observed this summer. The upper boundary clearly acted as resistance for EUR/USD’s rise on Friday.
From the bears’ perspective:
→ the price has broken downward through an ascending trajectory (shown in purple), and the lower purple line has already changed its role from support to resistance (as indicated by the arrow);
→ today’s rebound from the 1.1600 support level appears weak, as highlighted by the long upper shadow on the candlestick;
→ if this rebound is merely an interim recovery following the bearish B→C impulse, it fails to reach the 50% Fibonacci retracement level.
In addition, the B peak only slightly exceeded the previous August high (which resembles a bull trap).
Taking all this into account, we could assume that in the near term we may see bears attempt to break the 1.1600 support level and push EUR/USD towards the median line of the primary descending channel.
Trade over 50 forex markets 24 hours a day with FXOpen. Take advantage of low commissions, deep liquidity, and spreads from 0.0 pips. Open your FXOpen account now or learn more about trading forex with FXOpen.
CFDs are complex instruments and come with a high risk of losing your money.
This article represents the opinion of the Companies operating under the FXOpen brand only. It is not to be construed as an offer, solicitation, or recommendation with respect to products and services provided by the Companies operating under the FXOpen brand, nor is it to be considered financial advice.
👍2
#nvidia #NVDA #stockmarket #stocktrading #marketanalysis
Nvidia (NVDA) Upcoming Earnings Report
Tomorrow after hours, Nvidia will release its quarterly report, attracting heightened attention given its position as:
→ the world’s largest company (market capitalisation of around $4.39 trillion);
→ a leader in the development of AI-related industries;
→ strong stock price performance — approximately +33% year-to-date, +108% from the yearly low.
Bullish Expectations
Analysts anticipate Nvidia will report revenue of around $46 billion, more than 50% higher than the same period last year.
Investors are counting on confirmation of robust demand for Nvidia’s chips from tech giants such as Microsoft, Google, Amazon, and Meta, all of which continue to expand capital expenditure on data centres to power AI workloads.
Further support for NVDA’s share price could come from positive news about demand for the new Blackwell chips and the resumption of sales in China following a recent agreement with the US government.
Bearish Concerns
Even strong results may fall short of “sky-high” optimistic expectations, potentially triggering profit-taking and a decline in Nvidia’s (NVDA) stock price. The stock trades at a high P/E multiple (price-to-earnings ratio), making it vulnerable to any negative news or even a minor miss against forecasts.
The primary concern is that Nvidia’s forward guidance might point to a slowdown in AI infrastructure spending growth by its key clients. Any hint of this could negatively affect not only Nvidia’s shares but also the broader technology sector.
Technical Analysis of Nvidia (NVDA) Chart
NVDA’s share price remains within an upward channel (shown in blue), with the following configuration:
→ until mid-August, the price remained within the upper half of the channel;
→ in August, the price declined towards the lower boundary (point A).
The $170 level appears to be a key support:
→ it is a round psychological level;
→ the low at point A looks like an aggressive test of this level, after which the price reversed upward.
From a bullish perspective:
→ support is provided by the lower boundary of the channel;
→ a long bullish candlestick (2) signals persistent demand.
From a bearish perspective, the $183 level looks like key resistance: NVDA’s share price slowed its advance here in early August, with repeated unsuccessful attempts to break higher.
Given the above, we could assume that the bulls may attempt to push through the $183 resistance on the back of the earnings release, but to do so, Nvidia’s results and guidance must at least meet the market’s extremely optimistic expectations.
Trade global index CFDs with zero commission and tight spreads. Open your FXOpen account now or learn more about trading index CFDs with FXOpen.
CFDs are complex instruments and come with a high risk of losing your money.
This article represents the opinion of the Companies operating under the FXOpen brand only. It is not to be construed as an offer, solicitation, or recommendation with respect to products and services provided by the Companies operating under the FXOpen brand, nor is it to be considered financial advice.
👍2
#xtiusd #brentoil #commodities #oilprices #marketanalysis
XTI/USD Chart Analysis: Oil Price Falls 2.8% from This Week’s High
As the XTI/USD chart shows, this morning (27 August) WTI crude oil is trading around the $63 level, although on Monday it climbed above $64.70. This means the price has retreated by approximately 2.8% from this week’s high.
The bearish momentum may be linked to the market’s reassessment of geopolitical risks. According to Reuters, US Special Representative Steve Witkoff stated that:
→ he will meet with a Ukrainian delegation in New York this week;
→ the US administration is also in talks with Russia, seeking to bring the war to an end.
He also noted that Washington is striving for de-escalation in the Middle East. We could assume that market participants are pricing in the possibility that these efforts could lead to the easing of sanctions and reduce risks and restrictions in global oil trade.
Technical Analysis of the XTI/USD Chart
On 19 August, we highlighted that:
→ the August downtrend remained intact, though it appeared to be weakening;
→ bulls might exploit this situation and attempt to launch an attack.
Indeed, since then the price rallied to a peak near $64.80, forming an upward trajectory shown by the orange lines. However, at the start of this week, momentum shifted back to the bears, as evidenced by a series of bearish signals on the chart:
→ Yesterday, bulls attempted to resume the upward trend from the lower orange boundary but failed – this was reflected in a candlestick with a long upper shadow, touching the $64 level before reversing downwards.
→ Bears then built on this success, pushing the price below $63.50 (where the lower orange line had been positioned).
→ This morning, WTI is trading close to weekly lows, highlighting the bulls’ inability to counter the pressure.
As a result, bears have driven the price back into the descending channel that has been in place since the start of the month. Given the above, we could assume that the market may continue to develop bearish dynamics within this downward channel – with WTI potentially heading towards the red median line.
The forthcoming oil inventory report (due today at 15:30 GMT+3) might have a significant influence on how the situation unfolds.
Start trading commodities with tight spreads. Open your trading account now or learn more about trading commodity CFDs with FXOpen.
CFDs are complex instruments and come with a high risk of losing your money.
This article represents the opinion of the Companies operating under the FXOpen brand only. It is not to be construed as an offer, solicitation, or recommendation with respect to products and services provided by the Companies operating under the FXOpen brand, nor is it to be considered financial advice.
👍2
#stockmarket #stocktrading #MarketNews #marketanalysis
Boeing (BA) Share Price Could Reach 2025 Highs
As the Boeing (BA) stock chart indicates, the price rose by 3.5% yesterday, while the S&P 500 index (US SPX 500 mini on FXOpen) gained only 0.4%. Boeing’s stronger performance reflects optimism driven by news (and market rumours) reported in the media suggesting that:
→ Korean Air has purchased more than 100 aircraft during the newly elected South Korean president’s visit to the White House;
→ Boeing is negotiating the sale of 500 aircraft to China;
→ the Trump administration may acquire stakes in companies linked to the defence sector (Palantir, Boeing, Lockheed Martin).
Technical Analysis of BA Stock Chart
BA’s price fluctuations have formed an upward channel (shown in blue). However, at the end of July, the rally encountered resistance around the $235 level:
→ following a volatility spike at the end of July (triggered by the quarterly earnings release), the price retreated towards the lower boundary of the channel;
→ in mid-August, the price turned downwards again from this level.
At the same time, we can observe a sequence of higher lows (1-2-3), emphasising that the lower boundary of the channel is acting as key support, setting the pace for BA’s growth trajectory in 2025.
It is worth noting that the stock’s oscillation between support (the lower boundary) and resistance around $235 is creating bullish patterns such as an Ascending Triangle and a Cup and Handle.
Should reports of a potential Boeing share purchase by the US government be confirmed, the BA stock price could advance to new annual highs. In such a scenario, several factors could be important:
→ the price may subsequently consolidate around the channel’s median;
→ historically, the $250–260 zone has acted as significant resistance during 2021–2023;
→ the $235 level may switch roles to become support, similar to the way $218 previously did.
Trade global index CFDs with zero commission and tight spreads. Open your FXOpen account now or learn more about trading index CFDs with FXOpen.
CFDs are complex instruments and come with a high risk of losing your money.
This article represents the opinion of the Companies operating under the FXOpen brand only. It is not to be construed as an offer, solicitation, or recommendation with respect to products and services provided by the Companies operating under the FXOpen brand, nor is it to be considered financial advice.
👍2
#stockmarket #GOOGL #stocks #marketanalysis #MarketNews
Alphabet (GOOGL) Shares Set an All-Time High
As the chart of Alphabet (GOOGL) shares shows, the price in August exceeded the February high. For the first time in history, the close price moved above $210.
The positive market sentiment is being driven by the development of AI technologies, as well as Alphabet’s (GOOGL) ambition to maintain a leading position in this field. Among the latest news, it is worth noting that Meta Platforms (META) has signed an agreement to use Google Cloud’s infrastructure for its AI projects, which is expected to bring Alphabet around $10 billion in revenue.
Technical Analysis of GOOGL Shares
In the long-term context, price fluctuations are forming an ascending channel (shown in blue). After falling to the lower boundary in early April (when Trump first announced his tariffs), the balance of sentiment shifted, and the price has since been moving within a new medium-term ascending channel (shown in purple), approaching the upper boundary of the blue channel.
At the same time, we can make the following observations, which generally point to a bullish market:
→ the price has confidently broken above the median line of the long-term channel;
→ the price has consolidated above the psychological level of $200, which acted as resistance at the start of the year;
→ this summer, the price has been trading near the upper boundary of the medium-term channel, highlighting strong demand – short-term declines towards the median line of the medium-term channel have quickly attracted buyers;
→ in August, the $205.75 level switched its role from resistance to support.
From a bearish perspective, the RSI indicator is showing signs of divergence, suggesting that the rally may be running out of steam. However, it seems that more significant drivers would be needed to shift the current positive sentiment:
→ Technically, Alphabet’s (GOOGL) share price reaching the upper boundary (which looks realistic given the bullish factors listed) could motivate buyers to take profits.
→ Major economic news, such as a change in the Federal Reserve’s interest rate policy.
Trade global index CFDs with zero commission and tight spreads. Learn more about trading index CFDs with FXOpen.
CFDs are complex instruments and come with a high risk of losing your money.
This article represents the opinion of the Companies operating under the FXOpen brand only. It is not to be construed as an offer, solicitation, or recommendation with respect to products and services provided by the Companies operating under the FXOpen brand, nor is it to be considered financial advice.
👍2
#NZDUSD #forextrading #tradingtips #marketanalysis #MarketNews
NZD/USD Rises by ~1.4% in 2 Days
As the NZD/USD chart shows, the New Zealand dollar was trading around 0.5820 against the US dollar on Wednesday, but today it has climbed above 0.5895 – an impressive gain of approximately 1.4% in just two days.
The rise in NZD/USD is being driven both by the general weakening of the US dollar ahead of the Federal Reserve’s expected September rate cut, and by strengthening demand for the “kiwi”. As Reuters notes:
→ the New Zealand dollar is often used as a substitute for the yuan because of close trade relations with China;
→ meanwhile, the yuan is strengthening, with Chinese policymakers recommending support for the currency given its low valuation and the need to facilitate trade negotiations with the US.
Technical Analysis of the NZD/USD Chart
It’s worth paying attention to the unusual trading activity (marked by the arrow) and its context:
→ it was the lowest level in more than four months;
→ after a sharp decline, the price stabilised near the lower boundary of the channel;
→ trading was fairly active, and although the price was drifting lower, it failed to generate strong bearish momentum.
It is possible that so-called Smart Money was attracted by the undervalued asset, preventing further declines through buy orders and accumulating long positions. If so, from this perspective it is notable that:
→ the 0.5820 level acted as support on Wednesday – the price rebounded sharply;
→ yesterday NZD/USD moved into the upper half of the channel, breaking through the 0.5875 resistance.
This week’s price rise has formed a trajectory marked by purple lines. NZD/USD might be heading towards the upper boundary of the ascending channel, with the following resistance levels standing out along the way:
→ the former support at 0.5910;
→ the 50% Fibonacci retracement level from the A→B move.
An attempt to break through this resistance zone could result in a pullback towards the lower boundary of the purple channel.
Trade over 50 forex markets 24 hours a day with FXOpen. Take advantage of low commissions, deep liquidity, and spreads from 0.0 pips. Learn more about trading forex with FXOpen.
CFDs are complex instruments and come with a high risk of losing your money.
This article represents the opinion of the Companies operating under the FXOpen brand only. It is not to be construed as an offer, solicitation, or recommendation with respect to products and services provided by the Companies operating under the FXOpen brand, nor is it to be considered financial advice.
👍2
#nvidia #NVDA #stockmarket #stocktrading #marketanalysis #MarketNews
Nvidia (NVDA) Shows Bearish Signs After Earnings Release
On Wednesday, Nvidia published a fairly strong quarterly report:
→ Revenue for the second quarter came in at $46.74 billion (record), up 56% compared with the same period last year;
→ Adjusted earnings per share (EPS) were $1.05, a 54% year-on-year increase and above analysts’ expectations of $1.01–$1.02.
However, in the Data Centre segment (closely watched by the market), results fell slightly short of Wall Street forecasts, which may suggest a slowdown in capital flows into AI infrastructure. This factor could explain why Nvidia (NVDA) underperformed the index later in the week: for instance, the S&P 500 hit a record high on Thursday, while NVDA closed lower.
Technical analysis of Nvidia (NVDA) chart
Six days ago, we:
→ Drew an upward channel (shown in blue), capturing NVDA’s price swings after the bullish surge at the end of June;
→ Highlighted the importance of support at $170 and resistance at $183.
Indeed, $183 looks like a solid barrier:
→ The numbers (1, 2, 3) mark failed attempts by the bulls to break through this resistance, giving grounds to view the chart in the context of a triple top pattern.
→ The third peak only slightly exceeds the previous highs, which resembles a bull trap and the Upthrust After Distribution (UTAD) pattern in Richard Wyckoff’s methodology, signalling the prospect of lower prices. A bearish gap the following day (shown by the red arrow) and a weak Friday close underline the bears’ aggression.
Given the above, we could assume that the bulls may try to keep the price within the channel, relying on support at its lower boundary. Yet the mentioned signals suggest that the bears are intensifying pressure. If we see only a weak rebound from the lower boundary at the start of September, the current channel could be at risk. In the event of a bearish breakout, a move down to test the $170 support could happen.
Trade global index CFDs with zero commission and tight spreads. Learn more about trading index CFDs with FXOpen.
CFDs are complex instruments and come with a high risk of losing your money.
This article represents the opinion of the Companies operating under the FXOpen brand only. It is not to be construed as an offer, solicitation, or recommendation with respect to products and services provided by the Companies operating under the FXOpen brand, nor is it to be considered financial advice.
👍2
#Forex #USD #GBP #OilPrices #OPEC #Trading #Investing #MarketNews #GlobalEconomy
Market Insights with Gary Thomson: UK Retail Sales, Canada Jobs, US NFP, and OPEC+ Meeting
In this video, we’ll explore the key economic events, market trends, and corporate news shaping the financial landscape. Get ready for expert insights into forex, commodities, and stocks to help you navigate the week ahead. Let’s dive in!
In this episode of Market Insights, Gary Thomson unpacks the strategic implications of the week’s most critical events driving global markets.
👉 Key topics covered in this episode:
🔸 UK Retail Sales
UK retail sales data on 5 September could spark GBP volatility. June figures showed a rebound but missed forecasts. Another weak print may pressure the pound. Will the data lift GBP or drag it lower again?
🔸 Unemployment Rate in Canada
Canada’s unemployment data on 5 September could sway CAD ahead of the BoC meeting. July’s rate held at 6.9%, near a 4-year high. Will stronger jobs data support CAD, or will weakness add pressure?
🔸 US NFP and Unemployment Rate
US nonfarm payrolls on 5 September could spark volatility before the Fed meeting. July data showed big downward revisions and a weaker jobs picture. Will another soft NFP push the US dollar lower?
🔸 OPEC+ Meeting
OPEC+ meets on 7 September to decide on oil output after finishing voluntary cuts. Their move could shake oil prices on 8 September. Will OPEC+ stick to higher production or pause increases?
🔸 Trade Tensions
Switzerland is set to finalise a new trade deal with Washington in early September, aiming to ease tariffs. The agreement may involve higher defence spending and expanded US energy access.
Gain insights to strengthen your trading knowledge.
💬 Don’t forget to like, comment, and subscribe for more professional market insights every week.
https://cutt.ly/3rLHBpIV
To take advantage of price fluctuations in the foreign exchange markets, consider enlisting the services of a reliable broker like FXOpen.
⚠️
This forecast represents FXOpen Companies opinion only, it should not be construed as an offer, invitation or recommendation in respect to FXOpen Companies products and services or as financial advice.
YouTube
Market Insights with Gary Thomson: UK Retail Sales, Canada Jobs, US NFP, and OPEC+ Meeting
In this video, we’ll explore the key economic events and market trends, shaping the financial landscape. Get ready for expert insights into forex and commodities to help you navigate the week ahead. Let’s dive in!
In this episode of Market Insights, Gary…
In this episode of Market Insights, Gary…
👍3
#stocktrading #stockmarket #MarketNews #marketanalysis
Alibaba (BABA) Shares Soar ~13% After Earnings Report
Alibaba published its second-quarter report on Friday morning. Although the company’s gross revenue came in below analysts’ forecasts ($34.6bn vs $35.1bn), BABA’s share price surged by around 13% (to its highest level since March) as the market reacted positively to:
→ Faster growth in cloud services revenue, seen as key to the company’s success in monetising artificial intelligence, similar to Microsoft and Google.
→ Testing of a new processor designed to reduce reliance on Nvidia.
Technical analysis of Alibaba (BABA) shares
When analysing BABA’s price movements in early July, we identified a resistance zone at $126–$145.
Since then, the price tested the $126 level twice in August, reversing downwards each time. However, the earnings release triggered a wide bullish gap, meaning that $126 could now act as support.
Further bullish arguments:
→ The A-B-C-D-E formation created a contracting triangle, which can be interpreted as a long-term balance of supply and demand. The current bullish impulse breaks this balance, pointing to the potential for a major bullish trend.
→ Starting from point D, price movements have formed an ascending channel (shown in blue), with its median and lower boundary potentially serving as support.
From a bearish perspective, the sharp 19% rise could encourage investors to take profits on existing long positions, as the RSI indicator has moved into overbought territory and BABA’s share price is close to the upper boundary of the blue channel.
Taking all of this into account, we could assume that after the initial strong emotional reaction to the news, the market may reassess its impact and BABA’s share price could correct (for instance, towards the lower boundary of the gap at $128.22).
At the same time, the strong fundamental outlook, driven by the company’s prospects of becoming a leader in the AI sector, suggests that by the end of 2025 we may see an attempt to break above the March high (point A).
Trade global index CFDs with zero commission and tight spreads. Learn more about trading index CFDs with FXOpen.
CFDs are complex instruments and come with a high risk of losing your money.
This article represents the opinion of the Companies operating under the FXOpen brand only. It is not to be construed as an offer, solicitation, or recommendation with respect to products and services provided by the Companies operating under the FXOpen brand, nor is it to be considered financial advice.
👍2
#marketanalysis #marketanalysis #forextrading #tradingtips #GBPUSD
GBP/USD Exchange Rate Tumbles
As today’s GBP/USD chart shows, the pound sterling fell by nearly 1% against the US dollar in just one hour, forming an exceptionally long bearish candle.
The sharp drop was driven by concerns over public finances and a broad sell-off in the bond market. According to Reuters, the yield on UK 30-year government bonds hit 5.69% – the highest level since May 1998 – highlighting the elevated risk premium.
Technical analysis of GBP/USD Price Chart
When analysing the pair’s movements in July, we questioned GBP/USD’s ability to sustain growth. Since then, the chart has developed a series of lower highs and lower lows, forming a bearish A→B→C→D structure.
At the end of August, the pair consolidated between the Support and Resistance lines shown on the chart.
Factors reinforcing the bearish context and confirming earlier doubts include:
→ a failed bullish breakout attempt (marked with a red arrow);
→ Liquidity Grab patterns above previous highs (marked with black arrows).
What could happen next?
Today’s decline highlights a strong resistance zone formed by:
→ the breakout level of August’s support around 1.3462;
→ the upper boundary of the descending channel.
Bulls may find some support at the psychological 1.3400 level. However, if pressure increases (particularly if new bearish fundamental drivers emerge), GBP/USD could slide towards the median of the descending channel.
Trade over 50 forex markets 24 hours a day with FXOpen. Take advantage of low commissions, deep liquidity, and spreads from 0.0 pips. Learn more about trading forex with FXOpen.
CFDs are complex instruments and come with a high risk of losing your money.
This article represents the opinion of the Companies operating under the FXOpen brand only. It is not to be construed as an offer, solicitation, or recommendation with respect to products and services provided by the Companies operating under the FXOpen brand, nor is it to be considered financial advice.
👍2
#goldprice #XAUUSD #commodities #marketanalysis #MarketNews
Gold Price Reaches a New All-Time High
As shown on today’s XAU/USD chart, the price of gold has risen above $3,530 per ounce for the first time in history.
In 2025, the increase in gold prices has been driven by sustained central bank purchases, asset diversification, steady demand for so-called safe-haven assets amid geopolitical and trade tensions, as well as general dollar weakness.
At the beginning of September, bullish sentiment may have been reinforced by:
→ Expectations of a Federal Reserve rate cut. According to the CME FedWatch tool, markets are pricing in a nearly 92% probability of a 25-basis-point rate cut at the Fed meeting on 17 September. Gold, as a non-yielding asset, is typically seen as a beneficiary of low interest rates.
→ News from China, where, in the presence of leaders from many countries, the establishment of a SCO development bank was announced. Market participants may have interpreted this as a new source of geopolitical risk and as pressure on the dollar’s status. Donald Trump has already claimed that the summit in China represents a conspiracy against the United States.
Technical Analysis of the XAU/USD Chart
Looking at gold’s price on 11 August, we:
→ Drew descending lines forming a red channel.
→ Highlighted an important support zone in the form of a bullish Fair Value Gap (marked as FVG1 in purple).
New data allows for the following observations:
→ FVG1 acted as support in the second half of August.
→ The red channel lines resemble a large-scale bullish flag pattern within a long-term uptrend, underscored by the EMA.
By using the July and August extremes, we can trace the outlines of an upward trajectory (shown in blue). The price is currently near the upper boundary, which could trigger a pullback, given overbought signals on the RSI indicator and investors’ potential desire to take profits after more than a 6% rise over the past 10 days.
From a bullish perspective, a possible pullback target could be the potential support area formed by:
→ FVG2. Although it does not strictly conform to construction rules, it reflects an imbalance in favour of buyers that led to a sharp price rally. Bears attempted to resist around the psychological $3,500 level but were defeated.
→ Level C, representing the 50% Fibonacci retracement of the A→B impulse.
It should be noted that the upward impulse has not yet been exhausted, as indicated by the green lines.
Start trading commodities with tight spreads. Learn more about trading commodity CFDs with FXOpen.
CFDs are complex instruments and come with a high risk of losing your money.
This article represents the opinion of the Companies operating under the FXOpen brand only. It is not to be construed as an offer, solicitation, or recommendation with respect to products and services provided by the Companies operating under the FXOpen brand, nor is it to be considered financial advice.
👍2
#stockmarket #stocktrading #GOOGL #MarketNews #marketanalysis
Alphabet (GOOGL) Stock Price Soars By Around 8% After Court Ruling
At the end of August, we reported that Alphabet (GOOGL) stock price had reached a historic high, closing above $210. But today, the price is likely to climb to a new, significantly higher level. Yesterday, in after-hours trading, it surged by roughly 8%.
Why did Alphabet (GOOGL) shares rise?
The jump is explained by a court ruling in a case concerning alleged monopoly practices related to the Chrome browser. According to Investopedia, a federal judge ruled that the tech giant does not need to sell Chrome. This dispelled fears that Alphabet might have been forced to part with a core part of its business.
Interestingly, one of the factors behind the judge’s decision was the spread of AI solutions (such as ChatGPT and Perplexity), which offer competition to Chrome’s search and browsing functions.
Technical analysis of GOOGL shares
In our earlier review, we identified:
→ an upward channel (shown in blue), formed by long-term price movements;
→ an intermediate channel (in place since late spring).
If today’s trading in GOOGL opens around where the price settled in yesterday’s after-hours session (close to $226), this would mean:
→ the growth target at the upper boundary of the blue channel has been reached;
→ in the context of the summer’s price swings, Alphabet (GOOGL) shares will be in an extremely overbought zone.
Once the initial excitement following the news subsides, this could pave the way for a correction, which seems reasonable after a rise of more than 55% in the past five months.
In this case, the $215 level may serve as an indicative target for the correction to end:
→ it marks the lower boundary of a bullish gap that is highly likely to form today;
→ the market could then return within the aforementioned channels, giving the bulls renewed confidence to buy, as Alphabet (GOOGL) would no longer appear overbought, while the strong fundamental backdrop (as can reasonably be expected) would remain intact.
Trade over 50 forex markets 24 hours a day with FXOpen. Take advantage of low commissions, deep liquidity, and spreads from 0.0 pips. Learn more about trading forex with FXOpen.
CFDs are complex instruments and come with a high risk of losing your money.
This article represents the opinion of the Companies operating under the FXOpen brand only. It is not to be construed as an offer, solicitation, or recommendation with respect to products and services provided by the Companies operating under the FXOpen brand, nor is it to be considered financial advice.
👍3
#silver #XAGUSD #commodities #marketanalysis #MarketUpdates
Silver Price Retreats from a 14-Year High
As the XAG/USD chart shows, yesterday silver climbed above $41.40 per ounce. The last time silver traded at this level was in September 2011. The rise in XAG/USD was supported by gold surging to a record high, which we reported yesterday.
Furthermore, Goldman Sachs analysts have issued a gold price forecast for mid-2026, according to which XAU/USD could rise to:
→ $4,000 under the base case;
→ $5,000 if 1% of the private US Treasury market flows into gold. This scenario would imply a loss of Federal Reserve independence, higher inflation, and the US dollar weakening as a so-called reserve currency.
Technical Analysis of XAG/USD
Analysing XAG/USD fluctuations, we can identify two ascending channels:
→ Medium-term (shown in blue): in play since early summer;
→ Short-term (shown in purple): reflecting increased demand over the past two weeks.
Within this context, it is evident that silver has encountered a resistance cluster formed by the upper boundaries of these channels. For short- and medium-term traders, this suggests that XAG/USD may be considered overvalued → potentially triggering a wave of profit-taking on long positions.
Signs of demand exhaustion include:
→ A bearish divergence on the RSI indicator;
→ The aggressive decline from the upper channel boundary (highlighted by the orange arrow).
Bulls may find support at the median line and lower boundary of the purple channel.
Given the above, we might assume that the purple channel could still sustain silver’s upward momentum by inertia. At the same time, the formation of a bearish reversal pattern (e.g. a double top) near the upper blue boundary could occur, followed by a correction towards the psychological $40 level (where a buyer imbalance was previously observed).
Start trading commodities with tight spreads. Learn more about trading commodity CFDs with FXOpen.
CFDs are complex instruments and come with a high risk of losing your money.
This article represents the opinion of the Companies operating under the FXOpen brand only. It is not to be construed as an offer, solicitation, or recommendation with respect to products and services provided by the Companies operating under the FXOpen brand, nor is it to be considered financial advice.
👍3
#AAPL #stockmarket #stocktrading #MarketNews #MarketUpdates
Apple (AAPL) Shares Jump to a Six-Month High
As the AAPL chart shows, yesterday the price rose above $238 – its highest level since early March.
The optimistic sentiment was fuelled by:
→ A court ruling concerning Google, which we reported on yesterday. Apple shares advanced after the court allowed Alphabet to continue paying Apple for preloading Google Search on the iPhone. Bank of America analysts even raised their AAPL price target to $260.
→ The upcoming Apple presentation scheduled for 9 September. Expectations are that the event could unveil the iPhone 17 and new Apple Watch models, which may provide a bullish catalyst.
Technical Analysis of Apple (AAPL) Stocks
Analysing the chart in early August, we:
→ identified an ascending channel (shown in blue);
→ noted that, given the aggressive rally (accompanied by bullish gaps) and a strong fundamental backdrop, any corrections were likely to be limited.
Since then:
→ AAPL has moved higher, justifying the expansion of the blue channel;
→ the pullback (marked by an arrow) was minor, as expected, confirming the median line of the expanded channel as support;
→ in the short term, we could identify grounds for a new upward trajectory (shown in orange).
Yesterday’s price action in AAPL:
→ produced a wide bullish gap at the open (which may act as support);
→ broke through the long-term descending trendline (R), which had been acting as resistance;
→ indicated that the $235 level (around the August high) now functions as support.
Within this context, we could assume that:
→ in the short term, AAPL may maintain its upward trajectory within the orange channel;
→ in the longer term, bulls may target the upper boundary of the blue channel – located near the psychological $250 mark. Reaching this level could trigger stronger selling pressure.
In the event of a significant correction (for example, due to disappointment with new product launches), potential support levels could include:
→ the median of the blue channel;
→ the trendline R.
Trade global index CFDs with zero commission and tight spreads. Learn more about trading index CFDs with FXOpen.
CFDs are complex instruments and come with a high risk of losing your money.
This article represents the opinion of the Companies operating under the FXOpen brand only. It is not to be construed as an offer, solicitation, or recommendation with respect to products and services provided by the Companies operating under the FXOpen brand, nor is it to be considered financial advice.
👍4