
#usdchf #tradingtips #forextrading #MarketUpdates #marketanalysis
USD/CHF Falls to Its Lowest Level in Nearly Five Months
Today, the exchange rate of one US dollar against the Swiss franc dropped below 0.87000 francs—its lowest level since early November 2024.
Since the start of 2025, the USD/CHF pair has declined by more than 4%.
Why Is USD/CHF Falling Today?
On one hand, the US dollar is weakening against other currencies due to Trump’s decision to implement the previously announced tariffs on international trade, as mentioned in our previous post.
On the other hand, the Swiss franc is gaining strength due to its appeal as a safe-haven asset. Furthermore, this morning’s release of the Consumer Price Index (CPI) showed that inflation in Switzerland remains at zero, increasing the franc’s value at a time when tariff conflicts pose risks to the global economy.
Technical Analysis of the USD/CHF Chart
Since the start of 2025, the USD/CHF pair has been following a downward trajectory, highlighted by a declining channel (marked in red), with the following key points:
→ The median line has shifted from support to resistance, as indicated by the arrows.
→ The price broke through the March support level around 0.8757, accelerating the decline.
→ The lower boundary of the channel provided support this morning, slowing bearish momentum.
It is possible that the 0.8757 level will act as resistance in April 2025. However, the future direction of USD/CHF will largely depend on news developments, particularly statements from global leaders regarding tariffs in international trade.
Trade over 50 forex markets 24 hours a day with FXOpen. Take advantage of low commissions, deep liquidity, and spreads from 0.0 pips. Open your FXOpen account now or learn more about trading forex with FXOpen.
CFDs are complex instruments and come with a high risk of losing your money.
This article represents the opinion of the Companies operating under the FXOpen brand only. It is not to be construed as an offer, solicitation, or recommendation with respect to products and services provided by the Companies operating under the FXOpen brand, nor is it to be considered financial advice.
USD/CHF Falls to Its Lowest Level in Nearly Five Months
Today, the exchange rate of one US dollar against the Swiss franc dropped below 0.87000 francs—its lowest level since early November 2024.
Since the start of 2025, the USD/CHF pair has declined by more than 4%.
Why Is USD/CHF Falling Today?
On one hand, the US dollar is weakening against other currencies due to Trump’s decision to implement the previously announced tariffs on international trade, as mentioned in our previous post.
On the other hand, the Swiss franc is gaining strength due to its appeal as a safe-haven asset. Furthermore, this morning’s release of the Consumer Price Index (CPI) showed that inflation in Switzerland remains at zero, increasing the franc’s value at a time when tariff conflicts pose risks to the global economy.
Technical Analysis of the USD/CHF Chart
Since the start of 2025, the USD/CHF pair has been following a downward trajectory, highlighted by a declining channel (marked in red), with the following key points:
→ The median line has shifted from support to resistance, as indicated by the arrows.
→ The price broke through the March support level around 0.8757, accelerating the decline.
→ The lower boundary of the channel provided support this morning, slowing bearish momentum.
It is possible that the 0.8757 level will act as resistance in April 2025. However, the future direction of USD/CHF will largely depend on news developments, particularly statements from global leaders regarding tariffs in international trade.
Trade over 50 forex markets 24 hours a day with FXOpen. Take advantage of low commissions, deep liquidity, and spreads from 0.0 pips. Open your FXOpen account now or learn more about trading forex with FXOpen.
CFDs are complex instruments and come with a high risk of losing your money.
This article represents the opinion of the Companies operating under the FXOpen brand only. It is not to be construed as an offer, solicitation, or recommendation with respect to products and services provided by the Companies operating under the FXOpen brand, nor is it to be considered financial advice.

👍2
#sp500 #stockmarket #stocks #marketanalysis #MarketNews
S&P 500 Index Hits 2025 Low Following Trump's Tariff Announcement
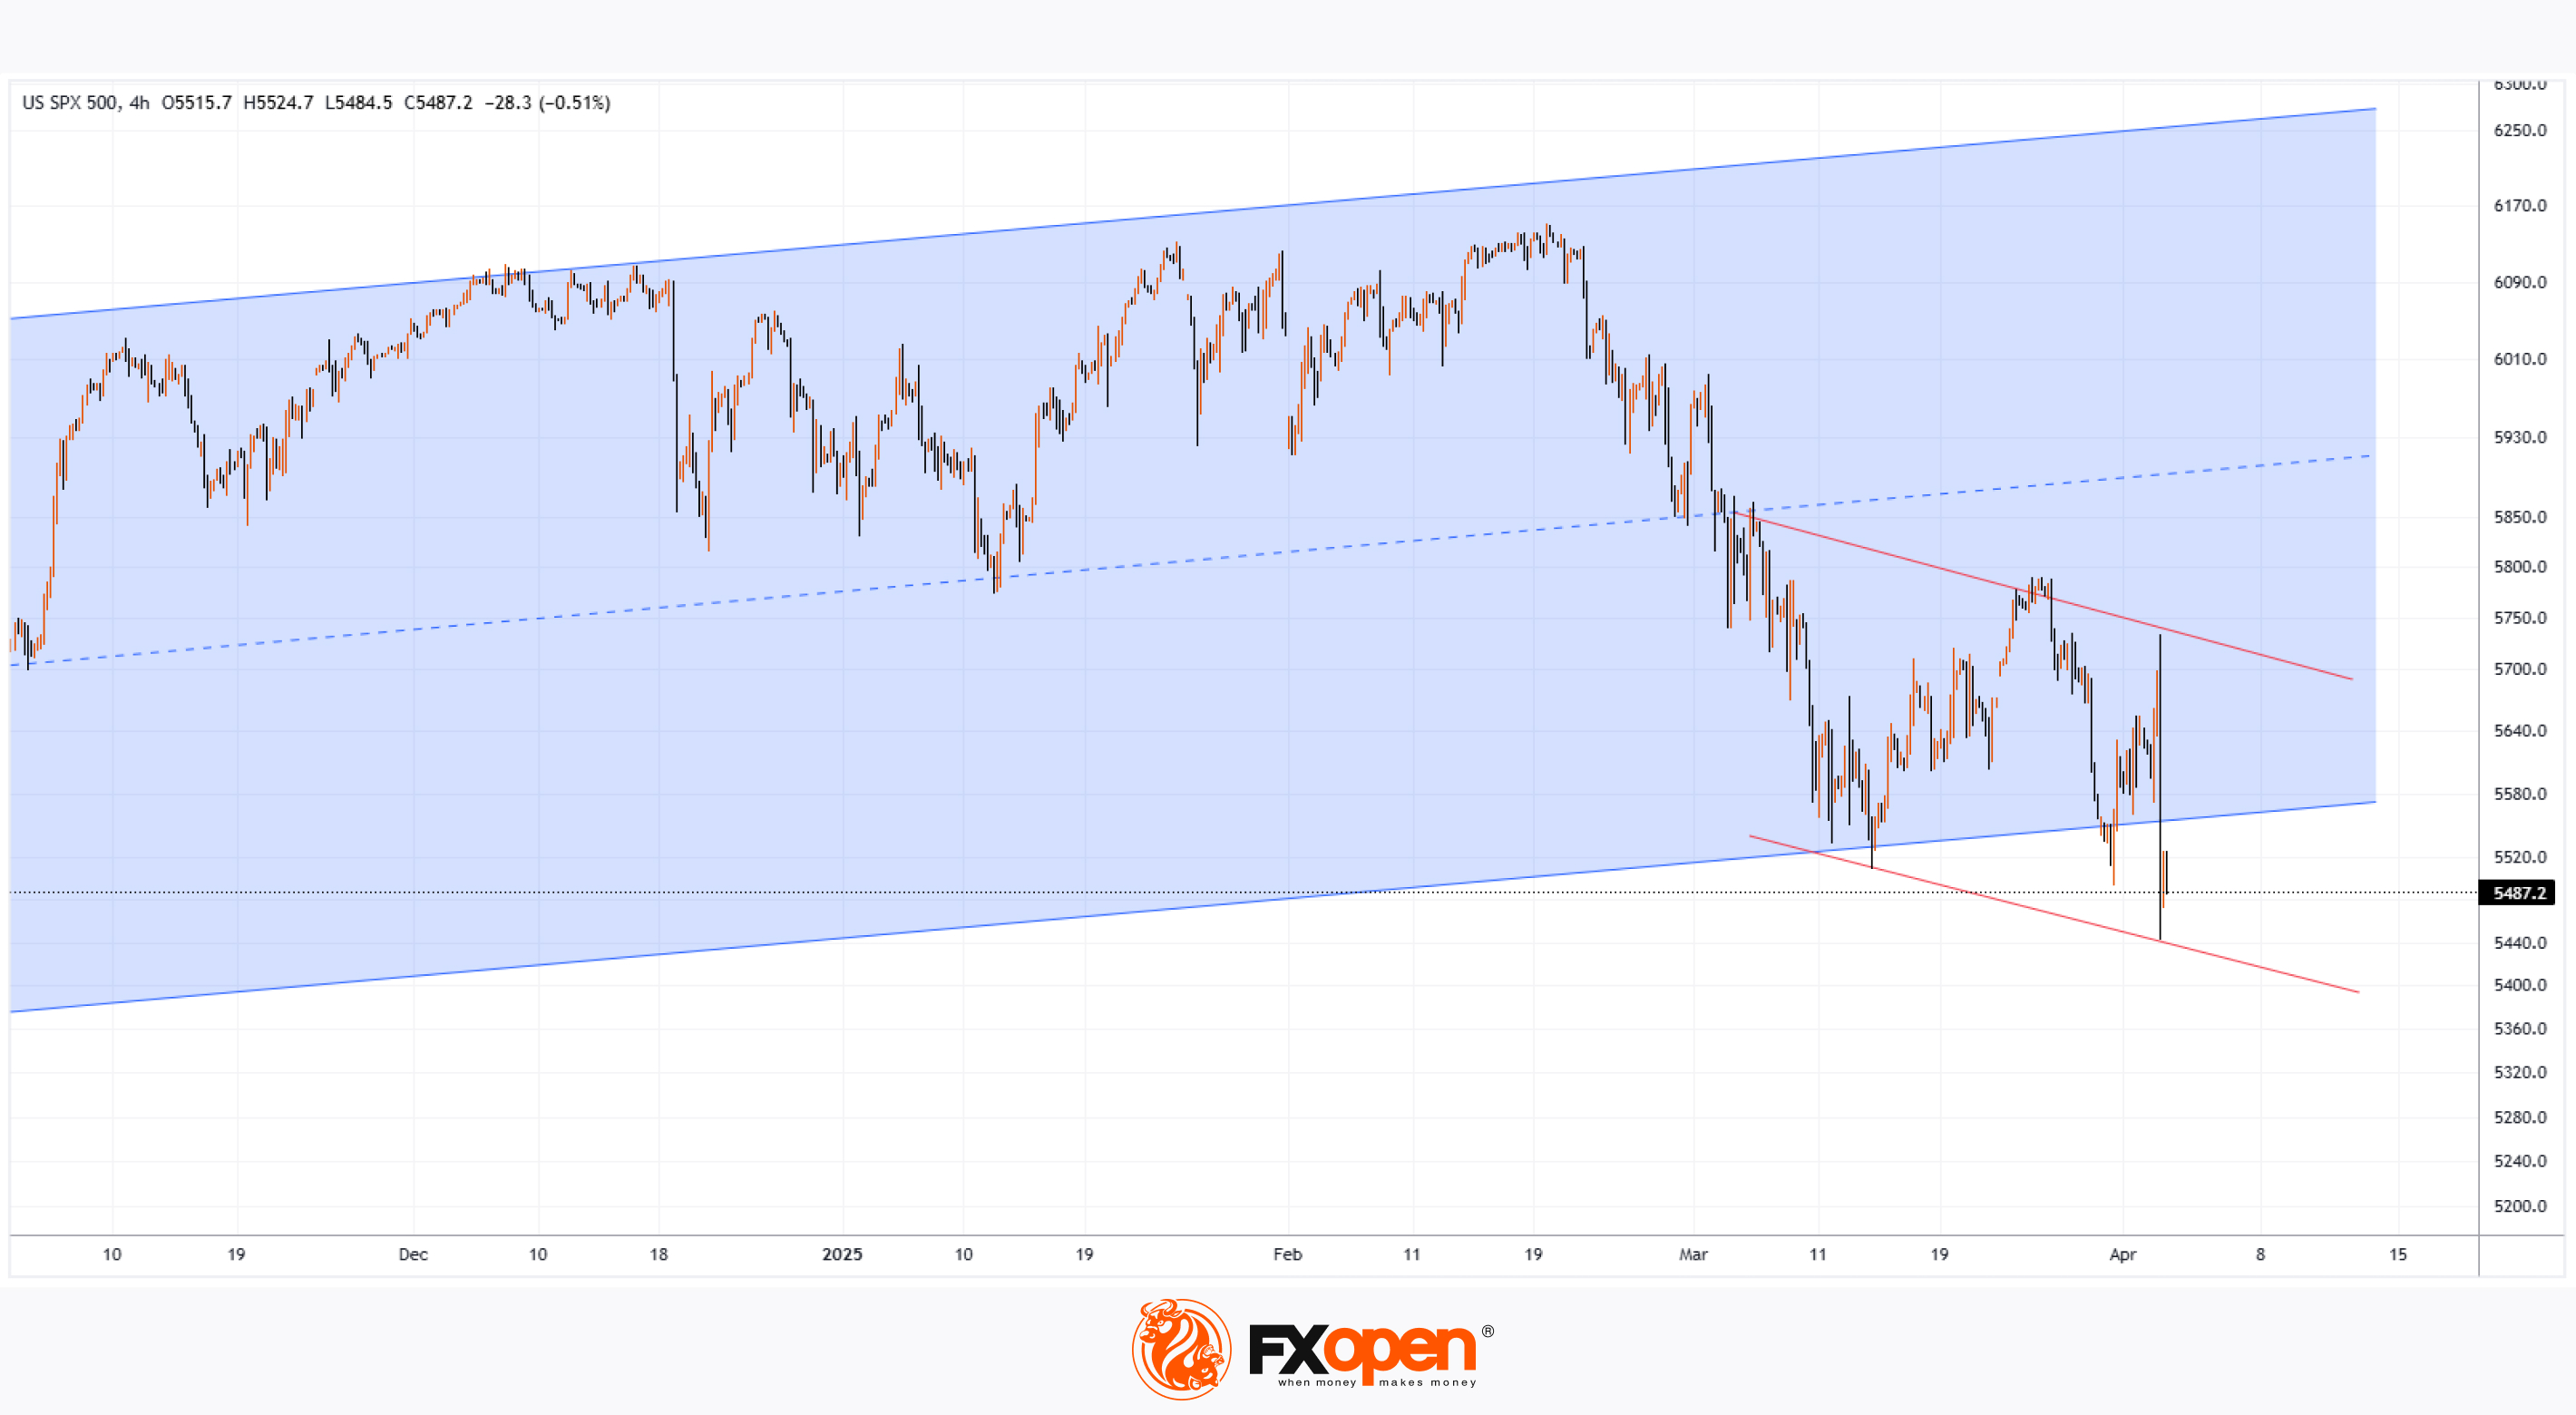
As shown on the S&P 500 Index (US SPX 500 mini on FXOpen) chart, the benchmark US stock index dropped below 5,450 points for the first time in 2025. This decline reflects the US stock market’s reaction to the tariffs imposed by the White House on international trade.
According to Reuters:
→ President Donald Trump announced a 10% tariff on most goods imported into the United States, with Asian countries being hit the hardest.
→ This move escalates the global trade war. "The consequences will be devastating for millions of people worldwide," said European Commission President Ursula von der Leyen, adding that the 27-member EU bloc is preparing to retaliate if negotiations with Washington fail.
Financial Markets’ Reaction to Trump’s Tariffs
→ Stock markets in Beijing and Tokyo fell to multi-month lows.
→ Gold hit a new all-time high, surpassing $3,160.
→ The US dollar weakened against other major currencies.
The S&P 500 Index (US SPX 500 mini on FXOpen) is now trading at levels last seen in September 2024, before Trump's election victory.
Investor sentiment appears to have turned bearish, with growing concerns over the impact of Trump's tariffs, as fears mount that they could slow down the US economy and fuel inflation.
Technical Analysis of the S&P 500 Index (US SPX 500 mini on FXOpen)
The bearish momentum seen yesterday signals a continued correction, which we first identified in our 17 March analysis.
At that time, we mapped out a rising channel (blue) that began in 2024, suggesting that selling pressure might ease near its lower boundary. However, Trump's policy decision has reinforced bearish confidence, and now the price may continue fluctuating within the two downward-sloping red lines. This suggests that the long-term blue growth channel is losing its relevance.
Trade global index CFDs with zero commission and tight spreads. Open your FXOpen account now or learn more about trading index CFDs with FXOpen.
CFDs are complex instruments and come with a high risk of losing your money.
This article represents the opinion of the Companies operating under the FXOpen brand only. It is not to be construed as an offer, solicitation, or recommendation with respect to products and services provided by the Companies operating under the FXOpen brand, nor is it to be considered financial advice.
S&P 500 Index Hits 2025 Low Following Trump's Tariff Announcement
As shown on the S&P 500 Index (US SPX 500 mini on FXOpen) chart, the benchmark US stock index dropped below 5,450 points for the first time in 2025. This decline reflects the US stock market’s reaction to the tariffs imposed by the White House on international trade.
According to Reuters:
→ President Donald Trump announced a 10% tariff on most goods imported into the United States, with Asian countries being hit the hardest.
→ This move escalates the global trade war. "The consequences will be devastating for millions of people worldwide," said European Commission President Ursula von der Leyen, adding that the 27-member EU bloc is preparing to retaliate if negotiations with Washington fail.
Financial Markets’ Reaction to Trump’s Tariffs
→ Stock markets in Beijing and Tokyo fell to multi-month lows.
→ Gold hit a new all-time high, surpassing $3,160.
→ The US dollar weakened against other major currencies.
The S&P 500 Index (US SPX 500 mini on FXOpen) is now trading at levels last seen in September 2024, before Trump's election victory.
Investor sentiment appears to have turned bearish, with growing concerns over the impact of Trump's tariffs, as fears mount that they could slow down the US economy and fuel inflation.
Technical Analysis of the S&P 500 Index (US SPX 500 mini on FXOpen)
The bearish momentum seen yesterday signals a continued correction, which we first identified in our 17 March analysis.
At that time, we mapped out a rising channel (blue) that began in 2024, suggesting that selling pressure might ease near its lower boundary. However, Trump's policy decision has reinforced bearish confidence, and now the price may continue fluctuating within the two downward-sloping red lines. This suggests that the long-term blue growth channel is losing its relevance.
Trade global index CFDs with zero commission and tight spreads. Open your FXOpen account now or learn more about trading index CFDs with FXOpen.
CFDs are complex instruments and come with a high risk of losing your money.
This article represents the opinion of the Companies operating under the FXOpen brand only. It is not to be construed as an offer, solicitation, or recommendation with respect to products and services provided by the Companies operating under the FXOpen brand, nor is it to be considered financial advice.
👍3
#stockmarket #AAPL #MarketNews #MarketUpdates
Apple (AAPL) Shares Plummet Over 9% Following Trump's Tariff Announcement
Many stock indices declined after the US President announced the introduction of tariffs for multiple countries, as we reported yesterday morning. During yesterday’s trading session, the sell-off in equities intensified.
According to media reports, market participants had hoped that the tariff threats were mere rhetoric and a negotiation tactic. However, many were shocked by both the number of countries affected and the scale of the imposed tariffs. Several well-known technology companies led the market downturn.
How Do Trump's Tariffs Impact Big Tech Companies?
Significant tariffs were imposed on Chinese imports, yet Apple manufactures around 90% of its iPhones in China. Many affordable products sold on Amazon are also set to become more expensive, as they are sourced from China.
Meta Platforms' advertising business could suffer considerable losses as companies worldwide cut advertising budgets. Nvidia and Broadcom may also struggle, given that the tariffs apply to many electronic devices incorporating their chips.
As a result, shares of Apple (AAPL), Amazon (AMZN), Meta Platforms (META), Broadcom (AVGO), and Nvidia (NVDA) fell by approximately 9% by the close of trading yesterday.
Microsoft (MSFT) shares, however, proved more resilient, dropping just 2.3%, as software products are not easily subject to tariffs. Moreover, software developers do not rely on international supply chains.
Technical Analysis of AAPL Chart
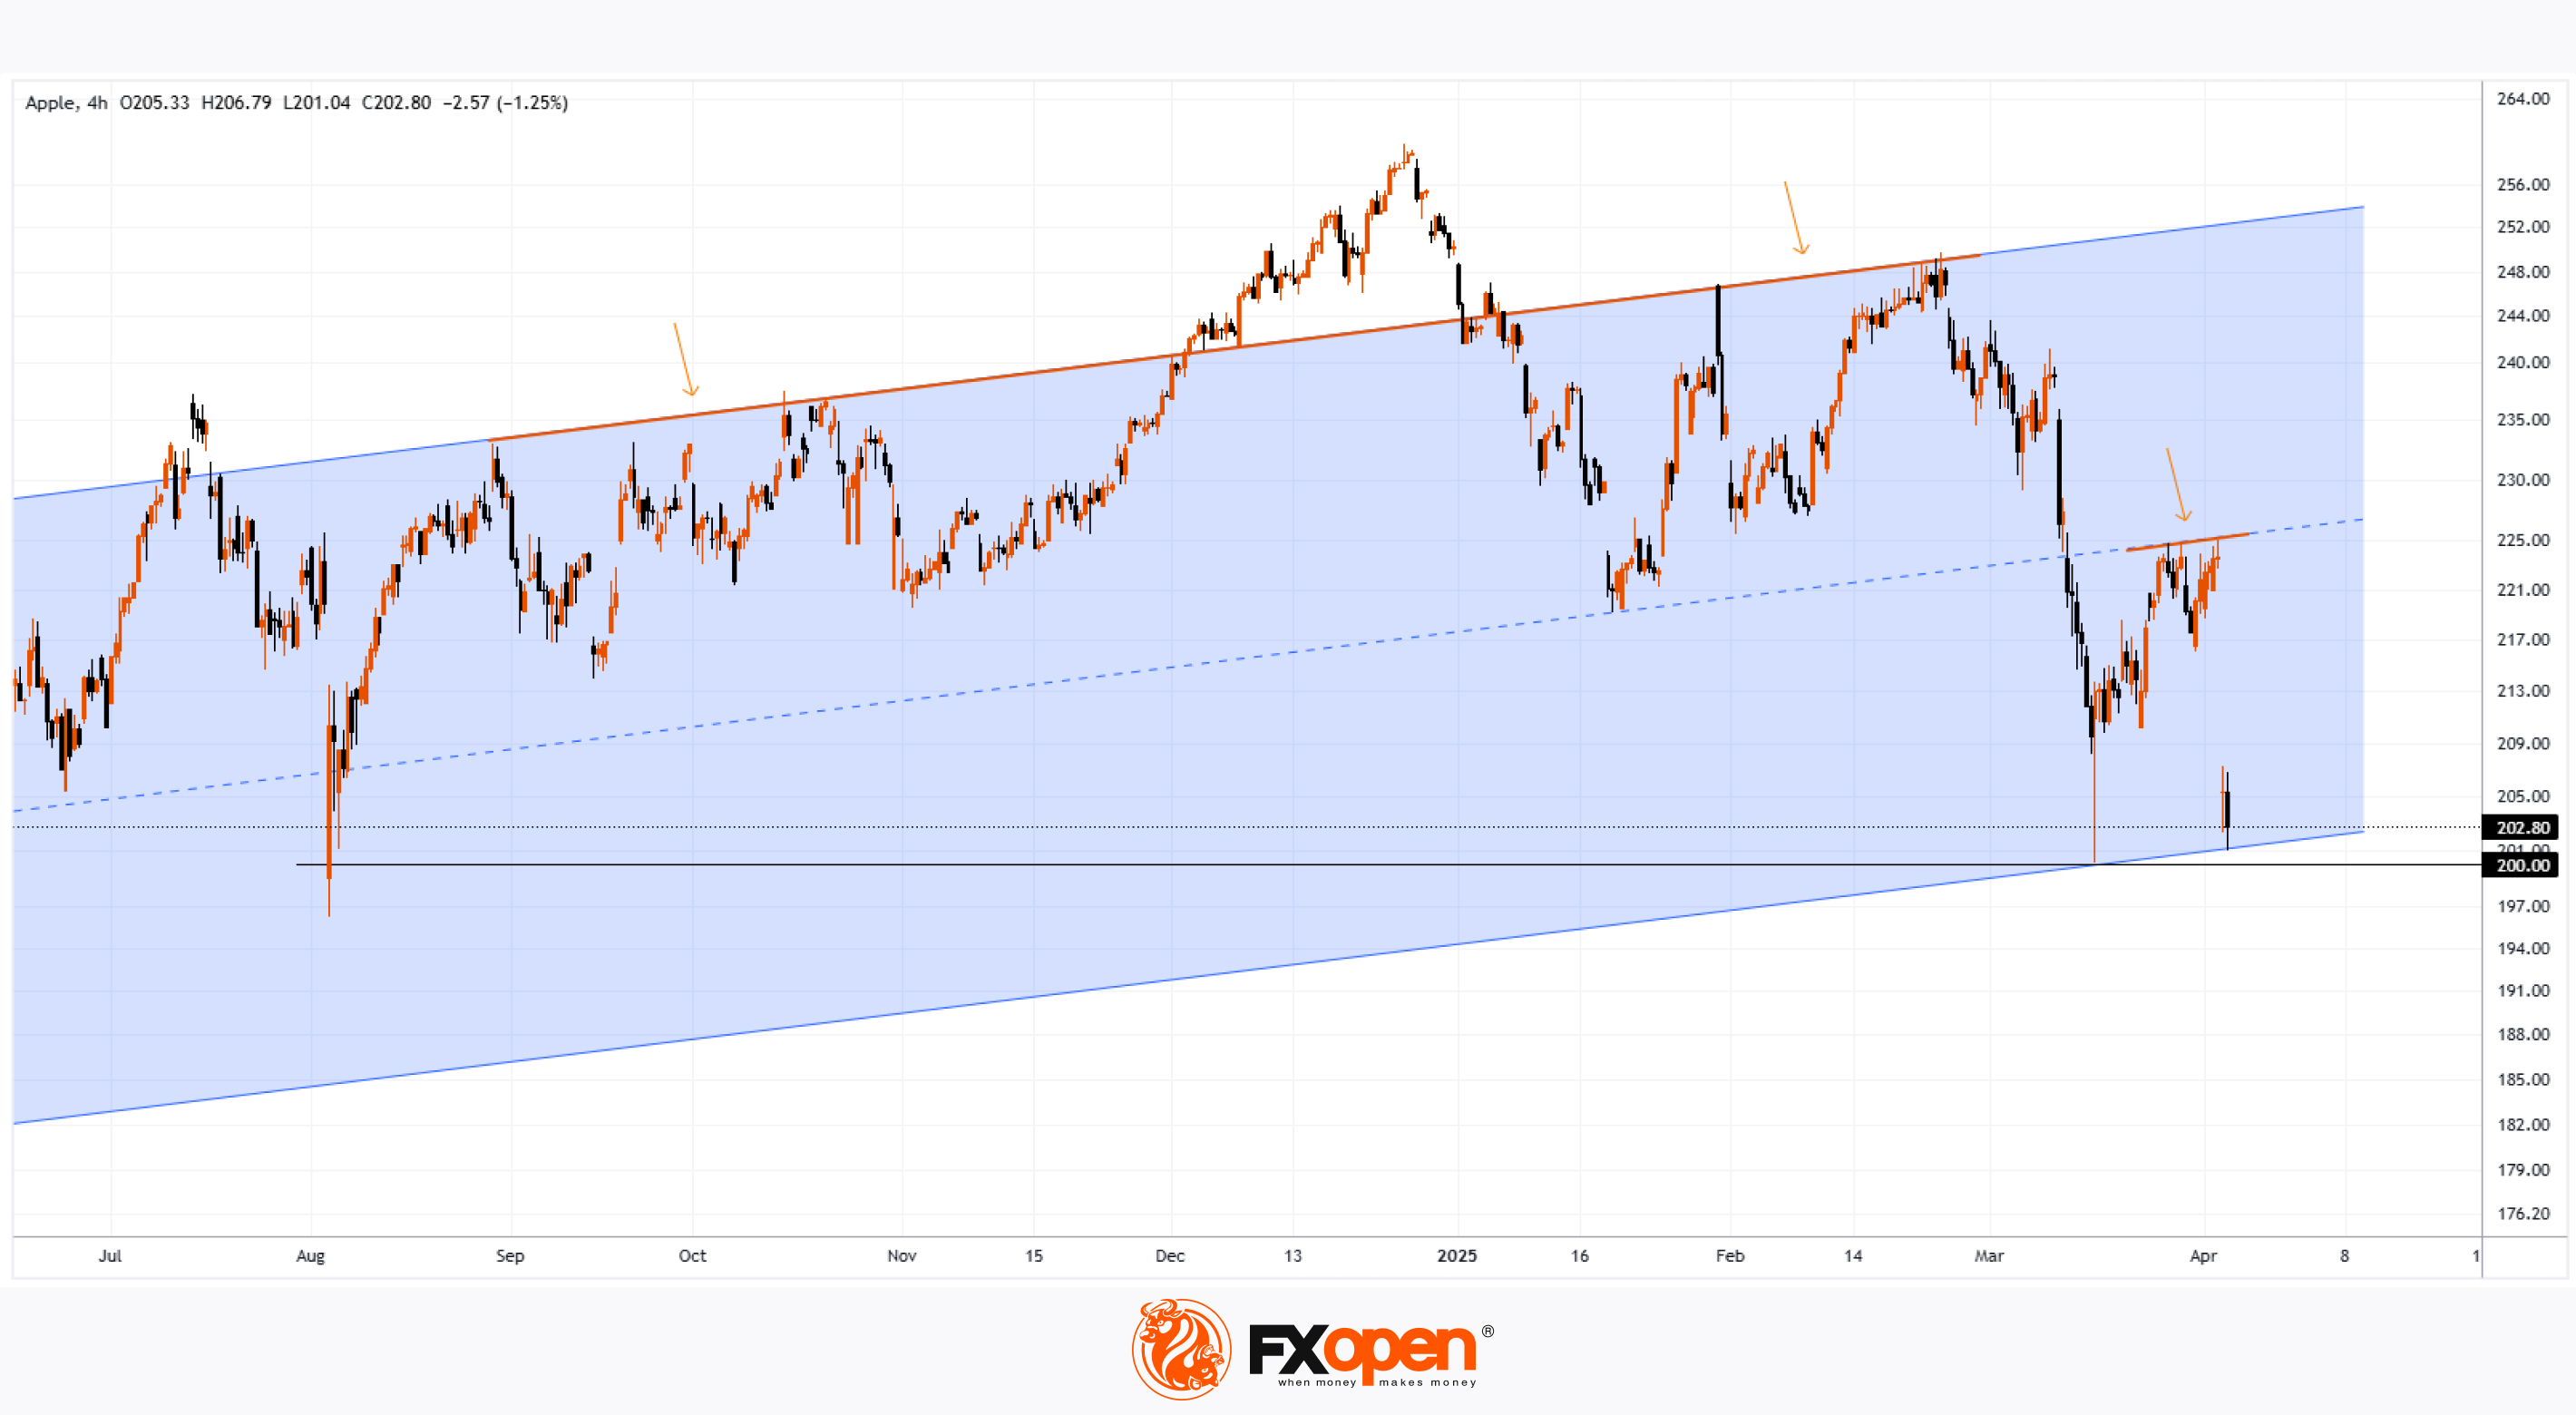
Apple’s stock price fluctuations have formed a trend channel (shown in blue), with:
→ The upper boundary acting as resistance since last autumn, although bulls managed to push the price above it during the Christmas rally. We previously highlighted Apple’s overbought condition and the possibility of a correction on 27 December 2024.
→ New data indicates that resistance has now shifted to the median at around $225.
This puts the lower boundary of the trend channel at risk of a bearish breakout. In the coming days, AAPL’s chart may see a bearish assault on the psychological $200 level, which proved significant in August 2024.
Trade global index CFDs with zero commission and tight spreads. Open your FXOpen account now or learn more about trading index CFDs with FXOpen.
CFDs are complex instruments and come with a high risk of losing your money.
This article represents the opinion of the Companies operating under the FXOpen brand only. It is not to be construed as an offer, solicitation, or recommendation with respect to products and services provided by the Companies operating under the FXOpen brand, nor is it to be considered financial advice.
Apple (AAPL) Shares Plummet Over 9% Following Trump's Tariff Announcement
Many stock indices declined after the US President announced the introduction of tariffs for multiple countries, as we reported yesterday morning. During yesterday’s trading session, the sell-off in equities intensified.
According to media reports, market participants had hoped that the tariff threats were mere rhetoric and a negotiation tactic. However, many were shocked by both the number of countries affected and the scale of the imposed tariffs. Several well-known technology companies led the market downturn.
How Do Trump's Tariffs Impact Big Tech Companies?
Significant tariffs were imposed on Chinese imports, yet Apple manufactures around 90% of its iPhones in China. Many affordable products sold on Amazon are also set to become more expensive, as they are sourced from China.
Meta Platforms' advertising business could suffer considerable losses as companies worldwide cut advertising budgets. Nvidia and Broadcom may also struggle, given that the tariffs apply to many electronic devices incorporating their chips.
As a result, shares of Apple (AAPL), Amazon (AMZN), Meta Platforms (META), Broadcom (AVGO), and Nvidia (NVDA) fell by approximately 9% by the close of trading yesterday.
Microsoft (MSFT) shares, however, proved more resilient, dropping just 2.3%, as software products are not easily subject to tariffs. Moreover, software developers do not rely on international supply chains.
Technical Analysis of AAPL Chart
Apple’s stock price fluctuations have formed a trend channel (shown in blue), with:
→ The upper boundary acting as resistance since last autumn, although bulls managed to push the price above it during the Christmas rally. We previously highlighted Apple’s overbought condition and the possibility of a correction on 27 December 2024.
→ New data indicates that resistance has now shifted to the median at around $225.
This puts the lower boundary of the trend channel at risk of a bearish breakout. In the coming days, AAPL’s chart may see a bearish assault on the psychological $200 level, which proved significant in August 2024.
Trade global index CFDs with zero commission and tight spreads. Open your FXOpen account now or learn more about trading index CFDs with FXOpen.
CFDs are complex instruments and come with a high risk of losing your money.
This article represents the opinion of the Companies operating under the FXOpen brand only. It is not to be construed as an offer, solicitation, or recommendation with respect to products and services provided by the Companies operating under the FXOpen brand, nor is it to be considered financial advice.
👍4
#stockmarket #stocktrading #NASDAQ #MarketUpdates
Nasdaq 100 drops to its lowest level since January 2024
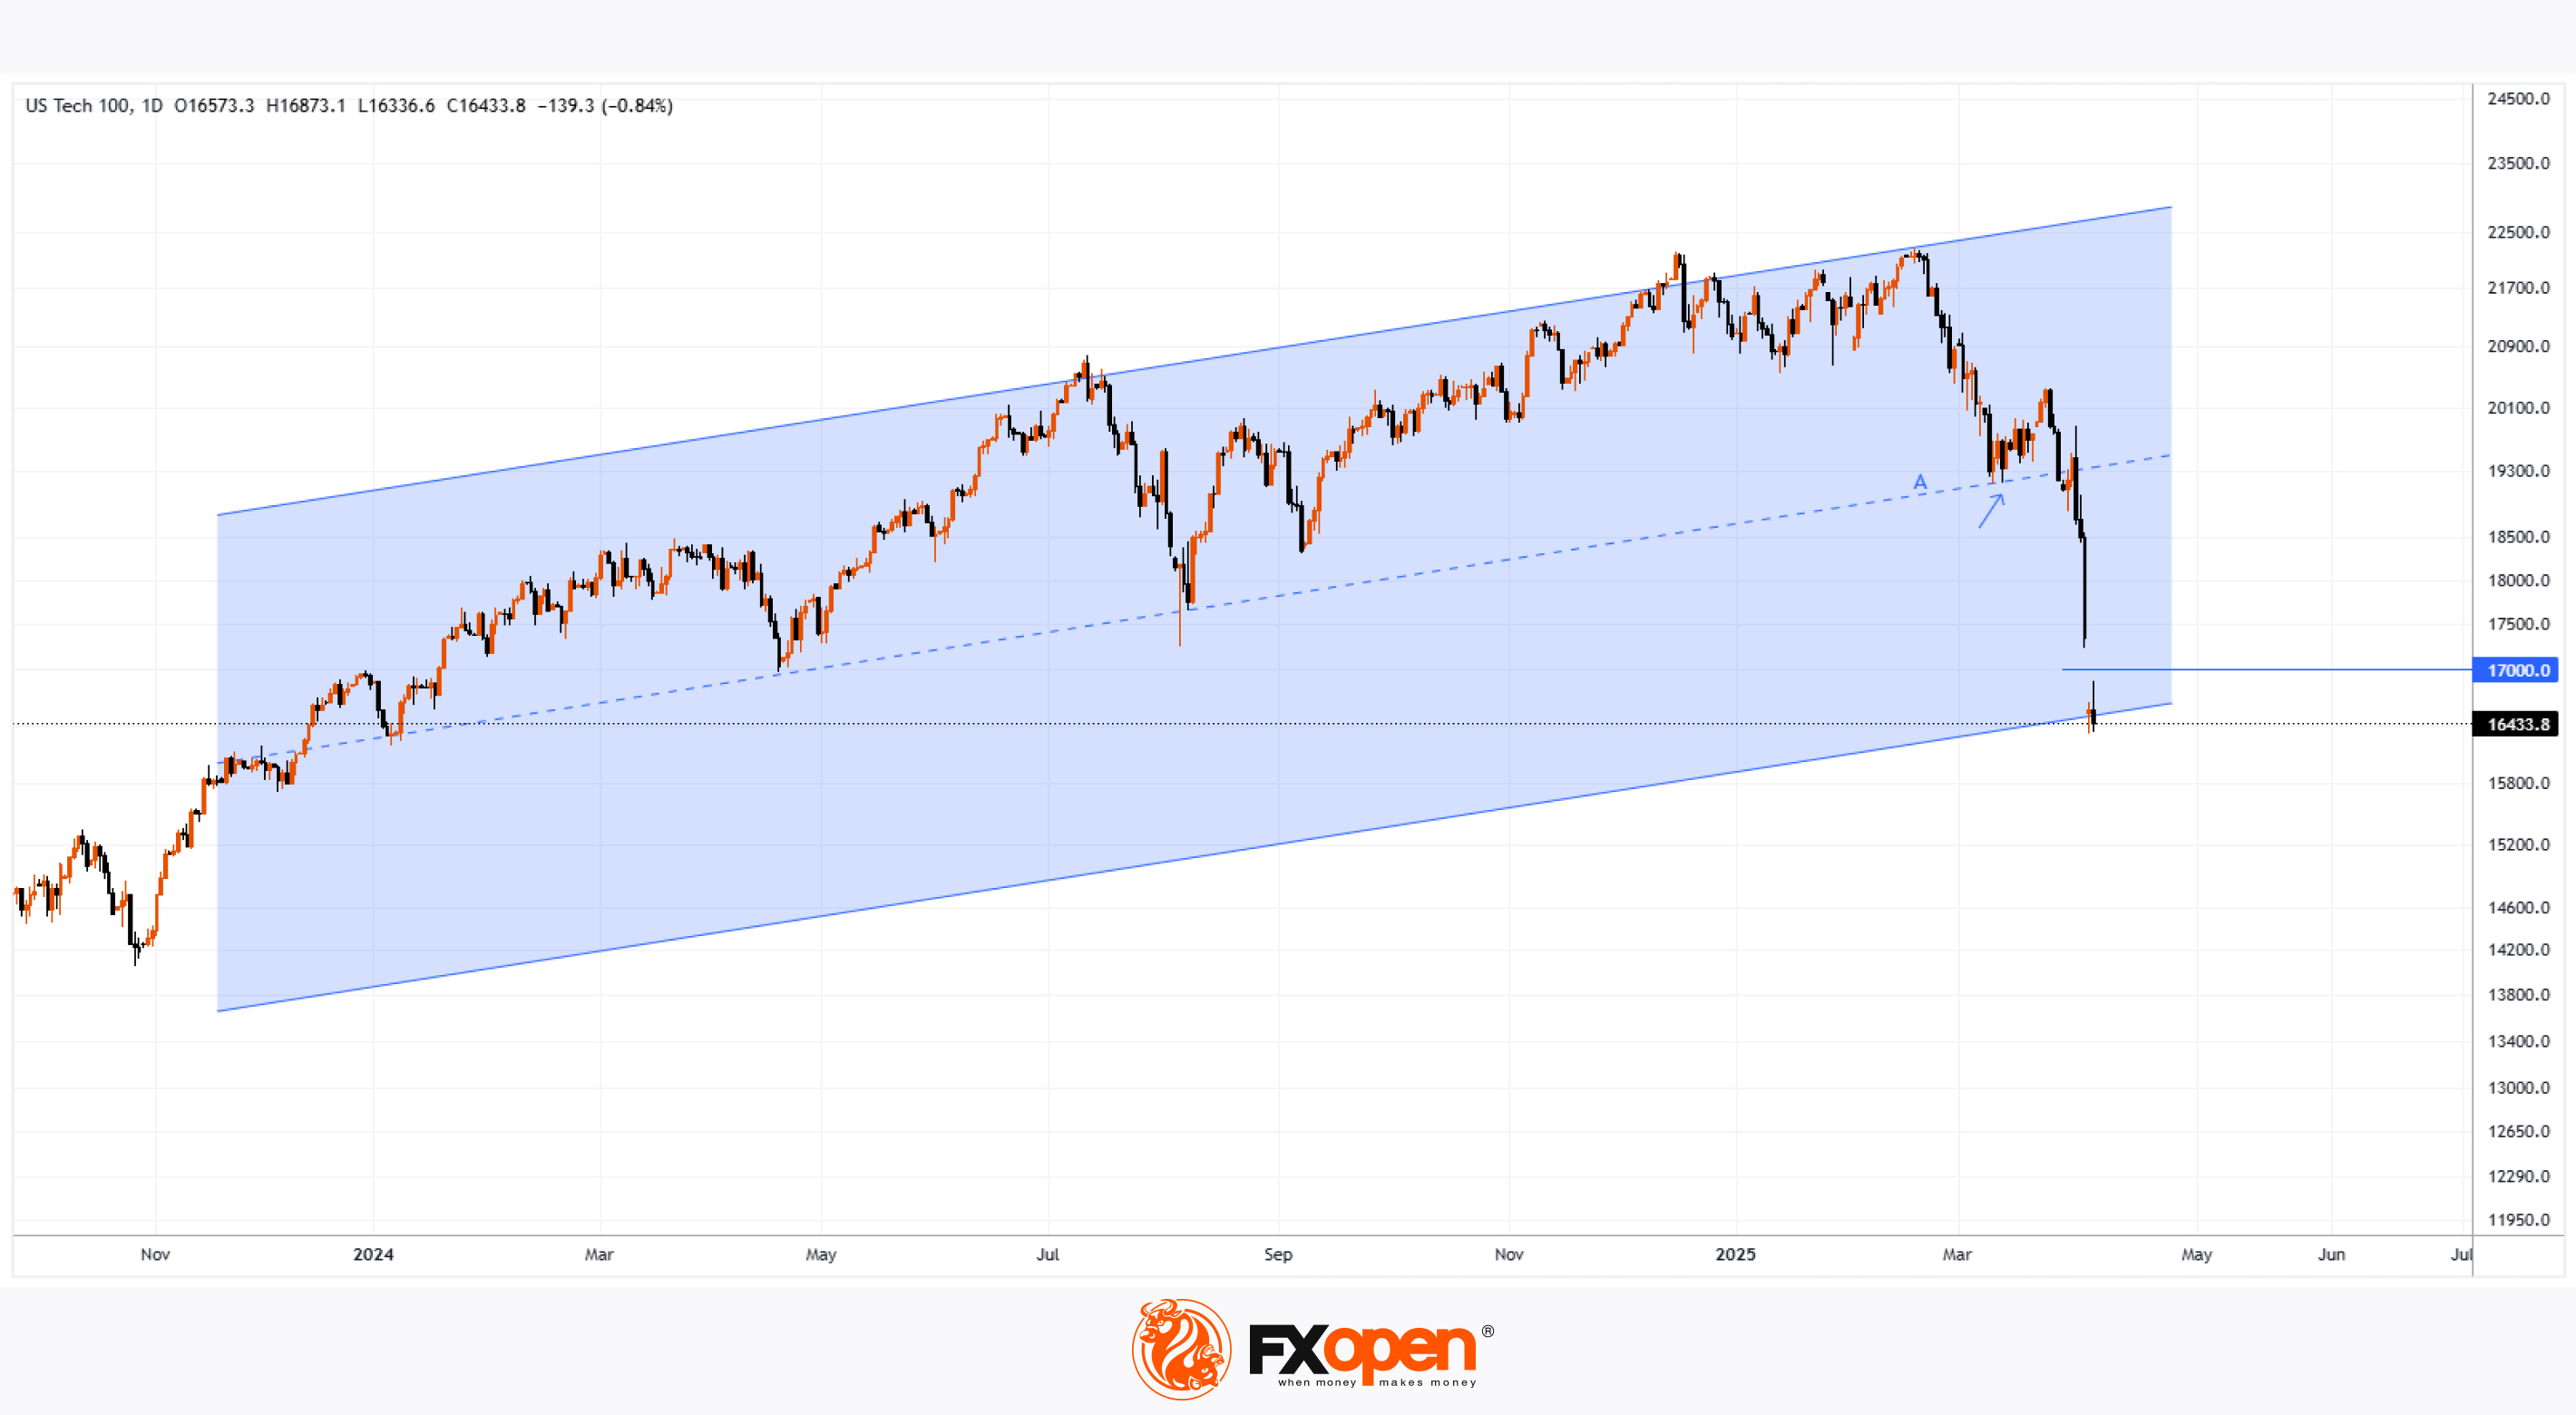
According to the chart of the Nasdaq 100 (US Tech 100 mini on FXOpen), the index opened this week around the 16,500 mark – a price level last seen in early 2024.
This suggests that the sharp sell-off in equities seen last Thursday and Friday may well continue today.
Stock indices respond to Trump’s tariffs
Treasury Secretary Scott Bessent said on NBC News’ Meet the Press that there is “no reason” to expect a recession.
However, equity charts reflect market sentiment described by CNN Business’s Fear & Greed Index as “extreme fear”. This wave of negativity followed President Trump’s announcement on 2 April of harsher-than-expected international trade tariffs. In response, China and other nations announced retaliatory measures.
As a result, the Nasdaq 100 (US Tech 100 mini on FXOpen) now trades roughly 25% below its 2025 peak – officially entering bear market territory.
Technical analysis of the Nasdaq 100 (US Tech 100 mini on FXOpen)
Back on 28 February, we drew an ascending trendline (line A). Bulls attempted a rebound from this support (as shown by the arrow), but their efforts were overwhelmed by the White House’s latest policy decisions.
Given the updated price action, we can now treat line A as the median of an ascending channel. From this perspective, the index is currently near the lower boundary of the channel.
Technically, this could indicate potential support. However, as long as the price remains below the bearish gap – which includes the key psychological level of 17,000 – talk of a meaningful recovery may be premature.
Trade global index CFDs with zero commission and tight spreads. Open your FXOpen account now or learn more about trading index CFDs with FXOpen.
CFDs are complex instruments and come with a high risk of losing your money.
This article represents the opinion of the Companies operating under the FXOpen brand only. It is not to be construed as an offer, solicitation, or recommendation with respect to products and services provided by the Companies operating under the FXOpen brand, nor is it to be considered financial advice.
Nasdaq 100 drops to its lowest level since January 2024
According to the chart of the Nasdaq 100 (US Tech 100 mini on FXOpen), the index opened this week around the 16,500 mark – a price level last seen in early 2024.
This suggests that the sharp sell-off in equities seen last Thursday and Friday may well continue today.
Stock indices respond to Trump’s tariffs
Treasury Secretary Scott Bessent said on NBC News’ Meet the Press that there is “no reason” to expect a recession.
However, equity charts reflect market sentiment described by CNN Business’s Fear & Greed Index as “extreme fear”. This wave of negativity followed President Trump’s announcement on 2 April of harsher-than-expected international trade tariffs. In response, China and other nations announced retaliatory measures.
As a result, the Nasdaq 100 (US Tech 100 mini on FXOpen) now trades roughly 25% below its 2025 peak – officially entering bear market territory.
Technical analysis of the Nasdaq 100 (US Tech 100 mini on FXOpen)
Back on 28 February, we drew an ascending trendline (line A). Bulls attempted a rebound from this support (as shown by the arrow), but their efforts were overwhelmed by the White House’s latest policy decisions.
Given the updated price action, we can now treat line A as the median of an ascending channel. From this perspective, the index is currently near the lower boundary of the channel.
Technically, this could indicate potential support. However, as long as the price remains below the bearish gap – which includes the key psychological level of 17,000 – talk of a meaningful recovery may be premature.
Trade global index CFDs with zero commission and tight spreads. Open your FXOpen account now or learn more about trading index CFDs with FXOpen.
CFDs are complex instruments and come with a high risk of losing your money.
This article represents the opinion of the Companies operating under the FXOpen brand only. It is not to be construed as an offer, solicitation, or recommendation with respect to products and services provided by the Companies operating under the FXOpen brand, nor is it to be considered financial advice.
👍2
#forextrading #forextrading #NZDUSD #tradingtips #marketanalysis
NZD/USD Analysis: Exchange Rate Nears 2025 Low
Less than a month ago, we analysed the NZD/USD chart and:
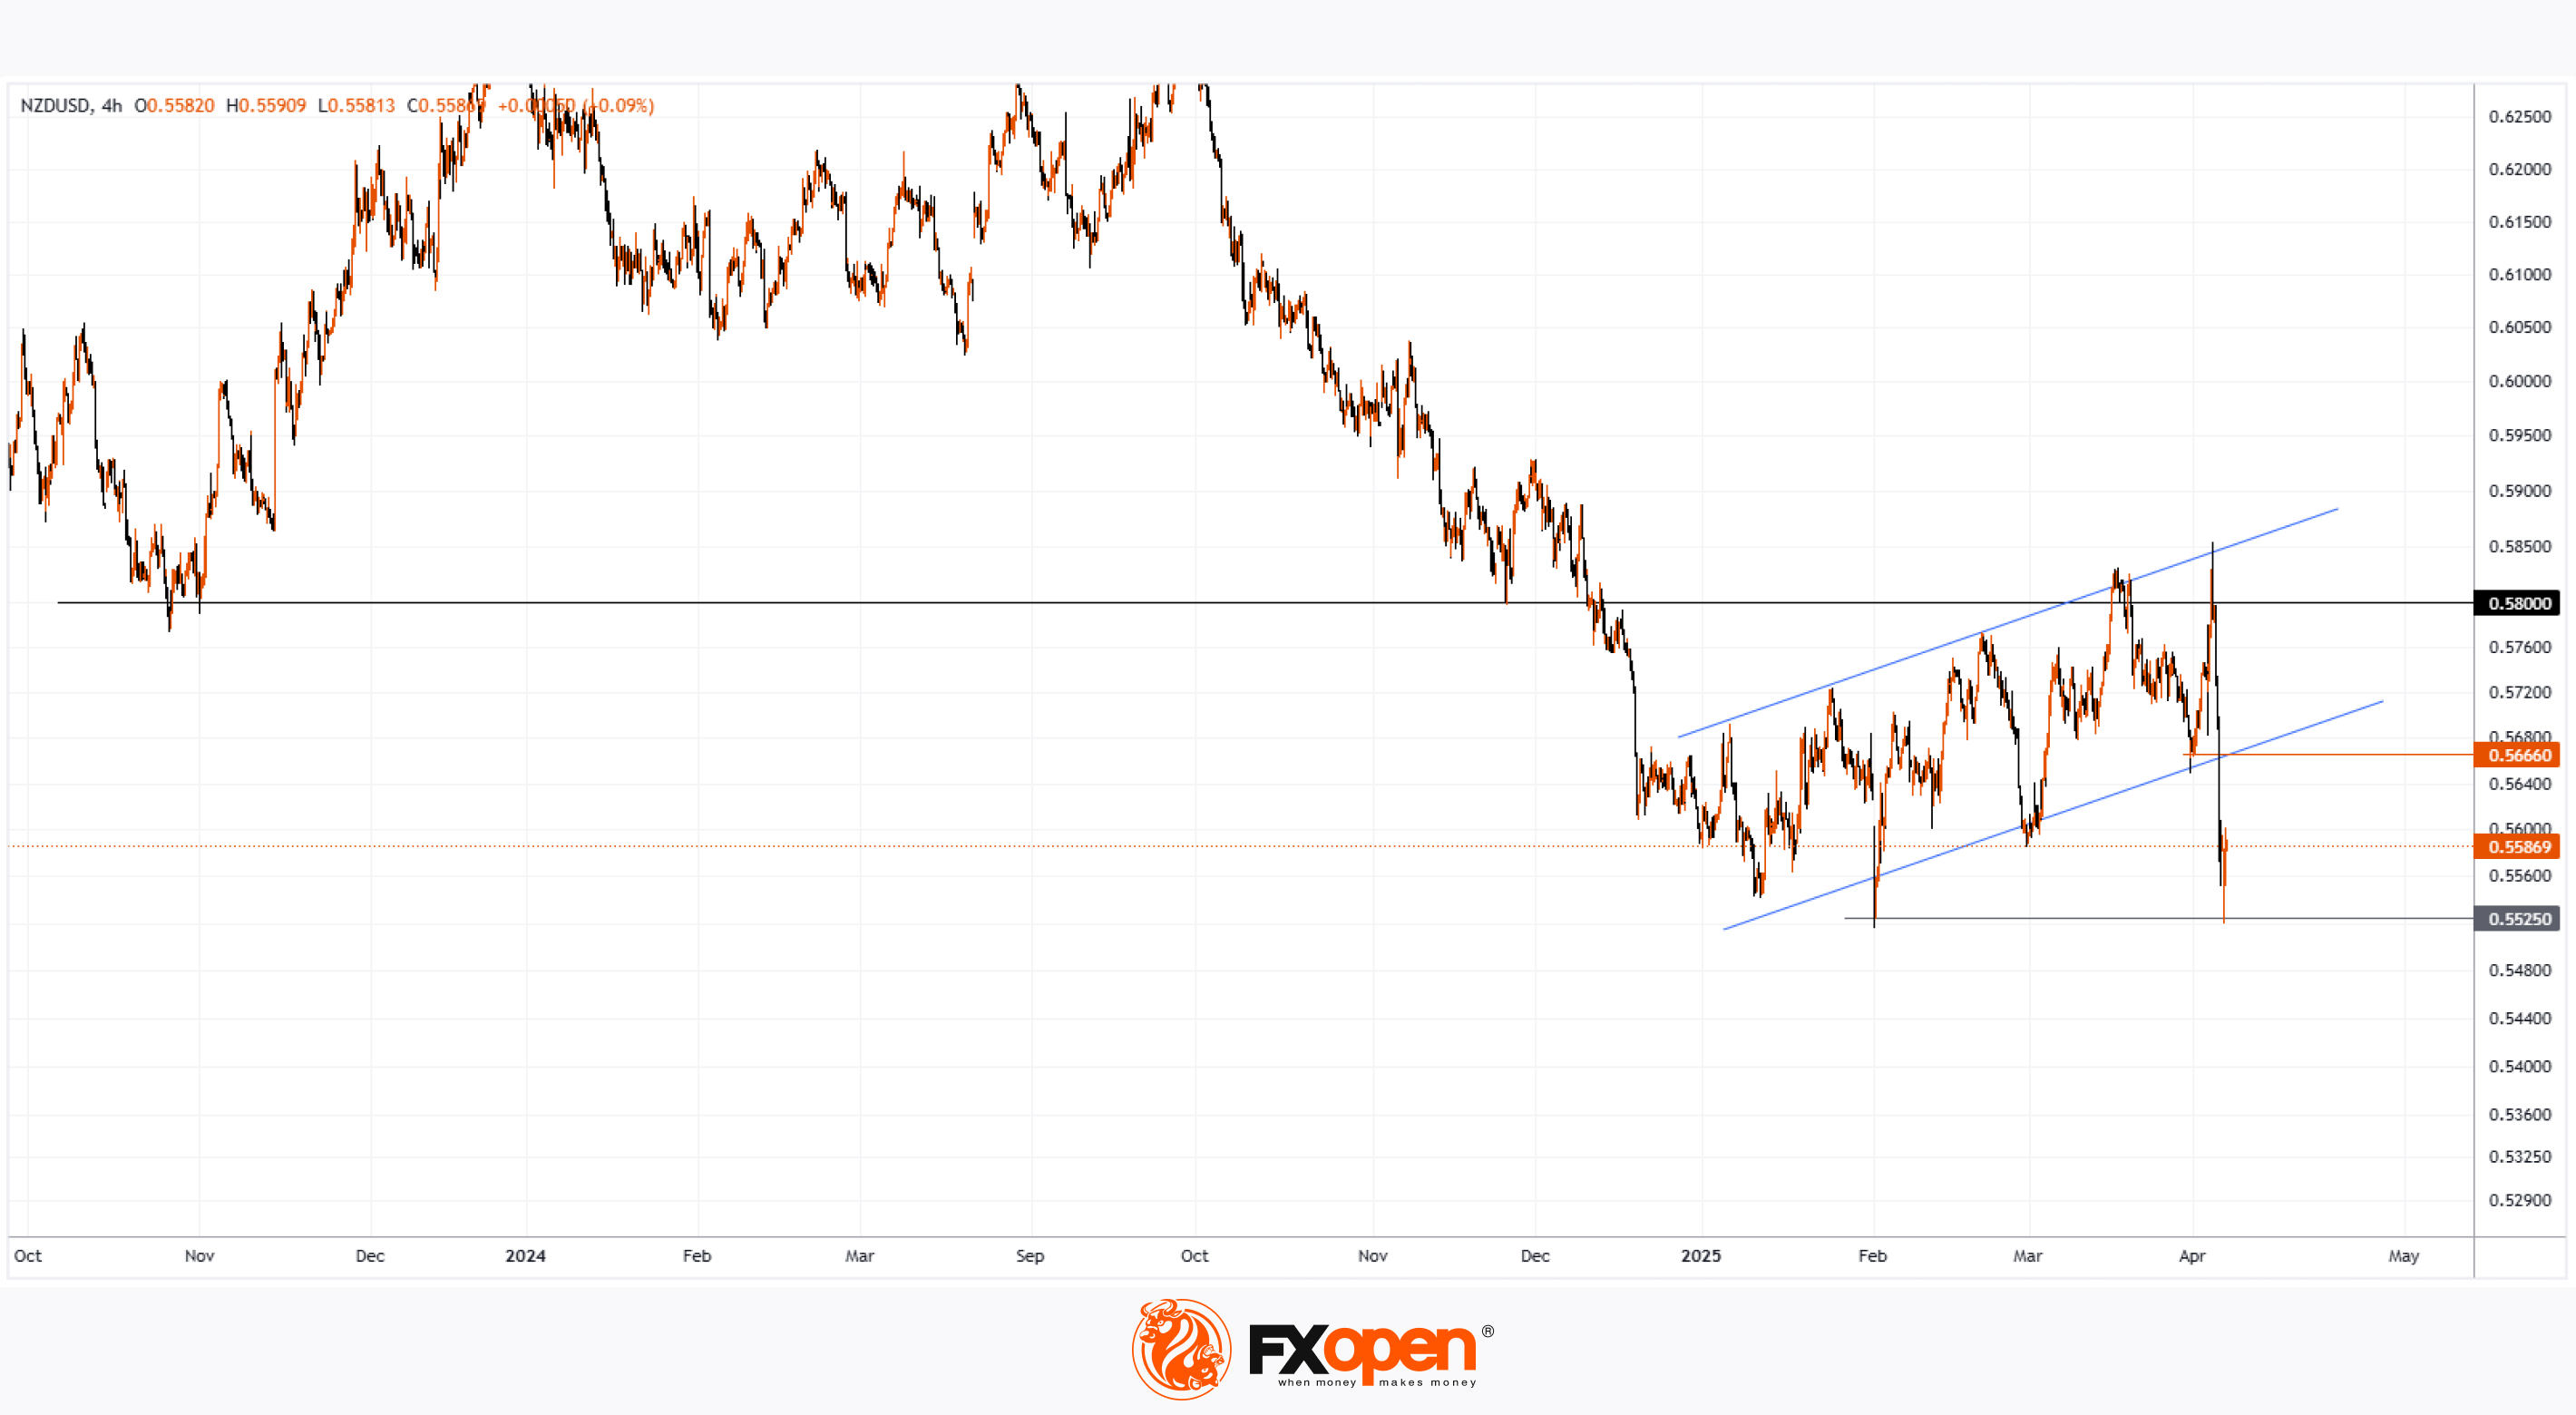
→ highlighted the key resistance level at 0.5800;
→ outlined a potential scenario involving a decline from that zone.
Now, the NZD/USD pair is trading close to its lowest level of 2025, recorded on 3 February near 0.5525. The latest surge in volatility appears to be driven by President Trump’s widely discussed decision to impose substantial tariffs on trade with multiple countries.
For context, the Australian dollar has fallen to a five-year low amid concerns that retaliatory trade measures could trigger a global recession. The New Zealand dollar, however, has remained somewhat more stable — possibly because traders are anticipating Wednesday’s Reserve Bank of New Zealand (RBNZ) meeting, where the central bank may signal efforts to stabilise the currency. According to Forex Factory, a rate cut from 3.75% to 3.50% is expected.
Technical analysis of NZD/USD chart
Price movements in 2025 have formed an ascending channel (marked in blue), but bears broke through the lower boundary late last week near the 0.5666 level.
This suggests that even if NZD/USD sees a short-term rebound, it may face resistance around that same level — a classic “break-and-retest” pattern often watched by traders.
Trade over 50 forex markets 24 hours a day with FXOpen. Take advantage of low commissions, deep liquidity, and spreads from 0.0 pips. Open your FXOpen account now or learn more about trading forex with FXOpen.
CFDs are complex instruments and come with a high risk of losing your money.
This article represents the opinion of the Companies operating under the FXOpen brand only. It is not to be construed as an offer, solicitation, or recommendation with respect to products and services provided by the Companies operating under the FXOpen brand, nor is it to be considered financial advice.
NZD/USD Analysis: Exchange Rate Nears 2025 Low
Less than a month ago, we analysed the NZD/USD chart and:
→ highlighted the key resistance level at 0.5800;
→ outlined a potential scenario involving a decline from that zone.
Now, the NZD/USD pair is trading close to its lowest level of 2025, recorded on 3 February near 0.5525. The latest surge in volatility appears to be driven by President Trump’s widely discussed decision to impose substantial tariffs on trade with multiple countries.
For context, the Australian dollar has fallen to a five-year low amid concerns that retaliatory trade measures could trigger a global recession. The New Zealand dollar, however, has remained somewhat more stable — possibly because traders are anticipating Wednesday’s Reserve Bank of New Zealand (RBNZ) meeting, where the central bank may signal efforts to stabilise the currency. According to Forex Factory, a rate cut from 3.75% to 3.50% is expected.
Technical analysis of NZD/USD chart
Price movements in 2025 have formed an ascending channel (marked in blue), but bears broke through the lower boundary late last week near the 0.5666 level.
This suggests that even if NZD/USD sees a short-term rebound, it may face resistance around that same level — a classic “break-and-retest” pattern often watched by traders.
Trade over 50 forex markets 24 hours a day with FXOpen. Take advantage of low commissions, deep liquidity, and spreads from 0.0 pips. Open your FXOpen account now or learn more about trading forex with FXOpen.
CFDs are complex instruments and come with a high risk of losing your money.
This article represents the opinion of the Companies operating under the FXOpen brand only. It is not to be construed as an offer, solicitation, or recommendation with respect to products and services provided by the Companies operating under the FXOpen brand, nor is it to be considered financial advice.
👍3
#FederalReserve #FOMC #InterestRates #USInflation #MarketVolatility #EconomicOutlook #EarningsSeason #StockMarketNews #Macroeconomics #FinanceNews
Market Insights with Gary Thomson: FOMC Minutes, US Inflation Rate, US PPI, Earnings Reports
In this video, we’ll explore the key economic events, market trends, and corporate news shaping the financial landscape. Get ready for expert insights into forex, commodities, and stocks to help you navigate the week ahead. Let’s dive in!
In this episode, we discuss:
🔸 FOMC Meeting Minutes
The FOMC meeting minutes on Wednesday will offer insight into the Fed’s outlook on the US economy and interest rates. With Trump’s tariffs already shaking markets, will the US dollar face more volatility?
🔸 US Inflation Rate
Thursday’s US inflation report could fuel market volatility, especially amid Trump’s tariff concerns. Will inflation remain stubbornly high, or are we in for a surprise?
🔸 US Producer Price Index
Friday’s US PPI release could impact market sentiment. Will wholesale inflation pressures ease further, or is another surprise ahead?
🔸 Corporate Earnings Statements
Big names like JPMorgan Chase & Co, Wells Fargo & Company, and BlackRock, Inc. are releasing their Q1 2025 results. Check other names that can bring volatility to the market.
Don’t miss out—gain insights to stay ahead in your trading journey.
https://cutt.ly/JrdqTg2K
To take advantage of price fluctuations in the foreign exchange markets, consider enlisting the services of a reliable broker like FXOpen.
⚠️
This forecast represents FXOpen Companies opinion only, it should not be construed as an offer, invitation or recommendation in respect to FXOpen Companies products and services or as financial advice.
Market Insights with Gary Thomson: FOMC Minutes, US Inflation Rate, US PPI, Earnings Reports
In this video, we’ll explore the key economic events, market trends, and corporate news shaping the financial landscape. Get ready for expert insights into forex, commodities, and stocks to help you navigate the week ahead. Let’s dive in!
In this episode, we discuss:
🔸 FOMC Meeting Minutes
The FOMC meeting minutes on Wednesday will offer insight into the Fed’s outlook on the US economy and interest rates. With Trump’s tariffs already shaking markets, will the US dollar face more volatility?
🔸 US Inflation Rate
Thursday’s US inflation report could fuel market volatility, especially amid Trump’s tariff concerns. Will inflation remain stubbornly high, or are we in for a surprise?
🔸 US Producer Price Index
Friday’s US PPI release could impact market sentiment. Will wholesale inflation pressures ease further, or is another surprise ahead?
🔸 Corporate Earnings Statements
Big names like JPMorgan Chase & Co, Wells Fargo & Company, and BlackRock, Inc. are releasing their Q1 2025 results. Check other names that can bring volatility to the market.
Don’t miss out—gain insights to stay ahead in your trading journey.
https://cutt.ly/JrdqTg2K
To take advantage of price fluctuations in the foreign exchange markets, consider enlisting the services of a reliable broker like FXOpen.
⚠️
This forecast represents FXOpen Companies opinion only, it should not be construed as an offer, invitation or recommendation in respect to FXOpen Companies products and services or as financial advice.
YouTube
Market Insights with Gary Thomson: FOMC Minutes, US Inflation Rate, US PPI, Earnings Reports
In this video, we’ll explore the key economic events, market trends, and corporate news shaping the financial landscape. Get ready for expert insights into forex, commodities, and stocks to help you navigate the week ahead. Let’s dive in!
In this episode…
In this episode…
👍1
#stockmarket #stocktrading #marketanalysis
Hang Seng Index Plunges by Around 13%
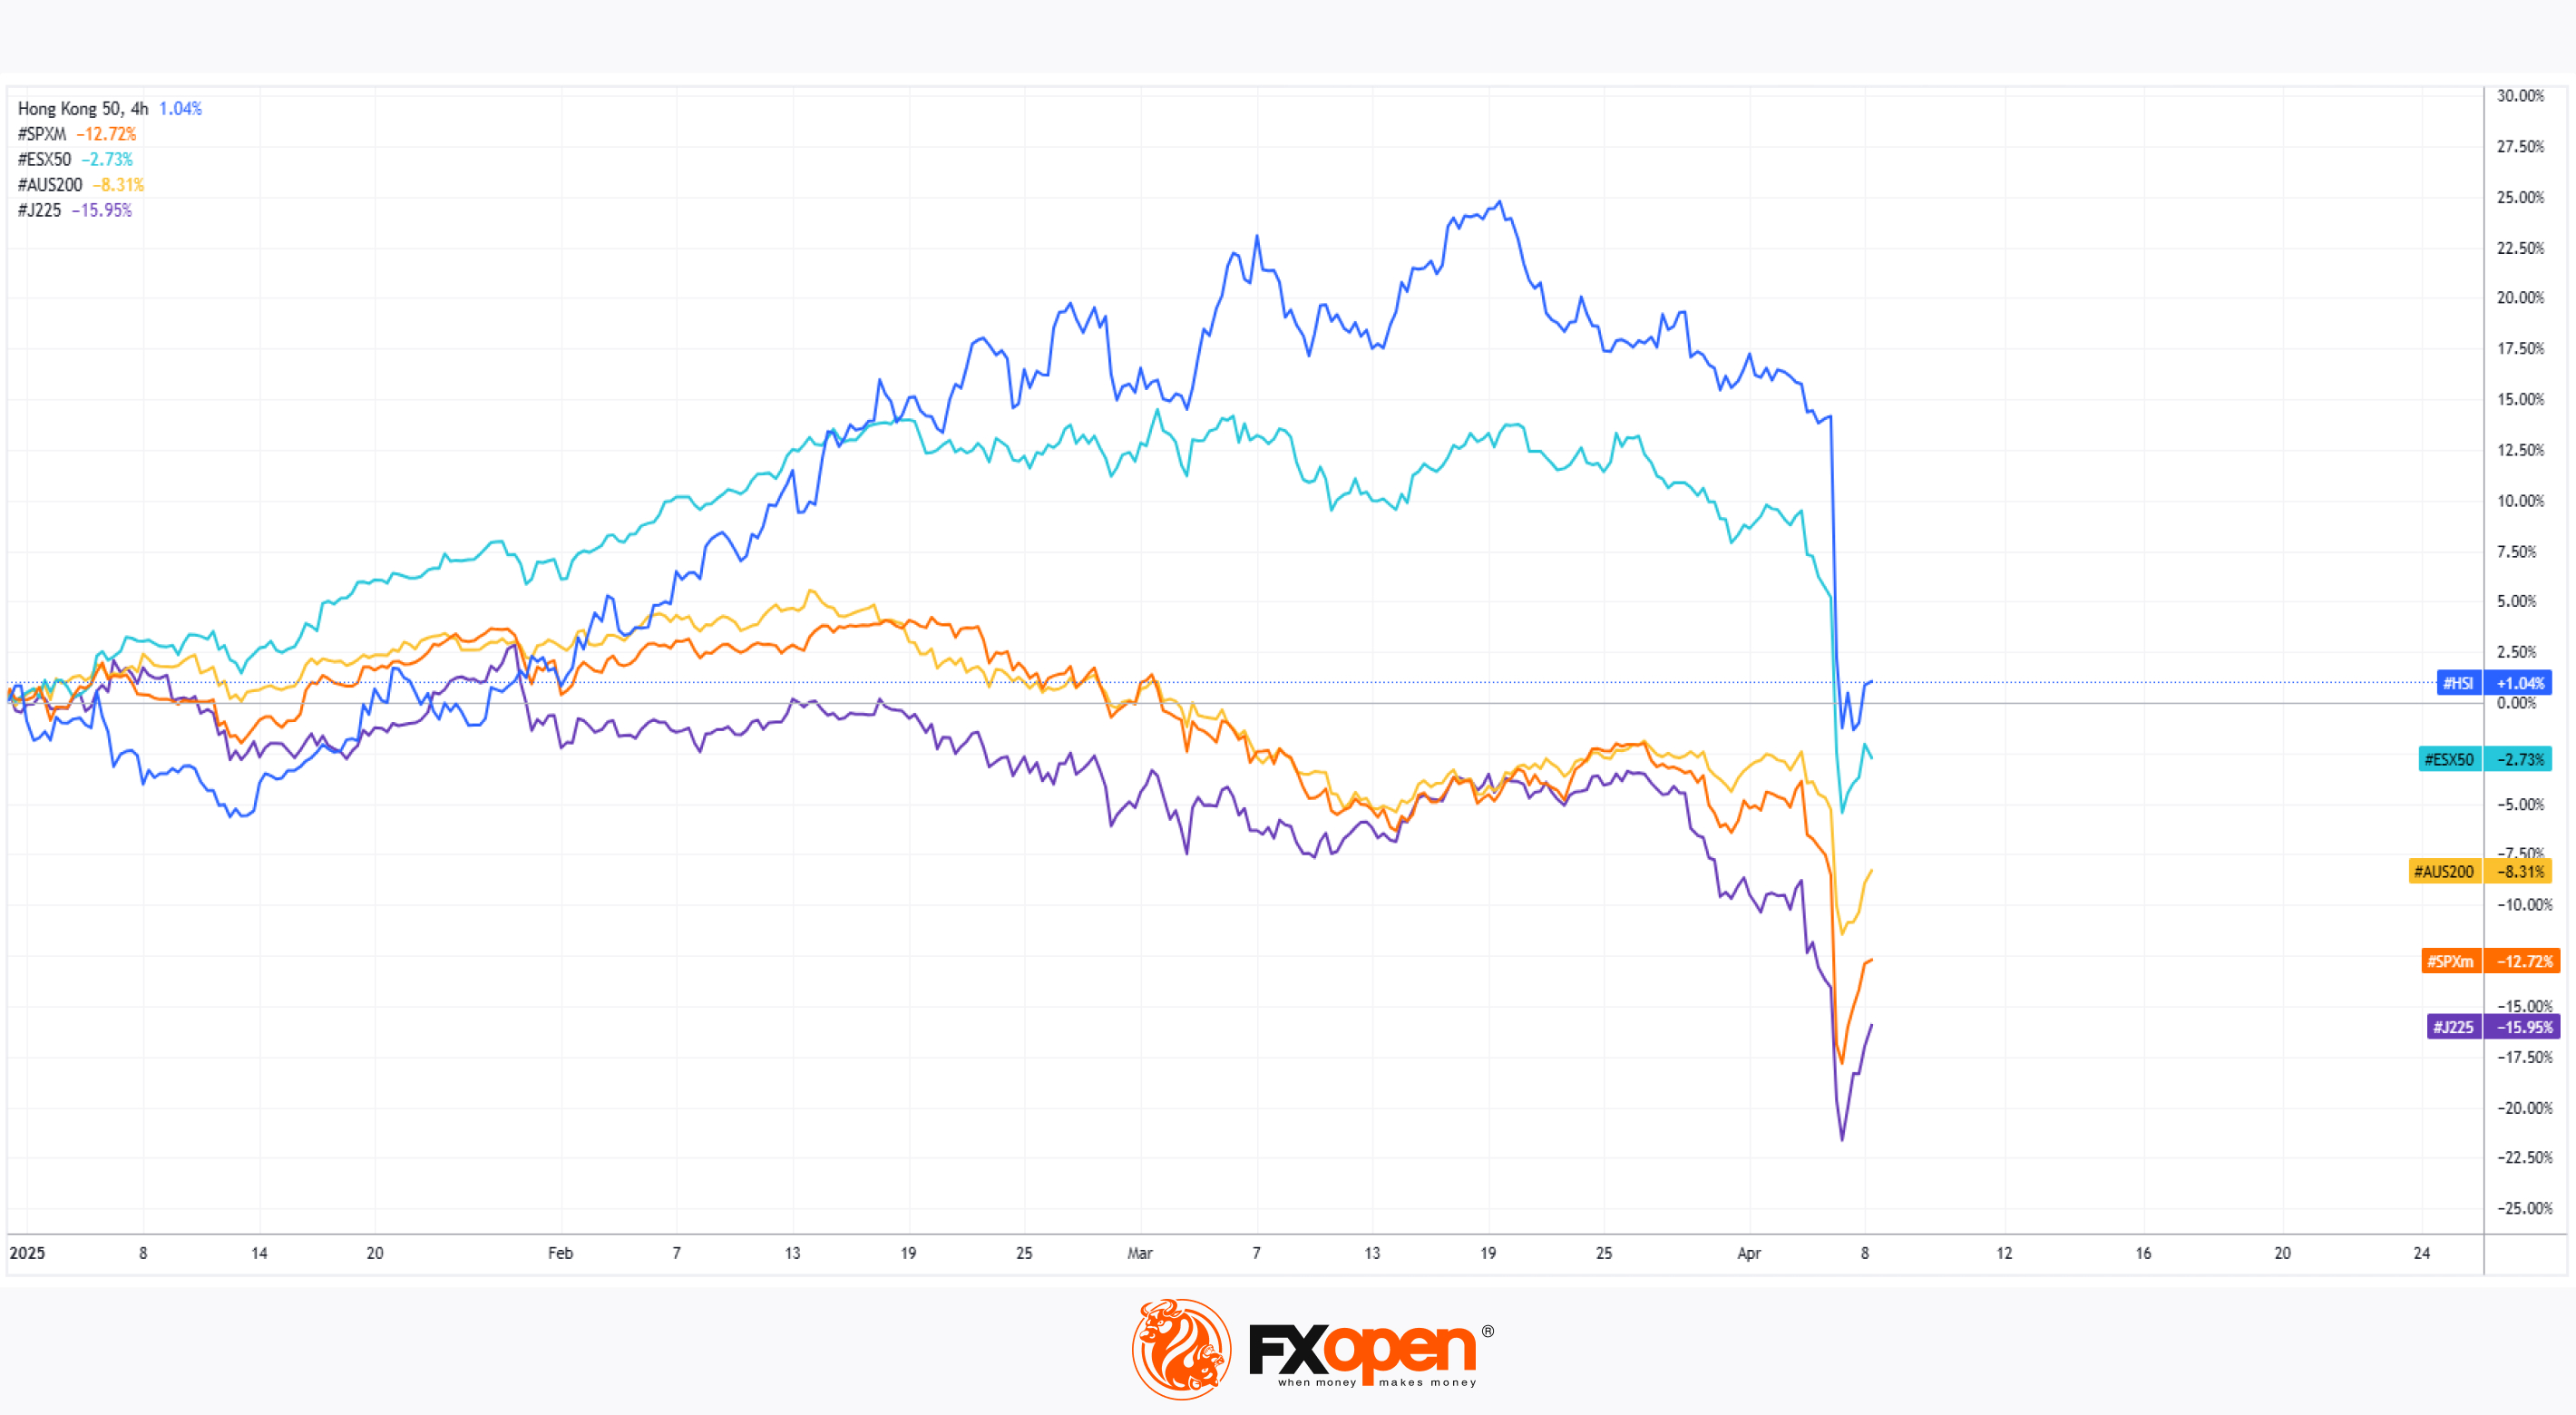
Hong Kong’s Hang Seng Index (Hong Kong 50 on FXOpen) tumbled by over 13% as trading resumed after the weekend with a sharp bearish gap.
According to media reports, this marked the biggest single-day drop since the 1997 Asian financial crisis.
Hang Seng Index Chart
In our analysis of the upward trend on the Hang Seng (Hong Kong 50 on FXOpen) chart a month ago, we noted that:
→ investor enthusiasm around artificial intelligence was still fuelling the rally;
→ however, the price appeared vulnerable to a correction.
We also highlighted that the outlook would largely depend on the fundamental backdrop, particularly the tariff standoff between China and the United States.
Since then, the Hang Seng Index (Hong Kong 50 on FXOpen) has fallen by around 17%, following the announcement of harsher-than-expected tariffs by President Trump, with China responding in kind.
Despite the drop, Hang Seng is outperforming peers
Despite Monday’s dramatic decline, the Hang Seng is still outperforming several other markets. As shown in the chart above, it remains in positive territory for 2025, unlike:
→ the ASX 200 (Australia 200 on FXOpen);
→ the S&P 500 (US SPX 500 mini on FXOpen);
→ and other global indices, including those in Europe and Japan.
What lies ahead?
Market sentiment remains highly sensitive to tariff-related news. For instance, Bloomberg reported that a post on social media platform X claimed President Trump was considering a 90-day pause on tariffs (excluding China), sparking hopes of a rebound.
Should Trump choose to soften the recently announced tariffs, this could act as a catalyst for a strong recovery across global equity markets.
Trade global index CFDs with zero commission and tight spreads. Open your FXOpen account now or learn more about trading index CFDs with FXOpen.
CFDs are complex instruments and come with a high risk of losing your money.
This article represents the opinion of the Companies operating under the FXOpen brand only. It is not to be construed as an offer, solicitation, or recommendation with respect to products and services provided by the Companies operating under the FXOpen brand, nor is it to be considered financial advice.
Hang Seng Index Plunges by Around 13%
Hong Kong’s Hang Seng Index (Hong Kong 50 on FXOpen) tumbled by over 13% as trading resumed after the weekend with a sharp bearish gap.
According to media reports, this marked the biggest single-day drop since the 1997 Asian financial crisis.
Hang Seng Index Chart
In our analysis of the upward trend on the Hang Seng (Hong Kong 50 on FXOpen) chart a month ago, we noted that:
→ investor enthusiasm around artificial intelligence was still fuelling the rally;
→ however, the price appeared vulnerable to a correction.
We also highlighted that the outlook would largely depend on the fundamental backdrop, particularly the tariff standoff between China and the United States.
Since then, the Hang Seng Index (Hong Kong 50 on FXOpen) has fallen by around 17%, following the announcement of harsher-than-expected tariffs by President Trump, with China responding in kind.
Despite the drop, Hang Seng is outperforming peers
Despite Monday’s dramatic decline, the Hang Seng is still outperforming several other markets. As shown in the chart above, it remains in positive territory for 2025, unlike:
→ the ASX 200 (Australia 200 on FXOpen);
→ the S&P 500 (US SPX 500 mini on FXOpen);
→ and other global indices, including those in Europe and Japan.
What lies ahead?
Market sentiment remains highly sensitive to tariff-related news. For instance, Bloomberg reported that a post on social media platform X claimed President Trump was considering a 90-day pause on tariffs (excluding China), sparking hopes of a rebound.
Should Trump choose to soften the recently announced tariffs, this could act as a catalyst for a strong recovery across global equity markets.
Trade global index CFDs with zero commission and tight spreads. Open your FXOpen account now or learn more about trading index CFDs with FXOpen.
CFDs are complex instruments and come with a high risk of losing your money.
This article represents the opinion of the Companies operating under the FXOpen brand only. It is not to be construed as an offer, solicitation, or recommendation with respect to products and services provided by the Companies operating under the FXOpen brand, nor is it to be considered financial advice.
👍2
#stockmarket #stocktrading #NKE #Nike #marketanalysis #MarketNews
Nike (NKE) Share Price Falls to Lowest Level Since 2017
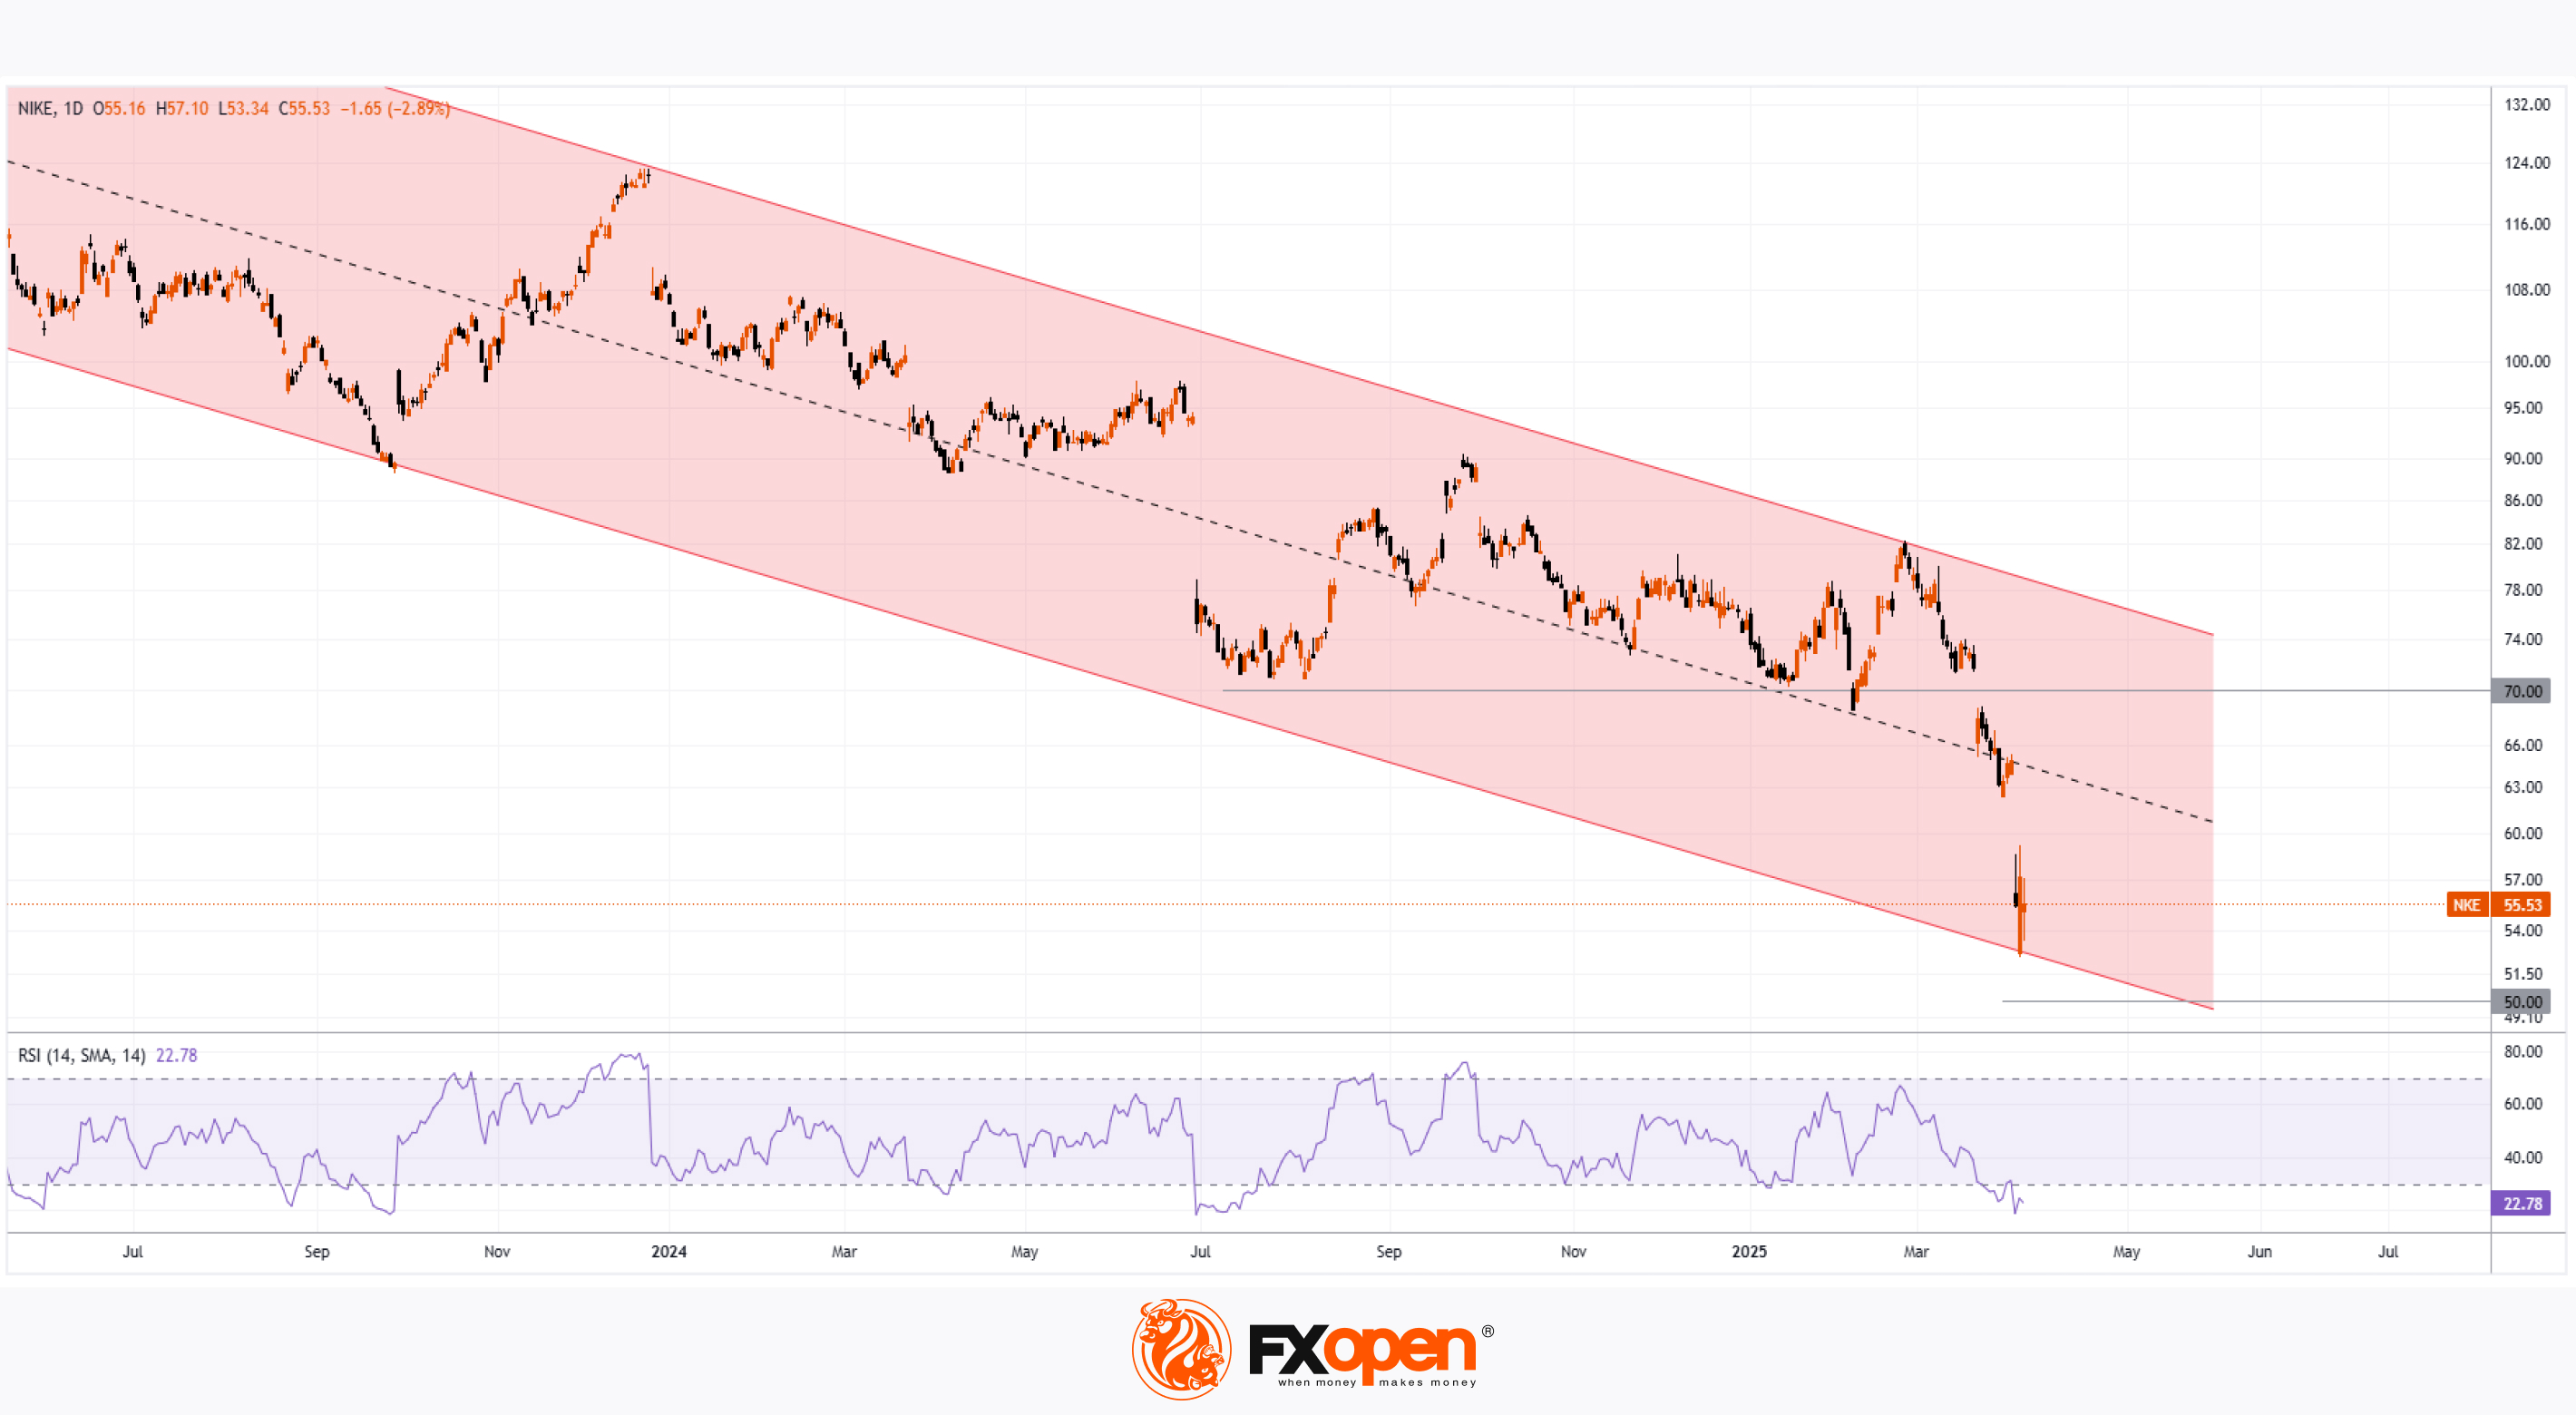
The chart for Nike (NKE) shows that the share price has dropped to around $55 – levels last seen in November 2017.
Since the start of 2025, the stock has declined by approximately 27%.
Why Has Nike’s Share Price Dropped?
As noted in our analysis from September 2024, Nike shares had been trending downward for several months due to intense competition. However, President Trump’s tariffs have become the dominant bearish factor.
This is largely because Nike relies heavily on manufacturing operations in Asia – many of which have been directly affected by the newly imposed tariffs.
What’s Next?
According to the Wall Street Journal, manufacturers are taking a wait-and-see approach. They’re reluctant to shift production out of Asia, which could mean higher prices for American consumers. A full return to U.S. production is unlikely due to:
→ a shortage of skilled workers and suppliers;
→ significantly higher wages in the U.S. compared to Asia;
→ relocating production from Asia is a complex business migration, not just a factory move – a process many companies might not be prepared for.
Some firms are reducing their margins or optimising logistics, but most are hoping to weather the storm or delay major changes.
Technical Analysis of Nike (NKE) Shares
The price is forming a downward channel (highlighted in red), with the following characteristics:
→ the median line provided temporary support, but the early April rebound attempt was very weak;
→ the lower boundary of the channel now appears to be acting as support.
The RSI indicator suggests strong oversold conditions. Bulls might take comfort in the proximity of the psychological $50 mark strengthening this support level. However, it seems that only positive developments on the tariff front are likely to reverse sentiment meaningfully.
According to WSJ analysts, Trump’s recent comments hint at possible negotiations. But unless the President changes his stance, Mexico, Brazil, and India – nations well-placed to act as intermediaries between China and the U.S. – could emerge as the main beneficiaries.
Trade global index CFDs with zero commission and tight spreads. Open your FXOpen account now or learn more about trading index CFDs with FXOpen.
CFDs are complex instruments and come with a high risk of losing your money.
This article represents the opinion of the Companies operating under the FXOpen brand only. It is not to be construed as an offer, solicitation, or recommendation with respect to products and services provided by the Companies operating under the FXOpen brand, nor is it to be considered financial advice.
Nike (NKE) Share Price Falls to Lowest Level Since 2017
The chart for Nike (NKE) shows that the share price has dropped to around $55 – levels last seen in November 2017.
Since the start of 2025, the stock has declined by approximately 27%.
Why Has Nike’s Share Price Dropped?
As noted in our analysis from September 2024, Nike shares had been trending downward for several months due to intense competition. However, President Trump’s tariffs have become the dominant bearish factor.
This is largely because Nike relies heavily on manufacturing operations in Asia – many of which have been directly affected by the newly imposed tariffs.
What’s Next?
According to the Wall Street Journal, manufacturers are taking a wait-and-see approach. They’re reluctant to shift production out of Asia, which could mean higher prices for American consumers. A full return to U.S. production is unlikely due to:
→ a shortage of skilled workers and suppliers;
→ significantly higher wages in the U.S. compared to Asia;
→ relocating production from Asia is a complex business migration, not just a factory move – a process many companies might not be prepared for.
Some firms are reducing their margins or optimising logistics, but most are hoping to weather the storm or delay major changes.
Technical Analysis of Nike (NKE) Shares
The price is forming a downward channel (highlighted in red), with the following characteristics:
→ the median line provided temporary support, but the early April rebound attempt was very weak;
→ the lower boundary of the channel now appears to be acting as support.
The RSI indicator suggests strong oversold conditions. Bulls might take comfort in the proximity of the psychological $50 mark strengthening this support level. However, it seems that only positive developments on the tariff front are likely to reverse sentiment meaningfully.
According to WSJ analysts, Trump’s recent comments hint at possible negotiations. But unless the President changes his stance, Mexico, Brazil, and India – nations well-placed to act as intermediaries between China and the U.S. – could emerge as the main beneficiaries.
Trade global index CFDs with zero commission and tight spreads. Open your FXOpen account now or learn more about trading index CFDs with FXOpen.
CFDs are complex instruments and come with a high risk of losing your money.
This article represents the opinion of the Companies operating under the FXOpen brand only. It is not to be construed as an offer, solicitation, or recommendation with respect to products and services provided by the Companies operating under the FXOpen brand, nor is it to be considered financial advice.
👍2
#stockmarket #stocktrading #MarketUpdates #marketanalysis
Defence Stocks Rose After Trump's Decision to Increase the Defence Budget to $1 Trillion
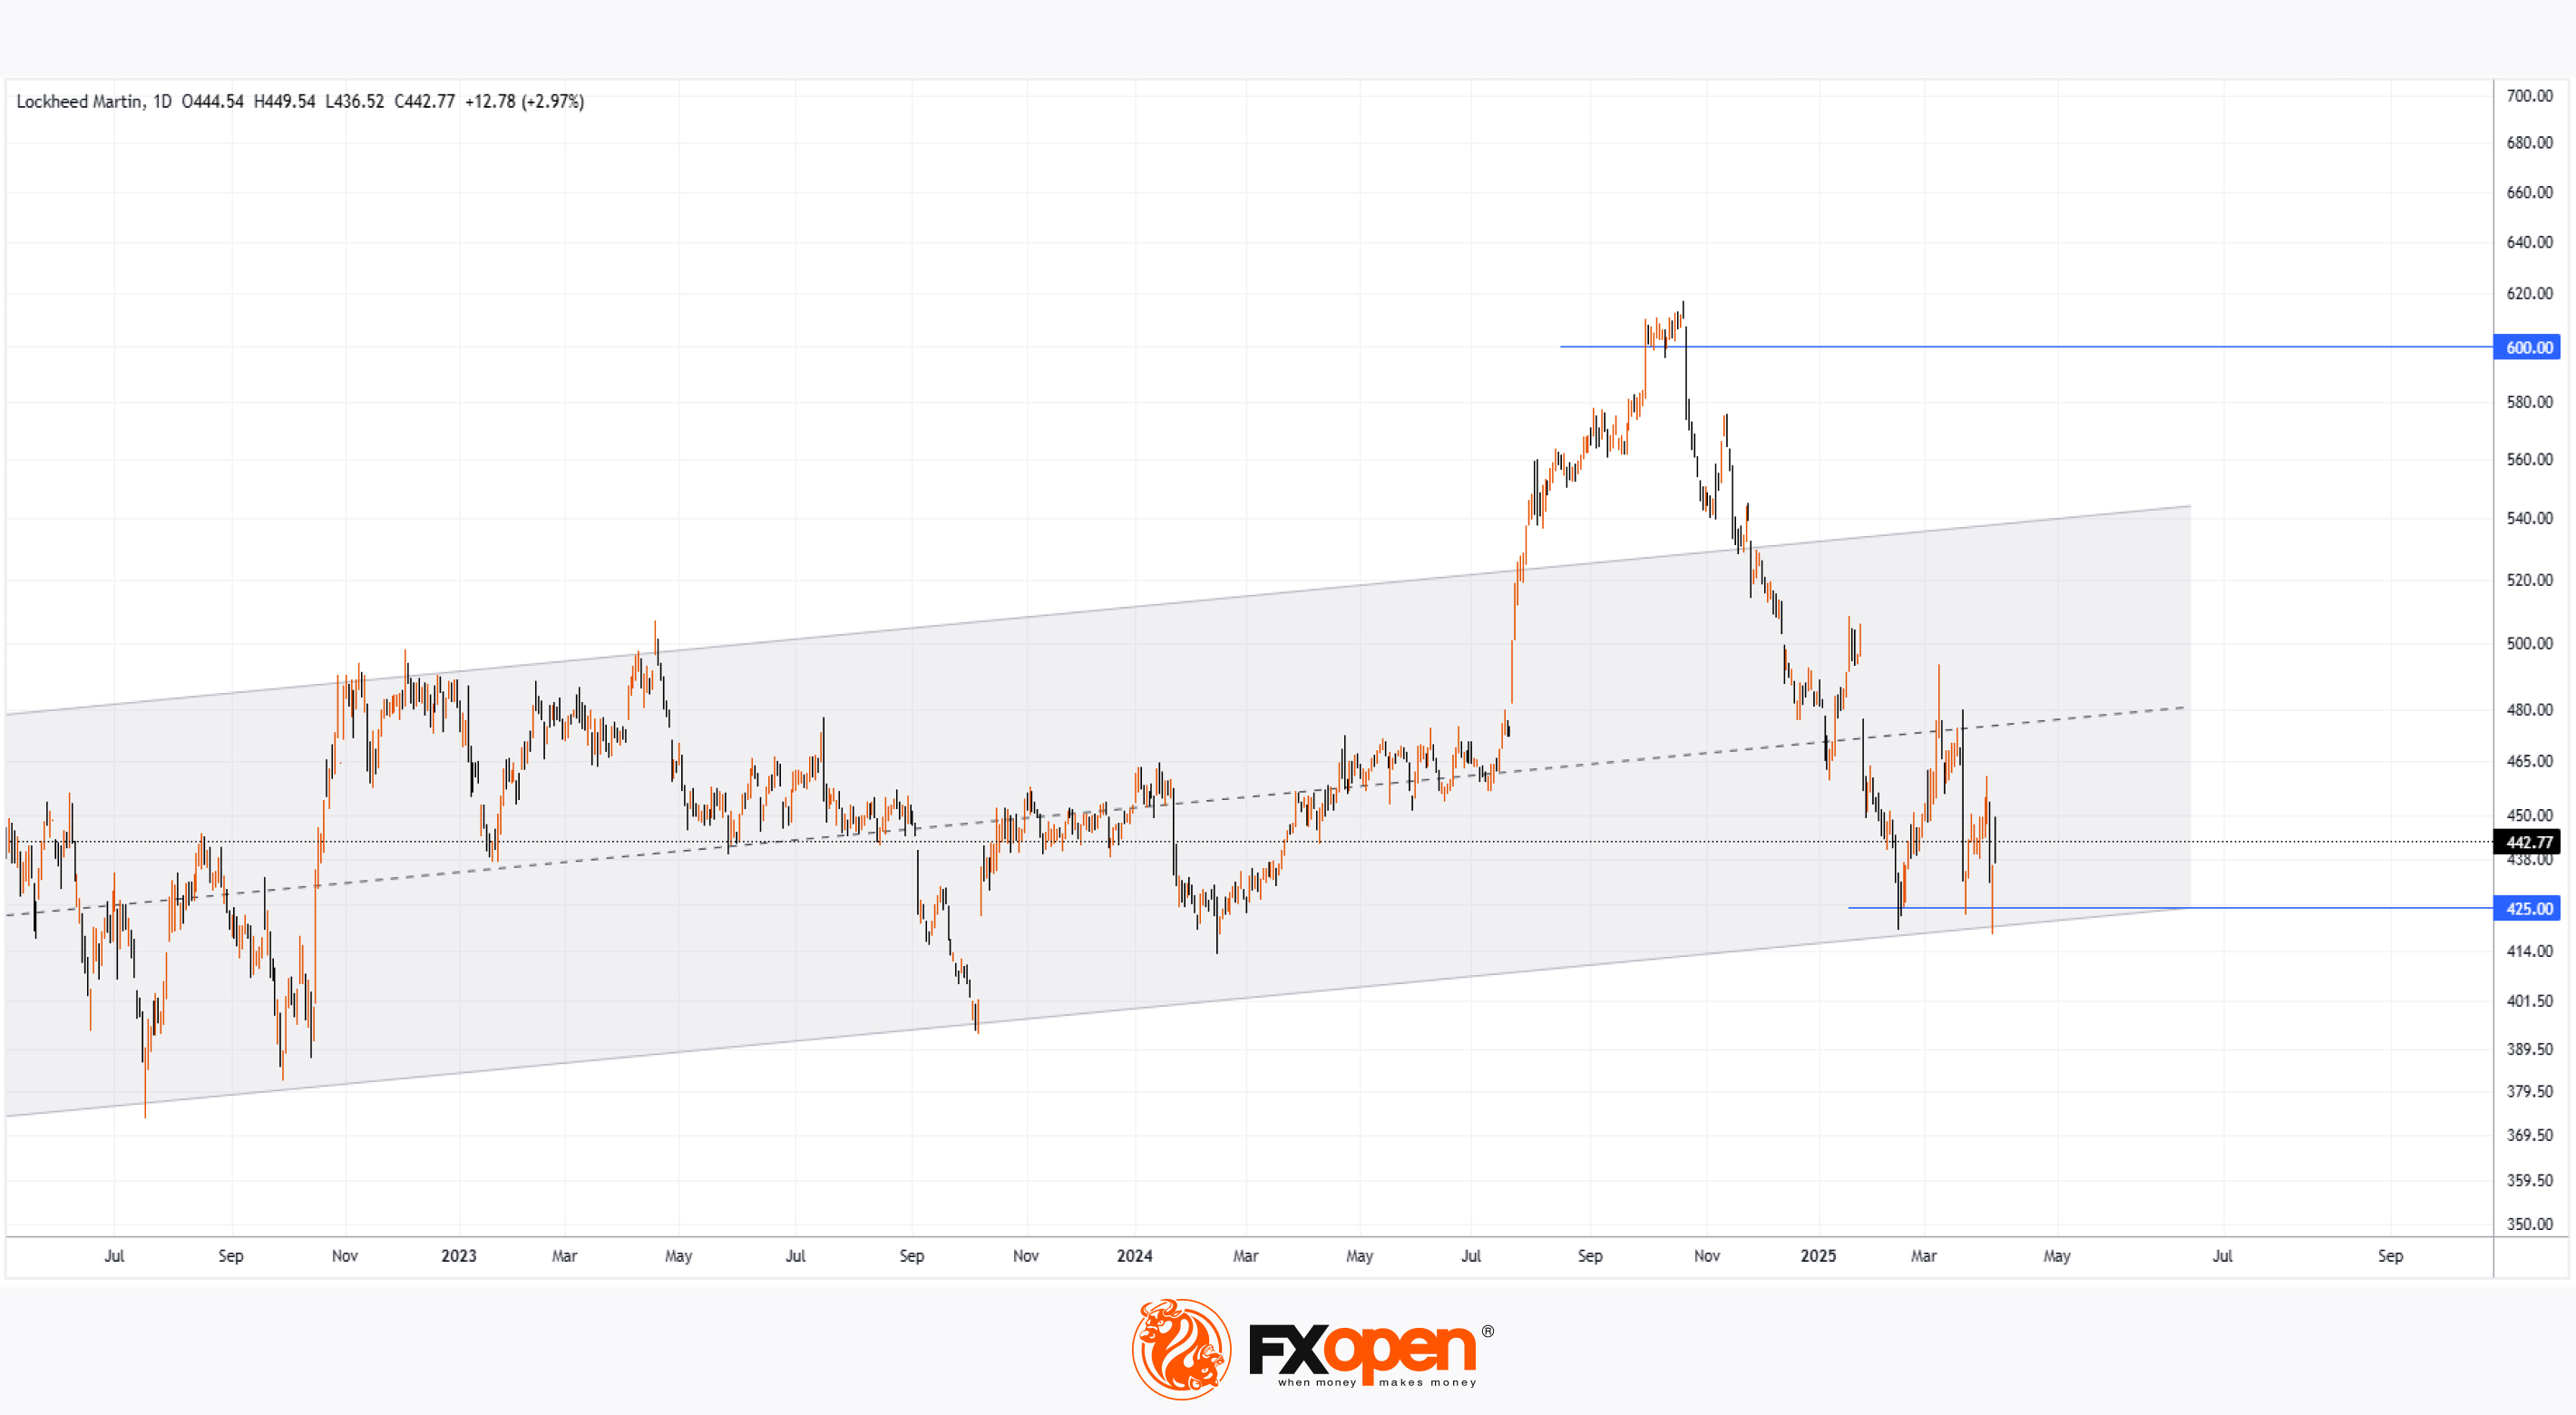
As shown in the charts, despite predominantly bearish sentiment in the stock market yesterday — with the difference between the opening and closing price for the S&P 500 index (US SPX 500 mini on FXOpen) being down by 4% — defence company stocks showed growth.
According to the WSJ, Palantir Technologies shares rose by 8% to $84.05 on Tuesday, while General Dynamics and Boeing increased by 5% to $260.12 and $145.365 respectively. Northrop Grumman and Lockheed Martin gained about 4% each.
Why Did Lockheed Martin (LMT) Shares Rise?
This occurred after President Trump announced that the defence budget for the 2026 fiscal year would be around $1 trillion, and Defence Secretary Pete Hegset published his announcement about the budget on X (formerly Twitter).
The increase in the defence budget by approximately $50-100 billion contrasts with previous statements from US leadership in February, when:
→ Trump said that "we have no reason to spend almost a trillion dollars on the military";
→ Hegset suggested annually cutting the defence budget by 8% — or around $50 billion — over the next five years.
Such statements had been putting pressure on the price of LMT stock in 2025.
Technical Analysis of the Lockheed Martin (LMT) Chart Today
As a reminder, on 3 October we suggested that breaking the psychological $600 level would trigger profit-taking, which would, in turn, drive a correction following the impressive rally. In the same analysis, we outlined a long-term channel (shown in grey). Since then, the price has dropped by more than 25%. Today, the LMT share price is near the lower boundary of this channel.
It is worth noting that the recent lows around the $425 level resemble a bullish Triple Bottom pattern.
Given this, it is reasonable to assume that bulls may attempt to recover at least part of the decline that started in October 2024. It’s also possible that concerns over rising geopolitical tensions amid the global trade war could support this move.
Trade global index CFDs with zero commission and tight spreads. Open your FXOpen account now or learn more about trading index CFDs with FXOpen.
CFDs are complex instruments and come with a high risk of losing your money.
This article represents the opinion of the Companies operating under the FXOpen brand only. It is not to be construed as an offer, solicitation, or recommendation with respect to products and services provided by the Companies operating under the FXOpen brand, nor is it to be considered financial advice.
Defence Stocks Rose After Trump's Decision to Increase the Defence Budget to $1 Trillion
As shown in the charts, despite predominantly bearish sentiment in the stock market yesterday — with the difference between the opening and closing price for the S&P 500 index (US SPX 500 mini on FXOpen) being down by 4% — defence company stocks showed growth.
According to the WSJ, Palantir Technologies shares rose by 8% to $84.05 on Tuesday, while General Dynamics and Boeing increased by 5% to $260.12 and $145.365 respectively. Northrop Grumman and Lockheed Martin gained about 4% each.
Why Did Lockheed Martin (LMT) Shares Rise?
This occurred after President Trump announced that the defence budget for the 2026 fiscal year would be around $1 trillion, and Defence Secretary Pete Hegset published his announcement about the budget on X (formerly Twitter).
The increase in the defence budget by approximately $50-100 billion contrasts with previous statements from US leadership in February, when:
→ Trump said that "we have no reason to spend almost a trillion dollars on the military";
→ Hegset suggested annually cutting the defence budget by 8% — or around $50 billion — over the next five years.
Such statements had been putting pressure on the price of LMT stock in 2025.
Technical Analysis of the Lockheed Martin (LMT) Chart Today
As a reminder, on 3 October we suggested that breaking the psychological $600 level would trigger profit-taking, which would, in turn, drive a correction following the impressive rally. In the same analysis, we outlined a long-term channel (shown in grey). Since then, the price has dropped by more than 25%. Today, the LMT share price is near the lower boundary of this channel.
It is worth noting that the recent lows around the $425 level resemble a bullish Triple Bottom pattern.
Given this, it is reasonable to assume that bulls may attempt to recover at least part of the decline that started in October 2024. It’s also possible that concerns over rising geopolitical tensions amid the global trade war could support this move.
Trade global index CFDs with zero commission and tight spreads. Open your FXOpen account now or learn more about trading index CFDs with FXOpen.
CFDs are complex instruments and come with a high risk of losing your money.
This article represents the opinion of the Companies operating under the FXOpen brand only. It is not to be construed as an offer, solicitation, or recommendation with respect to products and services provided by the Companies operating under the FXOpen brand, nor is it to be considered financial advice.
👍2
#brentoil #oilprices #commodities #marketanalysis
Brent Crude Price Continues to Fall
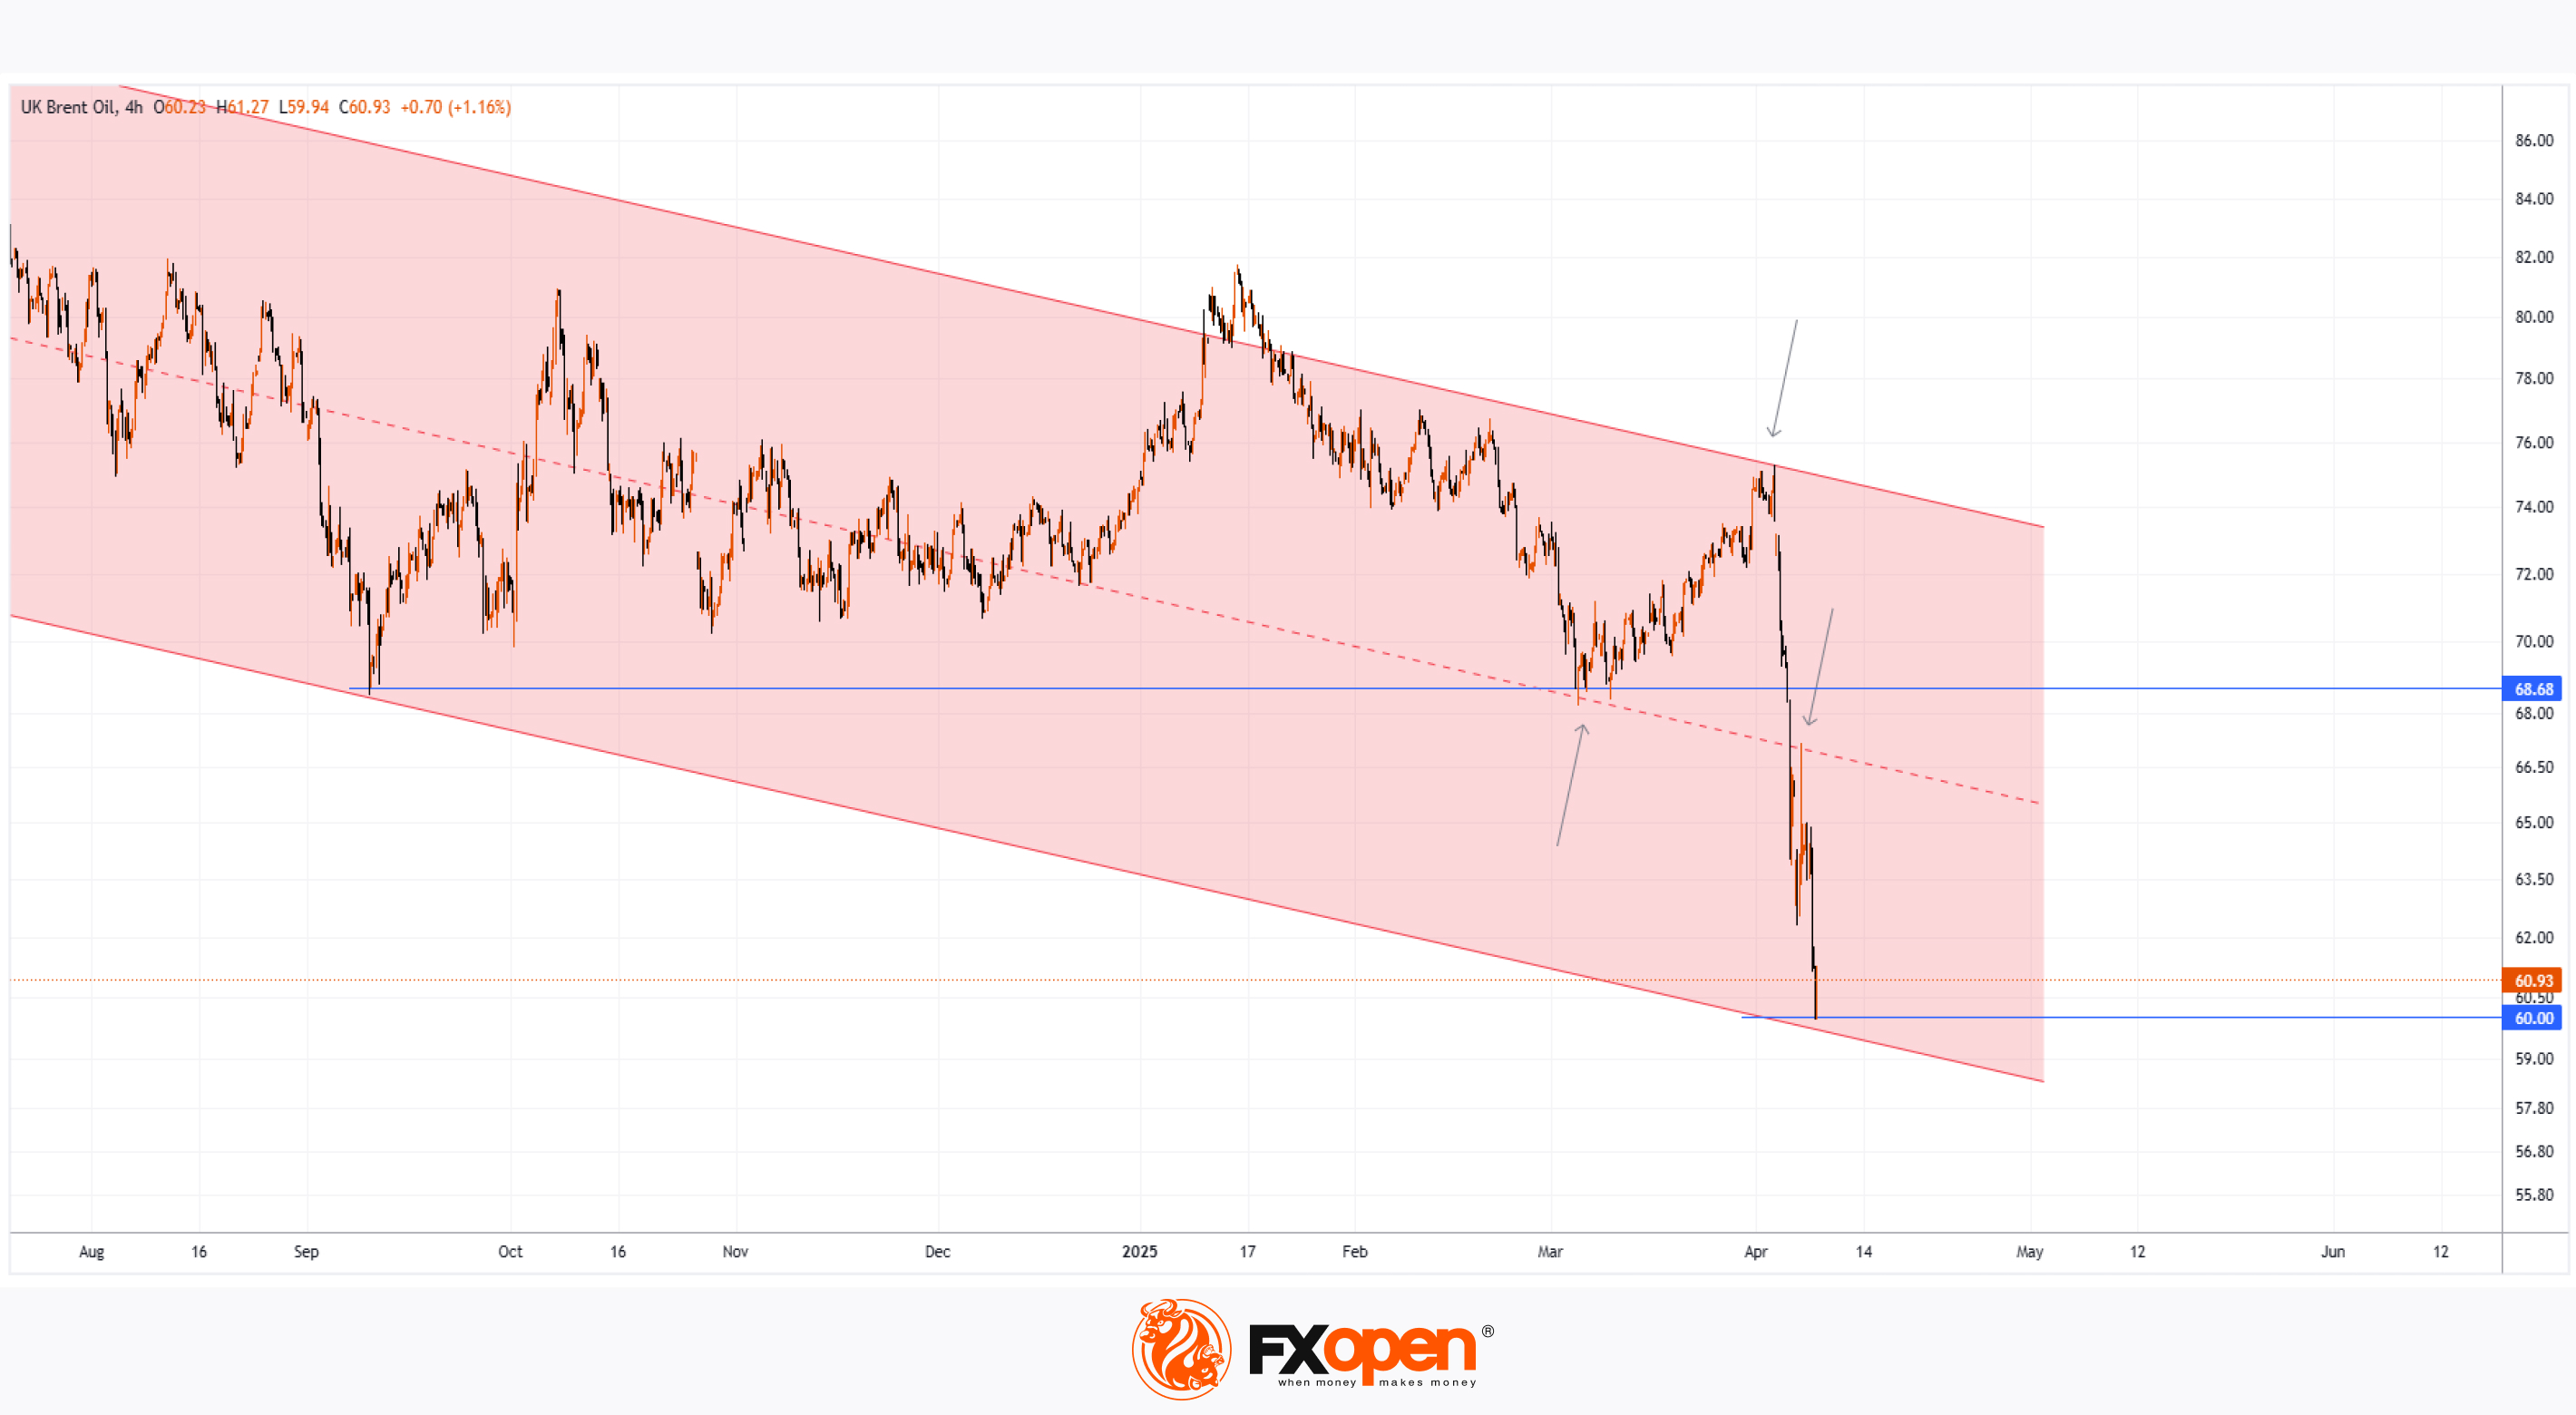
Today, the price of Brent crude has dropped below $60 per barrel, marking its lowest level since March 2021. As shown on the XBR/USD chart, from the start of 2025, the price saw a rise of around 2.6% at the end of March 2025.
Why is oil falling?
The key driver is the escalation of the trade war. Yesterday, the US President announced the imposition of additional tariffs on trade with China, bringing the total to 104%.
The decline in Brent prices seems to reflect traders' concerns about the risks of a global recession.
Oil price forecasts for 2025 and 2026
Yesterday, analysts at Goldman Sachs released their oil price forecasts for Brent and WTI crude. They expect prices to reach $62 per barrel for Brent and $58 for WTI by December 2025. By December 2026, they anticipate a further decline to $55 and $51, respectively. However, analysts caveat that these forecasts are based on the assumption that the US will avoid a recession and that OPEC+ countries will increase their supplies.
In the event of a global economic slowdown, Brent prices could drop to $40 by the end of 2026.
Technical analysis of the XBR/USD chart today
The sharp decline in Brent prices has resulted in a forceful breach of key lows from 2024 and 2025 around the $68.68 level.
Additionally, the XBR/USD chart shows that the price continues to follow a downward channel (indicated in red), with the following levels acting as resistance (marked by arrows):
→ The upper boundary of the channel;
→ Its median (previously acting as support) – indicating the dominance of supply forces.
It is possible that the lower boundary of the channel, strengthened by the psychological level of $60.00, will provide support, slowing the bearish progress of Brent prices. However, the key factor will undoubtedly be the news flow, with sharp statements from the White House.
Traders are focusing on how China will react to the 104% tariffs announced by Donald Trump. As Reuters reports, the President stated yesterday, "We have many countries coming to us wanting to make deals," adding that he expects China to also seek an agreement.
Start trading commodities with tight spreads. Open your trading account now or learn more about trading commodity CFDs with FXOpen.
CFDs are complex instruments and come with a high risk of losing your money.
This article represents the opinion of the Companies operating under the FXOpen brand only. It is not to be construed as an offer, solicitation, or recommendation with respect to products and services provided by the Companies operating under the FXOpen brand, nor is it to be considered financial advice.
Brent Crude Price Continues to Fall
Today, the price of Brent crude has dropped below $60 per barrel, marking its lowest level since March 2021. As shown on the XBR/USD chart, from the start of 2025, the price saw a rise of around 2.6% at the end of March 2025.
Why is oil falling?
The key driver is the escalation of the trade war. Yesterday, the US President announced the imposition of additional tariffs on trade with China, bringing the total to 104%.
The decline in Brent prices seems to reflect traders' concerns about the risks of a global recession.
Oil price forecasts for 2025 and 2026
Yesterday, analysts at Goldman Sachs released their oil price forecasts for Brent and WTI crude. They expect prices to reach $62 per barrel for Brent and $58 for WTI by December 2025. By December 2026, they anticipate a further decline to $55 and $51, respectively. However, analysts caveat that these forecasts are based on the assumption that the US will avoid a recession and that OPEC+ countries will increase their supplies.
In the event of a global economic slowdown, Brent prices could drop to $40 by the end of 2026.
Technical analysis of the XBR/USD chart today
The sharp decline in Brent prices has resulted in a forceful breach of key lows from 2024 and 2025 around the $68.68 level.
Additionally, the XBR/USD chart shows that the price continues to follow a downward channel (indicated in red), with the following levels acting as resistance (marked by arrows):
→ The upper boundary of the channel;
→ Its median (previously acting as support) – indicating the dominance of supply forces.
It is possible that the lower boundary of the channel, strengthened by the psychological level of $60.00, will provide support, slowing the bearish progress of Brent prices. However, the key factor will undoubtedly be the news flow, with sharp statements from the White House.
Traders are focusing on how China will react to the 104% tariffs announced by Donald Trump. As Reuters reports, the President stated yesterday, "We have many countries coming to us wanting to make deals," adding that he expects China to also seek an agreement.
Start trading commodities with tight spreads. Open your trading account now or learn more about trading commodity CFDs with FXOpen.
CFDs are complex instruments and come with a high risk of losing your money.
This article represents the opinion of the Companies operating under the FXOpen brand only. It is not to be construed as an offer, solicitation, or recommendation with respect to products and services provided by the Companies operating under the FXOpen brand, nor is it to be considered financial advice.
👍2
#sp500 #stockmarket #stocktrading #MarketUpdates #marketanalysis
Trump Delays Tariffs for 90 Days. The S&P 500 Rebounds Sharply
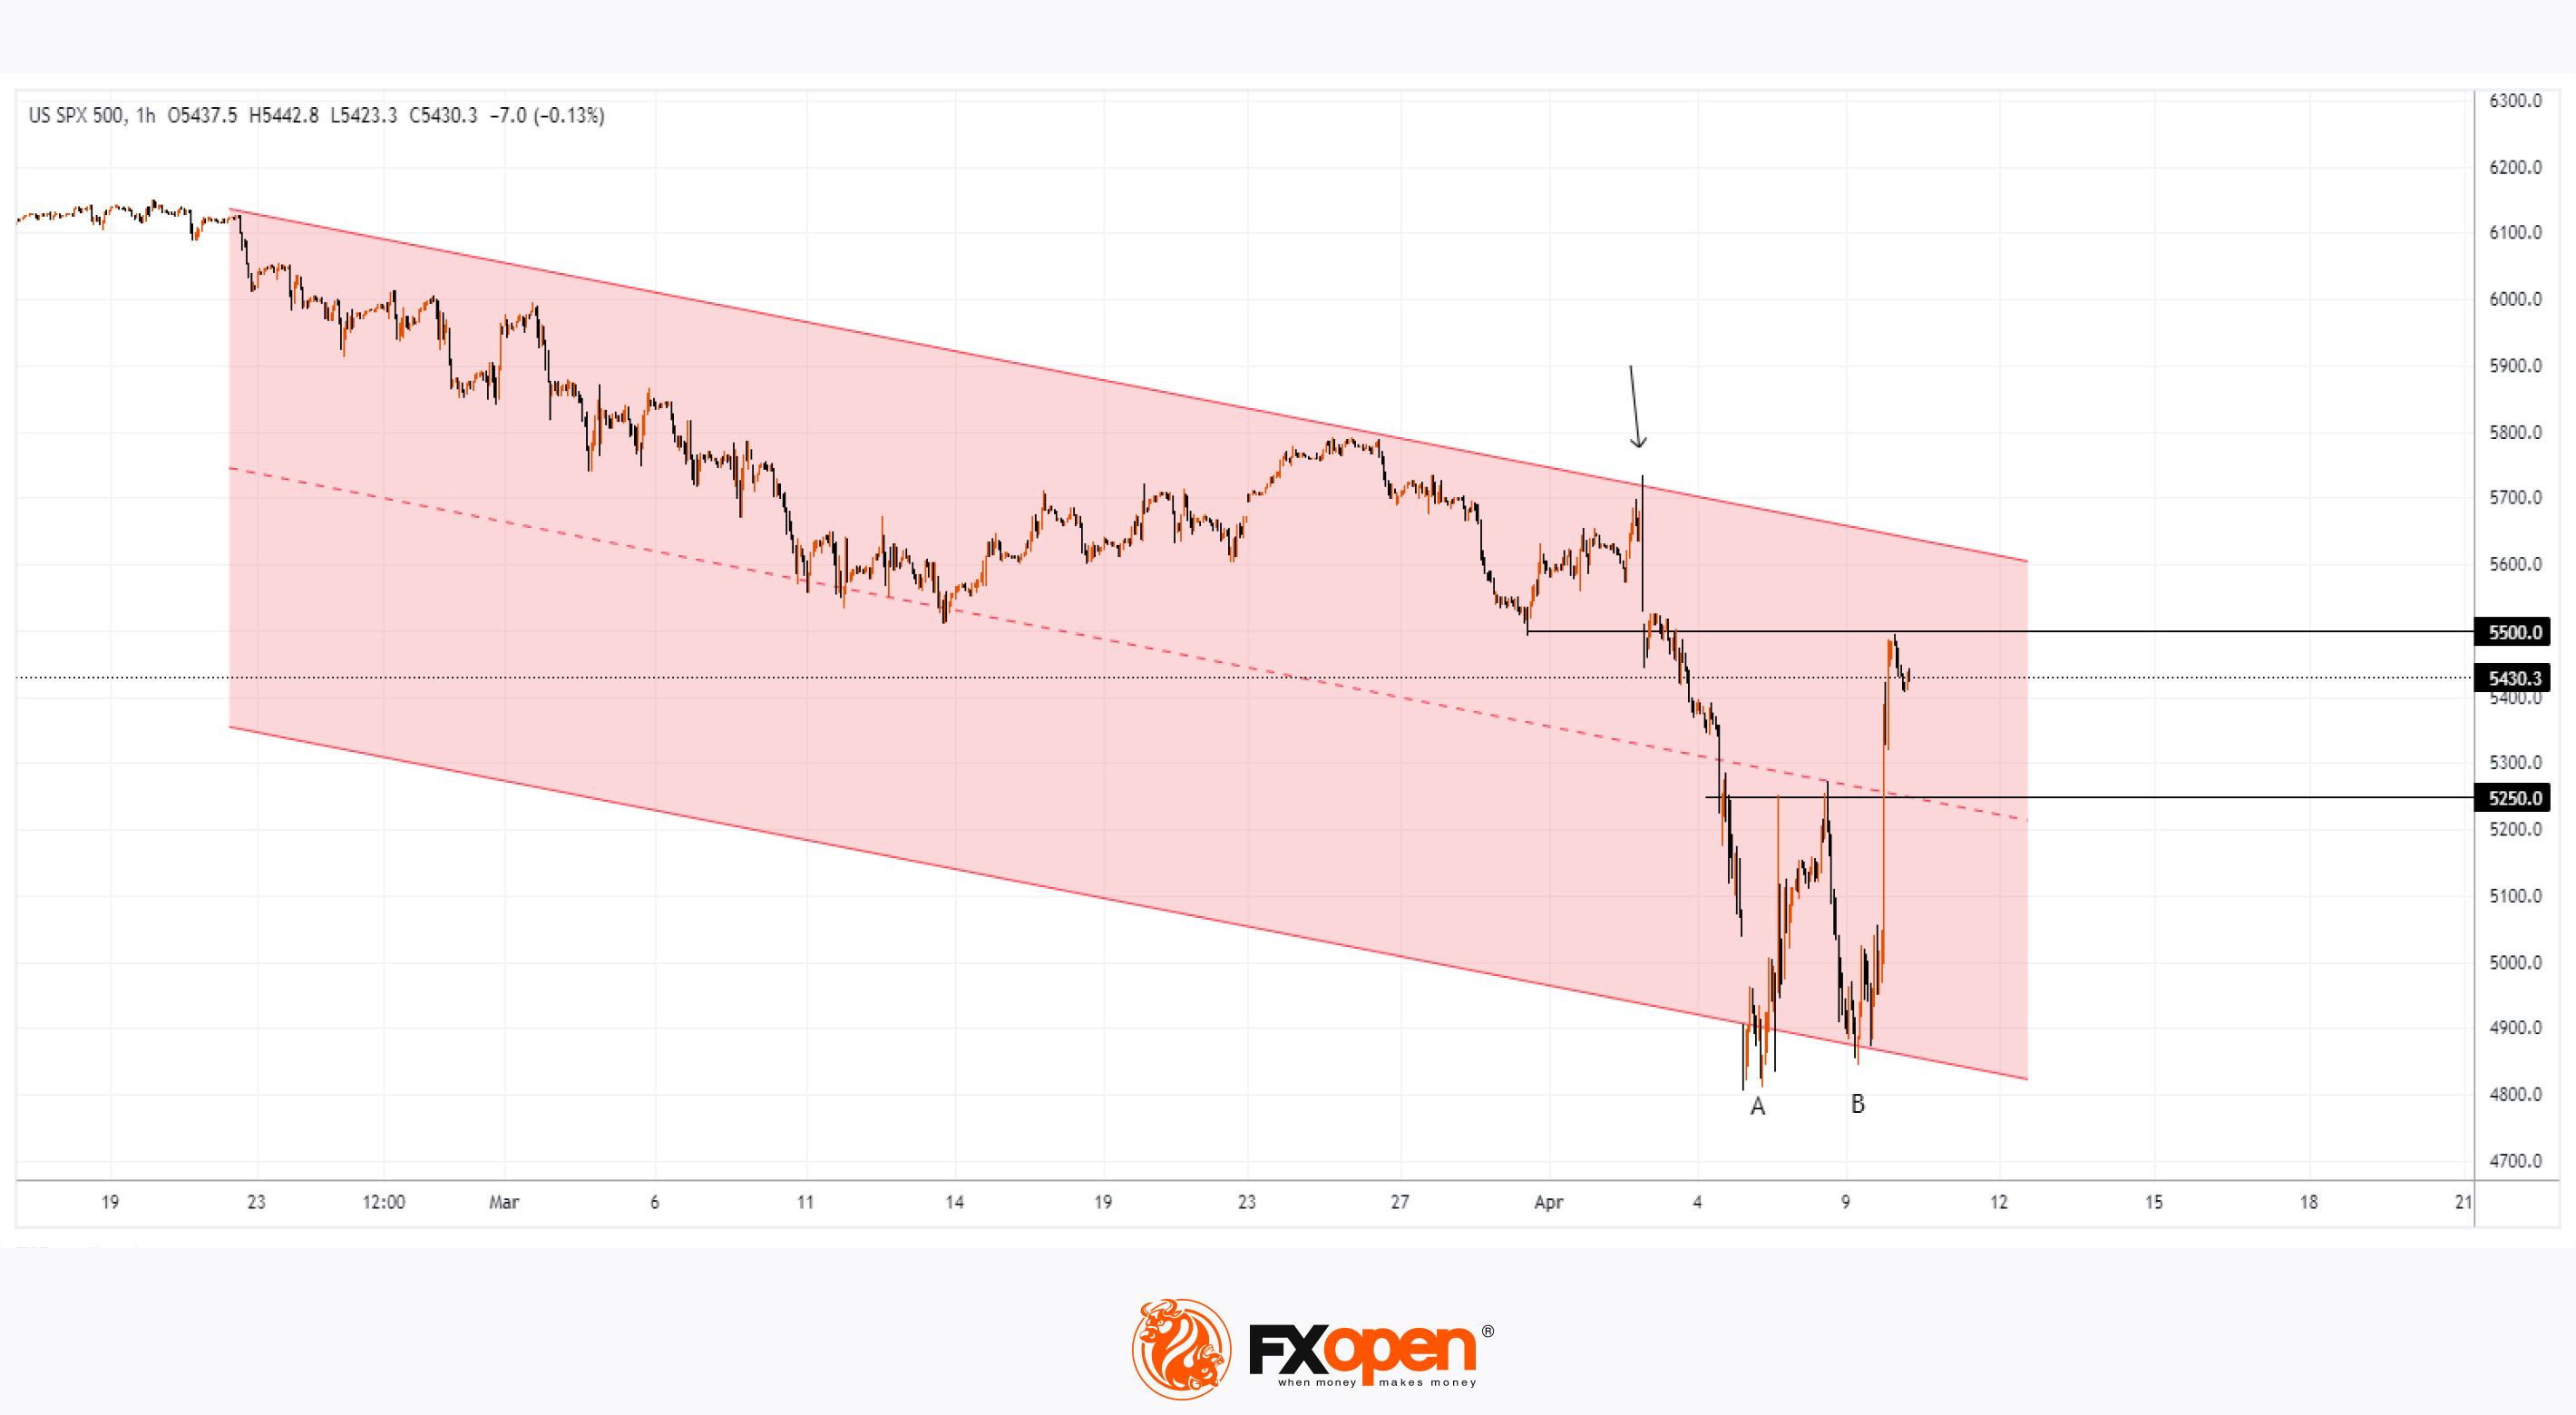
As shown in the chart of the S&P 500 (US SPX 500 mini on FXOpen), the index is currently trading near the 5,500 level.
This result is highly encouraging, considering that as recently as yesterday morning, the index was hovering around 4,900.
Why Have Stocks Risen?
The strong rebound seen yesterday evening was triggered by a statement from the US President — he announced a 90-day delay in the implementation of wide-ranging global trade tariffs, which had originally been unveiled on 2 April and led to a sharp drop in the index (as indicated by the arrow).
However, this does not apply to China, for which tariffs were not delayed but increased. "Due to the lack of respect China has shown towards global markets, I am raising the tariff imposed on China by the United States of America to 125%, effective immediately," said Donald Trump, according to media reports.
Overall, US stock markets responded positively to the news, and Goldman Sachs economists have withdrawn their US recession forecasts.
Technical Analysis of the S&P 500 Chart (US SPX 500 mini on FXOpen)
Despite yesterday’s sharp rebound, the stock market remains in a downtrend (as indicated by the red channel).
From a bullish perspective:
→ A Double Bottom pattern (A–B) has formed around the 4,900 level;
→ Price has moved into the upper half of the channel.
From a bearish perspective:
→ Bulls must overcome key resistance near the psychological 5,000 level;
→ While tariffs have been delayed, they have not been cancelled. As such, the risk of an escalating trade war is likely to continue putting pressure on the S&P 500 index (US SPX 500 mini on FXOpen) in the coming months.
Trade global index CFDs with zero commission and tight spreads. Open your FXOpen account now or learn more about trading index CFDs with FXOpen.
CFDs are complex instruments and come with a high risk of losing your money.
This article represents the opinion of the Companies operating under the FXOpen brand only. It is not to be construed as an offer, solicitation, or recommendation with respect to products and services provided by the Companies operating under the FXOpen brand, nor is it to be considered financial advice.
Trump Delays Tariffs for 90 Days. The S&P 500 Rebounds Sharply
As shown in the chart of the S&P 500 (US SPX 500 mini on FXOpen), the index is currently trading near the 5,500 level.
This result is highly encouraging, considering that as recently as yesterday morning, the index was hovering around 4,900.
Why Have Stocks Risen?
The strong rebound seen yesterday evening was triggered by a statement from the US President — he announced a 90-day delay in the implementation of wide-ranging global trade tariffs, which had originally been unveiled on 2 April and led to a sharp drop in the index (as indicated by the arrow).
However, this does not apply to China, for which tariffs were not delayed but increased. "Due to the lack of respect China has shown towards global markets, I am raising the tariff imposed on China by the United States of America to 125%, effective immediately," said Donald Trump, according to media reports.
Overall, US stock markets responded positively to the news, and Goldman Sachs economists have withdrawn their US recession forecasts.
Technical Analysis of the S&P 500 Chart (US SPX 500 mini on FXOpen)
Despite yesterday’s sharp rebound, the stock market remains in a downtrend (as indicated by the red channel).
From a bullish perspective:
→ A Double Bottom pattern (A–B) has formed around the 4,900 level;
→ Price has moved into the upper half of the channel.
From a bearish perspective:
→ Bulls must overcome key resistance near the psychological 5,000 level;
→ While tariffs have been delayed, they have not been cancelled. As such, the risk of an escalating trade war is likely to continue putting pressure on the S&P 500 index (US SPX 500 mini on FXOpen) in the coming months.
Trade global index CFDs with zero commission and tight spreads. Open your FXOpen account now or learn more about trading index CFDs with FXOpen.
CFDs are complex instruments and come with a high risk of losing your money.
This article represents the opinion of the Companies operating under the FXOpen brand only. It is not to be construed as an offer, solicitation, or recommendation with respect to products and services provided by the Companies operating under the FXOpen brand, nor is it to be considered financial advice.
👍2
#tsla #tesla #stocktrading #stockmarket #MarketUpdates #marketanalysis
Tesla (TSLA) Shares Jump Approximately 22% in a Single Day
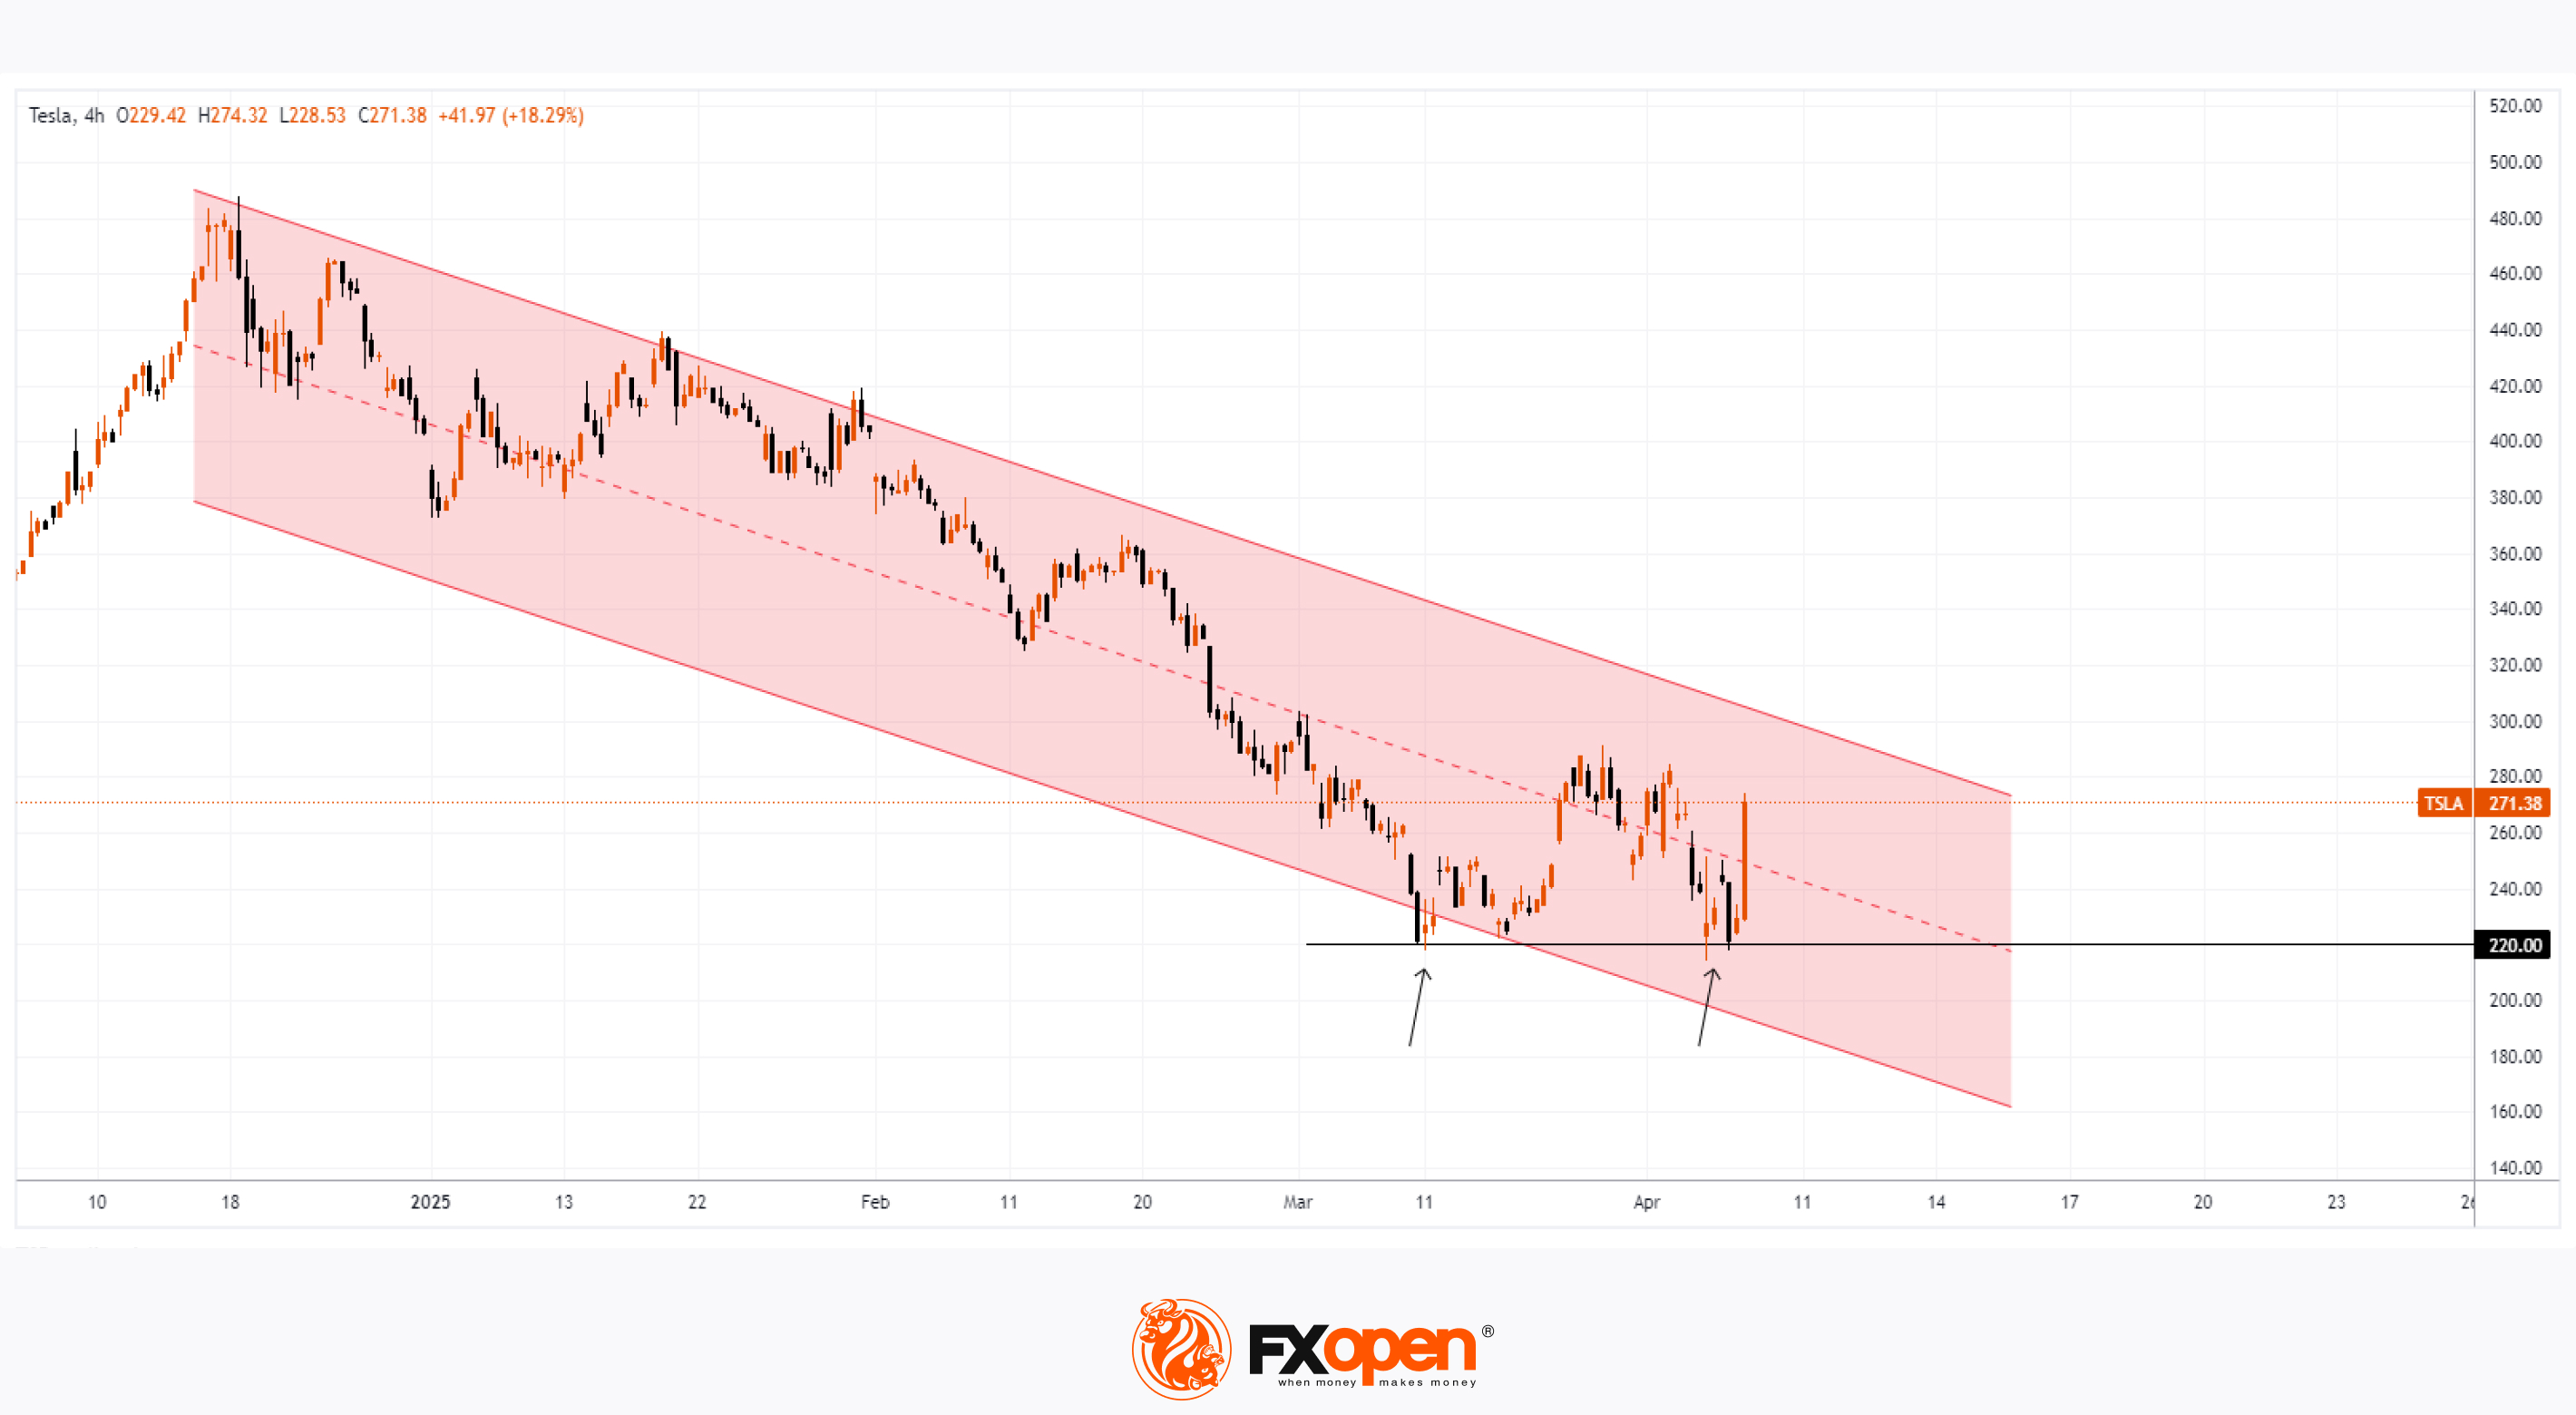
Tesla was among the standout performers in the stock market rally that followed President Trump’s decision to delay, by 90 days, the implementation of new international trade tariffs — with the notable exception of China. According to the charts, Tesla (TSLA) shares surged by approximately 22%.
Why Did TSLA Shares Soar?
Some insight comes from Cathie Wood, CEO of asset management firm ARK Invest.
In an interview with Barron’s on Wednesday, she noted the following:
→ Tesla plans to launch a new, more affordable vehicle this quarter, likely priced at around $30,000 — roughly half the cost of the base Model Y.
→ The upcoming release of Tesla’s robotaxi service could also lower the need for large upfront vehicle purchases, offering consumers a more economical alternative.
→ Tesla sources more components from North America than most other US carmakers, meaning it is less exposed to tariff-related costs.
And there’s another reason TSLA may have jumped — one that can be found in the chart.
Technical Analysis of TSLA
Take note: the March and April lows (marked with arrows) are both around the $220 level. Meanwhile, the S&P 500 (US SPX 500 mini on FXOpen) posted a significantly lower low in April compared to March. This suggests that, in early April, TSLA was outperforming the broader market. Why?
One possible explanation is that there has been — and perhaps still is — a strong accumulation interest in TSLA. Buyers may have been quietly scooping up available shares amid recession fears. When yesterday’s news suddenly shifted market sentiment, the “spring” uncoiled, catapulting TSLA’s share price upward.
However, the overall downtrend remains intact. If bullish momentum continues, the price may encounter resistance around the psychologically significant $300 level — which coincides with the upper boundary of the downward channel.
Trade global index CFDs with zero commission and tight spreads. Open your FXOpen account now or learn more about trading index CFDs with FXOpen.
CFDs are complex instruments and come with a high risk of losing your money.
This article represents the opinion of the Companies operating under the FXOpen brand only. It is not to be construed as an offer, solicitation, or recommendation with respect to products and services provided by the Companies operating under the FXOpen brand, nor is it to be considered financial advice.
Tesla (TSLA) Shares Jump Approximately 22% in a Single Day
Tesla was among the standout performers in the stock market rally that followed President Trump’s decision to delay, by 90 days, the implementation of new international trade tariffs — with the notable exception of China. According to the charts, Tesla (TSLA) shares surged by approximately 22%.
Why Did TSLA Shares Soar?
Some insight comes from Cathie Wood, CEO of asset management firm ARK Invest.
In an interview with Barron’s on Wednesday, she noted the following:
→ Tesla plans to launch a new, more affordable vehicle this quarter, likely priced at around $30,000 — roughly half the cost of the base Model Y.
→ The upcoming release of Tesla’s robotaxi service could also lower the need for large upfront vehicle purchases, offering consumers a more economical alternative.
→ Tesla sources more components from North America than most other US carmakers, meaning it is less exposed to tariff-related costs.
And there’s another reason TSLA may have jumped — one that can be found in the chart.
Technical Analysis of TSLA
Take note: the March and April lows (marked with arrows) are both around the $220 level. Meanwhile, the S&P 500 (US SPX 500 mini on FXOpen) posted a significantly lower low in April compared to March. This suggests that, in early April, TSLA was outperforming the broader market. Why?
One possible explanation is that there has been — and perhaps still is — a strong accumulation interest in TSLA. Buyers may have been quietly scooping up available shares amid recession fears. When yesterday’s news suddenly shifted market sentiment, the “spring” uncoiled, catapulting TSLA’s share price upward.
However, the overall downtrend remains intact. If bullish momentum continues, the price may encounter resistance around the psychologically significant $300 level — which coincides with the upper boundary of the downward channel.
Trade global index CFDs with zero commission and tight spreads. Open your FXOpen account now or learn more about trading index CFDs with FXOpen.
CFDs are complex instruments and come with a high risk of losing your money.
This article represents the opinion of the Companies operating under the FXOpen brand only. It is not to be construed as an offer, solicitation, or recommendation with respect to products and services provided by the Companies operating under the FXOpen brand, nor is it to be considered financial advice.
👍3
#XAUUSD #goldprice #marketanalysis #MarketNews #commodities
Gold Price Surpasses $3,200 for the First Time in History
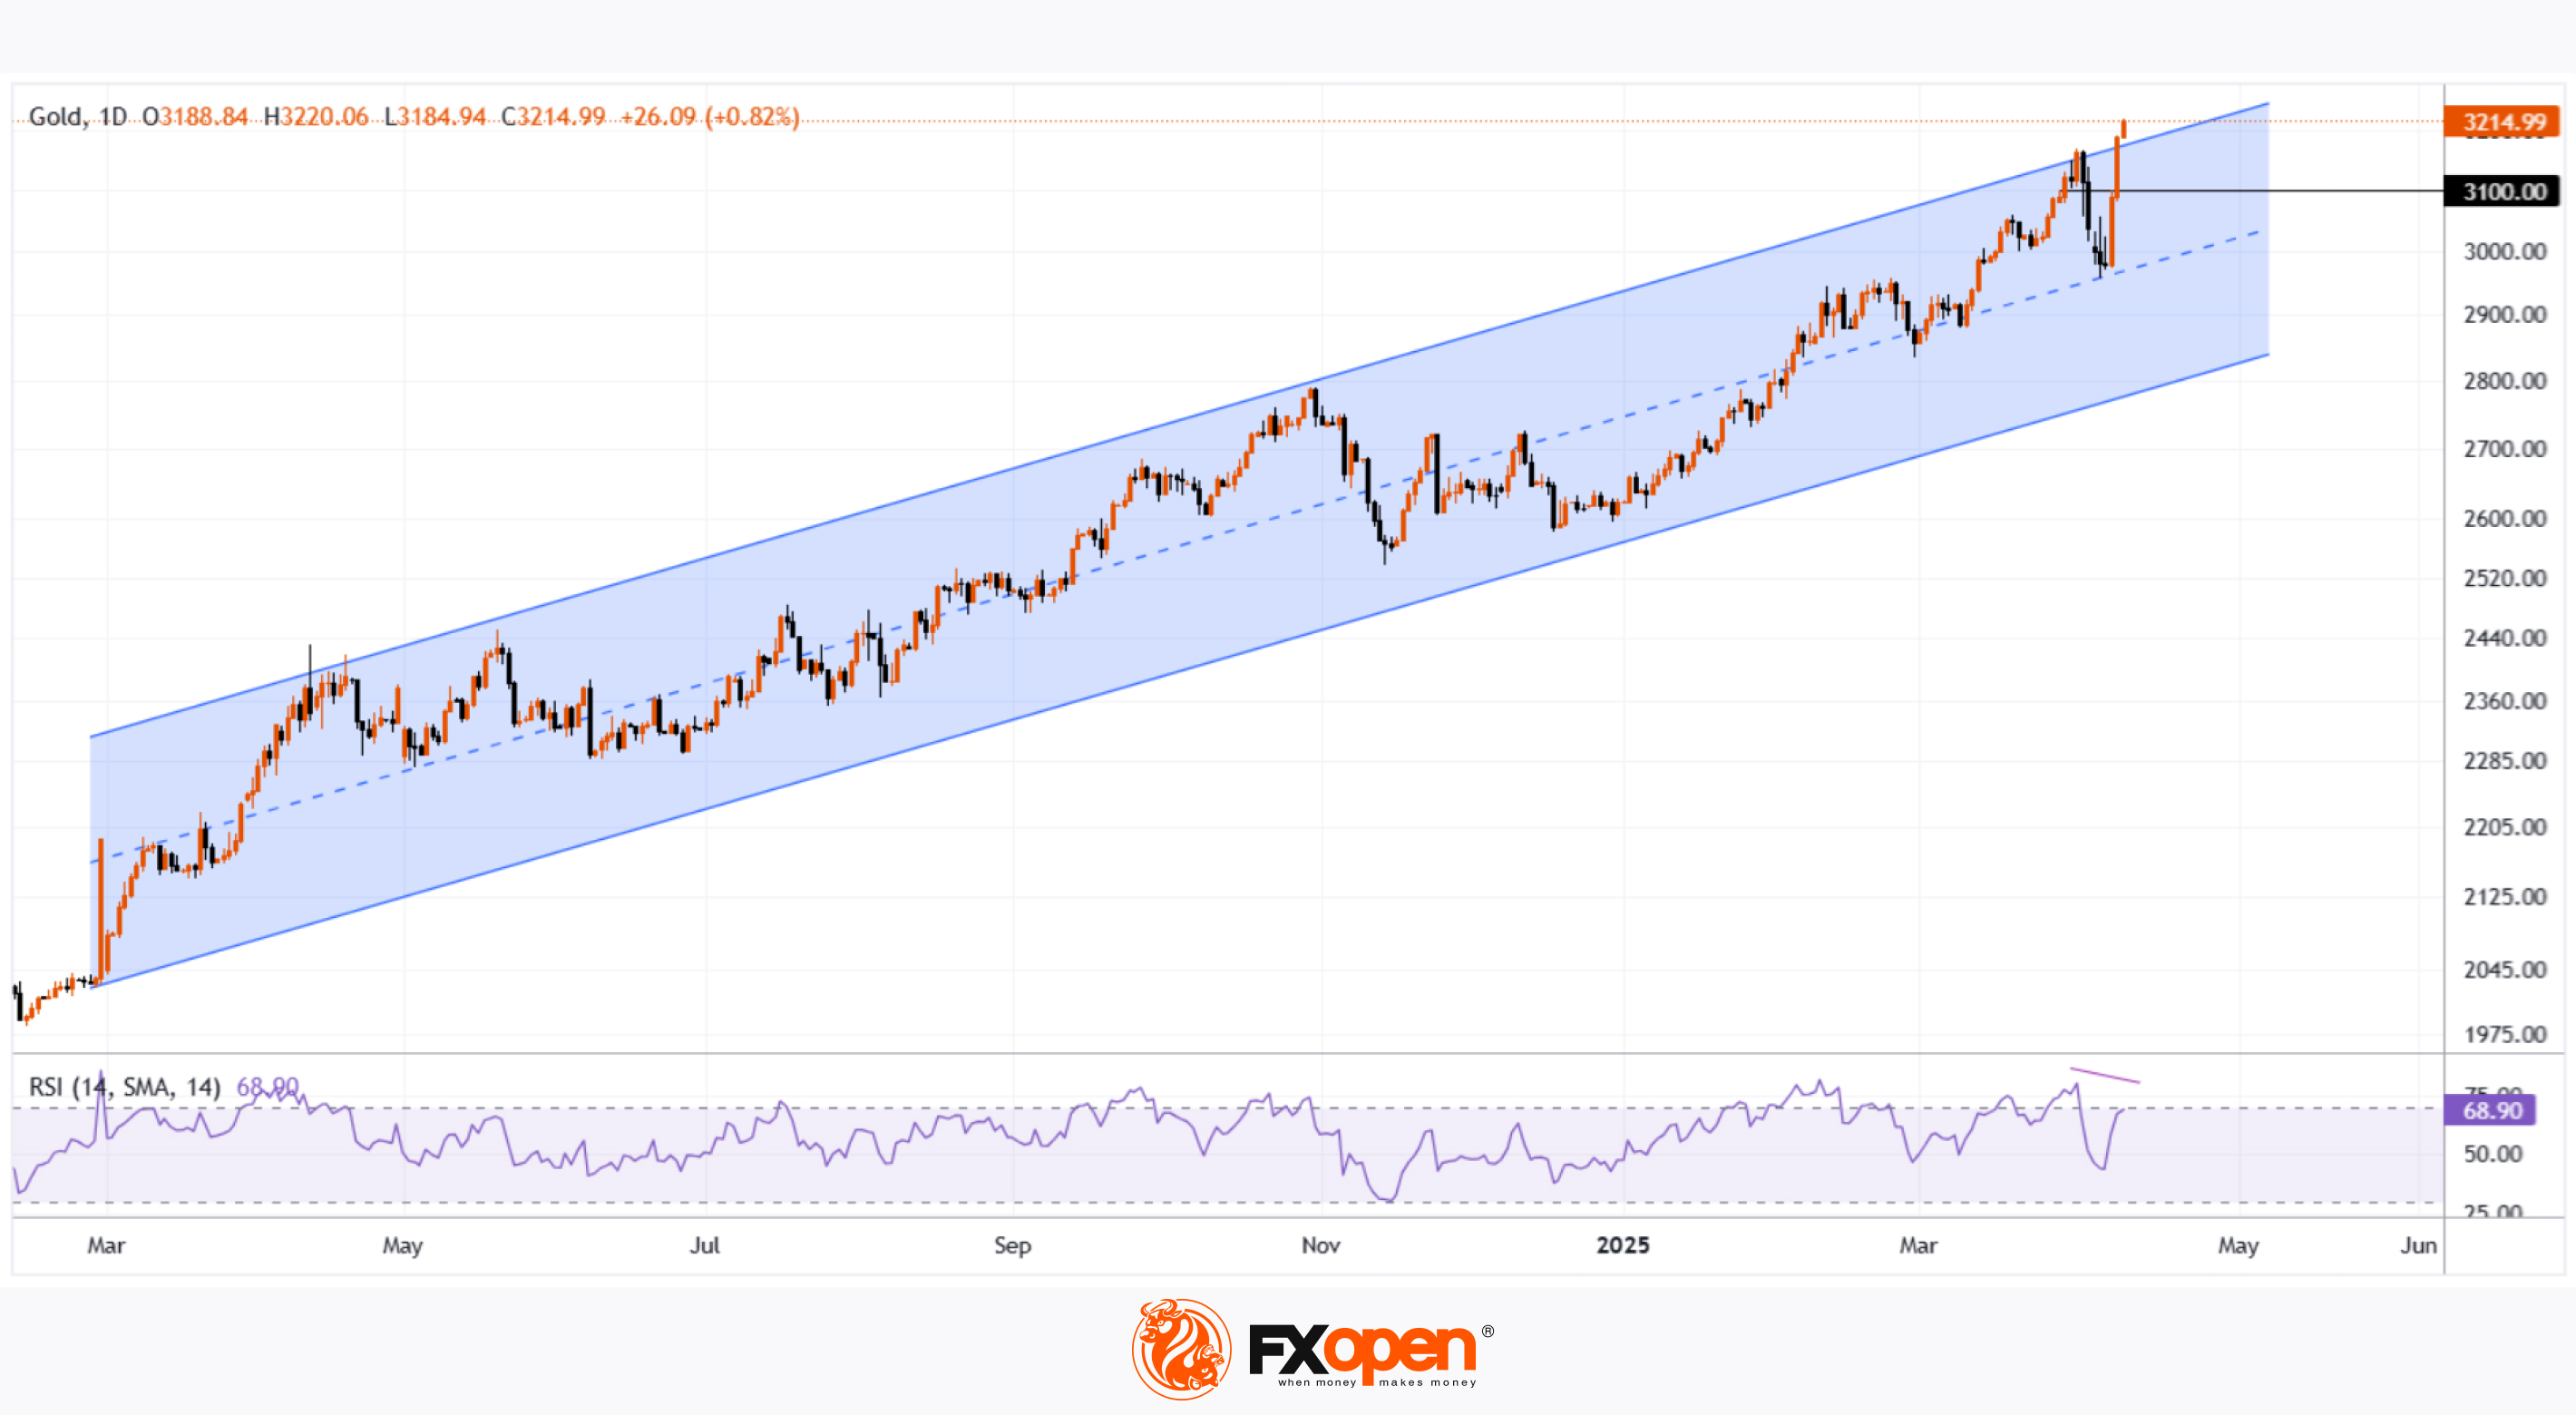
According to the XAU/USD chart today, the price of an ounce of gold is fluctuating above the $3,200 level on global exchanges — a level never reached before.
Since the beginning of 2025, gold has gained approximately 22%.
Why Is Gold Rising Today?
Today’s bullish momentum in the gold market is driven by two key factors.
First, inflation data. Figures released yesterday for the CPI (Consumer Price Index) revealed a slowdown in inflation in the United States. This suggests a greater likelihood of monetary policy easing by the Federal Reserve. According to Reuters, gold prices now reflect expectations of three interest rate cuts by the end of 2025 — and lower rates typically support a stronger XAU/USD.
Second, fears of a global recession. Although US President Donald Trump has introduced a 90-day delay on the implementation of international trade tariffs, this does not apply to China, where tariffs have been increased to a striking 145%. Traders fear that Beijing could retaliate by raising tariffs on US goods beyond the current 84%.
Technical Analysis of XAU/USD
At present, the gold market is showing strong upward momentum, which began in early March (as illustrated by the blue trend channel). Key points include:
→ A breakout above the upper boundary of the channel;
→ The RSI indicator suggests a potential bearish divergence forming.
This points to the possibility of a short-term pullback into the blue channel, which would be a natural correction — especially considering the rapid $200 surge from $3,000 to $3,200 over just two days. However, given the current news backdrop, it seems unlikely that the bulls will relinquish control anytime soon.
For long-term gold price forecasts → read the article: Analytical Gold Price Predictions for 2025 and Beyond.
Start trading commodities with tight spreads. Open your trading account now or learn more about trading commodity CFDs with FXOpen.
CFDs are complex instruments and come with a high risk of losing your money.
This article represents the opinion of the Companies operating under the FXOpen brand only. It is not to be construed as an offer, solicitation, or recommendation with respect to products and services provided by the Companies operating under the FXOpen brand, nor is it to be considered financial advice.
Gold Price Surpasses $3,200 for the First Time in History
According to the XAU/USD chart today, the price of an ounce of gold is fluctuating above the $3,200 level on global exchanges — a level never reached before.
Since the beginning of 2025, gold has gained approximately 22%.
Why Is Gold Rising Today?
Today’s bullish momentum in the gold market is driven by two key factors.
First, inflation data. Figures released yesterday for the CPI (Consumer Price Index) revealed a slowdown in inflation in the United States. This suggests a greater likelihood of monetary policy easing by the Federal Reserve. According to Reuters, gold prices now reflect expectations of three interest rate cuts by the end of 2025 — and lower rates typically support a stronger XAU/USD.
Second, fears of a global recession. Although US President Donald Trump has introduced a 90-day delay on the implementation of international trade tariffs, this does not apply to China, where tariffs have been increased to a striking 145%. Traders fear that Beijing could retaliate by raising tariffs on US goods beyond the current 84%.
Technical Analysis of XAU/USD
At present, the gold market is showing strong upward momentum, which began in early March (as illustrated by the blue trend channel). Key points include:
→ A breakout above the upper boundary of the channel;
→ The RSI indicator suggests a potential bearish divergence forming.
This points to the possibility of a short-term pullback into the blue channel, which would be a natural correction — especially considering the rapid $200 surge from $3,000 to $3,200 over just two days. However, given the current news backdrop, it seems unlikely that the bulls will relinquish control anytime soon.
For long-term gold price forecasts → read the article: Analytical Gold Price Predictions for 2025 and Beyond.
Start trading commodities with tight spreads. Open your trading account now or learn more about trading commodity CFDs with FXOpen.
CFDs are complex instruments and come with a high risk of losing your money.
This article represents the opinion of the Companies operating under the FXOpen brand only. It is not to be construed as an offer, solicitation, or recommendation with respect to products and services provided by the Companies operating under the FXOpen brand, nor is it to be considered financial advice.
👍2
📊 Will Gold Keep Climbing?
Gold has just hit a historic high of $3,200/oz! What's your outlook for the rest of 2025?
Gold has just hit a historic high of $3,200/oz! What's your outlook for the rest of 2025?
Anonymous Poll
40%
It’ll break $3,500 soon
20%
📉 A correction is coming
20%
Still bullish, but slow growth
20%
Too volatile to predict
#EURUSD #tradingtips #tradingforex #MarketUpdates
EUR/USD Hits Highest Level in Over Three Years
This morning, the euro surged above the 1.300 mark against the US dollar for the first time since February 2022.
Throughout this week, the EUR/USD pair has broken through the highs of both 2023 and 2024.
Why Is EUR/USD Rising?
Amid the whirlwind of news surrounding the imposition and suspension of tariffs in US–EU trade, one dominant factor stands out — the sell-off of US bonds.
According to Reuters, long-term US Treasury bonds are being heavily sold this week. The yield on 10-year notes has jumped from 3.9% to around 4.4%, marking the steepest increase in yields since 2001. This may reflect a reaction by foreign holders of US debt to sanctions imposed by the White House, combined with growing uncertainty about the US economy — especially as recession fears gain more media attention.
As a result, the US dollar is showing weakness against a range of currencies, including the Japanese yen, Swiss franc, and the euro.
Technical Analysis of EUR/USD
The chart reveals a clear ascending channel (marked in blue), with the price repeatedly interacting with its upper, lower, and median boundaries — highlighted with markers and arrows.
Current bullish sentiment has pushed the pair towards the upper boundary of this channel. It’s possible this resistance line could halt further gains, potentially leading to a correction — perhaps down to the 1.11 level, which previously acted as a strong resistance point.
Trade over 50 forex markets 24 hours a day with FXOpen. Take advantage of low commissions, deep liquidity, and spreads from 0.0 pips. Open your FXOpen account now or learn more about trading forex with FXOpen.
CFDs are complex instruments and come with a high risk of losing your money.
This article represents the opinion of the Companies operating under the FXOpen brand only. It is not to be construed as an offer, solicitation, or recommendation with respect to products and services provided by the Companies operating under the FXOpen brand, nor is it to be considered financial advice.
EUR/USD Hits Highest Level in Over Three Years
This morning, the euro surged above the 1.300 mark against the US dollar for the first time since February 2022.
Throughout this week, the EUR/USD pair has broken through the highs of both 2023 and 2024.
Why Is EUR/USD Rising?
Amid the whirlwind of news surrounding the imposition and suspension of tariffs in US–EU trade, one dominant factor stands out — the sell-off of US bonds.
According to Reuters, long-term US Treasury bonds are being heavily sold this week. The yield on 10-year notes has jumped from 3.9% to around 4.4%, marking the steepest increase in yields since 2001. This may reflect a reaction by foreign holders of US debt to sanctions imposed by the White House, combined with growing uncertainty about the US economy — especially as recession fears gain more media attention.
As a result, the US dollar is showing weakness against a range of currencies, including the Japanese yen, Swiss franc, and the euro.
Technical Analysis of EUR/USD
The chart reveals a clear ascending channel (marked in blue), with the price repeatedly interacting with its upper, lower, and median boundaries — highlighted with markers and arrows.
Current bullish sentiment has pushed the pair towards the upper boundary of this channel. It’s possible this resistance line could halt further gains, potentially leading to a correction — perhaps down to the 1.11 level, which previously acted as a strong resistance point.
Trade over 50 forex markets 24 hours a day with FXOpen. Take advantage of low commissions, deep liquidity, and spreads from 0.0 pips. Open your FXOpen account now or learn more about trading forex with FXOpen.
CFDs are complex instruments and come with a high risk of losing your money.
This article represents the opinion of the Companies operating under the FXOpen brand only. It is not to be construed as an offer, solicitation, or recommendation with respect to products and services provided by the Companies operating under the FXOpen brand, nor is it to be considered financial advice.

👍2
#marketanalysis #MarketNews #stockmarket #stocktrading
Trump Exempts Electronics from Tariffs; Nasdaq 100 Opens with Bullish Gap
Despite the weekend, the news flow remained intense amid the escalating trade war. According to media reports:
→ Certain tech products, including those made by Apple, have been exempted from Trump’s tariffs.
→ Trump announced he would make a significant statement regarding semiconductor tariffs on Monday, 14 April.
Stock Indices React to Trump’s Tariff Moves
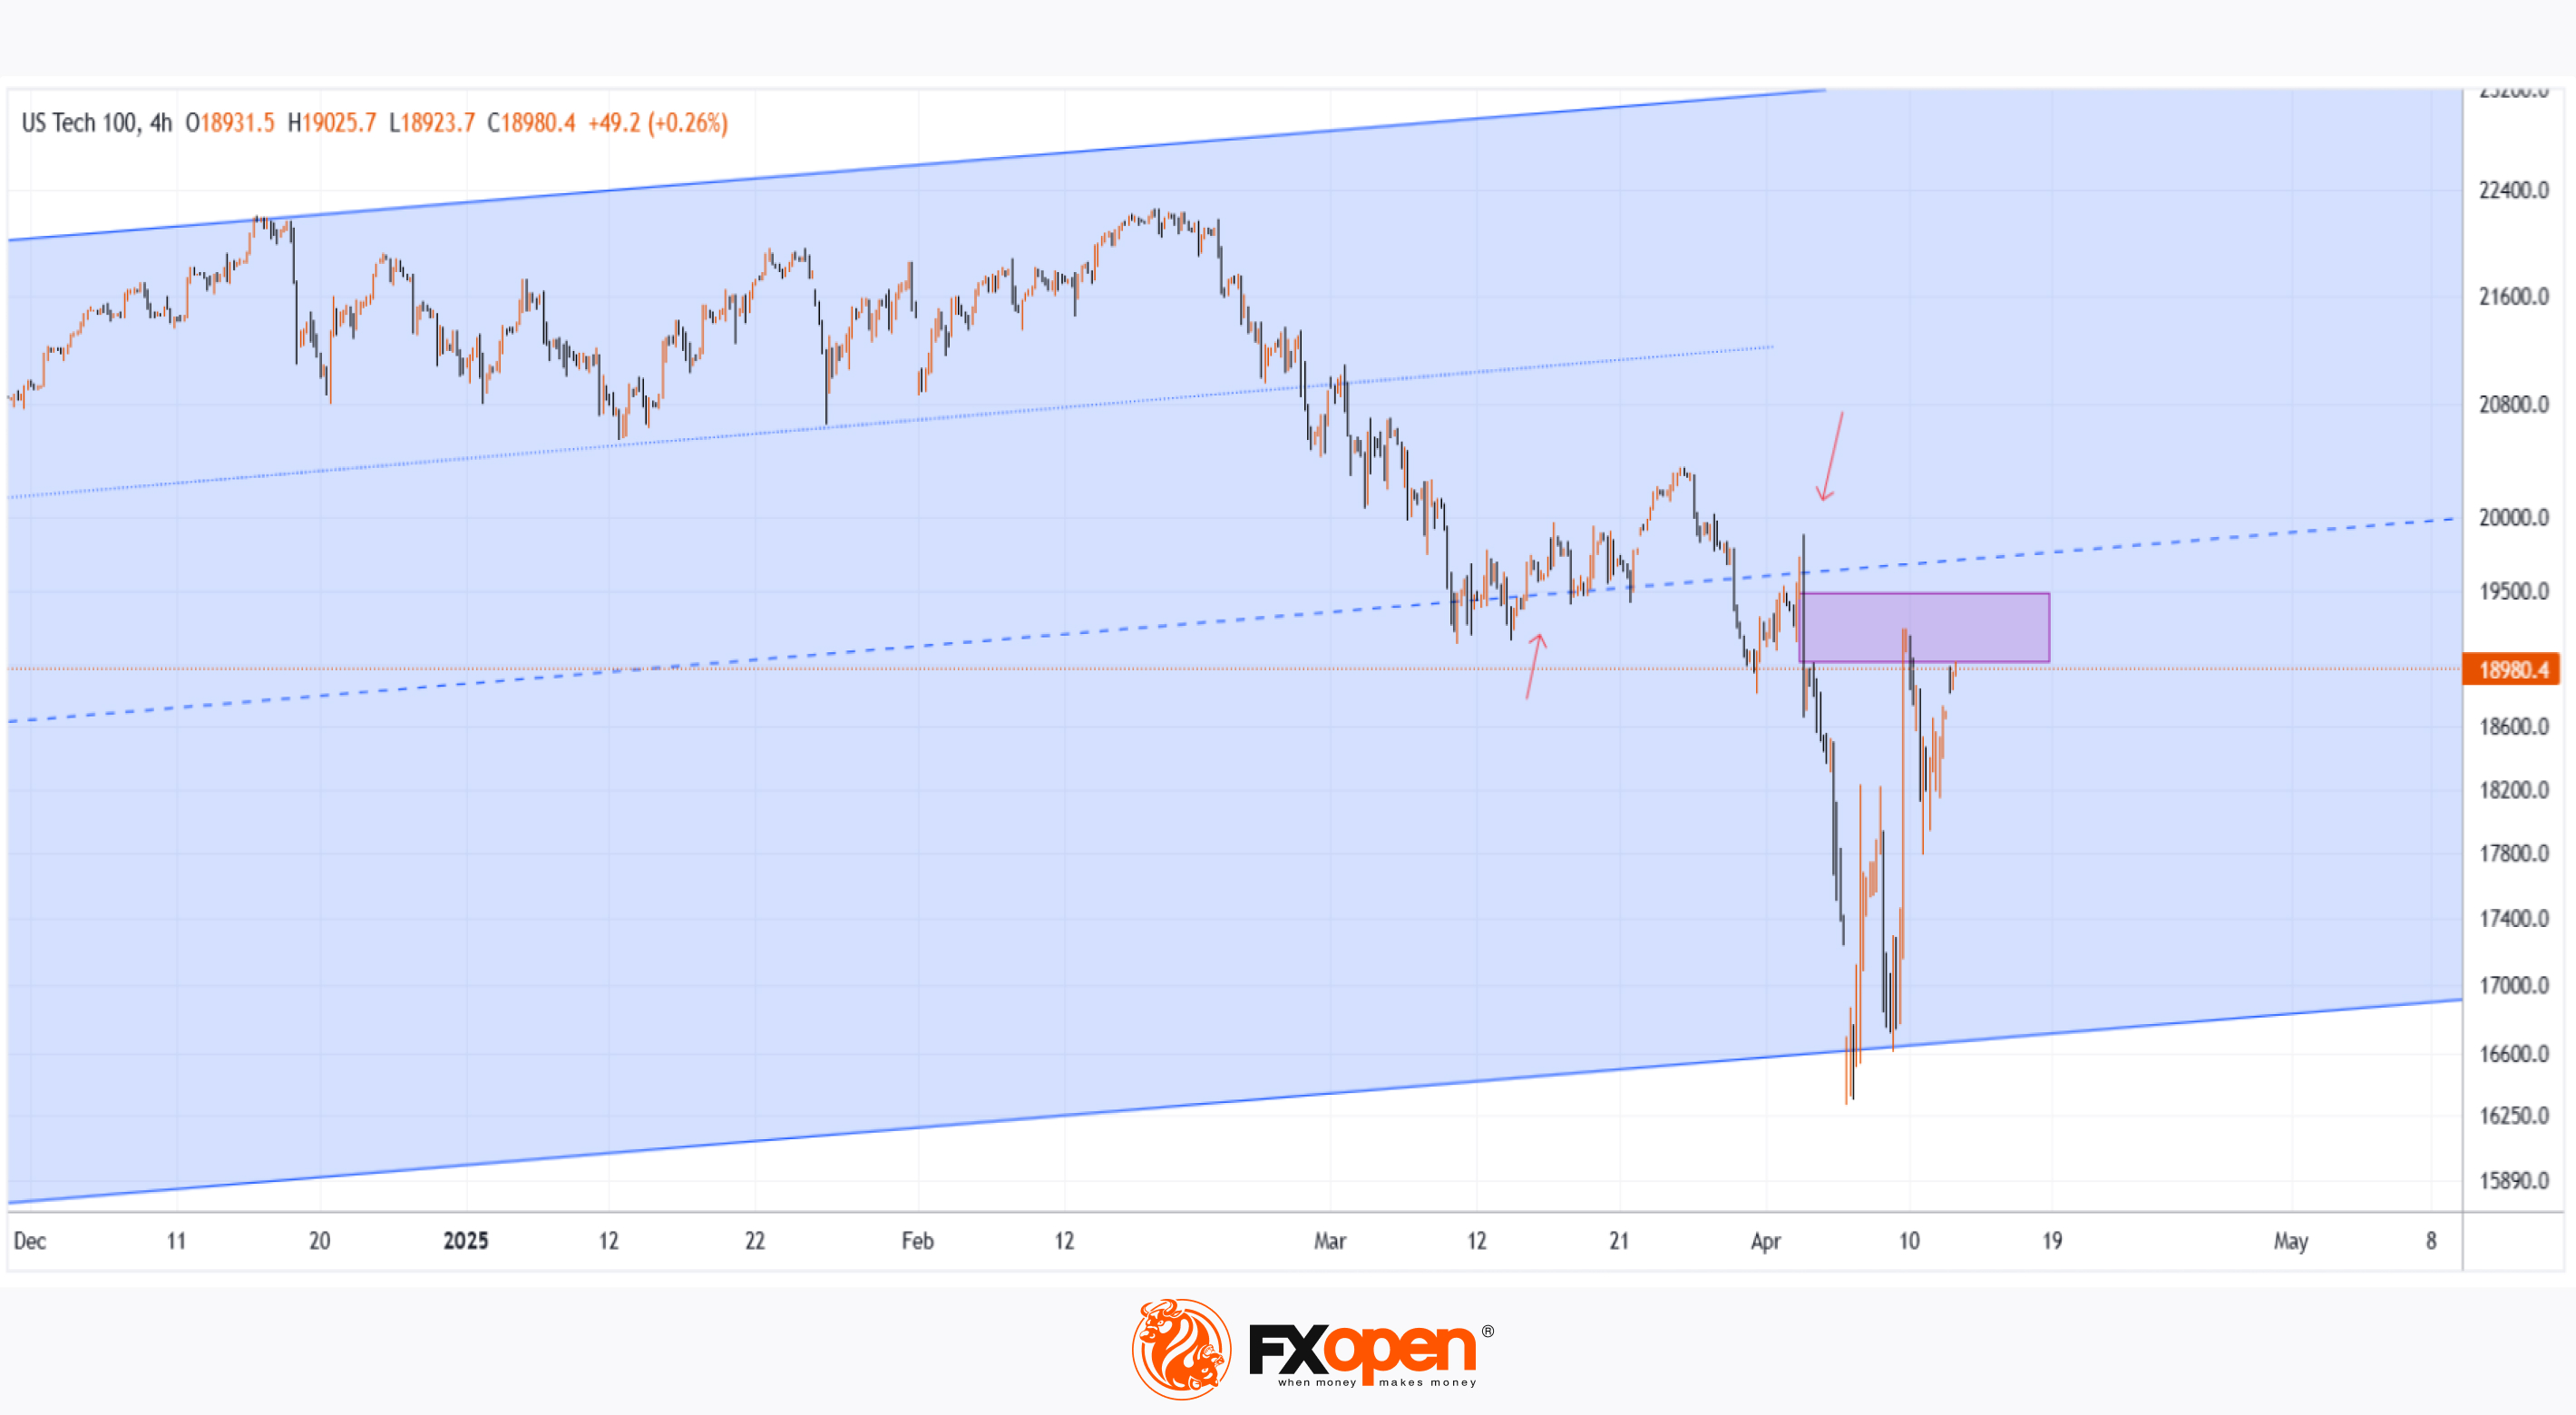
These announcements were taken positively by the markets. As shown on the chart of the Nasdaq 100 index (US Tech 100 mini on FXOpen), the new week opened with a bullish gap exceeding 1.5% – a stronger performance than the S&P 500 (US SPX 500 mini on FXOpen), which also saw a bullish gap.
This may suggest that market participants are cautiously optimistic that the sweeping tariff measures might be eased through exemptions, delays, or negotiation concessions. Nevertheless, the CNN Business Fear & Greed Index remains in "extreme fear" territory, despite inching higher compared to last week.
As of this morning, the Nasdaq 100 (US Tech 100 mini on FXOpen) has recovered approximately 15% from its 2025 low.
Trade global index CFDs with zero commission and tight spreads. Open your FXOpen account now or learn more about trading index CFDs with FXOpen.
CFDs are complex instruments and come with a high risk of losing your money.
This article represents the opinion of the Companies operating under the FXOpen brand only. It is not to be construed as an offer, solicitation, or recommendation with respect to products and services provided by the Companies operating under the FXOpen brand, nor is it to be considered financial advice.
Trump Exempts Electronics from Tariffs; Nasdaq 100 Opens with Bullish Gap
Despite the weekend, the news flow remained intense amid the escalating trade war. According to media reports:
→ Certain tech products, including those made by Apple, have been exempted from Trump’s tariffs.
→ Trump announced he would make a significant statement regarding semiconductor tariffs on Monday, 14 April.
Stock Indices React to Trump’s Tariff Moves
These announcements were taken positively by the markets. As shown on the chart of the Nasdaq 100 index (US Tech 100 mini on FXOpen), the new week opened with a bullish gap exceeding 1.5% – a stronger performance than the S&P 500 (US SPX 500 mini on FXOpen), which also saw a bullish gap.
This may suggest that market participants are cautiously optimistic that the sweeping tariff measures might be eased through exemptions, delays, or negotiation concessions. Nevertheless, the CNN Business Fear & Greed Index remains in "extreme fear" territory, despite inching higher compared to last week.
As of this morning, the Nasdaq 100 (US Tech 100 mini on FXOpen) has recovered approximately 15% from its 2025 low.
Trade global index CFDs with zero commission and tight spreads. Open your FXOpen account now or learn more about trading index CFDs with FXOpen.
CFDs are complex instruments and come with a high risk of losing your money.
This article represents the opinion of the Companies operating under the FXOpen brand only. It is not to be construed as an offer, solicitation, or recommendation with respect to products and services provided by the Companies operating under the FXOpen brand, nor is it to be considered financial advice.
👍2
#Economy #Finance #Investing #StockMarket #Inflation #InterestRates #GlobalEconomy #BankOfEngland #ECB
Market Insights with Gary Thomson: UK & Canada Inflation, BOC & ECB Rates, Corporate Earnings
In this video, we’ll explore the key economic events, market trends, and corporate news shaping the financial landscape. Get ready for expert insights into forex, commodities, and stocks to help you navigate the week ahead. Let’s dive in!
In this episode, we discuss:
🔸 UK’s Unemployment and Inflation Rates
With the Bank of England’s rate decision due on May 8, this week’s UK labour and inflation data could stir volatility. Will wage growth and inflation trends push the BoE to delay rate cuts, or is a shift in policy on the horizon?
🔸 Inflation Rate in Canada & BOC Interest Rate Decision
With inflation climbing and job losses mounting, Canada’s economy faces mixed signals ahead of the BoC’s rate decision. Will policymakers prioritize inflation control or economic support?
🔸ECB Interest Rate Decision
With the ECB likely to cut rates again, attention turns to the press conference for clues on future policy. Will Lagarde strike a dovish or hawkish tone?
🔸 Corporate Earnings Statements
Big names like Goldman Sachs, Johnson & Johnson, Bank of America, and Netflix are releasing their Q1 2025 results. Will earnings boost confidence or deepen market jitters?
Don’t miss out—gain insights to stay ahead in your trading journey.
https://cutt.ly/MrfH7j4X
To take advantage of price fluctuations in the foreign exchange markets, consider enlisting the services of a reliable broker like FXOpen.
⚠️
This forecast represents FXOpen Companies opinion only, it should not be construed as an offer, invitation or recommendation in respect to FXOpen Companies products and services or as financial advice.
Market Insights with Gary Thomson: UK & Canada Inflation, BOC & ECB Rates, Corporate Earnings
In this video, we’ll explore the key economic events, market trends, and corporate news shaping the financial landscape. Get ready for expert insights into forex, commodities, and stocks to help you navigate the week ahead. Let’s dive in!
In this episode, we discuss:
🔸 UK’s Unemployment and Inflation Rates
With the Bank of England’s rate decision due on May 8, this week’s UK labour and inflation data could stir volatility. Will wage growth and inflation trends push the BoE to delay rate cuts, or is a shift in policy on the horizon?
🔸 Inflation Rate in Canada & BOC Interest Rate Decision
With inflation climbing and job losses mounting, Canada’s economy faces mixed signals ahead of the BoC’s rate decision. Will policymakers prioritize inflation control or economic support?
🔸ECB Interest Rate Decision
With the ECB likely to cut rates again, attention turns to the press conference for clues on future policy. Will Lagarde strike a dovish or hawkish tone?
🔸 Corporate Earnings Statements
Big names like Goldman Sachs, Johnson & Johnson, Bank of America, and Netflix are releasing their Q1 2025 results. Will earnings boost confidence or deepen market jitters?
Don’t miss out—gain insights to stay ahead in your trading journey.
https://cutt.ly/MrfH7j4X
To take advantage of price fluctuations in the foreign exchange markets, consider enlisting the services of a reliable broker like FXOpen.
⚠️
This forecast represents FXOpen Companies opinion only, it should not be construed as an offer, invitation or recommendation in respect to FXOpen Companies products and services or as financial advice.
YouTube
Market Insights with Gary Thomson: UK & Canada Inflation, BOC & ECB Rates, Corporate Earnings
In this video, we’ll explore the key economic events, market trends, and corporate news shaping the financial landscape. Get ready for expert insights into forex, commodities, and stocks to help you navigate the week ahead. Let’s dive in!
In this episode…
In this episode…
👍2
#oilprices #brentoil #commodities #MarketUpdates #marketanalysis
Brent Crude Price Consolidates
When analysing the Brent crude oil price chart six days ago, we:
→ identified a downward channel marked in red;
→ noted that the median line was acting as resistance;
→ suggested the price could find support at the lower boundary of the channel, reinforced by the psychological $60 per barrel level.
As shown on the XBR/USD chart, since then:
→ the price has indeed rebounded from the lower boundary (as indicated by the arrow), rising from its lowest level in nearly four years;
→ the median line has reaffirmed its role as resistance (highlighted by the marker).
Why Is Oil Consolidating?
From a technical perspective, several indicators suggest the market is consolidating. Notably, both the ADX and ATR indicators are trending downwards, which may be interpreted as a weakening of price momentum and volatility. Additionally, Brent’s price currently hovers around the channel’s median line — a level where supply and demand often reach equilibrium.
From a fundamental standpoint, it’s reasonable to assume that the current price has already factored in the latest developments surrounding the global trade war. However, another round of bold statements from the White House could still trigger a fresh move on the XBR/USD chart.
Start trading commodities with tight spreads. Open your trading account now or learn more about trading commodity CFDs with FXOpen.
CFDs are complex instruments and come with a high risk of losing your money.
This article represents the opinion of the Companies operating under the FXOpen brand only. It is not to be construed as an offer, solicitation, or recommendation with respect to products and services provided by the Companies operating under the FXOpen brand, nor is it to be considered financial advice.
Brent Crude Price Consolidates
When analysing the Brent crude oil price chart six days ago, we:
→ identified a downward channel marked in red;
→ noted that the median line was acting as resistance;
→ suggested the price could find support at the lower boundary of the channel, reinforced by the psychological $60 per barrel level.
As shown on the XBR/USD chart, since then:
→ the price has indeed rebounded from the lower boundary (as indicated by the arrow), rising from its lowest level in nearly four years;
→ the median line has reaffirmed its role as resistance (highlighted by the marker).
Why Is Oil Consolidating?
From a technical perspective, several indicators suggest the market is consolidating. Notably, both the ADX and ATR indicators are trending downwards, which may be interpreted as a weakening of price momentum and volatility. Additionally, Brent’s price currently hovers around the channel’s median line — a level where supply and demand often reach equilibrium.
From a fundamental standpoint, it’s reasonable to assume that the current price has already factored in the latest developments surrounding the global trade war. However, another round of bold statements from the White House could still trigger a fresh move on the XBR/USD chart.
Start trading commodities with tight spreads. Open your trading account now or learn more about trading commodity CFDs with FXOpen.
CFDs are complex instruments and come with a high risk of losing your money.
This article represents the opinion of the Companies operating under the FXOpen brand only. It is not to be construed as an offer, solicitation, or recommendation with respect to products and services provided by the Companies operating under the FXOpen brand, nor is it to be considered financial advice.
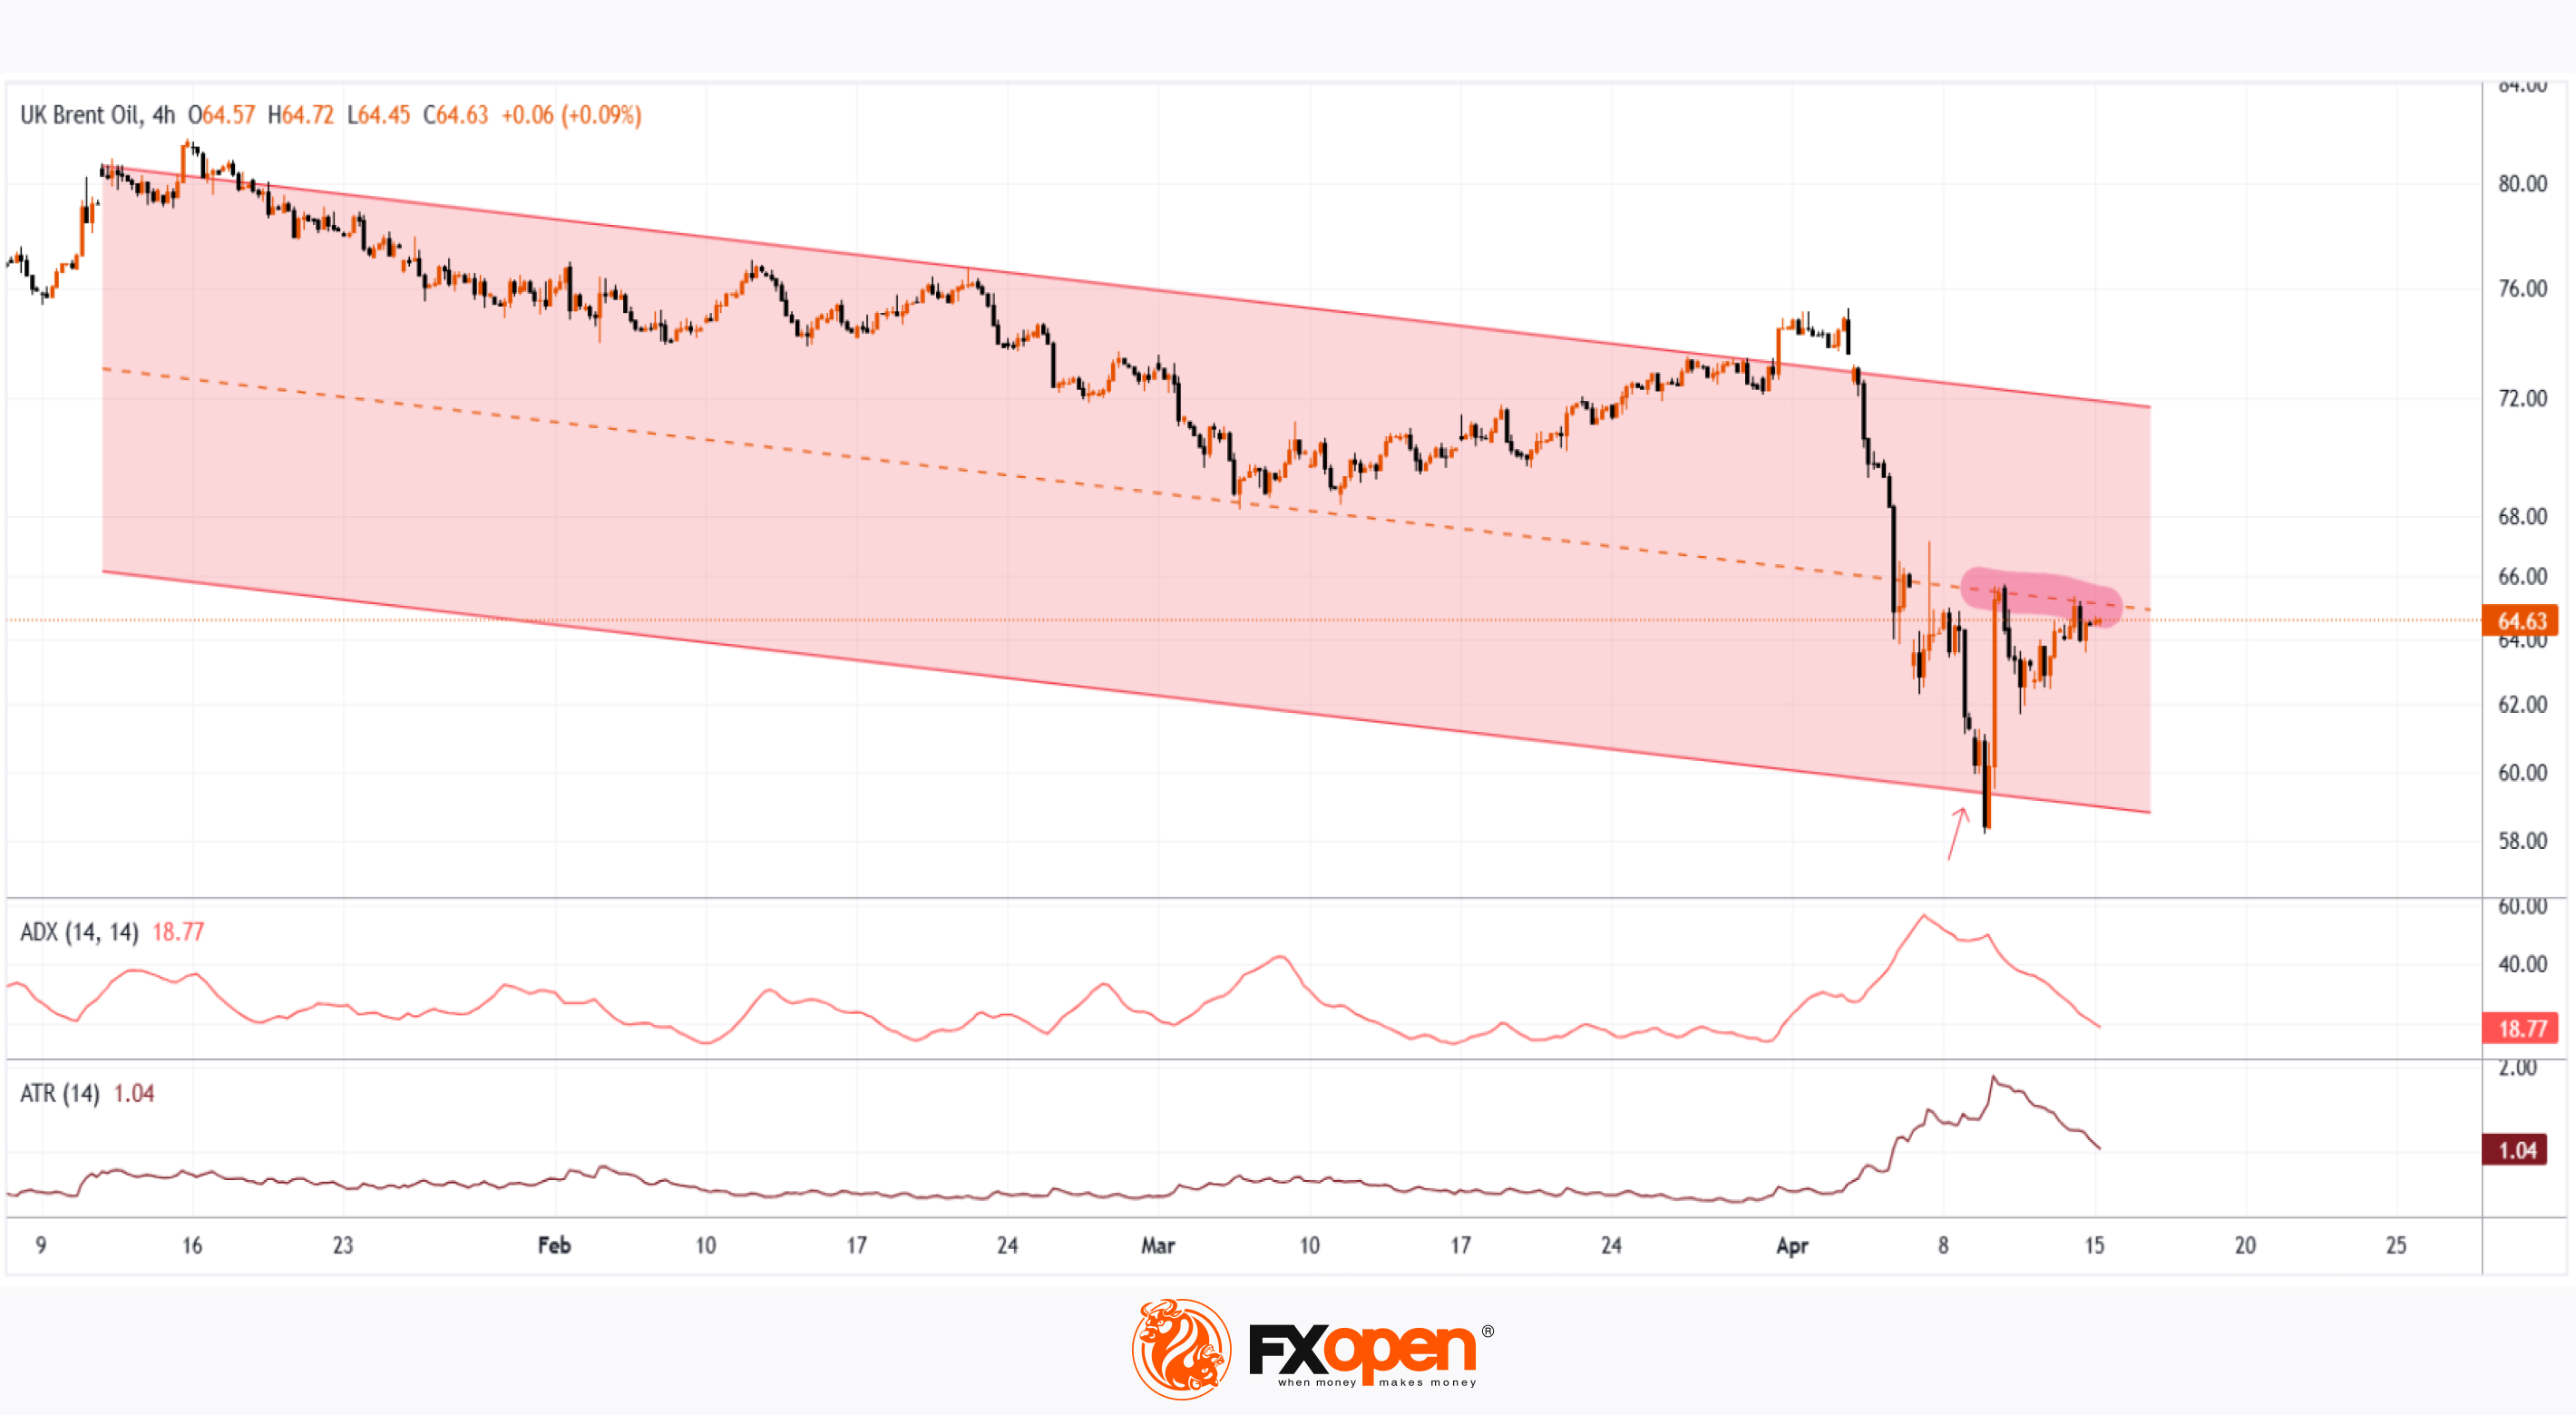
👍3
#stockmarket #stocktrading #marketanalysis #MarketUpdates
Walmart (WMT) shares reach highest level since early March
As shown on the chart of Walmart (WMT) shares, trading closed yesterday above the $94 mark – a level not seen since the beginning of March. This means that since the start of 2025, Walmart’s share price has risen by approximately 5.5%.
This positive trend stands in stark contrast to the S&P 500 index (US SPX 500 mini on FXOpen), which has declined by more than 8% over the same period.
Why are Walmart (WMT) shares outperforming the index?
Apparently, from the market’s point of view, this is due to the fact that Walmart’s supermarkets are a source of essential goods for Americans, giving the company an advantage in a scenario where the US economy may slide into recession.
According to Mizuho Bank analyst David Bellinger, Walmart is a sensible choice for investors trying to stay afloat in a volatile market. He forecasts that WMT’s share price could rise to $105 – around 15% higher than its current level.
Bellinger notes that Walmart continues to attract price-conscious shoppers and has made significant progress in e-commerce, helping the company remain resilient even amid the prospect of economic slowdown.
Technical analysis of Walmart (WMT) shares
The chart shows that the share price is moving within a long-term upward trend. The black dashed line, which had acted as support for many months, has been broken:
- This suggests that the line may now act as a median;
- Allowed us to widen the channel and find its lower boundary, which is expected to offer support.
Indeed, the lower boundary of the expanded channel provided support in the first half of April, with particular attention drawn to the large bullish candlestick on 9 April (marked with an arrow). According to the NYSE, over 46 million shares were traded on that day – more than twice the average volume. This highlights the strength of demand.
It is possible that WMT shares may continue to outperform the index going forward, forming fluctuations while:
→ receiving support from the psychological $90 level (previously a resistance point);
→ gradually approaching the median of the aforementioned channel.
Trade global index CFDs with zero commission and tight spreads. Open your FXOpen account now or learn more about trading index CFDs with FXOpen.
CFDs are complex instruments and come with a high risk of losing your money.
This article represents the opinion of the Companies operating under the FXOpen brand only. It is not to be construed as an offer, solicitation, or recommendation with respect to products and services provided by the Companies operating under the FXOpen brand, nor is it to be considered financial advice.
Walmart (WMT) shares reach highest level since early March
As shown on the chart of Walmart (WMT) shares, trading closed yesterday above the $94 mark – a level not seen since the beginning of March. This means that since the start of 2025, Walmart’s share price has risen by approximately 5.5%.
This positive trend stands in stark contrast to the S&P 500 index (US SPX 500 mini on FXOpen), which has declined by more than 8% over the same period.
Why are Walmart (WMT) shares outperforming the index?
Apparently, from the market’s point of view, this is due to the fact that Walmart’s supermarkets are a source of essential goods for Americans, giving the company an advantage in a scenario where the US economy may slide into recession.
According to Mizuho Bank analyst David Bellinger, Walmart is a sensible choice for investors trying to stay afloat in a volatile market. He forecasts that WMT’s share price could rise to $105 – around 15% higher than its current level.
Bellinger notes that Walmart continues to attract price-conscious shoppers and has made significant progress in e-commerce, helping the company remain resilient even amid the prospect of economic slowdown.
Technical analysis of Walmart (WMT) shares
The chart shows that the share price is moving within a long-term upward trend. The black dashed line, which had acted as support for many months, has been broken:
- This suggests that the line may now act as a median;
- Allowed us to widen the channel and find its lower boundary, which is expected to offer support.
Indeed, the lower boundary of the expanded channel provided support in the first half of April, with particular attention drawn to the large bullish candlestick on 9 April (marked with an arrow). According to the NYSE, over 46 million shares were traded on that day – more than twice the average volume. This highlights the strength of demand.
It is possible that WMT shares may continue to outperform the index going forward, forming fluctuations while:
→ receiving support from the psychological $90 level (previously a resistance point);
→ gradually approaching the median of the aforementioned channel.
Trade global index CFDs with zero commission and tight spreads. Open your FXOpen account now or learn more about trading index CFDs with FXOpen.
CFDs are complex instruments and come with a high risk of losing your money.
This article represents the opinion of the Companies operating under the FXOpen brand only. It is not to be construed as an offer, solicitation, or recommendation with respect to products and services provided by the Companies operating under the FXOpen brand, nor is it to be considered financial advice.

👍3
#NFLX #netflix #stocktrading #stockmarket #MarketUpdates #marketanalysis
Netflix (NFLX) Share Price Jumps Nearly 5%
According to the charts, Netflix (NFLX) shares rose to their highest level since early April, while the S&P 500 index (US SPX 500 mini on FXOpen) declined by approximately 0.2% yesterday.
Since the beginning of 2025, NFLX’s share price has increased by more than 8%, showing resilience in a volatile stock market that remains sensitive to the escalation of the global trade war.
Why Is Netflix (NFLX) Gaining in Value?
The strong performance may be attributed to three key factors:
▪️Jason Helfstein, an analyst at financial holding company Oppenheimer, believes the company likely faces “limited” risks. Netflix does not sell tradeable goods subject to tariffs and could even benefit from a potential economic downturn if consumers opt to stay home more often.
▪️According to The Wall Street Journal, Netflix has set a target of reaching a market capitalisation of $1 trillion and doubling its revenue to $39 billion by 2030.
▪️Positive sentiment ahead of the earnings report – yes, Netflix is one of the first to release its quarterly results.
Technical Analysis of NFLX Share Chart
The share price is moving within an upward channel (shown in blue), with strong support in 2025 provided by both the lower boundary of the channel and the $840 level – a level originating from the powerful rally at the end of 2024.
On the other hand, the price has now approached the psychological $1000 level. It is possible that, in light of the upcoming earnings release (scheduled for tomorrow, 17 April), the bulls may attempt a breakout and aim to secure a foothold in the upper half of the channel.
Trade global index CFDs with zero commission and tight spreads. Open your FXOpen account now or learn more about trading index CFDs with FXOpen.
CFDs are complex instruments and come with a high risk of losing your money.
This article represents the opinion of the Companies operating under the FXOpen brand only. It is not to be construed as an offer, solicitation, or recommendation with respect to products and services provided by the Companies operating under the FXOpen brand, nor is it to be considered financial advice.
Netflix (NFLX) Share Price Jumps Nearly 5%
According to the charts, Netflix (NFLX) shares rose to their highest level since early April, while the S&P 500 index (US SPX 500 mini on FXOpen) declined by approximately 0.2% yesterday.
Since the beginning of 2025, NFLX’s share price has increased by more than 8%, showing resilience in a volatile stock market that remains sensitive to the escalation of the global trade war.
Why Is Netflix (NFLX) Gaining in Value?
The strong performance may be attributed to three key factors:
▪️Jason Helfstein, an analyst at financial holding company Oppenheimer, believes the company likely faces “limited” risks. Netflix does not sell tradeable goods subject to tariffs and could even benefit from a potential economic downturn if consumers opt to stay home more often.
▪️According to The Wall Street Journal, Netflix has set a target of reaching a market capitalisation of $1 trillion and doubling its revenue to $39 billion by 2030.
▪️Positive sentiment ahead of the earnings report – yes, Netflix is one of the first to release its quarterly results.
Technical Analysis of NFLX Share Chart
The share price is moving within an upward channel (shown in blue), with strong support in 2025 provided by both the lower boundary of the channel and the $840 level – a level originating from the powerful rally at the end of 2024.
On the other hand, the price has now approached the psychological $1000 level. It is possible that, in light of the upcoming earnings release (scheduled for tomorrow, 17 April), the bulls may attempt a breakout and aim to secure a foothold in the upper half of the channel.
Trade global index CFDs with zero commission and tight spreads. Open your FXOpen account now or learn more about trading index CFDs with FXOpen.
CFDs are complex instruments and come with a high risk of losing your money.
This article represents the opinion of the Companies operating under the FXOpen brand only. It is not to be construed as an offer, solicitation, or recommendation with respect to products and services provided by the Companies operating under the FXOpen brand, nor is it to be considered financial advice.

👍2