
Inflation in the UK Has Fallen
According to Forex Factory, the Consumer Price Index (CPI) reading came in below expectations: while analysts had forecast a decline to 2.7% year-on-year from the previous 2.8%, the actual CPI figure was 2.6%.
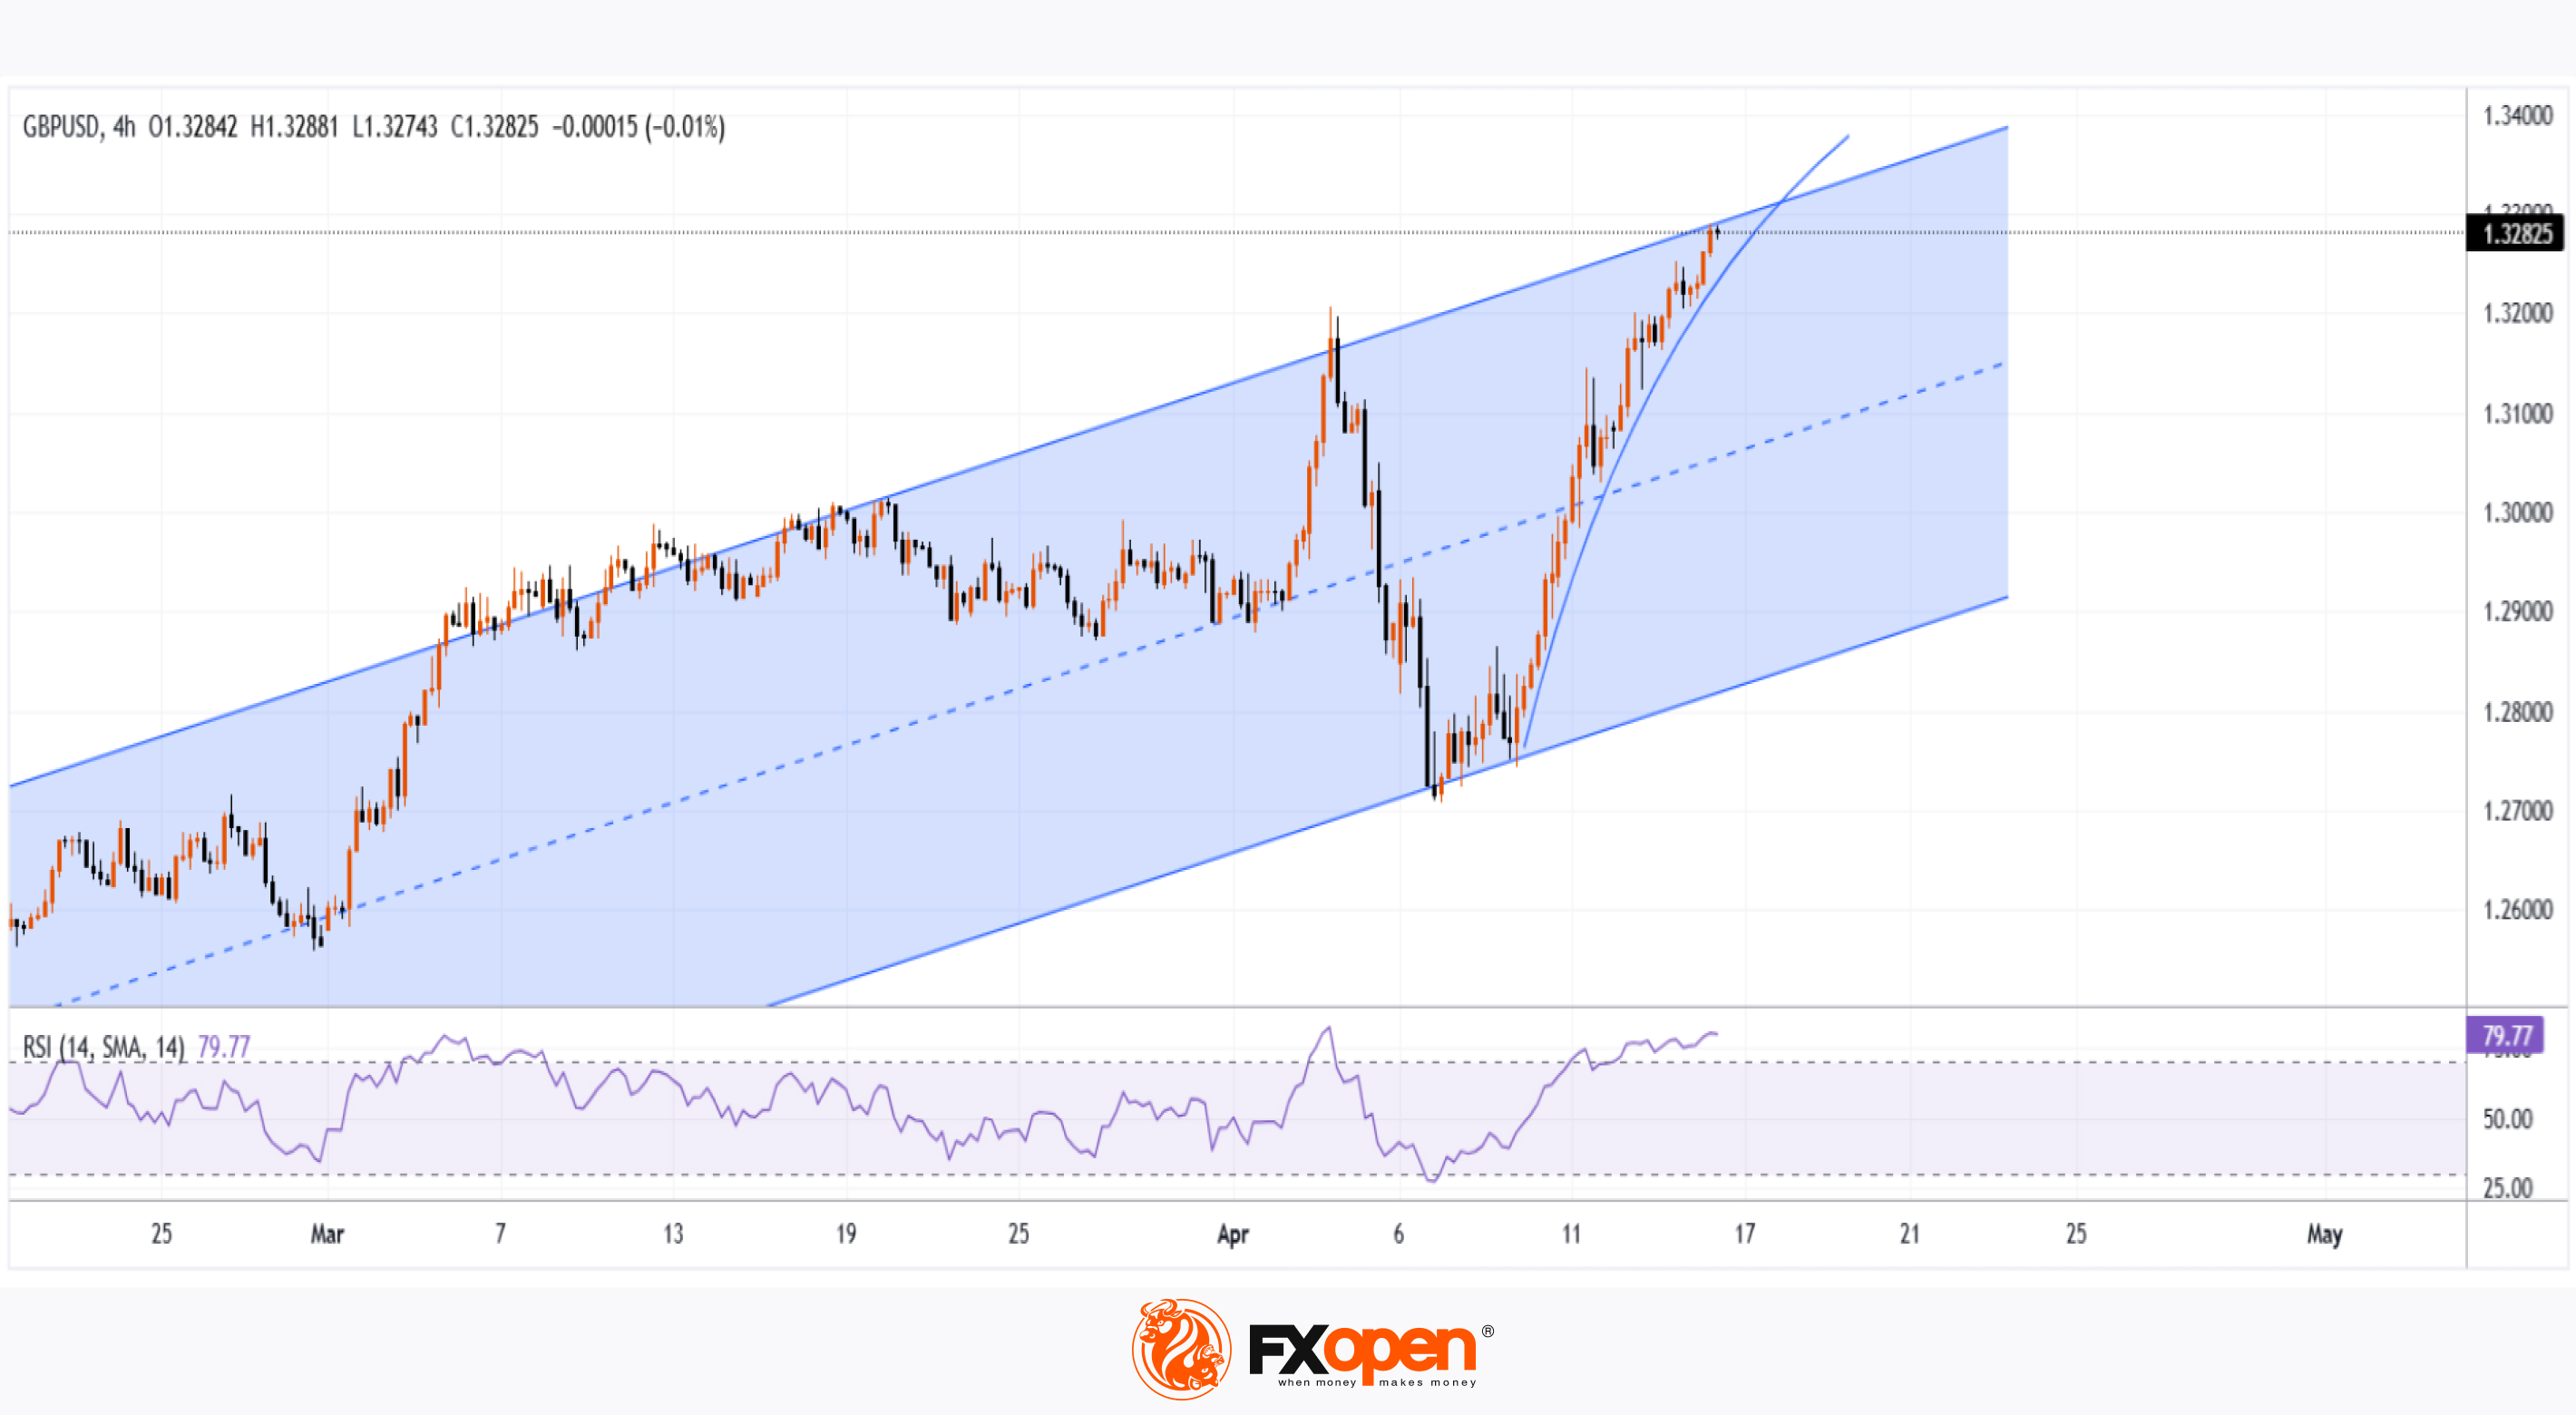
Following the release of this news, the GBP/USD exchange rate rose to 1.3280 – the highest level in seven months.
On the one hand, falling inflation is a sign of a healthy economy and a relief for the Bank of England, especially considering that CPI stood in double digits just two years ago. As a result, analysts may now predict that interest rates could be cut at the meeting scheduled for 8 May.
On the other hand, demand for the dollar remains volatile due to Trump’s tariff policies, fears of a US recession, and a wave of bond sell-offs.
Technical Analysis of the GBP/USD Chart
In just one week, the pound-to-dollar rate has risen by approximately 4.2%, with the RSI indicator now hovering near extreme overbought levels. Furthermore, the price is approaching the upper boundary of the ascending channel, which has been in play since the beginning of 2025.
In such conditions, a correction (with a bearish breakout of the ascending trendline, shown in blue) appears a logical development. However, a key factor in sustaining the current trend of dollar weakness could be the speech by Federal Reserve Chair Jerome Powell, scheduled for today at 20:30 GMT+3.
Trade global index CFDs with zero commission and tight spreads. Open your FXOpen account now or learn more about trading index CFDs with FXOpen.
CFDs are complex instruments and come with a high risk of losing your money.
This article represents the opinion of the Companies operating under the FXOpen brand only. It is not to be construed as an offer, solicitation, or recommendation with respect to products and services provided by the Companies operating under the FXOpen brand, nor is it to be considered financial advice.
According to Forex Factory, the Consumer Price Index (CPI) reading came in below expectations: while analysts had forecast a decline to 2.7% year-on-year from the previous 2.8%, the actual CPI figure was 2.6%.
Following the release of this news, the GBP/USD exchange rate rose to 1.3280 – the highest level in seven months.
On the one hand, falling inflation is a sign of a healthy economy and a relief for the Bank of England, especially considering that CPI stood in double digits just two years ago. As a result, analysts may now predict that interest rates could be cut at the meeting scheduled for 8 May.
On the other hand, demand for the dollar remains volatile due to Trump’s tariff policies, fears of a US recession, and a wave of bond sell-offs.
Technical Analysis of the GBP/USD Chart
In just one week, the pound-to-dollar rate has risen by approximately 4.2%, with the RSI indicator now hovering near extreme overbought levels. Furthermore, the price is approaching the upper boundary of the ascending channel, which has been in play since the beginning of 2025.
In such conditions, a correction (with a bearish breakout of the ascending trendline, shown in blue) appears a logical development. However, a key factor in sustaining the current trend of dollar weakness could be the speech by Federal Reserve Chair Jerome Powell, scheduled for today at 20:30 GMT+3.
Trade global index CFDs with zero commission and tight spreads. Open your FXOpen account now or learn more about trading index CFDs with FXOpen.
CFDs are complex instruments and come with a high risk of losing your money.
This article represents the opinion of the Companies operating under the FXOpen brand only. It is not to be construed as an offer, solicitation, or recommendation with respect to products and services provided by the Companies operating under the FXOpen brand, nor is it to be considered financial advice.
👍2
#NVDA #nvidia #sp500 #stockmarket #MarketUpdates #marketanalysis
Chipmaker Stocks Declines
According to the charts, semiconductor stocks underperformed the broader equity market yesterday. While the S&P 500 index (US SPX 500 mini on FXOpen) fell by around 2.2%, the drop was far steeper across the chip sector:
→ The bullish semiconductor ETF (SOXL) declined by 15%;
→ Nvidia (NVDA) shares fell by 6.9%;
→ Advanced Micro Devices (AMD) dropped by 7.3%.
In other words, chipmaker stocks dragged down the broader market, raising concerns ahead of the upcoming earnings season.
Why Are Chip Stocks Falling?
The decline stems from corporate assessments of how the escalating global trade war and new tariffs could impact future performance.
According to media reports:
→ AMD expects to face tariffs of up to $800 million on exports to China;
→ For Nvidia, similar levies could exceed $5 billion.
Technical Analysis – Nvidia (NVDA)
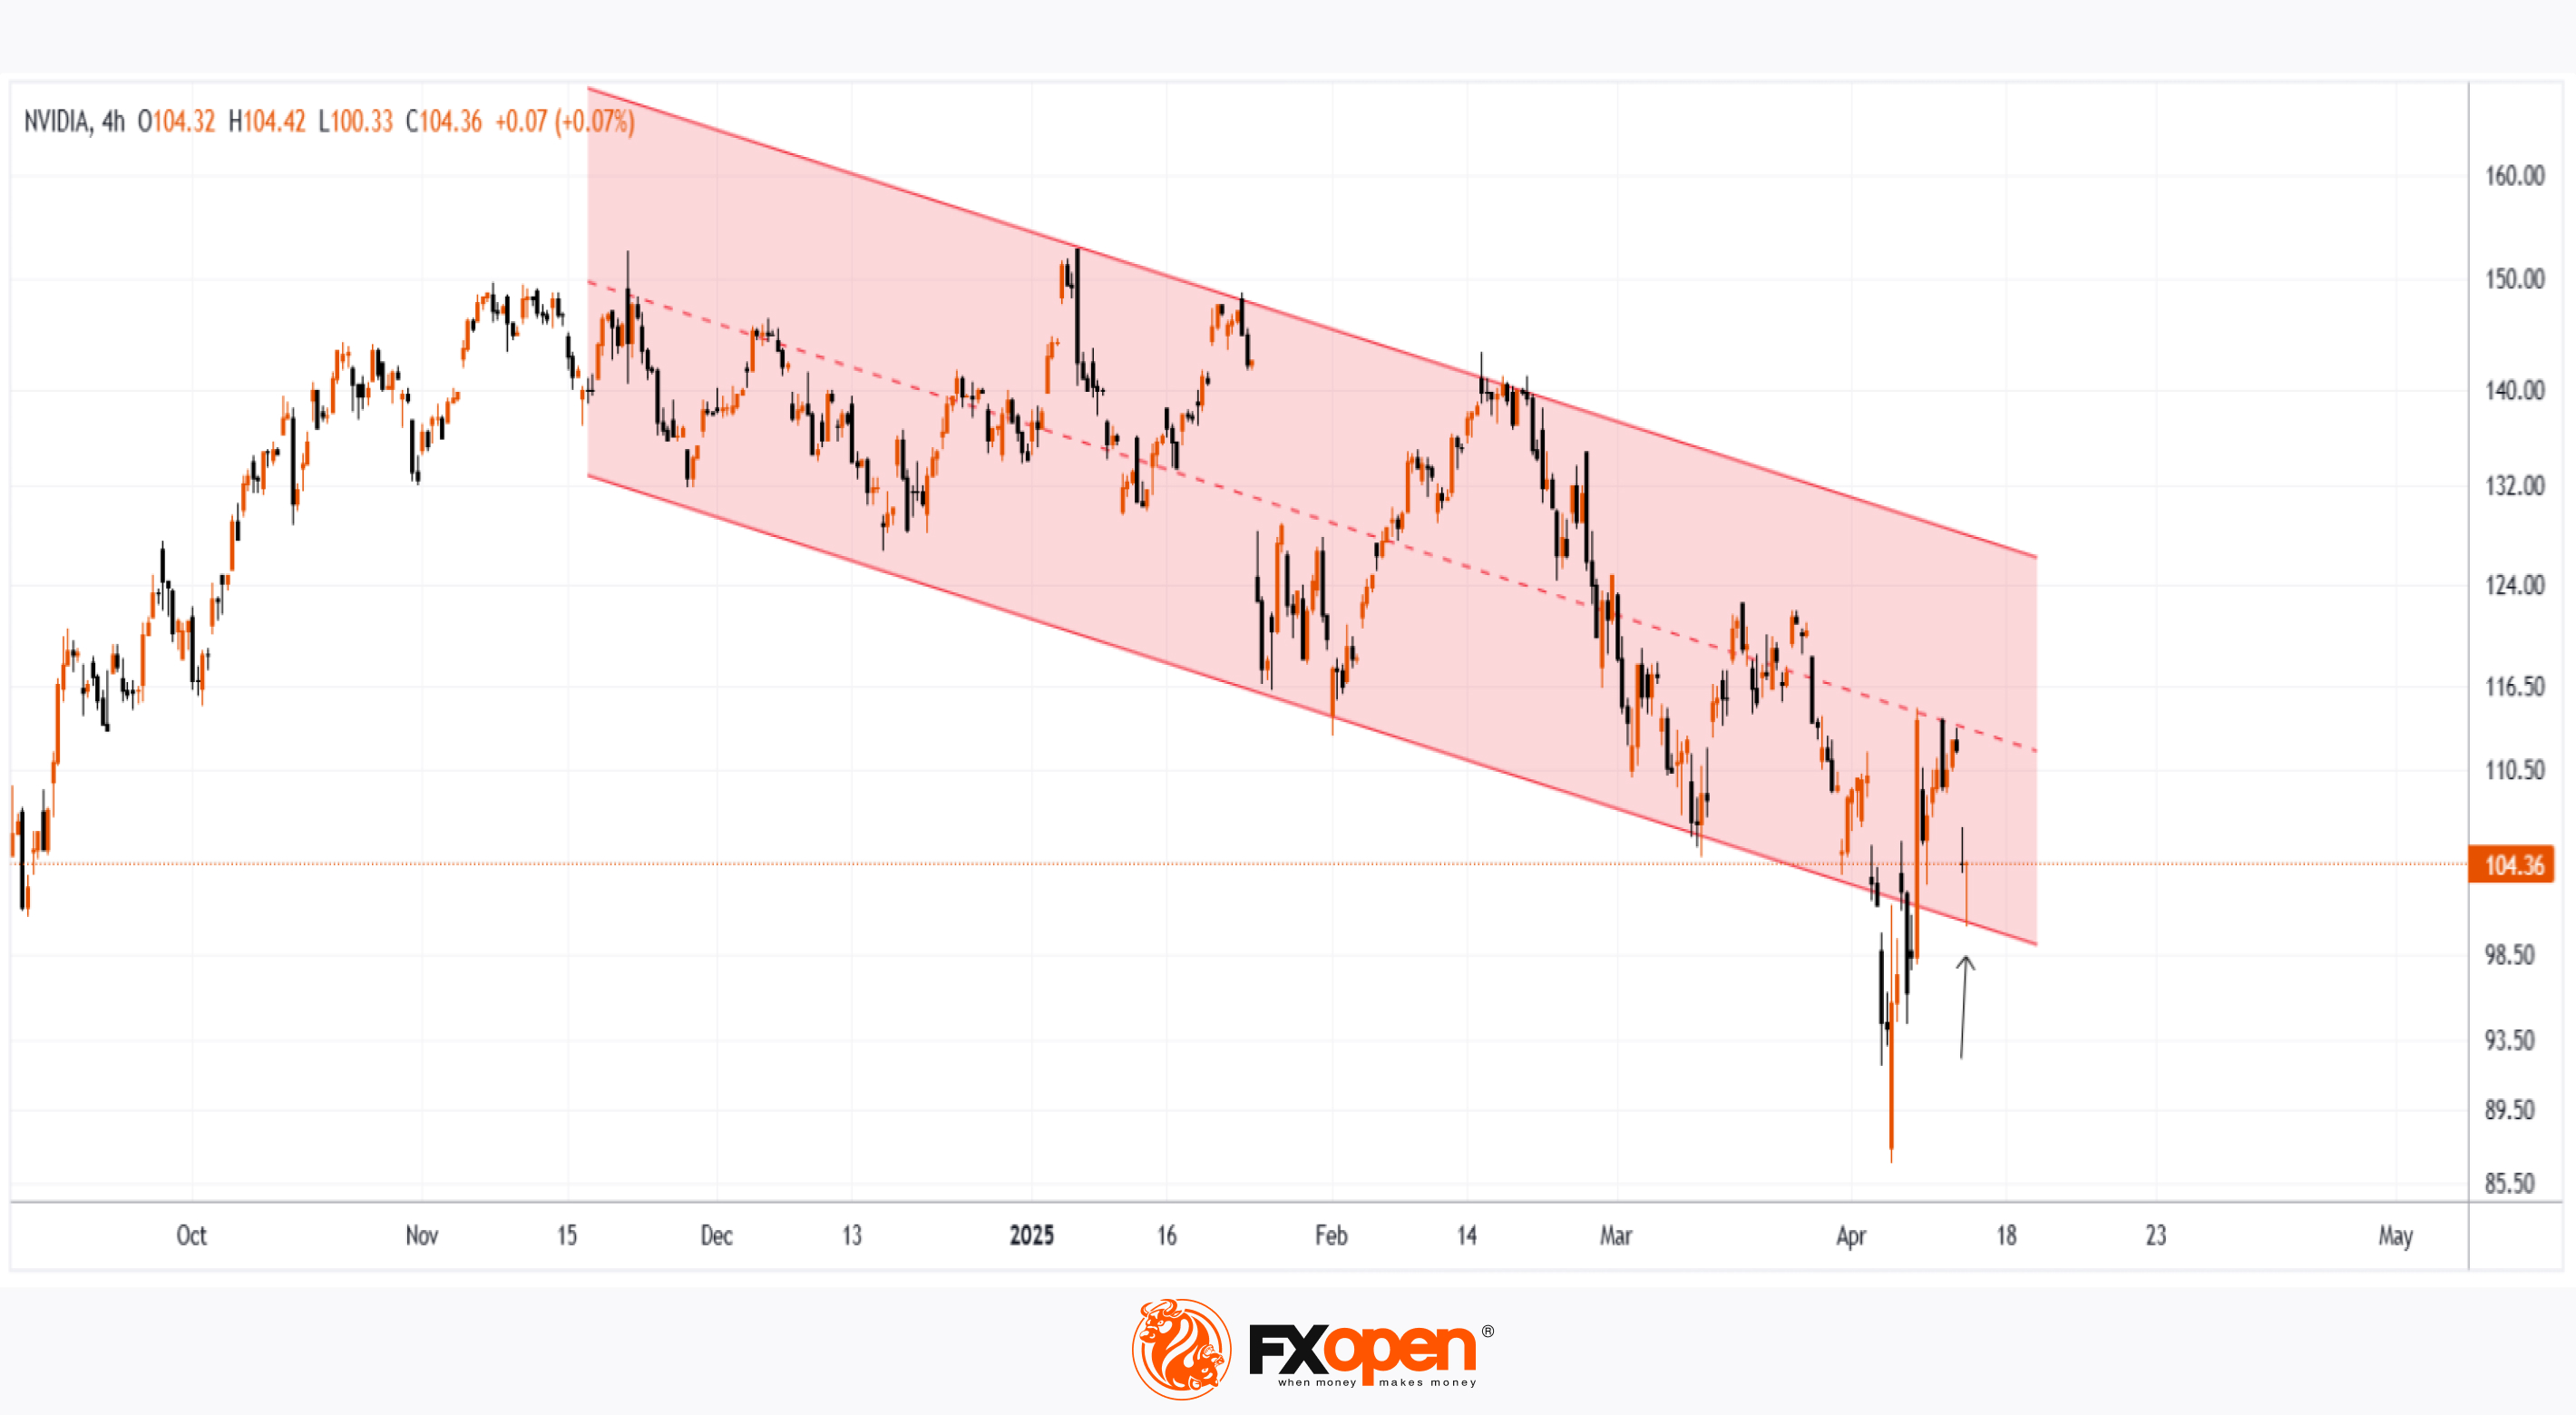
The price continues to fluctuate within a downward channel, previously identified in our analysis:
The lower boundary of the channel is acting as support, helping the price close near its opening level yesterday (forming a Doji candle on the daily chart).
Technical Analysis – AMD
A similar picture is emerging on the AMD chart:
The $96 level now appears to be a key resistance zone.
In Summary
All eyes are on today’s earnings report from chipmaker TSMC (TSM), which could significantly influence the currently bearish sentiment in the sector.
Trade global index CFDs with zero commission and tight spreads. Open your FXOpen account now or learn more about trading index CFDs with FXOpen.
CFDs are complex instruments and come with a high risk of losing your money.
This article represents the opinion of the Companies operating under the FXOpen brand only. It is not to be construed as an offer, solicitation, or recommendation with respect to products and services provided by the Companies operating under the FXOpen brand, nor is it to be considered financial advice.
Chipmaker Stocks Declines
According to the charts, semiconductor stocks underperformed the broader equity market yesterday. While the S&P 500 index (US SPX 500 mini on FXOpen) fell by around 2.2%, the drop was far steeper across the chip sector:
→ The bullish semiconductor ETF (SOXL) declined by 15%;
→ Nvidia (NVDA) shares fell by 6.9%;
→ Advanced Micro Devices (AMD) dropped by 7.3%.
In other words, chipmaker stocks dragged down the broader market, raising concerns ahead of the upcoming earnings season.
Why Are Chip Stocks Falling?
The decline stems from corporate assessments of how the escalating global trade war and new tariffs could impact future performance.
According to media reports:
→ AMD expects to face tariffs of up to $800 million on exports to China;
→ For Nvidia, similar levies could exceed $5 billion.
Technical Analysis – Nvidia (NVDA)
The price continues to fluctuate within a downward channel, previously identified in our analysis:
The lower boundary of the channel is acting as support, helping the price close near its opening level yesterday (forming a Doji candle on the daily chart).
Technical Analysis – AMD
A similar picture is emerging on the AMD chart:
The $96 level now appears to be a key resistance zone.
In Summary
All eyes are on today’s earnings report from chipmaker TSMC (TSM), which could significantly influence the currently bearish sentiment in the sector.
Trade global index CFDs with zero commission and tight spreads. Open your FXOpen account now or learn more about trading index CFDs with FXOpen.
CFDs are complex instruments and come with a high risk of losing your money.
This article represents the opinion of the Companies operating under the FXOpen brand only. It is not to be construed as an offer, solicitation, or recommendation with respect to products and services provided by the Companies operating under the FXOpen brand, nor is it to be considered financial advice.
👍3
#stockmarket #stocks #MarketUpdates #marketanalysis
Stock Markets Consolidate Ahead of the Holidays
A lull is expected on the financial markets today due to a shortened trading week related to the Easter holiday celebrations.
It is reasonable to assume that traders will get a “breather” after a news-heavy April, which caused a volatile “shakeout” in the stock markets.
US Stock Markets
On Wednesday, Federal Reserve Chair Jerome Powell was both cautious and somewhat aggressive in his forecasts regarding US monetary policy, stating that Trump’s tariffs could delay the achievement of inflation targets.
In response, US President Donald Trump accused Powell of “playing politics”, hinting at his possible dismissal.
European Stock Markets
On Thursday, the ECB cut interest rates for the seventh time in the past 12 months, and European Central Bank President Christine Lagarde left the door open for further easing.
Analysts had expected a rate cut from 2.65% to 2.40%, so the financial markets reacted relatively calmly to the ECB’s decision.
Technical Analysis of the S&P 500 Chart (US SPX 500 mini on FXOpen)
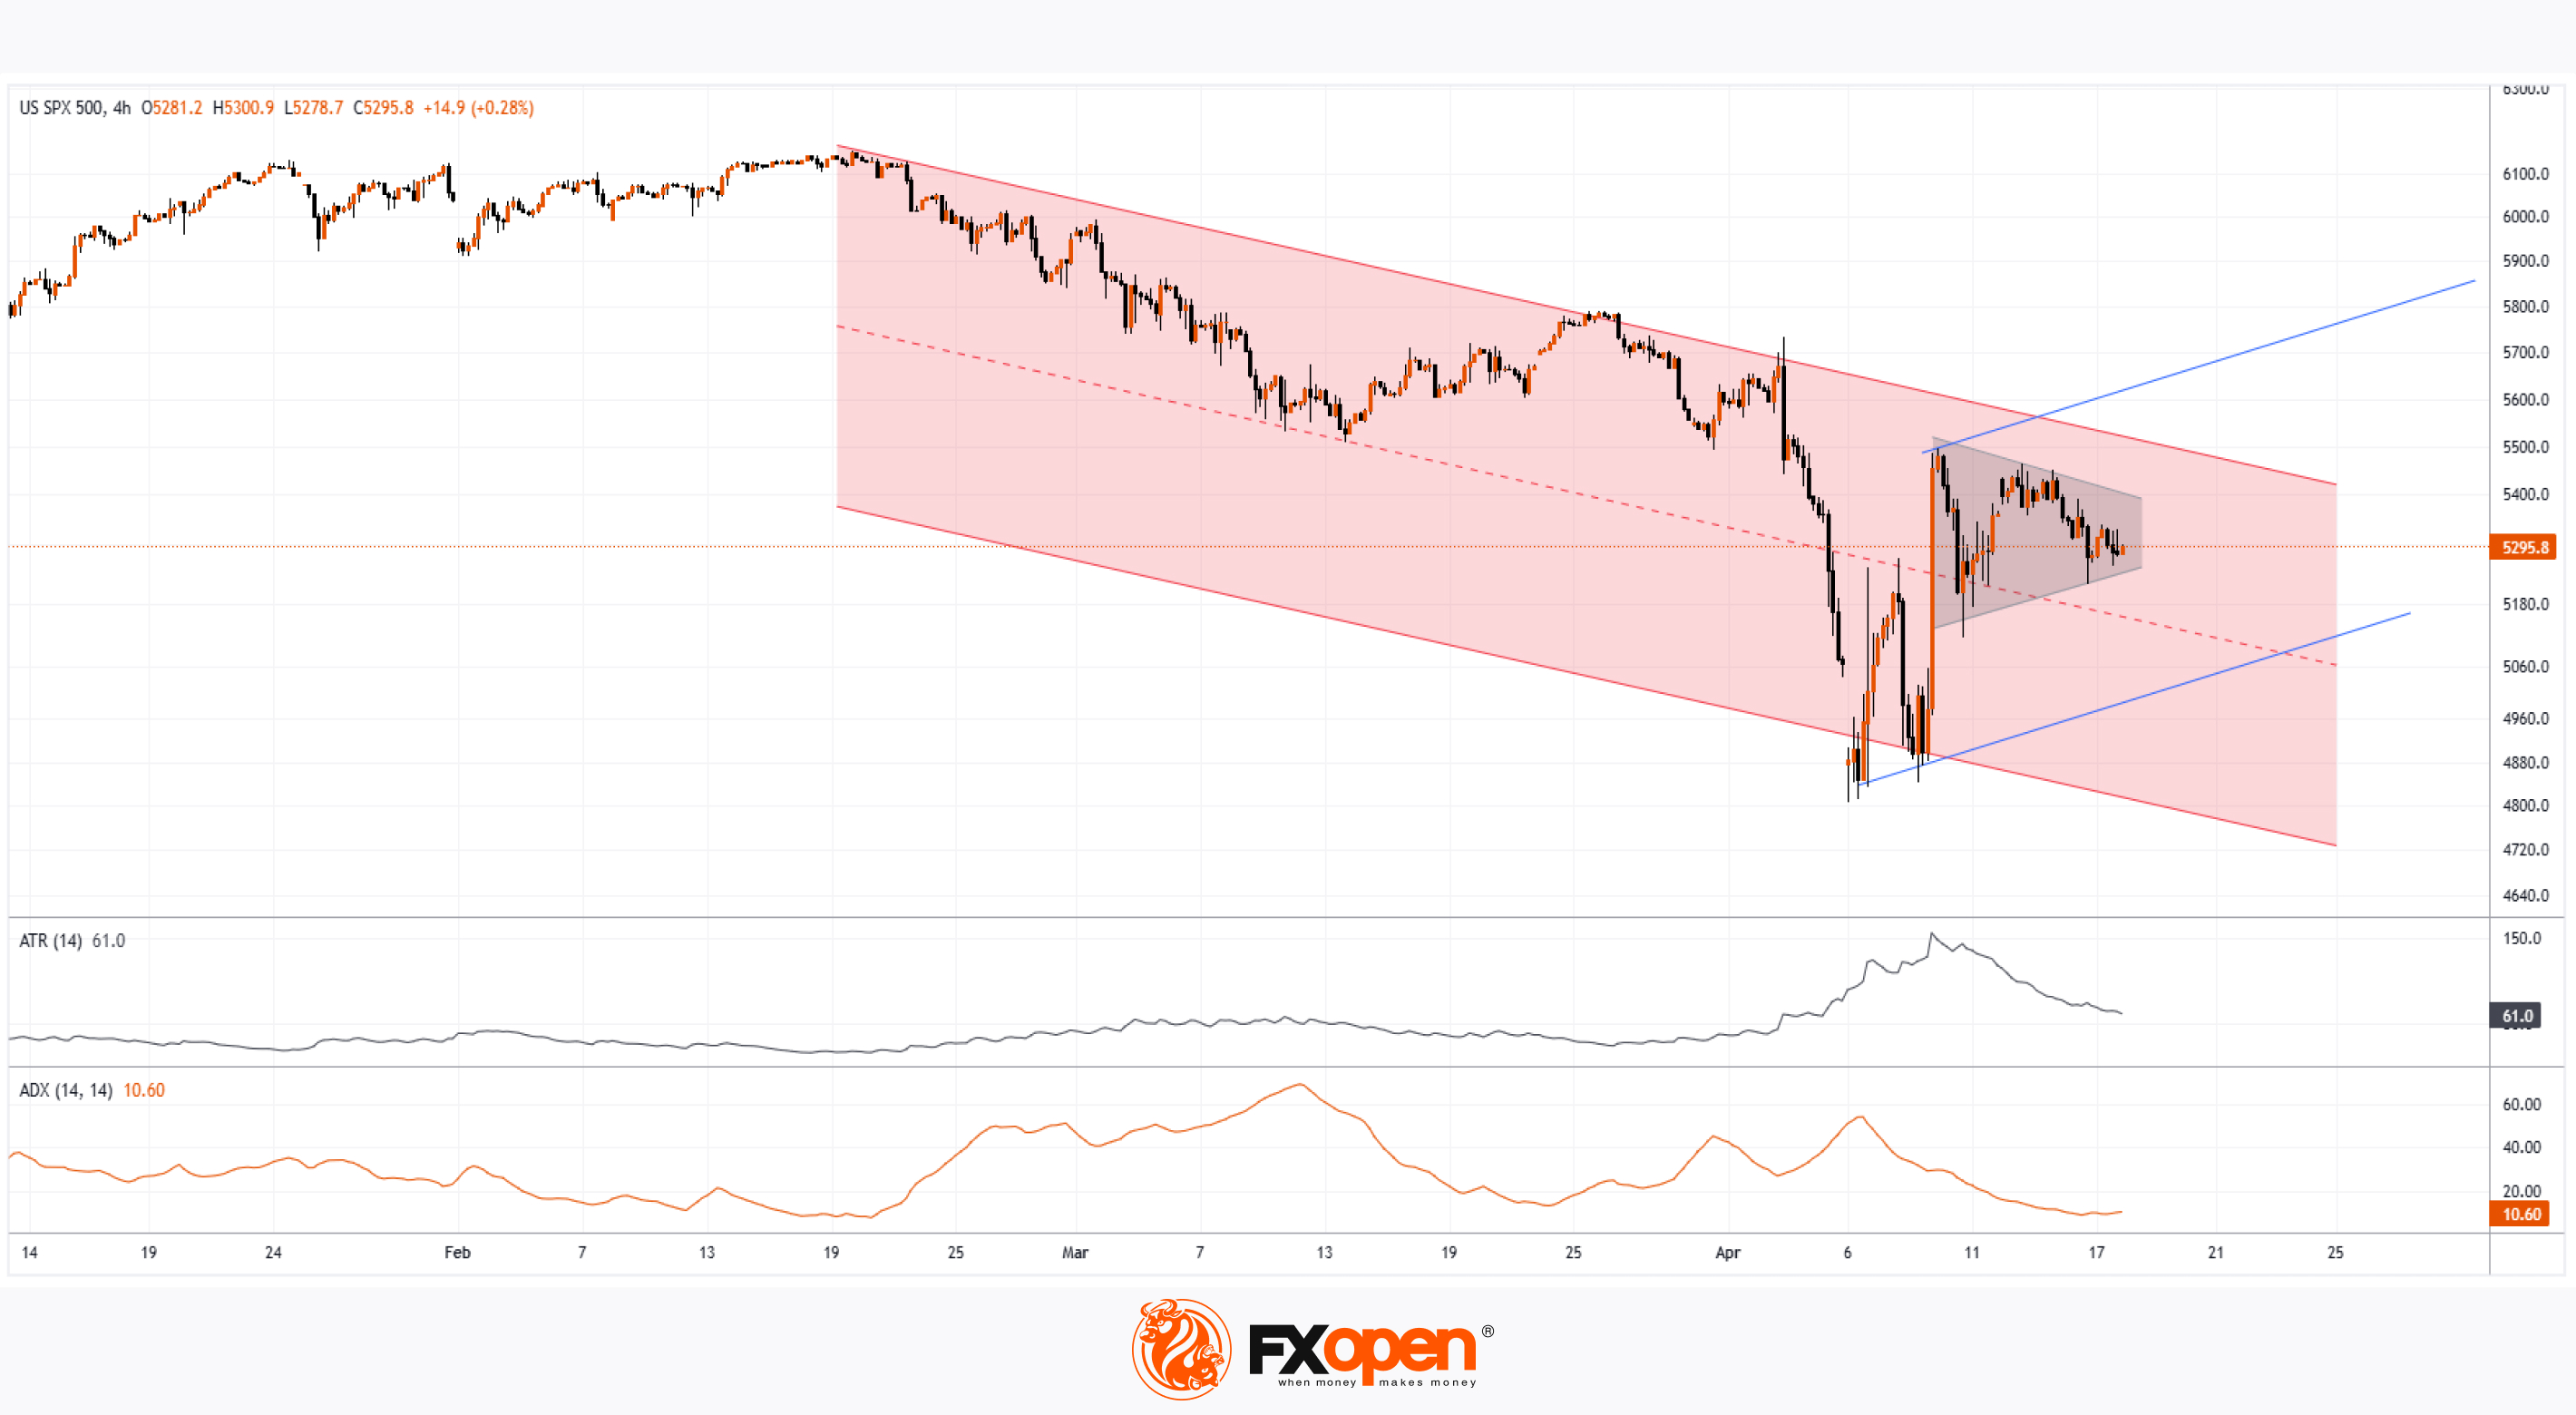
On the charts of European and US stock indices today, a narrowing triangle pattern is forming, indicating a balance between supply and demand — in other words, price is more efficiently factoring in all influencing elements.
On the S&P 500 chart (US SPX 500 mini on FXOpen), the triangle is highlighted in grey. The ADX and ATR indicators are trending downwards, which underlines signs of consolidation.
From a bearish perspective, the market is in a downtrend (marked by the red trend channel) — but from a bullish point of view, price is in the upper half of the channel.
Although the situation appears “reassuring”, the long weekend may bring a string of high-impact statements from the White House, which could disrupt the balance and lead to a breakout from the triangle.
It is not out of the question that the bulls may seize the initiative and challenge the upper boundary of the channel in an attempt to lay the groundwork for an upward trend (shown in blue lines).
Trade global index CFDs with zero commission and tight spreads. Open your FXOpen account now or learn more about trading index CFDs with FXOpen.
CFDs are complex instruments and come with a high risk of losing your money.
This article represents the opinion of the Companies operating under the FXOpen brand only. It is not to be construed as an offer, solicitation, or recommendation with respect to products and services provided by the Companies operating under the FXOpen brand, nor is it to be considered financial advice.
Stock Markets Consolidate Ahead of the Holidays
A lull is expected on the financial markets today due to a shortened trading week related to the Easter holiday celebrations.
It is reasonable to assume that traders will get a “breather” after a news-heavy April, which caused a volatile “shakeout” in the stock markets.
US Stock Markets
On Wednesday, Federal Reserve Chair Jerome Powell was both cautious and somewhat aggressive in his forecasts regarding US monetary policy, stating that Trump’s tariffs could delay the achievement of inflation targets.
In response, US President Donald Trump accused Powell of “playing politics”, hinting at his possible dismissal.
European Stock Markets
On Thursday, the ECB cut interest rates for the seventh time in the past 12 months, and European Central Bank President Christine Lagarde left the door open for further easing.
Analysts had expected a rate cut from 2.65% to 2.40%, so the financial markets reacted relatively calmly to the ECB’s decision.
Technical Analysis of the S&P 500 Chart (US SPX 500 mini on FXOpen)
On the charts of European and US stock indices today, a narrowing triangle pattern is forming, indicating a balance between supply and demand — in other words, price is more efficiently factoring in all influencing elements.
On the S&P 500 chart (US SPX 500 mini on FXOpen), the triangle is highlighted in grey. The ADX and ATR indicators are trending downwards, which underlines signs of consolidation.
From a bearish perspective, the market is in a downtrend (marked by the red trend channel) — but from a bullish point of view, price is in the upper half of the channel.
Although the situation appears “reassuring”, the long weekend may bring a string of high-impact statements from the White House, which could disrupt the balance and lead to a breakout from the triangle.
It is not out of the question that the bulls may seize the initiative and challenge the upper boundary of the channel in an attempt to lay the groundwork for an upward trend (shown in blue lines).
Trade global index CFDs with zero commission and tight spreads. Open your FXOpen account now or learn more about trading index CFDs with FXOpen.
CFDs are complex instruments and come with a high risk of losing your money.
This article represents the opinion of the Companies operating under the FXOpen brand only. It is not to be construed as an offer, solicitation, or recommendation with respect to products and services provided by the Companies operating under the FXOpen brand, nor is it to be considered financial advice.
👍2
Media is too big
VIEW IN TELEGRAM
#Easter2025 #SeasonOfRenewal #Partnership #Gratitude #Growth
Happy Easter from FXOpen 🐥
As we celebrate this season of renewal, we would like to extend our warmest wishes to all our valued clients and partners. May this time bring peace, joy, and prosperity to you and your loved ones.
Thank you for your continued trust and collaboration. We look forward to further growth and success together.
Wishing you a wonderful Easter weekend!🥚
Happy Easter from FXOpen 🐥
As we celebrate this season of renewal, we would like to extend our warmest wishes to all our valued clients and partners. May this time bring peace, joy, and prosperity to you and your loved ones.
Thank you for your continued trust and collaboration. We look forward to further growth and success together.
Wishing you a wonderful Easter weekend!🥚
👍1
#stocktrading #stockmarket #MarketUpdates #marketanalysis
Coca-Cola Company (KO) Shares Trade Near All-Time High
Stock market charts indicate that from the start of last week’s trading through to its close:
→ The S&P 500 Index (US SPX 500 mini on FXOpen) declined by approximately 3%;
→ Pepsico (PEP) shares dropped by more than 1%;
→ Coca-Cola Company (KO) shares rose by around 2.4%.
Why Aren’t Coca-Cola Shares Falling?
The relatively strong performance of Coca-Cola (KO) shares compared to the broader market and its main competitor may be attributed to the fact that Coca-Cola operates a concentrate production facility in Atlanta, USA. In contrast, Pepsico’s equivalent production is based in Ireland. This gives Coca-Cola a potential advantage under the tariff policies pursued by the Trump administration.
Incidentally, according to media reports, Diet Coke is the favourite drink of the US President.
Technical Analysis of KO Stock Chart
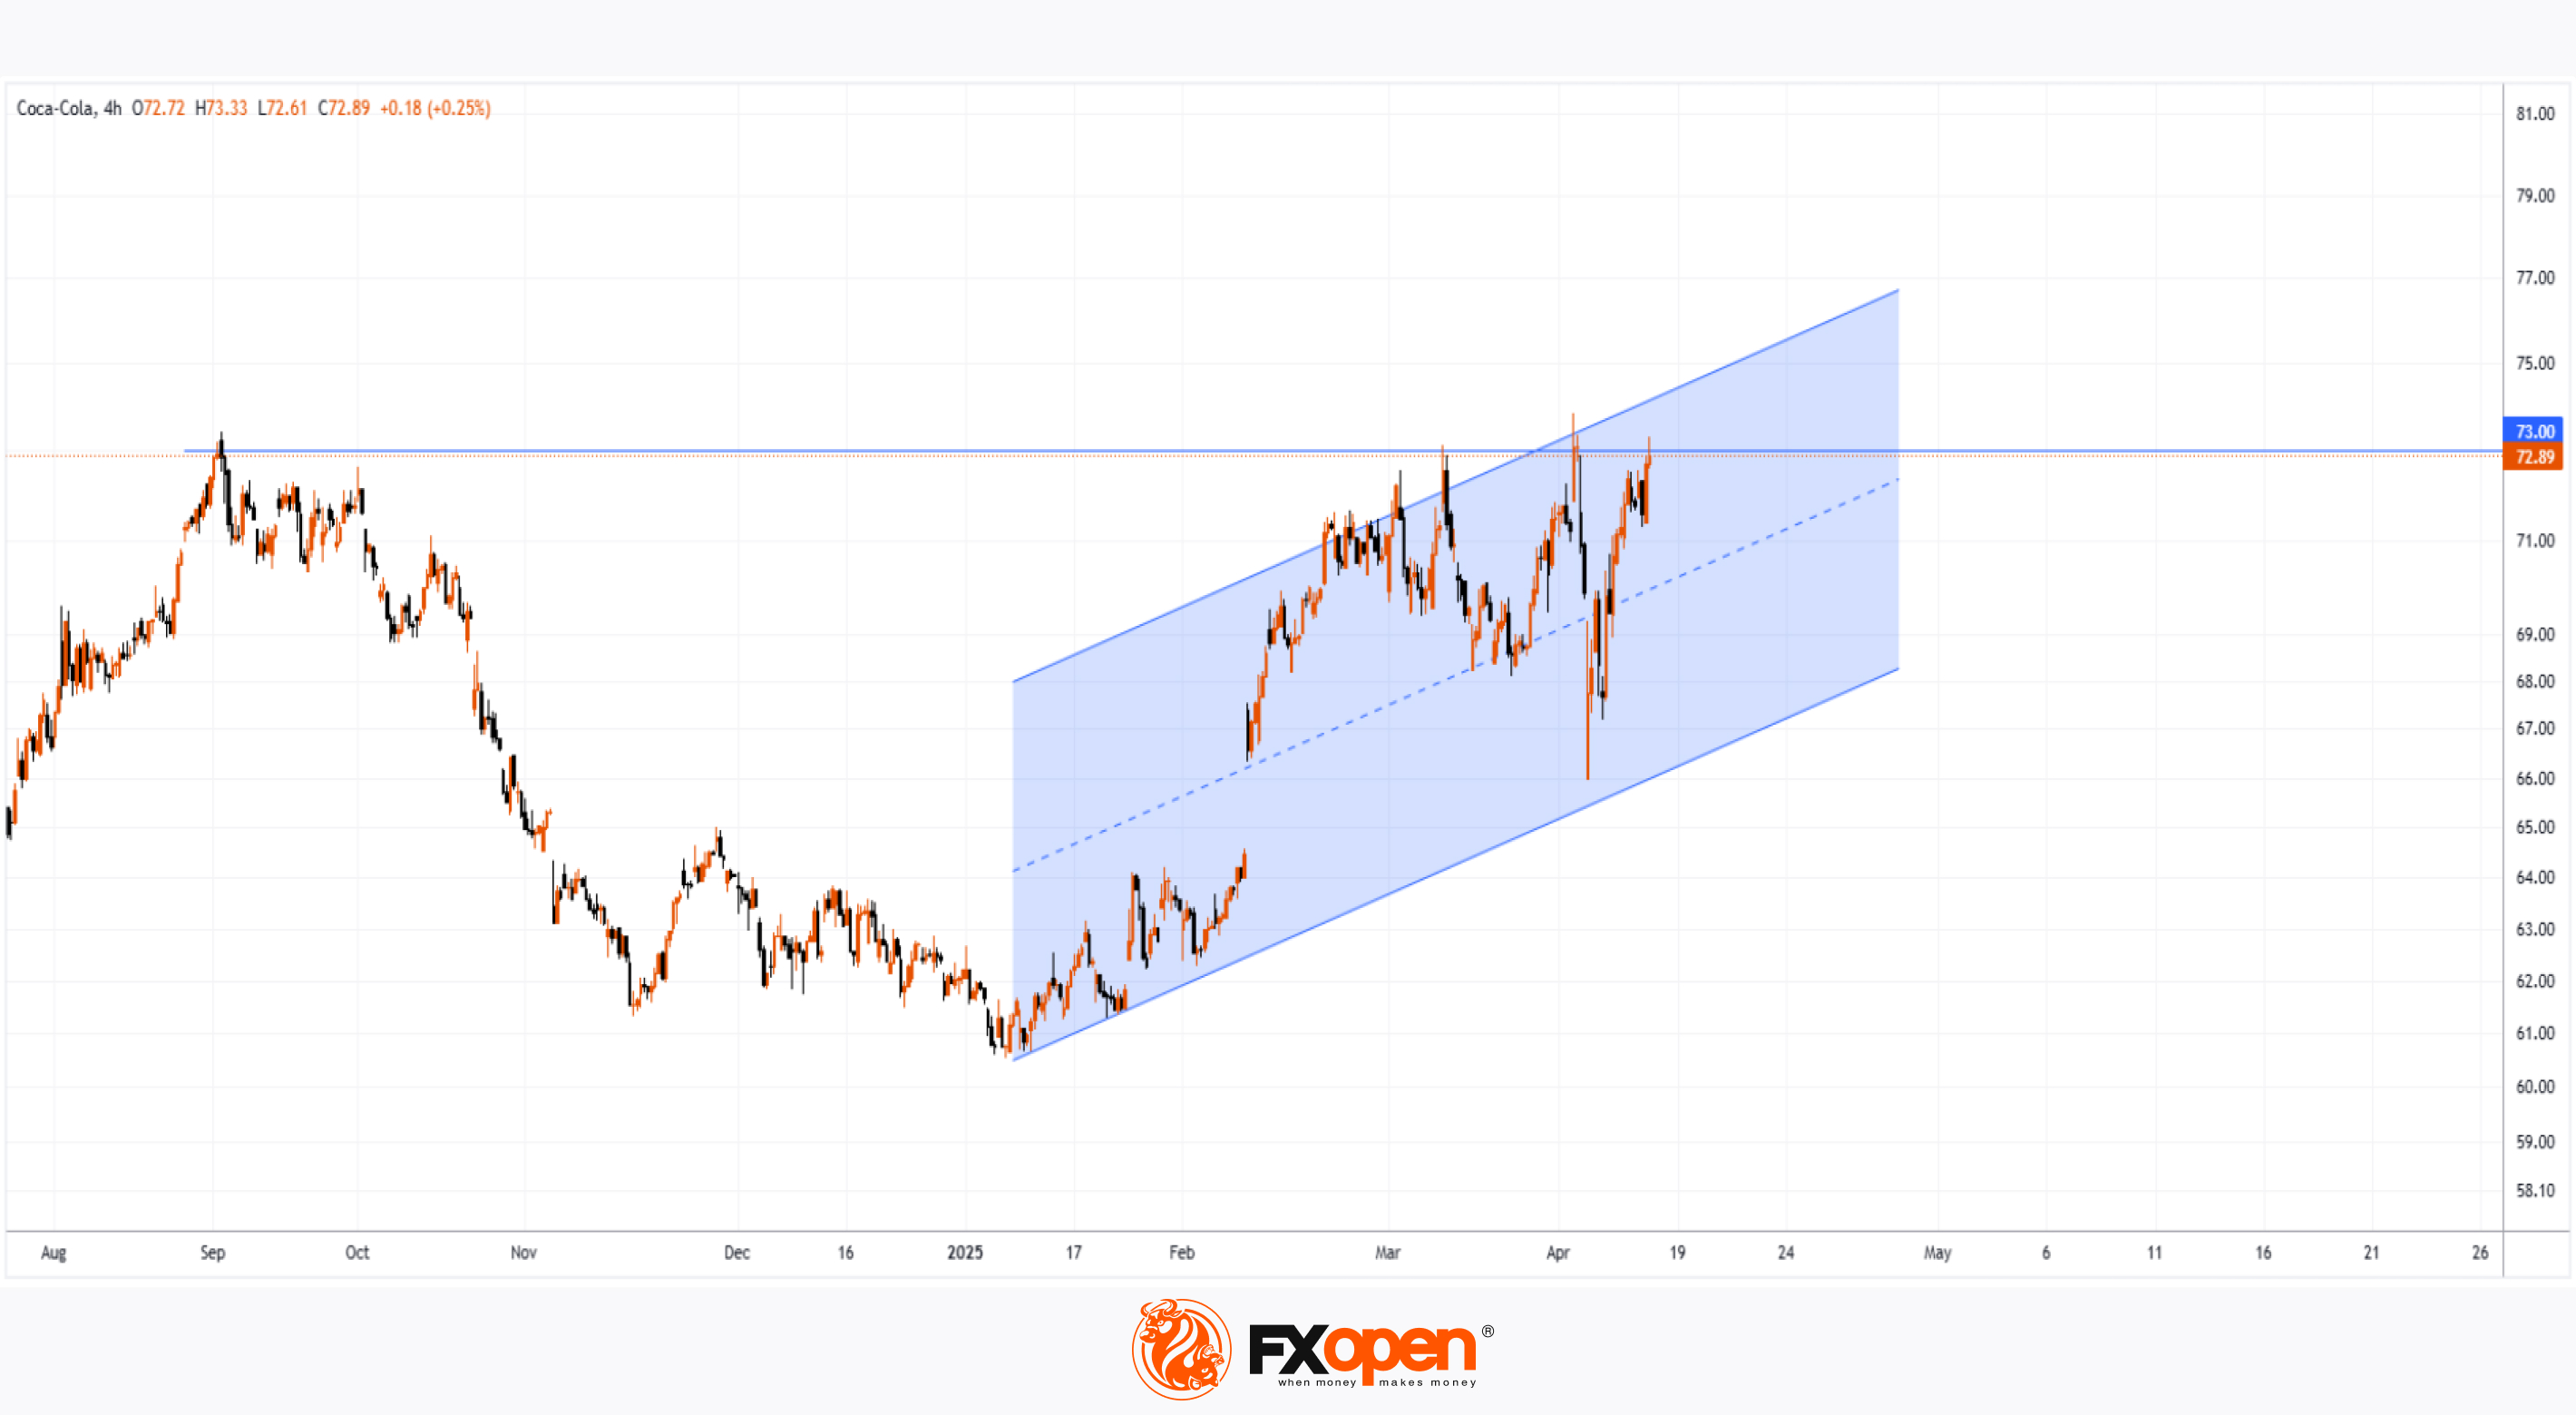
In 2025, KO stock has been forming an upward channel, though the current price is approaching key resistance levels:
→ the upper boundary of this ascending channel;
→ the $73 level, above which several successive all-time highs have been formed. However, price action suggests that bulls have so far struggled to establish a foothold above this mark.
It is possible that the upcoming quarterly earnings report, scheduled for 29 April, could provide a positive catalyst for KO’s share price.
Trade global index CFDs with zero commission and tight spreads. Open your FXOpen account now or learn more about trading index CFDs with FXOpen.
CFDs are complex instruments and come with a high risk of losing your money.
This article represents the opinion of the Companies operating under the FXOpen brand only. It is not to be construed as an offer, solicitation, or recommendation with respect to products and services provided by the Companies operating under the FXOpen brand, nor is it to be considered financial advice.
Coca-Cola Company (KO) Shares Trade Near All-Time High
Stock market charts indicate that from the start of last week’s trading through to its close:
→ The S&P 500 Index (US SPX 500 mini on FXOpen) declined by approximately 3%;
→ Pepsico (PEP) shares dropped by more than 1%;
→ Coca-Cola Company (KO) shares rose by around 2.4%.
Why Aren’t Coca-Cola Shares Falling?
The relatively strong performance of Coca-Cola (KO) shares compared to the broader market and its main competitor may be attributed to the fact that Coca-Cola operates a concentrate production facility in Atlanta, USA. In contrast, Pepsico’s equivalent production is based in Ireland. This gives Coca-Cola a potential advantage under the tariff policies pursued by the Trump administration.
Incidentally, according to media reports, Diet Coke is the favourite drink of the US President.
Technical Analysis of KO Stock Chart
In 2025, KO stock has been forming an upward channel, though the current price is approaching key resistance levels:
→ the upper boundary of this ascending channel;
→ the $73 level, above which several successive all-time highs have been formed. However, price action suggests that bulls have so far struggled to establish a foothold above this mark.
It is possible that the upcoming quarterly earnings report, scheduled for 29 April, could provide a positive catalyst for KO’s share price.
Trade global index CFDs with zero commission and tight spreads. Open your FXOpen account now or learn more about trading index CFDs with FXOpen.
CFDs are complex instruments and come with a high risk of losing your money.
This article represents the opinion of the Companies operating under the FXOpen brand only. It is not to be construed as an offer, solicitation, or recommendation with respect to products and services provided by the Companies operating under the FXOpen brand, nor is it to be considered financial advice.
👍2
#USDJPY #forextrading #tradingtips #MarketUpdates #marketanalysis
USD/JPY Analysis: Exchange Rate Falls Below 140 Yen per Dollar Today
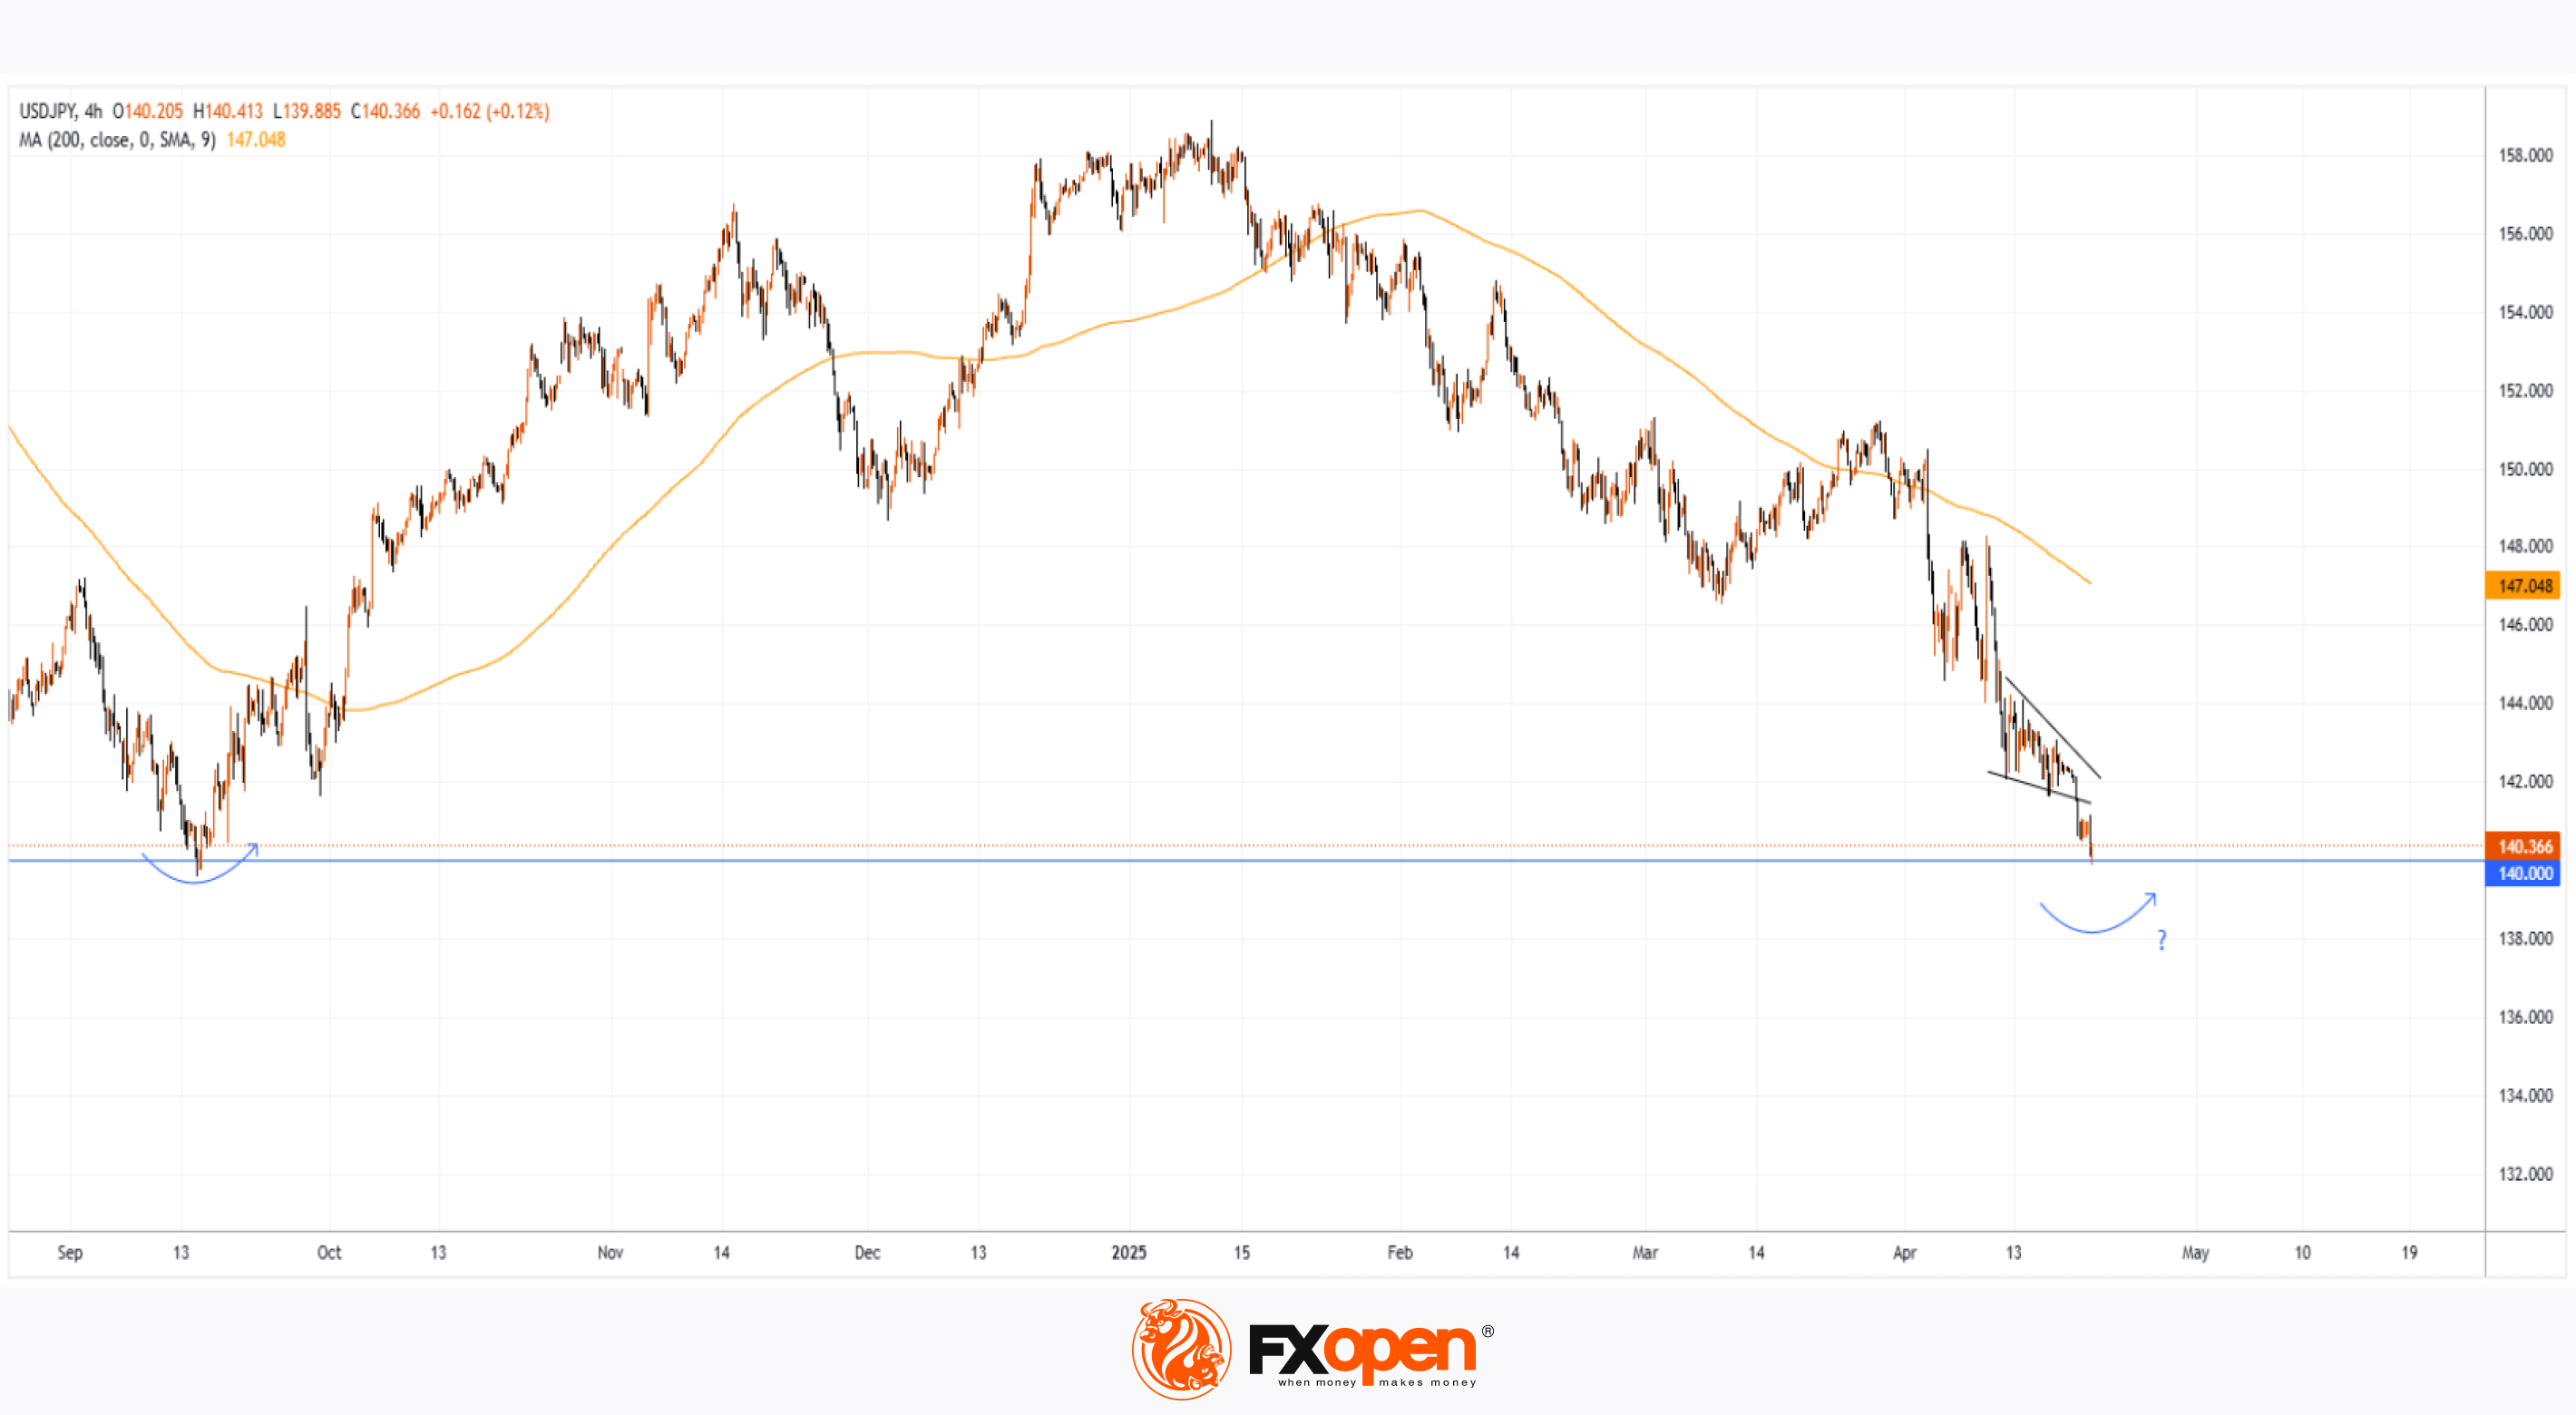
As shown on the USD/JPY chart today, the exchange rate between the US dollar and Japanese yen has fallen below 140 yen per dollar – marking the first time this has occurred in 2025. Since the beginning of the year, the rate has dropped by approximately 11%.
Among the main driving factors is the White House's tariff policy, which has triggered a sell-off in US government bonds and a weakening of the dollar. One of the more recent developments includes the release of the Consumer Price Index report by the Bank of Japan, which revealed that the CPI remained steady at 2.2%, despite analysts (according to ForexFactory) forecasting a rise to 2.4%.
It’s possible that, due to the lack of inflationary pressure in Japan, the yen is in a relatively stronger position compared to the US currency, where concerns persist that trade wars and Trump’s push for lower interest rates may lead to a spike in inflation and a devaluation of the dollar.
Technical Analysis of the USD/JPY Chart
It’s worth noting that the psychological level of 140 yen per dollar has acted as key support since late 2023. On the rare occasions when the rate has dipped below this mark, the bulls have soon regained confidence, prompting a reversal.
It’s quite possible we may witness a similar attempt on the USD/JPY chart in the coming weeks or even days. However, the current outlook remains bearish, as the price has broken below the Descending Wedge pattern (marked with black lines), indicating that supply is outweighing demand.
Trade over 50 forex markets 24 hours a day with FXOpen. Take advantage of low commissions, deep liquidity, and spreads from 0.0 pips. Open your FXOpen account now or learn more about trading forex with FXOpen.
CFDs are complex instruments and come with a high risk of losing your money.
This article represents the opinion of the Companies operating under the FXOpen brand only. It is not to be construed as an offer, solicitation, or recommendation with respect to products and services provided by the Companies operating under the FXOpen brand, nor is it to be considered financial advice.
USD/JPY Analysis: Exchange Rate Falls Below 140 Yen per Dollar Today
As shown on the USD/JPY chart today, the exchange rate between the US dollar and Japanese yen has fallen below 140 yen per dollar – marking the first time this has occurred in 2025. Since the beginning of the year, the rate has dropped by approximately 11%.
Among the main driving factors is the White House's tariff policy, which has triggered a sell-off in US government bonds and a weakening of the dollar. One of the more recent developments includes the release of the Consumer Price Index report by the Bank of Japan, which revealed that the CPI remained steady at 2.2%, despite analysts (according to ForexFactory) forecasting a rise to 2.4%.
It’s possible that, due to the lack of inflationary pressure in Japan, the yen is in a relatively stronger position compared to the US currency, where concerns persist that trade wars and Trump’s push for lower interest rates may lead to a spike in inflation and a devaluation of the dollar.
Technical Analysis of the USD/JPY Chart
It’s worth noting that the psychological level of 140 yen per dollar has acted as key support since late 2023. On the rare occasions when the rate has dipped below this mark, the bulls have soon regained confidence, prompting a reversal.
It’s quite possible we may witness a similar attempt on the USD/JPY chart in the coming weeks or even days. However, the current outlook remains bearish, as the price has broken below the Descending Wedge pattern (marked with black lines), indicating that supply is outweighing demand.
Trade over 50 forex markets 24 hours a day with FXOpen. Take advantage of low commissions, deep liquidity, and spreads from 0.0 pips. Open your FXOpen account now or learn more about trading forex with FXOpen.
CFDs are complex instruments and come with a high risk of losing your money.
This article represents the opinion of the Companies operating under the FXOpen brand only. It is not to be construed as an offer, solicitation, or recommendation with respect to products and services provided by the Companies operating under the FXOpen brand, nor is it to be considered financial advice.
👍1
#tesla #tsla #stocktrading #stockmarket #MarketUpdates #marketanalysis
Tesla Shares (TSLA) Drop Nearly 6% Ahead of Quarterly Report
On Monday, Tesla’s share price fell by almost 6%, dipping below $230 and hovering near its yearly low. Since the beginning of 2025, Tesla shares have lost approximately 44% in value, marking their worst quarter since 2022.
Why Is TSLA Falling?
There is no shortage of investor concerns, including (as reported by various media outlets):
→ Elon Musk’s involvement with the Trump administration, which is said to be distracting him from focusing on Tesla, particularly as signs emerge of slowing progress in the development of robotaxis and autonomous driving technology.
→ A decline in demand — both for the Cybertruck model specifically and the product line in general — especially amid protests and boycotts across the US and Europe. Tesla previously reported 336,681 vehicle deliveries in Q1, down 13% compared to the same period last year.
→ Increased competition from Chinese carmakers, uncertainty around international trade tariffs, and other contributing factors.
According to The Wall Street Journal, analysts at Barclays and Oppenheimer have voiced concerns about “brand dilution” and weakness in China, while Dan Ives of Wedbush is hopeful for an “inspirational vision” from Elon Musk.
Technical Analysis of TSLA Stock
We previously noted the importance of the $220 support level, which prevented the price from falling further during the first half of April (as indicated by the arrow), at a time when broader stock indices showed much more bearish trends.
That level still appears relevant for now, but it’s likely that the upcoming quarterly earnings report will trigger a sharp increase in volatility. Should investors find the results underwhelming, TSLA’s share price could fall to the lower boundary of the current descending channel (highlighted in red), potentially breaching the psychological $200-per-share mark.
Trade global index CFDs with zero commission and tight spreads. Open your FXOpen account now or learn more about trading index CFDs with FXOpen.
CFDs are complex instruments and come with a high risk of losing your money.
This article represents the opinion of the Companies operating under the FXOpen brand only. It is not to be construed as an offer, solicitation, or recommendation with respect to products and services provided by the Companies operating under the FXOpen brand, nor is it to be considered financial advice.
Tesla Shares (TSLA) Drop Nearly 6% Ahead of Quarterly Report
On Monday, Tesla’s share price fell by almost 6%, dipping below $230 and hovering near its yearly low. Since the beginning of 2025, Tesla shares have lost approximately 44% in value, marking their worst quarter since 2022.
Why Is TSLA Falling?
There is no shortage of investor concerns, including (as reported by various media outlets):
→ Elon Musk’s involvement with the Trump administration, which is said to be distracting him from focusing on Tesla, particularly as signs emerge of slowing progress in the development of robotaxis and autonomous driving technology.
→ A decline in demand — both for the Cybertruck model specifically and the product line in general — especially amid protests and boycotts across the US and Europe. Tesla previously reported 336,681 vehicle deliveries in Q1, down 13% compared to the same period last year.
→ Increased competition from Chinese carmakers, uncertainty around international trade tariffs, and other contributing factors.
According to The Wall Street Journal, analysts at Barclays and Oppenheimer have voiced concerns about “brand dilution” and weakness in China, while Dan Ives of Wedbush is hopeful for an “inspirational vision” from Elon Musk.
Technical Analysis of TSLA Stock
We previously noted the importance of the $220 support level, which prevented the price from falling further during the first half of April (as indicated by the arrow), at a time when broader stock indices showed much more bearish trends.
That level still appears relevant for now, but it’s likely that the upcoming quarterly earnings report will trigger a sharp increase in volatility. Should investors find the results underwhelming, TSLA’s share price could fall to the lower boundary of the current descending channel (highlighted in red), potentially breaching the psychological $200-per-share mark.
Trade global index CFDs with zero commission and tight spreads. Open your FXOpen account now or learn more about trading index CFDs with FXOpen.
CFDs are complex instruments and come with a high risk of losing your money.
This article represents the opinion of the Companies operating under the FXOpen brand only. It is not to be construed as an offer, solicitation, or recommendation with respect to products and services provided by the Companies operating under the FXOpen brand, nor is it to be considered financial advice.

👍3
#XAUUSD #goldprice #commodity #MarketUpdates #marketanalysis
Gold Price Plunges After Climbing to $3,500 for the First Time
As the XAU/USD chart shows:
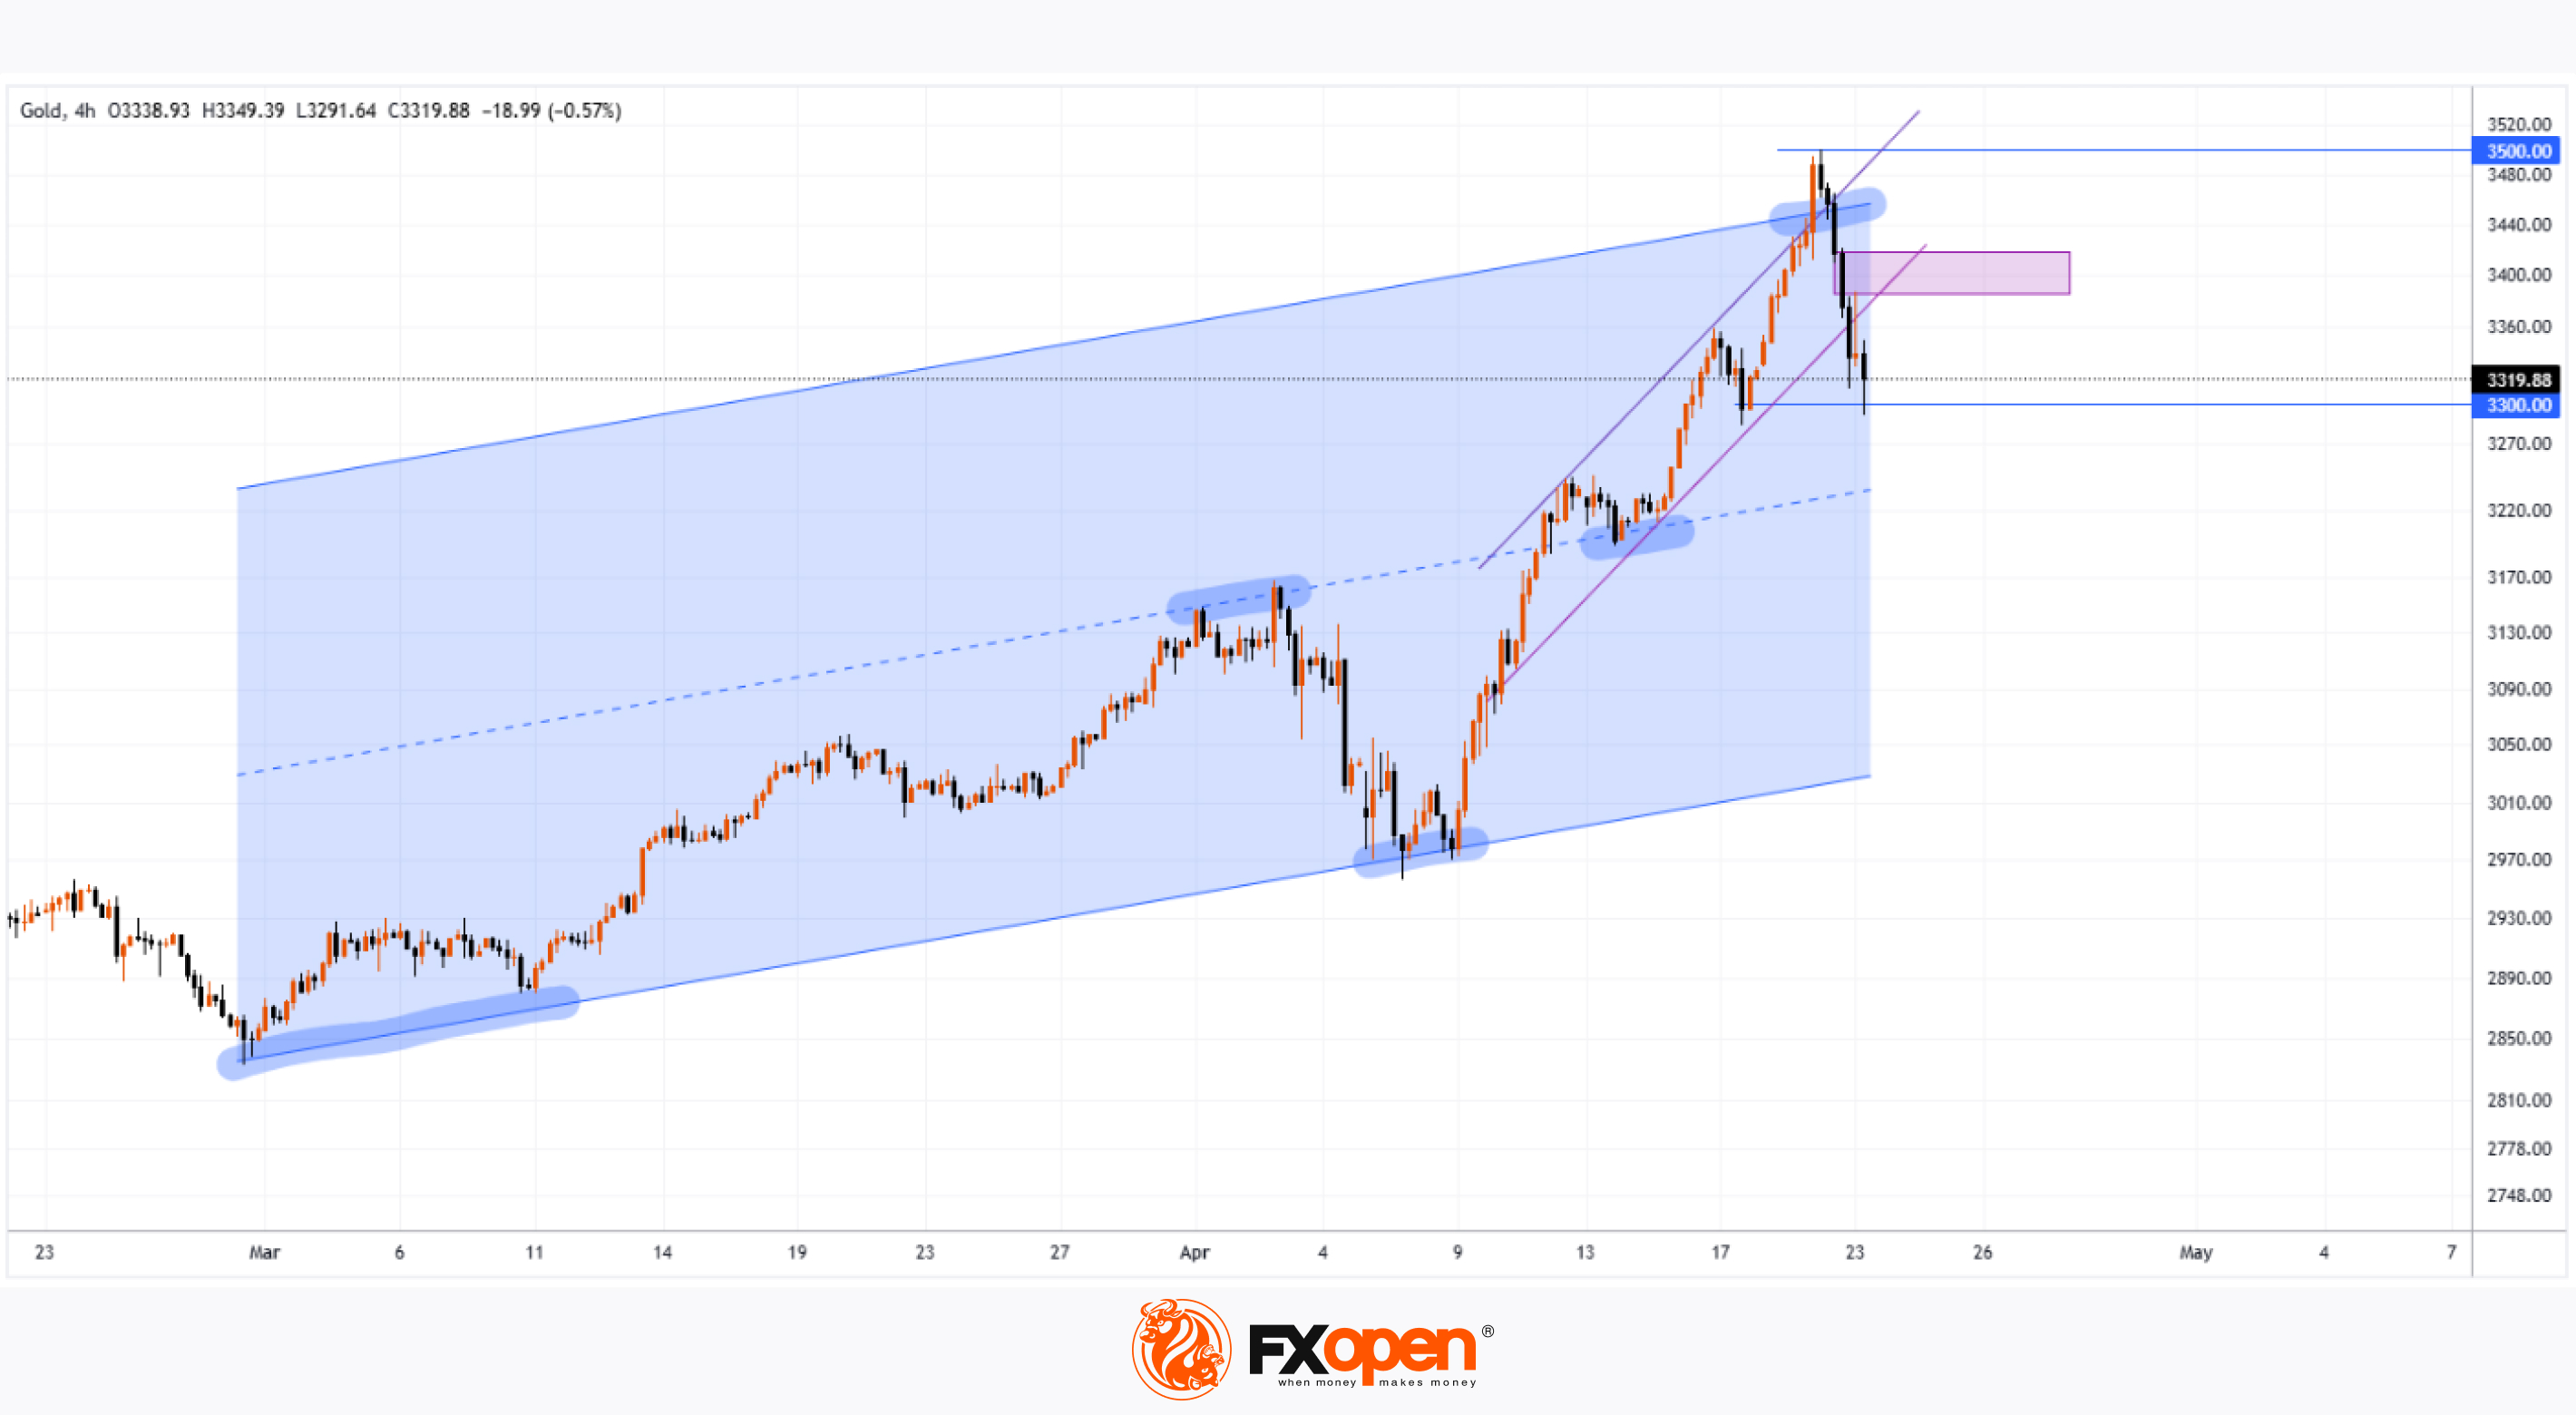
→ Yesterday, the spot gold price stopped just a few cents short of the key psychological level of $3,500 (and even exceeded it on the futures market);
→ But this morning, an ounce is trading around $3,300, having dropped aggressively by more than 5%.
Why Did Gold Suddenly Drop?
The sharp decline followed a shift in rhetoric from President Trump. According to Reuters:
→ The US President backed away from threats to dismiss Federal Reserve Chair Jerome Powell;
→ He also signalled a more moderate stance on tariffs against China.
Market participants interpreted this as a reason to take profits on long positions, as the softened tone from the White House reduced demand for safe-haven assets. As a result, gold collapsed from its historic high, while the US dollar index rebounded from multi-month lows.
Technical Analysis of the XAU/USD Chart
Gold price fluctuations have formed an upward channel (highlighted in blue), with key reversal points marked for constructing the channel. From this perspective, one interpretation is that the upper boundary marked a price area where gold was extremely overbought. Now, the imbalance in market sentiment may be driving the price back towards the median, where supply and demand tend to stabilise.
And although the $3,300 level is currently acting as support, the XAU/USD chart reveals several signs suggesting that bears are taking control:
→ The price has dropped by approximately $200 in less than two days;
→ A bearish Fair Value Gap has formed during the decline (highlighted by a rectangle) – a pattern typically interpreted as sellers outweighing buyers;
→ The steep purple ascending channel has been broken.
It can be assumed that even if the fundamental backdrop offers reasons for a short-term price recovery, this may prove to be only a temporary bounce following a sharp shift in sentiment towards bearishness at the start of the current week.
Start trading commodities with tight spreads. Open your trading account now or learn more about trading commodity CFDs with FXOpen.
CFDs are complex instruments and come with a high risk of losing your money.
This article represents the opinion of the Companies operating under the FXOpen brand only. It is not to be construed as an offer, solicitation, or recommendation with respect to products and services provided by the Companies operating under the FXOpen brand, nor is it to be considered financial advice.
Gold Price Plunges After Climbing to $3,500 for the First Time
As the XAU/USD chart shows:
→ Yesterday, the spot gold price stopped just a few cents short of the key psychological level of $3,500 (and even exceeded it on the futures market);
→ But this morning, an ounce is trading around $3,300, having dropped aggressively by more than 5%.
Why Did Gold Suddenly Drop?
The sharp decline followed a shift in rhetoric from President Trump. According to Reuters:
→ The US President backed away from threats to dismiss Federal Reserve Chair Jerome Powell;
→ He also signalled a more moderate stance on tariffs against China.
Market participants interpreted this as a reason to take profits on long positions, as the softened tone from the White House reduced demand for safe-haven assets. As a result, gold collapsed from its historic high, while the US dollar index rebounded from multi-month lows.
Technical Analysis of the XAU/USD Chart
Gold price fluctuations have formed an upward channel (highlighted in blue), with key reversal points marked for constructing the channel. From this perspective, one interpretation is that the upper boundary marked a price area where gold was extremely overbought. Now, the imbalance in market sentiment may be driving the price back towards the median, where supply and demand tend to stabilise.
And although the $3,300 level is currently acting as support, the XAU/USD chart reveals several signs suggesting that bears are taking control:
→ The price has dropped by approximately $200 in less than two days;
→ A bearish Fair Value Gap has formed during the decline (highlighted by a rectangle) – a pattern typically interpreted as sellers outweighing buyers;
→ The steep purple ascending channel has been broken.
It can be assumed that even if the fundamental backdrop offers reasons for a short-term price recovery, this may prove to be only a temporary bounce following a sharp shift in sentiment towards bearishness at the start of the current week.
Start trading commodities with tight spreads. Open your trading account now or learn more about trading commodity CFDs with FXOpen.
CFDs are complex instruments and come with a high risk of losing your money.
This article represents the opinion of the Companies operating under the FXOpen brand only. It is not to be construed as an offer, solicitation, or recommendation with respect to products and services provided by the Companies operating under the FXOpen brand, nor is it to be considered financial advice.
👍2
#GOOGL #stockmarket #stocktrading #MarketUpdates #MarketNews
Alphabet (GOOGL) Shares Hover Near Psychological Level Ahead of Earnings Report
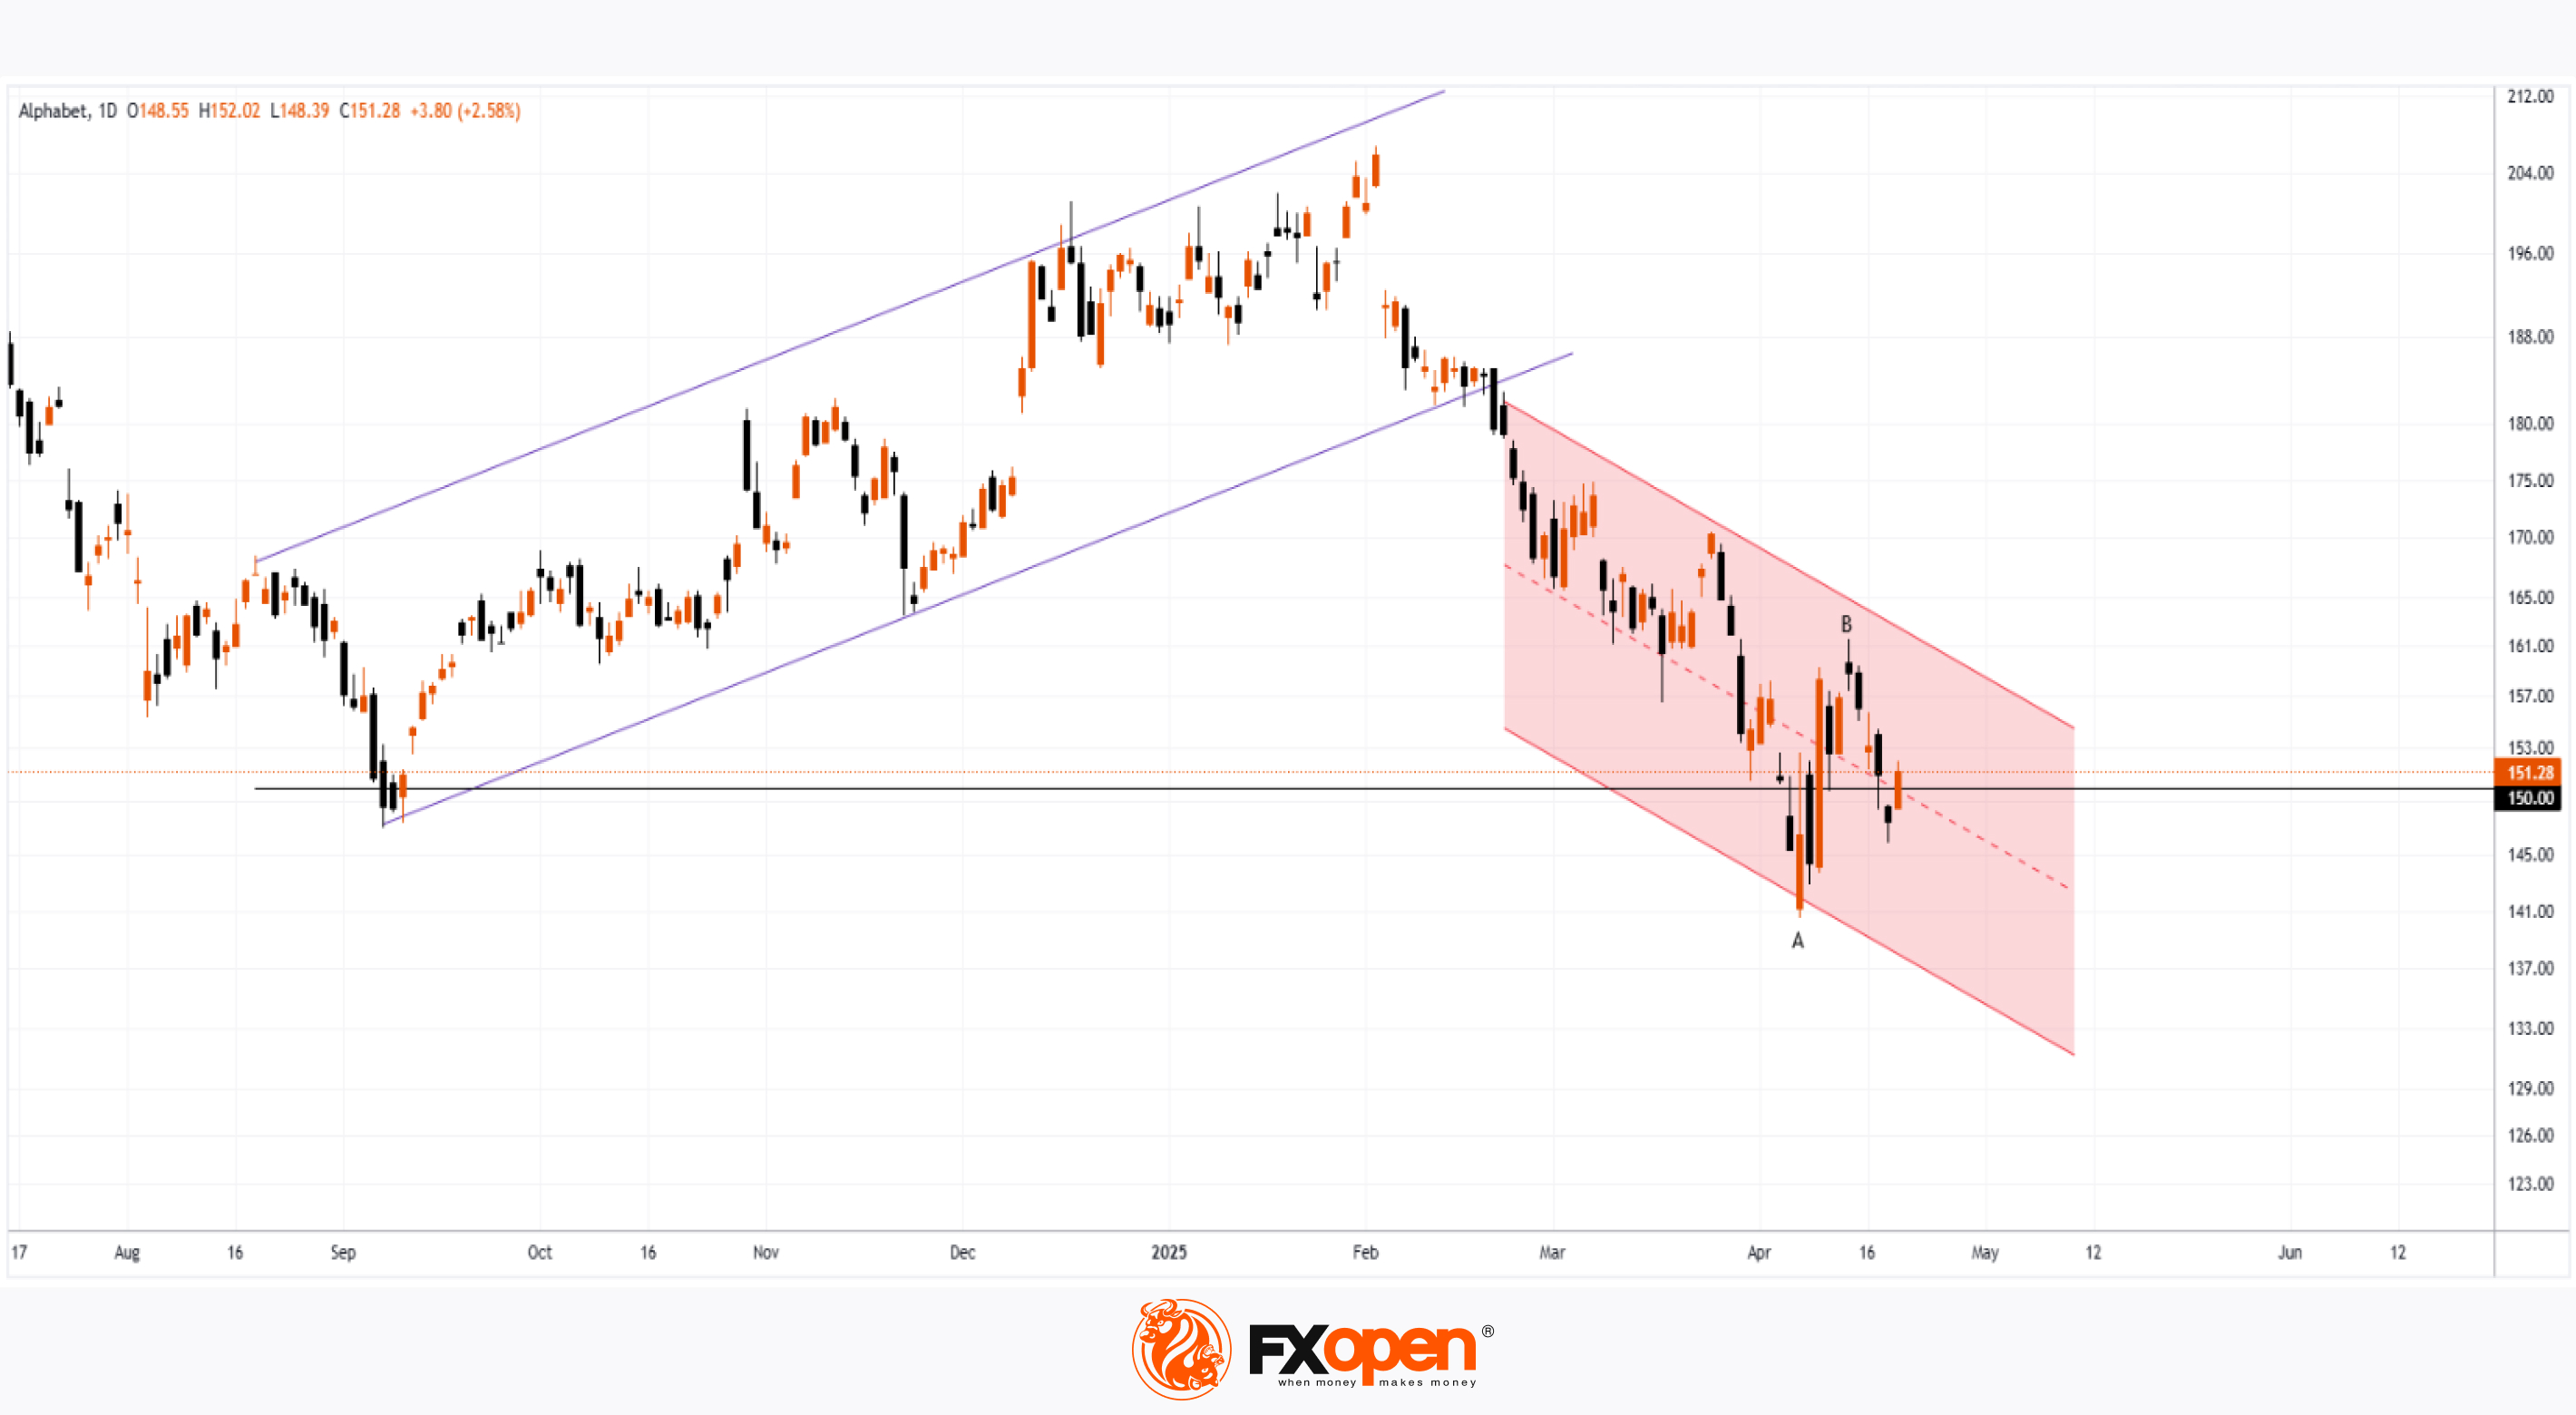
On 31 March, we noted that bearish sentiment could push Alphabet’s (GOOGL) share price towards the psychological level of $150. As the current price chart suggests, GOOGL is now trading close to that very level.
Moreover, the price is approximately equidistant from the recent highs and lows (marked A and B), which may be interpreted as a sign of balanced supply and demand — and a wait-and-see stance from market participants ahead of Alphabet’s Q1 earnings release (scheduled for tomorrow, 24 April).
Awaiting the GOOGL Earnings Report
With the Nasdaq 100 index (US Tech 100 mini on FXOpen) having fallen by around 13.5% since the beginning of the year, investors are approaching tech earnings with caution. According to Barron’s, three key themes are expected to dominate the narrative:
→ management forecasts amid continued uncertainty around the White House’s tariff policy;
→ plans for major capital investment in AI-related infrastructure;
→ signs of softening consumer demand.
Given the current climate of uncertainty, Alphabet’s earnings report could prove particularly influential — serving as a benchmark for shaping market expectations ahead of other major tech company reports.
Technical Analysis of Alphabet (GOOGL)
The $150 level has served as key support throughout 2024, and over the coming days it may act as a springboard for a new price movement, potentially driven by the earnings results.
From a bearish perspective, the market remains in a downward trend (indicated in red) following a breakout below the lower boundary of a previously active rising channel (marked in purple) that had held since last autumn. However, if Alphabet’s management maintains an upbeat outlook for 2025, this could give the bulls the confidence to challenge the upper limit of the red channel.
Trade global index CFDs with zero commission and tight spreads. Open your FXOpen account now or learn more about trading index CFDs with FXOpen.
CFDs are complex instruments and come with a high risk of losing your money.
This article represents the opinion of the Companies operating under the FXOpen brand only. It is not to be construed as an offer, solicitation, or recommendation with respect to products and services provided by the Companies operating under the FXOpen brand, nor is it to be considered financial advice.
Alphabet (GOOGL) Shares Hover Near Psychological Level Ahead of Earnings Report
On 31 March, we noted that bearish sentiment could push Alphabet’s (GOOGL) share price towards the psychological level of $150. As the current price chart suggests, GOOGL is now trading close to that very level.
Moreover, the price is approximately equidistant from the recent highs and lows (marked A and B), which may be interpreted as a sign of balanced supply and demand — and a wait-and-see stance from market participants ahead of Alphabet’s Q1 earnings release (scheduled for tomorrow, 24 April).
Awaiting the GOOGL Earnings Report
With the Nasdaq 100 index (US Tech 100 mini on FXOpen) having fallen by around 13.5% since the beginning of the year, investors are approaching tech earnings with caution. According to Barron’s, three key themes are expected to dominate the narrative:
→ management forecasts amid continued uncertainty around the White House’s tariff policy;
→ plans for major capital investment in AI-related infrastructure;
→ signs of softening consumer demand.
Given the current climate of uncertainty, Alphabet’s earnings report could prove particularly influential — serving as a benchmark for shaping market expectations ahead of other major tech company reports.
Technical Analysis of Alphabet (GOOGL)
The $150 level has served as key support throughout 2024, and over the coming days it may act as a springboard for a new price movement, potentially driven by the earnings results.
From a bearish perspective, the market remains in a downward trend (indicated in red) following a breakout below the lower boundary of a previously active rising channel (marked in purple) that had held since last autumn. However, if Alphabet’s management maintains an upbeat outlook for 2025, this could give the bulls the confidence to challenge the upper limit of the red channel.
Trade global index CFDs with zero commission and tight spreads. Open your FXOpen account now or learn more about trading index CFDs with FXOpen.
CFDs are complex instruments and come with a high risk of losing your money.
This article represents the opinion of the Companies operating under the FXOpen brand only. It is not to be construed as an offer, solicitation, or recommendation with respect to products and services provided by the Companies operating under the FXOpen brand, nor is it to be considered financial advice.
👍1
#forextrading #tradingtips #marketanalysis #MarketUpdates
USD/CHF Rebounds from Multi-Year Low
As the charts show, the USD/CHF exchange rate fell below 0.810 US dollars per franc earlier this week. The pair had not traded this low since the 2008 financial crisis.
Demand for the Swiss franc as a safe-haven currency was driven by concerns over the escalation of the trade war between the United States and other major economies.
However, the USD/CHF pair has since rebounded and is currently trading above 0.825. This recovery was supported by yesterday’s statement from Finance Minister Bessent at the JPMorgan Private Investors Conference, where he expressed optimism about imminent de-escalation in trade tensions with China.
Technical Analysis of the USD/CHF Chart
The chart indicates that the trend remains bearish, highlighted by the descending channel marked in red. A bullish attempt to push the price into the upper half of the channel earlier this morning (as shown by the arrow) failed to produce any significant momentum.
The price is fluctuating around the median line, a level where supply and demand tend to balance. It is possible that the market has already priced in the positive news from yesterday, and the bears may attempt to reassert pressure, driving the price back towards the 0.810 support level.
Nevertheless, much will depend on the fundamental backdrop. A stronger dollar could follow in response to possible developments such as:
→ a statement from China signalling readiness to de-escalate its tariff policy;
→ signs of progress in trade deals between the United States and key partners such as Japan, South Korea, and India.
Trade over 50 forex markets 24 hours a day with FXOpen. Take advantage of low commissions, deep liquidity, and spreads from 0.0 pips. Open your FXOpen account now or learn more about trading forex with FXOpen.
CFDs are complex instruments and come with a high risk of losing your money.
This article represents the opinion of the Companies operating under the FXOpen brand only. It is not to be construed as an offer, solicitation, or recommendation with respect to products and services provided by the Companies operating under the FXOpen brand, nor is it to be considered financial advice.
USD/CHF Rebounds from Multi-Year Low
As the charts show, the USD/CHF exchange rate fell below 0.810 US dollars per franc earlier this week. The pair had not traded this low since the 2008 financial crisis.
Demand for the Swiss franc as a safe-haven currency was driven by concerns over the escalation of the trade war between the United States and other major economies.
However, the USD/CHF pair has since rebounded and is currently trading above 0.825. This recovery was supported by yesterday’s statement from Finance Minister Bessent at the JPMorgan Private Investors Conference, where he expressed optimism about imminent de-escalation in trade tensions with China.
Technical Analysis of the USD/CHF Chart
The chart indicates that the trend remains bearish, highlighted by the descending channel marked in red. A bullish attempt to push the price into the upper half of the channel earlier this morning (as shown by the arrow) failed to produce any significant momentum.
The price is fluctuating around the median line, a level where supply and demand tend to balance. It is possible that the market has already priced in the positive news from yesterday, and the bears may attempt to reassert pressure, driving the price back towards the 0.810 support level.
Nevertheless, much will depend on the fundamental backdrop. A stronger dollar could follow in response to possible developments such as:
→ a statement from China signalling readiness to de-escalate its tariff policy;
→ signs of progress in trade deals between the United States and key partners such as Japan, South Korea, and India.
Trade over 50 forex markets 24 hours a day with FXOpen. Take advantage of low commissions, deep liquidity, and spreads from 0.0 pips. Open your FXOpen account now or learn more about trading forex with FXOpen.
CFDs are complex instruments and come with a high risk of losing your money.
This article represents the opinion of the Companies operating under the FXOpen brand only. It is not to be construed as an offer, solicitation, or recommendation with respect to products and services provided by the Companies operating under the FXOpen brand, nor is it to be considered financial advice.

👍2
#stockmarket #stocktrading #IBM #MarketUpdates #marketanalysis
IBM Share Price Falls Following Earnings Report
Yesterday, after the close of the main trading session, International Business Machines (IBM) released its Q1 earnings report, exceeding Wall Street analysts’ expectations in several key areas. According to FactSet:
→ Earnings per share came in at $1.60 (forecast = $1.42), although this was below last year’s figure of $1.68.
→ Quarterly revenue reached $14.54 billion (forecast = $14.39 billion), marking a 1% increase year-on-year.
Initially, IBM shares rose on the news, but then dropped by approximately 6% during after-hours trading, according to Google Finance.
This suggests that today’s trading session may see IBM shares open below the $230 mark.
Market participants may have been disappointed by the following:
→ IBM’s mainframe business (large-scale computing systems designed for high-volume data processing) continued its decline, falling by 6% year-on-year.
→ Revenue from software and consulting divisions increased, but only by 3% compared to the same period last year.
→ The revenue forecast for Q2 stands at $6.6 billion – a 3% decline relative to the same quarter in 2024.
Technical Analysis of IBM Share Price
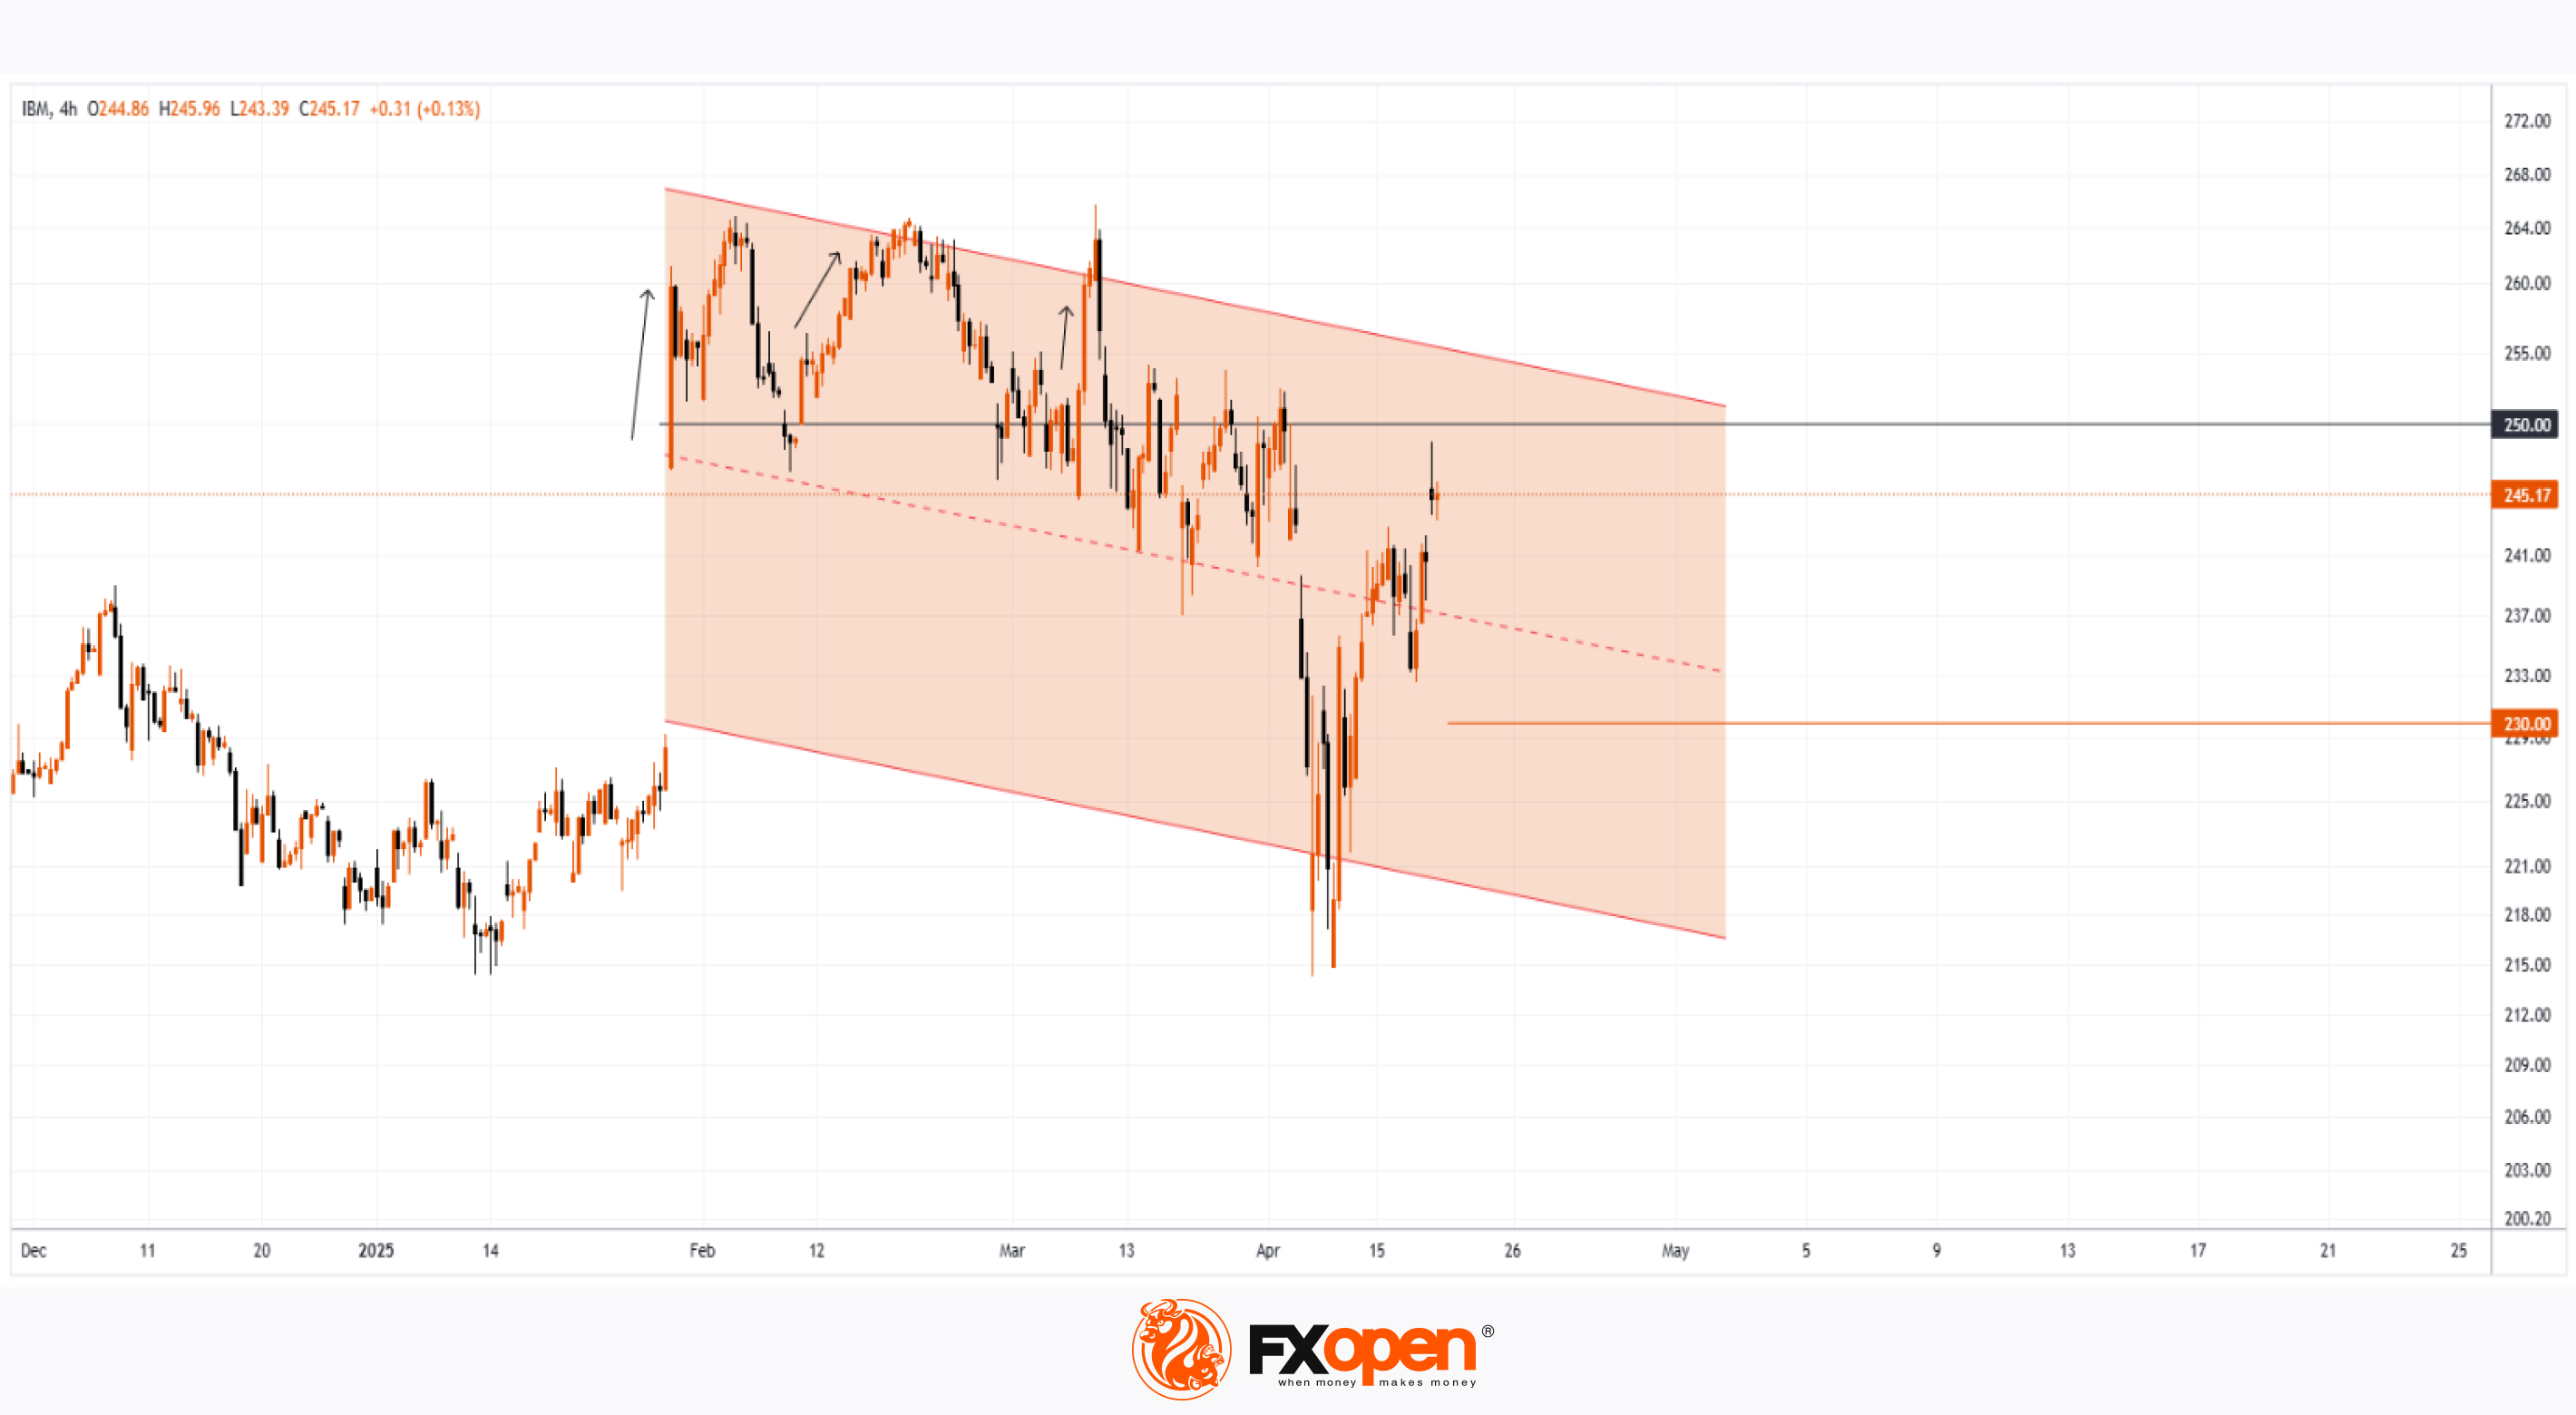
The chart shows signs of seller activity above the psychological level of $250. As indicated by the arrows, the price attempted several rallies above this level with varying momentum, but each time retreated back.
At the same time, price fluctuations formed a downward channel, which was extended to the downside in early April amid news regarding new tariffs in international trade.
Price stabilisation observed between 15–17 April suggests that supply and demand were temporarily balanced ahead of the earnings release. However, the negative market reaction to the report may shift sentiment and act as a catalyst for further price movement towards the lower boundary of the channel, around the key support level of $215.
Trade global index CFDs with zero commission and tight spreads. Open your FXOpen account now or learn more about trading index CFDs with FXOpen.
CFDs are complex instruments and come with a high risk of losing your money.
This article represents the opinion of the Companies operating under the FXOpen brand only. It is not to be construed as an offer, solicitation, or recommendation with respect to products and services provided by the Companies operating under the FXOpen brand, nor is it to be considered financial advice.
IBM Share Price Falls Following Earnings Report
Yesterday, after the close of the main trading session, International Business Machines (IBM) released its Q1 earnings report, exceeding Wall Street analysts’ expectations in several key areas. According to FactSet:
→ Earnings per share came in at $1.60 (forecast = $1.42), although this was below last year’s figure of $1.68.
→ Quarterly revenue reached $14.54 billion (forecast = $14.39 billion), marking a 1% increase year-on-year.
Initially, IBM shares rose on the news, but then dropped by approximately 6% during after-hours trading, according to Google Finance.
This suggests that today’s trading session may see IBM shares open below the $230 mark.
Market participants may have been disappointed by the following:
→ IBM’s mainframe business (large-scale computing systems designed for high-volume data processing) continued its decline, falling by 6% year-on-year.
→ Revenue from software and consulting divisions increased, but only by 3% compared to the same period last year.
→ The revenue forecast for Q2 stands at $6.6 billion – a 3% decline relative to the same quarter in 2024.
Technical Analysis of IBM Share Price
The chart shows signs of seller activity above the psychological level of $250. As indicated by the arrows, the price attempted several rallies above this level with varying momentum, but each time retreated back.
At the same time, price fluctuations formed a downward channel, which was extended to the downside in early April amid news regarding new tariffs in international trade.
Price stabilisation observed between 15–17 April suggests that supply and demand were temporarily balanced ahead of the earnings release. However, the negative market reaction to the report may shift sentiment and act as a catalyst for further price movement towards the lower boundary of the channel, around the key support level of $215.
Trade global index CFDs with zero commission and tight spreads. Open your FXOpen account now or learn more about trading index CFDs with FXOpen.
CFDs are complex instruments and come with a high risk of losing your money.
This article represents the opinion of the Companies operating under the FXOpen brand only. It is not to be construed as an offer, solicitation, or recommendation with respect to products and services provided by the Companies operating under the FXOpen brand, nor is it to be considered financial advice.
👍2
#stockmarket #stocktrading #MarketUpdates #marketanalysis
Why Coinbase (COIN) Shares Are Rising
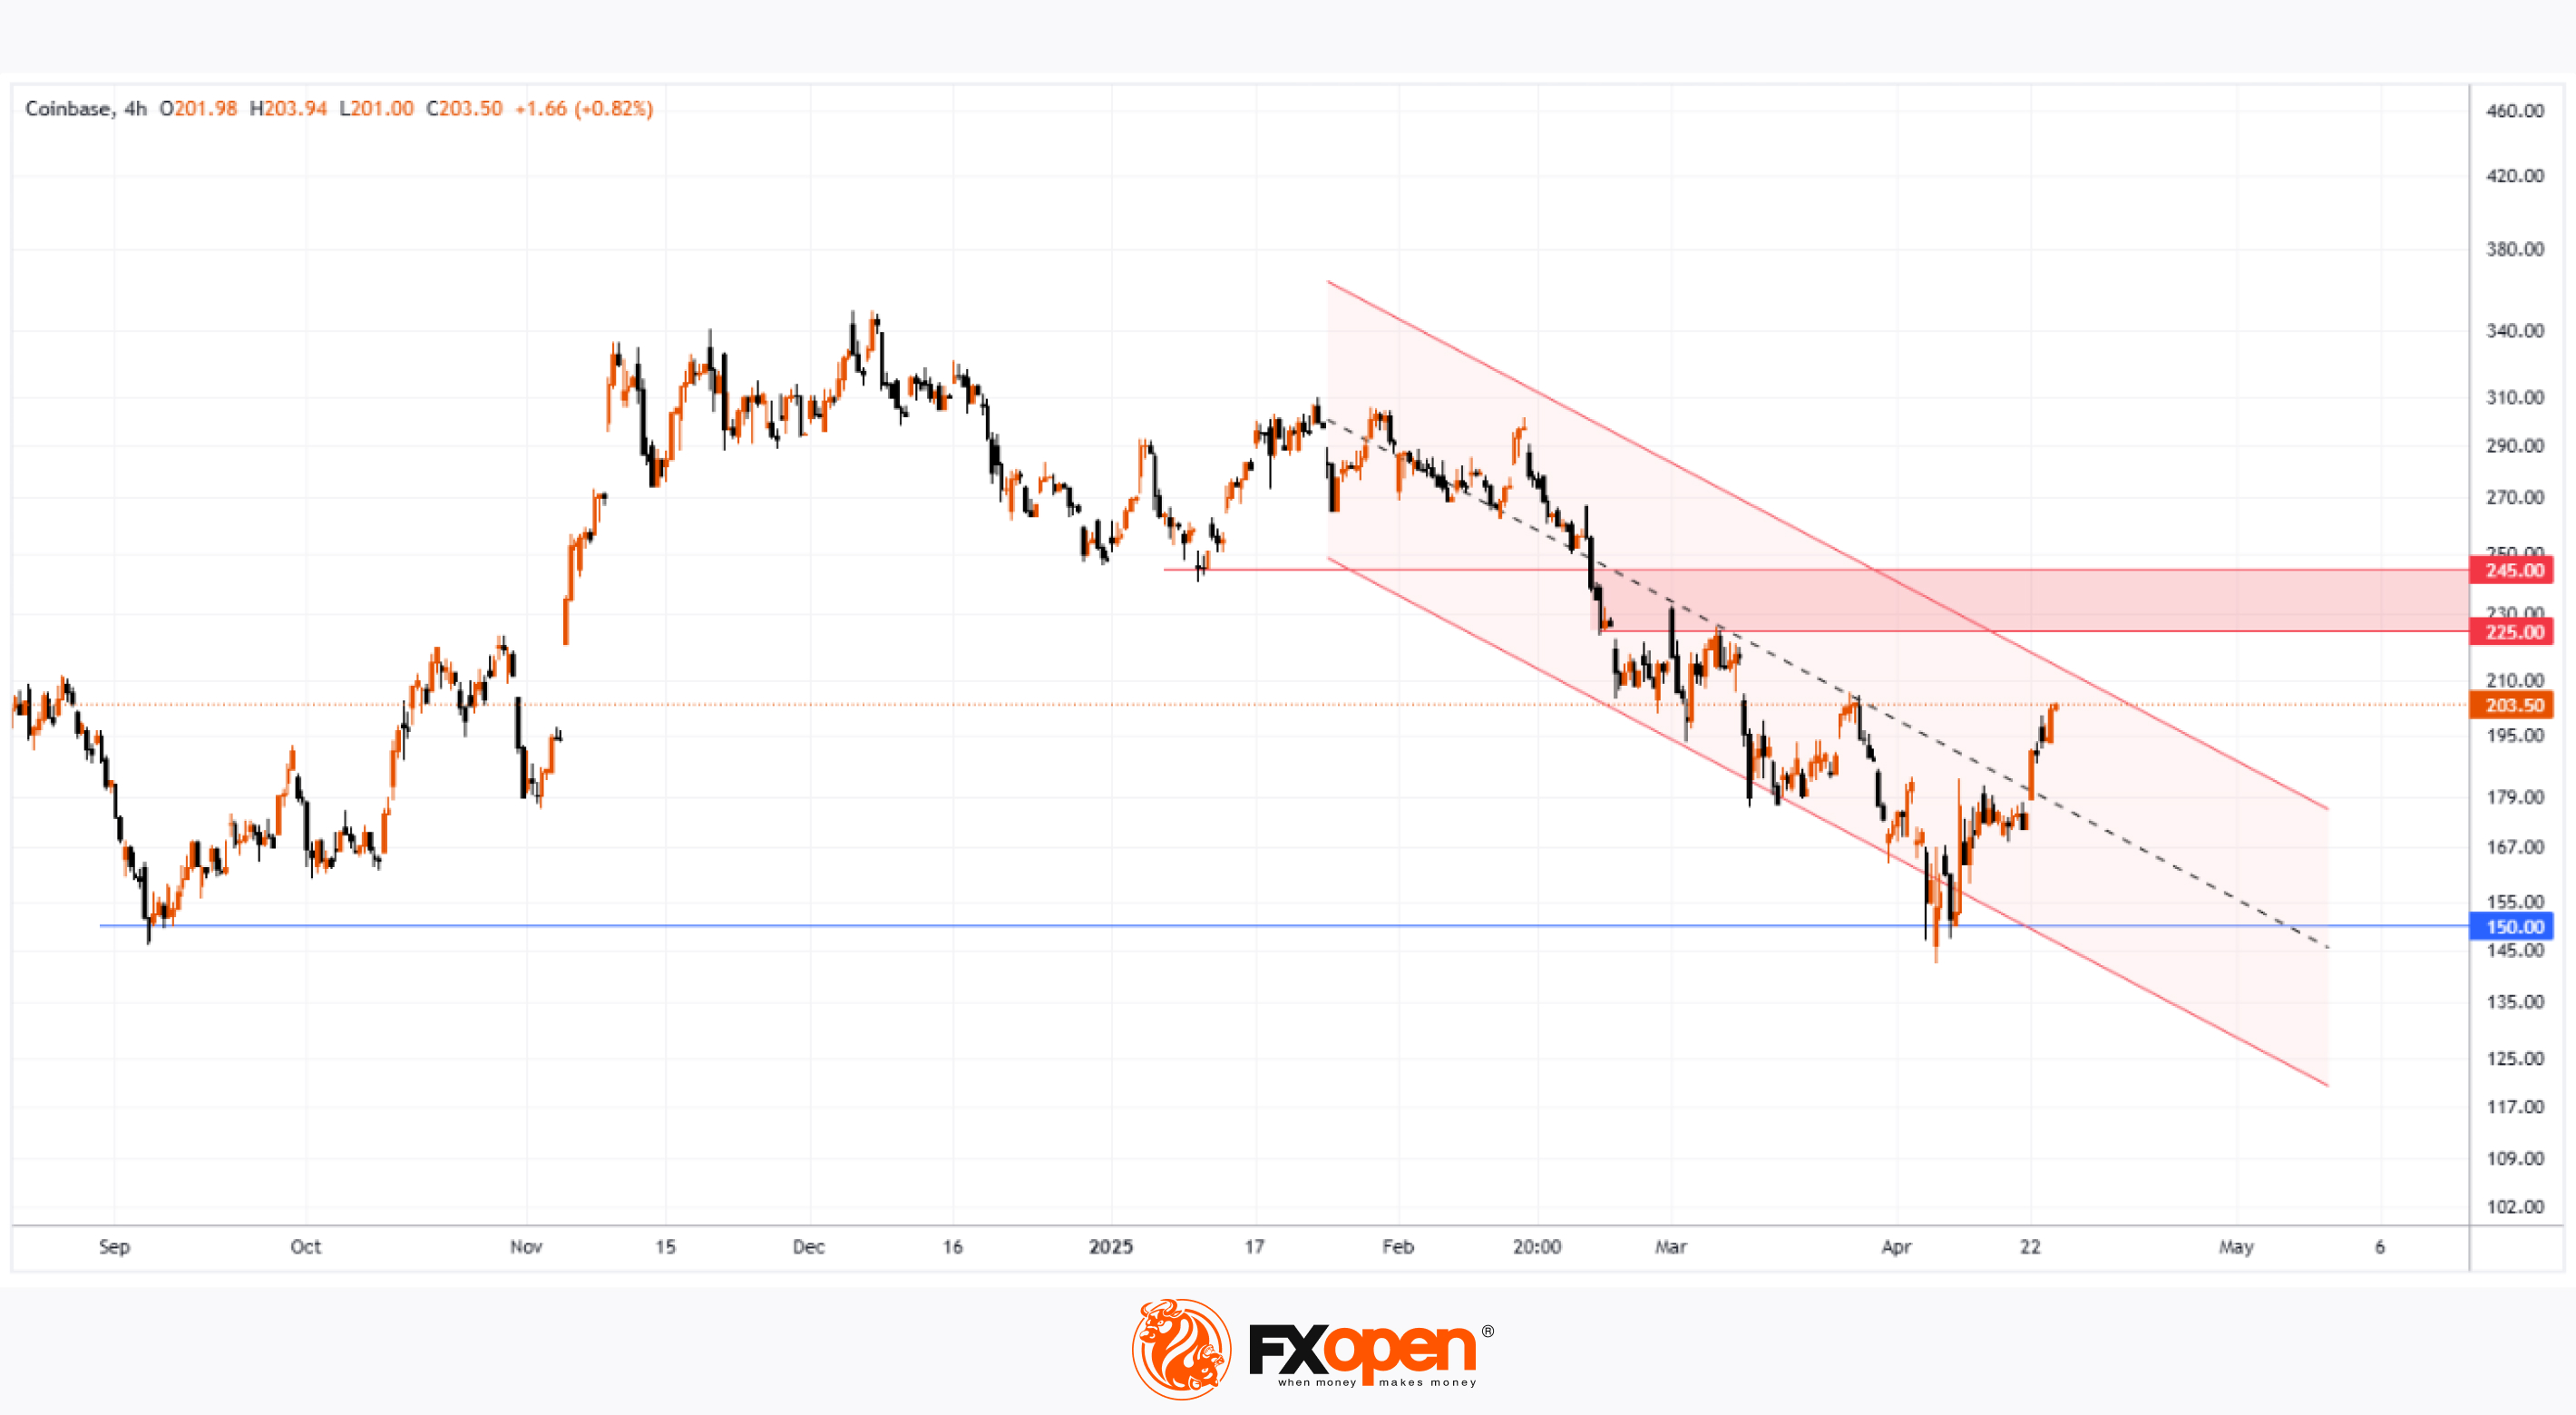
As the Coinbase (COIN) stock chart shows, trading closed yesterday above the $200 mark — for the first time since March.
Since the beginning of April, COIN's share price has risen by nearly 20%, while the S&P 500 index (US SPX 500 mini on FXOpen) has declined by approximately 2%.
Bullish Drivers Behind COIN’s Price Rise
According to media reports, several factors are contributing to the bullish momentum:
→ Yesterday’s announcement that Coinbase and PayPal are expanding their partnership in the areas of crypto payments and decentralised finance (DeFi). The collaboration aims to increase the adoption of the PYUSD stablecoin and integrate it into merchant settlements.
→ The anticipated adoption of US stablecoin legislation, designed to establish a regulatory framework for the use of stablecoins. This is being supported by the Trump administration’s progressive stance on cryptocurrencies, including the appointment of crypto-friendly officials, the creation of a strategic crypto reserve, and other pro-crypto initiatives.
Technical Analysis of COIN Stock
The psychological level of $150, which served as strong support in 2024, has proven resilient again in April 2025. However, despite the rapid rise in price from $150 to $200 in under three weeks, there are reasons to believe that bullish sentiment may begin to fade:
→ The COIN share price remains within a downward trend, highlighted by a channel originating in early 2025.
→ The upper boundary of the channel may act as a resistance level.
→ Bears have previously demonstrated control in the $225–240 zone, where the price declined sharply (marked with a red rectangle).
Trade global index CFDs with zero commission and tight spreads. Open your FXOpen account now or learn more about trading index CFDs with FXOpen.
CFDs are complex instruments and come with a high risk of losing your money.
This article represents the opinion of the Companies operating under the FXOpen brand only. It is not to be construed as an offer, solicitation, or recommendation with respect to products and services provided by the Companies operating under the FXOpen brand, nor is it to be considered financial advice.
Why Coinbase (COIN) Shares Are Rising
As the Coinbase (COIN) stock chart shows, trading closed yesterday above the $200 mark — for the first time since March.
Since the beginning of April, COIN's share price has risen by nearly 20%, while the S&P 500 index (US SPX 500 mini on FXOpen) has declined by approximately 2%.
Bullish Drivers Behind COIN’s Price Rise
According to media reports, several factors are contributing to the bullish momentum:
→ Yesterday’s announcement that Coinbase and PayPal are expanding their partnership in the areas of crypto payments and decentralised finance (DeFi). The collaboration aims to increase the adoption of the PYUSD stablecoin and integrate it into merchant settlements.
→ The anticipated adoption of US stablecoin legislation, designed to establish a regulatory framework for the use of stablecoins. This is being supported by the Trump administration’s progressive stance on cryptocurrencies, including the appointment of crypto-friendly officials, the creation of a strategic crypto reserve, and other pro-crypto initiatives.
Technical Analysis of COIN Stock
The psychological level of $150, which served as strong support in 2024, has proven resilient again in April 2025. However, despite the rapid rise in price from $150 to $200 in under three weeks, there are reasons to believe that bullish sentiment may begin to fade:
→ The COIN share price remains within a downward trend, highlighted by a channel originating in early 2025.
→ The upper boundary of the channel may act as a resistance level.
→ Bears have previously demonstrated control in the $225–240 zone, where the price declined sharply (marked with a red rectangle).
Trade global index CFDs with zero commission and tight spreads. Open your FXOpen account now or learn more about trading index CFDs with FXOpen.
CFDs are complex instruments and come with a high risk of losing your money.
This article represents the opinion of the Companies operating under the FXOpen brand only. It is not to be construed as an offer, solicitation, or recommendation with respect to products and services provided by the Companies operating under the FXOpen brand, nor is it to be considered financial advice.
👍1
#usdcad #tradingforex #forextrading #MarketUpdates
USD/CAD Consolidates
In the second half of April, the USD/CAD chart has shown a decline in volatility following significant spikes observed since February.
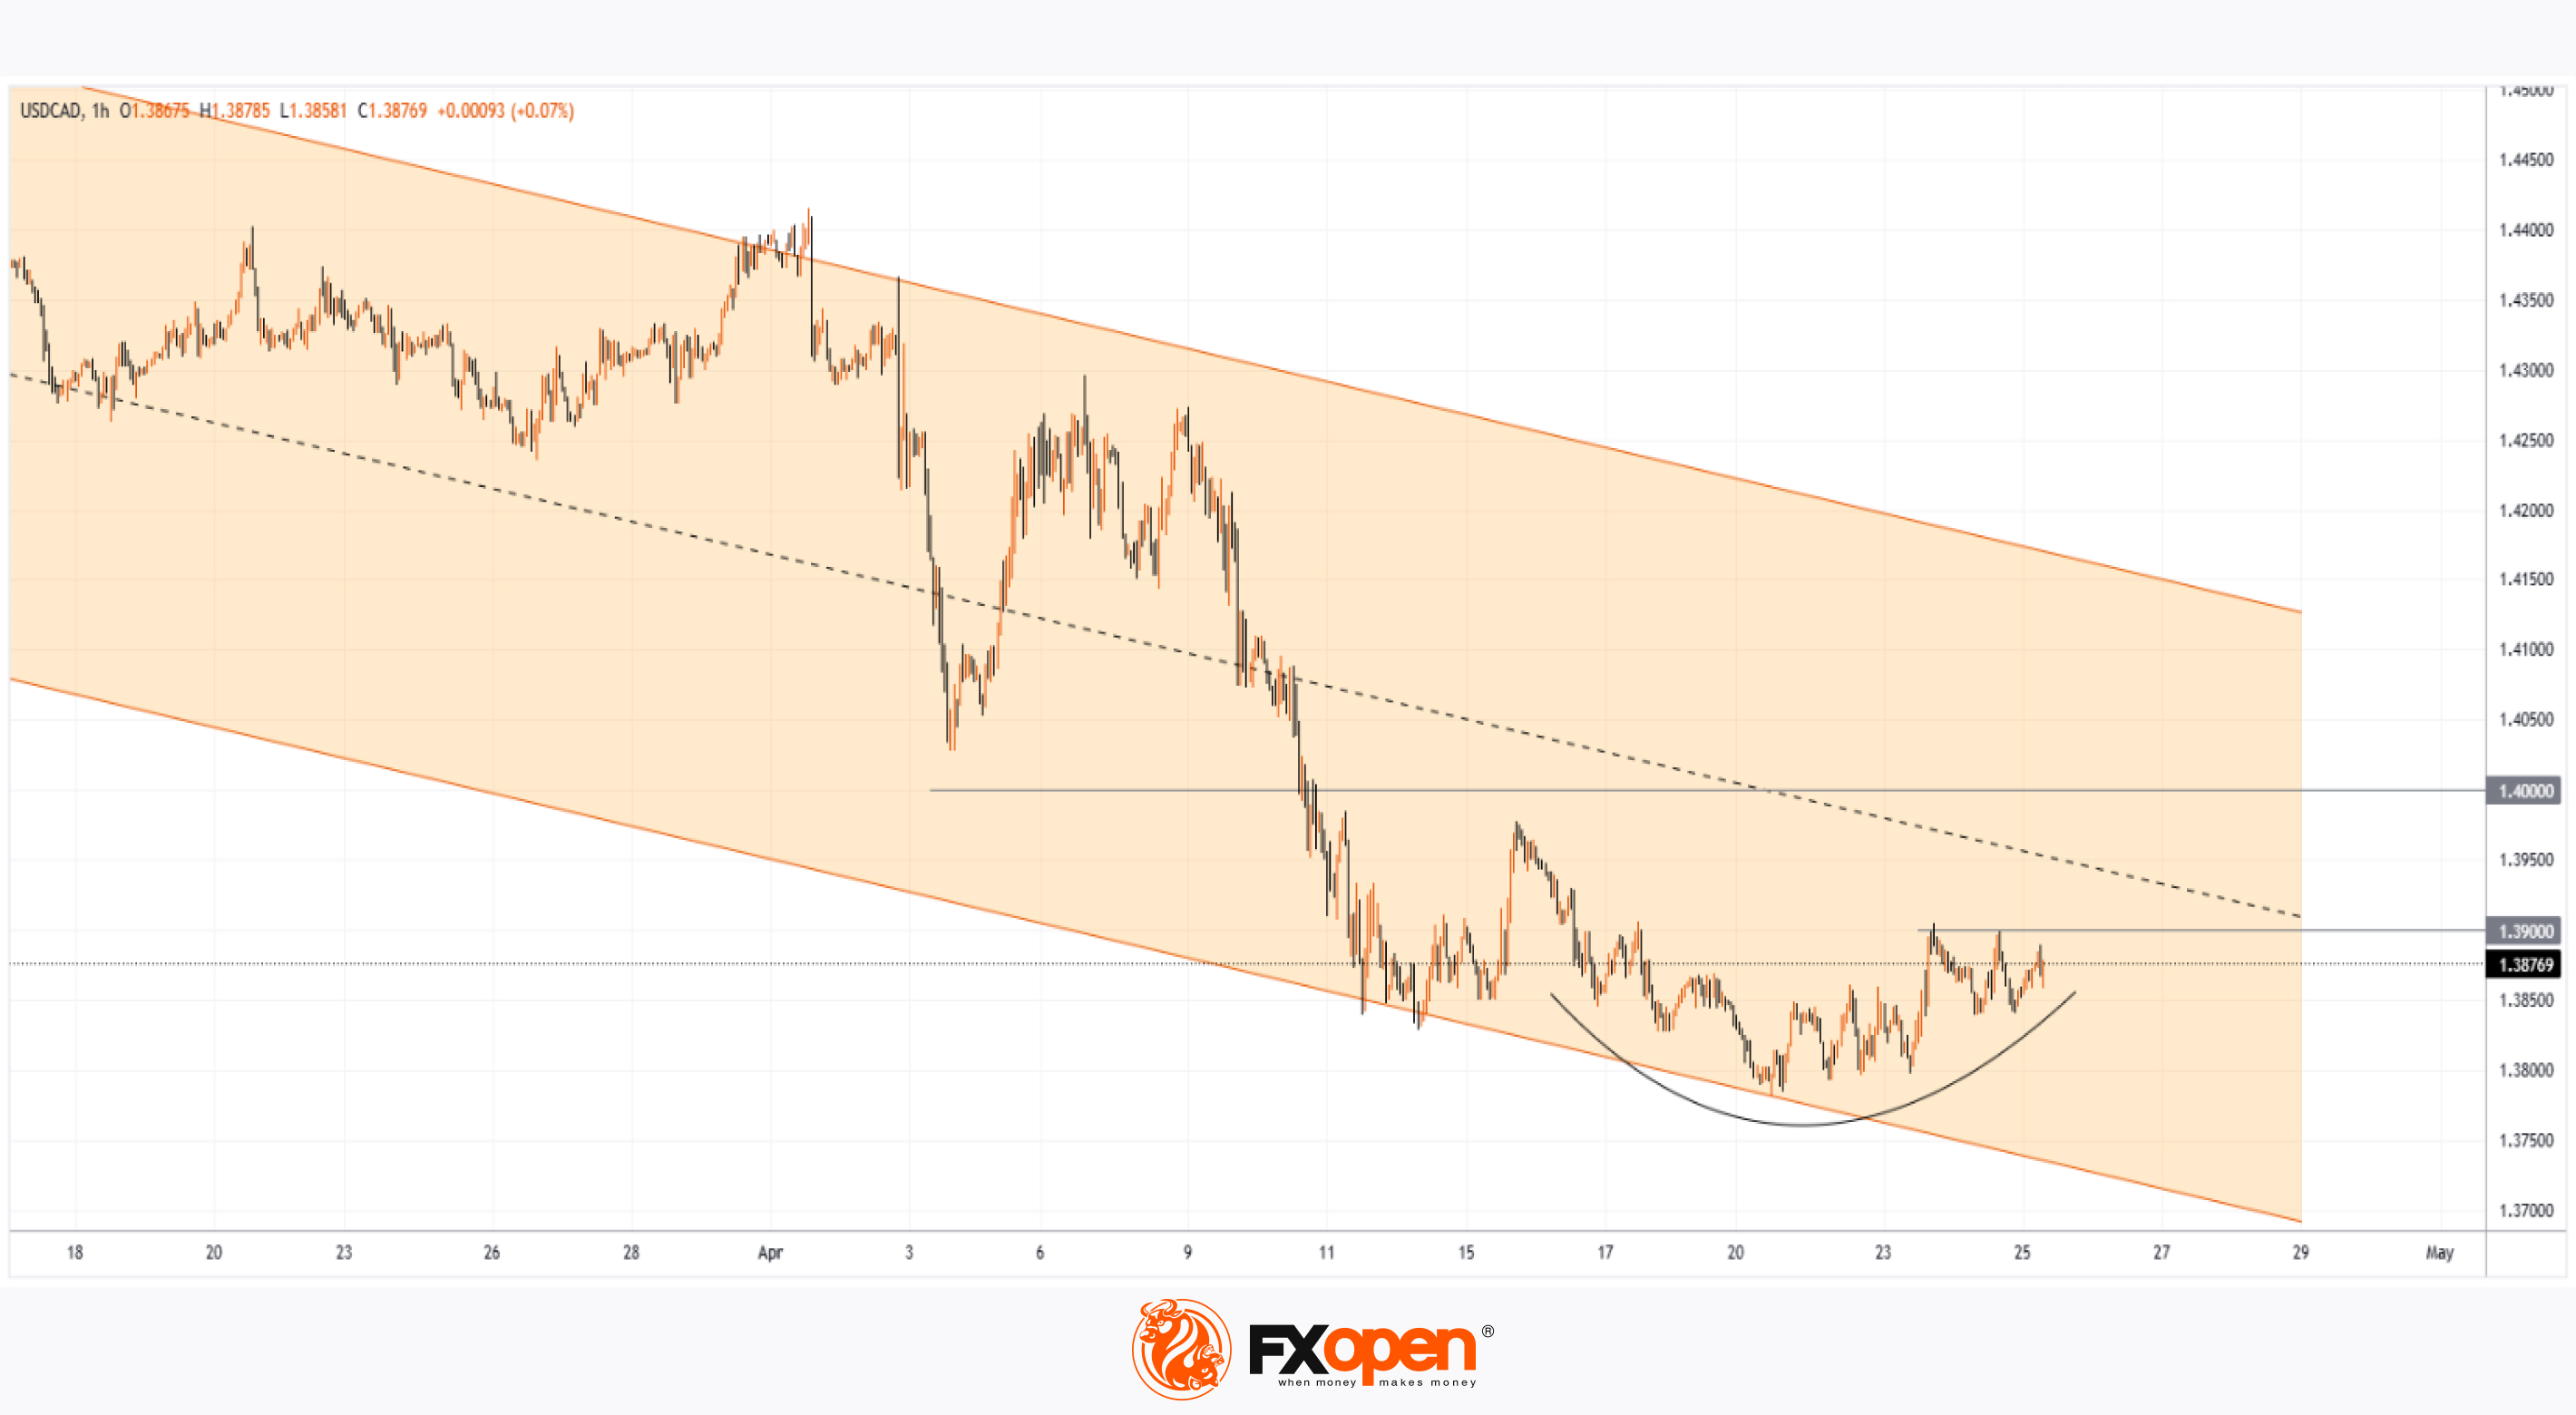
The Canadian dollar has stabilised against the US dollar within the 1.390–1.380 range over the past week, as market participants assess what a fair USD/CAD rate might be, given the evolving news backdrop:
→ The US dollar gained upward momentum on hopes of easing trade tensions between the US and China, although the information remains conflicting — Trump claims negotiations are ongoing, while Beijing denies this.
→ Oil prices — a key Canadian export — have recovered by more than 10% from their April lows, providing support for the Canadian dollar.
→ Economic data published this week suggests a cooling in the Canadian economy: employment is declining, and the pace of average wage growth has slowed to 5.4%.
→ Although an important political event — the Canadian Parliamentary elections — is set to take place this weekend, it appears to have had little impact on the USD/CAD exchange rate so far. Trade tariffs between the US and Canada likely remain the dominant concern.
Technical Analysis of the USD/CAD Chart
Price fluctuations have formed a descending channel that originated in March.
From a bearish perspective, resistance may be encountered at:
→ the median line of the channel;
→ the psychological level of 1.400.
From a bullish perspective:
→ the price has formed a rounding bottom pattern near the 1.380 level;
→ the lower boundary of the channel is acting as significant support.
It is possible that the weekend will bring key developments that could act as catalysts, breaking the established range between 1.390 and 1.380.
Trade over 50 forex markets 24 hours a day with FXOpen. Take advantage of low commissions, deep liquidity, and spreads from 0.0 pips. Open your FXOpen account now or learn more about trading forex with FXOpen.
CFDs are complex instruments and come with a high risk of losing your money.
This article represents the opinion of the Companies operating under the FXOpen brand only. It is not to be construed as an offer, solicitation, or recommendation with respect to products and services provided by the Companies operating under the FXOpen brand, nor is it to be considered financial advice.
USD/CAD Consolidates
In the second half of April, the USD/CAD chart has shown a decline in volatility following significant spikes observed since February.
The Canadian dollar has stabilised against the US dollar within the 1.390–1.380 range over the past week, as market participants assess what a fair USD/CAD rate might be, given the evolving news backdrop:
→ The US dollar gained upward momentum on hopes of easing trade tensions between the US and China, although the information remains conflicting — Trump claims negotiations are ongoing, while Beijing denies this.
→ Oil prices — a key Canadian export — have recovered by more than 10% from their April lows, providing support for the Canadian dollar.
→ Economic data published this week suggests a cooling in the Canadian economy: employment is declining, and the pace of average wage growth has slowed to 5.4%.
→ Although an important political event — the Canadian Parliamentary elections — is set to take place this weekend, it appears to have had little impact on the USD/CAD exchange rate so far. Trade tariffs between the US and Canada likely remain the dominant concern.
Technical Analysis of the USD/CAD Chart
Price fluctuations have formed a descending channel that originated in March.
From a bearish perspective, resistance may be encountered at:
→ the median line of the channel;
→ the psychological level of 1.400.
From a bullish perspective:
→ the price has formed a rounding bottom pattern near the 1.380 level;
→ the lower boundary of the channel is acting as significant support.
It is possible that the weekend will bring key developments that could act as catalysts, breaking the established range between 1.390 and 1.380.
Trade over 50 forex markets 24 hours a day with FXOpen. Take advantage of low commissions, deep liquidity, and spreads from 0.0 pips. Open your FXOpen account now or learn more about trading forex with FXOpen.
CFDs are complex instruments and come with a high risk of losing your money.
This article represents the opinion of the Companies operating under the FXOpen brand only. It is not to be construed as an offer, solicitation, or recommendation with respect to products and services provided by the Companies operating under the FXOpen brand, nor is it to be considered financial advice.
👍2
#sp500 #stockmarket #stocktrading #marketanalysis #MarketNews
S&P 500 Chart Analysis Ahead of the Busiest Week of Earnings Season
Despite the fact that President Trump’s earlier decision to impose tariffs (at higher rates than expected) shook the stock markets, the S&P 500 index (US SPX 500 mini on FXOpen) could still end April without significant losses (currently trading less than 2% below the month’s opening level) or even achieve a positive result.
According to media reports, around 180 S&P 500 companies are expected to release their quarterly earnings this week, including Apple (AAPL), Amazon (AMZN), Coca-Cola (KO), Eli Lilly (LLY), Meta (META), Microsoft (MSFT), and Chevron (CVX).
The share prices of these major companies — some of the largest by market capitalisation — could have a substantial impact on the S&P 500 index chart (US SPX 500 mini on FXOpen), given that their combined weight accounts for approximately a quarter of the index calculation.
Technical Analysis of the S&P 500 Chart
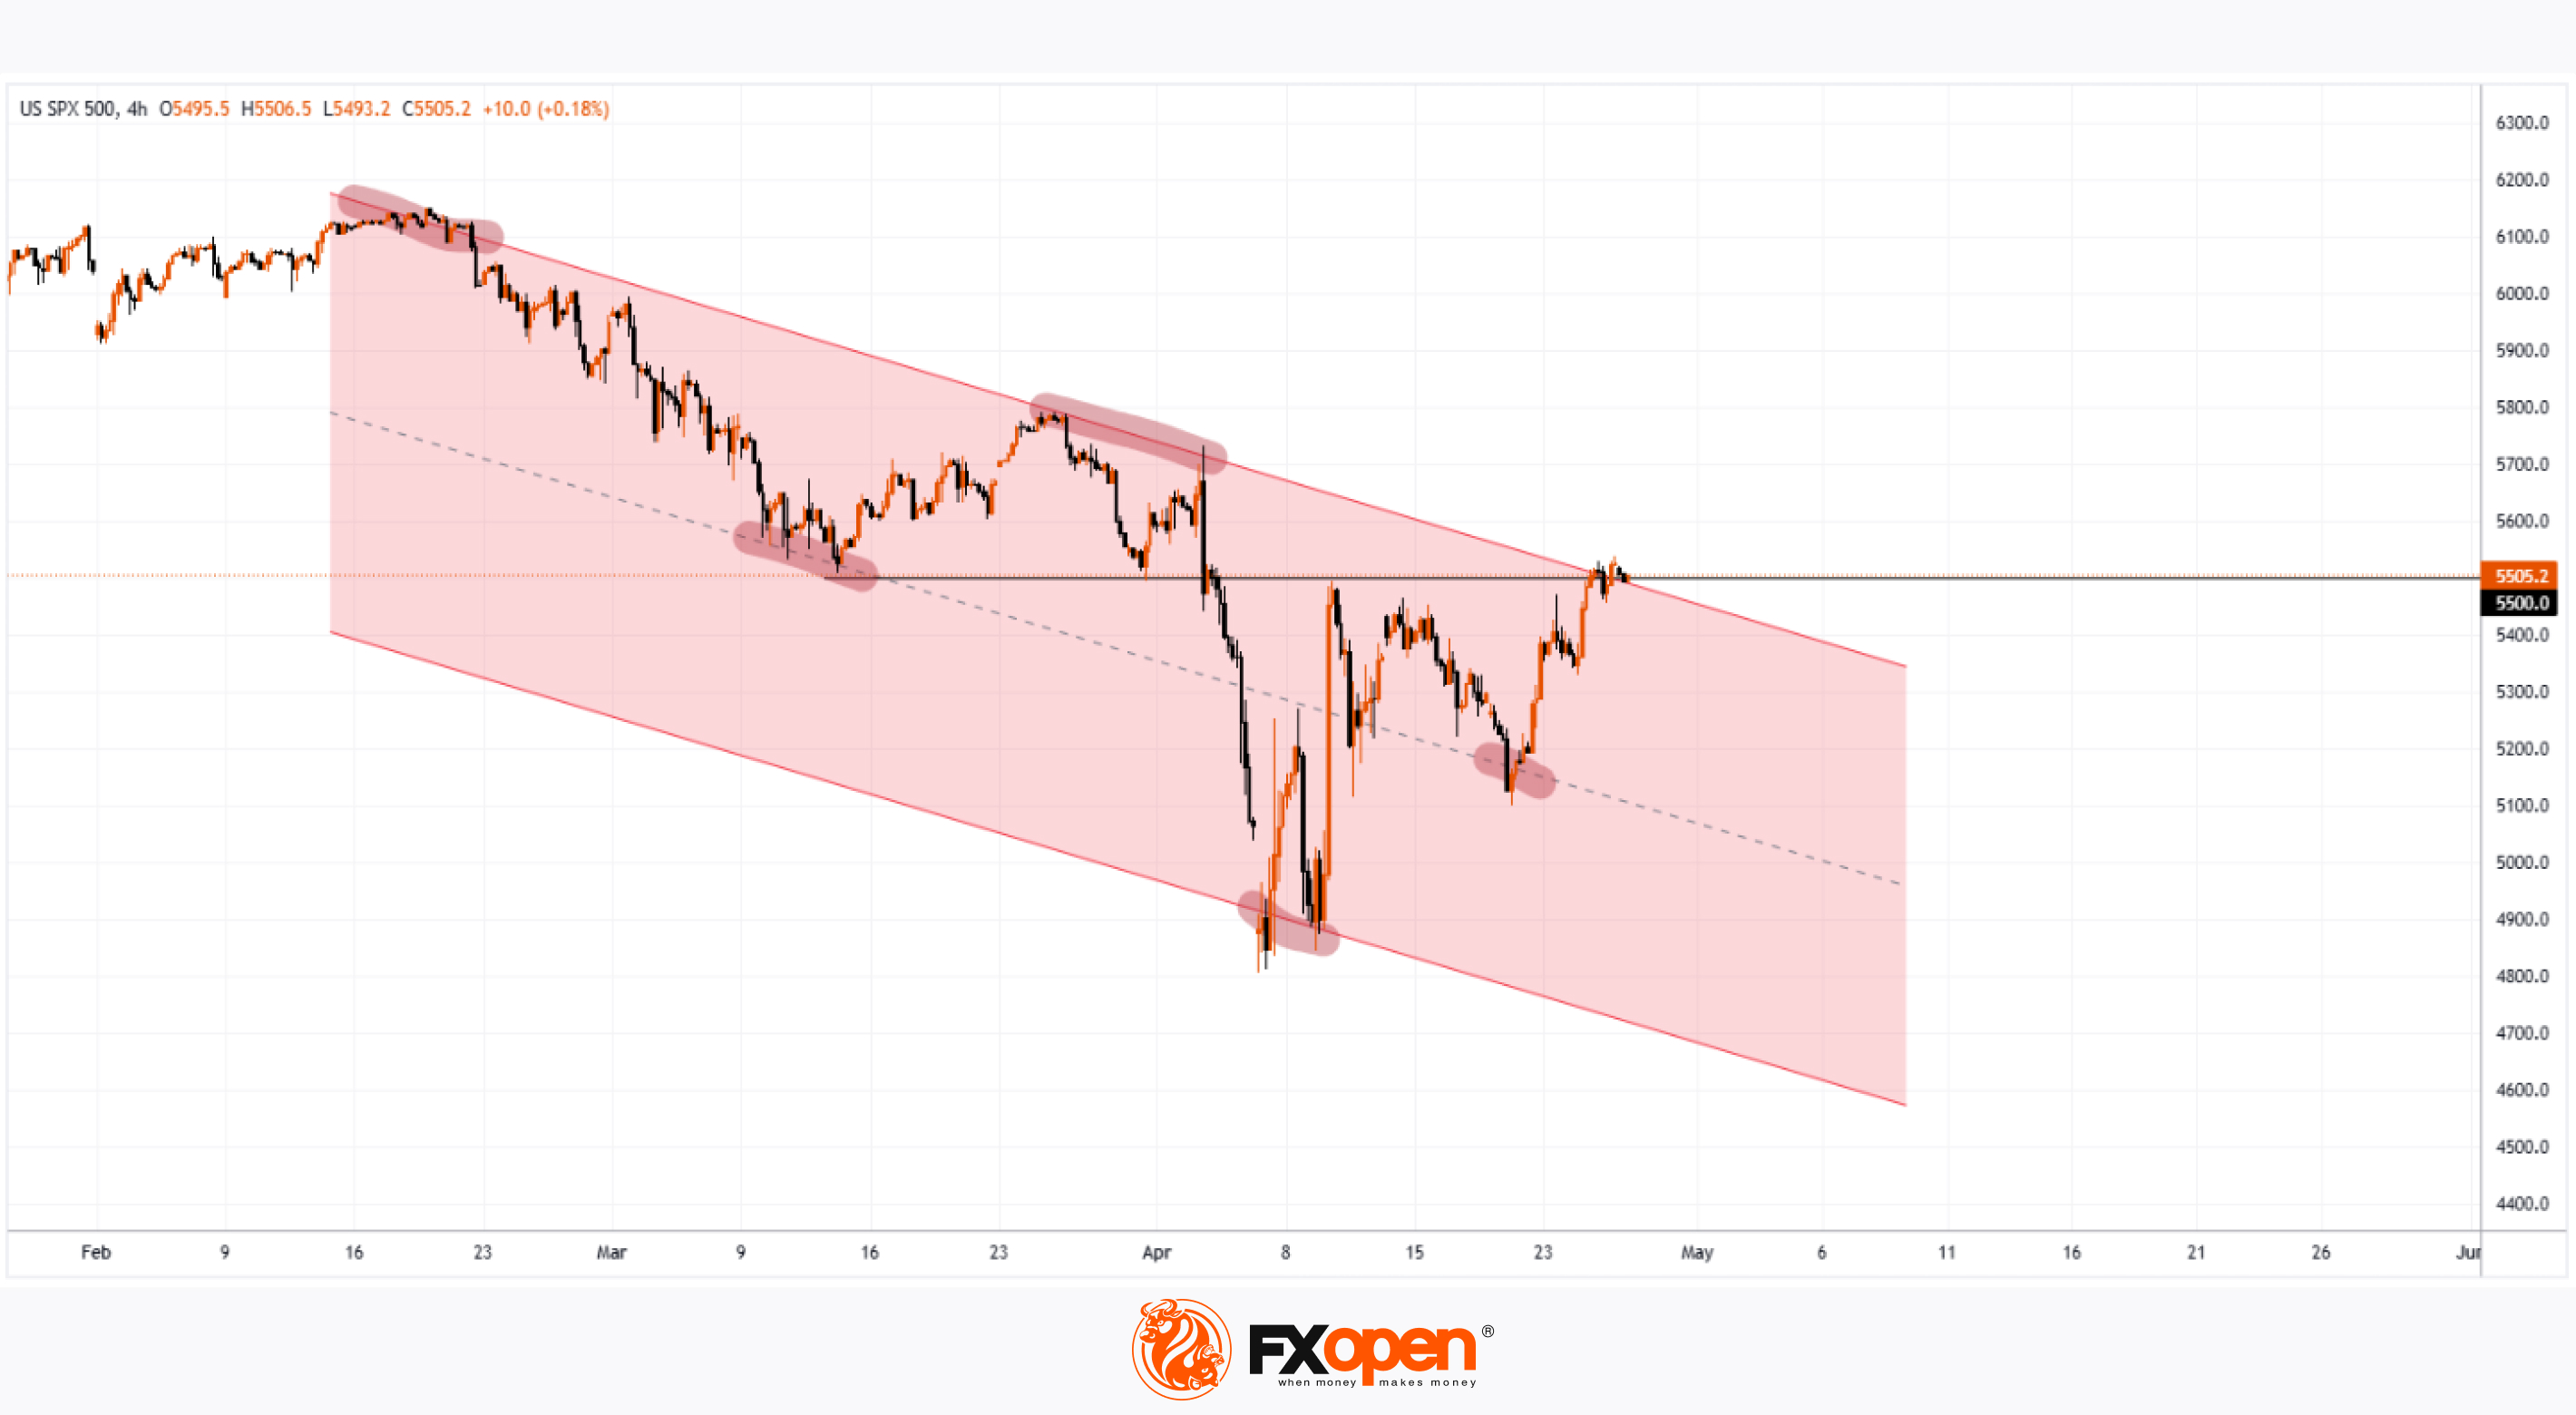
Based on the key price actions marked on the chart, we can identify a descending trend channel for the US stock market, which has been in effect since mid-February.
At the same time, the price has:
→ moved into the upper half of this channel, reaching its upper boundary;
→ found support around the median line (as evidenced by the price action on 21 April).
These are bullish signs, reinforced by the aggressive nature of the rebound from the psychological 5,000-point level, which acted as significant support in the first few days following the tariff announcement. Bears may still see an attractive opportunity to attempt to resume the downward momentum of the S&P 500 index (US SPX 500 mini on FXOpen), but will the fundamental backdrop support such a move?
From an optimistic perspective, sharp impulses driven by corporate news could lead to a breakout above the upper boundary of the red channel. This would likely be facilitated by important announcements (particularly from senior officials in the US, China, and Europe) regarding de-escalation of the tariff situation.
Trade global index CFDs with zero commission and tight spreads. Open your FXOpen account now or learn more about trading index CFDs with FXOpen.
CFDs are complex instruments and come with a high risk of losing your money.
This article represents the opinion of the Companies operating under the FXOpen brand only. It is not to be construed as an offer, solicitation, or recommendation with respect to products and services provided by the Companies operating under the FXOpen brand, nor is it to be considered financial advice.
S&P 500 Chart Analysis Ahead of the Busiest Week of Earnings Season
Despite the fact that President Trump’s earlier decision to impose tariffs (at higher rates than expected) shook the stock markets, the S&P 500 index (US SPX 500 mini on FXOpen) could still end April without significant losses (currently trading less than 2% below the month’s opening level) or even achieve a positive result.
According to media reports, around 180 S&P 500 companies are expected to release their quarterly earnings this week, including Apple (AAPL), Amazon (AMZN), Coca-Cola (KO), Eli Lilly (LLY), Meta (META), Microsoft (MSFT), and Chevron (CVX).
The share prices of these major companies — some of the largest by market capitalisation — could have a substantial impact on the S&P 500 index chart (US SPX 500 mini on FXOpen), given that their combined weight accounts for approximately a quarter of the index calculation.
Technical Analysis of the S&P 500 Chart
Based on the key price actions marked on the chart, we can identify a descending trend channel for the US stock market, which has been in effect since mid-February.
At the same time, the price has:
→ moved into the upper half of this channel, reaching its upper boundary;
→ found support around the median line (as evidenced by the price action on 21 April).
These are bullish signs, reinforced by the aggressive nature of the rebound from the psychological 5,000-point level, which acted as significant support in the first few days following the tariff announcement. Bears may still see an attractive opportunity to attempt to resume the downward momentum of the S&P 500 index (US SPX 500 mini on FXOpen), but will the fundamental backdrop support such a move?
From an optimistic perspective, sharp impulses driven by corporate news could lead to a breakout above the upper boundary of the red channel. This would likely be facilitated by important announcements (particularly from senior officials in the US, China, and Europe) regarding de-escalation of the tariff situation.
Trade global index CFDs with zero commission and tight spreads. Open your FXOpen account now or learn more about trading index CFDs with FXOpen.
CFDs are complex instruments and come with a high risk of losing your money.
This article represents the opinion of the Companies operating under the FXOpen brand only. It is not to be construed as an offer, solicitation, or recommendation with respect to products and services provided by the Companies operating under the FXOpen brand, nor is it to be considered financial advice.
👍2
#stockmarket #stocktrading #MarketNews #MarketUpdates
An Important Bullish Pattern Forms on the NIO Share Price Chart
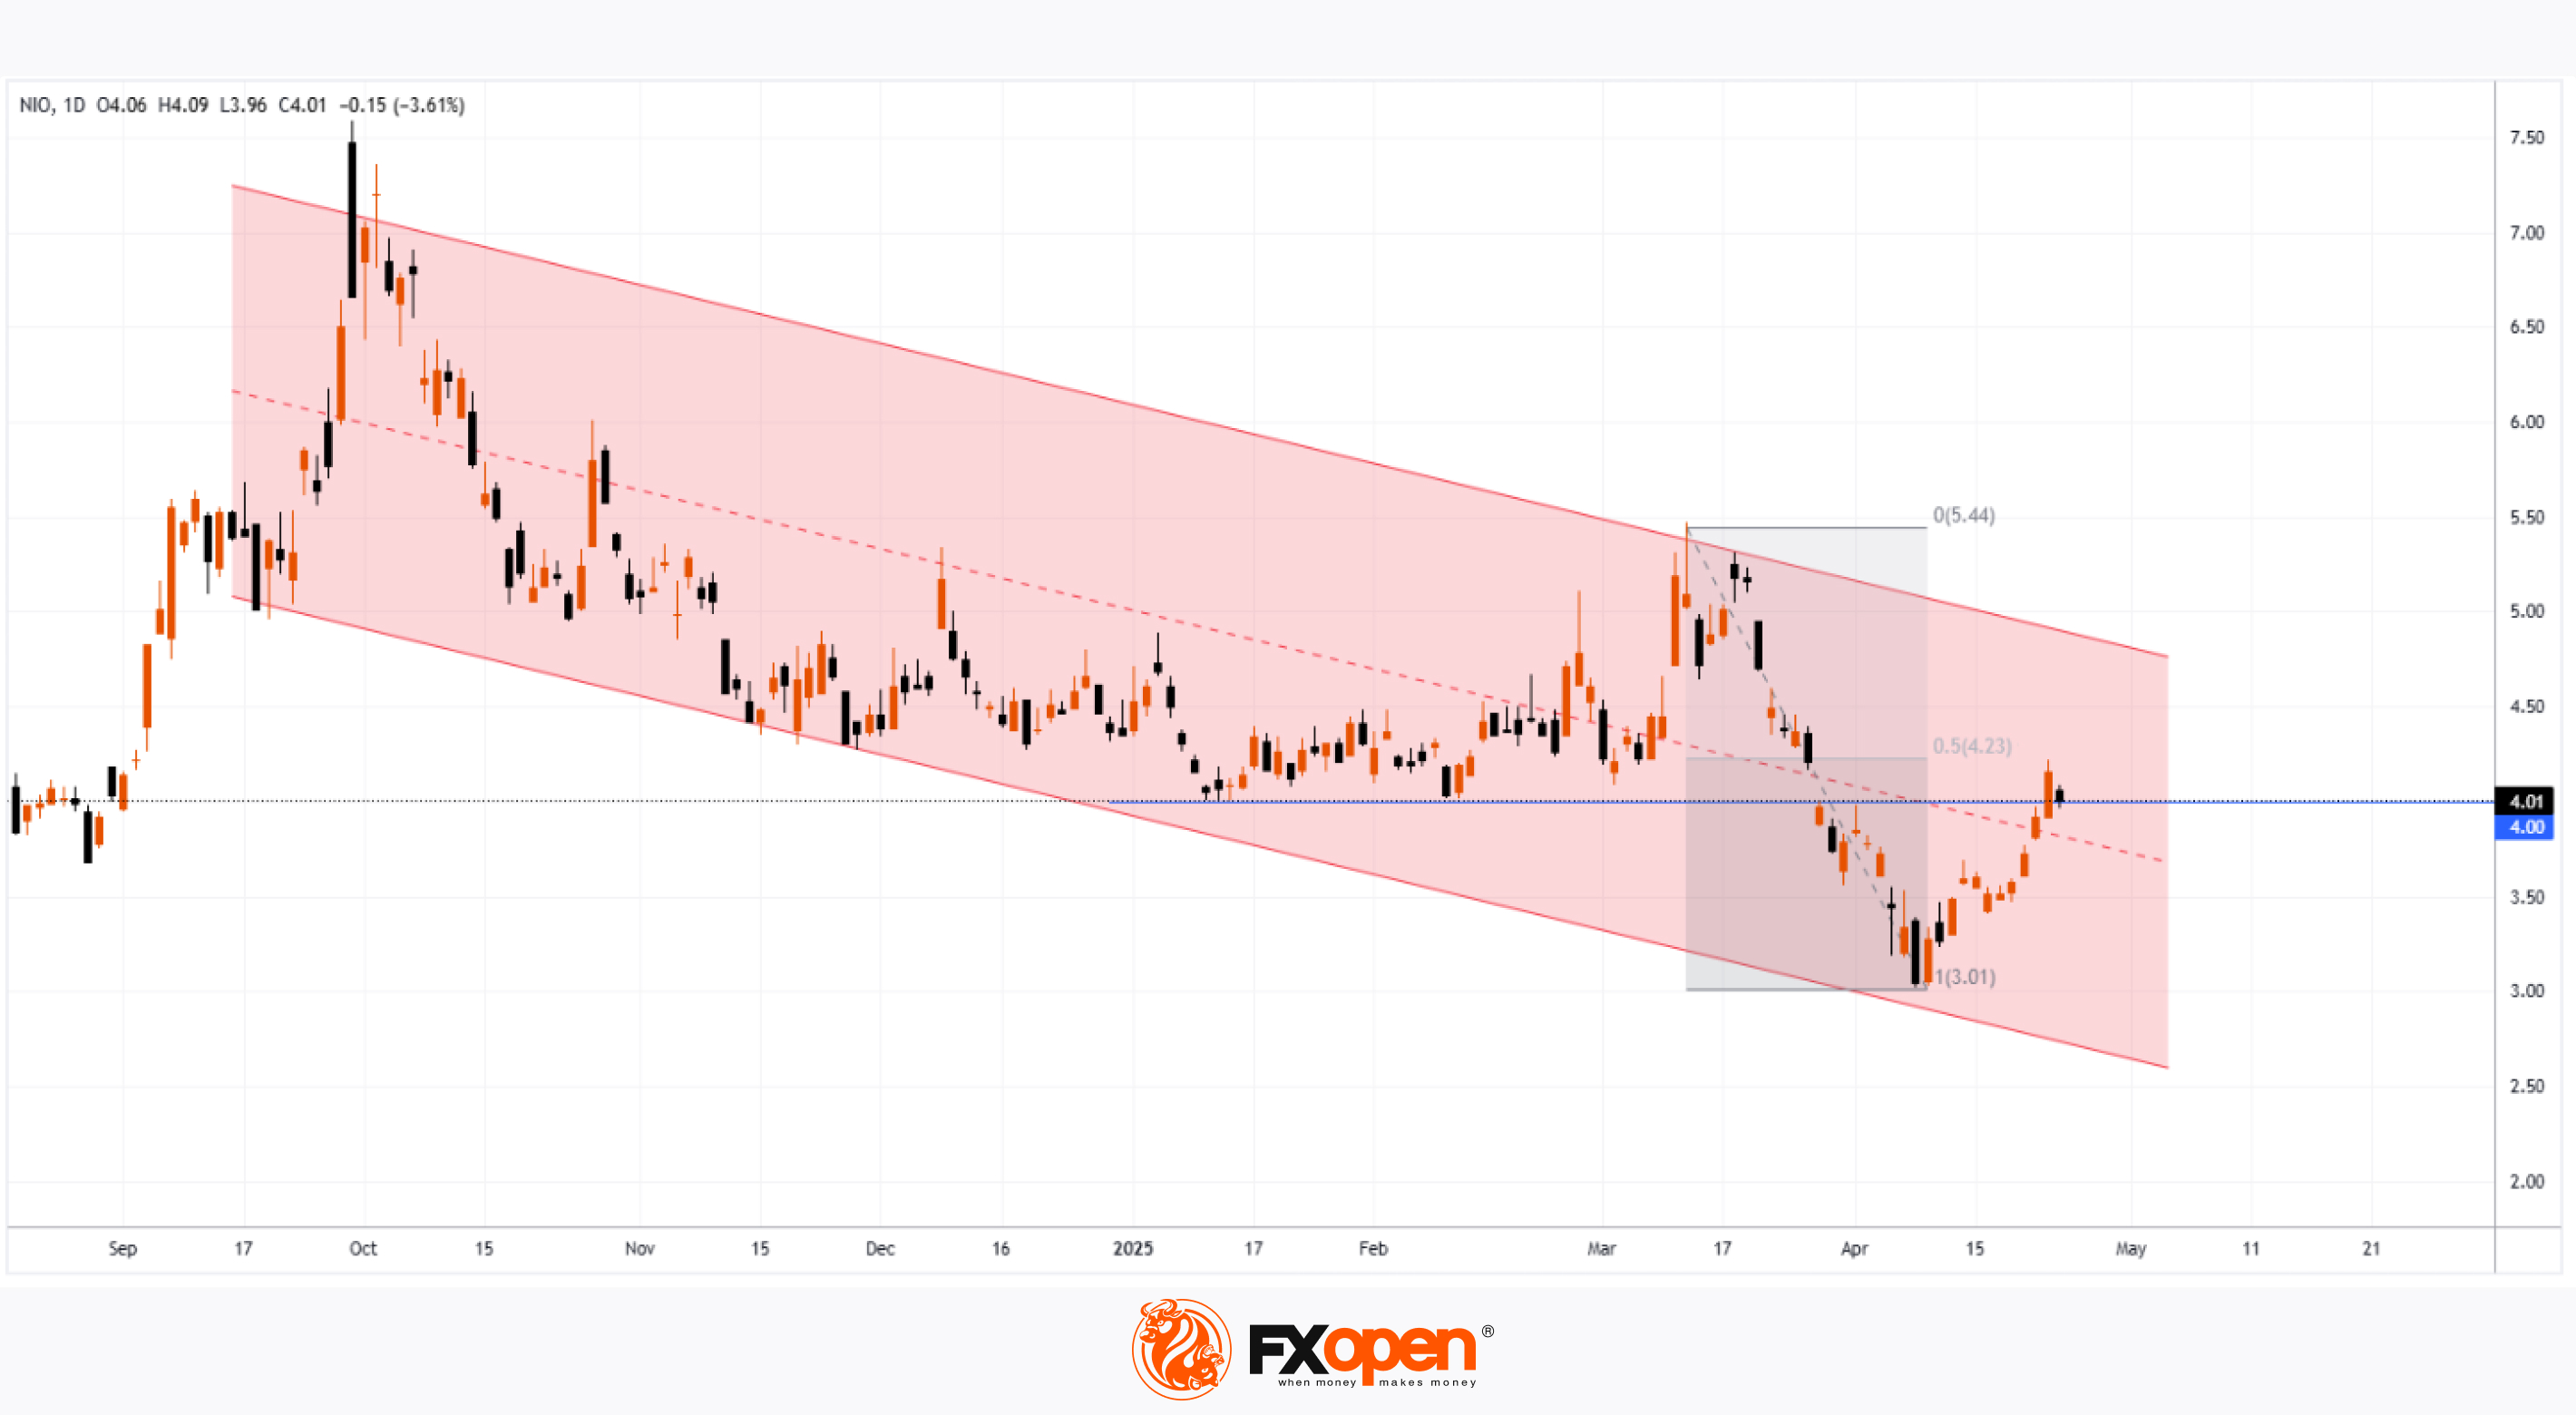
Today, the share price of NIO Inc. (NIO), a Chinese manufacturer of "smart" electric vehicles, is trading above $4 – a development that may be viewed as an optimistic scenario following the drop to $3 in the first half of April, marking the lowest level in nearly five years.
Why Has NIO’s Share Price Risen?
Bullish sentiment has been supported by news that the company: → increased vehicle deliveries by 40.1% compared to the same period last year; → is launching its premium ET9 model, expanding its range of offerings.
Additionally, news offering hope that high tariffs in international trade may not hinder the company's growth has also had a positive impact on NIO’s share price.
Technical Analysis of NIO’s Share Price Chart
From the perspective of candlestick analysis on the daily chart, a "Three White Soldiers" pattern (marked with an arrow) can be observed. This is considered an important bullish signal, as according to Thomas Bulkowski, author of Encyclopedia of Candlestick Charts, following the formation of a "Three White Soldiers" pattern, a bearish trend (highlighted by the red channel) reverses to the upside in 82% of cases.
However, it is important to bear in mind that resistance may be encountered at:
→ the $4 per share level, as it previously served as a support;
→ the 50% Fibonacci retracement level from the downward move between 12 March and 8 April.
Trade global index CFDs with zero commission and tight spreads. Open your FXOpen account now or learn more about trading index CFDs with FXOpen.
CFDs are complex instruments and come with a high risk of losing your money.
This article represents the opinion of the Companies operating under the FXOpen brand only. It is not to be construed as an offer, solicitation, or recommendation with respect to products and services provided by the Companies operating under the FXOpen brand, nor is it to be considered financial advice.
An Important Bullish Pattern Forms on the NIO Share Price Chart
Today, the share price of NIO Inc. (NIO), a Chinese manufacturer of "smart" electric vehicles, is trading above $4 – a development that may be viewed as an optimistic scenario following the drop to $3 in the first half of April, marking the lowest level in nearly five years.
Why Has NIO’s Share Price Risen?
Bullish sentiment has been supported by news that the company: → increased vehicle deliveries by 40.1% compared to the same period last year; → is launching its premium ET9 model, expanding its range of offerings.
Additionally, news offering hope that high tariffs in international trade may not hinder the company's growth has also had a positive impact on NIO’s share price.
Technical Analysis of NIO’s Share Price Chart
From the perspective of candlestick analysis on the daily chart, a "Three White Soldiers" pattern (marked with an arrow) can be observed. This is considered an important bullish signal, as according to Thomas Bulkowski, author of Encyclopedia of Candlestick Charts, following the formation of a "Three White Soldiers" pattern, a bearish trend (highlighted by the red channel) reverses to the upside in 82% of cases.
However, it is important to bear in mind that resistance may be encountered at:
→ the $4 per share level, as it previously served as a support;
→ the 50% Fibonacci retracement level from the downward move between 12 March and 8 April.
Trade global index CFDs with zero commission and tight spreads. Open your FXOpen account now or learn more about trading index CFDs with FXOpen.
CFDs are complex instruments and come with a high risk of losing your money.
This article represents the opinion of the Companies operating under the FXOpen brand only. It is not to be construed as an offer, solicitation, or recommendation with respect to products and services provided by the Companies operating under the FXOpen brand, nor is it to be considered financial advice.
👍2
#oilprices #oilindustry #commodities #XTIUSD #MarketNews
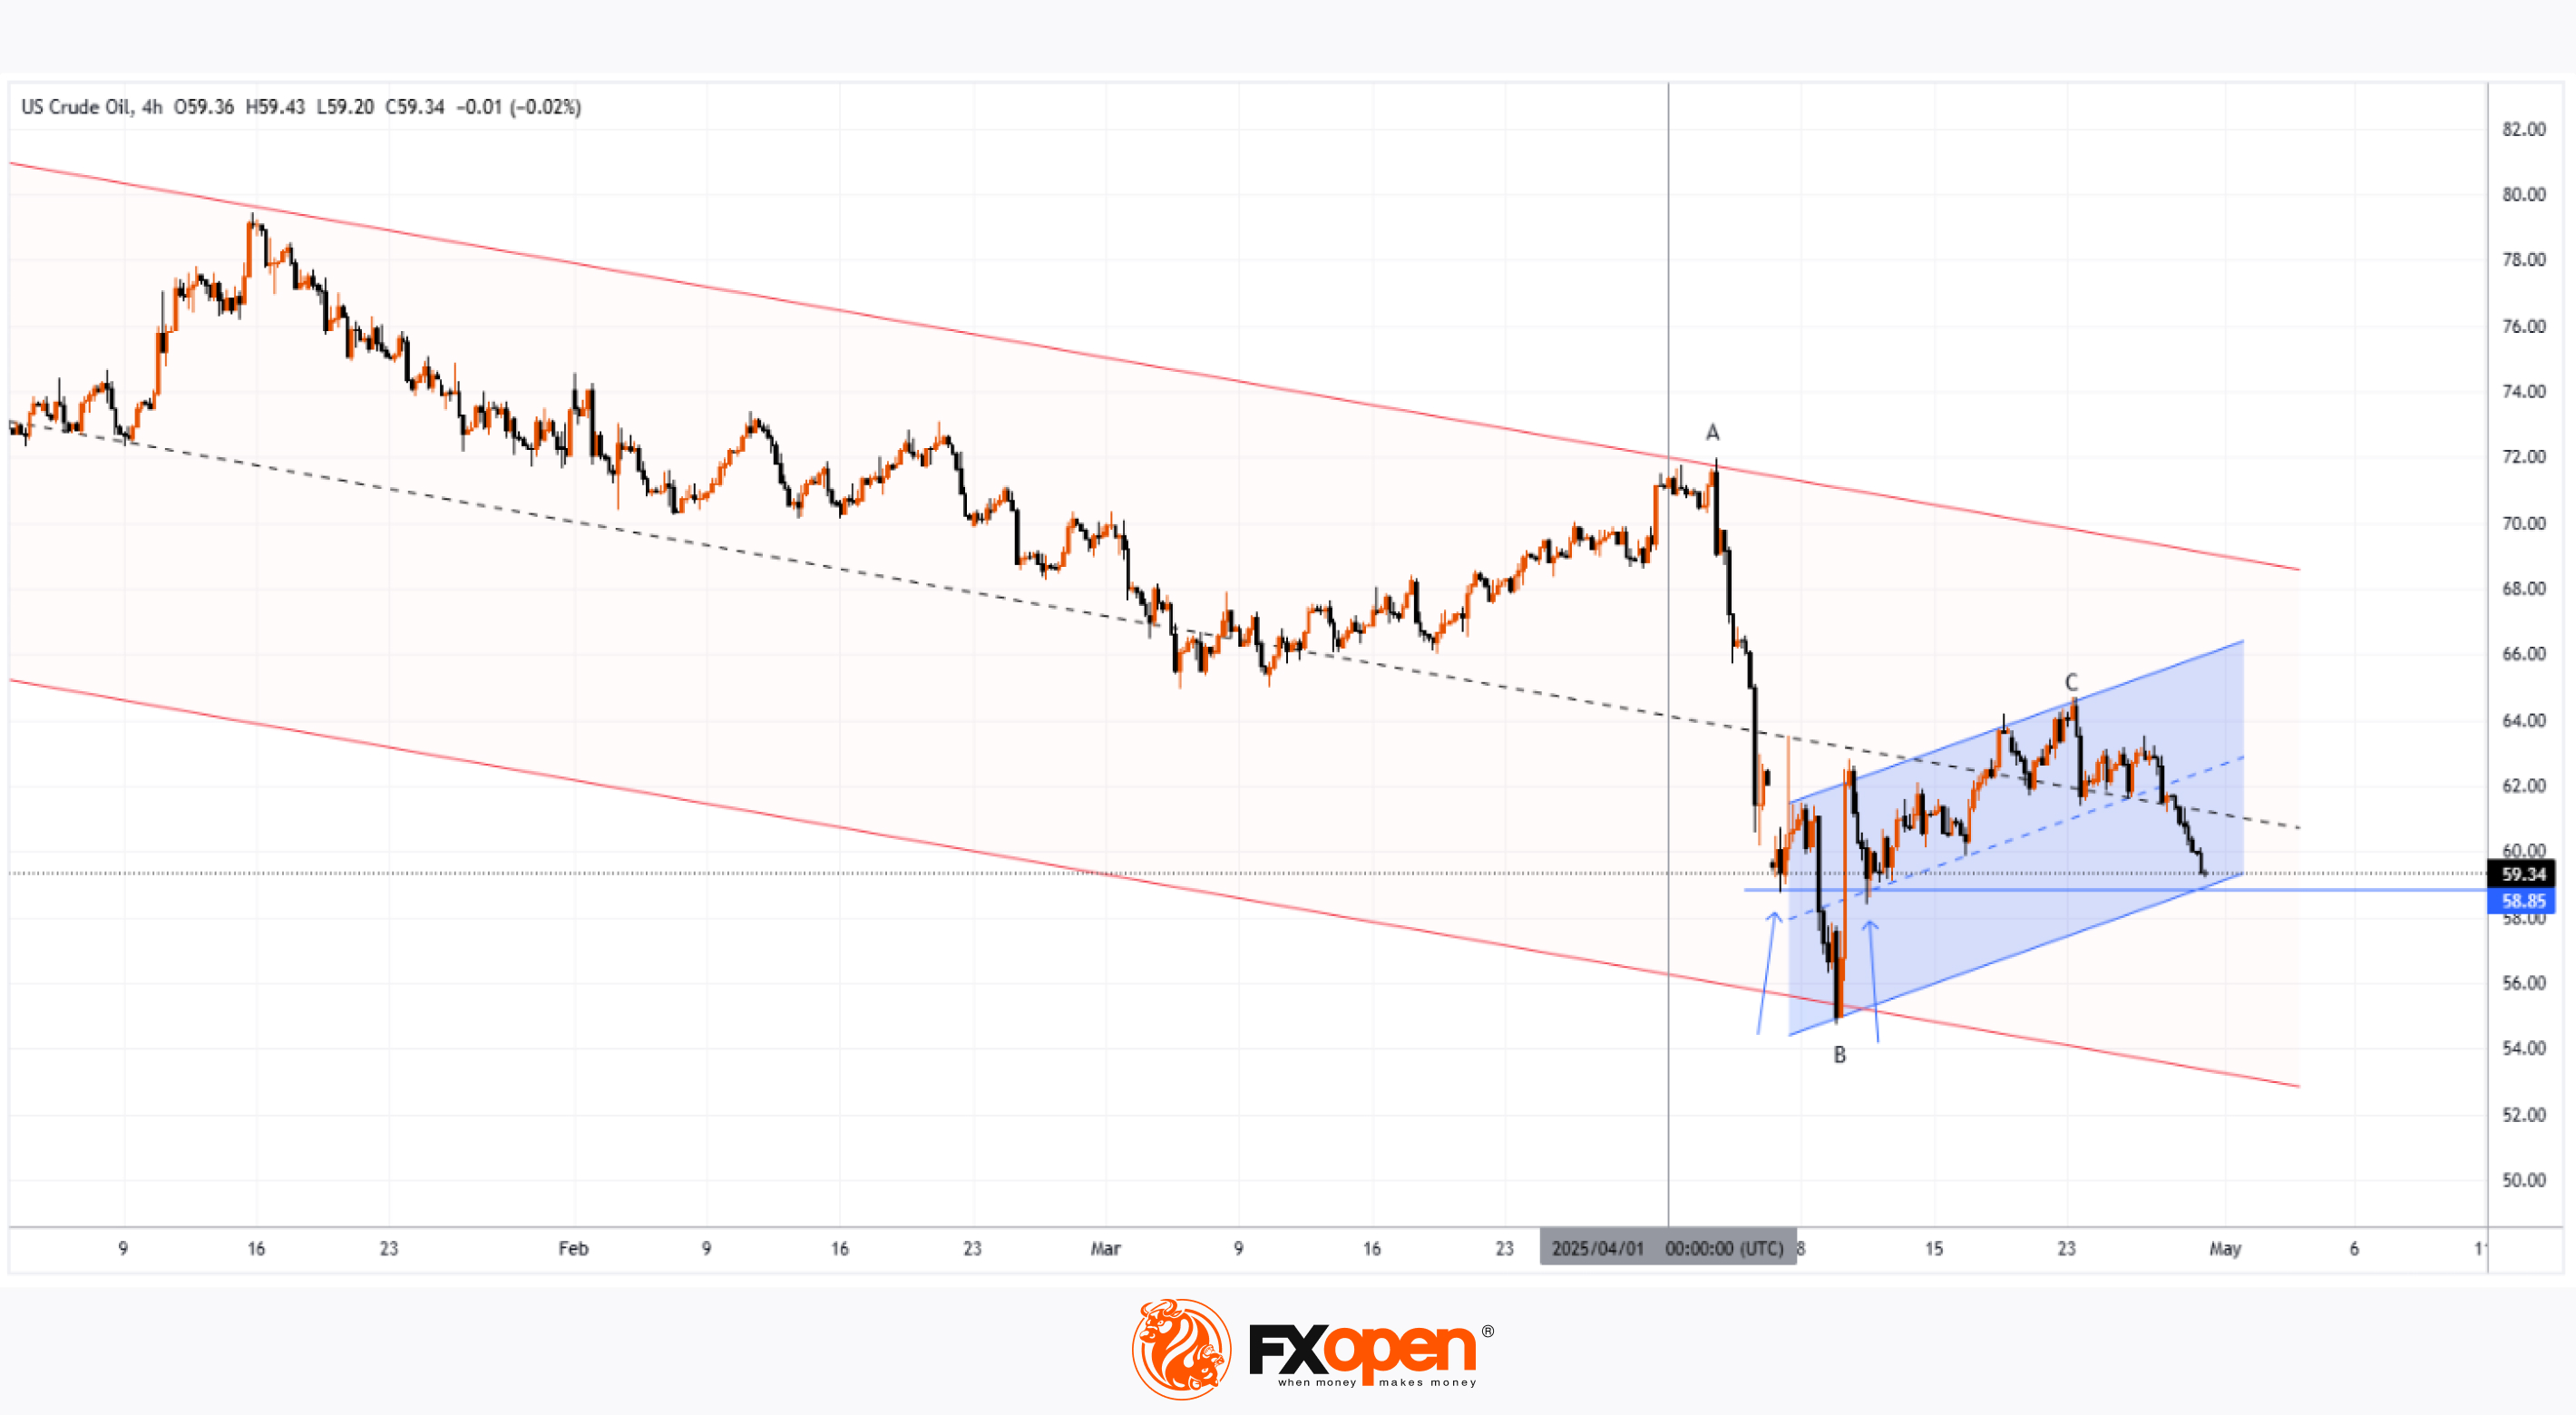
Oil Prices: April Could Be the Worst Month in Three and a Half Years
As the XTI/USD chart shows:
→ at the beginning of April, WTI crude was trading above $71 per barrel;
→ this morning, on the last day of the month, the price has fallen below $60.
The overall decline may reach 16% — the worst monthly performance since November 2021.
Why Is Oil Falling?
The primary driver behind the sharp drop in oil prices earlier this month was the introduction of new US tariffs, particularly targeting China and the EU. This raised concerns that a potential global trade war could slow economic growth and, in turn, reduce global oil demand.
According to a Reuters poll, the tariffs imposed by Trump have made a global recession in 2025 a realistic risk.
In addition, growing attention is being paid to OPEC+ and its plans to increase oil production. The next meeting is scheduled for 5 May.
Technical Analysis of the XTI/USD Chart
Oil price fluctuations in 2025 have formed a descending channel (highlighted in red), with lower highs and lower lows reflecting continued bearish sentiment.
Bulls may hope for support to emerge around the $58.85 level, as:
→ this has acted as support before (as indicated by arrows);
→ this level aligns with the lower boundary of a local upward trend (shown in blue), which formed after news broke that Trump had postponed the implementation of some tariffs — triggering a sharp rebound in oil prices from the 9 April low.
Nevertheless, the broader structure remains bearish: the rise towards point C appears to be a corrective recovery following the impulse drop from A to B. Given the potential impact of upcoming news — including statements from the White House and OPEC+ decisions — a bearish breakout below the blue channel cannot be ruled out.
Start trading commodities with tight spreads. Open your trading account now or learn more about trading commodity CFDs with FXOpen.
CFDs are complex instruments and come with a high risk of losing your money.
This article represents the opinion of the Companies operating under the FXOpen brand only. It is not to be construed as an offer, solicitation, or recommendation with respect to products and services provided by the Companies operating under the FXOpen brand, nor is it to be considered financial advice.
Oil Prices: April Could Be the Worst Month in Three and a Half Years
As the XTI/USD chart shows:
→ at the beginning of April, WTI crude was trading above $71 per barrel;
→ this morning, on the last day of the month, the price has fallen below $60.
The overall decline may reach 16% — the worst monthly performance since November 2021.
Why Is Oil Falling?
The primary driver behind the sharp drop in oil prices earlier this month was the introduction of new US tariffs, particularly targeting China and the EU. This raised concerns that a potential global trade war could slow economic growth and, in turn, reduce global oil demand.
According to a Reuters poll, the tariffs imposed by Trump have made a global recession in 2025 a realistic risk.
In addition, growing attention is being paid to OPEC+ and its plans to increase oil production. The next meeting is scheduled for 5 May.
Technical Analysis of the XTI/USD Chart
Oil price fluctuations in 2025 have formed a descending channel (highlighted in red), with lower highs and lower lows reflecting continued bearish sentiment.
Bulls may hope for support to emerge around the $58.85 level, as:
→ this has acted as support before (as indicated by arrows);
→ this level aligns with the lower boundary of a local upward trend (shown in blue), which formed after news broke that Trump had postponed the implementation of some tariffs — triggering a sharp rebound in oil prices from the 9 April low.
Nevertheless, the broader structure remains bearish: the rise towards point C appears to be a corrective recovery following the impulse drop from A to B. Given the potential impact of upcoming news — including statements from the White House and OPEC+ decisions — a bearish breakout below the blue channel cannot be ruled out.
Start trading commodities with tight spreads. Open your trading account now or learn more about trading commodity CFDs with FXOpen.
CFDs are complex instruments and come with a high risk of losing your money.
This article represents the opinion of the Companies operating under the FXOpen brand only. It is not to be construed as an offer, solicitation, or recommendation with respect to products and services provided by the Companies operating under the FXOpen brand, nor is it to be considered financial advice.
👍3
#stockmarket #stocktrading #MarketUpdates #marketanalysis #META
META Share Price Rises Cautiously Ahead of Earnings Report
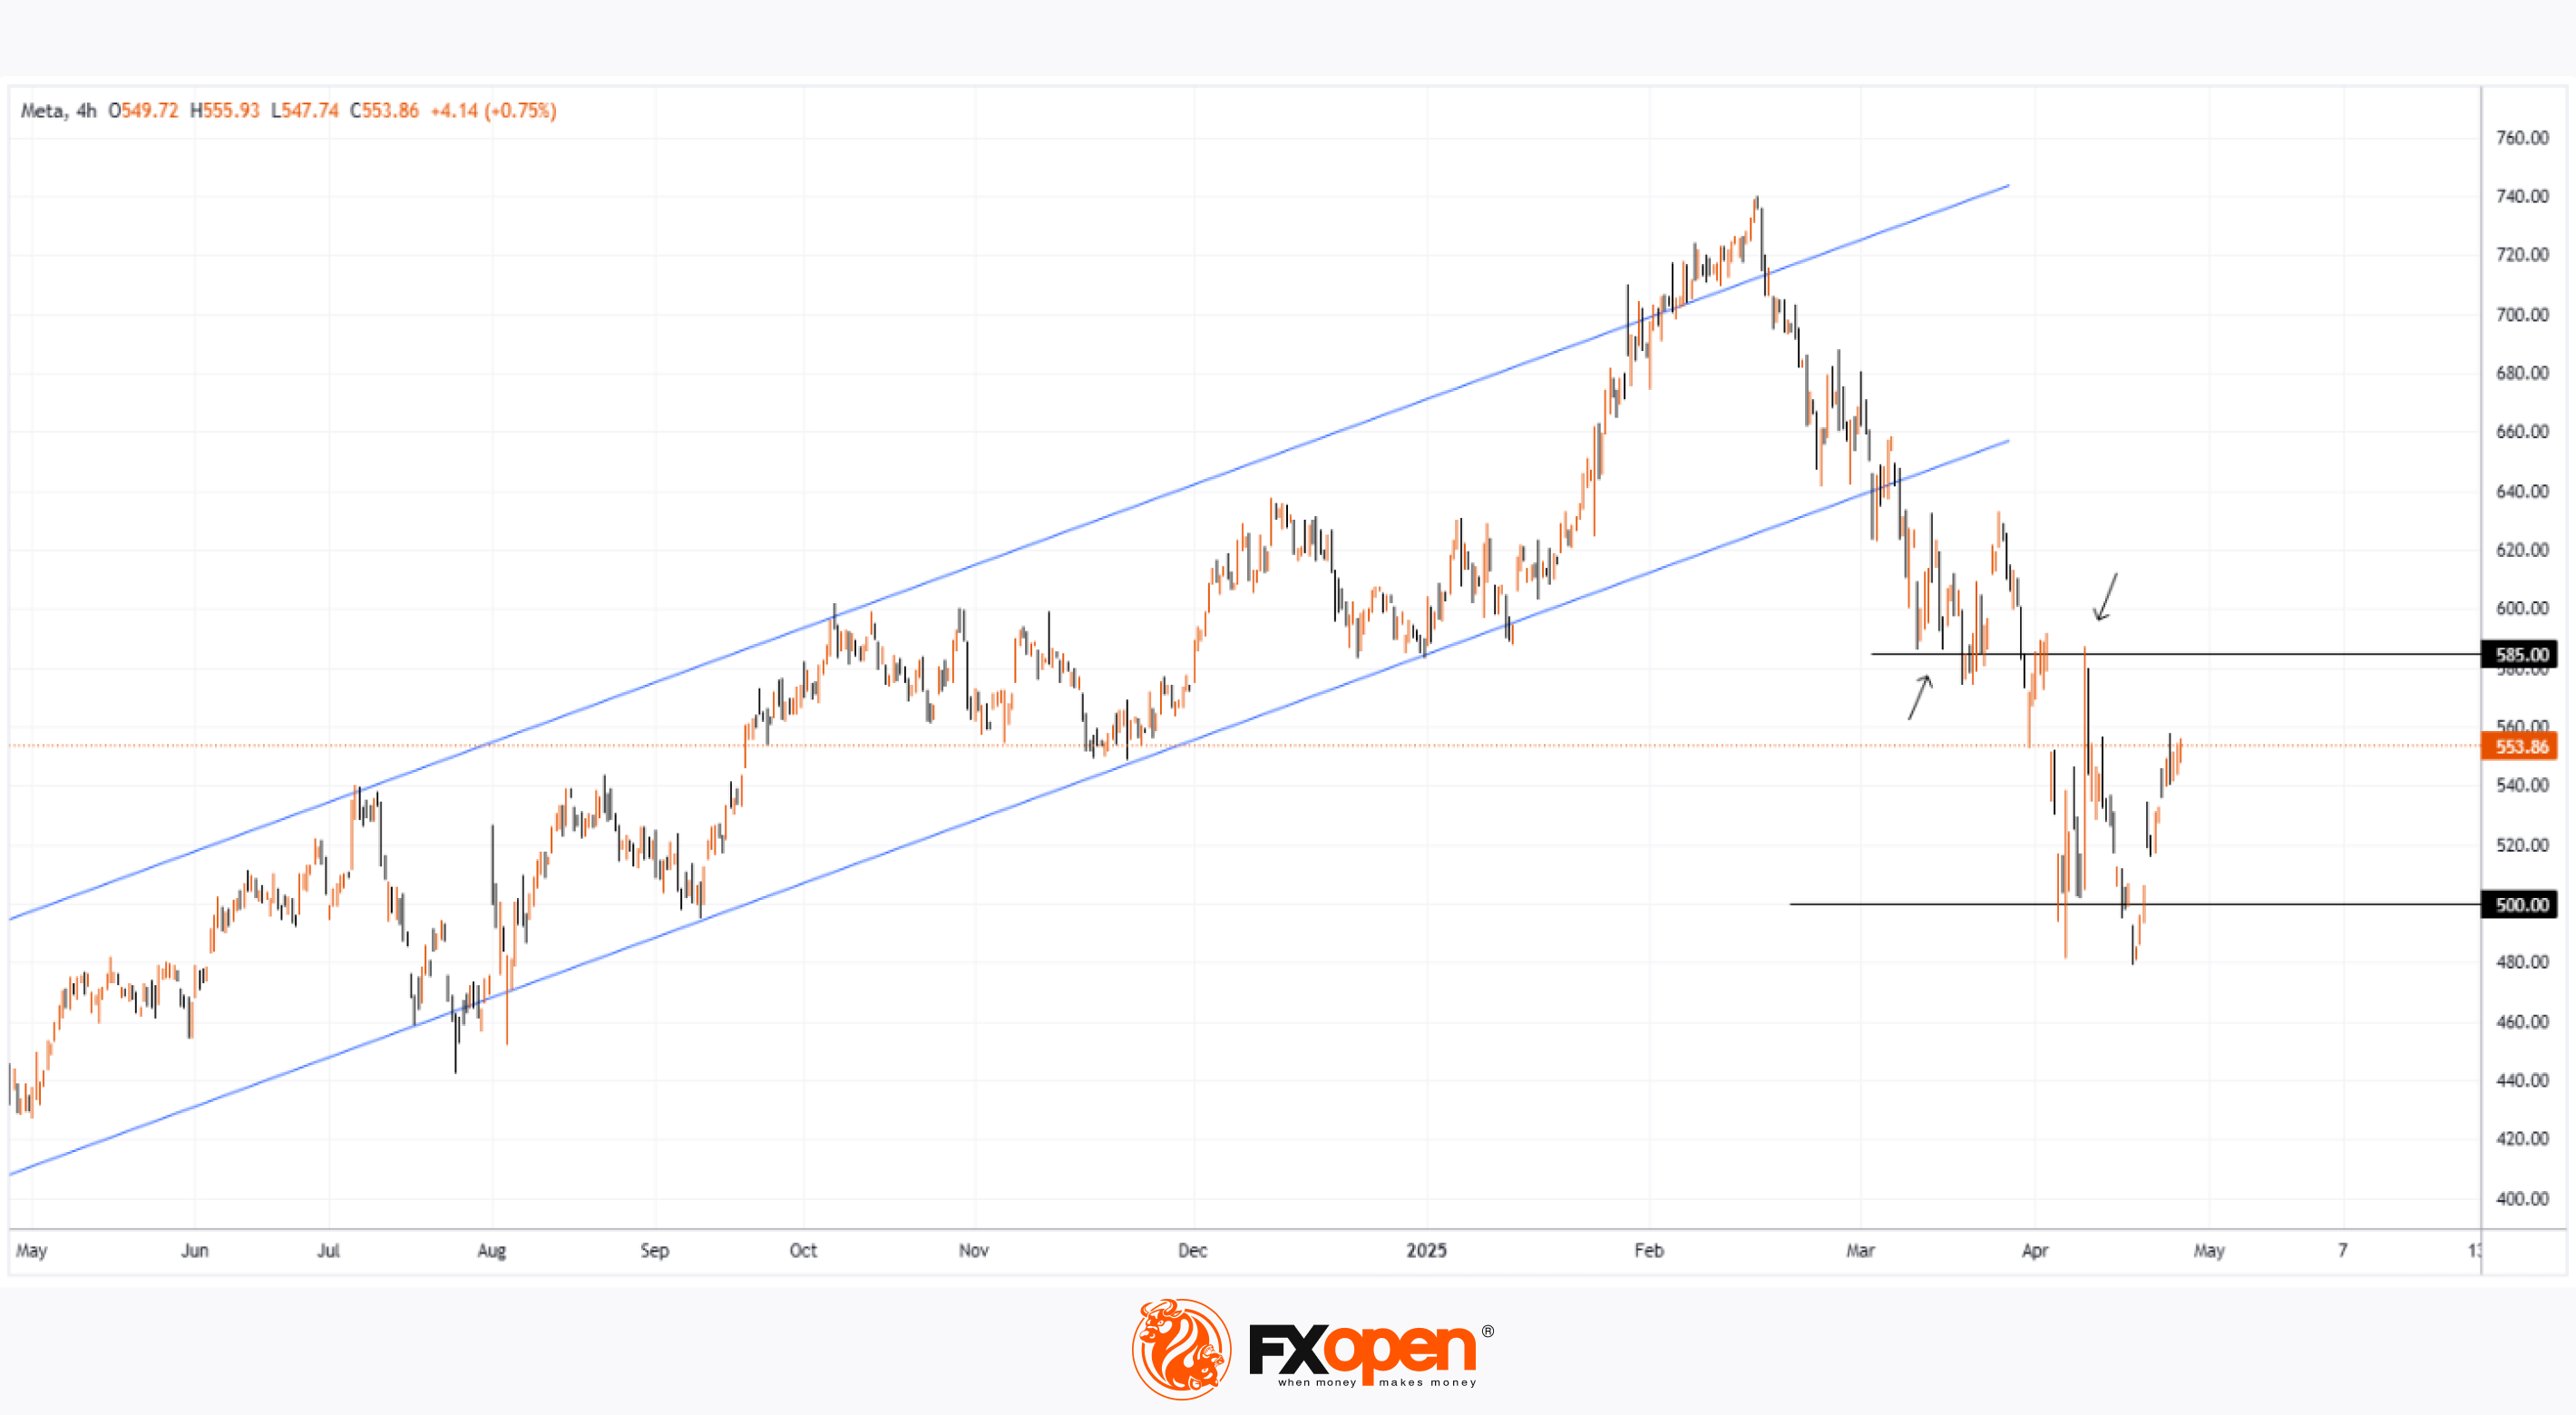
As shown on the Meta Platforms (META) chart, the share price rose by approximately 1% yesterday. This movement was supported by the announcement of the launch of the Meta AI app—an artificial intelligence-based application that will function as a personal assistant on mobile phones (similar to Google Gemini).
In a different market environment, the news might have prompted a more positive reaction. However, traders currently appear to be exercising caution, as Meta Platforms (META) is due to report its quarterly results after the close of the main trading session today. According to media reports, expectations include:
→ Revenue in the range of $41.35–$41.5 billion, which implies a year-on-year increase of roughly 13–14%.
→ Earnings per share (EPS) between $5.22 and $5.29, indicating a 11–12% rise compared to the same period last year.
Key Factors in Meta’s Quarterly Report
The following areas are likely to have a significant impact on META's share price in the wake of the report:
→ Advertising business, Meta’s primary revenue stream (around 96%). There is a possibility that US tariff policies could prompt major Chinese advertisers—such as Temu—to reduce their advertising spend in the United States.
→ Investment in Artificial Intelligence (AI) and Augmented Reality. Market participants may revise their valuation of the stock downwards if there are lingering concerns over the long-term return on these investments.
→ Forward guidance on revenue and earnings for the next quarter and full year 2025. These forecasts will carry particular weight in an environment of elevated uncertainty linked to US trade policy.
Most Wall Street analysts maintain a “Buy” rating on Meta shares. However, some have lowered their price targets in April, noting that the stock has lost roughly a third of its value since its all-time high in February.
Technical Analysis of Meta Platforms (META)
Price movements earlier in 2025 continued to trace a rising trend channel (shown in blue), with a run of 19 consecutive days of gains in February following upbeat news. However, this trend channel appears to have lost relevance at this stage.
The psychological level of $500 now offers strong support, while the $585 level has turned into resistance. It is reasonable to expect that the earnings report could trigger heightened volatility and a test of one of these key price levels.
Trade global index CFDs with zero commission and tight spreads. Open your FXOpen account now or learn more about trading index CFDs with FXOpen.
CFDs are complex instruments and come with a high risk of losing your money.
This article represents the opinion of the Companies operating under the FXOpen brand only. It is not to be construed as an offer, solicitation, or recommendation with respect to products and services provided by the Companies operating under the FXOpen brand, nor is it to be considered financial advice.
META Share Price Rises Cautiously Ahead of Earnings Report
As shown on the Meta Platforms (META) chart, the share price rose by approximately 1% yesterday. This movement was supported by the announcement of the launch of the Meta AI app—an artificial intelligence-based application that will function as a personal assistant on mobile phones (similar to Google Gemini).
In a different market environment, the news might have prompted a more positive reaction. However, traders currently appear to be exercising caution, as Meta Platforms (META) is due to report its quarterly results after the close of the main trading session today. According to media reports, expectations include:
→ Revenue in the range of $41.35–$41.5 billion, which implies a year-on-year increase of roughly 13–14%.
→ Earnings per share (EPS) between $5.22 and $5.29, indicating a 11–12% rise compared to the same period last year.
Key Factors in Meta’s Quarterly Report
The following areas are likely to have a significant impact on META's share price in the wake of the report:
→ Advertising business, Meta’s primary revenue stream (around 96%). There is a possibility that US tariff policies could prompt major Chinese advertisers—such as Temu—to reduce their advertising spend in the United States.
→ Investment in Artificial Intelligence (AI) and Augmented Reality. Market participants may revise their valuation of the stock downwards if there are lingering concerns over the long-term return on these investments.
→ Forward guidance on revenue and earnings for the next quarter and full year 2025. These forecasts will carry particular weight in an environment of elevated uncertainty linked to US trade policy.
Most Wall Street analysts maintain a “Buy” rating on Meta shares. However, some have lowered their price targets in April, noting that the stock has lost roughly a third of its value since its all-time high in February.
Technical Analysis of Meta Platforms (META)
Price movements earlier in 2025 continued to trace a rising trend channel (shown in blue), with a run of 19 consecutive days of gains in February following upbeat news. However, this trend channel appears to have lost relevance at this stage.
The psychological level of $500 now offers strong support, while the $585 level has turned into resistance. It is reasonable to expect that the earnings report could trigger heightened volatility and a test of one of these key price levels.
Trade global index CFDs with zero commission and tight spreads. Open your FXOpen account now or learn more about trading index CFDs with FXOpen.
CFDs are complex instruments and come with a high risk of losing your money.
This article represents the opinion of the Companies operating under the FXOpen brand only. It is not to be construed as an offer, solicitation, or recommendation with respect to products and services provided by the Companies operating under the FXOpen brand, nor is it to be considered financial advice.
👍3
#stockmarket #stocktrading #MSFT #MarketUpdates #marketanalysis
Microsoft (MSFT) Share Price Jumps Nearly 9% – What’s Next?
As the chart shows, Microsoft (MSFT) shares surged sharply, forming a large bullish gap: while trading closed around $391 on 30 April, yesterday’s candlestick closed just below the $425 mark.
What Drove the Rally in Microsoft Shares?
Microsoft released its financial results for the first quarter of 2025, exceeding Wall Street expectations on both revenue (actual = $70.1 billion, 2.4% above forecasts) and earnings per share (actual = $3.46, 7.4% above forecasts).
Particular attention was drawn to the strong performance of Azure – revenue from Azure and other cloud services soared by 33% year-on-year. A significant part of this growth was fuelled by robust demand for artificial intelligence services, which helps ease concerns about the return on large-scale infrastructure investments related to AI.
In addition, Microsoft issued an upbeat outlook for the next quarter, which ultimately triggered the sharp rise in its share price.
Technical Analysis of MSFT Chart
Yesterday’s candlestick closed near its low (highlighted by the arrow), indicating that bears were active during the trading session. From a technical analysis perspective, this can be explained by the proximity of the price to two key resistance lines:
1 → The upper boundary of a descending channel drawn from significant price action patterns (marked in red). The relevance of this channel is confirmed by the price’s behaviour near its median line (dashed).
2 → A former trendline that served as support throughout 2024.
Therefore, a short-term correction cannot be ruled out following the sharp rally in MSFT shares, potentially tempering some of the enthusiasm generated by Microsoft’s strong quarterly report.
Trade global index CFDs with zero commission and tight spreads. Open your FXOpen account now or learn more about trading index CFDs with FXOpen.
CFDs are complex instruments and come with a high risk of losing your money.
This article represents the opinion of the Companies operating under the FXOpen brand only. It is not to be construed as an offer, solicitation, or recommendation with respect to products and services provided by the Companies operating under the FXOpen brand, nor is it to be considered financial advice.
Microsoft (MSFT) Share Price Jumps Nearly 9% – What’s Next?
As the chart shows, Microsoft (MSFT) shares surged sharply, forming a large bullish gap: while trading closed around $391 on 30 April, yesterday’s candlestick closed just below the $425 mark.
What Drove the Rally in Microsoft Shares?
Microsoft released its financial results for the first quarter of 2025, exceeding Wall Street expectations on both revenue (actual = $70.1 billion, 2.4% above forecasts) and earnings per share (actual = $3.46, 7.4% above forecasts).
Particular attention was drawn to the strong performance of Azure – revenue from Azure and other cloud services soared by 33% year-on-year. A significant part of this growth was fuelled by robust demand for artificial intelligence services, which helps ease concerns about the return on large-scale infrastructure investments related to AI.
In addition, Microsoft issued an upbeat outlook for the next quarter, which ultimately triggered the sharp rise in its share price.
Technical Analysis of MSFT Chart
Yesterday’s candlestick closed near its low (highlighted by the arrow), indicating that bears were active during the trading session. From a technical analysis perspective, this can be explained by the proximity of the price to two key resistance lines:
1 → The upper boundary of a descending channel drawn from significant price action patterns (marked in red). The relevance of this channel is confirmed by the price’s behaviour near its median line (dashed).
2 → A former trendline that served as support throughout 2024.
Therefore, a short-term correction cannot be ruled out following the sharp rally in MSFT shares, potentially tempering some of the enthusiasm generated by Microsoft’s strong quarterly report.
Trade global index CFDs with zero commission and tight spreads. Open your FXOpen account now or learn more about trading index CFDs with FXOpen.
CFDs are complex instruments and come with a high risk of losing your money.
This article represents the opinion of the Companies operating under the FXOpen brand only. It is not to be construed as an offer, solicitation, or recommendation with respect to products and services provided by the Companies operating under the FXOpen brand, nor is it to be considered financial advice.
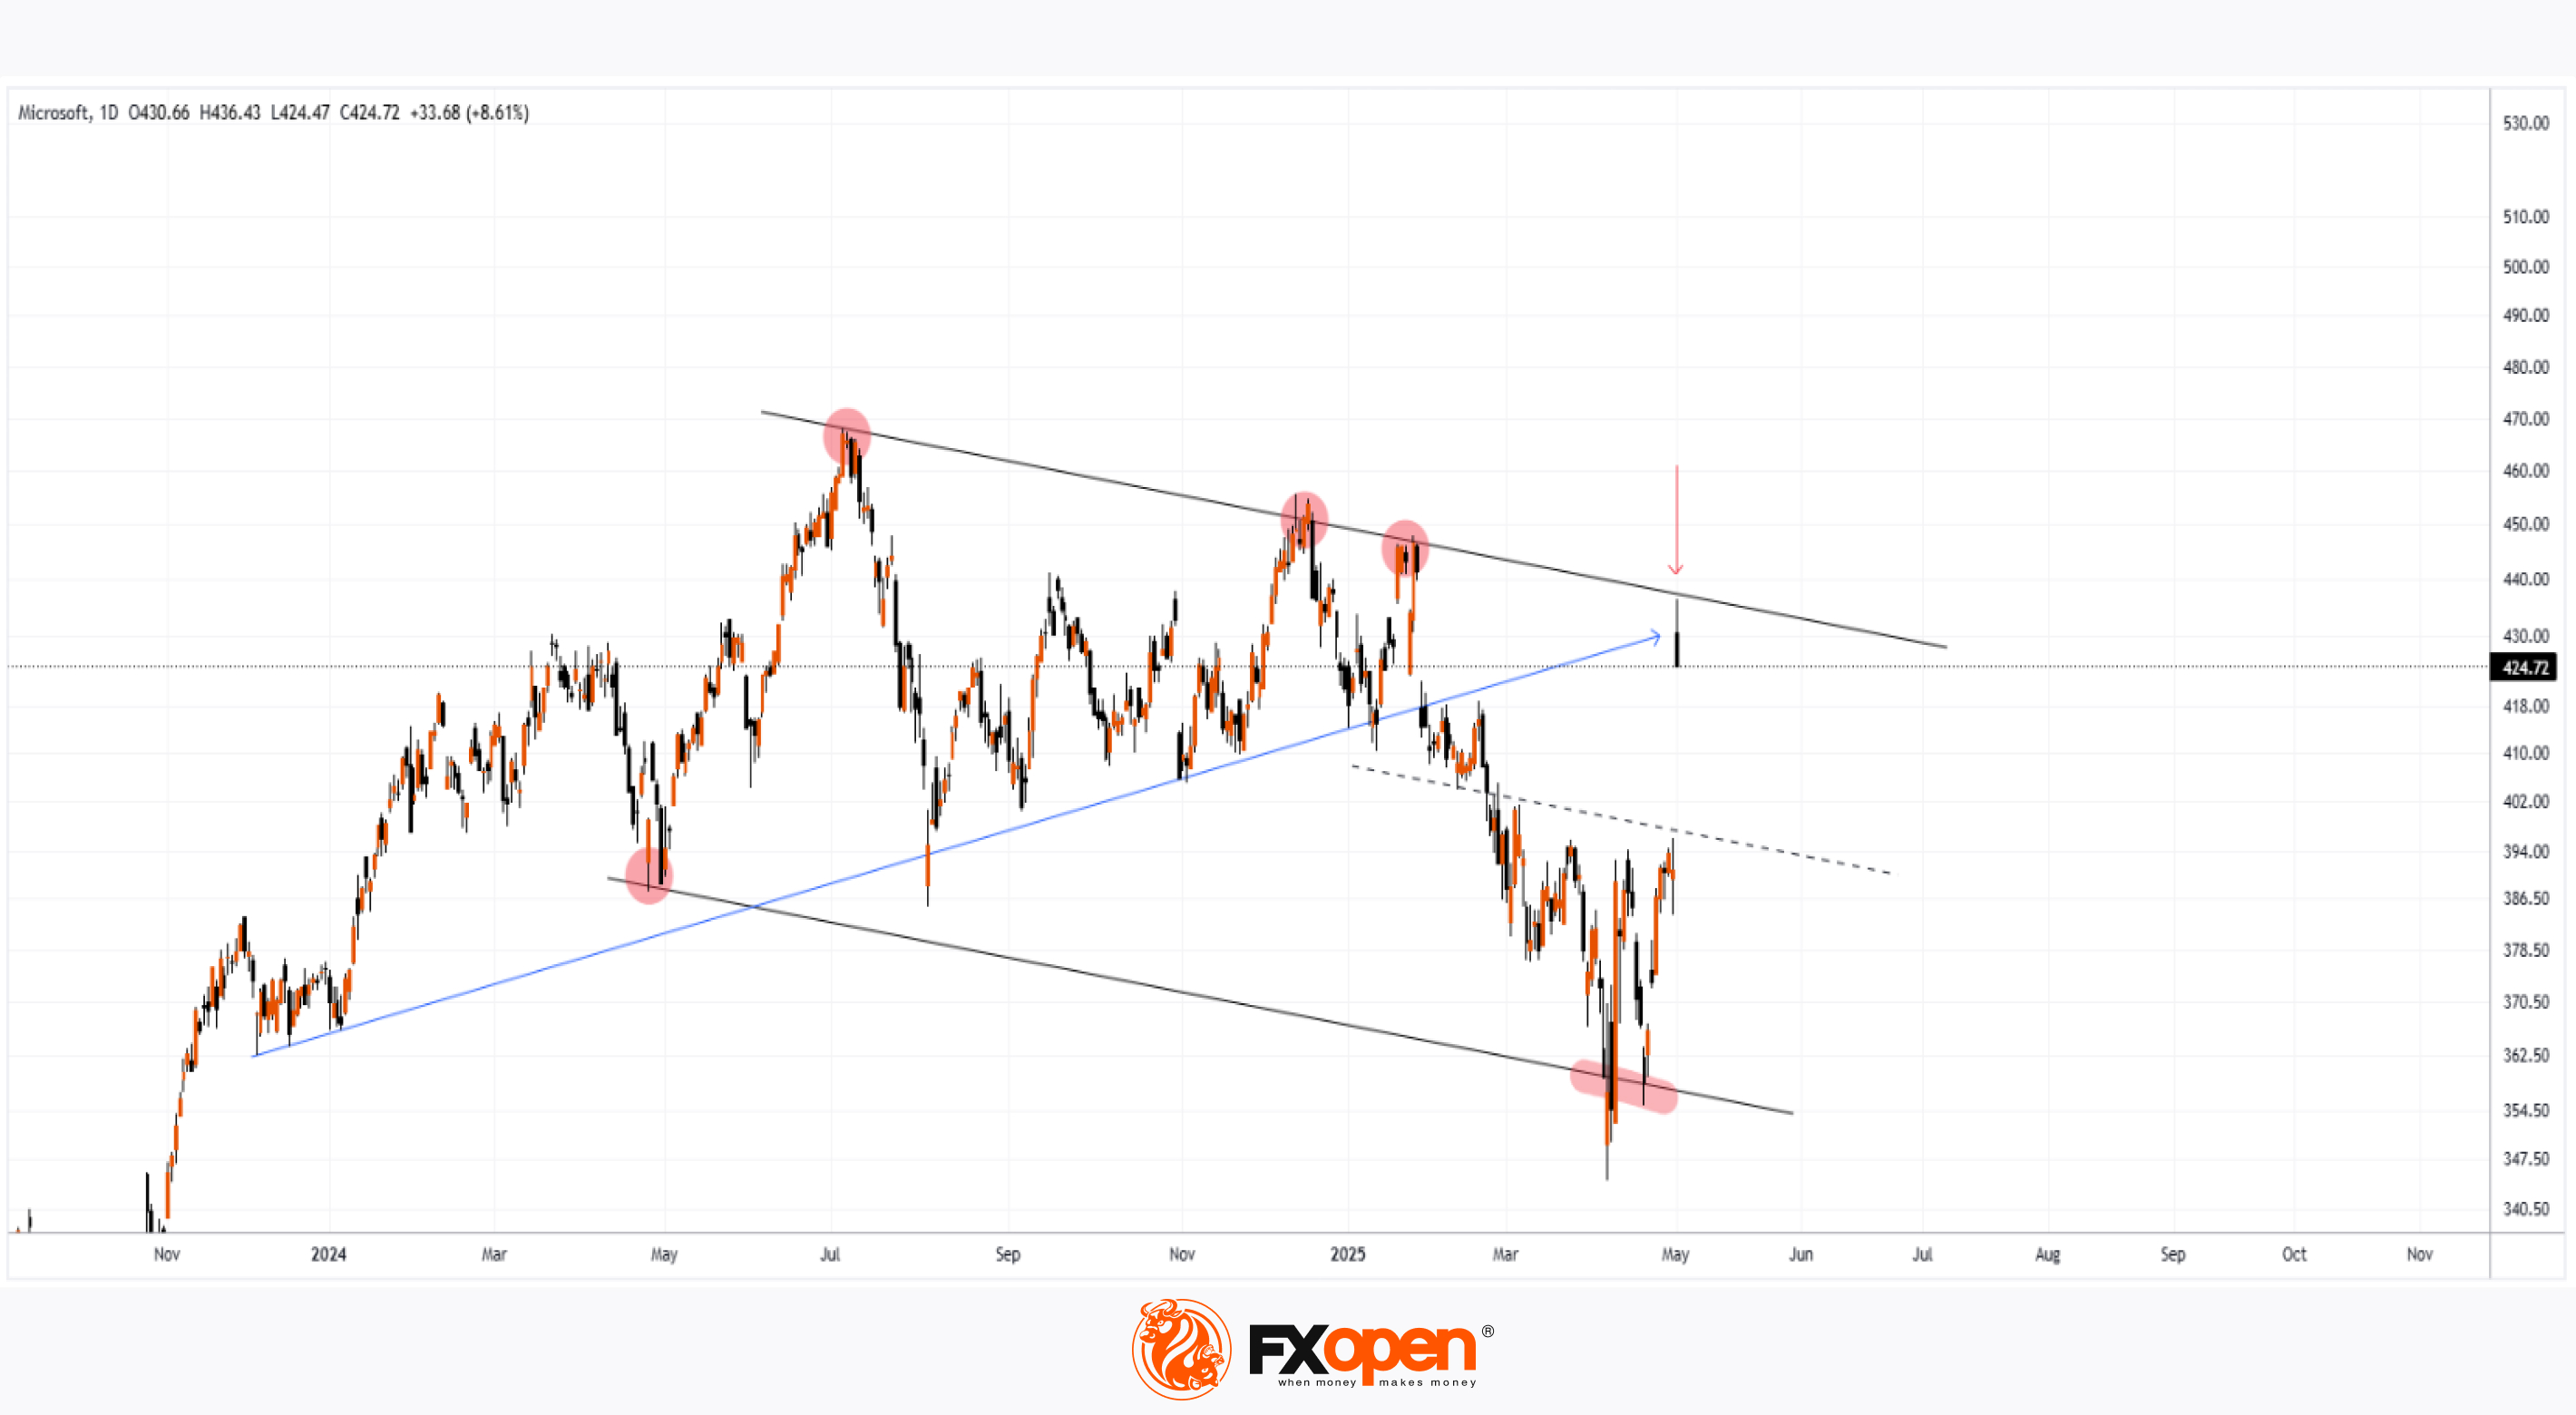
👍2
#stockmarket #stocktrading #MarketUpdates #MarketNews
Buffett Steps Down, Berkshire Shares (BRK.B) Pull Back from Record High
Berkshire Hathaway has released its quarterly report, which came in slightly below analysts’ expectations:
→ Earnings per share: actual = $4.46, forecast = $4.72
→ Revenue: actual = $90.8bn, forecast = $89.7bn
However, the bigger news was not the weaker results, but the decision of legendary 94-year-old Warren Buffett to step down as head of the company after nearly 60 years in charge. According to Reuters:
→ Vice Chairman Greg Abel will take over leadership;
→ Buffett will still influence decisions and has said he does “not intend to sell a single share of Berkshire”.
In pre-market trading today, BRK.B shares are priced around $526, compared to Friday’s close above $541, which marked a historic high. The decline suggests a natural negative reaction by market participants to the news.
Technical Analysis of BRK.B Stock Price
The Berkshire Hathaway stock price is moving within an upward channel, and:
→ In 2025, it has outperformed the broader equity index, showing a strong recovery following the early April market selloff;
→ Following the recent news, the price will likely retreat from the upper boundary of the channel toward the median line, which may act as support (as it did in late April, as shown by the arrow).
The recent price action appears to be a false bullish breakout above the $535 resistance — a bearish signal.
It’s possible that the initial emotional market reaction may fade, and BRK.B shares could continue to outperform the S&P 500 (tracked via the US SPX 500 mini on FXOpen). Whether this scenario plays out will depend on the leadership and decisions of Greg Abel, especially as the company now holds a record cash reserve of nearly $350 billion.
Trade global index CFDs with zero commission and tight spreads. Open your FXOpen account now or learn more about trading index CFDs with FXOpen.
CFDs are complex instruments and come with a high risk of losing your money.
This article represents the opinion of the Companies operating under the FXOpen brand only. It is not to be construed as an offer, solicitation, or recommendation with respect to products and services provided by the Companies operating under the FXOpen brand, nor is it to be considered financial advice.
Buffett Steps Down, Berkshire Shares (BRK.B) Pull Back from Record High
Berkshire Hathaway has released its quarterly report, which came in slightly below analysts’ expectations:
→ Earnings per share: actual = $4.46, forecast = $4.72
→ Revenue: actual = $90.8bn, forecast = $89.7bn
However, the bigger news was not the weaker results, but the decision of legendary 94-year-old Warren Buffett to step down as head of the company after nearly 60 years in charge. According to Reuters:
→ Vice Chairman Greg Abel will take over leadership;
→ Buffett will still influence decisions and has said he does “not intend to sell a single share of Berkshire”.
In pre-market trading today, BRK.B shares are priced around $526, compared to Friday’s close above $541, which marked a historic high. The decline suggests a natural negative reaction by market participants to the news.
Technical Analysis of BRK.B Stock Price
The Berkshire Hathaway stock price is moving within an upward channel, and:
→ In 2025, it has outperformed the broader equity index, showing a strong recovery following the early April market selloff;
→ Following the recent news, the price will likely retreat from the upper boundary of the channel toward the median line, which may act as support (as it did in late April, as shown by the arrow).
The recent price action appears to be a false bullish breakout above the $535 resistance — a bearish signal.
It’s possible that the initial emotional market reaction may fade, and BRK.B shares could continue to outperform the S&P 500 (tracked via the US SPX 500 mini on FXOpen). Whether this scenario plays out will depend on the leadership and decisions of Greg Abel, especially as the company now holds a record cash reserve of nearly $350 billion.
Trade global index CFDs with zero commission and tight spreads. Open your FXOpen account now or learn more about trading index CFDs with FXOpen.
CFDs are complex instruments and come with a high risk of losing your money.
This article represents the opinion of the Companies operating under the FXOpen brand only. It is not to be construed as an offer, solicitation, or recommendation with respect to products and services provided by the Companies operating under the FXOpen brand, nor is it to be considered financial advice.
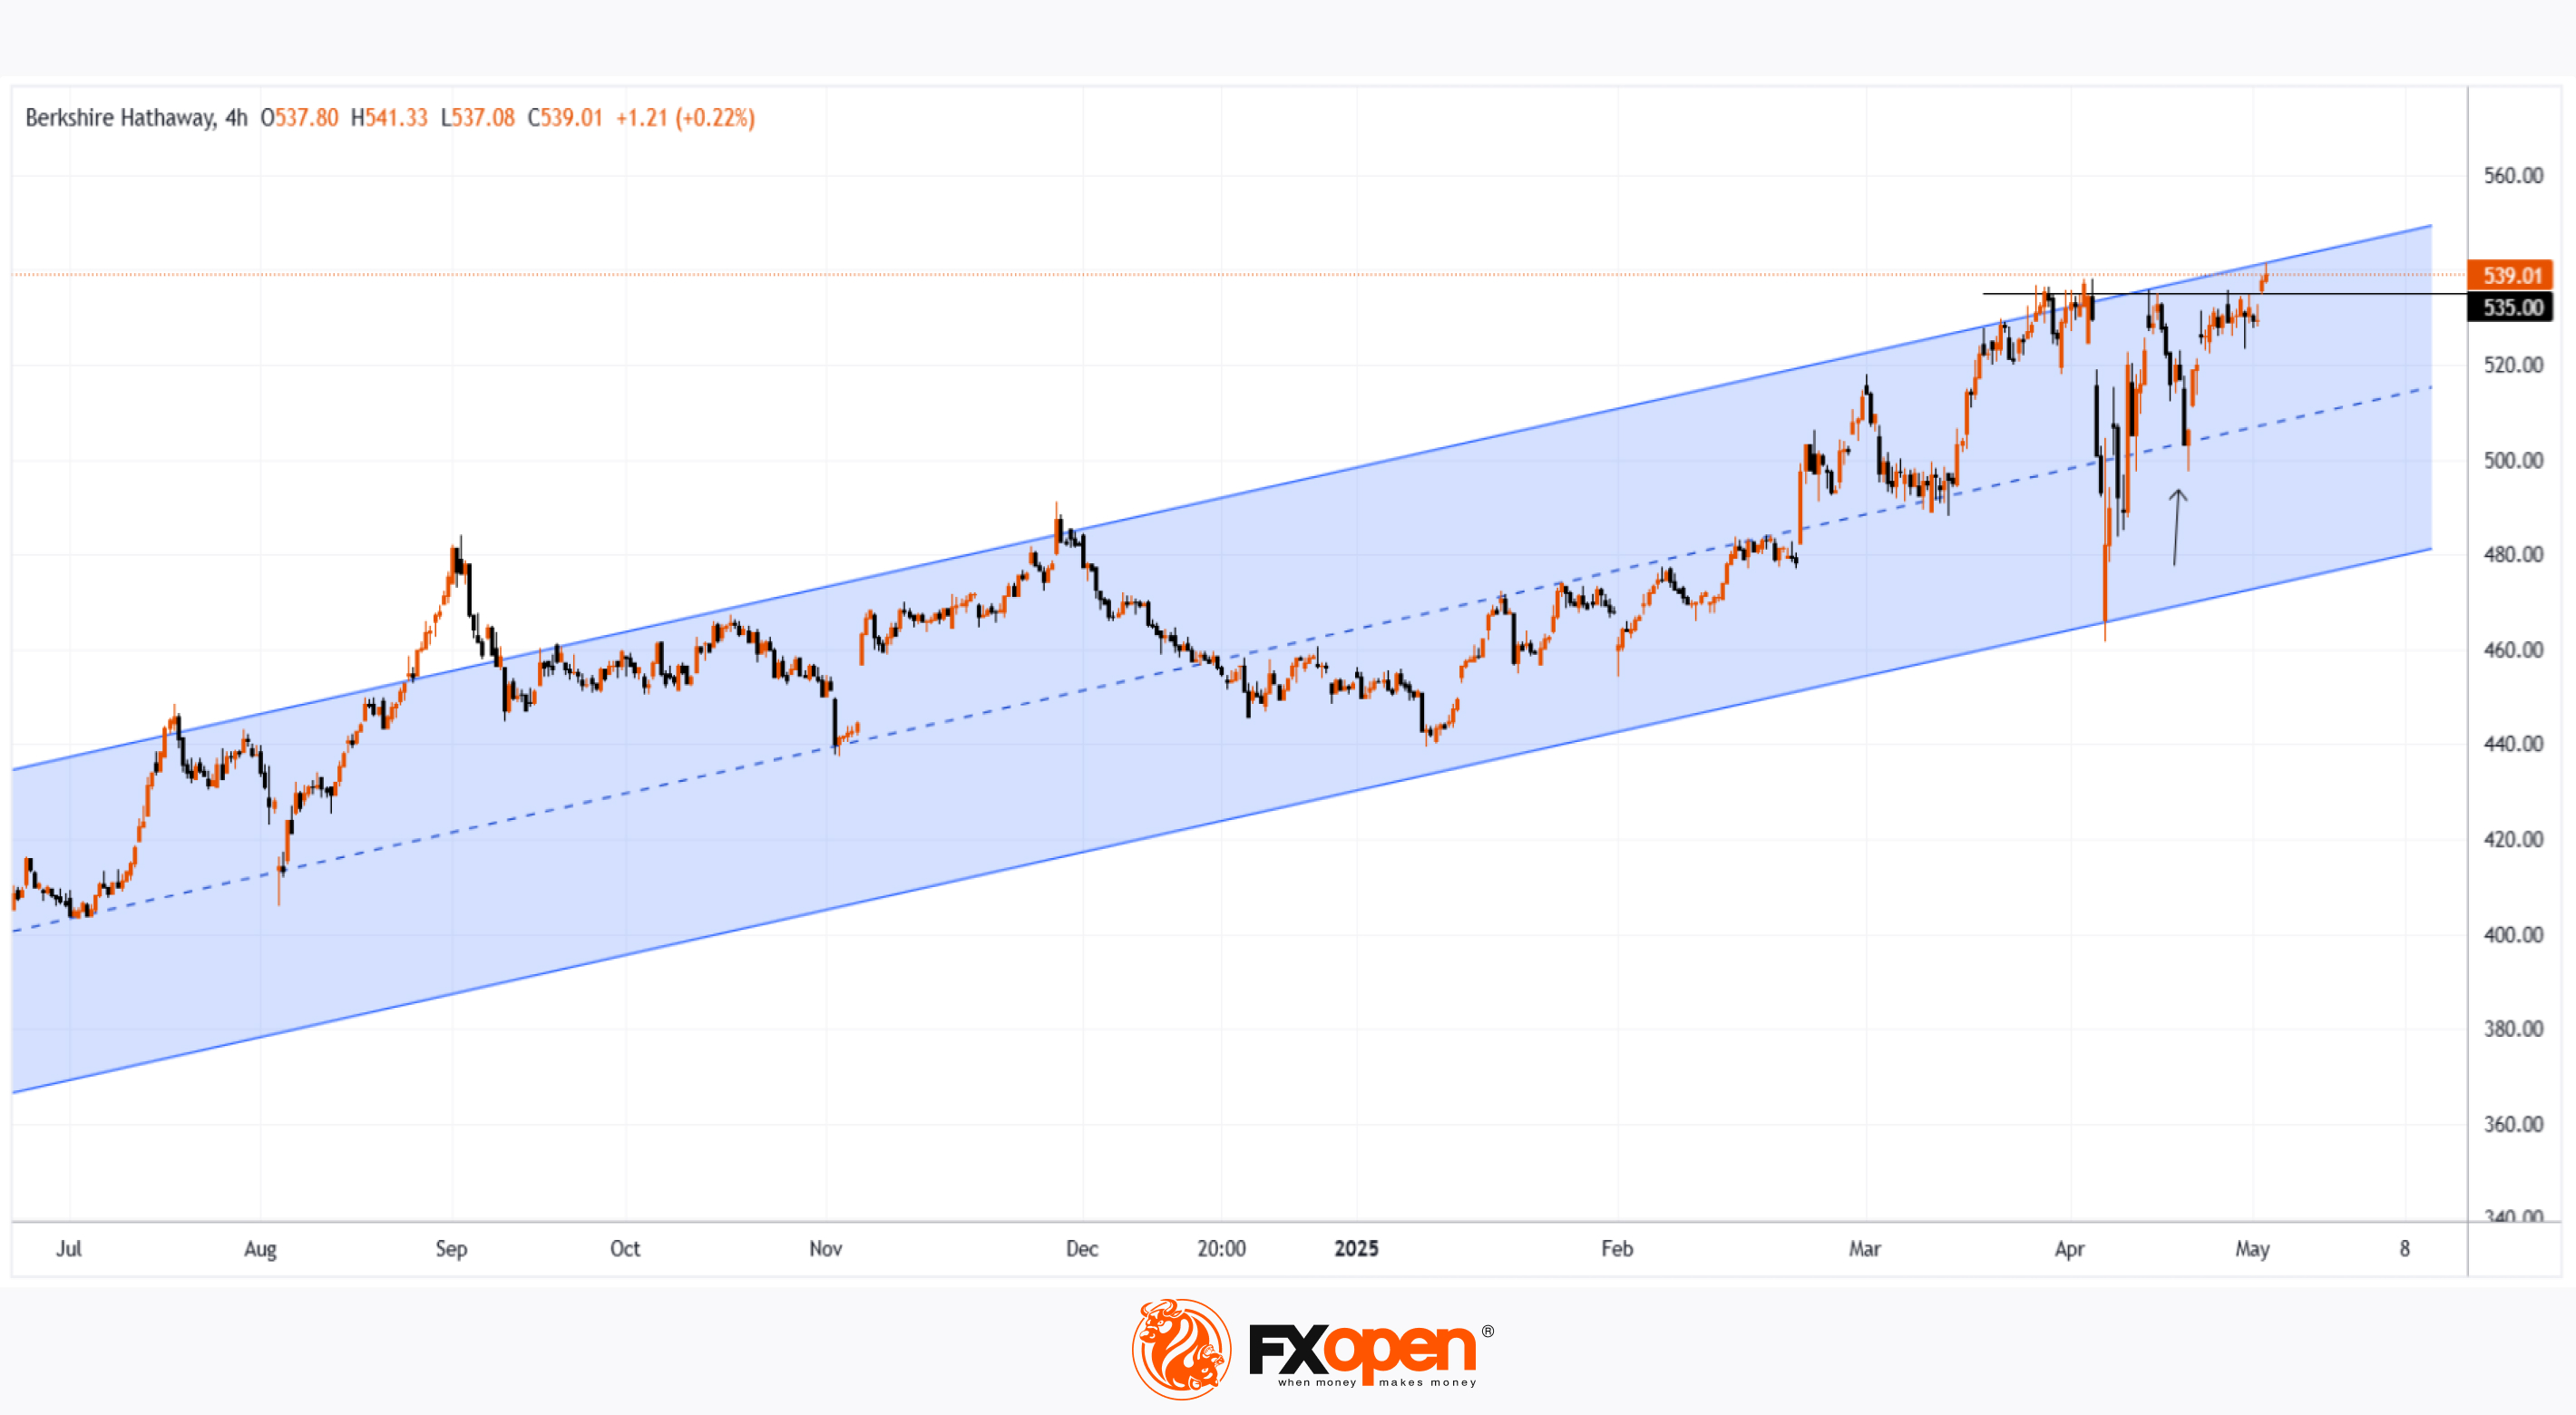
👍3
#brentoil #oilprices #MarketUpdates #marketanalysis
Brent Crude Opens with a Bearish Gap
As shown on the XBR/USD chart, Brent crude oil opened this Monday morning around $59.00, forming a bearish gap relative to Friday’s closing price of approximately $61.40.
The current Brent crude oil price is near the yearly low reached about a month ago, following the announcement of Trump’s tariffs, which turned out to be significantly higher than expected.
Why Is Oil Falling?
As we noted on 30 April, market participants are closely watching news related to OPEC+. Over the weekend, during an online meeting (according to media reports), the following developments occurred:
→ It was stated that the current oil market is fundamentally healthy;
→ A decision was made to accelerate the pace of oil production increases.
According to the plan, output will rise by 411,000 barrels per day — with some believing this move is partly due to certain OPEC+ countries previously failing to adhere to production quotas.
Technical Analysis of the XBR/USD Chart
Oil price movements in 2025 form a descending channel (shown in red), with progressively lower highs and lows indicating bearish sentiment.
Although bulls may hope that the lower boundary of the channel could act as support, bears are showing signs of dominance (as indicated by arrows):
→ the median line of the channel previously acted as resistance;
→ now, similar behaviour is seen at line Q, which divides the lower half of the channel into two quarters;
→ the Rounding Top pattern also signals strong selling pressure.
Fundamentally, oil prices are supported by China’s willingness to negotiate tariffs with the US. However, considering the OPEC+ decision and ongoing fears of a global recession, the current downward channel on the Brent crude oil price chart is unlikely to lose relevance any time soon.
Start trading commodities with tight spreads. Open your trading account now or learn more about trading commodity CFDs with FXOpen.
CFDs are complex instruments and come with a high risk of losing your money.
This article represents the opinion of the Companies operating under the FXOpen brand only. It is not to be construed as an offer, solicitation, or recommendation with respect to products and services provided by the Companies operating under the FXOpen brand, nor is it to be considered financial advice.
Brent Crude Opens with a Bearish Gap
As shown on the XBR/USD chart, Brent crude oil opened this Monday morning around $59.00, forming a bearish gap relative to Friday’s closing price of approximately $61.40.
The current Brent crude oil price is near the yearly low reached about a month ago, following the announcement of Trump’s tariffs, which turned out to be significantly higher than expected.
Why Is Oil Falling?
As we noted on 30 April, market participants are closely watching news related to OPEC+. Over the weekend, during an online meeting (according to media reports), the following developments occurred:
→ It was stated that the current oil market is fundamentally healthy;
→ A decision was made to accelerate the pace of oil production increases.
According to the plan, output will rise by 411,000 barrels per day — with some believing this move is partly due to certain OPEC+ countries previously failing to adhere to production quotas.
Technical Analysis of the XBR/USD Chart
Oil price movements in 2025 form a descending channel (shown in red), with progressively lower highs and lows indicating bearish sentiment.
Although bulls may hope that the lower boundary of the channel could act as support, bears are showing signs of dominance (as indicated by arrows):
→ the median line of the channel previously acted as resistance;
→ now, similar behaviour is seen at line Q, which divides the lower half of the channel into two quarters;
→ the Rounding Top pattern also signals strong selling pressure.
Fundamentally, oil prices are supported by China’s willingness to negotiate tariffs with the US. However, considering the OPEC+ decision and ongoing fears of a global recession, the current downward channel on the Brent crude oil price chart is unlikely to lose relevance any time soon.
Start trading commodities with tight spreads. Open your trading account now or learn more about trading commodity CFDs with FXOpen.
CFDs are complex instruments and come with a high risk of losing your money.
This article represents the opinion of the Companies operating under the FXOpen brand only. It is not to be construed as an offer, solicitation, or recommendation with respect to products and services provided by the Companies operating under the FXOpen brand, nor is it to be considered financial advice.
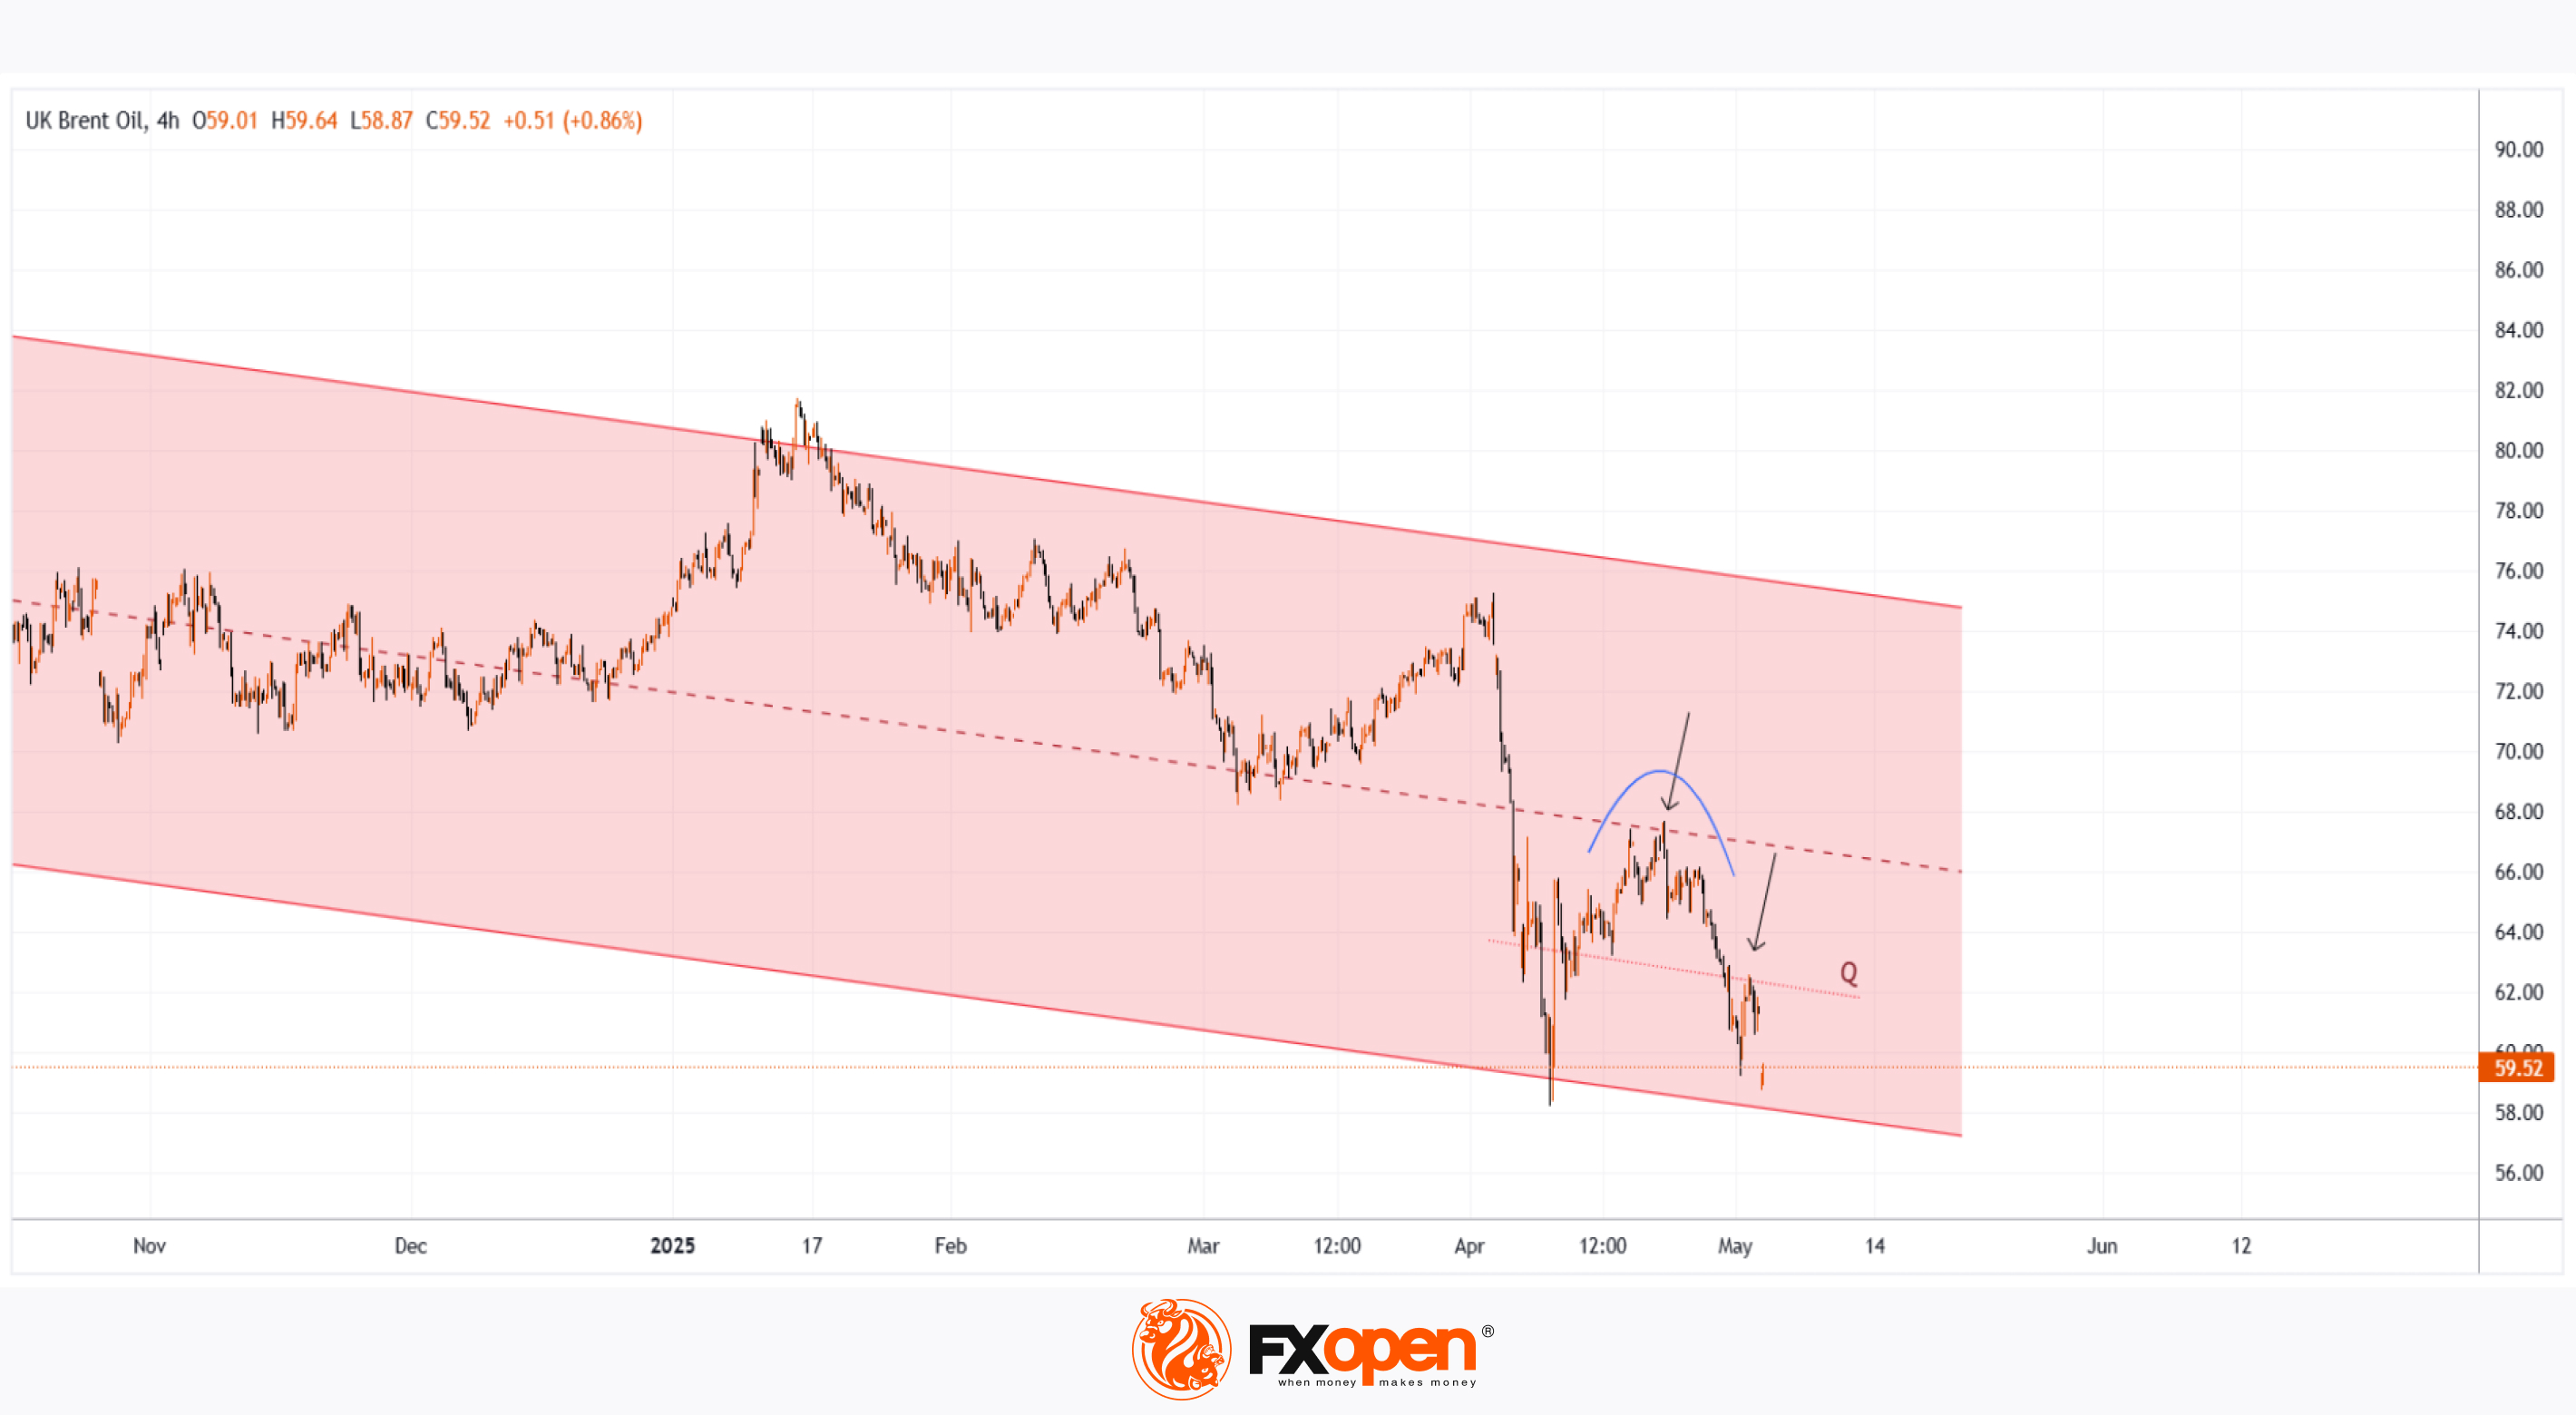
👍2