
#usdcad #forextrading #tradingtips #marketanalysis #MarketNews
USD/CAD Rises to 2-Month High
Today, the USD/CAD exchange rate briefly exceeded the 1.3870 mark – the highest level seen this summer. In less than ten days, the US dollar has strengthened by over 2% against the Canadian dollar.
Why Is USD/CAD Rising?
Given that both the Federal Reserve and the Bank of Canada left interest rates unchanged on Wednesday (as expected), the primary driver behind the pair’s recent rally appears to be US President Donald Trump's decision to impose tariffs on several countries – including Canada:
→ Despite efforts by Prime Minister of Canada Mark Carney to reach an agreement with Trump, no deal was achieved;
→ Canadian goods exported to the US will now be subject to a 35% tariff;
→ The tariffs take effect from 1 August;
→ Goods compliant with the United States-Mexico-Canada Agreement (USMCA) are exempt.
Media analysts note that the tariffs are likely to increase pressure on the Canadian economy, as approximately 75% of the country's exports are destined for the United States.
USD/CAD Technical Analysis
At the end of July, the price formed a steep ascending channel (A-B), with bullish momentum confirmed by a decisive breakout above the 1.3790 resistance level, as illustrated by the arrow:
→ the pullback before the breakout was relatively shallow;
→ the bullish breakout was marked by a long bullish candlestick with a close near the session high;
→ following the breakout, the price confidently consolidated above 1.3790.
Provided that the fundamental backdrop does not undergo a major shift, bulls might attempt to maintain control in the market. However, the likelihood of a correction is also increasing, as the RSI indicator has entered extreme overbought territory.
Should USD/CAD show signs of a correction after its steep ascent, support might be found at:
→ line C, drawn parallel to the A-B channel at a distance of its width;
→ the previously mentioned 1.3790 level, which now acts as a support following the breakout.
Trade over 50 forex markets 24 hours a day with FXOpen. Take advantage of low commissions, deep liquidity, and spreads from 0.0 pips. Open your FXOpen account now or learn more about trading forex with FXOpen.
CFDs are complex instruments and come with a high risk of losing your money.
This article represents the opinion of the Companies operating under the FXOpen brand only. It is not to be construed as an offer, solicitation, or recommendation with respect to products and services provided by the Companies operating under the FXOpen brand, nor is it to be considered financial advice.

👍2
#AAPL #stockmarket #stocktrading #marketanalysis #MarketNews
Apple (AAPL) Shares Jump Following Earnings Report
Yesterday, after the close of the regular trading session, Apple released its earnings report, which surpassed analysts’ expectations:
→ Earnings per share: actual = $1.57, forecast = $1.43;
→ Revenue: actual = $94.04 billion, forecast = $89.35 billion.
As a result, AAPL shares surged in the post-market, rising from $207.57 to $212.51.
Media Commentary:
→ The company reported a 13% year-on-year increase in iPhone sales.
→ However, according to Tim Cook, tariffs have already cost the company $800 million and this figure could exceed $1 billion in the next quarter.
Technical Analysis of the Apple (AAPL) Stock Chart
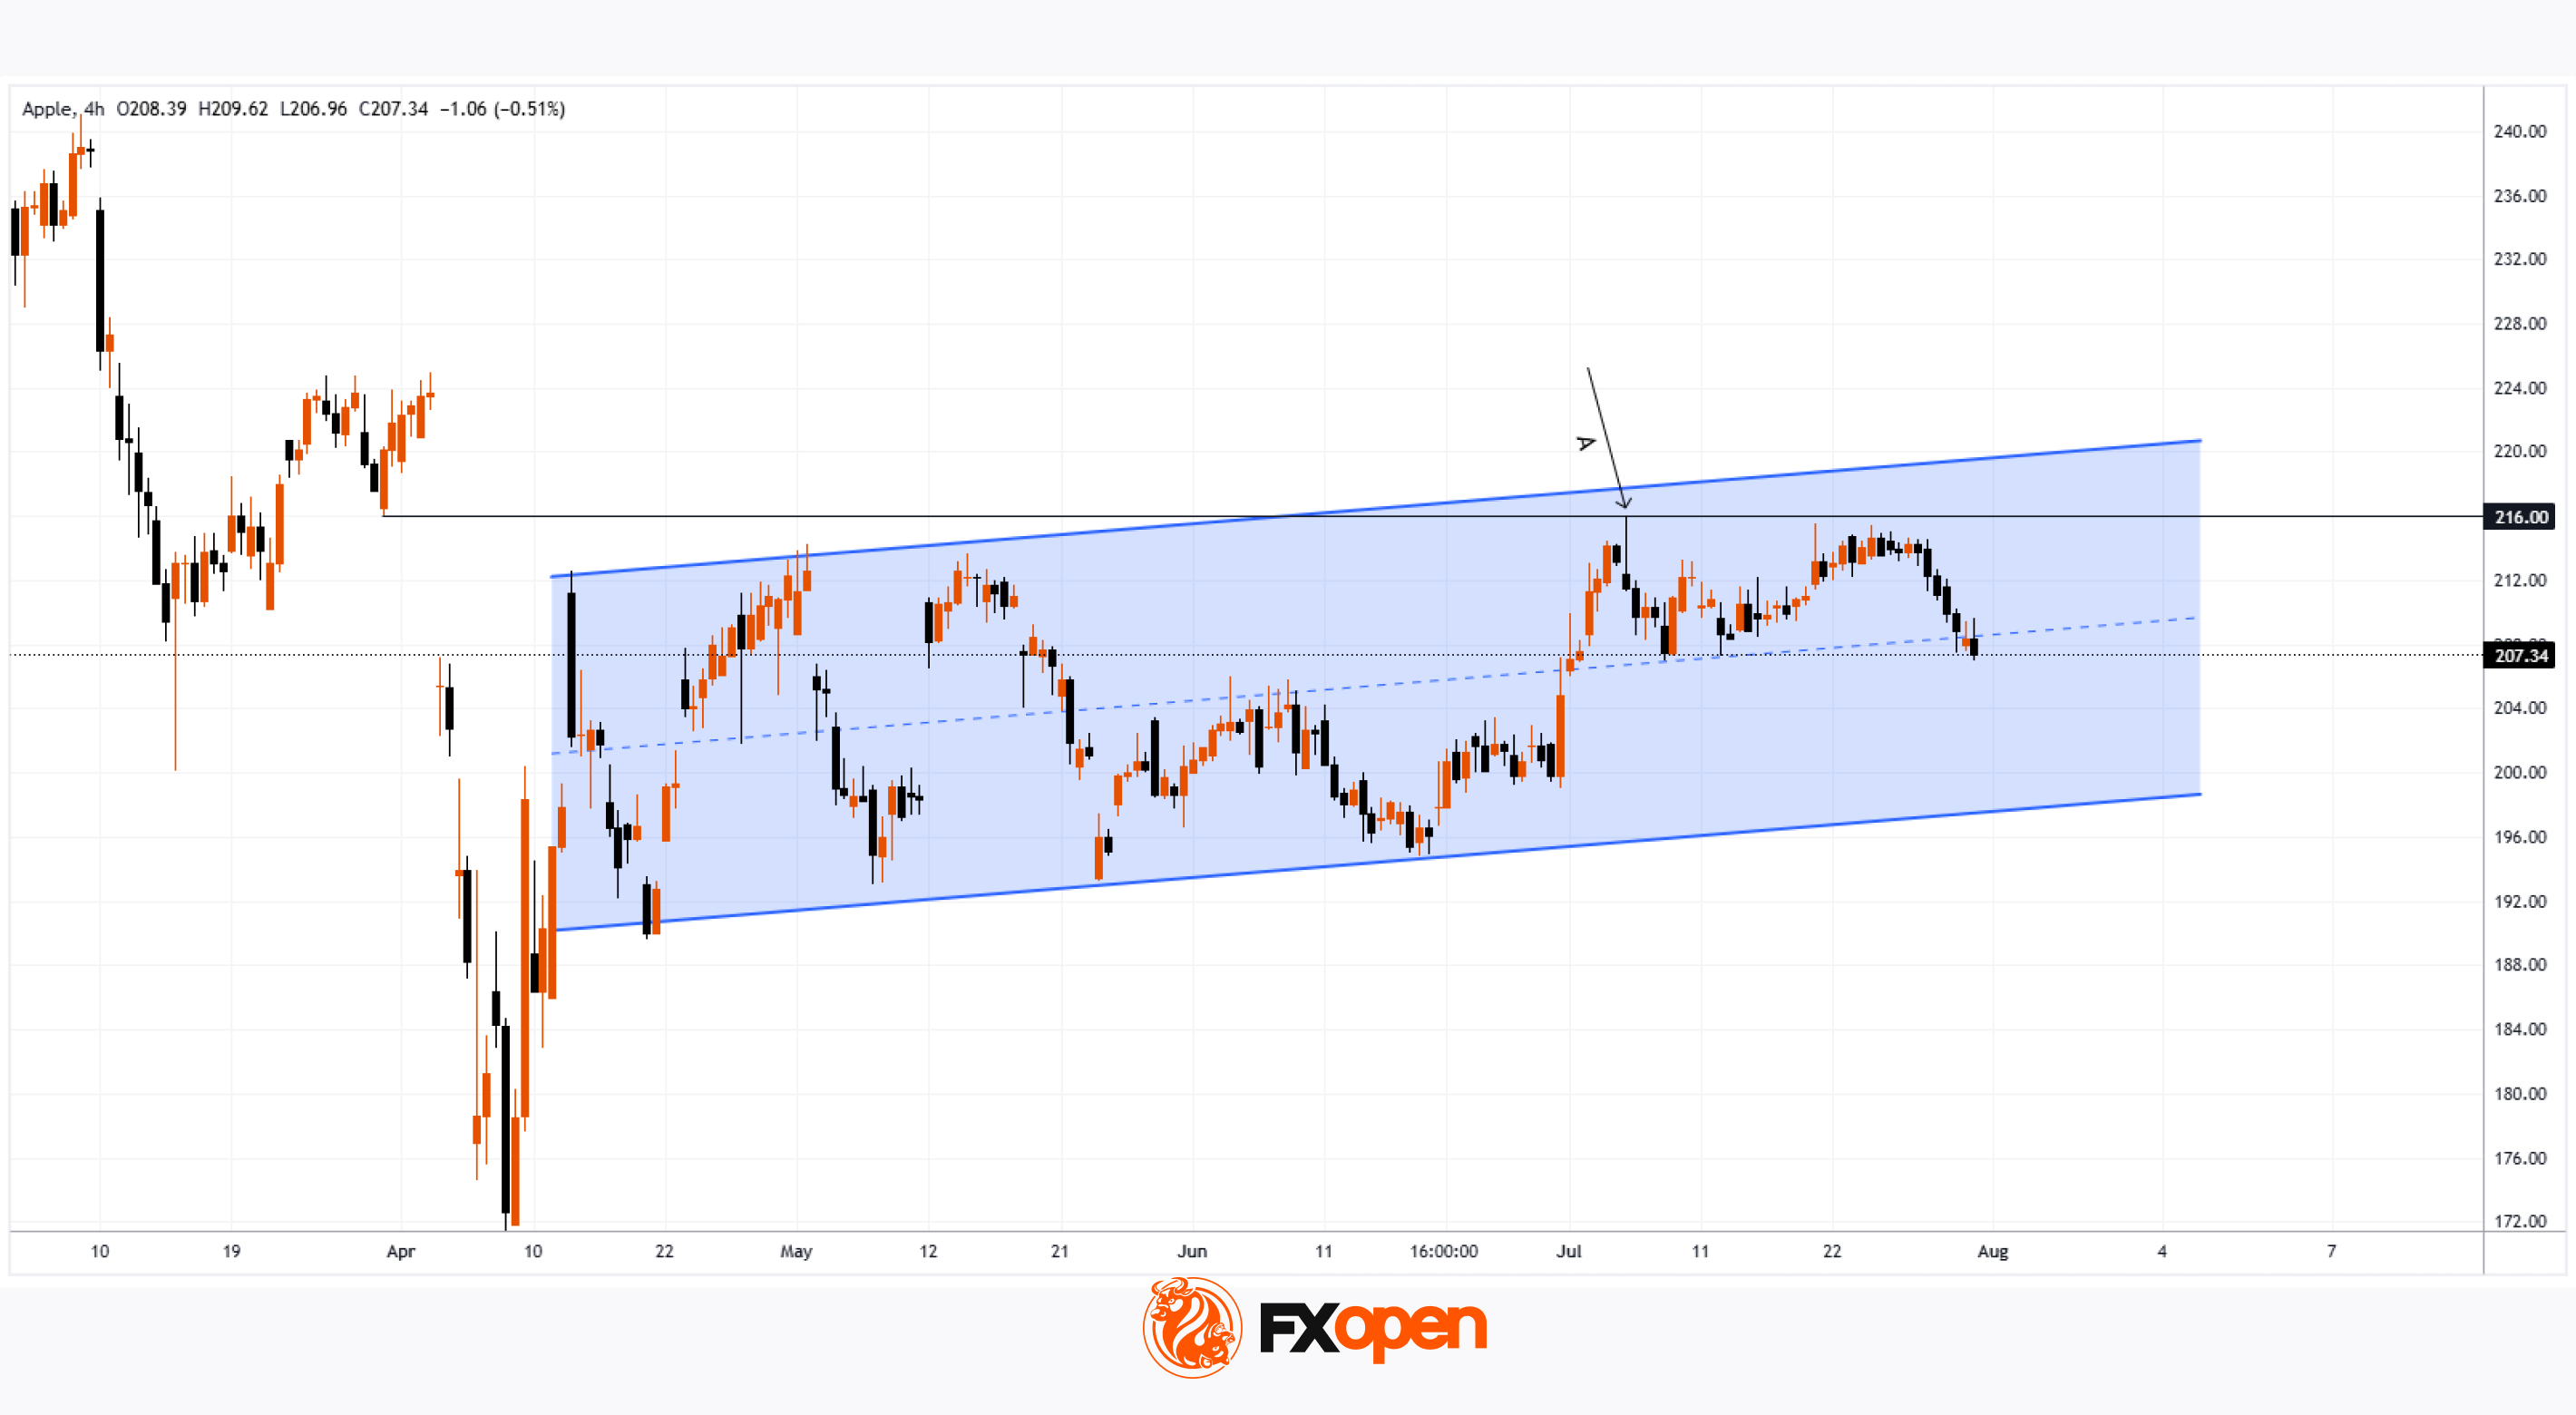
Following the volatility in April 2025, price action has justified the construction of an ascending channel (marked in blue). The $216 level, which has acted as a key reference point since March, remains a significant resistance area, because:
→ It has consistently prevented AAPL from reaching the upper boundary of the channel;
→ Even in the wake of a strong earnings report, the price failed to break through this level in post-market trading.
If the $216 level continues to cap gains in the coming days – despite the positive report – the stock might pull back towards the median line of the blue channel (following the post-market rally). This zone often reflects a balance between supply and demand. While such a retracement would appear technically justified, it may raise concerns among shareholders, particularly when compared to the more aggressive price rallies seen in the shares of other tech giants, such as Microsoft (MSFT), as we discussed yesterday.
From a more pessimistic perspective, peak A may turn out to be yet another lower high within a broader bearish structure that has been forming on the AAPL chart since December 2024, when the stock reached its all-time high around the $260 level.
Trade global index CFDs with zero commission and tight spreads. Open your FXOpen account now or learn more about trading index CFDs with FXOpen.
CFDs are complex instruments and come with a high risk of losing your money.
This article represents the opinion of the Companies operating under the FXOpen brand only. It is not to be construed as an offer, solicitation, or recommendation with respect to products and services provided by the Companies operating under the FXOpen brand, nor is it to be considered financial advice.
👍2
#DXY #marketanalysis #MarketNews #forextrading #tradingtips
US Dollar Index (DXY) Plummets Following Labour Market Data
The US Dollar Index (DXY) fell by approximately 1.4% on Friday after the release of disappointing US labour market figures. According to Forex Factory:
→ The unemployment rate rose from 4.1% to 4.2%;
→ The Nonfarm Employment Change figure came in at 73K, well below the forecast of 103K. This is the lowest level of job creation in the nonfarm sector in 2025 and is roughly half the previous month’s reading (prior to revisions).
→ Furthermore, revisions for May and June were significantly more severe than usual. The May figure was revised downward by 125,000 — from +144,000 to +19,000. Similarly, the June figure was revised down by 133,000 — from +147,000 to +14,000.
These results point to a weakening labour market, which increases the likelihood of a rate cut aimed at supporting economic growth. In turn, expectations of a Fed rate cut are acting as a bearish driver for the US dollar.
Technical Analysis of the DXY Chart
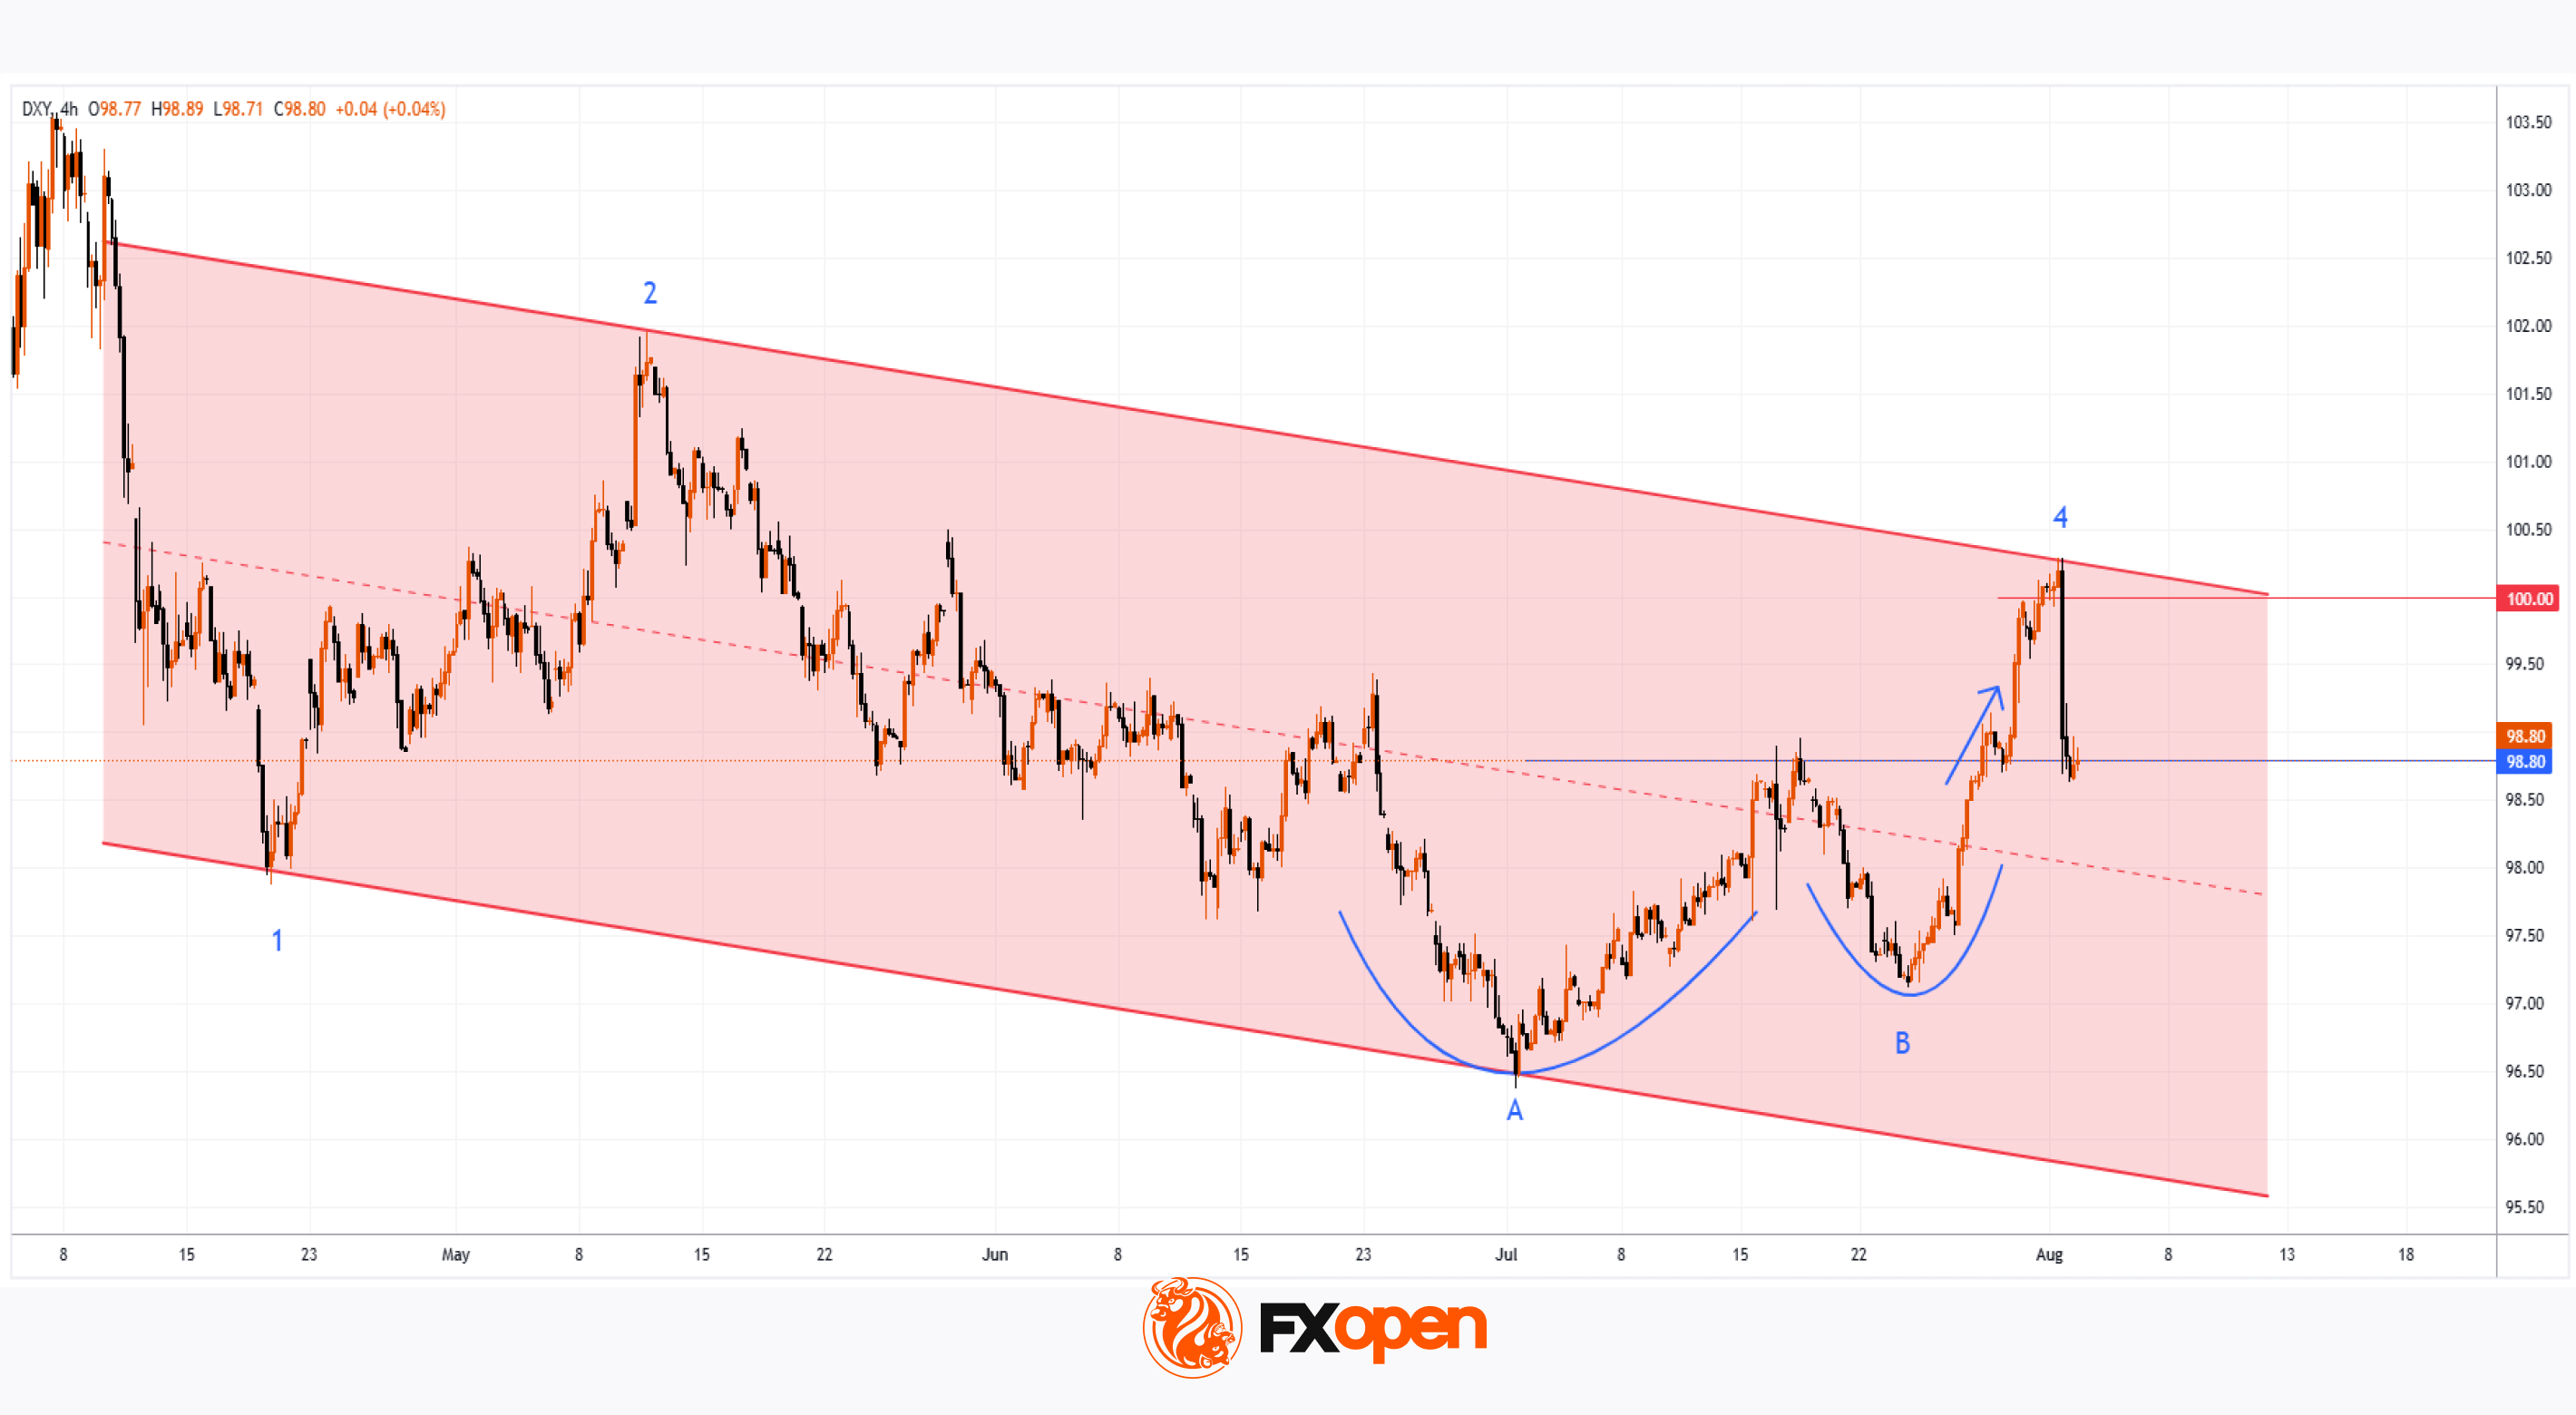
Six days ago, we highlighted two U-shaped trajectories (A and B), which together formed a bullish сup and рandle pattern on the US Dollar Index chart.
Following this, price action generated a notable upward impulse (as indicated by the arrow), breaking through the upper boundary of the pattern.
However, Friday’s news triggered the following developments:
→ A new top (4) was formed on the chart, accompanied by a false bullish breakout above the psychological level of 100.00;
→ The price declined to the 98.80 area. The downward move slowed here, as this zone had previously seen strong bullish activity during the breakout from the pattern’s upper boundary — likely explaining why the market is finding support here on Monday morning.
Overall, the technical picture has shifted towards a bearish outlook. Friday’s peak continues the summer sequence of lower highs and lows: 1 → 2 → bottom of pattern (A) → 4. This structure is part of a broader downtrend that has defined the market in 2025.
Should bearish sentiment persist, fuelled by Friday’s data, we can assume a further decline in the US Dollar Index towards the median line of the descending channel (shown in red), which has been drawn through the aforementioned price extremes.
Trade global index CFDs with zero commission and tight spreads. Open your FXOpen account now or learn more about trading index CFDs with FXOpen.
CFDs are complex instruments and come with a high risk of losing your money.
This article represents the opinion of the Companies operating under the FXOpen brand only. It is not to be construed as an offer, solicitation, or recommendation with respect to products and services provided by the Companies operating under the FXOpen brand, nor is it to be considered financial advice.
👍2
#META #stockmarket #stocktrading #marketanalysis #MarketNews
Meta Platforms (META) Shares Decline
Shares of the US tech giant Meta Platforms (META) hit a record high last week, climbing above $780 following the release of a strong earnings report:
→ Earnings per share (EPS) came in at $7.14, significantly exceeding the forecast of $5.88.
→ The company also outperformed expectations on key metrics related to advertising growth.
→ Additionally, the media has highlighted the growing importance of AI technology to Meta’s business.
However, shortly after reaching an all-time high, META shares began to show bearish momentum.
Technical Analysis of the META Chart
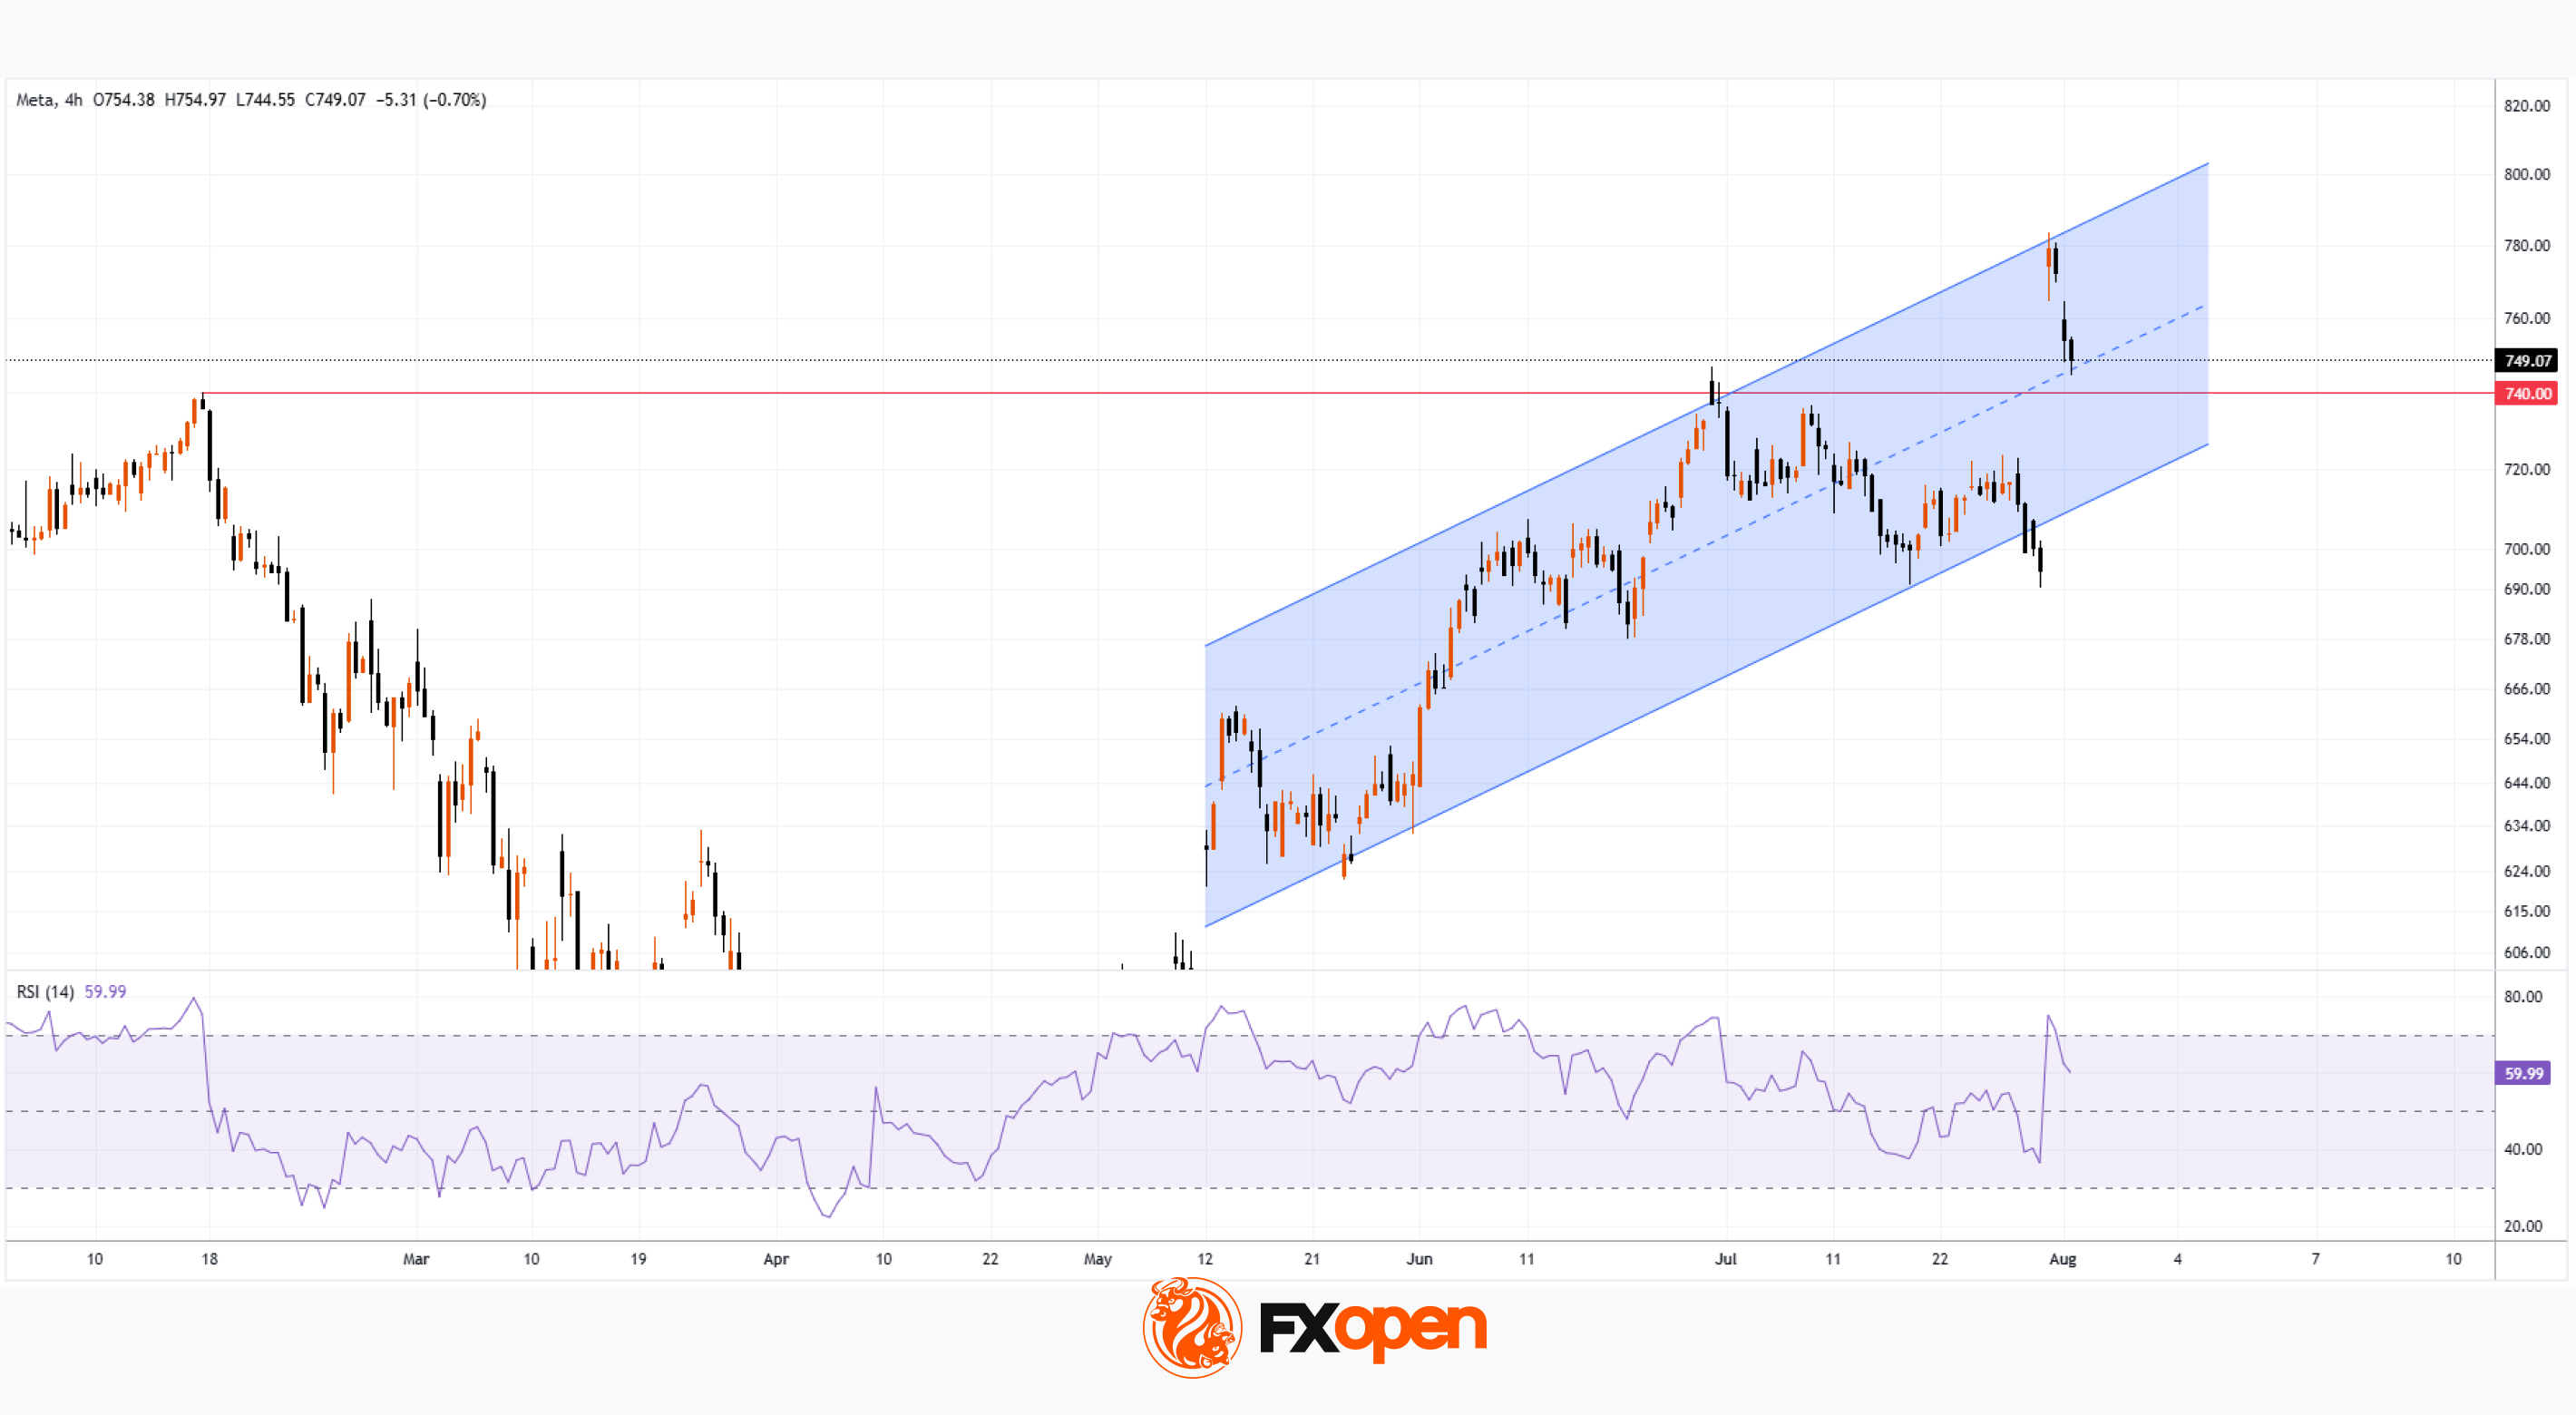
On the four-hour chart, the following signals are visible:
→ A bearish engulfing pattern formed on Thursday;
→ A bearish gap appeared at Friday’s market open, followed by a continuation of the downward move.
This represents a notable pullback from the historical peak — potentially indicating that the initial bullish reaction to the earnings report has faded. The share price decline suggests a correction from overbought territory, as confirmed by the RSI indicator.
The $740 level appears to be a key support zone — previously acting as major resistance before the breakout. Bulls could also find support from the median line and the lower boundary of the ascending channel that has been developing since mid-May.
Given this context, a scenario in which bulls attempt to resume the uptrend within the ascending channel cannot be ruled out, especially considering the company’s strong fundamentals and the presence of multiple technical support levels.
Trade global index CFDs with zero commission and tight spreads. Open your FXOpen account now or learn more about trading index CFDs with FXOpen.
CFDs are complex instruments and come with a high risk of losing your money.
This article represents the opinion of the Companies operating under the FXOpen brand only. It is not to be construed as an offer, solicitation, or recommendation with respect to products and services provided by the Companies operating under the FXOpen brand, nor is it to be considered financial advice.
👍2
#InterestRates #EarningsSeason #JobsReport #BankOfEngland #TechStocks #TradeTensions #GlobalMarkets #Inflation #Forex
Market Insights with Gary Thomson: BoE Interest Rate, Canada Jobs Data & Earnings Reports
In this video, we’ll explore the key economic events, market trends, and corporate news shaping the financial landscape. Get ready for expert insights into forex, commodities, and stocks to help you navigate the week ahead. Let’s dive in!
In this episode of Market Insights, Gary Thomson unpacks the strategic implications of the week’s most critical events driving global markets.
👉 Key topics covered in this episode:
🔸 BoE Interest Rate Decision
Markets expect a 25 bps rate cut from the Bank of England on 7 August, but GBP volatility may hinge more on the MPC vote split and policy tone. Inflation has eased but remains above target, keeping the BoE cautious. What factors can trigger volatility in GBP pairs?
🔸 Unemployment Rate in Canada
Canada’s jobs data due 8 August could sway rate cut expectations. Last month’s surprise drop in unemployment eased pressure on the Bank of Canada. Will the upcoming jobs report revive rate cut bets and weigh on the Canadian dollar?
🔸 Corporate Earnings Statements
This week’s earnings spotlight major tech and consumer firms. Key focus areas include AI adoption, data center growth, and consumer spending trends, with Palantir, AMD, Super Micro, Disney, and Shopify all in play. Which company’s earnings do you think will have the biggest market impact — and why?
🔸 Trade Tensions
Trade tensions remain a market risk, even without new Trump announcements this week. Reactions from major partners like India, the EU, China, and Canada could spark volatility.
Gain insights to strengthen your trading knowledge.
💬 Don’t forget to like, comment, and subscribe for more professional market insights every week.
https://cutt.ly/MrDlrJNa
To take advantage of price fluctuations in the foreign exchange markets, consider enlisting the services of a reliable broker like FXOpen.
⚠️
This forecast represents FXOpen Companies opinion only, it should not be construed as an offer, invitation or recommendation in respect to FXOpen Companies products and services or as financial advice.
YouTube
Market Insights with Gary Thomson: BoE Interest Rate, Canada Jobs Data & Earnings Reports
In this video, we’ll explore the key economic events, market trends, and corporate news shaping the financial landscape. Get ready for expert insights into forex, commodities, and stocks to help you navigate the week ahead. Let’s dive in!
In this episode…
In this episode…
👍2
#NASDAQ #stockmarket #stocktrading #MarketUpdates #MarketNews
Nasdaq 100 Analysis: Index Rebounds After Friday’s Decline
The release of disappointing US labour market data on Friday unsettled both stock market participants and the President of the United States:
→ Donald Trump promptly dismissed Erica McEntarfer, Commissioner of the Bureau of Labor Statistics, accusing her of falsifying employment data.
→ Stock indices accelerated their decline, with the Nasdaq 100 Index (US Tech 100 mini on FXOpen) falling below its 16 June low.
However, US stock indices staged a strong recovery on Monday. According to Reuters, yesterday marked the largest daily percentage gain since 27 May.
Why Did Stock Indices Rise?
Possible reasons include:
→ Buyers were attracted by the falling share prices of companies that, for the most part, had delivered strong quarterly earnings;
→ Market participants are betting on a potential rate cut by the Federal Reserve in September (a move strongly advocated by Trump), which could support both the economy and the stock market.
Technical Analysis of the Nasdaq 100 Chart (US Tech 100 mini on FXOpen)
In our earlier analysis of the Nasdaq 100 Index (US Tech 100 mini on FXOpen), we:
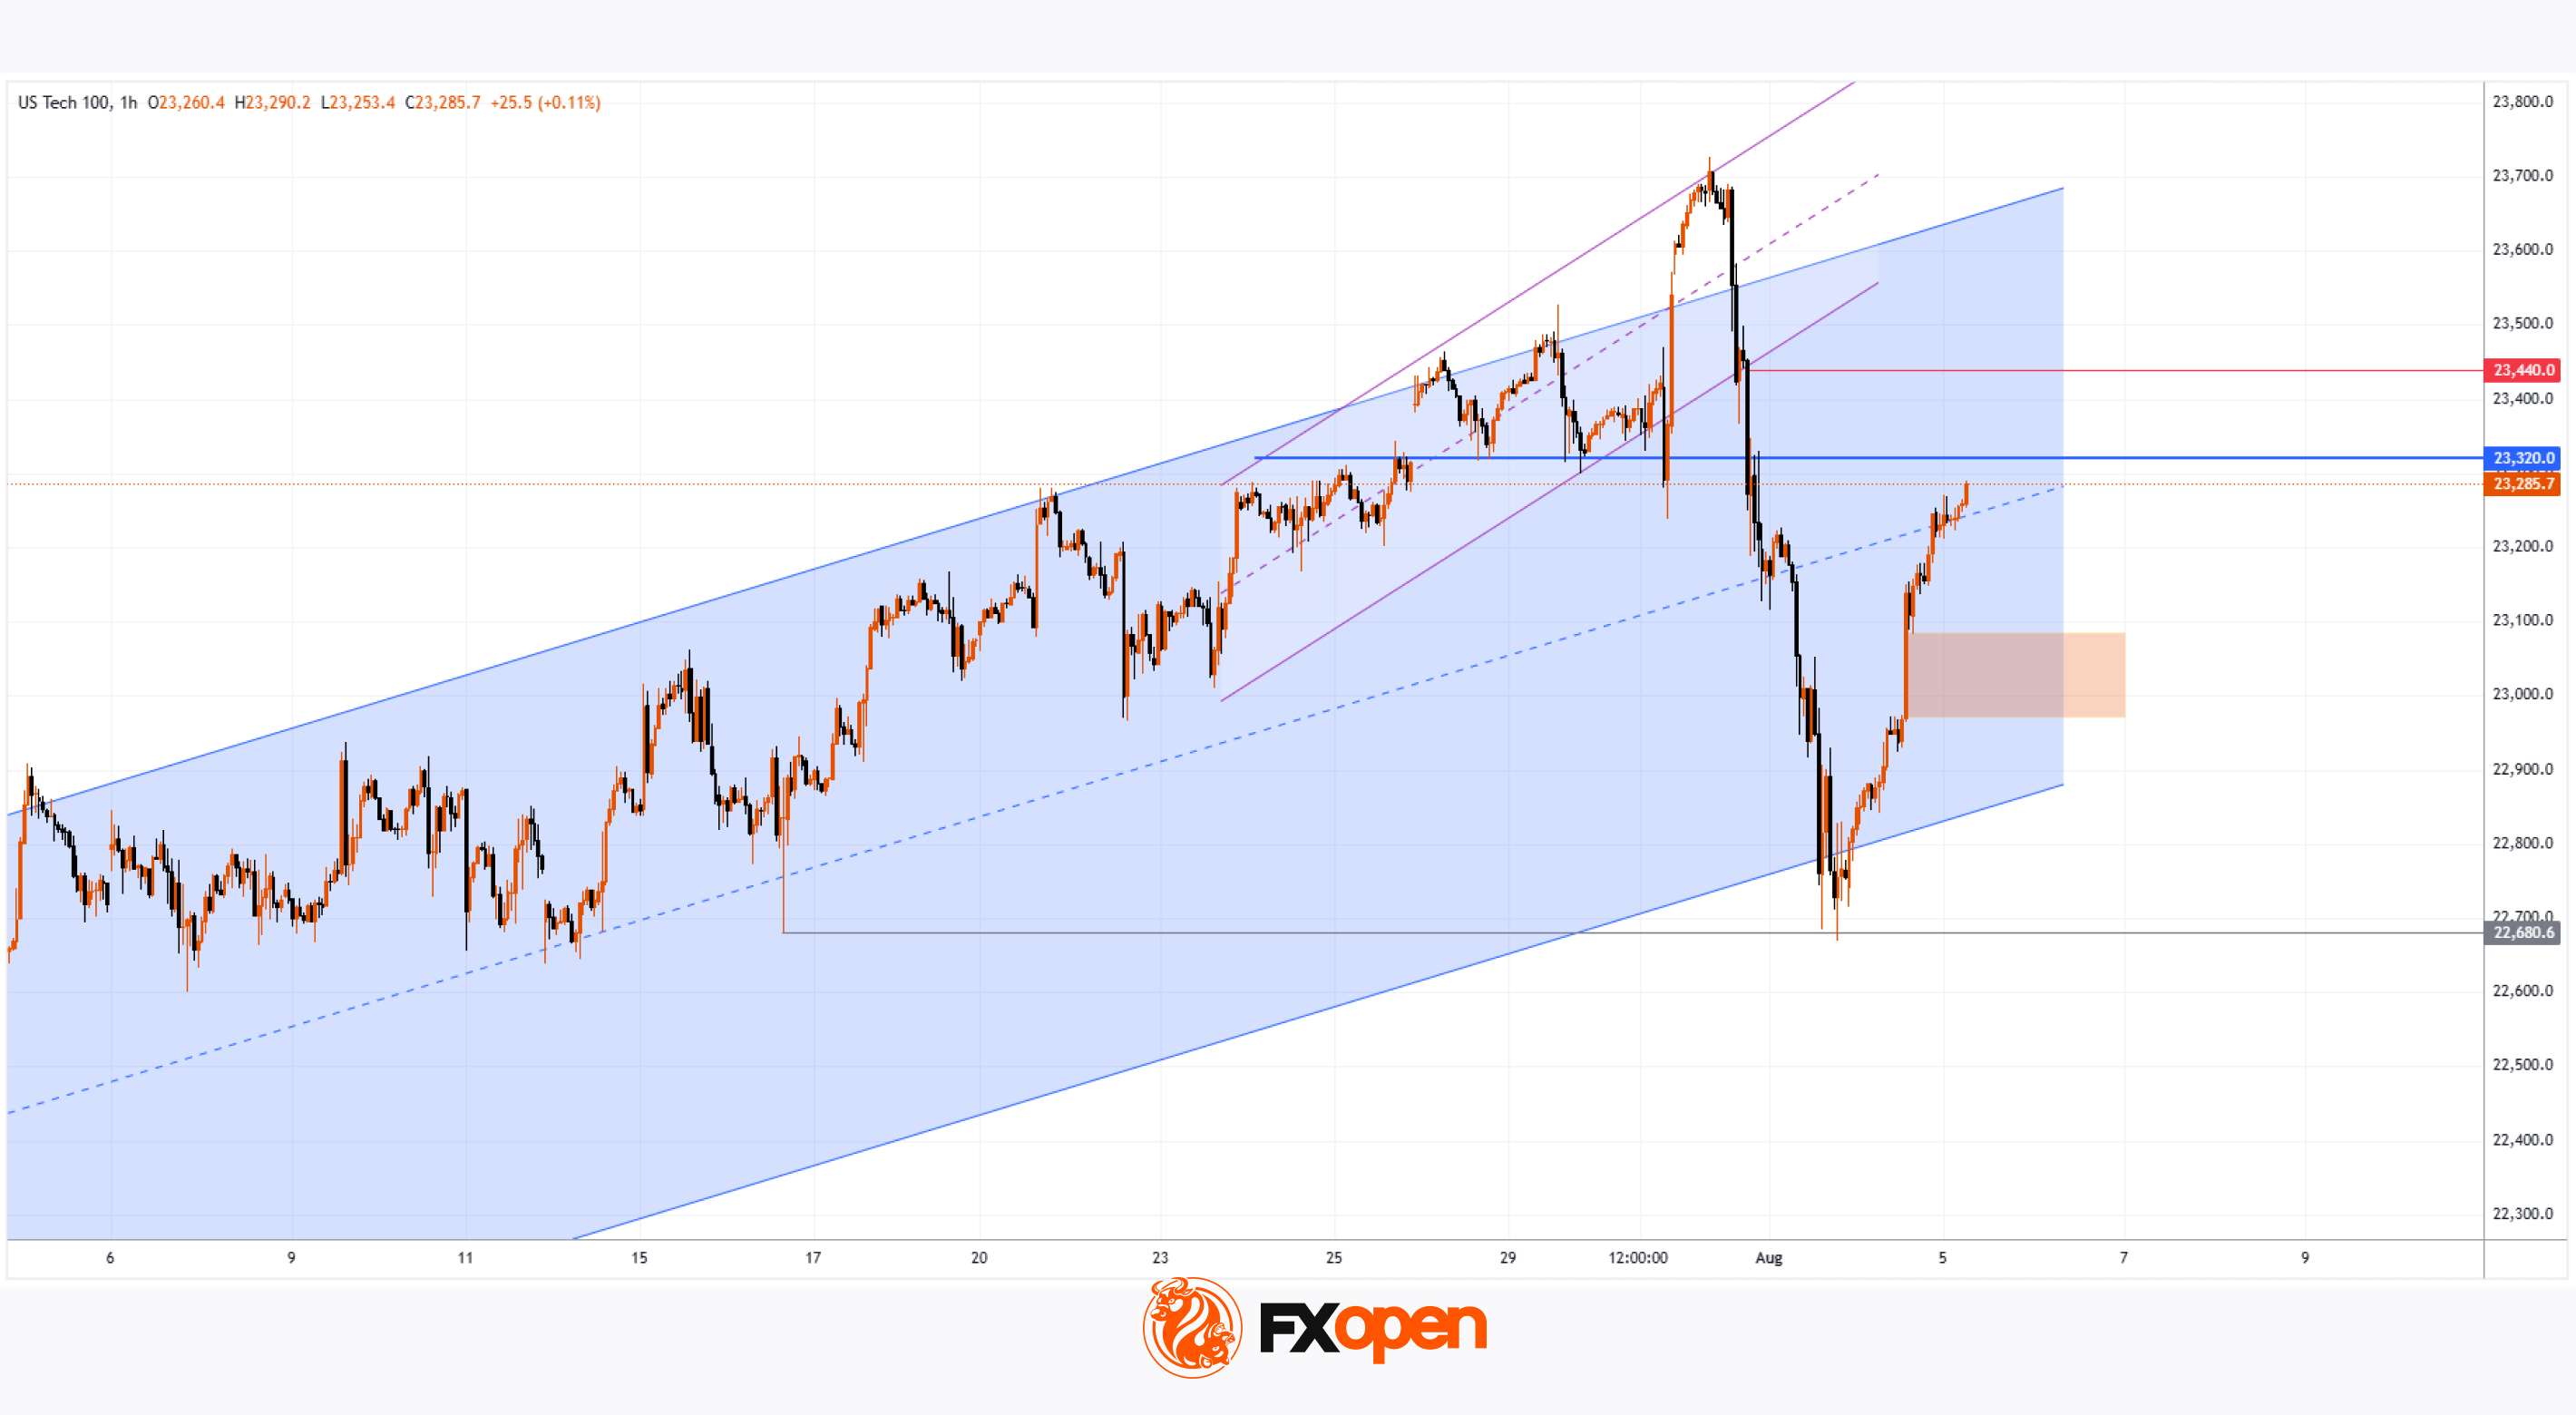
→ Identified a primary ascending channel (marked in blue);
→ Highlighted that the price had risen above the upper boundary of the channel (a sign of excessive optimism);
→ Anticipated a potential correction towards the 23,020 level.
However, the correction turned out to be more substantial than initially expected.
As a result of the price movements on Friday and Monday:
→ The blue channel was widened twofold;
→ The price found support at its new lower boundary and reversed upwards;
→ As of today, the Nasdaq 100 index is trading near the median line.
This can be interpreted as the market aggressively digesting recent corporate earnings reports and the prospects of a rate cut in light of a deteriorating labour market. Demand and supply may reach a new equilibrium, potentially leading to a consolidation phase around the median of the widened channel.
It is also possible that the area marked in orange—where the price previously rallied strongly, indicating a buyer-driven imbalance—may now act as support. Resistance levels might include:
→ Former support at 23,320;
→ 23,440 – the level at which bears broke through the purple channel.
Trade global index CFDs with zero commission and tight spreads. Open your FXOpen account now or learn more about trading index CFDs with FXOpen.
CFDs are complex instruments and come with a high risk of losing your money.
This article represents the opinion of the Companies operating under the FXOpen brand only. It is not to be construed as an offer, solicitation, or recommendation with respect to products and services provided by the Companies operating under the FXOpen brand, nor is it to be considered financial advice.
👍3
#oilprices #XBRUSD #commodities #MarketNews #marketanalysis
XBR/USD Chart Analysis: Oil Price Declines Towards Key Support
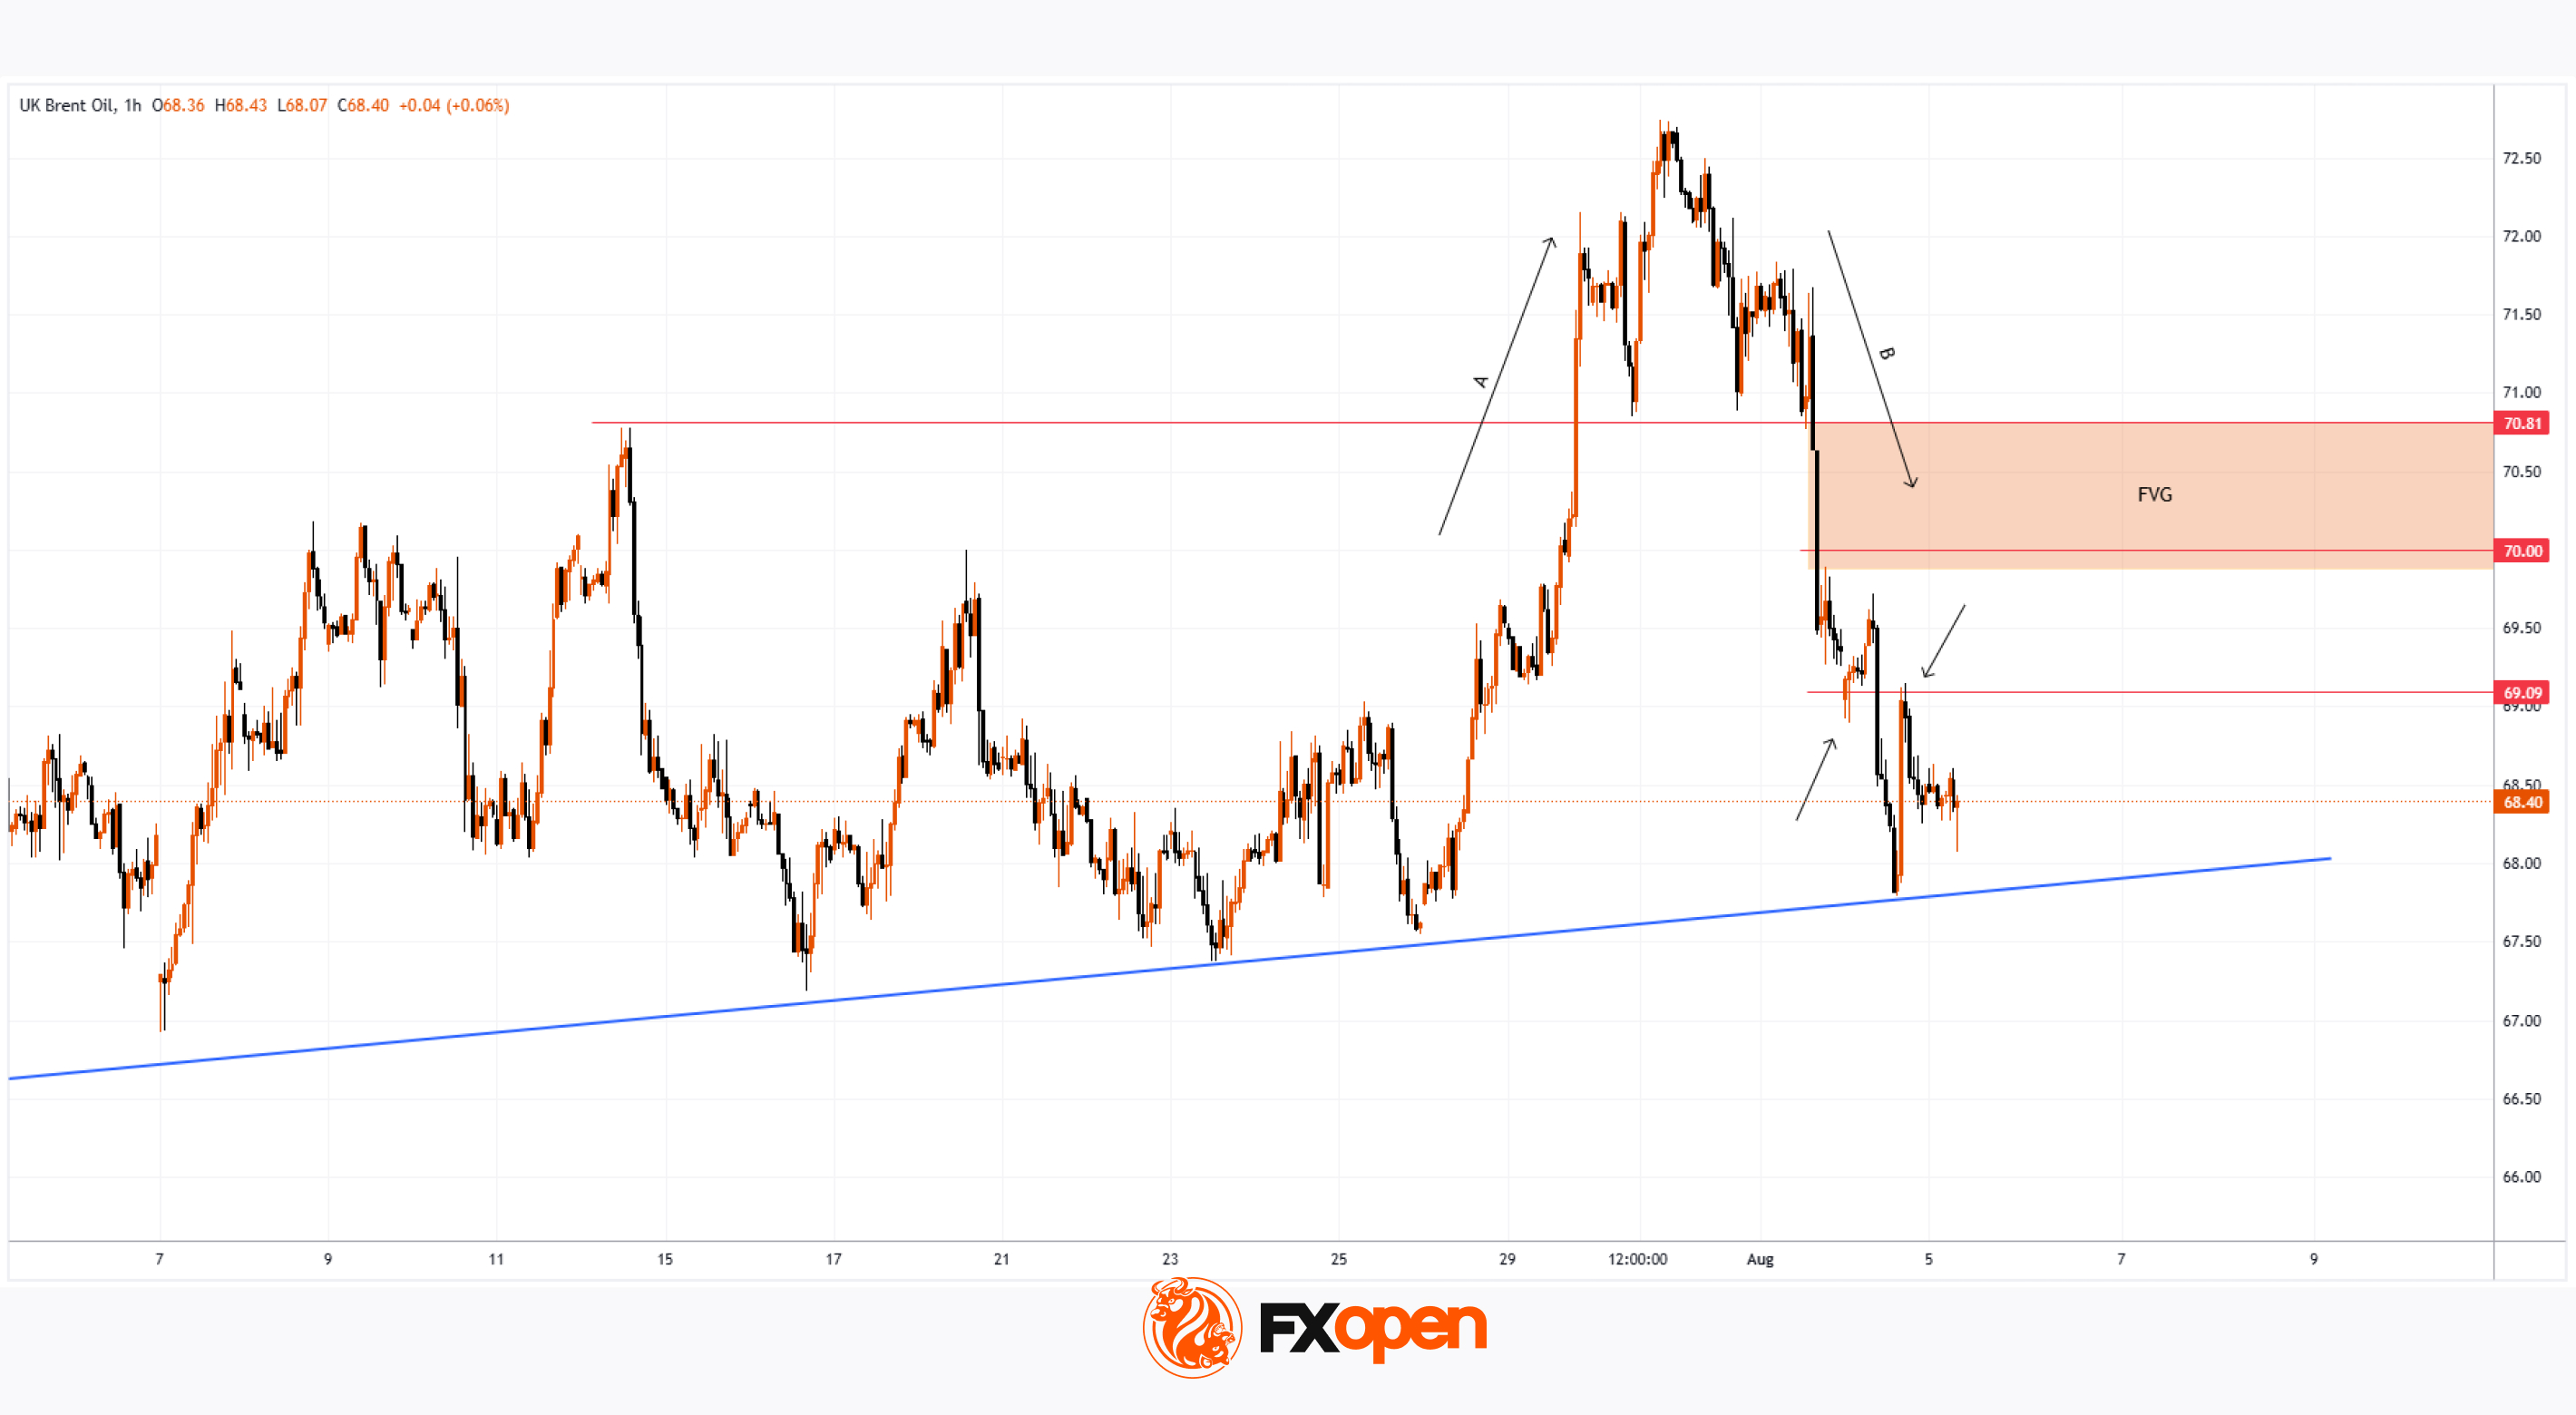
As the XBR/USD chart shows, Brent crude oil has made two significant moves recently:
1. Last week’s price increase (A) followed President Donald Trump’s intentions to impose tariffs on India due to its purchases of Russian oil. This could have disrupted established oil supply chains.
2. The price decline (B) may have been driven by both the decision of OPEC+ countries to increase production and reports of a weakening US labour market.
Thus, there is reason to believe that the more than 4.5% decline in Brent crude oil prices since the beginning of August reflects market participants’ scepticism about sustained high oil prices:
→ this has a negative impact on the US economy (JP Morgan analysts raised concerns about recession risks this week);
→ increased activity from oil producers may offset supply chain disruption risks.
Technical Analysis of the XBR/USD Chart
From a technical analysis perspective, Brent crude oil has dropped to a key support level (marked in blue), which was previously active in July. A rebound from this line could happen – in such a case, the price might face resistance at the Fair Value Gap area (marked in orange), formed between:
→ $70.81 – a support level active in late July, which was broken;
→ the psychological level of $70.00.
Attention should also be paid to price behaviour around the $69.00 level (indicated by arrows) – it quickly switched roles from support to resistance, indicating aggressive bearish sentiment. Given this observation, a potential bearish breakout attempt below the blue support line cannot be ruled out.
However, whether this scenario materialises will largely depend on developments in geopolitical risks and tariff agreements.
Start trading commodities with tight spreads. Open your trading account now or learn more about trading commodity CFDs with FXOpen.
CFDs are complex instruments and come with a high risk of losing your money.
This article represents the opinion of the Companies operating under the FXOpen brand only. It is not to be construed as an offer, solicitation, or recommendation with respect to products and services provided by the Companies operating under the FXOpen brand, nor is it to be considered financial advice.
👍4
#AMD #stockmarket #stocktrading #MarketNews #marketanalysis
AMD Shares Decline Despite Strong Earnings Report
Yesterday, following the close of the stock market, Advanced Micro Devices released a strong quarterly earnings report:
→ Earnings per share came in at $0.48 (roughly in line with forecasts);
→ Revenue reached $7.68 billion (versus expectations of $7.41 billion).
At the same time, CEO Lisa Su stated: “We’re well positioned to deliver significant growth in the second half.”
However, despite the solid performance and optimistic outlook, AMD shares declined in after-hours trading, falling below $165.
The decline in AMD’s share price following a strong report may be attributed to excessively high expectations and the stock's overbought condition ahead of the announcement.
Technical Analysis of the AMD Stock Chart
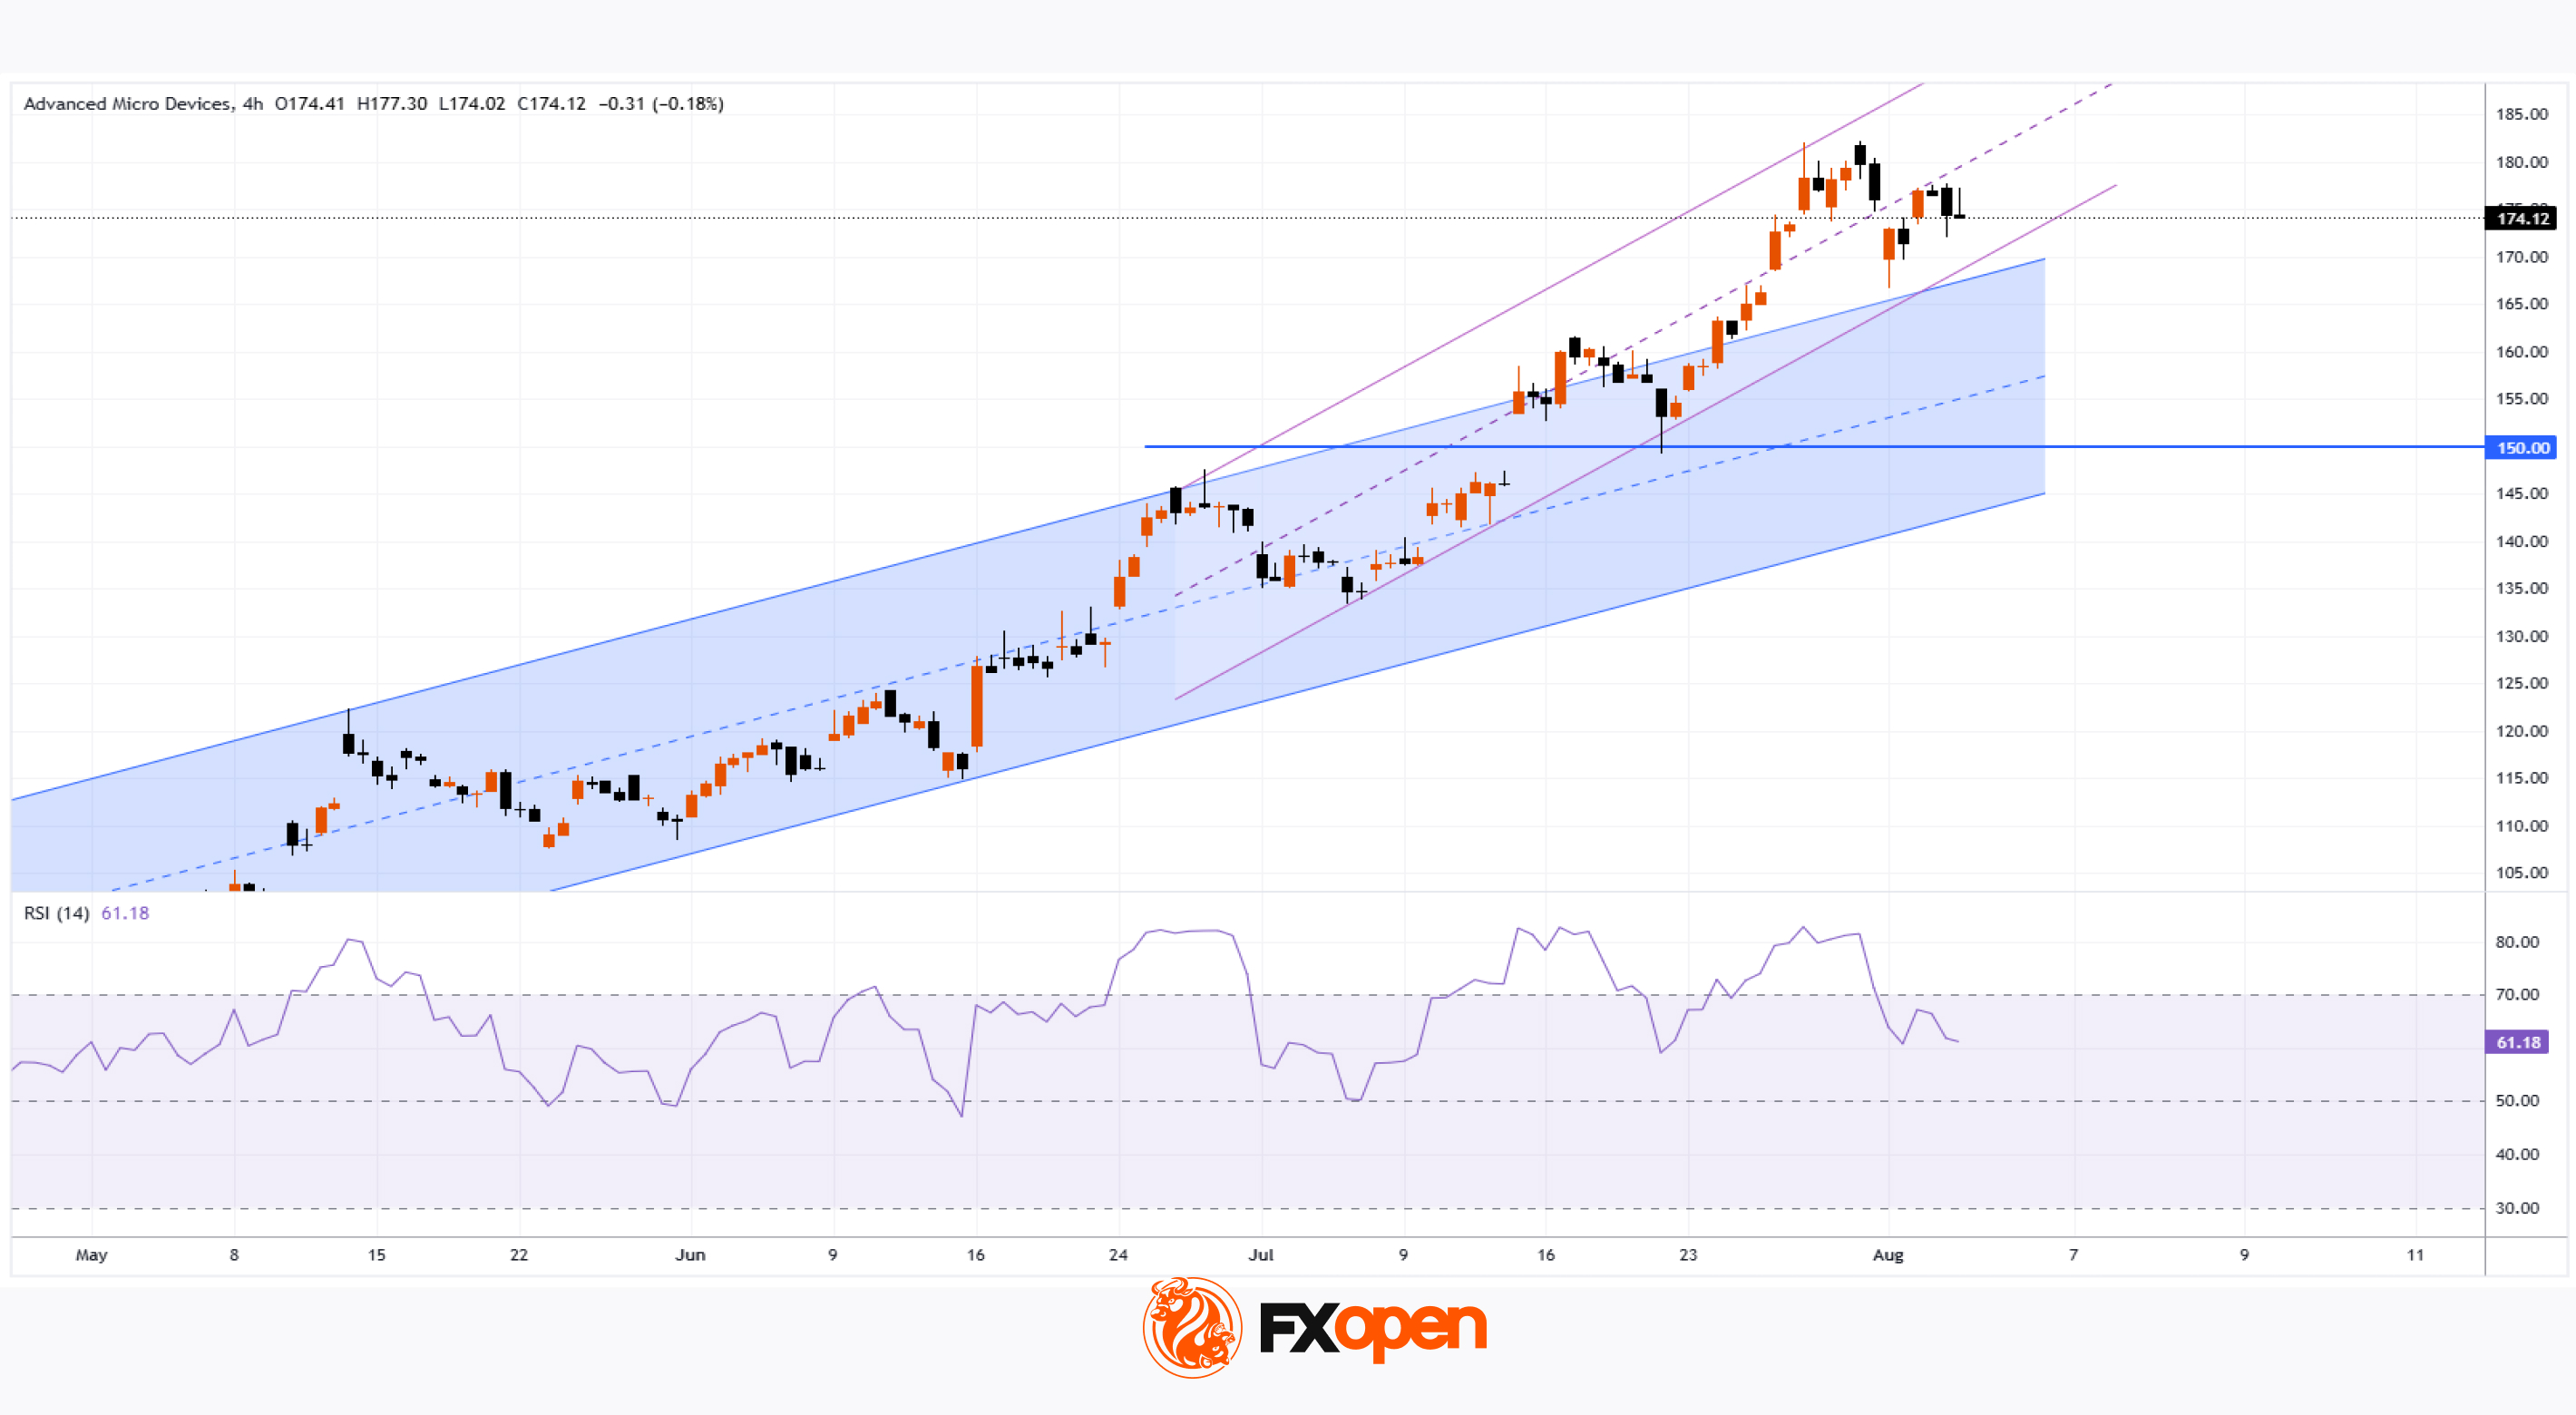
Since April 2025, price fluctuations have formed an ascending channel (highlighted in blue). In July:
→ the price broke above the upper boundary of this channel, moving sharply higher (marked in purple);
→ the RSI indicator remained above the 50 level throughout.
We can assume that investors were following the meteoric rise of Nvidia (NVDA) shares and were betting that the ongoing AI boom would enable AMD to deliver extraordinary results. However, these hopes were not fully realised — the classic case of "buy the rumour, sell the fact".
As a result, AMD shares may open today with a bearish gap. From a technical standpoint, this suggests that the price is returning to the limits of the blue ascending channel, where the midline and lower boundary may act as support levels. The psychological support level at $150 also appears significant.
This move may be interpreted as a correction — and once the excessive optimism accumulated in July dissipates, bulls may attempt to resume the upward trend, supported by fundamentally strong data.
Trade global index CFDs with zero commission and tight spreads. Open your FXOpen account now or learn more about trading index CFDs with FXOpen.
CFDs are complex instruments and come with a high risk of losing your money.
This article represents the opinion of the Companies operating under the FXOpen brand only. It is not to be construed as an offer, solicitation, or recommendation with respect to products and services provided by the Companies operating under the FXOpen brand, nor is it to be considered financial advice.
👍2
#gasprices #commodities #stocktrading #stockmarket
Natural Gas Prices Fall to Yearly Low
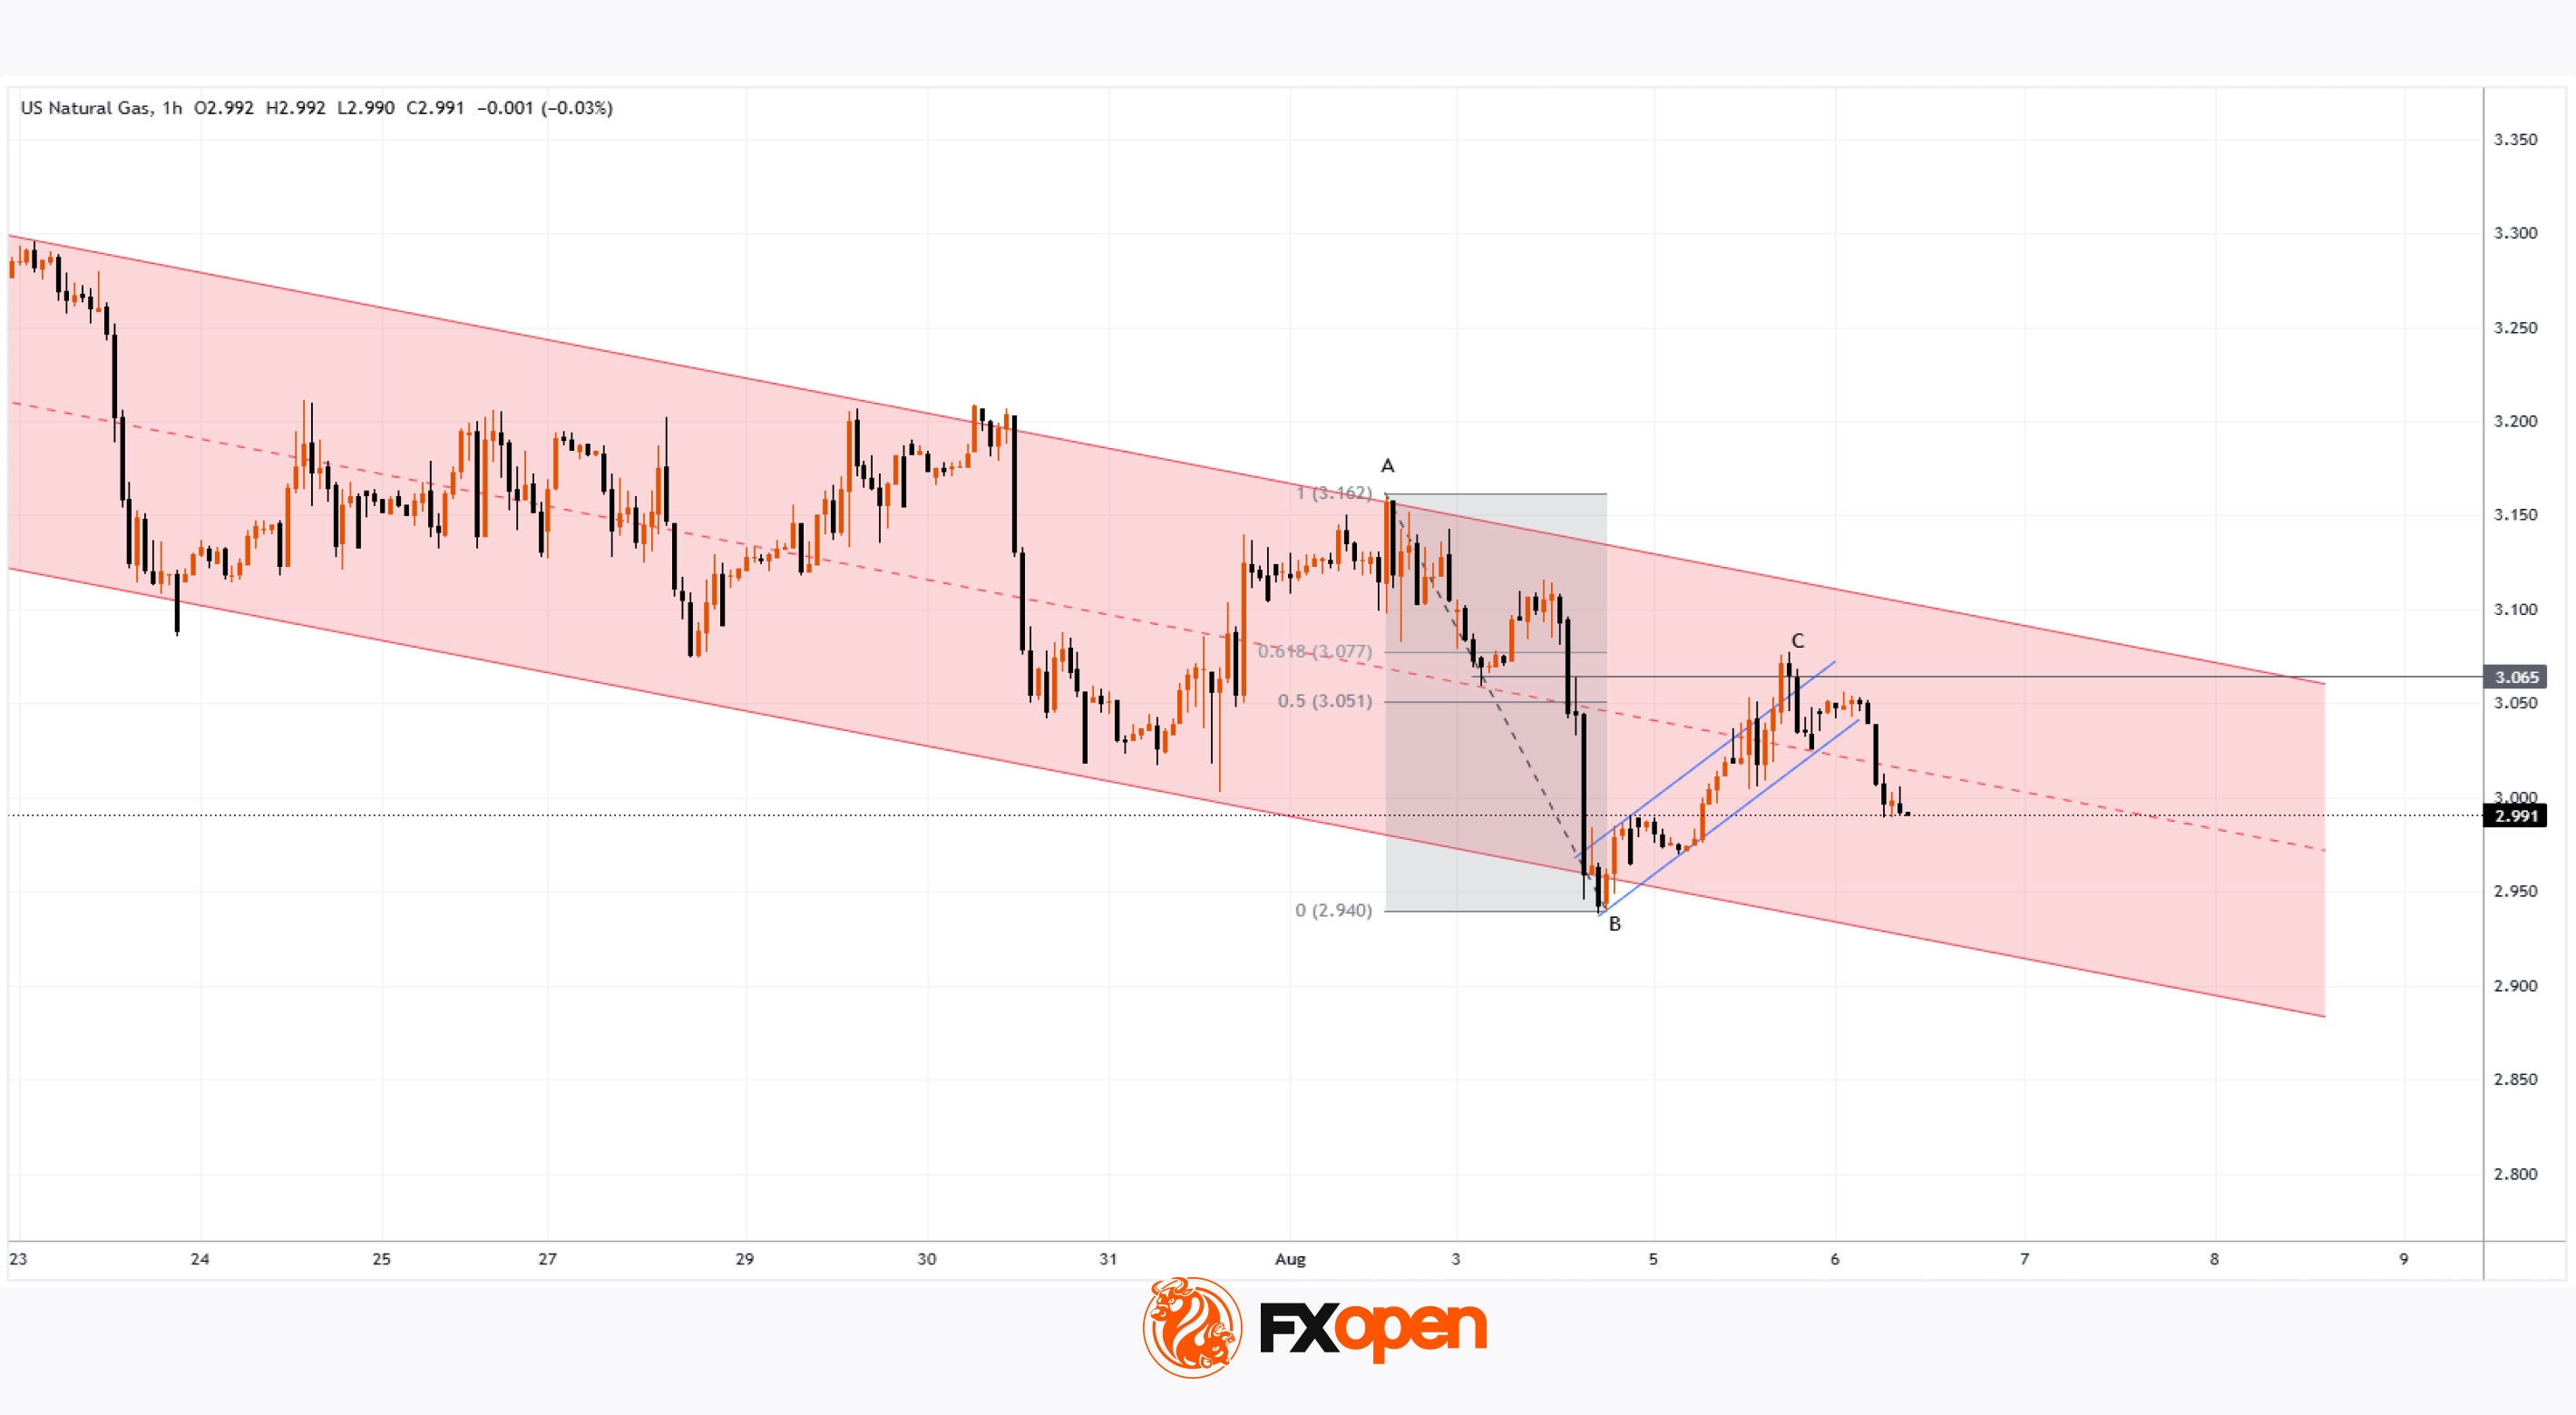
Analysing the chart on 22 July, we constructed a descending channel and assumed that natural gas prices would continue to form a bearish market structure of lower highs and lower lows. Since then, the market has declined by almost 10%.
As the XNG/USD chart shows today, natural gas prices are hovering around the psychological level of $3.000/MMBtu. Earlier this week, gas was trading around $2.940/MMBtu — the lowest level of 2025.
According to media reports, the price decline is driven by both high production levels and favourable weather forecasts for August, the hottest month of the year. What might happen next?
Technical Analysis of the XNG/USD Chart
We have updated the descending channel, taking into account the recent fluctuations in natural gas prices.
The chart shows that bearish momentum remains intact — the rise from point B to C appears to be a corrective rebound within the prevailing downward trend, with the following developments:
→ point C formed in the 0.5–0.618 area, which corresponds to classic Fibonacci retracement levels following the A→B impulse;
→ the former support at 0.365 has now become resistance.
Bulls may hope that the current sentiment could shift following tomorrow’s natural gas storage report (scheduled for 17:30 GMT+3). A drop in inventories could potentially trigger a bullish impulse on the XNG/USD chart.
Start trading commodities with tight spreads. Open your trading account now or learn more about trading commodity CFDs with FXOpen.
CFDs are complex instruments and come with a high risk of losing your money.
This article represents the opinion of the Companies operating under the FXOpen brand only. It is not to be construed as an offer, solicitation, or recommendation with respect to products and services provided by the Companies operating under the FXOpen brand, nor is it to be considered financial advice.
👍3
#EURUSD #forextrading #tradingtips #marketanalysis #MarketNews
EUR/USD Rises 2.3% Since the Beginning of August
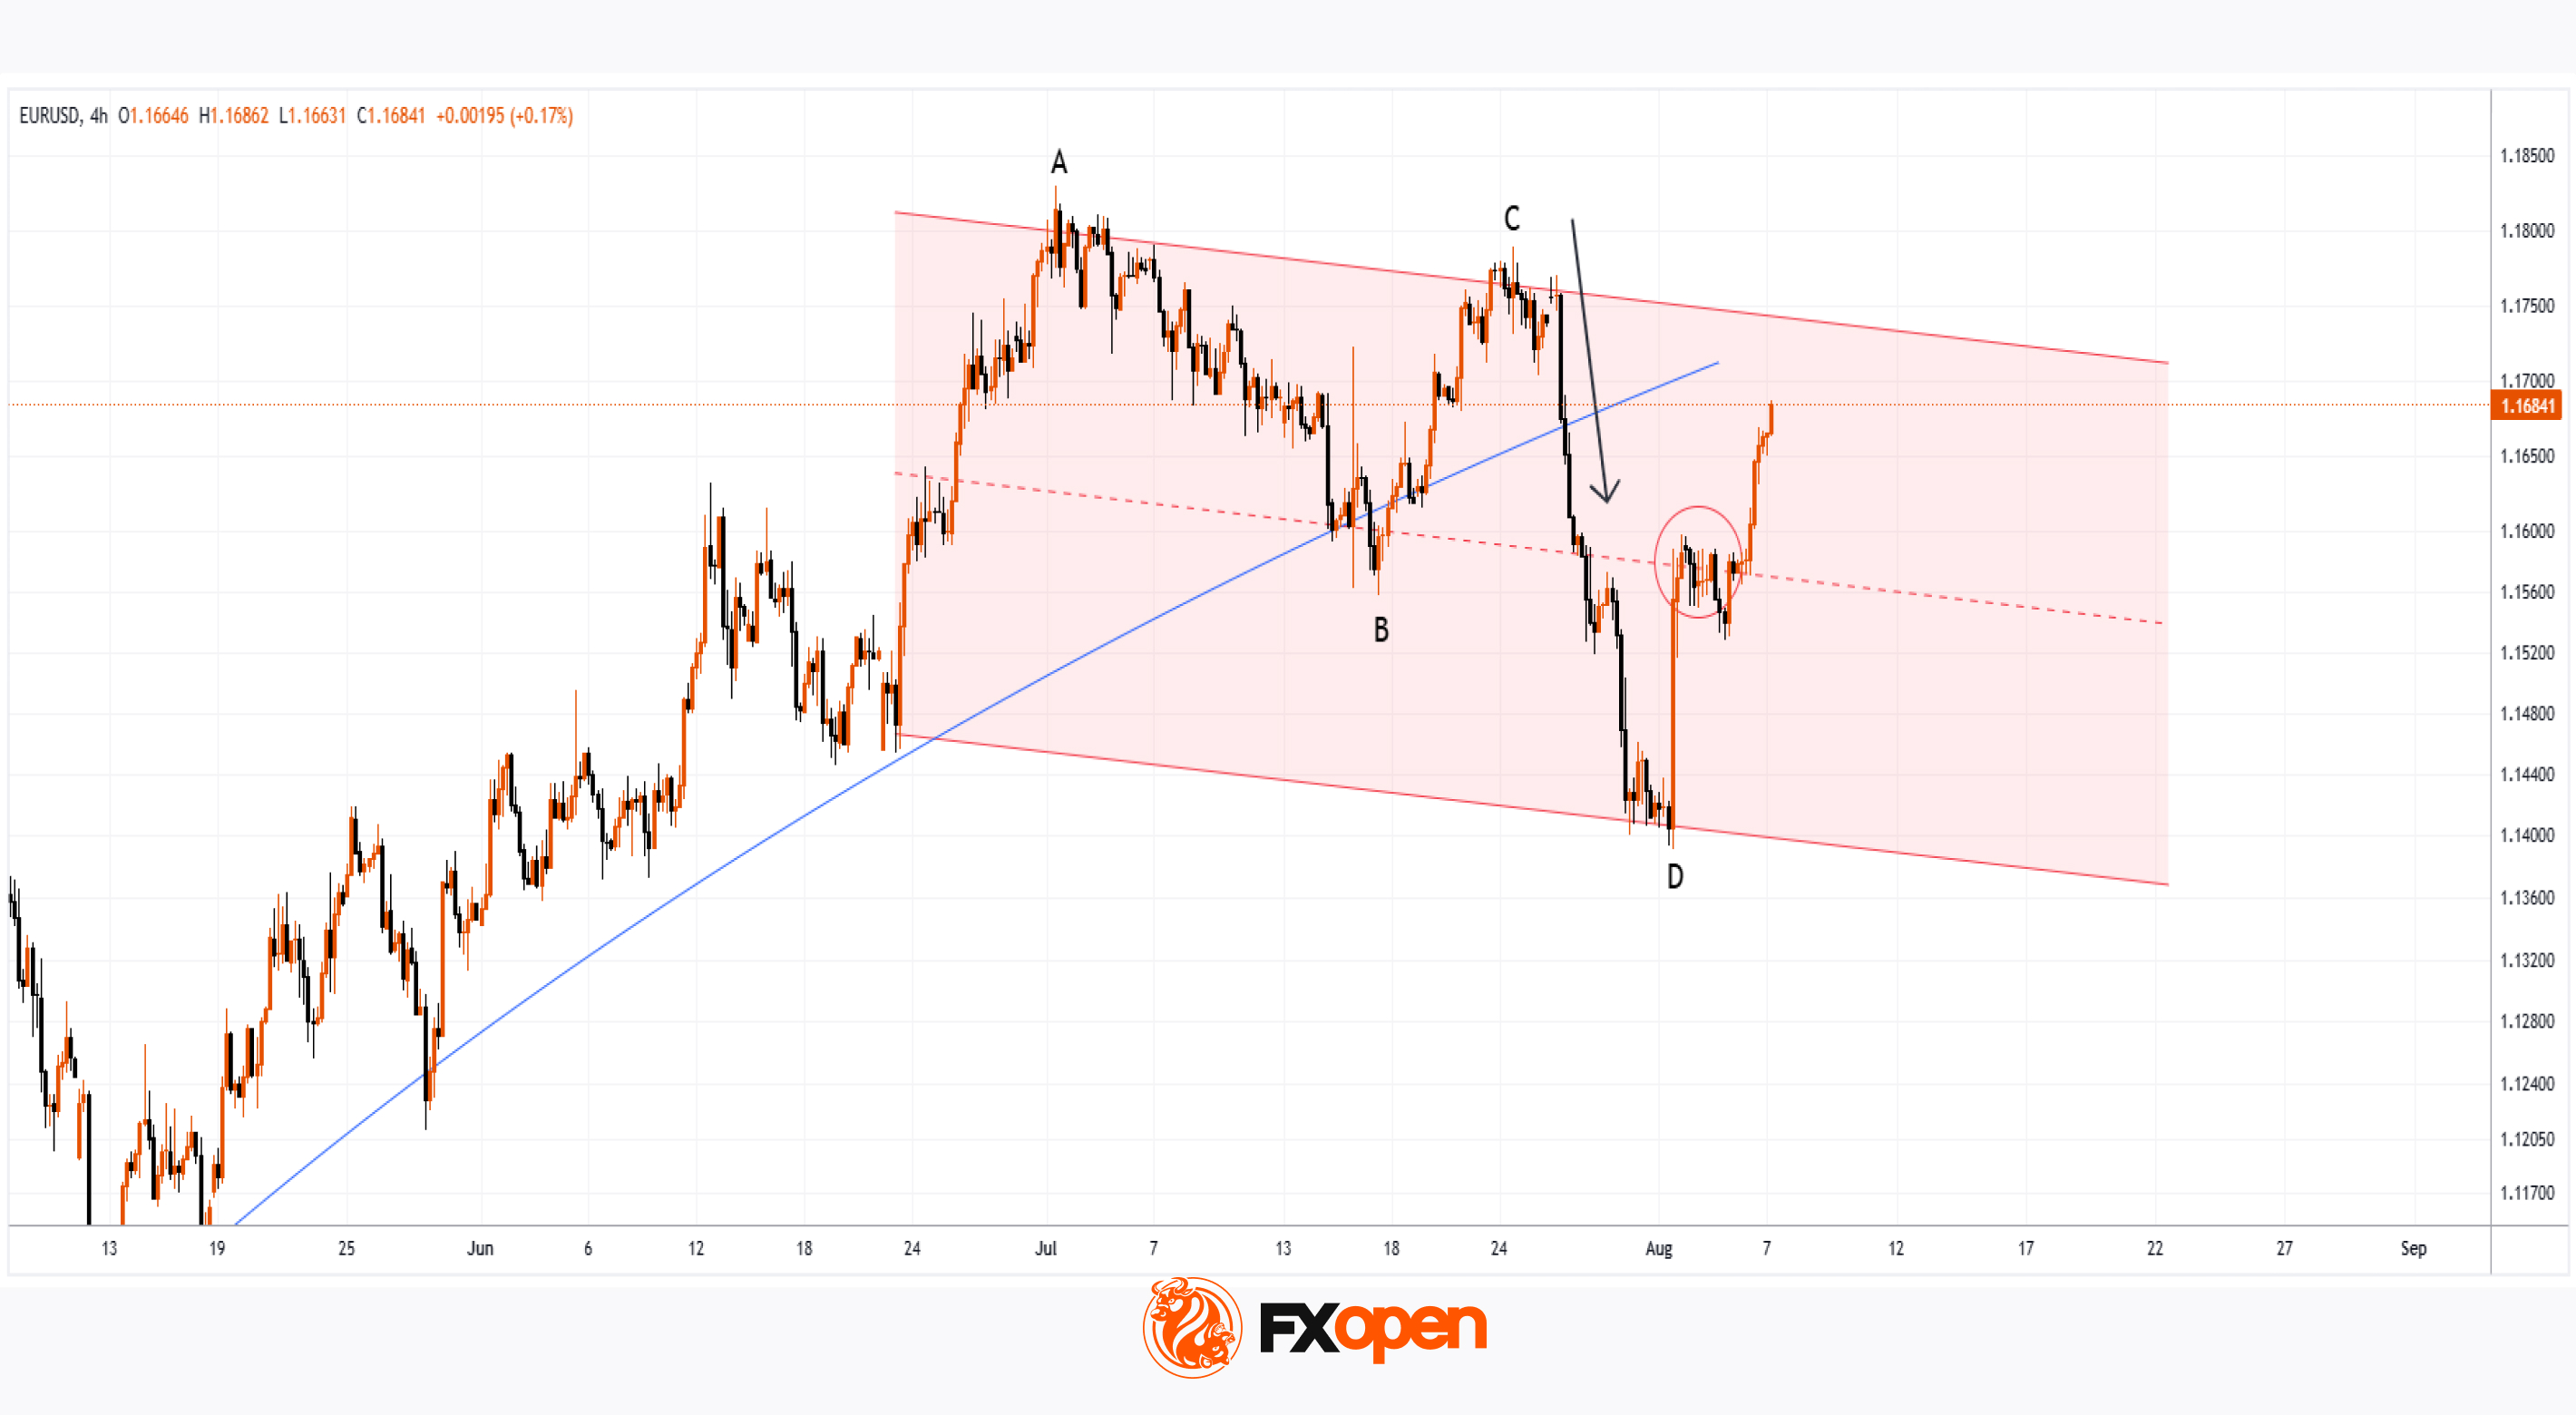
As the EUR/USD chart shows today, the euro has strengthened against the US dollar, climbing above the 1.1670 level, compared to the 1.1400 area at the beginning of the month.
Why Is EUR/USD Rising?
According to Reuters, the US dollar's weakness is being driven by:
→ Expectations of a Federal Reserve rate cut, which intensified following last week's disappointing US labour market data.
→ Anticipation of the upcoming US inflation report, scheduled for release on 12 August at 15:30 GMT+3.
On the other hand, the euro is being supported by growing optimism around a possible resolution of the military conflict in Ukraine, as well as the potential meeting between Donald Trump and Vladimir Putin.
Technical Analysis of the EUR/USD Chart
On 30 July, we noted that after hitting its July low, EUR/USD could stage a recovery — which indeed materialised. But does the chart now look bullish?
A definitive bullish outlook is hindered by the sequence of lower highs and lower lows (A-B-C-D), which continues to form a bearish market structure.
At the same time, the descending channel on the EUR/USD chart has become more pronounced. After a brief period of consolidation near the channel’s median line (marked with a circle), the price moved up towards the upper boundary of the channel. It is worth noting that a sharp decline occurred recently from these same levels (highlighted with an arrow), breaking through the blue support line.
Given these factors, it is reasonable to assume that bearish activity may intensify around current levels, potentially slowing further EUR/USD growth.
Trade over 50 forex markets 24 hours a day with FXOpen. Take advantage of low commissions, deep liquidity, and spreads from 0.0 pips. Open your FXOpen account now or learn more about trading forex with FXOpen.
CFDs are complex instruments and come with a high risk of losing your money.
This article represents the opinion of the Companies operating under the FXOpen brand only. It is not to be construed as an offer, solicitation, or recommendation with respect to products and services provided by the Companies operating under the FXOpen brand, nor is it to be considered financial advice.
👍2
#nikkei225 #stockmarket #stocktrading #marketanalysis #MarketNews
Nikkei 225 Index Rises Towards the 42,000 Level
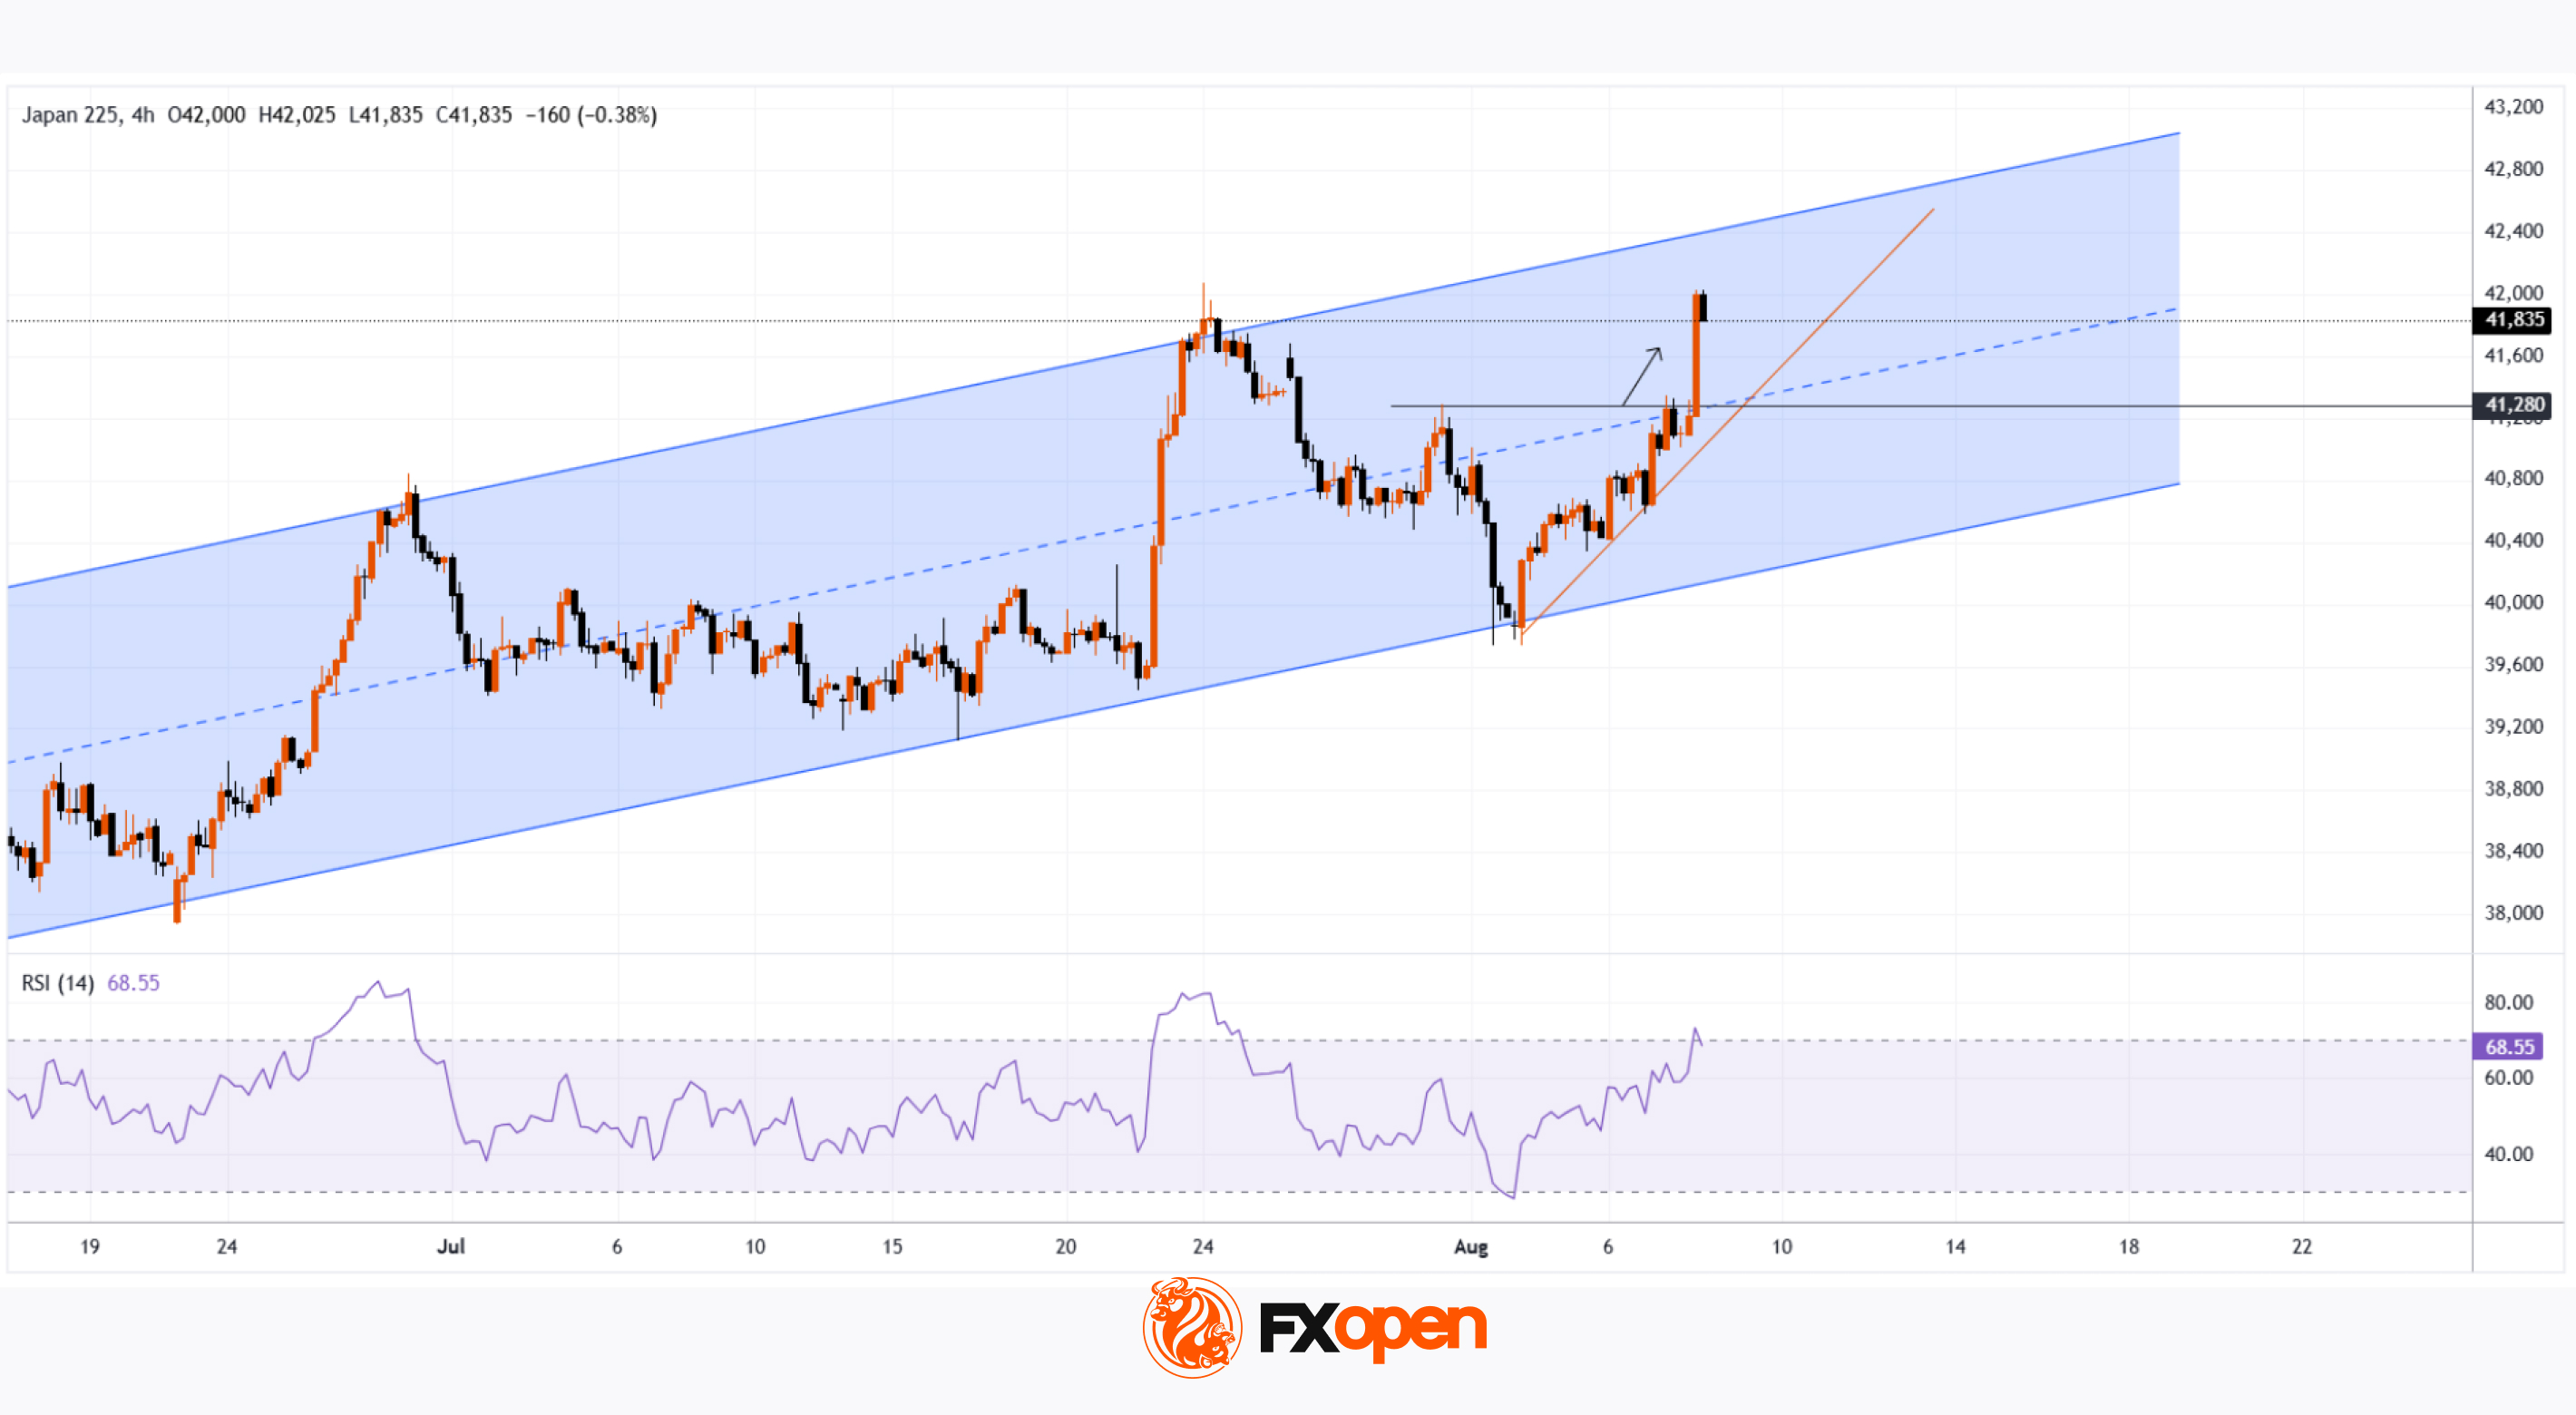
As the chart indicates, the Nikkei 225 stock index (Japan 225 on FXOpen) has today risen to the 42,000 mark, which is just below its all-time high.
Among the bullish drivers:
→ Corporate news. Strong quarterly results were reported by Sony Group and SoftBank.
→ Trade agreement developments. Positive news flow surrounds a potential tariff agreement between the United States and Japan, which could be finalised in the near term. According to Reuters, the Japanese government stated on Thursday that the US has pledged to adjust overlapping tariffs on Japanese goods to avoid double taxation.
Technical Analysis of the Nikkei 225 Chart
Previously, we highlighted the ascending channel that has shaped price action throughout 2025. This pattern remains valid, with the price now entering the upper half of the channel. The channel’s median line might act as a support level going forward.
The recent price behaviour attracts attention: a long bullish candle has formed on the chart – immediately following a breakout above the 41,280 resistance level (as indicated by the arrow). This signals a clear imbalance in favour of buyers.
From a bearish perspective:
→ The psychological resistance at 42,000 may hold – in late July, the price failed to stay above this level.
→ The RSI indicator has entered overbought territory.
→ Failure by the bulls to sustain a break above 42,000 could validate a potential Double Top bearish pattern.
From a bullish perspective:
→ The price might advance towards the upper boundary of the ascending channel.
→ The bullish candle displays characteristics of an FVG (Fair Value Gap) bullish pattern, which might serve as a future support level.
→ Further support could be provided by the orange trendline, as well as the former resistance at 41,280.
A bullish breakout attempt above 42,000 cannot be ruled out. However, will market optimism persist if the price approaches the upper limit of the channel?
Trade global index CFDs with zero commission and tight spreads. Open your FXOpen account now or learn more about trading index CFDs with FXOpen.
CFDs are complex instruments and come with a high risk of losing your money.
This article represents the opinion of the Companies operating under the FXOpen brand only. It is not to be construed as an offer, solicitation, or recommendation with respect to products and services provided by the Companies operating under the FXOpen brand, nor is it to be considered financial advice.
👍4
#AAPL #stocktrading #stockmarket #MarketNews #marketanalysis
Apple (AAPL) Shares Surge to Four-Month High
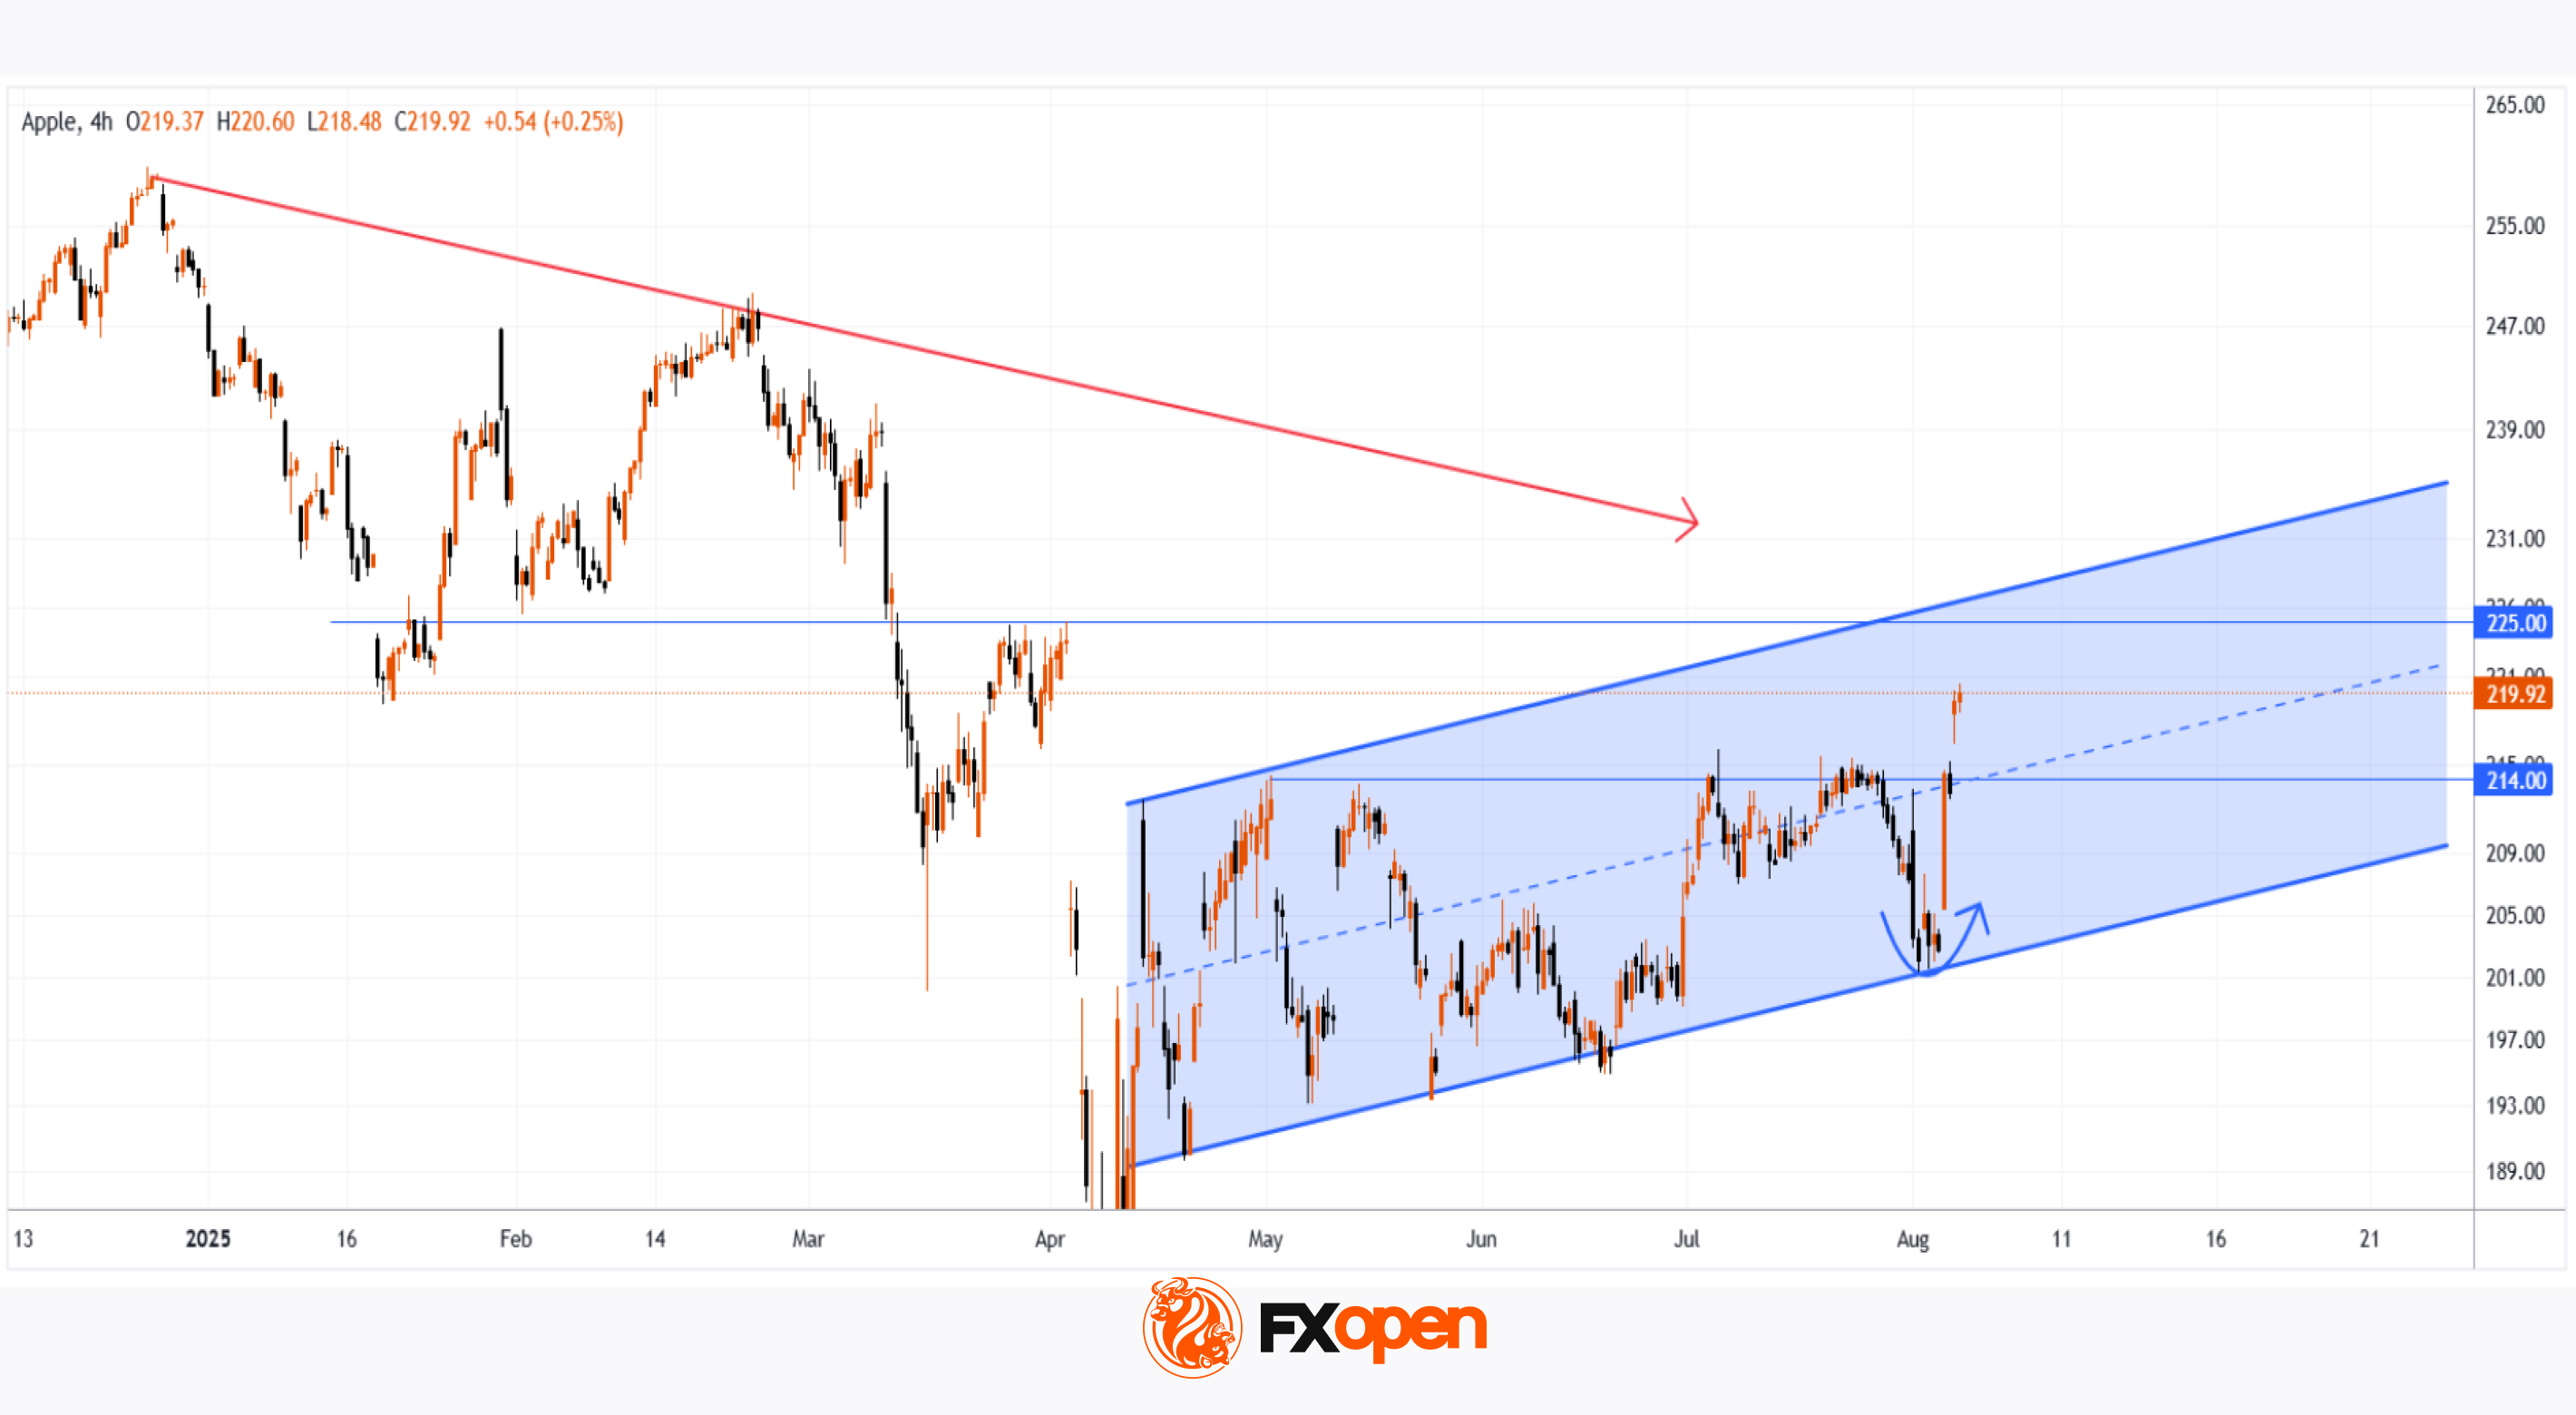
According to the AAPL price chart, the stock rose to the $220 level yesterday – marking its highest point since early April.
The rally was fuelled by several bullish factors:
→ Trade developments: President Trump announced an additional 25% tariff on goods from India, but notably excluded smartphones – a key point, as a significant portion of iPhones are manufactured there.
→ Seasonal momentum: Apple is approaching its historically strong period. A new iPhone model is traditionally unveiled in September, followed by the start of the holiday shopping season and strong retail demand.
Technical Analysis of Apple (AAPL) Shares
In our previous analysis, we identified an ascending channel (marked in blue) formed by price fluctuations following the April 2025 correction. A bullish reversal (highlighted with an arrow) has provided a basis to update the channel’s slope. In this configuration, the price is now in the upper half of the channel, moving towards its upper boundary.
From a price action standpoint, AAPL's rally is characterised by aggressive upward movement, accompanied by bullish gaps. This is a notable observation, suggesting that while sellers attempted to regain control during a consolidation phase in late July, they lacked conviction – with momentum now favouring the bulls.
This resembles a failed Rounding Top bearish pattern – bulls were able to push the price higher, signalling strong demand.
Potential resistance levels:
→ Near-term: The upper boundary of the channel, reinforced by the $225 level – a price point that has previously acted as a reversal zone.
→ Longer-term: A descending trendline (marked in red), drawn across key highs from recent months.
Bulls might find support at the channel median, which is further reinforced by the former resistance level of $214.
Having risen more than 8% since the start of the week, AAPL now appears overbought in the short term. However, given the strong fundamental backdrop, any potential pullbacks might prove to be shallow.
Trade global index CFDs with zero commission and tight spreads. Open your FXOpen account now or learn more about trading index CFDs with FXOpen.
CFDs are complex instruments and come with a high risk of losing your money.
This article represents the opinion of the Companies operating under the FXOpen brand only. It is not to be construed as an offer, solicitation, or recommendation with respect to products and services provided by the Companies operating under the FXOpen brand, nor is it to be considered financial advice.
👍2
#goldprice #XAUUSD #commodities #MarketNews #marketanalysis
Gold Price Declines Amid Easing Geopolitical Tensions
It has been announced that a meeting between the Presidents of the United States and Russia will take place this week. Donald Trump and Vladimir Putin are expected to meet in Alaska. This will mark the first face-to-face talks between the leaders of the two major powers since 2021, when Putin met with Biden in Geneva.
The upcoming meeting is widely seen as a potential step towards ending the full-scale military conflict in Ukraine, which began in 2022. Anticipation of the talks is easing geopolitical tensions, which is reflected in today’s downward movement of the gold price, visible on the XAU/USD chart.
XAU/USD Technical Analysis
Today, gold prices have fallen to the $3,360 area, with several bearish signals apparent on the chart:
→ The decline occurred on long bearish candles (as shown by the arrow). From a price action perspective, this suggests mounting selling pressure.
→ The MACD histogram has moved below zero, with the indicator lines pointing downward.
→ Gold has broken the upward trendline support from above (marked in blue). The breakout level, around $3,380, may now act as resistance, as sellers have asserted their dominance here.
→ From a broader perspective, the price appears to be reversing from the resistance line drawn through this summer’s highs.
Given these factors,we could assume that gold is heading towards the lower black trendline, which runs through the notable July lows and forms a channel with the upper line. However, along the way, sellers will need to overcome a key support zone in the form of a bullish Fair Value Gap (marked in purple). The upper boundary of this zone is reinforced by the 50% Fibonacci retracement level plotted from the bullish impulse points A→B.
Whether the bears can push the price through the FVG zone will largely depend on gold’s reaction to tomorrow’s US inflation data (CPI release scheduled for 15:30 GMT+3).
Start trading commodities with tight spreads. Open your trading account now or learn more about trading commodity CFDs with FXOpen.
CFDs are complex instruments and come with a high risk of losing your money.
This article represents the opinion of the Companies operating under the FXOpen brand only. It is not to be construed as an offer, solicitation, or recommendation with respect to products and services provided by the Companies operating under the FXOpen brand, nor is it to be considered financial advice.

👍2
#GlobalMarkets #InterestRates #Inflation #Forex #TradeWar #EarningsSeason #StockMarket #Investing #MarketNews
Market Insights with Gary Thomson: RBA Rate, US Inflation, UK Jobs & GDP, Earnings Reports
In this video, we’ll explore the key economic events, market trends, and corporate news shaping the financial landscape. Get ready for expert insights into forex, commodities, and stocks to help you navigate the week ahead. Let’s dive in!
In this episode of Market Insights, Gary Thomson unpacks the strategic implications of the week’s most critical events driving global markets.
👉 Key topics covered in this episode:
🔸RBA Interest Rate Decision
With the Reserve Bank of Australia expected to lower its cash rate by 25 basis points to 3.60% on 12 August, markets are bracing for a clear move toward monetary easing amid soft economic data. But with past surprises in mind, could the RBA still defy expectations?
🔸US Inflation Rate
The upcoming U.S. CPI report on 12 August could play a key role in shaping the Fed’s next move. With inflation creeping higher in June, will fresh data support the expected rate cut in September — or challenge it?
🔸UK Unemployment Rate
The UK jobs report on 12 August could sway GBP markets. With unemployment already at a multi-year high, will another uptick fuel expectations of a dovish Bank of England — and add pressure to the pound?
🔸UK GDP Growth Rate
UK GDP data due on 14 August may set the tone for the pound. After recent contractions, will signs of a rebound boost GBP?
🔸Trade Tensions
With the US–China tariff truce deadline looming and a potential 100% tariff on global semiconductors, markets are bracing for impact. Will negotiations ease the pressure — or trigger new waves of volatility?
🔸Earnings Reports
As the August 11–15 earnings calendar heats up, key reports from mining, software, and industrial giants are on deck. Most have beaten expectations so far — but will this trend hold, or are surprises ahead?
Gain insights to strengthen your trading knowledge.
💬 Don’t forget to like, comment, and subscribe for more professional market insights every week.
https://cutt.ly/2rF9ZJNL
To take advantage of price fluctuations in the foreign exchange markets, consider enlisting the services of a reliable broker like FXOpen.
⚠️
This forecast represents FXOpen Companies opinion only, it should not be construed as an offer, invitation or recommendation in respect to FXOpen Companies products and services or as financial advice.
YouTube
Market Insights with Gary Thomson: RBA Rate, US Inflation, UK Jobs & GDP, Earnings Reports
In this video, we’ll explore the key economic events, market trends, and corporate news shaping the financial landscape. Get ready for expert insights into forex, commodities, and stocks to help you navigate the week ahead. Let’s dive in!
In this episode…
In this episode…
👍2
#stockmarket #tsla #stocks #MarketNews #marketanalysis
Tesla (TSLA) Shares Break Above July High
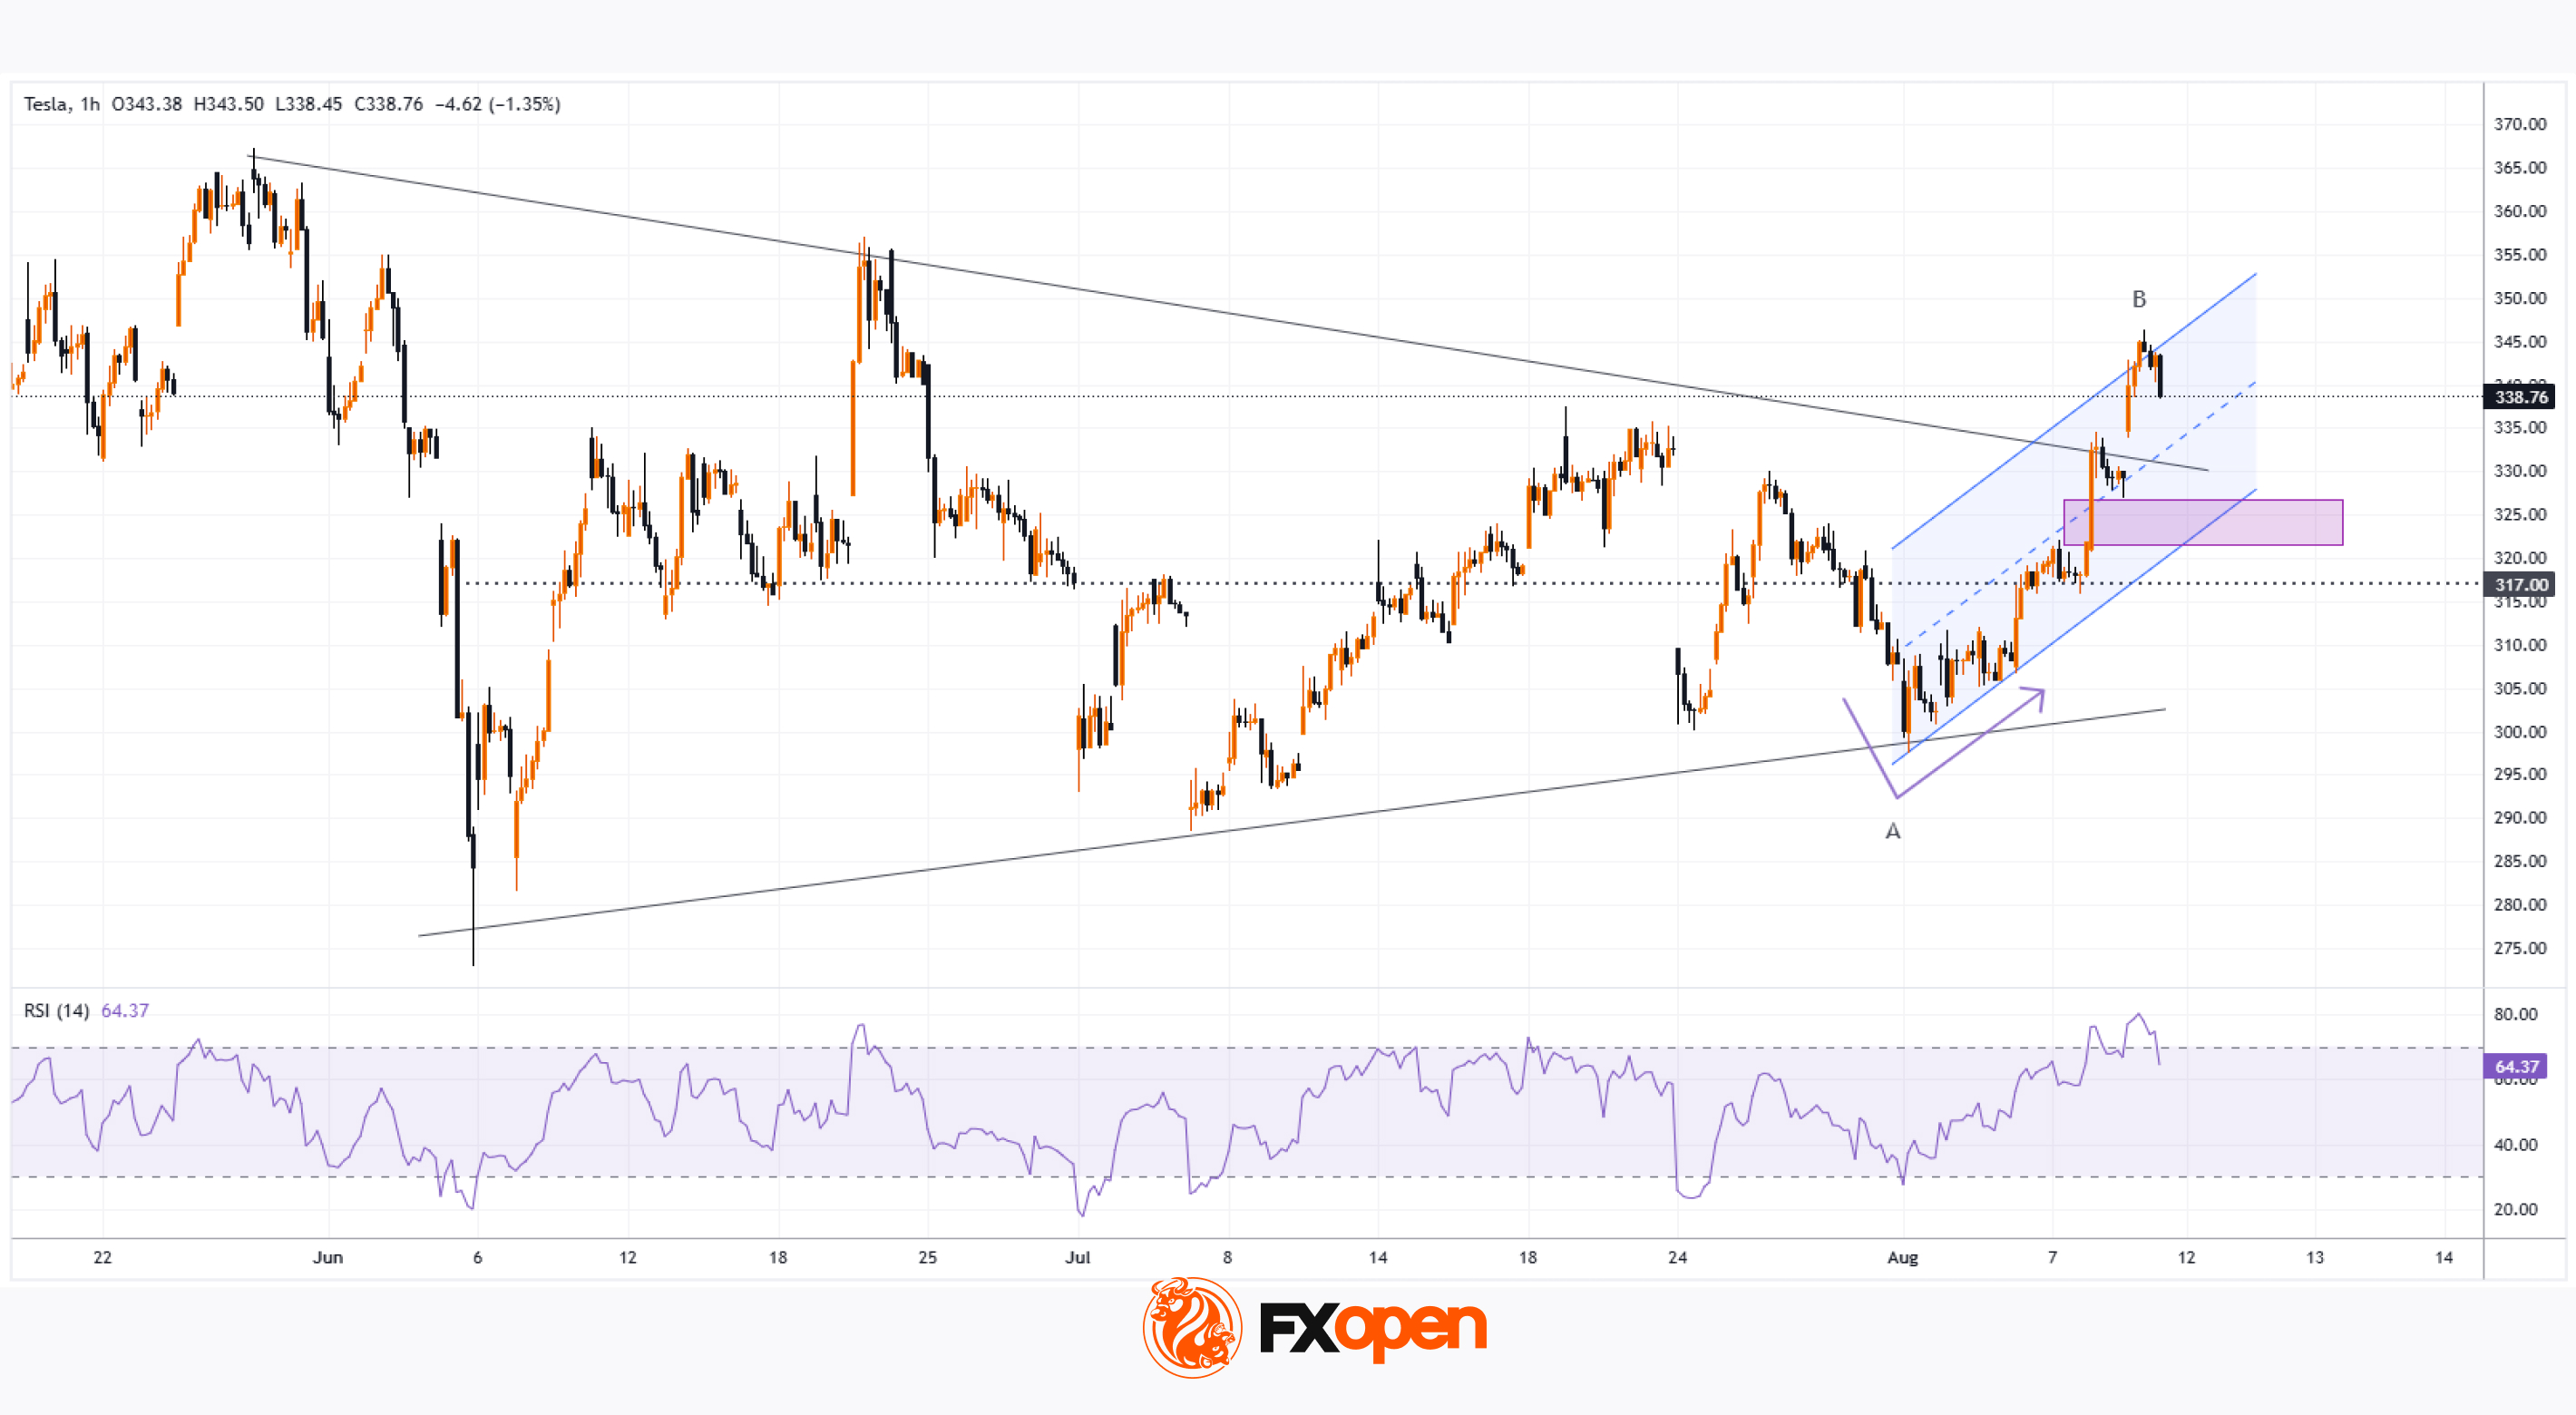
As the chart indicates, Tesla (TSLA) stock is demonstrating a pronounced upward trend. Specifically, its price:
→ has risen for four consecutive days;
→ has moved above its July high;
→ has gained over 10% since the start of August.
Why Is TSLA Rising?
Among other factors, TSLA’s share price is being driven by:
→ News that Tesla has extended the estimated delivery time for the Model Y from one–three weeks to four–six weeks (according to Barron’s). This may signal an increase in orders, boosting market optimism after the first two quarters showed a notable decline in electric vehicle sales.
→ Statements from Elon Musk regarding the development of the robotaxi project. According to him, Tesla’s robotaxi service will be publicly available next month. Musk also noted that Tesla has achieved several additional breakthroughs in artificial intelligence that will make car control remarkably similar to that of a human driver.
Can TSLA continue to rise?
Technical Analysis of TSLA Stock
When analysing the TSLA chart on 24 July, we identified a broadening triangle pattern with its axis around $317. Since then:
→ the price tested the lower boundary of the triangle and reversed upwards (as indicated by the arrow);
→ importantly, it broke through the upper boundary. This was made possible by the improvement in the fundamental backdrop (as reflected in the news), leading to a shift in market sentiment in favour of buyers.
Yesterday, the NASDAQ recorded the highest trading volume in August, with the daily candle closing below its midpoint – a sign of increased seller activity, further confirmed by the most recent long bearish candle on the hourly chart.
Given the above (as well as the RSI indicator approaching overbought levels), we could assume that TSLA’s share price could see a short-term correction following its rally in early August. Should the market follow this scenario, the price could pull back to the area highlighted in purple, which represents a significant support level, as it lies close to:
→ the upper boundary of the triangle (former resistance);
→ the lower boundary of the ascending channel (shown in blue);
→ the 50% retracement level of the A→B impulse;
→ price zones of strong upward movement (a bullish imbalance zone, as described by the Fair Value Gap pattern of the Smart Money Concept methodology).
Trade global index CFDs with zero commission and tight spreads. Open your FXOpen account now or learn more about trading index CFDs with FXOpen.
CFDs are complex instruments and come with a high risk of losing your money.
This article represents the opinion of the Companies operating under the FXOpen brand only. It is not to be construed as an offer, solicitation, or recommendation with respect to products and services provided by the Companies operating under the FXOpen brand, nor is it to be considered financial advice.
👍2
#nikkei225 #stockmarket #stocks #marketanalysis #MarketNews
Nikkei 225 Index Sets All-Time Record
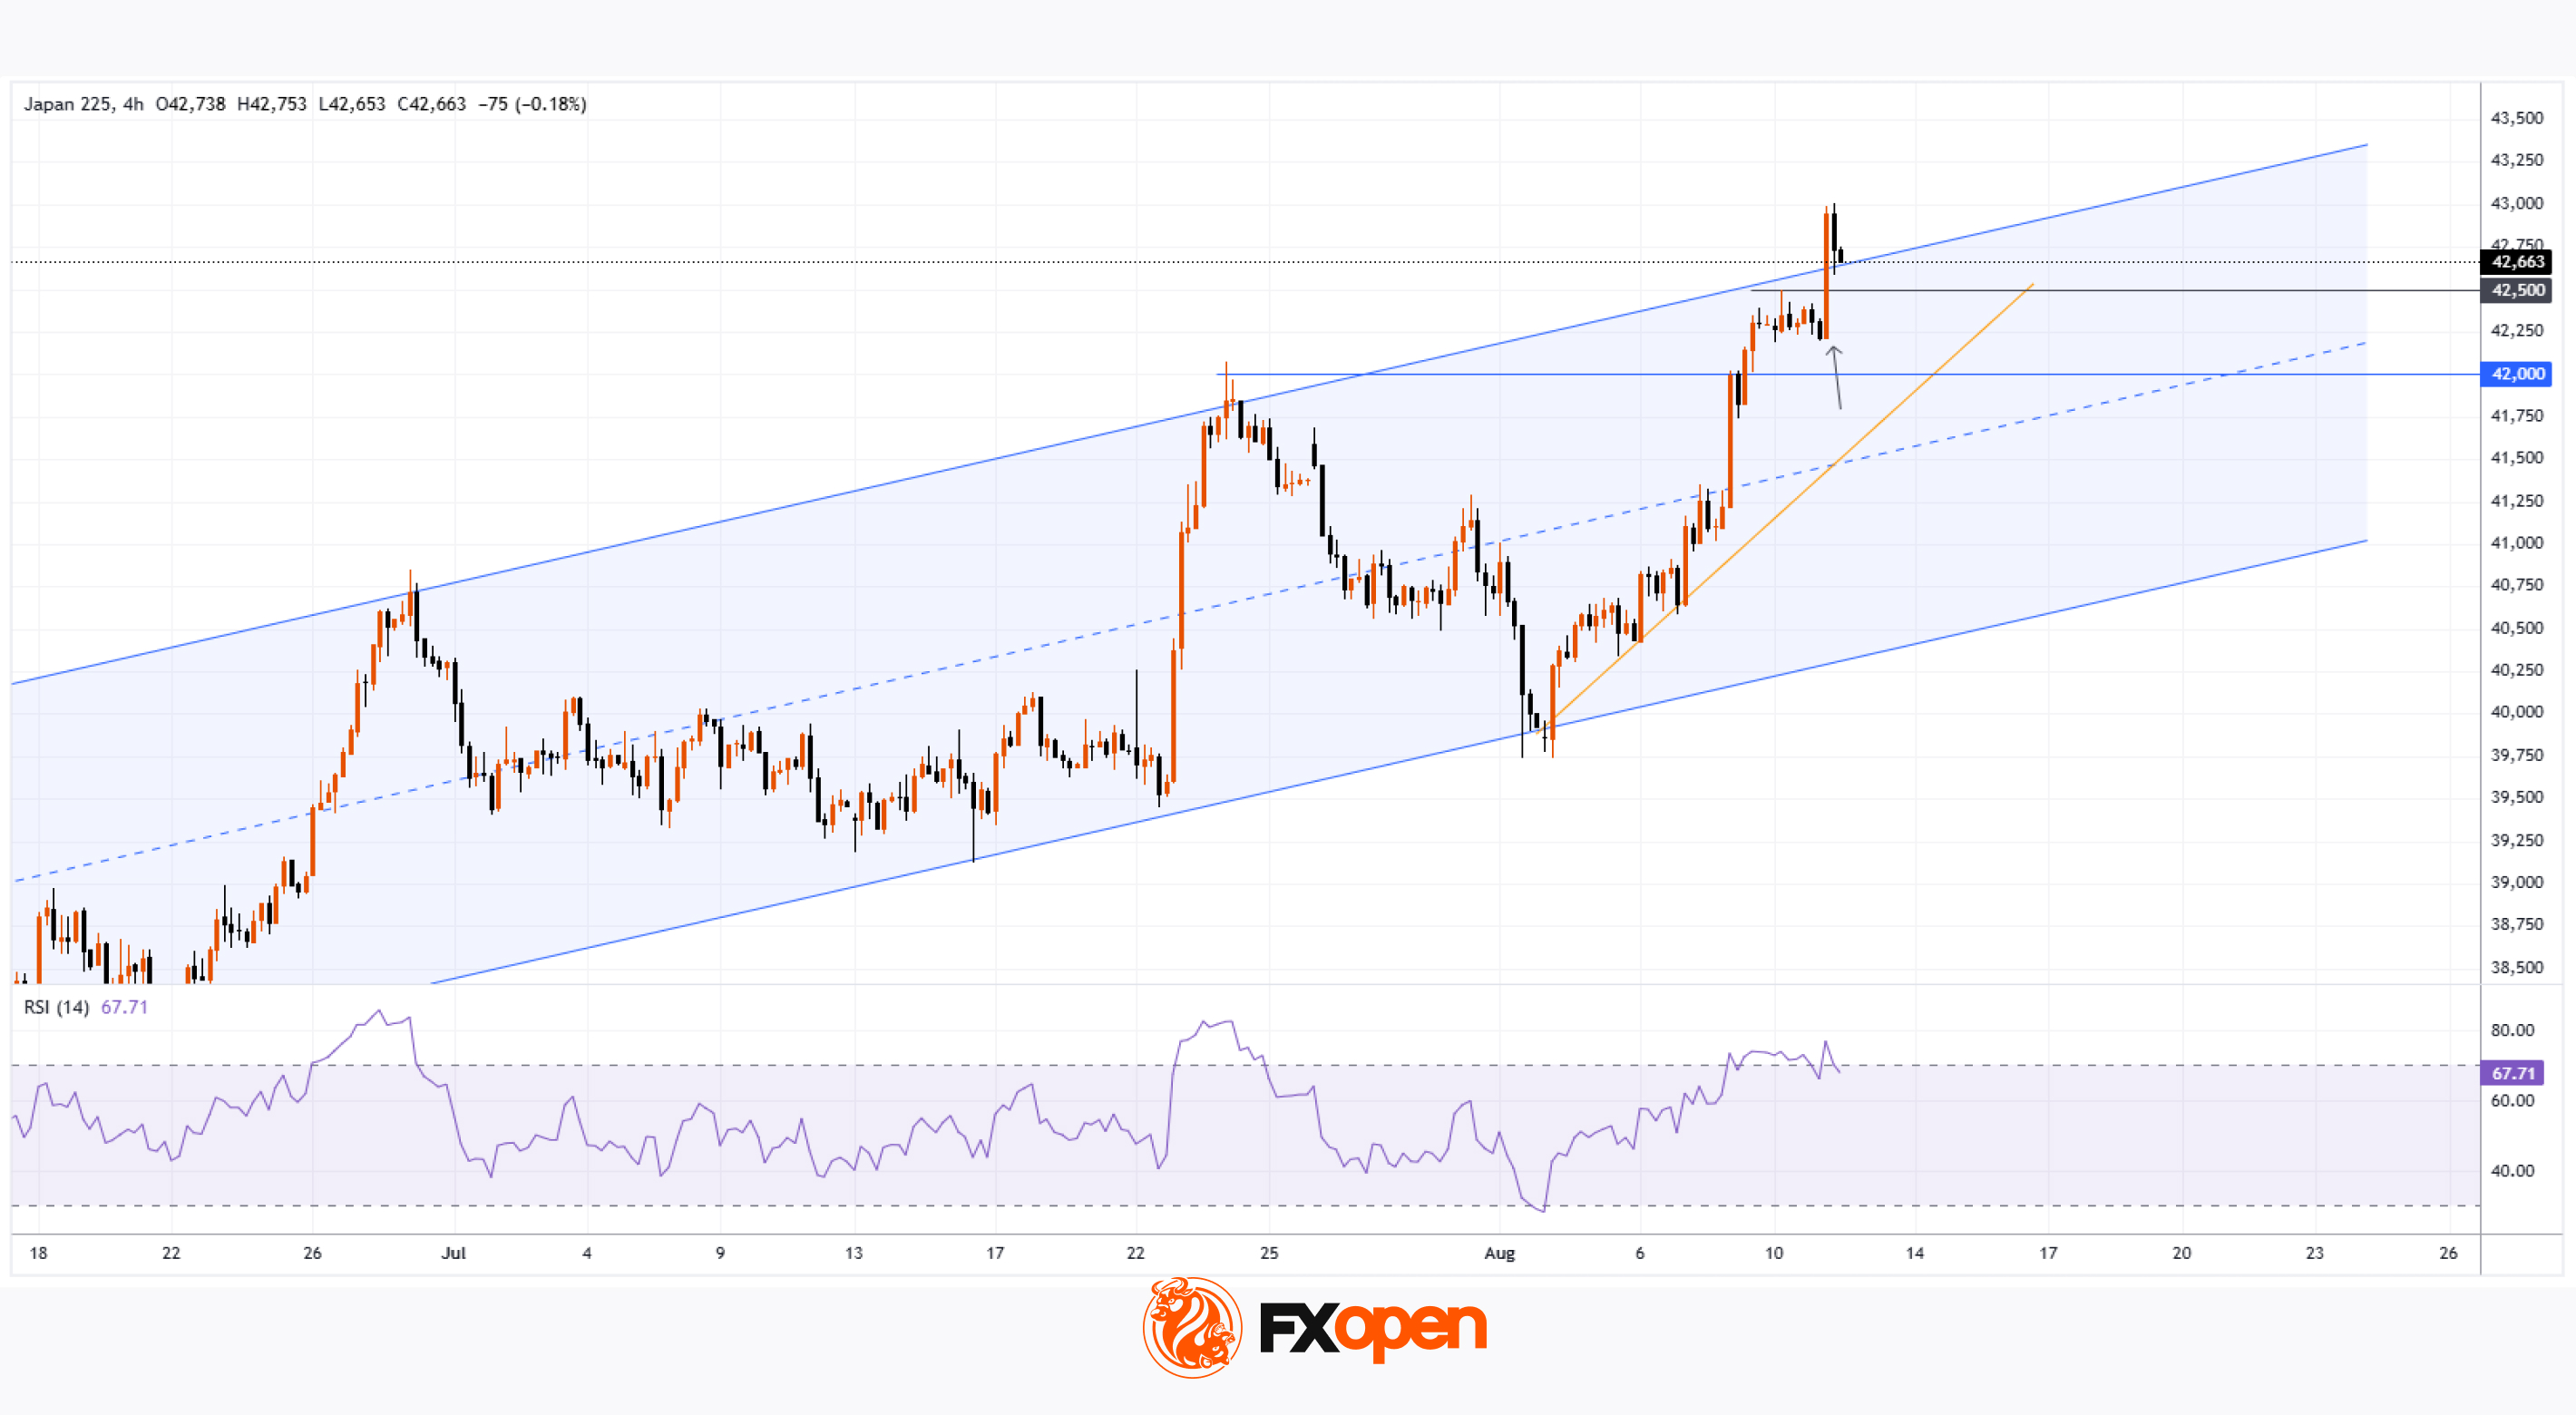
As the chart shows, the Nikkei 225 stock index (Japan 225 on FXOpen) rose today to the 43,000-point level, thereby:
→ surpassing its 2024 peak;
→ setting a new all-time high.
Bullish sentiment has been driven by strong quarterly earnings reports from Japanese companies and expectations regarding the Bank of Japan’s monetary policy. Optimism was further reinforced by news of extended trade negotiations between the United States and China. According to Reuters, the decision to prolong the tariff truce between the world’s two largest economies by a further 90 days has improved the outlook for global trade.
Technical Analysis of the Nikkei 225 Chart
Earlier this month, we:
→ identified an ascending channel formed by price fluctuations in 2025;
→ suggested that bullish momentum would likely be sufficient to attempt a breakout above the 42k level;
→ noted that optimism might wane if the price approached the channel’s upper boundary.
Since then:
→ the channel has remained valid, as has the intermediate trendline (marked in orange) of the uptrend;
→ following a brief consolidation, the price broke above the 42,500 level on a long bullish candle.
However, the subsequent bearish candles appear to signal the start of a short-term correction, which is reasonable given the RSI indicator’s overbought reading. In this scenario, the correction could extend, for example, to the 42,000 level – a psychological mark where the 2025 high had previously been located.
In the longer term, a bearish scenario cannot be ruled out. Note the candle marked with an arrow: although it appears strongly bullish at first glance, the sharp surge could be linked to a buying climax and the beginning of a distribution phase (as per Richard Wyckoff’s theory).
Given that the index is at record highs, major market participants may use the positive news flow to lock in profits and sell assets at elevated prices. Confidence in this hypothesis would be reinforced if today’s sharp rise is soon reversed, signalling the bulls’ failure to maintain control at these record levels.
Trade global index CFDs with zero commission and tight spreads. Open your FXOpen account now or learn more about trading index CFDs with FXOpen.
CFDs are complex instruments and come with a high risk of losing your money.
This article represents the opinion of the Companies operating under the FXOpen brand only. It is not to be construed as an offer, solicitation, or recommendation with respect to products and services provided by the Companies operating under the FXOpen brand, nor is it to be considered financial advice.
👍2
#sp500 #stockmarket #stocktrading #marketanalysis #MarketNews
S&P 500 Index Reaches New All-Time High
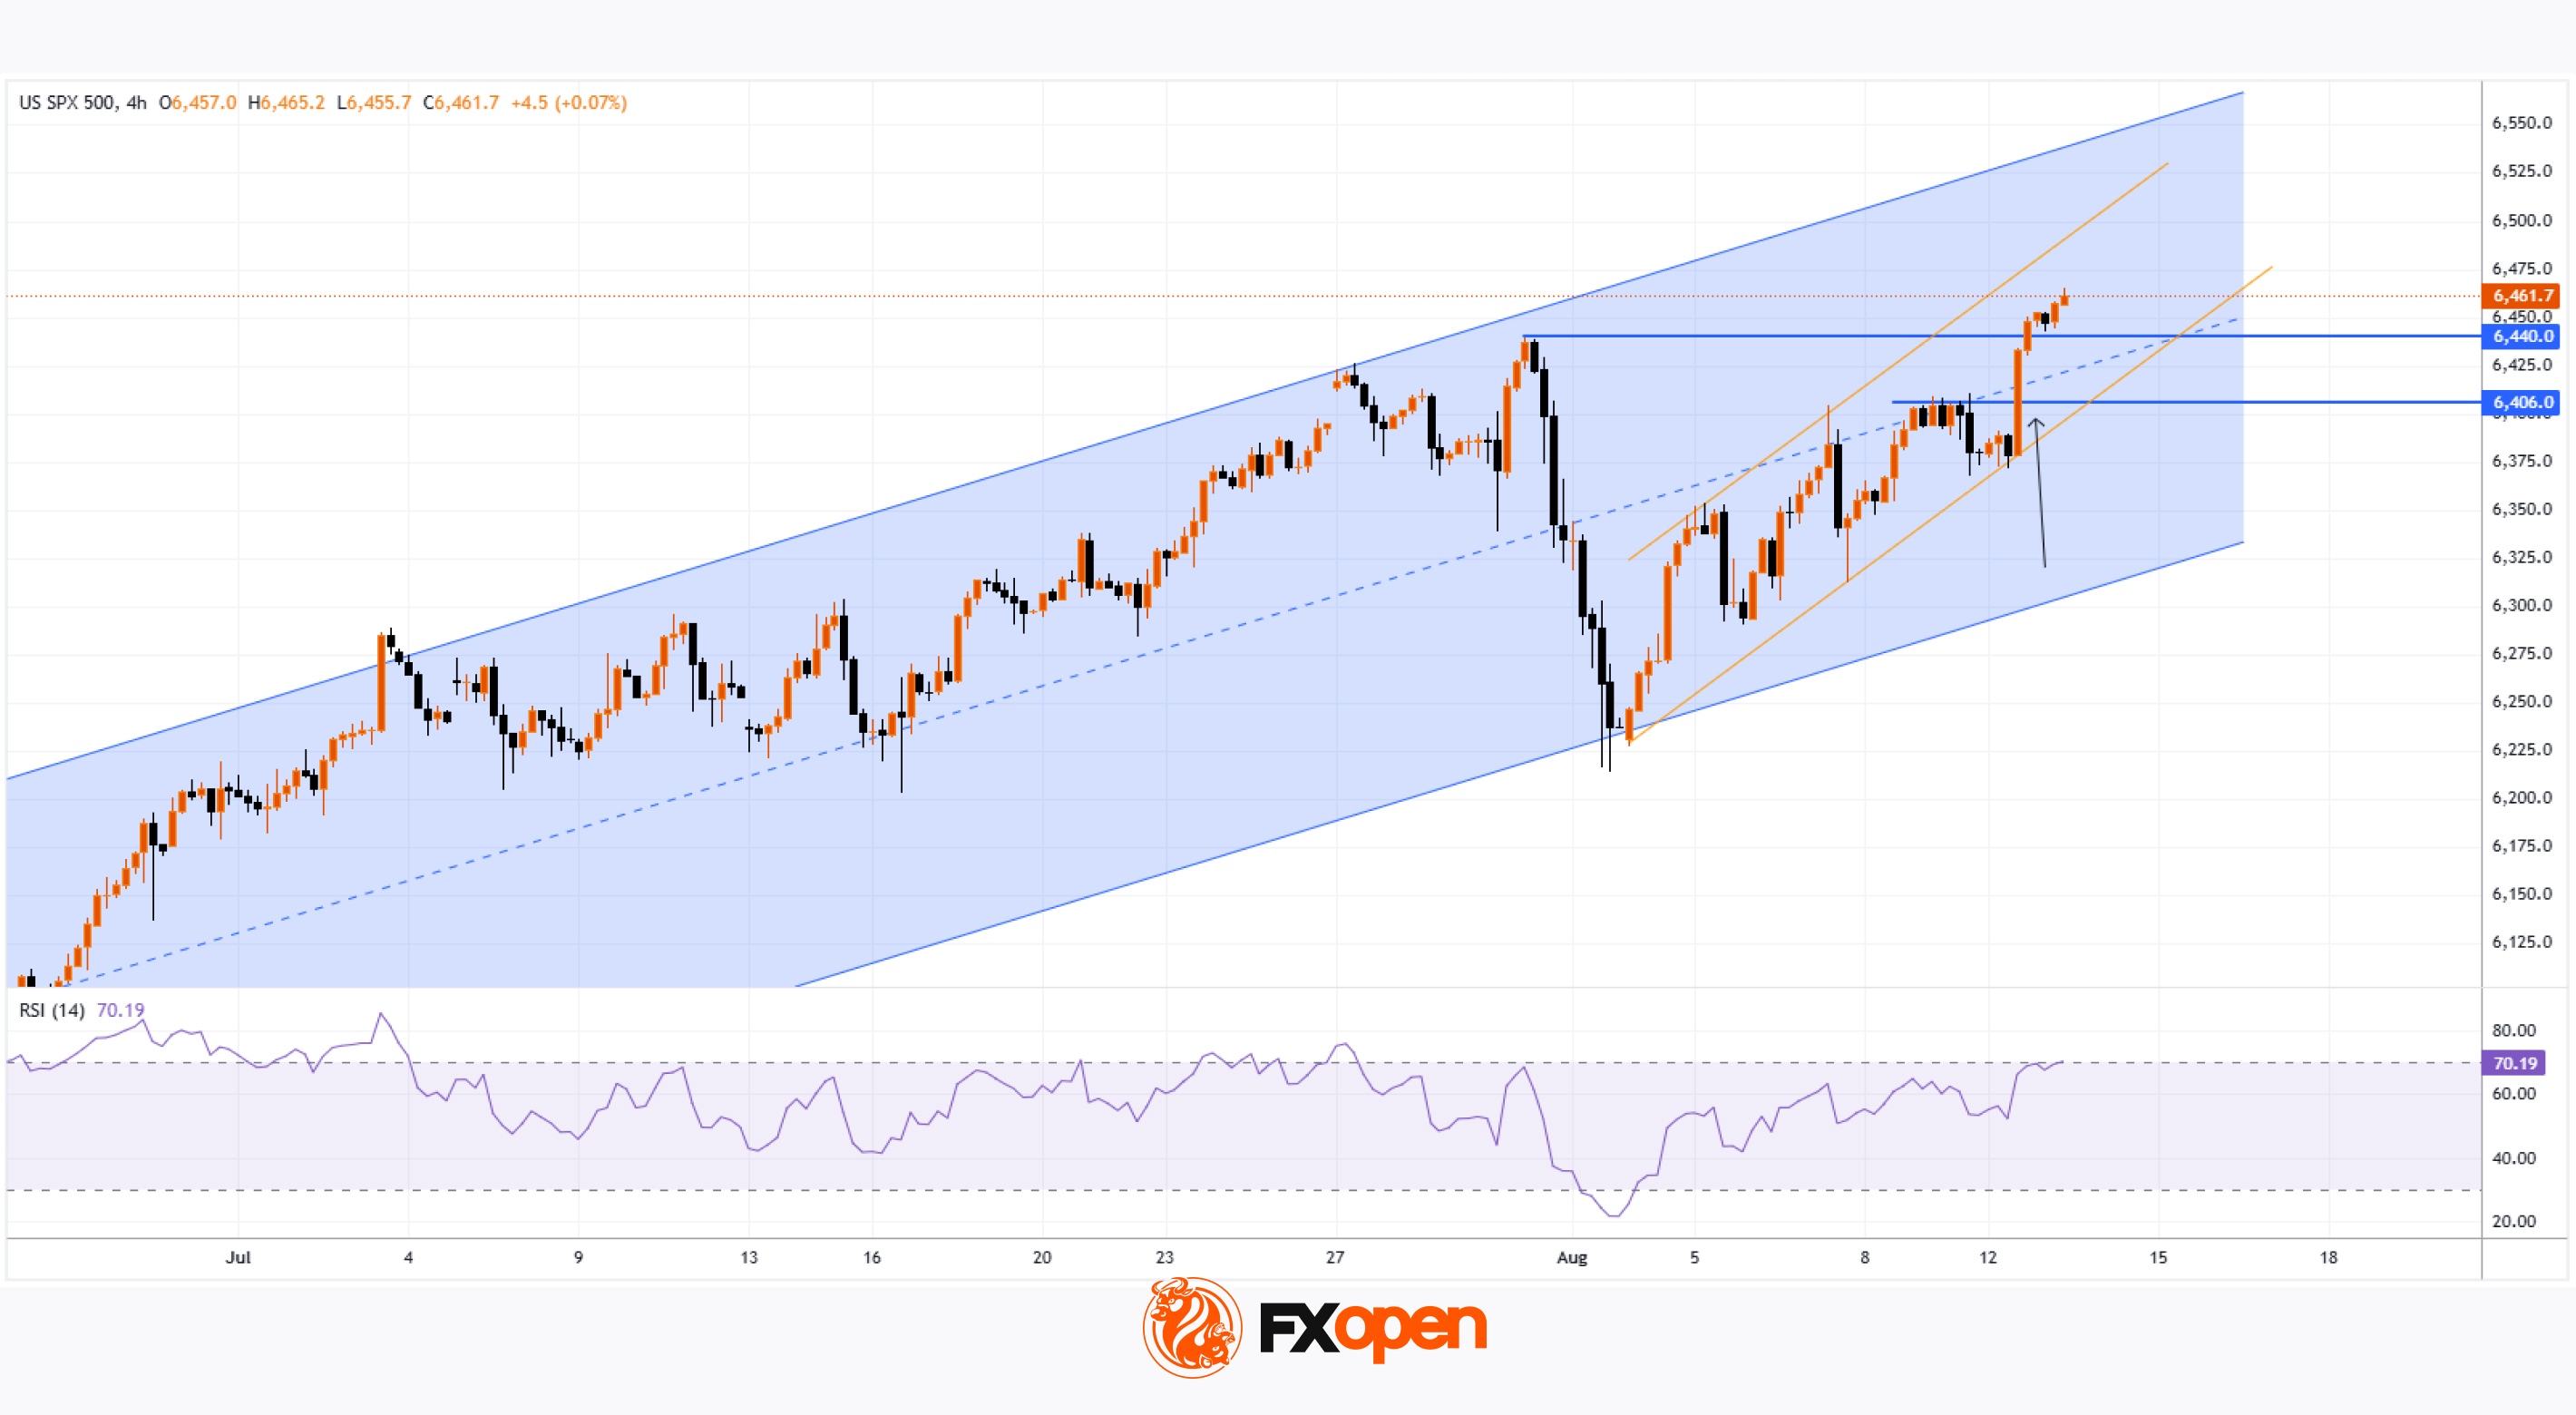
The S&P 500 index (US SPX 500 mini on FXOpen) set a new all-time high, climbing above the 6,460 mark. The rally in equities is a direct result of yesterday’s CPI report.
According to Forex Factory, the annual CPI remained at 2.7%, whereas analysts had forecast an increase to 2.8%. Moderate inflation readings provide stronger grounds for a Federal Reserve interest rate cut — a move President Trump has been strongly advocating.
Data from the CME FedWatch tool shows that traders now price in a 94% probability of a key rate cut in September, compared to nearly 86% the day before and around 57% a month ago. This prospect of monetary policy easing acts as a bullish driver for the stock market.
Technical Analysis of the S&P 500 Chart
On the H4 chart of the S&P 500 (US SPX 500 mini on FXOpen), there are grounds to outline an ascending channel (shown in blue). The price is currently in the upper half of the channel — a sign of prevailing optimism in the market.
Following yesterday’s CPI release, the price generated a strong bullish impulse, breaking two resistance levels from below (as indicated by the arrow):
→ August high at 6,406
→ Previous all-time high around 6,440
As a result, these former resistance levels now form the 6,406–6,440 zone. We can assume that:
→ this area may act as support going forward, as buyers clearly held the advantage here;
→ the median line of the ascending channel may also provide support, having shown signs of resistance in early August before being decisively broken on yesterday’s strong impulse.
The RSI indicator is hovering near overbought territory, making the market vulnerable to corrections. However, given the improved fundamental backdrop, any pullbacks might be shallow.
In the short term, the S&P 500 (US SPX 500 mini on FXOpen) may reach the upper orange line, which defines the growth trajectory from the lower to the upper boundary of the long-term ascending channel. Should the fundamental outlook be further reinforced by positive news — for example, relating to a US–Russia leaders’ meeting — the index could advance towards the upper boundary of the blue channel.
Trade global index CFDs with zero commission and tight spreads. Open your FXOpen account now or learn more about trading index CFDs with FXOpen.
CFDs are complex instruments and come with a high risk of losing your money.
This article represents the opinion of the Companies operating under the FXOpen brand only. It is not to be construed as an offer, solicitation, or recommendation with respect to products and services provided by the Companies operating under the FXOpen brand, nor is it to be considered financial advice.
👍1
#nvidia #NVDA #stocktrading #marketanalysis #MarketNews
Nvidia (NVDA) Share Price Growth Slows
Equity markets are on the rise:
→ The S&P 500 index (US SPX 500 mini on FXOpen) has reached a new all-time high;
→ The Nikkei 225 (Japan 225 on FXOpen) hit a fresh record high yesterday;
→ Gains are also seen across other assets — for example, Ethereum has climbed to its highest level since November 2021.
The CNN Fear & Greed Index indicates market “greed”, but it is worth noting that one of the market leaders, Nvidia (NVDA), is not matching the broader bullish momentum.
Technical Analysis of Nvidia (NVDA)
Although NVDA’s share price remains within a long-term ascending channel (shown in blue), holders have valid reasons for concern.
The NVDA chart shows that price growth is capped by the $183 resistance level, with a series of bearish signals emerging (as indicated by the arrows):
→ Following a bullish gap in late July, the price failed to sustain its highs and quickly retreated, erasing the upbeat sentiment;
→ A bearish engulfing pattern on 7 August suggests that the median line of the ascending channel is acting as resistance;
→ The RSI indicator peaked on 29 July, but subsequent price increases have not been accompanied by higher RSI highs — a sign of bearish divergence.
As a result, NVDA price is consolidating within a narrowing triangle:
→ On the one hand, higher lows indicate that buyers are still supporting the price;
→ On the other hand, the $183 level continues to cap the advance of this market leader despite the broader bullish environment.
Bulls need to show determination soon to break through the key $183 resistance; otherwise, the ascending channel in place since early July risks being breached. In that scenario, the August low near $172 could be retested.
Trade global index CFDs with zero commission and tight spreads. Open your FXOpen account now or learn more about trading index CFDs with FXOpen.
CFDs are complex instruments and come with a high risk of losing your money.
This article represents the opinion of the Companies operating under the FXOpen brand only. It is not to be construed as an offer, solicitation, or recommendation with respect to products and services provided by the Companies operating under the FXOpen brand, nor is it to be considered financial advice.

👍2
#AUDUSD #forextrading #tradingtips #marketanalysis #MarketNews
Australian Dollar Retreats from August Highs
This week, forex traders’ attention is firmly on the AUD/USD market following key news releases from Australia:
→ Tuesday: Interest rate decision. According to ForexFactory, analysts’ forecasts were confirmed as the Reserve Bank of Australia (RBA) cut the cash rate from 3.85% to 3.60%.
→ Today: Labour market statistics revealed that the unemployment rate fell from 4.3% to 4.2%.
This dynamic fundamental backdrop has driven a rich technical setup on the AUD/USD chart, where bearish sentiment currently prevails.
Technical Analysis of the AUD/USD Chart
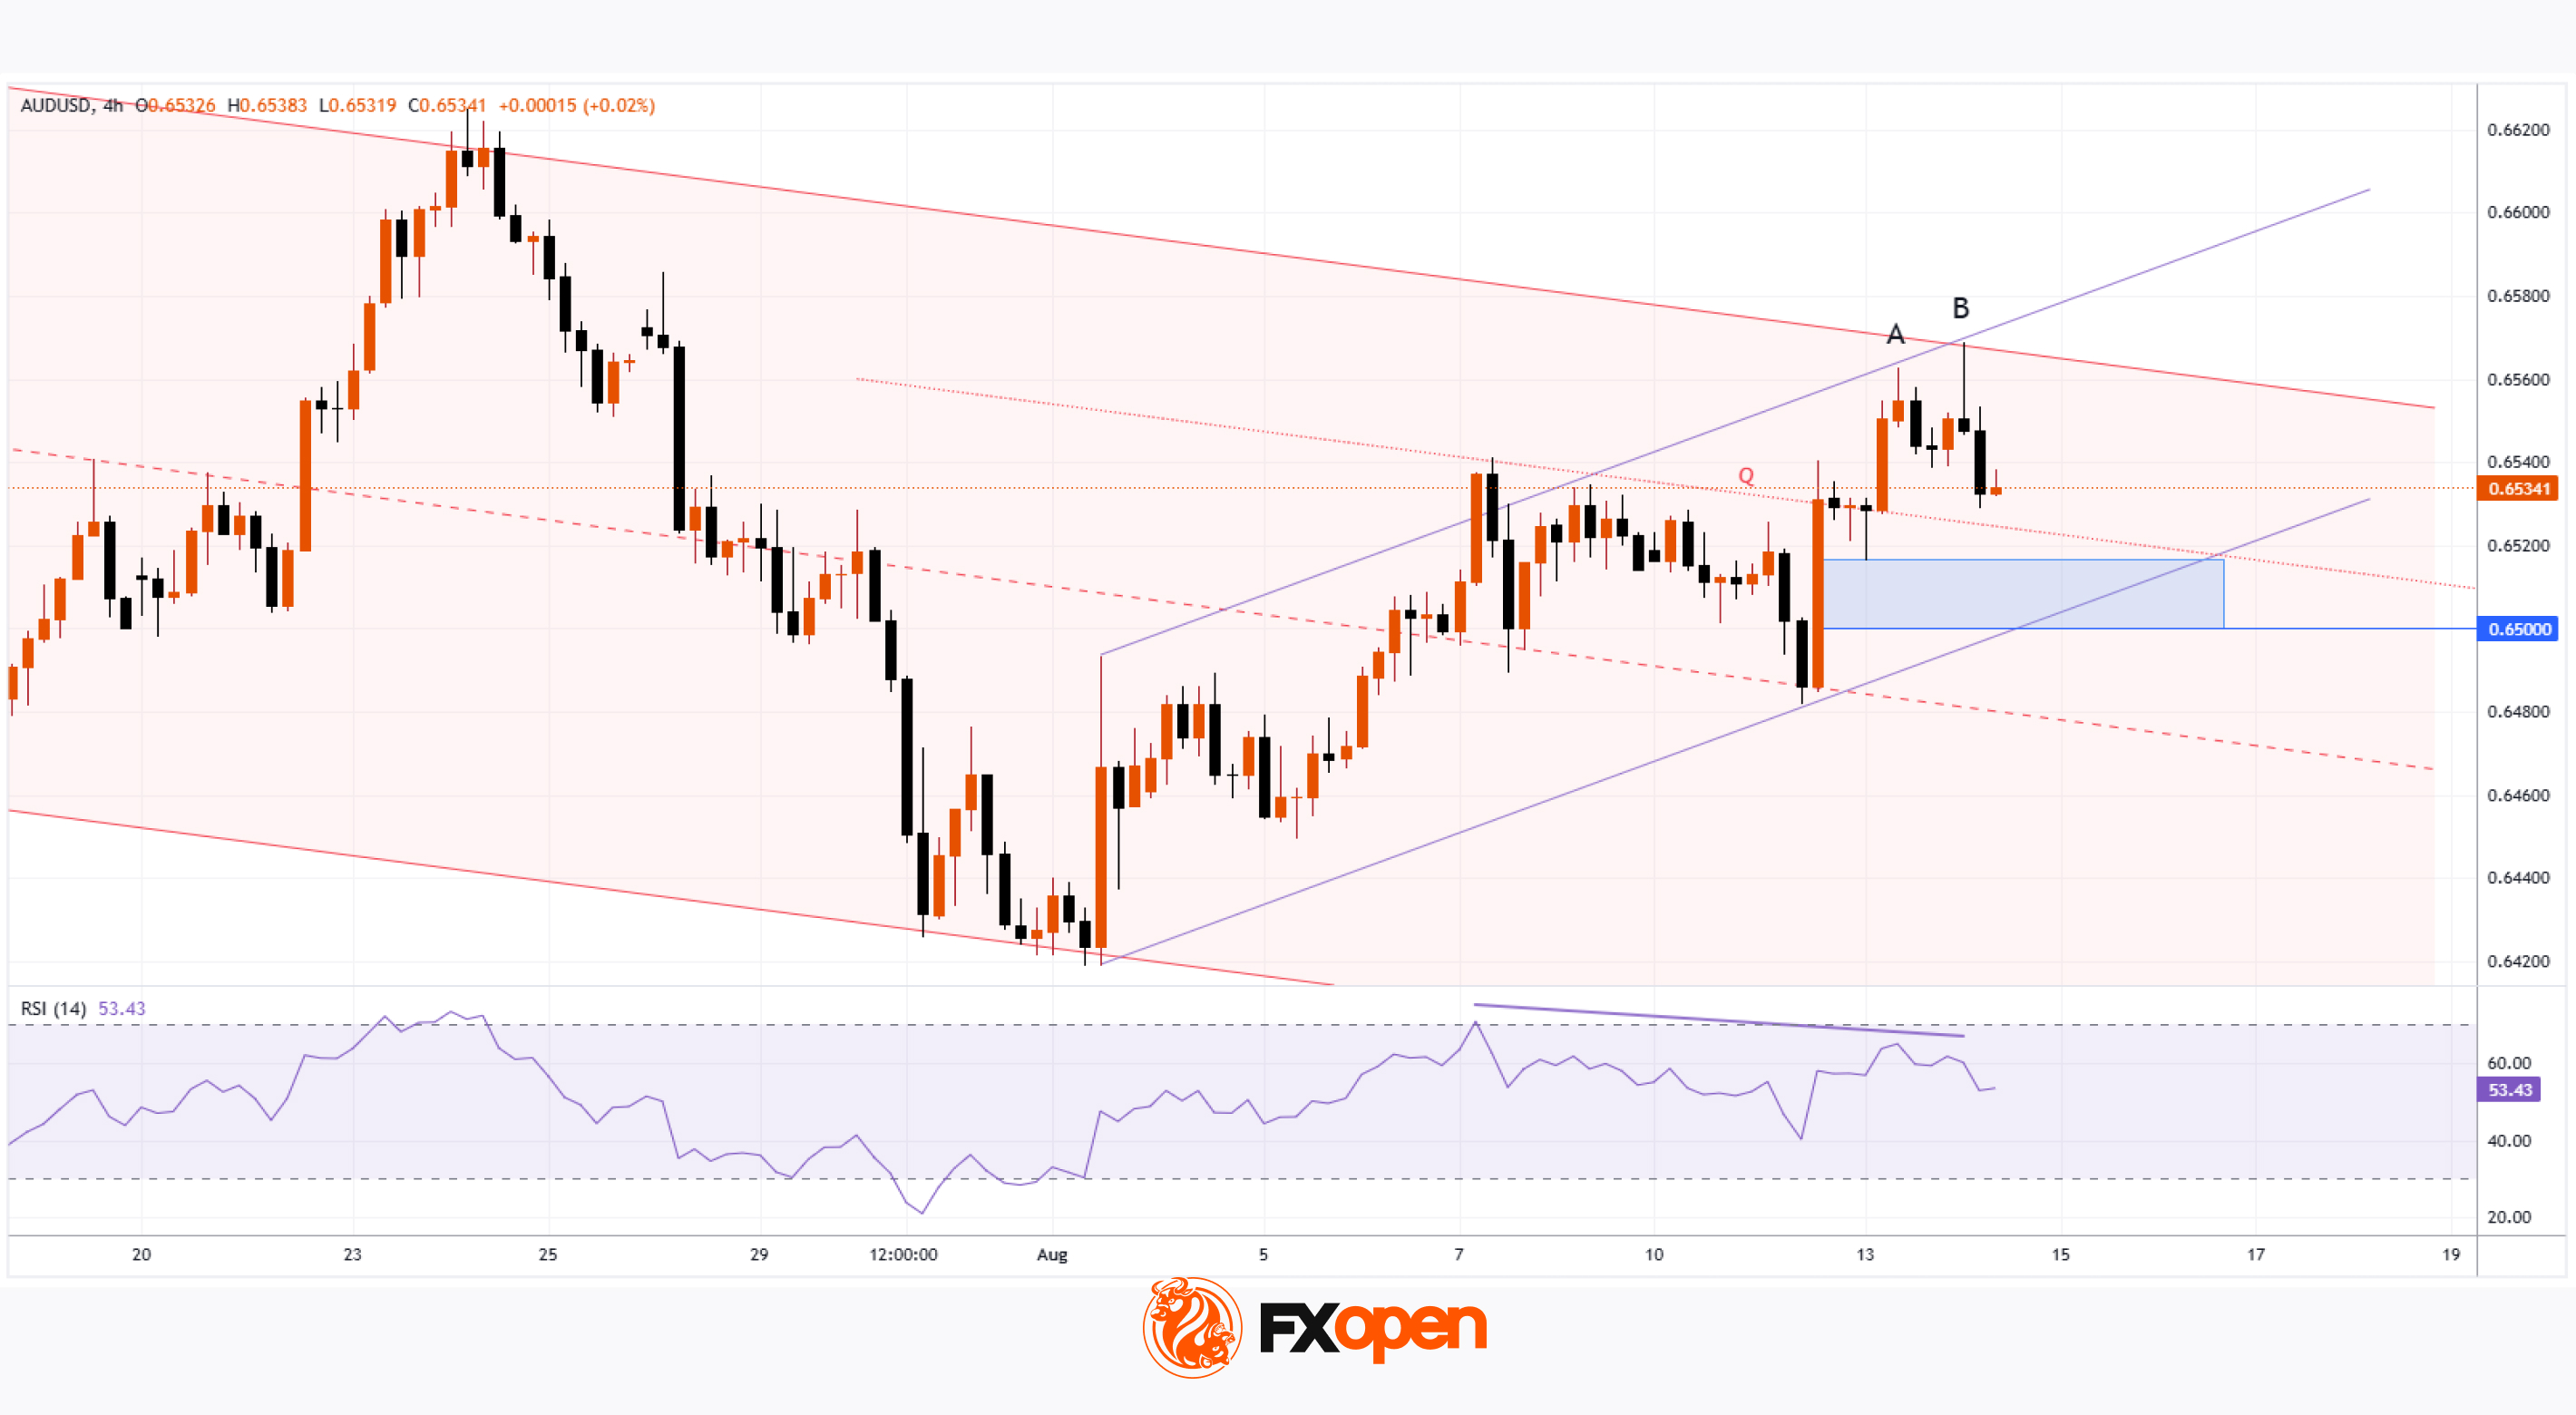
Since last month, AUD/USD price movements have been forming a descending channel (highlighted in red), and this week’s reversal from the August high reinforces its relevance.
Key factors emphasising the market’s bearish bias include:
→ Double top pattern formed by recent highs A and B. Notably, the long upper wicks of the candlesticks reflect increasing selling pressure.
→ The August upward move, marked by purple trendlines, may represent a corrective bear flag within the dominant downtrend.
→ Bearish RSI divergence – present not only between highs A and B, but also relative to the 7 July peak.
Potential Support Levels:
→ Lower purple trendline;
→ Line Q, which divides the upper half of the channel into two quarters;
→ The 0.65 psychological level – previously defended strongly by bulls, as evidenced by the wide bullish candle on 12 August, when price surged easily (a sign of buying imbalance).
These supports collectively form a key demand zone (shaded in purple). Bears will need significant momentum to break through this area and extend the prevailing downtrend in AUD/USD through August 2025.
Trade over 50 forex markets 24 hours a day with FXOpen. Take advantage of low commissions, deep liquidity, and spreads from 0.0 pips. Open your FXOpen account now or learn more about trading forex with FXOpen.
CFDs are complex instruments and come with a high risk of losing your money.
This article represents the opinion of the Companies operating under the FXOpen brand only. It is not to be construed as an offer, solicitation, or recommendation with respect to products and services provided by the Companies operating under the FXOpen brand, nor is it to be considered financial advice.
👍2
#stocktrading #stockmarket #intel #marketanalysis #MarketNews
Intel (INTC) Stock Price Rises 7% Amid White House Rumours
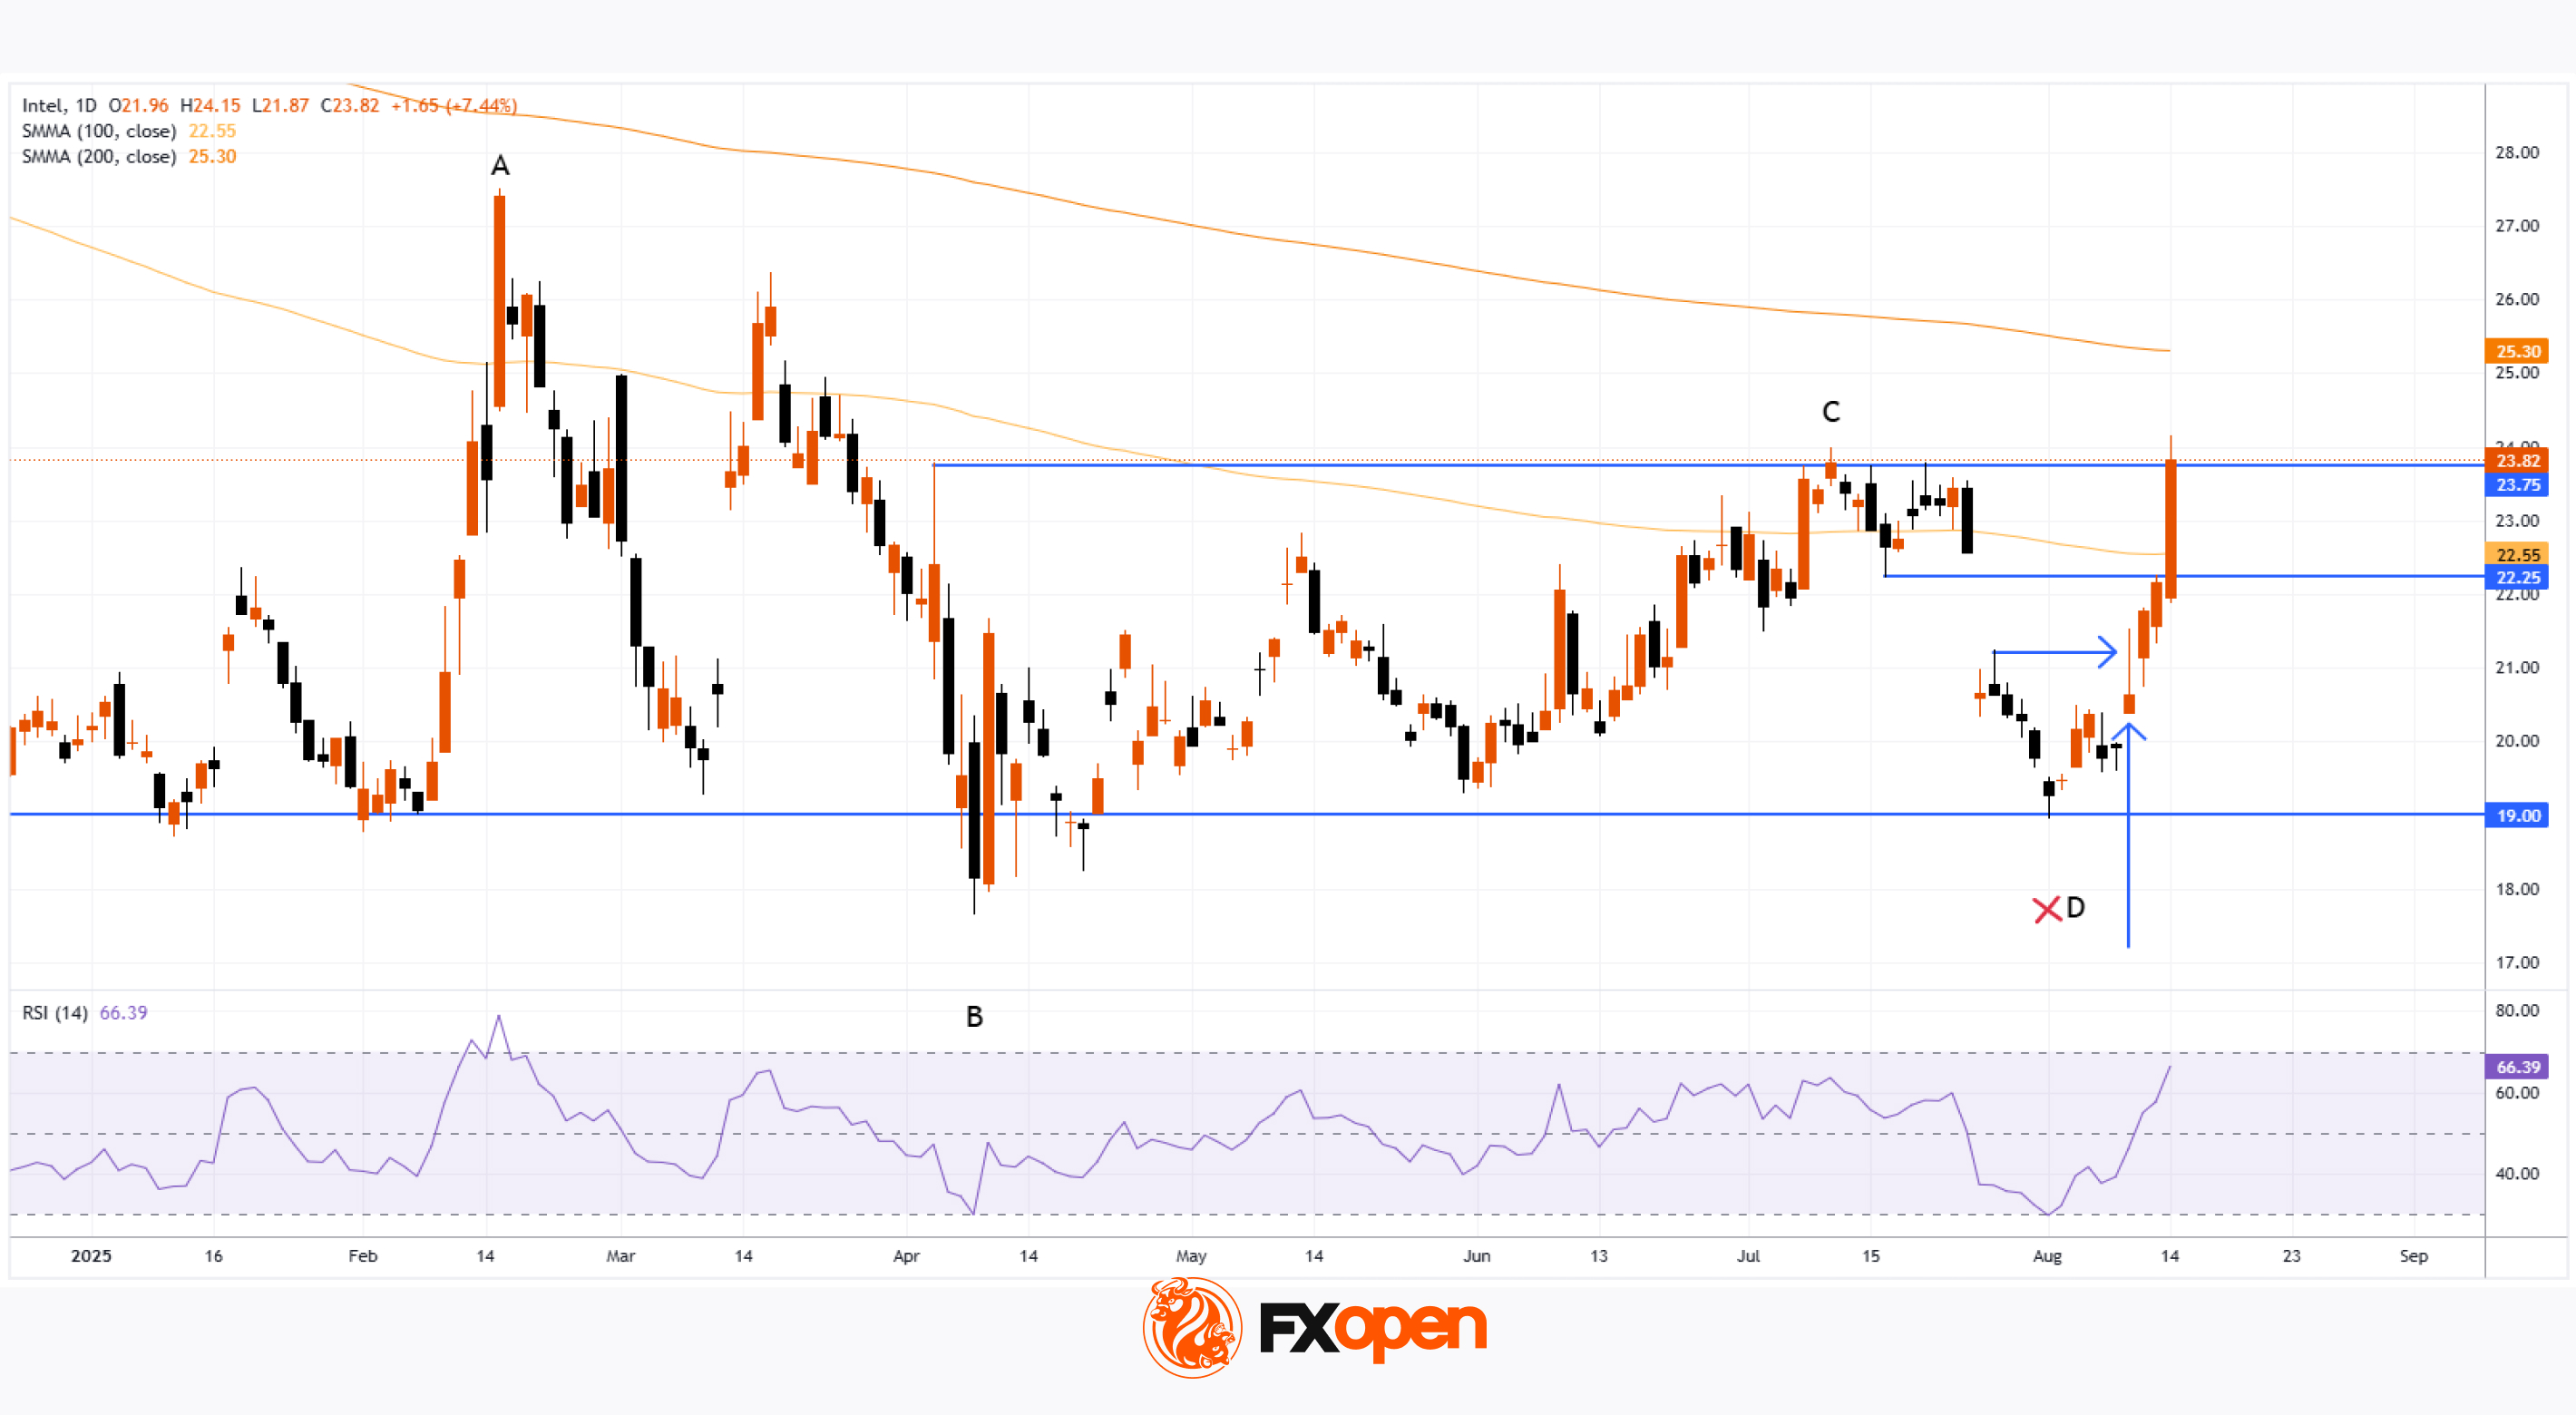
Intel (INTC) stock price surged more than 7% yesterday, making it the top performer in the S&P 500 index (US SPX 500 mini on FXOpen). The rally came on the back of a report in Barron’s stating that the US government is in talks to acquire a stake in Intel:
→ Intel declined to comment on Barron's report.
→ White House spokesperson Kush Desai stated: “Discussion about hypothetical deals should be regarded as speculation unless officially announced by the Administration.”
Meanwhile, Bloomberg reported that the Trump administration is negotiating with Intel over a potential US government stake in the company – a move aimed at boosting domestic manufacturing and supporting Intel’s plans to build a new facility in Ohio.
The prospect of state backing for the American chipmaker triggered a sharp bullish impulse yesterday, which could extend into today. In pre-market trading, INTC shares are hovering around $25 – their highest level since March.
Technical Analysis of INTC Shares
Previously, when analysing the INTC chart, we highlighted the significance of the $20 level, which appeared to act as strong support from major market participants. This may have reflected expectations that the government would not abandon a strategically important US company during challenging times – particularly in the context of technological rivalry with China.
For months, INTC shares had been in a downtrend (as shown by the 100- and 200-period moving averages). However, yesterday’s sharp rally now appears capable of reversing that trend:
→ Lower highs and lows at points A, B, and C had suggested a lower low at point D. Indeed, the price came close to setting it after a disappointing quarterly earnings report on 24 July, which led to a large bearish gap at the market open on 25 July.
→ Today, we may see the price break above point C’s high, signalling a potential end to the bearish market structure.
Candlestick analysis this week highlights strong bullish momentum:
→ On Monday (indicated by an upward arrow), trading opened with a bullish gap. However, sellers became active near the upper boundary of the aforementioned bearish gap (marked with a rightward arrow), causing the candle to close with a long upper wick – a sign of weakness.
→ The next two sessions demonstrated that buying pressure persisted – on Tuesday, the stock opened with a bullish gap and rose steadily throughout the day, with Wednesday’s strong candle further confirming buyer activity.
→ Yesterday, the price confidently broke through resistance at $22.25, moving towards the $23.75 level, which could be breached today.
→ The RSI indicator is now at its highest level since February.
The INTC share chart may be signalling that the prolonged bearish market, which began in 2021, is undergoing a significant shift in sentiment. This could mark the early stages of a rally – one that would be fundamentally justified if Intel does indeed secure government backing.
Trade global index CFDs with zero commission and tight spreads. Open your FXOpen account now or learn more about trading index CFDs with FXOpen.
CFDs are complex instruments and come with a high risk of losing your money.
This article represents the opinion of the Companies operating under the FXOpen brand only. It is not to be construed as an offer, solicitation, or recommendation with respect to products and services provided by the Companies operating under the FXOpen brand, nor is it to be considered financial advice.
👍2